the Creative Commons Attribution 4.0 License.
the Creative Commons Attribution 4.0 License.
 | 29 Jul 2022
Assessment of the Paris urban heat island in ERA5 and offline SURFEX-TEB (v8.1) simulations using the METEOSAT land surface temperature product
Miguel Nogueira
Alexandra Hurduc
Sofia Ermida
Daniela C. A. Lima
Pedro M. M. Soares
Emanuel Dutra
Cities concentrate people, wealth, emissions, and infrastructure, thus representing a challenge and an opportunity for climate change mitigation and adaptation. This urgently demands for accurate urban climate projections to help organizations and individuals to make climate-smart decisions. However, most of the large ensembles of global and regional climate model simulations do not include sophisticated urban parameterizations (e.g., EURO-CORDEX; CMIP5/6). Here, we explore this shortcoming in ERA5 (the latest generation reanalysis from the European Centre for Medium-Range Weather Forecasts) and in a simulation with the SURFEX (Surface Externalisée) land surface model employing the widely used bulk bare rock approach. The city of Paris is considered as a case study. Subsequently, we apply a more complex urban scheme – SURFEX coupled to the Town Energy Balance (TEB) urban canopy model to assess its benefits on characterizing the Paris urban climate. Both simulations and ERA5 were compared to the LSA SAF (Satellite Application Facility on Land Surface Analysis) land surface temperature product to evaluate the simulation of Parisian surface urban heat island (SUHI). Our results show a significant added value of SURFEX-TEB in reproducing the SUHI during the daytime and the UHI during both the daytime and nighttime (with overall reductions in the bias and root mean square error and improvements in the representation of the statistics of the SUHI/UHI displayed by the Perkins skill score or S score). The improvement in the simulated SUHI is lower during the nighttime due to the lack of land–atmosphere feedbacks in the proposed offline framework. Nonetheless, the offline SURFEX-TEB framework applied here clearly demonstrates the added value of using more comprehensive parameterization schemes to simulate the urban climate and, therefore, allowing the improvement of urban climate projections.
- Article
(1747 KB) - Full-text XML
- BibTeX
- EndNote


Urban areas accommodate nearly half of the global population, and this fraction is projected to increase to 68 % by 2050 according to the World Health Organization (World Health Organization, 2018). Moreover, cities concentrate wealth, infrastructures, and emissions that are responsible for about 75 % of the global greenhouse gas emissions from energy consumption (IPCC, 2014). Consequently, understanding and simulating the urban climate evolution is a key task for climate change assessments and for designing climate change adaptation and mitigation strategies.
The urban areas are characterized by drastic land use changes which are responsible for the increased trapping and absorption of solar radiation, reduced evapotranspiration, and decreased nighttime cooling in built-up areas. As a result, cities typically have warmer air and surface temperatures compared to nearby rural environments. This is the well-known urban heat island (UHI) effect, which has been found over multiple cities across the globe (see, e.g., Deilami et al., 2018, for a recent review).
The identification and quantification of the UHI dynamics have proven to be challenging. Despite its widespread emergence in urban environments, the UHI is sensitive to the specific land surface characteristics and meteorological conditions, hence displaying significant variability between different locations and periods. Indeed, previous investigations reported several different relevant UHI dependencies, including the city size and population density (Oke, 1982; Clinton and Gong, 2013; Oke et al., 2017; Manoli et al., 2019), socioeconomic conditions (e.g., Hong et al., 2019; Li et al., 2020; He et al., 2021), urban vegetation coverage (Kaloustian and Diab, 2015; Peng et al., 2012; Zhou et al., 2014; Nogueira and Soares, 2019), background climate conditions (namely precipitation and wind; Zhou et al., 2013; Lemonsu et al., 2013; Zhao et al., 2014; Manoli et al., 2019), and urban morphology (city geometry, building height, construction materials, etc.; Oke, 1973, 1982; Zhou et al., 2017; Krayenhoff et al., 2018; Nogueira and Soares, 2019; Masson et al., 2020). Heat release resulting from human activities has also been shown to modulate the UHI (De Munck et al., 2013; Schoetter et al., 2020). Moreover, surface and near-surface air temperatures over natural regions also display large sensitivity to the complex land use and land cover patterns (e.g., Beljaars et al., 1996; Koster et al., 2004; Johannsen et al., 2019; Nogueira et al., 2020a, 2021a), which represents an additional layer of complexity to the UHI.
Investigations of the UHI based on contrasting in situ temperature and surface fluxes observations from cities and neighboring rural locations are generally unable to capture its complex spatial heterogeneity, particularly for large cities, resulting in large uncertainties in the UHI characterization (Stewart, 2011; Schwarz et al., 2011; Stewart and Oke, 2012). The development of dense urban meteorological station networks allowed us to partially overcome these limitations, but the temporal and spatial coverage of such networks remains too narrow to fully characterize the urban-induced climate modulation (Muller et al., 2013; Konstantinov et al., 2018). Remote sensing techniques provide a widely used alternative for comprehensive characterization of the UHI and its variability, providing reliable estimates for numerous land surface properties with wide spatial coverage and adequate spatial and temporal sampling, including land surface temperature (LST), land use and land cover (LULC) maps, soil moisture, rainfall, and snow, amongst others (see Balsamo et al., 2018, for a recent review).
Numerous works revealed the existence of a surface urban heat island (SUHI), referring to warmer LST in urban areas compared to its rural environment (e.g., Roth et al., 1989; Imhoff et al., 2010; Schwarz et al., 2011; Peng et al., 2012; Zhao et al., 2014; Zhou et al., 2017). Yet, these studies identified significant differences between the UHI and SUHI, including the maximum UHI hour and seasonality, and the relationship between thermal contrast magnitude and land use. Moreover, LST estimates are often restricted to clear-sky conditions since, typically, the available all-sky estimates are restricted by a very coarse spatial resolution which is inappropriate for characterizing the urban environments (Masson et al., 2020). The LST estimates are also often constrained by the time of satellite overpass, which limits the temporal resolution.
Urban climate simulations generated by physically based numerical models can potentially circumvent some of the limitations of in situ and remote sensing observational products. Specifically, coherent information for multiple relevant variables with high spatial and temporal coverage and resolutions may be obtained. Additionally, due to the complexity and diversity of cities around the world, the city-scale climate properties are specific and often limited to a particular location. Moreover, while observations cover the past, numerical simulations can be extended to the future and, therefore, consider different scenarios of future socioeconomic evolution, urban development, and adaptation strategies, as shown, for example, in Georgescu et al. (2014), where it was demonstrated how urban planning could help offset the global warming effect in U.S. cities in the future.
Most large ensembles of global and regional climate model simulations have simplified representations of the urban environment (Garuma, 2018; Zhao et al., 2021). Furthermore, the available large ensembles of Earth system models (ESMs) and global climate models (GCMs) typically have coarse spatial resolutions (∼100 km), which are inadequate for representing most of the city-scale processes. Typically, state-of-the-art large, multi-model ensembles of regional climate models (RCMs) have grid resolutions of the order of tens of kilometers, which is still inappropriate for simulating many aspects of the urban climate system (e.g., Langendijk et al., 2019; Nogueira et al., 2020b; McNorton et al., 2021). The next generation of RCM ensembles will have a resolution of a few kilometers, allowing a better simulation of the local climate variability (Jacob et al., 2020). Indeed, several pilot studies have suggested significant added value of including urban canopy models (UCMs) to parameterize interactions between the urban surface and the atmosphere in RCMs with resolutions of a few kilometers (Chen et al., 2011; Kusaka et al., 2012; Hamdi et al., 2012; Lemonsu et al., 2014; Daniel et al., 2019; Garuma, 2018; Schoetter et al., 2020). It is worth pointing out, however, that several studies presenting RCMs combined with more complex urban schemes in short-term case studies have previously shown added value in simulating the urban climate (e.g., Salamanca et al., 2009, 2011). However, the use of UCMs coupled to RCMs is not a standard procedure for long-term/century climate simulations (and is not projected to be in the next generation of multi-model RCM ensembles) due to its very high computational costs, resulting in a poor representation of many aspects of urban climate in those RCM ensemble datasets (Langendijk et al., 2019; Nogueira et al., 2020b).
The use of land surface models (LSMs) coupled to a UCM, forced offline by atmospheric data, provides a computationally efficient option for urban climate simulation. This approach overcomes the computational and resolution limitations of ESMs, GCMs, and RCMs but comes at the cost of neglecting the urban land–atmosphere feedbacks and providing only diagnostics for the surface and near-surface variables. One may estimate the urban impact on surface and near-surface air temperature and humidity and near-surface wind and latent and sensible heat fluxes but not on clouds, precipitation, or local circulation. Despite those limitations, recent studies have demonstrated the added value of this approach in reproducing the key features of the observed urban climate compared to traditional climate simulations (without representation of urban processes), including the UHI and the frequency, intensity, and duration of urban extreme temperature events (Broadbent et al., 2018; Conlon et al., 2016; Daniel et al., 2018; Kaloustian and Diab, 2015; Lemonsu et al., 2013, 2015; Nogueira and Soares, 2019; Hamdi et al.,2020; Viguié et al., 2020; Nogueira et al., 2020b). Leveraging the competitive computational cost of offline LSM-UCM simulations, these studies explored the local climate response to multiple different urbanization patterns and emission scenarios over relatively long periods and at high spatial resolution. Additionally, Nogueira and Soares (2019) demonstrated how this type of framework may be used to disentangle the impact of land use change, both from large-scale warming induced by greenhouse gas emissions and from natural climate variability. Other approaches to tackling this problem have been suggested in the past, namely using dynamical downscaling to run climate simulations at the start and at the end of the century (e.g., Georgescu et al., 2014; Krayenhoff et al., 2018; Broadbent et al., 2020). This represents a critical task for anthropogenic climate change attribution and for designing effective mitigation strategies. The added value of the offline framework has also been demonstrated in simulating the impact of changes in vegetation cover patterns over non-urban regions (Johannsen et al., 2019; Nogueira et al., 2020a, 2021a).
The present study assesses the ability of the LSM-UCM approach to downscale ERA5 reanalysis, the fifth, and latest, generation reanalysis from the European Centre for Medium-Range Weather Forecasts (ECMWF) to resolutions of a few kilometers over dense urban areas. Specifically, we analyze the added value of the Météo-France SURFEX (Surface Externalisée) surface modeling platform (Le Moigne, 2018) in improving the simulation of the UHI and SUHI over Paris, a European megacity characterized by a well-known strong urban heat island effect (e.g., Sarkar and De Ridder, 2011; De Munck et al., 2013; Hamdi et al., 2015; Lemonsu et al., 2015; Daniel et al., 2019). SURFEX is particularly relevant in this context since it has shown to perform particularly well in offline urban simulations (e.g., Hamdi et al., 2015; Lemonsu et al., 2015; Nogueira and Soares, 2019; Nogueira et al., 2020b). Previously, Nogueira et al. (2020b) used the offline LSM approach to perform the downscaling of the EURO-CORDEX (European Coordinated Regional Climate Downscaling Experiment) simulation ensemble for the historical and future periods over an urban grid point inside the city of Lisbon and a neighboring rural grid point. The results highlighted the poor representation of the UHI effect in the EURO-CORDEX RCMs and suggested the added value of the online approach for simulating the UHI effect. However, this study was limited to two single-column simulations and focused on the daily maximum and daily minimum 2 m air temperature, which are diagnostic variables in the offline LSM approach. Here, we use high-resolution LST satellite data to investigate the spatial structure of the Parisian SUHI and its diurnal cycle in ERA5 and to assess the added value of the offline LSM downscaling approach, contrasting against the often-used bulk bare rock urban parameterization approach in large ensembles of GCMs/RCMs.
2.1 Observations and reanalysis
Parisian daily maximum and minimum temperatures (respectively, Tmax and Tmin) for the 2004–2018 period were obtained from two weather stations (Fig. 1), retrieved from the Global Summary of the Day (GSOD) and produced by the National Climatic Data Center (NCDC), which include quality control checks and random error removal. The first station located in the Montsouris public park (48.82∘ N, 2.33∘ E), in the Paris city center, was used as a reference to characterize the Parisian urban temperature. The second station located in Melun (southeast of Paris – 48.61∘ N, 2.67∘ E), in a natural environment, was used as reference to characterize the temperature surrounding Paris. These two stations were also previously employed by Hamdi et al. (2015) and Daniel et al. (2019) to characterize the Parisian UHI.
The LSA SAF (Satellite Application Facility on Land Surface Analysis) LST estimates are derived from the outgoing thermal infrared radiation (TIR) measured at the top of the atmosphere by the Spinning Enhanced Visible and InfraRed Imager (SEVIRI) on board the Meteosat Second Generation (MSG) series by employing a generalized split-window technique (Freitas et al., 2010). The TIR spectral band (8–13 µm) is particularly appropriate as it presents relatively weak atmospheric attenuation under clear-sky conditions and includes the peak of the Earth's spectral radiance (Li et al., 2013; Ermida et al., 2019). The LSA-SAF LST estimates were available every 15 min from 2004 to the present day over land pixels within the MSG disk, comprising satellite zenith view angles between 0 and 80∘, with a 3 km resolution at the nadir. The LSA-SAF LST estimates were aggregated as the average at 0, 15, 30, and 45 min for each hour. Then, the hourly mean for the period ranging from 2004 through 2018 was computed. LST obtained through remote sensing is intrinsically directional due to the heterogeneity of the land surface. Still, given the model resolution considered in this study, the LST's ability to evaluate model data should not be affected by its directional property or by the buildings' material emissivity.
ERA5 is the latest-generation global atmospheric reanalysis produced by the ECMWF, extending from 1979 to the present (although a preliminary version of an extension to 1950 is already available). ERA5 is based on a recent version of the ECMWF Integrated Forecast System (IFS; cycle 41r2), including several improvements compared to the version used in ERA-Interim (the ECMWF's previous generation reanalysis; Dee et al., 2011). That is, ERA5 features increased temporal, horizontal, and vertical resolutions (respectively, 1 h, ∼31 km and 137 vertical levels extending from surface to 0.01 hPa; see Hersbach et al., 2020, for a detailed description of ERA5), and an increased number and more recent versions of a wide variety of observational datasets are assimilated. Additionally, ERA5 benefits from improvements to several model parameterizations (e.g., convection and microphysics) and to the four-dimensional variational data assimilation scheme. Furthermore, it also presents an overall better accuracy in representing several climate variables compared to ERA-Interim, including LST, near-surface air temperature, wind, radiation, and rainfall (e.g., Urraca et al., 2018; Beck et al., 2019; Johannsen et al., 2019; Belmonte Rivas and Stoffelen, 2019; Nogueira, 2020).
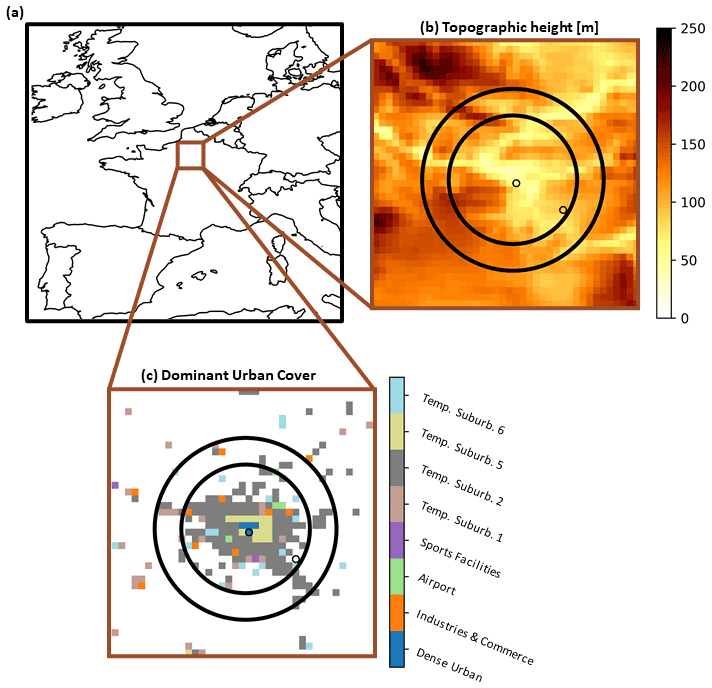
Figure 1Study domain identified by the brown square in panel (a). Panel (b) shows a magnification of the simulation domain, with the color shading representing topographic height. Panel (c) shows a magnification of the simulation domain, with the color scheme representing the dominant urban classes for grid boxes where urban fraction exceeds 0.1 (grid boxes where urban fraction is below 0.1 are white). The large black circles in panels (b) and (c) identify the inner and outer rings for computing the SUHI (see Sect. 2.3). The circular markers in panels (b) and (c) identify the station locations for computing the UHI (see Sect. 2.3).
2.2 SURFEX simulations
We performed a set of high-resolution (0.05∘ × 0.05∘) simulations of Paris and its surroundings (see Fig. 1) using the Météo-France SURFEX (Surface Externalisée) version 8.1 (Le Moigne, 2018) modeling platform. SURFEX couples multiple physically based models over all types of natural surfaces, including the interactions between soil–biosphere–atmosphere (ISBA) land surface scheme over natural land surfaces (Calvet et al., 1998; Gibelin et al., 2006) and the Town Energy Balance (TEB) urban canopy model (UCM) over urban surfaces. TEB uses the urban canyon approach (Oke, 1987) to simulate key urban physical processes on the local climate, including the possibility to account for the effects of vegetation and water bodies (see Masson, 2000, 2013, for a detailed description of TEB). The SURFEX simulations were performed in an offline setup forced by ERA5 fields, namely surface pressure, precipitation, short- and longwave radiative fluxes, and air temperature, humidity, and wind speed at 40 m height above sea level (above the Parisian urban canopy height). The simulations started in January 2003 and extended until the end of 2018, with a 15 min time step.
In total, two different SURFEX experiments were carried out here. In the first one, denoted SFX-ROCK, the city grid boxes were described as rock covers. This bulk urban parameterization is often employed in large ensembles of regional climate simulations (e.g., Daniel et al., 2019; Langendijk et al., 2019; Davin et al., 2020; Nogueira et al., 2020b). The second experiment, denoted SFX-TEB, employed the TEB UCM for urban grid boxes. Both experiments considered a multilayer soil diffusion scheme with 14 soil layers and a single-level canopy layer, which has previously been demonstrated to be adequate over European mid-rise cities such as Paris (Trusilova et al., 2016; Schoetter et al., 2020).
2.3 Assessment of the simulated UHI and SUHI
The UHI was defined here as the 2 m air temperature (T2 m) difference between the urban (Montsouris) and the rural (Melun) station locations. For ERA5 and SURFEX simulations, this was estimated using the respective nearest-neighbor grid boxes. Although the two-point difference approach cannot account for the complex spatial heterogeneity of urban environments and their surroundings, the limited number of observations available to this study defined this particular choice. Nonetheless, the complex spatial heterogeneity of the Paris area was accounted for by the SUHI definition considered here. Following the methodology employed in previous works (Peng et al., 2012; Zhou et al., 2013, 2017), the SUHI was defined as the difference between the average temperature within the considered urban cluster and the average temperature within an equal area belt around it. This approach combined land cover data (from ECOCLIMAP-II) with LSA-SAF LST. The urban cluster was defined as the grid boxes with urban fraction greater than 66 % within the inner circle shown in Fig. 1. The surrounding belt is also shown in Fig. 1. The SUHI was computed for ERA5, SFX-ROCK, and SFX-TEB, using the same approach and considering the same urban fractions from the ECOCLIMAP-II land cover data for all datasets.
The daytime and nighttime UHI and SUHI were evaluated separately. The daytime maximum T2 m and LST (denoted as Tmax and LSTmax, respectively) were computed as the maximum temperature within the 11:00 to 18:00 UTC interval. The nighttime minimum T2 m and LST (denoted as Tmin and LSTmin, respectively) were computed as the minimum temperature over the 00:00 to 07:00 UTC interval. We computed three error metrics for evaluating the UHI and SUHI in the different model-based datasets. The first was the mean bias, which was calculated following Eq. (1):
where mk and ok are, respectively, the model simulated and observed values, and N is the total number of days in the historical time series. The mean bias measures the models' systematic errors. The second was the Perkins skill score (Perkins et al., 2007), henceforth denoted as the S score, which measures the models' ability to reproduce the observed probability distribution functions (PDFs) as follows:
where min[xy] represents the minimum between two values, Zm and Zo are the modeled and observed empirical PDFs, respectively, and B is the total number of bins used to compute the empirical PDFs (here we used steps of 1 ∘C). S provides a measure of similarity between modeled and observed empirical PDFs, with S=100 % if the model reproduces the empirical PDF perfectly and decreasing towards zero as the similarity between the PDFs decreases. Both error metrics were also applied to evaluate the daytime and nighttime LST over the study domain grid boxes and the daytime and nighttime T2 m at the two station locations.
The third metric to be computed was the root mean squared error (RMSE), which measures the mean magnitude of the models' systematic error, as follows:
3.1 Intercomparison of the simulated SUHI over Paris
The observed LST averaged over the 2004–2018 period showed a clear signature of the Parisian SUHI effect during the daytime (Fig. 2a) and nighttime (Fig. 2b). The SUHI was not reproduced by ERA5 during the daytime (Fig. 2c) or the nighttime (Fig. 2d). The results also highlighted that the ERA5 0.25∘ resolution is too coarse to reproduce the complex urban climate patterns, even for a relatively large city such as Paris. The simulation SFX-ROCK also failed to reproduce the Paris SUHI during the daytime (Fig. 2e) and nighttime (Fig. 2f). As expected, the higher resolution did improve the simulation of topographic effects on surface temperature to the south and northwest of Paris (see Fig. 1b), although the bare rock approach misrepresented the city LST modulation. In contrast, the LST patterns resulting from the SFX-TEB simulation showed a clear signature of the Paris SUHI during the daytime (Fig. 2g), which was closer to the observed pattern. During the nighttime, SFX-TEB shows some signature of the SUHI (Fig. 2h) but underestimates its magnitude.
The improved ability of SFX-TEB to reproduce the urban LST over Paris was evidenced by the large reduction in the median bias over urban grid boxes (i.e., where the urban fraction was above ), i.e., from −7.0 ∘C in ERA5 and −6.7 ∘C in SFX-ROCK to 1.5 ∘C in SFX-TEB (Fig. 3a). Over natural surfaces, this reduction was lower, i.e., from −2.5 ∘C in ERA5 to −1.5 ∘C in SFX-ROCK and −1.3 ∘C in SFX-TEB. The 0.2 ∘C difference between SFX-ROCK and SFX-TEB was due to the considered definition of natural surfaces, encompassing all grid boxes with urban fractions below one-third. Indeed, in cases where the urban fraction was zero, the SFX-ROCK and SFX-TEB simulations were identical. Notice, however, that the differences amongst different datasets over natural surfaces were within the typical uncertainty associated with LSA-SAF LST estimates, which is of the order of 2 ∘C (Trigo et al., 2015). Over mixed surfaces (i.e., urban fractions between one-third and two-thirds) the median bias for annual averaged LST was −3.8 ∘C for ERA5, −3.3 ∘C for SFX-ROCK, and 0.5 ∘C for SFX-TEB. These differences were also within the typical observational uncertainty. Yet, the large improvements over urban surfaces and identical performances over natural surfaces suggest that SFX-TEB represented an improvement over mixed surfaces too, particularly when the grid-box urban fraction approaches two-thirds.
The largest reductions to the daytime LST over urban areas' systematic errors occurred during MAM (March–May), where the median bias was −8.8 ∘C for ERA5, −7.6 ∘C for SFX-ROCK, and 2.1 ∘C for SFX-TEB (Fig. 3e). A large reduction in the daytime LST systematic error was also found during SON (September–November), where the median bias was −6.5 ∘C for ERA5 and SFX-ROCK and −0.5 ∘C for SFX-TEB (Fig. 3i). During JJA (June–August), the median bias was −8.2 ∘C for ERA5, −5.2 ∘C for SFX-ROCK, and 5.1 ∘C for SFX-TEB (Fig. 3g). Finally, during DJF (December–February), the median bias was −4.1 ∘C for ERA5, −6.3 ∘C for SFX-ROC, and −2.8 ∘C for SFX-TEB (Fig. 3c). Notice that, on the seasonal scale, SFX-TEB was not always the best-performing model during the daytime (for example, ERA5 was the best-performing model during DJF over natural surfaces, and SFX-ROCK was the best-performing model during JJA over mixed surfaces).
During the nighttime, the differences in the annual average LST systematic errors amongst different simulations (Fig. 3b) were lower than during the daytime. Specifically, over urban surfaces, the median bias was −1.8 ∘C in ERA5, −2.0 ∘C in SFX-ROCK, and −1.7 ∘C in SFX-TEB. Over mixed surfaces, the median bias was 0.1 ∘C in ERA5 and −0.1 ∘C in SFX-ROCK, and near null in SFX-TEB. Finally, over natural surfaces, the nighttime median bias was 1.0 ∘C in ERA5 and 0.7 ∘C in SFX-ROCK and SFX-TEB. Notice that these differences amongst simulations were within the observational uncertainty. This was also true for all systematic differences in the nighttime LST amongst different datasets on the seasonal scale (Fig. 3d, f, h, j).
Figure 4 evidences the clear reduction in the simulated LST systematic errors during the daytime hours in SFX-TEB compared to ERA5 and SFX-ROCK over urban (Fig. 4c) and mixed (Fig. 4b) grid boxes. Over natural surfaces, the daytime performance was similar for SFX-ROCK and SFX-TEB, with both slightly outperforming ERA5 (Fig. 4a). Finally, during the nighttime hours, Fig. 4 showed a similar performance in reproducing the average LST over all surface types.
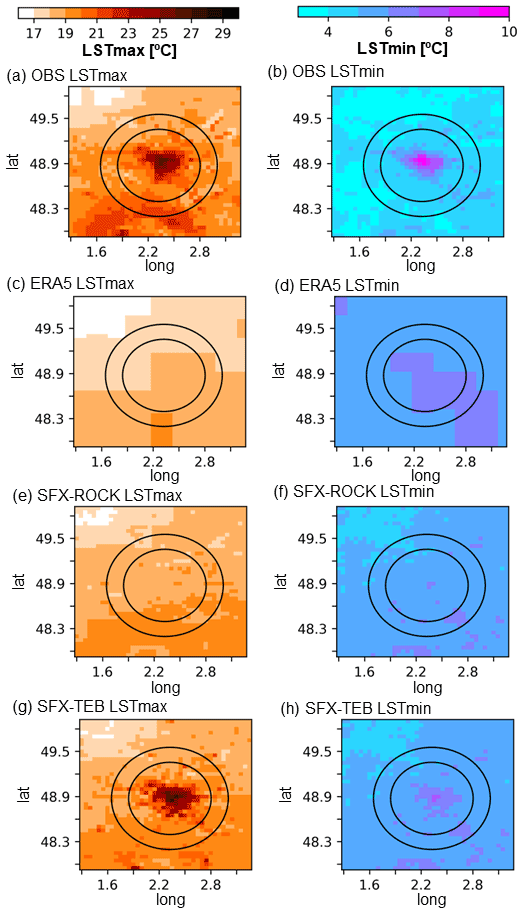
Figure 2Maps of LST averaged over the 2004–2018 period during the daytime (left column) and nighttime (right column) over the study domain computed from LSA-SAF (a, b), ERA5 (c, d), SFX-ROCK (e, f), and SFX-TEB (g, h). The black circles represent the inner and outer rings of the SUHI computation, as previously described in Fig. 1.
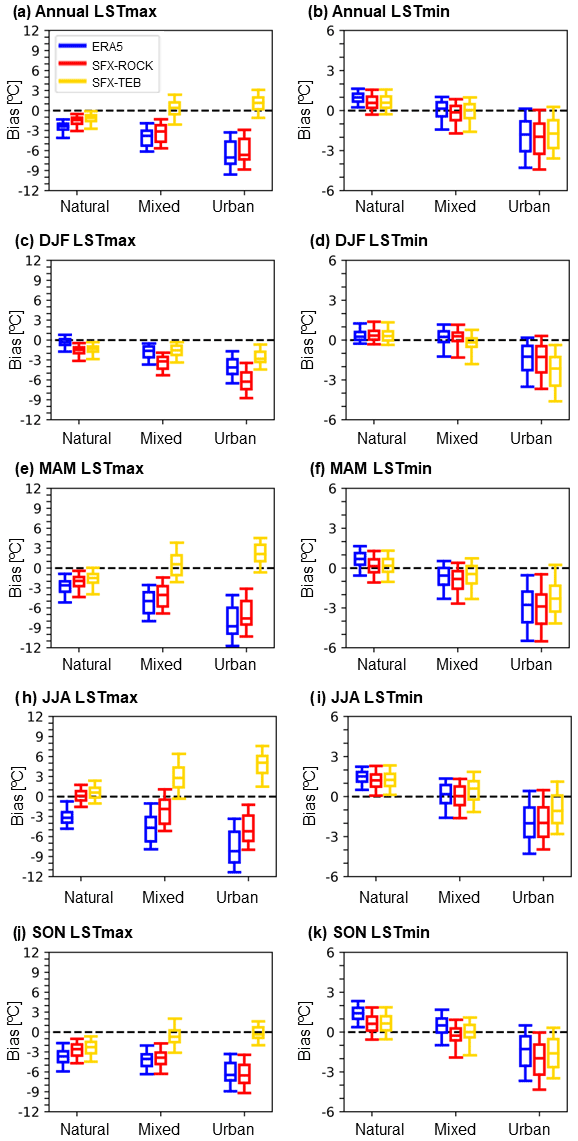
Figure 3Box plots of the LST bias computed over the 2004–2018 period for the daytime (left column) and nighttime (right column) for ERA5 (blue), SFX-ROCK (red), and SFX-TEB (yellow). The box plots represent the bias spread for grid boxes classified as natural surfaces (grid boxes with urban fraction below 0.33), mixed surfaces (grid boxes with urban fraction between 0.33 and 0.66), and urban surfaces (grid boxes with urban fractions above 0.66). From top to bottom, the rows represent the bias computed for the full annual cycle, i.e., DJF, MAM, JJA, and SON.

Figure 4Average diurnal cycle of LST computed over the 2004–2018 period from LSA-SAF (black), ERA5 (blue), SFX-ROCK (red), and SFX-TEB (yellow) for grid boxes classified as (a) natural surfaces (grid boxes with urban fraction below 0.33), (b) mixed surfaces (grid boxes with urban fraction between 0.33 and 0.66), and (c) urban surfaces (grid boxes with urban fractions above 0.66).
The SFX-TEB ability to reproduce the observed annual daytime LST PDF was better than ERA5 and SFX-ROCK over all surface types (Fig. 5a). Over urban surfaces, the median S score for the daily maximum LST was 42 % in ERA5, 49 % in SFX-ROCK, and 62 % in SFX-TEB. Over mixed surfaces, the median S score for the daily maximum LST was 58 % in ERA5, 64 % in SFX-ROCK, and 67 % in SFX-TEB. Over natural surfaces, the median S score for the daily maximum LST was 66 % in ERA5, 69 % in SFX-ROCK, and 70 % in SFX-TEB. The largest improvements in the daily maximum LST S score associated with SFX-TEB emerged during DJF (Fig. 5c), MAM (Fig. 5e), and SON (Fig. 5i), and lowest during JJA (Fig. 5g; in fact, SFX-ROCK outperformed SFX-TEB over mixed surfaces during summer). The small differences in the nighttime LST amongst simulations were also reflected in the S score, both on the annual (Fig. 5b) and seasonal scales (Fig. 5d, f, h, j).
There is a considerable overall reduction in the RMSE of LSTmax for urban surfaces (Fig. 6a) when using SFX-TEB (3 ∘C) in comparison with SFX-ROCK (6.5 ∘C) and ERA5 (7 ∘C). Although this reduction happens in every season, its magnitude is stronger in MAM (Fig. 6e) and SON (Fig. 6j), with a 67 % reduction in the error. Over natural and mixed surfaces, the reduction is either small or non-existent. For LSTmin, the overall impact of using SFX-TEB is mostly null for all surfaces (Fig. 6b), although there are small improvements over urban surfaces in MAM (Fig. 6f), JJA (Fig. 6i), and SON (Fig. 6k). In DJF (Fig. 6d), however, SFX-TEB presents the worst RMSE among both experiments and ERA5.
At a seasonal scale, the observed SUHI reveals a clear seasonal cycle during the daytime and a rather constant value during the nighttime (Fig. 7a and b). During the daytime (nighttime), the winter and summer SUHI effect amounts to around 3 and 6 ∘C (2 and 2.5 ∘C), respectively. UHI presents a less pronounced seasonal cycle during the daytime and similar values during the nighttime in relation to SUHI (Fig. 9a and b). During the daytime (nighttime), the winter and summer UHI effect amounts to around 0.6 and 0.25 ∘C (2 and 2.75 ∘C), respectively. These results are similar to what Le Roy et al. (2020) found when studying the intensity and spatial extent of the UHI and SUHI over Paris using 1 km resolution observational datasets. Both studies agree in terms of the SUHI and UHI annual cycle, despite displaying some differences in their intensities, namely in the daytime SUHI (4 ∘C in summer, 2 ∘C in winter) and the nighttime UHI (2 ∘C in summer, 1 ∘C in winter; Fig. 9b), which are both more intense in our study. These differences may arise from a number of reasons, i.e., the temporal ranges considered were different (2004–2018 in our study vs. 2000–2016), Le Roy et al. (2020) considered a much larger rural area, and the LST satellite data were retrieved from MODIS (which has a higher spatial resolution than SEVIRI but at the cost of the lower temporal resolution, with only two daily observations), and, finally, the T2 m observations were generated from a gridded dataset developed at Météo-France, while ours were obtained directly from two in situ weather stations.
SFX-TEB overestimated the observed daytime SUHI effect during MAM, JJA, and SON, while underestimating this effect during DJF (Fig. 7a). This resulted in an annual average overestimation of the SUHI intensity for this simulation. In contrast, ERA5 and SFX-ROCK largely underestimated the daytime SUHI effect over Paris (Fig. 7a). Indeed, misrepresentation of the urban radiative budget resulted in a nearly null SUHI effect in these simulations, as also illustrated by Fig. 2. One important result is that the magnitude of the daytime SUHI overestimation in SFX-TEB was smaller than the underestimation in ERA5 and SFX-ROCK, meaning that SFX-TEB improved the representation of the SUHI effect over all seasons (Fig. 7c). The statistical distribution of the daytime SUHI effect intensity was greatly improved in SFX-TEB compared to ERA5 and SFX-TEB throughout all seasons (Fig. 7e) – the annual average S score for the daytime SUHI PDF was 14 % in ERA5, 27 % in SFX-ROCK, and 81 % in SFX-TEB. SFX-TEB has the lowest daytime RMSE overall and in all seasons (Fig. 7g), with the strongest decrease happening in MAM. The overall RMSE was just below 3 ∘C in SFX-TEB, 4.5 ∘C in ERA5, and 5 ∘C in SFX-ROCK.
During the nighttime, the generally similar performance of all simulations over all types of surfaces resulted in a similar performance when reproducing the average nighttime UHI effect throughout all seasons (Fig. 7b). All simulations – ERA5, SFX-ROCK, and SFX-TEB – underestimated the observed nighttime Parisian SUHI, with the differences amongst the simulations being within the observational uncertainty (Fig. 7d). Nonetheless, the results revealed a better ability of the SFX-TEB to reproduce the nighttime SUHI statistics, which showed an annual average S score of 39 % – clearly above the 11 % and 18 % found for ERA5 and SFX-ROCK, respectively (Fig. 7f). This improved representation of the nighttime SUHI statistics was found during all seasons, with the largest during JJA and lowest during DJF (Fig. 7f). The RMSE is slightly lower in SFX-TEB in comparison with SFX-ROCK and ERA5 overall and in all seasons, except DJF (Fig. 7h).
The observations show a relatively small range of the diurnal amplitude of the Parisian SUHI, which is largely overestimated by the SFX-TEB simulation (Fig. 8a). This reflects the overestimation of the daytime LST and underestimation of the nighttime LST over the urban grid boxes, as discussed above, in all seasons, except winter (Fig. 8c). This issue is particularly pronounced during summer (Fig. 8g). Nonetheless, SFX-TEB still represented an improvement compared to ERA5 and SFX-ROCK. On the one hand, ERA5 and SFX-ROCK failed to simulate any urban-to-rural contrast throughout the full annual cycle (Fig. 8a, c, e, g, and i). On the other hand, the annual average systematic errors in the simulated LST were lower in SFX-TEB compared to ERA5 and SFX-ROCK (Fig. 8b), although the differences only exceeded the observational uncertainty during the daytime. The daytime reductions occurred mostly during DJF (Fig. 8d), MAM (Fig. 8f), and SON (Fig. 8j), while the daytime |bias| values during JJA (Fig. 8h) and the nighttime |bias| values during all seasons were within observational uncertainty.
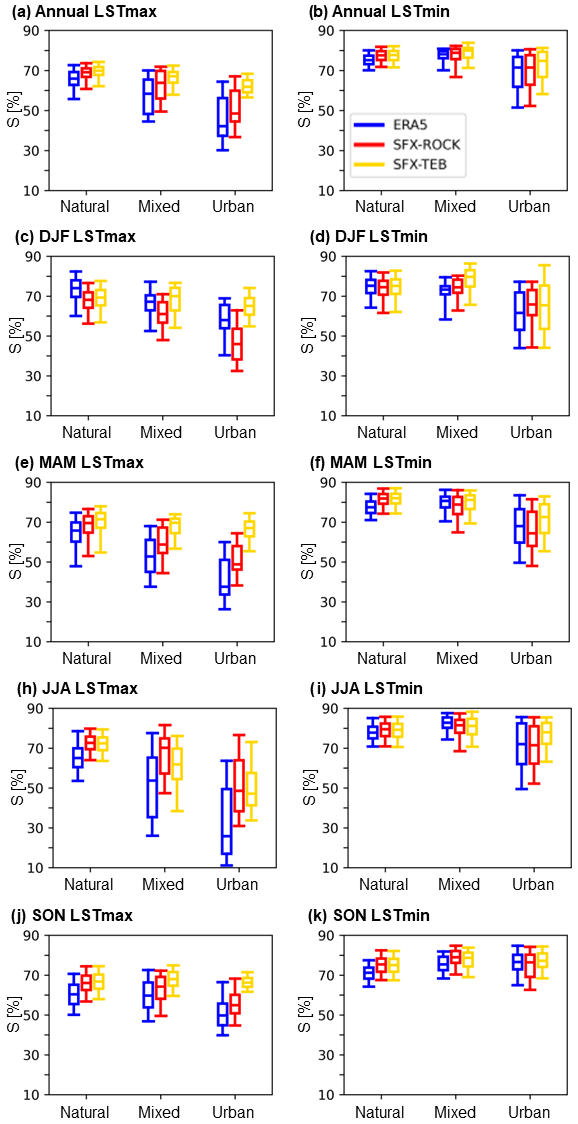
Figure 5Box plots of the S score computed over the 2004–2018 period from ERA5 (blue), SFX-ROCK (red), and SFX-TEB (yellow) for natural surfaces (grid boxes with urban fraction below 0.33), mixed surfaces (grid boxes with urban fraction between 0.33 and 0.66), and urban surfaces (grid boxes with urban fractions above 0.66). From top to bottom, the rows represent the S score computed for the full annual cycle, i.e., DJF, MAM, JJA, and SON.
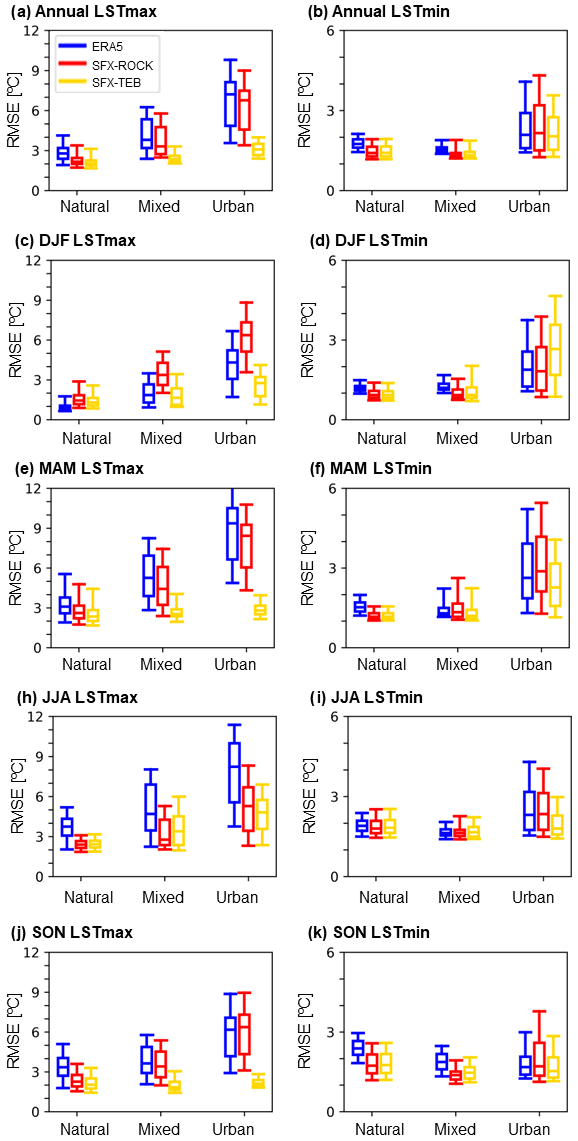
Figure 6Box plots of the RMSE computed over the 2004–2018 period from ERA5 (blue), SFX-ROCK (red), and SFX-TEB (yellow) for natural surfaces (grid boxes with urban fraction below 0.33), mixed surfaces (grid boxes with urban fraction between 0.33 and 0.66), and urban surfaces (grid boxes with urban fractions above 0.66). From top to bottom, the rows represent the RMSE computed for the full annual cycle, i.e., DJF, MAM, JJA, and SON.
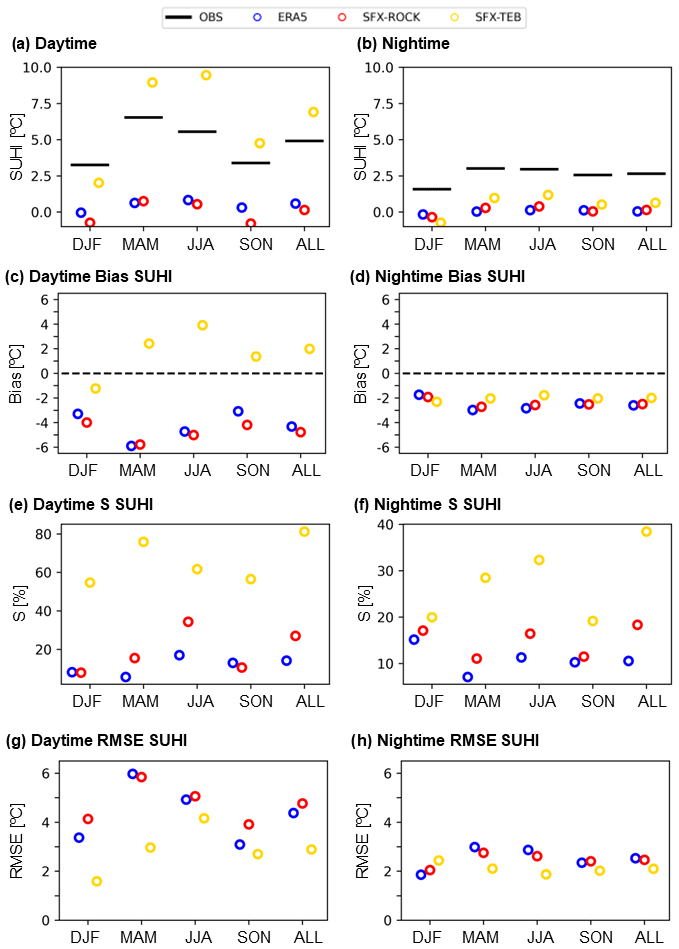
Figure 7Annual and seasonal average Parisian SUHI magnitude computed over the 2004–2018 period during the (a) daytime and (b) nighttime. The corresponding annual and seasonal average bias for the daytime is represented in panel (c) and for the nighttime in panel (d). The corresponding annual and seasonal S score is represented in panel (e) for the daytime and panel (f) for the nighttime. The corresponding annual and seasonal RMSE is represented in panel (g) for the daytime and panel (h) for the nighttime. The LSA-SAF is represented by black lines, ERA5 by blue markers, SFX-ROCK by red markers, and SFX-TEB by yellow markers.
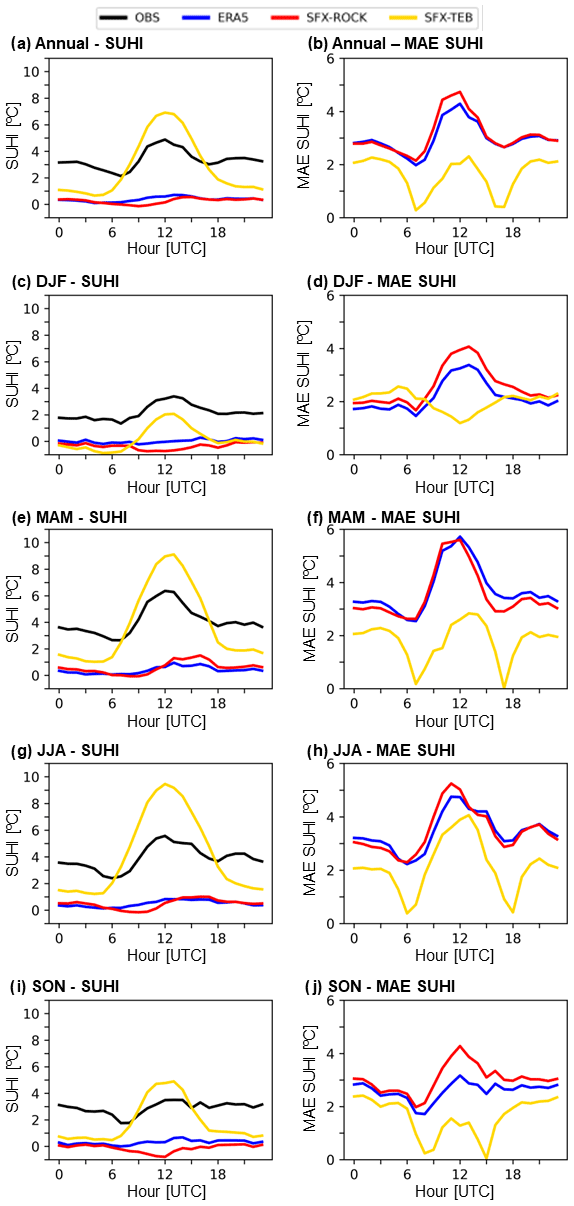
Figure 8Average SUHI diurnal cycle computed over the 2004–2018 period for (a) full year, (c) DJF, (e) MAM, (g) JJA, and (i) SON. The different colors represent LSA-SAF (black), ERA5 (blue), SFX-ROCK (red), and SFX-TEB (yellow). The respective |bias| diurnal cycles are represented for the (b) full year, (d) DJF, (f) MAM, (h) JJA, and (j) SON, using LSA-SAF as reference.
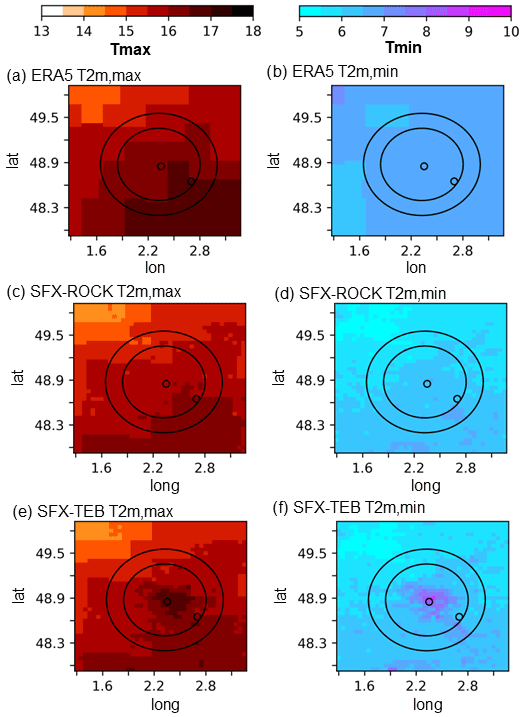
Figure 9The T2 m averaged over the 2004–2018 period during the daytime (left column) and nighttime (right column) over the study domain computed from ERA5 (a, b), SFX-ROCK (c, d), and SFX-TEB (e, f). The black circles represent the inner and outer rings for the SUHI computation, as previously described in Fig. 1.
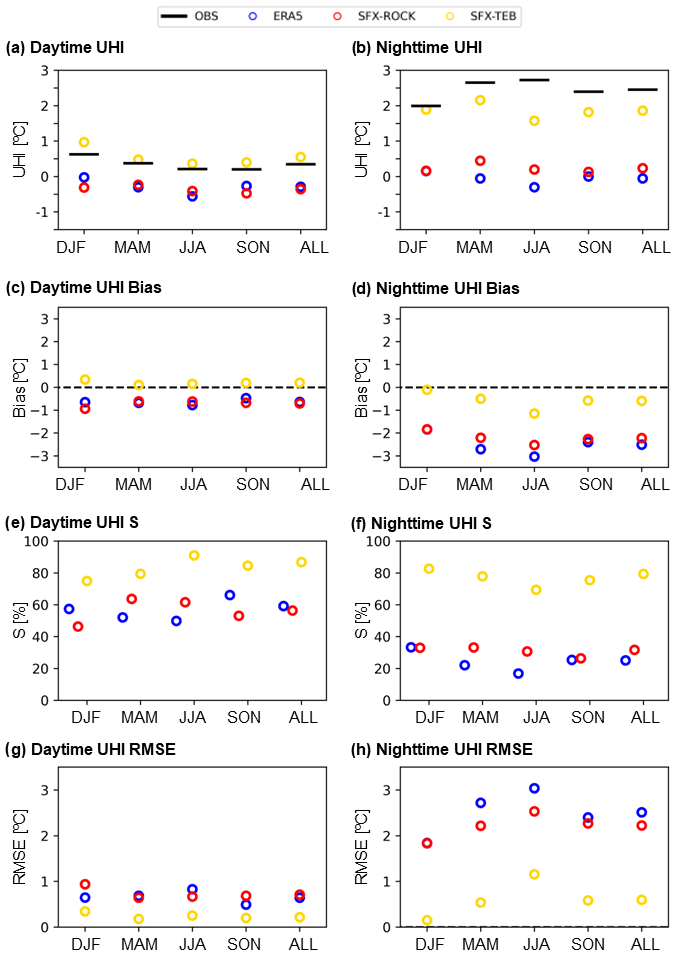
Figure 10Annual and seasonal average Parisian UHI magnitude computed over the 2004–2018 period during the (a) daytime and (b) nighttime. The corresponding annual and seasonal average bias for the daytime is represented in panel (c) and for the nighttime in panel (d). The corresponding annual and seasonal S score is represented in panel (e) for the daytime and panel (f) for the nighttime. The corresponding annual and seasonal RMSE is represented in panel (g) for the daytime and panel (h) for the nighttime. The observed UHI is represented by black lines, ERA5 by blue markers, SFX-ROCK by red markers, and SFX-TEB by yellow markers.
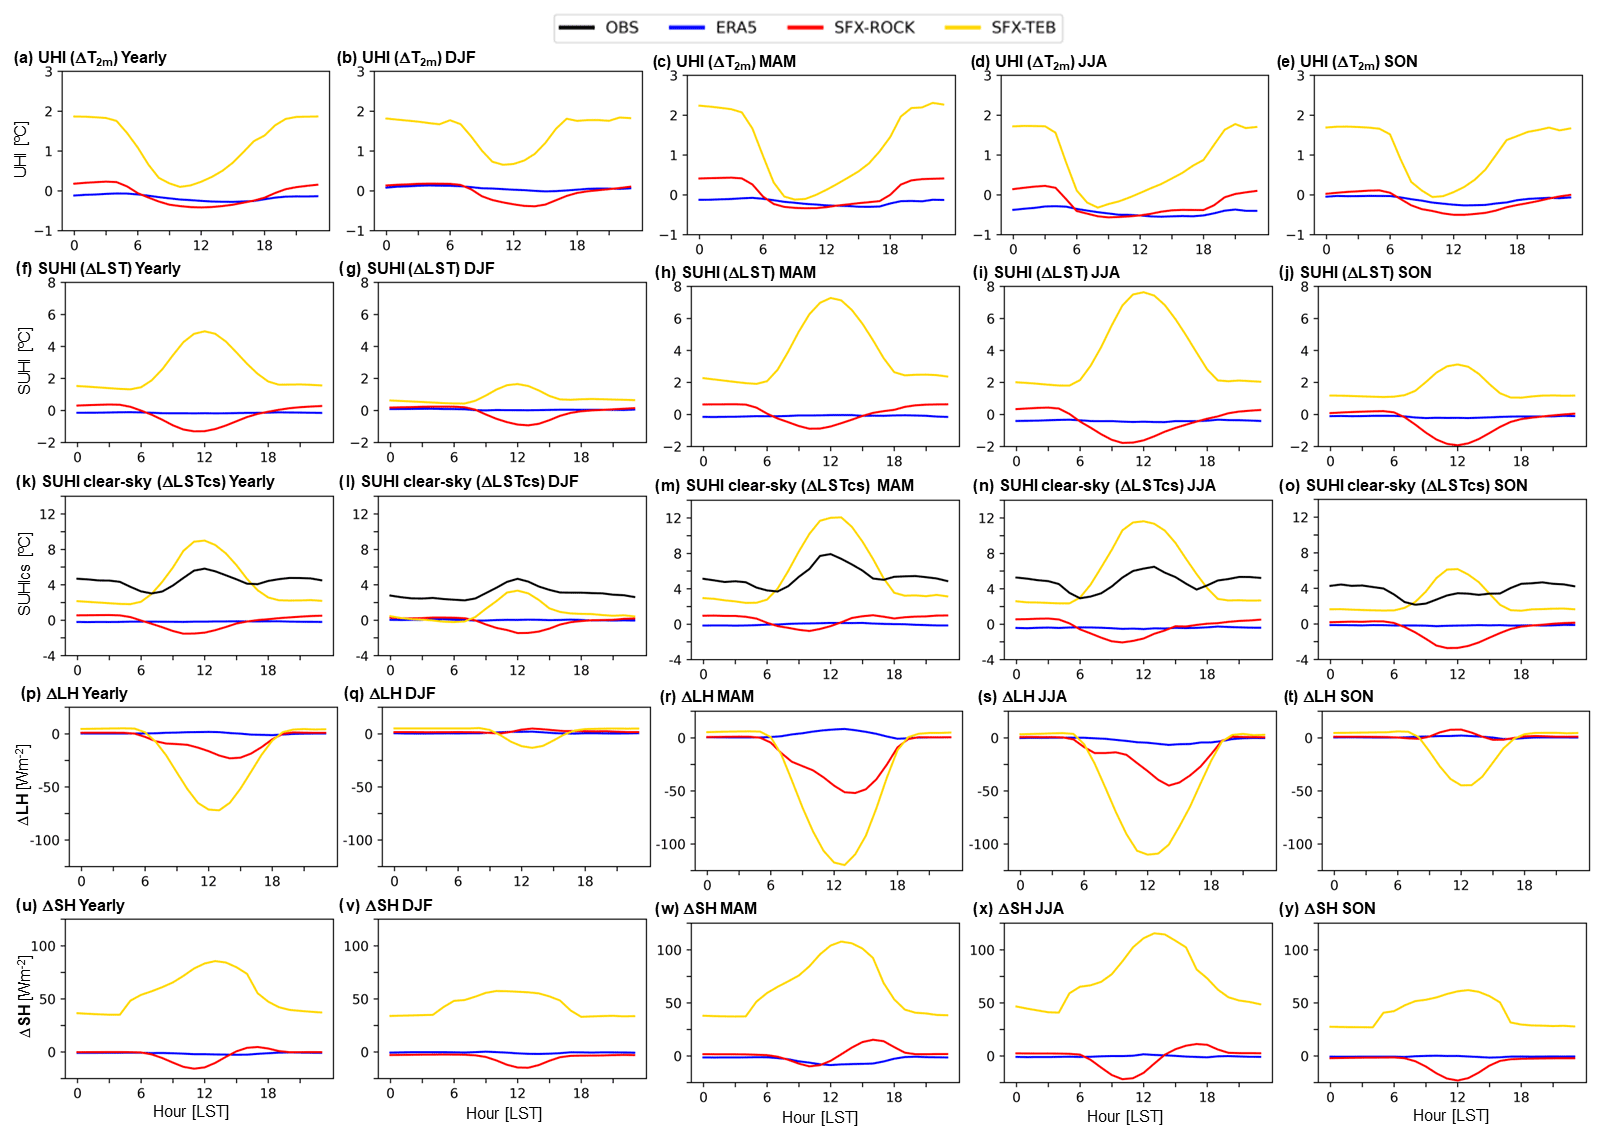
Figure 11Average diurnal cycle of UHI (a–e), SUHI under all-sky conditions (f–j), SUHI under clear-sky conditions (k–o), ΔLH (difference between surface latent heat flux between urban and rural areas; p–t), and ΔSH (difference between surface sensible heat flux between urban and rural areas; u–y). The columns, from left to right, represent averages taken over full year, DJF, MAM, JJA, and SON. The average diurnal cycles were computed over the 2004–2018 period. The different colors represent LSA-SAF (black), ERA5 (blue), SFX-ROCK (red), and SFX-TEB (yellow).
3.2 Intercomparison of the simulated UHI over Paris
The T2 m in ERA5 did not show any evidence of the UHI over Paris during the daytime (Fig. 9a) or during the nighttime (Fig. 9b). The UHI effect did not emerge in SFX-ROCK during the day- or nighttime (respectively, Fig. 9c and d). In contrast, the SFX-TEB T2 m showed a signature of the UHI over Paris during the daytime (Fig. 9e) and nighttime (Fig. 9f), in agreement with previous studies reporting the existence of the UHI effect over Paris (Lemonsu et al., 2014; Daniel et al., 2019). The enhanced performance in simulating the Paris UHI for SFX-TEB compared to ERA5 and SFX-ROCK was confirmed by the comparison against the UHI estimated from station observations (Fig. 10). During the daytime, ERA5 and SFX-ROCK underestimated the observed Parisian UHI effect throughout all seasons, while SFX-TEB slightly overestimated the UHI (Fig. 10a), resulting in an overall reduction in the bias in all seasons while also changing its sign (Fig. 10c). On the annual average, the systematic error magnitude reduced from 0.7 ∘C in ERA5 and SFX-ROCK to 0.2 ∘C in SFX-TEB. Moreover, SFX-TEB also improved the statistics of the daily UHI magnitude throughout all seasons (Fig. 10e), resulting in an overall S score value of 87 %, which is well above the 59 % and 56 %, respectively, found for ERA5 and SFX-ROCK. RMSE presents the lowest RMSE overall and in all seasons, although its magnitude is low (below 1 ∘C) for both experiments and ERA5 (Fig. 10g).
The results also showed that SFX-TEB improved the simulation of the UHI during the nighttime when compared to ERA5 and SFX-ROCK (Fig. 10b), reducing the bias error over all seasons by more than 1 ∘C, resulting in an overall |bias| value of 0.6 ∘C in SFX-TEB, 2.5 ∘C in ERA5, and 2.2 ∘C in SFX-ROCK (Fig. 10d). SFX-TEB largely improved the representation of the nighttime UHI statistical distribution in ERA5 and SFX-ROCK throughout all seasons (Fig. 10f). The overall S score was 25 % for ERA5, 31 % for SFX-ROCK, and 79 % for SFX-TEB. SFX-TEB presents the lowest RMSE overall and in all seasons, with a 2 ∘C decrease in relation to SFX-ROCK in every case (Fig. 10h).
The annual average diurnal cycle of the Paris UHI clearly illustrated the contrasting results from ERA5 and SFX-ROCK to SFX-TEB. SFX-TEB showed an annual averaged UHI intensity varying between +1.9 ∘C during the afternoon and night and +0.1 ∘C during the morning (Fig. 11a), while ERA5 and SFX-ROCK showed a nearly zero UHI effect throughout the entire diurnal cycle. The afternoon and nighttime UHI effect in SFX-TEB was highest during MAM (Fig. 11c) but remained above +1.5 ∘C throughout all seasons (Fig. 11b–e), while the morning UHI was strongest during DJF (Fig. 11b), and its minimum reached close to zero values during MAM (Fig. 11c), JJA (Fig. 11d), and SON (Fig. 11e).
The relatively strong magnitude of the nighttime UHI in SFX-TEB corresponds to a significant improvement compared to ERA5 and SFX-ROCK. This result contrasts with the relatively small magnitude of the nighttime SUHI in SFX-TEB, which largely underestimates observations. The better performance of SFX-TEB in simulating the UHI compared to the SUHI was likely related to the ability of the model to represent part of the nighttime urban canopy layer heating associated with prescribed anthropogenic heat fluxes, while the lack of land–atmosphere feedbacks inhibits this warmer canopy layer from affecting the LST.
The annual averaged SUHI measured as a difference between the urban and rural station locations under all-sky conditions computed from SFX-TEB peaked around 12:00 LT (local time), with a value of +5.0 ∘C, and reduced throughout the afternoon, stabilizing at a value around +1.5 ∘C during the night and morning (Fig. 11f). The inability of ERA5 and SFX-ROCK to simulate the SUHI throughout the diurnal cycle was also clearly evidenced in Fig. 11f. The SUHI was strongest for all hours of the day during MAM (Fig. 11h) and JJA (Fig. 11i) and weakest during DJF (Fig. 11g) and SON (Fig. 11j). We highlight the clear contrast between the UHI and SUHI diurnal cycles in Fig. 11. While the former peaked during the late afternoon and night and decreased sharply during the morning, the latter showed the opposite behavior, by peaking around midday and reaching the minimum during the nighttime and late afternoon. This result was related to the thermal inertia of the canopy layer resulting in the well-known lag between surface and near-surface air warming.
However, the analysis of the annual averaged SUHI measured as a difference between the urban and rural station locations under clear-sky conditions revealed significant differences in the average diurnal cycle simulated by SFX-TEB and observations (Fig. 11k). Indeed, SFX-TEB clearly overestimated the SUHI diurnal amplitude, as the maximum amplitude of the SUHI average diurnal cycle was 2.9 ∘C in observations and 6.8 ∘C in SFX-TEB. This large overestimation resulted from the SFX-TEB underestimation of the observed nighttime SUHI and the overestimation during the daytime. This effect was strongest during MAM (Fig. 11m) and JJA (Fig. 11n) and weakest during SON (Fig. 11o). During DJF (Fig. 11l), SFX-TEB underestimated the observed clear-sky SUHI intensity throughout the entire diurnal cycle. Despite its limitations, SFX-TEB represents an improvement, compared to ERA5 and SFX-ROCK, which fails to simulate the Parisian SUHI effect throughout the entire diurnal cycle (Fig. 11 l–o).
The strong overestimation of the annual averaged daytime SUHI in SFX-TEB was associated with a sharp difference in the surface turbulent heat fluxes between the urban and rural station locations. The urban site showed lower average latent heat flux (LH) values than the rural site by −75 W m−2 around noon (Fig. 11p) and higher sensible heat flux (SH) values by around +75 W m−2 (Fig. 11u). ERA5 and SFX-ROCK showed significantly smaller differences in LH and SH between urban and rural locations, in agreement with their inability to simulate the UHI and SUHI. The differences in SH and LH between urban and rural locations in SFX-TEB were strongest during MAM (respectively, Fig. 11r and w) and JJA (respectively, Fig. 11s and x) and weaker during SON (respectively, Fig. 11t and y) and DJF (respectively, Fig. 11q and v). These results suggest a direct link between the daytime overestimation of the daytime SUHI in SFX-TEB with the lack of surface–atmosphere feedback, in agreement with the recent findings of McNorton et al. (2021).
Finally, we noticed that the underestimation of the observed SUHI estimated as a point difference between the two station locations during the night hours and the overestimation during the morning and afternoon shown in Fig. 11k to o was coherent with the results presented in Fig. 6 for the daily minimum and daily maximum SUHI using the area-averaged SUHI definition. Moreover, these results were also coherent with the overestimation of the daily maximum UHI and underestimation of the daily minimum UHI presented in Fig. 9, including the daytime underestimation of both UHI and SUHI during DJF.
We assessed the added value of the SURFEX offline simulations to downscale ERA5 reanalysis over urban areas, focusing on the urban heat island effect over the city of Paris. The relevance of this study is threefold. First, ERA5 is a widely used product for climate research and applications, but an evaluation of its ability to represent urban climate is lacking. Second, it adds to recent works demonstrating the added value of the SURFEX offline downscaling framework for high-resolution computationally efficient urban climate simulation. Specifically, we leveraged on the hourly resolution of ERA5, the SURFEX simulations, and the LSA-SAF LST product to perform an unprecedented evaluation of the Parisian SUHI diurnal cycle, its key governing processes, and the ability of the different model setups to simulate them. Finally, the intercomparison of long-duration high spatial and temporal resolution datasets allow us to explore the key sensitivities of the UHI and SUHI and their implications for the development of urban climate modeling.
Our results showed that ERA5 does not reproduce the observed UHI or SUHI effects over Paris due to a lack of representation of urban processes in the ECMWF IFS and, also, the relatively coarse grid resolution, which is inappropriate for representing the highly heterogeneous urban environments. Increasing the grid resolution to the order of a few kilometers or less was found to be an important but not sufficient condition for simulating the urban heat island. Indeed, the high-resolution simulation employing the bulk bare rock approach to urban climate parameterization commonly used in large ensembles of ESMs, GCMs, and RCMs (see, e.g., Daniel et al., 2019; Langendijk et al., 2019; Zhao et al., 2021) was unable to reproduce the observed UHI and SUHI. In contrast, the high-resolution simulation employing an UCM for urban parameterization showed significant added value in reproducing the Parisian SUHI during the daytime when compared to ERA5 and SFX-ROCK.
Specifically, SFX-TEB reduced the systematic errors of daily maximum LST over urban pixels for all seasons (yearly average reduction of 4.2 and 3.9 ∘C, respectively, compared to ERA5 and SFX-ROCK). Moreover, SFX-TEB also improved the simulation of the observed daytime LST PDF over urban areas during all seasons compared to ERA5 and SFX-ROCK (with S values up to 20 % higher). On the other hand, the differences in LSTmin over urban surfaces and in LSTmax and LSTmin over natural surfaces were within observational uncertainty. In other words, SFX-TEB significantly improved the simulation of the urban daytime LST, while displaying similar skill to ERA5 and SFX-ROCK during the nighttime over urban areas and, also, over natural surfaces throughout the entire diurnal cycle.
SFX-TEB displayed a better performance overall in reproducing the observed daytime SUHI over Paris and its magnitude of variability (with the respective S score increasing by 67 % compared to ERA5). During the nighttime, we found a similar performance amongst ERA5, SFX-ROCK, and SFX-TEB in reproducing the nighttime SUHI effect throughout all seasons, with a generalized underestimation of the observed SUHI magnitude. Notice, however, that SFX-TEB showed a slight improvement in simulating the nighttime SUHI spatial pattern and temporal variability compared to ERA5 and SFX-ROCK.
ERA5 and SFX-ROCK did not reproduce the Parisian UHI effect throughout the entire diurnal cycle. In contrast, SFX-TEB displayed significant added value in simulating the observed UHI during the daytime and nighttime, resulting in an annual average bias magnitude reduction of 0.5 ∘C for the daytime and more than 1.5 ∘C for the nighttime compared to ERA5 and SFX-ROCK. The distribution of daily UHI variability was also improved in SFX-TEB, with the S score increased by roughly 30 % for the daytime and 50 % for the nighttime. The improved nighttime performance of SFX-TEB in simulating UHI relative to the SUHI may be explained by the ability of SFX-TEB to warm the urban canopy layer by anthropogenic heat releases combined with the lack of land–atmosphere feedbacks, which inhibits an LST response to the nighttime UHI. Finally, an analysis of the diurnal cycle of the simulated surface turbulent heat fluxes suggests that SFX-TEB overestimates the urban/rural contrasts in SH and LH during the daytime (particularly during warmer months). However, ERA5 and SFX-ROCK consistently underestimate the T2 m, LST, and turbulent flux contrast throughout the entire diurnal cycle. It is important to note that uncertainties in remotely sensed LST due to its directional property should be negligible in this study due to the coarse spatial resolution of the SURFEX model.
In summary, we highlight the large potential of the offline SURFEX-TEB framework for urban climate projections, given its ability to produce computationally efficient high-resolution climate projections with increased accuracy compared to ESMs, GCMs, and RCMs used in large ensemble datasets. Moreover, its relatively small computational cost allows us to perform a large number of climate experiments to investigate the impact of city-scale climate adaptation and mitigation strategies under different future emission scenarios. This framework may be improved in the future by including simplified representations of key land–atmosphere feedbacks. Specifically, the possibility to improve the ability of this framework in reproducing the nighttime SUHI by including coherent dynamical corrections to the forcing temperature and downwelling longwave radiation fields based on the T2 m diagnostic in the previous time step will be investigated in a subsequent work.
The SURFEX modeling platform of Météo-France is open source and can be downloaded freely at http://www.umr-cnrm.fr/surfex/spip.php?article387 (last access: July 2022; CNRM, 2016). It uses the CECILL-C license, a French equivalent to the L-GPL license (http://cecill.info/licences/Licence_CeCILL_V1.1-US.html, last access: July 2022; CEA-CNRS-Inria, 2013). It is updated at a relatively low frequency (every 3 to 6 months). If more frequent updates are needed – or if what is required is not in Open-SURFEX (DrHOOK, FA/LFI formats, or GAUSSIAN grid) – then readers are invited to follow the procedure to acquire a SVN (Subversion) account and access the real-time modifications of the code (see the instructions in the first link). In this study, SURFEX version 8.1 was used.
ERA5 data can be obtained freely from the Copernicus Climate Change Service Information website (https://cds.climate.copernicus.eu/cdsapp#!/dataset/reanalysis-era5-pressurelevels?tab=form, last access: July 2022; Copernicus Climate Change Service (C3S), 2019).
The LSA-SAF LST data can be obtained freely from their website (Trigo et al., 2011; climate data record: https://landsaf.ipma.pt/en/products/land-surface-temperature/lst-dr/, last access: July 2022; near real time: https://landsaf.ipma.pt/en/products/land-surface-temperature/lst/, last access: July 2022; https://doi.org/10.15770/EUM_SAF_LSA_0001, LSA SAF, 2019).
The NCDC GSOD weather station data can be obtained from their website (https://www.ncei.noaa.gov/access/metadata/landing-page/bin/iso?id=gov.noaa.ncdc:C00516, last access: 14 December 2021; DOC/NOAA/NESDIS/NCDC et al., 2022).
The considered fields (LST and T2 m) from the simulations (SFX-TEB and SFX-ROCK) considered in the present study are freely available at https://doi.org/10.5281/zenodo.5780448 (Nogueira et al., 2021b).
The conceptualization was done by MN, PMMS, and ED. LST data were acquired and processed by AH and SE. ERA5 processing was carried out by DCAL. The formal analysis and writing of the original draft were done by MN. All authors contributed to the writing, reviewing, and editing of the paper.
The contact author has declared that none of the authors has any competing interests.
Publisher's note: Copernicus Publications remains neutral with regard to jurisdictional claims in published maps and institutional affiliations.
The authors acknowledge the financial support of the Portuguese Fundação para a Ciência e a Tecnologia (FCT) I.P./MCTES through national funds (PIDDAC) – UIBD/50019/2020-IDL. We are also grateful for the scientific data from the CONTROL and LEADING projects, both funded by FCT, and our special thanks are extended to the EEA-Financial Mechanism 2014–2021 and the Portuguese Environment Agency through the Pre-defined Project-2 National Roadmap for Adaptation XXI (PDP-2), for all the provided data. Frederico Johannsen was funded by FCT (grant no. UI/BD/151498/2021). Finally, all authors acknowledge the ECMWF, for producing ERA5.
This research has been supported by the Portuguese Fundação para a Ciência e a Tecnologia (FCT) I.P./MCTES through national funds (PIDDAC) – UIBD/50019/2020-IDL.
This paper was edited by Jinkyu Hong and reviewed by two anonymous referees.
Balsamo, G., Agusti-Panareda, A., Albergel, C., Arduini, G., Beljaars, A., Bidlot, J., Blyth, E., Bousserez, N., Boussetta, S., Brown, A., Buizza, R., Buontempo, C., Chevallier, F., Choulga, M., Cloke, H., Cronin, M. F., Dahoui, M., De Rosnay, P., Dirmeyer, P. A., Drusch, M., Dutra, E., Ek, M. B., Gentine, P., Hewitt, H., Keeley, S. P. E., Kerr, Y., Kumar, S., Lupu, C., Mahfouf, J.-F., McNorton, J., Mecklenburg, S., Mogensen, K., Muñoz-Sabater, J., Orth, R., Rabier, F., Reichle, R., Ruston, B., Pappenberger, F., Sandu, I., Seneviratne, S. I., Tietsche, S., Trigo, I. F., Uijlenhoet, R., Wedi, N., Woolway, R. I., and Zeng, X.: Satellite and In Situ Observations for Advancing Global Earth Surface Modelling: A Review, Remote Sens., 10, 2038, https://doi.org/10.3390/rs10122038, 2018.
Beck, H. E., Pan, M., Roy, T., Weedon, G. P., Pappenberger, F., van Dijk, A. I. J. M., Huffman, G. J., Adler, R. F., and Wood, E. F.: Daily evaluation of 26 precipitation datasets using Stage-IV gauge-radar data for the CONUS, Hydrol. Earth Syst. Sci., 23, 207–224, https://doi.org/10.5194/hess-23-207-2019, 2019.
Beljaars, A. C. M., Viterbo, P., Miller, M. J., and Betts, A. K.: The Anomalous Rainfall over the United States during July 1993: Sensitivity to Land Surface Parameterization and Soil Moisture Anomalies, Mon. Weather Rev., 124, 362–383, https://doi.org/10.1175/1520-0493(1996)124<0362:TAROTU>2.0.CO;2, 1996.
Belmonte Rivas, M. and Stoffelen, A.: Characterizing ERA-Interim and ERA5 surface wind biases using ASCAT, Ocean Sci., 15, 831–852, https://doi.org/10.5194/os-15-831-2019, 2019.
Broadbent, A. M., Coutts, A. M., Tapper, N. J., and Demuzere, M.: The cooling effect of irrigation on urban microclimate during heatwave conditions, Urban Clim., 23, 309–329, https://doi.org/10.1016/j.uclim.2017.05.002, 2018.
Broadbent, M. A., Krayenhoff, S. E., and Georgescu, M.: The motley drivers of heat and cold exposure in 21st century US cities, P. Natl. Acad. Sci. USA, 117, 21108–21117, https://doi.org/10.1073/pnas.2005492117, 2020.
Calvet, J.-C., Noilhan, J., Roujean, J.-L., Bessemoulin, P., Cabelguenne, M., Olioso, A., and Wigneron, J.-P.: An interactive vegetation SVAT model tested against data from six contrasting sites, Agric. For. Meteorol., 92, 73–95, https://doi.org/10.1016/S0168-1923(98)00091-4, 1998.
Chen, F., Kusaka, H., Bornstein, R., Ching, J., Grimmond, C. S. B., Grossman-Clarke, S., Loridan, T., Manning, K. W., Martilli, A., Miao, S., Sailor, D., Salamanca, F. P., Taha, H., Tewari, M., Wang, X., Wyszogrodzki, A. A., and Zhang, C.: The integrated WRF/urban modelling system: development, evaluation, and applications to urban environmental problems, Int. J. Climatol., 31, 273–288, https://doi.org/10.1002/joc.2158, 2011.
Clinton, N. and Gong, P.: MODIS detected surface urban heat islands and sinks: Global locations and controls, Remote Sens. Environ., 134, 294–304, https://doi.org/10.1016/j.rse.2013.03.008, 2013.
CNRM: Open-SURFEX code package, SURFEX website [code], available at: https://www.umrcnrm.fr/surfex/spip.php?article387, last access: July 2022, 2016.
Conlon, K., Monaghan, A., Hayden, M., and Wilhelmi, O.: Potential Impacts of Future Warming and Land Use Changes on Intra-Urban Heat Exposure in Houston, Texas, PLoS One, 11, 1–19, https://doi.org/10.1371/journal.pone.0148890, 2016.
Copernicus Climate Change Service (C3S): ERA5: Fifth generation of ECMWF atmospheric reanalyses of the global climate, Copernicus Climate Change Service Climate Data Store (CDS), https://cds.climate.copernicus.eu/ (last access: 13 December 2021), 2019.
Daniel, M., Lemonsu, A., and Viguié, V.: Role of watering practices in large-scale urban planning strategies to face the heat-wave risk in future climate, Urban Clim., 23, 287–308, https://doi.org/10.1016/j.uclim.2016.11.001, 2018.
Daniel, M., Lemonsu, A., Déqué, M., Somot, S., Alias, A., and Masson, V.: Benefits of explicit urban parameterization in regional climate modeling to study climate and city interactions, Clim. Dynam., 52, 2745–2764, https://doi.org/10.1007/s00382-018-4289-x, 2019.
Davin, E. L., Rechid, D., Breil, M., Cardoso, R. M., Coppola, E., Hoffmann, P., Jach, L. L., Katragkou, E., de Noblet-Ducoudré, N., Radtke, K., Raffa, M., Soares, P. M. M., Sofiadis, G., Strada, S., Strandberg, G., Tölle, M. H., Warrach-Sagi, K., and Wulfmeyer, V.: Biogeophysical impacts of forestation in Europe: first results from the LUCAS (Land Use and Climate Across Scales) regional climate model intercomparison, Earth Syst. Dynam., 11, 183–200, https://doi.org/10.5194/esd-11-183-2020, 2020.
Dee, D. P., Uppala, S. M., Simmons, A. J., Berrisford, P., Poli, P., Kobayashi, S., Andrae, U., Balmaseda, M. A., Balsamo, G., Bauer, P., Bechtold, P., Beljaars, A. C. M., van de Berg, L., Bidlot, J., Bormann, N., Delsol, C., Dragani, R., Fuentes, M., Geer, A. J., Haimberger, L., Healy, S. B., Hersbach, H., Hólm, E. V., Isaksen, L., Kållberg, P., Köhler, M., Matricardi, M., McNally, A. P., Monge-Sanz, B. M., Morcrette, J.-J., Park, B.-K., Peubey, C., de Rosnay, P., Tavolato, C., Thépaut, J.-N., and Vitart, F.: The ERA-Interim reanalysis: configuration and performance of the data assimilation system, Q. J. Roy. Meteor. Soc., 137, 553–597, https://doi.org/10.1002/qj.828, 2011.
Deilami, K., Kamruzzaman, M., and Liu, Y.: Urban heat island effect: A systematic review of spatio-temporal factors, data, methods, and mitigation measures, Int. J. Appl. Earth Obs., 67, 30–42, https://doi.org/10.1016/j.jag.2017.12.009, 2018.
de Munck, C., Pigeon, G., Masson, V., Meunier, F., Bousquet, P., Tréméac, B., Merchat, M., Poeuf, P., and Marchadier, C.: How much can air conditioning increase air temperatures for a city like Paris, France?, Int. J. Climatol., 33, 210–227, https://doi.org/10.1002/joc.3415, 2013.
DOC/NOAA/NESDIS/NCDC National Climatic Data Center, NESDIS, NOAA, U.S. Department of Commerce: Global Surface Summary of the Day, National Centers for Environmental Information website,https://www.ncei.noaa.gov/access/metadata/landingpage/bin/iso?id=gov.noaa.ncdc:C00516, last access: July 2022.
Ermida, S. L., Trigo, I. F., DaCamara, C. C., Jiménez, C., and Prigent, C.: Quantifying the Clear-Sky Bias of Satellite Land Surface Temperature Using Microwave-Based Estimates, J. Geophys. Res.-Atmos., 124, 844–857, https://doi.org/10.1029/2018JD029354, 2019.
Freitas, S. C., Trigo, I. F., Bioucas-Dias, J. M., and Gottsche, F.-M.: Quantifying the Uncertainty of Land Surface Temperature Retrievals From SEVIRI/Meteosat, IEEE T. Geosci. Remote, 48, 523–534, https://doi.org/10.1109/TGRS.2009.2027697, 2010.
Garuma, G. F.: Review of urban surface parameterizations for numerical climate models, Urban Climate, 24, 830–851, https://doi.org/10.1016/j.uclim.2017.10.006, 2018.
Georgescu, M., Morefield, E. P., Bierwagen, G. B., and Weaver, P. C.: Urban adaptation can roll back warming of emerging megapolitan regions, P. Natl. Acad. Sci. USA, 111, 2909–2914, https://doi.org/10.1073/pnas.1322280111, 2014.
Gibelin, A.-L., Calvet, J.-C., Roujean, J.-L., Jarlan, L., and Los, S. O.: Ability of the land surface model ISBA-A-gs to simulate leaf area index at the global scale: Comparison with satellites products, J. Geophys. Res.-Atmos., 111, D18102, https://doi.org/10.1029/2005JD006691, 2006.
Hamdi, R., Degrauwe, D., and Termonia, P.: Coupling the Town Energy Balance (TEB) Scheme to an Operational Limited-Area NWP Model: Evaluation for a Highly Urbanized Area in Belgium, Weather Forecast., 27, 323–344, https://doi.org/10.1175/WAF-D-11-00064.1, 2012.
Hamdi, R., Giot, O., Troch, R. D., Deckmyn, A., and Termonia, P.: Future climate of Brussels and Paris for the 2050s under the A1B scenario, Urban Climate, 12, 160–182, https://doi.org/10.1016/j.uclim.2015.03.003, 2015.
Hamdi, R., Kusaka, H., Doan, Q.-V., Cai, P., He, H., Luo, G., Kuang, W., Caluwaerts, S., Duchêne, F., Van Schaeybroek, B., and Termonia, P.: The State-of-the-Art of Urban Climate Change Modeling and Observations, Earth Syst. Environ., 4, 631–646, https://doi.org/10.1007/s41748-020-00193-3, 2020.
He, B.-J., Wang, J., Liu, H., and Ulpiani, G.: Localized synergies between heat waves and urban heat islands: Implications on human thermal comfort and urban heat management., Environ. Res., 193, 110584, https://doi.org/10.1016/j.envres.2020.110584, 2021.
Hersbach, H., Bell, B., Berrisford, P., Hirahara, S., Horányi, A., Muñoz-Sabater, J., Nicolas, J., Peubey, C., Radu, R., Schepers, D., Simmons, A., Soci, C., Abdalla, S., Abellan, X., Balsamo, G., Bechtold, P., Biavati, G., Bidlot, J., Bonavita, M., De Chiara, G., Dahlgren, P., Dee, D., Diamantakis, M., Dragani, R., Flemming, J., Forbes, R., Fuentes, M., Geer, A., Haimberger, L., Healy, S., Hogan, R. J., Hólm, E., Janisková, M., Keeley, S., Laloyaux, P., Lopez, P., Lupu, C., Radnoti, G., de Rosnay, P., Rozum, I., Vamborg, F., Villaume, S., and Thépaut, J.-N.: The ERA5 global reanalysis, Q. J. Roy. Meteor. Soc., 146, 1999–2049, https://doi.org/10.1002/qj.3803, 2020.
Hong, J.-W., Hong, J., Kwon, E. E., and Yoon, D. K.: Temporal dynamics of urban heat island correlated with the socio-economic development over the past half-century in Seoul, Korea, Environ. Pollut., 254, 112934, https://doi.org/10.1016/j.envpol.2019.07.102, 2019.
Imhoff, M. L., Zhang, P., Wolfe, R. E., and Bounoua, L.: Remote sensing of the urban heat island effect across biomes in the continental USA, Remote Sens. Environ., 114, 504–513, https://doi.org/10.1016/j.rse.2009.10.008, 2010.
IPCC: Climate Change 2013 – The Physical Science Basis: Working Group I Contribution to the Fifth Assessment Report of the Intergovernmental Panel on Climate Change, Cambridge University Press, https://doi.org/10.1017/CBO9781107415324, 2014.
Jacob, D., Teichmann, C., Sobolowski, S., Katragkou, E., Anders, I., Belda, M., Benestad, R., Boberg, F., Buonomo, E., Cardoso, R. M., Casanueva, A., Christensen, O. B., Christensen, J. H., Coppola, E., De Cruz, L., Davin, E. L., Dobler, A., Domínguez, M., Fealy, R., Fernandez, J., Gaertner, M. A., García-Díez, M., Giorgi, F., Gobiet, A., Goergen, K., Gómez-Navarro, J. J., Alemán, J. J. G., Gutiérrez, C., Gutiérrez, J. M., Güttler, I., Haensler, A., Halenka, T., Jerez, S., Jiménez-Guerrero, P., Jones, R. G., Keuler, K., Kjellström, E., Knist, S., Kotlarski, S., Maraun, D., van Meijgaard, E., Mercogliano, P., Montávez, J. P., Navarra, A., Nikulin, G., de Noblet-Ducoudré, N., Panitz, H.-J., Pfeifer, S., Piazza, M., Pichelli, E., Pietikäinen, J.-P., Prein, A. F., Preuschmann, S., Rechid, D., Rockel, B., Romera, R., Sánchez, E., Sieck, K., Soares, P. M. M., Somot, S., Srnec, L., Sørland, S. L., Termonia, P., Truhetz, H., Vautard, R., Warrach-Sagi, K., and Wulfmeyer, V.: Regional climate downscaling over Europe: perspectives from the EURO-CORDEX community, Reg. Environ. Change, 20, 51, https://doi.org/10.1007/s10113-020-01606-9, 2020.
Johannsen, F., Ermida, S., Martins, J. P. A., Trigo, I. F., Nogueira, M., and Dutra, E.: Cold Bias of ERA5 Summertime Daily Maximum Land Surface Temperature over Iberian Peninsula, Remote Sens., 11, https://doi.org/10.3390/rs11212570, 2019.
Kaloustian, N. and Diab, Y.: Effects of urbanization on the urban heat island in Beirut, Urban Climate, 14, 154–165, https://doi.org/10.1016/j.uclim.2015.06.004, 2015.
Konstantinov, P., Varentsov, M., and Esau, I.: A high density urban temperature network deployed in several cities of Eurasian Artic, Environ. Res. Lett., 13, https://doi.org/10.1088/1748-9326/aacb84, 2018.
Koster, R. D., Dirmeyer, P. A., Guo, Z., Bonan, G., Chan, E., Cox, P., Gordon, C. T., Kanae, S., Kowalczyk, E., Lawrence, D., Liu, P., Lu, C.-H., Malyshev, S., McAvaney, B., Mitchell, K., Mocko, D., Oki, T., Oleson, K., Pitman, A., Sud, Y. C., Taylor, C. M., Verseghy, D., Vasic, R., Xue, Y., and Yamada, T.: Regions of strong coupling between soil moisture and precipitation, Science, 305, 1138–1140, https://doi.org/10.1126/science.1100217, 2004.
Krayenhoff, E. S., Moustaoui, M., Broadbent, A. M., Gupta, V., and Georgescu, M.: Diurnal interaction between urban expansion, climate change and adaptation in US cities, Nat. Clim. Change, 8, 1097–1103, https://doi.org/10.1038/s41558-018-0320-9, 2018.
Kusaka, H., Hara, M., and Takane, Y.: Urban Climate Projection by the WRF Model at 3-km Horizontal Grid Increment: Dynamical Downscaling and Predicting Heat Stress in the 2070's August for Tokyo, Osaka, and Nagoya Metropolises, J. Meteorol. Soc. Japan Ser. II, 90B, 47–63, https://doi.org/10.2151/jmsj.2012-B04, 2012.
Langendijk, G. S., Rechid, D., and Jacob, D.: Urban Areas and Urban–Rural Contrasts under Climate Change: What Does the EURO-CORDEX Ensemble Tell Us? – Investigating near Surface Humidity in Berlin and Its Surroundings, Atmosphere, 10, 730, https://doi.org/10.3390/atmos10120730, 2019.
Le Moigne, P. (Ed.): SURFEX Scientific Documentation, V8.1, http://www.umr-cnrm.fr/surfex/IMG/pdf/surfex_scidoc_v8.1.pdf (last access: 21 December 2021), 2018.
Lemonsu, A., Kounkou-Arnaud, R., Desplat, J., Salagnac, J.-L., and Masson, V.: Evolution of the Parisian urban climate under a global changing climate, Clim. Change, 116, 679–692, https://doi.org/10.1007/s10584-012-0521-6, 2013.
Lemonsu, A., Beaulant, A. L., Somot, S., and Masson, V.: Evolution of heat wave occurrence over the Paris basin (France) in the 21st century, Clim. Res., 61, 75–91, https://doi.org/10.3354/cr01235, 2014.
Lemonsu, A., Viguié, V., Daniel, M., and Masson, V.: Vulnerability to heat waves: Impact of urban expansion scenarios on urban heat island and heat stress in Paris (France), Urban Climate, 14, 586–605, https://doi.org/10.1016/j.uclim.2015.10.007, 2015.
Le Roy, B., Lemonsu, A., Kounkou-Arnaud, R., Brion, D., and Masson, V.: Long time series spatialized data for urban climatological studies: A case study of Paris, France, Int. J. Climatol., 40, 3567–3584, https://doi.org/10.1002/joc.6414, 2020.
Li, Y., Sun, Y., Li, J., and Gao, C.: Socioeconomic drivers of urban heat island effect: Empirical evidence from major Chinese cities, Sustain. Cities Soc., 63, 102425, https://doi.org/10.1016/j.scs.2020.102425, 2020.
Li, Z.-L., Tang, B.-H., Wu, H., Ren, H., Yan, G., Wan, Z., Trigo, I. F., and Sobrino, J. A.: Satellite-derived land surface temperature: Current status and perspectives, Remote Sens. Environ., 131, 14–37, https://doi.org/10.1016/j.rse.2012.12.008, 2013.
LSA SAF: Land Surface Temperature Climate Data Record – MSG, EUMETSAT SAF on Land Surface Analysis, LSA SAF [data set], https://doi.org/10.15770/EUM_SAF_LSA_0001, 2019.
Manoli, G., Fatichi, S., Schläpfer, M., Yu, K., Crowther, T. W., Meili, N., Burlando, P., Katul, G. G., and Bou-Zeid, E.: Magnitude of urban heat islands largely explained by climate and population, Nature, 573, 55–60, https://doi.org/10.1038/s41586-019-1512-9, 2019.
Masson, V.: A Physically-Based Scheme For The Urban Energy Budget In Atmospheric Models, Bound.-Lay. Meteorol., 94, 357–397, https://doi.org/10.1023/A:1002463829265, 2000.
Masson, V., Le Moigne, P., Martin, E., Faroux, S., Alias, A., Alkama, R., Belamari, S., Barbu, A., Boone, A., Bouyssel, F., Brousseau, P., Brun, E., Calvet, J.-C., Carrer, D., Decharme, B., Delire, C., Donier, S., Essaouini, K., Gibelin, A.-L., Giordani, H., Habets, F., Jidane, M., Kerdraon, G., Kourzeneva, E., Lafaysse, M., Lafont, S., Lebeaupin Brossier, C., Lemonsu, A., Mahfouf, J.-F., Marguinaud, P., Mokhtari, M., Morin, S., Pigeon, G., Salgado, R., Seity, Y., Taillefer, F., Tanguy, G., Tulet, P., Vincendon, B., Vionnet, V., and Voldoire, A.: The SURFEXv7.2 land and ocean surface platform for coupled or offline simulation of earth surface variables and fluxes, Geosci. Model Dev., 6, 929–960, https://doi.org/10.5194/gmd-6-929-2013, 2013.
Masson, V., Lemonsu, A., Hidalgo, J., and Voogt, J.: Urban Climates and Climate Change, Annu. Rev. Environ. Resour., 45, 411–444, https://doi.org/10.1146/annurev-environ-012320-083623, 2020.
McNorton, J. R., Arduini, G., Bousserez, N., Agustí-Panareda, A., Balsamo, G., Boussetta, S., Choulga, M., Hadade, I., and Hogan, R. J.: An Urban Scheme for the ECMWF Integrated Forecasting System: Single-Column and Global Offline Application, J. Adv. Model. Earth Sy., 13, e2020MS002375, https://doi.org/10.1029/2020MS002375, 2021.
Muller, C. L., Chapman, L., Grimmond, C. S. B., Young, D. T., and Cai, X.: Sensors and the city: a review of urban meteorological networks, Int. J. Climatol., 33, 1585–1600, https://doi.org/10.1002/joc.3678, 2013.
Nogueira, M.: Inter-comparison of ERA-5, ERA-interim and GPCP rainfall over the last 40 years: Process-based analysis of systematic and random differences, J. Hydrology, 583, 124632, https://doi.org/10.1016/j.jhydrol.2020.124632, 2020.
Nogueira, M. and Soares, P. M. M.: A surface modelling approach for attribution and disentanglement of the effects of global warming from urbanization in temperature extremes: application to Lisbon, Environ. Res. Lett., 14, 114023, https://doi.org/10.1088/1748-9326/ab465f, 2019.
Nogueira, M., Albergel, C., Boussetta, S., Johannsen, F., Trigo, I. F., Ermida, S. L., Martins, J. P. A., and Dutra, E.: Role of vegetation in representing land surface temperature in the CHTESSEL (CY45R1) and SURFEX-ISBA (v8.1) land surface models: a case study over Iberia, Geosci. Model Dev., 13, 3975–3993, https://doi.org/10.5194/gmd-13-3975-2020, 2020a.
Nogueira, M., Lima, D. C. A., and Soares, P. M. M.: An integrated approach to project the future urban climate response: Changes to Lisbon's urban heat island and temperature extremes, Urban Climate, 34, 100683, https://doi.org/10.1016/j.uclim.2020.100683, 2020b.
Nogueira, M., Boussetta, S., Balsamo, G., Albergel, C., Trigo, I. F., Johannsen, F., Miralles, D. G., and Dutra, E.: Upgrading Land-Cover and Vegetation Seasonality in the ECMWF Coupled System: Verification With FLUXNET Sites, METEOSAT Satellite Land Surface Temperatures, and ERA5 Atmospheric Reanalysis, J. Geophys. Res.-Atmos., 126, e2020JD034163, https://doi.org/10.1029/2020JD034163, 2021a.
Nogueira, M., Hurduc, A., Ermida, S., Lima, D. C., Soares, P. M., Johannsen, F., and Dutra, E.: Assessment of the Paris urban heat island in ERA5 and offline SURFEX-TEB (v8.1) simulations using METEOSAT land surface temperature product (Version 1), Zenodo [data set], https://doi.org/10.5281/zenodo.5780448, 2021b.
Oke, T. R.: City size and the urban heat island, Atmos. Environ., 7, 769–779, https://doi.org/10.1016/0004-6981(73)90140-6, 1973.
Oke, T. R.: The energetic basis of the urban heat island, Q. J. Roy. Meteor. Soc., 108, 1–24, https://doi.org/10.1002/qj.49710845502, 1982.
Oke, T. R.: Boundary layer climates, 2nd ed, Q. J. Roy. Meteor. Soc., 114, 484, https://doi.org/10.1002/qj.49711448412, 1987.
Oke, T. R., Mills, G., Christen, A., and Voogt, J. A.: Urban Climates, Cambridge University Press, Cambridge, https://doi.org/10.1017/9781139016476, 2017.
Peng, S., Piao, S., Ciais, P., Friedlingstein, P., Ottle, C., Bréon, F.-M., Nan, H., Zhou, L., and Myneni, R. B.: Surface Urban Heat Island Across 419 Global Big Cities, Environ. Sci. Technol., 46, 696–703, https://doi.org/10.1021/es2030438, 2012.
Perkins, S. E., Pitman, A. J., Holbrook, N. J., and McAneney, J.: Evaluation of the AR4 Climate Models' Simulated Daily Maximum Temperature, Minimum Temperature, and Precipitation over Australia Using Probability Density Functions, J. Climate, 20, 4356–4376, https://doi.org/10.1175/JCLI4253.1, 2007.
Roth, M., Oke, T. R., and Emery, W. J.: Satellite-derived urban heat islands from three coastal cities and the utilization of such data in urban climatology, Int. J. Remote Sens., 10, 1699–1720, https://doi.org/10.1080/01431168908904002, 1989.
Salamanca, F., Krpo, A., Martilli, A., and Clappier, A.: A new building energy model coupled with an urban canopy parameterization for urban climate simulations – part I. formulation, verification, and sensitivity analysis of the model, Theor. Appl. Climatol., 99, 331, https://doi.org/10.1007/s00704-009-0142-9, 2009.
Salamanca, F., Martilli, A., Tewari, M., and Chen, F.: A Study of the Urban Boundary Layer Using Different Urban Parameterizations and High-Resolution Urban Canopy Parameters with WRF, J. Appl. Meteorol. Climatol., 50, 1107–1128, https://doi.org/10.1175/2010JAMC2538.1, 2011.
Sarkar, A. and De Ridder, K.: The Urban Heat Island Intensity of Paris: A Case Study Based on a Simple Urban Surface Parametrization, Bound.-Lay. Meteorol., 138, 511–520, https://doi.org/10.1007/s10546-010-9568-y, 2011.
Schoetter, R., Kwok, Y. T., de Munck, C., Lau, K. K. L., Wong, W. K., and Masson, V.: Multi-layer coupling between SURFEX-TEB-v9.0 and Meso-NH-v5.3 for modelling the urban climate of high-rise cities, Geosci. Model Dev., 13, 5609–5643, https://doi.org/10.5194/gmd-13-5609-2020, 2020.
Schwarz, N., Lautenbach, S., and Seppelt, R.: Exploring indicators for quantifying surface urban heat islands of European cities with MODIS land surface temperatures, Remote Sens. Environ., 115, 3175–3186, https://doi.org/10.1016/j.rse.2011.07.003, 2011.
Stewart, I. D.: A systematic review and scientific critique of methodology in modern urban heat island literature, Int. J. Climatol., 31, 200–217, https://doi.org/10.1002/joc.2141, 2011.
Stewart, I. D. and Oke, T. R.: Local Climate Zones for Urban Temperature Studies, B. Am. Meteorol. Soc., 93, 1879–1900, https://doi.org/10.1175/BAMS-D-11-00019.1, 2012.
Trigo, I. F., Dacamara, C. C., Viterbo, P., Roujean, J.-L., Olesen, F., Barroso, C., Camacho-de- Coca, F., Carrer, D., Freitas, S. C., García-Haro, J., Geiger, B., Gellens-Meulenberghs, F., Ghilain, N., Meliá, J., Pessanha, L., Siljamo, N., and Arboleda, A.: The Satellite Application Facility for Land Surface Analysis, Int. J. Remote Sens., 32, 2725–2744, https://doi.org/10.1080/01431161003743199, 2011.
Trigo, I. F., Boussetta, S., Viterbo, P., Balsamo, G., Beljaars, A., and Sandu, I.: Comparison of model land skin temperature with remotely sensed estimates and assessment of surface-atmosphere coupling, J. Geophys. Res.-Atmos., 120, 12096–12111, https://doi.org/10.1002/2015JD023812, 2015.
Trusilova, K., Schubert, S., Wouters, H., Früh, B., Grossman-Clarke, S., Demuzere, M., and Becker, P.: The urban land use in the COSMO-CLM model: a comparison of three parameterizations for Berlin, Meteorol. Z., 25, 231–244, https://doi.org/10.1127/metz/2015/0587, 2016.
Urraca, R., Huld, T., Gracia-Amillo, A., Martinez-de-Pison, F. J., Kaspar, F., and Sanz-Garcia, A.: Evaluation of global horizontal irradiance estimates from ERA5 and COSMO-REA6 reanalyses using ground and satellite-based data, Solar Energ., 164, 339–354, https://doi.org/10.1016/j.solener.2018.02.059, 2018.
Viguié, V., Lemonsu, A., Hallegatte, S., Beaulant, A.-L., Marchadier, C., Masson, V., Pigeon, G., and Salagnac, J.-L.: Early adaptation to heat waves and future reduction of air-conditioning energy use in Paris, Environ. Res. Lett., 15, 075006, https://doi.org/10.1088/1748-9326/ab6a24, 2020.
World Health Organization: Global status report on alcohol and health 2018, World Health Organization, Geneva, edited by: Poznyak, V. and Rekve, D., ISBN 978-92-4-156563-9, 2018.
Zhao, L., Lee, X., Smith, R. B., and Oleson, K.: Strong contributions of local background climate to urban heat islands, Nature, 511, 216–219, https://doi.org/10.1038/nature13462, 2014.
Zhao, L., Oleson, K., Bou-Zeid, E., Krayenhoff, E. S., Bray, A., Zhu, Q., Zheng, Z., Chen, C., and Oppenheimer, M.: Global multi-model projections of local urban climates, Nat. Clim. Change, 11, 152–157, https://doi.org/10.1038/s41558-020-00958-8, 2021.
Zhou, B., Rybski, D., and Kropp, J. P.: On the statistics of urban heat island intensity, Geophys. Res. Lett., 40, 5486–5491, https://doi.org/10.1002/2013GL057320, 2013.
Zhou, B., Rybski, D., and Kropp, J. P.: The role of city size and urban form in the surface urban heat island, Sci. Rep.-UK, 7, 4791, https://doi.org/10.1038/s41598-017-04242-2, 2017.
Zhou, J., Yu, B., and Qin, J.: Multi-Level Spatial Analysis for Change Detection of Urban Vegetation at Individual Tree Scale, Remote Sens., 6, 9086–9103, https://doi.org/10.3390/rs6099086, 2014.