the Creative Commons Attribution 4.0 License.
the Creative Commons Attribution 4.0 License.
 | 05 Jul 2022
The impact of hurricane disturbances on a tropical forest: implementing a palm plant functional type and hurricane disturbance module in ED2-HuDi V1.0
Rafael L. Bras
Marcos Longo
Tamara Heartsill Scalley
Hurricanes commonly disturb and damage tropical forests. Hurricane frequency and intensity are predicted to change under the changing climate. The short-term impacts of hurricane disturbances to tropical forests have been widely studied, but the long-term impacts are rarely investigated. Modeling is critical to investigate the potential response of forests to future disturbances, particularly if the nature of the disturbances is changing with climate. Unfortunately, existing models of forest dynamics are not presently able to account for hurricane disturbances. Therefore, we implement the Hurricane Disturbance in the Ecosystem Demography model (ED2) (ED2-HuDi). The hurricane disturbance includes hurricane-induced immediate mortality and subsequent recovery modules. The parameterizations are based on observations at the Bisley Experimental Watersheds (BEW) in the Luquillo Experimental Forest in Puerto Rico. We add one new plant functional type (PFT) to the model – Palm, as palms cannot be categorized into one of the current existing PFTs and are known to be an abundant component of tropical forests worldwide. The model is calibrated with observations at BEW using the generalized likelihood uncertainty estimation (GLUE) approach. The optimal simulation obtained from GLUE has a mean relative error of −21 %, −12 %, and −15 % for stem density, basal area, and aboveground biomass, respectively. The optimal simulation also agrees well with the observation in terms of PFT composition (+1 %, −8 %, −2 %, and +9 % differences in the percentages of “Early”, “Mid”, “Late”, and “Palm” PFTs, respectively) and size structure of the forest (+0.8 % differences in the percentage of large stems). Lastly, using the optimal parameter set, we study the impact of forest initial condition on the recovery of the forest from a single hurricane disturbance. The results indicate that, compared to a no-hurricane scenario, a single hurricane disturbance has little impact on forest structure (+1 % change in the percentage of large stems) and composition (<1 % change in the percentage of each of the four PFTs) but leads to 5 % higher aboveground biomass after 80 years of succession. The assumption of a less severe hurricane disturbance leads to a 4 % increase in aboveground biomass.
- Article
(1845 KB) - Full-text XML
-
Supplement
(2879 KB) - BibTeX
- EndNote


Hurricanes are an important disturbance agent in tropical forests. They damage individual trees and reduce aboveground biomass (Zimmerman et al., 1994; Uriarte et al., 2019; Rutledge et al., 2021; Leitold et al., 2021). For example, Hurricane Hugo in 1989 uprooted and snapped 20 % of the trees at El Verde in the Luquillo Experimental Forest (LEF), Puerto Rico (Walker, 1991; Walker et al., 1992; Zimmerman et al., 1994), and reduced the aboveground biomass by 50 % at Bisley in the LEF (Scatena et al., 1993; Heartsill Scalley et al., 2010). Hurricane Katrina in 2005 damaged about 320 million large trees on US Gulf Coast forests, and the damaged trees are equivalent to 50 %–140 % of the net annual US carbon sink (Chambers et al., 2007). In the long term, the recovery from those damages will alter forest species composition and structure (Royo et al., 2011; Heartsill Scalley, 2017).
Hurricane-induced mortality varies with many factors, including hurricane severity (Parker et al., 2018), environmental conditions (Uriarte et al., 2019; Hall et al., 2020), forest exposure to hurricane winds (Boose et al., 1994, 2004), forest structure (Zhang et al., 2022b), and traits and size of individual trees (Curran et al., 2008; Lewis and Bannar-Martin, 2011). Trees with a larger diameter have been found to be more resistant to wind forces but more likely to suffer broken branches (Lewis and Bannar-Martin, 2011). Species with higher wood density tend to suffer less from hurricane disturbances (Zimmerman et al., 1994; Curran et al., 2008). Hurricanes with heavier rainfall and stronger wind generally lead to higher mortality (Uriarte et al., 2019; Hall et al., 2020), and forests that are more exposed to strong winds tend to have higher mortality (Uriarte et al., 2019). However, forests with a more wind-resistant structure and composition experience lower mortality even during a stronger hurricane event or a higher exposure (Zhang et al., 2022b).
The recovery from hurricanes also depends on many factors, such as the disturbance severity (Walker, 1991; Everham and Brokaw, 1996; Cole et al., 2014; Heartsill Scalley, 2017) and traits of individual species (Curran et al., 2008; Lewis and Bannar-Martin, 2011). Species with lower wood density have shorter times to resprout (Paz et al., 2018), higher growth rate (King et al., 2006), and shorter biomass recovery times (Curran et al., 2008). The number of resprouts of some species further varies with time since disturbance (Brokaw, 1998). Less severe disturbances lead to a faster recovery and a higher recovery of stem density and aboveground biomass compared to the level observed prior to the disturbance (Wang and Eltahir, 2000; Parker et al., 2018). For example, observations on a tropical forest canopy in western Mexico after two hurricanes – category 2 Jova and category 4 Patricia – showed that Hurricane Jova destroyed 11 % of the aboveground biomass while Hurricane Patricia destroyed 23 %; the recovery was more rapid after the less intense Hurricane Jova (Parker et al., 2018). Although the immediate mortality and subsequent recovery of tropical forest from hurricane disturbances have been thoroughly studied via observations, the long-term effects of consecutive hurricane disturbances on tropical forests have rarely been studied. Models that can simulate the immediate mortality and subsequent recovery of an ecosystem can play a role in understanding potential mechanisms driving the mortality and recovery of the ecosystems and studying the long-term effects of disturbances, particularly if the nature of the disturbances is changing with climate. Uriarte et al. (2009) implemented hurricane disturbance in a forest simulator and investigated the long-term dynamics of forest composition, diversity, and structure. However, the biological and environmental processes of the forest simulator used are not dynamic and thus the model cannot simulate the adaptation of vegetation to the changes of environment (Jorgensen, 2008). Vegetation dynamics models can account for changes in the ecosystem resulting from a changing environment (Medvigy et al., 2009; Longo et al., 2019a) and further allow us to explore scenarios via synthetic experiments and thus emulate what might happen in forests under novel environmental conditions. For example, Feng et al. (2018) used the Ecosystem Demography model (ED2) (Moorcroft et al., 2001) to study the impact of climate change on the forest studied in Uriarte et al. (2009). The ED2 model is a process-based vegetation dynamics model; it represents the size and age structure of the forest, and thus the model can represent the observed differential impact from disturbances (such as fire, drought, insects, land use change, and natural disturbances) across plants of different functional groups and size classes (Medvigy et al., 2012; Zhang et al., 2015; Miller et al., 2016; Trugman et al., 2016). However, the impacts of hurricane disturbances have not been implemented in vegetation dynamics models, and thus the long-term effects on the forest of a changing hurricane regime have not been investigated.
As mortality and recovery vary with species, the species composition of the forest is affected by hurricane disturbances. In modeling studies, it is impractical to incorporate each and every individual species (tens and hundreds). To address variation in species diversity, there has been a strong effort in the past decades to incorporate functional diversity in vegetation dynamics models (Moorcroft et al., 2001; Sakschewski et al., 2016; Fisher et al., 2018; Fisher and Koven, 2020). This effort acknowledges the variability in traits and trade-offs of species that exist in tropical forests (e.g., Baraloto et al., 2010). Three plant functional types (PFTs) are identified for the species in tropical forests during a secondary succession after a disturbance; they are early, mid, and late successional PFTs (hereafter Early, Mid, and Late PFTs), corresponding to the three successional stages during the secondary succession (Kammesheidt, 2000). Specifically, Early PFT dominates the early successional stage of the recovery; it includes fast growing pioneer species that have low wood density, establish and recruit in open gaps formed after disturbances, and grow rapidly in the high light environment. Mid PFT dominates the mid successional stage after a disturbance and includes species that have intermediate growth and are somewhat shade tolerant. Late PFT dominates the late successional stage and includes species that have slow growth and are shade tolerant. Using three PFTs is also a compromise between representing a range of life strategies while not adding too much complexity in model parameterizations (Moorcroft et al., 2001; Medlyn et al., 2005).
One important and distinct species in tropical forests in the Caribbean islands is the palm species Prestoea montana (Sierra palm). Many studies in the Luquillo Mountains have either excluded palms from analysis (Zimmerman et al., 1994) or treated palms separately from other trees (Zimmerman et al., 1994; Uriarte et al., 2009), as indeed they are monocots, not dicots like the other trees in the forest. A previous study that simulates the response of the forests in the Luquillo Mountains to climate change using the ED2 model categorized the palm species as a Late PFT tree (Feng et al., 2018). However, there are important differences: palms are more resistant to hurricane damage as compared to trees (Francis and Gillespie, 1993; Uriarte et al., 2019) and are more resilient to hurricane disturbances due to their high fecundity under open canopy (Lugo and Rivera Batlle, 1987; Lugo et al., 1998) and have high tolerance to shade (Ma et al., 2015). All those characteristics separate palms from other trees and favor the survival of palms after hurricane disturbances. We believe palms cannot be categorized into one of the existent PFT categories in the model, and hence we define a new PFT – Palm.
In this paper, we describe the implementation of hurricane mortality and recovery modules that account for the variation with disturbance severity, forest resistance state, PFT, and diameter size of individual stems in the Ecosystem Demography model (ED2). The model is then used to study the recovery of a tropical rainforest after hurricane disturbances. The results indicate that a scenario with a single hurricane disturbance has little long-term impact on forest structure and composition but enhances the aboveground biomass accumulation of a tropical rainforest, relative to a scenario of no hurricane disturbance.
2.1 Census observations
Tree censuses were carried out at Bisley Experimental Watersheds (BEW) in the Luquillo Experimental Forest in Puerto Rico starting in 1989, 3 months before Hurricane Hugo (pre-Hugo 1989), and repeated 3 months after Hurricane Hugo (post-Hugo 1989), and then every 5 years since then (1994, 1999, 2004, 2009, 2014). The census recorded the diameter at breast height (1.3 m) (DBH) and species of each stem with DBH ≥2.5 cm and height (H) of selected stems in 85 permanent forest dynamics plots in the forest. Each plot is a 10 m diameter circle and plots are 40 m apart extending 13 ha. The last census was conducted 3 months after Hurricane Maria and recorded auxiliary damage information of each stem. The detailed description of the study site and the census observations can be found in Zhang et al. (2022b), the census data between 1989 and 2014 are from Zhang et al. (2022a), and the post-Maria census data are from Zhang et al. (2020). Following Zhang et al. (2022b), species are categorized into four PFTs according to their successional status based on previous studies (Walker, 1991; Schowalter and Ganio, 1999; Uriarte et al., 2005; Muscarella et al., 2013; Heartsill Scalley, 2017; Feng et al., 2018): early, mid, and late successional tropical trees and palms (Early, Mid, Late, and Palm PFT, respectively). The stem density, DBH growth rate, and basal area are calculated from the census data for each PFT in each census. The aboveground biomass (AGB) of Early, Mid, and Late PFTs are estimated from DBH using the AGB–DBH relationship from Scatena et al. (1993); the AGB of Palm PFT is estimated from the AGB–height relationship of P. montana from Scatena et al. (1993) and the height–DBH relationship of Palm PFT from the census observations at our study site (Sect. 2.2.2).
2.2 Model description
The Ecosystem Demography model (ED) is a cohort-based model, and it describes the growth, reproduction, and mortality of each cohort in each patch in a forest site. A cohort is a group of stems with the same PFT and similar diameter size and age. A patch is an area with the same environmental condition and disturbance history. A cohort accumulates carbon through photosynthesis, and the net accumulated carbon (i.e., gross primary productivity minus respiration and maintenance of living tissues) will be used for growth and reproduction. When a cohort is mature, reaching the maturity reproductive height (e.g., 18 m), the cohort will allocate a portion of carbon to reproduction (e.g., 30 % of net carbon accumulation to seeds, flowers, and fruits), and the rest of the net accumulated carbon will be used for structural growth. Structural growth is quantified by the increase in DBH through structural-biomass–DBH allometries; stem height, leaf biomass, and crown area are then scaled given the H–DBH, leaf-biomass–DBH, and crown-area–DBH allometries. Each cohort will also experience mortality from multiple factors, including aging, competition, and disturbance, which will be described in detail in Sect. 2.3.2.
The model simulates transient fluxes of carbon, water, and energy during short-term physiological responses and long-term ecosystem composition and structure responses to changes in environmental conditions. The second version of the ED model, ED2, modifies the calculations of radiation and evapotranspiration of the original ED model, leading to a more realistic long-term response of ecosystem composition and structure to atmospheric forcing (Medvigy et al., 2009; Longo et al., 2019a). Details of the ED and ED2 models can be found in Moorcroft et al. (2001), Medvigy et al. (2009), and Longo et al. (2019b). Here we add a new PFT (Palm) and implement hurricane disturbance in the ED2 model, and we name it ED2-HuDi V1.0.
2.2.1 Adding palm as a new PFT
The standard ED2 model represents a variety of broadleaf trees, needleleaf trees, grasses, and lianas (Albani et al., 2006; Medvidy et al., 2009; Longo et al., 2019b; di Porcia e Brugnera et al., 2019). Yet, to date, none of the existing PFTs describe the traits of palms, even though palms are a globally abundant component of tropical forests (Muscarella et al., 2020). We know that the palm species that occurs at our study site (Prestoea montana) has a low wood density of 0.31 g cm−3 (Swenson and Umana, 2015) and it grows fast in open canopies like early successional tropical trees (Lugo and Rivera Batlle, 1987; Lugo et al., 1998) and are tolerant to shade like late successional tropical trees (Ma et al., 2015). Hence, we assume that the physiological traits of Palm have the same probability distributions as those of Late PFT except for wood density which is assumed the same as that of Early PFT. The allometries of Palm are discussed separately in the next section.
2.2.2 Modifying the allometric relationship
The allometric relationships between stem height (H; m) and diameter at breast height (DBH; cm) for four tropical PFTs (Early, Mid, Late, and Palm) come from census data at BEW in the Luquillo Experimental Forest in Puerto Rico (Zhang et al., 2022a). The relationships take the form
where a and b are PFT-specific scale and shape parameters (Fig. 1). The diameter range for the Palm PFT is between 10 and 20 cm, while that for the tree PFTs is between 2.5 and 90 cm. The scale parameter a is 1.6388, 2.2054, 2.3833, and 0.1628 for Early, Mid, Late, and Palm PFT, respectively. The shape parameter b is 0.80, 0.64, 0.59, and 1.47 for the four PFTs (Table S1 in the Supplement). Palm has a smaller scale parameter and a significantly larger shape parameter, demonstrating that palms are shorter than other PFTs given the same DBH. The constrained diameter range and the H–DBH allometry of Palm make it difficult for palms to access sunlight and would normally prevent them from establishing in the ED2 model. A previous study implementing liana to the ED2 model also experienced similar issues (di Porcia e Brugnera et al., 2019). They used an allometry for liana with DBH between 3 and 20 cm, and then for lianas with DBH less than 3 cm they used the allometry of early successional trees (di Porcia e Brugnera et al., 2019). Following a similar approach and to make sure Palm has reasonable opportunity to compete with a reasonable diameter range, we assume that the minimum height of Palm in the model is 4.8 m (corresponding to 10 cm DBH of Palm; other PFTs have a minimum height of 1.5 m for recruitment), and when Palm grows to a height of 18 m (corresponding to 20 cm DBH) – maximum height observed for the Palm in the forest (Fig. 1) – they will allocate all the carbon to reproduction instead of growth (relative allocation to reproduction is 1 for Palm, and 0.3 for other PFTs) (Table S1).
For other allometric relationships, such as leaf-biomass–DBH, structural-biomass–DBH, and crown-area–DBH relationships, we used the model default for Early, Mid, and Late PFTs and assumed that Palm has the same relationships as Early (Fig. S1 in the Supplement).
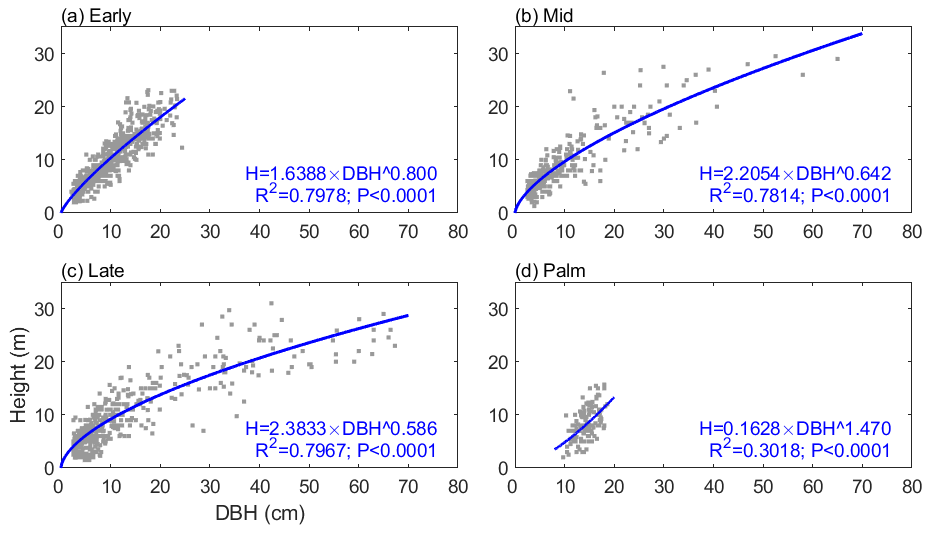
Figure 1The height–diameter (DBH) relationship for the four PFTs: (a) Early, (b) Mid, (c) Late, and (d) Palm. The gray dots are observations with outliers removed (Sect. S1), and the blue lines are the estimated height–DBH relationship based on these observations. The height–DBH model and the corresponding coefficient of determination (R2) and p value for each PFT are given at the bottom of each panel.
2.2.3 Implementing hurricane disturbance
The ED2 model accounts for several types of disturbances, such as fires, land use, and logging (Albani et al., 2006; Longo et al., 2019b), but not hurricane disturbance. To account for hurricane impacts, we implement a hurricane-induced wind mortality module and a seedling recovery module in the model. The wind mortality module consists of two parts – the disturbance rate of the forest area (λd) and the survivorship of each cohort (sc) in the disturbed areas. For any patch with pre-disturbance area A, the area that is affected by disturbance (Ad) is proportional to λd, following Moorcroft et al. (2001): . The disturbed area (Ad) will be disturbed and become a new patch (age 0), and the population within the new patch will be determined by the survivorship to disturbance. The remaining area (A−Ad) will remain undisturbed, and the stem density will remain unchanged. The survivorship of each cohort (sc) is the ratio of the cohort density that survived after the disturbance to the cohort density before the disturbance, and it is cohort dependent. The cohorts that survived in disturbed areas will make up the new patch (age 0). In this study, we assume that the forest is fully disturbed and λd=1. The survivorship of each cohort sc is calculated as , where λc is the mortality of each cohort. Based on previous analyses, λc varies with hurricane strength, forest structure, the PFT category, and the DBH size of the cohort (Zhang et al., 2022b). First, we implement a binary model for the mortality with respect to hurricane wind, where mortality occurs when hurricane wind exceeds a threshold and no mortality otherwise. This binary model is built on the binary relationship between hurricane-induced forest damage and hurricane wind speed from nine hurricane events at BEW between 1989 and 2017 (Sects. S2, S3, and S4 in the Supplement). The wind speed threshold was set at 41 m s−1 because the strongest hurricane wind that caused no damage to the forest at BEW was 40 m s−1 from Hurricane Georges in 1998 and the lowest wind speed that caused damage to the forest was 42 m s−1 from Hurricane Maria in 2017 (Sects. S2, S3, and S4). If mortality occurs (i.e., wind speed exceeds the threshold), the mortality rate of each cohort (λc) is a continuous function of the size structure of the forest, represented by the proportion of large stems (DBH ≥10 cm) to the total recruited stems (DBH ≥ 2.5 cm). Figure 2 shows the mortality of each PFT and DBH class during two hurricane events (Hugo and Maria) based on census observations at BEW (see Sect. 2.1). We fit a logistic function to the mortality–structure pair of each PFT and DBH class based on the observed pairs of mortality and structure from the two hurricane events.

Figure 2The mortality as a function of the size structure of the forest for each PFT and DBH class. The size structure is represented as the proportion of large stems (DBH ≥10 cm) to the total number of stems in the forest (DBH ≥2.5 cm). The dots represent observed mortality and proportion of large stems pairs from Hurricane Hugo and Hurricane Maria (Zhang et al., 2022b). Four colors represent four PFTs. The solid lines represent the estimated mortality as a logistic function of the proportion of large stems. The panel on the left is for small stems and that on the right is for large stems.
Hurricanes not only cause immediate stem mortality, but also affect the establishment of seedlings by opening the canopy (Everham and Brokaw, 1996; Brokaw, 1998; Uriarte et al., 2009, 2012). Brokaw (1998) pointed out that hurricanes promote germination and seedling establishment of the early successional species C. schreberiana, and that the seedling establishment ends shortly after the disturbance as the canopy closes. The census data at BEW also show abundant recruitments of the Early PFT in the first 20 years after Hurricane Hugo and decreasing recruitment with time (Zhang et al., 2022a). Therefore, based on the recruitment of Early PFT from the census data (Zhang et al., 2022a), we implement a recovery module where the seedling density from seed rain (ns; individuals m−2 yr−1) decreases with time since the last disturbance, and the reduction varies with PFT categories as follows:
where ns is the seedling density t years after the last hurricane disturbance, and n0 and α are PFT-dependent parameters. Specifically, Mid, Late, and Palm PFTs maintain a low but constant seedling density (n0=0.05 individuals m−2 yr−1 and α=0 yr−1). The Early PFT has high seedling density (n0=0.2 individuals m−2 yr−1) shortly after a hurricane disturbance and the seedling rate decreases to the same value as other PFTs about 20 years after the disturbance (α=0.06 yr−1), and it continues to decrease thereafter (Fig. 3).
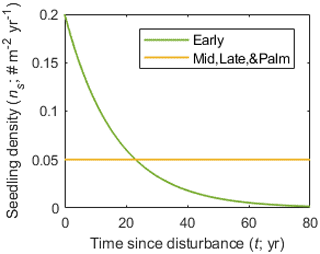
Figure 3The seedling density from seed rain for each PFT as a function of time since disturbance.
2.3 Model calibration and validation
2.3.1 The GLUE approach
The concept of the generalized likelihood uncertainty estimation (GLUE) (Binley and Beven, 1991; Beven and Binley, 1992; Mirzaei et al., 2015) has been widely used to calibrate parameters in complex hydrological models. The steps of GLUE include (1) generating a number of samples of the parameter set from a prior distribution of the parameters, (2) running the simulation for each parameter set, (3) choosing a likelihood function (or weight function) to calculate the weight of each simulation based on observations and the estimated outputs from the model simulation, and (4) selecting the optimal parameter set and estimating the posterior distribution of the parameters and the posterior distribution of the output variables. Here we use GLUE, for the first time, to calibrate the parameters in the ED2 model.
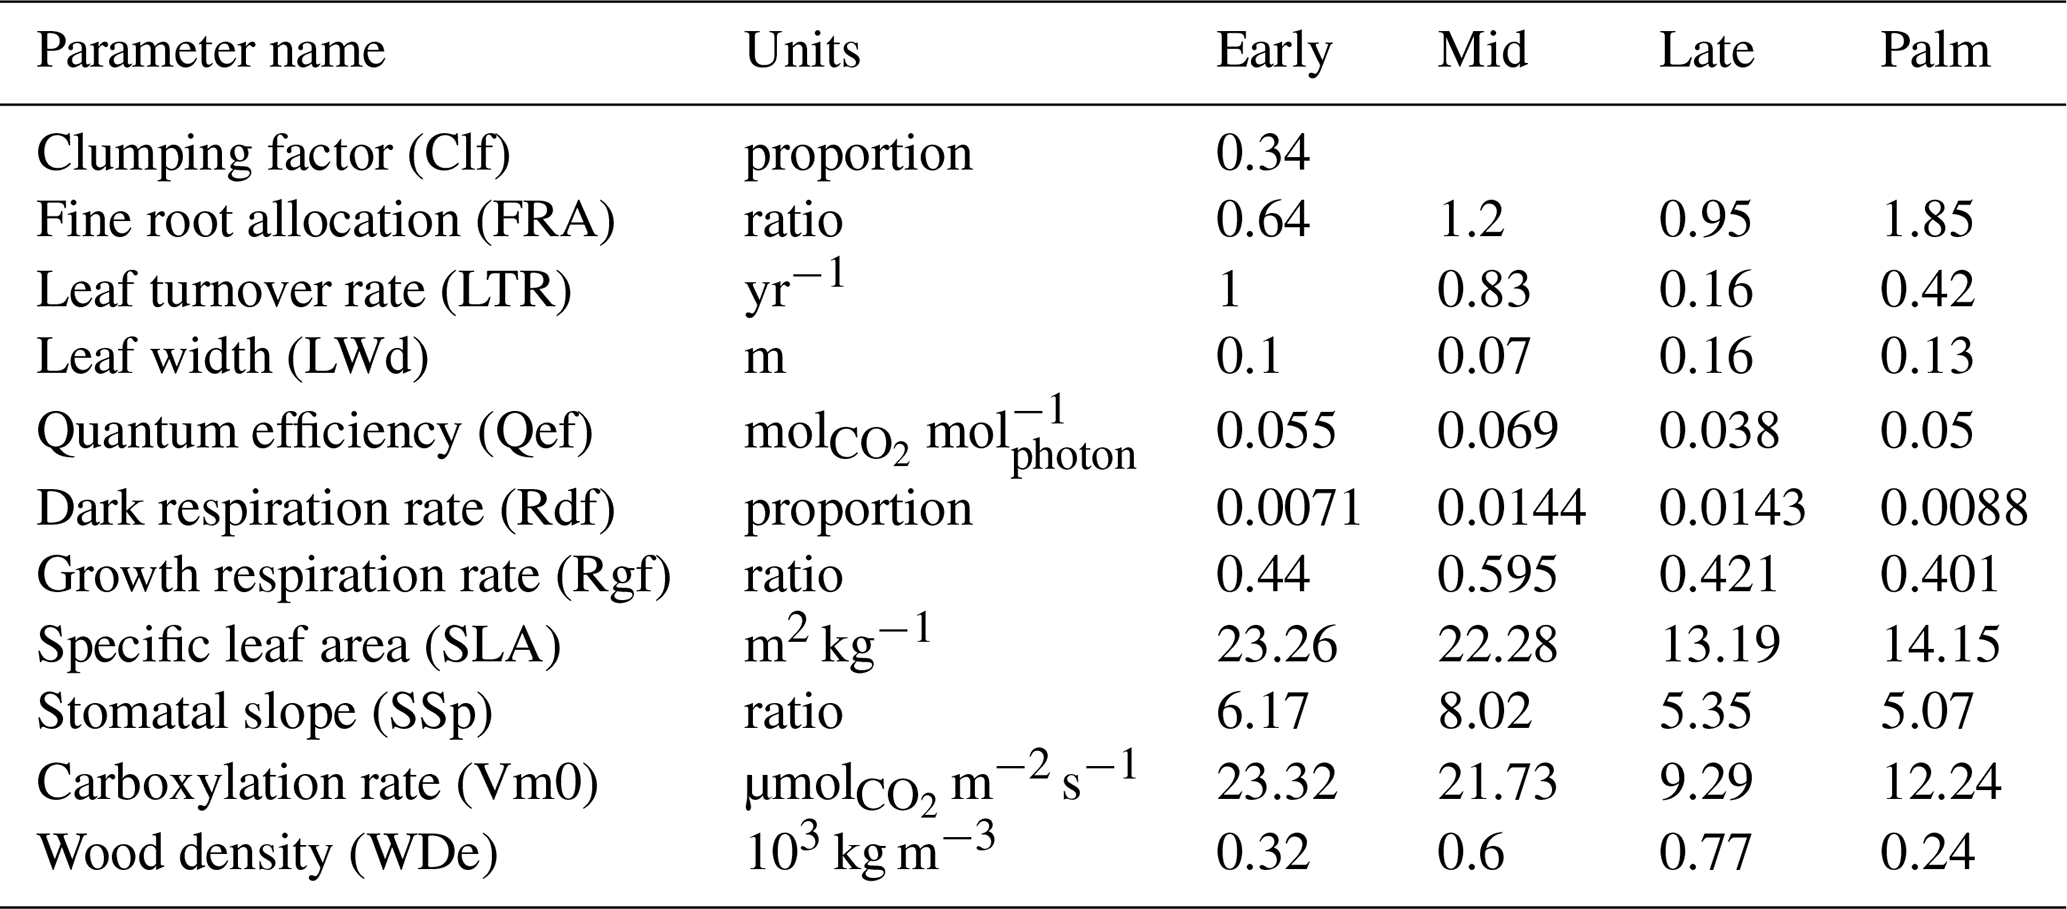
To obtain the prior distribution of parameters, we build on a previous parameter sensitivity analysis using the ED2 model for a nearby forest in Puerto Rico by Feng et al. (2018). They demonstrated that model simulations are sensitive to 10 parameters, listed in Table 1, and provided the posterior mean and 95 % confidence limits of the parameters calibrated from plant traits observations using the Predictive Ecosystem Analyzer (PEcAn; LeBauer et al., 2013). We select the same parameters and use the posterior distribution of those parameters from Feng et al. (2018) as the prior distribution for the GLUE in our study. We cannot just use their parameter distributions as final results because our implementation has a site-specific set of allometric equations, explicitly represents palms as a separate PFT, and considers hurricane disturbances (Sect. 2.2). Feng et al. (2018) reported only the mean and the upper and lower 95 % confidence limits of the parameters (not the entire distribution); we assume that the parameters have lognormal distributions. For the Palm PFT, we assume that it has the same distributions as Late, except that the woody tissue density of Palm has the same distribution as that of Early. From a different study system, Wang et al. (2013) constrained the dark respiration factor from 0.01–0.03 to 0.01–0.016 by assimilating observations of model output variables. Following Wang et al. (2013), we restrict the dark respiration factor to a smaller range with a uniform distribution between 0.005 and 0.0175 for each PFT. Consistent with Meunier et al. (2022), we found that model results are also sensitive to the parameter clumping factor (Fig. S2). Therefore, we add the parameter of clumping to the set being calibrated. Clumping factor is the ratio of effective LAI to the total LAI and affects the transmission of radiation (Chen and Black, 1992); it ranges from zero to one with zero representing leaves clumped in a single point (0-area) and one representing leaves uniformly distributed in the unit area. Because of tree crowns, branches, and subbranches, leaves of the plant canopy are not uniformly distributed per unit area nor clumped at a single point. We assume that the clumping factor is the same for all PFTs, and the distribution of the clumping factor is uniform between 0.2 and 0.8.
We sample 10 000 realizations for the 41 parameters (10 parameters for each of the four PFTs and the 1 clumping parameter for all PFTs) using the Latin hypercube sampling method embedded in MATLAB (Stein, 1987). We initialize the model with the pre-Hugo 1989 observations and run the model for 29 years, corresponding to 1989–2018. The first 25 years (1989–2014) are used to calibrate the model with observations and the last 4 years (2015–2018) for validation. We tested different calibration lengths (1989–1999, 1989–2004, and 1989–2009). The 1989–2009 calibration period gives the same optimal simulation as the 1989–2014 calibration period (Fig. 4), but shorter calibration lengths 1989–1999 (Fig. S3) and 1989–2004 (Fig. S4) throw away critical recovery information and cannot give robust simulation in the validation period. We calculate the mean squared errors (MSEs) of each realization (j, j=1, 2, …, 10 000) for the calibration period,
where represents the jth model simulations for variable i at time t, and Yi,t represents observations for variable i at time t. The variables used to calculate MSE are stem density (individuals m−2), average DBH growth rate (cm (5 yr)−1), and basal area (BA) (cm2 m−2) for the four PFTs (n=12) (Fig. 4). Times are the six census years (m=6) with observations before Hurricane Maria: post-Hugo 1989, 1994, 1999, 2004, 2009, 2014. Because BA is directly calculated from the DBH of each cohort and weighted by the stem density of the cohort, the size structure (distribution of stem DBHs) of the forest is implicitly represented with the variables overall stem density and total BA. Moreover, the PFT composition is explicitly represented with the PFT-specific variables. Therefore, the MSE metric implicitly measures the performance of a realization in describing the observed time series of the forest's size structure and PFT composition.
We select the simulation with the smallest MSE as the optimal simulation and the corresponding parameter set as the optimal parameter set. To obtain the posterior distribution of parameters, we first calculate the weight (likelihood) of each realization following Binley and Beven (1991),
which is then rescaled to sum to one (), where K is the parameter that controls the weight of each realization. When K=0, every simulation will have equal weights, and when K=∞, the single best simulation will have a rescaled weight of 1 while all others will be zero. We select K such that the weighted standard deviations from simulations are within and overlap as much as possible with the standard deviations of observations, indicating that the parameters in those weighted simulations are reasonable given the uncertainty of the observations (Freer et al., 1996). The weighted standard deviation of variable X is calculated as
where is the weighted mean of the simulated variable. We find that K=8 has the best performance on the posterior estimates of output variables stem density, aboveground biomass, basal area, proportion of each PFT, and proportion of large stems (Figs. 4, S5, and S6). Lastly, the posterior empirical cumulative distribution function (CDF) of the parameters is obtained as
The posterior empirical CDFs are then fit to lognormal distributions.
2.3.2 Non-hurricane mortality
The non-hurricane mortality of Palm is not well represented in the model (Fig. S7), as initially calibrated. The observed non-hurricane mortality is an overall mortality regardless of the cause of the death and is calculated from non-hurricane censuses, whereas the non-hurricane mortality in model simulations includes aging mortality, competition mortality, and disturbance mortality. We turned off all disturbances except for hurricane disturbance and treefall disturbance. The disturbance mortality includes the background exogenous mortality and treefall disturbance rate. Background mortality rate is 0.014 yr−1 for small trees and zero for large stems because, following Moorcroft et al. (2001), this mortality is accounted for in the treefall disturbance rate (i.e., the background mortality of large trees is what causes the treefall disturbance). The treefall disturbance rate mortality is a combination of the area impacted by treefall disturbance and the survivorship of this disturbance. By default, in ED2, it is assumed that the treefall disturbance rate is 0.014 yr−1, survivorship to treefall disturbance is zero for large trees and 10 % for small trees, and thus overall treefall mortality is 0.014 yr−1 for large trees and 0.0126 yr−1 for small trees. Competition mortality is related to carbon starvation (i.e., negative net carbon accumulation) due to light and water limitation and varies with cohorts. Aging mortality is the reciprocal of the longevity of the cohort without any biotic and abiotic influences, and it is modeled as a constant for each PFT depending on the wood density of the PFT (ρPFT) relative to the wood density of the Late PFT (ρLate): (Moorcroft et al., 2001). Since Palm has a much lower “wood” density (0.31 g cm−3; Swenson and Umana, 2015) than the Late PFT (model default 0.9 g cm−3), the aging mortality of Palm is ∼0.1 yr−1, or the longevity of palms would be equivalent to ∼10 years. However, this is in contrast to the average age of the palm species in the Luquillo Experimental Forest, which was found to be 61.1 years and the oldest palms were more than 100 years old in 1982 (Lugo and Rivera Batlle, 1987). This suggests that the aging mortality of Palm calculated from its woody tissue density is a drastic overestimation. Therefore, we assume that the aging mortality of Palm is independent of its woody tissue density and is 0 yr−1, the same as that of Late.
With a lower mortality (decreasing aging mortality from ∼0.1 to 0), the density of Palm increases continuously in the forest because of continuously recruiting seedlings, while the density of other PFTs and the AGB of all PFTs are less affected (Fig. S8). A previous study showed that hurricane disturbance can result in an increase in seed production in the palm species (Gregory and Sabat, 1996). Therefore, we calibrate the seedling recovery module of Palm that we implemented in Sect. 2.2.3. Specifically, we test several recovery seedling densities (Eq. 2) for Palm, assuming that the seedling density of Palm is similar to that of Early – decreasing with time since disturbance – but with different starting seedling level (n0) and decaying factor (α). We tested 36 combinations of n0 varying from 0 to 0.05 individuals m−2 yr−1 with an interval of 0.01 individuals m−2 yr−1 and α varying from 0 to 0.05 yr−1 with an interval of 0.01 yr−1. We found that five of them lead to a smaller MSE (Eq. 3) than the GLUE optimal simulation (0.1678, 0.1662, 0.1642, 0.1646, and 0.1691 for the five experiments and 0.1803 for the GLUE optimal), and the five combinations have the same starting seedling density (n0=0.02 individuals m−2 yr−1) but different values of the decaying factor (α=0.01, 0.02, 0.03, 0.04, and 0.05 yr−1, respectively) (Fig. S9). To choose from the five decaying values, we compared the recovery density schemes with the observed recruitment of Palms (stems entering the census with DBH ≥2.5 cm and H≥1.5 m each year). As we do not have seedlings but only recruited stems in our census data, we assumed that seedling density has the same response (varying with time since disturbance) as recruitment, but not necessarily the same magnitude (density) as recruitment. Based on the census data, there were 37, 64, 50, 34, and 32 palms recruited in the 85 plots (78.5 m2 each plot) in 1994, 1999, 2004, 2009, and 2014 censuses, respectively, which corresponds to 0.0011, 0.0019, 0.0015, 0.0010, and 0.0010 individuals m−2 yr−1 after 5, 10, 15, 20, and 25 years of the Hugo disturbance. In other words, the recruitment decreases to half of the starting level in 20–25 years, or a decaying factor α≈0.03 yr−1. We assume that the seedling density has the same decaying rate as the recruitment density and thus we select the seedling density scheme n0=0.02 individuals m−2 yr−1 and α=0.03 yr−1 as the seedling recovery scheme for Palm.
After changing the aging mortality of Palm to zero and the seedling density to a lower and slowly decreasing value, we did not repeat the GLUE. This is because Palm has constrained DBH size (between 10 and 25 cm) and decreasing the aging mortality increases its density while decreasing seedling reproduction decreases its density, which maintains the overall density of Palm, without affecting other variables of Palm nor variables of other PFTs (Fig. S9). Therefore, we use the parameter set found from the GLUE (Table 1) but with 0-aging mortality and a lower seedling density recovery (n0=0.02 individuals m−2 yr−1 and α=0.03 yr−1) for simulations in the following studies.
2.4 Parameter sensitivity analyses and variance decomposition
Using a similar approach to PEcAn (LeBauer et al., 2013), we analyze the sensitivity of model simulations to the parameters and the contribution of the parameters to the variances. Specifically, we set up nine experiments for each of the 41 parameters, corresponding to the nine quantiles (10th, 20th, …, 90th) of the posterior distribution of each parameter, while all other parameters remain constant at their optimal. For the total 369 sensitivity experiments, we initialize the model with the pre-Hugo observation and run each experiment for 25 years (1989–2014).
To study the stability of the optimal parameter set, we calculate the MSE of each experiment and compare it with the MSE of the optimal. To quantitatively study the sensitivity of output variables to the parameters, we calculate the standardized cubic regression coefficient (β),
where p and x are a specific parameter and the corresponding output variable. is the cubic regression function of x on p: , estimated from the pairs of parameter p and variable x along the nine quantiles of the posterior distribution of parameter p. is the partial derivative of on p at po, where po and xo are the optimal value of the parameter and the corresponding output variable. Only when the R2 metric of the regression function is significant at a 99 % confidence level via a Student's t test is β calculated. We calculate β for 20 variables (stem density, BA, AGB, and leaf area index (LAI) of each PFT and of all PFTs) and for the 41 parameters. The β for the variables at the first and the 25th simulation years are selected to represent the short-term and long-term response of modeled variables to the parameters, respectively.
To quantitatively study the uncertainty of the simulated variables (stem density, AGB, BA, LAI, etc.) from the uncertainties of the parameters, we calculate the coefficient of variation (θ) for each variable resulting from experiments with different parameters:
where σ and μ are the standard deviation and the mean value of the variable from the nine experiments of the parameter. To study the contribution of each parameter to the uncertainties of the simulated variables, we calculate the total variance from all the sensitivity experiments (VarT) and the variance from experiments of each parameter (Varp) and decompose the total variance as follows:
where Varp is the variance of model outputs from experiments with different values of parameter p, Np is the total number of parameters (Np=41), and ω represents the variance from the interaction among parameters.
2.5 Experiments with different initial conditions
To study the impact of the initial condition of the forest on the recovery, we set up two experiments with different initial forest states (pre-Hugo state and pre-Maria state) with a hurricane disturbance in the first simulation year (experiment IhugoH1 and experiment ImariaH1, hereafter), and one control experiment with pre-Hugo state and no hurricane disturbance in all simulation years (experiment IhugoHn, hereafter). The three experiments run for 112 simulation years (corresponding to years 1989–2100). The meteorological drivers between 1989 and 2017 are observations from meteorological towers at BEW (González, 2017), and the meteorological drivers between 2018 to 2100 are randomly sampled from the observations between 1989 and 2017. Hurricane disturbance is turned off in all simulation years for experiment IhugoHn and in all but the first simulation year for experiments IhugoH1 and ImariaH1. Thus, experiment IhugoHn represents the succession of the forest without hurricane disturbances for more than a century. Experiments IhugoH1 and ImariaH1 represent the recovery of the forest from a hurricane disturbance given different initial conditions of the forest.
3.1 Model assessment
3.1.1 Optimal simulation and optimal parameter set
Figure 4 shows the optimal model simulation along with census observations for years 1989–2018. The simulated stem density of Early increased from 0.0027 individuals m−2 in 1990 to 0.0324 individuals m−2 in 1994 (1100 % increase) and to 0.0748 individuals m−2 in 1999 (131 % increase) and decreased steadily thereafter, consistent with observations (0.0030 individuals m−2 in post-Hugo 1989, 1673 % increase in 1994 and 84 % increase in 1999). The simulated stem density of Mid is overall underestimated by 47 % compared to the mean from the 85 plots of observations but is within 1 standard deviation of the observations. The simulated stem density of Late and Palm are also within 1 standard deviation of the observations although the model predictions suggest 25 % underestimation and 38 % overestimation, respectively. The optimal simulation overestimates the growth rate of the Early PFT by 133 % for years between 2000 and 2014, but it generally captures the decrease in growth rate with time since the hurricane disturbance for all PFTs. Furthermore, the optimal simulation agrees well with the observations for the overall stem density (−21 % relative bias), basal area (−12 % relative bias), and aboveground biomass (−15 % relative bias), and captures well the PFT composition (+1 %, −8 %, −2 %, and +9 % differences in the percentages of Early, Mid, Late, and Palm PFTs, respectively) and size structure (+0.8 % differences in the percentage of large stems) (Fig. 5).
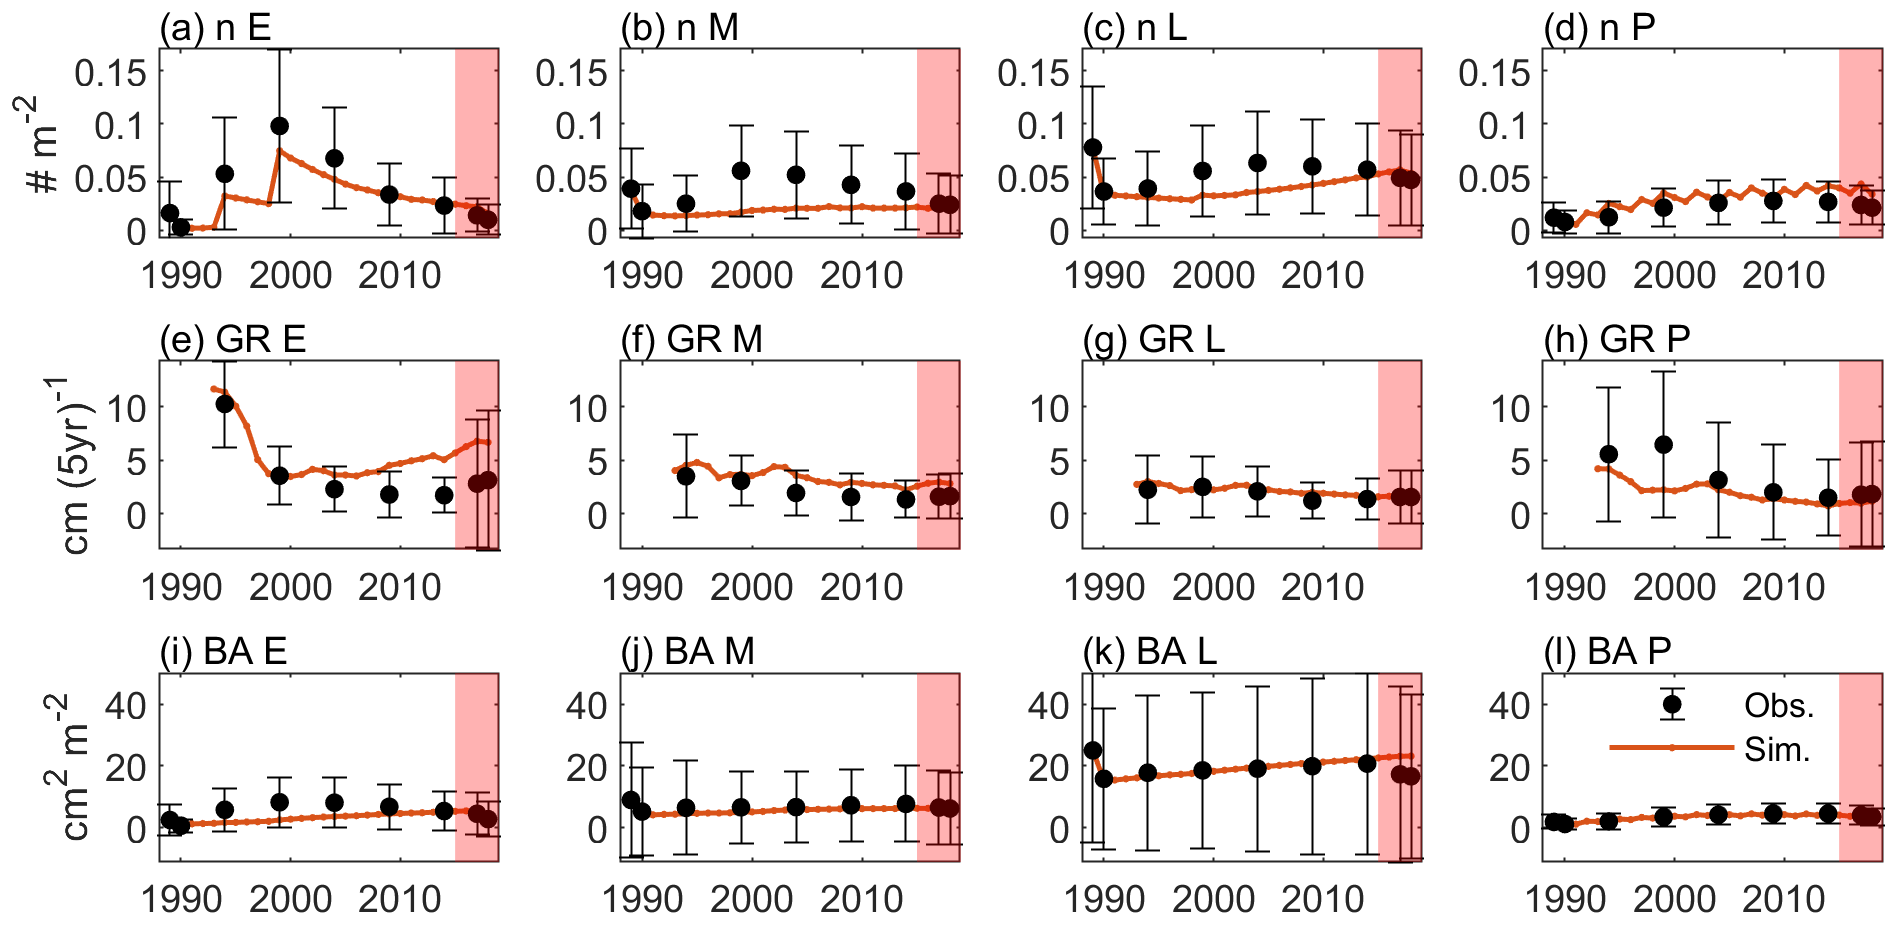
Figure 4Time series of variables from observation (dots and error bars) and the optimal simulation (red lines). (a–d) Stem density of all trees (n; DBH ≥2.5 cm) (individuals m−2) for Early, Mid, Late, and Palm PFTs, respectively. (e–h) Diameter growth rate (GR; cm (5 yr)−1) for the four PFTs. (i–l) Basal area (BA; cm2 m−2) for the four PFTs. The dots and the error bars represent the means and 1 standard deviation from the means across the 85 plots. Period between 1989–2014 is for model calibration and period between 2015–2018 is for model validation (shaded).
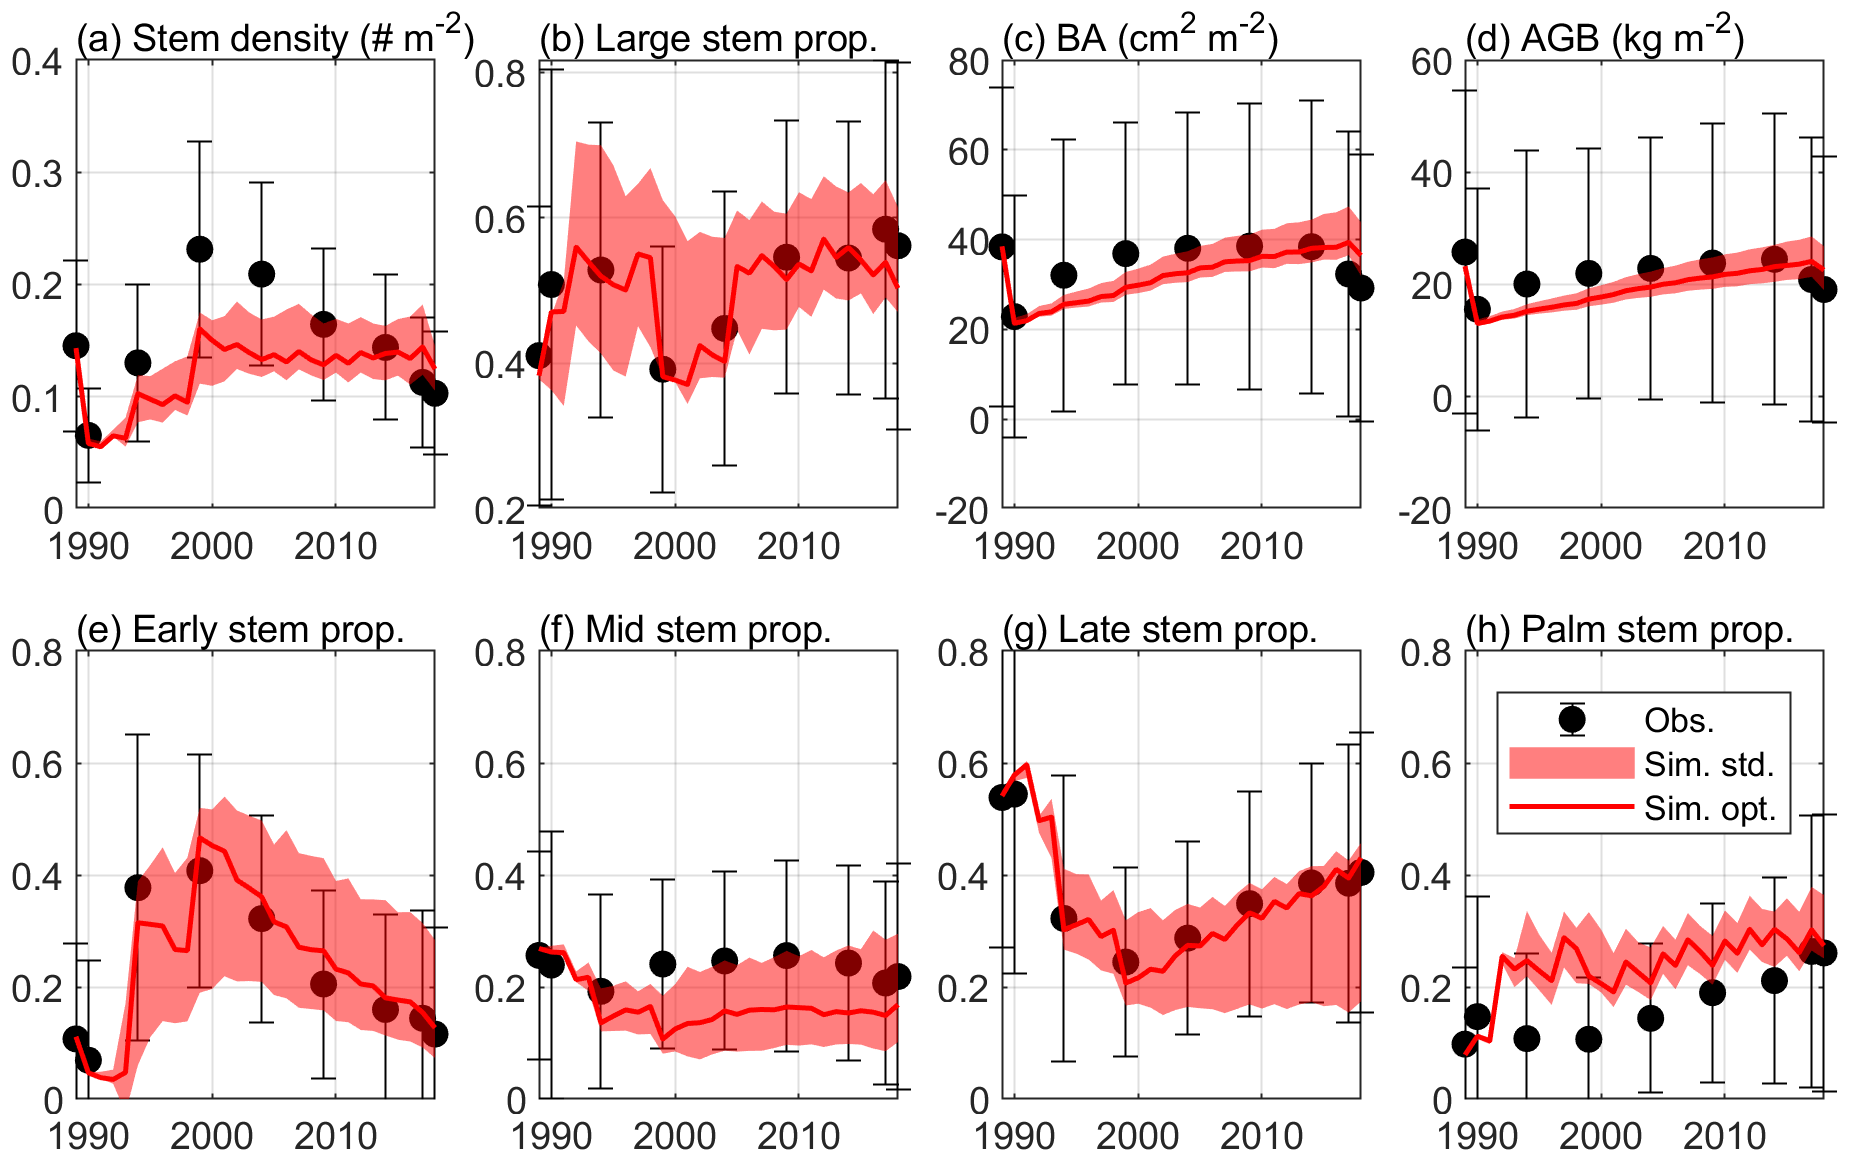
Figure 5The standard deviation of the estimated variables with K=8 in Eq. (4), along with the optimal simulation and observation. The figure shows (a) stem density of all stems with DBH ≥2.5 cm (individuals m−2), (b) stem density proportion of large stems with DBH ≥10 cm, (c) basal area (BA; cm2 m−2), (d) aboveground biomass (AGB; kg C m−2), and stem density proportion of (e) Early, (f) Mid, (g) Late, and (h) Palm PFTs.
In the verification period between 2015–2018, the simulated overall stem density, basal area, and aboveground biomass have a relative bias of +24 %, +23 %, and +17 %, respectively, compared to the mean of the observations. The simulated percentages of the four PFTs have a difference of +3 %, −7 %, −4 %, and 8 %, respectively, and the simulated large stem percentage has a difference of +0.3 % compared to the mean of the observations. Overall, the simulated variables between 2015–2018 are within the standard deviations of the observations (Figs. 4 and 5), suggesting that the parameters found using the data between 1989–2014 are valid for the 2015–2018 period.
Table 1 shows the optimal set of the parameter values. The clumping factor (0.34) is lower than that from other studies in different locations (∼0.7; He et al., 2012). Other parameters are reasonable and are consistent with reported values. For example, the leaf turnover rate of Late (0.16 yr−1) is consistent with a previous study (∼0.1; Gill and Jackson, 2000). The leaf turnover rate of Palm (0.42 yr−1) is consistent with previous observations of 0.36 yr−1 at BEW (Lugo et al., 1998). The woody tissue density of Palm (0.24 g cm−3) is consistent with previous observations of 0.31 g cm−3 (Swenson and Umana, 2015).
Table 1The optimal parameter set obtained from the GLUE method.
3.1.2 Posterior distribution of parameters
Figure 6 shows the posterior and prior probability distribution functions (PDFs) of the parameters. The most significant differences between the posterior and the prior distributions are for the parameters of clumping factor (Clf) and dark respiration rate (Rdf). The posterior PDFs of some parameters (i.e., carboxylation rate, specific leaf area, leaf width, stomatal slope, and wood density), which are well constrained by observational trait data (Feng et al., 2018), do not change much from the priors (the maximum difference between the prior and posterior CDFs is generally less than 0.1). The posterior PDFs of other parameters (e.g., leaf turnover rate, quantum efficiency, and fine root allocation), especially for the Early and Mid PFTs, with few observational trait data (Feng et al. 2018), changed greatly from the prior distributions (the maximum difference between the distributions is around 0.3).
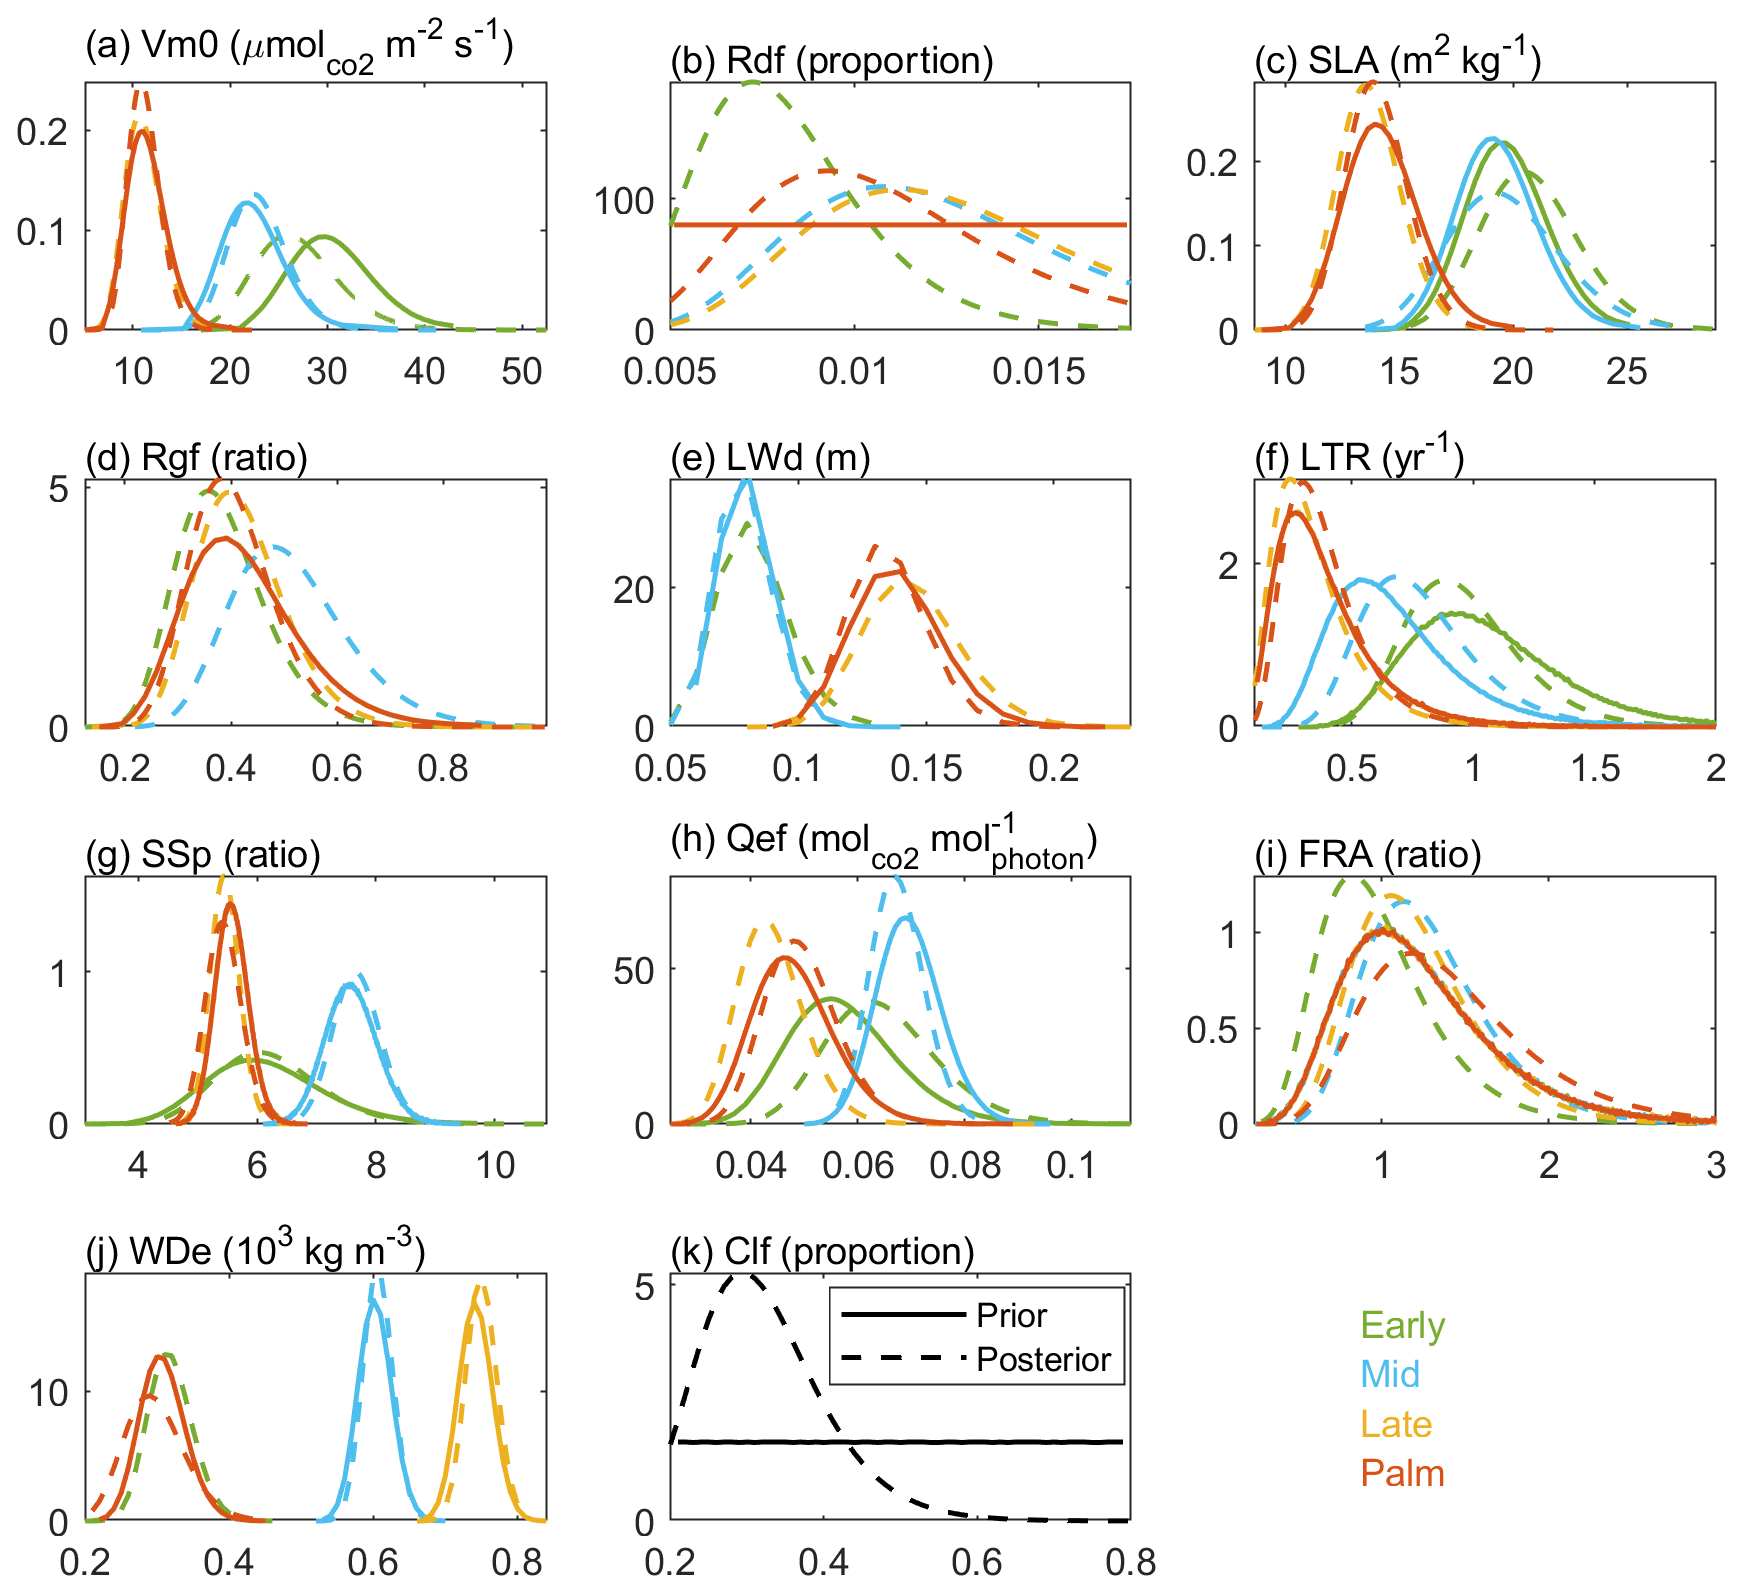
Figure 6The prior (solid line) and posterior (dashed line) probability density functions for the four PFTs (colors) of the 11 parameters. The first 10 parameters are PFT-dependent, and the last one leaf clumping factor (Clf) is PFT-independent. Palm has the same prior distribution as Late for all parameters except that the wood density (WDe) of Palm has the same prior distribution as that of Early. The long name of each parameter is shown in Table 1.
3.1.3 Parameter sensitivity and uncertainty
Among the 369 sensitivity experiments with different parameter values, 57 of them have slightly smaller-than-optimal MSEs, but the simulated variables (stem density, AGB, PFT composition, and size structure) from those experiments are very close to optimal (Fig. S10), indicating that the optimal simulation we found from GLUE is stable given the uncertainties of the parameters.
In terms of the sensitivity of simulated variables on the parameters, the magnitude of standardized cubic regression coefficients (β) is generally low (∼0.2) in the first simulation year (Fig. 7a), indicating that the parameters do not have a strong effect on the variables. LAI is the most sensitive variable in the short term, and it is sensitive to both the specific leaf area (SLA) of its own PFT and the clumping factor (Clf). Furthermore, each PFT is mainly sensitive to the parameters of its own PFT, and vice versa (Fig. 7a). After 25 years of simulation, the sensitivity of the variables on the parameters becomes more complex (Fig. 7b). First, the magnitude of β increases significantly, indicating that the parameters show stronger impacts on the variables in the long term. Second, the variables are sensitive to different parameters in the short term and in the long term. For example, SLA and clumping factor are the most important parameters to LAI in the first simulation year, but not after 25 years of simulation. Instead, quantum efficiency (Qef) and dark respiration (Rdf) are the most important parameters to LAI after 25 years of simulation. Third, besides the sensitivity of variables to the parameters of their own PFT, variables of a specific PFT also show sensitivity to the parameters of other PFTs. For example, the variables of Early and Mid PFTs are not only sensitive to Early and Mid PFTs parameters, but are also sensitive to Late PFT parameters. Specifically, the quantum efficiency, wood density, and specific leaf area have significant positive effects on the variables of its own PFT, but significant negative effects on other PFTs. The Palm PFT is sensitive to its own parameters, but also to the specific leaf area of the Early PFT (Fig. 7b).

Figure 7The standardized cubic regression coefficient (β) of variables at (a) first and (b) 25th year of the simulations regarding the parameters. The variables include stem density (nplant), basal area (BA), aboveground biomass (AGB), and leaf area index (LAI) for each PFT. The parameters include 10 PFT-dependent parameters and one PFT-independent parameter listed in Table 1.
The stem density has a larger variation than LAI, BA, and AGB after 25 years of simulation (Fig. 8). Given that large stems contribute more to LAI, BA, and AGB, larger variation of stem density than LAI, BA, and AGB indicates that small stems are more variable than large stems. The variation of those variables also varies with PFTs. For the stem density, Late PFT has the largest variation, followed by Early, then Mid, and Palm has the smallest variation, indicating that stem density of small Late is the most sensitive to the uncertainty of the parameters. For BA, AGB, and LAI, Early and Mid PFTs show the highest variability, followed by the Palm PFT, and the Late PFT has the lowest variation, indicating that large stems of Early and Mid PFTs are more sensitive to the uncertainty of the parameters than large stems of Late and Palm PFTs.
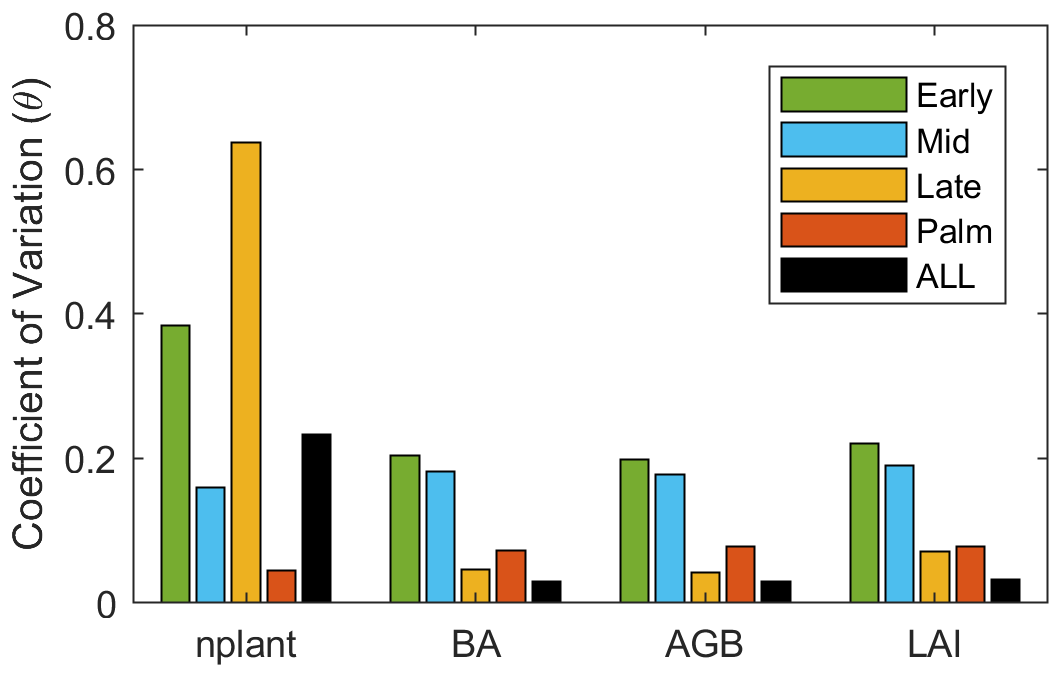
Figure 8The coefficient of variation (θ) for the variables of each PFT at the 25th simulation year.
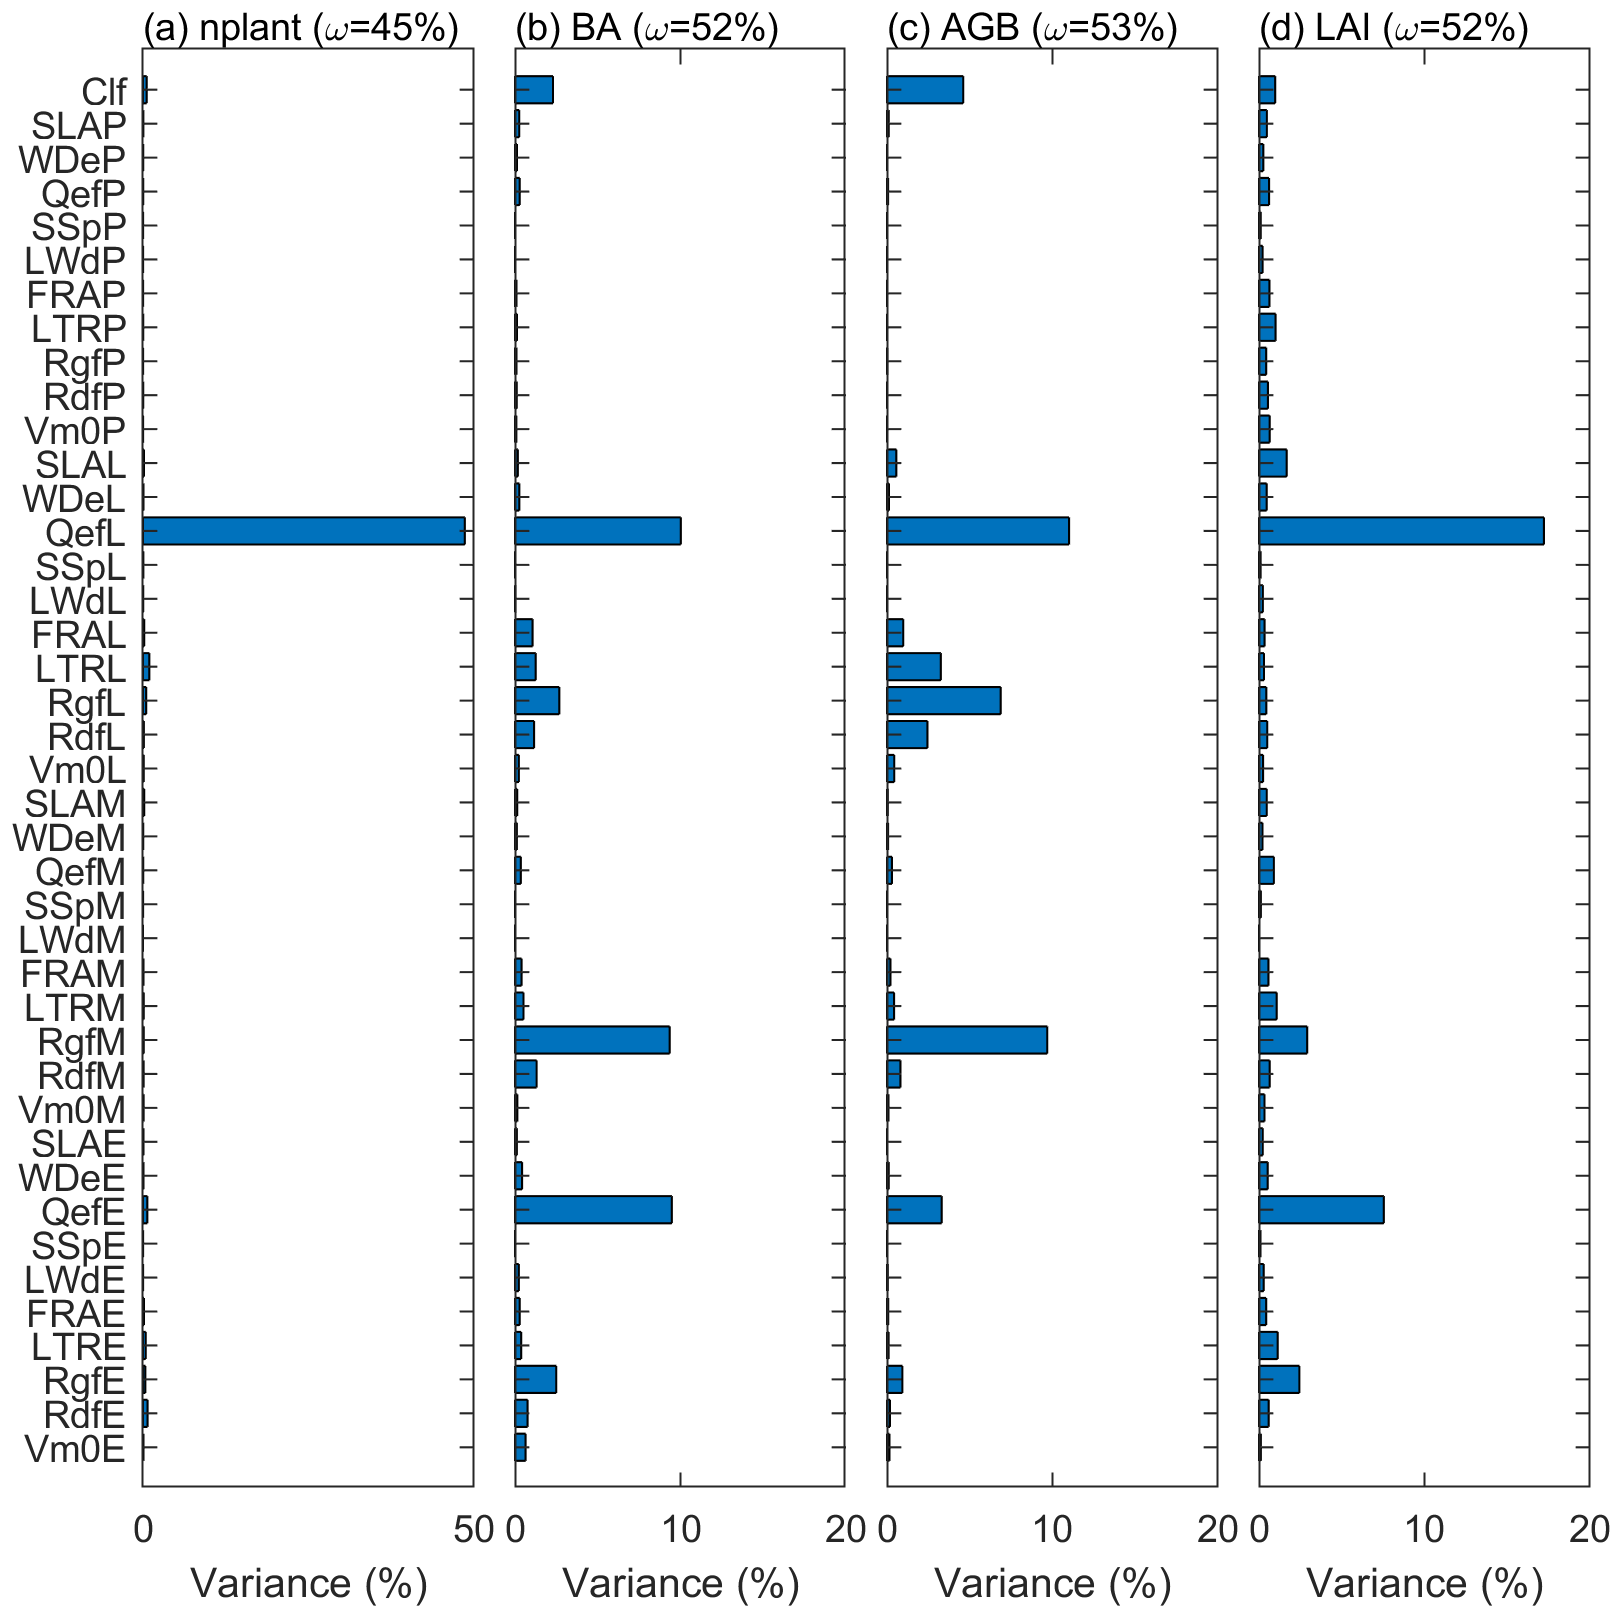
Figure 9The variance explained by each parameter for variables (a) stem density, (b) basal area, (c) aboveground biomass, and (d) leaf area index. The variance explained by the interaction among parameters are given in parentheses.
The variance decomposition analyses reveal that 50 % of the uncertainty of the stem density comes from the quantum efficiency of Late (QefL) (Fig. 9). However, QefL explains less than 10 % of the uncertainty in BA, AGB, and LAI, indicating that QefL has significant effects on the density of small stems, but fewer effects on the density of large stems. In other words, QefL impacts the recruitment and establishment of stems more than the growth of stems. The uncertainty of the growth of stems comes from the growth respiration factor (Rgf), which explains about 10 % of the uncertainty. The interaction among parameters accounts for 21 % of the uncertainty of the stem density, and more than 50 % of the uncertainty of the BA, AGB, and LAI.
3.1.4 Impact of initial condition on forest recovery
Figure 10 shows the 112-year simulations of the forest initialized with different forest states (pre-Maria state and pre-Hugo state) with or without hurricane disturbance at the first simulation year. Without hurricane disturbance (IhugoHn), the forest experiences a decrease (−17 %) in stem density in the first 10 years due to the self-thinning process of the forest (Fig. 10a). The decrease is mainly attributed to mortality of small stems of Mid and Late PFTs (Fig. S11b and c), which leads to an increase (5 %) in the proportion of large stems (DBH ≥10 cm) (Fig. 10b), but BA and AGB remain steady (Fig. 10c and d). After 10 years, a large number of Early PFT stems recruit with DBH less than 10 cm (Fig. S11a), decreasing the overall large stem proportion. After 30 years, Mid trees recruit and grow (Figs. S11b and S12b), increasing the total BA and AGB (Fig. 10c and d). As small Late trees recruit frequently after 20 years (Fig. S11c), the stem density increases steadily, and the proportion of large stems decreases steadily. Because small stems contribute little to BA and AGB, BA and AGB have a slower increase with time (Fig. 10c and d) than stem density (Fig. 10a).
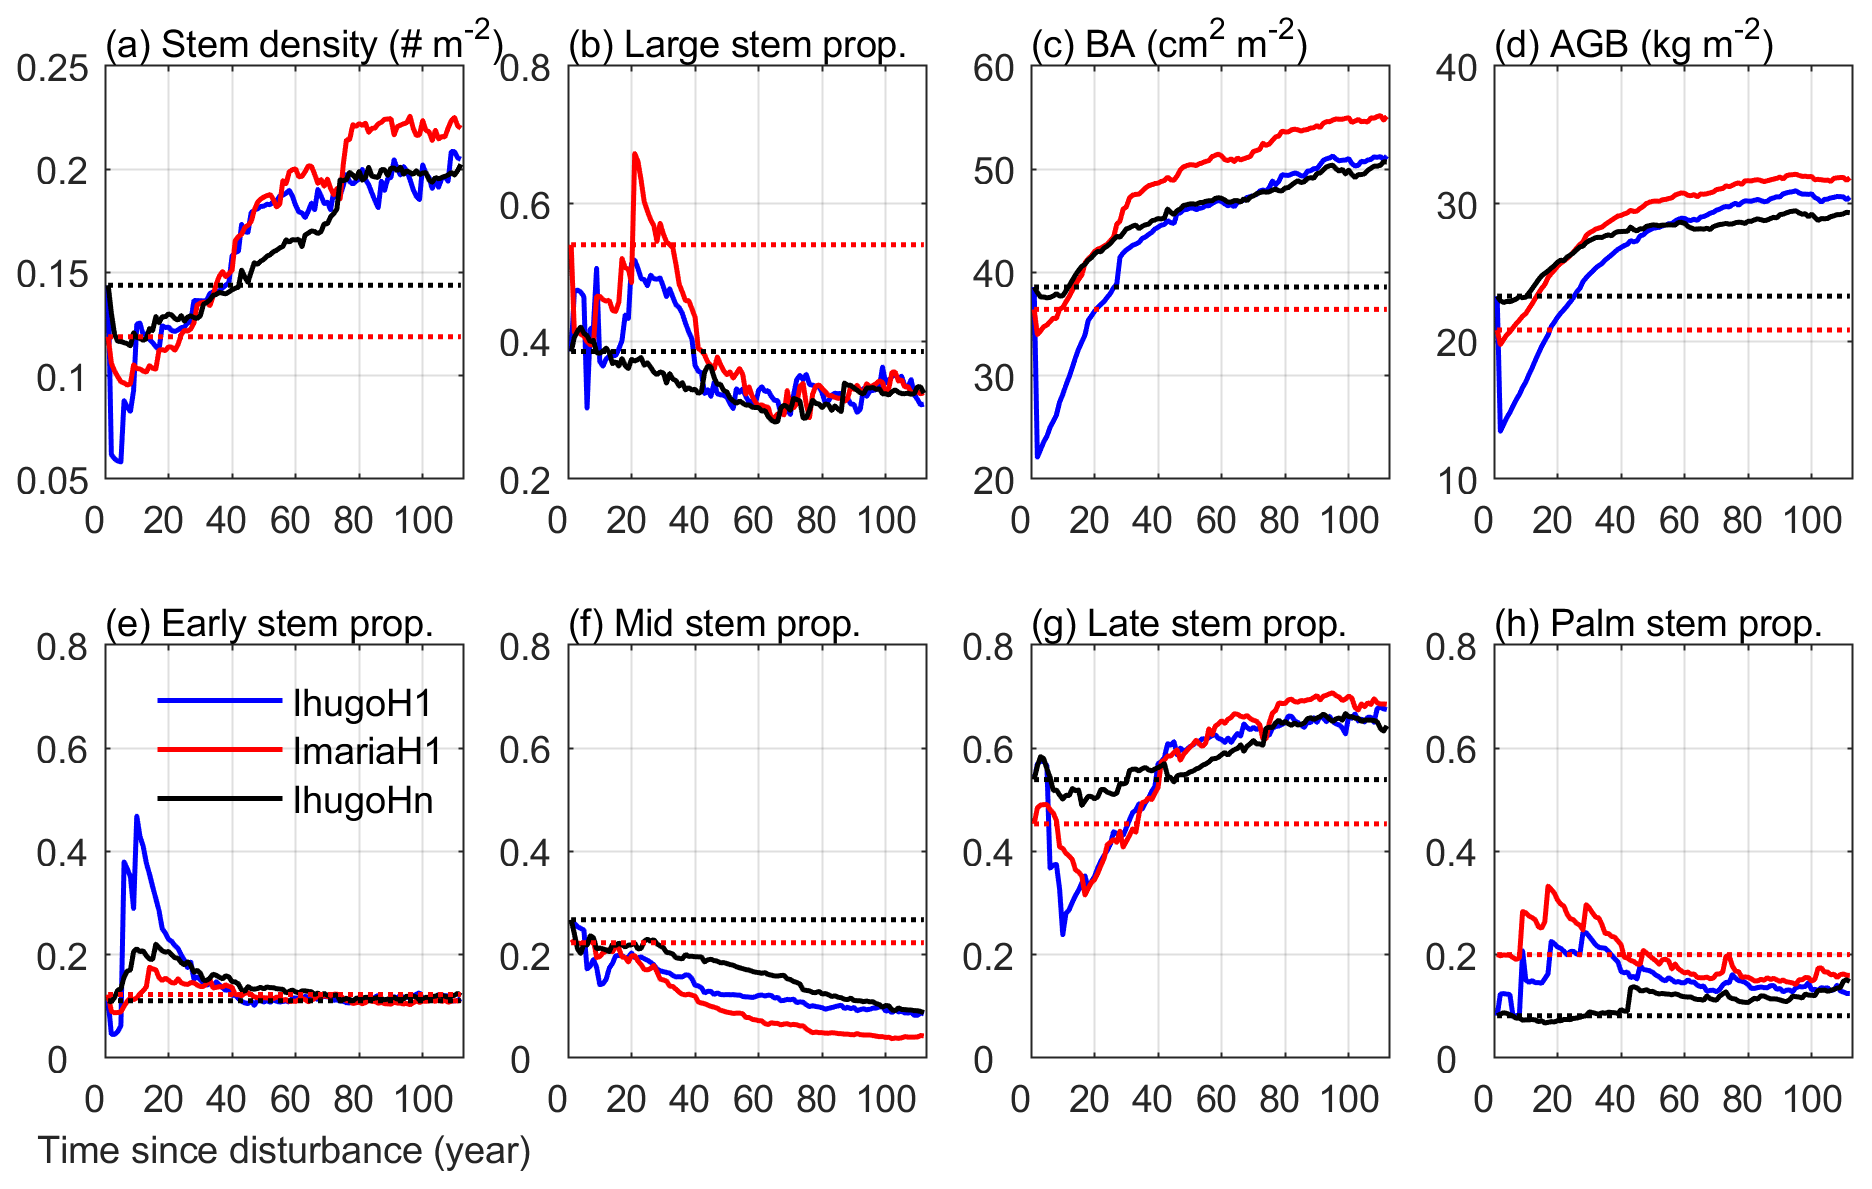
Figure 10Time series of eight variables from the simulation of the three experiments: IhugoHn, IhugoH1, ImariaH1. The dotted lines are the initial state of the variables for each experiment (IhugoHn and IhugoH1 have the same initial state). The variables in (a) stem density, (c) basal area, and (d) aboveground biomass are for stems with DBH ≥2.5 cm. The stem proportion in (b) is the proportion of the stem density with DBH ≥10 cm to the stem density with DBH ≥2.5 cm. The variables in (e)–(h) are the proportion of the stem density of each PFT with DBH ≥2.5 cm to the total stem density of all PFTs with DBH ≥2.5 cm.
After 80 years, the PFT composition reaches a steady state (the change of 30-year moving average is less than 1 % compared to the previous year; Fig. S13), where the Early, Mid, Late, and Palm PFTs account for 11.8 %, 10.6 %, 65.3 %, and 12.3 % of the total stem density, respectively (Fig. 10 e, f, g, h). This state is significantly different from the initial state and exhibits a 16 % reduction in the proportion of the Mid PFT. It exhibits increases on all other PFT proportions (+0.7 %, +11.4 %, and +4.1 % for Early, Late, and Palm, respectively). The Early PFT has stems of all DBH classes (Fig. S11a), while Mid PFT has mostly small stems with DBH less than 5 cm and a small cohort (2 individuals ha−1) of large stems with DBH around 200 cm (Fig. S14b and f), which contributes a significant portion to the total AGB (Fig. S12b). The Late PFT is the most abundant PFT (Fig. S11c) and contributes the most to the total AGB in the forest (Fig. S12c). The stem density of Late decreases with DBH (Fig. S11c), and the largest-DBH cohort reaches 180 cm (Fig. S14c), which is smaller than that of Mid but has a higher density (7 individuals ha−1) (Fig. S14g). The maximum DBH is far larger than that we observed (89 cm in 2017), which could be an overestimation due to no nutrient limitation. Palm recruits with DBH between 10 and 15 cm, the DBH grows slowly after recruitment, and DBH growth stops after they reach the reproduction height (18 m, and 25 cm in DBH correspondingly) and allocate all carbon to reproduction (Sect. 2.2.2); hence palms do not exceed 25 cm DBH (Fig. S14d), and most of them are between 10 and 20 cm (Figs. S11d and S12d). This is in agreement with the maximum reported values of DBH (Lugo and Rivera Batlle, 1987).
Compared with the experiment without hurricane disturbance in the first simulation year (IhugoHn), the experiments with hurricane disturbance in the first simulation year (IhugoH1 and ImariaH1) reach higher BA and AGB levels after 60 years of succession from the hurricane disturbance (Fig. 10c and d). This is due to the carbon accumulation of large Late PFT in disturbed forests (Fig. S12g and k). Large Late trees in disturbed forest (IhugoH1 and ImariaH1) have a higher growth rate and lower background mortality rate compared to those in the undisturbed forest (IhugoHn) (Fig. 11) because of the decreased competition to reach the open canopy. As the disturbed forest recovers, the BA and AGB increase to the level of the undisturbed forest (Fig. 10c and d), the growth rate decreases (Fig. 11a), and the mortality rate increases to the levels of those in the undisturbed forest, especially for severely disturbed forest (IhugoH1) (Fig. 11). With lower mortality and higher growth rate in the first 60 years, there will be more large Late trees in the canopy at the end of the simulation (12 vs. 8 individuals ha−1) (Fig. S14g) even though the maximum DBH will be smaller (Fig. S14c).
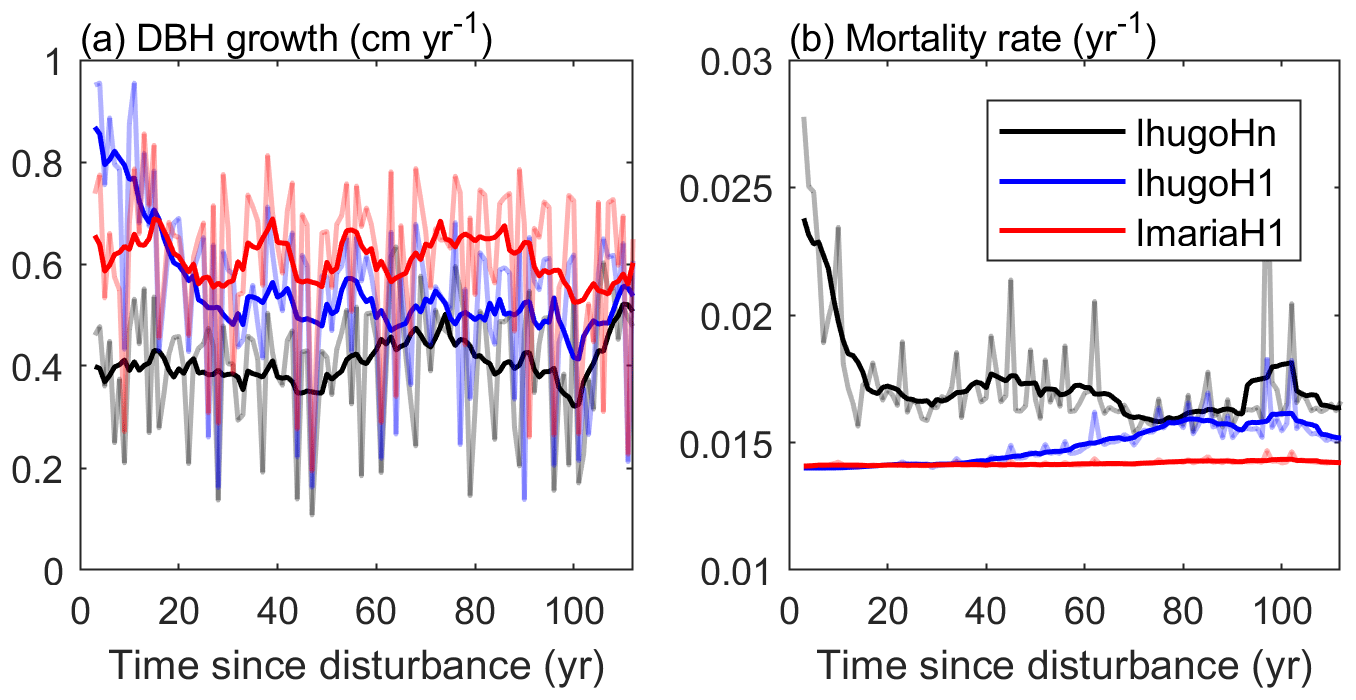
Figure 11Times series of (a) average growth rate and (b) mortality rate of Late trees with DBH ≥20 cm. The light-colored lines represent the yearly values, and the solid lines are 10-year moving averages.
The recovery is different with different initial states. With pre-Hugo state (IhugoH1), the forest takes 25 years to recover to the pre-disturbance BA and AGB levels (Fig. 10c and d), but with pre-Maria state (ImariaH1), it takes only 10 years to recover to the pre-disturbance BA level (Fig. 10c) and 5 years to the pre-disturbance AGB level (Fig. 10d). The succession dynamics are different, too. With pre-Hugo state, the hurricane-induced mortality is very high, and thus the canopy opens, Early and Palm PFTs recruit greatly in the first 20 years (Fig. S11e and h), and then it is taken over by the Late PFT (Fig. S11g). With pre-Maria initial state, the hurricane-induced mortality is low, the canopy is not significantly changed after the hurricane, and Early PFT does not recruit as much as it does in the pre-Hugo state initialized simulation (Fig. S11i and e). The PFT composition after 100 years is similar for the two simulations, but the BA and AGB are not (Fig. 10). The BA and AGB with the pre-Maria initialization are higher than those with the pre-Hugo initialization throughout the 110 years of simulations, even though the initial BA and AGB levels in the pre-Maria state are lower than those in the pre-Hugo state (Fig. 10c and d). This is because of the higher mortality in the first year with pre-Hugo state, leading to a larger reduction in the density of large stems. With the succession following the disturbance, there are more large stems, especially Late and Palm, in the pre-Maria simulation than in the pre-Hugo simulation (Fig. S14), contributing to the higher AGB and BA in the pre-Maria simulation (Fig. S12g, h, k, and l).
We developed a hurricane module (including a mortality module and a recovery module) for the ED2-HuDi model, based on census observations. We then applied a parameter estimation algorithm, GLUE, to calibrate important parameters in the model and selected the optimal parameter set for the final model simulation. However, because the observations are limited to only two hurricane events, the hurricane module may be biased toward the two observations. The simulation results show some discrepancies with observations, and these discrepancies could be in part due to the GLUE approach and parameter uncertainties. Here we discuss the uncertainty associated with the developed hurricane module, the limitations and advantages of the GLUE framework, and the uncertainties of model outputs.
4.1 Uncertainty of the hurricane module
We included a hurricane mortality module and a hurricane recovery module for hurricane disturbance. Crown damage is also an important part of hurricane disturbance and could have important impact on forest structure and carbon accumulation (Leitold et al., 2021), but we did not include crown damage in the hurricane disturbance module because the census data used to develop and calibrate the module do not include crown damage information. The hurricane mortality module was developed based on observations from two hurricane events at the study site. The relationship between mortality and forest size structure (proportion of large stems) was fitted to a logistic function (Fig. 2) for each PFT and DBH class. Generally, Palm PFT has a lower mortality than other PFTs, but Palm mortality was higher (11 % for Palm, 9 % for Mid, and 3 % for Late) when the forest was dominated by large stems (e.g., large stem proportion is 0.6, except for the high mortality of 39 % for Early; Fig. 2b). This was due to the high mortality of Palm during Maria, which was a result of plant pathogens (Zhang et al., 2022b; Heartsill Scalley, 2017). The mortality of large-stem Early PFT is significantly different from other PFTs, and this difference was due to the significantly higher mortality of large-stem Early during Hurricane Maria compared to other PFTs. Such high mortality of large-stem Early may be a result of other factors besides hurricane disturbance, and it could be further studied if there were more observations. Future work could include observations from other study sites to improve the hurricane disturbance module.
There are four critical parameters associated with the hurricane disturbance module, including disturbance rate of forest area (λd) and survivorship of each cohort (sc) from the mortality module, initial seedling density (ns), and decay factor of seedling density with time since disturbance (α) from the recovery module. We tested the sensitivity of the parameters of the recovery module but did not test the uncertainty of the parameters of the mortality module because the values are from observations at the study site. For future studies using this module, either testing the uncertainty of the parameters or using site-specific values are encouraged.
4.2 Limitations and advantages of GLUE
GLUE samples from continuous distributions, but the sampled parameter sets are in a discrete space; therefore, the GLUE approach may not lead to the true optimum due to the finite number of samples. To justify the sample size of 10 000 for 41 parameters in this study, we repeated GLUE for a larger sample size (20 000). The optimal simulation from 20 000-sample GLUE (Fig. S15) is very similar to that from the 10 000-sample GLUE (Fig. 4), and the optimal parameter sets from the two GLUEs are similar, suggesting that the two GLUEs found an optimum around the same local optimum and 10 000 samples are sufficient for the 41 parameters. However, given the nature of equifinality, there may be multiple parameter sets that can lead to the same observed state (Beven and Freer, 2001), and thus the optimal parameter set we found from GLUE may be one of many possible solutions.
Although GLUE may not guarantee the global optimum, it implicitly handles any effects of model nonlinearity, model structure errors, input data errors, and parameter covariation (Beven and Freer, 2001). Moreover, GLUE allows us to optimize parameters using any variables of interests in the cost function. For example, in our study, we want to make sure the model captures the size structure and PFT composition of the forest community, and thus we utilized forest stand variables including stem density, growth rate, and BA of each PFT in the cost function. Note that we did not calibrate the parameters using plant trait observations in this study, because the parameters we use are already calibrated with plant traits observations in Feng et al. (2018) and we adopted their calibrated parameters in our study (see Sect. 2.3.1).
4.3 Uncertainty of model outputs from parameters
To be consistent with census observations, we included stems with DBH ≥2.5 cm in the analyses. The large variation of simulated stem density (Fig. 8) could be due to the timing of cohorts exceeding the 2.5 cm threshold, and thus can be minimized by averaging stem density over several years (Massoud et al., 2019). The optimization is sensitive to light-related parameters, such as clumping factor, quantum efficiency, and dark respiration (Fig. 9). This is possibly because light limitation is the most important limitation in the model, as water is not limited in this tropical site, and we turned off nutrient limitation. This is consistent with Meunier et al. (2021), who found that light limitation contributes partly to model uncertainties. The clumping factor we calibrated for our study site is lower than that from other locations (He et al., 2012), which could be due to uncertainties of the allometries and estimates on the leaf area index (LAI). LAI is generally underestimated in the vegetation dynamics models (e.g., Xu et al., 2016). As discussed in Shiklomanov et al. (2021), the ED2 model has a less robust estimation on LAI because of structural errors in representing direct radiation backscatter. Both LAI and the clumping factor are rarely measured, and LAI estimated from satellite remote sensing data often have variable quality, especially in tropical forests (Xiao et al., 2016, 2017). Future census practices should include LAI and the clumping factor. Even though the LAI measured from the ground may be different from the LAI measured from above the canopy (with airborne lidar or satellites), ground measurements could provide useful information for both the vertical structure of the forest and the quality of satellite remote sensing and airborne lidar data. Furthermore, acclimation to understory light is not considered in this model; however, traits respond strongly to light environments (Lloyd et al., 2010; Keenan and Niinemets, 2017), and therefore it needs to be considered in future developments (Xu and Trugman, 2021).
Our results that modeled variables have different responses to parameters in the short term (e.g., first simulation year) and in the long term (e.g., 25th simulation year) agree with a previous study (Massoud et al., 2019). Furthermore, we showed that variables of a specific PFT are most sensitive to the parameters of the same PFT, but also sensitive to parameters of other PFTs. Those interactions between variables and parameters indicate the competition among PFTs. For example, Palm is sensitive to its own parameters, but also to Early SLA. This can be explained by the competition for light between Early and Palm, where a higher SLA of Early PFT leads to a higher LAI of Early allowing Early to photosynthesize more efficiently and thus be more competitive in the community. Those competitions are important for the co-existence of PFTs in model simulations and critical to the PFT composition and succession.
Hurricanes are a major disturbance to tropical forests, but hurricane disturbance had not been implemented in any model of vegetation dynamics. In this study, we implemented hurricane disturbance in the Ecosystem Demography model (ED2) and calibrated the model with forest stand observations of a tropical forest in Puerto Rico. The calibrated model has good representation of the recovery trajectory of PFT composition, size structure, stem density, basal area, and aboveground biomass of the forest. We used the calibrated model to study the recovery of the forest from a hurricane disturbance with different initial forest states and found that a single hurricane disturbance changes forest structure and composition in the short term and enhances AGB and BA in the long term compared with a no-hurricane situation. Forests with wind-resistant initial state will have lower mortality, recover faster, and reach a higher BA and AGB level than forests with a less wind-resistant initial state.
The model developed and results presented in this study can be utilized to understand the fate of tropical forests under a changing climate. Hurricanes are likely to become more frequent and severe in the future with global warming (IPCC, 2021). With frequent hurricane disturbances in the future, forests will not have enough time to reach a steady state, and the structure and composition will be constantly changing, which provides different initial states for future hurricane disturbances and thus different recovery trajectories. Climate change with changing temperature, precipitation, and CO2 concentration, etc. will also have an impact on the growth of individual trees and thus the structure and composition of forests (e.g., Feng et al., 2018). The ED2-HuDi model developed in this study will be a beneficial tool to understand the effects of frequent hurricane disturbances on forest recovery in the future under the changing climate.
The ED2-HuDi software is publicly available. The most up-to-date source code is available at https://github.com/zhjiay5/ED2 (last access: 27 June 2022). The exact version used in this paper is archived on Zenodo (https://doi.org/10.5281/zenodo.5565063; Zhang et al., 2021). Input tree census data are available at https://doi.org/10.2737/RDS-2022-0025 (Zhang et al., 2022a) and https://doi.org/10.2737/RDS-2020-0012 (Zhang et al., 2020). Meteorological data are available at http://www.hydroshare.org/resource/a6baaaf051cd4319a8aa3e17dbd42c08 (last access: 27 June 2022) and https://doi.org/10.2737/RDS-2017-0023 (González, 2017). Scripts to run the model and produce the plots for all the simulations presented in this paper are also publicly available at http://www.hydrology.gatech.edu/ (last access: 27 June 2022).
The supplement related to this article is available online at: https://doi.org/10.5194/gmd-15-5107-2022-supplement.
RLB conceptualized the work. THS provided field data and contributed the ecological interpretation of the results. RLB and JZ developed the methodology and performed the analyses. JZ and ML interpreted results. JZ wrote the first draft of the manuscript. All authors discussed results and critically revised and edited the manuscript.
The contact author has declared that neither they nor their co-authors have any competing interests.
The findings and conclusion in this publication are
those of the authors and should not be construed to represent any official
USDA or U.S. government policy.
Publisher's note: Copernicus Publications remains neutral with regard to jurisdictional claims in published maps and institutional affiliations.
We thank Paul Moorcroft, Xiangtao Xu, Elsa Ordway, Félicien Meunier, and Erik Larson for discussions on the model implementation and parameter sensitivity analyses. We acknowledge high-performance computing support from Cheyenne (https://doi.org/10.5065/D6RX99HX; Computational and Information Systems Laboratory, 2019) provided by NCAR's Computational and Information Systems Laboratory, sponsored by the National Science Foundation. This work was supported by the National Science Foundation and K. Harrison Brown Family Chair. This research was supported in part by the U.S. Department of Agriculture, Forest Service, and the USDA Forest Service International Institute of Tropical Forestry works in collaboration with the University of Puerto Rico. The research was supported by the Jet Propulsion Laboratory, California Institute of Technology, under a contract with the National Aeronautics and Space Administration. Marcos Longo was supported by the NASA Postdoctoral Program, administered by the Universities Space Research Association under contract with NASA, and by the Next Generation Ecosystem Experiments-Tropics, funded by the U.S. Department of Energy, Office of Science, Office of Biological and Environmental Research.
This research has been supported by the National Science Foundation (grant no. EAR1331841).
This paper was edited by Hans Verbeeck and reviewed by three anonymous referees.
Albani, M, Medvigy, D., Hurtt, G. C., and Moorcroft, P. R.: The contributions of land-use change, CO2 fertilization, and climate variability to the Eastern US carbon sink, Global Change Biol., 12, 2370–2390, 2006.
Baraloto, C., Timothy Paine, C. E., Poorter, L., Beauchene, J., Bonal, D., Domenach, A. M., Hérault, B., Patiño, S., Roggy, J. C., and Chave, J.: Decoupled leaf and stem economics in rain forest trees, Ecol. Lett., 13, 1338–1347, 2010.
Beven, K. and Binley, A.: The future of distribution models: Model calibration and uncertainty prediction, Hydrol. Process., 6, 279–298, 1992.
Beven, K. and Freer, J.: Equifinality, data assimilation, and uncertainty estimation in mechanistic modelling of complex environmental systems using the GLUE methodology, J. Hydrol., 249, 11–29, 2001.
Binley, A. M. and Beven, K. J.: Physically-based modelling of catchment hydrology: a likelihood approach to reducing predictive uncertainty, in: Computer Modelling in the Environmental Sciences, edited by: Farmer, D. G. and Rycroft, M. J., Clarendon Press, Oxford, 75–88, 1991.
Boose, E. R., Foster, D. R., and Fluet, M.: Hurricane Impacts of tropical and temperate forest landscapes, Ecol. Monogr., 64, 369–400, 1994.
Boose, E. R., Serrano, M. I., and Foster, D. R.: Landscape and regional impacts of hurricanes in Puerto Rico, Ecol. Monogr., 74, 335–352, 2004.
Brokaw, N. V. L.: Cecropia schreberiana in the Luquillo Mountains of Puerto Rico, Bot. Rev., 64, 91–120, 1998.
Chambers, J. Q., Fisher, J. I., Zeng, H., Chapman, E. L., Baker, D. B., and Hurtt, G. C.: Hurricane Katrina's carbon footprint on U.S. Gulf Coast forests, Science, 318, 1107, https://doi.org/10.1126/science.1148913, 2007.
Chen, J. and Black, T.: Foliage area and architecture of plant canopies from sunfleck size distributions, Agric. For. Meteorol., 60, 249–266, 1992.
Cole, L. E. S., Bhagwat, S. A., and Willis, K. J.: Recovery and resilience of tropical forests after disturbance, Nat. Commun., 5, 3906, https://doi.org/10.1038/ncomms4906, 2014.
Computational and Information Systems Laboratory: Cheyenne: HPE/SGI ICE XA System (University Community Computing). Boulder, CO. National Center for Atmospheric Research. https://doi.org/10.5065/D6RX99HX, 2019.
Curran, T. J., Gersbach, L. N., Edwards, W., and Krockenberger, A. K.: Wood density predicts plant damage and vegetative recovery rates caused by cyclone disturbance in tropical rainforest tree species of North Queensland, Australia, Austral Ecol., 33, 442–450, 2008.
di Porcia e Brugnera, M., Meunier, F., Longo, M., Krishna Moorthy, S. M., De Deurwaerder, H., Schnitzer, S. A., Bonal, D., Faybishenko, B., and Verbeeck, H.: Modeling the impact of liana infestation on the demography and carbon cycle of tropical forests, Global Change Biol., 25, 3767–3780, 2019.
Everham III, M. E. and Brokaw, N. V. L.: Forest damage and recovery from catastrophic wind, Bot. Rev., 62, 113–185, 1996.
Feng, X., Uriarte, M., González, G., Reed, S., Thompson, J., Zimmerman, J. K., and Murphy, L.: Improving predictions of tropical forest response to climate change through integration of field studies and ecosystem modeling, Global Change Biol., 24, e213–e232, 2018.
Fisher, R. A. and Koven, C. D.: Perspectives on the future of land surface models and the challenges of representing complex terrestrial systems, J. Adv. Model. Earth Sy., 12, e2018MS001453, https://doi.org/10.1029/2018MS001453, 2020.
Fisher, R. A., Koven, C. D., Anderegg, W. R. L., Christoffersen, B. O., Dietze, M. C., Farrior, C. E., Holm, J. A., Hurtt, G. C., Knox, R. G., Lawrence, P. J., Lichstein, J. W., Longo, M., Matheny, A. M., Medvigy, D., Muller-Landau, H. C., Powell, T. L., Serbin, S. P., Sato, H., Shuman, J. K., Smith, B., Trugman, A. T., Viskari, T., Verbeeck, H., Weng, E., Xu, C., Xu, X., Zhang, T., and Moorcroft, P. R.: Vegetation demographics in Earth System Models: A review of progress and priorities, Global Change Biol., 24, 35–54, 2018.
Francis, J. K. and Gillespie, A. J. R.: Relating gust speed to tree damage in hurricane Hugo, 1989, J. Arboriculture, 19, 368–373, 1993.
Freer, J., Beven, K., and Ambriose, B.: Bayesian estimation of uncertainty in runoff prediction and the value of data: An application of the GLUE approach, Water Resour. Res., 32, 2161–2173, 1996.
Gill, R. A. and Jackson, R. B.: Global patterns of root turnover for terrestrial ecosystems, New Phytologist, 147, 13–31, 2000.
González, G.: Luquillo Mountains meteorological and ceilometer data, Fort Collins, CO, Forest Service Research Data Archive [data set], https://doi.org/10.2737/RDS-2017-0023, 2017.
Gregory, A. A. and Sabat, A. M.: The effect of hurricane disturbance on the fecundity of Sierra palms (Prestoea montana), Bios, 67, 135–139, 1996.
Hall, J., Muscarella, R., Quebbeman, A., Arellano, G., Thompson, J., Zimmerman, J. K., and Uriarte, M.: Hurricane-induced rainfall is a stronger predictor of tropical forest damage in Puerto Rico than maximum wind speeds, Sci. Rep.-UK, 10, 4318, https://doi.org/10.1038/s41598-020-61164-2, 2020.
He, L., Chen, J. M., Pisek, J., Schaaf, C. B., and Strahler, A. H.: Global clumping index map derived from the MODIS BRDF product, Remote Sens. Environ., 119, 118–130, 2012.
Heartsill Scalley, T.: Insights on forest structure and composition from long-term research in the Luquillo mountains, Forests, 8, 204, https://doi.org/10.3390/f8060204, 2017.
Heartsill Scalley, T., Scatena, F. N., Lugo, A. E., Moya, S., and Estrada, C. R.: Changes in structure, composition, and nutrients during 15 years of hurricane-induced succession in a subtropical wet forest in Puerto Rico, Biotropica, 42, 455–463, 2010.
IPCC: Climate Change 2021: The physical science basis. Contribution of Working Group I to the Sixth Assessment Report of the Intergovernmental Panel on Climate Change, edited by: Masson-Delmotte, V., Zhai, P., Pirani, A., Connors, S. L., Péan, C., Berger, S., Caud, N., Chen, Y., Goldfarb, L., Gomis, M. I., Huang, M., Leitzell, K., Lonnoy, E., Matthews, J. B. R., Maycock, T. K., Waterfield, T., Yelekçi,O., Yu, R., and Zhou, B. , Cambridge University Press, in press, https://doi.org/10.1017/9781009157896, 2021.
Jorgensen, S. E.: Overview of the model types available for development of ecological models, Ecol. Model., 215, 3–9, 2008.
Kammesheidt, L.: Some autecological characteristics of early to late successional tree species in Venezuela, Acta Oecol., 21, 37–48, https://doi.org/10.1016/S1146-609X(00)00108-9, 2000.
Keenan, T. F. and Niinemets, U.: Global leaf trait estimates biased due to plasticity in the shade, Nature Plants, 3, 16201, https://doi.org/10.1038/nplants.2016.201, 2017.
King, D. A., Davies, S. J., Tan, S., and Noor, N. S. M.: The role of wood density and stem support costs in the growth and mortality of tropical trees, Journal of Ecology, 94, 670–680, 2006.
LeBauer, D. S., Wang, D., Richter, K. T., Davidson, C. C., and Dietze, M. C.: Facilitating feedbacks between field measurements and ecosystem models, Ecol. Monogr., 83, 133–154, 2013.
Leitold, V., Morton, D. C., Martinuzzi, S., Paynter, I., Uriarte, M., Keller, M., Ferraz, A., Cook, B. D., Corp, L. A., and González, G.: Tracking the rates and mechanisms of canopy damage and recovery following hurricane Maria using multitemporal Lidar data, Ecosystems, https://doi.org/10.1007/s10021-021-00688-8, 2021.
Lewis, R. J. and Bannar-Martin, K. H.: The impact of cyclone Fanele on a tropical dry forest in Madagascar, Biotropica, 44, 135–140, 2011.
Lloyd, J., Patiño, S., Paiva, R. Q., Nardoto, G. B., Quesada, C. A., Santos, A. J. B., Baker, T. R., Brand, W. A., Hilke, I., Gielmann, H., Raessler, M., Luizão, F. J., Martinelli, L. A., and Mercado, L. M.: Optimisation of photosynthetic carbon gain and within-canopy gradients of associated foliar traits for Amazon forest trees, Biogeosciences, 7, 1833–1859, https://doi.org/10.5194/bg-7-1833-2010, 2010.
Longo, M., Knox, R. G., Levine, N. M., Swann, A. L. S., Medvigy, D. M., Dietze, M. C., Kim, Y., Zhang, K., Bonal, D., Burban, B., Camargo, P. B., Hayek, M. N., Saleska, S. R., da Silva, R., Bras, R. L., Wofsy, S. C., and Moorcroft, P. R.: The biophysics, ecology, and biogeochemistry of functionally diverse, vertically and horizontally heterogeneous ecosystems: the Ecosystem Demography model, version 2.2 – Part 2: Model evaluation for tropical South America, Geosci. Model Dev., 12, 4347–4374, https://doi.org/10.5194/gmd-12-4347-2019, 2019a.
Longo, M., Knox, R. G., Medvigy, D. M., Levine, N. M., Dietze, M. C., Kim, Y., Swann, A. L. S., Zhang, K., Rollinson, C. R., Bras, R. L., Wofsy, S. C., and Moorcroft, P. R.: The biophysics, ecology, and biogeochemistry of functionally diverse, vertically and horizontally heterogeneous ecosystems: the Ecosystem Demography model, version 2.2 – Part 1: Model description, Geosci. Model Dev., 12, 4309–4346, https://doi.org/10.5194/gmd-12-4309-2019, 2019b.
Lugo, A. E. and Rivera Batlle, C. T.: Leaf production, growth rate, and age of the palm Prestoea montana in the Luquillo Experimental Forest, Puerto Rico, J. Trop. Ecol., 3, 151–161, 1987.
Lugo, A. E., Francis, J. K., and Frangi, J. L.: Prestoea montana (R. Graham) Nichols. Sierra palm. Palmaceae. Palm family, Tech. Rep. SO-ITF-SM-82, US Department of Agriculture, Forest Service, International Institute of Tropical Forestry, Rio Piedras, Puerto Rico, https://www.fs.usda.gov/treesearch/pubs/30213 (last access: 27 June 2022), 1998.
Ma, R.-Y., Zhang, J.-L., Cavaleri, M. A., Sterck, F., Strijk, J. S., and Cao, K.-F.: Convergent evolution towards high net carbon gain efficiency contributes to the shade tolerance of palms (Arecaceae), PLoS ONE, 10, e0140384, https://doi.org/10.1371/journal.pone.0140384, 2015.
Massoud, E. C., Xu, C., Fisher, R. A., Knox, R. G., Walker, A. P., Serbin, S. P., Christoffersen, B. O., Holm, J. A., Kueppers, L. M., Ricciuto, D. M., Wei, L., Johnson, D. J., Chambers, J. Q., Koven, C. D., McDowell, N. G., and Vrugt, J. A.: Identification of key parameters controlling demographically structured vegetation dynamics in a land surface model: CLM4.5(FATES), Geosci. Model Dev., 12, 4133–4164, https://doi.org/10.5194/gmd-12-4133-2019, 2019.
Medlyn, B. E., Robinson, A. P., Clement, R., and McMurtrie, R. E.: On the validation of models of forest CO2 exchange using eddy covariance data: some perils and pitfalls, Tree Physiol., 25, 839–857, 2005.
Medvigy, D., Wofsy, S. C., Munger, J. W., Hollinger, D. Y., and Moorcroft, P. R.: Mechanistic scaling of ecosystem function and dynamics in space and time: Ecosystem Demography model version 2, J. Geophys. Res., 114, G01002, https://doi.org/10.1029/2008JG000812, 2009.
Medvigy, D., Clark, K. L., Skowronski, N. S., and Schafer, K. V. R.: Simulated impacts of insect defoliation on forest carbon dynamics, Environ. Res. Lett., 7, 045703, https://doi.org/10.1088/1748-9326/7/4/045703, 2012.
Meunier, F., Verbeeck, H., Cowdery, B., Schnitzer, S. A., Smith-Martin, C. M., Powers, J. S., Xu, X., Slot, M., De Deurwaerder, H. P. T., Detto, M., Bonal, D., Longo, M., Santiago, L. S., and Dietze, M.: Unraveling the relative role of light and water competition between lianas and trees in tropical forests: A vegetation model analysis, J. Ecol., 109, 519–540, 2021.
Meunier, F., Visser, M. D., Shiklomanov, A., Dietze, M. C., Guzmán Q., J. A., Sanchez-Azofeifa, G. A., De Deurwaerder, H. P. T., Krishna Moorthy, S. M., Schnitzer, S. A., Marvin, D. C., Longo, M., Liu, C., Broadbent, E. N., Almeyda Zambrano, A. M., Muller-Landau, H. C., Detto, M., and Verbeeck, H.: Liana optical traits increase tropical forest albedo and reduce ecosystem productivity, Global Change Biol., 28, 227–244, 2022.
Miller, A. D., Dietze, M. C., DeLucia, E. H., and Anderson-Teixeira, K. J.: Alteration of forest succession and carbon cycling under elevated CO2, Global Change Biol., 22, 351–363, 2016.
Mirzaei, M., Huang, Y. F., El-Shafie, A., and Shatirah, A.: Application of the generalized likelihood uncertainty estimation (GLUE) approach for assessing uncertainty in hydrological models: A review, Stoch. Env. Res. Risk A., 29, 1265–1273, 2015.
Moorcroft, P. R., Hurtt, G. C., and Pacala, S. W.: A method for scaling vegetation dynamics: The ecosystem demography model (ED), Ecol. Monogr., 71, 557–586, 2001.
Muscarella, R., Uriarte, M., Forero-Montaña, J., Comita, L. S., Swenson, N. G., Thompson, J., Nytch, C. J., Jonckheere, I., and Zimmerman, J. K.: Life-history trade-offs during the seed-to-seedling transition in a subtropical wet forest community, J. Ecol., 101, 171–182, 2013.
Muscarella, R., Emilio, T., Phillips, O. L., et al.: The global abundance of tree palms, Global Ecol. Biogeogr., 29, 1495–1514, 2020.
Parker, G., Martínez-Yrízar, A., Álvarez-Yépiz, J. C., Maass, M., and Araiza, S.: Effects of hurricane disturbance on a tropical dry forest canopy in western Mexico, Forest Ecol. Manag., 426, 39–52, 2018.
Paz, H., Vega-Ramos, F., and Arreola-Villa, F.: Understanding hurricane resistance and resilience in tropical dry forest trees: A functional traits approach, Forest Ecol. Manag., 426, 115–122, 2018.
Royo, A. A., Heartsill Scalley T., Moya, S., and Scatena, F. N.: Non-arborescent vegetation trajectories following repeated hurricane disturbance: ephemeral versus enduring responses, Ecosphere, 27, 77, https://doi.org/10.1890/ES11-00118.1, 2011.
Rutledge, B. T., Cannon, J. B., McIntyre, R. K., Holland, A. M., and Jack, S. B.: Tree, stand, and landscape factors contributing to hurricane damage in a coastal plain forest: post-hurricane assessment in a longleaf pine landscape, Forest Ecol. Manag., 481, 118724, https://doi.org/10.1016/j.foreco.2020.118724, 2021.
Sakschewski, B., von Bloh, W., Boit, A., Poorter, L., Peña-Claros, M., Heinke, J., Joshi, J., and Thonicke, K.: Resilience of Amazon forests emerges from plant trait diversity, Nat. Clim. Change, 6, 1032–1036, 2016.
Scatena, F. N., Silver, W., Siccama, T., Johnson, A., and Sanchez, M. J.: Biomass and nutrient content of the Bisley Experimental Watersheds, Luquillo Experimental Forest, Puerto Rico, before and after hurricane Hugo, 1989, Biotropica, 25, 15–27, 1993.
Schowalter, T. D. and Ganio, L. M.: Invertebrate communities in a tropical rain forest canopy in Puerto Rico after hurricane Hugo, Ecol. Entomol., 24, 191–201, 1999.
Shiklomanov, A. N., Dietze, M. C., Fer, I., Viskari, T., and Serbin, S. P.: Cutting out the middleman: calibrating and validating a dynamic vegetation model (ED2-PROSPECT5) using remotely sensed surface reflectance, Geosci. Model Dev., 14, 2603–2633, https://doi.org/10.5194/gmd-14-2603-2021, 2021.
Stein, M.: Large sample properties of simulations using Latin Hypercube sampling, Technometrics, 29, 143–151, 1987.
Swenson, N. G. and Umana, M. N.: Data from: Interspecific functional convergence and divergence and intraspecific negative density dependence underlie the seed-to-seedling transition in tropical trees, Dryad [data set], https://doi.org/10.5061/dryad.j2r53. 2015.
Trugman, A. T., Fenton, N. J., Bergeron, Y., Xu, X., Welp, L. R., and Medvigy, D.: Climate, soil organic layer, and nitrogen jointly drive forest development after fire in the North American boreal zone, J. Adv. Model. Earth Sy., 8, 1180–1209, 2016.
Uriarte, M., Canham, C. D., Thompson, J., Zimmerman, J. K., and Brokaw, N. Seedling recruitment in a hurricane-driven tropical forest: light limitation, density-dependence and the spatial distribution of parent trees, J. Ecol., 93, 291–304, 2005.
Uriarte, M., Canham, C. D., Thompson, J., Zimmerman, J. K., Murphy, L., Sabat, A. M., Fetcher, N., and Haines, B. L.: Natural disturbance and human land use as determinants of tropical forest dynamics: Results from a forest simulator, Ecol. Monogr., 79, 423–443, 2009.
Uriarte, M., Clark, J. S., Zimmerman, J. K., Comita, L. S., Forero-Montana, J., and Thompson, J.: Multidimensional trade-offs in species responses to disturbance: implications for diversity in a subtropical forest, Ecology, 93, 191–205, 2012.
Uriarte, M., Thompson, J., and Zimmerman, J. K.: Hurricane Maria tripled stem breaks and doubled tree mortality relative to other major storms, Nat. Commun., 10, 1362, https://doi.org/10.1038/s41467-019-09319-2, 2019.
Walker, L. R.: Tree damage and recovery from hurricane Hugo in Luquillo Experimental Forest, Puerto Rico. Part A. special issue: ecosystem, plant, and animal responses to hurricanes in the Caribbean, Biotropica, 23, 379–385, 1991.
Walker, L. R., Voltzow, J., Ackerman, J. D., Fernandez, D. S., and Fetcher, N.: Immediate impact of hurricane Hugo on a Puerto Rico rain forest, Ecology, 73, 691–694, 1992.
Wang, D., LeBauer, D. and Dietze, M.: Predicting yields of short-rotation hybrid poplar (Populus spp.) for the United States through model-data synthesis, Ecol. Appl., 23, 944–958, 2013.
Wang, G. and Eltahir, E. A. B.: Biosphere-atmosphere interactions over West Africa. II: Multiple climate equilibria, Q. J. Roy. Meteor. Soc., 126, 1261–1280, 2000.
Xiao, Z., Liang, S., Wang, J., Xiang, Y., Zhao X., and Song, J.: Long-time-series global land surface satellite leaf area index product derived from MODIS and AVHRR surface reflectance, IEEE T. Geosci. Remote, 54, 5301–5318, 2016.
Xiao, Z., Liang, S., and Jiang, B.: Evaluation of four long time-series global leaf area index products, Agric. For. Meteorol., 246, 218–230, 2017.
Xu, X. and Trugman, A. T.: trait-based modeling of terrestrial ecosystems: Advances and challenges under global change, Curr. Clim. Change Rep., 7, 1–13, 2021.
Xu, X., Medvigy, D., Powers, J. S., Becknell, J. M., and Guan, K.: Diversity in plant hydraulic traits explains seasonal and inter-annual variations of vegetation dynamics in seasonally dry tropical forests, New Phytologist, 212, 80–95, 2016.
Zhang, J., Bras, R. L., and Heartsill Scalley, T.: Tree census at Bisley Experimental Watersheds three months after hurricane Maria, Fort Collins, CO, Forest Service Research Data Archive [data set], https://doi.org/10.2737/RDS-2020-0012, 2020.
Zhang, J., Bras, R. L., Longo, M., and Heartsill Scalley, T.: ED2 model with hurricane disturbance and a new tropical palm PFT (ED2-HuDi v1.0), Zenodo [code], https://doi.org/10.5281/zenodo.5565063, 2021.
Zhang, J., Bras, R. L., and Heartsill Scalley, T.: Tree census at Bisley Experimental Watersheds before and after Hurricane Hugo, Fort Collins, CO, Forest Service Research Data Archive [data set], https://doi.org/10.2737/RDS-2022-0025, 2022a.
Zhang, J., Heartsill Scalley, T., and Bras, R. L.: Forest structure and composition are critical to hurricane mortality, Forests, 13, 202, https://doi.org/10.3390/f13020202, 2022b.
Zhang, K., de Almeida Castanho, A. D., Galbraith, D. R., Moghim, S., Levine, N. M., Bras, R. L., Coe, M. T., Costa, M. H., Malhi, Y., Longo, M., Knox, R. G., McKnight, S., Wang, J., and Moorcroft, P. R.: The fate of Amazonian ecosystems over the coming century arising from changes in climate, atmospheric CO2 and land-use, Global Change Biol., 21, 2569–2587, 2015.
Zimmerman, J, K., Everham, E. M., Waide, R. B., Lodge, D. J., Taylor, C. M., and Brokaw, N. V. L.: Responses of tree species to hurricane winds in subtropical wet forest in Puerto Rico: Implications for tropical tree life histories, J. Ecol., 82, 911–922, 1994.