the Creative Commons Attribution 4.0 License.
the Creative Commons Attribution 4.0 License.
 | 21 Feb 2022
A parameterization of long-continuing-current (LCC) lightning in the lightning submodel LNOX (version 3.0) of the Modular Earth Submodel System (MESSy, version 2.54)
Francisco J. Pérez-Invernón
Heidi Huntrieser
Patrick Jöckel
Francisco J. Gordillo-Vázquez
Lightning flashes can produce a discharge in which a continuing electrical current flows for more than 40 ms. Such flashes are proposed to be the main precursors of lightning-ignited wildfires and also to trigger sprite discharges in the mesosphere. However, lightning parameterizations implemented in global atmospheric models do not include information about the continuing electrical current of flashes. The continuing current of lightning flashes cannot be detected by conventional lightning location systems. Instead, these so-called long-continuing-current (LCC) flashes are commonly observed by extremely low-frequency (ELF) sensors and by optical instruments located in space. Reports of LCC lightning flashes tend to occur in winter and oceanic thunderstorms, which suggests a connection between weak convection and the occurrence of this type of discharge.
In this study, we develop a parameterization of LCC lightning flashes based on a climatology derived from optical lightning measurements reported by the Lightning Imaging Sensor (LIS) on board the International Space Station (ISS) between March 2017 and March 2020. We use meteorological data from reanalyses to develop a global parameterization that uses vertical velocity at the 450 hPa pressure level as a proxy for the ratio of LCC to total lightning in thunderstorms. We implement this parameterization into the LNOX submodel of the Modular Earth Submodel System (MESSy) for usage within the European Center HAMburg general circulation model (ECHAM)/MESSy Atmospheric Chemistry (EMAC) model and compare the observed and simulated climatologies of LCC lightning flashes using six different lightning parameterizations. We find that the best agreement between the simulated and observed spatial distribution is obtained when using a novel combined lightning parameterization based on the cloud-top height over land and on the convective precipitation over ocean.
- Article
(25301 KB) - Full-text XML
- BibTeX
- EndNote


Lightning flashes are formed by electrical discharges with duration ranging between a few hundred of microseconds and hundreds milliseconds (Rakov and Uman, 2003). Lightning flashes containing a discharge in which a continuing electrical current flows for more than 40 ms are usually referred to as long-continuing-current lightning (LCC lightning) (Brook et al., 1962). LCC lightning has been associated with lightning-ignited fires (e.g., Fuquay et al., 1967; Latham and Williams, 2001; Pineda et al., 2014; Pérez-Invernón et al., 2021b), as the long duration of the discharge can favor ignition. This assumption is supported by laboratory experiments (e.g., McEachron and Hagenguth, 1942; Feng et al., 2019; Zhang et al., 2021).
LCC lightning is also proposed to be the main precursor of sprites (Bell et al., 1998; Cummer and Füllekrug, 2001; Cummer, 2003), a type of transient luminous event (TLE) taking place in the mesosphere above thunderclouds (Pasko et al., 2012; Gordillo-Vázquez and Pérez-Invernón, 2021). For example, Bell et al. (1998) reported sprite events triggered by lightning flashes with a continuing current lasting more than 1 ms. About 99 % of the reported sprites are initiated by positive cloud-to-ground (CG) lightning, while positive CG lightning flashes are only about 10 % of the total CG lightning (Chen et al., 2019). Even though positive CG lightning is rare, Bitzer (2017) reported that 55.2 % of the detected LCC lightning flashes over the US that were reported as CG lightning by the National Lightning Detection Network (NLDN) were positive. Despite evidence of the role of LCC lightning in lightning-ignited fires and in the production of sprites, there are still noteworthy uncertainties in the relationship between the meteorological conditions of thunderstorms and the occurrence of LCC lightning.
Lightning location systems (LLSs) provide global and continuous monitoring of the lightning activity all around the world. LLSs include very low-frequency (VLF) sensors that can detect the electromagnetic signature emitted by lightning flashes (Nag et al., 2015). VLF sensors are sensitive to the far-field component of the electromagnetic field produced by lightning, which is proportional to the peak current and decreases with distance following an inverse-square law (Rakov and Uman, 2003). However, the continuing phase of LCC lightning may lack a high peak current (Pineda et al., 2014). The continuing phase of LCC lightning produces an electrostatic field (also called near field) that decreases with distance following an inverse-cubic law. Therefore, LLSs provide little information about the continuing phase of lightning.
Fuquay et al. (1967) and Adachi et al. (2009) have shown that the optical signal emitted by lightning discharges can be related to the duration of the electrical discharge. Bitzer (2017) investigated for the first time the tropical and mid-latitude climatology of LCC lightning discharges from optical lightning measurements reported by the Lightning Imaging Sensor (LIS) on board the Tropical Rainfall Measuring Mission (TRMM) satellite following a low-Earth orbit between 1997 and 2015, providing lightning measurements in the range of latitudes between 35∘ N and 35∘ S. Based on the observation that LCC lightning discharges tend to occur in oceanic and winter thunderstorms, Bitzer (2017) proposed that thunderstorms with weaker updrafts would produce small charging rates, allowing the charging process to develop larger charge regions before the onset of lightning and providing the discharge with more energy to be transferred.
Lightning and TLEs are sub-grid phenomena that cannot be self-consistently implemented in global atmospheric models. However, the process of electric charge separation that produces lightning is highly influenced by dynamic and thermodynamic processes (Showalter, 1953). Therefore, lightning and TLE activity are parameterized in global atmospheric models using meteorological variables as proxies (e.g., Tost et al., 2007; Murray et al., 2012; Pérez-Invernón et al., 2019; Gordillo-Vázquez et al., 2019). In the same way, relating the occurrence of LCC lightning activity to large-scale meteorological parameters could be helpful to improve the parameterization of lightning-ignited fires in global climate models and (to) implement the occurrence of sprites. In this study, we present a simple LCC lightning parameterization which relates the ratio of LCC lightning to total lightning in thunderstorms with the updraft strength at a specific altitude. We implement this novel parameterization as an upgrade of the LNOX submodel (Tost et al., 2007) of the Modular Earth Submodel System (MESSy) and test it with the European Center HAMburg general circulation model (ECHAM)/MESSy Atmospheric Chemistry (EMAC) model (v2.54). We test the parameterization by comparing the simulated seasonal spatial distribution of LCC lightning during 2018 with lightning data reported by LIS on board the International Space Station (ISS LIS).
2.1 Lightning measurements and LCC lightning
The climatology of LCC lightning flashes developed by Bitzer (2017) was based on TRMM LIS data acquired during a 12-year period (2002–2013) for latitudes between 35∘ N and 35∘ S (Christian et al., 2003; Cecil et al., 2014). Bitzer (2017) proposed a method to identify LCC lightning flashes from the groups reported by TRMM LIS. ISS LIS detects optical emissions from lightning with a frame integration time of 1.79 ms (Bitzer and Christian, 2015) and a spatial resolution of 4 km (Blakeslee et al., 2020), while the spatial resolution of TRMM LIS was approximately 5 km (Christian et al., 2003; Cecil et al., 2014). LIS sorts contiguous events into groups and clusters groups into flashes with temporal criteria of 330 ms and spatial criteria of 5.5 km (Mach et al., 2007). Bitzer (2017) proposed that optical emissions detected in five or more consecutive frames (time-contiguous groups) that are in the same flash can be classified as an LCC(> 9 ms) lightning flash. In the same manner, optical emissions detected in 10 or more consecutive frames (time-contiguous groups) that are in the same flash can be classified as an LCC(> 18 ms) lightning flash. However, the duration of the continuing phase detected by ISS LIS should be considered a minimum. Bitzer (2017) compared the duration of the optical signal of a flash (7–9 ms) with the duration of the continuing current reported by the Huntsville Alabama Marx Meter Array (HAMMA) of 22 ms. According to this comparison between the duration of the continuing phase as measured by ISS LIS and HAMMA, LCC(> 18 ms) lightning flashes could have a continuing current lasting about 44–57 ms. This is consistent with the minimum duration of 40 ms for flashes that ignited fires as reported by McEachron and Hagenguth (1942) and Fuquay et al. (1967). LIS detects all sort of lightning: that is, intra-cloud (IC) and CG.
The operations of TRMM LIS ended in 2015, and a similar instrument on board the ISS replaced it in March 2017 and is still sampling latitudes between 54.3∘ N and 54.3∘ S (Blakeslee et al., 2020) as of January 2022. We use the method proposed by Bitzer (2017) to produce global climatologies of LCC(> 9 ms) and LCC(> 18 ms) lightning flashes based on ISS LIS lightning measurements between March 2017 and March 2020.
We show in Fig. 1 the obtained total annual lightning flash density (IC + CG lightning), LCC(> 9 ms) lightning flash density, and ratios between LCC(> 9 ms) and LCC(> 18 ms) lightning to total lightning (all lightning flashes). Figure 1a shows the total annual lightning flash density, which is in agreement with the ISS LIS annual gridded climatology reported by Blakeslee et al. (2020). The peak flash density (3.5 × 10³ flashes) occurs over central Africa, while there are other regions with significant lightning activity, such as the Himalayas, India, and some regions of Paraguay, Argentina, Brazil, Venezuela, North America, and the Maritime Continent. There is also a clear contrast between land and ocean, as reported by Blakeslee et al. (2020).
Figure 1b shows the obtained LCC(> 9 ms) lightning flash density. In total, we have obtained 234 007 LCC(> 9 ms) lightning flashes. Areas with high lightning activity coincide with a high abundance of LCC(> 9 ms) lightning flashes. However, other regions are also LCC(> 9 ms) lightning hotspots. This feature of LCC(> 9 ms) lightning flash spatial distributions is more clearly shown by the ratio of LCC(> 9 ms) lightning to all lightning reported by ISS LIS in each cell in Fig. 1c. The ratio of LCC(> 9 ms) lightning to all lightning is higher over ocean than over land. Oceanic thunderstorms are usually associated with weak convection, low lightning activity, and energetic lightning flashes (Liu et al., 2010; Said et al., 2013). As proposed by Bitzer (2017), a higher ratio of LCC lightning to all lightning in the ocean than over land indicates a possible relationship between convection and the occurrence of LCC lightning. Over land, the ratio of LCC(> 9 ms) lightning to all lightning reaches its maximum over Australia, southern Chile, Canada, and eastern Europe. These areas do not coincide with lightning hotspots, again indicating that areas with high convection do not coincide with areas with a high ratio of LCC(> 9 ms) lightning to total lightning. There are also some small areas with a high ratio of LCC(> 9 ms) lightning to all lightning in southern Africa, China, Japan, and on the western coast of North America. The obtained spatial distribution of the ratio of LCC(> 9 ms) lightning to all lightning is in agreement with Fig. 6 of Bitzer (2017) between 35∘ N and 35∘ S latitude. Interestingly, a high ratio downwind of North America, Argentina, southern Africa, and Australia can be seen. All these regions are well known for intercontinental transport of trace gases (start of warm conveyor belts) (Eckhardt et al., 2004). The ratio is also high in the outflow from western Africa to South America, a transport route for dust and biomass burning.
Figure 1d shows that the spatial distribution of the ratio of LCC(> 18 ms) lightning to all lightning flashes is similar to the spatial distribution of the ratio of LCC(> 9 ms) lightning to all lightning flashes, as both ratios are higher over ocean than over land and show maxima over the same continental areas. This agreement is not surprising as LCC(> 18 ms) lightning is a subset of LCC(> 9 ms) lightning. We obtain a total of 2.6 × 10⁴ LCC(> 18 ms) lightning flashes. This quantity is significantly lower than the total number of lightning flashes and LCC(> 9 ms) lightning flashes (3.5 × 10⁶ and 2.3 × 10⁵, respectively). Therefore, the spatial distribution of the ratio of LCC(> 18 ms) lightning to all lightning flashes is less smooth than the spatial distributions of the ratio of LCC(> 9 ms) to total lightning flashes.
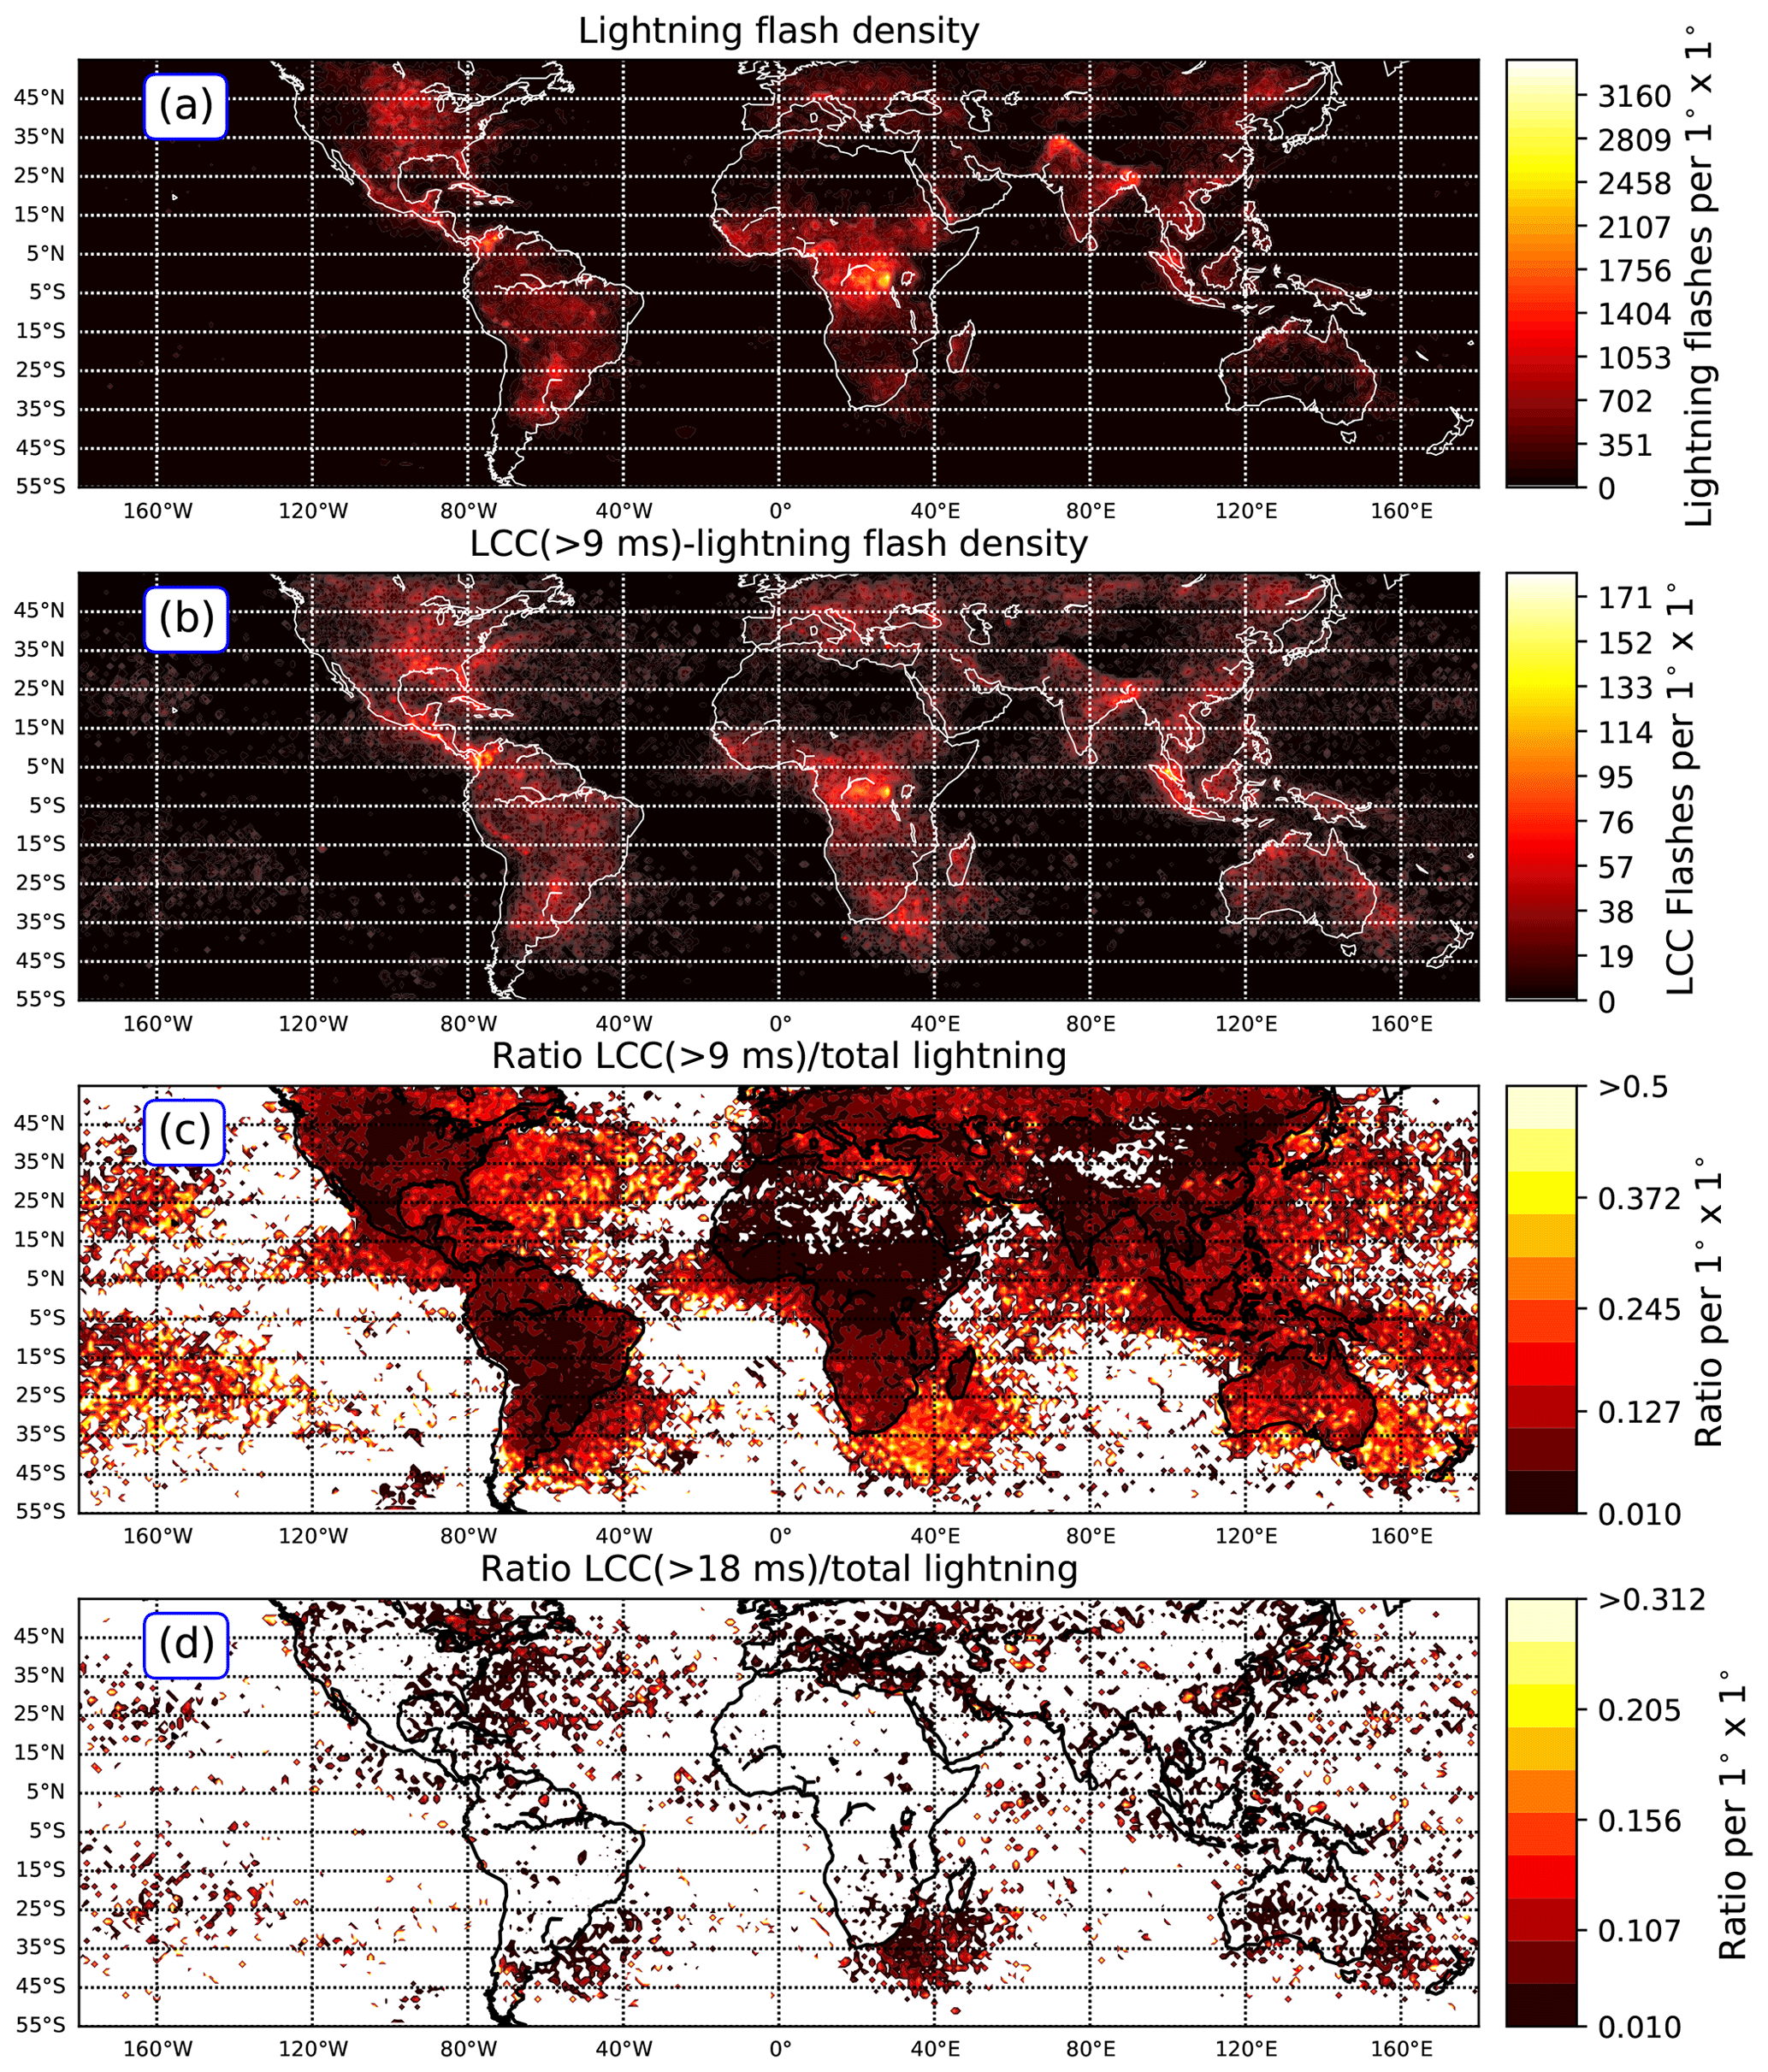
Figure 1 Annual lightning flash density (a), LCC(> 9 ms) lightning flash density (b), ratio between LCC(> 9 ms) lightning and lightning flash densities (c), and ratio between LCC(> 18 ms) lightning and lightning flash densities (d) extracted from ISS LIS data between March 2017 and March 2018 binned into 1∘ × 1∘ grids. The ratio is undefined in grids without any detection of LCC lightning flashes.
2.2 Meteorological data
Thunderstorm electrification processes are highly influenced by meteorological conditions, producing the rising of moist air reaching the level of free convection below the 500 hPa level (Showalter, 1953). Several of the most commonly used lightning parameterizations are based on meteorological variables at the 440 hPa pressure level that are related to convection. For example, the parameterizations by Allen and Pickering (2002) and Finney et al. (2014) use the updraft strength at the 440 hPa pressure level and the cloud ice flux at 440 hPa to estimate the lightning activity, respectively. The 440 hPa pressure level is typically chosen to parameterize lightning because temperature is about −25∘, favoring supersaturation and the co-existence of a mixture of ice particles and liquid droplets (Korolev and Mazin, 2003) that contributes to electrification (Khain et al., 2012). Other lightning parameterizations employ some meteorological variables that are also related to convection, such as the parameterization by Grewe et al. (2001) that uses the updraft velocity in clouds as a proxy for lightning activity or the parameterizations by Price and Rind (1992) and Luhar et al. (2021) that use the cloud-top height (CTH).
As proposed by Bitzer (2017) and Pérez-Invernón et al. (2021b), updrafts could play a role in the production of LCC lightning. The charging rate is influenced by the velocity (the updrafts) (Brooks et al., 1997). The slower charging rate can allow a larger charge region to develop before the discharge starts. Bitzer (2017) proposed that a larger charge region can provide a higher amount of electrical charge to be neutralized by a flash, allowing LCC lightning to be formed. Therefore, we propose using vertical velocity at the 450 hPa pressure level as a proxy for LCC lightning activity. The 450 hPa pressure level has been chosen because it is the nearest level to the 440 hPa level in the ERA5 grid in which ice particles and liquid droplets can co-exist. Romps (2019) proposed that using the 260 K isotherm for lightning parameterizations is more reliable than using the 440 hPa level. The 260 K isotherm lies within the mixed-phase regions of clouds and is close to the 440 hPa isobar. However, obtaining the updraft on the isotherm from ERA5 reanalysis is more complex than extracting the updraft on an isobar. In addition, the parameterizations that use the updraft on the 440 hPa isobar (Allen and Pickering, 2002; Finney et al., 2014) have shown good agreement with observations. Therefore, we use 1-hourly ERA5 vertical velocity at the 450 hPa pressure level with a horizontal resolution of 0.25∘ provided by the European Centre for Medium-Range Weather Forecasts (ECMWF) ERA5 reanalysis data set (Hersbach et al., 2020). In particular, we extract 1-hourly global values of the instantaneous vertical velocity at 450 hPa for the entire period between 1 March 2017 and 28 February 2018. As we describe in Sect. 2.2, we re-grid the data onto a 2.5∘ × 2.5∘ grid to develop the parameterization of LCC lightning.
In this section, we describe the developed LCC lightning parameterization. We start with a brief description of EMAC and the LNOX submodel in Sect. 3.1. In Sect. 2.2, we introduce the LCC lightning parameterization. Finally, we describe the implementation of the developed LCC lightning parameterization in the LNOX submodel in Sect. 3.3.
3.1 Chemistry–climate model EMAC and LNOX submodel
The developed LCC lightning parameterization is implemented as a modification of the LNOX submodel of the Modular Earth Submodel (MESSy v2.54) and tested with the EMAC model. The EMAC model is a numerical chemistry–climate model that couples the fifth-generation European Center HAMburg general circulation model (ECHAM5; Roeckner et al., 2006) and the second version of the Modular Earth Submodel System (MESSy) to link multi-institutional computer codes, known as MESSy submodels (Jöckel et al., 2010, 2016). Such submodels are used to describe tropospheric and middle atmosphere processes and their interaction with oceans, land, and influences coming from anthropogenic emissions.
The LNOX submodel estimates the flash density and production of NOx by lightning through different lightning parameterizations (Tost et al., 2007) and a scaling factor that ensures a global lightning occurrence rate of ∼ 45 flashes per second (Christian et al., 2003; Cecil et al., 2014). For the present study, we use the parameterization of Grewe et al. (2001) based on the updraft velocity in clouds (here referred to as Gupdr), the parameterization based on the CTH by Price and Rind (1992, here referred to as Pcth), the two parameterizations by Allen and Pickering (2002) based on the convective precipitation (here referred to as Aprec), and the updraft strength at the 440 hPa pressure level (here referred to as Aupdr), as well as our novel combination of the parameterization based on the CTH (Price and Rind, 1992) for land and on the updraft strength at the 440 hPa pressure level (Allen and Pickering, 2002) for ocean (here referred to as Pcth+Aprec). In addition, we have implemented an extra lightning parameterization based on the improved cloud-height-based parameterization reported by Luhar et al. (2021, Eqs. 17–18, here referred to as Lcth). The lightning parameterization developed by Luhar et al. (2021) produces better agreement with lightning observations over the ocean. Lightning parameterizations and scaling factors used in this study are summarized in Table 1.
3.2 Parameterization of LCC lightning based on the updraft strength
In this section, we investigate the relationship between the ratios of LCC(> 9 ms) and LCC(> 18 ms) lightning to total lightning flashes and the updraft strength from ERA5 reanalysis.
First, we process the ERA5 reanalysis data before combining with ISS LIS lightning data. The global 1-hourly averaged values of the vertical velocity at the 450 hPa level between March 2017 and March 2018 are re-gridded onto a 2.50∘ × 2.50∘ latitude and longitude grid, which it is similar to that typically used in global chemistry–climate models. To do that, we extract the value of the vertical velocity for each of the lightning flashes reported by ISS LIS as the averaged value in the position of the flash and up to five cells away (in latitude and longitude directions). Then, we create groups of all the lightning flashes that coincide in each grid cell; i.e., we define groups of lightning flashes taking place at the same hour and within a 2.50∘ × 2.50∘ grid box. There is a unique value of the vertical velocity at 450 hPa for each lightning flash in each group. Finally, we calculate the ratios of LCC(> 9 ms) and LCC(> 18 ms) lightning to total lightning flashes within each group of flashes.
We restrict our analysis to groups of flashes that include LCC(> 9 ms) and/or LCC(> 18 ms) lightning flashes and for which the sign of the vertical velocity indicates upward transport of air. We assume that the non-observation of LCC lightning flashes during the fast passage of ISS LIS over the thunderstorm does not provide enough information to assume that the observed thunderstorm cannot produce LCC lightning at all. Therefore, we do not include thunderstorms exclusively producing total lightning flashes during the passage of ISS LIS. We consider grid cells wherein the movement of air is dominated by downward velocity to not be representative of thunderstorms. Applying these criteria, we find 1.6342 × 10⁴ and 2.981 × 10³ groups of flashes including LCC(> 9 ms) lightning and LCC(> 18 ms) lightning, respectively. In Fig. 2 we plot the obtained ratios of LCC(> 9 ms) and LCC(> 18 ms) lightning to total lightning flashes versus the updraft mass flux, estimated as the vertical velocity divided by the acceleration of gravity (9.8 m s−2). The high dispersion of values shown in Fig. 2 indicates that a possible relationship between the ratios of LCC(> 9 ms) and LCC(> 18 ms) lightning to total lightning flashes and the updraft is not obvious.
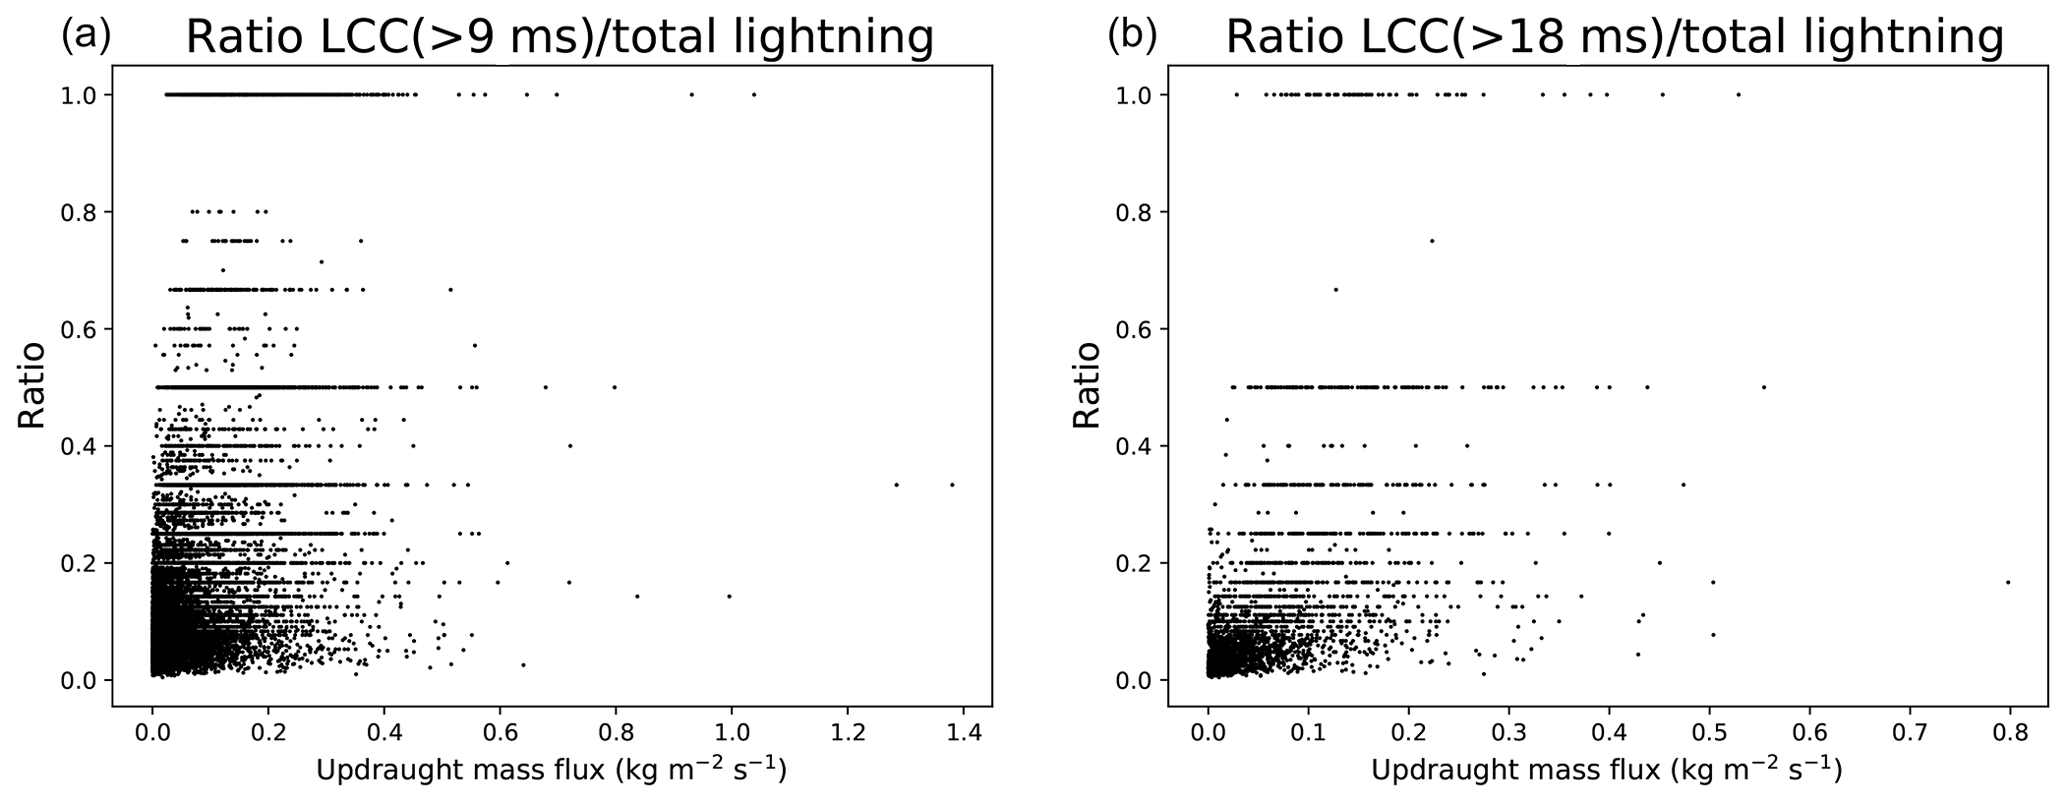
Figure 2 Ratios of (a) LCC(> 9 ms) and (b) LCC(> 18 ms) lightning to total lightning flashes versus the updraft mass flux extracted from ERA5 1-hourly averaged 2.75∘ × 2.75∘ grid cells for lightning reported by ISS LIS globally between March 2017 and March 2018.
Next, we analyze the data presented in Fig. 2. The average value of the updraft mass flux for the studied thunderstorms is 0.108 kg m−2 s−1. Most of the studied thunderstorms have updraft mass fluxes below 0.2 kg m−2 s−1. In particular, only 6.9 % of the thunderstorms included in the left panel have updraft mass fluxes larger than 0.2 kg m−2 s−1, while this quantity is reduced to 0.5 % for updraft mass fluxes larger than 0.5 kg m−2 s−1. In the right panel, only 5 % and 1.5 % of the included thunderstorms have updraft mass fluxes larger than 0.2 and 0.3 kg m−2 s−1, respectively. In an effort to develop a parameterization of the ratio of LCC lightning to total lightning that is not overrepresented by points in Fig. 2 with updraft mass fluxes below 0.2 kg m−2 s−1 and which is also applicable for projected simulations, we apply a discrete binning of the data using a 2.5 × 10⁻³ kg m−2 s−1 window. Red lines in Fig. 3 show the corresponding binned data.
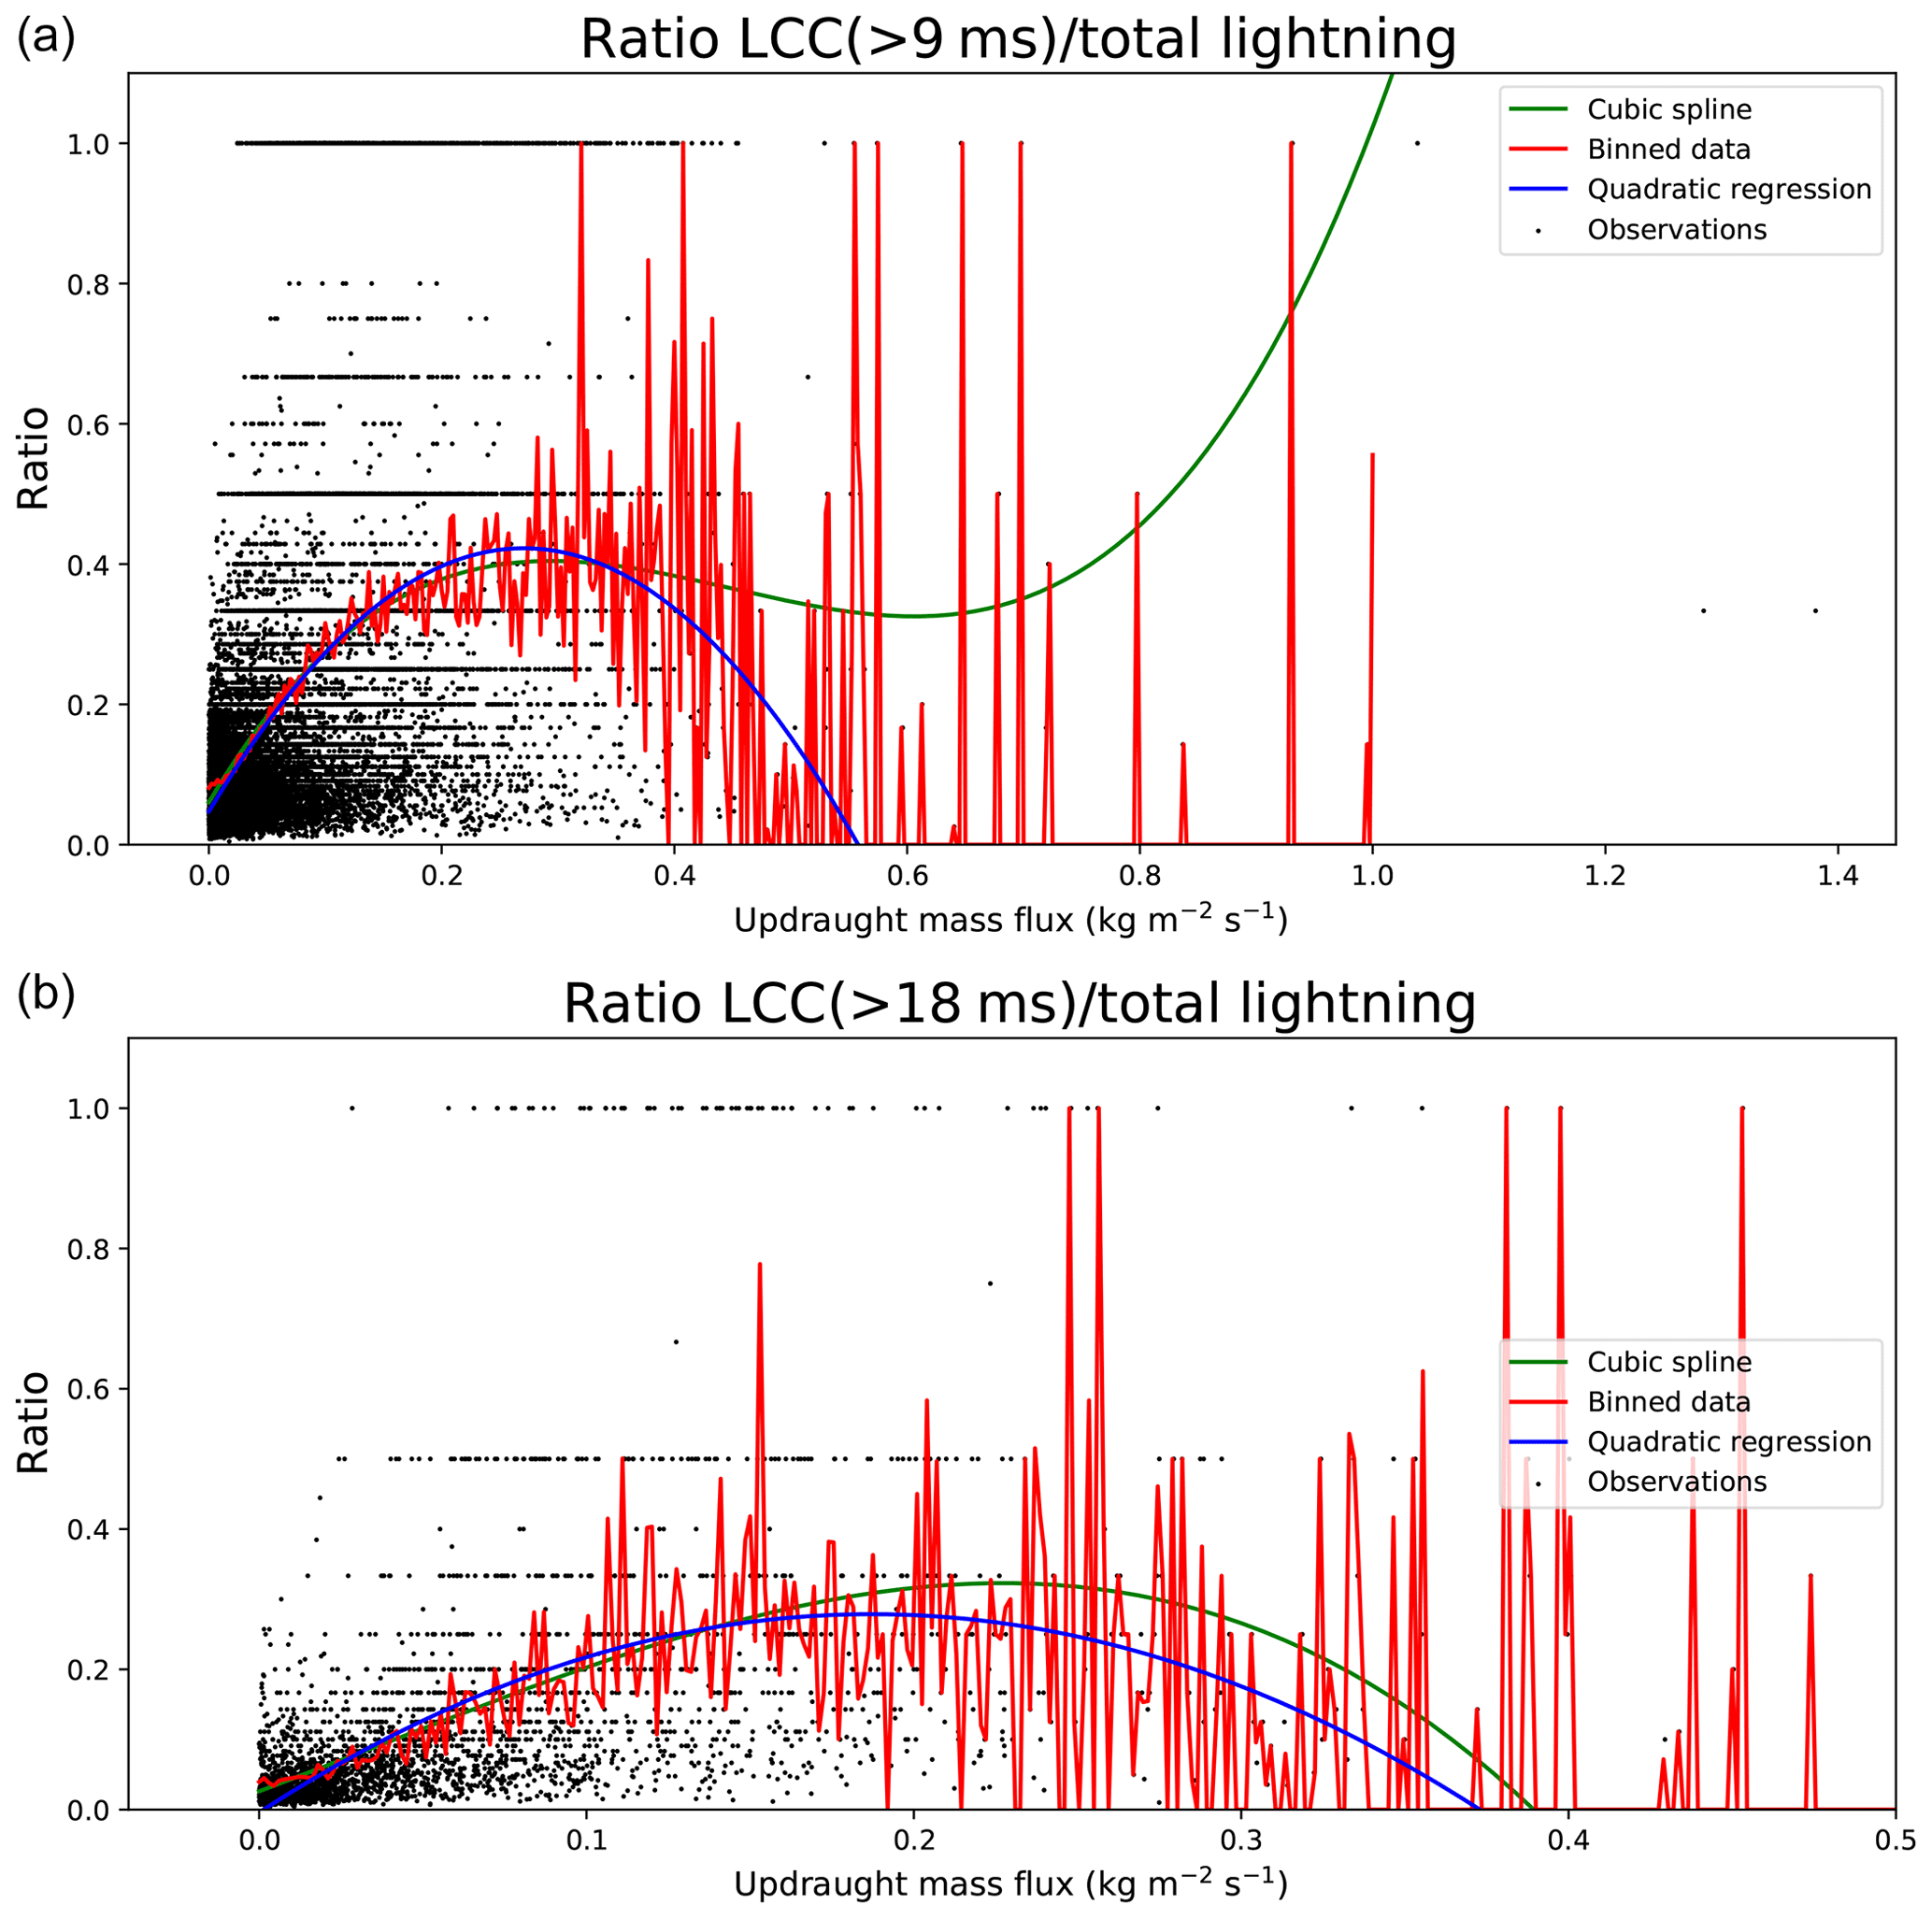
Figure 3 Ratios of (a) LCC(> 9 ms) and (b) LCC(> 18 ms) lightning to total lightning flashes versus the updraft mass flux as in Fig. 2. We have added a cubic smoothing spline (green line), a quadratic fitting (blue line), and a binning (red line) to the data as described in the text.
The binned data shown in Fig. 3 (red lines) indicate a possible quadratic relationship between the updraft mass flux and the ratios of LCC(> 9 ms) and LCC(> 18 ms) lightning to total lightning flashes below ∼ 0.5 and ∼ 0.3 kg m−2 s−1, respectively. Due to the lack of points above these values of the updraft mass flux, the binned data are noisy. Therefore, we approximate the ratio of LCC(> 9 ms) lightning to total lightning with a quadratic model between 0 and 0.5 kg m−2 s−1 (blue line in the first panel of Fig. 3). We assume that the ratio is unchanged and equal to zero for fluxes greater than 0.5 kg m−2 s−1. We obtain the ratio of LCC(> 9 ms) lightning to total lightning (R9) as calculated by
where M corresponds to the updraft mass flux.
In the same manner, we approximate the ratio of LCC(> 18 ms) lightning to total lightning with a quadratic model between 0 and 0.3 kg m−2 s−1 (blue line in the second panel of Fig. 3). In this case, the ratio is assumed to be unchanged and equal to zero for fluxes greater than 0.3 kg m−2 s−1. We obtain the ratio of LCC(> 18 ms) lightning to total lightning (R18) as calculated by
Binning the data brings a degree of arbitrariness into the model. Therefore, we compare the obtained quadratic approximation of the binned data to a cubic smoothing spline fitting over the original data using the function UnivariateSpline of SciPy (Virtanen et al., 2020) and setting a weight equal to the inverse of the standard deviation of the data and a smoothing factor equal to the number of observations, satisfying Boor's criterion (De Boor and De Boor, 1978). The obtained cubic smoothing splines are shown as green lines in Fig. 3. Comparison of the quadratic and the cubic smoothing spline models in both panels of Fig. 3 shows good agreement between the two models below 0.5 kg m−2 s−1. Therefore, we use the quadratic model to implement the ratios of LCC(> 9 ms) and LCC(> 18 ms) lightning to total lightning flashes in LNOX. The second-order polynomials are used between 0 and 0.5 kg m−2 s−1 in the case of LCC(> 9 ms) lightning and between 0 and 0.3 kg m−2 s−1 in the case of LCC(> 18 ms) lightning
We have performed a sensitivity analysis of the fitting by increasing the bin size by a factor of 5. We obtain a 30 % and a 50 % change in the fitting coefficients of Eqs. (1) and (2), respectively. Therefore, we conclude that the LCC(> 9 ms) lightning parameterization is not significantly influenced by the choice of the bin size. Due to the lack of data, the obtained LCC(> 18 ms) lightning parameterization has a stronger influence on the bin size.
3.3 Implementation in the MESSy submodel LNOX
In this section we describe the implementation of the LCC lightning parameterizations described by Eqs. (1) and (2) as a new subroutine called lcc in the LNOX submodel.
The new lcc subroutine receives the updraft mass flux (in kg m−2 s−1) and the total lightning flash frequency (in s−1) as inputs. Using Eqs. (1) and (2) and a scaling factor that depends on the time step and the spatial resolution, the lcc subroutine calculates the ratios of LCC(> 9 ms) and LCC(> 18 ms) lightning to total lightning flashes (set to zero if they are negative). The scaling factor is defined as a control namelist parameter of LNOX. The subroutine calculates the LCC(> 9 ms) and LCC(> 18 ms) lightning flash frequencies by multiplying the total lightning flash frequency by the calculated ratios. The outputs of the lcc subroutine are the LCC(> 9 ms) and LCC(> 18 ms) lightning flash frequencies and densities per second (s−1) and per second per square meter (s−1 m−2), respectively. For the output, we define four new channel objects (see Jöckel et al., 2010) in the LNOX submodel, namely the LCC(> 9 ms) and LCC(> 18 ms) lightning flash frequencies (s−1) and densities (in s−1 m−2).
A 1-year simulation was carried out for a demonstration of the developed LCC(> 9 ms) and LCC(> 18 ms) lightning parameterizations. The simulation setup is described in Sect. 4.1. The obtained lightning flash frequency resulting from each parameterization is presented in Sect. 4.2. Finally, the LCC lightning flash frequency is presented in Sect. 4, including a comparison with observational data from ISS LIS.
Price and Rind (1992)Luhar et al. (2021)Grewe et al. (2001)Allen and Pickering (2002)Allen and Pickering (2002)Price and Rind (1992); Allen and Pickering (2002)Table 1Lightning scaling factor used for each lightning parameterization.
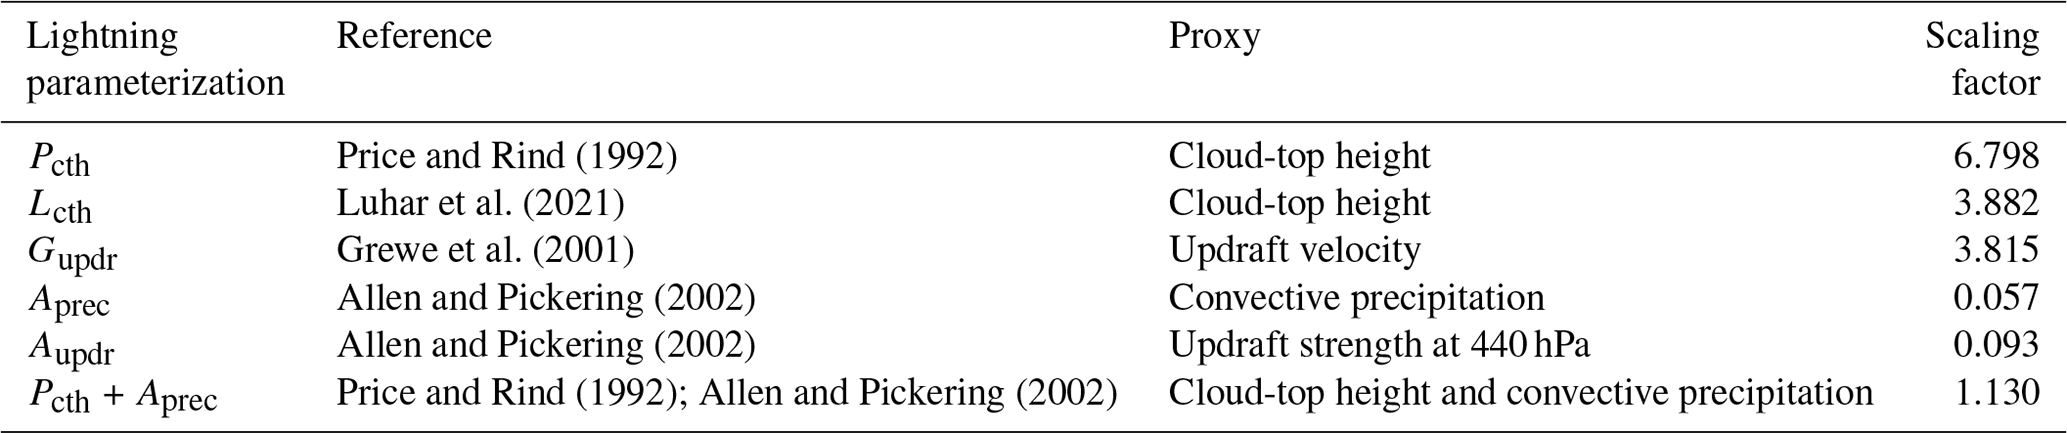
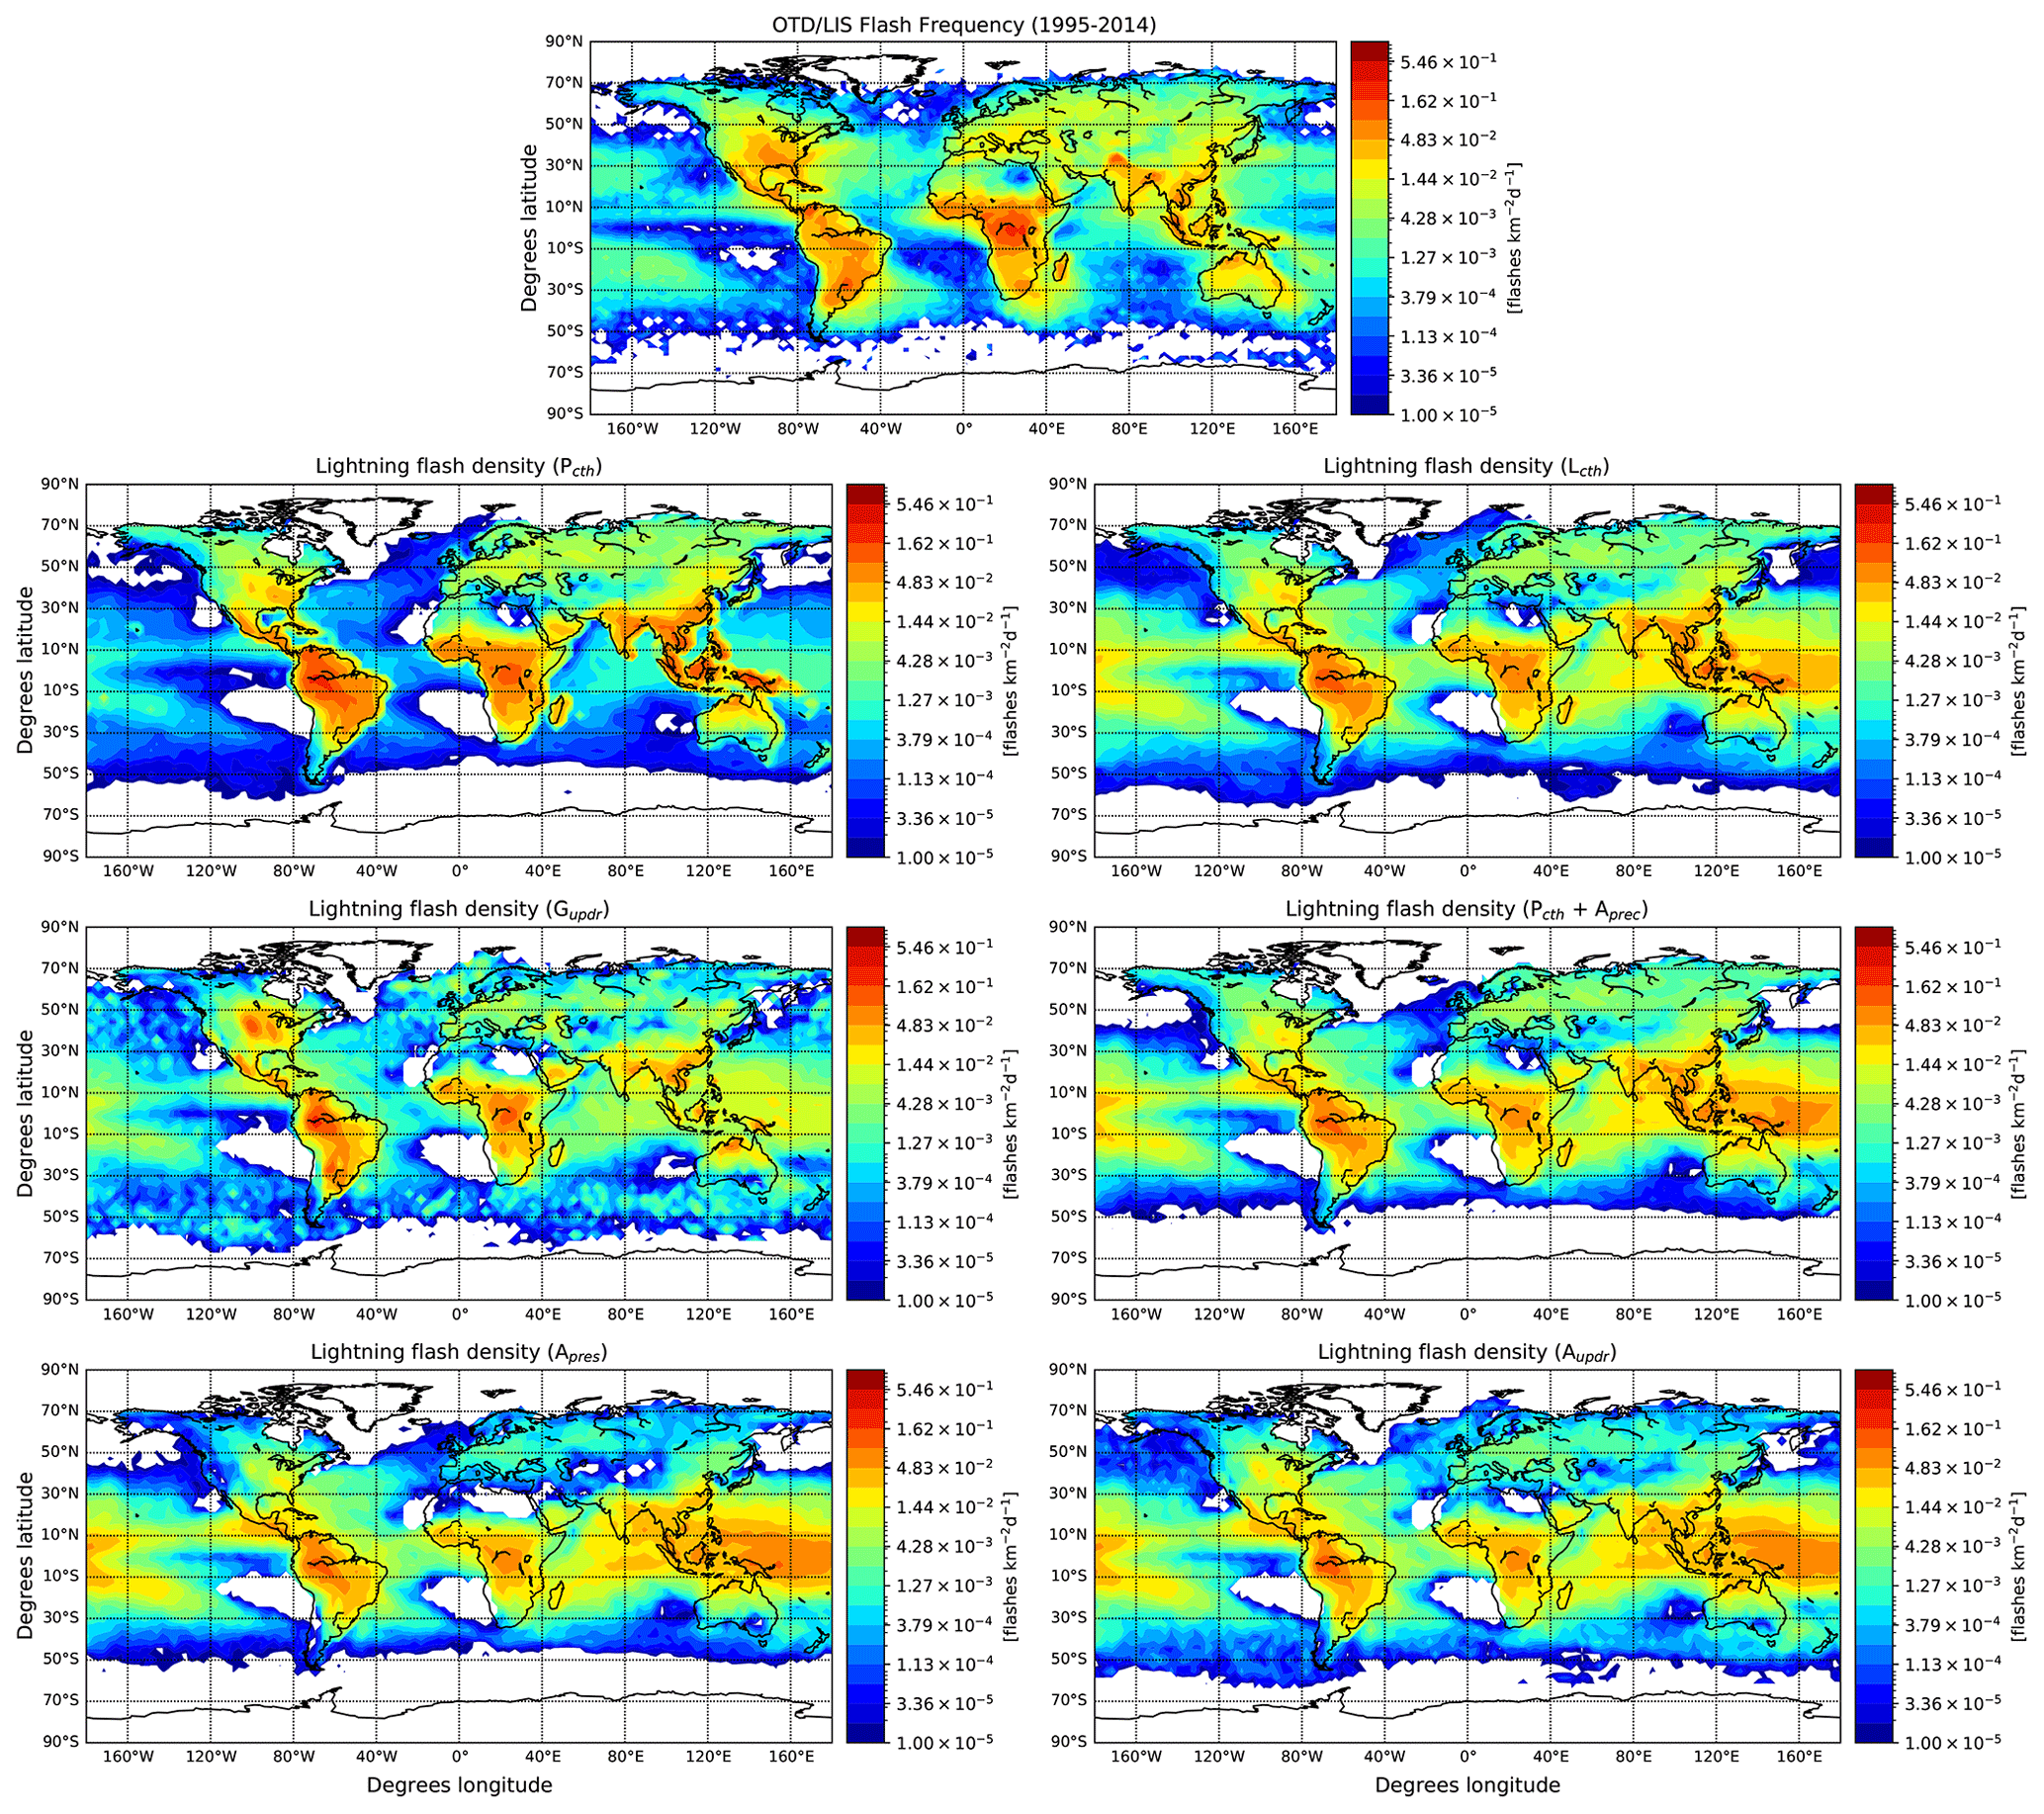
Figure 4 Global annual lightning observations (upper panel) by OTD/LIS using the OTD/LIS Gridded Lightning Climatology Data Collection version 2.3.2015 High-Resolution Monthly Climatology (HRMC) from 4 May 1995 to 31 December 2014 (Christian et al., 2003; Cecil et al., 2014). As in Gordillo-Vázquez et al. (2019), the climatology has been degraded to 2.5∘ longitude × 1.9∘ latitude resolution. Simulated annual average flash density (remaining panels) between 1 March 2017 and 28 February 2018 using different lightning parameterizations described in Table 1.
4.1 Simulation setup
In this example, we apply EMAC in the T42L90MA resolution, i.e., with a 2.8∘ × 2.8∘ quadratic Gaussian grid in latitude and longitude with 90 vertical levels reaching up to the 0.01 hPa pressure level and with 720 s time step length (Jöckel et al., 2016). We employ the namelist setup for purely dynamical simulations (referred to as the E5 setup, no chemistry) in the mode of free-running simulation. We use the Tiedtke convection scheme (Tiedtke, 1989) implemented in the submodel CONVECT. The simulation period is the same as that used to develop the LCC lightning parameterization, i.e., between 1 March 2017 and 28 February 2018. However, we start the simulation on January 2017 using ERA-Interim reanalysis meteorological fields (ECMWF, 2011) as initial conditions and considering 3 months of spin-up time. The lightning flash density, LCC lightning flash frequencies, and LCC lightning flash densities are output every 5 h. We do not modify the lightning-produced NOx in the code, as to the best of our knowledge there are no investigations reporting a difference in the production of NOx by LCC lightning with respect to total lightning.

Figure 5 Global annual lightning observations (upper panel) by OTD/LIS as in Fig. 4. Simulated annual average LCC(> 9 ms) lightning flash density (remaining panels) between 1 March 2017 and 28 February 2018 using different lightning parameterizations.
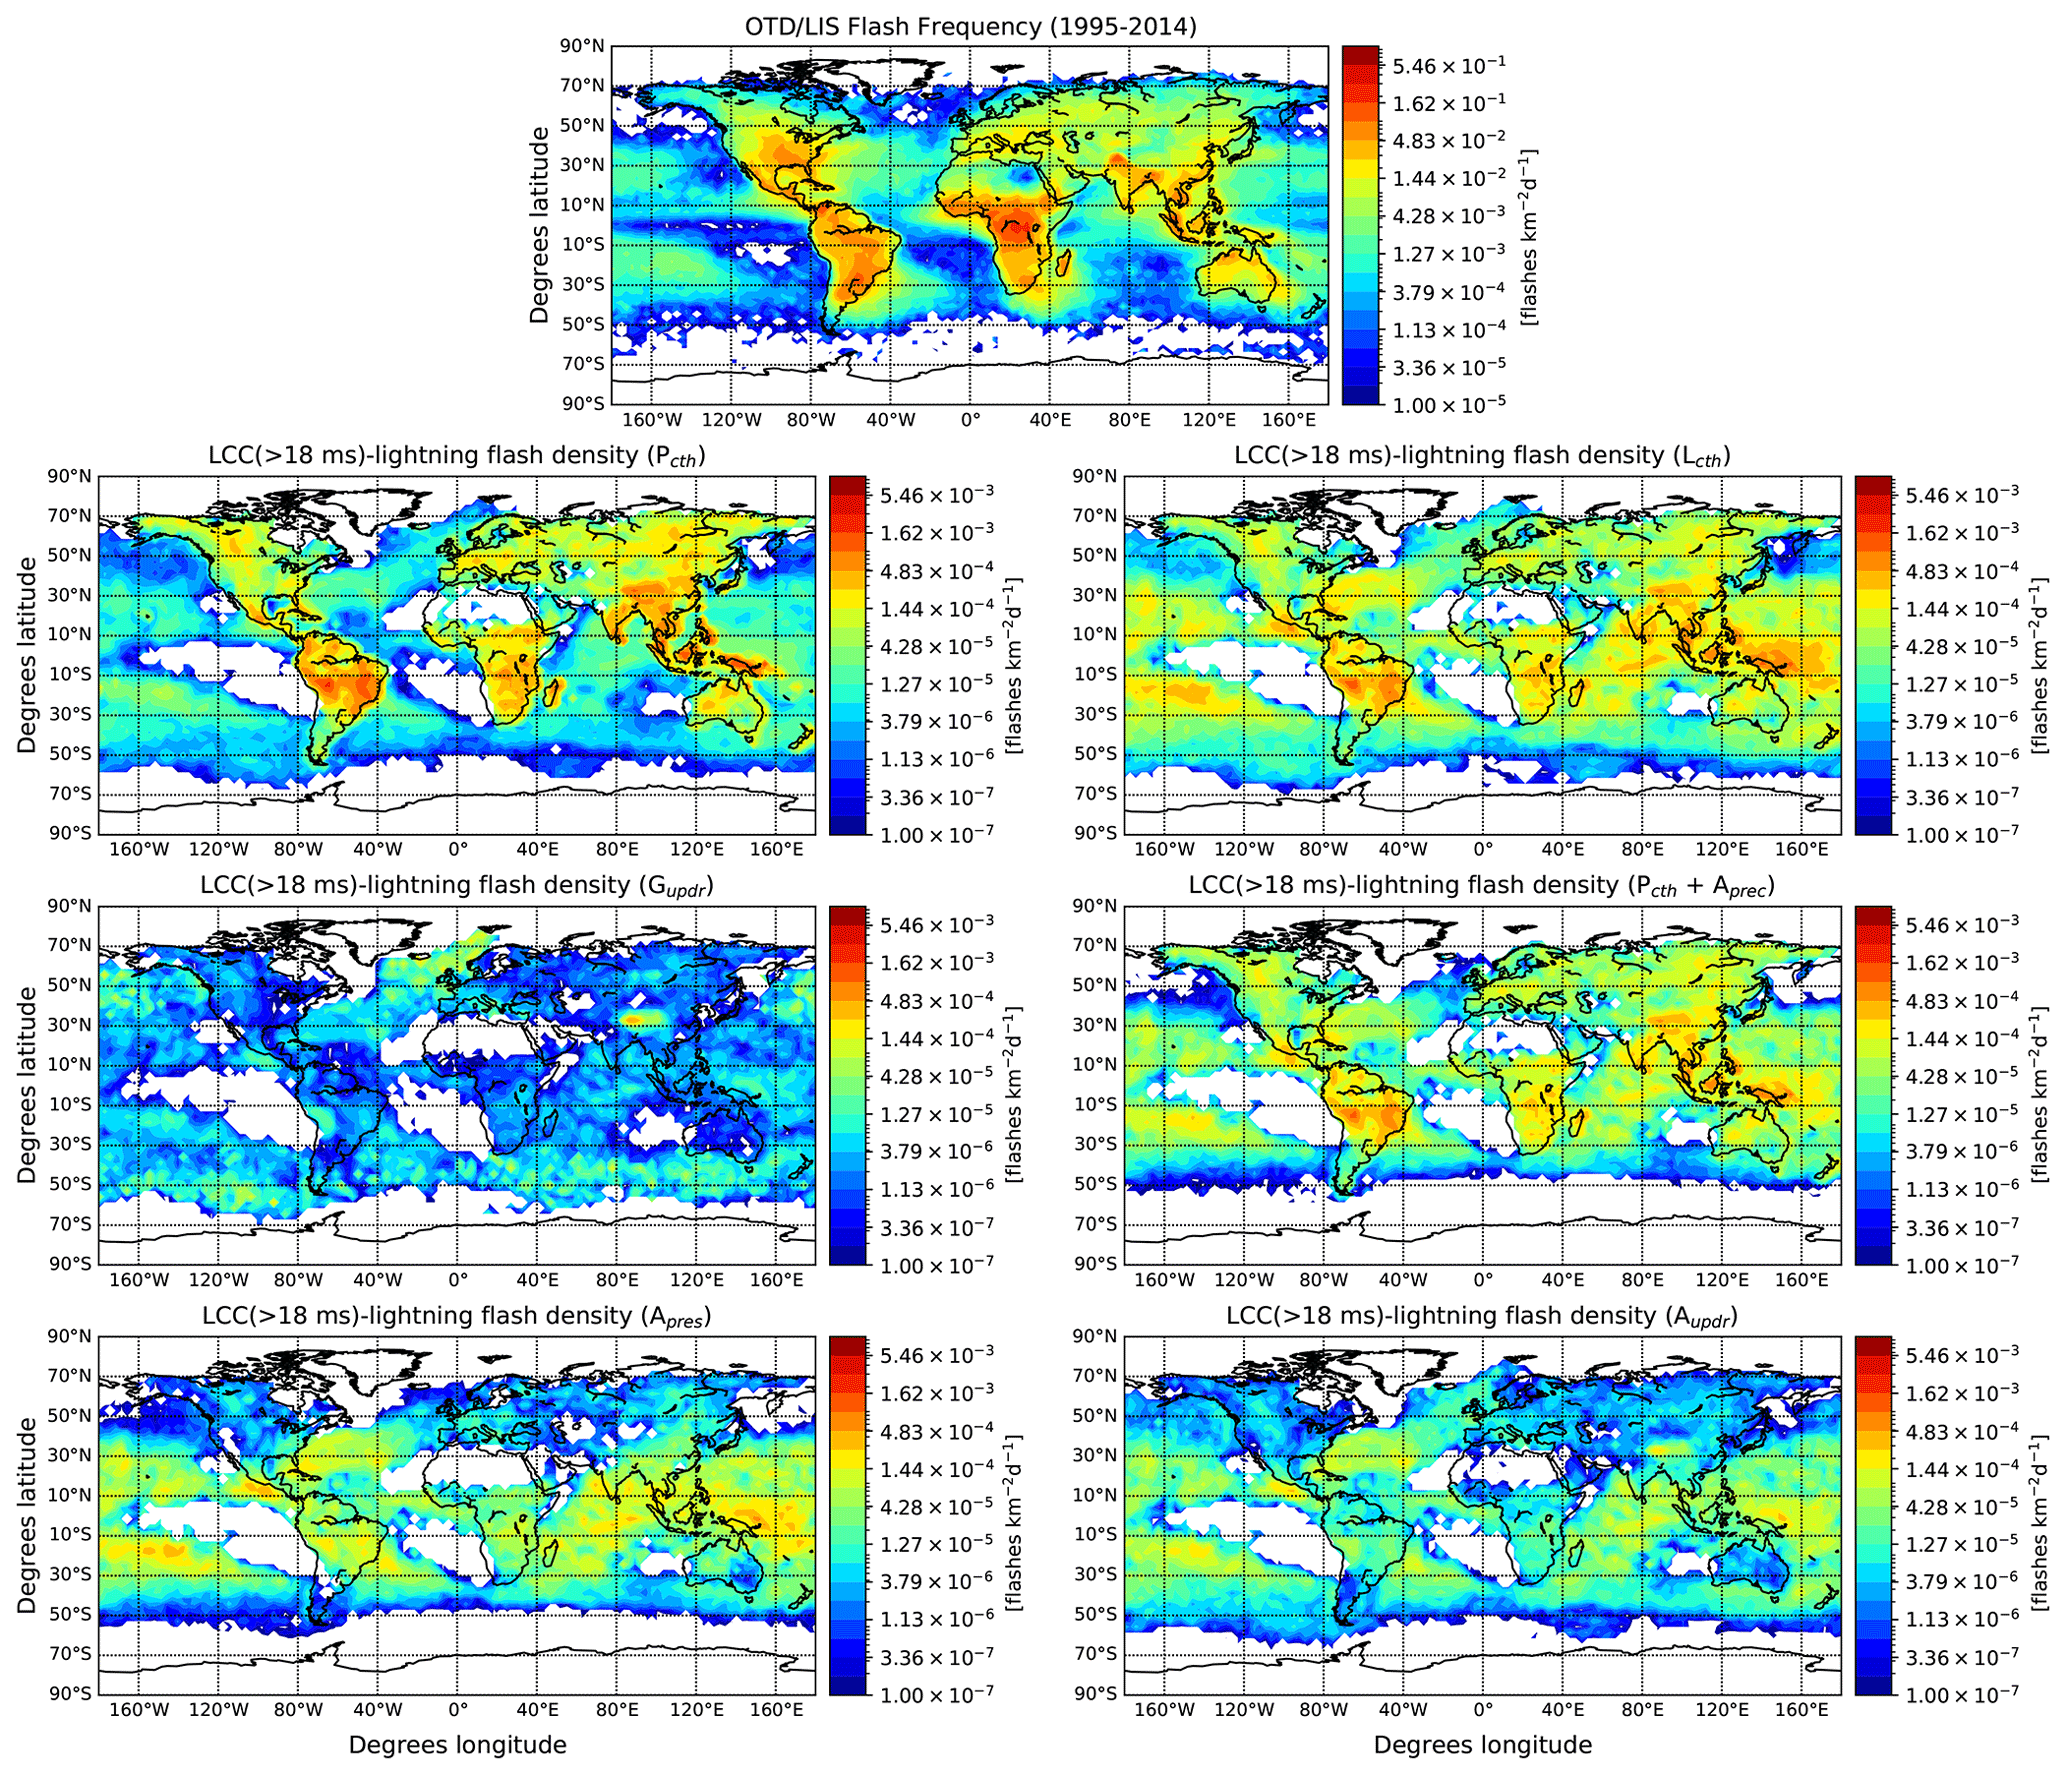
Figure 6 Global annual lightning observations (upper panel) by OTD/LIS as in Fig. 4. Simulated annual average LCC(> 18 ms) lightning flash density (remaining panels) between 1 March 2017 and 28 February 2018 using different lightning parameterizations.
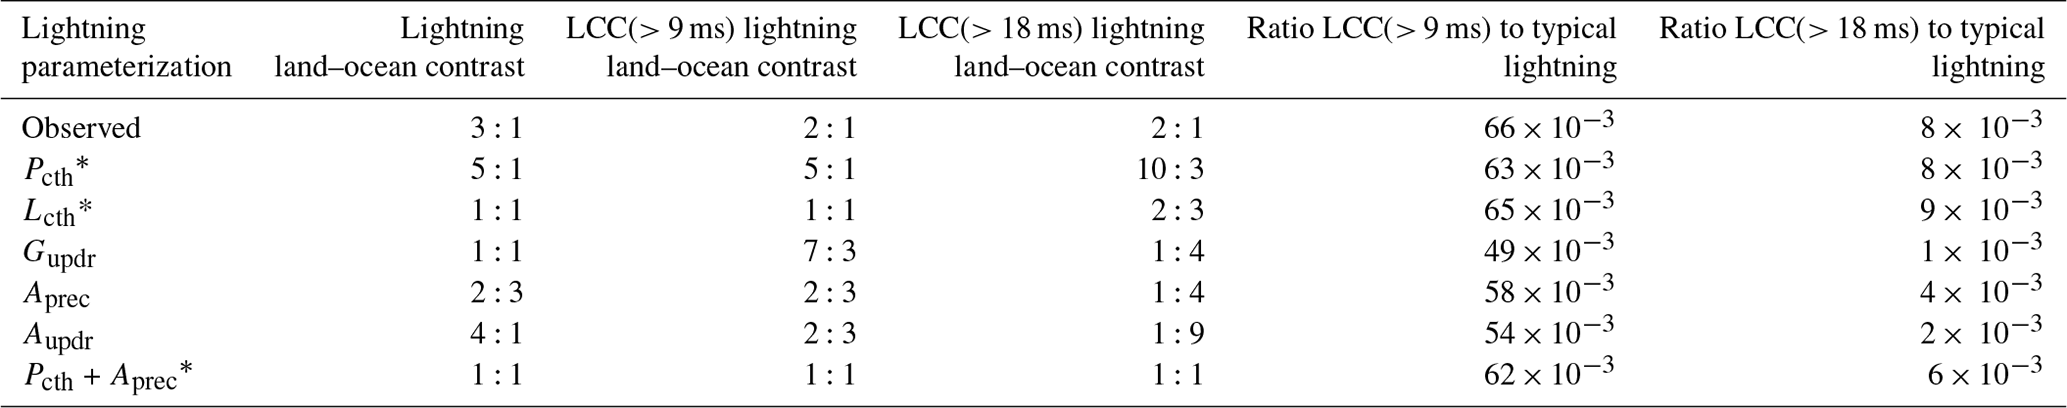
Table 2Contrast between land and ocean for LCC(> 9 ms), LCC(> 18 ms), and total lightning flashes for each lightning parameterization. We add the symbol * to the lightning parameterizations that are different for land and ocean.
The upward mass flux averaged over a grid cell is influenced by the total area of the cell, the time step, and the vertical resolution. In fact, as reported by Tost et al. (2007), lightning parameterizations based on the vertical velocity have to be re-scaled for different vertical resolutions. Therefore, an upward mass flux scaling factor has to be used in Eqs. (1) and (2) in our in T42L90MA resolution simulations. In order to calculate the upward mass flux scaling factor, we compare the maximum instantaneous value of the upward mass flux extracted from a 1-year EMAC simulation with the maximum value of the upward mass flux in a 2.5∘ × 2.5∘ latitude and longitude box from ERA5. We find that the maximum upward mass flux extracted from ERA5 is 6.57 times higher than the upward mass flux extracted from EMAC using different horizontal and vertical resolutions. Therefore, we use 6.57 as a upward mass flux scaling factor to multiply the upward mass flux before using Eqs. (1) and (2) for the T42L90MA resolution. For the T42L41DLR resolution (41 vertical levels from the surface up to the 10 hPa pressure level), we obtain an upward mass flux scaling factor of 6.95.

Figure 7 Seasonal observed (left panels) and simulated (right panels) ratio of LCC(> 9 ms) lightning to total lightning using the Pcth+Aprec lightning parameterization. The maximum value of the color bar is 0.44.
4.2 Lightning flash frequency
As explained in Sect. 3.3, the developed LCC lightning parameterizations are based on the lightning parameterization included in the atmospheric model. Therefore, we analyze the lightning density obtained with each of the employed lightning parameterizations first.
We have used a lightning scaling factor for each lightning parameterization in order to fix the annual global lightning flash rate to 45 flashes per second (Christian et al., 2003; Cecil et al., 2014). The lightning scaling factors are shown in Table 1.
The upper panel of Fig. 4 shows the global annual average flash density provided by OTD/LIS from 4 May 1995 to 31 December 2014 (Christian et al., 2003; Cecil et al., 2014), while the rest of the panels in Fig. 4 show the simulated global annual average flash density using different lightning parameterizations. According to space-based observations, the land–ocean contrast is nearly 3:1 (Christian et al., 2003; Cecil et al., 2014; Blakeslee et al., 2020). As previously reported by Tost et al. (2007), Pcth underestimates the lightning flash density over the oceans, producing a land–ocean contrast of about 5:1. Gupdr, Pcth+Aprec, and Lcth overestimate the lightning flash density over the ocean, producing a contrast of about 1:1. Finally, we obtain the highest overestimation over the ocean using Aprec and Aupdr, obtaining contrasts of 2:3 and 4:1, respectively.
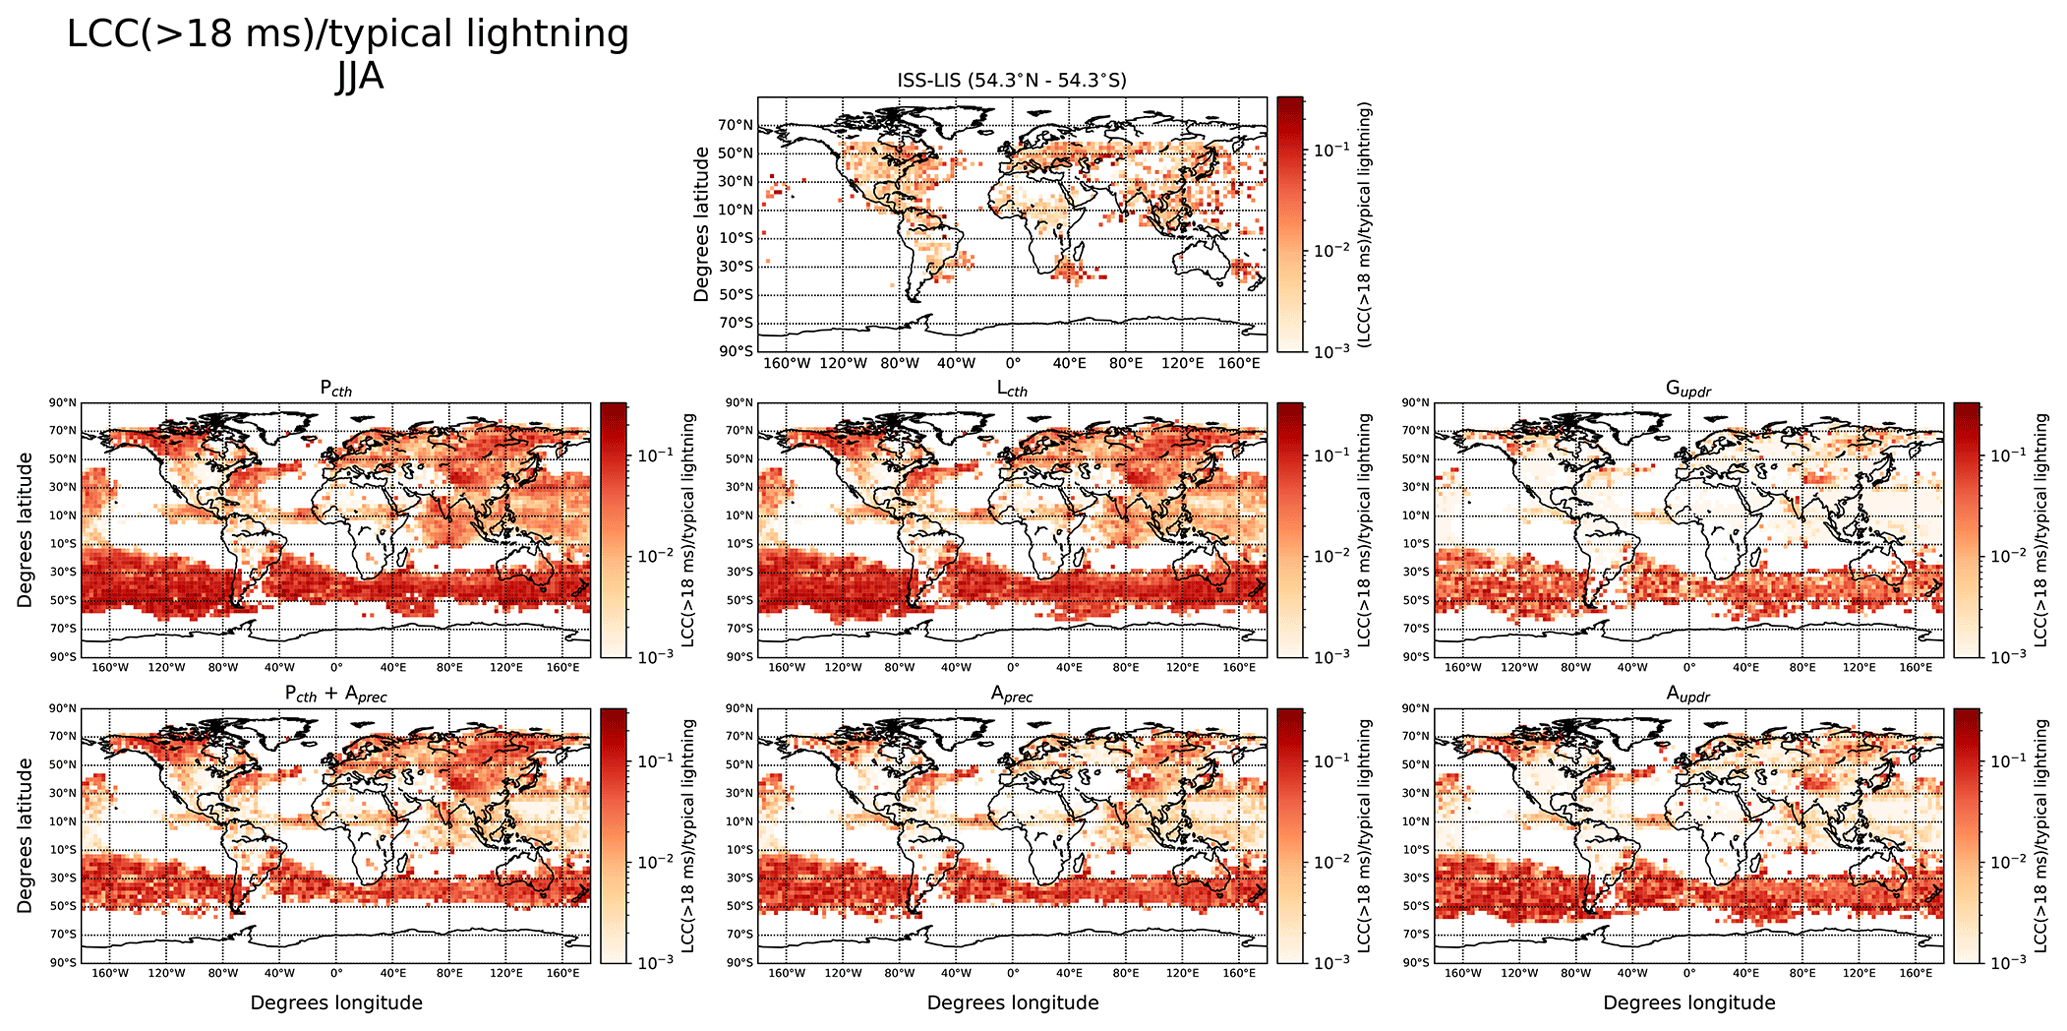
Figure 8 Seasonal observed (left panels) and simulated (right panels) ratio of LCC(> 18 ms) lightning to total lightning using the Pcth+Aprec lightning parameterization. The maximum value of the color bar is 0.33.
Figure 4 shows that the lightning parameterization can significantly influence the simulated spatial and seasonal distribution of lightning flashes. Therefore, we expect that the choice of lightning parameterization affects the simulated LCC lightning flash climatology.
4.3 LCC lightning flash frequency
Figures 5 and 6 show the simulated annual average LCC(> 9 ms) and LCC(> 18 ms) lightning flash density using different lightning parameterizations, while columns 2, 3, and 4 in Table 2 indicate the contrast between land and ocean for LCC(> 9 ms), LCC(> 18 ms), and total lightning flashes. The observed land–ocean ratio is 3:1 for total lightning, while it is 2:1 for LCC(> 9 ms) and LCC(> 18 ms) lightning, indicating that the ratio is shifted towards ocean in the case of LCC lightning. In the case of the Pcth and Lcth lightning parameterizations, the spatial distributions of LCC(> 9 ms) lightning flash densities are nearly similar to the corresponding spatial distributions of lightning flash density. However, the land–ocean contrast is slightly shifted towards ocean in the case of LCC(> 18 ms) lightning flash density with respect to lightning density (from 5:1 to 10:3). In the case of Gupdr, the land–ocean contrast is significantly shifted towards land for LCC(> 9 ms) lightning (from 1:1 to 7:3) and shifted towards ocean for LCC(> 18 ms) lightning (from 1:1 to 2:8) with respect to lightning density. The global distribution of LCC(> 18 ms) lightning density is substantially different to the spatial distributions of typical and LCC(> 9 ms) lightning densities, with maximum LCC(> 18 ms) lightning activity at higher latitudes (north and south) and in southern Asia. The land–ocean contrast is 1:1 for LCC(> 9 ms), LCC(> 18 ms), and total lightning flash densities when using the Pcth+Aprec lightning parameterization. The Aprec parameterization produces a land–ocean contrast shifted towards ocean for LCC(> 9 ms) and LCC(> 18 ms) lightning densities with respect to the land–ocean contrast of lightning flash density. In the case of Aupdr, we obtain a significant shift to ocean in the land–ocean contrast for LCC(> 9 ms) and LCC(> 18 ms) lightning with respect to total lightning (from 4:1 to 2:3 and to 1:9, respectively).
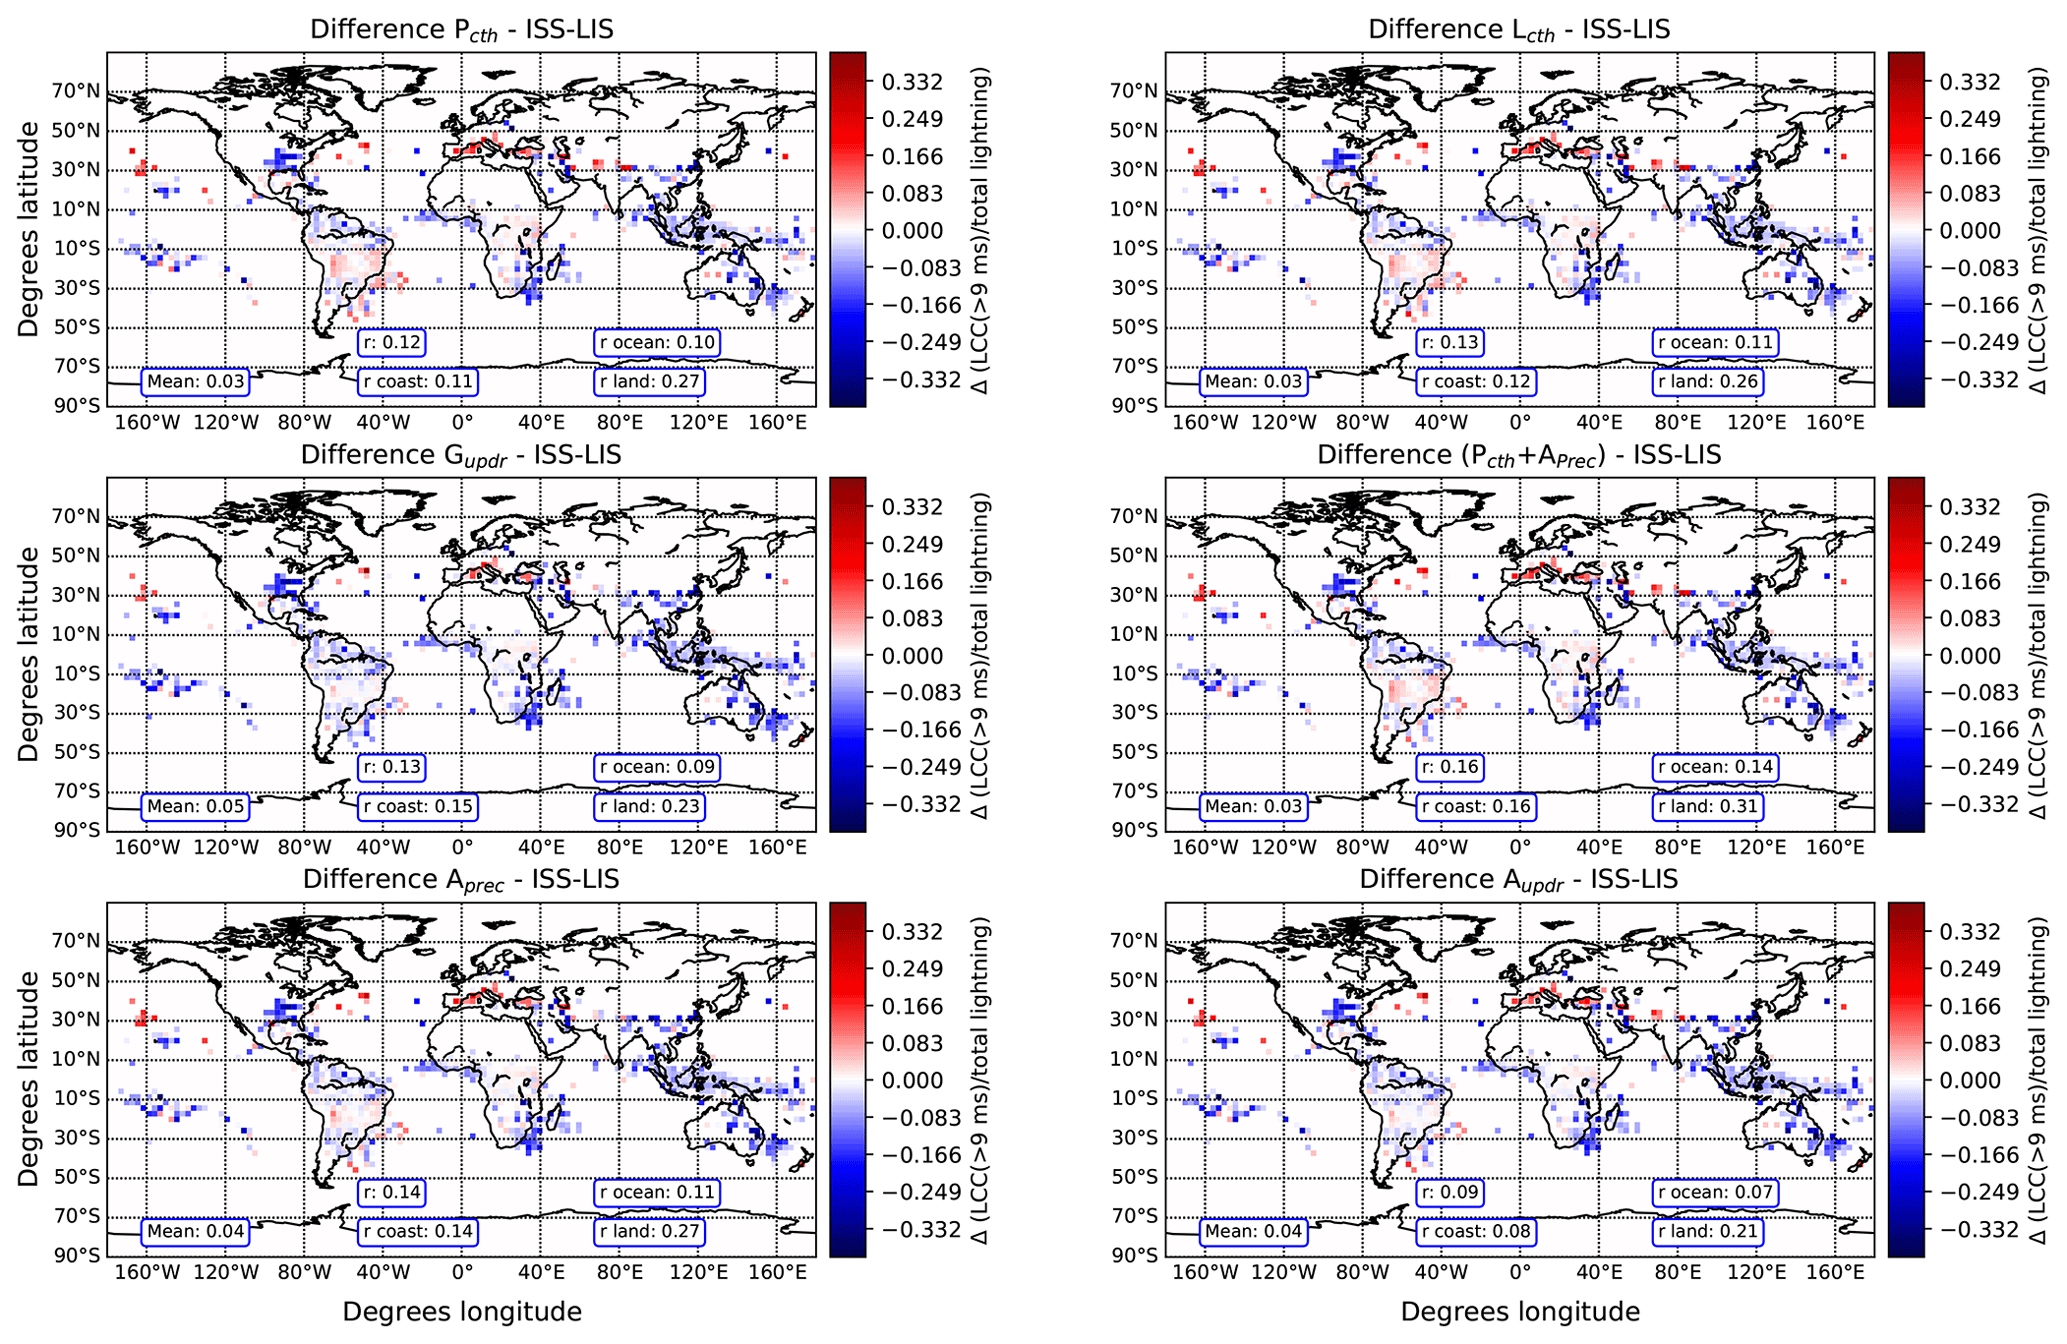
Figure 9 Difference between the observed and simulated ratio of LCC(> 9 ms) lightning to total lightning density in December, January, and February using different lightning parameterizations. Positive values indicate that the model overestimates the ratio. The calculated global, land, and ocean spatial correlation coefficients r are included.
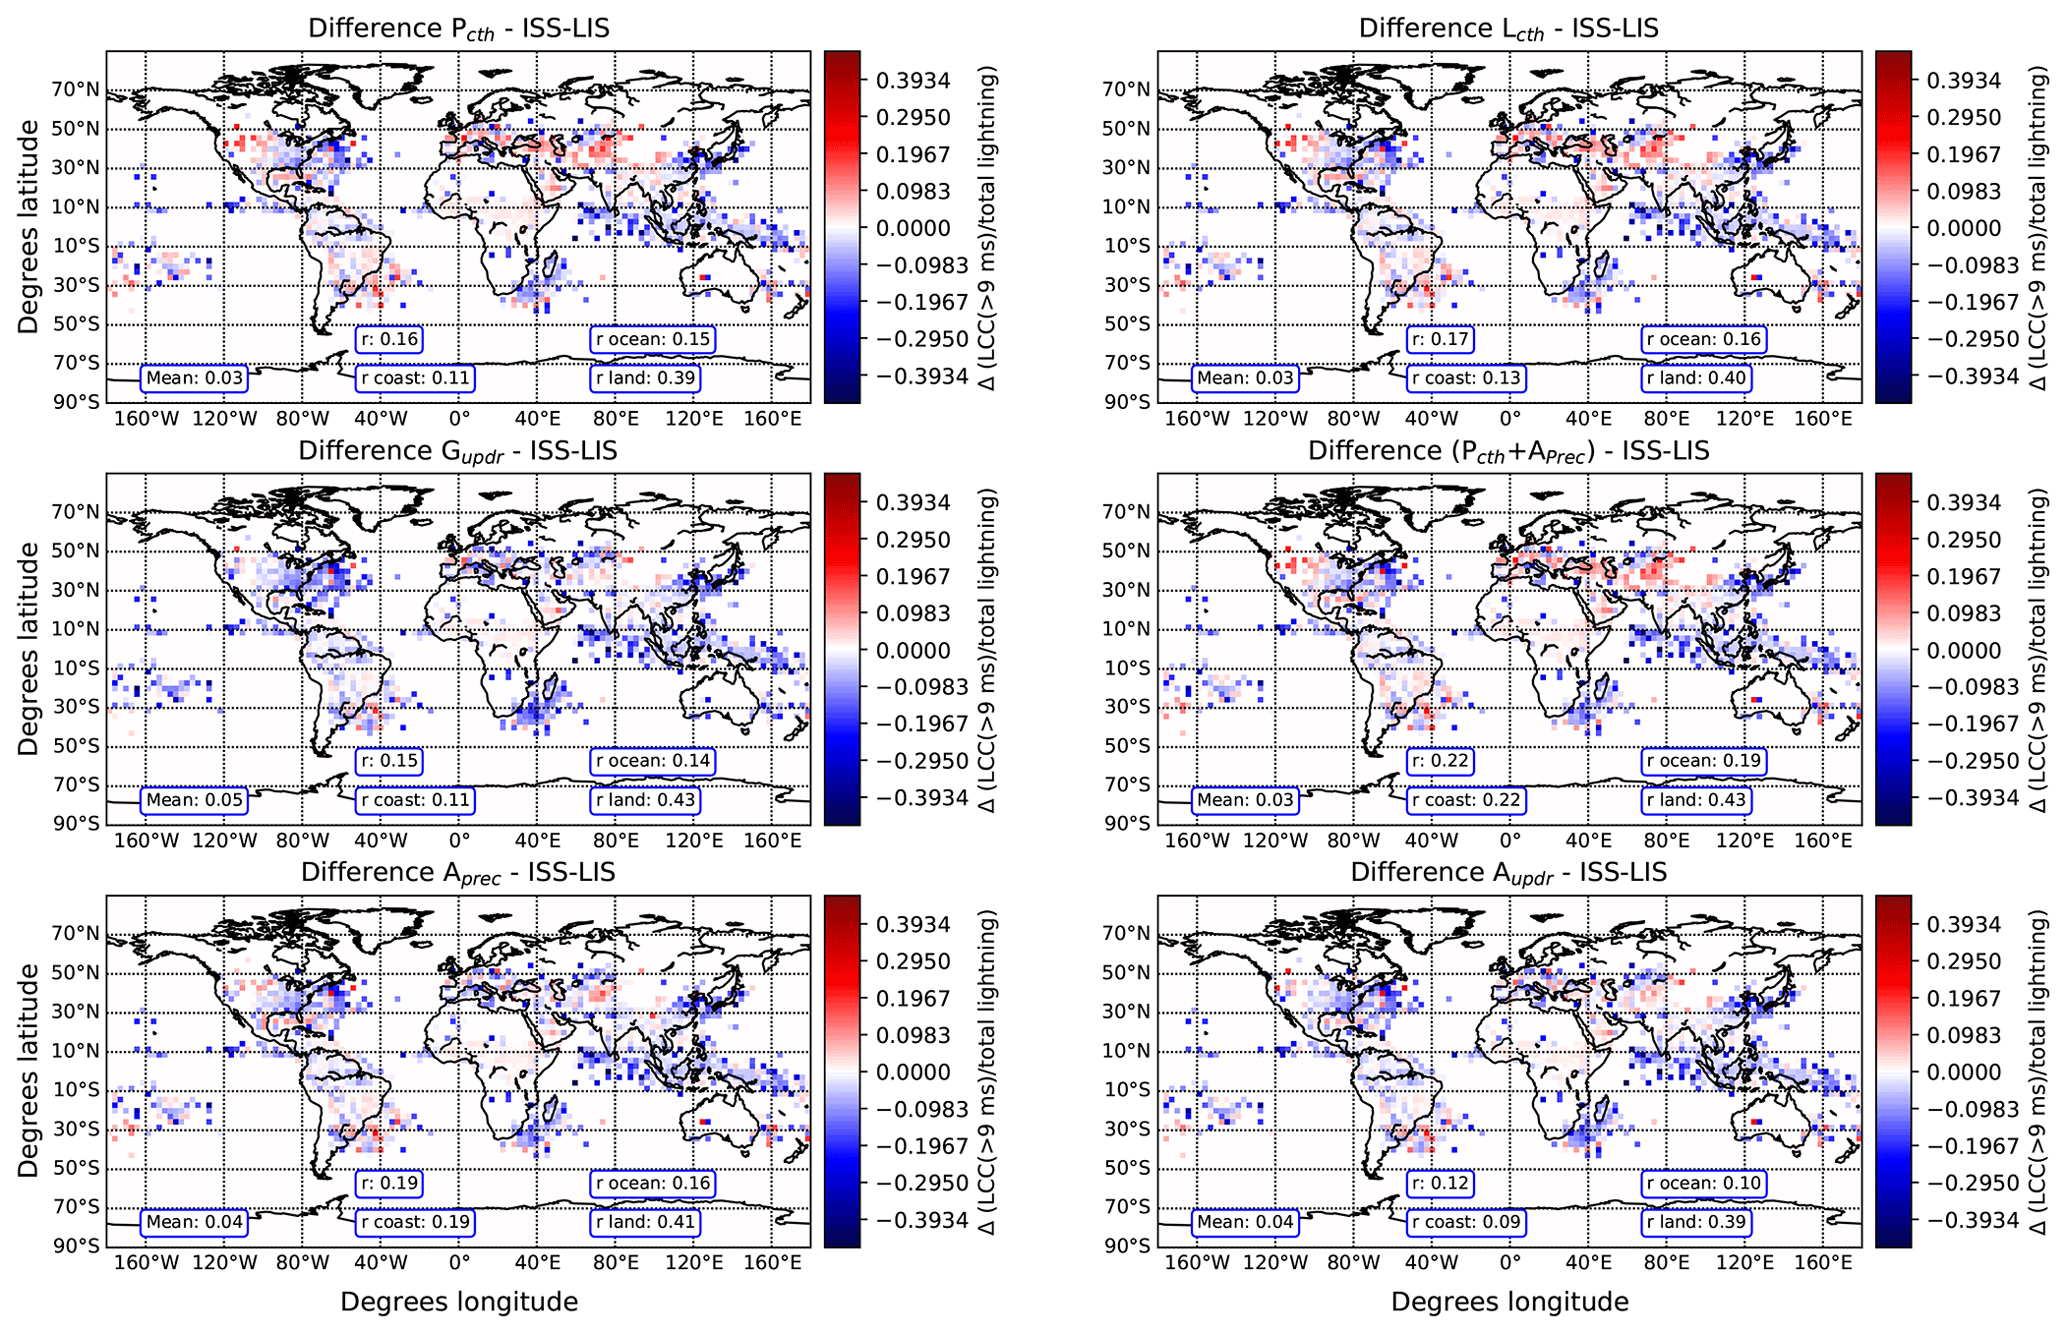
Figure 10 Difference between the observed and simulated ratio of LCC(> 9 ms) lightning to total lightning density i March, April, and May using different lightning parameterizations. Positive values indicate that the model overestimates the ratio. The calculated global, land, and ocean spatial correlation coefficients r are included.

Figure 11 Difference between the observed and simulated ratio of LCC(> 9 ms) lightning to total lightning density in June, July, and August using different lightning parameterizations. Positive values indicate that the model overestimates the ratio. The calculated global, land, and ocean spatial correlation coefficients r are included.
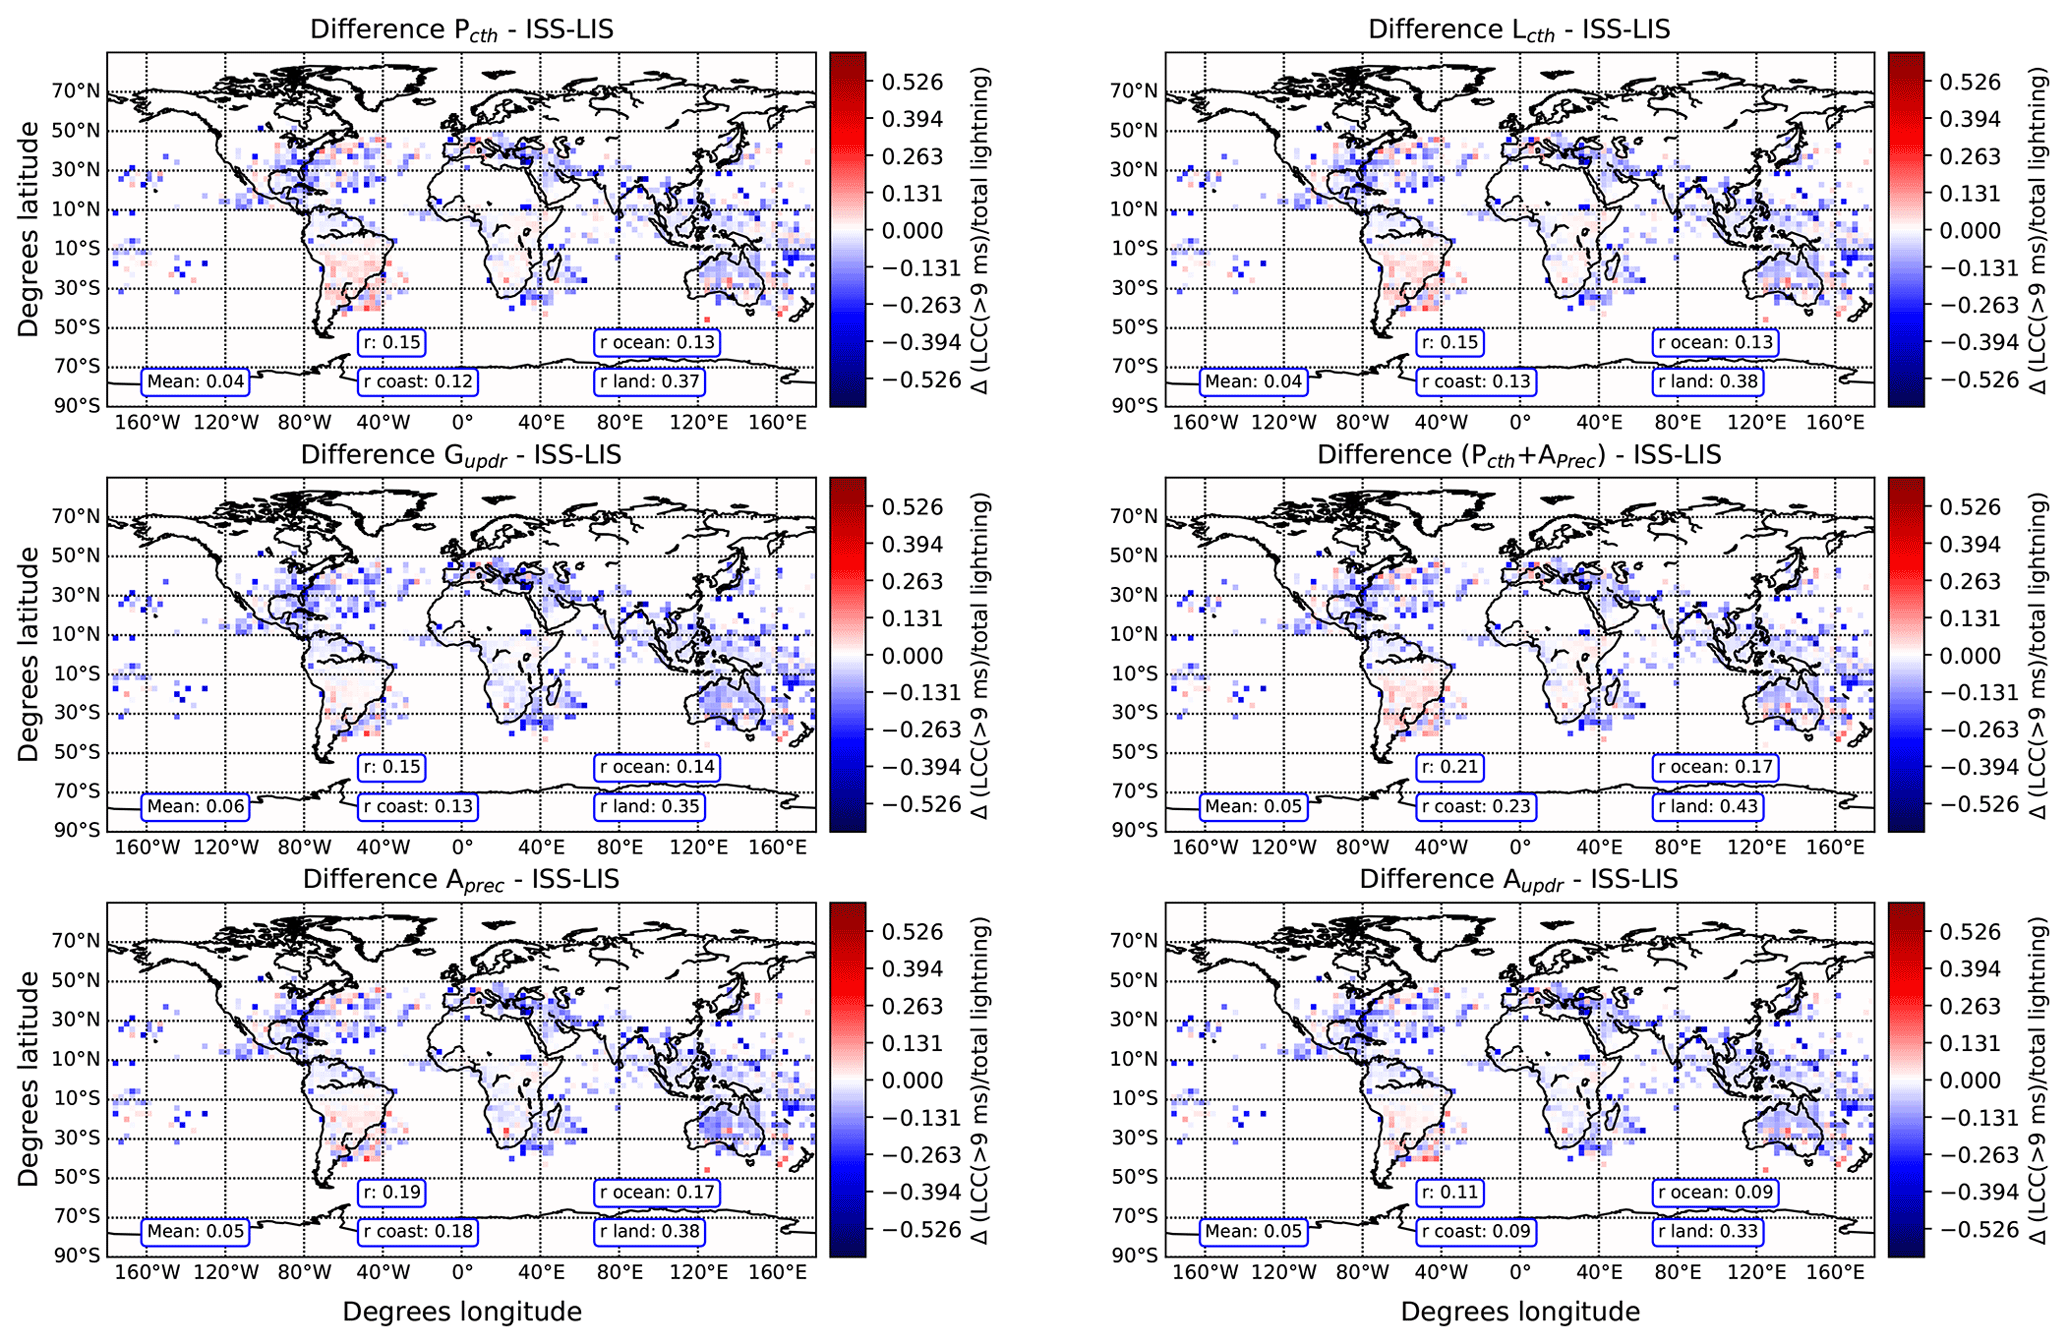
Figure 12 Difference between the observed and simulated ratio of LCC(> 9 ms) lightning to total lightning density in September, October, and November using different lightning parameterizations. Positive values indicate that the model overestimates the ratio. The calculated global, land, and ocean spatial correlation coefficients r are included.
Next, we compare the simulated and observed ratios of LCC(> 9 ms) and LCC(> 18 ms) lightning to total lightning. As detailed in Sect. 4.2, the ratio of LCC(> 9 ms) lightning to all lightning flashes at a global scale reported by ISS LIS is about 6.6 × 10⁻², while the ratio of LCC(> 18 ms) lightning to all lightning flashes at a global scale is about 8 × 10⁻³. The last two columns in Table 2 show the simulated globally averaged ratios of LCC(> 9 ms) and LCC(> 18 ms) lightning to total lightning using different lightning parameterizations. The best agreement between the observed and simulated ratios is obtained within lightning parameterizations based on the CTH, such as Pcth, Lcth, and Pcth+Aprec.
The seasonal observed and simulated ratios of LCC(> 9 ms) lightning and LCC(> 18 ms) lightning to total lightning are shown in Figs. 7 and 8, respectively. Lightning data have been gridded at 2.8∘ × 2.8∘ in latitude and longitude, while differences between the seasonal observed and simulated ratios of LCC(> 9 ms) lightning to total lightning are shown in Figs. 9–12. We include in Figs. 9–12 the globally averaged difference and the spatial correlation coefficients between observations and simulations (r). In general, all the investigated lightning parameterizations produce a fairly good estimation of the ratio of LCC(> 9 ms) lightning to total lightning in central Africa, where the observed ratio reaches its minimum and non-negligible value. However, they tend to underestimate the ratio over the oceans (see Figs. 9–12), where the observed ratio reaches its maximum values. Finally, all the parameterizations tend to overestimate the ratio over South America, especially over the eastern coast. Disagreement between the observed and modeled ratio of LCC(> 9 ms) lightning to total lightning on the eastern coast of South America can be due to the South Atlantic Anomaly (SAA). As reported by Buechler et al. (2014), high noise rates are frequent in LIS observations over the SAA. The noise can cause LIS to miss the tail of the optical signal emitted by LCC lightning.
Due to the lack of observations, comparison between simulated and observed spatial distributions of the ratio of LCC(> 18 ms) lightning to total lightning is not so straightforward as in the case of LCC(> 9 ms) lightning. However, Fig. 8 indicates that simulated and observed spatial distributions of the ratio of LCC(> 18 ms) lightning to total lightning are nearly in agreement. The simulation tends to underestimate the ratio of LCC(> 18 ms) lightning to total lightning over South America, the eastern coast of North America, central Africa, and southeastern Asia.
The upper panel of Fig. 13 shows the seasonal evolution of the spatial correlation coefficient between observations and simulations for land and ocean. The correlation coefficient over land ranges between 0.2 and 0.5, without showing significant differences between each of the lightning parameterizations used. The correlation coefficient over ocean oscillates between 0.1 and 0.2. The lightning parameterization that produces the highest correlation coefficient is Pcth+Aprec, while the one producing the lowest correlation coefficient is Aupdr. The highest correlation over land is reached during June, July, and August, in coincidence with the maximum lightning activity over the Northern Hemisphere. The better agreement during the season with the largest lightning activity can be due to the higher influence of this season on the data that we have used to develop the parameterization. On the contrary, lightning activity over the ocean (Blakeslee et al., 2014) and the correlation coefficient remain almost constant for all the seasons.
We show in the lower panel of Fig. 13 the global (land and ocean) correlation coefficient between the observed and simulated ratio of LCC(> 9 ms) lightning to total lightning (vertical axis) versus the deviation between the observed and simulated ratio (horizontal axis). Each point corresponds to a season and a lightning parameterization. The best globally averaged agreement between observations and simulations is produced by the Pcth+Aprec and Aprec lightning parameterizations, while the worst globally averaged agreement is produced by the Aupdr lightning parameterization. The Lcth lightning parameterization produces better agreement with observations than Pcth. Finally, both Lcth and Pcth produce a better estimate of the globally averaged ratio of LCC(> 9 ms) lightning to total lightning than Gupdr.
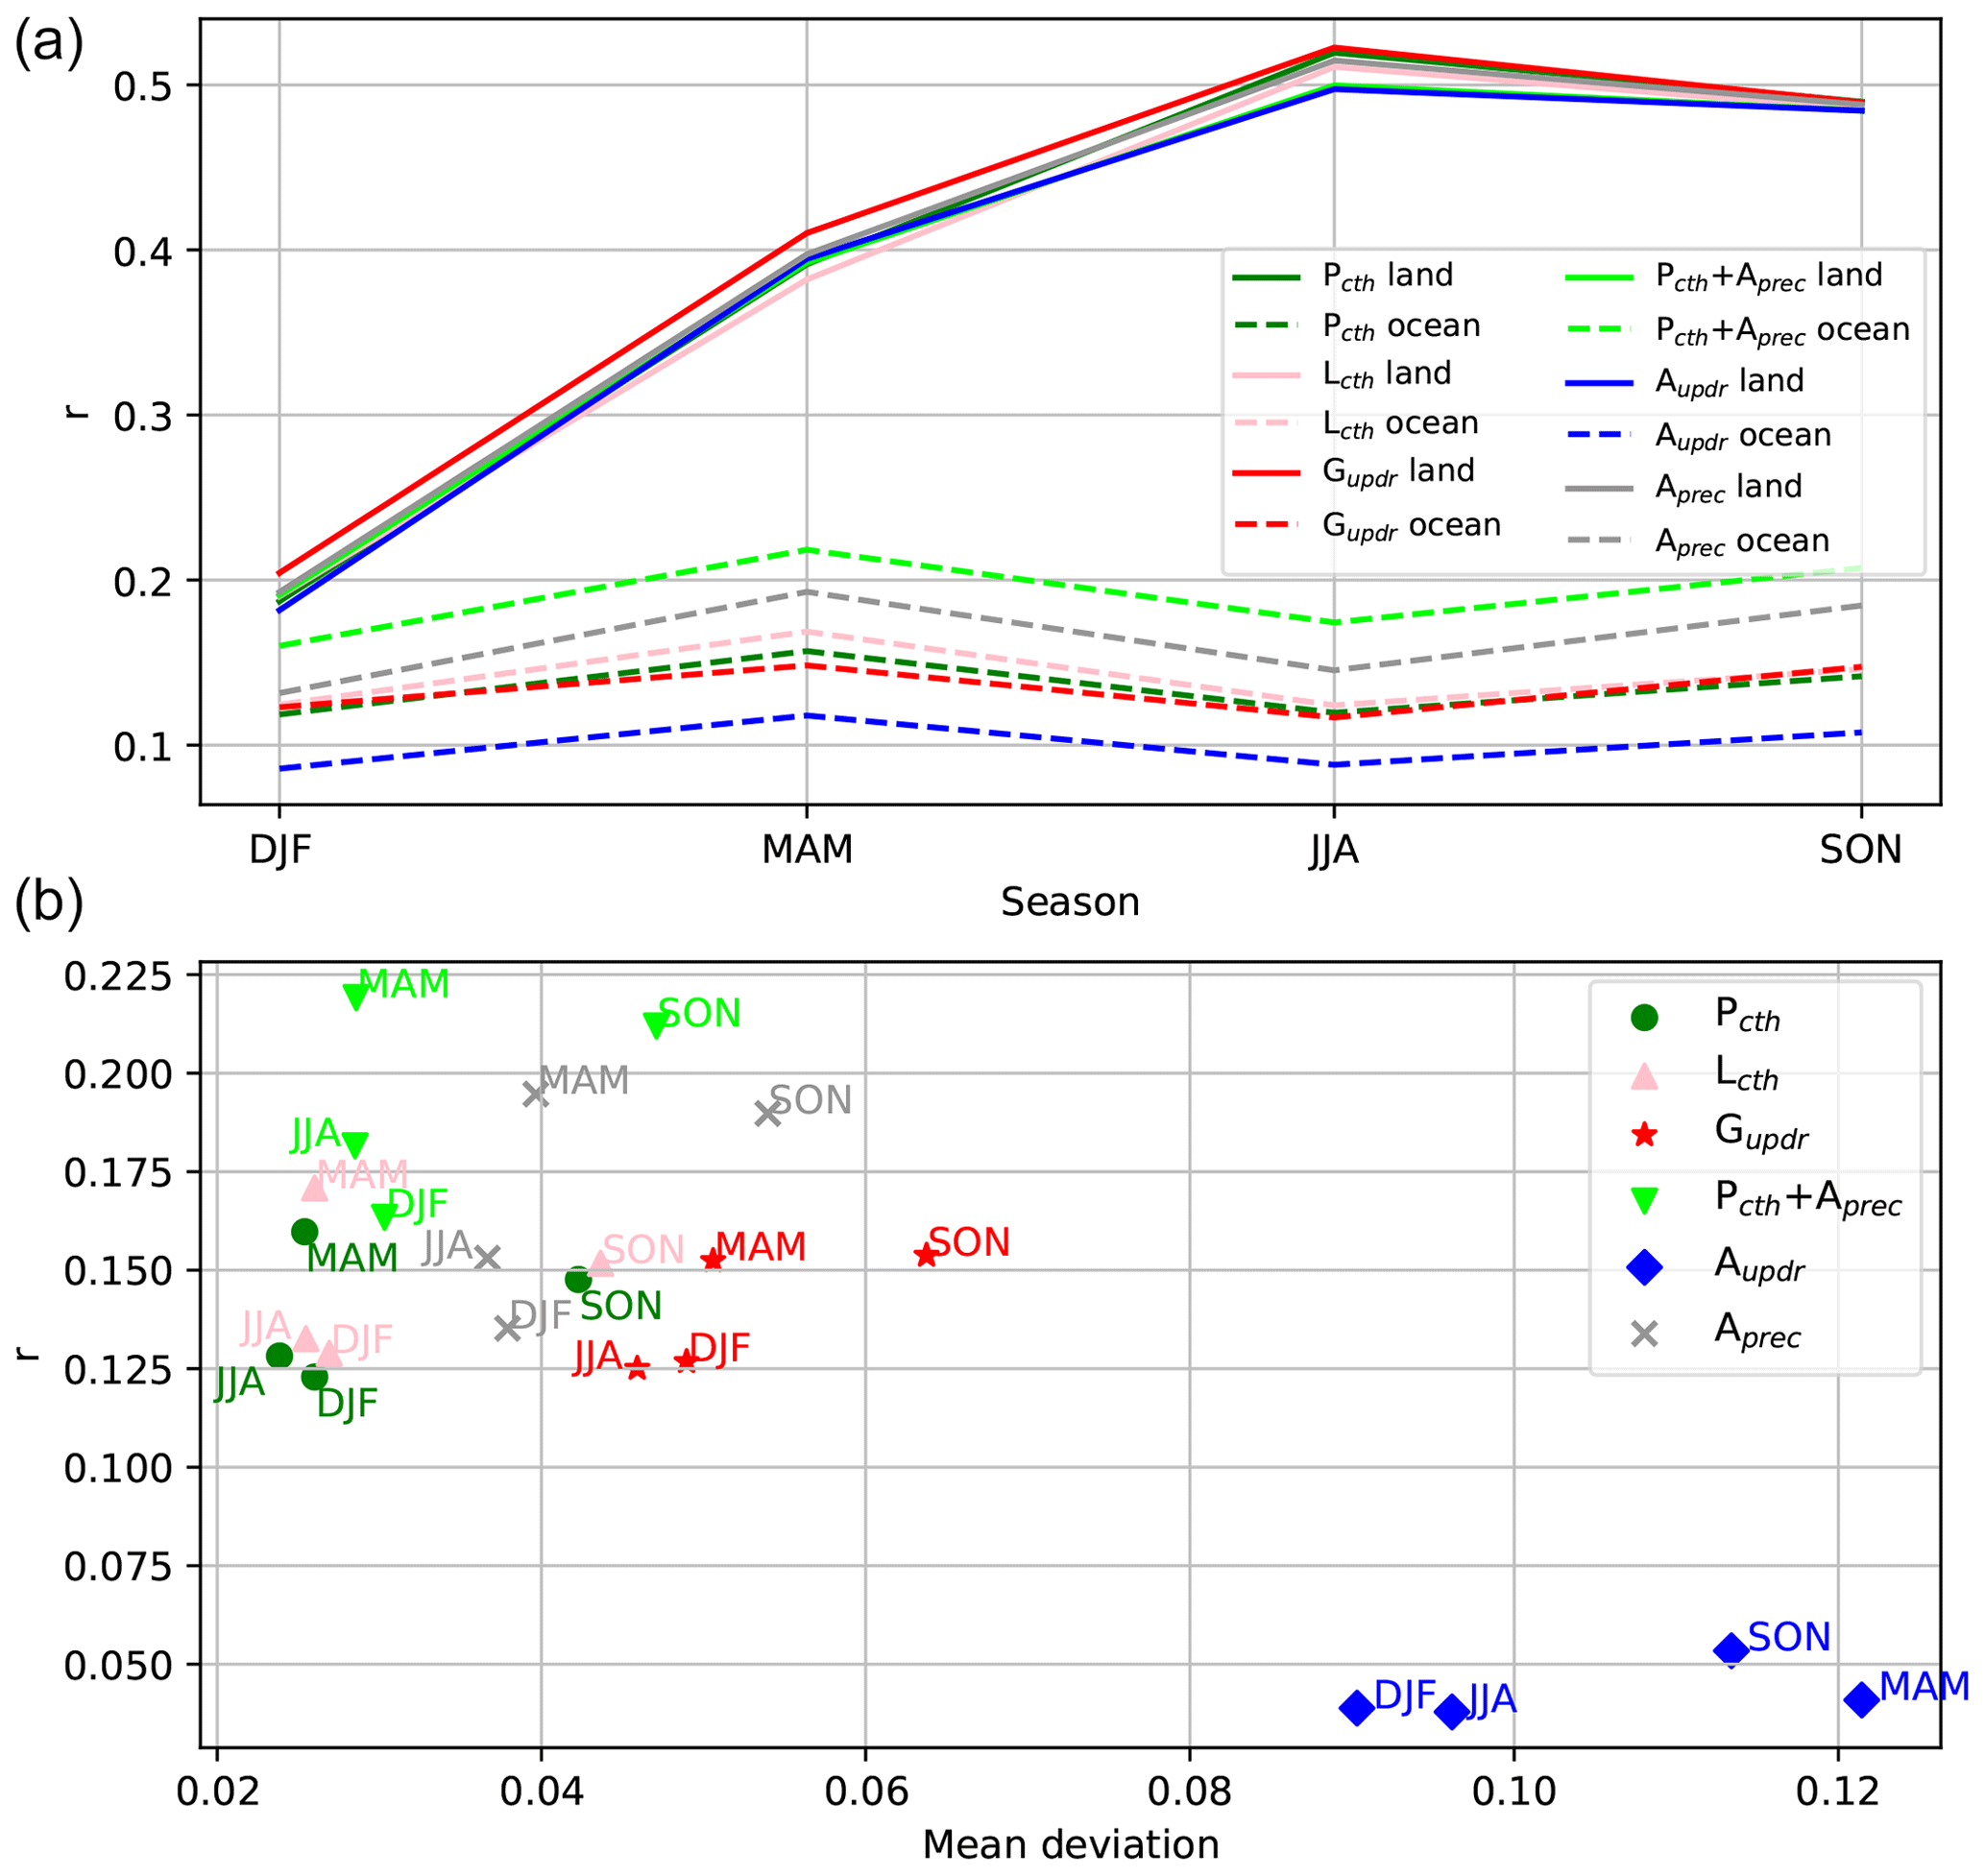
Figure 13 Seasonal evolution of the spatial correlation coefficient (r) between the observed and simulated ratio of LCC(> 9 ms) lightning to total lightning for land and ocean (a) as well as the seasonal global correlation coefficient versus the deviation averaged over all the grid cells between the observed and simulated ratio of LCC(> 9 ms) lightning to total lightning (b). Each point represents a different season.
In this section, we analyze the spatial and seasonal distributions of the ratio of LCC(> 9 ms) and LCC(> 18 ms) lightning to total lightning by comparing with observations.
5.1 Spatial distribution of LCC lightning
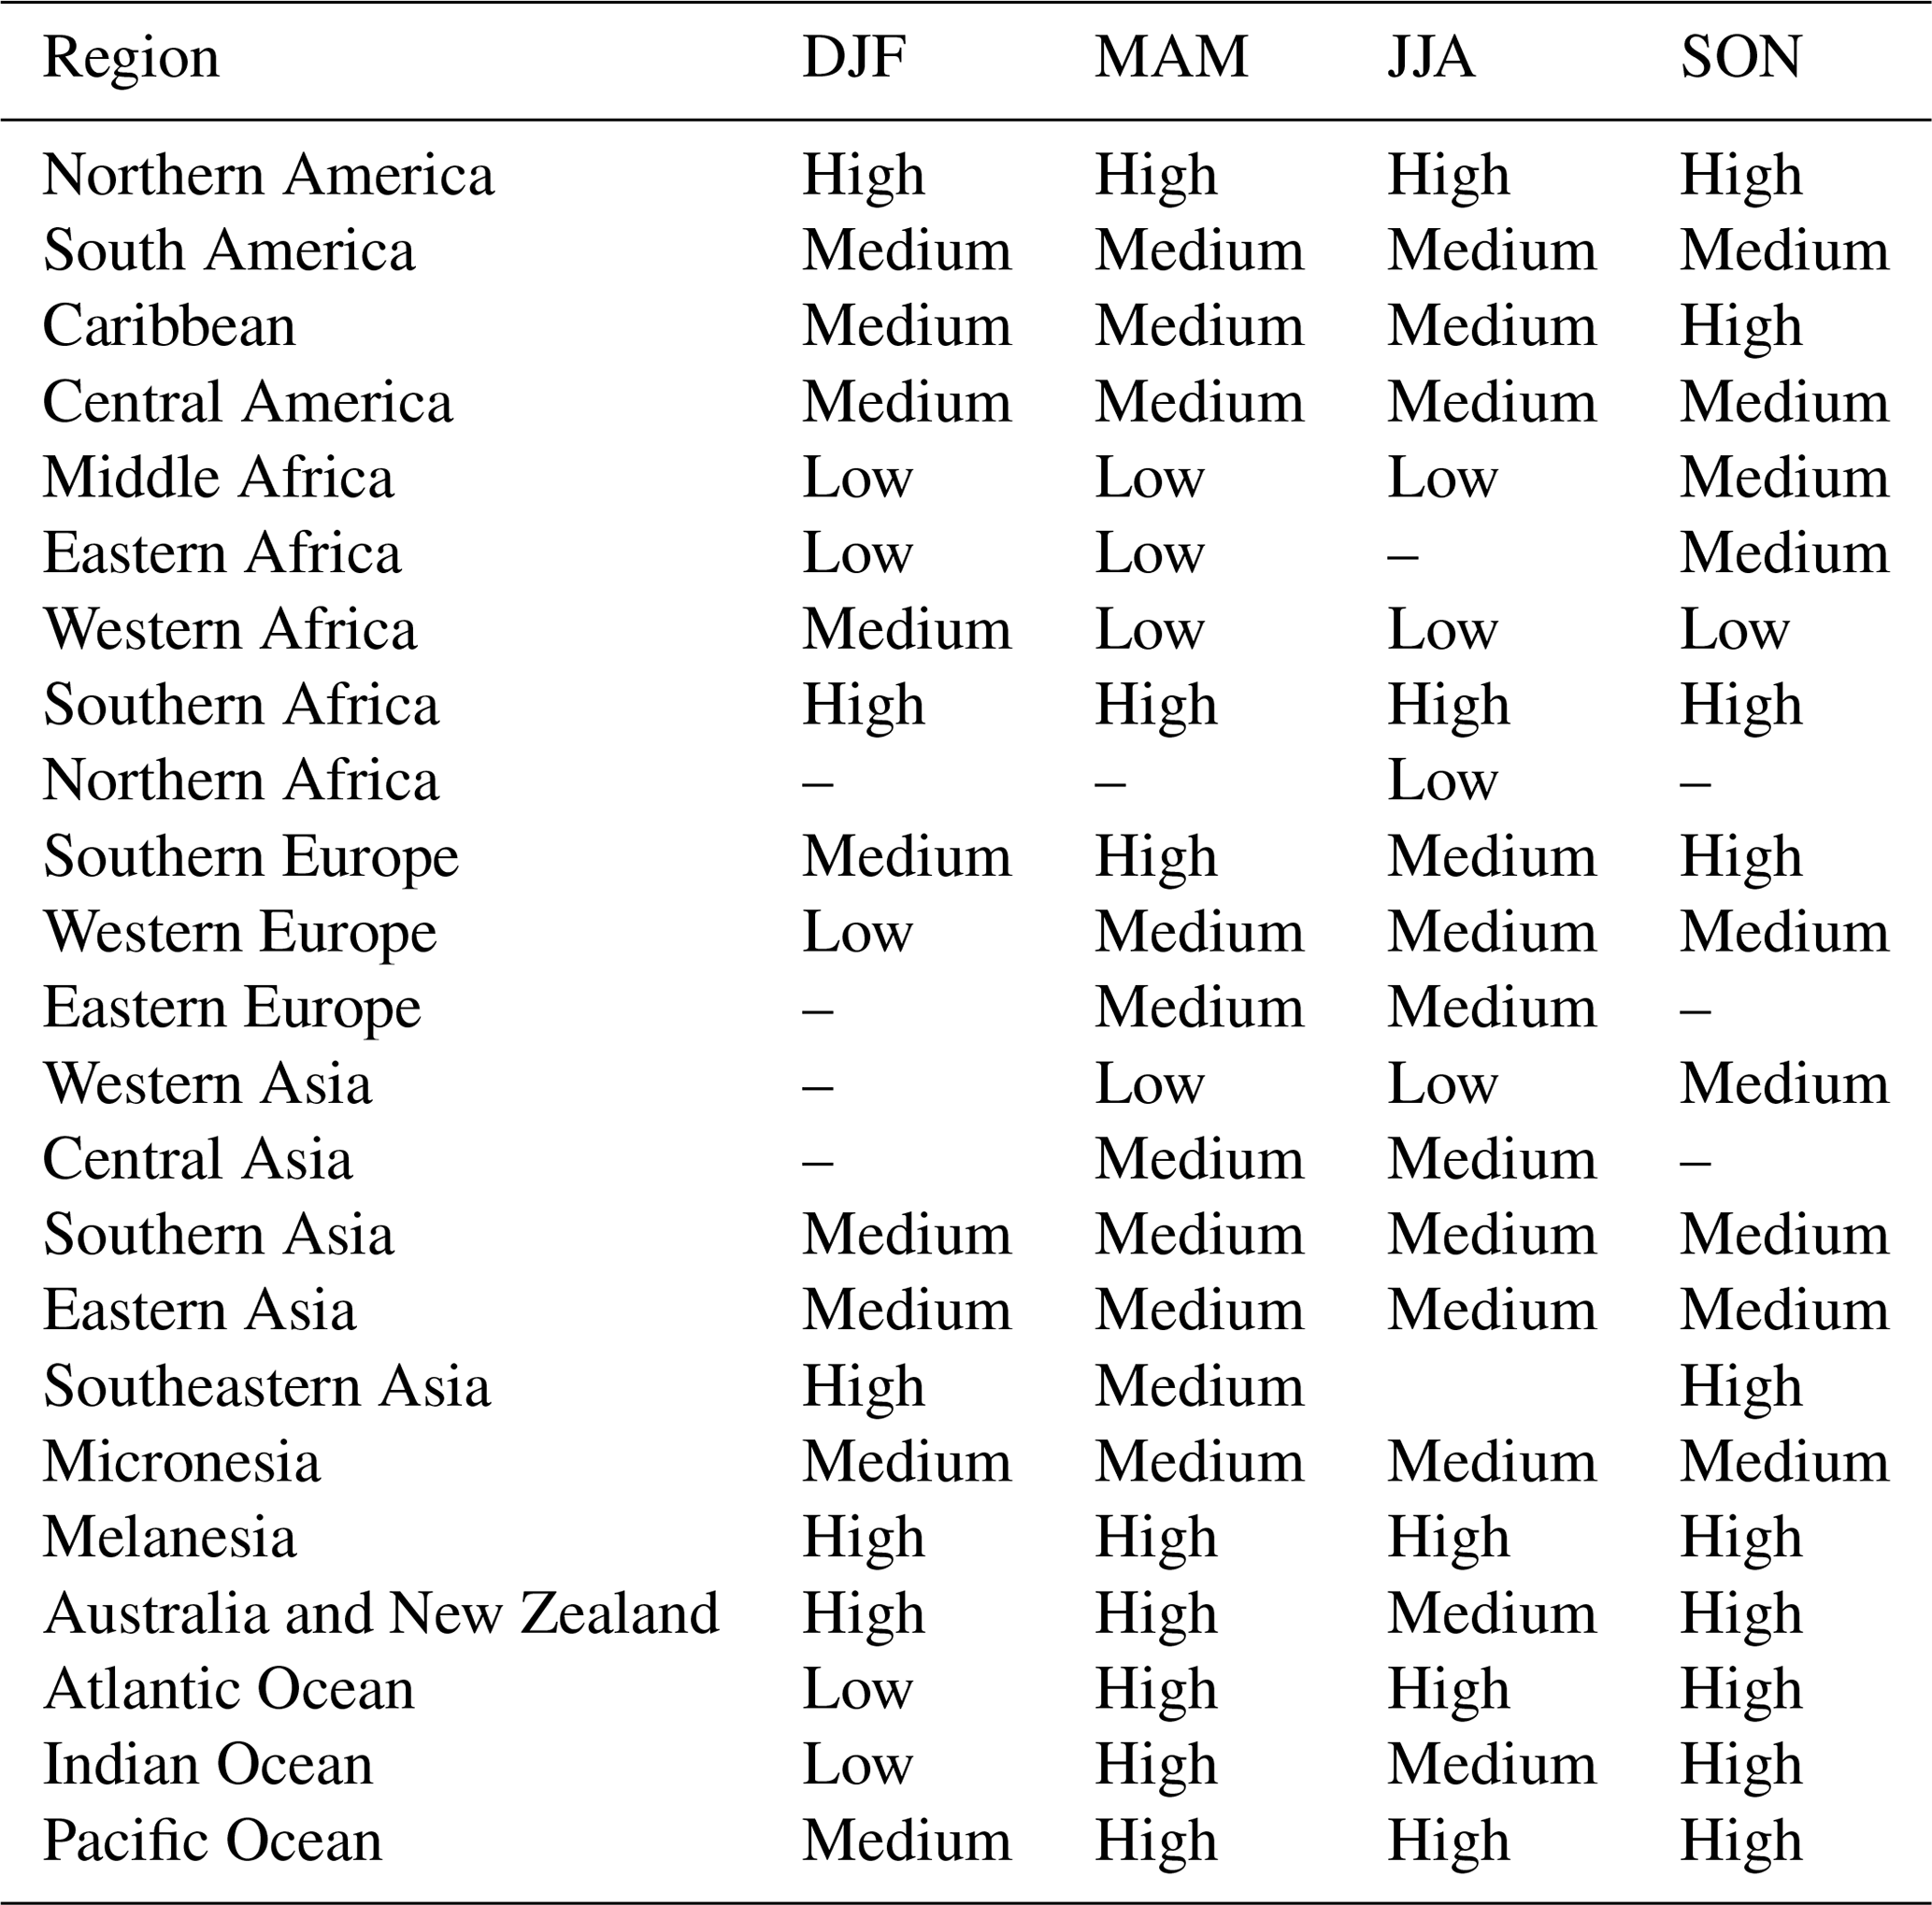
We indicate in Table 3 the relative value of the observed ratio of LCC(> 9 ms) to total lightning by region and season. The ratio of LCC(> 9 ms) lightning to total lightning is high in regions downwind of the continents, which are known to be the preferred regions where cyclones evolve (Eckhardt et al., 2004). In the so-called warm conveyor belt of the cyclones, a broad band of air masses rapidly ascends from lower levels to higher levels, causing instability and the development of deep convection. Deep convection developing in warm conveyor belts is generally weaker than in pre-frontal convective systems (Eckhardt et al., 2004), supporting the development of LCC lightning. The LCC lightning parameterization developed here reproduces the observed ratio of LCC(> 9 ms) to total lightning well in regions for intercontinental transport of trace gases with a high occurrence of warm conveyor belts.
Table 3Indication of the observed ratio of LCC(> 9 ms) to total lightning by region and season. High, medium, and low values correspond to values greater than 10−1, between 3×10⁻² and 10−1, and lower than 3×10⁻², respectively. The – symbol represents no data.
However, the oceanic region influenced by the outflow from western Africa to South America is not commonly influenced by warm conveyor belts. Intercontinental transport of aerosols and trace gases is commonly observed in this region (Ansmann et al., 2009). The parameterization of LCC lightning developed in this study significantly underestimates the ratio of LCC(> 9 ms) lightning to total lightning in the outflow from western Africa (see Fig. 9). This indicates that the aerosols in regions for intercontinental transport of trace gases can play a role in the occurrence of LCC lightning. This is not surprising, as it is known that aerosols participate in the electrification of thunderstorms (Tao et al., 2012; Pérez-Invernón et al., 2021a; Liu et al., 2021, and references therein). Despite this observation, we are not able to propose a possible mechanism to explain the relationship between LCC lightning and aerosols. More observations and microphysical modeling efforts are needed to understand the possible relationship between aerosols and LCC lightning.
All lightning parameterizations overestimate LCC(> 18 ms) lightning over ocean. However, the low lightning activity over ocean in conjunction with the low global ratio of LCC(> 18 ms) lightning to total lightning entails very few observations of LCC(> 18 ms) lightning over ocean, making it difficult to compare the simulated and observed spatial distributions over ocean. We have performed a simulation for the years 2009, 2010, and 2011 to compare the ratio of LCC(> 18 ms) lightning to total lightning using the Pcth+Aprec lightning parameterization. We have found global annual ratios of LCC(> 18 ms) lightning to total lightning of 6.57 × 10⁻³, 6.96 × 10⁻³, and 6.58 × 10⁻³ for 2009, 2010, and 2011, respectively. In addition, we have found the same seasonality as described in Table 3. Therefore, we conclude that there are not large differences in other years.
5.2 Seasonality of LCC lightning
The simulations suggest seasonality in the ratio of LCC(> 9 ms) lightning to total lightning over the large oceans (Atlantic, Indian, and Pacific oceans). Figure 7 shows that the highest oceanic ratios of LCC(> 9 ms) lightning to total lightning are reached in winter thunderstorms, characterized by weak updrafts, while intermediate values of the ratio are reached during MAM and SON seasons. This seasonality is partially in agreement with observations. The observed spatial distributions of the ratio of LCC(> 9 ms) lightning to total lightning over the oceans are in agreement with simulations in MAM and SON, when the updraft reaches intermediate values. However, there is not good agreement between the simulations and observations over the ocean in DJF and JJA, when the updraft has more extreme (low and high) values. The disagreement between simulations and observations in oceanic thunderstorms during winter can be due to sampling limitations, as the total number of flashes produced in those thunderstorms is low. The areas with a high simulated ratio of LCC(> 9 ms and > 18 ms) lightning to typical lightning shown in Figs. 7 and 8 coincide with regions with a high density of winter lightning reported by Montanyà et al. (2016). This agreement suggests a relationship between LCC lightning and winter lightning.
We have developed for the first time two parameterizations that use the updraft strength at the 450 hPa pressure level as a proxy for the ratio of LCC(> 9 ms) and LCC(> 18 ms) lightning to total lightning. This parameterization can be useful to introduce the occurrence of sprites into atmospheric models and to parameterize the occurrence of lightning-ignited wildfires. We have implemented these parameterizations as an upgrade of the LNOX submodel of the Modular Earth Submodel System (from v2.54 onwards) and made it available for the community MESSy concept. We have run a 1-year simulation with EMAC using different lightning parameterizations to calculate the total lightning. The obtained global ratio of LCC(> 9 ms) and LCC(> 18 ms) lightning to total lightning using a set of six lightning parameterizations is in agreement with the ratio reported by ISS LIS. However, the simulated spatial distribution of the ratios strongly depends on the choice of the lightning parameterization. We found that the best agreement between the observed and simulated spatial distributions of the ratios on a seasonal basis is achieved when using a novel combined lightning parameterization based on the cloud-top height (Pcth) over land and on the convective precipitation (Aprec) over ocean. The novel LCC lightning parameterization is also competitive when using the cloud-top height schemes. The simulated LCC(> 9 ms) and LCC(> 18 ms) lightning distributions differ from the spatial distribution of total lightning. In general, the distribution of LCC(> 9 ms) and LCC(> 18 ms) lightning is more shifted toward oceans, while some regional differences are obtained.
The lower lightning frequency over ocean than over land entails a significantly lower total number of observations of LCC(> 18 ms)-producing thunderstorms over ocean. Since LCC(> 18 ms) lightning flashes are rare, the climatology of LCC(> 18 ms) lightning provided by ISS LIS over the oceans is imprecise and rough. Therefore, a correct comparison of the simulated and observed climatology of LCC(> 18 ms) lightning is not realistic, while for LCC(> 9 ms) lightning we have enough data to receive realistic results. The total numbers of LCC(> 9 ms) and LCC(> 18 ms) flashes observed during 1 year are 2.3 ×10⁵ and 2.6 × 10⁴, respectively. Therefore, we estimate that 10 years of data are necessary to obtain robust conclusions for LCC(> 18 ms) lightning flashes.
Geostationary-based optical instruments devoted to monitoring the occurrence of lightning, such as the Geostationary Lightning Mapper (GLM) aboard the Geostationary Operational Environmental Satellite-16 (GOES-16) since 2017 (Goodman et al., 2013), the Lightning Mapping Imager (LMI) aboard the Feng-Yun-4 satellite (FY-4) since 2018 (Yang et al., 2017), and the Meteosat Third Generation (MTG) geostationary satellites of the EUropean organization for the exploitation of METeorological SATellites (EUMETSAT) equipped with a lightning imager (LI) to be launched in 2022 (Stuhlmann et al., 2005), will provide new observations that can complement the global climatology of LCC lightning provided by TRMM LIS and ISS LIS. New data from these instruments will improve the parameterizations of LCC lightning presented here.
Future work on investigating the relationships between lightning-ignited wildfires and LCC lightning can serve to use LCC lightning parameterizations (as the one presented here) as a proxy for lightning-ignited wildfires in forecasting or global atmospheric models. However, more reports about the optical and/or ELF signal emitted by fire-igniting lightning are needed to confirm the role of LCC lightning in the production of lightning-ignited fires.
In addition, simultaneous observations of lightning and sprites by space-based instruments can be helpful to develop a new parameterization of sprites based on LCC lightning parameterizations. A parameterization of sprites in global chemistry–climate models can be employed to investigate the role of sprites in the chemistry of the mesosphere. The Modular Multispectral Imaging Array (MMIA) on board the Atmosphere–Space Interactions Monitor (ASIM) (Neubert et al., 2019; Chanrion et al., 2019) since 2018 is equipped with three photometers that can simultaneously report the occurrence of sprites and the duration of the optical signal emitted by the lightning parent, providing us with new relationships between LCC lightning and sprites.
The Modular Earth Submodel System (MESSy) is continuously developed and applied by a consortium of institutions. The usage of MESSy and access to the source code are licensed to all affiliates of institutions which are members of the MESSy Consortium. Institutions can become a member of the MESSy Consortium by signing the MESSy Memorandum of Understanding. More information can be found on the MESSy Consortium website (http://www.messy-interface.org, last access: 5 October 2021). As the MESSy code is only available under license, the code cannot be made publicly available. The parameterization of LCC lightning has been developed based on MESSy version 2.54 and is included in version 2.55.
All data used in this paper will be directly available after a request is made to authors Francisco J. Pérez-Invernón (franciscojavier.perez-invernon@dlr.de) or Heidi Huntrieser (heidi.huntrieser@dlr.de). The ERA5 meteorological data are freely accessible through the Copernicus Climate Change Service (C3S, 2017), including ERA5, which is the fifth generation of the ECMWF atmospheric reanalyses of the global climate. Also see the Copernicus Climate Change Service Climate DataStore (CDS; https://cds.climate.copernicus.eu/cdsapp, last access: 27 January 2022; https://doi.org/10.24381/cds.bd0915c6, https://doi.org/10.24381/cds.adbb2d47, Hersbach et al., 2018a, b, and https://doi.org/10.24381/cds.e2161bac, Muñoz Sabater, 2021). ISS-LIS lightning data are freely accessible through the NASA Global Hydrology Resource Center (https://ghrc.nsstc.nasa.gov/lightning/data/data_lis_iss.html last access: 27 January 2022, DOI: https://doi.org/10.5067/LIS/ISSLIS/DATA107, Blakeslee, 2021). The data from the simulations presented in this study are freely available under https://doi.org/10.5281/zenodo.5606230 (Pérez-Invernón et al., 2021).
FJPI was responsible for conceptualization, methodology, validation, formal analysis, investigation, data curation, and writing the original draft. HH, PJ, and FJGV were responsible for conceptualization, methodology, validation, formal analysis, supervision, investigation, and writing (review and editing).
The contact author has declared that neither they nor their co-authors have any competing interests.
Publisher's note: Copernicus Publications remains neutral with regard to jurisdictional claims in published maps and institutional affiliations.
The authors would like to thank NASA for providing ISS LIS lightning data and ECMWF for providing the data from ERA5 forecasting models. The EMAC simulations have been performed at the German Climate Computing Centre (DKRZ) through support from the Bundesministerium für Bildung und Forschung (BMBF). DKRZ and its scientific steering committee are gratefully acknowledged for providing the HPC and data archiving resources. The authors would also like to thank Roland Eichinger (Deutsches Zentrum für Luft-und Raumfahrt, DLR) for providing valuable comments on this paper.
Francisco J. Pérez-Invernón acknowledges the sponsorship provided by the Federal Ministry for Education and Research of Germany through the Alexander von Humboldt Foundation. Additionally, this work was supported by the Spanish Ministry of Science and Innovation under project PID2019-109269RB-C43 and the FEDER program. FJGV acknowledges financial support from the State Agency for Research of the Spanish MCIU through the “Center of Excellence Severo Ochoa” award for the Instituto de Astrofísica de Andalucía (SEV-2017-0709).
This research has been supported by the Federal Ministry for Education and Research of Germany through the Alexander von Humboldt Foundation, the Spanish Ministry of Science and Innovation (grant no. PID2019-109269RB-C43 and the FEDER program), and the Spanish MCIU through the “Center of Excellence Severo Ochoa” award for the Instituto de Astrofísica de Andalucía (grant no. SEV-2017-0709).
The article processing charges for this open-access publication were covered by the German Aerospace Center (DLR).
This paper was edited by Andrea Stenke and reviewed by Daiwen Kang and two anonymous referees.
Adachi, T., Cummer, S. A., Li, J., Takahashi, Y., Hsu, R.-R., Su, H.-T., Chen, A. B., Mende, S. B., and Frey, H. U.: Estimating lightning current moment waveforms from satellite optical measurements, Geophys. Res. Lett., 36, L18808, https://doi.org/10.1029/2009GL039911, 2009. a
Allen, D. J. and Pickering, K. E.: Evaluation of lightning flash rate parameterizations for use in a global chemical transport model, J. Geophys. Res. Atmos., 107, 4711, https://doi.org/10.1029/2002JD002066, 2002. a, b, c, d, e, f, g
Ansmann, A., Baars, H., Tesche, M., Müller, D., Althausen, D., Engelmann, R., Pauliquevis, T., and Artaxo, P.: Dust and smoke transport from Africa to South America: Lidar profiling over Cape Verde and the Amazon rainforest, Geophys. Res. Lett., 36, L11802–L11807, https://doi.org/10.1029/2009GL037923, 2009. a
Bell, T. F., Reising, S. C., and Inan, U. S.: Intense continuing currents following positive cloud-to-ground lightning associated with red sprites, Geophys. Res. Lett., 25, 1285, https://doi.org/10.1029/98GL00734, 1998. a, b
Bitzer, P. M.: Global distribution and properties of continuing current in lightning, J. Geophys. Res. Atmos., 122, 1033–1041, 2017. a, b, c, d, e, f, g, h, i, j, k, l
Bitzer, P. M. and Christian, H. J.: Timing uncertainty of the lightning imaging sensor, J. Atmos. Ocean. Tech., 32, 453–460, https://doi.org/10.1175/JTECH-D-13-00177.1, 2015. a
Blakeslee, R. J.: Non-Quality Controlled Lightning ImagingSensor (LIS) on International Space Station (ISS) ScienceData, NASA Global Hydrology Re-source Center DAAC [data set], Huntsville, Alabama, U.S.A., https://doi.org/10.5067/LIS/ISSLIS/DATA110, 2021. a
Blakeslee, R., Lang, T., Koshak, W., Buechler, D., Gatlin, P., Mach, D., Stano, G., Virts, K., Walker, T., Cecil, D., Ellett, W., Goodman, S. J., Harrison, S., Hawkins, D. L., Heumesser, M., Lin, H., Maskey, M., Schultz, C. J., Stewart, M., Bateman, M., Chanrion, O.,and Christian, H.: Three years of the Lightning Imaging Sensor onboard the International Space Station: Expanded Global Coverage and Enhanced Applications, Earth Space Sci. Open Archive, 35812, 83, https://doi.org/10.1029/2020JD032918, 2020. a, b, c, d, e
Blakeslee, R. J., Mach, D. M., Bateman, M. G., and Bailey, J. C.: Seasonal variations in the lightning diurnal cycle and implications for the global electric circuit, Atmos. Res., 135, 228–243, https://doi.org/10.1016/j.atmosres.2012.09.023, 2014. a
Brook, M., Kitagawa, N., and Workman, E.: Quantitative study of strokes and continuing currents in lightning discharges to ground, J. Geophys. Res., 67, 649–659, https://doi.org/10.1029/JZ067i002p00649, 1962. a
Brooks, I., Saunders, C., Mitzeva, R., and Peck, S.: The effect on thunderstorm charging of the rate of rime accretion by graupel, Atmos. Res., 43, 277–295, https://doi.org/10.1016/S0169-8095(96)00043-9, 1997. a
Buechler, D. E., Koshak, W. J., Christian, H. J., and Goodman, S. J.: Assessing the performance of the Lightning Imaging Sensor (LIS) using deep convective clouds, Atmos. Res., 135, 397–403, https://doi.org/10.1016/j.atmosres.2012.09.008, 2014. a
Cecil, D. J., Buechler, D. E., and Blakeslee, R. J.: Gridded lightning climatology from TRMM-LIS and OTD: Dataset description, Atmos. Res., 135, 404–414, https://doi.org/10.1016/j.atmosres.2012.06.028, 2014. a, b, c, d, e, f, g
Chanrion, O., Neubert, T., Rasmussen, I. L., Stoltze, C., Tcherniak, D., Jessen, N. C., Polny, J., Brauer, P., Balling, J. E., Kristensen, S. S., Forchhammer, S., Hofmeyer, P., Davidsen, P., Mikkelsen, O., Hansen, D. B., Bhanderi, D. D. V., Petersen, C. G., and Lorenzen, M.: The Modular Multispectral Imaging Array (MMIA) of the ASIM payload on the International Space Station, Space Sci. Rev., 215, 28, https://doi.org/10.1007/s11214-019-0593-y, 2019. a
Chen, A. B.-C., Chen, H., Chuang, C.-W., Cummer, S. A., Lu, G., Fang, H.-K., Su, H.-T., and Hsu, R.-R.: On negative sprites and the polarity paradox, Geophys. Res. Lett., 46, 9370–9378, https://doi.org/10.1029/2019GL083804, 2019. a
Christian, H. J., Blakeslee, R. J., Boccippio, D. J., Boeck, W. L., Buechler, D. E., Driscoll, K. T., Goodman, S. J., Hall, J. M., Koshak, J. M., Mach, D. M., and Stewart, M. F.: Global frequency and distribution of lightning as observed from space by the Optical Transient Detector, J. Geophys. Res., 108, ACL 4-1–ACL 4-15, https://doi.org/10.1029/2002JD002347, 2003. a, b, c, d, e, f, g
Cummer, S. A.: Current moment in sprite-producing lightning, J. Atmos. Sol.-Terr. Phys, 65, 499–508, https://doi.org/10.1016/S1364-6826(02)00318-8, 2003. a
Cummer, S. A. and Füllekrug, M.: Unusually intense continuing current in lightning produces delayed mesospheric breakdown, Geophys. Res. Lett., 28, 495–498, https://doi.org/10.1029/2000GL012214, 2001. a
De Boor, C. and De Boor, C.: A practical guide to splines, edited by: De Boor, C., vol. 27, Springer-Verlag New York, 1st Edn., ISBN-10: 0387953663, 1978. a
Eckhardt, S., Stohl, A., Wernli, H., James, P., Forster, C., and Spichtinger, N.: A 15-year climatology of warm conveyor belts, J. Climate, 17, 218–237, https://doi.org/10.1175/1520-0442(2004)017<0218:AYCOWC>2.0.CO;2, 2004. a, b, c
ECMWF: European Centre for Medium-range Weather Forecast (ECMWF) (2011). The ERA-Interim reanalysis dataset, Copernicus Climate Change Service (C3S), https://www.ecmwf.int/en/forecasts/datasets/archive-datasets/reanalysis-datasets/era-interim (last access: 27 January 2022), 2011. a
Feng, J., Shen, H., and Liang, D.: Investigation of lightning ignition characteristics based on an impulse current generator, Ecol. Evol., 9, 14234–14243, https://doi.org/10.1002/ece3.5855, 2019. a
Finney, D. L., Doherty, R. M., Wild, O., Huntrieser, H., Pumphrey, H. C., and Blyth, A. M.: Using cloud ice flux to parametrise large-scale lightning, Atmos. Chem. Phys., 14, 12665–12682, https://doi.org/10.5194/acp-14-12665-2014, 2014. a, b
Fuquay, D. M., Baughman, R., Taylor, A., and Hawe, R.: Characteristics of seven lightning discharges that caused forest fires, J. Geophys. Res., 72, 6371–6373, https://doi.org/10.1029/JZ072i024p06371, 1967. a, b, c
Goodman, S. J., Blakeslee, R. J., Koshak, J. M., Mach, D., Bailey, J., Buechler, D., Carey, L., Schultz, C., Bateman, M., McCaul, E., Stanozum, G., Vamborg, F., Villaume, S., and Thépaut, J.-N.: The GOES-R geostationary lightning mapper (GLM), Atmos. Res., 125, 34–49, 2013. a
Gordillo-Vázquez, F. J. and Pérez-Invernón, F. J.: A review of the impact of transient luminous events on the atmospheric chemistry: Past, present, and future, Atmos. Res., 252, 105432, https://doi.org/10.1016/j.atmosres.2020.105432, 2021. a
Gordillo-Vázquez, F. J., Pérez-Invernón, F. J., Huntrieser, H., and Smith, A. K.: Comparison of Six Lightning Parameterizations in CAM5 and the Impact on Global Atmospheric Chemistry, Earth Space Sci., 6, 2317–2346, https://doi.org/10.1029/2019EA000873, 2019. a, b
Grewe, V., Brunner, D., Dameris, M., Grenfell, J., Hein, R., Shindell, D., and Staehelin, J.: Origin and variability of upper tropospheric nitrogen oxides and ozone at northern mid-latitudes, Atmos. Environ., 35, 3421–3433, https://doi.org/10.1016/S1352-2310(01)00134-0, 2001. a, b, c
Hersbach, H., Bell, B., Berrisford, P., Biavati, G., Horányi, A.,Muñoz Sabater, J., Nicolas, J., Peubey, C., Radu, R., Rozum, I.,Schepers, D., Simmons, A., Soci, C., Dee, D., and Thépaut, J.-N.: ERA5 hourly data on pressure levels from 1979 to present, Copernicus Climate Change Service (C3S) Climate Data Store(CDS) [data set], https://doi.org/10.24381/cds.bd0915c6, 2018a. a
Hersbach, H., Bell, B., Berrisford, P., Biavati, G., Horányi, A.,Muñoz Sabater, J., Nicolas, J., Peubey, C., Radu, R., Rozum,I., Schepers, D., Simmons, A., Soci, C., Dee, D., and Thépaut,J.-N.: ERA5 hourly data on single levels from 1979 to present, Copernicus Climate Change Service (C3S) Climate Data Store(CDS) [data set], https://doi.org/10.24381/cds.adbb2d47, 2018b. a
Hersbach, H., Bell, B., Berrisford, P., Hirahara, S., Horányi, A., Muñoz-Sabater, J., Nicolas, J., Peubey, C., Radu, R., Schepers, D., Simmons, A., Soci, C., Abdalla, S., Abellan, X., Balsamo, G., Bechtold, P., Biavati, G., Bidlot, J., Bonavita, M., De Chiara, G., Dahlgren, P., Dee, D., Diamantakis, M., Dragani, R., Flemming, J., Forbes, R., Fuentes, M., Geer, A., Haimberger, L., Healy, S., Hogan, R. J., Hólm, E., Janisková, M., Keeley, S., Laloyaux, P., Lopez, P., Lupu, C., Radnoti, G., de Rosnay, P., Rozum, I., Vamborg, F., Villaume, S., and Thépaut, J.-N.: The ERA5 global reanalysis, Q. J. Roy. Meteor. Soc., 146, 1999–2049, https://doi.org/10.1002/qj.3803, 2020. a
Jöckel, P., Kerkweg, A., Pozzer, A., Sander, R., Tost, H., Riede, H., Baumgaertner, A., Gromov, S., and Kern, B.: Development cycle 2 of the Modular Earth Submodel System (MESSy2), Geosci. Model Dev., 3, 717–752, https://doi.org/10.5194/gmd-3-717-2010, 2010. a, b
Jöckel, P., Tost, H., Pozzer, A., Kunze, M., Kirner, O., Brenninkmeijer, C. A. M., Brinkop, S., Cai, D. S., Dyroff, C., Eckstein, J., Frank, F., Garny, H., Gottschaldt, K.-D., Graf, P., Grewe, V., Kerkweg, A., Kern, B., Matthes, S., Mertens, M., Meul, S., Neumaier, M., Nützel, M., Oberländer-Hayn, S., Ruhnke, R., Runde, T., Sander, R., Scharffe, D., and Zahn, A.: Earth System Chemistry integrated Modelling (ESCiMo) with the Modular Earth Submodel System (MESSy) version 2.51, Geosci. Model Dev., 9, 1153–1200, https://doi.org/10.5194/gmd-9-1153-2016, 2016. a, b
Khain, A. P., Phillips, V., Benmoshe, N., and Pokrovsky, A.: The role of small soluble aerosols in the microphysics of deep maritime clouds, J. Atmos. Sci., 69, 2787–2807, https://doi.org/10.1175/2011JAS3649.1, 2012. a
Korolev, A. V. and Mazin, I. P.: Supersaturation of water vapor in clouds, J. Atmos. Sci., 60, 2957–2974, https://doi.org/10.1175/1520-0469(2003)060<2957:SOWVIC>2.0.CO;2, 2003. a
Latham, D. and Williams, E.: Lightning and forest fires, in: Forest Fires, Elsevier, 375–418, https://doi.org/10.1016/B978-012386660-8/50013-1, 2001. a
Liu, C., Williams, E. R., Zipser, E. J., and Burns, G.: Diurnal variations of global thunderstorms and electrified shower clouds and their contribution to the global electrical circuit, J. Atmos. Sci., 67, 309–323, https://doi.org/10.1175/2009JAS3248.1, 2010. a
Liu, Y., Williams, E., Li, Z., Guha, A., LaPierre, J., Stock, M., Heckman, S., Zhang, Y., and DiGangi, E.: Lightning Enhancement in Moist Convection with Smoke-laden Air Advected from Australian Wildfires, Geophys. Res. Lett., 48, e2020GL092355, https://doi.org/10.1029/2020GL092355, 2021. a
Luhar, A. K., Galbally, I. E., Woodhouse, M. T., and Abraham, N. L.: Assessing and improving cloud-height-based parameterisations of global lightning flash rate, and their impact on lightning-produced NOx and tropospheric composition in a chemistry–climate model, Atmos. Chem. Phys., 21, 7053–7082, https://doi.org/10.5194/acp-21-7053-2021, 2021. a, b, c, d
Mach, D. M., Christian, H. J., Blakeslee, R. J., Boccippio, D. J., Goodman, S. J., and Boeck, W. L.: Performance assessment of the optical transient detector and lightning imaging sensor, J. Geophys. Res.-Atmos., 112, D09210–D09226, https://doi.org/10.1029/2006JD007787, 2007. a
McEachron, K. and Hagenguth, J.: Effect of lightning on thin metal surfaces, IEEE Trans. Commun., 61, 559–564, 1942. a, b
Montanyà, J., Fabró, F., van der Velde, O., March, V., Williams, E. R., Pineda, N., Romero, D., Solà, G., and Freijo, M.: Global distribution of winter lightning: a threat to wind turbines and aircraft, Nat. Hazards Earth Syst. Sci., 16, 1465–1472, https://doi.org/10.5194/nhess-16-1465-2016, 2016. a
Muñoz Sabater, J.: ERA5-Land hourly data from 1950 to 1980, Copernicus Climate Change Service (C3S) Climate Data Store (CDS) [data set], https://doi.org/10.24381/cds.e2161bac, 2021. a
Murray, L. T., Jacob, D. J., Logan, J. A., Hudman, R. C., and Koshak, W. J.: Optimized regional and interannual variability of lightning in a global chemical transport model constrained by LIS/OTD satellite data, J. Geophys. Res.-Atmos., 117, D20307–D20321, https://doi.org/10.1029/2012JD017934, 2012. a
Nag, A., Murphy, M. J., Schulz, W., and Cummins, K. L.: Lightning locating systems: Insights on characteristics and validation techniques, Earth Space Sci., 2, 65–93, https://doi.org/10.1002/2014EA000051, 2015. a
Neubert, T., Østgaard, N., Reglero, V., Blanc, E., Chanrion, O., Oxborrow, C. A., Orr, A., Tacconi, M., Hartnack, O., and Bhanderi, D. D.: The ASIM mission on the International Space Station, Space Sci. Rev., 215, 26, https://doi.org/10.1007/s11214-019-0592-z, 2019. a
Pasko, V. P., Yair, Y., and Kuo, C.-L.: Lightning related transient luminous events at high altitude in the Earth’s atmosphere: Phenomenology, mechanisms and effects, Space Sci. Rev., 168, 475–516, https://doi.org/10.1007/s11214-011-9813-9, 2012. a
Pérez-Invernón, F. J., Gordillo-Vázquez, F. J., Smith, A. K., Arnone, E., and Winkler, H.: Global occurrence and chemical impact of stratospheric Blue Jets modeled with WACCM4, J. Geophys. Res.-Atmos., 124, 2841–2864, https://doi.org/10.1029/2018JD029593, 2019. a
Pérez-Invernón, F. J., Huntrieser, H., Gordillo-Vázquez, F., and Soler, S.: Influence of the COVID-19 lockdown on lightning activity in the Po Valley, Atmos. Res., 263, 105808, https://doi.org/10.1016/j.atmosres.2021.105808, 2021a. a
Pérez-Invernón, F. J., Huntrieser, H., Soler, S., Gordillo-Vázquez, F. J., Pineda, N., Navarro-González, J., Reglero, V., Montanyà, J., van der Velde, O., and Koutsias, N.: Lightning-ignited wildfires and long continuing current lightning in the Mediterranean Basin: preferential meteorological conditions, Atmos. Chem. Phys., 21, 17529–17557, https://doi.org/10.5194/acp-21-17529-2021, 2021v. a, b
Pérez-Invernón, F. J., Huntrieser, H., Jöckel, P., and Gordillo-Vázquez, F. J.: Monthly averaged lightning data extracted from 1-year EMAC simulation including LCC-lightning (between 1 March, 2017 and 28 February, 2018, T42L90MA resolution), Zenodo [data set], https://doi.org/10.5281/zenodo.5606230, 2021. a
Pineda, N., Montanyà, J., and Van der Velde, O. A.: Characteristics of lightning related to wildfire ignitions in Catalonia, Atmos. Res., 135, 380–387, https://doi.org/10.1016/j.atmosres.2012.07.011, 2014. a, b
Price, C. and Rind, D.: A simple lightning parameterization for calculating global lightning distributions, J. Geophys. Res.-Atmos., 97, 9919–9933, https://doi.org/10.1029/92JD00719, 1992. a, b, c, d, e
Rakov, V. A. and Uman, M. A. (Eds.): Lightning Physics and Effects, 1st Edn., Cambridge University Press, Cambridge, ISBN-10: 0521035414 , 2003. a, b
Roeckner, E., Brokopf, R., Esch, M., Giorgetta, M., Hagemann, S., Kornblueh, L., Manzini, E., Schlese, U., and Schulzweida, U.: Sensitivity of simulated climate to horizontal and vertical resolution in the ECHAM5 atmosphere model, J. Climate, 19, 3771–3791, https://doi.org/10.1175/JCLI3824.1, 2006. a
Romps, D. M.: Evaluating the future of lightning in cloud-resolving models, Geophys. Res. Lett., 46, 14863–14871, https://doi.org/10.1029/2019GL085748, 2019. a
Said, R. K., Cohen, M. B., and Inan, U. S.: Highly intense lightning over the oceans: Estimated peak currents from global GLD360 observations, J. Geophys. Res.-Atmos., 118, 6905–6915, https://doi.org/10.1002/jgrd.50508, 2013. a
Showalter, A. K.: A stability index for thunderstorm forecasting, B. Am. Meteorol. Soc., 34, 250–252, 1953. a, b
Stuhlmann, R., Rodriguez, A., Tjemkes, S., Grandell, J., Arriaga, A., Bézy, J.-L., Aminou, D., and Bensi, P.: Plans for EUMETSAT's Third Generation Meteosat geostationary satellite programme, Adv. Space Res, 36, 975–981, https://doi.org/10.1016/j.asr.2005.03.091, 2005. a
Tao, W.-K., Chen, J.-P., Li, Z., Wang, C., and Zhang, C.: Impact of aerosols on convective clouds and precipitation, Rev. Geophys., 50, RG2001, https://doi.org/10.1029/2011RG000369, 2012. a
Tiedtke, M.: A comprehensive mass flux scheme for cumulus parameterization in large-scale models, Mon. Weather Rev., 117, 1779–1800, https://doi.org/10.1175/1520-0493(1989)117<1779:ACMFSF>2.0.CO;2, 1989. a
Tost, H., Jöckel, P., and Lelieveld, J.: Lightning and convection parameterisations – uncertainties in global modelling, Atmos. Chem. Phys., 7, 4553–4568, https://doi.org/10.5194/acp-7-4553-2007, 2007. a, b, c, d, e
Virtanen, P., Gommers, R., Oliphant, T. E., Haberland, M., Reddy, T., Cournapeau, D., Burovski, E., Peterson, P., Weckesser, W., Bright, J., van der Walt, S. J., Brett, M., Wilson, J., Millman, K. J., Mayorov, N., Nelson, A. R. J., Jones, E., Kern, R., Larson, E., Carey, C. J., Polat, İ., Feng, Y., Moore, E. W., VanderPlas, J., Laxalde, D., Perktold, J., Cimrman, R., Henriksen, I., Quintero, E. A., Harris, C. R., Archibald, A. M., Ribeiro, A. H., Pedregosa, F., van Mulbregt, P., and SciPy 1.0 Contributors: SciPy 1.0: Fundamental Algorithms for Scientific Computing in Python, Nat. Meth., 17, 261–272, https://doi.org/10.1038/s41592-019-0686-2, 2020. a
Yang, J., Zhang, Z., Wei, C., Lu, F., and Guo, Q.: Introducing the new generation of Chinese geostationary weather satellites, Fengyun-4, B. Am. Meteorol. Soc., 98, 1637–1658, https://doi.org/10.1175/BAMS-D-16-0065.1, 2017. a
Zhang, H., Qiao, Y., Chen, H., Liu, N., Zhang, L., and Xie, X.: Experimental study on flaming ignition of pine needles by simulated lightning discharge, Fire Safety J., 120, 103029, https://doi.org/10.1016/j.firesaf.2020.103029, 2021. a