the Creative Commons Attribution 4.0 License.
the Creative Commons Attribution 4.0 License.
 | 16 Feb 2022
The Aerosol Module in the Community Radiative Transfer Model (v2.2 and v2.3): accounting for aerosol transmittance effects on the radiance observation operator
Cheng-Hsuan Lu
Quanhua Liu
Shih-Wei Wei
Benjamin T. Johnson
Cheng Dang
Patrick G. Stegmann
Dustin Grogan
Guoqing Ge
Ming Hu
Michael Lueken
The Community Radiative Transfer Model (CRTM), a sensor-based radiative transfer model, has been used within the Gridpoint Statistical Interpolation (GSI) system for directly assimilating radiances from infrared and microwave sensors. We conducted numerical experiments to illustrate how including aerosol radiative effects in CRTM calculations changes the GSI analysis. Compared to the default aerosol-blind calculations, the aerosol influences reduced simulated brightness temperature (BT) in thermal window channels, particularly over dust-dominant regions. A case study is presented, which illustrates how failing to correct for aerosol transmittance effects leads to errors in meteorological analyses that assimilate radiances from satellite infrared sensors. In particular, the case study shows that assimilating aerosol-affected BTs significantly affects analyzed temperatures in the lower atmosphere across several regions of the globe. Consequently, a fully cycled aerosol-aware experiment improves 1–5 d forecasts of wind, temperature, and geopotential height in the tropical troposphere and Northern Hemisphere stratosphere. Whilst both GSI and CRTM are well documented with online user guides, tutorials, and code repositories, this article is intended to provide a joined-up documentation for aerosol absorption and scattering calculations in the CRTM and GSI. It also provides guidance for prospective users of the CRTM aerosol option and GSI aerosol-aware radiance assimilation. Scientific aspects of aerosol-affected BT in atmospheric data assimilation are briefly discussed.
- Article
(5295 KB) - Full-text XML
- BibTeX
- EndNote


An accurate and computationally efficient radiative transfer model is essential in radiance assimilation for supporting weather prediction, physical retrievals for satellite environmental data records, and inter-comparison between different remote sensing instruments. The Community Radiative Transfer Model (CRTM) is a radiative transfer model used extensively within satellite and remote sensing systems (Weng, 2007; Han et al., 2007). It was primarily designed for computing satellite radiances and has been widely used within the Gridpoint Statistical Interpolation (GSI, Wu et al., 2002; Kleist et al., 2009) system for directly assimilating radiances from infrared (IR) and microwave (MW) sensors. Specifically, clear-sky radiance calculations are carried out within the CRTM given the atmospheric scattering and absorption profile, surface emissivity and reflectivity, and source functions. For cloudy radiance simulations (Stegmann et al., 2018), vertical profiles of hydrometeor variables (e.g., cloud liquid water path and ice water path) are also required. Note that the CRTM was not designed to enact composition–radiation interaction effects within spectral longwave and shortwave radiative transfer calculations in general circulation models. Instead, the CRTM was developed to support monochromatic satellite radiance assimilation from longwave and microwave sensors, and for satellite retrieval algorithm development.
Past studies have demonstrated that aerosols significantly impact the simulation of brightness temperature (BT) in the IR channels. BT is “a descriptive measure of radiation in terms of the temperature of a hypothetical blackbody emitting an identical amount of radiation at the same wavelength” (American Meteorological Society, 2012). A reduction in retrieved BT of 2–4 K in the atmospheric window region due to a strong dust outbreak was reported during the Saharan Dust Experiment (SHADE) campaign (Highwood et al., 2003). Pierangelo et al. (2004) and Peyridieu et al. (2009) showed that the dust cooling effects may reach 3 K in tropical atmospheric conditions depending on the dust burden. Diaz et al. (2001) found that there is a significant increase in the errors of sea surface temperature (SST) retrievals in the presence of enhanced aerosol loading in the atmosphere. The dust effects on satellite-derived SST are constrained by accounting for dust absorption (Weaver et al., 2003), applying a dust correction scheme (Nalli and Stowe, 2002; Merchant et al., 2006), or removing dust-contaminated observations (Divakarla et al., 2012).
The impact of aerosol-affected BTs on the meteorological analysis fields has also been investigated. Wei et al. (2021) used the Global Data Assimilation System (GDAS, Kleist et al., 2009) to assess the aerosol impact on the meteorological analysis. To do this, two GDAS experiments were conducted: a control cycled experiment, where aerosol transmittance effects are not considered, and an offline non-cycled experiment, where aerosol transmittance effects are considered in the BT calculations. The offline experiment uses identical observations and first guesses as the control experiment, and thus the response of atmospheric analysis to aerosol-aware radiance calculations can be clearly demonstrated. The experimental setup in Wei et al. (2021) followed the methodology presented in Kim et al. (2018), which is based on the Goddard Earth Observing System (GEOS) atmospheric data assimilation system (ADAS). Note that GEOS-ADAS and GDAS both used GSI and CRTM, although the version and configuration differed. The studies by Kim et al. (2018) and Wei et al. (2021) reported that (i) there is a considerable cooling effect on simulated BT when aerosols are considered, (ii) including aerosol transmittance effects in the BT calculation improves the fit to observations over the dust-laden regions, and (iii) the offline aerosol-aware experiment produces warmer analyzed SST (0.3–0.5 K) over the Atlantic Ocean. Wei et al. (2021) also reported a warmer analyzed lower atmosphere (0.15 K) over Africa and the central Atlantic Ocean in the offline aerosol-aware experiment.
The experiments conducted in Kim et al. (2018) and Wei et al. (2021) were based on the application of the CRTM aerosol absorption and scattering routines. While aerosol absorption and scattering options are available from CRTM version 2.2 onwards, to our knowledge the documentation of the CRTM aerosol module (Liu and Lu, 2016) has yet to be updated. Here we presented a joined-up documentation for aerosol absorption and scattering calculations in the CRTM and GSI. In addition, we provide guidance for prospective users of running aerosol-affected GSI analysis. Scientific aspects of aerosol-affected BT in atmospheric data assimilation are also briefly discussed.
Below, we provide a brief introduction to the GSI in Sect. 2.1 and a description of the CRTM aerosol option in Sect. 2.2. In Sect. 2.3, a description of running aerosol-aware GSI analysis is given.
2.1 GSI
The multi-partner-developed GSI is an incremental three-dimensional variational (3D-Var) data assimilation system (Wu et al., 2002; Kleist et al., 2009). GSI, alone or combined with an ensemble system, has been used widely by modeling centers and the research community for a range of applications. For instance, it is used operationally by the National Oceanic and Atmospheric Administration (NOAA) National Centers for Environmental Prediction (NCEP) for medium-range weather forecasting. It is also used by the National Aeronautics and Space Administration (NASA) Global Modeling and Assimilation Office (GMAO) for recent production of the Modern-Era Retrospective Analysis for Research and Applications, version 2 (MERRA-2; Gelaro et al., 2017). The community version of the GSI system has been supported and maintained by the Developmental Testbed Center (DTC; http://dtcenter.org, last access: 8 February 2022). Note that DTC is scheduled to cease all activities supporting the GSI user community by the end of December 2021. However, community GSI-related assets (website, forum, and repository) built by DTC will remain available to and usable by the community.
GSI can assimilate a wide range of observations, including conventional observations (such as radiosonde observations), radar data, satellite retrievals (for example global positioning system (GPS) radio occultation sounding data), satellite radiance data, etc. For IR satellite instruments, GSI has the capability to assimilate radiances from the Advanced Infrared Sounder (AIRS) on AQUA; Infrared Atmospheric Sounding Interferometer (IASI) on METOP-A and METOP-B; Cross-track Infrared Sounder (CrIS) on S-NPP; High resolution Infrared Radiation Sounder (HIRS) on METOP-A, METOP-B, and NOAA-19; Advanced Very High Resolution Radiometer (AVHRR) on NOAA-18 and METOP-A; Spinning Enhanced Visible and Infrared Imager (SEVIRI) on M08 and M10; and Geostationary Operational Environmental Satellite (GOES) Sounders (sndrD1, sndrD2, sndrD3, and sndrD4) on GOES-15. A comprehensive list of all observations assimilated and monitored by GDAS can be found at the web page for “Observational Data Processing at NCEP” (https://www.emc.ncep.noaa.gov/emc/pages/infrastructure/obs-data-processing.php, last access: 8 February 2022).
Despite the broad applications of GSI, the publicly released version handles only clear-sky radiances for IR sensors. Without correcting for aerosol transmittance effects, systematic biases may be introduced into the meteorological analysis fields when observations affected by aerosols are assimilated. The aerosol-aware option (discussed in Sect. 2.2) reduces such errors by enabling aerosols to influence GSI's radiance observation operator, CRTM, which calculates the BT and Jacobians (radiance first derivative). This option, however, may fluctuate the amount of observations assimilated in GSI because the quality control (QC) algorithm screens out observations based on measured BTs and aerosol-free simulated BTs. Thus, an improved QC algorithm is needed to fully exploit radiance measurements under all sky conditions. The technical issues regarding the QC procedure have been discussed in Kim et al. (2018) and Wei et al. (2021).
2.2 CRTM aerosol module
The CRTM, a one-dimensional radiative transfer model (Liu and Weng, 2006), is being developed at the US Joint Center for Satellite Data Assimilation (JCSDA) with algorithm and software input from JCSDA collaborating research institutions. The CRTM is composed of four modules, which include gaseous transmittance, surface emission and reflection, cloud and aerosol absorption and scattering, and a solver for radiative transfer (Han et al., 2006). Given an atmospheric profile of temperature, cloud and surface properties, and gaseous constituents and aerosol concentrations, the CRTM is called within the GSI to calculate BTs for satellite sensors from IR sounders to MW imagers. Here, we describe the aerosol scattering and absorption scheme in CRTM version 2. We refer the readers to Han et al. (2006) for the full details regarding CRTM version 1.
Absorption by atmospheric trace gases, such as water vapor and carbon dioxide, is parameterized using the Optical Depth in Absorber Space (ODAS) and the Optical Depth in Pressure Space (ODPS) algorithms (Chen et al., 2012), which are based on rigorous line-by-line calculations from the Line-By-Line Radiative Transfer Model (LBLRTM, Clough et al., 1992). For enacting aerosol attenuation effects, the CRTM uses pre-computed look-up tables, which calculate aerosol optical properties, specifically the extinction coefficient, single-scattering albedo, asymmetry factor, and phase function coefficients. The CRTM version 2.2 and 2.3 (Johnson et al., 2021) contain the optical look-up table based on the aerosol types of the mass-based Goddard Chemistry Aerosol Radiation and Transport (GOCART, Chin et al., 2002; Colarco et al., 2010) module, for their radiative effects from the ultraviolet to the infrared. Operationally, given aerosol types, radius, concentration, and ambient relative humidity, CRTM generates aerosol optical profiles that the radiative transfer solver requires for multi-scattering simulations and radiance calculations. The effect of aerosols on MW sensors is not considered yet because the impact of aerosols on MW radiance is usually very small, given that aerosol size is generally much smaller than MW wavelengths (Petty, 2006). There are ongoing and planned CRTM development efforts to incorporate more aerosol optical tables (such as the Community Multiscale Air Quality model, CMAQ). With the expansion of the aerosol schemes, a new releasing and versioning system for optical tables is essential and currently under discussion. This article, however, mainly discusses the GOCART model, which is the default aerosol scheme in the CRTM version 2.
The GOCART model (Chin et al., 2002, 2014), a bulk aerosol scheme, simulates major tropospheric aerosol components, including dust, sea salt, black carbon (BC), organic carbon (OC), and sulfate. It is one of the most widely used aerosol modules in the Weather Research and Forecasting model coupled with Chemistry (WRF-Chem; see Ukhov et al., 2021, and references therein). It is used in the GEOS framework at GMAO for near-real-time aerosol forecasts (Colarco et al., 2010) as well as in MERRA reanalysis (Buchard et al., 2015) and MERRA-2 reanalysis (Randles et al., 2017). It is also implemented in the Global Forecast System (GFS) framework at NCEP for near-real-time global aerosol forecasts (Lu et al., 2016; Wang et al., 2018; Zhang et al., 2021).
When GOCART was selected as the aerosol module within WRF-Chem, it was configured with 14 GOCART aerosol species (Liu et al., 2011): sulfate, hydrophobic and hydrophilic OC and BC, sea salt in four particle size bins (with radii of 0.1–0.5, 0.5–1.5, 1.5–5, and 5–10 µm), and dust particles in five particle size bins (with radii of 0.1–1.0, 1.0–1.8, 1.8–3, 3–6, and 6–10 µm). A default CRTM look-up table has been used for pre-calculated aerosol optical property parameters for the 14 GOCART aerosol species (Liu et al., 2007; Liu and Lu, 2016). We assume that the particles are spherical and externally mixed. We also assume lognormal size distributions for sulfate and carbonaceous aerosols as well as for each sea salt and dust bin. The lognormal size distribution for N particles can be expressed as follows (d'Almeida et al., 1991):
where r is a radius, rg is the geometric median radius, and σg is the geometric mean standard deviation. The kth moment of the distribution can be expressed as follows (Binkowski and Roselle, 2003):
where M0 is the number N of aerosol particles, and M2 and M3 are proportional to the total particulate surface area and volume, respectively. Thus, the effective radius (reff) can be defined as follows:
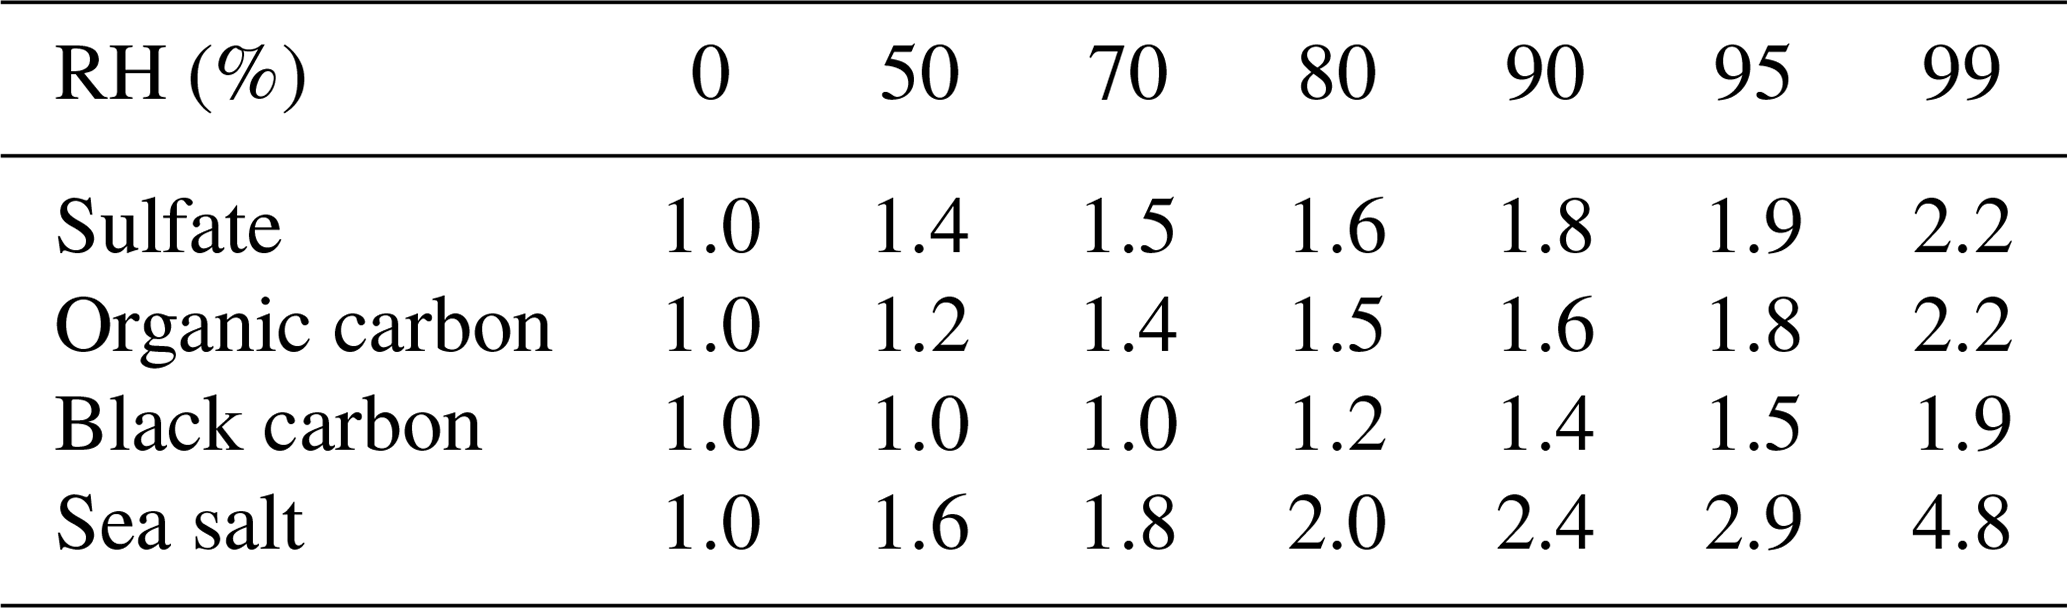
Table 1 lists the GOCART size parameters (particle density, effective radius, and geometric standard deviation) and refractive indices at 550 nm used in CRTM version 2. The optical properties of each aerosol species are computed based on Mie scattering theory. Hydrophilic aerosol particle size increases as relative humidity (RH) of the ambient atmosphere increases. Therefore, the water content in aerosol needs to be considered when calculating the refractive index. The effective radius growth factor for hygroscopic aerosols may be theoretically calculated or obtained from a pre-calculated look-up table (d'Almeida et al., 1991). In this study, the hygroscopic growth factor used for the GOCART model (Chin et al., 2002) is adopted and given in Table 2. Once the growth factor ag is evaluated, the refractive index nr for the hygroscopic aerosol can be calculated using a volume mixing method as follows:
where no and nw are the refractive indices for dry aerosols and water, respectively. We adopt the refractive index no from the Optical Properties of Aerosols and Clouds (OPAC) dataset (Hess et al., 1998), while the water refractive index is given by Hale and Querry (1973).
Table 1Goddard Chemistry Aerosol Radiation and Transport (GOCART) size distribution parameters and refractive indices at 550 nm for dry aerosols.
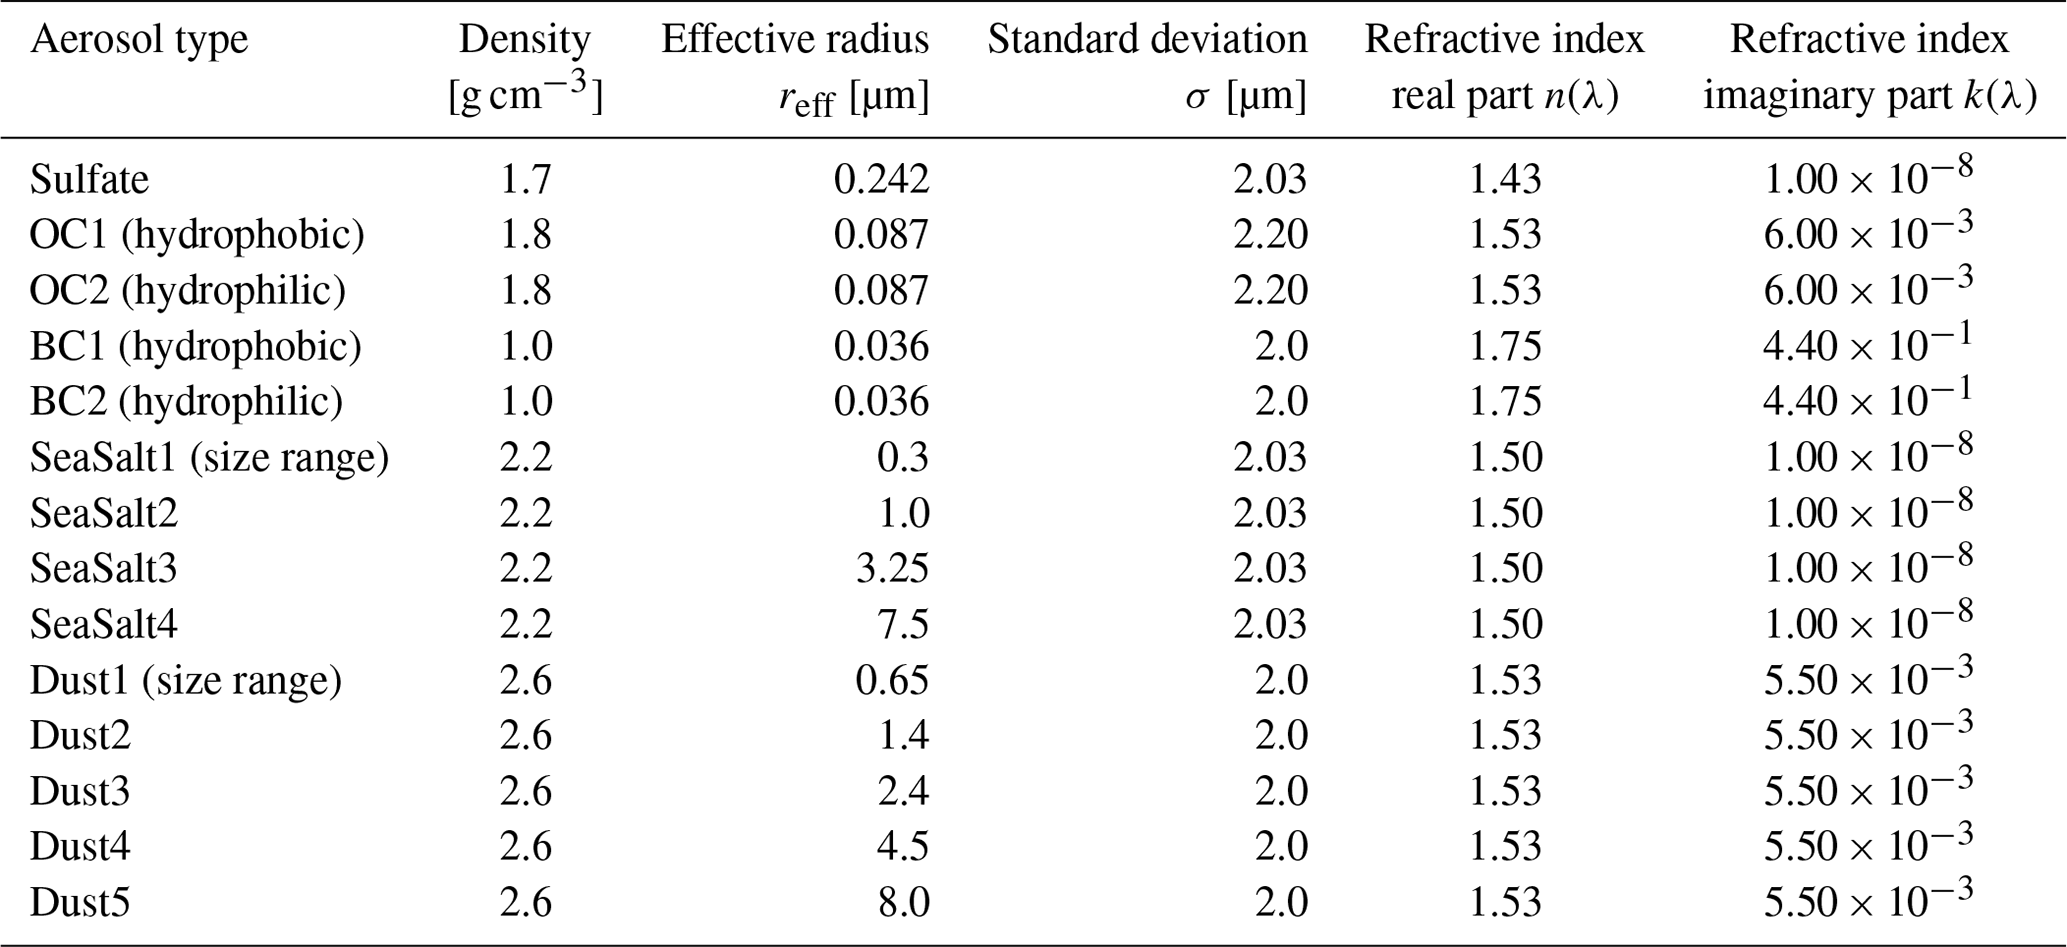
Table 2Hygroscopic aerosol growth factor ag as a function of the ambient relative humidity (RH).
The GOCART model used by GMAO and NCEP for aerosol forecast and reanalysis has evolved to use five sea salt size bins (with radii of 0.03–0.1, 0.1–0.5, 0.5–1.5, 1.5–5, and 5–10 µm). The first sub-micron sea salt bin was added to facilitate optical properties and aerosol–cloud interaction studies (Colarco et al., 2010) but was excluded from the previous GOCART versions as well as the WRF-Chem GOCART model. While GMAO's GEOS and NCEP's GFS contain 15 GOCART aerosol species, the CRTM aerosol module has also not yet been modified to include the new added sub-micron sea salt bin (see Table 1). To overcome this discrepancy, the latest GSI/CRTM release (i.e., GSI 3.7 and CRTM 2.3) combines the mixing ratios from the two sub-micron sea salt bins in order to use the aerosol optical property parameters from the original GOCART model. This limitation is acknowledged in this article and will be addressed in a future CRTM release (see Sect. 4).
While the CRTM is primarily designed for computing satellite radiances, an additional module was added to CRTM by Liu and Lu (2016) to compute aerosol optical depth (AOD). This CRTM-AOD module enables the GSI system to assimilate AOD observations (Liu et al., 2011; Schwartz et al., 2014; Pagowski et al., 2014). This article, however, is focused on the observation operator for radiance, and we refer the reader to Pagowski et al. (2014) for the description of the AOD observation operator and GSI AOD data assimilation.
2.3 Running aerosol-aware GSI analysis
The operational version of GSI maintained by the NOAA/NCEP Environmental Modeling Center (EMC) is utilized in the present study. Its source code and associated static files are distributed through the GitHub repository (https://github.com/NOAA-EMC/GSI, last access: 8 February 2022). An open-access repository of GSI source code is archived on Zenodo (Lueken et al., 2021). To run the GSI analysis, the reader can refer to the user guide for GSI v3.7 (the latest version released as of April 2021), which is available at https://dtcenter.ucar.edu/com-GSI/users/docs/users_guide/html_v3.7/index.html (last access: 8 February 2022). In addition, an online tutorial is available at https://dtcenter.ucar.edu/com-GSI/users/tutorial/online_tutorial/index_v3.7.php (last access: 8 February 2022). For CRTM, the user guide and tutorials can be found at https://www.jcsda.org/jcsda-project-community-radiative-transfer-model (last access: 8 February 2022). Thus, only a brief description of aerosol-affected BT calculations is given.
A regression test “global_C96_fv3aerorad” has been introduced into the NOAA/EMC GSI code repository (pull request no. 32) to assure the functionality of aerosol-aware BT derivations in GSI/CRTM works as expected. This regression test uses a sample background file taken from the aerosol member of the Global Ensemble Forecast System (GEFS-Aerosol; Zhang et al., 2021). All 15 GOCART aerosol species are passed along to the CRTM. In addition to the background file, a user needs to modify the configuration files, anavinfo and satinfo, in the “fix” directory. The anavinfo file is the information file to set control and analysis variables. The satinfo file is the information file to specify satellite channels to be assimilated and associated parameters. For an aerosol-aware experiment where aerosol absorption and scattering are included in BT calculations, aerosol species are specified in the “chem_guess” section of anavinfo, and sensors and channels are set to 1 in the “iaerosol” column of satinfo. The reader can refer to the fv3aerorad_satinfo.txt and anavinfo_fv3aerorad for the aerosol-aware configuration. The corresponding namelist (gsiparm.anl) can be found in the “global_C96_fv3aerorad” section (line 2931–3046) in regression_namelists.sh under the “regression” directory. It should be noted that the namelist variable, “lread_ext_aerosol”, determines how GSI ingests the aerosol information from background files or external files. An open-access repository of fixed files and sample data for the “fv3aerorad” regression test is archived at Zenodo (Lu et al., 2021).
3.1 Aerosol impacts on BT calculations
To illustrate how an aerosol transmittance correction is required within satellite radiances assimilated into meteorological data assimilation systems, we present a detailed analysis of a single-cycle GSI experiment (the AER experiment) using GOCART fields from MERRA-2 at 12:00 Z on 22 June 2020. This time is chosen because it captures a strong Saharan dust event that covers the trans-Atlantic region. A baseline GSI experiment (the CTL experiment) with the anavinfo and satinfo resource files reverted back to the default aerosol-blind configuration was also conducted. Both experiments used the same first-guess fields and assimilated identical conventional and satellite observations within a ±3 h assimilation window. In AER, the aerosol transmittance effects were only considered in the CRTM simulation for IR sensors.
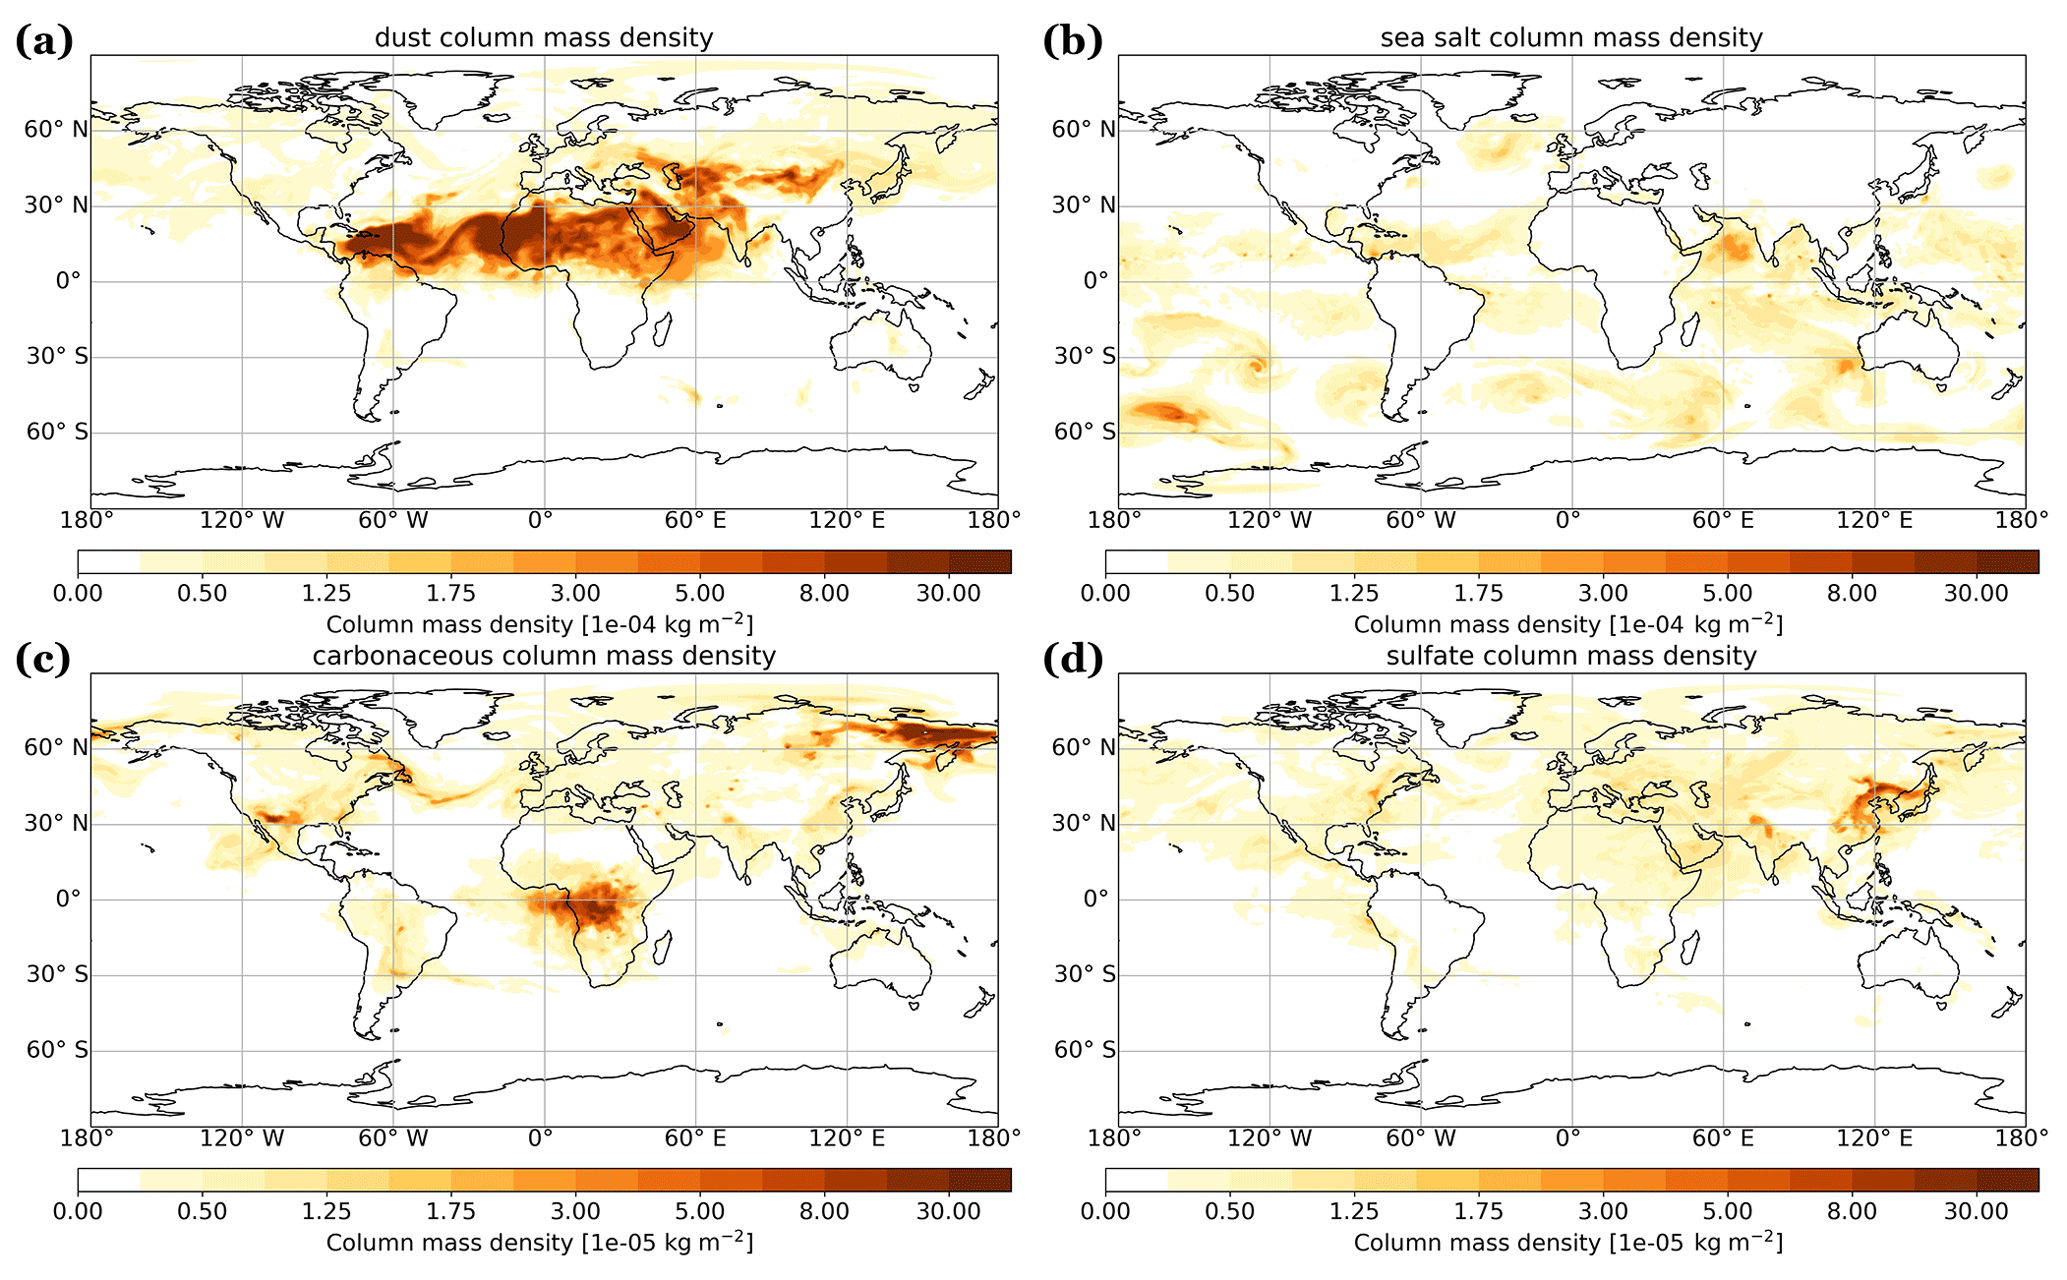
Figure 1Aerosol column mass density (kg m−2) from MERRA-2 at 12:00 Z on 22 June 2020: (a) dust, (b) sea salt, (c) carbonaceous, and (d) sulfate.
Figure 1 shows the global aerosol column mass density distribution from MERRA-2 at 12:00 Z on 22 June 2020. The panels a, b, c, and d depict dust, sea salt, carbonaceous, and sulfate aerosols, respectively. Dust plumes spread over northern Africa, the tropical Atlantic Ocean, the Middle East, and northwestern China. Wind-driven sea salt aerosols are seen over tropical and Southern Hemisphere oceans. Carbonaceous and sulfate aerosols mainly appear in areas with extensive biomass burning and fuel combustion activities (note: one order smaller than dust and sea salt). The overall aerosol loading is dominated by mineral dust. Wu et al. (2020) evaluated the dust spatiotemporal variations of MERRA-2 against satellite observations and global model simulations. They found that MERRA-2 agrees well with satellite observations due to the assimilation of satellite AOD. But in North America and the Arctic, the dust burden in MERRA-2 is much larger than those in other models despite having similar dust emissions fluxes. The high dust burden over these regions is due to a higher mass fraction of fine dust and enhanced dust transport. Furthermore, Bullard et al. (2016) reported that large gaps exist in our understanding of basic characteristics of high-latitude dust sources. This highlights the importance of representing aerosol emissions, transport, removal, and size distribution in global models in correctly simulating aerosol spatiotemporal distributions.
Figure 2a shows the first-guess BT differences of IASI on board METOP-A between the two experiments (AER − CTL) in the IR atmospheric window channels over dust-, sea-salt-, carbonaceous-, and sulfate-dominant regions. The stratification criterion for each type is where the fraction of column mass density of the dominant species, from MERRA-2, is larger than 0.65 (shown in Fig. 2b). Figure 2a shows that dust aerosols generate the stronger cooling effects, about 0.7 K at the thermal IR window region (∼10 µm), than other species. The importance of correcting for aerosol transmittance effects within BT algorithms has been reported in previous studies (Sokolik, 2002; Weaver et al., 2003; Pierangelo et al., 2004; Matricardi, 2005; Merchant et al., 2006; Kim et al., 2018; Wei et al., 2021). Table 3 describes the range and the average of total aerosol column mass density over the regions with different dominant aerosol species. It shows that the total loading of aerosols is similar over the dust- and carbonaceous-aerosol-dominated regions. This indicates that the stronger cooling effects by dust aerosol on BT in the IR window region is not due to stronger loading. Note that in the Northern Hemisphere, the high-latitude region is characterized as dust-dominant except for the Russian Far East in MERRA-2 (Fig. 2b). While anomalous or erroneous modeled aerosol loading may bias the results, the finding that dust has the largest impact on the BT simulations, reported in this study and previous studies, remains unchanged. Therefore, we focus our remaining analysis on dust over tropical Africa and the mid-Atlantic.
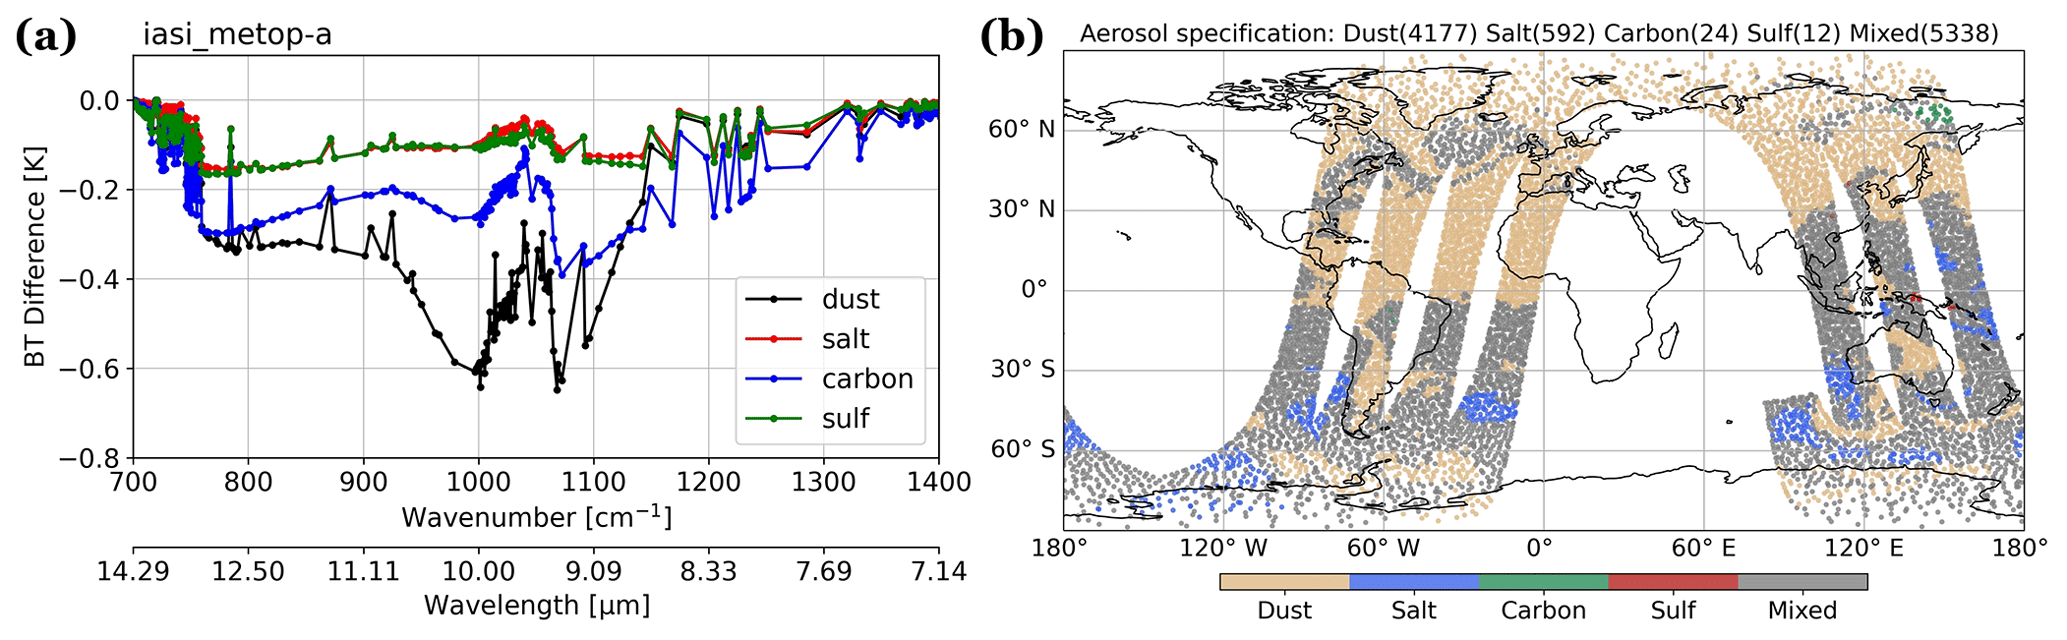
Figure 2(a) The differences (AER − CTL) of first-guess brightness temperatures in the IR window region of IASI on board METOP-A. (b) The corresponding regions dominated by different aerosol species at 12:00 Z on 22 June 2020. The data counts for each species are labeled in panel (b).
Table 3The range of aerosol column mass density (kg m−2) from MERRA-2 at the regions dominated by different aerosol species (fraction over 0.65) of IASI on board METOP-A at the cycle of 12:00 Z on 22 June 2020.
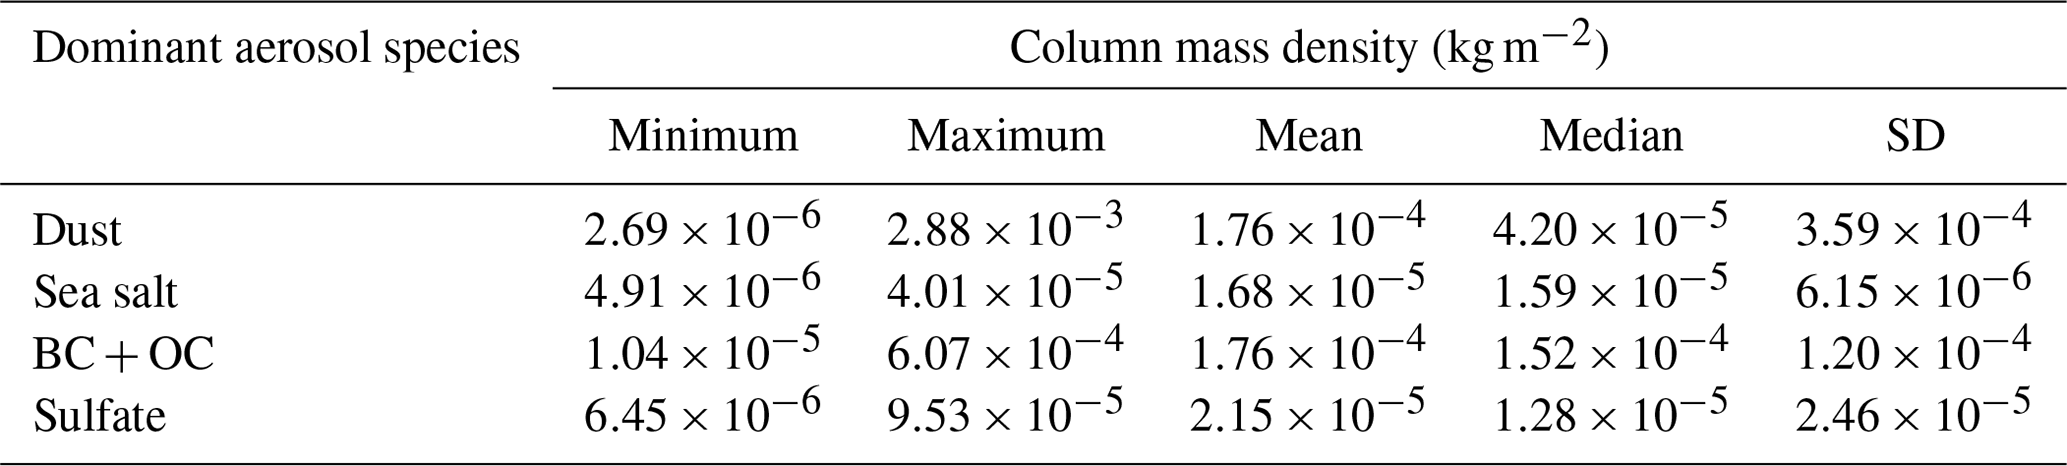
Figure 3 displays the AER − CTL difference in the simulated BTs and their respective first-guess departures (observed minus first guess, OMF) calculated at the 10.39 µm channel from IASI on board METOP-A. The figure focuses on North Africa and the trans-Atlantic region, where a large dust plume spans the region. Significant aerosol cooling (∼4 K) in BT was found in the aerosol-aware experiment (Fig. 3a) due to the large plume. Comparing the first guess departures from CTL and AER experiments (Fig. 3b and c) shows that OMFs for AER are warmer than CTL (compare 0.27 K vs. −0.09 K). Note that some observations assimilated in CTL were rejected in AER (near 55∘ W and 15∘ N) and vice versa (near 65∘ W and 15∘ N, and over Africa). This feature suggests that the quality control has been influenced by including aerosol transmittance effects in CRTM. Over the trans-Atlantic region, the aerosol-aware experiment assimilated several observations with larger first-guess departures located in the strong dust plume (Fig. 3d). Figure 4 presents the scatter plot of dust column mass density versus OMF differences (AER − CTL) for these data points assimilated in AER at 12:00 Z on 22 June 2020. The data points with large OMF differences are corresponding to the areas with higher dust loading. Nevertheless, when considering aerosol information, the root-mean-square first-guess departures decreased 0.08 globally and 0.42 K over the trans-Atlantic region at this channel (not shown here). This implies that simulated BTs in the aerosol-aware run are in better agreement with the observations.
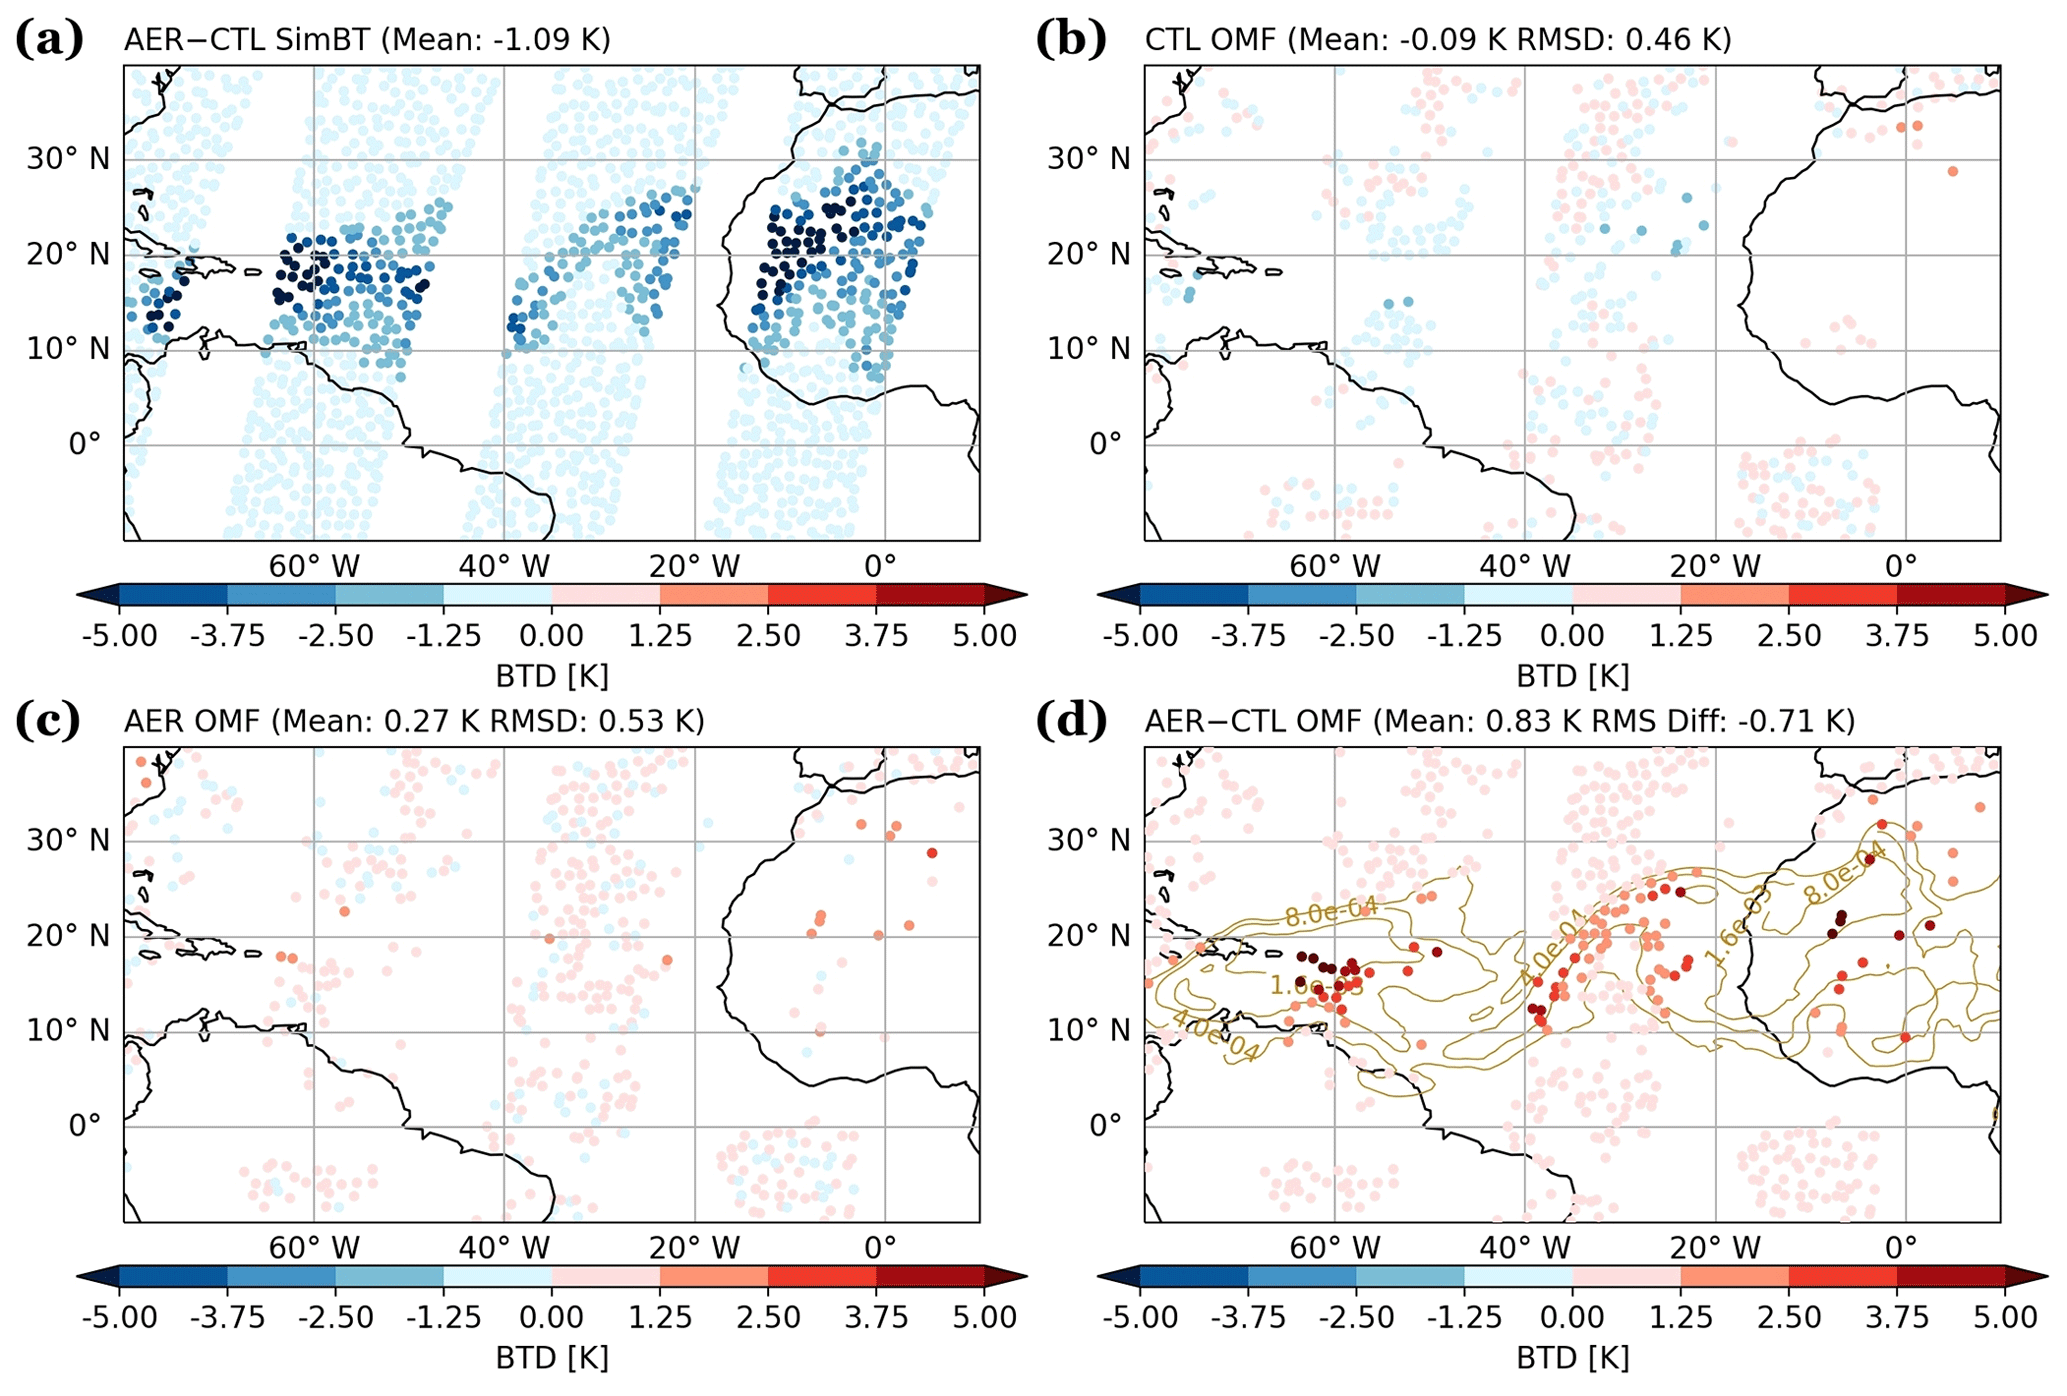
Figure 3(a) Simulated BT differences (AER − CTL), (b) bias-corrected OMF from the CTL experiment, (c) bias-corrected OMF from the AER experiment, and (d) OMF differences (AER − CTL) for 10.39 µm channel of IASI on board METOP-A. All the data are from the analysis cycle at 12:00 Z on 22 June 2020. Contours of total column mass density from MERRA-2 are plotted in panel (d).
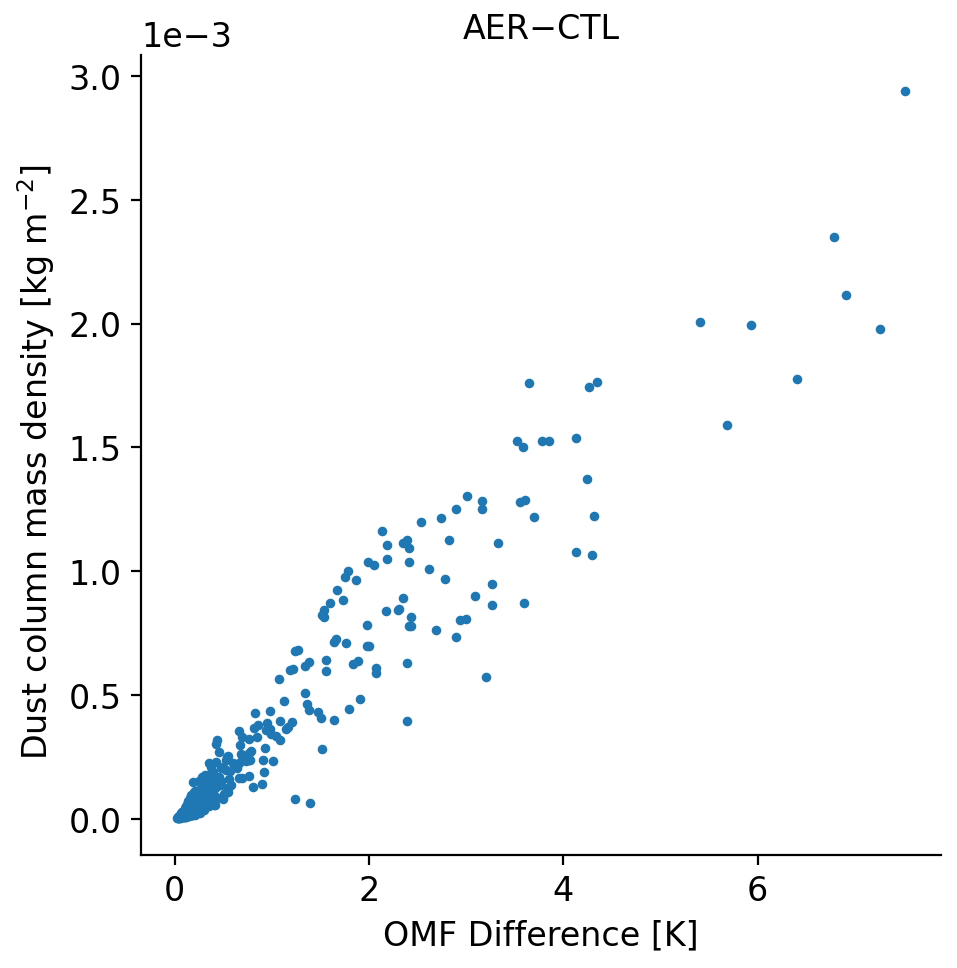
Figure 4The scatter plot of dust column mass density from MERRA-2 against the first-guess departure differences (AER − CTL) assimilated in AER experiment (without bias correction) at 12:00 Z on 22 June 2020.
Figure 5 shows (a) the global differences in analyzed temperature at 900 hPa between the two experiments and (b) the total aerosol column mass density incorporated into the GSI/CRTM system. When aerosol transmittance effects are considered in the BT calculations, the air temperatures are not only adjusted over aerosol-laden regions but also across the globe. The impact is shown outside aerosol-active regions, which could be attributed to the change from the spatial correlation in the GSI background error covariance. Over the trans-Atlantic region where the dust loading is high (shown in Fig. 1a), the AER experiment produces 0.5 to 1 K of warming relative to CTL. As dust travels off the west coast of Africa into the Atlantic, the particles are lifted and carried by the Saharan air layer (SAL), around 800–600 hPa (Diaz et al., 1976; Karyampudi et al., 1999). In the case of 12:00 Z on 22 June 2020, MERRA-2 captured the dust transport within SAL, and air mass is increasingly composed of fine dust particles due to the gravitational settling of coarser particles (not shown here). Wei et al. (2022) conducted a series of CRTM v2.3 experiments using idealized dust profiles and reported that mass loading and the altitude of the dust layer are the primary and secondary factors affecting the BT simulations, respectively; changes in the fine versus coarse particle partition show little influence on the BT simulations. Based on these results we speculate that elevated dust plume retains unneglected influences on BT calculations (Fig. 3a). Experiments with robust estimated aerosol distributions over extended time periods are needed to quantify the sensitivity of GSI analysis to aerosol-aware CRTM calculations. This paper, however, is intended to provide a joined-up documentation for the CRTM aerosol option, and thus unraveling these questions is beyond the scope of this study.
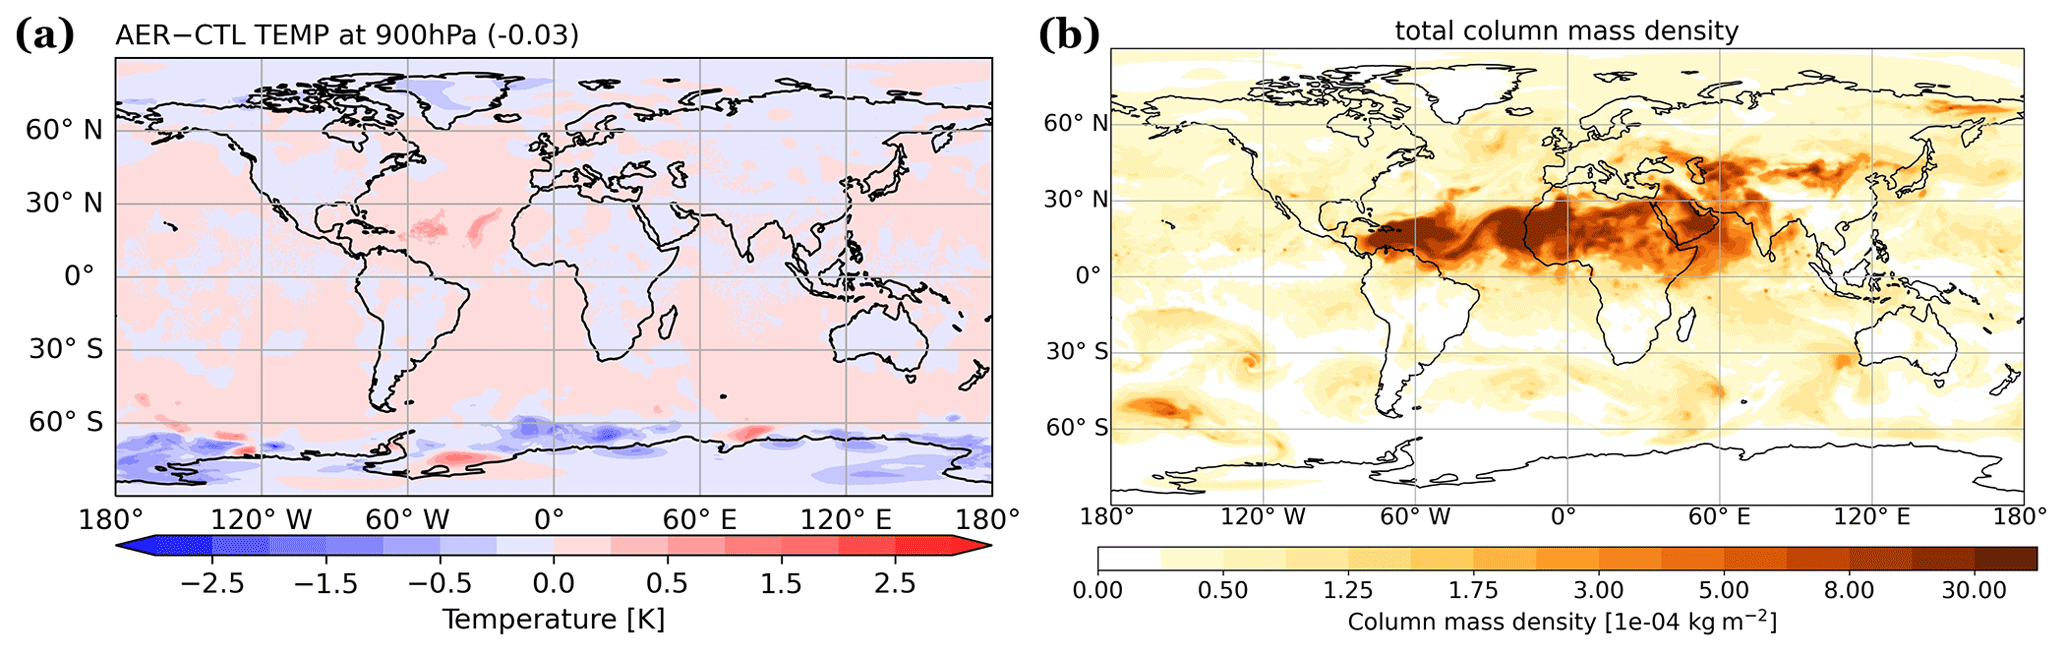
Figure 5(a) The differences (AER − CTL) of analyzed temperature (K) at 900 hPa and (b) the corresponding aerosol column mass density (kg m−2) from MERRA-2 at 12:00 Z on 22 June 2020.
3.2 Aerosol impacts on the analysis
The experiments reported in this section were produced with the NCEP GFS version 14 and the corresponding GDAS. Our experiments used a coarser resolution, T670 (∼30 km) for the model and T254 (∼80 km) for the analysis, different from the NCEP operational GFSv14 configuration at T1534 (∼13 km) and T574 (∼27 km). The experiments covered the August 2017 period, initialized from NCEP's archived GDAS analysis on 25 July at 00:00 Z. The analysis cycles every 6 h (at 00:00, 06:00, 12:00, and 18:00 Z), with a ±3 h assimilation window and continuous data utilization. The control experiment (CTL_cyc) was an aerosol-blind fully cycled experiment where aerosol effects on radiances are not considered (as they are by default). The aerosol experiment (AER_cyc) was an aerosol-aware fully cycled experiment where aerosol-affected satellite radiances are taken into account. Here, we used CRTM version 2.2.4. Time-varying three-dimensional GOCART aerosols were taken from NCEP's archived NEMS GFS Aerosol Component (NGAC) v2, which simulates the emission, transport, and removal of the GOCART aerosols (Wang et al., 2018).
Figure 6 displays the statistics of analysis departures (observation minus analysis, OMA) from CTL_cyc and AER_cyc to evaluate the performance of temperature analysis at the lower atmosphere over the tropical region (20∘ S–20∘ N). The positive value of mean OMAs indicates that both experiments have cold biases in the tropical region. It shows neutral impact on the root mean square (RMS) and slightly positive impact on the cold biases. The latter implies that the departure of temperature analysis becomes larger when considering aerosol transmittance effects during the data assimilation (i.e., AER_cyc).
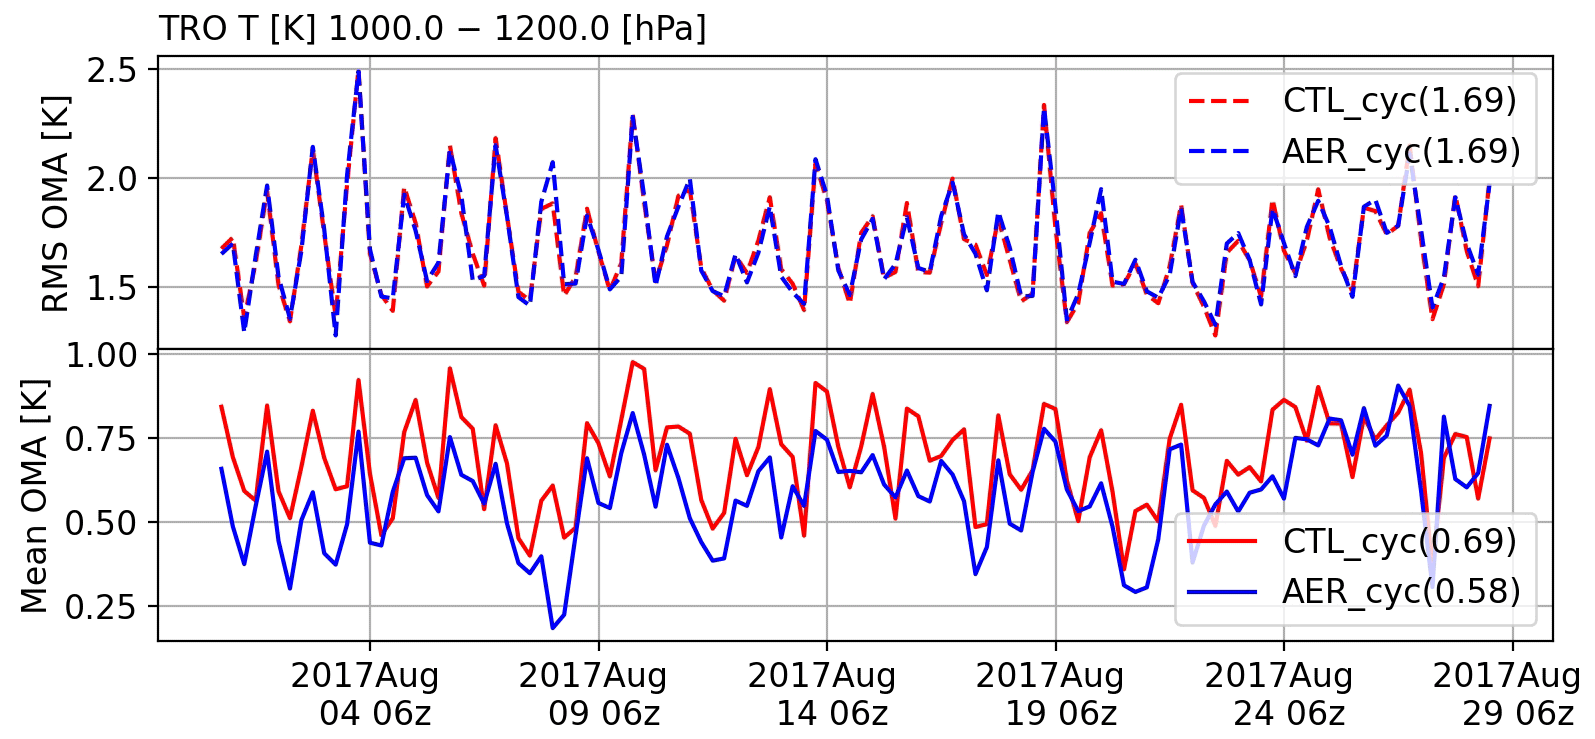
Figure 6The comparison of the RMS and mean analysis departures (observation minus analysis, OMA) against in situ measurements (e.g., radiosonde) of temperature with pressure over 1000 hPa at the tropical region (20∘ S–20∘ N) during 00:00 Z on 1 August to 18:00 Z on 28 August 2017.
Medium-range forecasts of AER_cyc are examined against CTL_cyc using the verification package from NOAA/NCEP EMC (https://www.emc.ncep.noaa.gov/gmb/STATS_vsdb, last access: 8 February 2022). Figure 7 displays the scorecard of anomaly correlation and root-mean-square error (RMSE) for the day-1, -3, and -5 forecasts over 1–28 August 2017. Anomaly correlation coefficients show neutral to positive impact on day-1 forecasts of wind and temperature fields when aerosol cooling effects in BTs are considered. The RMSE scorecards show the forecast improvements in the wind, temperature, and height fields throughout the troposphere over the tropics (20∘ S–20∘ N) and at the upper level over the Northern Hemisphere (20–80∘ N). For the Southern Hemisphere (20–80∘ S), however, there is neutral impact or degradation in the forecasts, which is likely due to cloud contamination and mixture of sea salt and aged smoke/sulfate aerosols. Compared to both hemispheres, the tropical forecasts show the most improved statistics in the aerosol-aware analysis, which may be attributed to larger aerosol loading in this region. While the RMSE scorecard focuses on background (i.e., time-averaged) fields, it should be noted that evaluation of the aerosol impacts on the analysis and forecasts of African easterly wave that developed Hurricane Harvey and Gert in 2017 is presented in Grogan et al. (2021).

Figure 7Scorecard of anomaly correlation and RMSE of comparison
between AER_cyc and CTL_cyc. Green colors mean
AER_cyc is better than CTL_cyc at 95 %
(filled box), 99 % (![]() ), and 99.9 % (
), and 99.9 % (![]() ) significance level. Red colors
mean AER_cyc is worse than CTL_cyc at 95 %
(filled box), 99 % (
) significance level. Red colors
mean AER_cyc is worse than CTL_cyc at 95 %
(filled box), 99 % (![]() ), and 99.9 % (
), and 99.9 % (![]() ) significance level. Grey boxes
mean no statistically significant difference between AER_cyc
and CTL_cyc. Blue boxes are not statistically relevant. The
statistics are calculated between 20 to 80∘ of latitude for both
hemispheres. The data between 20∘ S and 20∘ N are used for the tropical region.
) significance level. Grey boxes
mean no statistically significant difference between AER_cyc
and CTL_cyc. Blue boxes are not statistically relevant. The
statistics are calculated between 20 to 80∘ of latitude for both
hemispheres. The data between 20∘ S and 20∘ N are used for the tropical region.
This article described aerosol absorption and scattering calculations of the CRTM version 2 in the GSI analysis. We also conducted sensitivity experiments to investigate the aerosol-affected GSI analysis in both single-cycle and fully cycled runs. Both GSI and CRTM are well documented with user guides, tutorials, and code repositories available online. This article is primarily a joined-up documentation for aerosol absorption and scattering calculations in the CRTM version 2 and GSI. It also provides guidance for prospective users of the CRTM aerosol option. Scientific aspects of aerosol-affected BT in atmospheric data assimilation are briefly discussed. Specifically, numerical experiments were conducted to illustrate how including aerosol radiative effects in CRTM changes the GSI analysis. We found that taking the aerosols into account reduces simulated BT in thermal window channels over dust-dominant regions. Assimilating aerosol-affected BTs produces a warmer analyzed lower atmosphere. From the verification scorecard, neutral to positive results are found in the fully cycled, aerosol-aware experiment.
The CRTM team, in coordination with its partners and collaborators, is building a robust capability to accurately and consistently simulate the emission, absorption, and scattering properties of all (radiatively important) atmospheric constituents. There are several ongoing and planned efforts to enhance the CRTM aerosol module. For example, more aerosol optical look-up tables have been added and the calculations of aerosol optical properties are being evaluated. In addition, the CRTM is being refactored toward a more flexible aerosol interface to handle aerosol optical look-up tables as well as to support aerosol specifications from other operational aerosol models, such as CMAQ. Other aerosol-related efforts include but are not limited to improving the physical representation of aerosols and including active sensors such as aerosol lidar. These developments, once implemented and tested, will be reported in future paper.
Various software packages are referred to throughout the paper. The following list contain links to the main software documentations or repositories discussed:
-
The GSI web page: https://dtcenter.ucar.edu/com-GSI/users/index.php (last access: 8 February 2022);
-
The GSI v3.7 user guide: https://dtcenter.ucar.edu/com-GSI/users/docs/users_guide/html_v3.7/index.html (last access: 8 February 2022);
-
The GSI v3.7 online tutorial: https://dtcenter.ucar.edu/com-GSI/users/tutorial/online_tutorial/index_v3.7.php (last access: 8 February 2022);
-
The DTC community GSI (as of 29 November 2021, via Zenodo): https://doi.org/10.5281/zenodo.5735601 (Lueken et al., 2021);
-
The CRTM v2.3.0 public repository (as of 13 November 2021, via Zenodo): https://doi.org/10.5281/zenodo.5695707 (Johnson et al., 2021);
-
The fv3aerorad regression test public repository (via Zenodo): https://doi.org/10.5281/zenodo.5736503 (Lu et al., 2021);
-
The aerosol-related Fortran code in GSI – aerosol files check (when lread_ext_aerosol is true): ./src/gsi/read_files.f90; aerosol data ingestion: ./src/gsi/ncepnems_io.f90, ./src/gsi/general_read_nemsaero.f90; CRTM simulation: ./src/gsi/crtm_interface.f90; effective radius setup: ./src/gsi/set_crtm_aerosolmod.f90.
The GDAS and NGACv2 data used in Sect. 3.2 are archived at NCEP High Performance Storage System and can be made available to the readers upon request.
QL implemented the aerosol module, CHL designed the experiments, and SWW performed the experiments. CHL prepared the paper with contributions from SWW, QL, and CD. DG, BTJ, PGS, GG, and MH helped to review and revise the manuscript. BTJ created the open-access CRTM repository. GG and ML created the open-access GSI repository. SWW created the fv3aerorad regression test repository.
The contact author has declared that neither they nor their co-authors have any competing interests.
Publisher’s note: Copernicus Publications remains neutral with regard to jurisdictional claims in published maps and institutional affiliations.
The study of CTL and AER cycled experiments are supported by the Next Generation Global Prediction System (NGGPS) program within NOAA/NWS. The testing and refinement of GSI/CRTM regression test is supported by the DTC Visitor Program. All experiments were conducted at NOAA/NESDIS-funded Supercomputer for Satellite Simulations and Data Assimilation Studies (S4) cluster maintained by Space Science and Engineering Center (SSEC) at University of Wisconsin-Madison. We thank GMAO collaborators, Arlindo da Silva, Mian Chin, and Peter Colarco, for providing valuable input on the calculations of aerosol optical properties for GOCART aerosols.
This research has been supported by the National Oceanic and Atmospheric Administration (grant no. NA15NWS4680008).
This paper was edited by Graham Mann and reviewed by two anonymous referees.
American Meteorological Society: Brightness Temperature, Glossary of Meteorology, available at: https://glossary.ametsoc.org/wiki/Brightness_temperature (last access: 8 February 2022), 2012.
Binkowski, F. S. and Roselle, S. J.: Models-3 Community multiscale air quality (CMAQ) model aerosol component, 1 Model description, J. Geophys. Res., 108, 4183, https://doi.org/10.1029/2001JD001409, 2003.
Buchard, V., da Silva, A. M., Colarco, P. R., Darmenov, A., Randles, C. A., Govindaraju, R., Torres, O., Campbell, J., and Spurr, R.: Using the OMI aerosol index and absorption aerosol optical depth to evaluate the NASA MERRA Aerosol Reanalysis, Atmos. Chem. Phys., 15, 5743–5760, https://doi.org/10.5194/acp-15-5743-2015, 2015.
Bullard, J. E., Baddock, M., Bradwell, T., Crusius, J., Darlington, E., Gaiero, D., Gasso, S., Gisladottir, G., Hodgkins, R., McCulloch, R., McKenna-Neuman, C., Mockford, T., Stewart, H., and Thorsteinsson, T.: High-latitude dust in the Earth system, Rev. Geophys., 54, 447–485, https://doi.org/10.1002/2016RG000518, 2016.
Chen, Y., Weng, F., Han, Y., and Liu, Q.: Planck-Weighted Transmittance and Correction of Solar Reflection for Broadband Infrared Satellite Channels, J. Atmos. Sci., 29, 382–396, 2012.
Chin, M., Ginoux, P., Kinne, S., Torres, O., Holben, B. N., Duncan, B. N., Martin, R. V., Logan, J. A., and Higurashi, A.: Tropospheric aerosol optical thickness from the GOCART model and comparisons with satellite and Sun photometer measurements, J. Atmos. Sci., 59, 461–483, https://doi.org/10.1175/1520-0469(2002)059<0461:TAOTFT>2.0.CO;2, 2002.
Chin, M., Diehl, T., Tan, Q., Prospero, J. M., Kahn, R. A., Remer, L. A., Yu, H., Sayer, A. M., Bian, H., Geogdzhayev, I. V., Holben, B. N., Howell, S. G., Huebert, B. J., Hsu, N. C., Kim, D., Kucsera, T. L., Levy, R. C., Mishchenko, M. I., Pan, X., Quinn, P. K., Schuster, G. L., Streets, D. G., Strode, S. A., Torres, O., and Zhao, X.-P.: Multi-decadal aerosol variations from 1980 to 2009: a perspective from observations and a global model, Atmos. Chem. Phys., 14, 3657–3690, https://doi.org/10.5194/acp-14-3657-2014, 2014.
Clough, S., Iacano, M. J., and Moncet, J.-L.: Line-by-line Calculations of Atmospheric Fluxes and Cooling Rates: Application to Water Vapor, J. Geophys. Res., 97, 15761–15785, 1992.
Colarco, P., da Silva, A., Chin, M., and Diehl, T.: Online simulations of global aerosol distributions in the NASA GEOS-4 model and comparisons to satellite and ground-based aerosol optical depth, J. Geophys. Res., 115, D14207, https://doi.org/10.1029/2009JD012820, 2010.
d'Almeida, G. A., Koepke, P., and Shettle, E.P.: Atmospheric Aerosols: global climatology and radiative characteristics, A. Deepak Publishing, Hampton, VA, ISBN 978-0-937-19422-5, 1991.
Diaz, H. F., Carlson, T. N., and Prospero, J. M.: A study of the structure and dynamics of the Saharan air layer over the northern equatorial Atlantic during BOMEX, National Hurricane and Experimental Meteorology Laboratory NOAA, Tech. Memo., ERL WMPO-32, 61 pp., available at: https://repository.library.noaa.gov/view/noaa/32843 (last access: 8 February 2022), 1976.
Diaz, J. P., Arbelo, M., Expósito, F. J., Podestá, G., Prospero, J. M., and Evans, R.: Relationship between errors in AVHRR-derived sea surface temperature and the TOMS Aerosol Index, Geophys. Res. Lett., 28, 1989–1992, 2001.
Divakarla, M., Barnet, C., Goldberg, M., Gu, D., Liu, X., Xiong, X., Kizer, S., Guo, G., Wilson, M., Maddy, E., Nalli, N., Gambacorta, A., King, T., Ma, X., and Blackwell, W.: Evaluation of CrIMSS operational products using in-situ measurements, model analysis fields, and retrieval products from heritage algorithms, IEEE International Geoscience and Remote Sensing Symposium, Munich, Germany, 22–27 July 2012, 1046–1049, https://doi.org/10.1109/IGARSS.2012.6350818, 2012.
Gelaro, R., McCarty, W., Suarez, M. J., Todling, R., Molod, A., Takacs, L., Randles, C. A, Darmenov, A., Bosilovich, M. G., Reichle, R., Wargan, K., Coy, L., Cullather, R., Draper, C., Akella, S., Buchard, V., Conaty, A., da Silva, A. M., Gu, W., Kim, G.-K., Koster, R., Lucchesi, R., Merkova, D., Nielsen, J. E., Partyka, G., Pawson, S., Putman, W, Rienecker, M., Schubert, S. D., Sienkiewicz, M., and Zhao, B.: The Modern-Era Retrospective Analysis for Research and Applications, Version 2 (MERRA-2), J. Climate, 30, 5419–5454, https://doi.org/10.1175/JCLI-D-16-0758.1, 2017.
Grogan, D. F. P., Lu, C.-H., Wei, S.-W., and Chen, S.-P.: Effects of Saharan Dust on African Easterly Waves: The Impact of Aerosol-Affected Satellite Radiances on Data Assimilation, Atmos. Chem. Phys. Discuss. [preprint], https://doi.org/10.5194/acp-2021-129, in review, 2021.
Hale, G. M. and Querry, M. R.: Optical constants of water in the 200-nm to 200-mm wavelength region, Appl. Opt., 12, 555–563, 1973.
Han, Y., van Delst, P., Liu, Q., Weng, F., Yan, B., Treadon, R., and Derber, J.: JCSDA Community Radiative Transfer Model (CRTM) – Version 1, NOAA NESDIS, Tech. Rep., 122, NOAA, Silver Spring, Md, 33 pp., available at: https://repository.library.noaa.gov/view/noaa/1157 (last access: 8 February 2022), 2006.
Han, Y., Weng, F., Liu, Q., and van Delst, P.: A fast radiative transfer model for SSMIS upper atmosphere sounding channels, J. Geophys. Res., 112, D11121, https://doi.org/10.1029/2006JD008208, 2007.
Hess, M., Koepke, P., and Schult I.: Optical properties of aerosols and clouds: the software package OPAC, B. Am. Meteorol. Soc., 79, 831–844, 1998.
Highwood, E. J., Haywood, J. M., Silverstone, M. D., Newman, S. M., and Taylor, J. P.: Radiative properties and direct effect of Saharan dust measured by the C-130 aircraft during Saharan Dust Experiment (SHADE): 2. Terrestrial spectrum, J. Geophys. Res., 108, 8578, https://doi.org/10.1029/2002JD002552, 2003.
Johnson, B., Dang, C., Rosinski, J., Ma, Y., and Stegmann, P. G.: JCSDA/crtm: Tagged release for CRTM v2.3 for Zenodo archival and DOI (v2.3.0-Public-Zenodo), Zenodo [code], https://doi.org/10.5281/zenodo.5695707, 2021.
Karyampudi, V. M., Palm, S. P., Reagen, J. A., Fang, H., Grant, W. B., Hoff, R. M., Moulin, C., Pierce, H. F., Torres, O., Browell, E. V., and Melfi, S. H.: Validation of the Saharan dust plume conceptual model using lidar, Meteosat, and ECMWF data, B. Am. Meteorol. Soc., 80, 1045–1075, https://doi.org/10.1175/1520-0477(1999)080<1045:VOTSDP>2.0.CO;2, 1999.
Kim, J., Akella, S., da Silva, A. M., Todling, R., and McCarty, W.: Preliminary evaluation of influence of aerosols on the simulation of brightness temperature in the NASA's Goddard Earth Observing System Atmospheric Data Assimilation System, Tech. Rep. Ser. Glob. Model. Data Assim., vol. 49, TM–2018-104606, Goddard Space Flight Center, National Aeronautics and Space Administration, Greenbelt, Maryland, US, available at: https://ntrs.nasa.gov/citations/20180001946 (last access: 8 February 2022), 2018.
Kleist, D. T., Parrish, D. F., Derber, J. C., Treadon, R., Wu, W. S., and Lord, S.: Introduction of the GSI into the NCEP Global Data Assimilation System, Weather Forecast., 24, 1691–1705, https://doi.org/10.1175/2009WAF2222201.1, 2009.
Liu, Q. and Lu, C.-H.: Community Radiative Transfer Model for Air Quality Studies, in: Light Scattering Reviews, volume 11, edited by: Kokhanovsky, A., Springer Praxis Books, Springer, Berlin, Heidelberg, 67–115, ISBN 978-3-662-49536-0, https://doi.org/10.1007/978-3-662-49538-4_2, 2016.
Liu, Q. and Weng, F.: Advanced doubling-adding method for radiative transfer in planetary atmosphere, J. Atmos. Sci., 63, 3459–3465, https://doi.org/10.1175/JAS3808.1, 2006.
Liu, Q., Han, Y., van Delst, P., and Weng, F.: Modeling aerosol radiance for NCEP data assimilation, in Fourier Transform Spectroscopy/Hyperspectral Imaging and Sounding of the Environment, paper HThA5, OSA Technical Digest Series, Optical Society of America, 11–15 February 2007, ISBN 1-55752-828-4, https://doi.org/10.1364/HISE.2007.HThA5, 2007.
Liu, Z., Liu, Q., Lin, H.-C., Schwartz, C. S., Lee, Y.-H., and Wang, T.: Three-dimensional variational assimilation of MODIS aerosol optical depth: Implementation and application to a dust storm over East Asia, J. Geophys. Res., 116, D23206, https://doi.org/10.1029/2011JD016159, 2011.
Lu, C.-H., da Silva, A., Wang, J., Moorthi, S., Chin, M., Colarco, P., Tang, Y., Bhattacharjee, P. S., Chen, S.-P., Chuang, H.-Y., Juang, H.-M. H., McQueen, J., and Iredell, M.: The implementation of NEMS GFS Aerosol Component (NGAC) Version 1.0 for global dust forecasting at NOAA/NCEP, Geosci. Model Dev., 9, 1905–1919, https://doi.org/10.5194/gmd-9-1905-2016, 2016.
Lu, C.-H., Liu, Q., Wei, S.-W., Johnson, B. T., Dang, C., Stegmann, P. G., Grogan, D., Ge, G., Hu, M., and Lueken, M.: Sample data and fixed files for running fv3aerorad in GSI, Zenodo [data set], https://doi.org/10.5281/zenodo.5736503, 2021.
Lueken, M., Safford, E., Treadon, R., Mahajan, R., Whitaker, J., Derber, J., Kumar, K., Wu, W., Bathmann, K., Tong, M., Li, X., Potts, M., Liu, E., Pondeca, M., Zhu, Y., Collard, A., Jones, E., Hu, M., Carley, J., Kleist, D., Jung, J., Su, X., Thomas, C., Yang, R.., Genkova, I., Ma, Z., Ge., G., Liu, H., Gayno, G., and Nebuda, S.: comgsi/GSI: comgsi.2021-11-29 (comgsi.2021-11-29), Zenodo [code], https://doi.org/10.5281/zenodo.5735601, 2021.
Matricardi, M.: The inclusion of aerosols and clouds in RTIASI, the ECMWF fast radiative transfer model for the infrared atmospheric sounding interferometer, ECMWF Tech. Memo., 474, https://doi.org/10.21957/1krvb28ql, 2005.
Merchant, C. J., Embury, O., Le Borgne, P., and Bellecm, B.: Saharan dust in nighttime thermal imagery: Detection and reduction of related biases in retrieved sea surface temperature, Remote Sens. Environ., 104, 15–30, https://doi.org/10.1016/j.rse.2006.03.007, 2006.
Nalli, N. R. and Stowe, L. L.: Aerosol correction for remotely sensed sea surface temperatures from the National Oceanic and Atmospheric Administration advanced very high resolution radiometer, J. Geophys. Res., 107, 3172, https://doi.org/10.1029/2001JC001162, 2002.
Pagowski, M., Liu, Z., Grell, G. A., Hu, M., Lin, H.-C., and Schwartz, C. S.: Implementation of aerosol assimilation in Gridpoint Statistical Interpolation (v. 3.2) and WRF-Chem (v. 3.4.1), Geosci. Model Dev., 7, 1621–1627, https://doi.org/10.5194/gmd-7-1621-2014, 2014.
Petty, G.: A First Course in Atmospheric Radiation, 2nd edn., Sundog Publishing, Madison, WI, ISBN 978-0-972-90331-8, 2006.
Peyridieu, S., Chédin, A., Tanré, D., Capelle, V., Pierangelo, C., Lamquin, N., and Armante, R.: Saharan dust infrared optical depth and altitude retrieved from AIRS: a focus over North Atlantic – comparison to MODIS and CALIPSO, Atmos. Chem. Phys., 10, 1953–1967, https://doi.org/10.5194/acp-10-1953-2010, 2010.
Pierangelo, C., Chédin, A., Heilliette, S., Jacquinet-Husson, N., and Armante, R.: Dust altitude and infrared optical depth from AIRS, Atmos. Chem. Phys., 4, 1813–1822, https://doi.org/10.5194/acp-4-1813-2004, 2004.
Randles, C. A., da Silva, A. M., Buchard, V., Colarco, P. R., Darmenov, A., Govindaraju, R., Smirnov, A., Holben, B., Ferrare, R., Hair, J., Shinozuka, Y., and Flynn, C. J.: The MERRA-2 Aerosol Reanalysis, 1980 Onward. Part I: System Description and Data Assimilation Evaluation, J. Climate, 30, 6823–6850, https://doi.org/10.1175/JCLI-D-16-0609.1, 2017.
Schwartz, C. S., Liu, Z., Lin, H.-C., and Cetola, J. D.: Assimilating aerosol observations with a “hybrid” variational-ensemble data assimilation system, J. Geophys. Res.-Atmos., 119, 4043–4069, https://doi.org/10.1002/2013JD020937, 2014.
Sokolik, I. N.: The spectral radiative signature of wind-blown mineral dust: Implications for remote sensing in the thermal IR region: The spectral radiative signature of wind-blown mineral dust, Geophys. Res. Lett., 29, 2154, https://doi.org/10.1029/2002GL015910, 2002.
Stegmann, P. G., Tang, G., Yang, P., and Johnson, B. T.: A stochastic model for density-dependent microwave Snow- and Graupel scattering coefficients of the NOAA JCSDA community radiative transfer model, J. Quant. Spectrosc. Ra., 211, 9–24, https://doi.org/10.1016/j.jqsrt.2018.02.026, 2018.
Ukhov, A., Ahmadov, R., Grell, G., and Stenchikov, G.: Improving dust simulations in WRF-Chem v4.1.3 coupled with the GOCART aerosol module, Geosci. Model Dev., 14, 473–493, https://doi.org/10.5194/gmd-14-473-2021, 2021.
Wang, J., Bhattacharjee, P. S., Tallapragada, V., Lu, C.-H., Kondragunta, S., da Silva, A., Zhang, X., Chen, S.-P., Wei, S.-W., Darmenov, A. S., McQueen, J., Lee, P., Koner, P., and Harris, A.: The implementation of NEMS GFS Aerosol Component (NGAC) Version 2.0 for global multispecies forecasting at NOAA/NCEP – Part 1: Model descriptions, Geosci. Model Dev., 11, 2315–2332, https://doi.org/10.5194/gmd-11-2315-2018, 2018.
Weaver, C. J., Joiner, J., and Ginoux, P.: Mineral aerosol contamination of TIROS Operational Vertical Sounder (TOVS) temperature and moisture retrievals, J. Geophys. Res., 108, 4246, https://doi.org/10.1029/2002JD002571, 2003.
Wei, S.-W., Lu, C.-H., Liu, Q., Collard, A., Zhu, T., Grogan, D., Li, X., Wang, J., Grimbine, R., and Bhattacharjee, P.: The impact of aerosols on satellite radiance data assimilation using NCEP global data assimilation system, Atmosphere, 12, 432–451, https://doi.org/10.3390/atmos12040432, 2021.
Wei, S.-W., Lu, C.-H., Johnson, B. T., Dang, C., Stegmann, P., Grogan, D., Ge, G., and Hu, M.: The influence of aerosols on satellite infrared radiance simulations and Jacobians: Numerical experiments of CRTM and GSI, Remote. Sens., 14, 683–702, https://doi.org/10.3390/rs14030683, 2022.
Weng, F.: Advances in radiative transfer modeling in support of satellite data assimilation, J. Atmos. Sci., 64, 3799–3807, https://doi.org/10.1175/2007JAS2112.1, 2007.
Wu, M., Liu, X., Yu, H., Wang, H., Shi, Y., Yang, K., Darmenov, A., Wu, C., Wang, Z., Luo, T., Feng, Y., and Ke, Z.: Understanding processes that control dust spatial distributions with global climate models and satellite observations, Atmos. Chem. Phys., 20, 13835–13855, https://doi.org/10.5194/acp-20-13835-2020, 2020.
Wu, W.-S., Purser, R. J., and Parrish, D. F.: Three-dimensional variational analysis with spatially inhomogeneous covariances, Mon. Weather Rev., 130, 2905–2916, https://doi.org/10.1175/1520-0493(2002)130<2905:TDVAWS>2.0.CO;2, 2002.
Zhang, L., Montuoro, R., McKeen, S. A., Baker, B., Bhattacharjee, P. S., Grell, G. A., Henderson, J., Pan, L., Frost, G. J., McQueen, J., Saylor, R., Li, H., Ahmadov, R., Wang, J., Stajner, I., Kondragunta, S., Zhang, X., and Li, F.: Development and Evaluation of the Aerosol Forecast Member in NCEP’s Global Ensemble Forecast System (GEFS-Aerosols v1), Geosci. Model Dev. Discuss. [preprint], https://doi.org/10.5194/gmd-2021-378, in review, 2021.