the Creative Commons Attribution 4.0 License.
the Creative Commons Attribution 4.0 License.
 | 03 Feb 2021
CoupModel (v6.0): an ecosystem model for coupled phosphorus, nitrogen, and carbon dynamics – evaluated against empirical data from a climatic and fertility gradient in Sweden
Per-Erik Jansson
Annemieke I. Gärdenäs
This study presents the integration of the phosphorus (P) cycle into CoupModel (v6.0, referred to as Coup-CNP). The extended Coup-CNP, which explicitly considers the symbiosis between soil microbes and plant roots, enables simulations of coupled carbon (C), nitrogen (N), and P dynamics for terrestrial ecosystems. The model was evaluated against observed forest growth and measured leaf C∕P, C∕N, and N∕P ratios in four managed forest regions in Sweden. The four regions form a climatic and fertility gradient from 64∘ N (northern Sweden) to 56∘ N (southern Sweden), with mean annual temperature varying from 0.7–7.1 ∘C and soil C∕N and C∕P ratios varying between 19.8–31.5 and 425–633, respectively. The growth of the southern forests was found to be P-limited, with harvested biomass representing the largest P losses over the studied rotation period. The simulated P budgets revealed that southern forests are losing P, while northern forests have balanced P budgets. Symbiotic fungi accounted for half of total plant P uptake across all four regions, which highlights the importance of fungal-tree interactions in Swedish forests. The results of a sensitivity analysis demonstrated that optimal forest growth occurs at a soil N∕P ratio between 15–20. A soil N∕P ratio above 15–20 will result in decreased soil C sequestration and P leaching, along with a significant increase in N leaching. The simulations showed that Coup-CNP could describe shifting from being mostly N-limited to mostly P-limited and vice versa. The potential P-limitation of terrestrial ecosystems highlights the need for biogeochemical ecosystem models to consider the P cycle. We conclude that the inclusion of the P cycle enabled the Coup-CNP to account for various feedback mechanisms that have a significant impact on ecosystem C sequestration and N leaching under climate change and/or elevated N deposition.
- Article
(4011 KB) - Full-text XML
-
Supplement
(880 KB) - BibTeX
- EndNote


Phosphorus (P) is an essential element for photosynthetic plants in terrestrial ecosystems, with the P cycle coupled to carbon (C) and nitrogen (N) fluxes through processes such as decomposition of soil organic matter and nutrient uptake (Lang et al., 2016; Vitousek et al., 2010). A steep increase in the anthropogenic release of C and N to the atmosphere relative to P release has altered plant and soil nutrient stoichiometry, leading to new forcing conditions (Elser et al., 2007; Penuelas et al., 2013). For instance, numerous monitoring studies have revealed increasing N∕P ratios in plants and soils, especially in forests from North America (Crowley et al., 2012; Gress et al., 2007; Tessier and Raynal, 2003) and central and northern Europe (Braun et al., 2010; Jonard et al., 2015; Talkner et al., 2015). Such trends are generally assumed to indicate that these ecosystems are shifting from being N-limited to either co-limited by both N and P or P-limited (Elser et al., 2007; Saito et al., 2008; Vitousek et al., 2010; Du et al., 2020). Human activities are expected to continue increasing atmospheric N deposition; as such, P availability and P cycle dynamics will become progressively more important in regulating the biogeochemistry of terrestrial ecosystems and amplifying feedbacks relevant to climate change, e.g. limiting the growth response of plants to increased temperature (Deng et al., 2017; Fleischer et al., 2019; Goll et al., 2017).
Nevertheless, the P cycle is seldom incorporated into ecosystem model structures. Incorporating the P cycle is essential to improving how global models can assess climate–C cycling interactions (Reed et al., 2015). Most of the process-based models that can simulate P cycling were specifically developed for agricultural systems and focus on the soil processes, e.g. EPIC (Jones et al., 1984, Gassman et al., 2005), ANIMO (Groenendijk et al., 2005), and GLEAMS (Knisel and Turtola, 2000). A few catchment-scale models that focus on surface water quality, e.g. SWAT (Arnold et al., 2012), HYPE (Arheimer et al., 2012), and INCA-P (Jackson-Blake et al., 2016), aim to simulate how crop management influences P leaching and thus consider processes such as nutrient retention, leaching, and transport. The C response to P limitation has recently been studied through several empirical and field studies (Van Sundert et al., 2020; Du et al., 2020). For example, Van Sundert et al. (2020) showed that the productivity of European beech (Fagus sylvestris) forests is negatively related to soil organic carbon concentrations and mineral C∕P ratios. Several global vegetation models have included the P cycle to study how it affects the C cycle (Goll et al., 2012, 2017; Wang et al., 2010; Yang et al., 2014; Zhu et al., 2016; Thum et al., 2019). These P-enabled models differ in how they describe soil P dynamics, i.e. implicitly or explicitly through symbiotic relationships with mycorrhiza and other soil microbes, plant P use, and acquisition strategies, ultimately leading to considerable uncertainty in the C response (Fleischer et al., 2019; Medlyn et al., 2016; Reed et al., 2015). Medlyn et al. (2016) applied six global vegetation models – including two coupled Carbon–Nitrogen–Phosphorus (CNP) models (CABLE and CLM4.0-CNP) – to study how the C cycle of the Eucalyptus-Free Air CO2 Enrichment experiment responds to elevated CO2 (eCO2) levels. The results demonstrated notable variations in predicted net primary productivity ranging from 0.5 % to 25 %. The CNP models that explicitly considered the P dependency of C assimilation predicted the lowest eCO2 response. Yu et al. (2018) included the P cycle in the ForSAFE field-scale biogeochemical model to study the P budget of a southern Swedish spruce forest site. They concluded that internal turnover from mineralisation of soil organic matter affects the P supply more than weathering. Fleischer et al. (2019) demonstrated that four CNP models, when applied to the Amazon forest, provide up to 50 % lower estimates of the eCO2-induced biomass increment than the 10 coupled C–N models. They suggested that the inclusion of flexible tissue stoichiometry and enhanced plant P acquisition could improve the ability of terrestrial ecosystem models to simulate C-P cycle coupling.
Most terrestrial plants live in symbiosis with mycorrhizal fungi to increase the uptake capacity of P, among other nutrients (Smith and Read, 2008). Several studies have shown that the depletion zone around plant roots, which is caused by plant uptake and the immobile nature of mineral P, increases when a plant interacts with mycorrhizal fungi (Bolan, 1991; Schnepf and Roose, 2006; Smith, 2003). Global meta-analysis studies have highlighted that the symbiosis between plants and soil mycorrhizal fungi strongly influences plant P availability and subsequently affects plant growth (Terrer et al., 2016, 2019). Previous research has shown that mycorrhizal fungi can receive between 1 % and 25 % of plant photosynthates and constitute as much as 70 % of the total soil microbial biomass; thus, it is clear that this symbiont has a major impact on soil C sequestration (Averill et al., 2014; Clemmensen et al., 2013; Staddon et al., 2003). Even though there is a well-established link between mycorrhizal fungi and plant P nutrition (Bucher, 2007; Read and Perez-Moreno, 2003; Rosling et al., 2016), this factor is seldom included in ecosystem models (Smith and Read, 2008). To the best of our knowledge, only Orwin et al. (2011) have presented an ecosystem model that considers C, N, and P together with symbiotic fungi. They found that considering organic nutrient uptake by symbiotic fungi in an ecosystem model can significantly increase soil C storage, with this effect being more pronounced under nutrient-limited conditions. In this model, organic nutrient uptake reflects a pathway through which plants can utilise organic nutrients by biochemical mineralisation, either in symbiosis with mycorrhizal fungi or via root exudates (e.g. Schachtman et al., 1998; Gärdenäs et al., 2011; Richardson et al., 2009). However, plant growth is static in the model presented by Orwin et al. (2011); as such, plant–soil or plant–environment interactions are largely ignored. Our model (Eckersten and Beier, 1998; He et al., 2018) also includes a shortcut for nutrient uptake that relies on rhizosphere processes. The assumption is that nutrients released by biochemical mineralisation are instantly taken up by symbiotic microbes and/or the plants, thereby bypassing the soil matrix solution. He et al. (2018) integrated the MYCOFON model (Meyer et al., 2009) into CoupModel v5 to ensure that the symbiosis between plant roots and mycorrhiza would be sufficiently considered and compared the results with a previous implicit representation of N uptake in forest ecosystems with limited N availability. CoupModel v5 assumes that carbohydrates provided by plants are the primary driver of mycorrhizal responses to N availability and that fungal uptake of N will influence host plant photosynthesis. We argued that terrestrial ecosystem models that explicitly consider mycorrhizal interactions should also take into account P cycling due to the significant role of symbiont mycorrhiza for P uptake in P-limited environments. For this reason, we developed a new version of CoupModel that includes the P cycle.
The overall objective of this study was to improve the current understanding of C, N, and P cycle interactions in forest ecosystems by presenting a new scheme for modelling P dynamics. More specifically, the study had the following aims: (1) to present the new CoupModel v6.0, which explicitly includes the P cycle and interactions between the N and P cycles; (2) to estimate the regional C, N, and P budgets of Swedish forests along a climatic and fertility gradient; and (3) to demonstrate how soil N and P availability influence growth, soil C, and nutrient leaching. Hence, we present a new version of CoupModel (v6.0), hereafter referred to as Coup-CNP, which explicitly simulates the P cycle. The key features of the new Coup-CNP model are (1) coupled C, N, and P dynamics; (2) explicit representations of symbiosis between plant roots and mycorrhiza, along with implicit routes through which non-symbiotic microbes contribute to N and P uptake from the soil; (3) flexible CNP stoichiometry for plant components, soil organic matter, and symbiotic microbes; (4) dynamic nutrient demand and uptake, as well as photosynthesis and growth rates, all of which are regulated by N and P availability; and (5) simultaneous uptake of nutrients to roots or symbiotic mycorrhizae from both inorganic and organic pools. The Coup-CNP model was evaluated using four forest regions situated along a climatic and fertility gradient in Sweden that has been considered previously by He et al. (2018) and Svensson et al. (2008).
2.1 Brief description of CoupModel (v5)
The CoupModel platform (coupled heat and mass transfer model for soil–plant–atmosphere systems) is a process-based model designed to simulate water and heat fluxes, along with C and N cycles, in terrestrial ecosystems (Jansson, 2012). The main model structure is a one-dimensional, vertical model, with one or two layers of vegetation (e.g. a tree and field layer, as in this application) on a multi-layered soil profile. The core of the model consists of five sets of coupled partial differential equations that cover water; heat; and C, N, and P cycles (the latter is only included in v6.0). They are numerically solved using an explicit forward difference model scheme (Euler integration; for more details, see p. 400–401 in Jansson and Karlberg, 2011), which means that the current size of a state variable is calculated based on fluxes to and from the state variable during the previous time step. In this application, we used a daily time step for each equation, although a smaller time step was applied for the water and heat calculations during specific events representing peaks in water and/or heat flow, e.g. snow melting, to ensure numerical stability and accuracy. The model is driven by climatic data – precipitation, air temperature, relative humidity, wind speed, and global radiation, i.e. the sum of direct and diffuse shortwave incoming radiation – and can simulate ecosystem dynamics with daily resolution. Vegetation is described using the “multiple big leaves” concept, i.e. two vegetation layers (trees and understorey plants) are simulated taking into account mutual competition for light interception, water uptake, and soil N (Jansson and Karlberg, 2011). The model and technical description (Jansson and Karlberg, 2011) is freely available at http://www.coupmodel.com (last access: 2 December 2020). Furthermore, Jansson (2012) has previously presented CoupModel use, calibration, and validation, while He et al. (2018) introduced an explicit plant–mycorrhizal representation (CoupModel v5).
2.2 Phosphorus cycle representation in CoupModel (v6.0)
Coup-CNP was extended with P cycle representation to enable simulations of coupled C, N, and P dynamics for terrestrial ecosystems while explicitly considering the symbiosis between soil microbes and plant roots. Coup-CNP has P state variables and fluxes representing different plant parts, symbiotic microbes, soil organic P forms (Po, P that is bound to organic C in the soil), and soil inorganic P forms (Pi) (Fig. 1). To clarify the coupling between C, N, and P cycles, the C and N state variables and major N and N+P fluxes are given in Fig. 1.
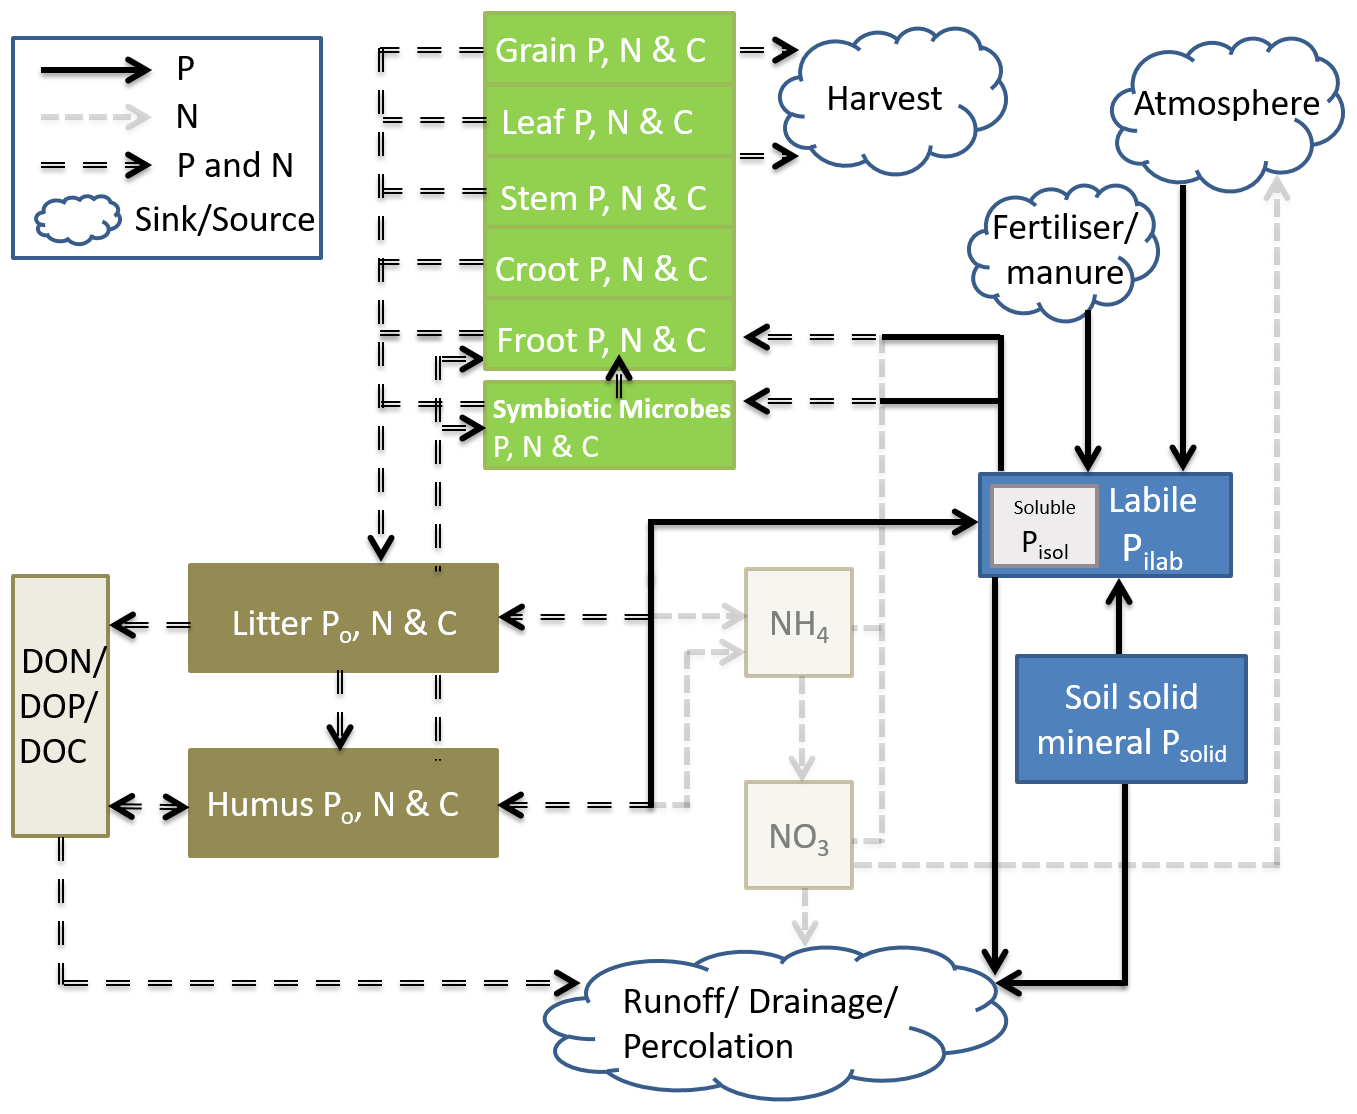
Figure 1Conceptual figure of the simplified Coup-CNP and its relationship to the N cycle. The green pools represent plant-symbiotic microbes (e.g. mycorrhiza fungi), while brown pools represent soil organic matter, grayish-yellow pools represent water solutions, and blue pools represent soil inorganic P. Within the pools, Croot stands for coarse roots and Froot stands for fine roots.
P within plants is partitioned into grain, leaf, stem, coarse root, and fine root, in addition to P in symbiotic microbes, which is analogous to how C and N are represented in CoupModel v5.0 (Fig. 1). In this paper, we use mycorrhizal fungi as the main representation of plant–microbe symbiosis; the same concept is also applicable for other symbiosis microbes. Soil organic P is divided into three state variables in every soil layer – litter (PLitter), humus (PHumus), and dissolved organic (PDOP) – which is analogous to how C and N are represented in CoupModel v2.0 (Fig. 1). Non-symbiosis microbes are implicitly included in litter. Soil inorganic P is represented by both new and renewed state variables. A new state variable is soil solid inorganic P, Psolid, which is a lumped pool containing primary and secondary mineral compounds containing P, such as apatite (and occluded P) (Smeck, 1985; Wang et al., 2007). Pilab is the sum of phosphate ions absorbed by soil and those in soil solution, which follows how the mineral pool is represented in the salt tracer module of CoupModel (Gärdenäs et al., 2006). Instantaneous equilibrium between adsorbed and soil solution P is assumed. Plants and microbes take up phosphate ions from the Pilab pool. Pisol, which is an intrinsic part of Pilab, can be compared with the sum of the N state variables NH and NO (Fig. 1).
We developed the P model in a way that (1) focuses on the P processes that are most relevant to biogeochemical cycling, e.g. dynamic plant growth and P leaching, and (2) follows the conceptual structure of CoupModel as closely as possible. The P processes that are relevant to biogeochemical cycling are described in more detail below. Appendix A further describes processes that are analogous to those of the N cycle, e.g. atmospheric deposition, fertilisation (Sect. A1), mineralisation–immobilisation (Sect. A2), plant growth and uptake (Sect. A3), litterfall (Sect. A4), leaching and surface runoff (Sect. A5), and removal of plant harvest (Sect. A6). For simplicity, the equations are given in a form that reflects one time step and one of the layers of the entire soil profile. This paper has been formatted in a way that conforms to the CoupModel nomenclature; more specifically, a capitalised P refers to state variables while a lower case p refers to parameters that are related to P processes.
2.2.1 Weathering
During weathering soil solid inorganic P (Psolid) is transformed into labile P (Pilab) (Fig. 1; Eq. 1). The weathering rate depends on soil pH and temperature (Guidry and Machenzie, 2000) and is calculated as follows:
where Psolid → ilab is the flux rate of weathering (g P m−2 d−1), and kw is a first-order integrated weathering rate coefficient (d−1) that depends on lithology, rates of physical erosion, and soil properties (Table 3). The erosion affects the weathering rate by reducing the pool size of Psolid (Eq. A14). f(Ts) and f(pH) are response functions of soil temperature and pH, respectively, while Psolid is the size of the Psolid pool (g P m−2), determined by
where δP is the prescribed Psolid content for each soil layer (g P g dry soil−1), with reported ranges from 1 × 10⁻⁴ to 1.5 × 10⁻³ g P g soil−1 (Yang et al., 2014), ρbulk is the dry bulk density of each soil layer (g cm−3), and Δzlayer is the thickness of the simulated soil layer (m).
The temperature effect can be expressed as an Arrhenius function (3), where Ea,wea is the activation energy parameter (J mol−1) for minerals (i.e. apatite; available from empirical studies), R is the gas constant (J K−1 mol−1), Ts is the simulated soil temperature in ∘C, Ts,0 is a parameter (∘C) that normalizes the function f(Ts)=1, and Tabszero is −273.15 ∘C.
Alternatively, the existing Ratkowsky function, O'Neill function, or Q10 method can be used to determine the temperature response in CoupModel.
The effect of soil pH on weathering can be calculated as follows:
where nH is a parameter that describes the sensitivity of the soil to pH changes when it deviates from pHopt, an optimal pH value for weathering (Table 3).
2.2.2 Inorganic soluble phosphorus dynamics
When Pi is added to a soil ecosystem, the soluble (Pisol) and adsorbed P pools reach equilibrium in less than 1 h (Cole et al., 1977; Olander and Vitousek, 2005). As a daily time step is applied to this model, we assume that Pisol and the adsorbed part of Pilab are always in equilibrium (Eq. 5). The modified Langmuir isotherm (Barrow, 1979) was used to model the fast and reversible sorption process within Pilab.
Here Pilab,con is the concentration of labile pool (g P g soil−1), pmax,ads is the maximum sorption capacity of the labile pool (g P g soil−1), and c50,ads is an empirical parameter corresponding to 50 % of P saturation (g P m−2) (Table 3). It should be noted that Pilab,con can also be calculated using Eq. (2) as follows: ).
2.2.3 Soil inorganic phosphorus dynamics and nutrient shortcut uptake
Atmospheric P deposition is assumed to directly flow into the labile inorganic P pool (Pilab) in the uppermost soil layer (Eq. A1 in Appendix A). If mineral Pi fertiliser is applied at the soil surface, the Pi first enters an undissolved fertiliser pool, after which Pi from this pool gradually dissolves into the labile P pool following a decay-type function (Eq. A1). P can also be added as an external organic substrate (faeces or manure). In this case, P moves to the surface faeces (Pofae), litter (PLitter), and labile (Pilab) P pools according to the composition of the manure. Pi within Pisol and dissolved organic P (PDOP) can be transported by water flows between layers or from a layer to a drainage outlet (Eqs. A12–13). The soil surface layer may also lose solid inorganic P (Psolid) by erosion, which is driven by surface runoff (Eq. A14).
P mineralisation is conceptually divided into biological and biochemical mineralisation (Eqs. A2–A6) following McGill and Cole (1981). Biological mineralisation, which is regulated by temperature and moisture, represents the microbe-mediated oxidation of organic matter, during which nutrients (P and N) are immobilised by non-symbiotic microbes or transferred from litter to humus (Fig. 1; Eq. A2). Biochemical mineralisation, on the other hand, describes the release of Pi through extracellular enzymatic action (e.g. phosphatases from root exudates), which is driven by plant demand for nutrients (Richardson and Simpson, 2011). In Coup-CNP, biochemical mineralisation is conceptually included in the shortcut uptake of nutrients (called organic uptake in earlier CoupModel publications) and assumed to be driven by the unfulfilled plant P demand after Pilab root uptake (Eq. A8) but is regulated by the availability in other P pools (i.e. shortcut uptake coefficients in Eq. A4). The assumption is that under P-limited conditions, plant roots and symbiotic fungi bypass Pilab and obtain mineralised Pi directly from organic PLitter and PHumus (Fig. 1; Eq. A4).
2.2.4 Plant growth under phosphorus and nitrogen limitation
Plant photosynthesis is modelled by a “light use efficiency” approach (Monteith, 1965, Eq. 6). We adopted Liebig's law of the minimum to simulate how plants respond to multiple nutrient stress (Liebig, 1840). This approach assumes that the nutrient (N, P) that has the smallest supply relative to the corresponding plant demand will limit growth (Eq. 7).
where Ca→plant is the plant carbon assimilation rate (g C m−2 d−1); εL is the coefficient for radiation use efficiency (g C J−1); f(Tleaf), f(nutrient), and f(Eta∕Etp) are response functions of leaf temperature, leaf nutrient status (Nleaf, Pleaf) in proportion to its C content, and water, respectively; and Rs represents radiation absorbed by the canopy (J m−2 d−1). Details concerning , as well as growth and maintenance respiration, can be found in Jansson and Karlberg (2011). Plant demand for nutrients was estimated through defined optimum ratios (Eq. A9). The nutrient response function f(nutrient), which includes P, is described below.
As is the case with N, the photosynthetic process responds to the leaf C∕P ratio, a dynamic which has been modelled by Ingestad and Ågren (1992). Hence, photosynthesis is not limited by P below an optimum C∕P ratio (pCP,opt), while between pCP,opt and pCP,th the response function decreases linearly until it reaches zero.
Here C∕Pleaf is the actual leaf C∕P ratio and pCP,opt and pCP,th are parameters that vary between plant species (Table 3). The leaf C∕P ratio is calculated at each time step using the leaf state variables C and P.
2.2.5 Symbiotic mycorrhizal fungal growth and phosphorus dynamics
The following section describes the fungal processes that are specific to P. Plant C allocation to mycorrhizal fungi is influenced by soil Pi concentrations. We thus introduce a response function fa→fungi(Pi) to account for reductions in plant C allocation to mycorrhizal fungi when soil Pi concentrations are high, which is analogous to the N response function in He et al. (2018),
where Pisol is the total soluble Pi in the soil (g P m−2) (Eq. 5), and pavail is a reduction parameter (m4 g−2 P) (Table 3). According to Bahr et al. (2015), mycorrhizal fungal biomass decreases when either N or P is added to the system, while the addition of both N and P leads to the most significant decrease. These multiple responses were integrated into the model so that potential fungal growth would decline as a result of either increasing soil N or P.
Here is the defined maximum C flow that plants allocate to fungi (g C m−2 d−1), Ca→root is the total C allocated to both root and mycorrhiza (g C m−2 d−1) (Eq. A10), pfmaxis a parameter that defines the maximum C fraction allocated to mycorrhiza from the total root and mycorrhiza C pool (Table 3), and fa→fungi(Pi), and fa→fungi(N) are response functions that describe how soil N and P availability regulates maximum mycorrhizal fungal growth (Eq. 9).
The actual growth of mycorrhizal fungi, Ca→fungi (g C m−2 d−1), is limited by the defined maximum growth, (Eq. 10) calculated as follows:
where Croot is the total root C content (g C m−2), pfopt is the defined optimum ratio parameter between fungal and root C content (Table 3), Cfungi is the total C content of fungi (g C m−2), and f(Nsupply) and f(Psupply) are response functions of fungal growth to the amount of N and P (both uptake from inorganic pools and shortcut uptake from organic pools) transferred from fungi to plants (Eq. 12). In this way, mycorrhizal fungal growth is also influenced by how efficiently the fungi transfer nutrients to the host plant (Eq. 11). The model follows the assumption that plants provide fungi with C as long as their investment is outweighed by the benefits (i.e. acquired N or P) (Nasholm et al., 2013; Nehls, 2008). We further assume the C investment will be limited by the minimum nutrient supply efficiency provided by fungi. f(Psupply) is calculated as follows:
where is the defined threshold rate of fungal P supply (g P m−2 d−1), below which plant C investment is limited, and pfth is a threshold fraction determined by fungal and plant species (Table 3). Pfungi→plant is the actual mycorrhizal fungal P supply to the plant (g P m−2 d−1) (Eq. 16), and Pilab→root describes plant uptake by roots (g P m−2 d−1) (Eq. A8).
P in the fungal biomass, Pfungi (g P m−2), is calculated as follows:
where fungal P litter production (Pfungi→litter, g P m−2 d−1) is estimated from a first-order rate equation,
where Pfungi stands for fungal P content (g P m−2), plrate is the litterfall rate parameter (d−1) (Table 3), and pfret is a parameter describing the fraction of P retained in fungal tissue during senescence (Table 3).
P transfer from mycorrhizal fungi to plants, Pfungi→plant (g P m−2 d−1), is driven by plant P demand (Eq. A9) after root uptake (Eq. A8) but is regulated by P availability to fungi,
wherePfungiavail is the P that can be acquired by fungi and transferred to the plant (g P m−2), calculated as follows:
where Pfungi is fungal P content (g P m-2) and pcpfungimax is a parameter describing the predefined maximum C∕P ratio of fungal tissue (Table 3). This is based on the assumption that mycorrhizal fungi will only supply the plant with P as long as fungal C demand is fulfilled (Nehls, 2008).
2.2.6 Phosphorus uptake by mycorrhizal fungi
The total and partial uptake of P by mycorrhizal fungi is calculated in a way that is analogous to how He et al. (2018) calculated N uptake by mycorrhizal fungi,
The mycorrhiza is further distinguished into the mycelia, responsible for N and P uptake (both in inorganic forms and nutrient shortcut from organic pools), and the fungal mantle, which covers the fine-root tips (He et al., 2018). Pilab uptake is first limited by the potential uptake rate Pilabpot→fungi (g P m−2 d−1), which is determined by the biomass of fungal mycelia,
where Pilabpot→fungi describes the potential fungal Pi uptake rate (g P m−2 d−1), pi,rate is a parameter that describes the potential mycorrhizal fungal uptake rate of Pi per unit Cfungi (g P g C−1 d−1) (Table 3), and pfmyc is the fraction of fungal mycelia in total fungal biomass (Table 3).
The actual fungal uptake of Pilab, Pilab→fungi (g P m−2 d−1), is calculated based on the potential uptake rate (Eq. 19), which is further regulated by soil Pilab availability,
where f(Pfungiavail) is an availability function determining the fraction of Pilab that fungi can directly obtain (Eq. 21) and f(Pfungidef) is the function determining the deficiency fraction that fungi can possibly uptake, which is determined by the fungal C∕P ratio (Eq. 22),
where piavail defines the fraction of Pilab that can be directly obtained by roots (Table 3; see also Eq. A8), uptf,enh is an enhanced uptake coefficient that accounts for the fact that fungal mycelia have higher uptake efficiency than roots (He et al., 2018).
The function of uptake deficiency fraction, f(Pfungidef), scales the unfulfilled capacity of fungi for P uptake and is calculated as follows:
where pcpfungimin is the defined minimum fungal C∕P ratio parameter (Table 3).
In our model, we assume that Pi derived from the enzymatic hydrolysis of organic Po is directly taken up by fungi (termed nutrient shortcut uptake in this study). Similar to Pilab→fungi (Eq. 20), fungal uptake of PLitter is first limited by the potential uptake rate PLitterpot→fungi (g P m−2 d−1), which is determined by the biomass of fungal mycelia.
Here pLitter,rate is a parameter that describes the potential rate at which fungal mycelia acquire P from soil litter (g P g C−1 d−1) (Table 3). The actual uptake from PLitter to fungi, PLitter→fungi (g P m−2 d−1), is calculated by
where pLitterf is the nutrient shortcut uptake parameter that describes the uptake rate of soil litter PLitter that can be hydrolysed and directly acquired by fungi (d−1) (Table 3), fracP,lit is introduced to ensure that fungal nutrient shortcut uptake is less than the missing plant demand after Pilab uptake, as well as to avoid uptake from only one organic pool, calculated as follows:
where pHumusf is the fungal nutrient shortcut uptake parameter that describes the uptake rate of soil humus PHumus that can be hydrolysed and directly acquired by fungi (d−1). The same approach can be used to quantify fungal P uptake from the humus pool by replacing terms that include the litter P pool with the humus P pool in Eqs. (23), (24), and (25).
The fungal mantle prevents contact between roots and the soil and thereby limits the rate at which roots can directly acquire nutrients from the soil. The plant root Pi uptake response to P availability and the fungal mantle is calculated as follows
where piavail is a parameter that describes the maximum fraction of Pilab that is available for uptake by plant roots, (Eq. A8) (i.e. not covered by the fungal mantle), fm is an uptake reduction parameter that describes cover by the fungal mantle, and m is the mycorrhisation degree; see He et al. (2018).
3.1 Description of the region
The Coup-CNP model was tested on four managed forest regions – Västerbotten (64∘ N), Dalarna (61∘ N), Jönköping (57∘ N), and Skåne (56∘ N) – situated along a climatic, N and P deposition, and fertility gradient across Sweden. These are the same four regions that were investigated by Svensson et al. (2008) and He et al. (2018). An overview of the climatic, geological, plant, and soil characteristics of the four regions is provided in Table 1. In general, the four regions represent a north–south transect characterised by increasing mean air temperature (from 0.7 to 7.1 ∘C), precipitation (613–838 mm), and atmospheric N deposition (1.5–12.5 kg N ha−1 yr−1). The measured annual P deposition ranges from 0.06 to 0.28 kg P ha−1, with the lowest and highest deposition rates observed in the 61 and 57∘ N regions, respectively. To ensure comparability, all sites selected in the four regions are characterised by podzol soil (Jahn et al., 2006) and dominated by Scots pine (Pinus sylvestris) and/or Norway spruce (Picea abies) (Table 1). Soil fertility, indicated by C-to-nutrient ratios, exhibited an increasing trend from north to south; however, the highest soil organic C∕P ratio (thus the poorest P content) was measured in the 61∘ N region (Table 1). Soil mineral P content varied with geology (Table 1). The aqua regia extraction method was used to determine total soil mineral P content from regional till samples collected by the Geological Survey of Sweden (SGU) (Andersson et al., 2014). Samples were taken from the C horizon at a depth of approximately 0.8 m, where the till is generally not disturbed by weathering. In general, Swedish till soils belong to the youngest and least weathered soils in Europe. High total mineral P contents can be found in the southern (i.e. 57 and 56∘ N) and northern parts of the country (i.e. 64∘ N), which include apatite and iron ore districts (Table 1). Total mineral P content in central Sweden (e.g. 61∘ N) is much lower than in other parts due to the occurrence of marine and postglacial clays that cover, for example, the Mälaren region.
Table 1Overview of climatic, geological, plant, and soil characteristics of the four forest regions.
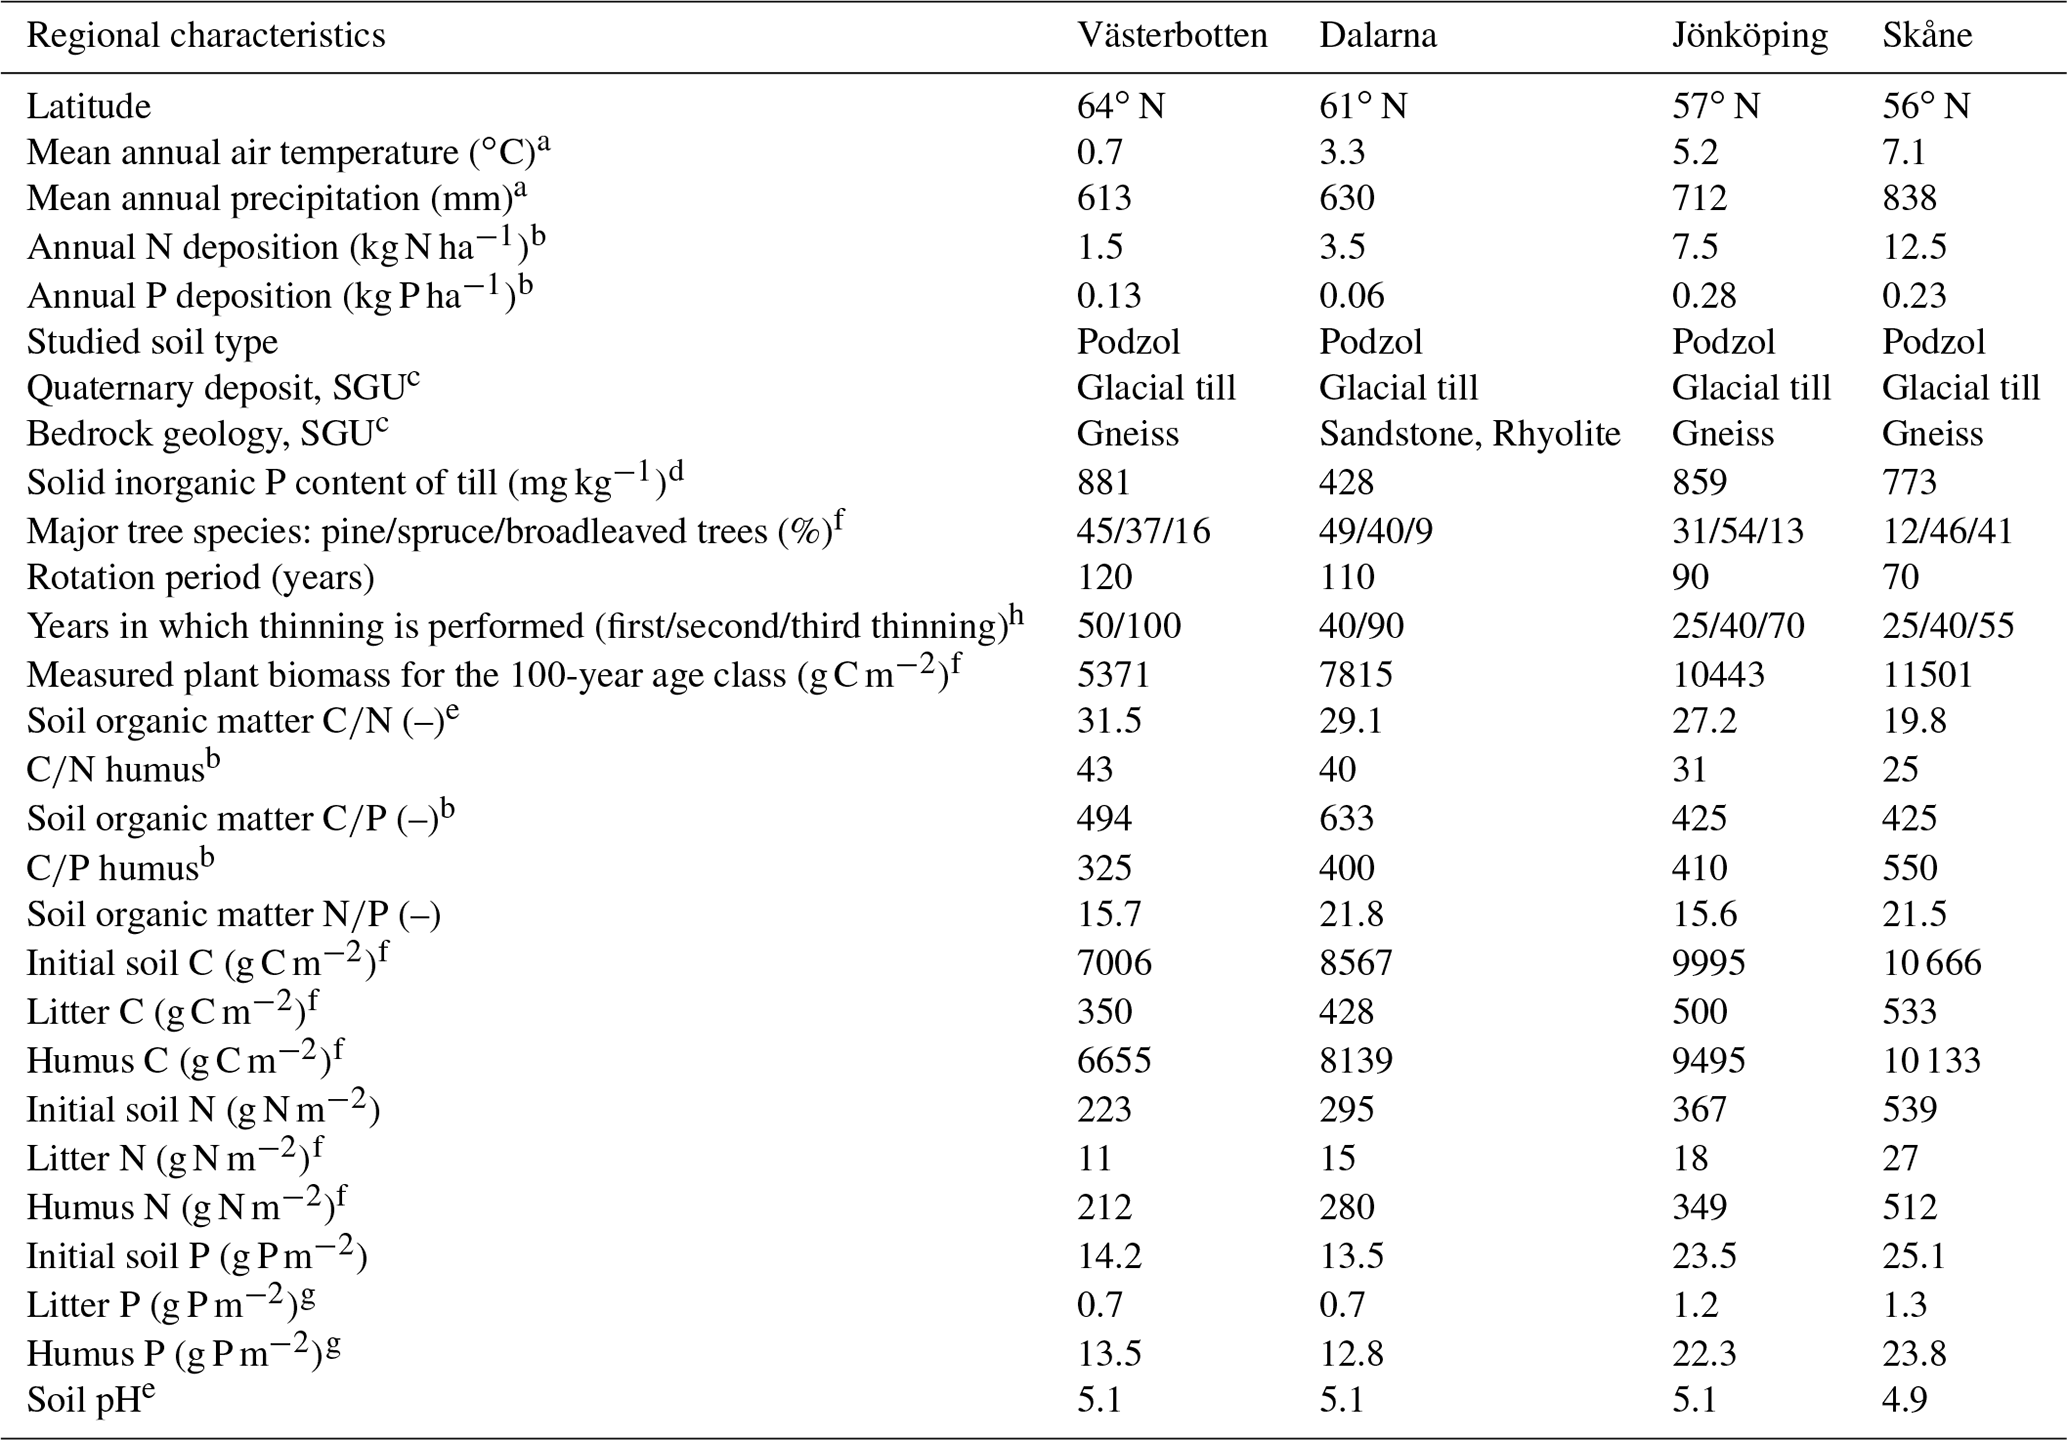
a The 30-year (1961 to 1991) annual average from regional SMHI stations. b N and P deposition data were obtained from the SWETHTRO project, while the soil organic C∕P ratio was estimated with available Swedish Forest Agency data, and data of C∕N and C∕P humus were from the additional survey of Swedish Forest Agency. c Geological Survey of Sweden (SGU), https://apps.sgu.se/kartvisare/ (last access: 21 September 2019). d According to Geochemical Atlas of Sweden (2014), measured till samples from the C horizon, ca. 0.8 m below the soil surface. e Calculated based on Swedish Forest Soil Inventory data (SFSI, https://www.slu.se/en/Collaborative-Centres-and-Projects/Swedish-Forest-Soil-Inventory/, last access: 12 September 2019). f Svensson et al. (2008). g Assumption that 5 % of the total organic pool is litter and 95 % is humus, as reported for N in Svensson et al. (2008). h https://pub.epsilon.slu.se/9266/1/SkogsData2012_webb.pdf (last access: 12 September 2019).
3.2 Datasets for model evaluation
Literature data concerning tree biomass, leaf nutrient content, water flow and P leaching were compiled from sites representing coniferous forests on Podzol soil within the major moisture classes (mesic and moist), according to the Swedish National Forest Soil Inventory (NFSI) (Olsson et al., 2009; Stendahl et al., 2010). The corresponding forest biomass data were based on measured standing stock volumes of different age classes presented in the Swedish Forest Inventory (SFI) (SLU, 2003); for more details, see Svensson et al. (2008).
The leaf nutrient data used in the evaluation were based on measurements from forest monitoring sites of the Swedish Forest Agency (Wijk, 1997; Akselsson et al., 2015) that represented the studied regions (some forest sites are also part of the ICP FOREST LEVEL II monitoring programme, http://www.icp-forests.org, last access: 20 June 2019). The data representing the northern 64∘ N region include two Scots pine stand sites: Gransjö ( N, E) and Brattfors ( N, E). The 61∘ N region was represented by two sites with Scots pine stands: Kansbo ( N, E) and Furudalsbruk ( N, E). The 57∘ N region was represented by the Fagerhult ( N, E) site, which is dominated by Norway spruce, and the Gynge Scots pine stand ( N, E). The data representing the 56∘ N region comprised a Scots pine stand in Bjärsgård ( N, E), a Norway spruce stand in Västra Torup ( N, E), and a European Beech stand in Kampholma ( N, E).
To compare the model outputs with empirical measures of P leaching, PO4 and total P data in stream water were obtained from the open database of environmental monitoring data (MVM, https://miljodata.slu.se/mvm/, lsat access: 2 October 2019). Thus, the observations of P leaching also contain P leaching from upstream sources. DOP was not measured for the regions; instead, DOP was calculated as the difference between the measured total P and PO4. This means that the “measured DOP” may contain both our simulated DOP fractions and particular phosphorus. We used measured water outflow rates from the regional outlet from the Swedish Meteorological and Hydrological Institute (SMHI, https://vattenwebb.smhi.se/station/, last access: 2 October 2019) to convert the concentrations into fluxes.
3.3 Model design and setup
The results were based on simulated forest development with daily resolution over a rotation period from a stand age of 10 years to 10 years after final harvesting. The 10 years after final harvesting, as per recommendations from Gärdenäs et al. (2003), were included to cover potential nutrient leaching during the regeneration phase. The trees across all of the investigated regions were assumed to have been planted in 1961; thus, the period from 1961 to 1970 was used as a spin-up period. The harvesting intensities and rotation lengths were specified for each region following recommendations from SLU (2012). The simulated rotational period was 120, 110, 90, and 70 years from the northern to southern regions, respectively. Two thinnings were conducted in the two northern regions, while three thinnings were conducted in the two southern regions (Table 1). Following general forest management guidelines, it was assumed that 20 % of the stems are removed and that 5 % is transformed into litter during thinning (Swedish Forest Agency, 2005). For leaves and roots, it was assumed that 25 % is transformed into litter. For all of the regions, one clearance – during which 60 % of the stand is removed – was applied at the end of the spin-up period, i.e. when the stand is 10 years old. During final felling, 5 % of trees remain intact, and it was assumed that 90 % of the stems are harvested – with 5 % becoming litter – and that all of the leaves and roots become litter.
3.4 Model forcing and initial and boundary conditions
Historical weather data were derived from the nearby SMHI weather station data through spatial interpolation for each region. Projections of future weather data were generated by the climate change and environmental objective (CLEO) project, using ECHAM5 projections and bias correction of regional climatic data (Thomas Bosshard, SMHI, personal communication, 2019). Concerning P deposition, the P deposition rate from each region (Table 1) was kept constant over the simulation period, as was also the case for N deposition.
As was performed by Svensson et al. (2008), an 11.3 m deep soil profile containing 20 layers was simulated for all four regions. An assumed constant heat flow was used to define the lower boundary condition for heat, and no water flow was assumed at the bottom soil layer. Part of the model setup and initial conditions, e.g. soil physical properties, drainage, initial soil C content, and C∕N ratio, followed what was reported by Svensson et al. (2008), who also relied on National Swedish Forest Inventory (NSFI) data. He et al. (2018) additionally described explicit mycorrhizal fungi settings. The following section will only describe the initial conditions for the newly developed P model.
The two vegetation layers were initialised as bare ground with small amounts of C, N and P from the seedling phase to the start of vegetation growth. The initial solid inorganic P content, soil organic matter content, and soil stoichiometry conditions are reported in Table 1. The initial soil organic P pool (Table 1) was partitioned between the soil litter (5 %) and humus pools (95 %), which is analogous to N partition in Svensson et al. (2008). The total amount of soil organic P decreased exponentially with depth (Fransson and Bergkvist, 2000). Litter and humus were assumed to be distributed down to depths of 0.5 and 1 m, respectively. The initial labile Pi concentrations were set according to previous data from similar Swedish forest sites (Kronnäs et al., 2019; Fransson and Bergkvist, 2000). Soil pH was set according to the NSFI data and kept constant over the simulation period (Table 1). The initial value of soil organic P for the soil profile was estimated based on measurements of soil organic matter N∕P ratios from the same forest monitoring sites of the Swedish Forest Agency (Wijk, 1995; Akselsson et al., 2015) at which leaf nutrient content had been sampled. However, only the organic N∕P ratio at the O horizon was measured at most sites (Table 1). Thus, in our calculations of the total stock of soil organic P, we assumed that the mean N∕P ratio measured for the O horizon also extends to the other horizons in the default model run. Model uncertainties associated with this assumption were assessed by including various soil N∕P ratios (10–25) in the sensitivity analysis (e.g. Fig. 5).
3.5 Sensitivity analysis
The C and N parameters for these regions have been calibrated in previous versions of CoupModel (Svensson et al., 2008), while the parameters describing fungal processes, humus decomposition rate, and shortcut N uptake rate from the humus pool were calibrated by He et al. (2018) (Table 2). The surface cover parameters and litterfall rates of understorey vegetation were modified from Svensson et al. (2008) to achieve more realistic understorey dynamics for the analysed regions (Table 3). Most of the default values of the newly introduced P parameters were derived from the literature (Table 3). For instance, the optimal leaf C∕P ratios for forest growth and the C∕P ratios of individual plant components were obtained from empirical measurements from Swedish forests (e.g. Thelin et al., 1998, 2002). The weathering and surface runoff parameters were defined according to data from laboratory experiments (Guidry and Machenzie, 2000).
Table 2Parameters with specific values for different regions.

a From He et al. (2018). b A high shortcut P uptake rate was assumed for regions with high soil organic matter C∕P ratios
We conducted a global sensitivity analysis of various parameterisation schemes (n=34) for the new Coup-CNP model using a Monte Carlo-based sensitivity analysis method to assess the stability and robustness of the model with respect to its parameter values. The sampled parameters and their ranges (Table S1), model design, and global sensitivity results (Tables S2, S3, S4) are reported in detail in the Supplement. Based on these simulations and parameter sensitivity rankings, we selected the three parameters that had the strongest effect on the model outcome to serve as the basis for a new set of model runs – which underlie the sensitivity analysis results discussed in this paper. These three parameters are initial soil humus P, the shortcut N uptake rate, and the shortcut P uptake rate (Tables S2, S3, Table 2), all of which strongly regulate soil N and P availability. The sensitivity of plant growth, soil C, and leaching losses in response to soil N and P availability was then assessed by varying the soil N∕P ratio from 10 to 25 for the study regions (see Table 2 and Fig. 5). These ranges were set according to previously published Swedish forest soil data (Lagerström et al., 2009; Giesler et al., 2002; Kronnäs et al., 2019) and additional soil humus P data from the Swedish Forestry Agency inventory (Table 1). The ranges of the shortcut uptake coefficients for N and P were based on regional minima and maxima for N and P shortcut uptake rates (Table 2).
4.1 Model assessment
The new Coup-CNP model was able to reproduce the observed development of forest tree biomass (SLU, 2003) over the rotation period well (Fig. 2). It should be noted that the dips in the simulated biomass are related to the timing of forestry operations in the model that are not represented in the empirical measurements. The regional biomass data show an increasing trend from north to south, which the model captured clearly (Fig. 2). However, when the predictions were compared with observed plant biomass prior to final harvesting, the model showed a slight underestimation (12 %) for the northern 61∘ N region and slight overestimations for the other regions (7 %, 13 %, and 1 % for the 64, 57, and 56∘ N regions, respectively).
Table 3Parameters used for the default model run for the P processes with common values across all four studied regions. Note that the same parameter values were applied for tree and understorey layers unless otherwise specified.
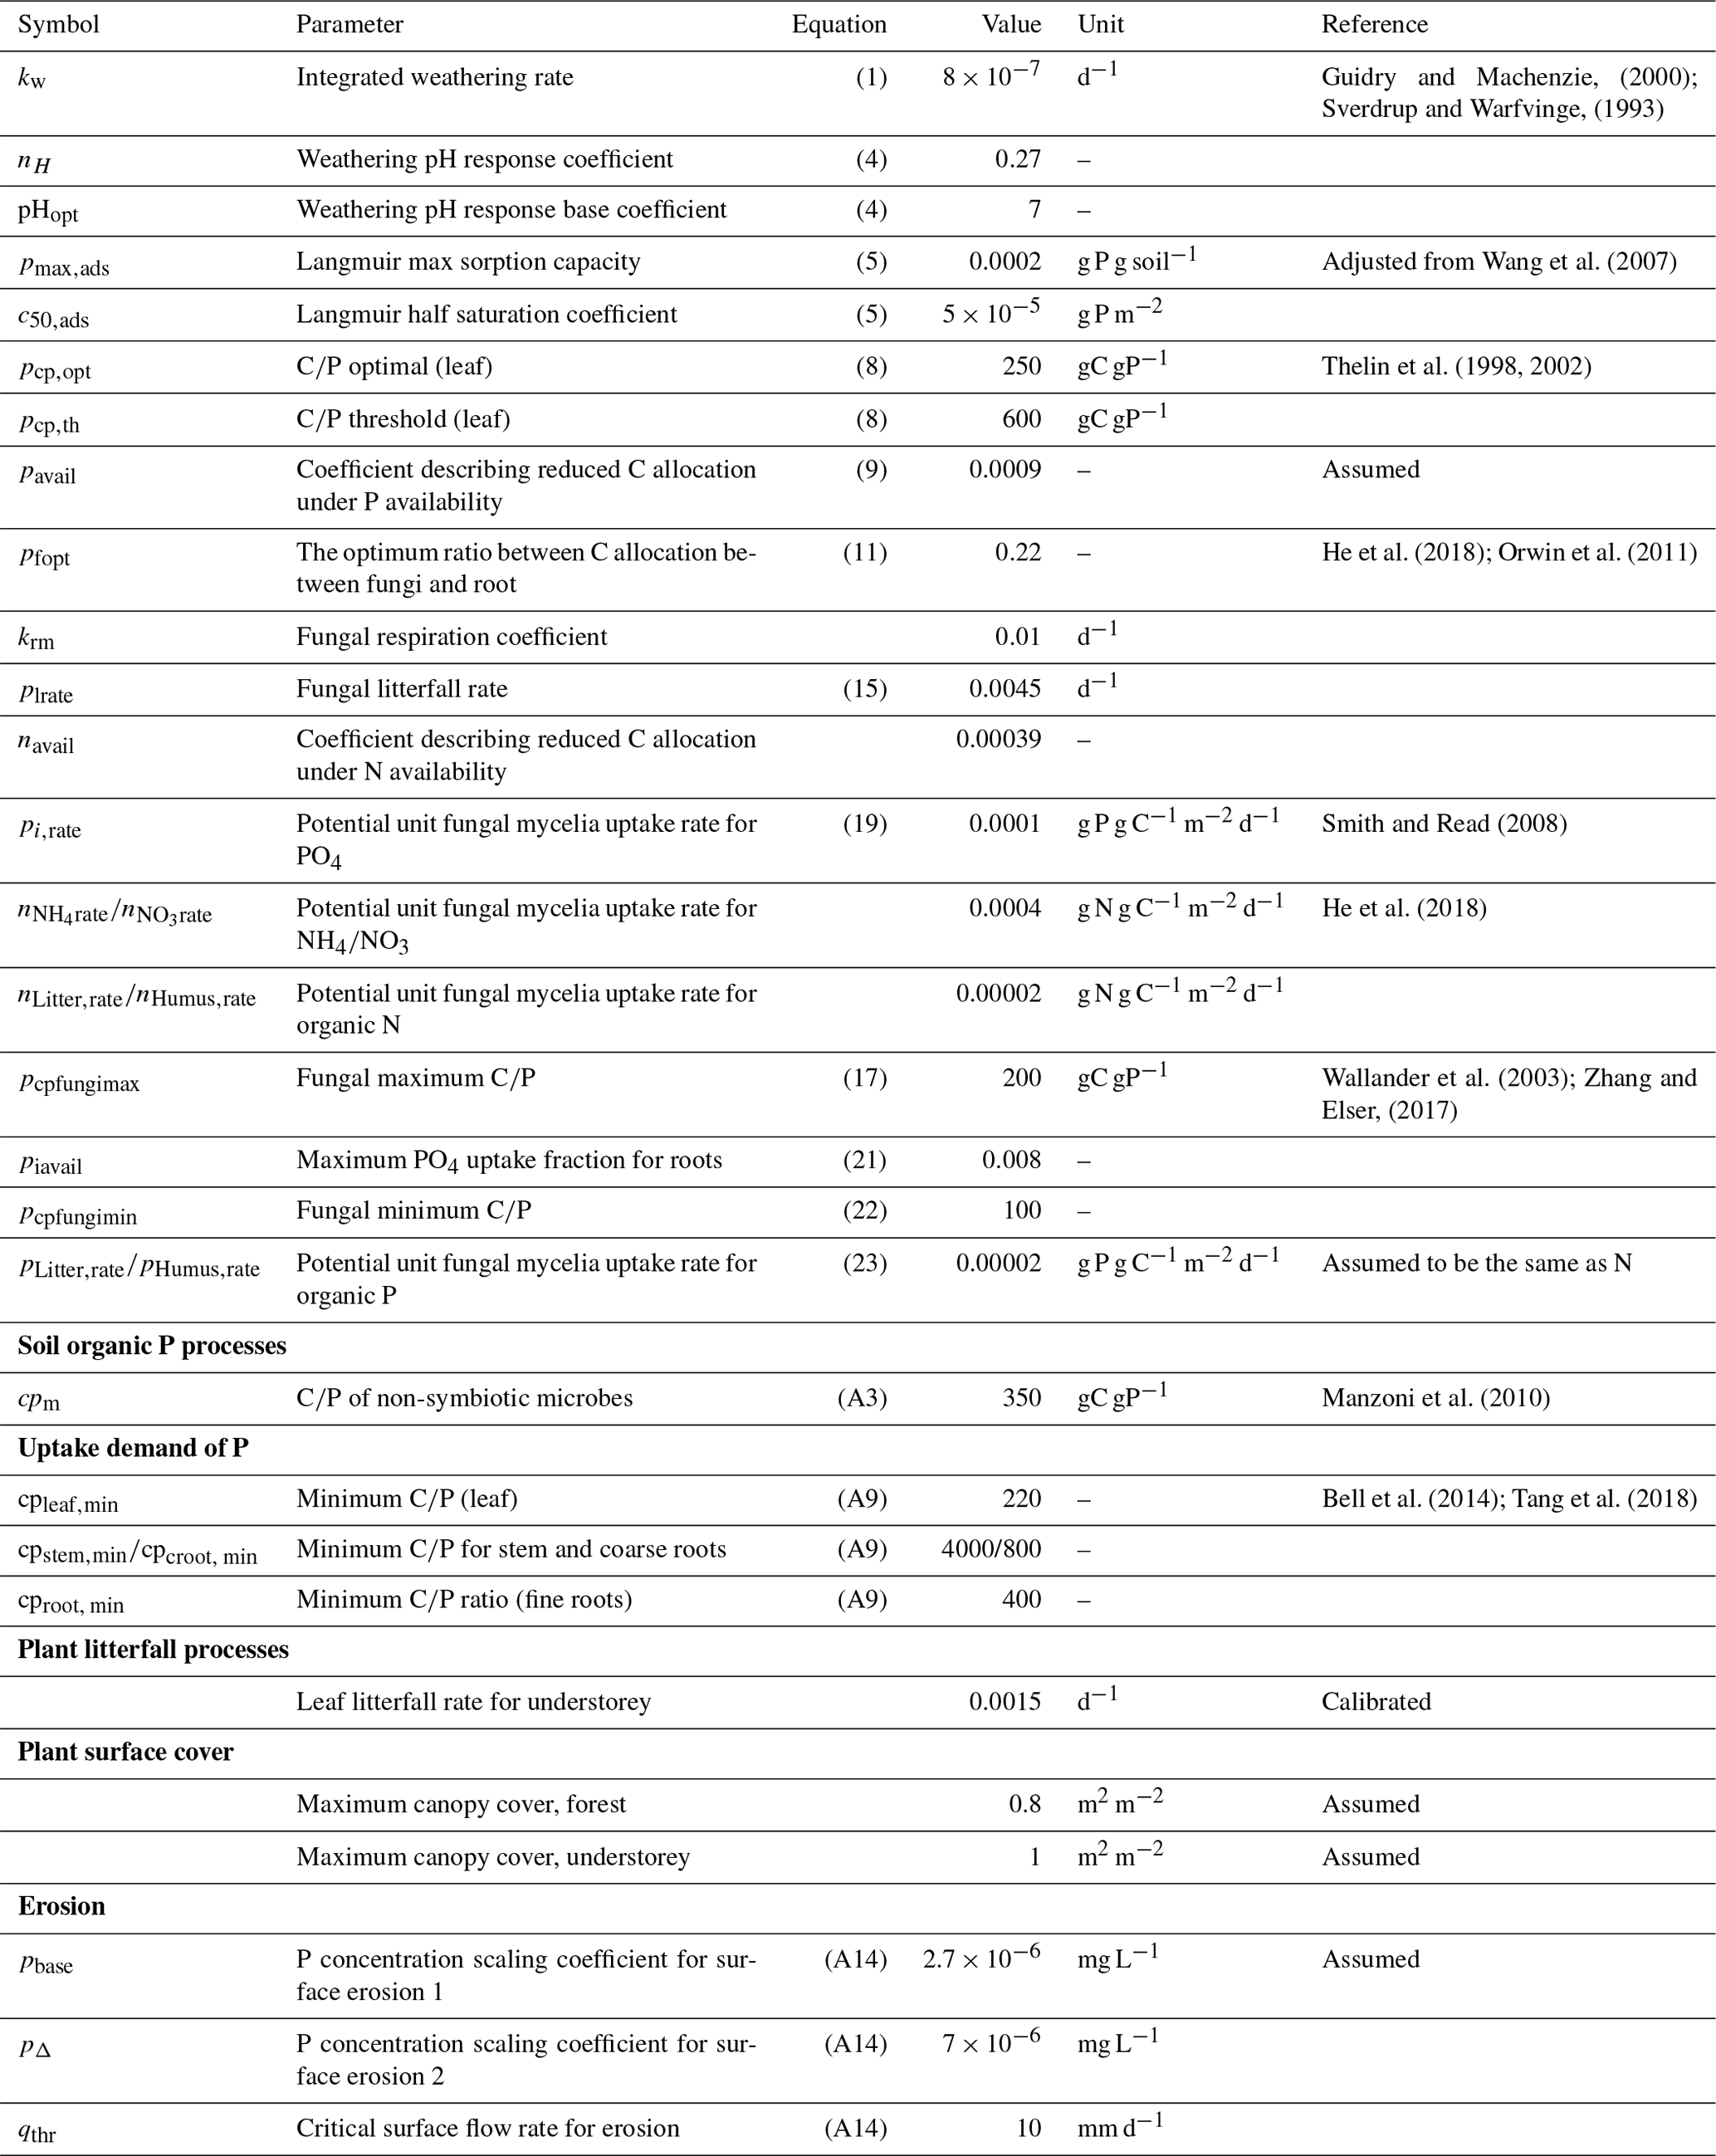
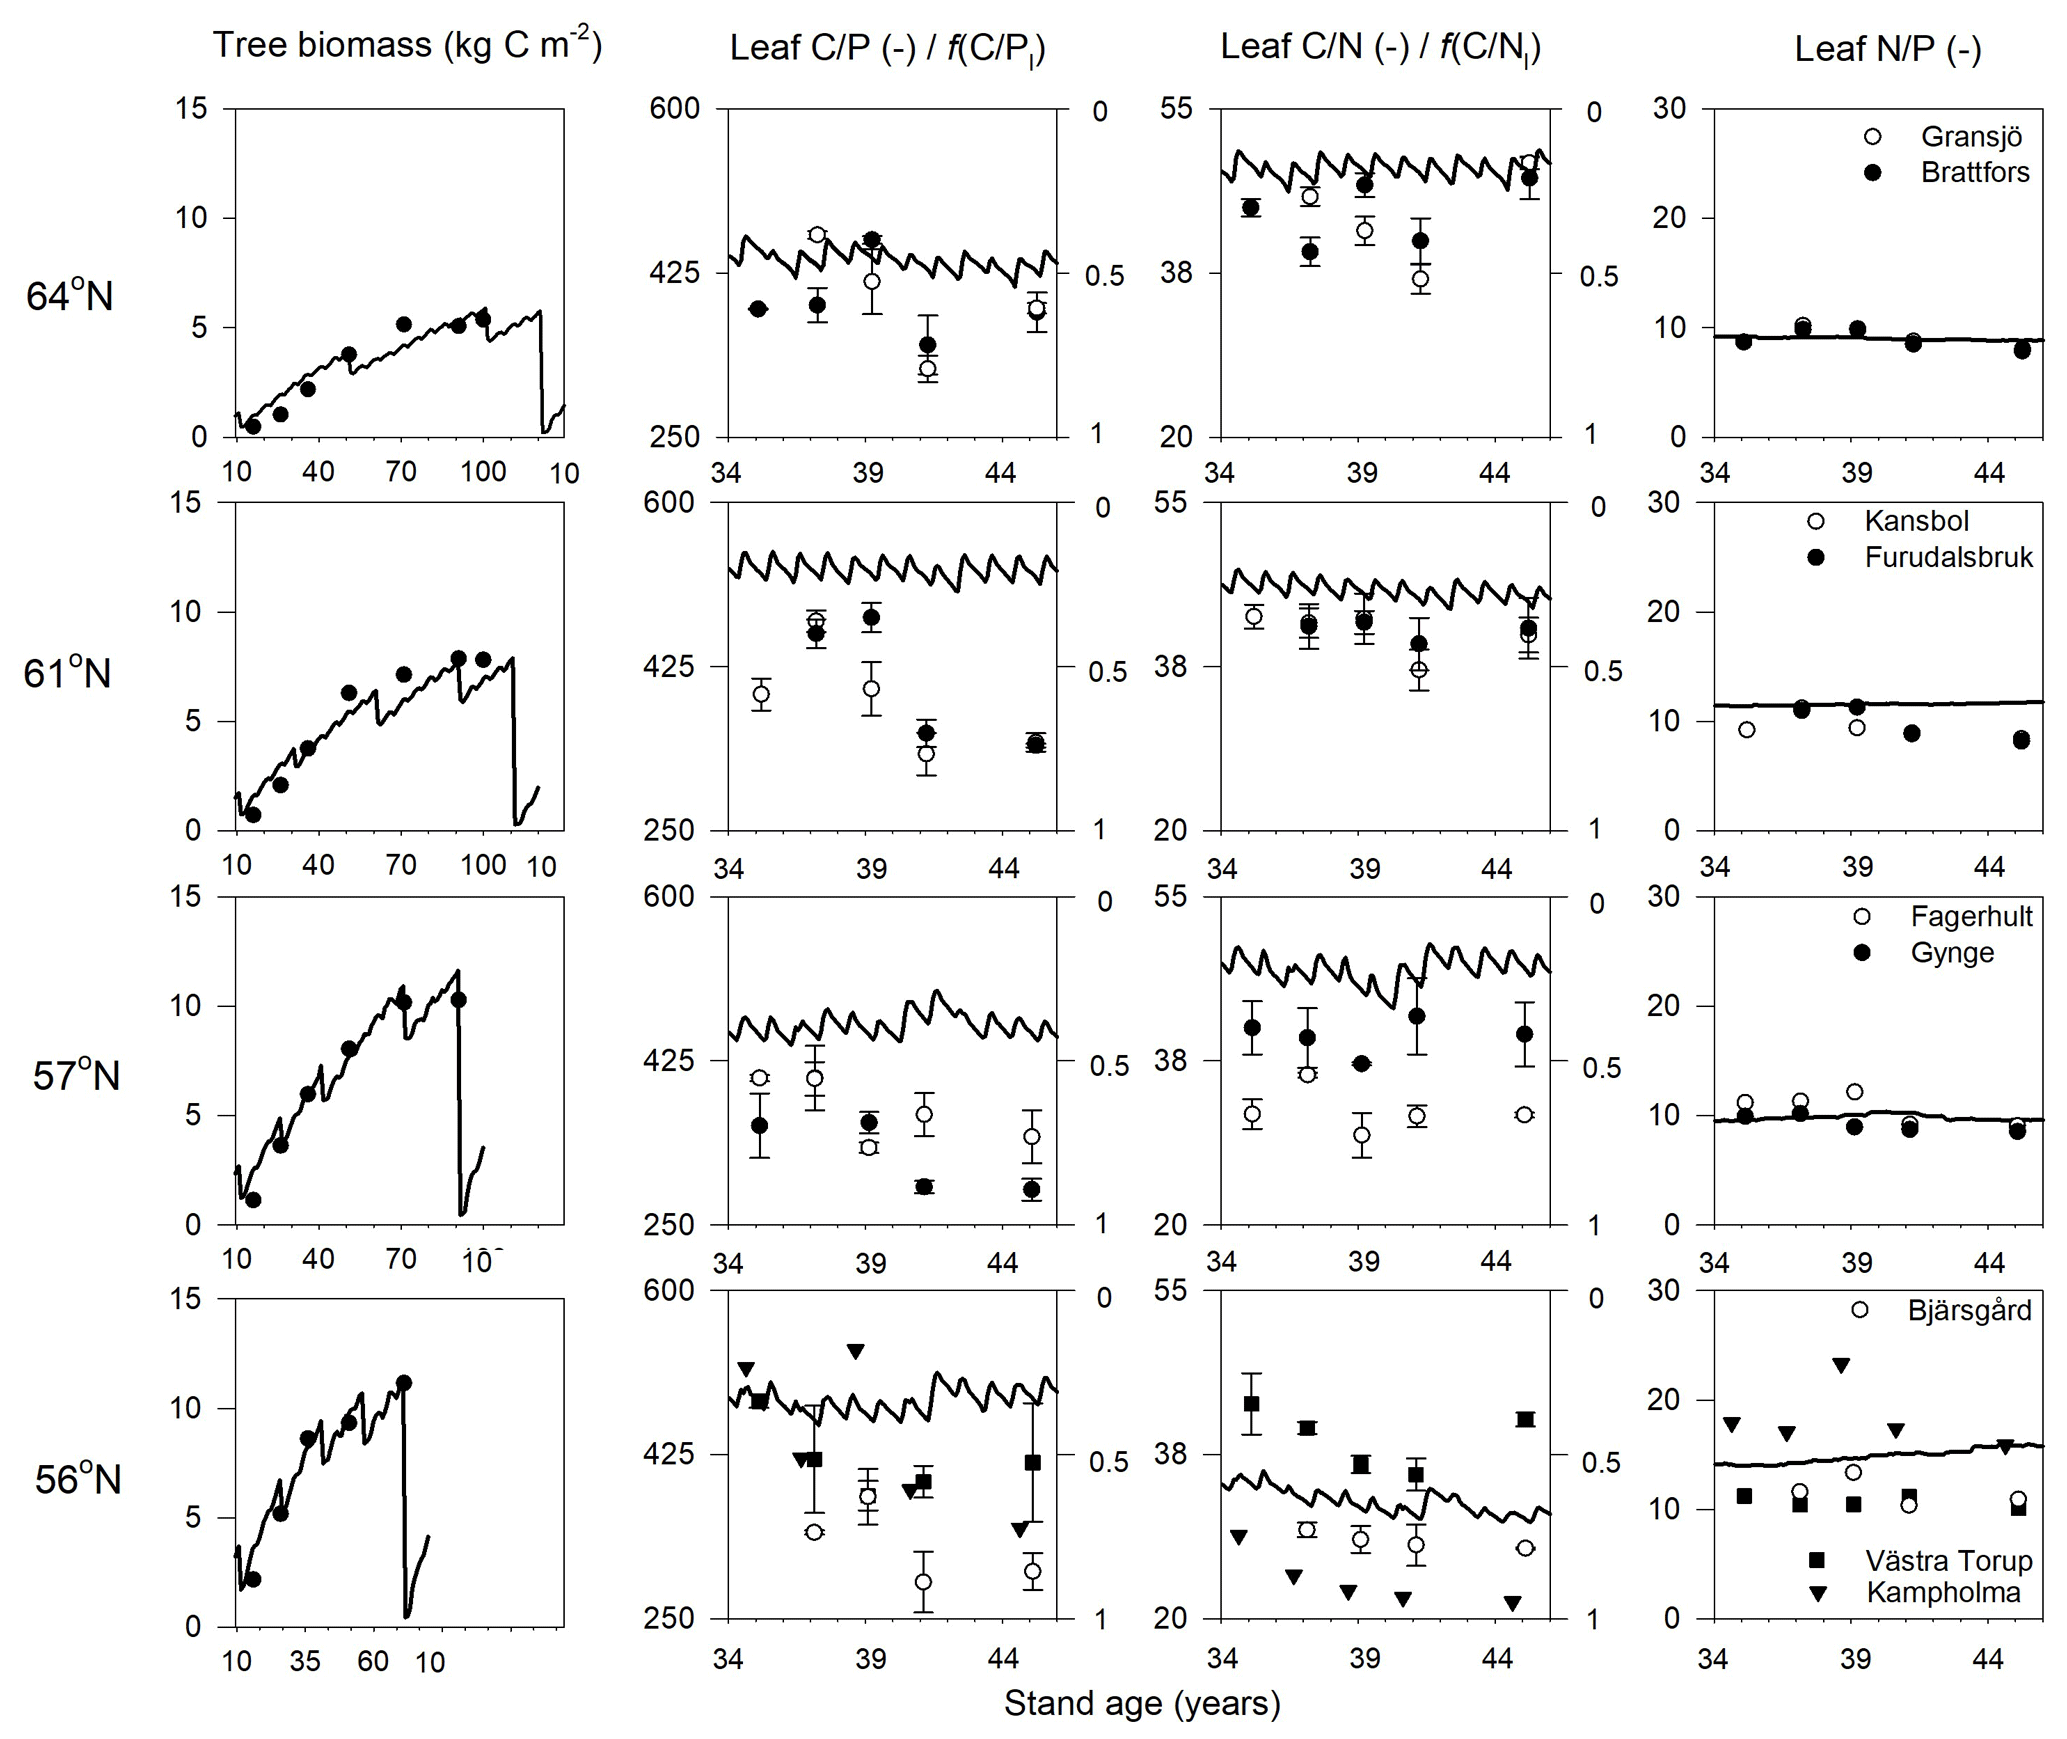
Figure 2Simulated (lines) and measured (symbols) plant biomass and leaf C∕P, C∕N, and N∕P ratios over the rotation period across the four regions. The x axis denotes the stand age in years. The right axis of charts showing leaf C∕P and C∕N ratios shows the minimum (f(nutrient)=0) and optimum (f(nutrient)=1) values in terms of nutrient response to gross primary production, respectively. Biomass data and leaf nutrient data were from SFI (SLU, 2003) and the Swedish Forest Agency.
The simulated leaf C∕P ratios agree fairly well with the available Swedish Forest Agency data (Wijk, 1997; Akselsson et al., 2015), despite a general overestimation of 10 %, 32 %, 30 %, and 21 % from north to south. The average measured leaf C∕P ratio across the four regions was 396 (standard deviation 48), 398 (59), 355 (45), and 396 (72) from north to south. The model found that the 56 and 61∘ N regions have higher C∕P ratios than the other regions, which can also be seen from the observational data (Fig. 2). The average measured leaf C∕N ratios across the four regions were 44 (4), 41 (3), 36 (5), and 31 (7) from north to south. As such, the model provided accurate simulations of leaf C∕N ratios and captured a decreasing leaf C∕N trend from north to south. The exception was a slight leaf C∕N overestimation for the 57∘ N region (Fig. 2). Regarding leaf N∕P ratios, the average values across the regions – from north to south – were 9.1 (1), 9.6 (1.3), 9.9 (1.4), and 13.4 (3.8), respectively. As such, the Coup-CNP model was also able to accurately reproduce the measured leaf N∕P ratios, revealing that leaf N∕P increases as the latitude decreases (Fig. 2). In terms of the climatic variables, the radiation absorbed by the tree canopy increased from north to south, while the temperature and water limitation of gross primary production (GPP) declined from north to south (Table 4). Forest growth in the 64 and 57∘ N regions were primarily limited by N, while forest growth in the 61 and 56∘ N regions was predominantly limited by P (Table 4). The limiting effect of P availability could be seen in the relatively high predicted N∕P ratios, as the 56∘ N region – and to a lesser extent the 61∘ N region – showed high N∕P ratios (Fig. 2).
Table 4Summary of the plant–fungal internal C, N and P variables (shown as average values over the rotations period) of the simulated forest ecosystems. Bold values indicate a limiting factor for GPP, according to Liebig's law of the minimum. The scale describing the response on GPP includes temperature, water, and N and P ranges from 0 (no assimilation) to 1 (optimal growth conditions).
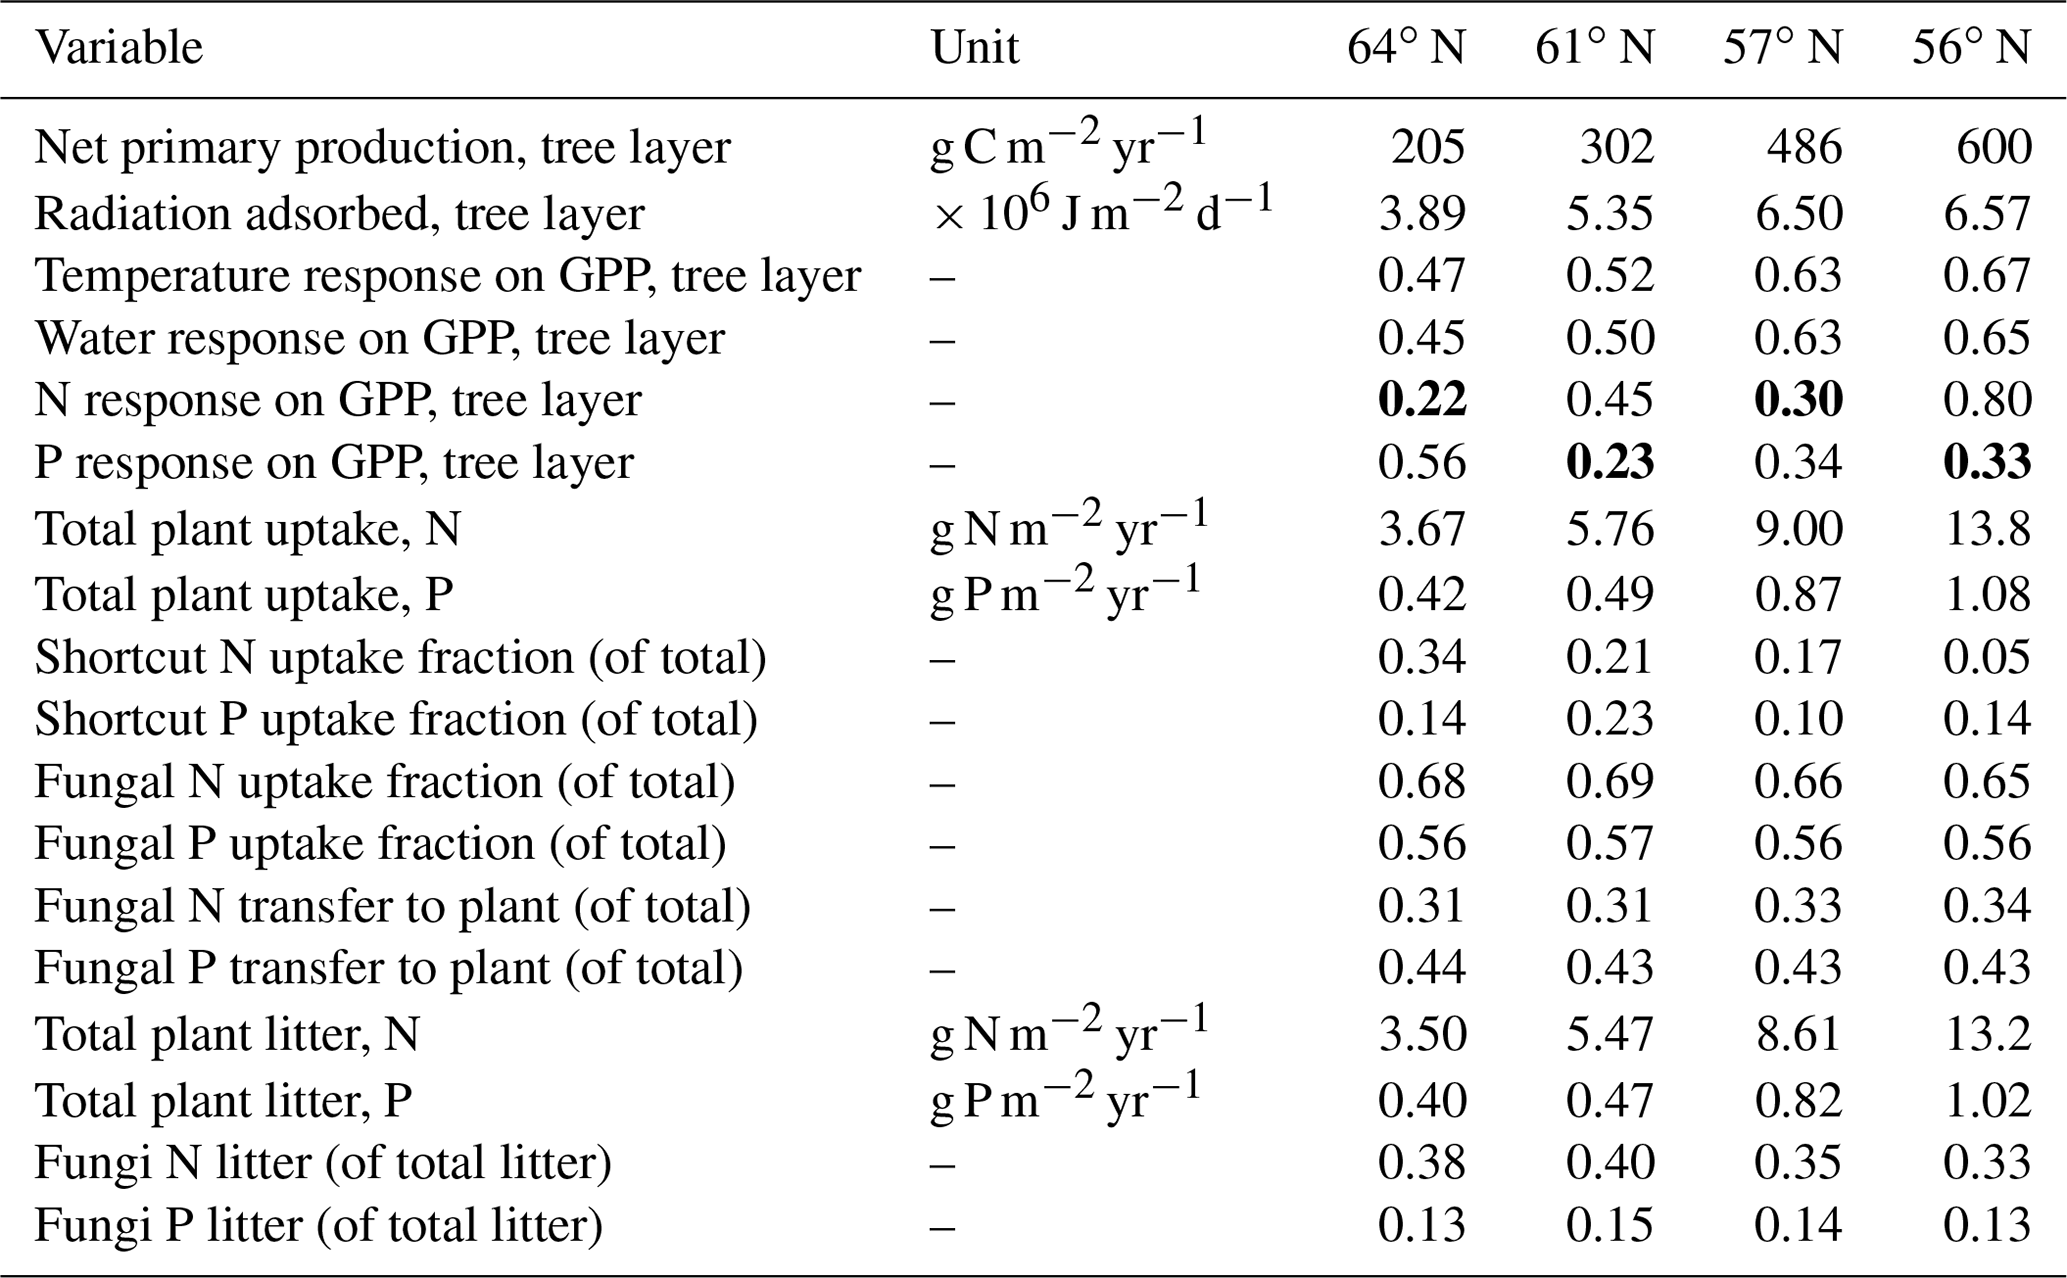
Total annual plant N and P uptake rates in the northernmost region were modelled to be 3.7 g N m−2 yr−1 and 0.4 g P m−2 yr−1. The southernmost region demonstrated N and P uptake rates that were 3 and 2 times higher, respectively, than what was modelled for the northernmost region (Table 4). Total N uptake via shortcut uptake from the organic N pools decreased from north to south (Table 4). The modelling results also indicated that shortcut uptake of P is necessary to satisfy the demands of the plant. However, the fraction of total P uptake from the shortcut pathway was found to be associated with neither latitude nor C∕N ratio. Instead, it is regulated by soil C∕P ratio and geology (Tables 1 and 5). The contribution of fungi to total N litter production decreased from north to south, but this was not the case for P, as fungi contributed a stable amount to the P litter pool across all four regions (Table 4).
The simulated annual soil C sequestration rates were 2, −2, 9, and 15 g C m−2 yr−1 from north to south, respectively (Figs. 3a, 4a, Table 5). Thus, the soil C stock was generally in a steady state over the forest rotation period, with slightly higher C sequestration rates predicted for the southern regions (Figs. 3a, 4a). The soil C∕N ratios of all of the regions were in a steady state over the forest rotation period. In contrast, the C∕P ratios and N∕P ratios showed a slightly increasing trend over the rotation period, with the exception of the soil N∕P ratio in the 64∘ N region (Fig. 3b, c, d).
Table 5Simulated annual average soil C changes (g C m−2 yr−1), positive mean sequestration, negative mean losses), including comparison with previously reported results. Values in parentheses indicate uncertainties due to certain model parameters.

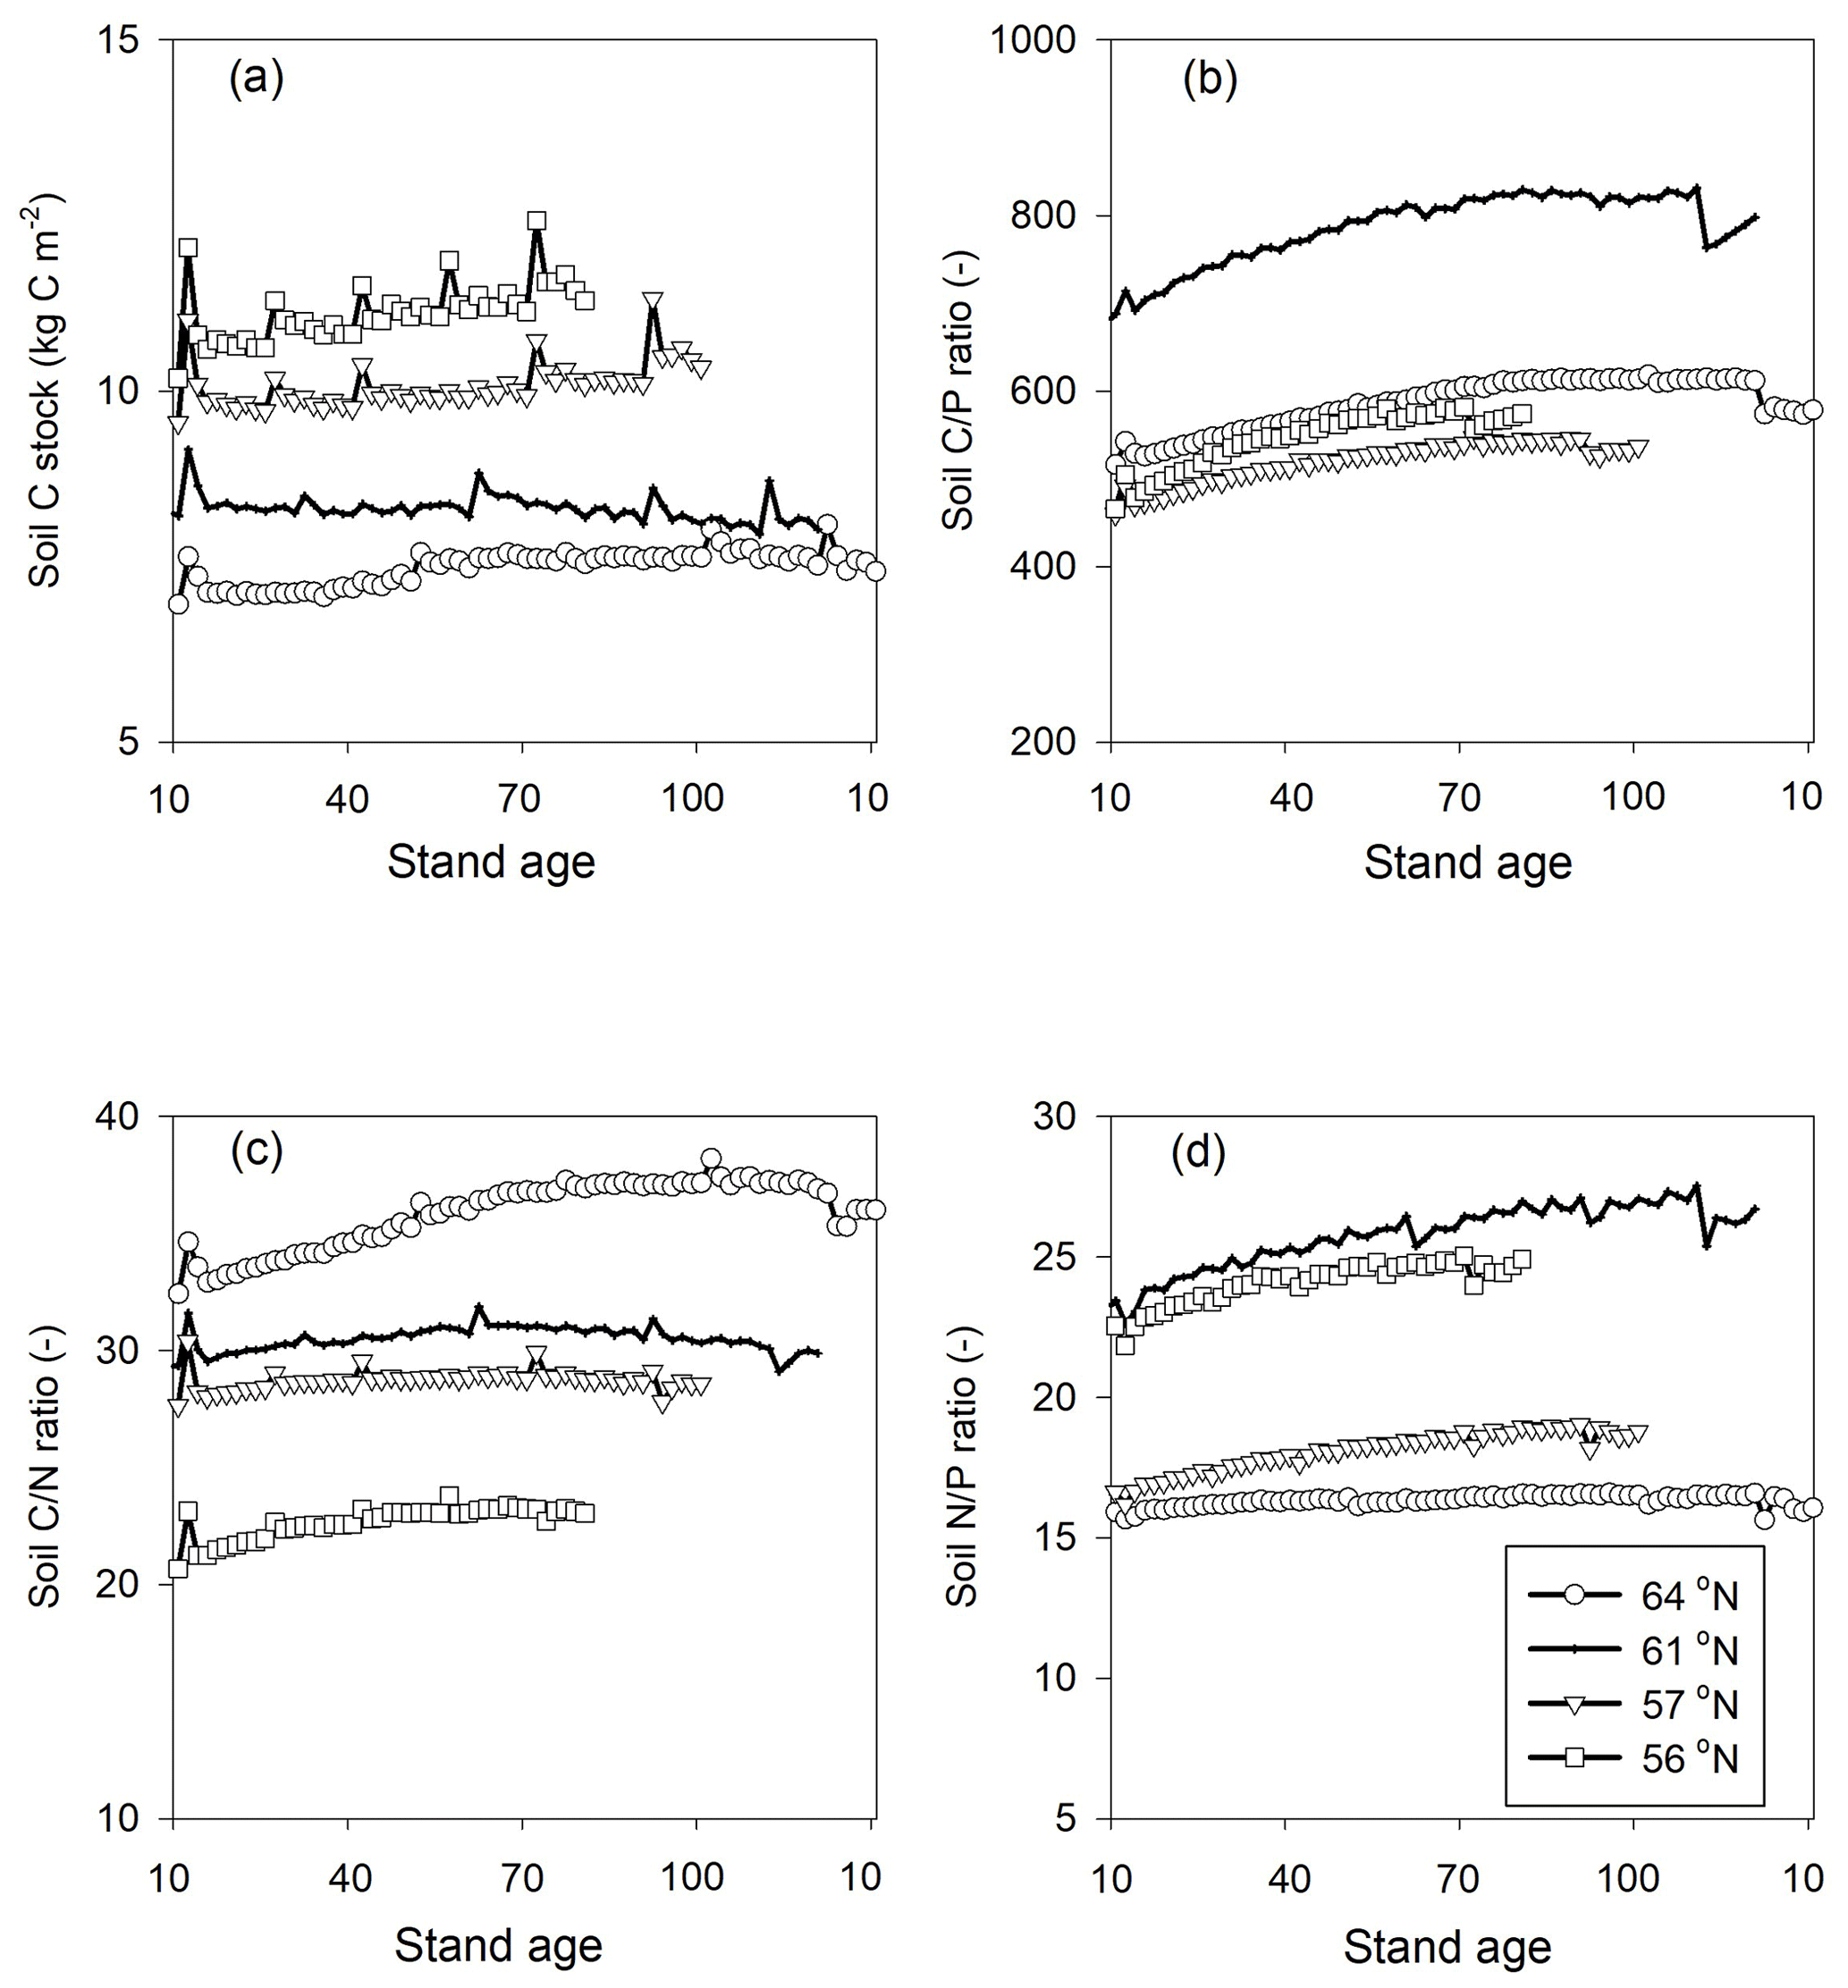
Figure 3Simulated (a) soil C stocks and (b) soil C∕P, (c) soil C∕N, and (d) soil N∕P ratios over the rotation period (i.e. from the relative age of 10 years to 10 years after the final harvest). The rotation period increases from southern to northern Sweden, and the small peaks in soil C were related to forest operations, which were more frequent in southern Sweden. A clearance at year 10 was conducted across all four sites. Thinnings varied from four in southern regions to two in northern regions.
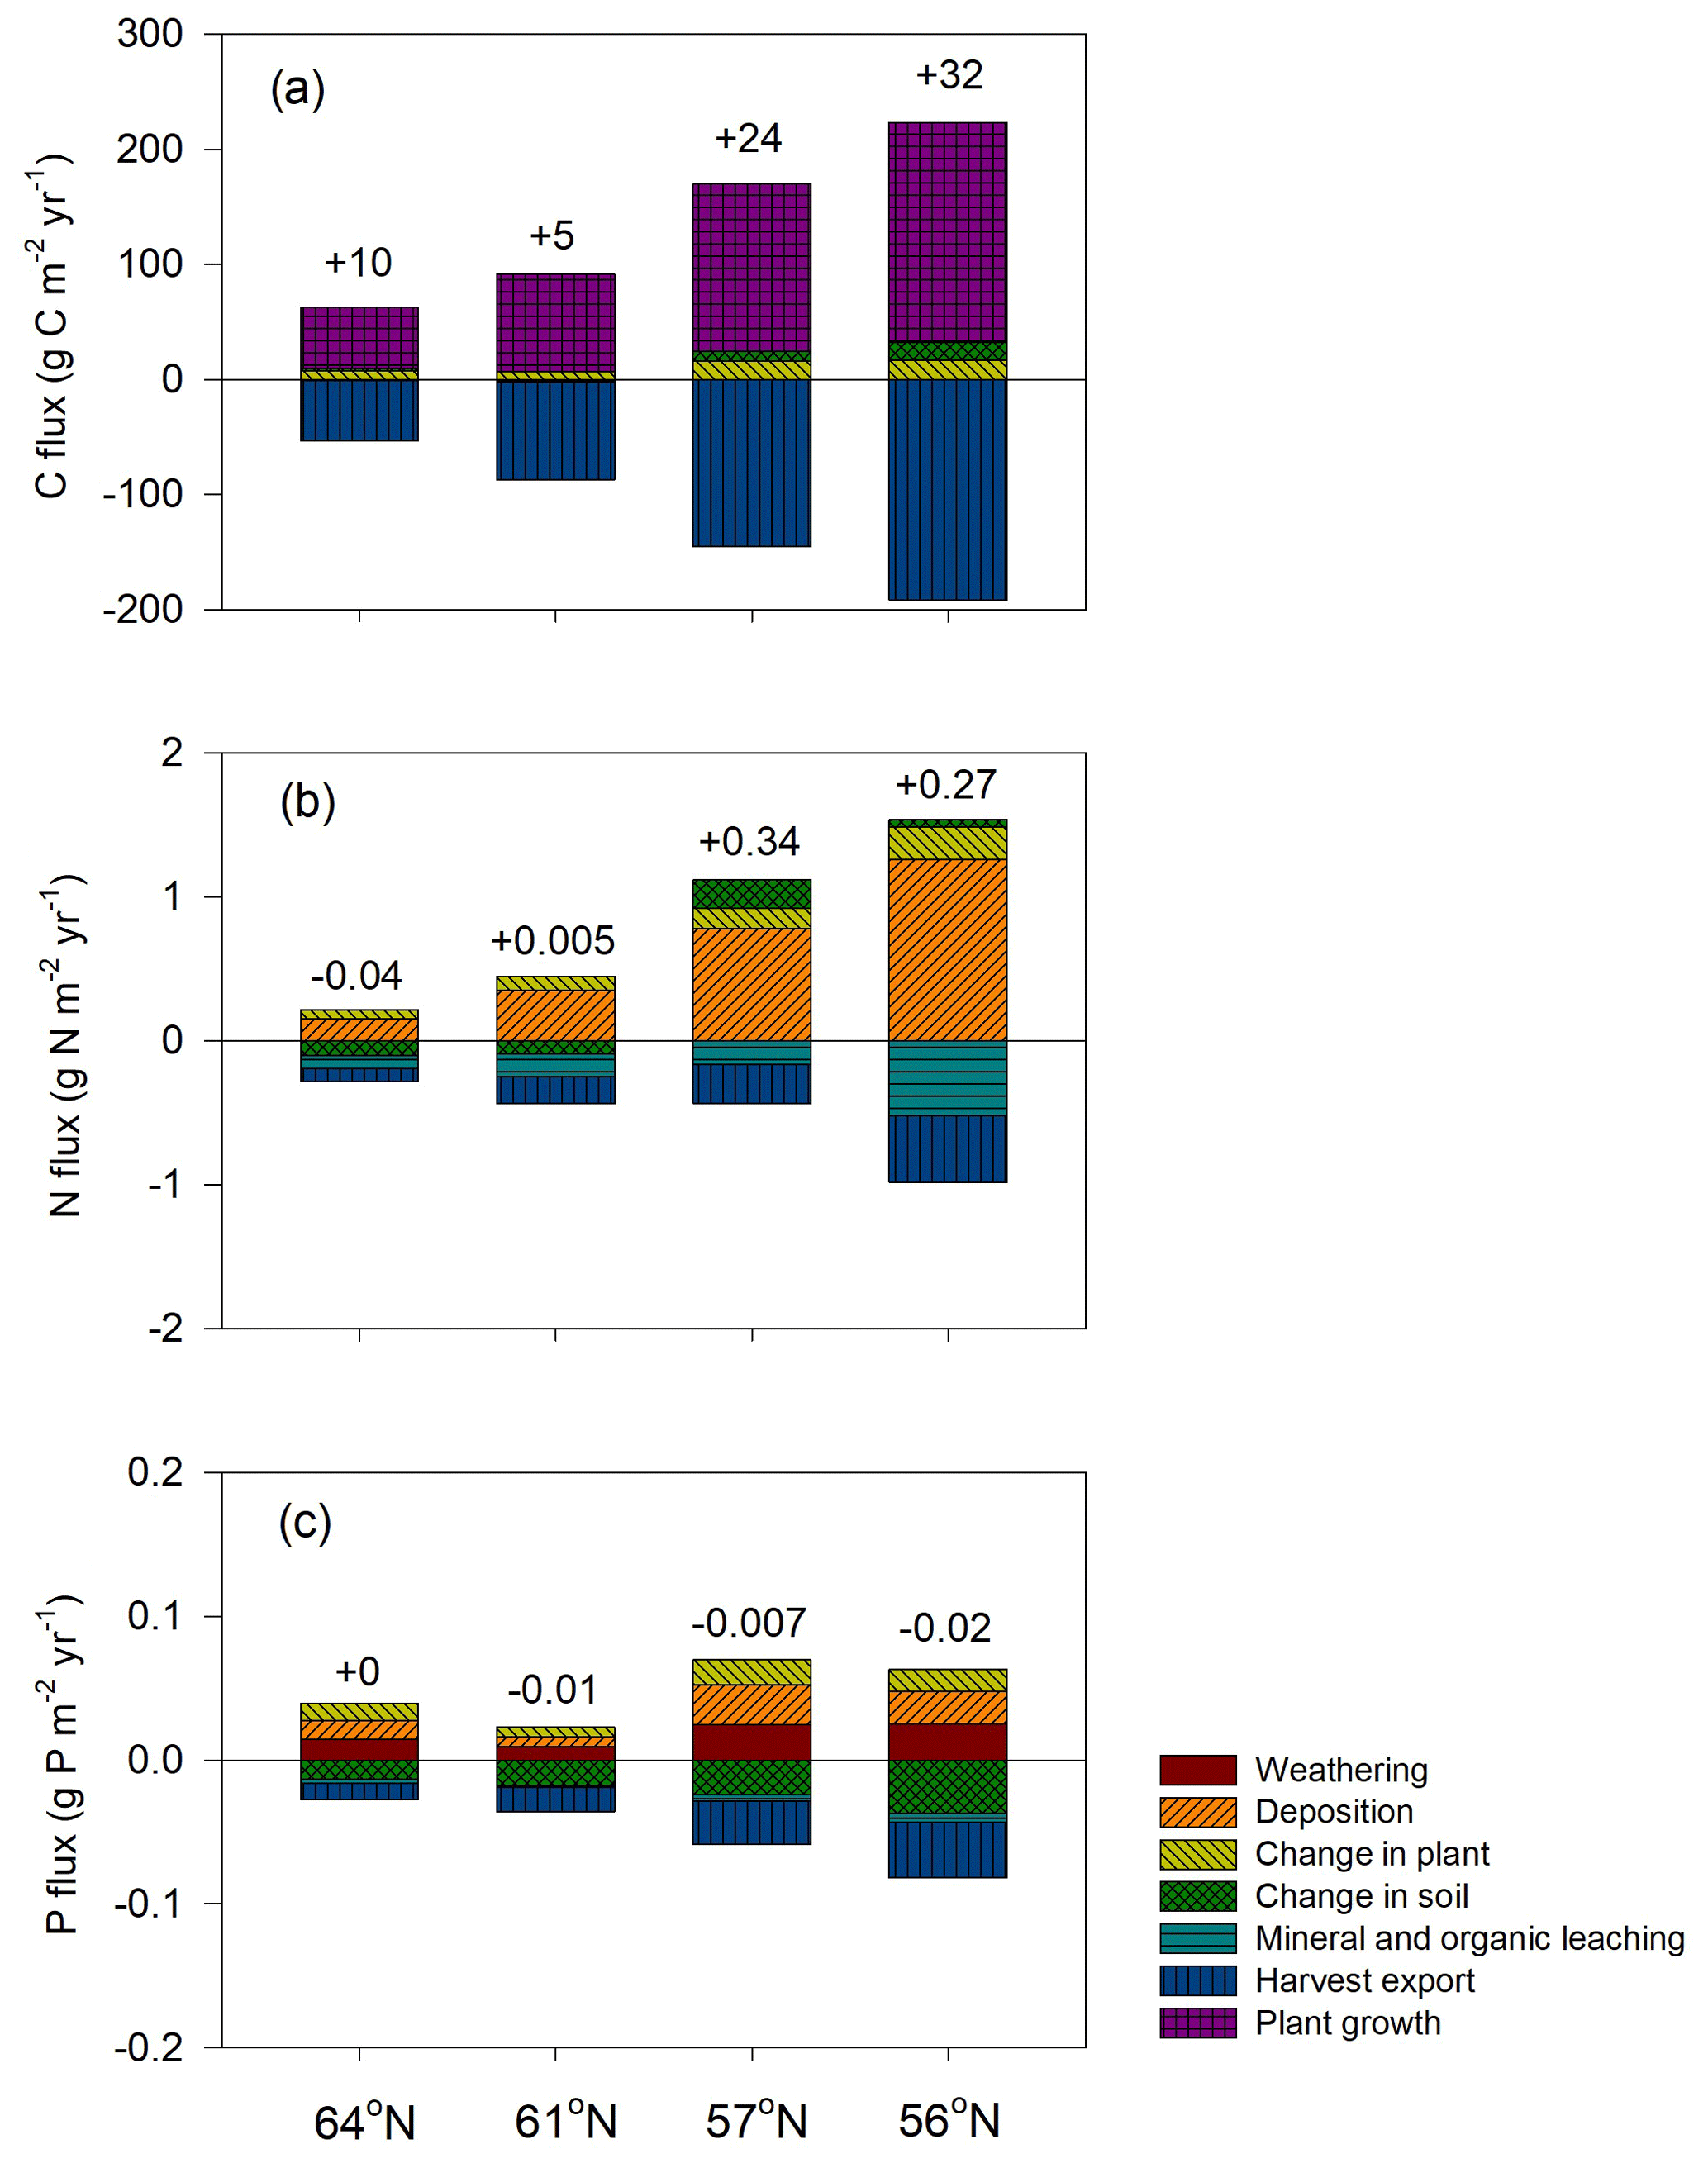
Figure 4Simulated mean annual fluxes in (a) C, (b) N, and (c) P in the four regions. The numbers above the stacks indicate the annual mean change in the ecosystem. The simulation period starts from year 10 and ends 10 years after final felling. Plant growth in (a) represents net primary production.
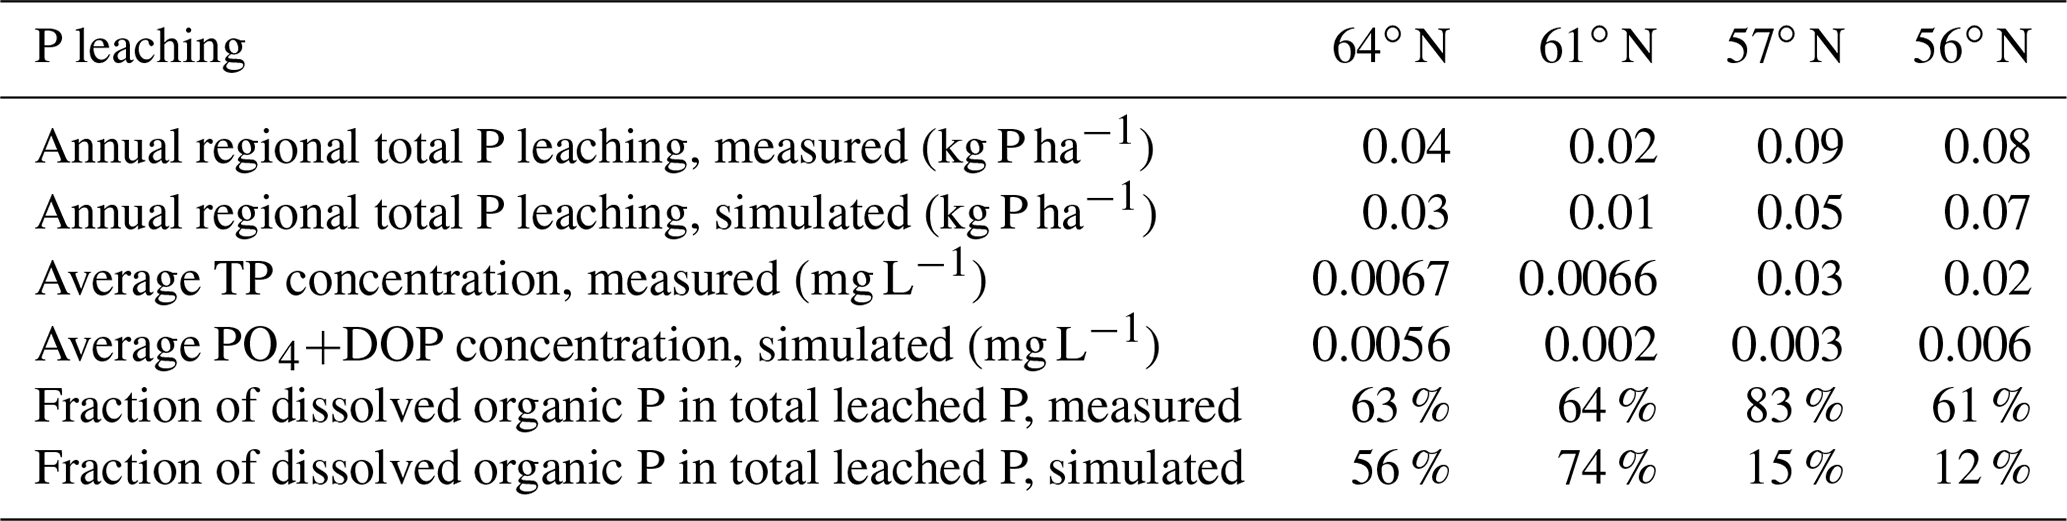
The modelled P leaching generally reflected the observational data; however, the mean estimated concentrations were often lower than the measurements available for each region (MVM, https://miljodata.slu.se/mvm/, last access: 2 October 2019, Table 6). It should be noted that the observed stream P concentrations include P from the entire watershed, whereas our model only includes upstream P sources. The data show that P losses through leaching were small compared to the internal fluxes, i.e. they account for approximately one-third of the annual deposition input, while DOP losses were more dominant in the northern systems (Table 6). However, the simulated proportion of DOP in total losses through leaching was much lower than what had been measured, and the decreasing trend from north to south identified in the simulations was not supported by the observational data (Table 6).
Table 6Simulated and measured annual P losses through leaching. Measured total phosphorous (TP) is larger than the simulated DOP and PO4 fraction due to the presence of particulate phosphorus and because the measured value contains P leaching from upstream sources.
4.2 Modelled forest C, N, and P budgets
Regarding C assimilation, average plant growth over the rotation period in the southernmost region was predicted to be 3 times higher than that of the northernmost region (Fig. 4a). As most of the forest productivity was transformed into harvested products, the change in plant C was small, as the simulation started when the plants were 10 years old and ended 10 years after they had been harvested. Regarding the N budget, the northernmost ecosystem showed a slight loss, while the southern ecosystems showed N gains. The N sequestration rates generally increased towards the southern latitudes (Fig. 4b). The P budget showed an opposite pattern, as the northernmost ecosystem was in balance while the other three ecosystems showed P losses, with total losses increasing from north to south (Fig. 4c).
Most of the C captured from the atmosphere was stored in the harvested plants (Fig. 4a). Our model predicted small losses of dissolved organic carbon (DOC) through leaching, and the forest soil in all of the regions was found to be in a quasi-steady state with generally low sequestration. An exception was the region with the lowest P-availability (61∘ N), which showed soil C losses (Tables 1, 5).
Our results identified atmospheric deposition as the main N input. When accounting only for harvested N, 60 %, 53 %, 35 %, and 36 % of the deposited N was removed from the 64, 61, 57, and 56∘ N regions, respectively (Fig. 4b). The N accumulated in standing plants and harvested plants accounted for 104 %, 80 %, 54 %, and 55 % of the annual N deposition in the 64, 61, 57, and 56∘ N regions, respectively. The model results indicate that the soils of the two northern regions will lose N, while soils of the two southern regions will accumulate N. Annual average losses through leaching were predicted to increase from north to south and had a range of 0.09, 0.19, 0.27, and 0.47 g N m−2 from north to south, which corresponds to 60 %, 45 %, 21 %, and 41 % of the annual N deposition, respectively (Fig. 4b).
The simulated annual P weathering fluxes ranged from 0.009 to 0.025 g P m−2 yr−1 and showed similar magnitudes as the deposition inputs (Fig. 4c). The most significant source of P losses over the rotation period was harvesting, which removed 89 %, 255 %, 108 %, and 167 % of the deposited P from the 64, 61, 57, and 56∘ N regions, respectively (Fig. 4c). When the P that accumulated in standing and harvested plants is considered together, this accounts for 85 %, 147 %, 90 %, and 114 % of the total P input through deposition and weathering for the 64, 61, 57, and 56∘ N regions, respectively. Thus, the simulation revealed that soils from all four studied regions are slightly losing P, with annual losses ranging from 0.01 to 0.03 g P m−2 from north to south (Fig. 4c).
4.3 Impacts of forest growth, soil C and leaching on soil N and P levels
Forest growth, measured through harvested biomass, increased as the soil N∕P ratios increased from 10 to 15 but decreased once an optimum soil N∕P ratio of around 15–20 was reached. This trend was noted for three studied regions (Fig. 5a), becoming less pronounced from north to south, and was ultimately undetectable for the northernmost region, where GPP was strongly limited by radiation (average absorbed radiation 3.89 × 10⁶ J m−2 d−1 at 64∘ N and 6.57 × 10⁶ J m−2 d−1 at 56∘ N, Table 4). The 64∘ N region had the lowest air temperature and amount of precipitation, which also contributed to GPP limitation (temperature and water limitation of GPP were 0.47 and 0.45 at 64∘ N, respectively, and 0.67 and 0.65 at 56∘ N, respectively; Table 4). Soil C sequestration across the 56–61∘ N latitudes was found to be highly sensitive to soil N∕P ratios, with the model predicting that soil C sequestration would consistently decrease as the soil N∕P ratio increases (Fig. 5b). In addition, total P losses through leaching generally decreased as soil N∕P ratios increased; an exception was the 57∘ N region, where P losses through leaching also increased for soil N∕P ratios above 15–18, a range which coincides with maximum plant harvest (Fig. 5a). In contrast, total N losses through leaching were found to be positively correlated with the soil N∕P ratio above 15, with this relationship being more pronounced for the southern regions (Fig. 5c, d). Thus, the sensitivity analysis results indicate that strong C–N–P interactions are also prevalent in forest ecosystems (Fig. 5). Forest soils with soil N∕P ratios exceeding 15–18 were predicted to exhibit slower forest growth rates, lower soil C sequestration (potentially even losses), and high N leaching risk.
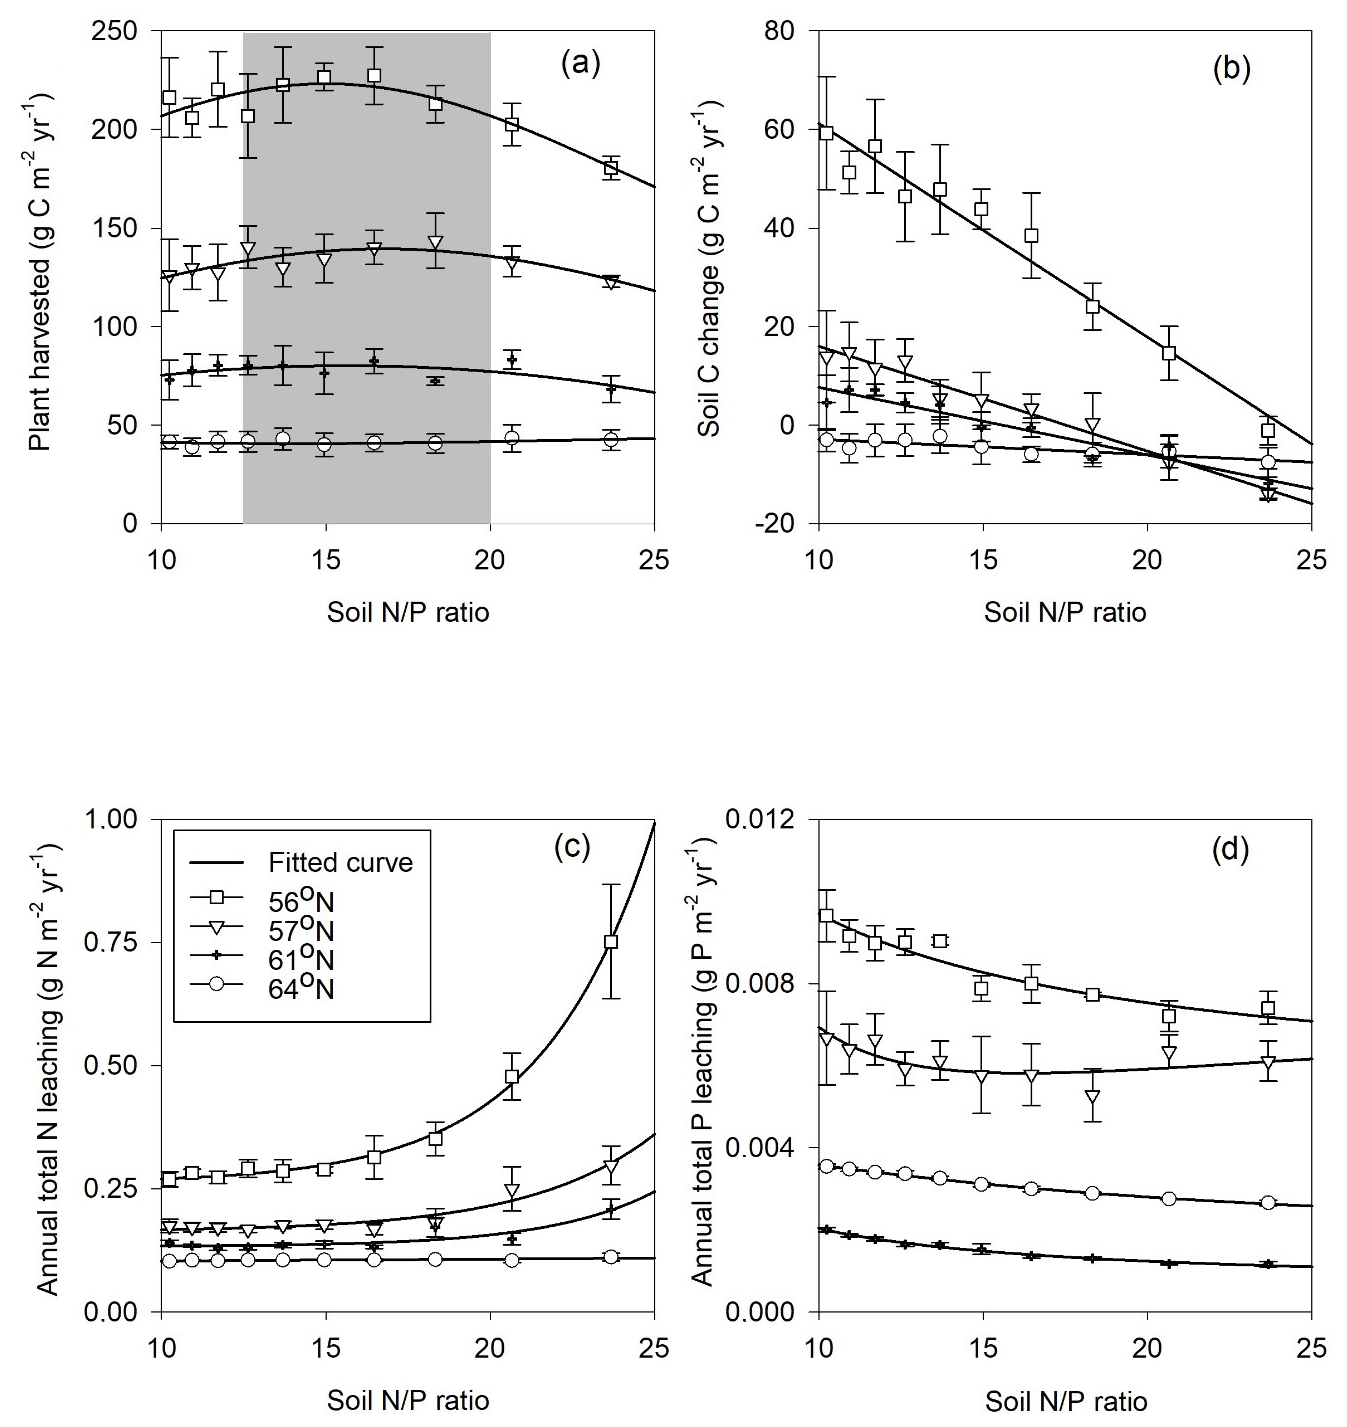
Figure 5Simulated annual mean (a) harvested biomass, (b) soil C change (positive values denote sequestration, negative values denote losses), (c) total N leaching, and (d) total P leaching in response to changes in soil organic N∕P ratio across the four regions. The bars demonstrate the standard deviation of a mean value based on changes in shortcut uptake rates of N and P (see Table 2).
5.1 Modelled P budgets and comparison with other modelling studies
It is important to compare our modelled P fluxes with previously reported values. In a study that compared results from the PROFILE model with empirical data, Akselsson et al. (2008) estimated the average weathering rate in Swedish forests (down to a depth of 0.5 m) to be 0.009 g P m−2 yr−1, ranging from 0.001 to 0.024 g m−2 yr−1 (5 % and 95 % percentiles, respectively). This can be compared with our simulated P weathering rate (down to a depth of 1 m soil depth) range of 0.009 to 0.025 g P m−2 yr−1. Both our estimations and those by Akselsson et al. (2008) were far lower than the 0.071 g P m−2 yr−1 (0.5 m depth) reported by Yu et al. (2018) for a spruce forest on Podzol soil in southern Sweden. It is important to mention that Yu et al. (2018) suggested that the weathering rate they provided was an overestimation.
The modelled total plant P uptake rates in this study ranged from 0.4 to 1 g P m−2 yr−1 (Table 4), which is slightly higher than the 0.5 ± 0.4 to 0.96 g P m−2 yr−1 reported by Johnson et al. (2003) and Yanai (1992) for temperate forests and the 0.5 g P m−2 yr−1 reported for a southern Swedish forest by Yu et al. (2018). One explanation for this discrepancy could be that Coup-CNP explicitly considers mycorrhizal processes related to P uptake, e.g. the presented estimates revealed that mycorrhizal fungi accounted for more than half of total plant P uptake (Table 4). This highlights that mycorrhizal fungi are crucial to plant P acquisition in forest ecosystems. The estimated P uptake by fungi was – to a large extent – proportional to the rates estimated for N (Table 4). He et al. (2018) compared explicit and implicit models and found that CoupModel v5.0 predictions of plant N uptake were higher when mycorrhizal fungi were explicitly included in the model. Furthermore, it is important to note that previous accounts of empirical data (Johnson et al., 2003; Yanai, 1992), as well as the ForSAFE model (Yu et al., 2018), did not account for P uptake by understorey vegetation. In this study, understorey vegetation was estimated to contribute to around one-third of total P uptake in northern regions and one-sixth of total P uptake in southern regions (data not shown).
Akselsson et al. (2008) reported that in Swedish forests whole-tree harvesting causes average P removal of 0.054 g P m−2 yr−1 with a range from 0.016 to 0.13 g P m−2 yr−1. This agrees well with our modelled range (0.012 to 0.038 g P m−2 yr−1) as well as the value reported by Yu et al. (2018) of 0.037 g P m−2 yr−1.
The P balances estimated for the ecosystem in this study ranged from 0 to −0.02 g P m−2 yr−1 (with the negative value representing P losses). This agrees with what has been reported by Akselsson et al. (2008), i.e. an average P balance of −0.029, ranging from 0.008 g P m−2 yr−1 in northern Sweden to −0.1 g P m−2 yr−1 in southern Sweden. The modelling by Yu et al. (2018) yielded P accumulation of 0.004 g P m−2 yr−1 over a 300-year period in southern Sweden. This predicted gain in P over the simulation period, which was very low, could have been due to relatively high P inputs via weathering. Our modelled regional P budget implies that clear-felling will result in a negative P balance for most Swedish forests even when P uptake by mycorrhizal fungi in nutrient-poor forests is accounted for. The exception to this prediction is the northernmost region.
5.2 Implications of P availability on forest C and N dynamics
Our results demonstrate that Swedish forests are increasingly P-limited with decreasing latitude, a trend that was especially noticeable at southern latitudes (Table 4). N limitation was more severe than P limitation at the 64 and 57∘ N regions. Furthermore, the canopy of forests in the northernmost region intercepted far less radiation than the canopies at lower latitudes. This may partly mask the response to nutrient limitation, and cause forests in these regions to appear less sensitive to nutrient limitation. This was supported by the observed leaf N∕P ratios (average values between ca. 9–14), which are recognised as reflecting the state of nutrient limitation in forest trees (e.g. Jonard et al., 2015). In Swedish spruce forests, leaf N∕P ratios below 7 are normally considered an indicator of N limitation, while ratios above 12 signal P limitation (Rosengren-Brinck and Nihlgård, 1995; Yu et al., 2018). Linder (1995) has previously reported an optimal N∕P ratio of 10 for spruce forests in northern Sweden. A similar optimal N∕P ratio for pine forest was also reported (Ingestad, 1979; Tarvainen et al., 2016). Our leaf N∕P ratio estimates were within these ranges, with the exception of the southernmost region (Fig. 1). The ratio of total plant P uptake to total N uptake in the southernmost region was much lower than what was measured for the other regions (Table 4), which further suggests P limitation in the southernmost region. The 61∘ N region, which was characterised by the lowest P inputs among the studied regions due to geology and deposition (Table 1) (Fig. 4), was also shown to be P-limited (Table 4). This low P input also explains why this region showed the highest simulated fraction of shortcut P uptake from soil organic P (Table 4). Our modelling suggests that northern regions, which have traditionally been conceived as N-limited (Högberg et al., 2017), may experience P limitation or co-limitation by N and P. For instance, the 57∘ N region showed N limitation, as the average response of N on GPP (0.30) is lower than the average response of P on GPP (0.34) over the rotation period (Table 4). However, our model results for the same region also yielded average values for the response of P on GPP that were lower than the average values for the response of N on GPP during initial stand development. This suggests that co-limitation could still occur, e.g. at some points during the first 10 years of the simulation, and indicates that nutrient limitations may shift during forest development stages. For example, Tarvainen et al. (2016) reported a decrease in needle P following N fertilisation in a Scots pine forest in northern Sweden. Several groundwater discharge areas were also shown to be P-limited (Giesler et al., 2002). Sundqvist et al. (2014) and Vincent et al. (2014) reported that alpine ecosystems in northern Sweden may also be P-limited.
The removal of harvest residue from final fellings for use in biofuel production is common and expected to increase in southern and central regions of Sweden (Cintas et al., 2017; Ortiz et al., 2014; Stendahl et al., 2010). Our modelling indicates that clear-cutting or final-felling will significantly impact the forest P balance and soil C sequestration (Figs. 4c, 5b). Furthermore, it is important to note that this practice was found to affect P availability more than N availability, especially in southern Sweden (Fig. 4b, c). Simulations with earlier versions of CoupModel have also revealed N depletion for final-felling and clear-felling scenarios in northern Sweden but reported N gains for southern Sweden (He et al., 2018; Svensson et al., 2008; Gärdenäs et al., 2003).
The soil C sequestration simulated by the Coup-CNP model is generally comparable with what has been reported in previous studies (Table 5). Plants in the northern regions need to acquire nutrients to meet demands for growth, but the Coup-CNP model showed that plants acquire a smaller fraction of total nutrients than what was previously estimated (Coup-CN model; see Table 8 in Svensson et al., 2008). Our results further suggest that P regulates soil organic carbon (SOC), as an increasing soil N∕P ratio will decrease soil C sequestration rates (Fig. 5b).
Our global parameter sensitivity analysis showed that initial soil organic P content and the shortcut uptake coefficients for N and P have a larger influence on model outputs than parameters related to weathering rates (see the Supplement). This again confirms that the internal cycling of P is more important in regulating ecosystem C, N, and P dynamics than current weathering inputs in Swedish forests, a finding that is similar to what has been reported by Yu et al. (2018). The sensitivity analysis results revealed that the optimum soil N∕P ratio for forest production on podzol soils across the 61–56∘ N regions is between 15–20 (Fig. 5). Manzoni et al. (2010) reviewed the forest litter decomposition process and found that litter C-to-nutrient ratios decreased – towards a C∕N ratio of 20 and C∕P ratio of 350 (thus an N∕P ratio of 17.5) – as decomposition proceeded. A synthesis of long-term decomposition studies covering northern forests also showed that the N∕P ratio of both fine litter and woody residues converges to around 20 (Laiho and Prescott, 2004). The optimum range identified by the Coup-CNP model is thus similar to these observed convergence ratios, which generally represent the shift from immobilisation during the initial decomposition phase to net mobilisation (Penuelas et al., 2013; Güsewell, 2004; Cleveland and Liptzin, 2007). Lagerström et al. (2009) measured soil and microbial nutrient contents in 30 diversified forest islands in northern Sweden that vary considerably in terms of fertility. Surprisingly, they found that microbial biomass N∕P ratios remained unchanged across the gradient, suggesting that nutrient availability is mainly determined by soil organic N∕P ratios. The identified bell-shaped response of plant growth to the soil N∕P ratio thus highlights the importance of nutrient stoichiometry. This implies that forests with N∕P below the optimal range can benefit from N fertilisation, which will stimulate forest growth and reduce the P leaching risk. In contrast, P fertilisation in forests with N∕P above the optimal range will stimulate forest growth, promote soil C sequestration, and reduce N leaching (Fig. 5). A synthesis of long-term water quality measurements from forest streams in the geochemical monitoring network (GEOMON) found total N fluxes to be tightly linked to dissolved organic nitrogen (DON) ∕ TP ratios (Oulehle et al., 2017). As such, total N leaching increased with the DON ∕ TP ratio, a finding which agrees with the results obtained in this modelling study. The presented modelling predictions thus corroborate that decreased P availability can profoundly affect the N cycle and catchment retention.
To summarise, the presented model (CoupModel v6.0) demonstrated that integrating the P cycle into ecosystem models can significantly impact estimations of forest C and N dynamics. This is an important finding in the context of climate change and forest management, as researchers need to have tools that will reliably model the C–N–P dynamics in an ecosystem. Climate change research strives to maximise C accumulation in terrestrial ecosystems, but this may currently be limited by P availability, which will be further jeopardised by the removal of forest residues for bioenergy production. The presented results show that forest growth in southern regions, which are characterised by high N deposition and already show limitation by P, will be most affected (Fig. 4c, Table 4) (Akselsson et al., 2008; Yu et al., 2018; Almeida et al., 2019).
This paper presents the newest version of the Coup-CNP model. The evaluation data from this study offer a partial picture of the entire P cycle, and further validation should focus on the internal P fluxes and their interaction with C and N. As such, the global sensitivity analysis presented here provides an example for future use of the model. A user can choose which modules to include depending on the specific research question. The Coup-CNP was evaluated using data of Swedish forest ecosystems and model results suggest soil organic matter C∕P ratio is a good indicator of plant P availability. However, in the long run, the weathering provides the ultimate source for P. Most of the P model concepts builds on well-established concepts. However, there are few model assumptions and parameters, which would benefit from further research and more experimental evidence to test and evaluate its more general validity. Our results show the importance of the P shortcut uptake to sustain the forest growth and thereby highlighting the role of microbes. The plant P availability is regulated by the competition between mineral P uptake, shortcut P uptake, and soil adsorption. Coup-CNP simulates such competition by different coefficients or parameters, which are largely unconstrained by observations. Similarly, while a plant–mycorrhizal symbiosis interaction scheme is suggested, it relies on several parameters or coefficients, which are again largely unconstrained by observations. We recommend further testing of the model for agricultural, wetland, and other ecosystems with a wide range of plant P availability to reduce uncertainties in the model outputs.
This paper describes the most recent version (6.0) of CoupModel, which explicitly considers the phosphorus cycle and mycorrhizal interactions. The simulations of the C, N, and P budgets for four forest regions were complete and accurate based on comparisons using empirical forest biomass, leaf nutrient ratio, and P leaching data. The development and evaluation of this new model demonstrates that P availability needs to be considered when studying how climate change will influence C turnover and ecosystem responses. Simulations that do not factor in P availability may overlook important feedback mechanisms and overestimate the C sink. Thus, the detailed description of all the Coup-CNP components and their interactions – including the water, heat, C, N, and P cycles – are highly relevant to future studies.
Our model results showed that N was the most limiting nutrient for the 64 and 57∘ N regions, while P was the most limiting nutrient for the 61 and 56∘ N regions (Table 4). The N limitation at the 64 and 57∘ N regions was more severe than the P limitation at the 61 and 56∘ N regions. Furthermore, the northernmost region was characterised by lower temperature, precipitation, and radiation intercepted by the canopy relative to other regions, all of which may have skewed the estimated sensitivity to nutrient limitation. During the simulated rotation period, southern forests showed P losses, mainly through harvesting and changes in soil storage, while northern forests were close to a steady state in P availability. Mycorrhizal fungi accounted for half of total plant P uptake in all of the regions, which highlights the crucial role of the mycorrhiza in Swedish forests. A sensitivity analysis determined that a soil N∕P ratio of 15 to 20 is optimal for forest growth. Furthermore, soil N∕P ratios above 15–20 decreased soil C sequestration and total P leaching and significantly increased N leaching. The largest P outflow over the rotation period was found to be removal via final-felling.
The simulations showed that Coup-CNP was able to describe shifting from being mostly N-limited to mostly P-limited and vice versa. We conclude that the potential P-limitation of terrestrial ecosystems highlights the need for biogeochemical ecosystem models to consider the P cycle. The inclusion of the P cycle enabled the Coup-CNP to account for various feedback mechanisms that have a significant impact on ecosystem C sequestration and N leaching under climate change and/or elevated N deposition.
The following section provides the equations for P processes that are analogous to those describing N processes and discusses parameterisation aspects. The inclusion of the N cycle in CoupModel was previously described by Gärdenäs et al. (2003), Jansson and Karlberg (2011), and He et al. (2018).
A1 Deposition and fertilisation
Atmospheric deposition, Pdep→ilab is treated as a model input using the parameter pdep. In contrast to N deposition, only dry P deposition is considered since wet deposition is generally neglectable. Fertilisation Pfert→ilab is also treated as a model input and calculated as follows:
where Pfert→ilab is the rate of fertiliser P addition (g P m−2 d−1) and pkfert is the specific dissolution rate of commercial fertiliser (d−1). The value of pkfert depends on fertiliser type and moisture conditions, e.g. in our model a value of 0.15 corresponds to a half-time of 5 d, and 90 % of the fertiliser is dissolved into the Pilab pool within 15 d. If manure fertiliser is used, the organic Po in the manure is added into a separate organic pool Pofae, termed faeces. Fecal processes are similar to those of soil litter described below.
According to a global compilation of published data, the average annual global P deposition is 0.027 g P m−2 yr−1 (0.033 for Europe), which equals to 0.000074 g P m−2 d−1 (Tipping et al., 2014; Schlesinger, 1997).
A2 Mineralisation–immobilisation and decomposition
The Pilab pool is also controlled by biological demand and turnover (Olander and Vitousek, 2005). The P flux of biological mineralisation–immobilisation is calculated as precisely as for N, in that C fluxes from litter (or faeces) to humus – or from humus to atmosphere – are driven by the microbial need for energy. The non-symbiotic microbes are implicitly simulated using a fixed microbe C∕P ratio parameter. The C∕P ratio for microbes (cpm) can vary widely, ranging from approximately 25 to 400 (see review by Manzoni et al., 2010).
Here kl is the decomposition coefficient for soil litter (d−1), Clitter is the size of the litter pool (g C m−2), and f(T) and f(θ) are common temperature and water content response functions for decomposition; for more details see Jansson and Karlberg (2011). Humus decomposition is calculated by changing the pool size and decomposition coefficient in the previous equation into terms that describe humus. PLitter→ilab is the mineralisation flux from the soil litter pool to the Pilab pool (g P m−2 d−1). PLitter→Humus is the humification flux rate. CDecomL is the C decomposition flux of soil litter (g C m−2 d−1), whereas Clitter∕Plitter and cpm represent the C-to-P ratio in the litter pool and microbes, respectively. fe,l is a microbial efficiency parameter that represents the fraction of mineralised C that remains in the soil. Corresponding fluxes are calculated by changing the efficiency parameter to fe,f or fe,h, along with changing the litter C∕P ratio to a fecal C∕P ratio or humus C∕P ratio, to provide the corresponding flows from the faecal pool, Pofae→ilab, or the humus pool, PHumus→ilab, respectively. A negative value means that net immobilisation takes place.
Total biological mineralisation is calculated as follows:
The biochemical mineralisation process includes the release of root exudates, e.g. efflux of protons and organic anions, phosphatase, and cellulolytic enzymes required for the hydrolysis or mineralisation of Po (Richardson and Simpson, 2011; Bünemann, 2015; Hinsinger, 2001). This additional mineralisation process is driven by plant demand for P (Richardson et al., 2009). Bünemann (2008) reviewed the existing enzyme addition experiments and showed, for example, that the phosphatase enzyme has low substrate specificity and that up to 60 % of total organic Po in soil can be hydrolysed and mineralised. We therefore assume that biochemical mineralisation can occur from both the soil litter and humus pools. The flux rate is calculated as a first-order function regulated by pool size and uptake rate. Furthermore, it is assumed that the flux rate will not exceed the remaining plant demand after root Pi uptake (Eq. A8). The following Eq. (A4) is used when symbiotic microbes are implicitly simulated.
Here PLitter→plant and PHumus→plant represent the biochemical mineralisation fluxes from the litter and humus pools (g P m−2 d−1), respectively, assuming immediate uptake by the plant roots after mineralisation. ouptPlitter and ouptPhumus are coefficient parameters that define the maximum plant uptake rates from the soil litter and humus pools, respectively. PLitter and PHumus are the P pool sizes (g P m−2), fracP,litter and fracP,humus are introduced to ensure that biochemical mineralisation remains less than the missing plant demand after Pilab uptake, as well as to ensure proportional uptake from PLitter and PHumus. In this modelling framework, the inorganic Pi released by enzymatic activity is acquired directly by plants rather than entering the Pi pool.
Total biochemical mineralisation is calculated as follows:
The total mineralisation–immobilisation flux is calculated as follows:
As is the case with DOC ∕ DON, in Coup-CNP organic P dissolution is described as a microbial decomposition process. The redistribution is done following that of water flow, as the dissolved organic matter (DOM) is assumed to have full mobility with water. The formation of DOM is from litter and humus (Eq. A7). The DOM can be fixed by humus via adsorption and precipitation, among other processes. A fixation coefficient, dDOD, which varies between layers, was also introduced (Kalbitz et al., 2000; Kaiser and Kalbitz, 2012). Parameterisations from Svensson et al. (2008) were used in this study. The equation for DOP is similar to that for DOC and is calculated as follows:
where dDO,l and dDO,h are the dissolution rate coefficients (d−1) for the litter and humus, respectively, f(T) and f(θ) are common response functions for soil temperature and water content and identical to those used for the decomposition process (Eq. A2).
A3 Plant growth and P uptake
Plants can acquire Pi through both the roots and mycorrhizal fungi; for this reason, both of these processes were simulated. We assume that Pi uptake by the roots is driven by net photosynthesis and determined by plant demand, yet constrained by the Pilab pool size.
Here Pdemand is the plant P demand, based on the C∕P ratios of various plant compartments (iplant includes leaf, stem, fine roots, and coarse roots),
where Ca→iplant is the photosynthetic assimilation for each compartment iplant (g C m−2 d−1), Ciplant→a is the respiration of each compartment, and cpiplantmin is the defined minimum C∕P ratio for each plant compartment. Empirical measurements show that the C∕P ratio of leaves generally varies between 200 and 600, while the stem and roots require C∕P ratios between 1000 and 3000 and 500 and 1500, respectively (Bell et al., 2014; Tang et al., 2018). The model provides flexible stoichiometry because the C∕P ratios for distinct compartments are calculated for each time step.
In addition, increasing soil P abundance, particularly when P fertiliser is added, is known to decrease belowground C allocation (Ericsson, 1995). We assume that an increasing C∕P ratio (i.e. decreasing P content) in the leaf, C∕Pl, will increase belowground allocation (e.g. frac(root)).
Here rcpc1 and rcpc2 are the plant allocation pattern parameters, determined by plant species and a similar equation as what was used to calculate frac) (He et al., 2018). CoupModel can additionally account for the effects of water stress on plant allocation. In this study, C allocation to roots is assumed to be constrained by both N and P contents in the leaves, i.e. frac) and frac).
A4 Plant litterfall
Plant litterfall P fluxes are proportional to the corresponding C fluxes and determined by the C∕P ratio of each compartment iplant (iplant=leaf, steam, grain, fine roots, and coarse roots), calculated as follows:
where cliplant is the litterfall rate (d−1) for plant compartment iplant, Ciplant is the C stock in that compartment (g C m−2), and ciplantret is a parameter defined as the fraction of C that was retained before litterfall. Total litterfall also includes inputs from mycorrhizal fungi. The litterfall flux is directly added to the surface soil litter pool or to the layer in which it formed when it was produced by roots and fungi. The average C∕P ratio of fresh litter varies widely, e.g. between 100 and 4100 (Manzoni et al., 2010). The retention of nutrients prior to leaf senescence is one of the main factors that affect the C∕P ratio of fresh litter. During litterfall seasons, plants can reallocate P and N from leaves to an internal, mobile storage form to prepare for rapid growth in the spring. This mechanism is known to increase the efficient use of nutrients (e.g. Aerts, 1996) (see also mretain in Table S1 in the Supplement).
A5 Leaching and surface runoff
The losses of soluble Pisol,loss (g P m−2 d−1) are modelled through the transport of water,
where qdrainage is the water flow (mm d−1) due to drainage, and qpercolation is the deep percolation flow (mm d−1), θ,j is the water content (volume %) of soil layer j, and Δz,j is the layer thickness (m) of soil layer j. The vertical Pi flow between layers is calculated through a similar equation.
DOP losses from the system is calculated as follows:
In addition, we also accounted for particulate phosphorus (PP) losses, e.g. due to soil erosion, subsidence, and lateral losses of secondary minerals and occluded P due to surface runoff. We assume the PP loss is simply proportional to the water flow. When surface runoff occurs, for example during snow melting, the loss is assumed to occur only for the first soil layer (soil surface),
where qsurfacerunoff is the surface runoff flow (mm d−1). An empirical scale factor kscale is introduced to account for the concentration of erodible Psolid over the flow rate of surface runoff. PΔ (mg P L−1), Pbase (mg P L−1), and qthr (mm d−1) are empirical coefficients.
Therefore, the total P losses are calculated as follows:
A6 P removal during plant harvest
The removal of P during harvesting was calculated in a similar way as C losses through harvesting and depends on the C∕P ratio of the specific plant compartment.
Table B1Simulated annual P budget, including the associated uncertainty range (mean ± SD in g P m−2 yr−1).
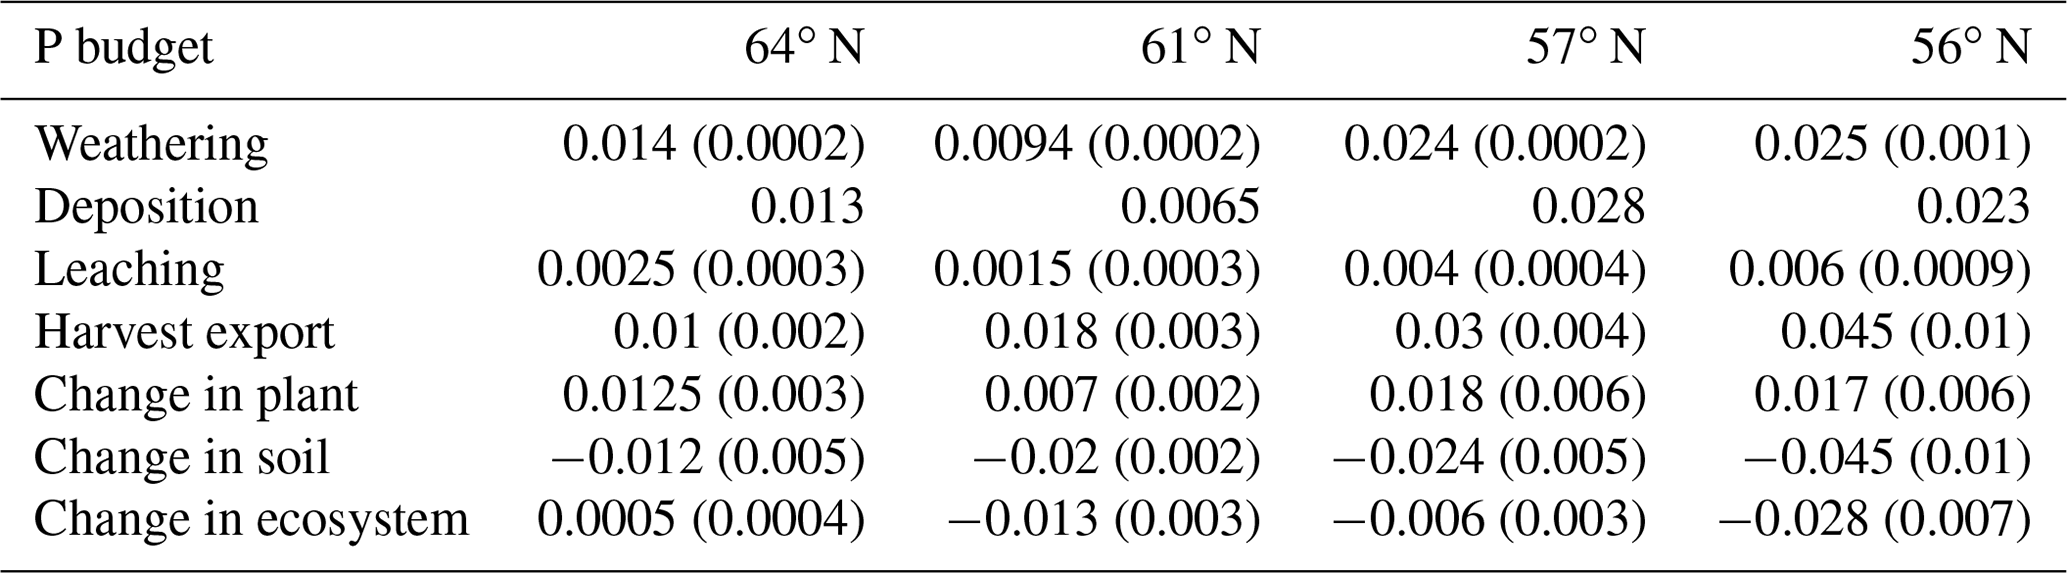
Table B2Simulated annual N budget, including the associated uncertainty range (mean ± SD in g N m−2 yr−1).
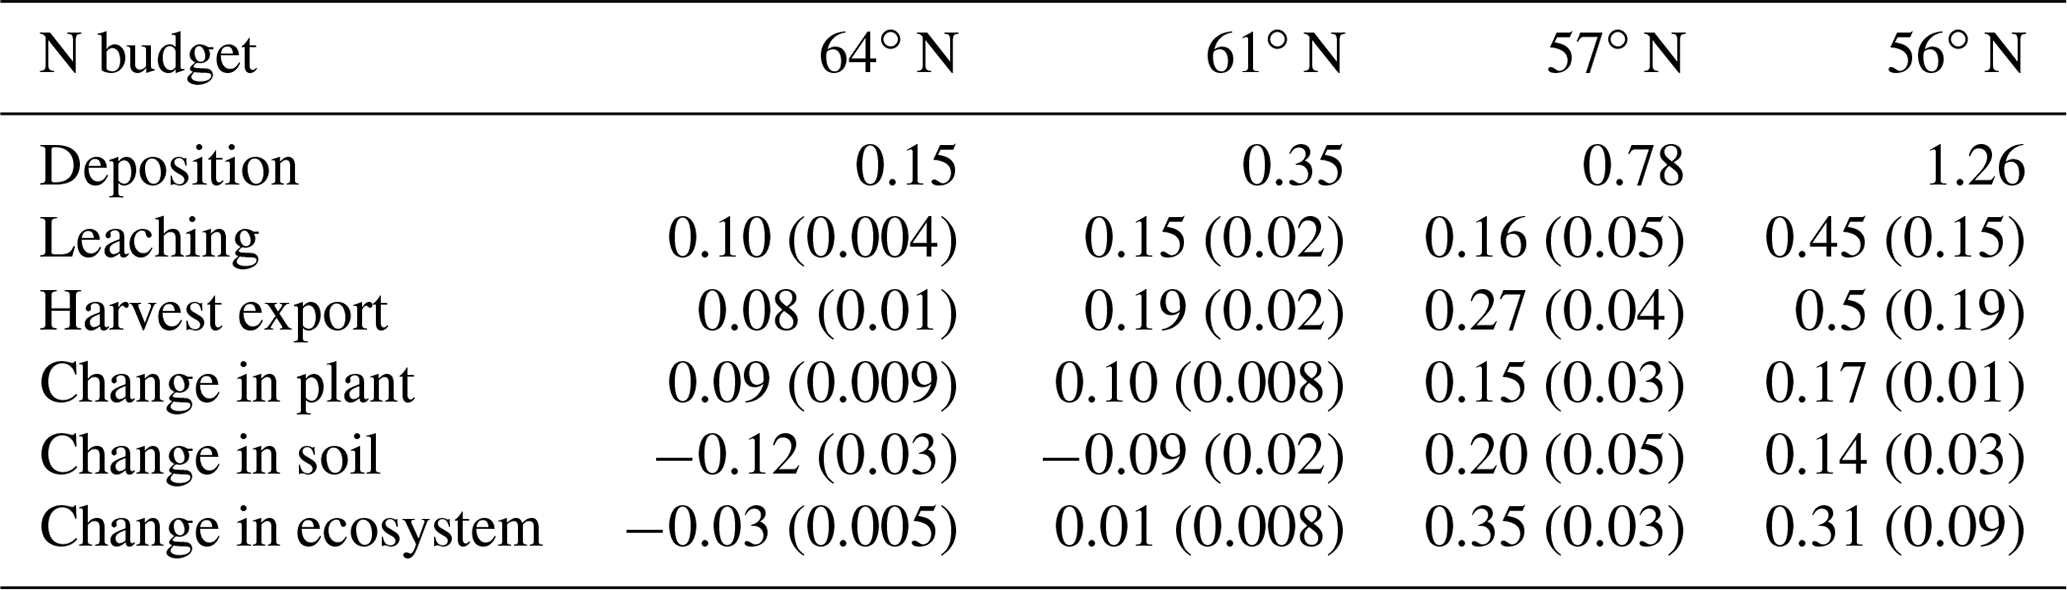
Table B3Simulated annual C budget, including the associated uncertainty range (mean ± SD in g C m−2 yr−1).
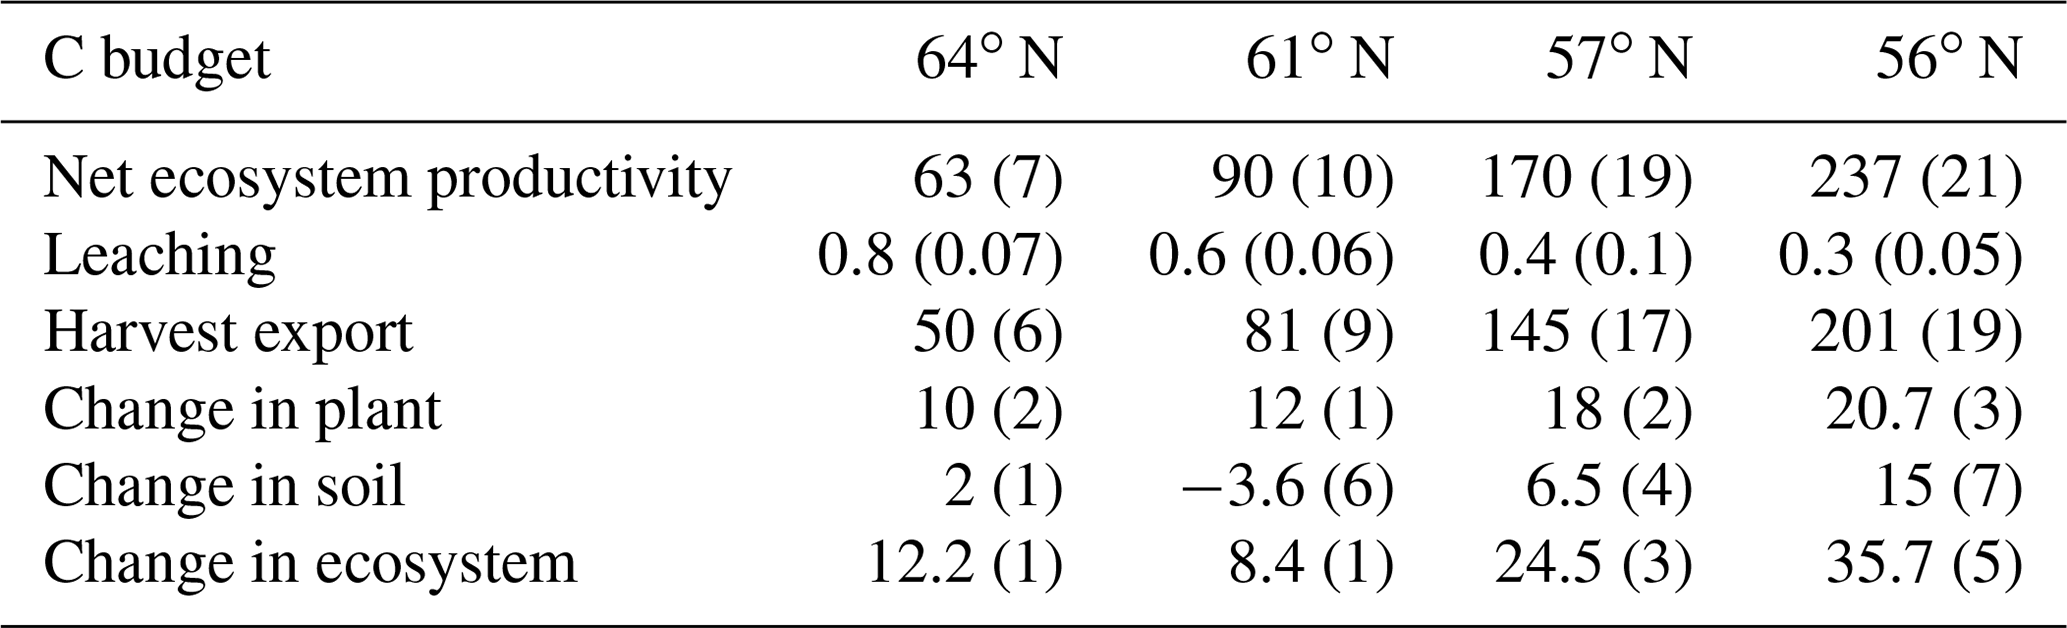

Figure C1Simulated annual mean harvested biomass amounts for the four studied regions at different shortcut uptake rates for N and P. The bar indicates the standard deviation for each data point (Table 2).
The model and extensive documentation, including tutorial exercises, are freely available from the CoupModel home page: http://www.coupmodel.com/ (last access: 2 December 2020). CoupModel is written in the C programming language and runs with a GUI under Windows but can also be run on other platforms without a GUI. Version 6.0, from 3 July 2019, was used for the presented simulations. This version is archived on Zenodo (https://doi.org/10.5281/zenodo.3547628, He et al., 2020a), as are the simulation files, including the model and calibration setup, parameterisation settings, and corresponding input and validation files. The files used to generate the sensitivity analysis in the Supplement are archived at Zenodo (https://doi.org/10.5281/zenodo.4291963, He et al., 2020b).
The supplement related to this article is available online at: https://doi.org/10.5194/gmd-14-735-2021-supplement.
AG formulated the project. HH conducted the literature review and developed the phosphorus model concepts with AG and PEJ. HH and PEJ implemented the phosphorus cycle code into CoupModel. HH performed the simulations and analysis. HH drafted the manuscript, to which AG and PEJ contributed.
The authors declare that they have no conflict of interest.
The authors express their gratitude to all persons who provided data and background information. Gunilla Pihl-Karlsson and Per-Erik Karlsson at IVL Göteborg provided regional P deposition data for the studied regions, whereas the Swedish Forest Agency (Olle Kellner) provided data on needle P and N contents, soil P, and regional P deposition across the studied regions. Magnus Svensson provided the regional simulation files with CoupModel v4.0, while Thomas Bosshard at SMHI provided the regional climate files. The Department of Aquatic Sciences and Assessment (SLU) contributed P concentrations from open-water data, while the Swedish Geological Survey (SGU) provided regional mineral P content data. The Swedish Forest Soil Inventory provided soil C∕N data. Cecilia Akeselson collected data for the SWETHRO project.
The project “incorporating phosphorus cycle into ecosystem models” was supported by MERGE (ModElling the Regional and Global Earth system) Further, we acknowledge the comments from participants of the N–P interaction workshops for the new model concepts, which was funded by MERGE and BECC (Biodiversity and Ecosystem services in a Changing Climate).
The Department of Biological and Environmental Sciences, University of Gothenburg, Sweden, and the strategic research area, along with ModElling the Regional and Global Earth system (MERGE), BECC (Biodiversity and Ecosystem services in a Changing Climate), and the Formas strong research environment IMPRESS (217-2011-1747) funded the study.
This paper was edited by Carlos Sierra and reviewed by two anonymous referees.
Aerts, R.: Nutrient resorption from senescing leaves of perennials: are there general patterns?, J. Ecol., 84, 597–608, 1996.
Akselsson, C., Pihl Karlsson, G., Karlsson, P.-E., and Ahlstrand, J.: Miljöövervakning på Obsytorna 1984–2013, Beskrivning, resultat, utvärdering och framtid, Skogsstyrelsen Rapport 2015:1, 142 pp., available at: https://shopcdn.textalk.se/shop/9098/art21/25828721-150940-Obsytor_webb.pdf (last access: 28 January 2021), 2015.
Akselsson, C., Westling, O., Alveteg, M., Thelin, G., Fransson, A. M., and Hellsten, S.: The influence of N load and harvest intensity on the risk of P limitation in Swedish forest soils, Sci. Total Environ., 404, 284–289, https://doi.org/10.1016/j.scitotenv.2007.11.017, 2008.
Almeida, J. P., Rosenstock, N. P., Forsmark, B., Bergh, J., and Wallander, H.: Ectomycorrhizal community composition and function in a spruce forest transitioning between nitrogen and phosphorus limitation, Fungal Ecol., 40, 20–31, https://doi.org/10.1016/j.funeco.2018.05.008, 2019.
Andersson, M., Carlsson, M., Ladenberger, A., Morris, G., Sadeghl, M., and Uhlbäck, J.: Geokemisk atlas över sverige, Sveriges Geologiska Undersökning, Uppsala, Sweden, 2014.
Arheimer, B., Dahné, J., Donnelly, C., Lindström, G., and Strömqvist, J.: Water and nutrient simulations using the HYPE model for Sweden vs. the Baltic Sea basin – influence of input-data quality and scale, Hydrol. Res., 43, 315–329, https://doi.org/10.2166/nh.2012.010, 2012.
Arnold, J. G., Daniel, N. M., Gassman, P. W., Abbaspour, K. C., and White, M. J.: SWAT: Model use, calibration, and validation, Transactions of the American Society of Agricultural and Biological Engineers, 55, 1491–1508, 2012.
Averill, C., Turner, B. L., and Finzi, A. C.: Mycorrhiza-mediated competition between plants and decomposers drives soil carbon storage, Nature, 505, 543–545, https://doi.org/10.1038/nature12901, 2014.
Bahr, A., Ellström, M., Bergh, J., and Wallander, H.: Nitrogen leaching and ectomycorrhizal nitrogen retention capacity in a Norway spruce forest fertilized with nitrogen and phosphorus, Plant Soil, 390, 323–335, https://doi.org/10.1007/s11104-015-2408-6, 2015.
Barrow, N. J.: The description of desorption of phosphate from soil, J. Soil. Sci., 30, 259–270, 1979.
Bell, C., Carrillo, Y., Boot, C. M., Rocca, J. D., Pendall, E., and Wallenstein, M. D.: Rhizosphere stoichiometry: are C : N : P ratios of plants, soils, and enzymes conserved at the plant species-level?, New Phytol., 201, 505–517, https://doi.org/10.1111/nph.12531, 2014.
Bolan, N. S.: A critical review on the role of mycorrhizal fungi in the uptake of phosphorus by plants, Plant Soil, 134, 189–207, 1991.
Braun, S., Thomas, V. F., Quiring, R., and Fluckiger, W.: Does nitrogen deposition increase forest production? The role of phosphorus, Environ. Pollut., 158, 2043–2052, https://doi.org/10.1016/j.envpol.2009.11.030, 2010.
Bucher, M.: Functional biology of plant phosphate uptake at root and mycorrhiza interfaces, New Phytol., 173, 11–26, https://doi.org/10.1111/j.1469-8137.2006.01935.x, 2007.
Bünemann, E. K.: Enzyme additions as a tool to assess the potential bioavailability of organically bound nutrients, Soil Biol. Biochem., 40, 2116–2129, https://doi.org/10.1016/j.soilbio.2008.03.001, 2008.
Bünemann, E. K.: Assessment of gross and net mineralization rates of soil organic phosphorus-A review, Soil Biol. Biochem., 89, 82–98, https://doi.org/10.1016/j.soilbio.2015.06.026, 2015.
Cintas, O., Berndes, G., Hansson, J., Poudel, B. C., Bergh, J., Börjesson, P., Egnell, G., Lundmark, T., and Nordin, A.: The potential role of forest management in Swedish scenarios towards climate neutrality by mid century, Forest Ecol. Manag., 383, 73–84, https://doi.org/10.1016/j.foreco.2016.07.015, 2017.
Clemmensen, K. E., Bahr, A., Ovaskainen, O., Dahlberg, A., Ekblad, A., Wallander, H., Stenlid, J., Finlay, R. D., Wardle, D. A., and Lindahl, B. D.: Roots and associated fungi drive long-term carbon sequestration in boreal forest, Science, 339, 1615–1618, https://doi.org/10.1126/science.1231923, 2013.
Cleveland, C. C. and Liptzin, D.: C:N:P stoichiometry in soil: is there a “Redfield ratio” for the microbial biomass?, Biogeochemistry, 85, 235–252, https://doi.org/10.1007/s10533-007-9132-0, 2007.
Cole, C. V., Innis, G. S., and Stewart, J. W. B.: Simulation of Phosphorus cycling in semiarid grasslands, Ecology, 58, 2–15, 1977.
Crowley, K. F., McNeil, B. E., Lovett, G. M., Canham, C. D., Driscoll, C. T., Rustad, L. E., Denny, E., Hallett, R. A., Arthur, M. A., Boggs, J. L., Goodale, C. L., Kahl, J. S., McNulty, S. G., Ollinger, S. V., Pardo, L. H., Schaberg, P. G., Stoddard, J. L., Weand, M. P., and Weathers, K. C.: Do nutrient limitation patterns shift from Nitrogen toward Phosphorus with increasing Nitrogen deposition across the northeastern United States?, Ecosystems, 15, 940–957, https://doi.org/10.1007/s10021-012-9550-2, 2012.
Deng, Q., Hui, D., Dennis, S., and Reddy, K. C.: Responses of terrestrial ecosystem phosphorus cycling to nitrogen addition: A meta-analysis, Global Ecol. Biogeogr., 26, 713–728, https://doi.org/10.1111/geb.12576, 2017.
Du, E., Terrer, C., Pellegrini, A. F. A., Ahlström, A., van Lissa, C. J., Zhao, X., Xia N., Wu, X., and Jackson, R. B.: Global patterns of terrestrial nitrogen and phosphorus limitation, Nat. Geosci., 13, 221–226. https://doi.org/10.1038/s41561-019-0530-4, 2020.
Eckersten, H. and Beier, C.: Comparison of N and C dynamics in two Norway spruce stands using a process oriented simulation model, Eniron. Pollut., 102, 395–401, https://doi.org/10.1016/S0269-7491(98)80059-6, 1998.
Elser, J. J., Bracken, M. E., Cleland, E. E., Gruner, D. S., Harpole, W. S., Hillebrand, H., Ngai, J. T., Seabloom, E. W., Shurin, J. B., and Smith, J. E.: Global analysis of nitrogen and phosphorus limitation of primary producers in freshwater, marine and terrestrial ecosystems, Ecol. Lett., 10, 1135–1142, https://doi.org/10.1111/j.1461-0248.2007.01113.x, 2007.
Ericsson, T.: Growth and shoot: root ratio of seedlings in relation to nutrient availability, Plant Soil, 168, 205–214, 1995.
Fleischer, K., Rammig, A., De Kauwe, M. G., Walker, A. P., Domingues, T. F., Fuchslueger, L., Garcia, S., Goll, D. S., Grandis, A., Jiang, M., Haverd, V., Hofhansl, F., Holm, J. A., Kruijt, B., Leung, F., Medlyn, B. E., Mercado, L. M., Norby, R. J., Pak, B., von Randow, C., Quesada, C. A., Schaap, K. J., Valverde-Barrantes, O. J., Wang, Y.-P., Yang, X., Zaehle, S., Zhu, Q., and Lapola, D. M.: Amazon forest response to CO2 fertilization dependent on plant phosphorus acquisition, Nat. Geosci., 12, 736–741, https://doi.org/10.1038/s41561-019-0404-9, 2019.
Fransson, A.-M. and Bergkvist, B.: Phosphorus fertilisation causes durable enhancement of phosphorus concentrations in forest soil, Forest Ecol. Manag., 130, 69–76, https://doi.org/10.1016/S0378-1127(99)00184-X, 2000.
Gärdenäs, A., Eckersten, H., and Lillemägi, M.: Modeling long-term effects of N fertilization and N deposition on the N balances of forest stands in Sweden, Swedish University of Agricultural Sciences, 34, 1651–7210, 2003.
Gärdenäs, A., Jansson, P.-E., and Karlberg, L.: A model of accumulation of radionuclides in biosphere originating from groundwater contamination, SKB report R-06-47, SKB, Solna, Sweden, 2006.
Gärdenäs, A., Ågren, G., Bird, J., Clarholm, M., Hallin, S., Ineson, P., Kätterer, T., Knicker, H., Nilsson, I., Näsholm, T., Ogle, S., Paustian, K., Persson, T., and Stendahl, J.: Knowledge gaps in soil carbon and nitrogen interactions – From molecular to global scale, Soil Biol. Biochem., 43, 702–717, https://doi.org/10.1016/j.soilbio.2010.04.006, 2011.
Gassman, P. W., Williams, J. R., Benson, V. W., César lzaurralde, R., Hauck, L. M., Jones, C. A., Atwood, J. D., Kiniry, J. D., and Flowers, J. D.: Historical development and applications of the EPIC and APEX models, CARD working paper 05-WP 397, Center for Agricultural and Rural Development, Iowa State University, Ames, IA, USA, https://doi.org/10.13031/2013.17074, 2005.
Giesler, R., Petersson, T., and Högberg, P.: Phosphorus limitation in boreal forests: effects of aluminum and iron accumulation in the humus layer, Ecosystems, 5, 300–314, https://doi.org/10.1007/s10021-001-0073-5, 2002.
Goll, D. S., Brovkin, V., Parida, B. R., Reick, C. H., Kattge, J., Reich, P. B., van Bodegom, P. M., and Niinemets, Ü.: Nutrient limitation reduces land carbon uptake in simulations with a model of combined carbon, nitrogen and phosphorus cycling, Biogeosciences, 9, 3547–3569, https://doi.org/10.5194/bg-9-3547-2012, 2012.
Goll, D. S., Vuichard, N., Maignan, F., Jornet-Puig, A., Sardans, J., Violette, A., Peng, S., Sun, Y., Kvakic, M., Guimberteau, M., Guenet, B., Zaehle, S., Penuelas, J., Janssens, I., and Ciais, P.: A representation of the phosphorus cycle for ORCHIDEE (revision 4520), Geosci. Model Dev., 10, 3745–3770, https://doi.org/10.5194/gmd-10-3745-2017, 2017.
Gress, E. S., Nichols, T. D., Northcraft, C. C., and Peterjohn, W. T.: Nutrient limitation in soils exhibiting differing nitrogenavailabilities: what lies beyond nitrogen saturation?, Ecology, 88, 119–130, https://doi.org/10.1890/0012-9658(2007)88[119:NLISED]2.0.CO;2, 2007.
Groenendijk, P., Renaud, L. V., and Roelsma, J.: Prediction of nitrogen and phosphorus leaching to groundwater and surface waters; process descriptions of the Animo4.0 model, Alterra–Report 983, 114 pp., Wageningen, The Netherlands, 2005.
Guidry, M. W. and Machenzie, F. T.: Apatite weathering and the phanerozoic phosphorus cycle, Geology, 28, 631–634, 2000.
Güsewell, S.: N : P ratios in terrestrial plants: variation and functional significance, New Phytol., 164, 243–266, https://doi.org/10.1111/j.1469-8137.2004.01192.x, 2004.
He, H., Meyer, A., Jansson, P.-E., Svensson, M., Rütting, T., and Klemedtsson, L.: Simulating ectomycorrhiza in boreal forests: implementing ectomycorrhizal fungi model MYCOFON in CoupModel (v5), Geosci. Model Dev., 11, 725–751, https://doi.org/10.5194/gmd-11-725-2018, 2018.
He, H., Jansson, P.-E., and Gärdenäs, A.: CoupModel (v6.0): code and evaluating database (Version V 6.0), Zenodo, https://doi.org/10.5281/zenodo.3547628, 2020a.
He, H., Jansson, P.-E., and Gärdenäs, A.: CoupModel (v6.0): Global parameter sensitivity analysis (Version V 6.0), Zenodo, https://doi.org/10.5281/zenodo.4291963, 2020b.
Hinsinger, P.: Bioavailability of soil inorganic P in the rhizosphere as affected by root-induced chemical changes: a review, Plant Soil, 237, 173–195, 2001.
Högberg, P., Näsholm, T., Franklin, O., and Högberg, M. N.: Tamm Review: On the nature of the nitrogen limitation to plant growth in Fennoscandian boreal forests, Forest Ecol. Manag., 403, 161–185, https://doi.org/10.1016/j.foreco.2017.04.045, 2017.
Ingestad, T.: Mineral nutrient requirements of Pinus silvestris and Picea abies Seedlings, Physiol. Plantarum, 45, 373–380, 1979.
Ingestad, T. and Ågren, G. I.: Theories and methods on plant nutrient and growth, Physiol Plantarum, 84, 177–184, 1992.
Jackson-Blake, L. A., Wade, A. J., Futter, M. N., Butterfield, D., Couture, R. M., Cox, B. A., Crossman, J., Ekholm, P., Halliday, S. J., Jin, L., Lawrence, D. S. L., Lepistö, A., Lin, Y., Rankinen, K., and Whitehead, P. G.: The INtegrated CAtchment model of phosphorus dynamics (INCA-P): Description and demonstration of new model structure and equations, Environ. Model. Softw., 83, 356–386, https://doi.org/10.1016/j.envsoft.2016.05.022, 2016.
Jahn, R., Blume, H.-P., Asio, V.-B., Spaargaren, O., and Schad, P.: Guidelines for soil description, Food and Agriculture Organization of the United Nations, Rome, Italy, 2006.
Jansson, P. E.: CoupModel: model use, calibration, and validation, T. ASABE, 4, 1335–1344, 2012.
Jansson, P. E. and Karlberg, L.: User manual of Coupled heat and mass transfer model for soil-plant-atmosphere systems, Royal Institute of Technology, Department of Land and Water Resources, Stockholm, Sweden, 2011.
Johnson, A. H., Frizano, J., and Vann, D. R.: Biogeochemical implications of labile phosphorus in forest soils determined by the Hedley fractionation procedure, Oecologia, 135, 487–499, https://doi.org/10.1007/s00442-002-1164-5, 2003.
Jonard, M., Furst, A., Verstraeten, A., Thimonier, A., Timmermann, V., Potocic, N., Waldner, P., Benham, S., Hansen, K., Merila, P., Ponette, Q., de la Cruz, A. C., Roskams, P., Nicolas, M., Croise, L., Ingerslev, M., Matteucci, G., Decinti, B., Bascietto, M., and Rautio, P.: Tree mineral nutrition is deteriorating in Europe, Glob. Change Biol., 21, 418–430, https://doi.org/10.1111/gcb.12657, 2015.
Jones, C. A., Cole, C. V., Sharpley, A. N., and Williams, J. R.: A simplified soil and plant phosphorus model: I. Documentation, Soil Sci. Soc. Am. J., 48, 800–805, https://doi.org/10.2136/sssaj1984.03615995004800040020x, 1984.
Kaiser, K. and Kalbitz, K.: Cycling downwards – dissolved organic matter in soils, Soil Biol. Biochem., 52, 29–32, https://doi.org/10.1016/j.soilbio.2012.04.002, 2012.
Kalbitz, K., Solinger, S., Park, J.-H., Michalzik, B., and Matzner, E.: Controls on the dynamics of dissolved organic matter in soils: a review, Soil Sci., 165, 277–304, 2000.
Knisel, W. G. and Turtola, E.: Gleams model application on a heavy clay soil in Finland, Agr. Water Manage., 43, 285–309, https://doi.org/10.1016/S0378-3774(99)00067-0, 2000.
Kronnäs, V., Akselsson, C., and Belyazid, S.: Dynamic modelling of weathering rates – the benefit over steady-state modelling, SOIL, 5, 33–47, https://doi.org/10.5194/soil-5-33-2019, 2019.
Lagerström, A., Esberg, C., Wardle, D. A., and Giesler, R.: Soil phosphorus and microbial response to a long-term wildfire chronosequence in northern Sweden, Biogeochemistry, 95, 199–213, https://doi.org/10.1007/s10533-009-9331-y, 2009.
Laiho, R. and Prescott, C. E.: Decay and nutrient dynamics of coarse woody debris in northern coniferous forests: a synthesis, Can. J. Forest Res., 34, 763–777, https://doi.org/10.1139/x03-241, 2004.
Lang, F., Bauhus, J., Frossard, E., George, E., Kaiser, K., Kaupenjohann, M., Krüger, J., Matzner, E., Polle, A., Prietzel, J., Rennenberg, H., and Wellbrock, N.: Phosphorus in forest ecosystems: New insights from an ecosystem nutrition perspective, J. Plant Nutr. Soil. Sci., 179, 129–135, https://doi.org/10.1002/jpln.201500541, 2016.
Liebig, J.: Die Chemie in ihrer Andwendung auf Agrikultur und Physiologie, Vieweg und Söhne, Braunschweig, Germany, 1840.
Linder, S.: Foliar analysis for detecting and correcting nutrient imbalances in Norway spruce, Ecol. Bull., 44, 178–190, 1995.
Manzoni, S., Trofymow, J. A., Jackson, R. B., and Porporato, A.: Stoichiometric controls on carbon, nitrogen, and phosphorus dynamics in decomposing litter, Ecol. Monogr., 80, 89–106, https://doi.org/10.1890/09-0179.1, 2010.
McGill, W. B. and Cole, C. V.: Comparative aspects of cycling of organic C, N, S and P through soil organic matter, Geoderma, 26, 267–286, 1981.
Medlyn, B. E., De Kauwe, M. G., Zaehle, S., Walker, A. P., Duursma, R. A., Luus, K., Mishurov, M., Pak, B., Smith, B., Wang, Y. P., Yang, X., Crous, K. Y., Drake, J. E., Gimeno, T. E., Macdonald, C. A., Norby, R. J., Power, S. A., Tjoelker, M. G., and Ellsworth, D. S.: Using models to guide field experiments: a priori predictions for the CO2 response of a nutrient- and water-limited native Eucalypt woodland, Glob. Change Biol., 22, 2834–2851, https://doi.org/10.1111/gcb.13268, 2016.
Meyer, A., Grote, R., Polle, A., and Butterbach-Bahl, K.: Simulating mycorrhiza contribution to forest C- and N cycling-the MYCOFON model, Plant Soil, 327, 493–517, https://doi.org/10.1007/s11104-009-0017-y, 2009.
Monteith, J. L.: Evaporation and environment, Symp. Soc. Exp. Biol., 16, 205–234, 1965.
Nasholm, T., Hogberg, P., Franklin, O., Metcalfe, D., Keel, S. G., Campbell, C., Hurry, V., Linder, S., and Hogberg, M. N.: Are ectomycorrhizal fungi alleviating or aggravating nitrogen limitation of tree growth in boreal forests?, New Phytol., 198, 214–221, https://doi.org/10.1111/nph.12139, 2013.
Nehls, U.: Mastering ectomycorrhizal symbiosis: the impact of carbohydrates, J. Exp. Bot., 59, 1097–1108, https://doi.org/10.1093/jxb/erm334, 2008.
Olander, L. and Vitousek, P.: Short-term controls over inorganic phosphorus during soil and ecosystem development, Soil Biol. Biochem., 37, 651–659, https://doi.org/10.1016/j.soilbio.2004.08.022, 2005.
Olsson, M. T., Erlandsson, M., Lundin, L., Nilsson, T., Nilsson, Å., and Stendahl, J.: Organic carbon stocks in Swedish Podzol soils in relation to soil hydrology and other site characteristics, Silva Fennica, 43, 209–222, 2009.
Ortiz, C. A., Lundblad, M., Lundström, A., and Stendahl, J.: The effect of increased extraction of forest harvest residues on soil organic carbon accumulation in Sweden, Biomass Bioenergy, 70, 230–238, https://doi.org/10.1016/j.biombioe.2014.08.030, 2014.
Orwin, K. H., Kirschbaum, M. U., St. John, M. G., and Dickie, I. A.: Organic nutrient uptake by mycorrhizal fungi enhances ecosystem carbon storage: a model-based assessment, Ecol. Lett., 14, 493–502, https://doi.org/10.1111/j.1461-0248.2011.01611.x, 2011.
Oulehle, F., Chuman, T., Hruška, J., Krám, P., McDowell, W. H., Myška, O., Navrátil, T., and Tesař, M.: Recovery from acidification alters concentrations and fluxes of solutes from Czech catchments, Biogeochemistry, 132, 251–272, https://doi.org/10.1007/s10533-017-0298-9, 2017.
Penuelas, J., Poulter, B., Sardans, J., Ciais, P., van der Velde, M., Bopp, L., Boucher, O., Godderis, Y., Hinsinger, P., Llusia, J., Nardin, E., Vicca, S., Obersteiner, M., and Janssens, I. A.: Human-induced nitrogen-phosphorus imbalances alter natural and managed ecosystems across the globe, Nat. Commun., 4, 2934, https://doi.org/10.1038/ncomms3934, 2013.
Read, D. J. and Perez-Moreno, J.: Mycorrhizas and nutrient cycling in ecosystems – a journey towards relevance?, New Phytol., 157, 475–492, https://doi.org/10.1046/j.1469-8137.2003.00704.x, 2003.
Reed, S. C., Yang, X., and Thornton, P. E.: Incorporating phosphorus cycling into global modeling efforts: a worthwhile, tractable endeavor, New Phytol., 208, 324–329, https://doi.org/10.1111/nph.13521, 2015.
Richardson, A. E. and Simpson, R. J.: Soil microorganisms mediating phosphorus availability update on microbial phosphorus, Plant Physiol., 156, 989–996, https://doi.org/10.1104/pp.111.175448, 2011.
Richardson, A. E., Barea, J.-M., McNeill, A. M., and Prigent-Combaret, C.: Acquisition of phosphorus and nitrogen in the rhizosphere and plant growth promotion by microorganisms, Plant Soil, 321, 305–339, https://doi.org/10.1007/s11104-009-9895-2, 2009.
Rosengren-Brinck, U. and Nihlgård, B.: Nutritional status in needles of Norway spruce in relation to water and nutrient supply, Ecol. Bull., 44, 168–177, 1995.
Rosling, A., Midgley, M. G., Cheeke, T., Urbina, H., Fransson, P., and Phillips, R. P.: Phosphorus cycling in deciduous forest soil differs between stands dominated by ecto- and arbuscular mycorrhizal trees, New Phytol., 209, 1184–1195, https://doi.org/10.1111/nph.13720, 2016.
Saito, M. A., Goepfert, T. J., and Ritt, J. T.: Some thoughts on the concept of colimitation: three definitions and the importance of bioavailability, Limnol. Oceanogr., 53, 276–290, 2008.
Schachtman, D. P., Reid, R. J., and Ayling, S. M.: Phosphorus uptake by plants: from soil to cell, Plant Physiol., 116, 447–453, 1998.
Schlesinger, W. H.: Biogeochemistry. An analysis of global change, Academic Press, Cambridge, MA, USA, 1997.
Schnepf, A. and Roose, T.: Modelling the contribution of arbuscular mycorrhizal fungi to plant phosphate uptake, New Phytol., 171, 669–682, https://doi.org/10.1111/j.1469-8137.2006.01771.x, 2006.
SLU: Skogsdata: Aktuella uppgifter om de svenska skogarna från Riksskogstaxeringen, SLU, Umeå, Sweden, available at: https://pub.epsilon.slu.se/9266/1/SkogsData2012_webb.pdf (last access: 10 February 2020), 2012.
Smeck, N. E.: Phosphorus dynamics in soils and landscapes, Geoderma, 36, 185–199, 1985.
Smith, S. E.: Mycorrhizal fungi can dominate phosphate supply to plants irrespective of growth responses, Plant Physiol., 133, 16–20, https://doi.org/10.1104/pp.103.024380, 2003.
Smith, S. E. and Read, D. J.: Mycorrhizal symbiosis, 3rd ed., Academic Press, Cambridge, MA, USA, 2008.
Staddon, P. L., Thompson, K., Jakobsen, I., Grime, J. P., Askew, A. P., and Fitter, A. H.: Mycorrhizal fungal abundance is affected by long-term climatic manipulations in the field, Glob. Change Biol., 9, 186–194, https://doi.org/10.1046/j.1365-2486.2003.00593.x, 2003.
Stendahl, J., Johansson, M.-B., Eriksson, E., Nilsson, Å., and Langvall, O.: Soil organic carbon in Swedish spruce and pine forests- differences in stock levels and regional patterns, Silva Fennica, 44, 5–21, 2010.
Sundqvist, M. K., Liu, Z., Giesler, R., and Wardle, D. A.: Plant and microbial responses to nitrogen and phosphorus addition across an elevational gradient in subarctic tundra, Ecology, 95, 1819–1835, https://doi.org/10.1890/13-0869.1, 2014.
Svensson, M., Jansson, P.-E., and Berggren Kleja, D.: Modelling soil C sequestration in spruce forest ecosystems along a Swedish transect based on current conditions, Biogeochemistry, 89, 95–119, https://doi.org/10.1007/s10533-007-9134-y, 2008.
Sverdrup, H. and Warfvinge, P.: Calculating field weathering rates using a mechanistic geochemical model PROFILE, Appl. Geochem., 8, 273–283, https://doi.org/10.1016/0883-2927(93)90042-F, 1993.
Swedish Forest Agency: Grundbok for skogsbrukare, Swedish Forest Agency, Jönköping, Sweden, 2005.
Talkner, U., Meiwes, K. J., Potočić, N., Seletković, I., Cools, N., De Vos, B., and Rautio, P.: Phosphorus nutrition of beech (Fagus sylvatica L.) is decreasing in Europe, Ann. For. Sci., 72, 919–928, https://doi.org/10.1007/s13595-015-0459-8, 2015.
Tang, Z., Xu, W., Zhou, G., Bai, Y., Li, J., Tang, X., Chen, D., Liu, Q., Ma, W., Xiong, G., He, H., He, N., Guo, Y., Guo, Q., Zhu, J., Han, W., Hu, H., Fang, J., and Xie, Z.: Patterns of plant carbon, nitrogen, and phosphorus concentration in relation to productivity in China's terrestrial ecosystems, P. Natl. Acad. Sci. USA, 115, 4033–4038, https://doi.org/10.1073/pnas.1700295114, 2018.
Tarvainen, L., Lutz, M., Rantfors, M., Nasholm, T., and Wallin, G.: Increased needle nitrogen contents did not improve shoot photosynthetic performance of mature nitrogen-poor Scots pine trees, Front. Plant Sci., 7, 1051, https://doi.org/10.3389/fpls.2016.01051, 2016.
Terrer, C., Vicca, S., Hungate, B. A., Phillips, R. P., and Prentice, I. C.: Mycorrhizal association as a primary control of the CO2 fertilization effect, Science, 353, 72–74, https://doi.org/10.1126/science.aaf4610, 2016.
Terrer, C., Jackson, R. B., Prentice, I. C., Keenan, T. F., Kaiser, C., Vicca, S., Fisher, J. B., Reich, P. B., Stocker, B. D., Hungate, B. A., Peñuelas, J., McCallum, I., Soudzilovskaia, N. A., Cernusak, L. A., Talhelm, A. F., Van Sundert, K., Piao, S., Newton, P. C. D., Hovenden, M. J., Blumenthal, D. M., Liu, Y. Y., Müller, C., Winter, K., Field, C. B., Viechtbauer, W., Van Lissa, C. J., Hoosbeek, M. R., Watanabe, M., Koike, T., Leshyk, V. O., Polley, H. W., and Franklin, O.: Nitrogen and phosphorus constrain the CO2 fertilization of global plant biomass, Nat. Clim. Change, 9, 684–689, https://doi.org/10.1038/s41558-019-0545-2, 2019.
Tessier, J. T. and Raynal, D. J.: Use of nitrogen to phosphorus ratios in plant tissue as an indicator of nutrient limitation and nitrogen saturation, J. Appl. Ecol., 40, 523–534, https://doi.org/10.1046/j.1365-2664.2003.00820.x, 2003.
Thelin, G., Rosengren-Brinck, U., Nihlgård, B., and Barkman, A.: Trends in needle and soil chemistry of Norway spruce and Scots pine stands in South Sweden 1985–1994, Environ. Poll., 99, 149–158, https://doi.org/10.1016/S0269-7491(97)00192-9, 1998.
Thelin, G., Rosengren, U., Callesen, I., and Ingerslev, M.: The nutrient status of Norway spruce in pure and in mixed-species stands, For. Ecol. Manage., 160, 115–125, https://doi.org/10.1016/S0378-1127(01)00464-9, 2002.
Thum, T., Caldararu, S., Engel, J., Kern, M., Pallandt, M., Schnur, R., Yu, L., and Zaehle, S.: A new model of the coupled carbon, nitrogen, and phosphorus cycles in the terrestrial biosphere (QUINCY v1.0; revision 1996), Geosci. Model Dev., 12, 4781–4802, https://doi.org/10.5194/gmd-12-4781-2019, 2019.
Tipping, E., Benham, S., Boyle, J. F., Crow, P., Davies, J., Fischer, U., Guyatt, H., Helliwell, R., Jackson-Blake, L., Lawlor, A. J., Monteith, D. T., Rowe, E. C., and Toberman, H.: Atmospheric deposition of phosphorus to land and freshwater, Environ. Sci. Process. Impacts., 16, 1608–1617, https://doi.org/10.1039/c3em00641g, 2014.
Van Sundert, K., Radujkovic, D., Cools, N., De Vos, B., Etzold, S., Fernandez-Martinez, M., Janssens, I., Merila, P., Penuelas, J., Sardans, J., Stendahl, J., Terrer, C., and Vicca, S.: Towards comparable assessment of the soil nutrient status across scales – review and development of nutrient metrics, Glob. Change Biol., e26, 392–409, https://doi.org/10.1111/gcb.14802, 2020.
Vincent, A. G., Sundqvist, M. K., Wardle, D. A., and Giesler, R.: Bioavailable soil phosphorus decreases with increasing elevation in a subarctic tundra landscape, PLoS One, 9, e92942, https://doi.org/10.1371/journal.pone.0092942, 2014.
Vitousek, P. M., Porder, S., Houlton, B. Z., and Chadwick, O. A.: Terrestrial phosphorus limitation: mechanisms, implications, and nitrogen-phosphorus interactions, Ecol. Appl., 20, 5–15, 2010.
Wallander, H., Mahmood, S., Hagerberg, D., Johansson, L., and Pallon, J.: Elemental composition of ectomycorrhizal mycelia identified by PCR-RFLP analysis and grown in contact with apatite or wood ash in forest soil, FEMS Microbiol. Ecol., 44, 57–65, https://doi.org/10.1111/j.1574-6941.2003.tb01090.x, 2003.
Wang, Y. P., Houlton, B. Z., and Field, C. B.: A model of biogeochemical cycles of carbon, nitrogen, and phosphorus including symbiotic nitrogen fixation and phosphatase production, Global Biogeochem. Cy., 21, GB1018, https://doi.org/10.1029/2006gb002797, 2007.
Wang, Y. P., Law, R. M., and Pak, B.: A global model of carbon, nitrogen and phosphorus cycles for the terrestrial biosphere, Biogeosciences, 7, 2261–2282, https://doi.org/10.5194/bg-7-2261-2010, 2010.
Wijk, S.: Skogsvårdsorganisationens skogliga observationsytor, Anvisningar för analys av markprover, version 1995-11-15, Skogsstyrelsen, Jönköping, Sweden, 1995.
Wijk, S.: Skogsvårdsorganisationens skogliga observationsytor, Manual – anvisningar för urval av träd för barrprovtagning, Version 1997-08-14, Skogsstyrelsen, Jönköping, Sweden, 1997.
Yanai, R. D.: Phosphorus budget of a 70-year-old northern hardwood forest, Biogeochemistry, 17, 1–22, https://doi.org/10.1007/BF00002757, 1992.
Yang, X., Thornton, P. E., Ricciuto, D. M., and Post, W. M.: The role of phosphorus dynamics in tropical forests – a modeling study using CLM-CNP, Biogeosciences, 11, 1667–1681, https://doi.org/10.5194/bg-11-1667-2014, 2014.
Yu, L., Zanchi, G., Akselsson, C., Wallander, H., and Belyazid, S.: Modeling the forest phosphorus nutrition in a southwestern Swedish forest site, Ecol. Model., 369, 88–100, https://doi.org/10.1016/j.ecolmodel.2017.12.018, 2018.
Zhang, J. and Elser, J. J.: Carbon:Nitrogen:Phosphorus stoichiometry in fungi: a meta-analysis, Front. Microbiol., 8, 1281, https://doi.org/10.3389/fmicb.2017.01281, 2017.
Zhu, Q., Riley, W. J., Tang, J., and Koven, C. D.: Multiple soil nutrient competition between plants, microbes, and mineral surfaces: model development, parameterization, and example applications in several tropical forests, Biogeosciences, 13, 341–363, https://doi.org/10.5194/bg-13-341-2016, 2016.
- Abstract
- Introduction
- Description of model structure and phosphorus model
- Description of the region used for simulation and model setup
- Results
- Discussion
- Conclusions
- Appendix A: Equations and parameterisation regarding the phosphorus processes that are analogous to nitrogen processes
- Appendix B: Simulated annual mean P, N, and C budgets, generated by varying three regional key parameters, including soil N∕P ratio and the shortcut uptake rates for N and P
- Appendix C: Sensitivity of annual harvested biomass to changes in the shortcut uptake rates for N and P
- Code and data availability
- Author contributions
- Competing interests
- Acknowledgements
- Financial support
- Review statement
- References
- Supplement