the Creative Commons Attribution 4.0 License.
the Creative Commons Attribution 4.0 License.
 | 25 Nov 2021
Globally consistent assessment of economic impacts of wildfires in CLIMADA v2.2
Gabriela Aznar-Siguan
Christopher Fairless
David N. Bresch
In light of the dramatic increase in economic impacts due to wildfires over recent years, the need for globally consistent impact modelling of wildfire damages is ever increasing. Insurance companies, individual households, humanitarian organizations, governmental authorities, and investors and portfolio owners are increasingly required to account for climate-related physical risks. In response to these societal challenges, we present an extension to the open-source and open-access risk modelling platform CLIMADA (CLImate ADAptation) for modelling economic impacts of wildfires in a globally consistent and spatially explicit approach. All input data are free, public and globally available, ensuring applicability in data-scarce regions of the Global South. The model was calibrated at resolutions of 1, 4 and 10 km using information on past wildfire damage reported by the disaster database EM-DAT. Despite the large remaining uncertainties, the model yields sound damage estimates with a model performance well in line with the results of other natural catastrophe impact models, such as for tropical cyclones. To complement the global perspective of this study, we conducted two case studies on the recent megafires in Chile (2017) and Australia (2020). The model is made available online as part of a Python package, ready for application in practical contexts such as disaster risk assessment, near-real-time impact estimates or physical climate risk disclosure.
- Article
(3160 KB) - Full-text XML
- BibTeX
- EndNote


Wildfire risk is rapidly increasing globally, leading to dramatic impacts on ecosystems, biodiversity and society. Economic damages threaten individual households, insurance companies and governmental authorities alike. Over the past few years, (re-)insurance firms and government agencies announced record losses due to wildfire hazards (Swiss Re, 2019). While insured losses due to wildfire accounted for less than 2 % of total insured losses during the period from 1985 to 2015, this number is up to 12.4 % for the period from 2016 to 2020 (Swiss Re, 2021). While changing land use and management, increasing climate extremes, and lengthening of fire seasons show clear human influence (Jolly et al., 2015; Abatzoglou and Williams, 2016), it is very possible that climate models still underestimate the rapid risk increase of wildfire activity (Sanderson and Fisher, 2020). However, the recent Fire Model Intercomparison Project (FireMIP) shows that most state-of-the-art fire models show clear skill in capturing trends of fire under global environmental change (Hantson et al., 2020).
In contrast to the modelling of wildfires within climate models, globally consistent economic loss modelling of wildfire damages is in its infancy, especially compared to other natural catastrophes such as earthquakes, tropical cyclones or flooding (Ward et al., 2020). In previous global studies, risk is often related to area burned by using satellite data (Cao et al., 2015; Meng et al., 2015) and not as the direct impact on people's livelihoods or infrastructure. On more local scales, several modelling groups developed highly skilled models for the analysis of fire spread (e.g. Tymstra et al., 2010; Finney, 1998, 2006) and risk (e.g. Miller and Ager, 2013; Thompson and Calkin, 2011; Thompson et al., 2015) with the aim of investigating highly complex research questions around fuel treatment, forestry planning, carbon budgets and wildland–urban interface (WUI) risk (Parisien et al., 2019). These models have further been used to assess the effects of climate change on regional wildfire risk (e.g. Lozano et al., 2017; Riley and Loehman, 2016). However, as these models typically depend on numerous different and highly resolved input variables and are computationally expensive to run, their transferability to data-scarce regions of the world is limited. The few existing wildfire loss models are typically proprietary, developed to estimate risks in regions of the Western world (where losses in USD terms are biggest) and not readily applicable on a global scale (e.g. Papakosta et al., 2017; Munich Re, 2021; Risk Frontier, 2021). Increasingly, the demand for globally consistent physical risk assessment comes also from the financial industry, in order to properly disclose financial risk (e.g. within the Task Force on Climate-related Financial Disclosures, TCFD, Westcott et al., 2020). To our understanding, no model has been developed to assess economic damages from wildfires on a continental to global scale. Accordingly, the review article on natural hazard risk assessment by Ward et al. (2020) identifies global wildfire risk as a “particularly understudied area of disaster risk assessment”.
The open-source software CLIMADA (CLImate ADAptation) (Aznar-Siguan and Bresch, 2019) is a well-established platform to assess the impacts of natural hazards and for the appraisal of adaptation options (Bresch and Aznar-Siguan, 2020). The framework allows for a fully probabilistic, event-based risk assessment based on the risk definition of the IPCC (IPCC, 2014) that depends on three components: hazard, exposure and vulnerability. The event-based modelling approach of CLIMADA has been used to conduct studies on, among others areas, the impacts of tropical cyclones on infrastructure (Gettelman et al., 2018; Eberenz et al., 2020a), the impacts of floods on displaced people (Kam et al., 2021), and the damage caused by European winter storms (Welker et al., 2021) and river floods (Sauer et al., 2021). In this study, we present and describe the newly developed module to assess the risk of wildfires to economic impacts.
We combine historical fire hazards from satellite data (Giglio et al., 2016) with CLIMADA's exposure model LitPop (Eberenz et al., 2020b). We then assess economic impacts with a vulnerability component calibrated using impact data of past events from the disaster risk database EM-DAT (Guha-Sapir, 2021) (Sect. 2). We present the result of our calibration in Sect. 3.1 and apply the model in two case studies for the recent megafires in Australia in 2019/20 and Chile in 2017 (Sect. 3.2). Finally, we discuss our results with a focus on the inherent uncertainties (Sect. 4) and conclude our study in Sect. 5.
In this study, we developed a new wildfire module with the CLIMADA impact modelling framework. It is fully open-source, written in Python and available on GitHub (https://github.com/CLIMADA-project/climada_python, last access: 22 November 2021). The CLIMADA framework matches geographic exposure (e.g. assets, people, infrastructure) to geographic hazard for every event and uses impact functions (also called vulnerability curves) to relate the two to calculate damages. The impact per exposure cell is the multiplication of the exposure's value by the generated mean damage degree, which is given by the impact function evaluated at the event's intensity at that location. See Aznar-Siguan and Bresch (2019) for more information on the CLIMADA methodology. With this framework, the wildfire model is built around the three components of hazard, exposure and vulnerability.
2.1 Data
2.1.1 Hazard
The data for historic events come from the Fire Information for Resource Management System (FIRMS) provided by NASA Earthdata (NASA, 2021). The measurements were acquired by the MODIS and VIIRS instruments on board different satellites to provide near-real-time active fire locations. By measuring the mid-infrared radiation, these instruments are able to detect thermal anomalies. With the help of a hybrid thresholding and contextual algorithm, each swat pixel is classified as a fire pixel or not (see Giglio et al., 2016, for MODIS instrument and Schroeder et al., 2014, for VIIRS instrument). The MODIS data are available starting from November 2000 at a resolution of 1 km, while the VIIRS data are available starting from January 2012 at a resolution of 375 m. Both data sets provide global coverage; are available for free online; and hold information on latitude, longitude, acquisition date, and the brightness in Kelvin [K] for each pixel identified as fire pixel. In this study we only worked with MODIS (Collection 6) data and even partly decreased the resolution, as this proved to yield sufficient results. However, the model is also fully operational with VIIRS data.
2.1.2 Asset exposure
Exposure data for the impact assessment of wildfires was taken from LitPop (Eberenz et al., 2020b). This data set combines night light intensity and population density to spatially distribute macroeconomic indicators (such as GDP, produced capital or total asset value) onto grid cells at resolutions as fine as 1 km globally. The approach allows consistent impact assessment on different resolutions across the whole globe. The data are publicly available online and available in CLIMADA via an API. In this study, we used data on 2019 total asset value (TAV) for calibration purposes.
2.1.3 Impact
We used impact data of past wildfires from the international disaster database EM-DAT from the Center for Research on the Epidemiology of Disasters (CRED) (Guha-Sapir, 2021) to calibrate our model. EM-DAT is a global database of natural and technological disasters, containing information on the impacts of more than 21 000 disasters in the world since 1900, of which 86 refer to wildfires that occurred since November 2000 (the start of the MODIS mission), and includes information on total economic damage. Information is provided at country level and is based on reports from UN agencies, non-governmental organizations, insurance companies, research institutes and press agencies. Given the broad range of sources and the lack of an international standard for the reporting of damage information, the data of EM-DAT contains inherent uncertainties (Bakkensen et al., 2018). In this study, reported damages were inflated to 2019 using EM-DAT's information of inflation to establish comparability in between the different events and to the exposure data.
2.2 Methods
2.2.1 Historical events
The new wildfire model in CLIMADA is made available within the python class “WildFire”. It computes the hazard properties from the FIRMS input. In this study, we map FIRMS data on a regular raster by using the “BallTree” nearest-neighbour algorithm (Pedregosa et al., 2011). If two FIRMS data points fall onto the same raster point, the maximum intensity is taken. As definition and information of wildfire events is highly inconsistent, we took all fires active within an administration level 1 area (admin 1, i.e. state level in the US) for the event duration as indicated by EM-DAT.
2.2.2 Impact functions
Impact functions are commonly used to relate mean damage ratios of exposure to a given hazard intensity (Aznar-Siguan and Bresch, 2019). We assume that the fire brightness temperature serves as a proxy for hazard intensity in all ways that fires cause damage to infrastructure. These are predominantly ember attack and radiant heat and only to a very small extent direct flame contact (Blanchi et al., 2006). As sub-peril impact data are extremely rare, such assumptions are commonly used in the modelling of natural hazard impacts, e.g. for the assessment of tropical cyclone damages where wind speed serves as proxy for torrential rain, surge induced flooding and landslides (Gettelman et al., 2018; Eberenz et al., 2020a).
As impact functions of several natural hazards resemble a sigmoid type (e.g. Welker et al., 2021; Sauer et al., 2021), we used the widely used idealized function proposed by Emanuel (2011):
where i at a given location is defined as
where Ilat,lon denotes the intensity of a fire at a specific grid point. Ithresh, the minimum intensity where damages occur (here chosen as a constant 295 K – the minimum value of a FIRMS data point to be displayed as a fire). Hence, Ihalf, which can be seen as the steepness of the sigmoid function, is the only parameter that undergoes calibration. We also examined sigmoid functions with two degrees of freedom by allowing Ithresh and Ihalf to move simultaneously. However, the additional complexity did not yield a noteworthy improvement in results, and the resulting impact functions look very similar in shape as Ithresh always gets set to a value close to 295 K.
2.2.3 Calibration
In order to assess economic damages, impact functions have to be calibrated. This is done iteratively, by comparing modelled damages against the reported damage from EM-DAT and thereby minimizing an error term (a cost function). In this study, the root-mean-square fraction (RMSF) serves as the cost function:
where the input variable N denotes the number of events, the estimated damage of event i and yi its reported damage. RMSF reflects the relative deviation between modelled and reported damages. We prefer this cost function over the widely used root-mean-square error (RMSE) as it weights all events equally, irrespective of their overall damage. Using RMSE would bias the result of our calibration towards the costliest events and thus towards rich countries.
To minimize RMSF with respect to Ihalf we used a Bayesian optimization method (Head et al., 2020), which iteratively computes impacts with CLIMADA. The Bayesian optimization method converged quickly, requiring less than 500 model runs to find an optimum value for Ihalf. We further performed a 10-fold cross-validation to gain a sense of accuracy of Ihalf. For this we randomly split our event impact data into training data (90 % of events) and test data (10 % of events) 10 times to estimate the uncertainty of Ihalf. For the final impact function we calibrated Ihalf on all data.
To gain further confidence in our results, we performed calibrations at 1, 4, and 10 km resolution (30, 120, and 300 arcsec). The assessment of the resulting RMSF for all resolutions and the respective cross-validations is displayed in the Appendix (Fig. A3).
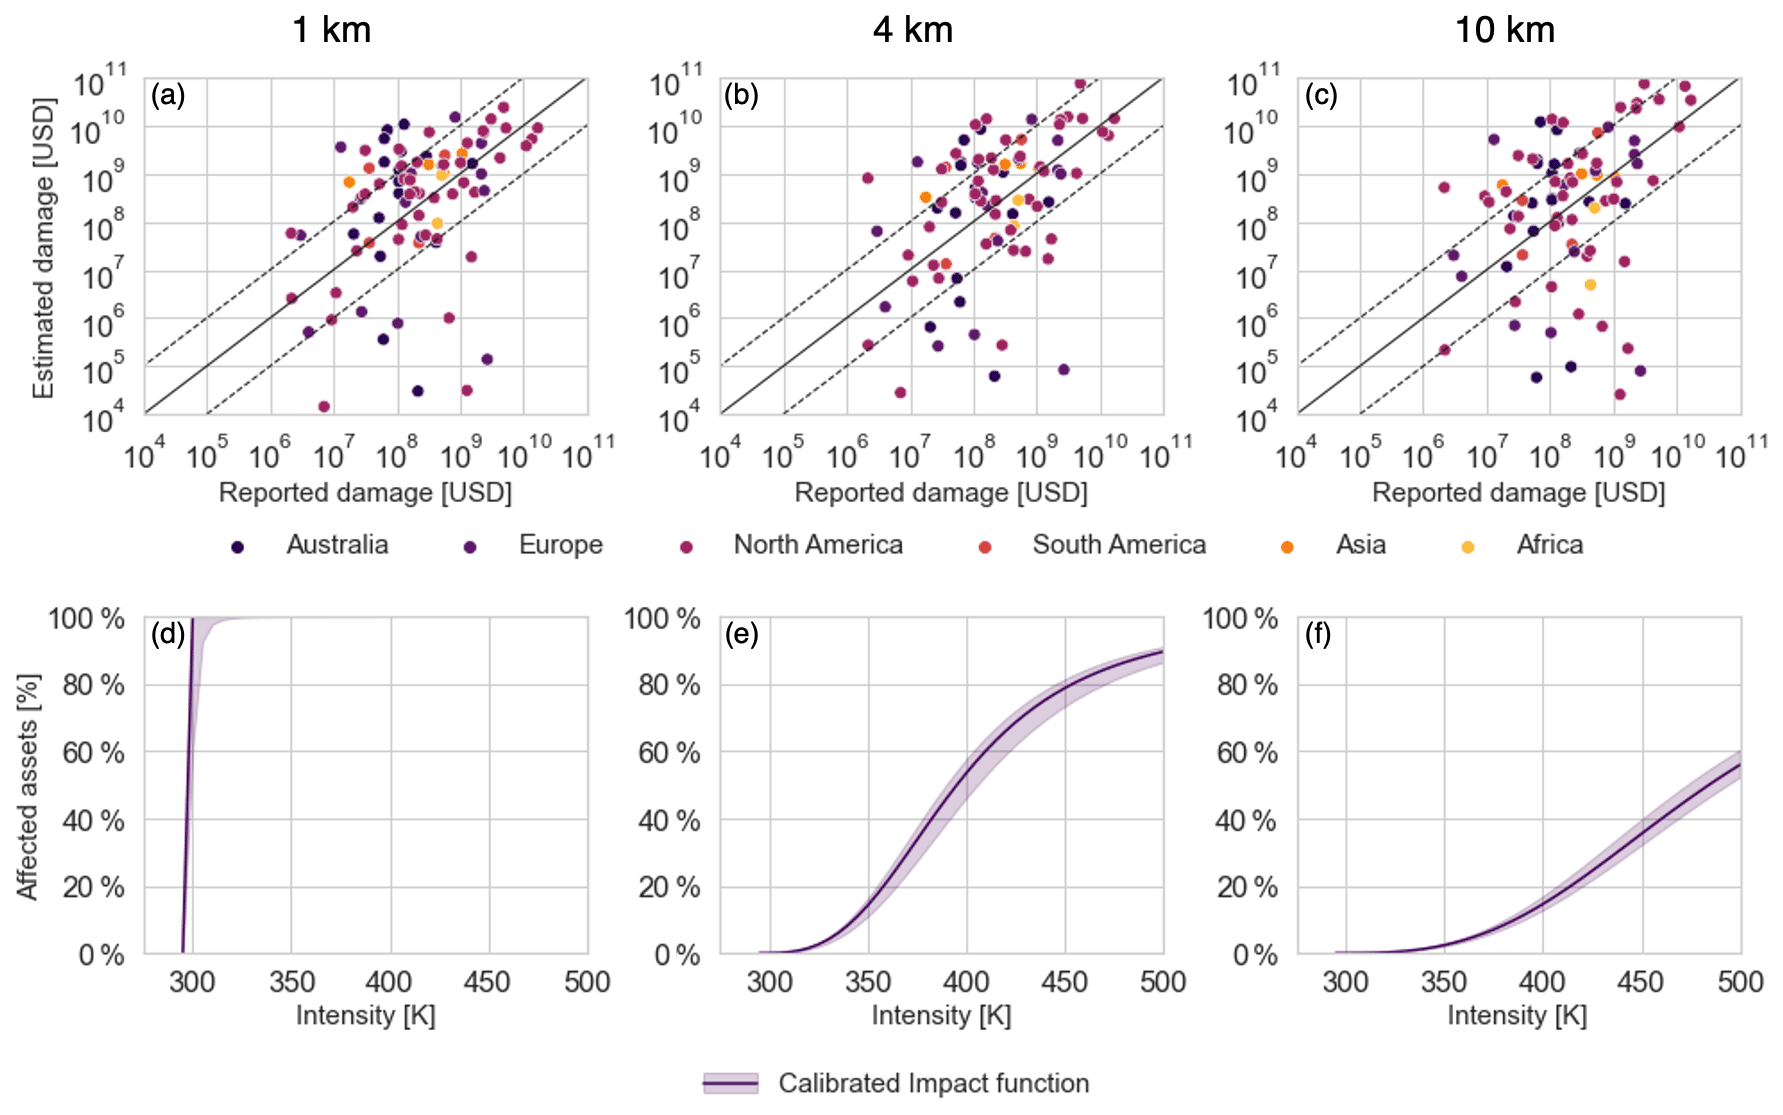
Figure 1(a–c) Reported damages against estimated damages for hazard and exposure resolutions of (a) 1 km, (b) 4 km, and (c) 10 km. The dotted lines indicate a deviation of an order of magnitude from a perfect estimate and colours group events by continent. (d–f) The corresponding calibrated impact functions for the different resolutions (d) 1 km, (e), 4 km and (f) 10 km, relating satellite-detected fire temperature to percentage damage. The shading indicates uncertainties as assessed using a 10-fold cross-validation of model parameter Ihalf.
3.1 Impact function calibration
We calibrated impact functions for hazard and exposure resolutions of 1, 4 and 10 km as displayed in Fig. 1d–f with the methodology described above. Damage estimates for past events are displayed against the reported damage data, (Fig. 1a–c). Event location, duration and total economic damage were retrieved from the EM-DAT database. For the modelling we downloaded FIRMS data for the respective country and for the event duration as indicated in EM-DAT. Information on the locations affected by the fires is reported highly heterogeneously, but it is always available at least on an admin 1 level (i.e. state level in the US). Hence, to allow for consistency, damage estimates were accumulated to admin 1 level. After calibrating for the three resolutions, the RMSF cost function (Eq. 3) was minimized best with 1 km resolution, equalling 20.8 (for Ihalf=295.0 K). At this high resolution, the impact function converges to a step function (Fig. 1a), which could be interpreted as all assets being destroyed wherever a fire is detected. We were concerned that the total exposure under higher-resolution footprints was not enough to recreate EM-DAT losses, resulting in the 100 % damage step function, but since damage estimates are not negatively biased we ruled this out. The model performed nearly equally well on a 4 km resolution, where a minimum RMSF of 22.6 was found (for Ihalf=409.4 K), which results in a smoother shape of the impact function. At 10 km resolution the model performed worse, with a minimum RMSF of 35.1 (for Ihalf=484.4 K). The obtained RMSF are well in line with impact function calibrations for other hazards, e.g. tropical cyclones where RMSF values in the range of 16.8–22.2 were found (Eberenz et al., 2020a). Although uncertainties remain substantial (see also Sect. 4.2), our approach performs well on the order of magnitude, as the two dotted lines in Fig. 1a–c indicate. This is true for 55 out of 86 events (64 %) at a 1 km resolution and 54 out of 86 events (63 %) at 4 km resolution (with 47/86 events (55 %) at 10 km). Most importantly, this ratio is even better for the most expensive events with reported damages of more than USD 1 billion, where 18 out of 21 (86 %) are estimated in the correct order of magnitude for 1 km resolution (76 % for 4 km and 62 % for 10 km). This is of great importance, as such events are of special interest to society and stakeholders. Looking at differences within 2 orders of magnitude, model estimates are correct for 90 % of the events on the 1 and 4 km scale (84 % for 10 km). We also conducted experiments on coarser resolutions (20 km, not shown); however, the results became inconclusive. We refrained from calibrating the model for resolutions below 1 km, as the LitPop approach is not suited for such assessments because detailed local features would gain relevance (Eberenz et al., 2020b).
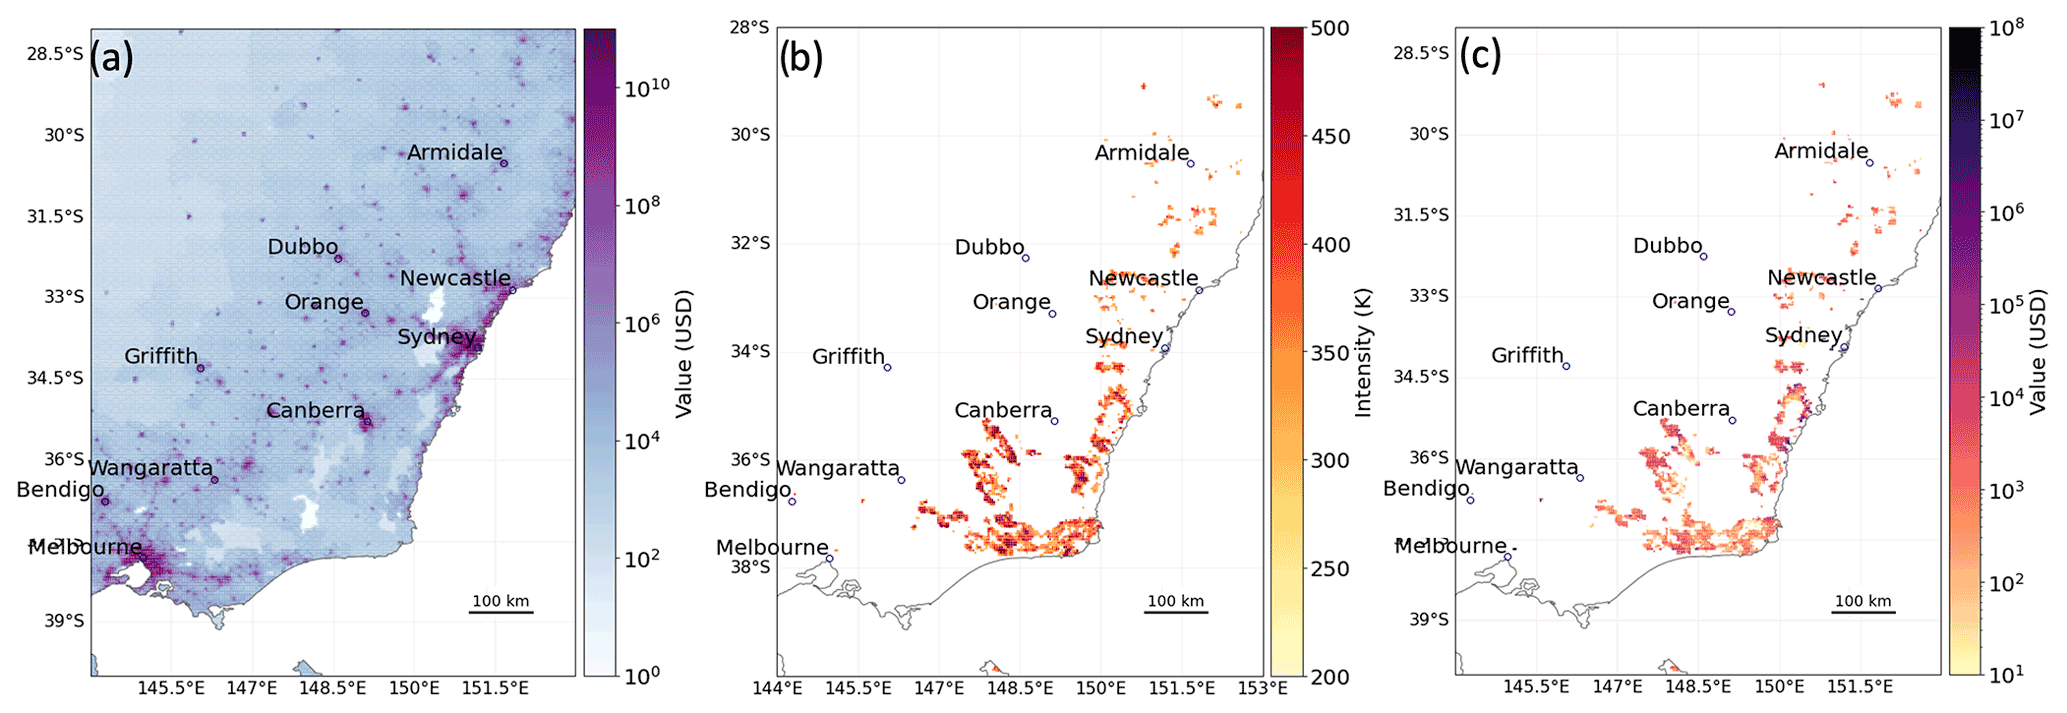
Figure 2Maps of south-eastern Australia showing (a) the spatial distribution of asset exposure value generated using LitPop, (b) the wildfires active between 29 December 2019 and 6 January 2020, and (c) the resulting damage per grid point as estimated by CLIMADA. The largest impacts stem from the comparably small fires close to Melbourne and Sydney.
The model shows no systematic error for individual continents. However, given that most reported damage data stems from the USA and Australia, the calibration is likely biased towards these regions. The model did not produce an impact for one instance in Chile, where EM-DAT reports an event in the province of Coquimbo during February 2002 with an impact of USD 100 million, but FIRMS data show no relevant fire activity in that province during that time span.
While not all events were individually investigated, we found our underestimations of damages are often linked to damages to rural assets, such as national park infrastructure, or expensive agricultural assets, such as timber resources or vineyards. In these cases, the exposure at peril is underrepresented, as the night-time luminosity of such assets is low. As an example, the greatly underestimated Great Smokey Mountains wildfire (reported damage of USD 1.2 billion, estimated damage of USD 30 000) that occurred in Tennessee in 2016 caused massive damage to a national park for which the infrastructure is not well represented in our exposure layer.
On the one hand, overestimates can sometimes be linked to damages along the wildland–urban interface (WUI), where even at 1 km resolution sub-grid information is required to precisely represent this critical boundary. Generally, increasing the resolution of the exposure layer (while keeping the hazard resolution constant) yields better results for all hazard resolutions (see Fig. A3 in the Appendix). On the other hand, increasing the resolution of the hazard yields steeper impact functions, which are not dependent on the exposure layer. This finding is important for the model's capability to work with different sources of exposure data (see Fig. A1 in the Appendix).
3.2 Model evaluation
In order to more closely assess model output on direct economic damages, we performed two case studies – one for the prominent 2019/2020 wildfire season in Australia and the other one for the January 2017 Chilean wildfires. While Chile is a comparably data-scarce country, the CLIMADA modelling approach requires no country-specific adjustment and thus facilitates studies in countries of the Global South. Both studies are conducted at a resolution of 4 km for hazard and exposure and with the impact function obtained from our calibration. We chose to use a resolution of 4 km as the calibration revealed that the model performs only slightly better on a resolution of 1 km. Hence, the higher resolution does not reliably provide additional value, while the potential errors in exposure disaggregation increase with higher resolution.
3.2.1 Australia 2020
The 2019/2020 Australian wildfire season, commonly referred to as the Black Summer Fires, shattered many records. More houses and land were burned than ever before in the country, over 1 billion animals were estimated to have been killed, while some species might even be driven to extinction by the fires (Filkov et al., 2020). As impacts of climate change become more and more detectable and earlier projections of increasing fire risk eventuate (Abram et al., 2021), government agencies and (re-)insurers are forced to act. Economic damages from the fires are estimated at roughly USD 1.5–2 billion (Guha-Sapir, 2021; Bevere, 2021), well in line with the CLIMADA estimate of USD 1.3 billion. The geographical distribution of fire damages emphasizes the need for a spatially explicit modelling framework for infrastructure damage assessment. While large parts of the fire are irrelevant in that perspective, the greatest damages stem from the densely populated areas, stressing again the importance of the WUI for economic damages.
3.2.2 Chile 2017

Figure 3Maps of Chile showing (a) the spatial distribution of asset exposure value generated using LitPop, (b) the wildfires active in January 2017, and (c) the resulting damage per grid point as estimated by CLIMADA.
In 2017, Chile suffered the worst wildfires in the country's history (De la Barrera et al., 2018). Chile is highly susceptible to wildfires due to its frequent periods of hot and dry weather, especially in its so-called Mediterranean region (32–39∘ S). Furthermore, 25 % of the Chilean urban population inhabits WUI areas (Sarricolea et al., 2020). The 2017 fires destroyed more than 3000 houses and burned down an area of more than 500 000 ha (De la Barrera et al., 2018). Economic damages are estimated to exceed USD 500 million (Guha-Sapir, 2021); the CLIMADA estimate of USD 1.8 billion is substantially higher but still within an order of magnitude. The overestimate is likely due to the WUI around the area of Concepción, where high damages occurred in our model that cannot be confirmed from newspaper or field reports. We chose this example to show how WUI interactions can sometimes lead to overestimations of damage. The fires also caused other impacts that are not included in the loss figures and not accounted for at all in our model setup – namely intense effects on health due to air pollution affecting three-quarters of the Chilean population but also an increased risk of flooding and landslides (De la Barrera et al., 2018).
4.1 Globally consistent wildfire risk assessment
In this study we present and describe a newly developed and calibrated model to assess economic damages of wildfires globally but at a high resolution. This has been identified as a particularly under-researched field (Ward et al., 2020). The model builds on the CLIMADA modelling platform, which is a broadly used tool for natural hazard impact assessment. The model produces sound estimates of wildfire damages on scales of 1 and 4 km and reasonable estimates on a scale of 10 km. Its capabilities in estimating impacts are well in line with well-established global impact models for natural hazards such as tropical cyclones (Geiger et al., 2016; Eberenz et al., 2020a). The improvement in damage estimates going from 4 to 1 km is relatively minor. We therefore expect that information on local exposure characteristics and exposure-specific vulnerability curves is likely to be more important to model improvements than further increases in exposure or hazard resolution. However, we refrained from working with better resolved regional data because this would conflict with our globally consistent approach. While the model results are less precise on a 10 km scale, we still regard this as a useful setup for coupling with regional climate models that are approaching such resolutions (Jacob et al., 2020). Furthermore, for many practical applications, such as financial risk disclosure, information on exposure is often available at a relatively coarse resolution (e.g. ZIP code level).
We deliberately refrained from producing traditional risk metrics such as exceedance frequency curves or time series analyses as we suspect that the analysis of past data would lead to an underestimation of current wildfire risk due to the strong inherent climate trend. However, as the FIRMS data are available in near real time, the model is well suited for rapid impact estimates, which are crucial for efficient disaster response and recovery (e.g. insurance payments or governmental response).
The CLIMADA platform provides interoperability with custom exposure data sets, given that they contain information on latitude, longitude, and exposed value. The calibrated vulnerability curves of this study might serve as a valid starting point for impact calculations with bespoke exposure data. However, especially at high resolution (<1 km), exposure-specific features gain importance, e.g. the distance between infrastructure and vegetation. Hence, a re-calibration might be required.
The model is open source and open access and can be applied to any location in the world, as it is designed to depend solely on freely available and easily accessible global data sets. Bespoke regional data might easily be included by users, given the open architecture of the approach.
4.2 Uncertainties
As with any impact modelling, assessment of economic impacts due to wildfires is subject to major uncertainties. Here, we discuss uncertainties that are inherent in this model. Identifying and addressing these uncertainties might also guide future research questions. Following Refsgaard et al. (2007), we distinguish between the sources and the nature of the uncertainties. The nature of uncertainty can be parted into epistemic and stochastic (or aleatory) uncertainty. The epistemic uncertainty can be understood as the uncertainty due to imperfect knowledge and the stochastic uncertainty as the uncertainty due to inherent variability (Refsgaard et al., 2007). The relevant sources of uncertainties are data and model uncertainty, and we will discuss their epistemic and stochastic uncertainty.
Looking at the epistemic data uncertainty, a major portion is due to the general lack of impact data. EM-DAT draws information from various different sources with no widely agreed-upon reporting standard (Guha-Sapir and Below, 2002). In addition, the blending of direct and indirect economic damages further enlarges the uncertainties. Thus, reported figures should not be considered hard data but rather rough estimates that come with uncertainties up to nearly an order of magnitude themselves (Guha-Sapir and Checchi, 2018). Furthermore, due to smaller reporting capabilities, uncertainties are likely bigger in poorer countries and thus within the most vulnerable communities. Finding reliable damage information is even harder when we look for data on a sub-national scale. The model has therefore been built to provide consistent impact estimates with similar precision to the source data and without systematic biases. Large uncertainties are also present within the exposure data. As LitPop hinges on night light luminosity and population density, agricultural assets can be substantially underestimated, as a vineyard is hardly differentiated from a fallow field. On the other hand, a motorway that is brightly illuminated during the whole night can lead to overestimations of exposure (Eberenz et al., 2020b). The fire detection error of MODIS data is 1.2 % (Giglio et al., 2016). Hence, in comparison to the other data sources, the hazard data come with little uncertainty: given the shape of the impact functions, small differences in fire intensity do not affect damage estimates very strongly. However, small forest clearings can register as false fire detections, while thick smoke might obscure large fires; therefore, fire extent data are also not perfect (Giglio et al., 2016).
On the side of the epistemic model uncertainty, the uncertainties stem from the design of CLIMADA, its wildfire module, and the choice of its parameters. In this study, we estimate impacts solely based on the heat of a fire – this is a strong simplification, as it is known that fires attack infrastructure through other processes, such as ember attack (Blanchi et al., 2006). We also do not include major drivers of economic losses in our model, such as smoke, health costs, fire suppression costs, business interruption or loss of tourism (Diaz, 2012). Given the source data uncertainty and our need for a globally consistent approach, we decided that a simpler model with fewer tunable parameters is more transparent, and just as able to reproduce the reported data, given the other epistemic uncertainties.
Finally, fire risk modelling is subject to major stochastic uncertainty. Although influenced by many factors, the spread of wildfires is chaotic. Whether or not a building catches fire or whether a fire is detected sufficiently early remain subject to (bad) luck. The co-location of fire and exposure in a model grid cell could lead to 0 % or 100 % damage. Thus, as is common in natural hazard impact modelling, uncertainties will always remain a major component of any results. Future work will be able to quantify this uncertainty and provide confidence intervals for losses.
We show that a reasonably simple, globally consistent wildfire impact model at 4 km resolution can reproduce past damages well. The newly developed model is calibrated at resolutions of 1, 4 and 10 km and returns damage estimates that are correct within an order of magnitude in 63 % of past events. For fire events causing more than USD 1 billion damages it has an even better performance of 76 %. The model is best suited to studies on regional or country levels or across multiple countries and continents. It further lends itself to applications with specialized exposure sets, for example the assessment of supply chain risks or risk disclosures of financial portfolios (e.g. TCFD), since the impact functions adjust for the precision of the input data. Even for local assessments, such as in climate adaptation studies (Souvignet et al., 2016), the model can serve as a valid starting point, as it lends itself to easy integration of bespoke data sets and straightforward re-calibration. If developed further in such a fashion, CLIMADA's framework can be used to comprehensively appraise adaptation options (Bresch and Aznar-Siguan, 2020), including from multi-hazard and multi-metric perspectives. The model, data and tutorials are available freely online.
We plan to develop this model further for fully probabilistic wildfire risk assessment, including coupling to regional climate models. Furthermore, since wildfire risk often emerges in combination with other hazards such as drought and heatwaves, in future work the model should be included in multi-hazard risk analysis to allow for a consistent, holistic view of risk, including compound events (Zscheischler et al., 2018).
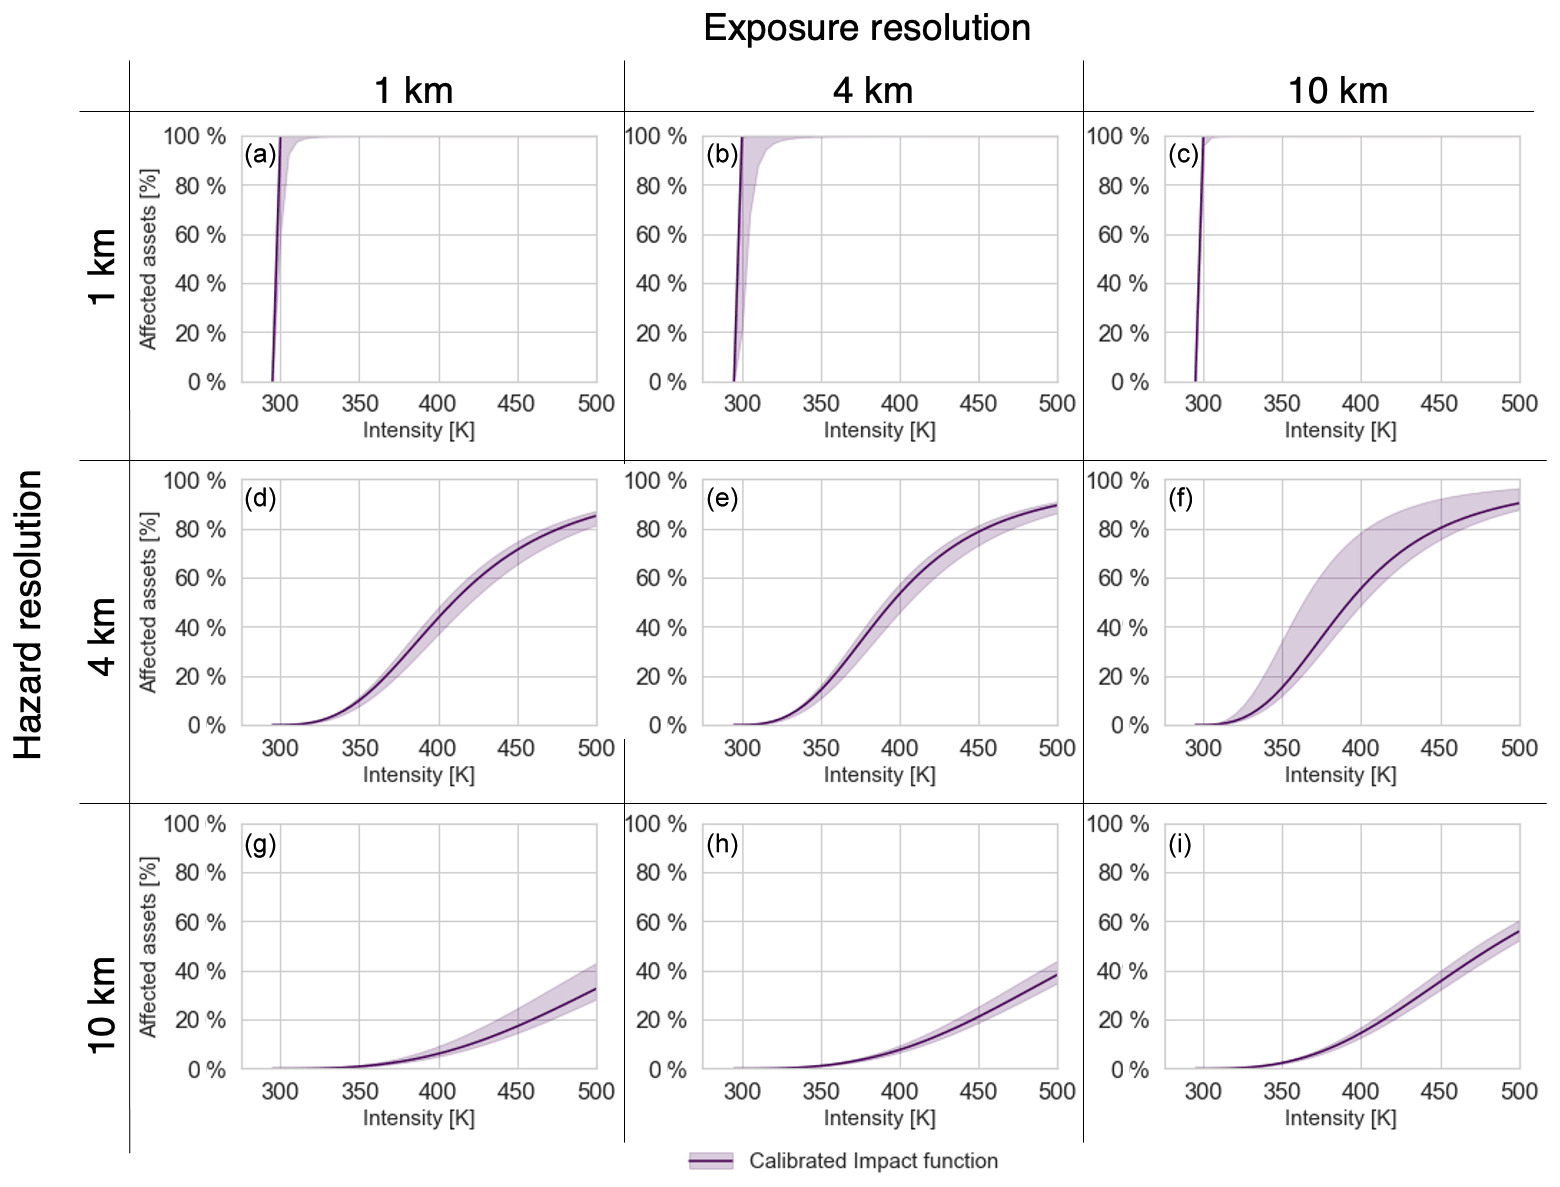
Figure A1Calibrated impact functions for different resolutions of hazard and exposure. The curves relate satellite-detected fire temperature to a damage percentage at that location. The shading indicates uncertainties as assessed using a 10-fold cross-validation of model parameter Ihalf (see Sect. 2.2.2). The shape of the impact functions remain relatively stable across different exposure resolutions and becomes steeper with increasing hazard resolution.

Figure A2Reported damages against estimated damages, coloured per continent for different hazard and exposure resolutions. The dotted lines indicate deviations of an order of magnitude.
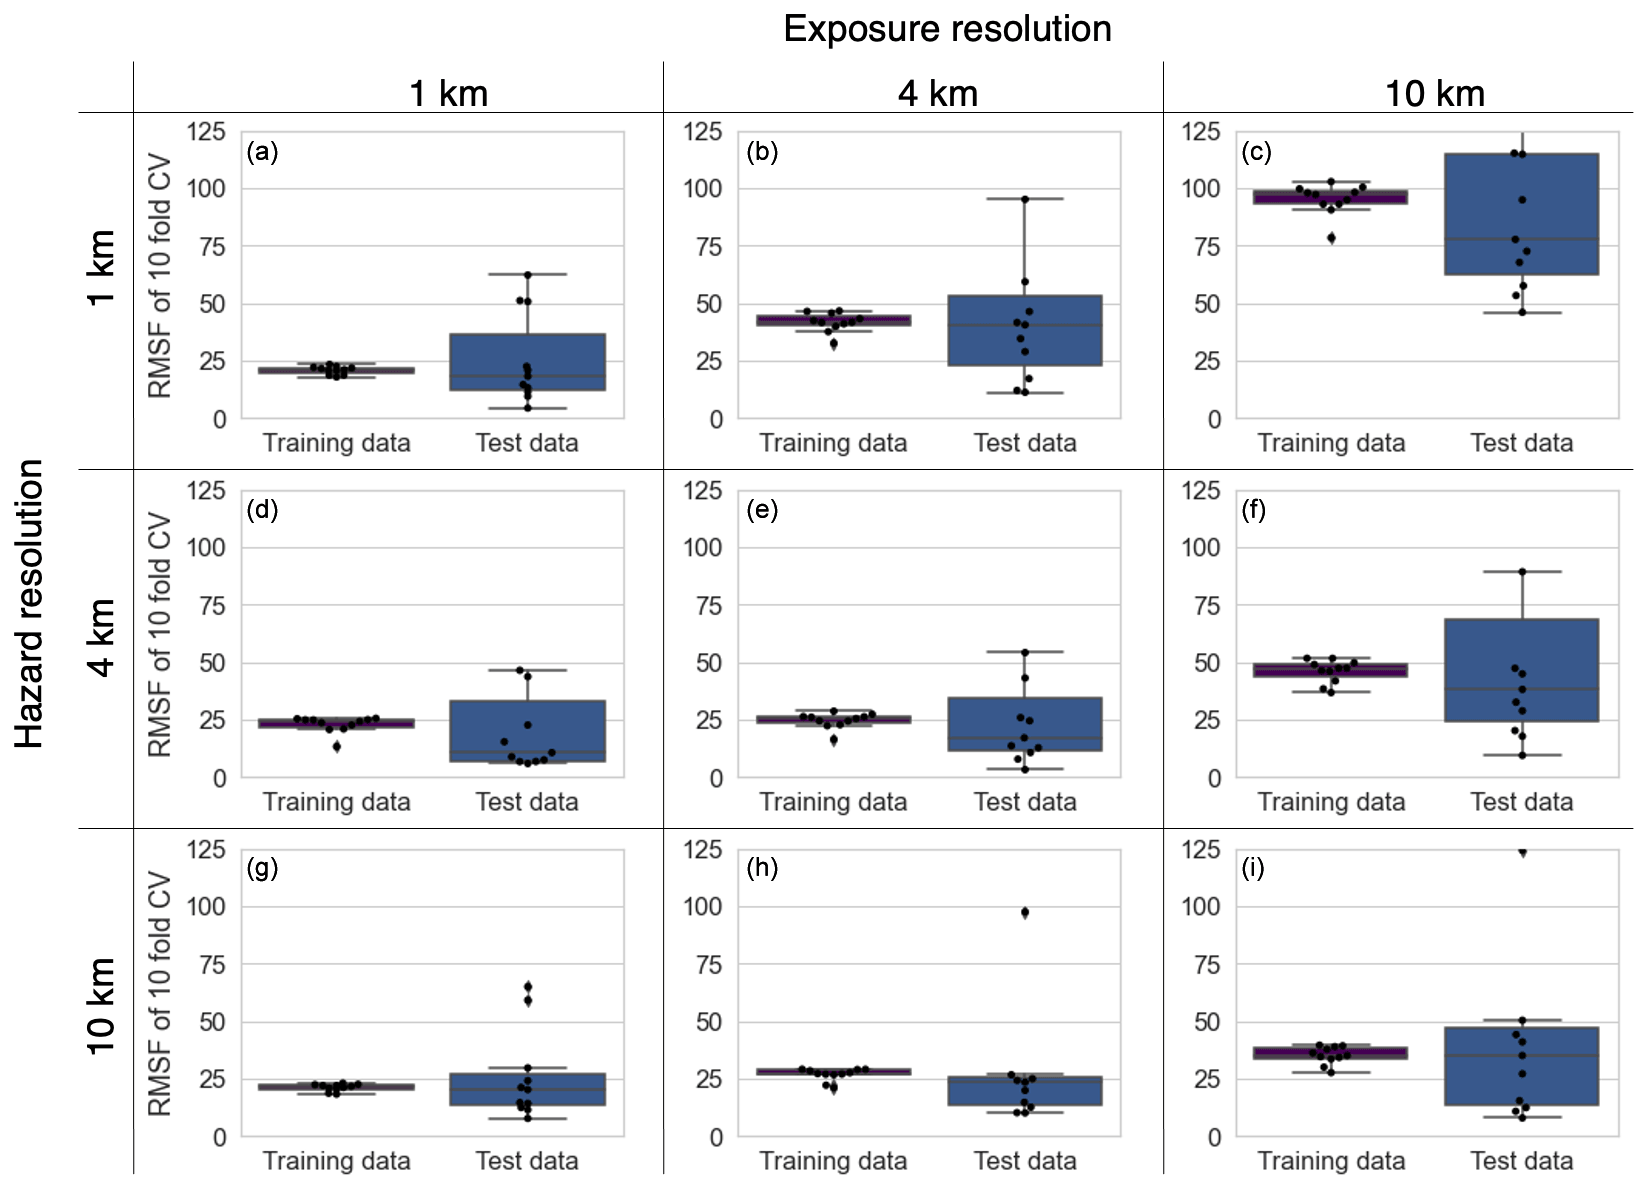
Figure A3Boxplots of RMSF of training and testing error as a result of a 10-fold cross-validation (CV) for different hazard and exposure resolutions. The black dots indicate individual results of each calibration. RMSF become smaller with higher exposure resolution. Testing errors are well in line with training errors, indicating no heavy data bias.
CLIMADA is openly available on GitHub at https://github.com/CLIMADA-project/climada_python (Aznar-Siguan and Bresch, 2019) under the GNU GPL license (GNU, 2007). CLIMADA version v2.1 was used for calculation performed for this publication. The whole wildfire module is made available within release v2.2 (https://doi.org/10.5281/zenodo.5084352, Aznar et al., 2021). Documentation and an interactive tutorial are available within the repository. The new wildfire module and scripts reproducing the main results and figures of this study are available under https://github.com/samluethi/CLIMADA_WildFire_Paper (last access: 22 November 2021) (https://doi.org/10.5281/zenodo.4911382, Lüthi, 2021). All data used in this study are free and publicly available as indicated in Sect. 2.1 or available upon request.
GAS developed the first version of the model. SL finalized the model development, performed the analysis and wrote the draft of the manuscript. CF contributed to the analysis of the results. DNB oversaw the model implementation and contributed to the analysis of results. All authors contributed to the writing of the paper.
The contact author has declared that neither they nor their co-authors have any competing interests.
Publisher’s note: Copernicus Publications remains neutral with regard to jurisdictional claims in published maps and institutional affiliations.
We want to thank Marine Pérus for developing an initial version of the wildfire module. We further acknowledge Chahan Kropf, Evelyn Mühlhofer, and Emanuel Schmid for reviewing our code and maintaining the CLIMADA platform. We would like to thank Olivia Romppainen-Martius and one anonymous referee for their supportive and valuable reviews.
This paper was edited by Gerd A. Folberth and reviewed by Olivia Romppainen-Martius and one anonymous referee.
Abatzoglou, J. T. and Williams, A. P.: Impact of anthropogenic climate change on wildfire across western US forests, Proceedings of the National Academy of Sciences, National Acad. Sciencesm., 113, 11770–11775, ISBN 0027-8424, 2016. a
Abram, N. J., Henley, B. J., Sen Gupta, A., Lippmann, T. J. R., Clarke, H., Dowdy, A. J., Sharples, J. J., Nolan, R. H., Zhang, T., Wooster, M. J., Wurtzel, J. B., Meissner, K. J., Pitman, A. J., Ukkola, A. M., Murphy, B. P., Tapper, N. J., and Boer, M. M.: Connections of climate change and variability to large and extreme forest fires in southeast Australia, Communications Earth & Environment, 2, 8, https://doi.org/10.1038/s43247-020-00065-8, 2021. a
Aznar-Siguan, G. and Bresch, D. N.: CLIMADA v1: a global weather and climate risk assessment platform, CLIMADA v1, Geosci. Model Dev., 12, 3085–3097, https://doi.org/10.5194/gmd-12-3085-2019, 2019. a, b, c, d
Aznar, G., Eberenz, S., Steinmann, C. B., Vogt, T., Roosli, T. ingajsa, Lüthi, S., Evelyn-M, Hartman, J., emanuel-schmid, Guillod, B. P., Stalhandske, Z., Ciullo, A., Kropf, C., Bresch, D. N., Pui Man (Mannie) Kam, wjan262, Fairless, C., Meiler, S., and DarioStocker: CLIMADA-project/climada_python: v2.2.0 (v2.2.0), Zenodo [code], https://doi.org/10.5281/zenodo.5084352, 2021. a
Bakkensen, L. A., Shi, X., and Zurita, B. D.: The Impact of Disaster Data on Estimating Damage Determinants and Climate Costs, Econ. Dis. Cli. Cha., 2, 49–71, https://doi.org/10.1007/s41885-017-0018-x, 2018. a
Bevere, L.: Yet more wildfires, Swiss Re Institute, available at: https://www.swissre.com/risk-knowledge/mitigating-climate-risk/yet-more-wildfires.html, last access: 22 November 2021. a
Blanchi, R., Leonard, J., and Leicester, R. H.: Bushfire risk at the rural/urban interface, in: Australasian Bushfire Conference, Brisbane, Australia, 6–9, 2006. a, b
Bresch, D. N. and Aznar-Siguan, G.: CLIMADA v1.4.1: towards a globally consistent adaptation options appraisal tool, Geosci. Model Dev., 14, 351–363, https://doi.org/10.5194/gmd-14-351-2021, 2021. a, b
Cao, X., Meng, Y., and Chen, J.: Mapping grassland wildfire risk of the world, in: World Atlas of Natural Disaster Risk, 277–283, Springer, Berlin, Heidelberg, 2015. a
De la Barrera, F., Barraza, F., Favier, P., Ruiz, V., and Quense, J.: Megafires in Chile 2017: Monitoring multiscale environmental impacts of burned ecosystems, Sci. Total Environ., 637, 1526–1536, https://doi.org/10.1016/j.scitotenv.2018.05.119, 2018. a, b, c
Diaz, J. M.: Economic impacts of wildfire, Southern Fire Exchange, 498, 2012–7, available at https://fireadaptednetwork.org/wp-content/uploads/2014/03/economic_costs_of_wildfires.pdf (last access: 22 November 2021), 2012. a
Eberenz, S., Lüthi, S., and Bresch, D. N.: Regional tropical cyclone impact functions for globally consistent risk assessments, Nat. Hazards Earth Syst. Sci., 21, 393–415, https://doi.org/10.5194/nhess-21-393-2021, 2020a. a, b, c, d
Eberenz, S., Stocker, D., Röösli, T., and Bresch, D. N.: Asset exposure data for global physical risk assessment, Earth Syst. Sci. Data, 12, 817–833, https://doi.org/10.5194/essd-12-817-2020, 2020b. a, b, c, d
Emanuel, K.: Global warming effects on US hurricane damage, Weather, Climate, and Society, 3, 261–268, https://doi.org/10.1175/WCAS-D-11-00007.1, 2011. a
Filkov, A. I., Ngo, T., Matthews, S., Telfer, S., and Penman, T. D.: Impact of Australia's catastrophic 2019/20 bushfire season on communities and environment, Retrospective analysis and current trends, Journal of Safety Science and Resilience, 1, 44–56, https://doi.org/10.1016/j.jnlssr.2020.06.009, 2020. a
Finney, M. A.: FARSITE, Fire Area Simulator – model development and evaluation, US Department of Agriculture, Forest Service, Rocky Mountain Research Station, 1998. a
Finney, M. A.: An overview of FlamMap fire modeling capabilities, in: Fuels Management – how to Measure Success: Conference Proceedings, edited by: Andrews, P. L., Butler, B. W., 28–30 March 2006; Portland, OR, Proceedings RMRS-P-41, Fort Collins, CO: US Department of Agriculture, Forest Service, Rocky Mountain Research Station, 41, 213–220, 2006. a
Geiger, T., Frieler, K., and Levermann, A.: High-income does not protect against hurricane losses, Environ. Res. Lett., 11, 084012, https://doi.org/10.1088/1748-9326/11/8/084012, 2016. a
Gettelman, A., Bresch, D. N., Chen, C. C., Truesdale, J. E., and Bacmeister, J. T.: Projections of future tropical cyclone damage with a high-resolution global climate model, Clim. Change, 146, 575–585, 2018. a, b
Giglio, L., Schroeder, W., and Justice, C. O.: The collection 6 MODIS active fire detection algorithm and fire products, Remote Sens. Environ., 178, 31–41, 2016. a, b, c, d
GNU: The GNU General Public License v3.0, GNU Project, Free Software Foundation, available at: https://www.gnu.org/licenses/gpl-3.0.html (last access: 22 November 2021), 2007. a
Guha-Sapir, D.: EM-DAT disaster risk database, CRED/UCLouvain, Brussels, Belgium, available at: https://www.emdat.be/, last access: 22 November 2021. a, b, c, d
Guha-Sapir, D. and Below, R.: The quality and accuracy of disaster data: A comparative analyse of 3 global data sets, Centre for Research on the Epidemiology of Disasters (CRED) Working Paper, Brussels: CRED, 2002. a
Guha-Sapir, D. and Checchi, F.: Science and politics of disaster death tolls, BMJ Brit. Med. J., 362, k4005, https://doi.org/10.1136/bmj.k4005, 2018. a
Hantson, S., Kelley, D. I., Arneth, A., Harrison, S. P., Archibald, S., Bachelet, D., Forrest, M., Hickler, T., Lasslop, G., Li, F., Mangeon, S., Melton, J. R., Nieradzik, L., Rabin, S. S., Prentice, I. C., Sheehan, T., Sitch, S., Teckentrup, L., Voulgarakis, A., and Yue, C.: Quantitative assessment of fire and vegetation properties in simulations with fire-enabled vegetation models from the Fire Model Intercomparison Project, Geosci. Model Dev., 13, 3299–3318, https://doi.org/10.5194/gmd-13-3299-2020, 2020. a
Head, T., Kumar, M., Nahrstaedt, H., Louppe, G., and Shcherbatyi, I.: scikit-optimize/scikit-optimize (v0.8.1), Zenodo, https://doi.org/10.5281/zenodo.4014775, 2020. a
Smith, K., Woodward, A., Campbell-Lendrum, D., Chadee, D., Honda, Y., Liu, Q., Olwoch, J., Revich, B., Sauerborn, R., Aranda, C. and Berry, H.: IPCC - IPPC AR5: Human health: impacts, adaptation, and co-benefits, in: Climate Change 2014: impacts, adaptation, and vulnerability, Part A: global and sectoral aspects, Contribution of Working Group II to the fifth assessment report of the Intergovernmental Panel on Climate Change, 709–754, Cambridge University Press, 2014. a
Jacob, D., Teichmann, C., Sobolowski, S., Katragkou, E., Anders, I., Belda, M., Benestad, R., Boberg, F., Buonomo, E., Cardoso, R. M., Casanueva, A., Christensen, O. B., Christensen, J. H., Coppola, E., De Cruz, L., Davin, E. L., Dobler, A., Domínguez, M., Fealy, R., Fernandez, J., Gaertner, M. A., García-Díez, M., Giorgi, F., Gobiet, A., Goergen, K., Gómez-Navarro, J. J., Alemán, J. J. G., Gutiérrez, C., Gutiérrez, J. M., Güttler, I., Haensler, A., Halenka, T., Jerez, S., Jiménez-Guerrero, P., Jones, R. G., Keuler, K., Kjellström, E., Knist, S., Kotlarski, S., Maraun, D., van Meijgaard, E., Mercogliano, P., Montávez, J. P., Navarra, A., Nikulin, G., de Noblet-Ducoudré, N., Panitz, H.-J., Pfeifer, S., Piazza, M., Pichelli, E., Pietikäinen, J.-P., Prein, A. F., Preuschmann, S., Rechid, D., Rockel, B., Romera, R., Sánchez, E., Sieck, K., Soares, P. M. M., Somot, S., Srnec, L., Sørland, S. L., Termonia, P., Truhetz, H., Vautard, R., Warrach-Sagi, K., and Wulfmeyer, V.: Regional climate downscaling over Europe: perspectives from the EURO-CORDEX community, Reg. Environ. Change, 20, 51, https://doi.org/10.1007/s10113-020-01606-9, 2020. a
Jolly, W. M., Cochrane, M. A., Freeborn, P. H., Holden, Z. A., Brown, T. J., Williamson, G. J., and Bowman, D. M.: Climate-induced variations in global wildfire danger from 1979 to 2013, Nat. Commun., 6, 1–11, 2015. a
Kam, P. M., Aznar-Siguan, G., Schewe, J., Milano, L., Ginnetti, J., Willner, S., McCaughey, J. W., and Bresch, D. N.: Global warming and population change both heighten future risk of human displacement due to river floods, Environ. Res. Lett., 16, 044026, https://doi.org/10.1088/1748-9326/abd26c, 2021. a
Lozano, O. M., Salis, M., Ager, A. A., Arca, B., Alcasena, F. J., Monteiro, A. T., Finney, M. A., Del Giudice, L., Scoccimarro, E., and Spano, D.: Assessing climate change impacts on wildfire exposure in Mediterranean areas, Risk Anal., 37, 1898–1916, 2017. a
Lüthi, S.: Globally consistent assessment of economic impacts of wildfires, Zenodo [code], https://doi.org/10.5281/zenodo.4911382, 2021. a
Meng, Y., Deng, Y., and Shi, P.: Mapping forest wildfire risk of the world, in: World atlas of natural disaster risk, 261–275, Springer, Berlin, Heidelberg, 2015. a
Miller, C. and Ager, A. A.: A review of recent advances in risk analysis for wildfire management, Int. J. Wildland Fire, 22, 1, https://doi.org/10.1071/WF11114, 2013. a
Munich Re: Bushfire & wildfire risks, Munich Re, available at: https://www.munichre.com/en/risks/ (last access: 22 November 2021), 2021. a
NASA: MCD14DL, Earth Data, https://doi.org/10.5067/FIRMS/MODIS/MCD14DL.NRT.006, 2021. a
Papakosta, P., Xanthopoulos, G., and Straub, D.: Probabilistic prediction of wildfire economic losses to housing in Cyprus using Bayesian network analysis, Int. J. Wildland Fire, 26, 10, https://doi.org/10.1071/WF15113, 2017. a
Parisien, M.-A., Dawe, D. A., Miller, C., Stockdale, C. A., and Armitage, O. B.: Applications of simulation-based burn probability modelling: a review, Int. J. Wildland Fire, 28, 913, https://doi.org/10.1071/WF19069, 2019. a
Pedregosa, F., Varoquaux, G., Gramfort, A., Michel, V., Thirion, B., Grisel, O., Blondel, M., Prettenhofer, P., Weiss, R., and Dubourg, V.: Scikit-learn: Machine learning in Python, J. Mach. Learn. Res., 12, 2825–2830, 2011. a
Refsgaard, J. C., van der Sluijs, J. P., Højberg, A. L., and Vanrolleghem, P. A.: Uncertainty in the environmental modelling process–a framework and guidance, Environ. Modell. Softw., 22, 1543–1556, 2007. a, b
Riley, K. L. and Loehman, R. A.: Mid‐21st‐century climate changes increase predicted fire occurrence and fire season length, Northern Rocky Mountains, United States, Ecosphere, 7, e01543, https://doi.org/10.1002/ecs2.1543, 2016. a
Risk Frontier: FireAUS – Detailed Loss Model – RISK FRONTIERS, available at: https://riskfrontiers.com/models/fireaus/, last access: 22 November 2021. a
Sanderson, B. M. and Fisher, R. A.: A fiery wake-up call for climate science, Nat. Clim. Change, 10, 175–177, https://doi.org/10.1038/s41558-020-0707-2, 2020. a
Sarricolea, P., Serrano-Notivoli, R., Fuentealba, M., Hernández-Mora, M., De la Barrera, F., Smith, P., and Meseguer-Ruiz, O.: Recent wildfires in Central Chile: Detecting links between burned areas and population exposure in the wildland urban interface, Sci. Total Environ., 706, 135894, 2020. a
Sauer, I. J., Reese, R., Otto, C., Geiger, T., Willner, S. N., Guillod, B. P., Bresch, D. N., and Frieler, K.: Climate signals in river flood damages emerge under sound regional disaggregation, Nat. Commun., 12, 2128, https://doi.org/10.1038/s41467-021-22153-9, 2021. a, b
Schroeder, W., Oliva, P., Giglio, L., and Csiszar, I. A.: The New VIIRS 375 m active fire detection data product: Algorithm description and initial assessment, Remote Sens. Environ., 143, 85–96, 2014. a
Souvignet, D. M., Wieneke, D. F., Mueller, L., and Bresch, D. D. N.: Economics of Climate Adaptation (ECA), Guidebook for Practitioners, p. 100, 2016. a
Swiss Re: sigma 2/2019: Secondary natural catastrophe risks on the front line, Tech. Rep. 2/2019, Swiss Re, Zurich, available at: https://www.swissre.com/institute/research/sigma-research/sigma-2019-02.html (last access: 22 November 2021), 2019. a
Swiss Re: sigma 1/2021: Natural catastrophes in 2020, Tech. Rep., 1, Swiss Re, Zurich, available at: https://www.swissre.com/institute/research/sigma-research/sigma-2021-01.html, last access: 22 November 2021. a
Thompson, M. P. and Calkin, D. E.: Uncertainty and risk in wildland fire management: a review, J. Environ. Manage., 92, 1895–1909, 2011. a
Thompson, M. P., Haas, J. R., Gilbertson-Day, J. W., Scott, J. H., Langowski, P., Bowne, E., and Calkin, D. E.: Development and application of a geospatial wildfire exposure and risk calculation tool, Environ. Modell. Softw., 63, 61–72, 2015. a
Tymstra, C., Bryce, R. W., Wotton, B. M., Taylor, S. W., and Armitage, O. B.: Development and structure of Prometheus: the Canadian wildland fire growth simulation model, Information Report NOR-X-417, (Edmonton, AB), Natural Resources Canada, Canadian Forest Service, Northern Forestry Centre, 2010. a
Ward, P. J., Blauhut, V., Bloemendaal, N., Daniell, J. E., de Ruiter, M. C., Duncan, M. J., Emberson, R., Jenkins, S. F., Kirschbaum, D., Kunz, M., Mohr, S., Muis, S., Riddell, G. A., Schäfer, A., Stanley, T., Veldkamp, T. I. E., and Winsemius, H. C.: Review article: Natural hazard risk assessments at the global scale, Nat. Hazards Earth Syst. Sci., 20, 1069–1096, https://doi.org/10.5194/nhess-20-1069-2020, 2020. a, b, c
Welker, C., Röösli, T., and Bresch, D. N.: Comparing an insurer's perspective on building damages with modelled damages from pan-European winter windstorm event sets: a case study from Zurich, Switzerland, Nat. Hazards Earth Syst. Sci., 21, 279–299, https://doi.org/10.5194/nhess-21-279-2021, 2021. a, b
Westcott, M., Ward, J., Surminski, S., Sayers, P., Bresch, D. N., and Claire, B.: Be Prepared: Exploring Future Climate-Related Risk for Residential and Commercial Real Estate Portfolios, The Journal of Alternative Investments, 23, 24–34, https://doi.org/10.3905/jai.2020.1.100, 2020. a
Zscheischler, J., Westra, S., van den Hurk, B. J. J. M., Seneviratne, S. I., Ward, P. J., Pitman, A., AghaKouchak, A., Bresch, D. N., Leonard, M., Wahl, T., and Zhang, X.: Future climate risk from compound events, Nat. Clim. Change, 8, 469–477, https://doi.org/10.1038/s41558-018-0156-3, 2018. a