the Creative Commons Attribution 4.0 License.
the Creative Commons Attribution 4.0 License.
 | 18 Nov 2021
Black carbon modeling in urban areas: investigating the influence of resuspension and non-exhaust emissions in streets using the Street-in-Grid model for inert particles (SinG-inert)
Jérémy Vigneron
Christophe Debert
Olivier Chrétien
Black carbon (BC) is a primary and inert pollutant often used as a traffic tracer. Even though its concentrations are generally low at the regional scale, BC presents very high concentrations in streets (at the local scale), potentially with important effects on human health and the environment. Modeling studies of BC concentrations usually underestimate BC concentrations due to uncertainties in both emissions and modeling. Both exhaust and non-exhaust traffic emissions present uncertainties, but the uncertainties with respect to non-exhaust emissions, such as tire, brake, and road wear as well as particle resuspension, are particularly high. In terms of modeling, street models do not always consider the two-way interactions between the local and regional scales. Using a two-way modeling approach, a street with high BC concentrations may influence urban background concentrations above the street, which can subsequently enhance the BC concentrations in the same street. This study uses the multiscale Street-in-Grid model (SinG) to simulate BC concentrations in a suburban street network in Paris, taking the two-way coupling between local and regional scales into account. The BC concentrations in streets proved to have an important influence on urban background concentrations. The two-way dynamic coupling leads to an increase in BC concentrations in large streets with high traffic emissions (with a maximal increase of about 48 %) as well as a decrease in narrow streets with low traffic emissions and low BC concentrations (with a maximal decrease of about 50 %).
A new approach to estimate particle resuspension in streets is implemented, strictly respecting the mass balance on the street surface. The resuspension rate is calculated from the available deposited mass on the street surface, which is estimated based on particle deposition and wash-off parameterizations adapted to street-canyon geometries. The simulations show that particle resuspension presents a low contribution to BC concentrations, as the deposited mass is not significant enough to justify high resuspension rates.
Non-exhaust emissions, such as brake, tire, and road wear, may largely contribute to BC emissions, with a contribution that is equivalent to exhaust emissions. Here, a sensitivity analysis of BC concentrations is performed by comparing simulations with different emission factors of tire, brake, and road wear. The different emission factors considered are estimated based on the literature. We found a satisfying model–measurement comparison using high tire wear emission factors, which may indicate that the tire emission factors usually used in Europe are probably underestimated. These results have important policy implications: public policies replacing internal combustion engines with electric vehicles may not eliminate BC air pollution but only reduce it by half.
- Article
(1944 KB) - Full-text XML
- BibTeX
- EndNote


Black carbon (BC) is a primary and chemically inert atmospheric pollutant, compound of PM2.5 (particulate matter with a diameter lower than 2.5 µm). BC background concentrations in urban areas are generally quite low, but they can reach high values in streets. The Parisian air quality agency (AIRPARIF) performed chemical speciation of particulate matter between September 2009 and September 2010 and found that the BC concentration represented approximately 4 % of the PM2.5 concentration in rural areas, 10 % in urban background regions, and reached up to 27 % in a street with heavy traffic (AIRPARIF, 2012). BC is mainly emitted by traffic and is often used as a traffic pollutant tracer (Invernizzi et al., 2011; de Miranda et al., 2019). During winter, wood burning for residential heating is also an important source of BC in some regions, such as Paris city (AIRPARIF, 2012). Special attention is paid to BC because of its potential impacts on human health. Recent studies have shown a strong correlation between BC concentrations and the occurrence of cancers (Lequy et al., 2021), respiratory and cardiovascular problems (Jansen et al., 2005; Highwood and Kinnersley, 2006; Janssen et al., 2011; Dons et al., 2012), and impacts on fetus development (Zhang et al., 2019a, b). BC is also responsible for environmental impacts due to its radiative properties (light absorption), which lead to visibility reduction (Tao et al., 2009; Chen et al., 2016; Li et al., 2019) and global warming (Jacobson, 2001; Chung and Seinfeld, 2005; Tripathi et al., 2005; Ramachandran and Kedia, 2010).
Although the BC concentration is high in urban streets, the BC concentration and its dispersion are often not modeled at the street scale. Most air quality studies regarding BC employ statistical regression techniques that estimate BC concentrations over a street network based on meteorological data and point observations (Richmond-Bryant et al., 2009; Awad et al., 2017; Van den Bossche et al., 2018; Sanchez et al., 2018; Van den Hove et al., 2019; Boniardi et al., 2019; Liu et al., 2019; Jones et al., 2020). When street or street-network models are used, emission data are often modified and/or are coupled to observational data to improve the modeled concentrations. For example, Brasseur et al. (2015) used a street model over two street canyons in Brussels. To achieve the high BC concentrations observed in the streets, a correction factor of 3.0 was applied to traffic emissions calculated with COPERT IV, a database that provides traffic emission factors for European vehicles (Ntziachristos and Samaras, 2018). This underestimation is also suggested in studies using more complex local-scale models for BC dispersion. For example, Tong et al. (2011) simulated BC concentrations using the Comprehensive Turbulent Aerosol Dynamics and Gas Chemistry (CTAG) model in the urban South Bronx region of New York. A good correlation between observed and simulated BC concentrations was reached by combining field measurements and numerical simulations and by increasing the number of heavy-duty diesel vehicles in the morning peaks (and, consequently, the BC emissions) by 15 %. The corrections applied to BC emissions in these studies suggest an underestimation of BC emissions.
Uncertainties in BC concentrations modeled with street-network models are partly due to uncertainties in traffic emissions. Traffic emissions are classified as exhaust emissions and as non-exhaust emissions, such as tire, brake, and road wear emissions as well as particle resuspension. On the one hand, exhaust emissions are relatively well known, as they are characterized under controlled laboratory conditions. Nowadays, exhaust emission factors in Europe are determined according to the vehicle technology and fuel, providing realistic emission factors for a diverse vehicle fleet. Details about vehicle categories, technologies, and fuel are given in the European Monitoring and Evaluation Program (EMEP) guidelines (Ntziachristos and Samaras, 2018). However, Ntziachristos and Samaras (2018) also provided information about BC emissions by reporting the speciation of PM2.5 in the form of ratios. These ratios vary depending on the vehicle category (light-duty vehicles, LDVs, or heavy-duty vehicles, HDVs), fuel, and the regulatory standard of the vehicle manufacturing (Euro-Norm), as presented in Table 3.91 of Ntziachristos and Samaras (2018). The uncertainties in the ratios depend on the vehicle category. For light-duty diesel vehicles, which present the highest ratios, the uncertainties in the ratios are quite low, ranging from 5 to 10 %. For diesel vehicles equipped with a particle filter, the uncertainties are high (about 50 %) but with a lower ratio than other diesel vehicles as well as a lower PM2.5 emission rate.
On the other hand, non-exhaust emissions are still not well known in the literature, and they are not included in regulatory emission legislation. Non-exhaust emissions consist of particles emitted from vehicle operations and are linked to tire, brake, and road wear as well as resuspension. Their emission factors are greatly variable and are associated with large uncertainties. Uncertainties in non-exhaust emissions can be explained by the difficulty involved in dissociating the emissions from the different processes and by the great variability in (i) the tire, brake, and road constituents used in different locations; (ii) the vehicle characteristics, such as weight and the location of driving wheels; (iii) the vehicle operational conditions, such as vehicle speed and ambient temperature; and (iv) the methodologies to determinate wear emission factors, such as direct measurements in situ, wind-tunnel experiments, or receptor-oriented methods (Boulter, 2005; Thorpe and Harrison, 2008). These uncertainties are reflected in the estimation of the contribution of non-exhaust emissions to the PM concentration observed in the literature, as detailed in Sect. 2.
Another aspect that may affect the underestimation of BC concentrations in simulations is the one-way coupling approach usually employed in street-network or local-scale models. Street-network models often use prescribed background concentrations. Although the vertical mass transfer between streets and the background influences the concentrations in streets, its influence on the background concentrations is often neglected. The multiscale Street-in-Grid (SinG) model combines the Model of Urban Network of Intersecting Canyons and Highways (MUNICH) (Lugon et al., 2020a; Kim et al., 2018) for modeling street concentrations and Polaid3D for modeling background concentrations (Sartelet et al., 2007), allowing one to simulate the local and regional scale simultaneously. SinG performs a two-way coupling between the regional and local scales, taking the influence of the vertical mass transfer between the background and streets on both the background and street concentrations into account in each iteration. This two-way coupling between streets and the background can be especially important for BC, as the concentrations observed in streets are considerably larger than BC concentrations in the urban background. Previous studies on gas-phase pollutants have observed an important effect of two-way coupling on NO2, NO, and NOx concentrations in streets, which may reach 60 % in streets with high traffic emissions (Lugon et al., 2020a; Kim et al., 2018).
This study presents simulations of BC concentrations in a Parisian suburban street network using the SinG model. It investigates the influence of non-exhaust emissions on BC concentrations in streets, presenting a sensitivity analysis of wear emission factors and a new approach to estimate particle resuspension while respecting mass conservation at the street surface. It also investigates the importance of a two-way coupling between the regional and local scales by comparing BC concentrations in streets calculated by SinG with those calculated by MUNICH as a stand-alone model (MUNICH-only). Emission factors of tire, brake, and road wear are calculated based on the literature, and sensitivity tests are performed. Model–data comparisons are based on BC observations performed during the “Multiscale Modeling of Traffic Pollutants in Urban Area” (TRAFIPOLLU) campaign (https://trimis.ec.europa.eu/project/multiscale-modeling-traffic-pollutants-urban-area, last access: 2 November 2021), in a street called “Boulevard Alsace Lorraine”. The same measurement site was used by Kim et al. (2018) for the evaluation of NOx and NO2 concentrations simulated by SinG. Section 3 describes SinG, emphasizing the parameterizations of particles' deposition, wash-off, and resuspension. Section 4 summarizes the simulations' setup at the both regional and local scales. Section 5 describes the sensitivity analysis to estimate the importance of tire, brake, and road wear emissions on BC concentrations, and Sect. 6 presents the influence of the two-way coupling between the regional and local scales on BC concentrations in streets.
As mentioned in Sect. 1, non-exhaust emissions still present high uncertainties, and great variability in emission factors is observed in the literature. This section presents an overview of the different studies that estimate particulate non-exhaust emissions. It also includes some studies that investigate their BC content.
According to Berdowski et al. (2002), non-exhaust emissions only contribute to 3.1 % of PM10 and 1.7 % of PM2.5 concentrations in European countries; in France, these values are 2.2 % of PM10 and 1.1 % of PM2.5. Similarly, Dore et al. (2003) estimated that the contribution of non-exhaust emissions is low: they estimated that 80 % of inhalable PM is emitted from road traffic, of which only 3 % is non-exhaust emissions. In contrast, other studies have estimated that the contribution of non-exhaust emissions is very high. Rauterberg-Wulff (1999) obtained tire wear emission factors using wind-tunnel experiments under controlled conditions that were of the same order of magnitude as diesel exhaust emissions. Using tunnel measurement techniques, Lawrence et al. (2016) quantified PM10 emission factors from exhaust and non-exhaust sources for a vehicle fleet. They estimated the non-exhaust PM10 emission factor to be 50 % higher than the exhaust emission factor: 49 % of PM10 emissions were estimated to be non-exhaust emissions, 33 % were estimated to be exhaust emissions, and 18 % were considered to be unexplained emissions. Brake and road wear presented an important contribution to PM10 emissions, with almost the same emission factor as petrol exhaust. The resuspension process had the highest emission factor (10.4 mg per vehicle kilometer against 4.5 mg per vehicle kilometer of petrol exhaust and 8.3 mg per vehicle kilometer of diesel exhaust), followed by unexplained sources (7.2 mg per vehicle kilometer). Harrison et al. (2001) measured PM10 and PM2.5 at five sites in the United Kingdom in order to perform a correlation between emission sources and PM10 concentrations. They estimated that the mass of coarse particles (PM2.5–10) from non-exhaust emissions is approximately the same as the mass of fine particles (PM2.5) from exhaust emissions. Note that important differences are observed in their size distribution. Exhaust emissions are composed of tiny particles, with diameters lower than 1 µm (Ntziachristos and Samaras, 2018). Particles from non-exhaust emissions are coarser. According to the European emission guidelines (Ntziachristos and Boulter, 2016), 60 % of particles emitted from tire wear are PM10, 42 % are PM2.5, and only 6 % are PM1. Particles from brake wear emissions have lower diameters: 98 % are PM10, 39 % are PM2.5, and 10 % are PM1. The coarsest particles are those from road wear: 50 % are PM10, 27 % are PM2.5, and there is no PM1. The non-exhaust emissions can also be very important for secondary particle formation, especially regarding secondary organic aerosol (SOA). Khare et al. (2020) highlighted the importance of asphalt-related emissions in SOA formation, which are still absent from emission inventories. These emissions are dependent on the solar radiation and temperature over the asphalt surface, and are variable according to the asphalt life cycle stages (such as storage, paving, and use). The annual estimation of asphalt-related SOA precursor emissions at urban scales is estimated to exceed those from motor vehicles. These studies show that non-exhaust emissions can be very important for air quality and that it is necessary to improve the identification source techniques and the parameterizations to quantify non-exhaust emission rates.
A few emission models try to integrate vehicle operational conditions to estimate non-exhaust emission factors, based on empirical factors and simplified parameterizations (Guevara et al., 2020; Denby et al., 2013a). The High-Elective Resolution Modelling Emission System (HERMES) model (Guevara et al., 2020) employs the non-exhaust emission factors proposed in the EMEP guidelines (Ntziachristos and Boulter, 2016), which provide PM10 wear emission rates for passenger cars, motorcycles, LDVs, and HDVs. A speed correction ratio is adopted for tire and brake wear emission factors, ranging from 1.39 to 0.902 for tire wear and from 1.67 to 0.185 for brake wear. Specifically for HDVs, PM10 tire and brake wear emissions are calculated considering vehicle weight, represented by a load factor ranging from 0 to 1. HDV tire wear emissions also take the vehicle size into account by considering the number of axles. A detailed description of non-exhaust emission factors employed in the HERMES model is available in the EMEP guidelines (Ntziachristos and Boulter, 2016), and a brief summary is presented in Sect. 4.2 of this paper. PM10 emission rates from tire, brake, and road wear indicated in the EMEP guidelines are quite low. Tire wear emission rates are around 6 mg per vehicle kilometer for LDVs and 18 mg per vehicle kilometer for HDVs, brake wear emission rates are around 8 mg per vehicle kilometer for LDVs and 40 mg per vehicle kilometer for HDVs, and road wear emission rates are equal to 7.5 mg per vehicle kilometer for LDVs and 38 mg per vehicle kilometer for HDVs. In contrast, the Non-exhaust Road Traffic Induced Particle (NORTRIP) model considers the vehicle speed to determine PM10 tire and road wear emission rates, but it does not account for brake wear emissions, which are assumed to be independent of vehicle speed. The NORTRIP model adopts a linear regression based on tire and road wear emission rates observed at a reference speed of 70 km h−1. Road wear emissions also take the road characteristics into account, as the pavement hardness. A detailed description of non-exhaust emission factors employed in the NORTRIP model is available in Denby et al. (2013a). Quite similar tire and brake wear rates are obtained using the EMEP guidelines and the NORTRIP model. The road wear emissions calculated using the NORTRIP model with the road characteristics employed by Thouron et al. (2018) in “Boulevard Alsace Lorraine” (a street east of Paris) are higher than those proposed in the EMEP guidelines by a ratio 6.0. This difference can be explained by their different algorithm and road characteristics. More details about tire, brake, and road wear emissions using the NORTRIP model and the EMEP guidelines emission factors are presented in Sect. 5.
Other studies assume constant non-exhaust emission factors for separate sources, and they show a great variability of several orders of magnitude between emission factors for tire wear. The bibliographic review presented in Boulter (2005) shows different tire wear emission factors, ranging from 10 to 100 000 mg per vehicle kilometer. Tire wear emission factors of the order of 100 mg per vehicle kilometer for passenger cars are observed in the literature: Luhana et al. (2004) measured an average tire wear emission rate for passenger cars of 97 mg per vehicle kilometer, and Baumann and Ismeier (1997) reported a value of 80 mg per vehicle kilometer. According to the bibliographic review presented in the United States Environmental Protection Agency (EPA) report (Table 3-1; available at https://cfpub.epa.gov/si/si_public_file_download.cfm?p_download_id=525701, last access: 2 November 2021), other studies have proposed tire wear emissions rates for LDVs of around 100 mg per vehicle kilometer, such as Gebbe (1997) (110 mg per vehicle kilometer) and Malmqvist (1983) (120 mg per vehicle kilometer). Higher LDV tire wear rates of around 200 mg per vehicle kilometer were estimated by Councell et al. (2004) and Baekken (1993), whereas Schuring and Clark (1988) reported a value of around 300 mg per vehicle kilometer (ranging from 240 to 360 mg per vehicle kilometer). Tire wear emission rates could be even higher according to the ambient and operational conditions: Park et al. (2018) investigated tire wear particles generated in a laboratory under different tire/road contact conditions and observed important variations in tire wear emission factors and size distributions with variation in road cornering conditions. Under constant speed conditions (80 km h−1), the tire wear emission rates obtained with a 2∘ tire slip angle were about 300 times larger than those obtained with no tire slip angle, increasing from 3.5 to 1110.8 mg km−1 per tire. Considering a vehicle with four tires, the tire wear emissions range from 14 to 4443.2 mg per vehicle kilometer with just a 2∘ tire slip angle variation.
Brake wear emissions present a lower variability according to the literature. However, greater variations in PM10 brake wear emissions were observed by Abu-Allaban et al. (2003) using a receptor modeling technique, ranging from 0 to 80 mg per vehicle kilometer for LDVs and from 0 to 610 mg per vehicle kilometer for HDVs. Other experimental studies have estimated lower brake wear emission rates, with typical values of around 8 mg per vehicle kilometer for LDVs and 40 mg per vehicle kilometer (Grigoratos and Martini, 2015; Denby et al., 2013a; Sanders et al., 2003; Ntziachristos and Boulter, 2016).
Road emission factors vary from 3.8 mg per vehicle kilometer (Boulter, 2005) to 200 mg per vehicle kilometer (Thouron et al., 2018). Compared with other non-exhaust emission sources, road wear emission factors present the worst-quality codes according to the EMEP European emission guidelines (Ntziachristos and Boulter, 2016), where different quality codes (ranging from B to D) are defined for non-exhaust emissions as follows: B (emission factors not statistically significant based on a small set of measured reevaluated data), C (emission factors estimated on the basis of available literature), and D (emission factors estimated by applying similarity considerations and/or extrapolation). The poor quality of these codes for road wear highlight the difficulties in precisely separating the non-exhaust emission sources as well as the dependence of road characteristics and vehicles operational conditions.
Among the non-exhaust emissions, particle resuspension is probably the process that presents the largest uncertainties. Diverse studies have estimated resuspension emission factors that are often higher than exhaust emissions but with a variability of several orders of magnitude. Luhana et al. (2004) observed relatively low resuspension factors: about 0.8 mg per vehicle kilometer for LDVs and 14.4 mg per vehicle kilometer for HDVs. Note that the same study observed an important contribution of tire wear, with an average emission factor of 94 mg per vehicle kilometer for passenger cars. Lawrence et al. (2016) determined the emission factors for a typical vehicle fleet (composed of 92 % of passenger cars) using wind-tunnel experiments. Resuspension presented a higher emission factor (10.4 mg per vehicle kilometer) compared with lower emission factors from combustion (4.5 mg per vehicle kilometer for gasoline vehicles and 8.3 mg per vehicle kilometer for diesel vehicles), tire and brake wear (4.4 mg per vehicle kilometer), road wear (4.5 mg per vehicle kilometer), and unexplained sources (7.2 mg per vehicle kilometer). For a similar fleet, Pay et al. (2011) measured PM10 resuspension factors in Berlin and estimated them to be 88 mg per vehicle kilometer for LDVs and 217 mg per vehicle kilometer for HDVs. These values were adopted in the HERMES model to calculate particles resuspension in Spain (Pay et al., 2011) and led to a similar impact on PM10 concentrations as exhaust emissions. Note that other non-exhaust emission factors used in the HERMES model are based on the EMEP guidelines, but no resuspension emission rate is defined by Ntziachristos and Boulter (2016) due to the great uncertainties observed in the literature. In the HERMES model, resuspension emission factors are the most important non-exhaust emission source, and no precise information about vehicle operational conditions or the available mass on the surface is considered. Other studies obtained even higher resuspension factors: 10–1000 mg per vehicle kilometer (Venkatram et al., 1999), 7600–8400 mg per vehicle kilometer (Moosmüller et al., 1998), 40–780 mg per vehicle kilometer for LDVs, and 230–7800 mg per vehicle kilometer for HDVs (Abu-Allaban et al., 2003), showing the huge uncertainties in particle resuspension factors.
Considerable difficulties are mentioned in experimental studies with respect to differentiating tire, brake, and road wear emissions from resuspension (Thorpe et al., 2007; Ntziachristos and Boulter, 2016; Beji et al., 2020); this indicates that these wear emission factors may be even higher than expected and with different possible classification among sources. Due these difficulties, Beji et al. (2020) classified non-exhaust emissions as brake wear emissions and tire–road contact particles, grouping tire and road wear and resuspension into the same source.
Resuspension emission factors can be employed in air quality models (Pay et al., 2011), but besides the uncertainties in these emission factors, the methodology does not necessarily respect mass balance on the street surface. If resuspension is implemented in the model using resuspension emission factors, a mass balance between total particle emissions, deposition, drainage caused by rain (wash-off), and resuspension factors may not hold. However, this mass balance may be used to determine the available particle mass on the street surface that may be resuspended. The NORTRIP model (Denby et al., 2013a, b) computes particle resuspension based on a street surface mass balance, also integrating particle wash-off. However, the NORTRIP model artificially assumes that tire, brake, and road wear emissions are instantly deposited over the street surface, and only these sources are employed to calculate the particle mass on the street.
Beyond the uncertainties attached to PM non-exhaust emission factors, their chemical composition is still not well known. Tire wear emissions contain a large fraction of BC, as BC represents 22 %–30 % of tire weight (Thorpe and Harrison, 2008). Quite similarly, the BC fraction observed in particles emitted from tire wear has been reported to be about 13 %–19 % (Kreider et al., 2010), 18 % (Park et al., 2017), and 15.3 % (Ntziachristos and Boulter, 2016) in the literature. Road and brake wear present lower BC fractions of 1.06 % (±50 %) and 2.6 %, respectively, according to Ntziachristos and Boulter (2016). More recently, Lyu and Olofsson (2020) investigated BC emissions from disk brakes and concluded that the BC fraction in PM1 emitted from brake wear is higher than the BC fraction from combustion process. The BC fractions observed in PM1 emitted by three different types of brake ranged from 20.7 % to 72.4 %, with an average value of 41.5 %, depending on the surface conditions and graphite content of the brake materials. These studies regarding non-exhaust emission characteristics emphasize that the existing knowledge on the BC emissions from tire, brake, and road wear is far from complete, and further studies are required.
Street-in-Grid (SinG) is a multiscale model that performs a dynamic two-way coupling between the MUNICH (Model of Urban Network of Intersecting Canyons and Highways) street-network model and the Polair3D 3D chemistry transport model. As detailed in Lugon et al. (2020a), this dynamic coupling between local and regional scales allows a direct interaction between concentrations in the street network and those in the urban background: the mass transfer between the street and the background concentrations influences both the street and the background concentrations. Furthermore, SinG uses consistent chemical and physical parameterizations, such as the same chemical module and meteorological data, at both local and regional scales. Note that the MUNICH street-network model can also be used as a stand-alone model, with a one-way coupling approach. In this case, the background concentrations influence the concentrations in streets, but the mass transfer between streets and the background does not influence background concentrations. SinG and MUNICH are described in Lugon et al. (2020a) and Kim et al. (2018), and Polair3D is presented by Boutahar et al. (2004) and Sartelet et al. (2007), all available in the Polyphemus platform (Mallet et al., 2007). The size distribution of BC is modeled with a sectional approach, with diameters typically ranging from 10−3 to 10 µm. Because BC is an inert species, this study does not take chemical reactions into account, and only BC concentrations are modeled. The aerosol dynamics (nucleation, coagulation, and condensation/evaporation) is also neglected, as it would have no effect on BC mass concentration and only a small effect on the size distribution.
Particle resuspension is the non-exhaust emission process that presents the largest uncertainty and variability. Different studies in the literature propose constant resuspension emission factors (see Sect. 1), but this methodology does not necessarily respect mass conservation on the street surface. This study presents a new methodology to calculate particle resuspension, which is based on respecting mass conservation on the street surface. At each time iteration, SinG calculates the total particle mass available on the street surface (Mdep), considering particle deposition (Qdep), wash-off (Qwash), and resuspension (Qres) rates, by integrating the following equation:
As detailed in Sect. 3.3, the parameterizations used to calculate particle resuspension are based on the NORTRIP model (Denby et al., 2013a) but with an important difference: NORTRIP calculates the deposited mass assuming that all wear emissions are directly deposited and that deposition is not directly linked to the concentrations of particles in the street. Here, the concentrations of particles are computed with SinG, as detailed in Lugon et al. (2020a), and particle deposition is computed from the concentrations, meaning that the time to deposit is taken into account (no instantaneous deposit) and that particles from all origins (e.g., exhaust, non exhaust, and particles transported from other sources) may deposit. The formulations used for deposition, washout, and resuspension in the street surface mass balance equation are now detailed.
3.1 Particle deposition
Particle and gas dry-deposition modeling follows the Cherin et al. (2015) approach, designed for street canyons. This parametrization calculates particle deposition over the different available surfaces in a street canyon separately, such as pavement area and building walls. Note that only the particle deposition on the street pavement is considered when computing the mass deposited on the street surface that is available for resuspension. A complete description of this approach is detailed in Cherin et al. (2015), with the computation of deposition velocities for gas and particulate species. The deposition mass rate Qdep is proportional to the deposition velocity vdep and the species concentration in the street Csp. Particle deposition velocities vary with particle diameter, which is indicated by the size section b:
3.2 Particle wash-off
Particle wash-off over the street surface is computed using the wash-off factor fwash concept, as described in Denby et al. (2013a, b). In this parametrization, the particle mass rate drained by water Qwash is proportional to fwash and the deposited mass over the surface Mdep, as detailed in Eqs. (3) and (4):
where δt is the time step between two evaluations of groad (600 s here), hdrain,eff is the drainage efficiency parameter, groad is the amount of water present on the street surface (mm), and groad,min is the minimum water content for the drainage process (mm). Note that the drainage efficiency hdrain,eff depends on particle properties and can range from zero to one, depending on the species mixing state and solubility. As discussed in Denby et al. (2013a) and Vaze and Chiew (2002), salt should be well mixed and very soluble in water, thereby having high drainage efficiency. Because dust and BC are insoluble species and may not be well mixed with salts (Zhu et al., 2016; Majdi et al., 2020), their drainage efficiency should be poor. Here, hdrain,eff is taken equal to 0.001, as proposed in Denby et al. (2013b); groad corresponds to the water rain calculated in each street and integrated in time from the meteorology, and groad,min is 0.5 mm, as in Denby et al. (2013b). Drainage is treated as an instantaneous process in the model, as performed by Denby et al. (2013a) and Denby et al. (2013b).
3.3 Particle resuspension
Particle resuspension is calculated based on a resuspension factor fres, as proposed by Denby et al. (2013a) and employed in the NORTRIP model. This factor varies depending on the traffic flow characteristics, such as the LDV and HDV flow and speed:
where v indicates the vehicle type, Nv is the vehicle flow (vehicles per hour), uv is the vehicle speed (km h−1), uref(r) is the reference vehicle speed for the resuspension process (km h−1), and f0,v the reference mass fraction of the resuspension process (per vehicle). As used in Denby et al. (2013a) and Thouron et al. (2018), this study adopts uref(r)=50 km h−1, per vehicle, and per vehicle.
The resuspension rate Qres is then calculated as detailed in Eq. (6), as a function of the deposited mass on the street surface Mdep (µg):
3.4 Solving particle mass balance over the street surface
Using the formulations of wash-off and resuspension presented in Eqs. (4) and (6), the time evolution of the surface mass (Eq. 1) can be rewritten as
with an analytical solution:
As indicated in the previous sections, Mdep is a determinant to calculate the particle resuspension and wash-off. It represents the maximal particle mass that can be resuspended, in order to ensure mass conservation on the street surface. Besides respecting mass conservation on the street surface, this approach presents other advantages: (i) particle deposition is estimated from concentrations (and not from wear emissions as in NORTRIP), following a formulation adapted to street-network geometries, and (ii) no additional hypothesis is necessary to determine chemical speciation of resuspended particles, as resuspended and deposited particles are assumed to have the same composition. A limitation of this approach lies in the difficulty to estimate the resuspension factor fres and its variations with chemical species.
To compute the concentrations in the street volume, MUNICH and SinG solve an equation describing the time evolution of the mass M in each street segment (Kim et al., 2018; Lugon et al., 2020a). New terms are added to this equation: the particle resuspension rate Qres; the tire, brake, and road emission rates (Qemis,wear) as an inlet flux; and the particle wash-off rate Qwash as an outlet flux. They are highlighted in Eq. (9), which is solved for each size section:
where Qemis,exh is the exhaust traffic emission rate, Qinflow is the mass inflow rate at intersections, Qvert is the turbulent mass flux between the atmosphere and the street, Qoutflow is the outflow flux, and Qdep,v is the deposition flux over the street volume v, considering the street pavement and building walls surfaces. These terms are detailed in Kim et al. (2018) and Lugon et al. (2020a). Concentrations calculated in each street using Eq. (9) are then used to compute the deposition mass flux, as mentioned in Sect. 3.1.
This section describes the input data and the model configuration of the SinG simulations at both the regional and local scales. Six particle size sections are employed with the following bound diameters: 0.01, 0.0398, 0.1585, 0.4, 1.0, 2.5, and 10 µm. Simulations were run from 15 March to 15 May 2014. Model–data comparisons are performed for 12 April to 15 May, during which time BC concentrations were measured at the air monitoring station operated by AIRPARIF in the framework of the TRAFIPOLLU project (https://anr.fr/Projet-ANR-12-VBDU-0002, last access: 2 November 2021).
4.1 Regional scale
SinG is employed to simulate BC concentrations over a regional-scale domain covering Paris with a spatial resolution of 1 km×1 km (domain 4), as illustrated in Fig. 1. Initial and boundary concentrations are obtained from nested simulations at the regional scale using the Polair3D model, over Europe (domain 1, spatial resolution of 55 km×55 km), France (domain 2, spatial resolution of 11 km×11 km), Île-de-France region (domain 3, spatial resolution of 2 km×2 km), and Greater Paris (domain 4, spatial resolution of 1 km×1 km). All four domains have the same vertical discretization with 14 levels from 0 to 12 km. Meteorological data are calculated using the Weather Research and Forecasting (WRF) model (version 3.9.1.1), as detailed in Lugon et al. (2020a).
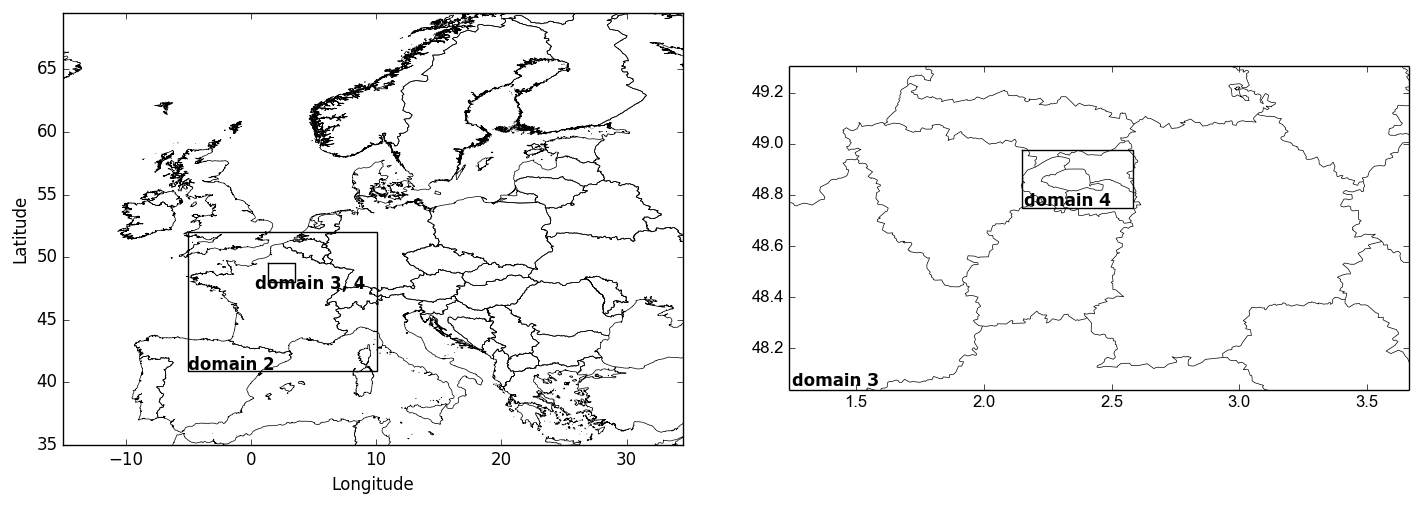
Figure 1Regional-scale nested domains: Europe (domain 1, spatial resolution 55 km×55 km), France (domain 2, spatial resolution 11 km×11 km), Île-de-France region (domain 3, spatial resolution 2 km×2 km), and Greater Paris (domain 4, spatial resolution 1 km×1 km).
BC emissions over Europe (domain 1) and France (domain 2) are obtained from the European Monitoring and Evaluation Program (EMEP) emission inventory for the year 2014, with a spatial resolution of .
Over the Île-de-France region (domain 3) and Greater Paris (domain 4), sources other than traffic are obtained using the AIRPARIF emission inventory for 2012. Because the simulated period corresponds to spring/summer in France with a low contribution from the residential sector, the differences between the emissions for 2012 and 2014 for sectors other than traffic have a low impact on BC modeling over Paris. BC traffic emissions are computed using the emission inventory for 2014 provided by the air quality agency of Paris (AIRPARIF), except in the street-network region (see Fig. 2) where they are obtained from the TRAFIPOLLU project, as detailed in Sect. 4.2. For BC traffic non-exhaust emissions, over domain 4 (both in the street-network region and outside), different scenarios of non-exhaust emissions are studied, as described in Sect. 5 (see Table 1).
Table 1List of the simulations performed, with the configuration options (with or without deposition, and with or without exhaust emission correction), the PM10 fraction () adopted in each wear emission source (tire wear indicated by ty, brake wear indicated by bk, and road wear indicated by rd), the BC fraction adopted in tire wear emissions (), and the corresponding BC emission factors for each wear emission source and vehicle type HDV and LDV () (in milligrams per vehicle kilometer).
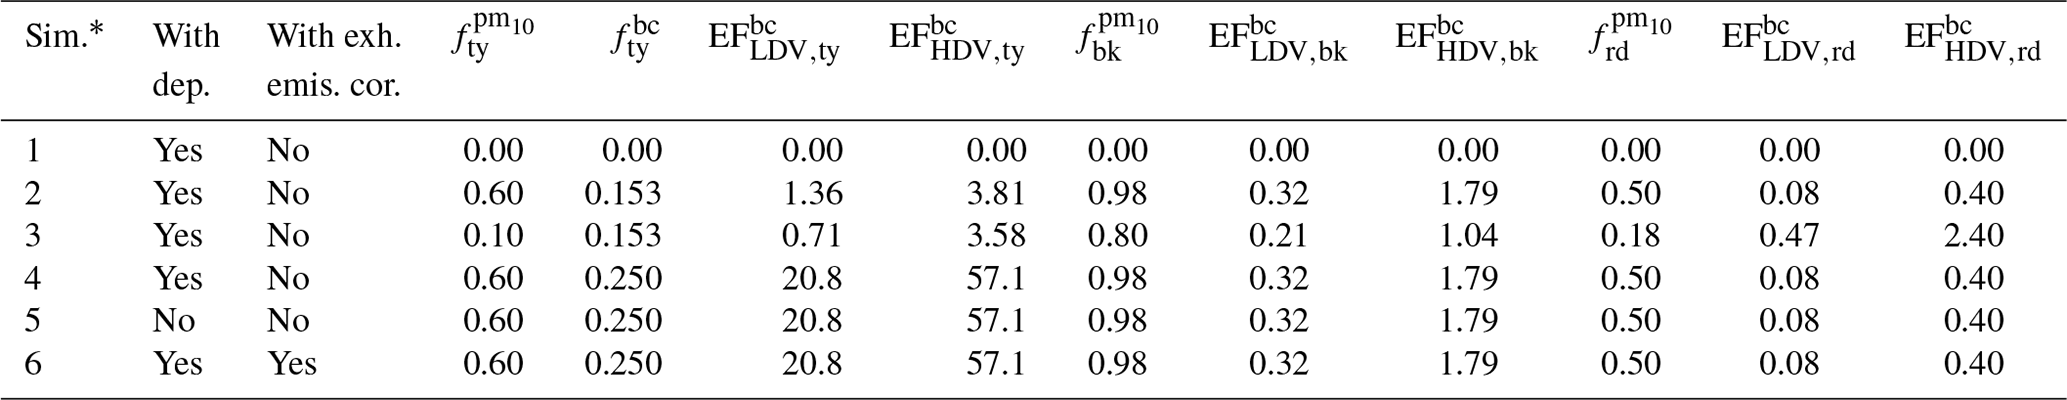
* The simulations are as follows: 1 – only exhaust emissions (Ntziachristos and Samaras, 2018); 2 – exhaust emissions (Ntziachristos and Samaras, 2018) and non-exhaust wear emissions from Ntziachristos and Boulter (2016); 3 – exhaust emissions (Ntziachristos and Samaras, 2018) and non-exhaust wear emissions based on Denby et al. (2013a); 4, 5, and 6 exhaust emissions (Ntziachristos and Samaras, 2018) and non-exhaust wear emissions based on Boulter (2005).
Note that in SinG, which is used over domain 4, traffic emissions are not used for the regional-scale modeling in the street-network region but only for the local-scale (street) modeling, as the local and regional scales are two-way coupled.
4.2 Local scale
At the local scale, SinG simulates the street network represented in Fig. 2, containing 577 streets including the “Boulevard Alsace Lorraine”, where the measurements were performed. Meteorological data above each street are extracted from the same WRF simulation as employed at the regional scale.
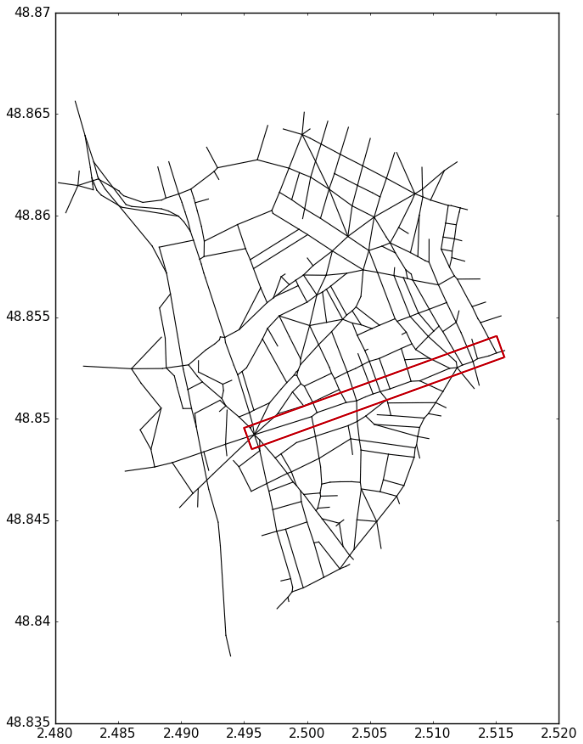
Figure 2The street network, with Boulevard Alsace Lorraine highlighted in the red rectangle.
BC exhaust traffic emissions are obtained from the TRAFIPOLLU project, using the same street network and exhaust inventory as detailed in Kim et al. (2018): the SymuVia dynamic traffic model was used to determine the hourly traffic in each street of the network and pollutant emissions were deduced using COPERT IV emission factors; emissions were calculated for 2 typical days – 25 March 2014, representative of weekdays, and 30 March 2014, representative of a weekends and holidays. BC non-exhaust emission factors from tire, brake, and road wear are computed using the formulations proposed in the EMEP guidelines (Ntziachristos and Boulter, 2016) to calculate PM10 wear emissions, and a speciation represented by a BC fraction () is defined for each wear source. The values used in this study for , , and are detailed in Sect. 5.
where s is the non-exhaust source (tire, brake, or road wear, indicated by ty, bk, and rd, respectively), v is the vehicle type (v= LDV or HDV), is the total suspended particle (TSP) wear emission rate for a determined source s and vehicle v, is the PM10 fraction of TSPs emitted by each wear source s, and Ss is the correction factor according to vehicle speed uv. Ss varies according to the wear emission source, as shown in Eqs. (11), (12), and (13):
The total suspended particle wear rates emitted by tire and brake wear in HDVs () are computed as a function of passenger car (PC) wear emissions. They consider the vehicle characteristics in terms of HDV weight (represented by a load correction factor LCFs) and the number of axles (Naxle), as indicated in Eqs. (14) and (15):
where LCFs is a load correction computed as a function of the load factor LF, ranging from zero to one.
The resulting non-exhaust emission rate (Qemis,wear) for each wear emission source s is proportional to the LDV and HDV flow (Nv), as indicated in Eq. (17):
As particle resuspension is directly dependent on the particle mass deposited on the street surface, it is dependent on the initial conditions of the simulation. In order to avoid this dependence, a spin-up of 25 d is adopted to enable a mass surface equilibrium between deposition, wash-off, and resuspension mass rates. More details are provided in Sect. 5.3.
As mentioned in Sect. 1, non-exhaust emissions are difficult to estimate. The huge variability in car models and speed regimes combined with the large diversity in tire, brake, and road components contribute to the large uncertainties associated with non-exhaust emissions. Furthermore, experimental studies report the complexity involved in differentiating resuspension from tire and road wear emissions.
This section presents a sensitivity analysis of BC street concentrations to BC non-exhaust emissions, using different tire, brake, and road emission factors from the literature.
5.1 The simulations
Different simulations were performed using SinG, with large variations in tire wear emissions properties. The BC fractions adopted for brake and road wear are constant in all simulations and are the same in all emitted size sections. They follow the EMEP guidelines (Ntziachristos and Boulter, 2016) with values of and . Table 1 summarizes the configuration used in each simulation, showing the PM10 fraction employed in each source s (), the BC fraction adopted in tire wear emissions (), and the resultant BC emission factor from each vehicle type v (LDVs and HDVs) and non-exhaust source s ().
To show the influence of non-exhaust emissions, simulation 1 ignores non-exhaust emissions. Simulation 2 employs the BC wear emission factors and size distribution indicated in the EMEP guidelines, which are also used in the HERMES model (Guevara et al., 2020; Ntziachristos and Boulter, 2016). TSP tire wear emission factors from HDVs are deduced from Eq. (14), considering a load factor (LF) of 1.0 and a number of axles (Naxle) of 2.0. Simulation 3 uses the PM10 wear emission factors and the size distribution indicated in the NORTRIP model (Denby et al., 2013a). They are of the same order of magnitude as those of the EMEP guidelines. Note that the road characteristics used in Boulevard Alsace Lorraine by Thouron et al. (2018) were employed for road wear emissions, leading to higher road wear emissions than in the EMEP guidelines. As NORTRIP does not indicate the BC fractions from each source, the same BC fractions as in the EMEP guidelines (Ntziachristos and Boulter, 2016) are adopted. Simulation 4 employs the same brake and road wear emission factors as in the EMEP guidelines, but tire wear emission factors are higher. The same size distribution of non-exhaust emissions indicated in the EMEP guidelines (Ntziachristos and Boulter, 2016) is employed. A LDV tire emission factor of 100 mg per vehicle kilometer is used, as proposed in several studies (Malmqvist, 1983; Baumann and Ismeier, 1997; Gebbe, 1997; Luhana et al., 2004; Boulter, 2005). As in simulation 2, the TSP tire wear emission factors from HDVs are deduced from Eq. (14), considering a load factor (LF) of 1.0 and a number of axles (Naxle) of 2.0. A PM10 fraction () of 0.6 is adopted, as in simulation 2. More details on the particle size distribution of non-exhaust emissions are given in Table A2.
The tire wear BC fraction is higher than in simulations 2 and 3. It is taken equal to 0.25, which is the average BC mass weight fraction with respect to tire composition (between 22 %–30 %) indicated in Thorpe and Harrison (2008). As in the EMEP guidelines and simulation 2, a speed correction factor Sty(uv) of 1.39 is employed in the simulation, as the LDV and HDV speed in the street network is lower than 40 km h−1 (average speed of around 32 km h−1 according to TRAFIPOLLU measurements). The resulting PM10 and BC tire wear emission factors from LDVs and HDVs are then mg per vehicle kilometer, mg per vehicle kilometer, mg per vehicle kilometer, and mg per vehicle kilometer.
In order to evaluate the impact of particle resuspension on BC concentrations in streets, simulation 5 uses the same settings as simulation 4, but it does not consider particle deposition; thus, particle resuspension is not computed. This simulation physically represents the concentrations obtained with a maximal BC resuspension, which is equal to the BC deposition. Finally, in order to evaluate the influence of uncertainties in the BC speciation of exhaust emissions, simulation 6 uses the same non-exhaust emission factors as simulation 4, but BC exhaust emissions are artificially increased by 23 %. This correction factor is defined using a linear correlation based on (i) the traffic-flow characteristics observed in Boulevard Alsace Lorraine during the TRAFIPOLLU campaign (percentage of diesel and petrol vehicles, according to the vehicle category and technology), and (ii) the uncertainties for each vehicle class detailed in Table 3-91 of Ntziachristos and Samaras (2018).
5.2 Model–measurement comparisons
The different simulations are evaluated by model–measurement comparisons of BC concentrations, measured in Boulevard Alsace Lorraine. The statistical criteria applied to evaluate the model performance are those defined by Hanna and Chang (2012) and Herring and Huq (2018). Two different criteria are defined: (i) a less strict criteria, accepted in urban areas, of , NMSE<6, FAC2≥0.3, and NAD<0.5; and (ii) a more strict criteria of , , NMSE<3, VG<1.6, FAC2≥0.5, and NAD<0.3.1 The definitions of the statistical indicators are given in Appendix A1.
Table 2 shows the statistical indicators obtained from the model–measurement comparisons for each simulation of Table 1. The BC concentrations observed in Boulevard Alsace Lorraine are strongly underestimated in simulations 1, 2, and 3, with an FB equal to −1.26, −1.10, and −1.15, respectively. They do not satisfy the performance criterion, even the less strict ones, except for the normalized mean square error (NMSE). However, the configurations used in simulations 4, 5, and 6, with higher tire wear emissions, result in satisfactory statistical indicators. They respect both the less and more strict performance criteria proposed by Hanna and Chang (2012) and Herring and Huq (2018). The temporal evolution of the BC concentrations obtained with simulation 4 is illustrated in Fig. 3, showing a good correlation between the BC hourly concentrations observed and those simulated by SinG. Both the NORTRIP and the HERMES models, whose emission factors are used in simulations 1, 2, and 3, have quite low PM10 tire wear emission factors compared with simulations 4, 5, and 6, which use a higher tire wear emission factor for passenger cars, as proposed in the review by Boulter (2005). The simulations performed by Pay et al. (2011) and Denby et al. (2013a), using the HERMES and NORTRIP models, respectively, achieved good correlations between simulated and measured particle concentrations. They assume that resuspension is the main non-exhaust emission process, using high resuspension rates and relatively low tire wear emission factors. The PM10 resuspension rates used by Pay et al. (2011), 88 mg per vehicle kilometer for LDVs and 217 mg per vehicle kilometer for HDVs, are similar to the tire wear emission factors employed in simulations 4, 5, and 6, 83.4 mg per vehicle kilometer for LDVs and 232.7 mg per vehicle kilometer for HDVs. These high resuspension rates may compensate for the low non-exhaust tire wear emissions employed in the HERMES and NORTRIP models. The ratio between the total BC emissions in simulation 4 and simulation 2 is 3.30. A quite similar ratio of 3.0 was employed by Brasseur et al. (2015) to increase BC emissions from the COPERT-IV emission inventory, as mentioned in Sect. 1.
Table 2Comparisons of BC measurements in Boulevard Alsace Lorraine: statistical indicators obtained for the different SinG simulations. The reader is referred to Appendix A for the definitions of the statistical parameters shown in the table.


Figure 3BC hourly concentrations in Boulevard Alsace Lorraine simulated by SinG (simulation 4) and observed during the TRAFIPOLLU campaign (µg m−3).
The comparison between simulations 4 and 5 shows that particle dry deposition has a low impact on BC concentrations in streets (0.15 % on average). Because the BC mass that may be resuspended is limited by the BC deposited mass, BC resuspension is also not significant compared with the other BC emission sources. Figure 4 illustrates the temporal evolution of BC deposition, wash-off, and resuspension. The resuspension rate is limited by the deposited mass at the surface, and both the resuspension and deposition rates are of the same order of magnitude. BC wash-off mass rates present the same order of magnitude for reposition and resuspension processes, and are concentrated on rainy days. This finding of a low resuspension rate agrees with the observation of Luhana et al. (2004), who estimated that tire wear emissions are the most important non-exhaust emissions and that particle resuspension is not very important.
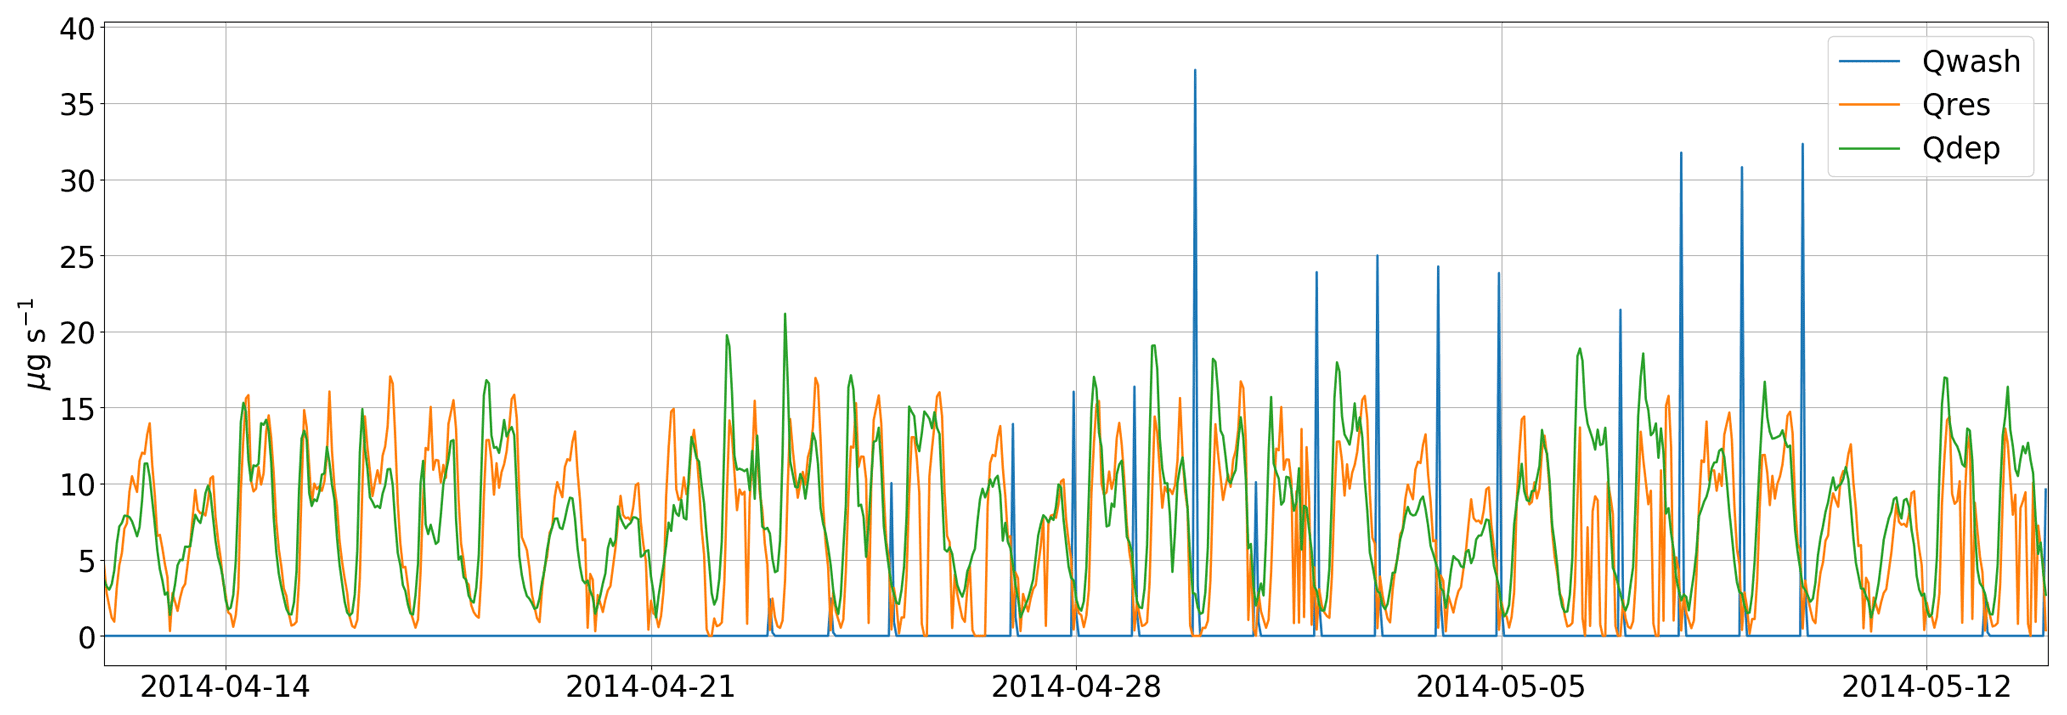
Figure 4BC wash-off, deposition, and resuspension rates simulated by SinG, simulation 4 (µg s−1).
The comparison between simulations 4 and 6 shows that increasing BC exhaust emissions by accounting for the uncertainties in the BC speciation in exhaust emissions slightly improves the BC concentrations in streets. Differences in BC concentrations simulated by modifying the BC exhaust emissions are less important than the differences simulated by modifying the BC tire wear emissions, suggesting that non-exhaust emissions are the most crucial emissions to improve.
5.3 Deposited mass over streets
A good representation of the deposited particle mass over the street surface is required to calculate particle resuspension. This section compares the simulated deposited particle mass over the Boulevard Alsace Lorraine with that observed by Hong et al. (2016a) during the TRAFIPOLLU campaign. Hong et al. (2016a) collected the total road dust in situ using dry sampling with a vacuum cleaner on 14 October 2014 at different points along the avenue. Figure 8a of Hong et al. (2016a) indicates the estimated total weight of dry stocks (in kg) as ranging from 1 to 21 kg, with an average value about 8.90 kg. Considering that the road surface is 2661 m2, as indicated in Hong et al. (2016a), the TSP mass density in Boulevard Alsace Lorraine is 3.34 g m−2. The size distribution of these samples is presented in Fig. 5 of Hong et al. (2016b), indicating that approximately 7.5 % of the total deposited mass is composed of particles with diameters lower than 10 µm (PM10). Therefore, the average mass density of PM10 in Boulevard Alsace Lorraine is about 250 mg m−2. Note that a quite similar PM10 mass density was observed by Amato et al. (2009) in Barcelona urban areas (ranging from 8.9 to 216 mg m−2). In the simulations, to deduce the PM10 deposited mass from the BC deposited mass, the fraction of BC in the PM10 deposited mass at the surface is assumed to be 2.11 %, following the observations of the chemical patterns of PM10 in deposited road dust in an urban environment performed by Amato et al. (2009).
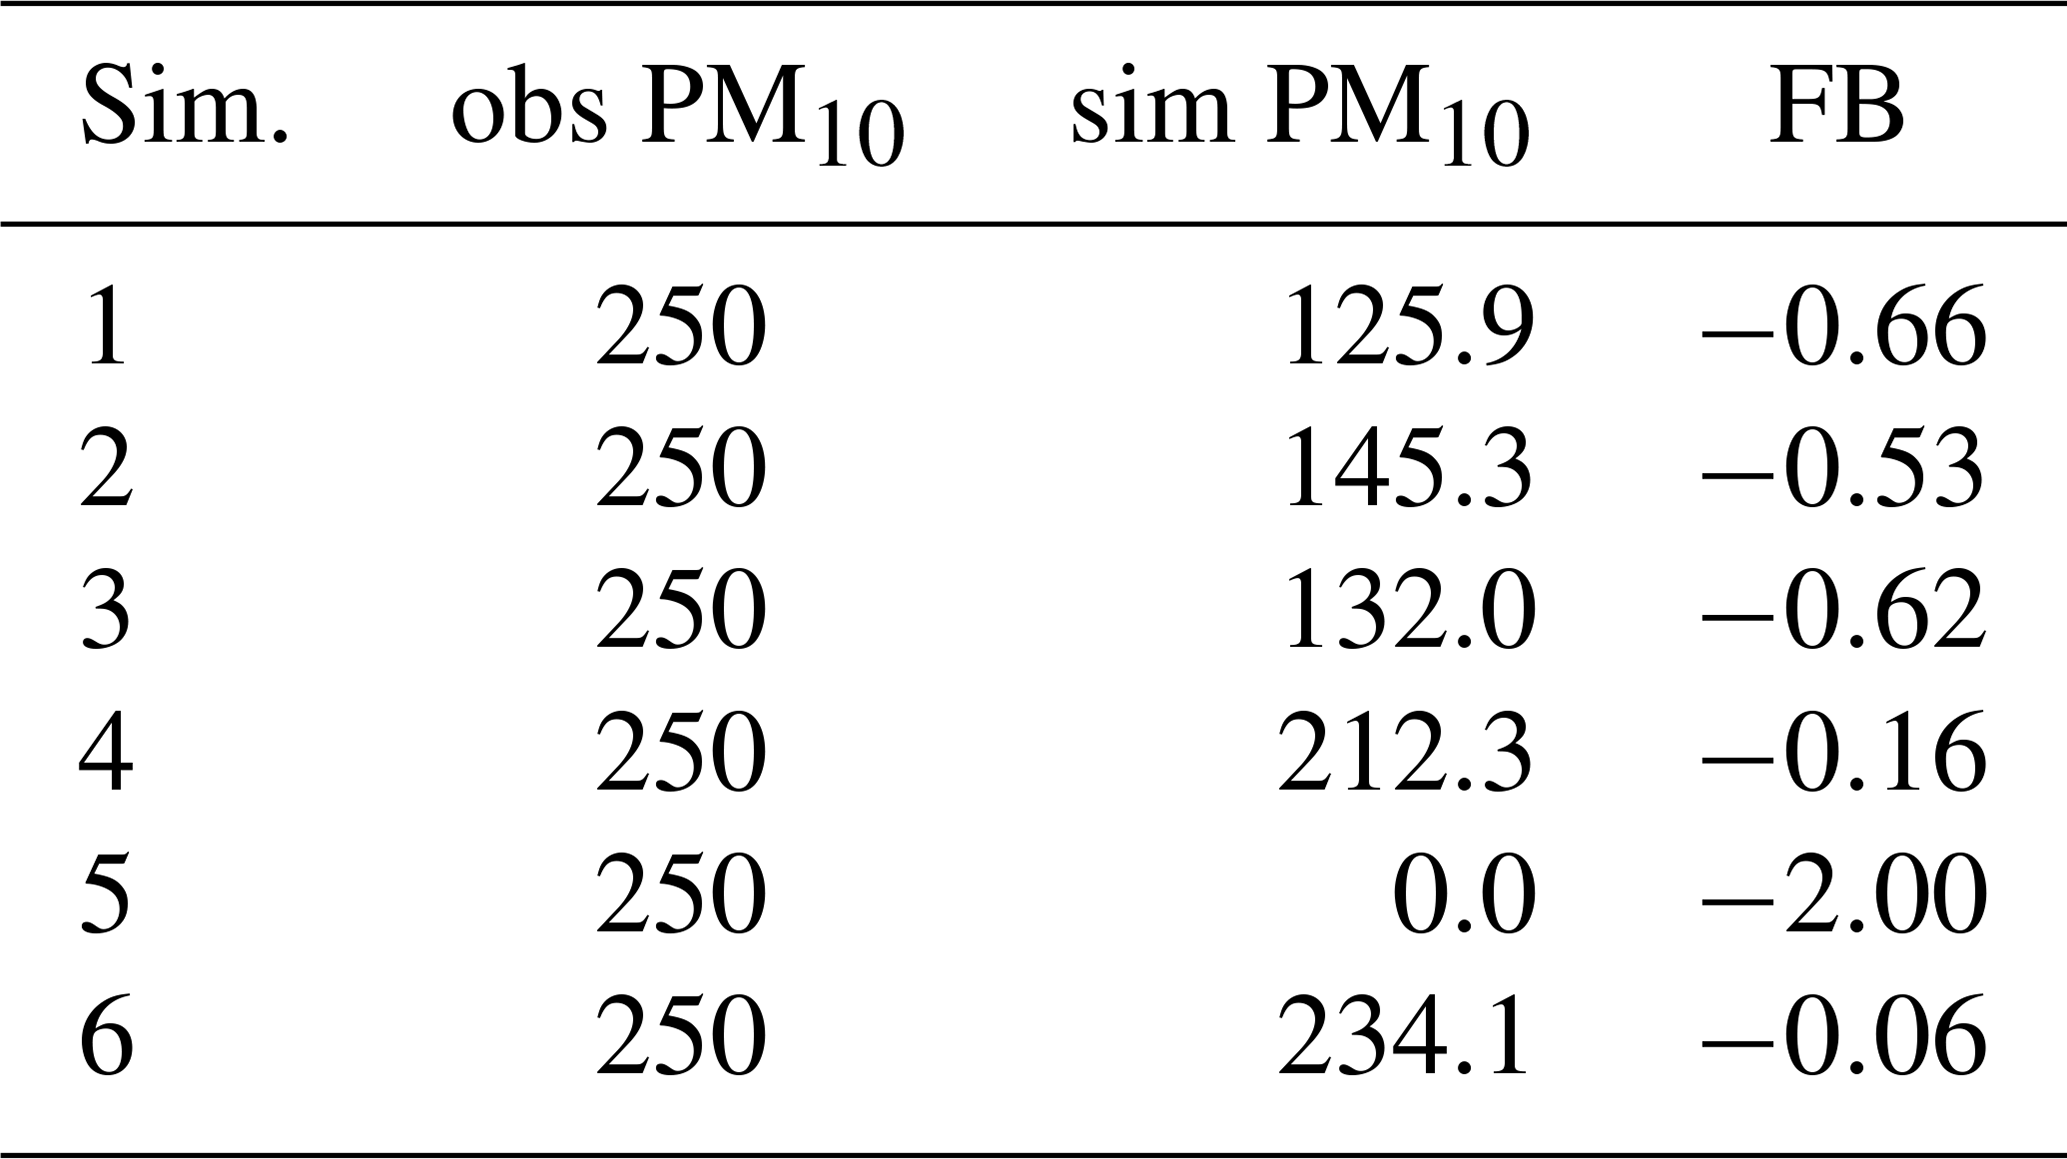
Figure 5 illustrates the PM10 deposited mass density (in mg m−2) obtained for each simulation for Boulevard Alsace Lorraine. As mentioned in Sect. 4.2, a spin-up of 25 d is used in each simulation, so that the deposited mass is independent of the initial conditions. Hence, the model–measurement comparisons here are performed starting from 12 April. In Fig. 5, this initial model–measurement comparison period (12 April) is indicated by the black vertical line. This spin-up is important to avoid an underestimation of particle deposition due to initial conditions. Table 3 summarizes the average PM10 mass density obtained from 12 April to 14 May in all simulations, the PM10 mass density estimated using the measurements performed by Hong et al. (2016a, b), and the corresponding FB between these mass densities. Good model–data correspondence is observed for simulations 4 and 6 with and −0.06, respectively. In simulations 1, 2, and 3, the deposited particle mass at the street surface is strongly underestimated, with an FB of around −0.60. Note that simulation 5 does not consider particle deposition, so no deposited particle mass is present at the street surface.
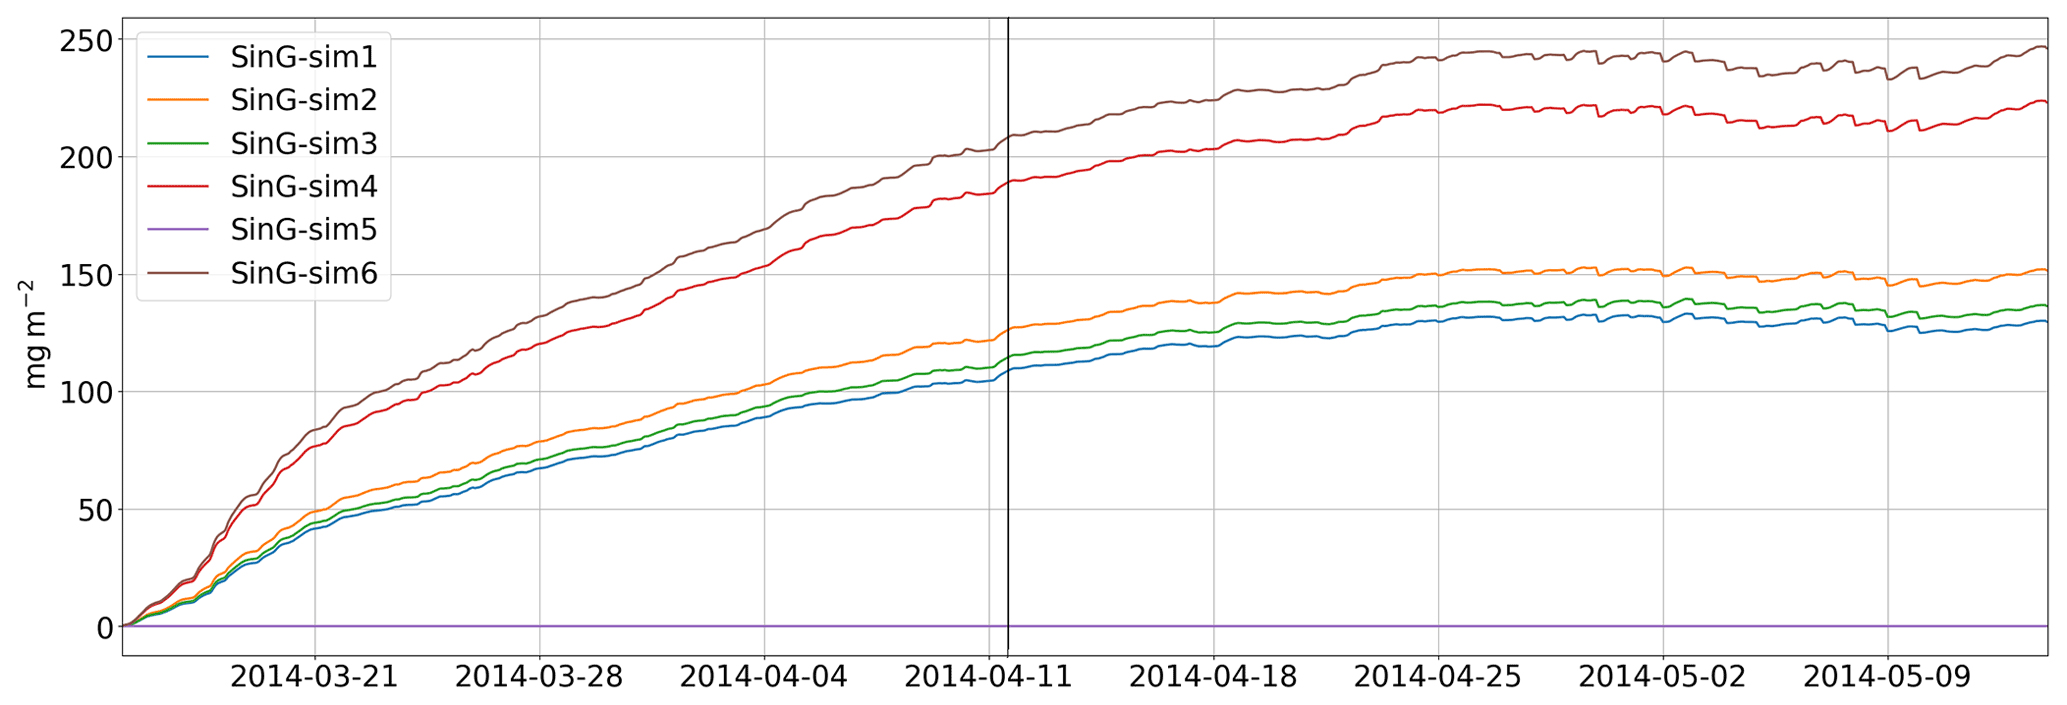
Figure 5Temporal evolution of equivalent PM10 deposited mass density over the Boulevard Alsace Lorraine surface obtained with the different SinG simulations (mg m−2).
Table 3Average mass density of PM10 deduced from the measurements in Boulevard Alsace Lorraine (obs PM10; mg m−2), average simulated mass density of PM10 (sim PM10; mg m−2), and the fractional bias (FB; unitless).
This section investigates the influence of the two-way coupling between the regional and local scales on BC concentrations in the street network. For this, the concentrations calculated by SinG, using the two-way approach, are compared with those calculated by MUNICH as a stand-alone model (one-way approach). As mentioned in Sect. 3, the coupling between the local and regional scales is two way in SinG, which couples the MUNICH street model to the Polair3D chemistry transport model. However, MUNICH may be used as a stand-alone model, simulating the street concentrations with a one-way coupling to the regional-scale background concentrations. In the latter case, the regional-scale (background) concentrations influence the street concentrations, but the street concentrations do not influence the background concentrations, and the vertical mass transfer between the local and regional scales only influences concentrations in streets. Note that traffic emissions are used in both the Polair3D regional-scale model and in the MUNICH street model in the one-way coupling. Because SinG employs a two-way coupling, the vertical mass transfer between the local and regional scales enables one to calculate background concentrations and concentrations in streets at each time step, providing a direct interaction between concentrations in the street network and those in the urban background. Therefore, traffic emissions are only considered at the local scale, and there is no double counting of traffic emissions in SinG.
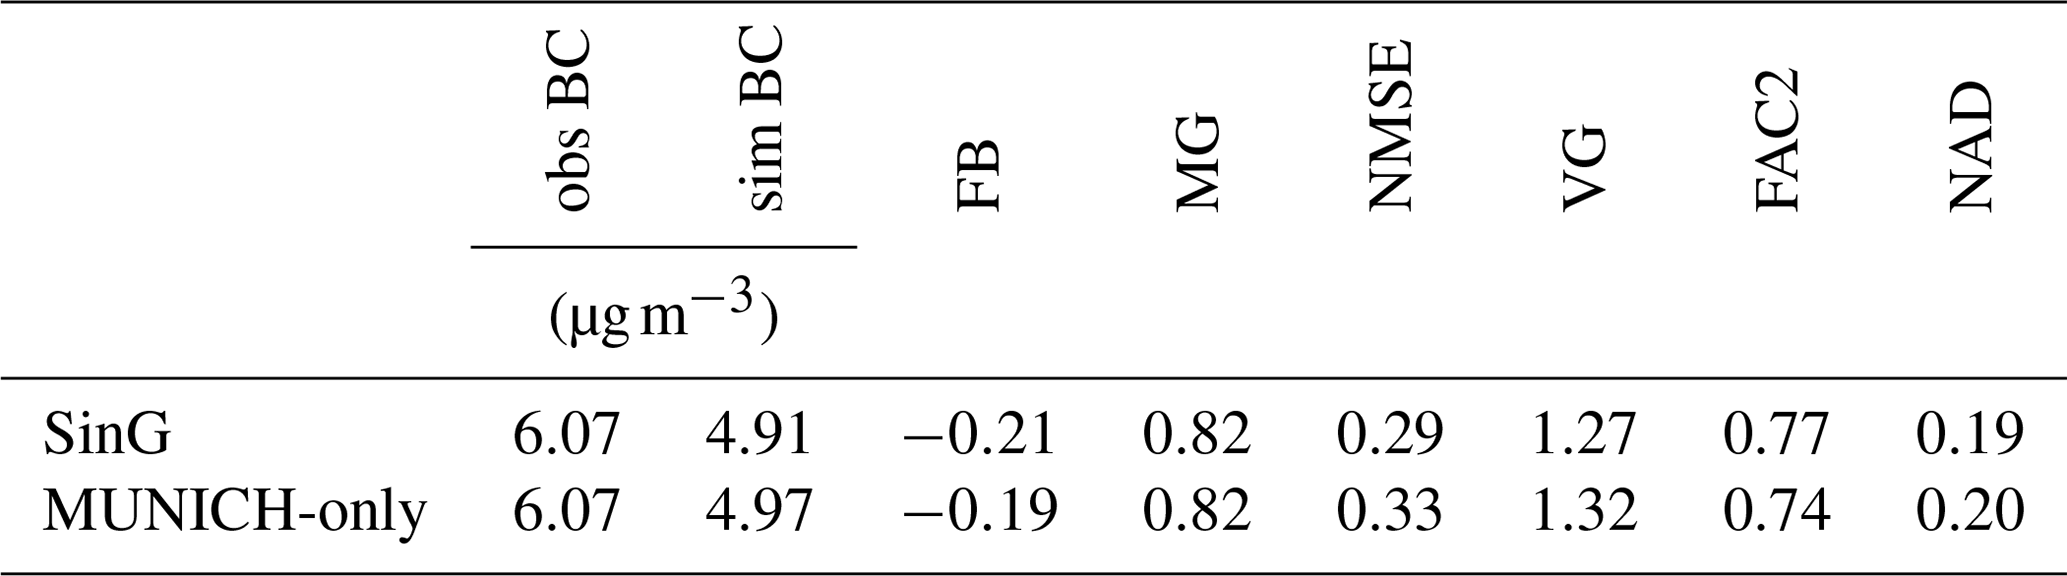
Simulations of BC concentrations using Polair3D, MUNICH, and SinG are performed using the non-exhaust emission factors of simulation 4 (see Table 1). Specifically regarding the BC concentrations in Boulevard Alsace Lorraine, both SinG and MUNICH as a stand-alone model (MUNICH-only) resulted in similar concentrations, respecting the most strict performance criteria (see Table A1). However, the differences between MUNICH and SinG depend on the street characteristics, as detailed in Lugon et al. (2020a). To analyze streets with different characteristics, this section focuses on the comparison between the one-way and two-way coupling approaches over the whole street network. As in Lugon et al. (2020a), two factors are analyzed to investigate the influence of the two-way coupling on the local-scale concentrations: (i) the strength of traffic emissions, and (ii) the street aspect ratio αr (the ratio between street height and width). The vertical mass flux between the local and regional scales is proportional to the concentration gradient between the street and the urban background, as shown in Eq. (8) of Lugon et al. (2020a). Streets with high traffic emissions tend to favor vertical mass transfer from the local to the regional scales, as they tend to present a high gradient between the street and the urban background concentrations. This vertical mass flux is also dependent on the street geometry, which is represented by the aspect ratio αr (see Eq. 9 in Lugon et al., 2020a). Streets with a low aspect ratio (large streets) tend to favor vertical transfer between the local and regional scales, whereas the vertical mass transfer between scales tends to be lower in streets with high aspect ratios (narrow streets). Streets are classified as large streets when αr≤0.3, intermediate streets when , and narrow streets when αr≥0.6 (Kim et al., 2018).
Figure 6 illustrates the average BC emissions in the street network (panel a), the average BC concentrations simulated by SinG (panel b), the absolute difference between the BC concentrations simulated by SinG and MUNICH (panel c), and the absolute relative differences between the BC concentrations simulated by SinG and MUNICH (panel d). A good correlation between traffic emissions and concentrations is observed, as expected. The differences between the average BC concentrations simulated by SinG and MUNICH range from −2.6 to 2.4 µg m−3, corresponding to relative errors between 0 % and 50 %. The BC concentrations simulated by SinG are higher than those simulated by MUNICH, especially in the streets located on the left side of the street network where the traffic emissions are the highest. This effect is also observed in the streets adjacent to the high-emission streets, which is probably due to the transport of pollutants from one street to another. Even though the BC concentrations are higher in SinG than in MUNICH near streets with high traffic emissions, they are lower over a large part of the domain (in the middle of the street network). This region simultaneously presents low BC emissions and concentrations, and high aspect ratios αr. Therefore, the concentration gradients between the local and regional scales are low, leading to small differences between local- and regional-scale concentrations. However, the absolute values of the relative differences between the concentrations simulated by MUNICH and SinG in this region are large and reach 50 %. These large differences and the lower concentrations simulated in SinG compared with MUNICH may be explained by the double counting of traffic emissions performed by MUNICH with the one-way coupling technique. Using the two-way coupling approach in SinG, streets with low traffic emissions and high aspect ratios present low vertical mass transfer between streets and the urban background. This mass transfer is lower than the traffic emissions considered at the regional scale in the one-way coupling approach (MUNICH). This results in lower background concentrations above streets using the two-way coupling approach (SinG), leading to lower street concentrations.

Figure 6Average BC emissions in the street network (a), average BC concentrations simulated by SinG (b), absolute differences between the BC concentrations simulated by SinG and MUNICH (c), and absolute values of relative differences between the BC concentrations simulated by SinG and MUNICH (d).
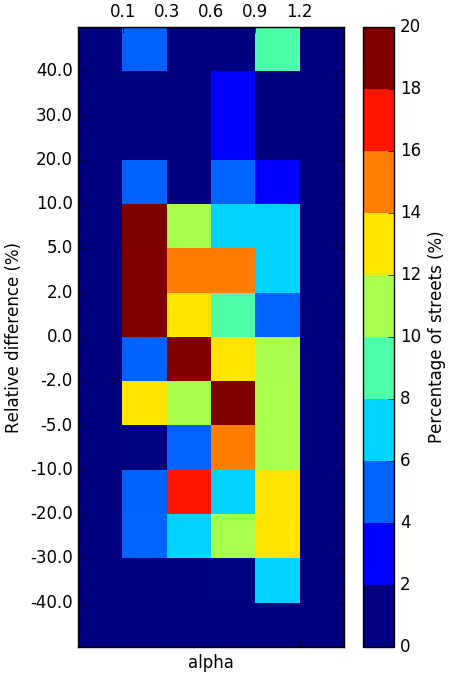
Figure 7Percentage of streets (purple) present in different αr intervals for different ranges of the relative differences between the BC concentrations simulated by SinG and MUNICH.
In order to more precisely evaluate the influence of the street geometry (represented by αr) in the relative differences between the BC concentrations simulated by SinG and MUNICH, an analysis of different αr intervals is carried out. Figure 7 illustrates the percentage of streets present in different ranges of αr intervals encountered in the street network for different ranges of relative differences between the BC concentrations simulated by SinG and MUNICH. The sum of each column corresponds to 100 %. Streets with low values of αr (large streets) tend to have more cars passing and higher emission rates. In this case, the BC concentrations tend to be higher using SinG than using MUNICH, and the relative differences are mostly positives. The higher the street aspect ratio αr, the higher the percentages of streets with a negative relative difference between SinG and MUNICH. The impact of the two-way coupling on BC concentrations in streets is high, with relative differences ranging from −51 % to 48 %.
This study performs simulations of BC concentrations in a Parisian suburban street network using the SinG multiscale model. Two main aspects influencing the BC concentrations in streets are investigated: (i) the non-exhaust emissions (tire, brake, and road wear) and particle resuspension, and (ii) the two-way coupling between the street-network model and the chemistry transport model that computes the urban background concentrations. A sensitivity analysis on BC non-exhaust emissions is performed, specifically regarding tire wear emissions. A new parametrization to calculate particle resuspension is also presented, respecting the mass balance at the street surface.
Constant resuspension emission factors are often used in the literature to model resuspension, without accounting for the amount of deposited mass. Particle resuspension is not an important source of BC in the simulations here, as the deposited mass over the street surface is not significant enough to justify high constant resuspension emission factors. As the simulated deposited mass agrees well with in situ measurements, other sources of BC emissions are investigated here. In particular, non-exhaust emissions, such as tire wear, can be relevant to improve the modeling of BC concentrations in streets; they can be as relevant as exhaust emissions, and their underestimation may justify the virtual increase in BC emissions often employed in street-network modeling studies. This can have direct consequences for public policies aimed at reducing BC concentrations in urban areas: non-exhaust emissions may contribute to as much as half of the BC concentrations in streets.
Non-exhaust emissions still present very high uncertainties, with a large spectrum of emission factors and experimental limitations to separate each non-exhaust emission source. More studies are needed to better characterize these emissions with respect to their size distributions and chemical compositions. In particular, large differences are observed in the literature between different studies estimating tire wear emissions, with tire wear emission factors from the EMEP guidelines being on the low side of factors. Following the literature, increasing the BC passenger car tire wear emission factors of the EMEP guidelines from 1.36 to 20.8 mg per vehicle kilometer leads to good comparisons between the simulated BC concentrations and the measured ones. The authors highlight that additional work, mostly experimental, should be conducted to confirm this result. Furthermore, more studies are needed to control these emissions. Some studies have already indicated the importance of controlling vehicle speed and/or smoothing traffic flow to reduce non-exhaust emissions (Beji et al., 2020); however, other aspects can be investigated, such as the road, tire, and brake characteristics as well as vehicle weight. Thus, the work presented here makes a very strong case for revising current BC vehicular emission inventories and explicitly taking non-exhaust emissions into account in air quality simulations.
Two-way coupling rather than one-way coupling between the local and regional scales proved to strongly influence the BC concentrations in streets. This is because the BC concentration gradients observed between streets (local scale) and the urban background (regional scale) are often high. The intensity of the vertical mass flux between streets and the background are function of traffic emissions and street geometry (represented by the aspect ratio αr). This two-way coupling leads to higher BC concentrations in large streets with high traffic emissions and lower BC concentrations in narrow streets with low traffic emissions (with differences ranging from −51.5 % to 48.4 %).
A1 Definitions
FB represents fractional bias:
MG represents geometric mean bias:
NMSE represents normalized mean square error:
VG represents geometric variance:
NAD represents normalized absolute difference:
FAC2 represents the fraction of data that satisfy
where o and c represent the observed and simulated concentrations, respectively.
A2 Statistical indicators obtained with SinG and MUNICH-only simulations for Boulevard Alsace Lorraine
Table A1Comparisons to BC measurements in Boulevard Alsace Lorraine: statistical indicators obtained with SinG and MUNICH-only simulations.
A3 Details of the particle size distribution from non-exhaust emissions
Ntziachristos and Boulter (2016)Denby et al. (2013a)Table A2Size distribution of the total suspended particles emitted from non-exhaust emissions used in the simulations, showing the coarse PM fraction (), the PM2.5 fraction (), and the PM1 fraction () adopted for each wear emission source (tire wear is indicated by ty, brake wear is indicated by bk, and road wear is indicated by rd).
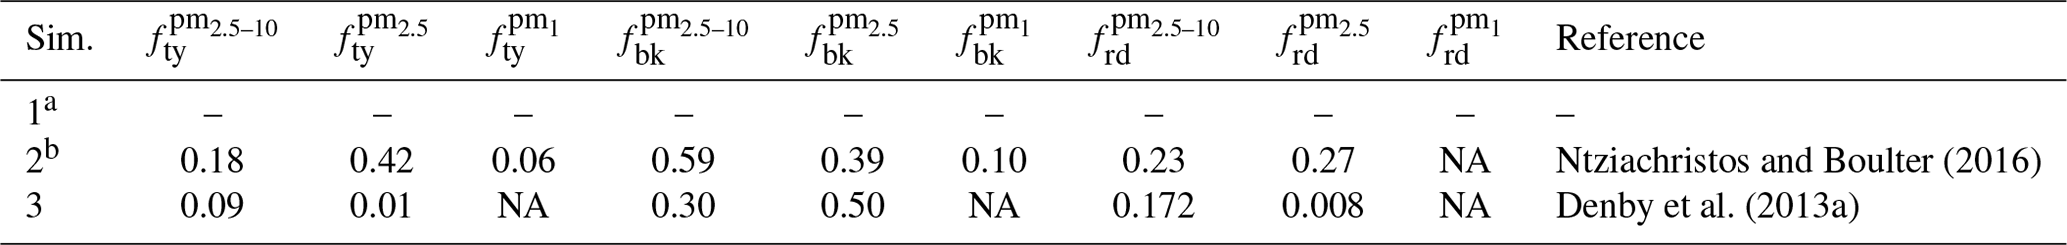
a Only exhaust emissions are considered (Ntziachristos and Samaras, 2018). b Same size distribution used in simulations 4, 5, and 6. NA: not available in the reference.
The source code of the Street-in-Grid and MUNICH models are available via Zenodo: https://doi.org/10.5281/zenodo.4393638 (Lugon et al., 2020b). The observation data are available upon request from AIRPARIF, TRAFIPOLLU campaign.
KS and LL were responsible for conceptualization. LL developed the software. LL conduced the visualization and validation; LL and KS performed the formal analysis. JV, KS, and CD acquired resources. KS and OC were responsible for funding acquisition. LL and KS were responsible for the original draft preparation and writing the paper.
The authors declare that they have no conflict of interest.
Publisher’s note: Copernicus Publications remains neutral with regard to jurisdictional claims in published maps and institutional affiliations.
The authors acknowledge financial support from the Department of Green Spaces and Environment (Mairie de Paris) and the École des Ponts ParisTech. The authors thank AIRPARIF for providing the emission inventory and the measured concentration data, and the TRAFIPOLLU ANR project for making data available for the model application and evaluation.
This research has been supported by the Department of Green Spaces and Environment (Mairie de Paris) and the École des Ponts ParisTech (grant no. CIFRE no. 2017/064).
This paper was edited by Jason Williams and reviewed by two anonymous referees.
Abu-Allaban, M., Gillies, J. A., Gertler, A. W., Clayton, R., and Proffitt, D.: Tailpipe, resuspended road dust, and brake-wear emission factors from on-road vehicles, Atmos. Environ., 37, 5283–5293, https://doi.org/10.1016/j.atmosenv.2003.05.005, 2003. a, b
AIRPARIF: Source apportionment of airbone particles in the Île-de-France region, Tech. rep., Air-quality agency of Paris, 2012. a, b
Amato, F., Pandolfi, M., Viana, M., Querol, X., Alastuey, A., and Moreno, T.: Spatial and chemical patterns of PM10 in road dust deposited in urban environment, Atmos. Environ., 43, 1650–1659, https://doi.org/10.1016/j.atmosenv.2008.12.009, 2009. a, b
Awad, Y. A., Koutrakis, P., Coull, B. A., and Schwartz, J.: A spatio-temporal prediction model based on support vector machine regression: ambient black carbon in three New England states, Environ. Res., 159, 427–434, https://doi.org/10.1016/j.envres.2017.08.039, 2017. a
Baekken, T.: Environmental effects of asphalt and tyre wear by road traffic, Tech. rep., Nordisk Seminor-og Arbejdsrapporter 1992, Copenhagen, Denmark, 1993 (in Norwegian). a
Baumann, W. and Ismeier, M.: Exemplarische Erfassung der Umweltexposition ausgewählter Kauschukderivate bei der bestimmungsgemäßen Verwendung in Reifen und deren Entsorgung, Endbericht zum Forschungsvorhaben, Tech. Report UBA-FB98-003, 1997. a, b
Beji, A., Deboudt, K., Khardi, S., Muresan, B., Flament, P., Fourmentin, M., and Lumière, L.: Non-exhaust particle emissions under various driving conditions: Implications for sustainable mobility, Transport. Res. D-Tr. E., 81, 102290, https://doi.org/10.1016/j.trd.2020.102290, 2020. a, b, c
Berdowski, J., Visschedijk, A., Creemers, E., and Pulles, T.: The coordinated European programme on particulate matter emission inventories, projections and guidance (CEPMEIP) Database, Tech. rep., TNO-MEP, Apeldoorn, NL, available at: http://www.air.sk/tno/cepmeip/ (last access: 2 November 2021), 2002. a
Boniardi, L., Dons, E., Campo, L., Van Poppel, M., Panis, L. I., and Fustinoni, S.: Annual, seasonal, and morning rush hour land use regression models for black carbon in a school catchment area of Milan, Italy, Environ. Res., 176, 108520, https://doi.org/10.1016/j.envres.2019.06.001, 2019. a
Boulter, P.: A review of emission factors and models for road vehicle non-exhaust particulate matter, Tech. Report PPR065, TRL Limited, Wokingham, UK, 2005. a, b, c, d, e, f
Boutahar, J., Lacour, S., Mallet, V., Quélo, D., Roustan, Y., and Sportisse, B.: Development and validation of a fully modular platform for numerical modelling of air pollution: POLAIR, Int. J. Environ. Pollut., 22, 17–28, https://doi.org/10.1504/IJEP.2004.005474, 2004. a
Brasseur, O., Declerck, P., Heene, B., and Vanderstraeten, P.: Modelling Black Carbon concentrations in two busy street canyons in Brussels using CANSBC, Atmos. Environ., 101, 72–81, https://doi.org/10.1016/j.atmosenv.2014.10.049, 2015. a, b
Chen, Y., Schleicher, N., Fricker, M., Cen, K., Liu, X.-l., Kaminski, U., Yu, Y., Wu, X.-f., and Norra, S.: Long-term variation of black carbon and PM2.5 in Beijing, China with respect to meteorological conditions and governmental measures, Environ. Pollut., 212, 269–278, https://doi.org/10.1016/j.envpol.2016.01.008, 2016. a
Cherin, N., Roustan, Y., Musson-Genon, L., and Seigneur, C.: Modelling atmospheric dry deposition in urban areas using an urban canopy approach, Geosci. Model Dev., 8, 893–910, https://doi.org/10.5194/gmd-8-893-2015, 2015. a, b
Chung, S. H. and Seinfeld, J. H.: Climate response of direct radiative forcing of anthropogenic black carbon, J. Geophys. Res., 110, D11102, https://doi.org/10.1029/2004JD005441, 2005. a
Councell, T. B., Duckenfield, K. U., Landa, E. R., and Callender, E.: Tire-wear particles as a source of zinc to the environment, Environ. Sci. Technol., 38, 4206–4214, https://doi.org/10.1021/es034631f, 2004. a
de Miranda, R. M., Perez-Martinez, P. J., de Fatima Andrade, M., and Ribeiro, F. N. D.: Relationship between black carbon (BC) and heavy traffic in São Paulo, Brazil, Transport. Res. D-Tr. E., 68, 84–98, https://doi.org/10.1016/j.trd.2017.09.002, 2019. a
Denby, B. R., Sundvor, I., Johansson, C., Pirjola, L., Ketzel, M., Norman, M., Kupiainen, K., Gustafsson, M., Blomqvist, G., and Omstedt, G.: A coupled road dust and surface moisture model to predict non-exhaust road traffic induced particle emissions (NORTRIP). Part 1: Road dust loading and suspension modelling, Atmos. Environ., 77, 283–300, https://doi.org/10.1016/j.atmosenv.2013.04.069, 2013a. a, b, c, d, e, f, g, h, i, j, k, l, m, n
Denby, B. R., Sundvor, I., Johansson, C., Pirjola, L., Ketzel, M., Norman, M., Kupiainen, K., Gustafsson, M., Blomqvist, G., and Omstedt, G.: A coupled road dust and surface moisture model to predict non-exhaust road traffic induced particle emissions (NORTRIP). Part 2: Surface moisture and salt impact modelling, Atmos. Environ., 81, 485–503, https://doi.org/10.1016/j.atmosenv.2013.09.003, 2013b. a, b, c, d, e
Dons, E., Panis, L. I., Van Poppel, M., Theunis, J., and Wets, G.: Personal exposure to black carbon in transport microenvironments, Atmos. Environ., 55, 392–398, https://doi.org/10.1016/j.atmosenv.2012.03.020, 2012. a
Dore, C. J., Goodwin, J. W. L., Watterson, J. D., Murrells, T. P., Passant, N. R., Hobson, M. M., Haigh, K. E., Baggott, S. L., Pye, S. T., Coleman, P. J., and King, K. R.: UK emissions of air pollutants 1970 to 2001, National Atmospheric Emissions Inventory, 2003. a
Gebbe, H.: Quantifizierung des reifenabriebs von kraftfahrzeugen in Berlin, ISS-Fahrzeugtechnik, TU Berlin, im Auftrag der Senatsverwaltung für Stadtentwicklung, Umweltschutz und Technologie Berlin, Berlin, 1997. a, b
Grigoratos, T. and Martini, G.: Brake wear particle emissions: a review, Environ. Sci. Pollut. R., 22, 2491–2504, https://doi.org/10.1007/s11356-014-3696-8, 2015. a
Guevara, M., Tena, C., Porquet, M., Jorba, O., and Pérez García-Pando, C.: HERMESv3, a stand-alone multi-scale atmospheric emission modelling framework – Part 2: The bottom–up module, Geosci. Model Dev., 13, 873–903, https://doi.org/10.5194/gmd-13-873-2020, 2020. a, b, c
Hanna, S. and Chang, J.: Acceptance criteria for urban dispersion model evaluation, Meteorol. Atmos. Phys., 116, 133–146, https://doi.org/10.1007/s00703-011-0177-1, 2012. a, b
Harrison, R. M., Yin, J., Mark, D., Stedman, J., Appleby, R. S., Booker, J., and Moorcroft, S.: Studies of the coarse particle (2.5–10 µm) component in UK urban atmospheres, Atmos. Environ., 35, 3667–3679, https://doi.org/10.1016/S1352-2310(00)00526-4, 2001. a
Herring, S. and Huq, P.: A review of methodology for evaluating the performance of atmospheric transport and dispersion models and suggested protocol for providing more informative results, Fluids, 3, 20, https://doi.org/10.3390/fluids3010020, 2018. a, b
Highwood, E. J. and Kinnersley, R. P.: When smoke gets in our eyes: The multiple impacts of atmospheric black carbon on climate, air quality and health, Environ. Int., 32, 560–566, https://doi.org/10.1016/j.envint.2005.12.003, 2006. a
Hong, Y., Bonhomme, C., Le, M.-H., and Chebbo, G.: A new approach of monitoring and physically-based modelling to investigate urban wash-off process on a road catchment near Paris, Water Res., 102, 96–108, https://doi.org/10.1016/j.watres.2016.06.027, 2016a. a, b, c, d, e
Hong, Y., Bonhomme, C., Le, M.-H., and Chebbo, G.: New insights into the urban washoff process with detailed physical modelling, Sci. Total Environ., 573, 924–936, https://doi.org/10.1016/j.scitotenv.2016.08.193, 2016b. a, b
Invernizzi, G., Ruprecht, A., Mazza, R., De Marco, C., Močnik, G., Sioutas, C., and Westerdahl, D.: Measurement of black carbon concentration as an indicator of air quality benefits of traffic restriction policies within the ecopass zone in Milan, Italy, Atmos. Environ., 45, 3522–3527, https://doi.org/10.1016/j.atmosenv.2011.04.008, 2011. a
Jacobson, M. Z.: Strong radiative heating due to the mixing state of black carbon in atmospheric aerosols, Nature, 409, 695–697, https://doi.org/10.1038/35055518, 2001. a
Jansen, K. L., Larson, T. V., Koenig, J. Q., Mar, T. F., Fields, C., Stewart, J., and Lippmann, M.: Associations between health effects and particulate matter and black carbon in subjects with respiratory disease, Environ. Health Persp., 113, 1741–1746, https://doi.org/10.1289/ehp.8153, 2005. a
Janssen, N. A. H., Hoek, G., Simic-Lawson, M., Fischer, P., Van Bree, L., Ten Brink, H., Keuken, M., Atkinson, R. W., Anderson, H. R., Brunekreef, B., and Casse, F. R.: Black carbon as an additional indicator of the adverse health effects of airborne particles compared with PM10 and PM2.5, Environ. Health Persp., 119, 1691–1699, https://doi.org/10.1289/ehp.1003369, 2011. a
Jones, R. R., Hoek, G., Fisher, J. A., Hasheminassab, S., Wang, D., Ward, M. H., Sioutas, C., Vermeulen, R., and Silverman, D. T.: Land use regression models for ultrafine particles, fine particles, and black carbon in southern California, Sci. Total Environ., 699, 134234, https://doi.org/10.1016/j.scitotenv.2019.134234, 2020. a
Khare, P., Machesky, J., Soto, R., He, M., Presto, A. A., and Gentner, D. R.: Asphalt-related emissions are a major missing nontraditional source of secondary organic aerosol precursors, Sci. Adv., 6, eabb9785, https://doi.org/10.1126/sciadv.abb9785, 2020. a
Kim, Y., Wu, Y., Seigneur, C., and Roustan, Y.: Multi-scale modeling of urban air pollution: development and application of a Street-in-Grid model (v1.0) by coupling MUNICH (v1.0) and Polair3D (v1.8.1), Geosci. Model Dev., 11, 611–629, https://doi.org/10.5194/gmd-11-611-2018, 2018. a, b, c, d, e, f, g, h
Kreider, M. L., Panko, J. M., McAtee, B. L., Sweet, L. I., and Finley, B. L.: Physical and chemical characterization of tire-related particles: Comparison of particles generated using different methodologies, Sci. Total Environ., 408, 652–659, 2010. a
Lawrence, S., Sokhi, R., and Ravindra, K.: Quantification of vehicle fleet PM10 particulate matter emission factors from exhaust and non-exhaust sources using tunnel measurement techniques, Environ. Pollut., 210, 419–428, https://doi.org/10.1016/j.envpol.2016.01.011, 2016. a, b
Lequy, E., Siemiatycki, J., de Hoogh, K., Vienneau, D., Dupuy, J.-F., Garès, V., Hertel, O., Christensen, J. H., Zhivin, S., Goldberg, M., et al.: Contribution of Long-Term Exposure to Outdoor Black Carbon to the Carcinogenicity of Air Pollution: Evidence regarding Risk of Cancer in the Gazel Cohort, Environ. Health Persp., 129, 037005, https://doi.org/10.1289/EHP8719, 2021. a
Li, X., Huang, L., Li, J., Shi, Z., Wang, Y., Zhang, H., Ying, Q., Yu, X., Liao, H., and Hu, J.: Source contributions to poor atmospheric visibility in China, Resour. Conserv. Recy., 143, 167–177, https://doi.org/10.1016/j.resconrec.2018.12.029, 2019. a
Liu, M., Peng, X., Meng, Z., Zhou, T., Long, L., and She, Q.: Spatial characteristics and determinants of in-traffic black carbon in Shanghai, China: Combination of mobile monitoring and land use regression model, Sci. Total Environ., 658, 51–61, https://doi.org/10.1016/j.scitotenv.2018.12.135, 2019. a
Lugon, L., Sartelet, K., Kim, Y., Vigneron, J., and Chrétien, O.: Nonstationary modeling of NO2, NO and NOx in Paris using the Street-in-Grid model: coupling local and regional scales with a two-way dynamic approach, Atmos. Chem. Phys., 20, 7717–7740, https://doi.org/10.5194/acp-20-7717-2020, 2020a. a, b, c, d, e, f, g, h, i, j, k, l
Lugon, L., Vigneron, J., Debert, C., Chrétien, O., and Sartelet, K.: Street-in-Grid model for inert particles (SinG-inert), Version 2.1, Zenodo [data set], https://doi.org/10.5281/zenodo.4393638, 2020b. a
Luhana, L., Sokhi, R., Warner, L., Mao, H., Boulter, P., McCrae, I., Wright, J., and Osborn, D.: Measurement of non-exhaust particulate matter. Characterisation of exhaust particulate emissions from road vehicles (PARTICULATES), Deliverable, European Commission – Directorate General Transport and Environment, Tech. rep., available at: https://ec.europa.eu/transport/road_safety/sites/roadsafety/files/pdf/projects_sources/particulates_d8.pdf (last access: 2 November 2021), 2004. a, b, c, d
Lyu, Y. and Olofsson, U.: On black carbon emission from automotive disc brakes, J. Aero. Sci., 148, 105610, https://doi.org/10.1016/j.jaerosci.2020.105610, 2020. a
Majdi, M., Kim, Y., Turquety, S., and Sartelet, K.: Impact of mixing state on aerosol optical properties during severe wildfires over the Euro-Mediterranean region, Atmos. Environ., 220, 117042, https://doi.org/10.1016/j.atmosenv.2019.117042, 2020. a
Mallet, V., Quélo, D., Sportisse, B., Ahmed de Biasi, M., Debry, É., Korsakissok, I., Wu, L., Roustan, Y., Sartelet, K., Tombette, M., and Foudhil, H.: Technical Note: The air quality modeling system Polyphemus, Atmos. Chem. Phys., 7, 5479–5487, https://doi.org/10.5194/acp-7-5479-2007, 2007. a
Malmqvist, P.-A.: Urban stormwater pollutant sources-an analysis of inflows and outflows of nitrogen, phosphorus, lead, zinc and copper in urban areas, thesis, Chalmers University of Technology, Gothenburg, Sweden, 1983. a, b
Moosmüller, H., Gillies, J., Rogers, C., DuBois, D., Chow, J., Watson, J., and Langston, R.: Particulate emission rates for unpaved shoulders along a paved road, J. Air. Waste Manage. Assoc., 48, 398–407, https://doi.org/10.1080/10473289.1998.10463694, 1998. a
Ntziachristos, L. and Boulter, P.: 1.A.3.b.vi Road transport: Automobile tyre and brake wear; 1.A.3.b.vii Road tranport: Automobile road abrasion, EMEP/EEA air pollutant emission inventory guidebook 2016, European Environment Agency (EEA), Copenhagen, Denmark, available at: https://www.eea.europa.eu/publications/emep-eea-guidebook-2016/part-b-sectoral-guidance-chapters/1-energy/1-a-combustion/1-a-3-b-vi, (last access: 2 November 2021), 2016. a, b, c, d, e, f, g, h, i, j, k, l, m, n, o, p
Ntziachristos, L. and Samaras, Z.: EMEP/EEA–Air Pollutant Emission Inventory Guidebook 2016 – Update Jul. 2018, European Environment Agency (EEA), Copenhagen, Denmark, available at: https://www.eea.europa.eu/publications/emep-eea-guidebook-2016/part-b-sectoral-guidance-chapters/1-energy/1-a-combustion/1-a-3-b-i (last access: 2 November 2021), 2018. a, b, c, d, e, f, g, h, i, j, k
Park, I., Lee, J., and Lee, S.: Laboratory study of the generation of nanoparticles from tire tread, Aerosol Sci. Tech., 51, 188–197, https://doi.org/10.1080/02786826.2016.1248757, 2017. a
Park, I., Kim, H., and Lee, S.: Characteristics of tire wear particles generated in a laboratory simulation of tire/road contact conditions, J. Aero. Sci., 124, 30–40, https://doi.org/10.1016/j.jaerosci.2018.07.005, 2018. a
Pay, M. T., Jiménez-Guerrero, P., and Baldasano, J. M.: Implementation of resuspension from paved roads for the improvement of CALIOPE air quality system in Spain, Atmos. Environ., 45, 802–807, https://doi.org/10.1016/j.atmosenv.2010.10.032, 2011. a, b, c, d, e
Ramachandran, S. and Kedia, S.: Black carbon aerosols over an urban region: radiative forcing and climate impact, J. Geophys. Res., 115, D10202, https://doi.org/10.1029/2009JD013560, 2010. a
Rauterberg-Wulff, A.: Determination of emission factors for tire wear particles by tunnel measurements, in: 8th International Symposium “Transport and Air Pollution”, Graz, Austria, June 1999. a
Richmond-Bryant, J., Saganich, C., Bukiewicz, L., and Kalin, R.: Associations of PM2.5 and black carbon concentrations with traffic, idling, background pollution, and meteorology during school dismissals, Sci. Total Environ., 407, 3357–3364, https://doi.org/10.1016/j.scitotenv.2009.01.046, 2009. a
Sanchez, M., Ambros, A., Milà, C., Salmon, M., Balakrishnan, K., Sambandam, S., Sreekanth, V., Marshall, J. D., and Tonne, C.: Development of land-use regression models for fine particles and black carbon in peri-urban South India, Sci. Total Environ., 634, 77–86, https://doi.org/10.1016/j.scitotenv.2018.03.308, 2018. a
Sanders, P. G., Xu, N., Dalka, T. M., and Maricq, M. M.: Airborne brake wear debris: size distributions, composition, and a comparison of dynamometer and vehicle tests, Environ. Sci. Technol., 37, 4060–4069, https://doi.org/10.1021/es034145s, 2003. a
Sartelet, K., Debry, E., Fahey, K., Roustan, Y., Tombette, M., and Sportisse, B.: Simulation of aerosols and gas-phase species over Europe with the POLYPHEMUS system: Part I–Model-to-data comparison for 2001, Atmos. Environ., 41, 6116–6131, https://doi.org/10.1016/j.atmosenv.2007.04.024, 2007. a, b
Schuring, D. and Clark, J.: Load, speed, and pressure effects on passenger car tire rolling-loss distribution, Rubber Chem. Technol., 61, 669–687, https://doi.org/10.5254/1.3536212, 1988. a
Tao, J., Ho, K.-F., Chen, L., Zhu, L., Han, J., and Xu, Z.: Effect of chemical composition of PM2.5 on visibility in Guangzhou, China, 2007 spring, Particuology, 7, 68–75, https://doi.org/10.1016/j.partic.2008.11.002, 2009. a
Thorpe, A. and Harrison, R. M.: Sources and properties of non-exhaust particulate matter from road traffic: a review, Sci. Total Environ., 400, 270–282, https://doi.org/10.1016/j.scitotenv.2008.06.007, 2008. a, b, c
Thorpe, A. J., Harrison, R. M., Boulter, P. G., and McCrae, I. S.: Estimation of particle resuspension source strength on a major London Road, Atmos. Environ., 41, 8007–8020, https://doi.org/10.1016/j.atmosenv.2007.07.006, 2007. a
Thouron, L., Seigneur, C., Kim, Y., Mahé, F., André, M., Bruge, B., Chanut, H., and Pellan, Y.: Intercomparison of three modeling approaches for traffic-related road dust resuspension using two experimental data, Transport. Res. D-Tr. E., 58, 108–121, https://doi.org/10.1016/j.trd.2017.11.003, 2018. a, b, c, d
Tong, Z., Wang, Y. J., Patel, M., Kinney, P., Chrillrud, S., and Zhang, K. M.: Modeling spatial variations of black carbon particles in an urban highway-building environment, Environ. Sci. Technol., 46, 312–319, https://doi.org/10.1021/es201938v, 2011. a
Tripathi, S., Dey, S., Tare, V., and Satheesh, S.: Aerosol black carbon radiative forcing at an industrial city in northern India, Geophys. Res. Lett., 32, L08802, https://doi.org/10.1029/2005GL022515, 2005. a
Van den Bossche, J., De Baets, B., Verwaeren, J., Botteldooren, D., and Theunis, J.: Development and evaluation of land use regression models for black carbon based on bicycle and pedestrian measurements in the urban environment, Environ. Modell. Softw., 99, 58–69, https://doi.org/10.1016/j.envsoft.2017.09.019, 2018. a
Van den Hove, A., Verwaeren, J., Van den Bossche, J., Theunis, J., and De Baets, B.: Development of a land use regression model for black carbon using mobile monitoring data and its application to pollution-avoiding routing, Environ. Res., 183, 108619, https://doi.org/10.1016/j.envres.2019.108619, 2019. a
Vaze, J. and Chiew, F. H.: Experimental study of pollutant accumulation on an urban road surface, Urban Water, 4, 379–389, https://doi.org/10.1016/S1462-0758(02)00027-4, 2002. a
Venkatram, A., Fitz, D., Bumiller, K., Du, S., Boeck, M., and Ganguly, C.: Using a dispersion model to estimate emission rates of particulate matter from paved roads, Atmos. Environ., 33, 1093–1102, https://doi.org/10.1016/S1352-2310(98)00316-1, 1999. a
Zhang, L., Cheng, S., Jiang, X., Zhang, J., Meng, P., Tang, Q., Qin, X., Wang, B., Chen, C., and Zou, Z.: Pregnancy exposure to carbon black nanoparticles exacerbates bleomycin-induced lung fibrosis in offspring via disrupting LKB1-AMPK-ULK1 axis-mediated autophagy, Toxicology, 425, 152244, https://doi.org/10.1016/j.tox.2019.152244, 2019a. a
Zhang, Y., Tu, B., Jiang, X., Xu, G., Liu, X., Tang, Q., Bai, L., Meng, P., Zhang, L., Qin, X., Zou, Z., and Chen, C.: Exposure to carbon black nanoparticles during pregnancy persistently damages the cerebrovascular function in female mice, Toxicology, 422, 44–52, https://doi.org/10.1016/j.tox.2019.04.014, 2019b. a
Zhu, S., Sartelet, K., Zhang, Y., and Nenes, A.: Three-dimensional modeling of the mixing state of particles over Greater Paris, J. Geophys. Res., 121, 5930–5947, https://doi.org/10.1002/2015JD024241, 2016. a
FB represents the fractional bias, MG is the geometric mean bias, NMSE is the normalized mean square error, VG is the geometric variance, NAD is the normalized absolute difference, and FAC2 is the fraction of predictions within a factor of 2 of observations.
- Abstract
- Introduction
- Uncertainties and variability in emission factors observed in non-exhaust emissions
- Model description
- Simulations' setup
- Sensitivity analysis to BC non-exhaust emissions
- Influence of the two-way coupling on BC concentrations in streets
- Conclusion
- Appendix A: Statistical parameters
- Data availability
- Author contributions
- Competing interests
- Disclaimer
- Acknowledgements
- Financial support
- Review statement
- References