the Creative Commons Attribution 4.0 License.
the Creative Commons Attribution 4.0 License.
 | 26 Oct 2021
Estimating global land system impacts of timber plantations using MAgPIE 4.3.5
Florian Humpenöder
Jan Philipp Dietrich
Benjamin Leon Bodirsky
Brent Sohngen
Christopher P. O. Reyer
Hermann Lotze-Campen
Alexander Popp
Out of 1150 Mha (million hectares) of forest designated primarily for production purposes in 2020, plantations accounted for 11 % (131 Mha) of this area and fulfilled more than 33 % of the global industrial roundwood demand. However, adding additional timber plantations to meet increasing timber demand intensifies competition for scarce land resources between different land uses such as food, feed, livestock and timber production. Despite the significance of plantations with respect to roundwood production, their importance in meeting the long-term timber demand and the implications of plantation expansion for overall land-use dynamics have not been studied in detail, in particular regarding the competition for land between agriculture and forestry in existing land-use models.
This paper describes the extension of the modular, open-source land system Model of Agricultural Production and its Impact on the Environment (MAgPIE) using a detailed representation of forest land, timber production and timber demand dynamics. These extensions allow for a better understanding of the land-use dynamics (including competition for land) and the associated land-use change emissions of timber production.
We show that the spatial cropland patterns differ when timber production is accounted for, indicating that timber plantations compete with cropland for the same scarce land resources. When plantations are established on cropland, it causes cropland expansion and deforestation elsewhere. Using the exogenous extrapolation of historical roundwood production from plantations, future timber demand and plantation rotation lengths, we model the future spatial expansion of forest plantations. As a result of increasing timber demand, we show a 177 % increase in plantation area by the end of the century (+171 Mha in 1995–2100). We also observe (in our model results) that the increasing demand for timber amplifies the scarcity of land, which is indicated by shifting agricultural land-use patterns and increasing yields from cropland compared with a case without forestry. Through the inclusion of new forest plantation and natural forest dynamics, our estimates of land-related CO2 emissions better match with observed data, in particular the gross land-use change emissions and carbon uptake (via regrowth), reflecting higher deforestation with the expansion of managed land and timber production as well as higher regrowth in natural forests and plantations.
Please read the corrigendum first before continuing.
-
Notice on corrigendum
The requested paper has a corresponding corrigendum published. Please read the corrigendum first before downloading the article.
-
Article
(10793 KB)
-
The requested paper has a corresponding corrigendum published. Please read the corrigendum first before downloading the article.
- Article
(10793 KB) - Full-text XML
- Corrigendum
- BibTeX
- EndNote


Forests covered 4060Mha (million hectares) of the global land (31 %) in 2020. Of this 4060 Mha, 1110 Mha was primary forest, 2657 Mha was secondary forest and 293 Mha was planted forest. Based on the FAO (2020a) definitions, plantations cover 131 Mha of the latter category, and other planted forests cover 162 Mha. According to FAO (2020a), 1150 Mha of forest is designated as production forest. Plantations, as a very special forest land-use type according to FAO definitions, account for 11 % of that area (and only 3 % of the global forest area) but likely supplied more than 33 % (654 Mm3) of the global industrial roundwood demand (1984 Mm3) in 2020 based on historical trends (Jürgensen et al., 2014). This relatively large contribution compared with the area covered underlines plantations' special role in global land-use dynamics. Roundwood consists of two subcategories: industrial roundwood and wood fuel.
Historical trends show a continuous increase in the share of roundwood production coming from plantations (Jürgensen et al., 2014). This trend indicates the efficacy and importance of timber plantations with respect to meeting roundwood demand and the role of renewable forest management in natural forests (i.e., primary and secondary forests), especially in North America and Europe (Siry et al., 2018; Biber et al., 2020). The remaining share comes from other sources including the harvesting of natural forests or managed secondary or planted forests. Deforestation continues to occur at a large scale, with wood harvesting being an important driving factor after cropland expansion (Curtis et al., 2018).
Deforestation contributes to about a third (3.8 Gt CO2 yr−1) of agriculture, forestry and land-use (AFOLU) change emissions (10–12 Gt CO2 yr−1) (Jia et al., 2019; Smith et al., 2014), and as it is an important driver of biodiversity loss, a better understanding of how we can produce timber using land resources efficiently is imperative. Plantation forests for timber production have a potentially higher annual average increment per area than natural forests and managed natural forests (IPCC, 2006) because they are managed more intensively (e.g., fertilizer and thinning) and rely on high-quality seeds and seedlings for regeneration. Due to their higher productivity compared with natural forests (FAO, 2013; IPCC, 2006; Cubbage et al., 2007; Payn et al., 2015), timber plantations have the potential to fulfill a major portion of global roundwood demand while using a relatively small amount of land. However, assuming land distribution among different land uses to be a zero-sum game, higher demand for timber plantation areas has to come from reducing other land uses (e.g., agriculture or natural vegetation), which creates additional pressures on the land system.
Land being a limited resource and the increasing demand for food, feed and timber drives competition between different land use types. Increasing demand for roundwood and the way this roundwood is produced drives competition for land via more forest area, which might displace agricultural areas. Land-use models can help with analyzing these land competition dynamics based on observed data by optimizing a set of objective(s) and minimizing negative trade-offs between land uses (Verhagen et al., 2018). Understanding such competition helps to reveal how changes in the land system affect the functioning of the land system as a whole and the trade-offs that this competition may entail (Crate et al., 2017).
As part of land systems, forest resource use has been included in many modeling activities including integrated assessment models (IAMs) like the Global Change Analysis Model (GCAM) (Calvin et al., 2019; Wise et al., 2014) and the Integrated Model to Assess the Global Environment (IMAGE) (Stehfest et al., 2014). Forests are also included in varying degrees of representation in recursive dynamic optimization models like the Global Forest Sector Model (EFI-GTM) (Kallio et al., 2004) and the Global Biosphere Management Model (GLOBIOM) (Havlík et al., 2011) coupled with the Global Forest Model (G4M) (Kindermann et al., 2006). Timber supply and demand are also represented in the Global Timber Model (GTM) (Sohngen et al., 1999), which is an inter-temporal optimization model. A detailed review of recent developments and applications of partial equilibrium models in the forest sector is provided by Latta et al. (2013). However, existing land-use models or forest economics models at a higher spatial resolution either simulate detailed forest types and neglect competition for land or vice versa. No existing land-use model to our knowledge combines both of these features at a global scale.
To correctly represent the competition for land and the role of different forest types in meeting growing roundwood demand, a land-use model should ideally (a) represent land resource competition while accounting for food, feed and timber demand, and (b) represent different growth rates between natural and planted forests (accounting for optimal rotations in timber plantations).
However, of the recursive dynamic models mentioned above, partial equilibrium models like EFI-GTM and GTM do not use spatially explicit differences in forest growth rates but instead employ aggregated forest inventory data as model inputs. Both of these models focus on a detailed representation of the forest and timber industry but do not model competition for land between forests and agriculture at a fine spatial scale. IMAGE and GLOBIOM, both use spatially explicit differences in forest growth rates and tree species while representing competition for land between forests and agriculture but do not explicitly differentiate between natural forests and timber plantations. In IMAGE, land-use evolution for timber plantations is a model parameter and is not endogenously determined. GLOBIOM when coupled with G4M also circumvents the myopic nature of recursive dynamic models, as G4M results are linked to GLOBIOM for making appropriate land-use change decisions regarding wood production and forest land use. GCAM models competition between land uses via land competition nests (Snyder et al., 2020), where land-use categories belonging to the same category in the nest (e.g., crops) are assumed to compete more directly with each other than with land uses in other categories (e.g., forest) (van de Ven et al., 2021). Additionally, the choice of plantation rotation lengths is an important component for managed forests that follow even-aged management systems. To the best of our knowledge, the determination of optimal rotation lengths for timber plantations has not been done in any of the uncoupled global recursive dynamic models to date (Kallio et al., 2004; Calvin et al., 2019; Havlík et al., 2011).
In light of these limitations in representing timber plantations in the land-use modeling frameworks described above, tools that quantify and analyze land competition while explicitly accounting for the specifics of forest plantations within a uniform modeling framework are required. The Model of Agricultural Production and its Impact on the Environment (MAgPIE) uses both biophysical and economic drivers to simulate land-use change and its impact on the environment while accounting for feed, food and livestock demand (Popp et al., 2010; Lotze-Campen et al., 2008; Dietrich et al., 2019; Bodirsky et al., 2020). Driven by the motivation to represent coherent forest land-use dynamics within a single modeling framework, we present an extension of the MAgPIE 4 modeling framework using timber production and the associated land-use dynamics. The extension not only addresses the forestry sector modeling gaps outlined above via new MAgPIE modules that differentiate between timber plantations and natural vegetation land use but also includes forest age-class dynamics in a large-scale global land-use model like MAgPIE for the first time.
2.1 Model description
2.1.1 MAgPIE framework
The MAgPIE modeling framework (Dietrich et al., 2019; Lotze-Campen et al., 2008) is a global multiregional land system model. The objective function of MAgPIE is to minimize the global costs to produce food, feed, bioenergy and timber throughout the 21st century in a recursive dynamic model with limited foresight. The long time horizons in the establishment of new trees today, followed by harvesting such trees sometime in the future, calls for the use of a recursive dynamic model in order to understand how today's decisions impact tomorrow's behavior. MAgPIE is driven by the demand for agricultural commodities and roundwood, which is calculated based on population and income projections for the 21st century from the Shared Socioeconomic Pathways (SSPs).
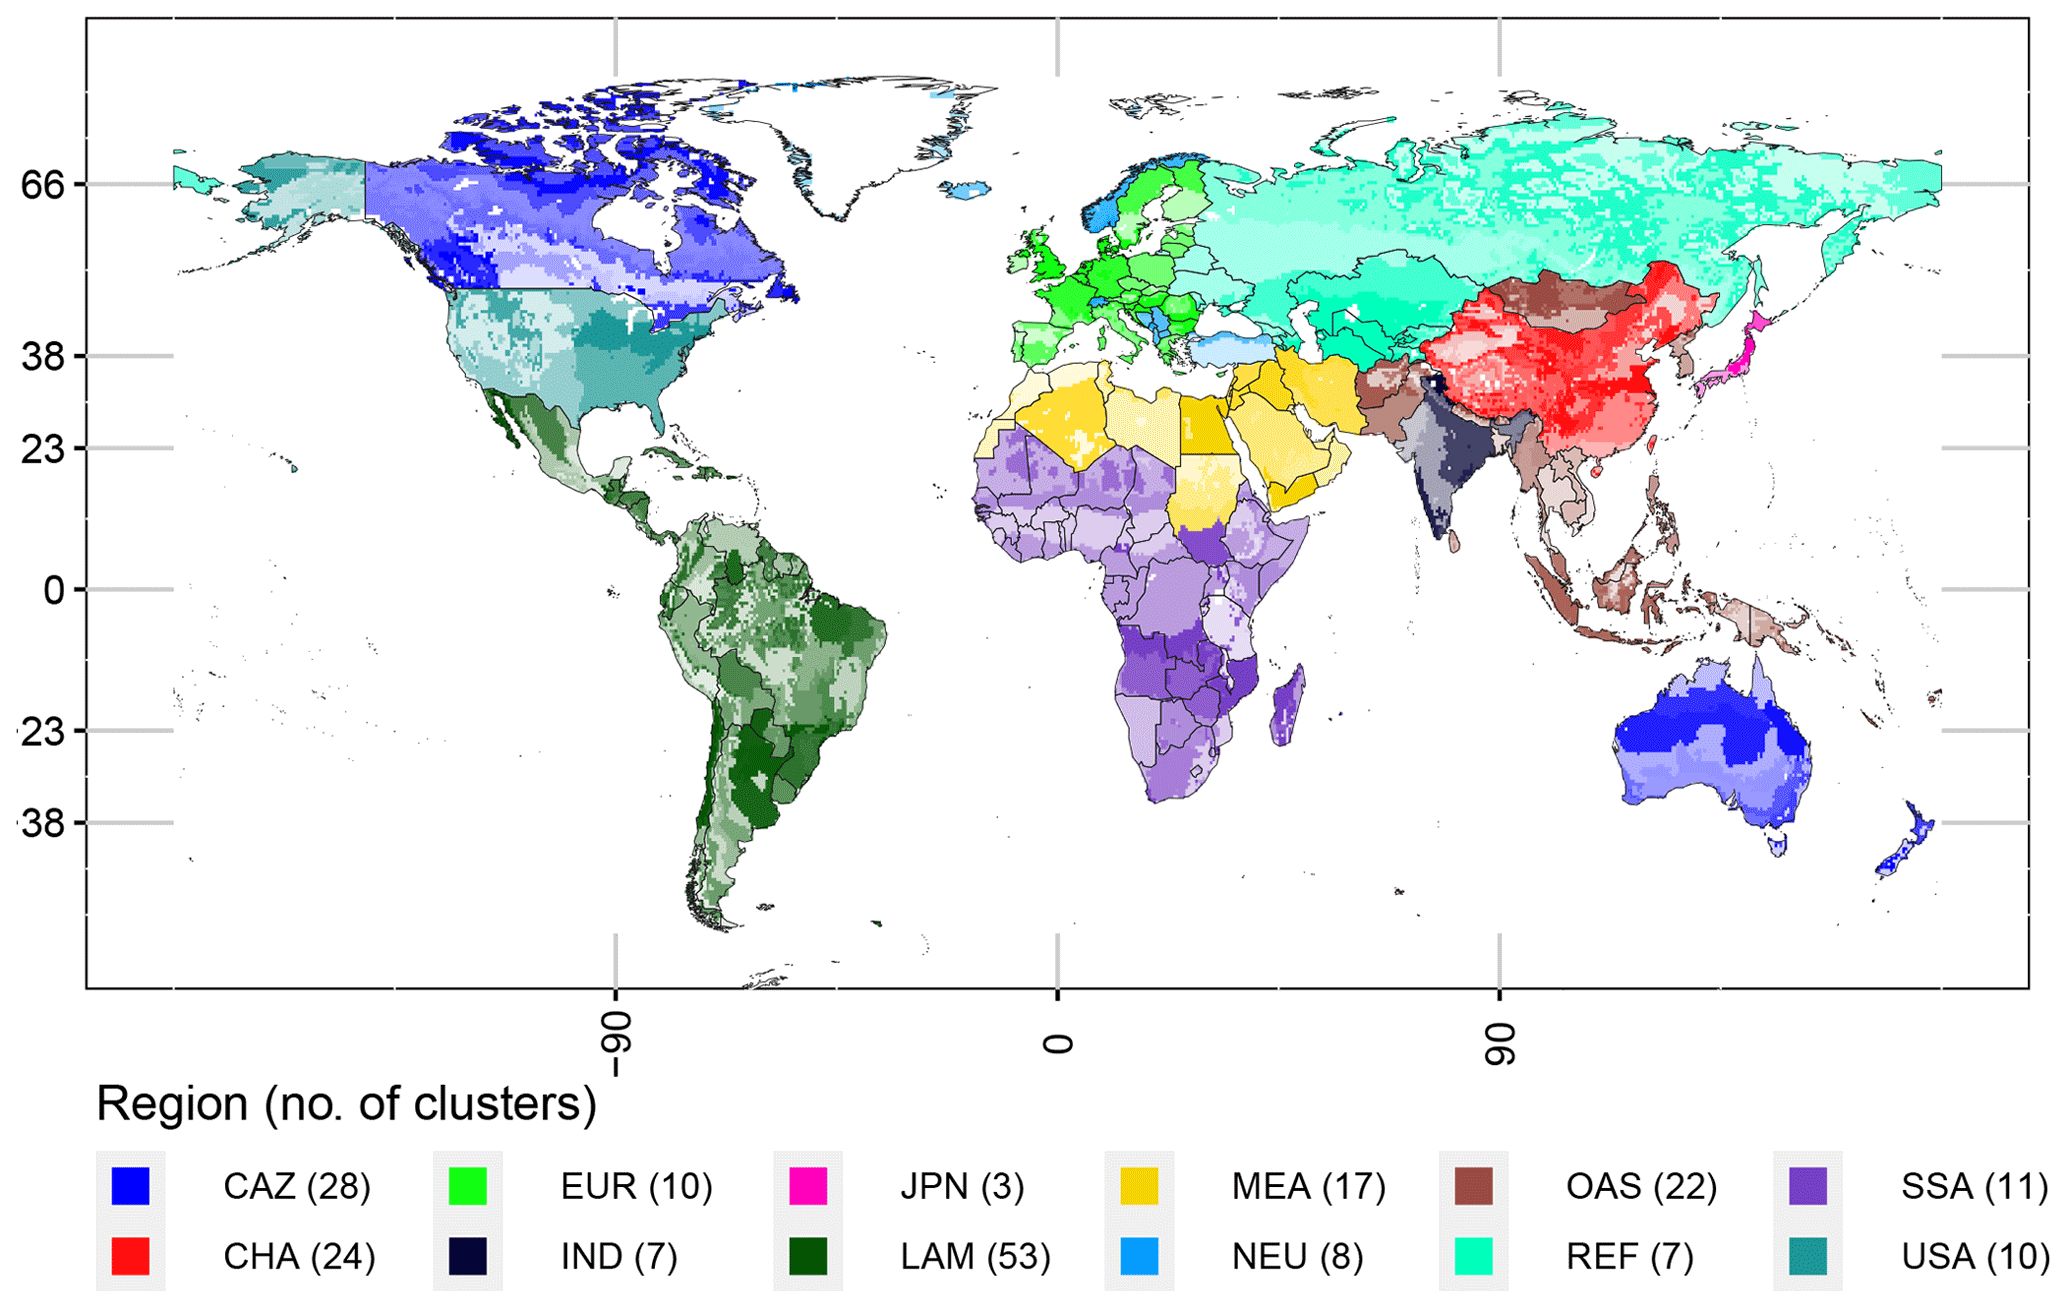
Figure 1A total of 200 simulation clusters in MAgPIE based on Dietrich et al. (2020a) on a 0.5∘ resolution grid. Clusters in each region are plotted on a gradient from the darkest to lightest shade of color representing a region.
MAgPIE derives specific land-use patterns, yields, and total costs of agricultural and roundwood production for each simulation cluster as described in Dietrich et al. (2019). MAgPIE's optimization is bound by spatially explicit biophysical constraints derived from the global gridded crop and hydrology model LPJmL (Bondeau et al., 2007). For this assessment, the spatially explicit (0.5∘ resolution) LPJmL outputs are aggregated for MAgPIE into 200 simulation units/clusters using a clustering algorithm (Dietrich et al., 2019, 2013), as shown in Fig. 1. MAgPIE is a nonlinear mathematical programming model written in the General Algebraic Modeling System (GAMS) (GAMS, 2021) and solved with the CONOPT4 solver (Drud, 2015).
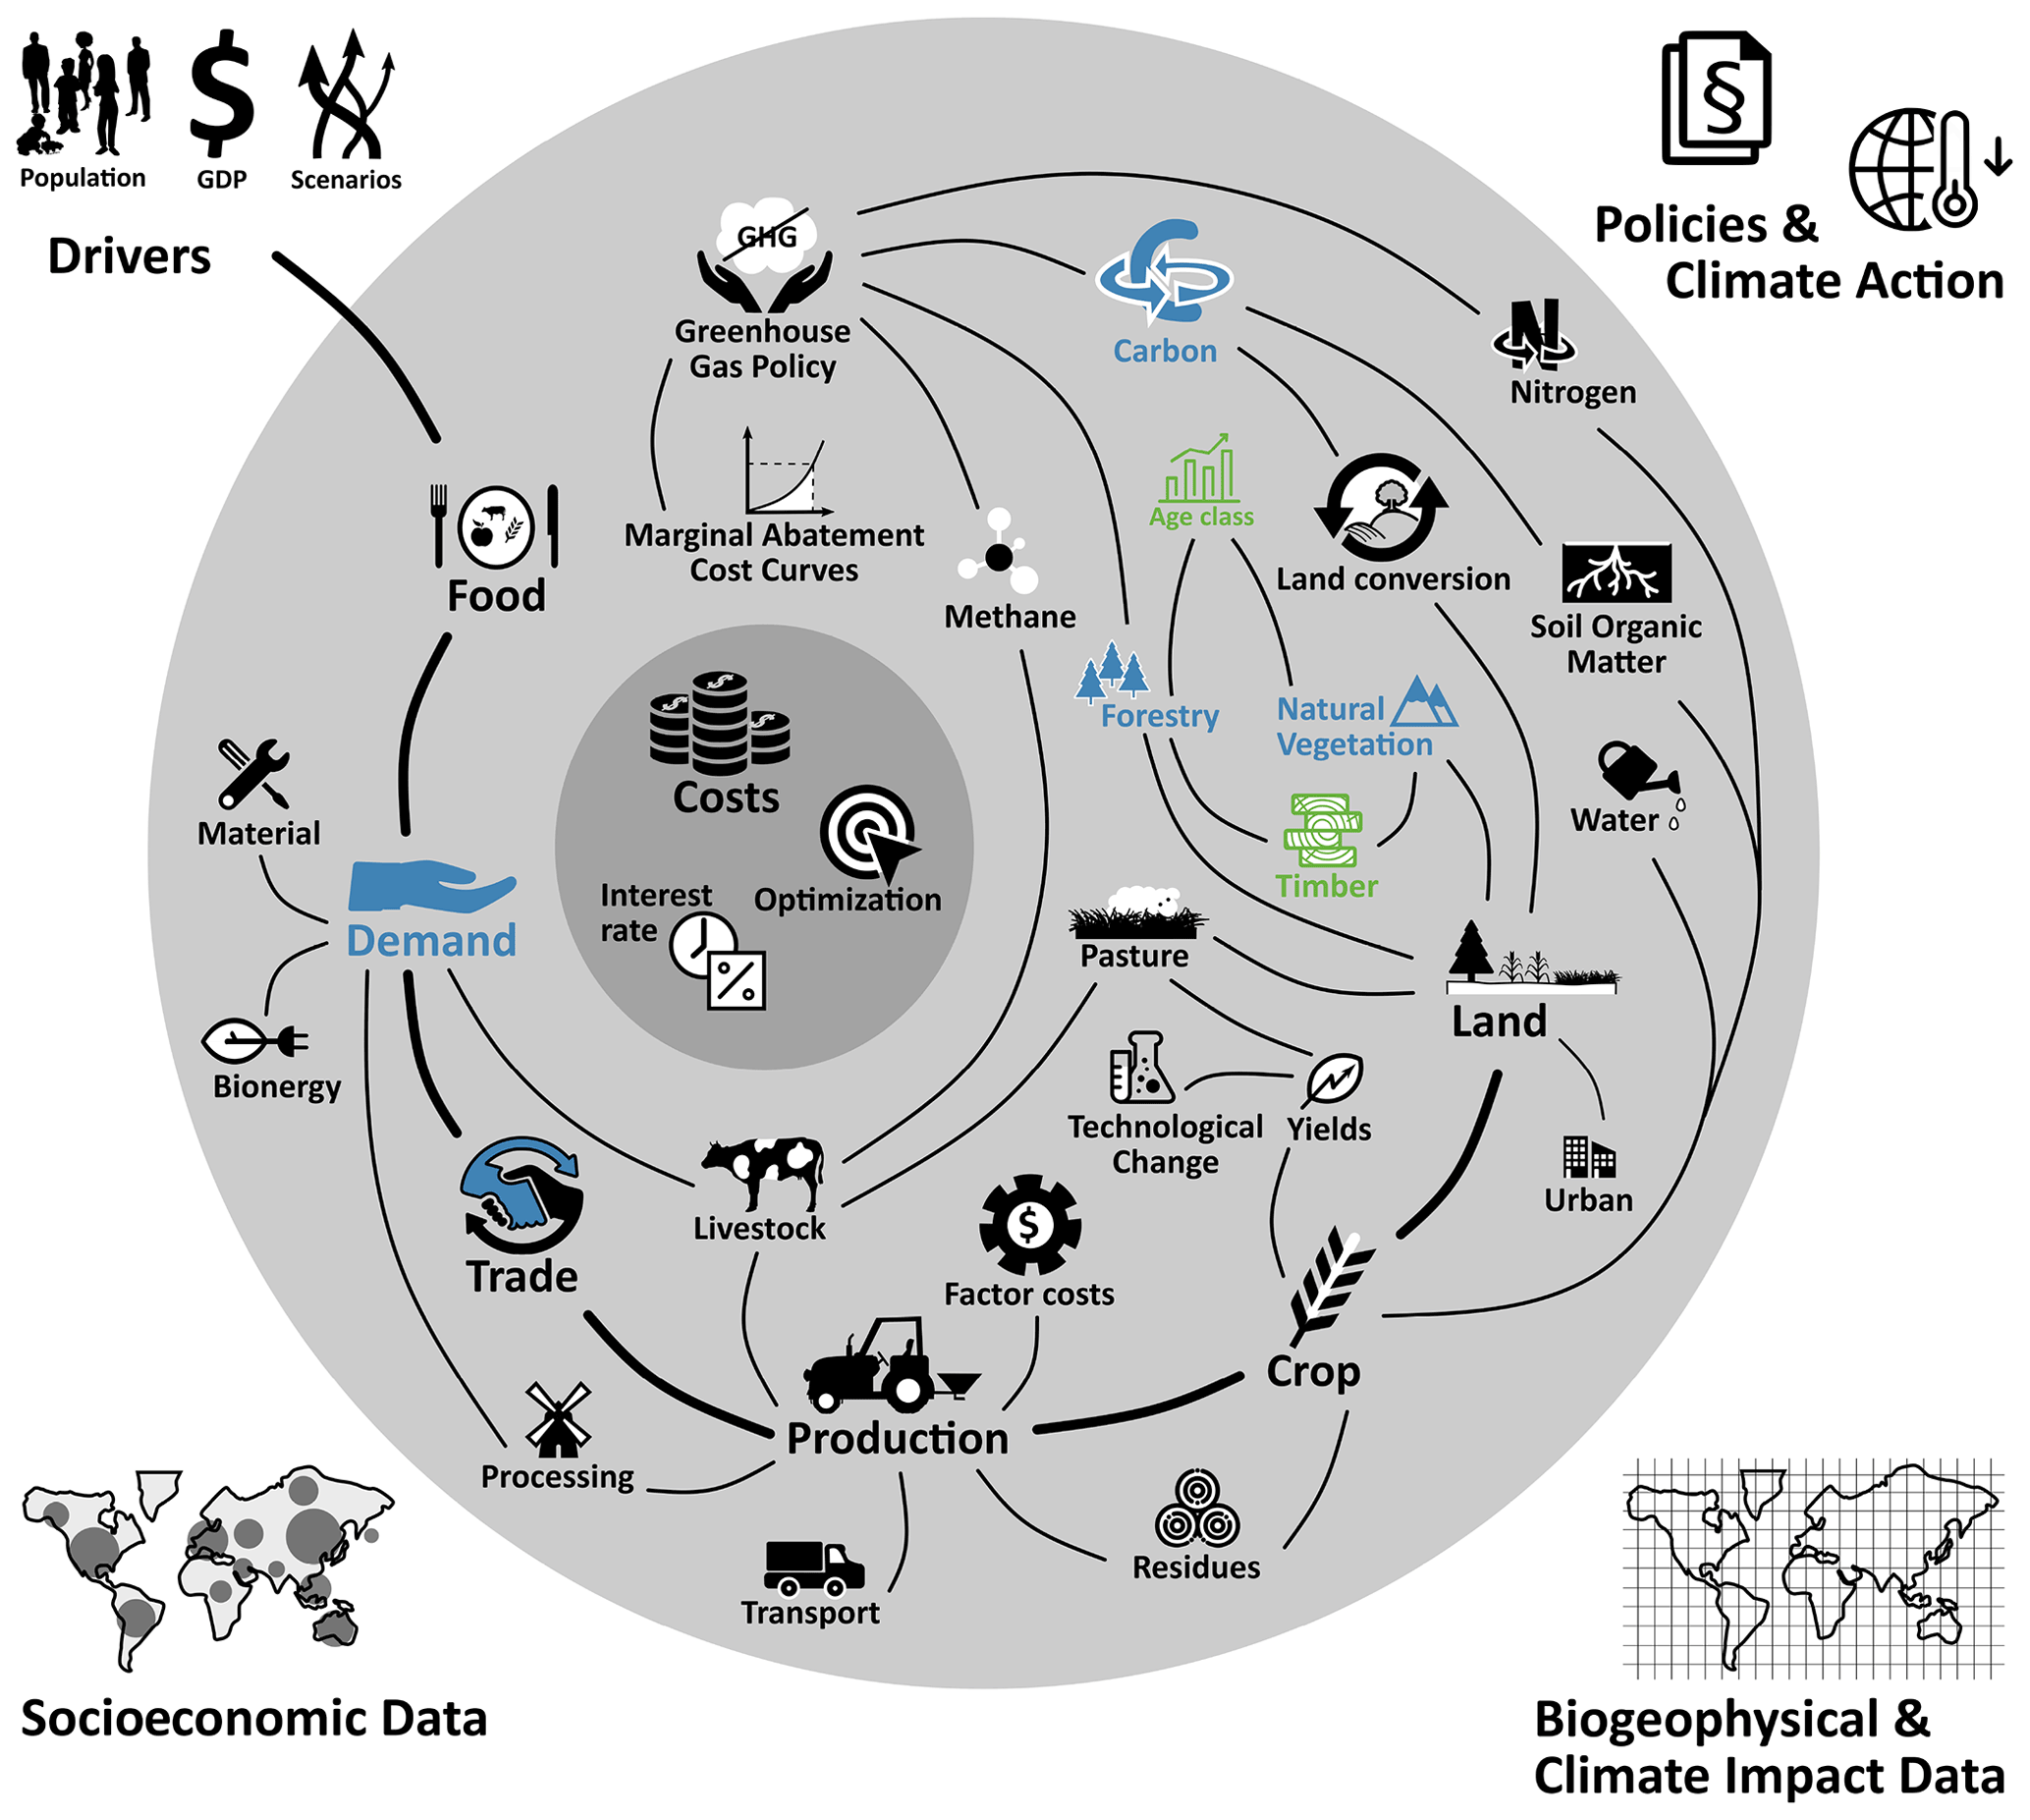
Figure 2The extended MAgPIE 4.3.5 framework. Blue represents an update to existing modules, and green represents new inclusions to Dietrich et al. (2019). See the model documentation (Dietrich et al., 2020b) for a more detailed presentation of module interactions and their implementation.
2.1.2 MAgPIE 4.3.5
The existing MAgPIE 4 framework (Dietrich et al., 2019) has been extended by the inclusion of timber production via forest land and timber demand, which we refer to as MAgPIE 4.3.5 in the text. The growth function for forests (Humpenöder et al., 2014) is parameterized using plantation- and natural-vegetation-specific parameters from Braakhekke et al. (2019). Finally, the trade representation was also extended to include industrial roundwood and wood fuel trade. The extension of the MAgPIE framework from version 4 to version 4.3.5 is shown in Fig. 2.
Table 1Summary of main differences between the two scenario setups.

2.2 Scenarios
We analyze two scenarios here, namely “default” and “forestry” (Table 1). Both the default and forestry scenarios take assumptions from the SSP2 story line also known as the “business-as-usual” or “middle-of-the-road” scenario (Riahi et al., 2017). In the default case, we replicate assumptions from a standard MAgPIE configuration based on Dietrich et al. (2020b), where (a) timber demand is not modeled, (b) no forest is harvested for timber production, (c) there is no competition for land between agriculture and forestry, and (d) secondary forests and plantations are assumed to belong to the highest age class during model initialization. The setup of the default scenario without wood demand, without harvest from plantations (and other forests) and without new plantation establishment implies that the plantation area remains constant at 1995 levels.
The forestry scenario, on the other hand, accounts for (a) gross domestic product (GDP) and population-driven industrial roundwood and wood fuel demand, (b) plantations and natural forests as a source of timber production, (c) endogenous competition for scarce land resources between agriculture and forestry, and (d) the heterogeneous age-class structure of secondary forests and plantations during initialization. Plantation forests are initialized such that there is a higher weight provided to younger age classes, reflecting the notion that replanting has continued to exceed harvests in plantation forests over the last decades. Secondary forests are initialized based on the land distribution among age classes described in Poulter et al. (2019).
In terms of protected areas, both scenarios account for national policies implemented (NPI) in terms of forest protection and afforestation according to existing national policies until 2030, in support of the Paris Agreement. Additional land protection is based on the World Database on Protected Areas (WDPA) which earmarks category I and II areas from the International Union for Conservation of Nature (IUCN) (UNESCO, 2011).
2.3 Rotation lengths
According to the maximum sustained yield rotation-period model described in Amacher et al. (2009), a forest owner's approach is to maximize the volume of timber that can be obtained from a given stand on a sustained yield basis. Such optimal time to harvest trees occurs when the timber volume increment is maximized such that the mean annual increment (MAI) is equivalent to the current annual increment (CAI). Maximizing the increment for choosing rotation lengths, however, results in longer rotation lengths compared with economically optimal Faustmann rotations. Additionally, in the MAgPIE framework, high rotations (ca. > 100 years) affect how the plantation area is initialized and result in a much lower availability of plantations for timber production (see Sect. 2.4). Therefore, for our implementation, we use the maximization of the CAI to ascertain the prescribed rotation lengths for timber plantations in MAgPIE, as from a empirical point of view, this criteria is closer to economically optimal (FAO, 1997) Faustmann rotations (Amacher et al., 2009).
In Eq. (1), is the first derivative of the age class (ac) specific carbon density with respect to age classes (fac). Instead of using the forest volume as described in Amacher et al. (2009), we use carbon density as a proxy for the same forest volume. Long-term average potential carbon density information for each MAgPIE cluster is obtained from LPJmL (Bondeau et al., 2007). This carbon density information is fed into a Chapman–Richards growth function to derive age-class-specific carbon densities, i.e., the f(ac) based on Humpenöder et al. (2014) (Fig. 3a). The first derivative of these carbon densities provides the marginal values with respect to age classes (Fig. 3b). Equating the first derivative of the CAI to zero provides the cluster-specific optimal rotation lengths (Fig. 3d), i.e., the optimal age class at which the harvest of the timber plantation is allowed in each cluster. Rotation length decisions once made cannot be altered at a later time step, which is in line the recursive dynamic optimization in MAgPIE. Natural forests are not bounded by the rotation length constraints of plantations. Spatially explicit rotation lengths used in MAgPIE, based on the maximum CAI, are shown in Fig. 4.
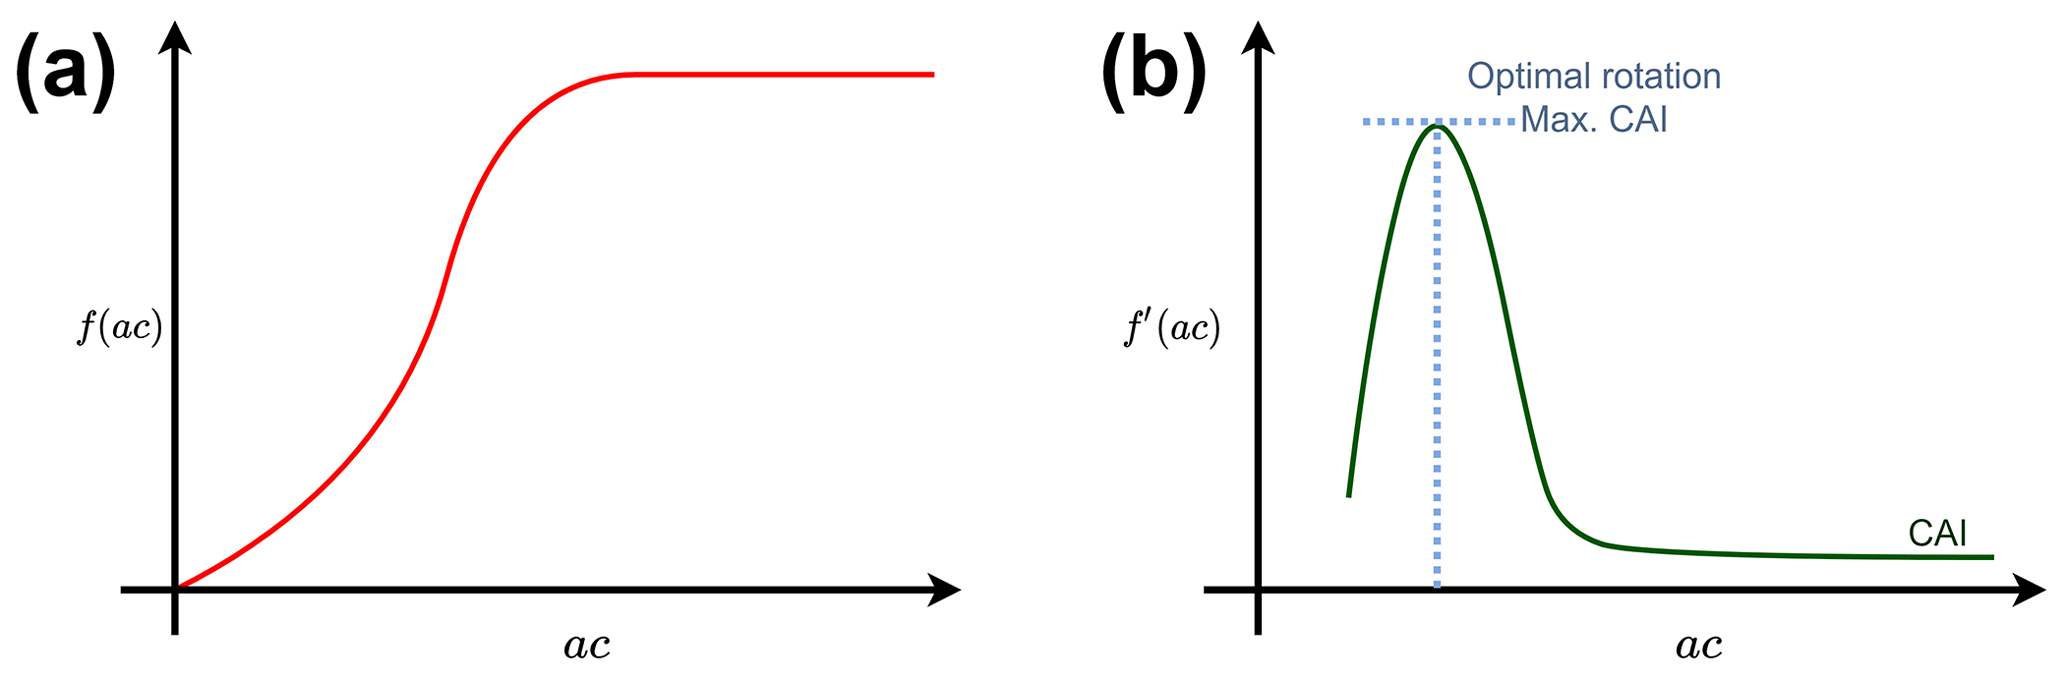
Figure 3Qualitative representation of the rotation length calculation using a single-rotation model in MAgPIE based on Amacher et al. (2009). The x axis represents the age-class equivalent of rotation lengths. Panel (a) shows an S-shaped growth curve calculation for every MAgPIE cluster. Panel (b) presents the first derivative of these cluster-specific carbon densities.
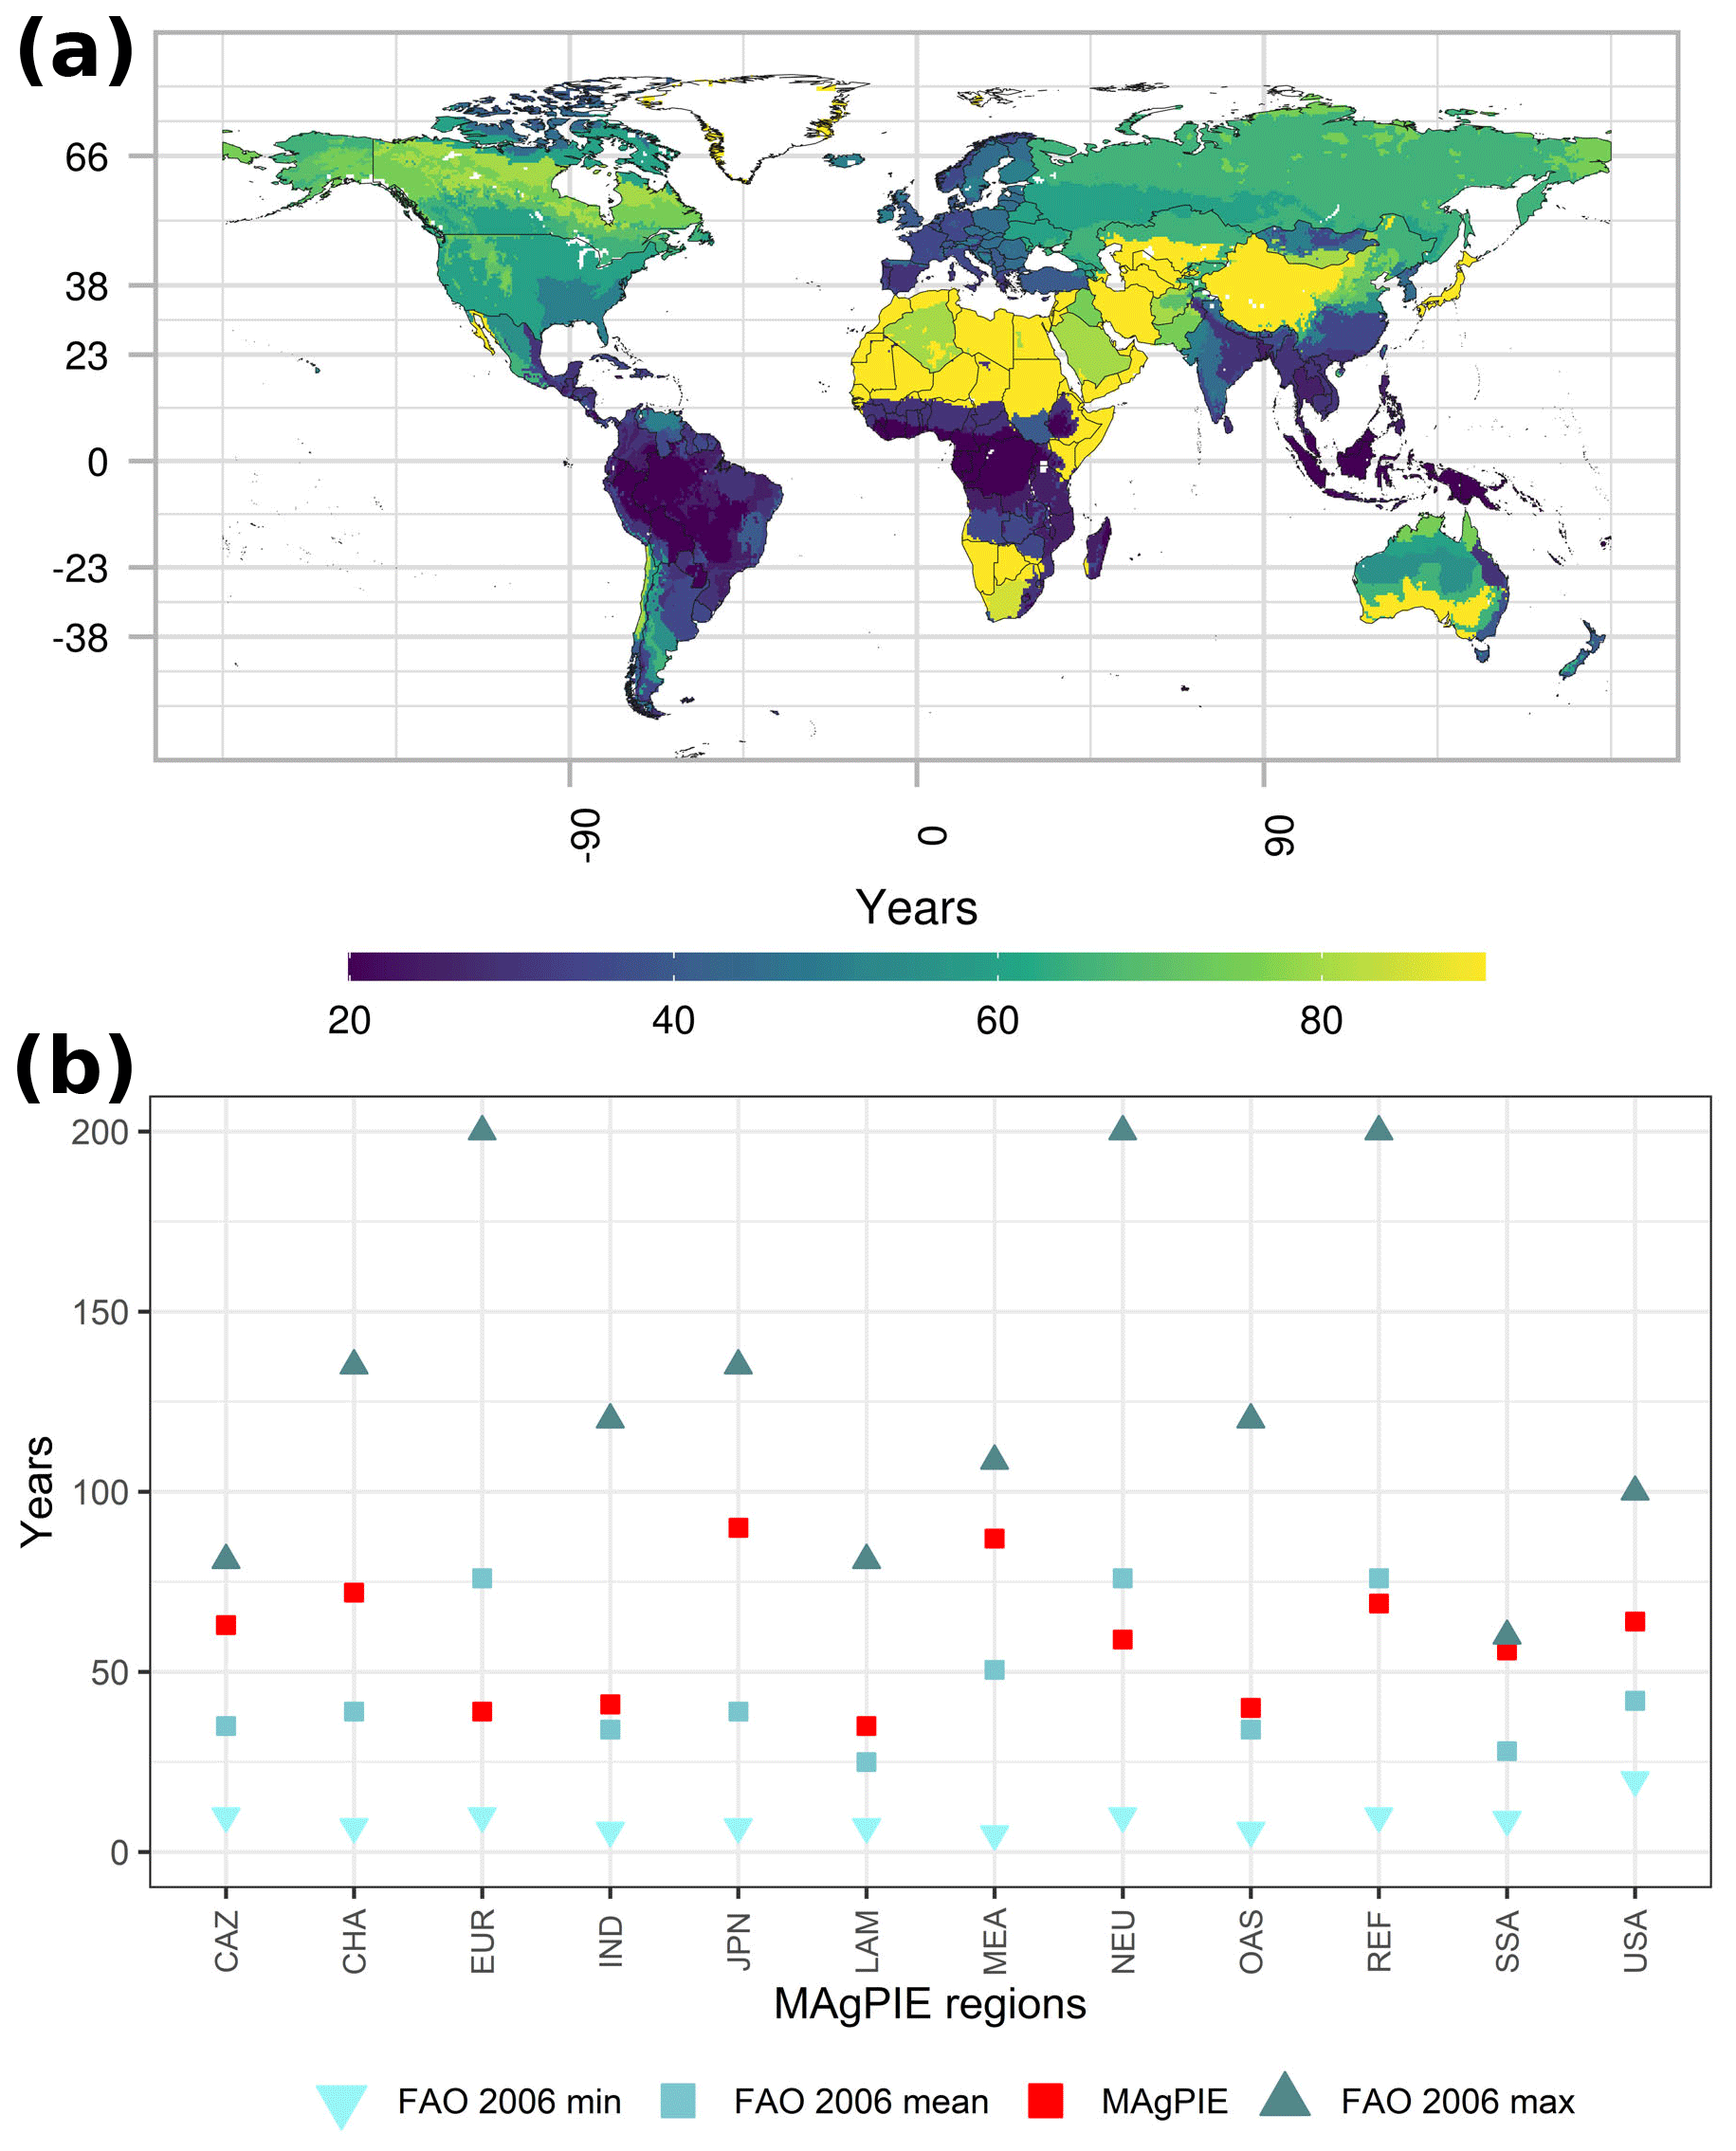
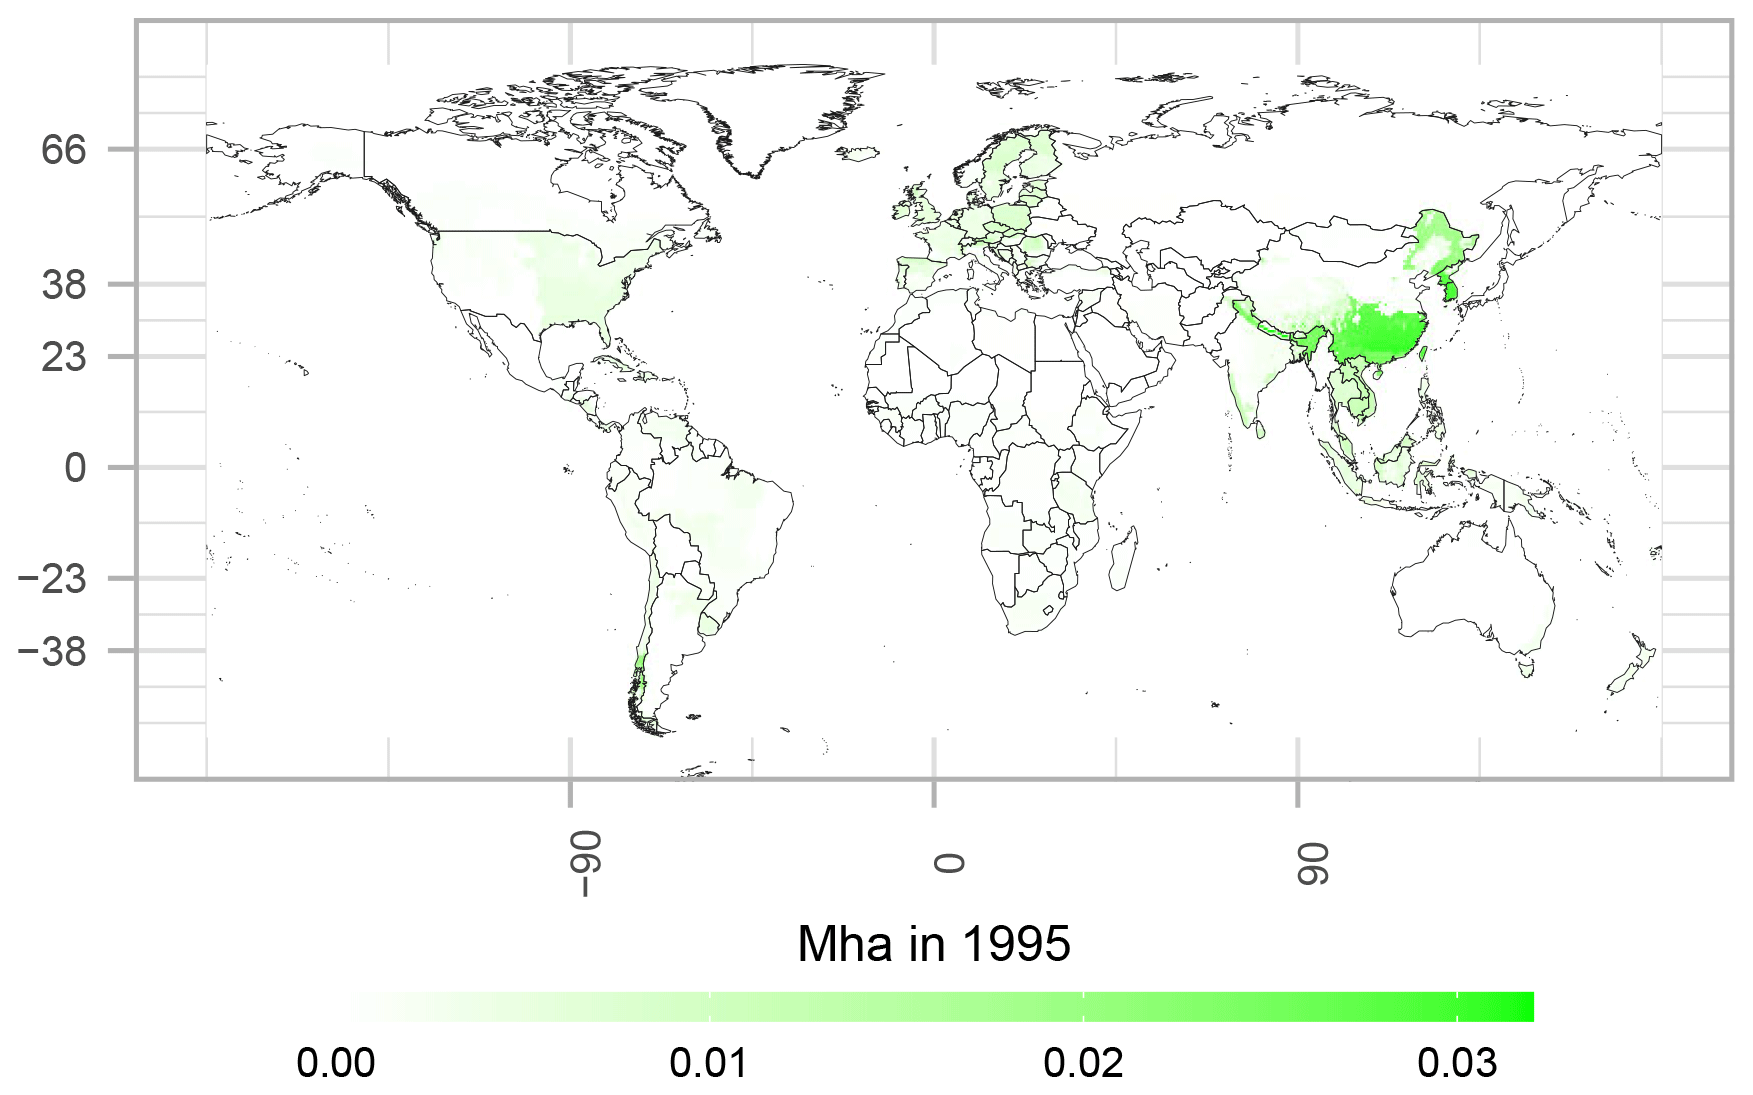
Figure 5Initialization of the plantation area in 1995 in the forestry scenario using the rotation length for the age-class distribution (in Mha).
2.4 Forest initialization
In MAgPIE, forestry rotation lengths determine what the initial distribution of the planted forest area should look like in 1995. The country-level planted forest area from FAO (2015) is downscaled to a 0.5∘ grid using the area-weighted mean of wood removals (Hurtt et al., 2020) and then upscaled to the MAgPIE cluster level (Dietrich et al., 2019) for initialization of the 1995 values. The distribution of this area among different age classes, i.e., the age-class structure of plantations during initialization, is driven by rotation lengths. The aggregated cluster-level planted forest area is first distributed between plantations and other plantation areas based on the historical share of such a distinction based on FAO (2020b). The cluster-level plantation area is then divided among age classes such that there is a higher weight provided to younger age classes, reflecting the notion that plantation area establishment has increased over the last decades. Figure 5 shows the initialization of the MAgPIE plantation area in each cell in 1995.
Natural vegetation in MAgPIE consists of primary forest (untouched pristine forest with no signs of human intervention), secondary forests (forests with some indication of human intervention and management) and other land (degraded forests or uncultivated land with a lower vegetation carbon density than normal forests). The initial spatial distribution of the natural vegetation in MAgPIE is based on the Land-Use Harmonization (LUH) data set (Hurtt et al., 2020) and is adjusted for harmonization with Forest Resources Assessment Report (FRA) data (MacDicken, 2015) with reallocation of natural vegetation area. The area allocated to primary forests is assumed to exist in the highest age class in 1995. The area allocated to secondary forests is assumed to follow the distribution of forests in different age classes based on Poulter et al. (2019). After the initialization of forest areas, the development of forest cover is modeled endogenously in the model and driven by roundwood demand, timber harvest costs, expected yields, carbon prices, demand for agricultural land, land-use change costs and land-use change constraints.
2.5 Timber demand
Demand for end-use wood products in MAgPIE is driven by changes in per capita income and population for the Shared Socioeconomic Pathway 2 (SSP2) story line. Here, we take assumptions from the SSP2 story line to derive the timber demand. We use a simple demand function specification from Lauri et al. (2019), initialized with historical demand volumes from FAOSTAT (FAO, 2017) and shifted over time using changes in GDP and population as shown in Eq. (2). The demand estimates for roundwood, industrial roundwood, wood fuel, other industrial roundwood, pulpwood, sawlogs and veneer logs, fiberboard, particleboard and oriented strand board (OSB), wood pulp, sawn wood, plywood, veneer sheets, wood-based panels and other sawn wood are made independently in the model.
Here, t is the simulation time step (i.e., time), wp represents different demand categories for wood products, Q is the annual timber demand (in Mm3), N is the population, I is income in USD per capita per year (in purchase power parity, PPP, base 2005) and E is the income elasticity of wood products based on Morland et al. (2018). End-use wood product demand calculated from Eq. (2) is aggregated and used as a demand for two wood products: industrial roundwood and wood fuel. Industrial roundwood demand is calculated as the sum of fiberboard, particleboard and OSB, plywood, veneer sheets, wood pulp, sawn wood, other sawn wood and other industrial roundwood. The processing of wood products is not explicitly modeled in MAgPIE. By-products of end-use production activities and the recycling of roundwood is also not accounted for in MAgPIE. Wood fuel is assumed to come from two different sources: direct harvest and logging residues from harvesting for industrial roundwood.
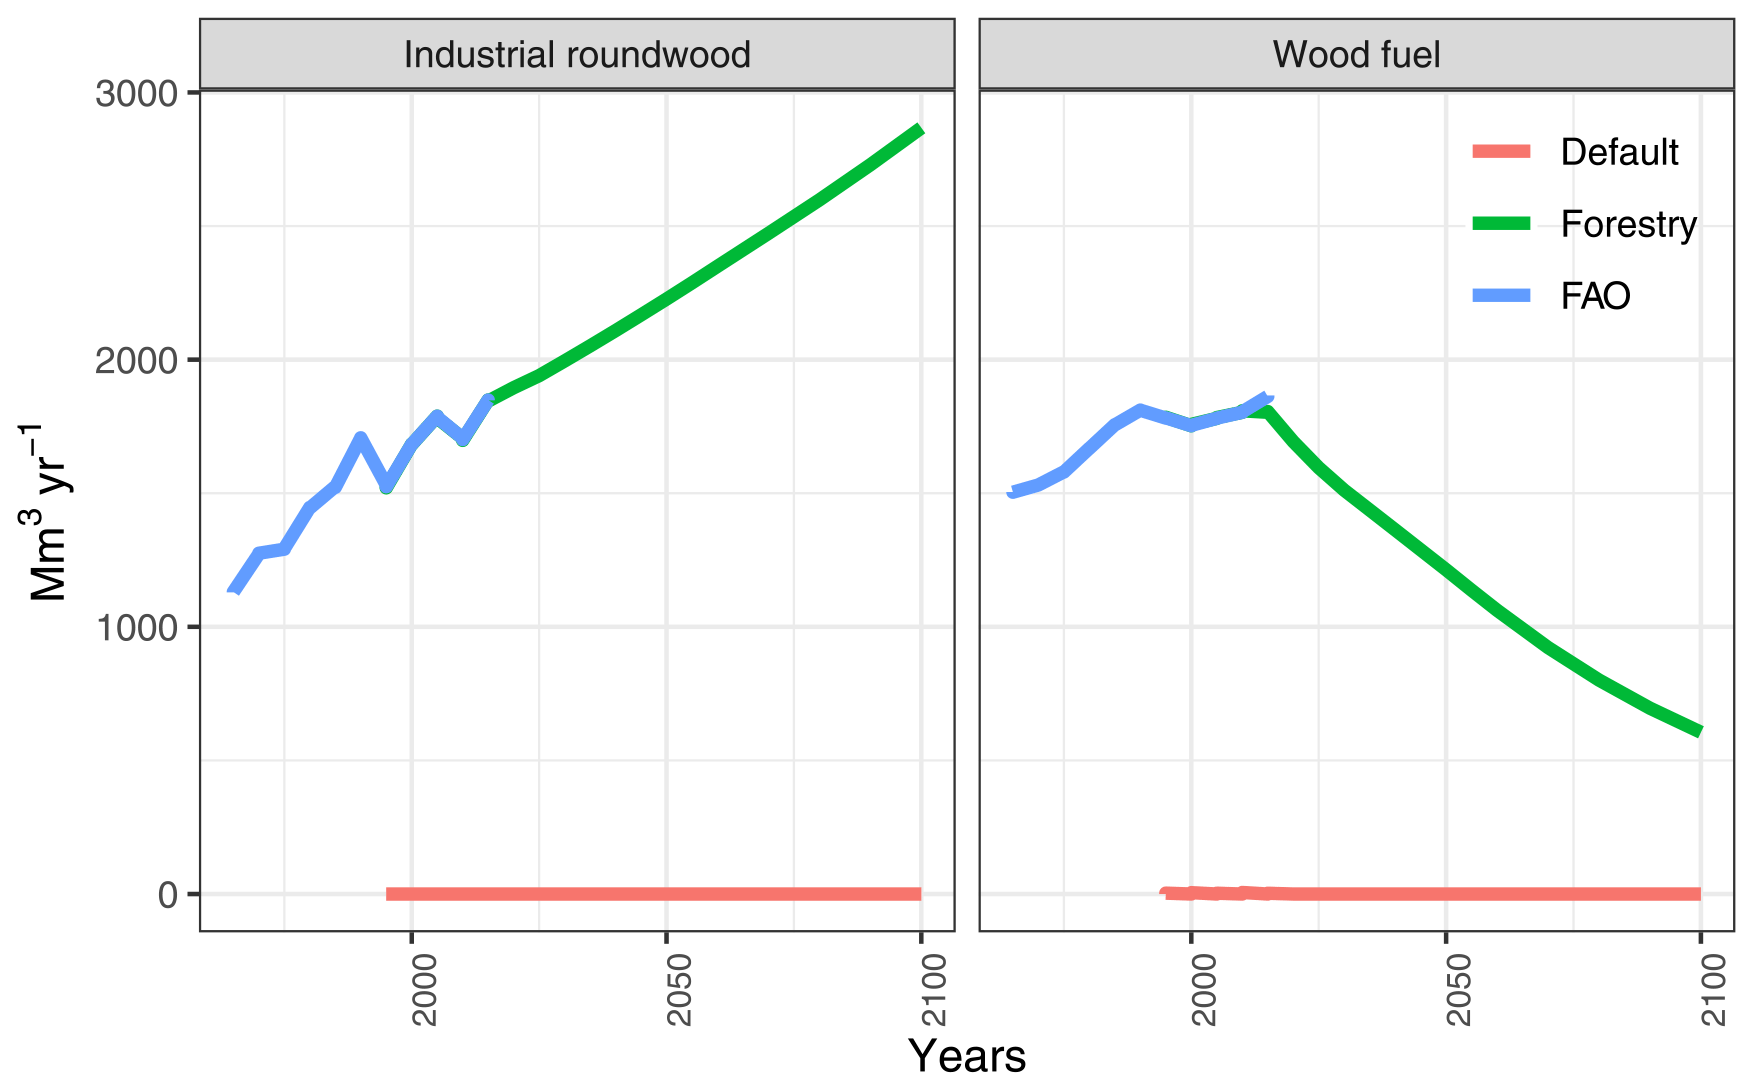
Global industrial roundwood and wood fuel demand modeled in MAgPIE is shown in Fig. 6 along with validation from historical data reported by FAO (regional numbers in Fig. A4). Wood fuel enters demand calculations with a negative income elasticity based on Morland et al. (2018) to be consistent with the decreasing residential sector biomass use for energy in an SSP2 world (Lauri et al., 2019; IIASA, 2018). We use the logging residue data from Oswalt et al. (2019) which indicate that 30 % of industrial roundwood harvest is residue. Assuming 50 % of this is recovered from forests (Pokharel et al., 2017, report a range of 30 %–70 % from available literature), we use a maximum of 15 % of biomass removed during industrial roundwood production as wood residues which can contribute towards fulfilling wood fuel demand.
We assume that the residues are collected from the overall production system, i.e., we do not explicitly differentiate between residues from the harvest of plantations or natural forests. We do not model the decay in productivity after residue removal, as fertilization would be applied to some plantations to maintain productivity. The residue generation constraint in MAgPIE is an upper bound for the model which provides flexibility with respect to deciding (based on the cost of production) if the residue should be removed (or not) from the part of production which comes from plantations.
2.6 Forest biomass
Biomass which can potentially be removed from natural forests is calculated based on the average long-term vegetation carbon densities in natural vegetation from LPJmL. The growth of natural vegetation in MAgPIE follows an S-shaped growth curve, as described in Humpenöder et al. (2014), but with updated growth curve parameters based on Braakhekke et al. (2019). Timber plantations, on the other hand, are considered more productive (for a younger stand age per unit area) compared with primary forests and secondary forests (FAO, 2006). To reflect this, we use a different parametrization of the timber plantation growth function compared with natural forests based on Braakhekke et al. (2019). Harvestable biomass from forests is calculated as shown in Eq. (3) based on Ravindranath and Ostwald (2007) and Standard (2013):
where t is the simulation step (i.e., time), j is the MAgPIE simulation cluster, ft is the forest type (i.e., plantation or natural vegetation), ac is the forest age class, clcl is the Köppen–Geiger climate class, y is the age class (ac) and forest-type-specific biomass yield (in t DM ha−1), C is the forest-type-specific carbon density (in t C ha−1), r is the shoot-to-root ratio, cf is the carbon fraction in dry matter (IPCC, 2019), kg is the Köppen–Geiger climate classification (Rubel and Kottek, 2010) and b is the biomass expansion factor (FAO, 2013). Forest classification in MAgPIE is represented in Fig. 7, and a detailed description of forest land dynamics is given in Dietrich et al. (2020a). Harvestable biomass yield (y) is different between natural forests (primary and secondary forests) and plantations by virtue of differences in the parametrization of underlying growth function(s). Primary forests are assumed to exist in the highest age class and are, therefore, assigned old-growth forest yields. Both secondary forest and plantation yields are age-class-specific but differ with respect to growth dynamics.

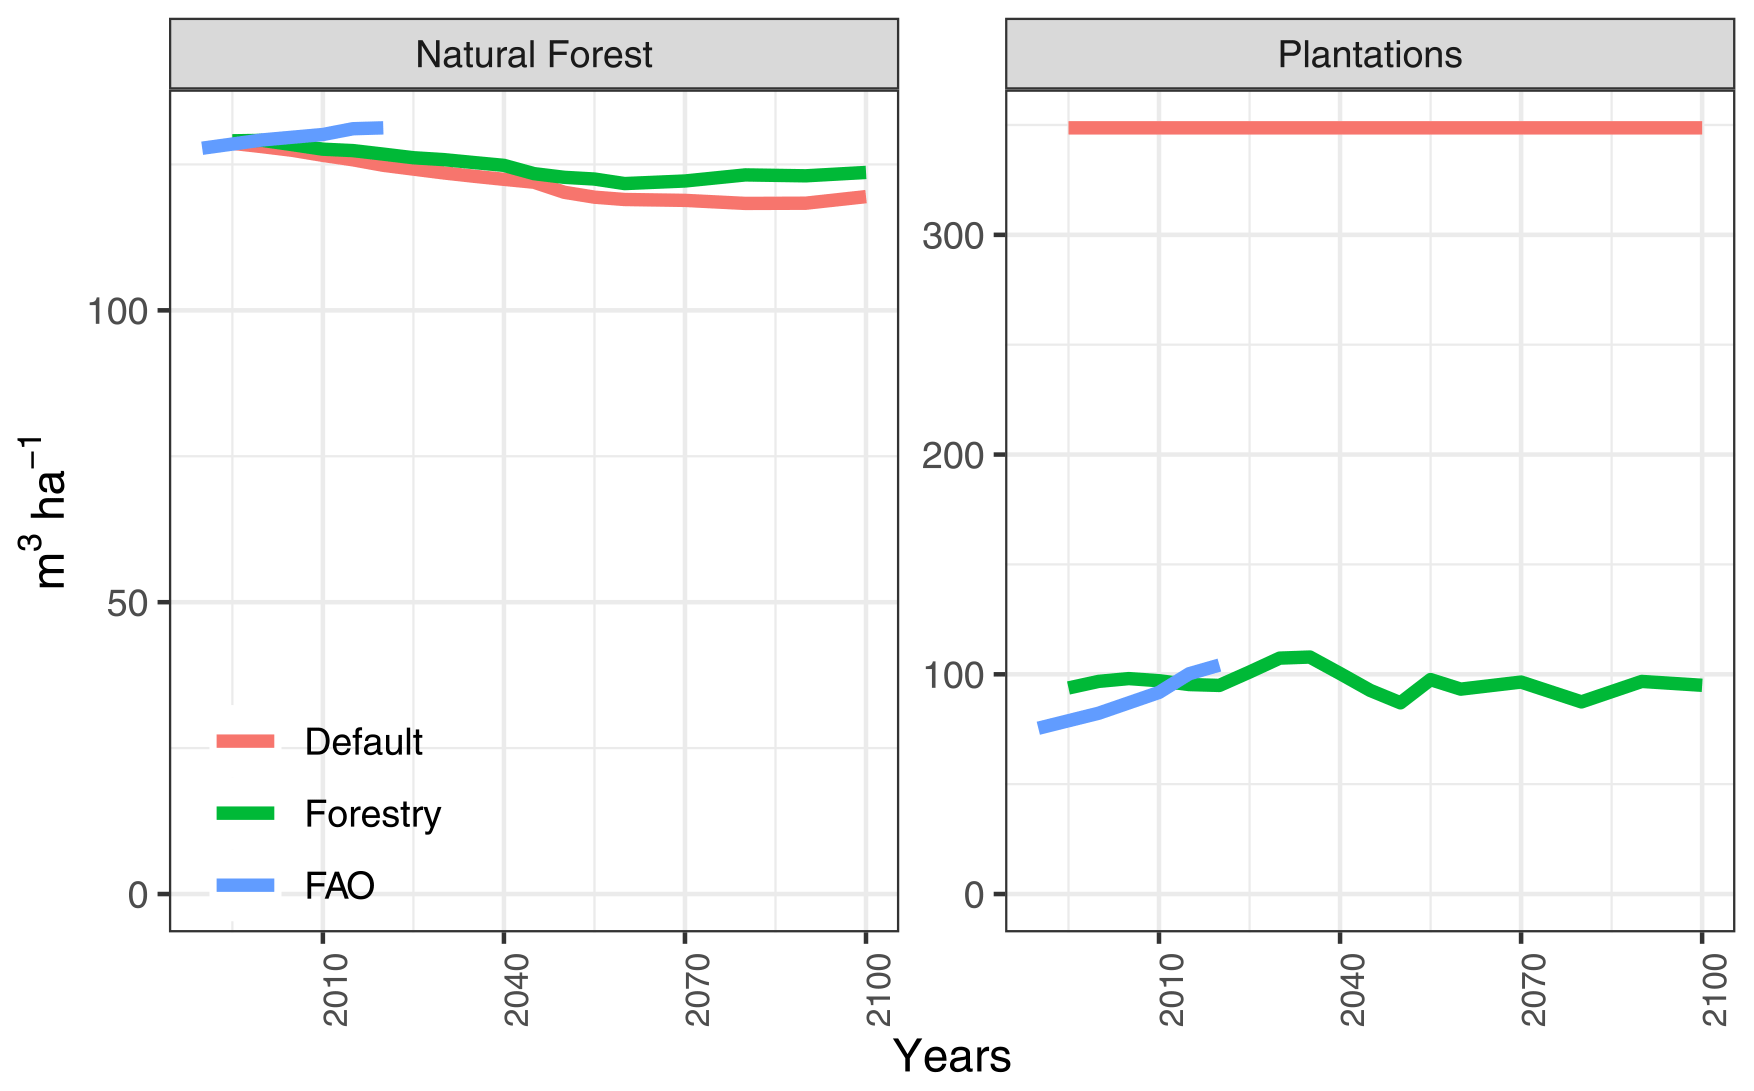
The carbon density in plantations and natural forests is calibrated using a scaling factor to match the historically reported forest growing stock at a regional level (FAO, 2020a). This scaling factor is calculated as the ratio between observed growing stocks (both in plantations and natural forests) reported by FAO (2020a) and initialized growing stocks in MAgPIE before optimization. Calibrated growing stock in natural forests and plantations at the global level is shown in Fig. 8 (regional numbers shown in Fig. A8).
2.7 Timber production
2.7.1 Plantation establishment
The amount of newly established timber plantations depends on current roundwood demand, the assumed future share of production coming from plantations and expected future yields. Expected future yields from plantations are calculated based on the rotation lengths. As shown in Eq. (4), we define a regional constraint while establishing new timber plantations:
where “plant” is the plantation land, j is the MAgPIE simulation cluster, ac′ is the age classes to be established (usually the youngest age class, ac0), Qi,rw is the regional annual demand for roundwood (rw; i.e., industrial roundwood and wood fuel in region i as shown in Fig. 6), σi,rw is the regional self-sufficiency ratio of roundwood (industrial roundwood and wood fuel) production (Table A3) and ηi is the share of production which can come from plantations based on extrapolations from Pöyry (1999). For the extrapolation of these shares, we assume (starting from the last historically available data in 2000) a 1 % increase per annum till 2020, a 0.4 % increase per annum between 2020 and 2050, and a 0.2 % increase from 2050 to 2100 (Table A4). ESi is a calibration factor to nudge the model towards historical plantation area patterns (Table A5) via the establishment of new plantations.
For example, assuming industrial roundwood demand of 100 Mm3 in 2020 in region i with a self-sufficiency ratio of 0.8 and ηi of 0.5, the model will need to establish plantations such that 100 × 0.8 × 0.5 = 40 Mm3 of timber can be produced from this region in the future. The model then tries to establish new plantations in the simulation step depending on expected yields. Assuming this region has two clusters, both with an expected yield of 5 m3 ha−1, there will be 4 Mha () of plantations established in each cluster, i.e, 8 Mha of total new plantations in this region.
2.7.2 Timber harvesting
Timber plantations are harvested once they reach maturity at the specified optimal rotation lengths. After every time step, forest age classes are shifted forward. Plantations are protected from harvest during the whole duration of time below their specified rotation length. There is no such restriction on the harvest of natural vegetation based on age and maturity, as natural forests are not bounded by rotational constraints. Forests in MAgPIE are harvested based on harvesting costs and associated trade-offs. MAgPIE's objective function is to minimize global production costs, and using a lower harvesting cost (per ha) for plantations than in natural forests implicitly provides a signal to the model to harvest forests with higher growing stock first.
Roundwood (industrial roundwood and wood fuel) can be produced from both natural forests (primary and secondary forests) and from managed plantations (forestry), which we distinguish according to Fig. 7. Additionally, wood fuel can also be harvested from other land, which is defined as non-managed land that has an insufficient carbon stock (< 20 t C ha−1) to be classified as forest. Timber production from forests is calculated based on the area harvested and the harvestable yields (Eq. 3).
2.8 Land-use change emissions
Net CO2 flux from land use, land-use change and forestry (LULUCF) includes CO2 fluxes from forest harvest (for roundwood production), deforestation (clearing forest for alternative land use), afforestation, shifting cultivation (deforestation followed by abandoning), and regrowth of forests following wood harvest or abandonment. Some of these activities lead to emissions of CO2 to the atmosphere (e.g., burning wood fuel after harvest and conversion of forests to agricultural land), whereas others lead to CO2 sinks (e.g., afforestation, regrowth and long-term carbon stored in harvested wood products).
Land, in particular biomass production from vegetation, affects both the source and sinks of CO2. When reporting LULUCF emissions, the long-term carbon stored in wood products is usually either not reported or not accounted for in models that simulate forest land use (Stehfest et al., 2019; Havlík et al., 2011; Braakhekke et al., 2019; Doelman et al., 2018, 2020; Humpenöder et al., 2018). As management of forests and different uses of harvested wood play a crucial role in the regulation of the concentration of atmospheric CO2, it is important to account for this pool when reporting LULUCF emissions (IPCC, 2019; Johnston and Radeloff, 2019; Böttcher and Reise, 2020; Zhang et al., 2020).
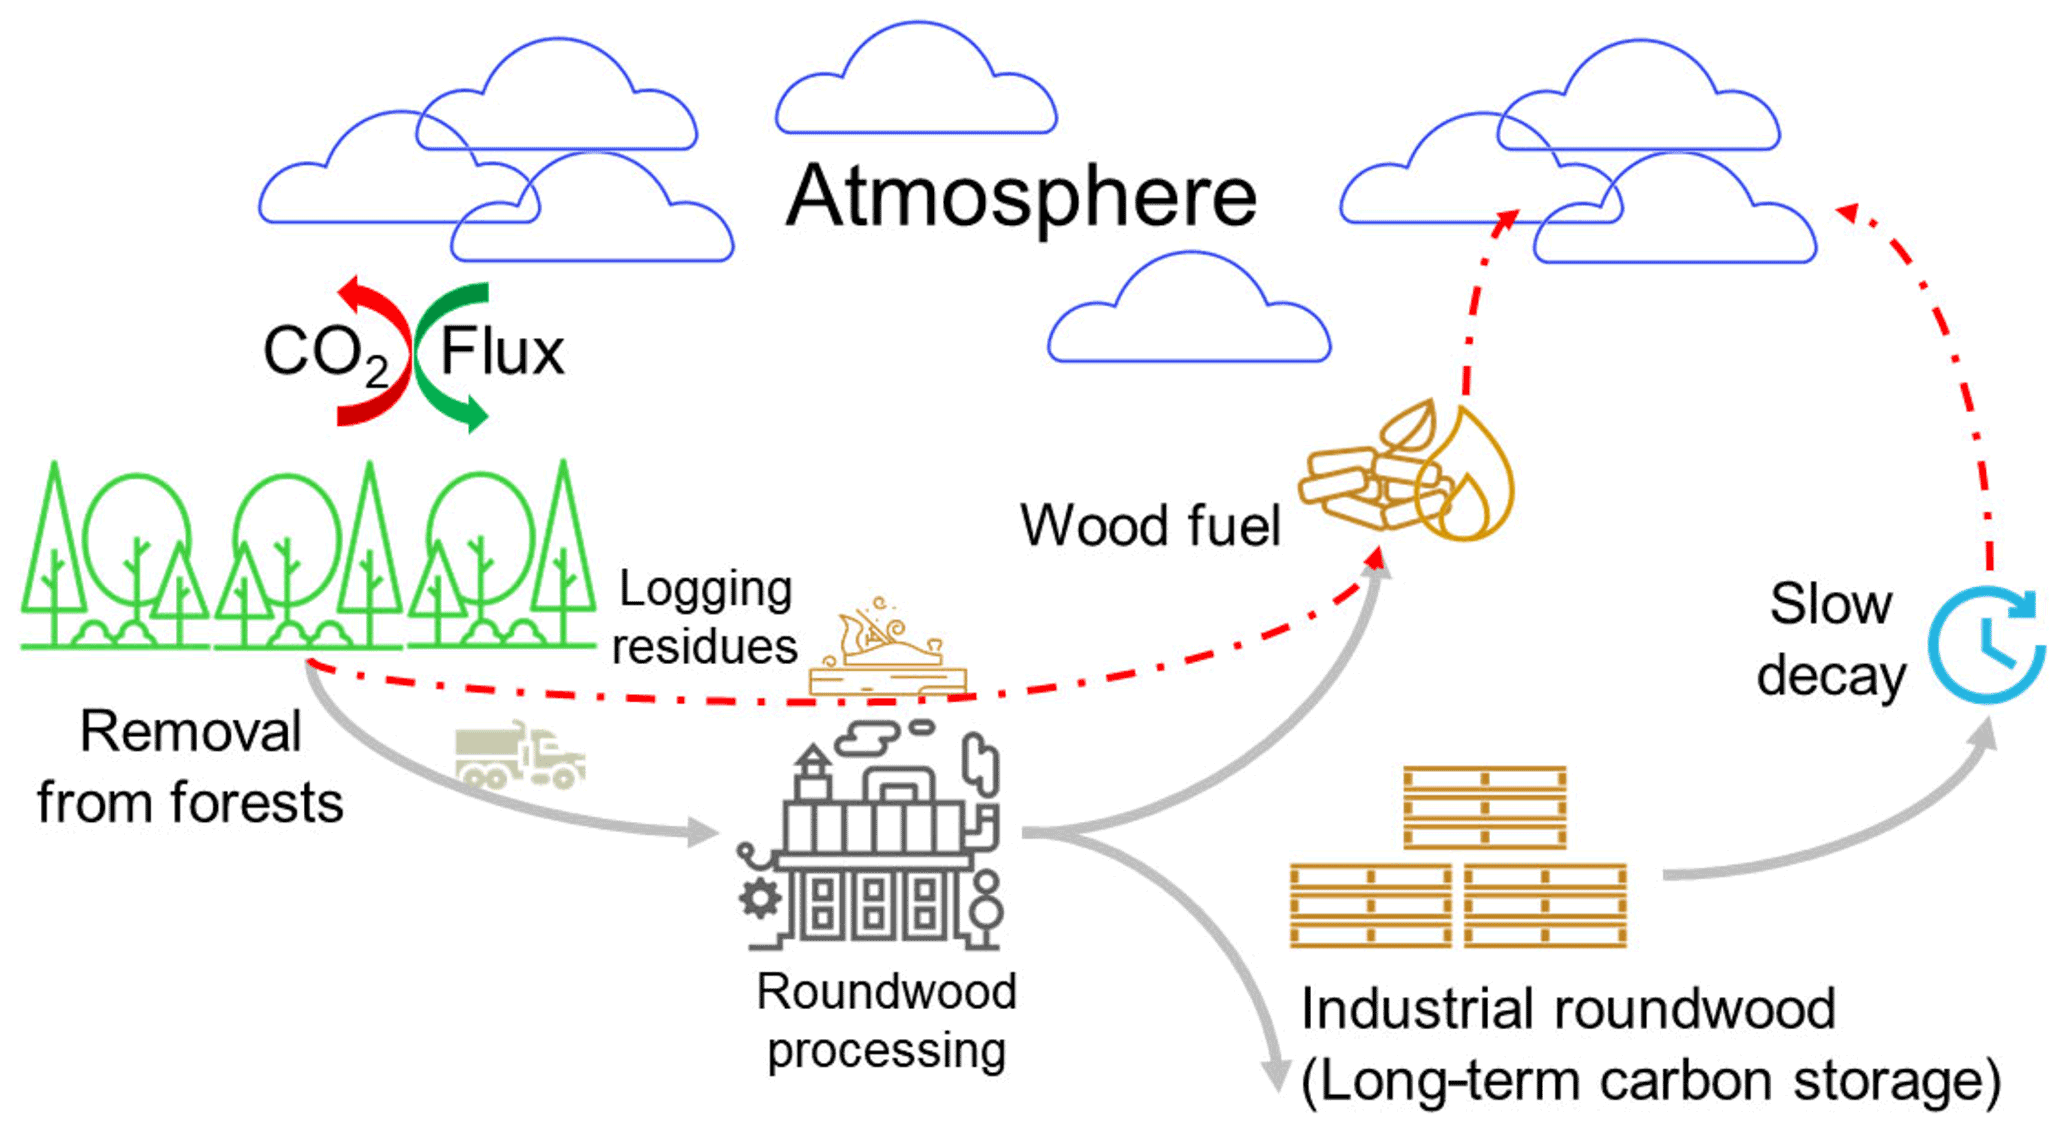
Figure 9Concept for accounting for carbon emission and storage dynamics from forests and harvested roundwood. Wood fuel is assumed to be emitted within the optimization step in which it is harvested. Industrial roundwood enters a long-term storage pool, from which slow turnover happens and is tracked via the IPCC (2019) methodology described in Eqs. (5a)–(5c).
In MAgPIE, we account for gross land-use change emissions (i.e., land-use change emissions not including regrowth), emissions due to shifting agriculture (as part of gross land-use change emissions) based on historically observed deforestation driver rates from Curtis et al. (2018), regrowth in forests and on other land, and long-term carbon storage in wood products while also calculating the slow release of CO2 back into the atmosphere from these wood products due to decay (Fig. 9). Carbon stored in harvested wood products (HWPs) can affect national greenhouse gas (GHG) inventories, in which the production and end-use of HWPs play a key role (Johnston and Radeloff, 2019). We account for this long-term carbon storage in wood according to the guidance provided by the Intergovernmental Panel on Climate Change (IPCC) as defined in Eqs. (5a)–(5c) (IPCC, 2019):
where C is the carbon stock in industrial roundwood at the beginning of year t (in Mt C), k is the decay constant of first-order decomposition for industrial roundwood (yr−1) and takes a value of ln (2) half-life−1 of industrial roundwood (half-life is assumed to be 35 years here based on IPCC, 2019), “inflow” is the inflow to the non-decayed industrial roundwood pool during year t (Mt C yr−1), ΔC is the carbon stock change in the industrial roundwood pool during year t (Mt C yr−1), S is the domestically produced industrial roundwood in each region and f is the share of domestic stock for the production of a particular HWP. f values are taken from Johnston and Radeloff (2019). As carbon stored in HWPs is a function of timber demand, it is directly influenced by developments in socioeconomic factors including population, income and trade, akin to timber demand in MAgPIE. The calculation of the long-term carbon storage in harvested wood products is documented in Bodirsky et al. (2021).
Table 2Modeled land-use change between 1995 and 2100 (in Mha).
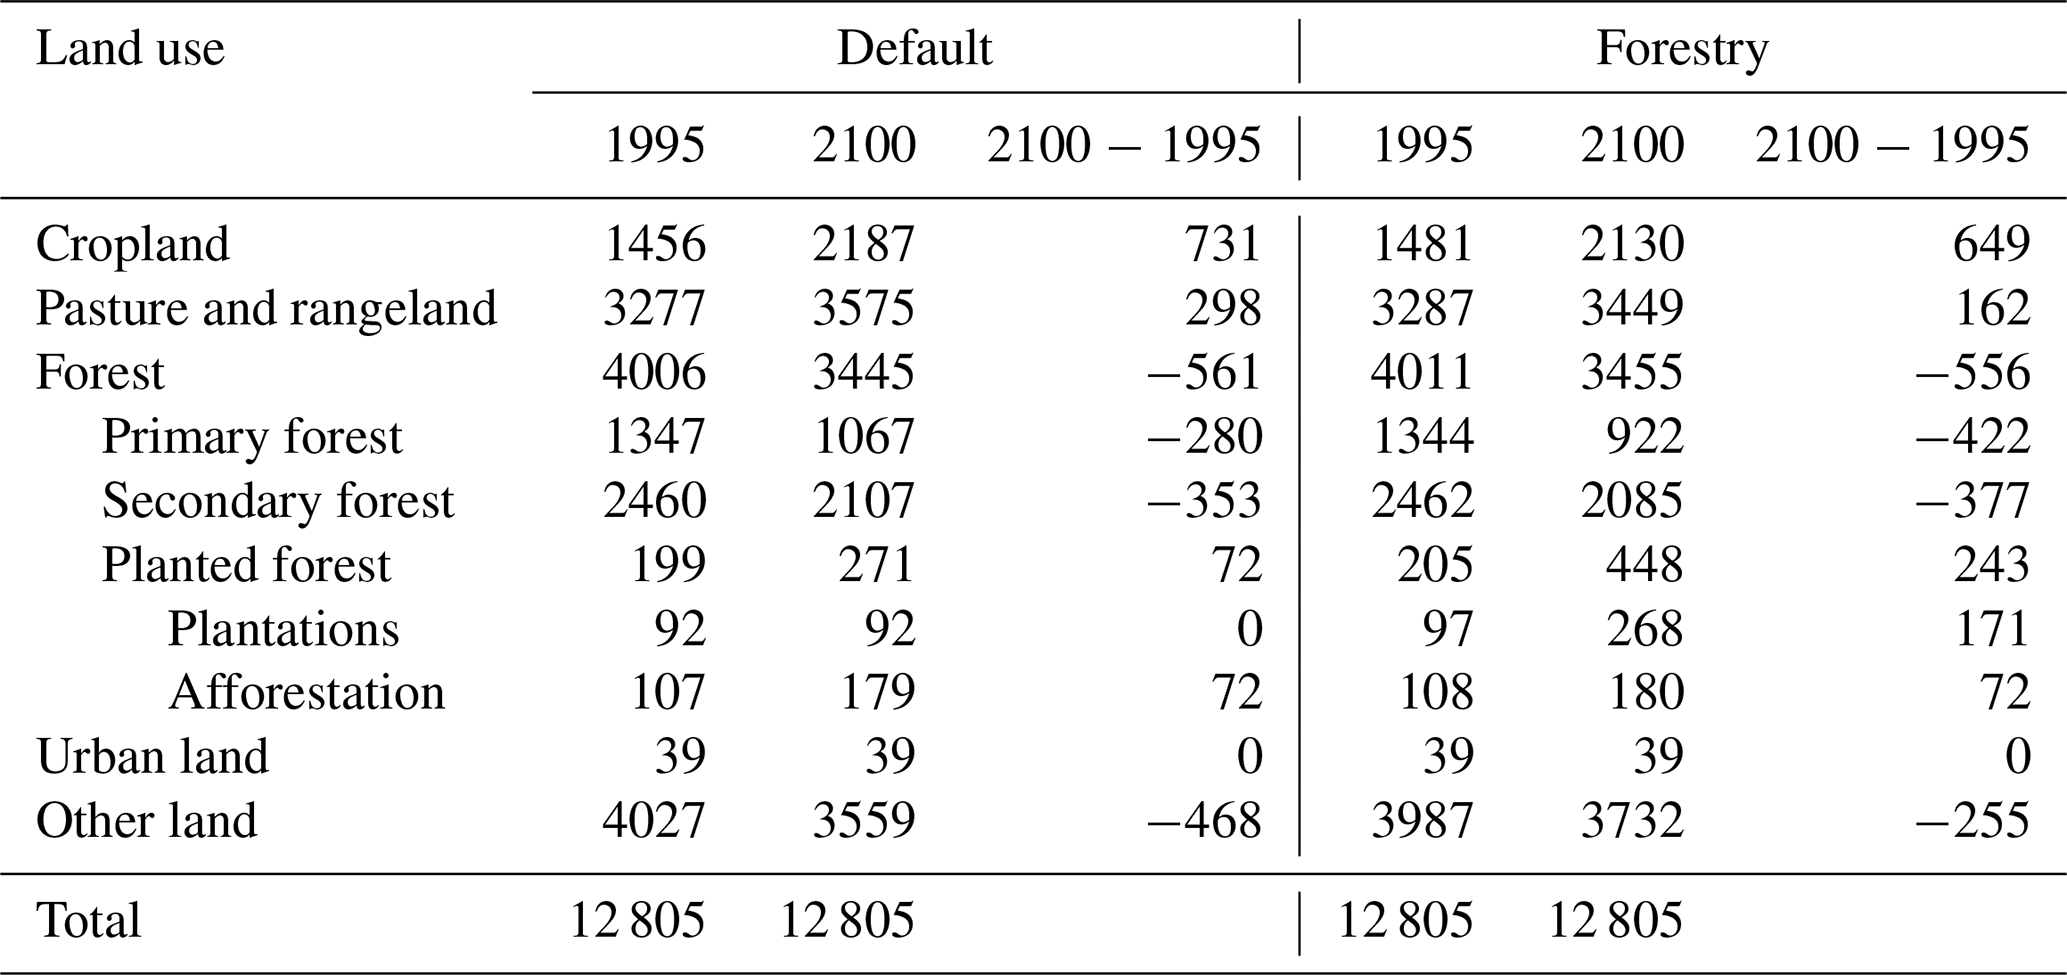

3.1 Global land-use change
Global land-cover and land-use change dynamics over time in the default scenario and the forestry scenario (both SSP2) are shown in Table 2 (rounded to nearest zero) and Fig. 10.
In MAgPIE, once natural forests are harvested, the area can be converted to either agricultural land or timber plantations if such expansions are necessary. In the default scenario, we observe that agricultural land (cropland and pasture land) increases by 731 Mha in 1995–2100, mainly at the expense of forests. A smaller increase is seen in the forestry scenario where agricultural land increases by 649 Mha at the expense of forests and other land, indicating that more cropland intensification takes place when timber production is included. Timber plantation area increases by 171 Mha in the forestry scenario to satisfy a considerable portion of industrial roundwood and wood fuel demand from plantations, given the increasing timber demand due to income and population growth. Primary and secondary forest area declines by 422 and 377 Mha, respectively, between 1995 and 2100 due to the expansion of cropland and timber plantations in the forestry scenario. Other land area decreases by 255 Mha between 1995 and 2100 in the forestry scenario (compared with 468 Mha in the default scenario).
To satisfy food and feed demand and to accommodate the land-use competition between cropland and forestry, MAgPIE estimates an agricultural yield shift of 113 % and 116 % in the default and forestry scenarios, respectively, by 2100 relative to 1995 through investments in yield-increasing technological change. Such yield-increasing technological change is realized via agricultural land-use intensity in MAgPIE and is measured using a τ-factor developed by Dietrich et al. (2012). The global and regional land-use intensity indicator τ for the forestry and default scenarios is shown in Fig. A3.
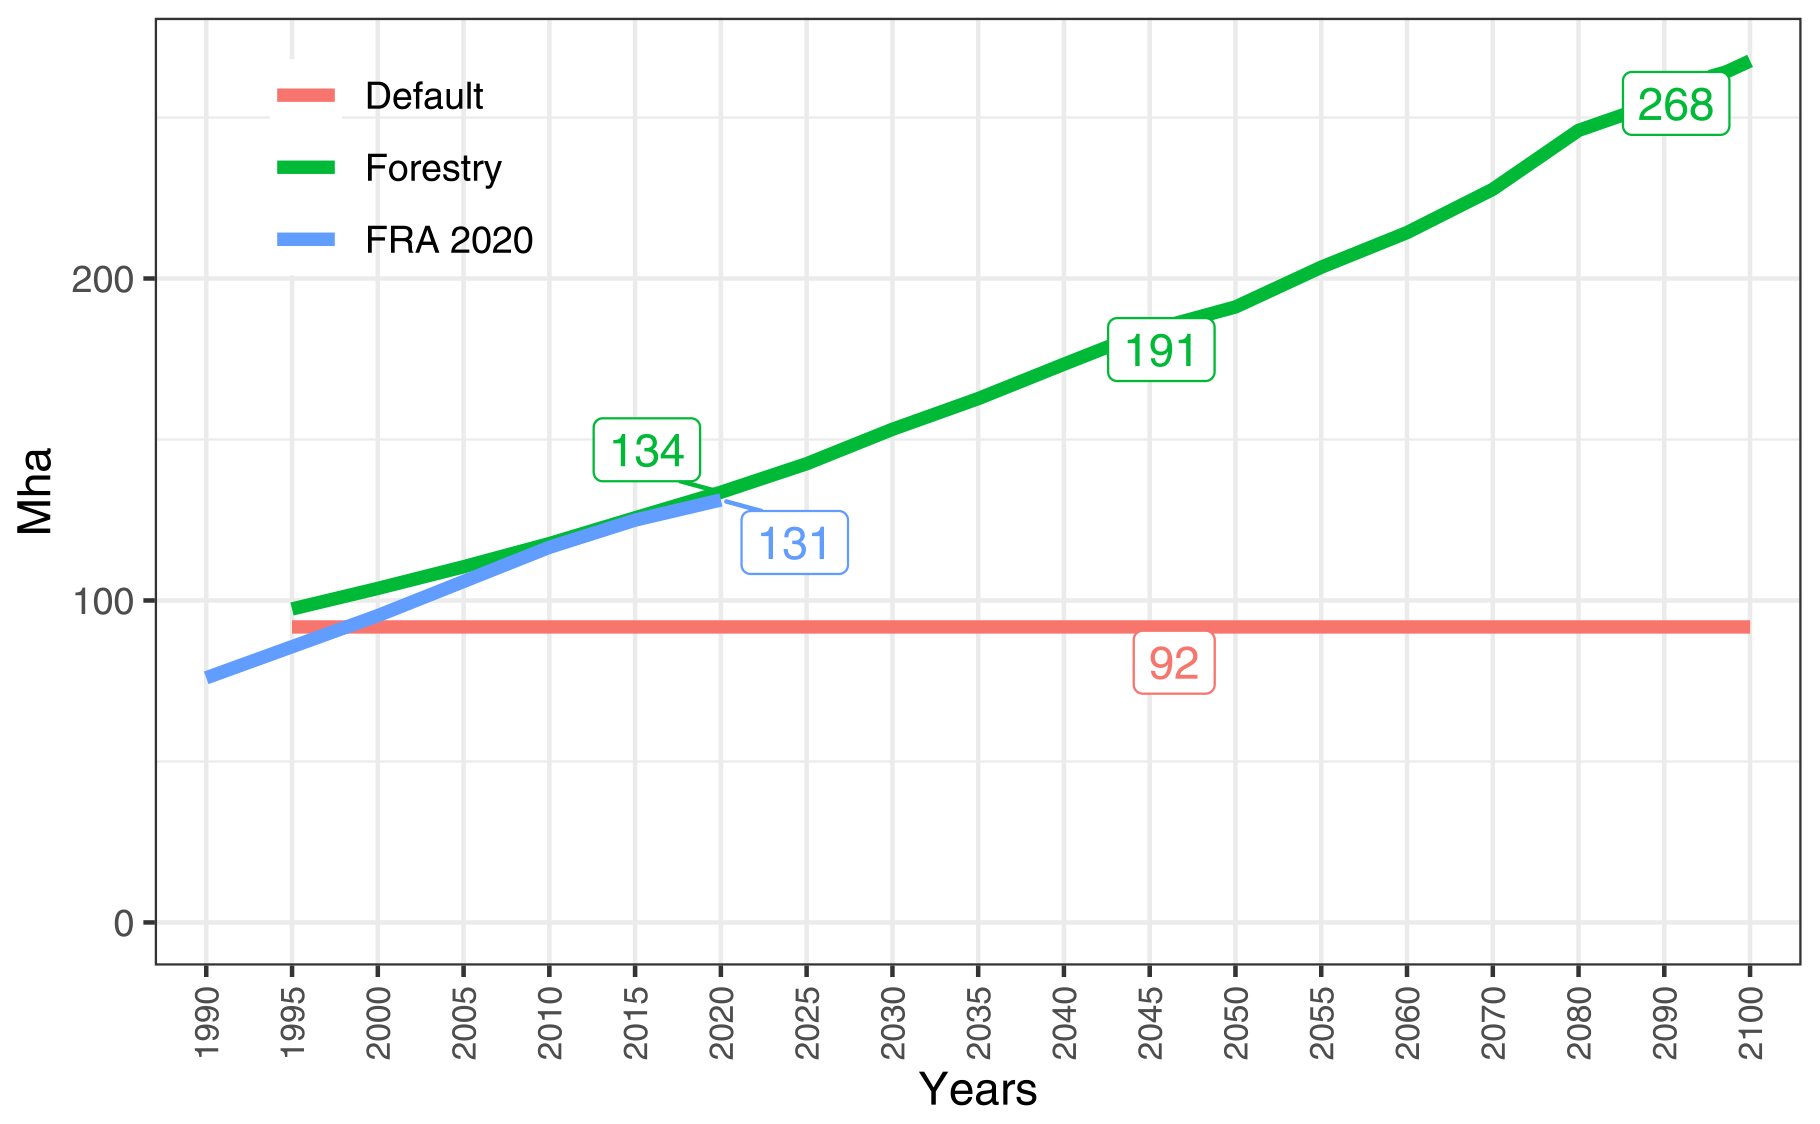
Figure 11Development of plantation area for 1995–2100 at the global level in the default and forestry scenarios. The flat line in the default scenario is due to the assumption of static plantations at 1995 levels. Historical numbers are from the Forest Resources Assessment Report (FRA) 2020 (FAO, 2020b).
Figure 11 shows the historical trends (from the FRA 2020) and future projections (MAgPIE) with respect to the development of plantation area at the global level (regional development in Fig. A1). Until 2020, MAgPIE matches the historical trend very well, while the levels are slightly higher when compared with the observed data.
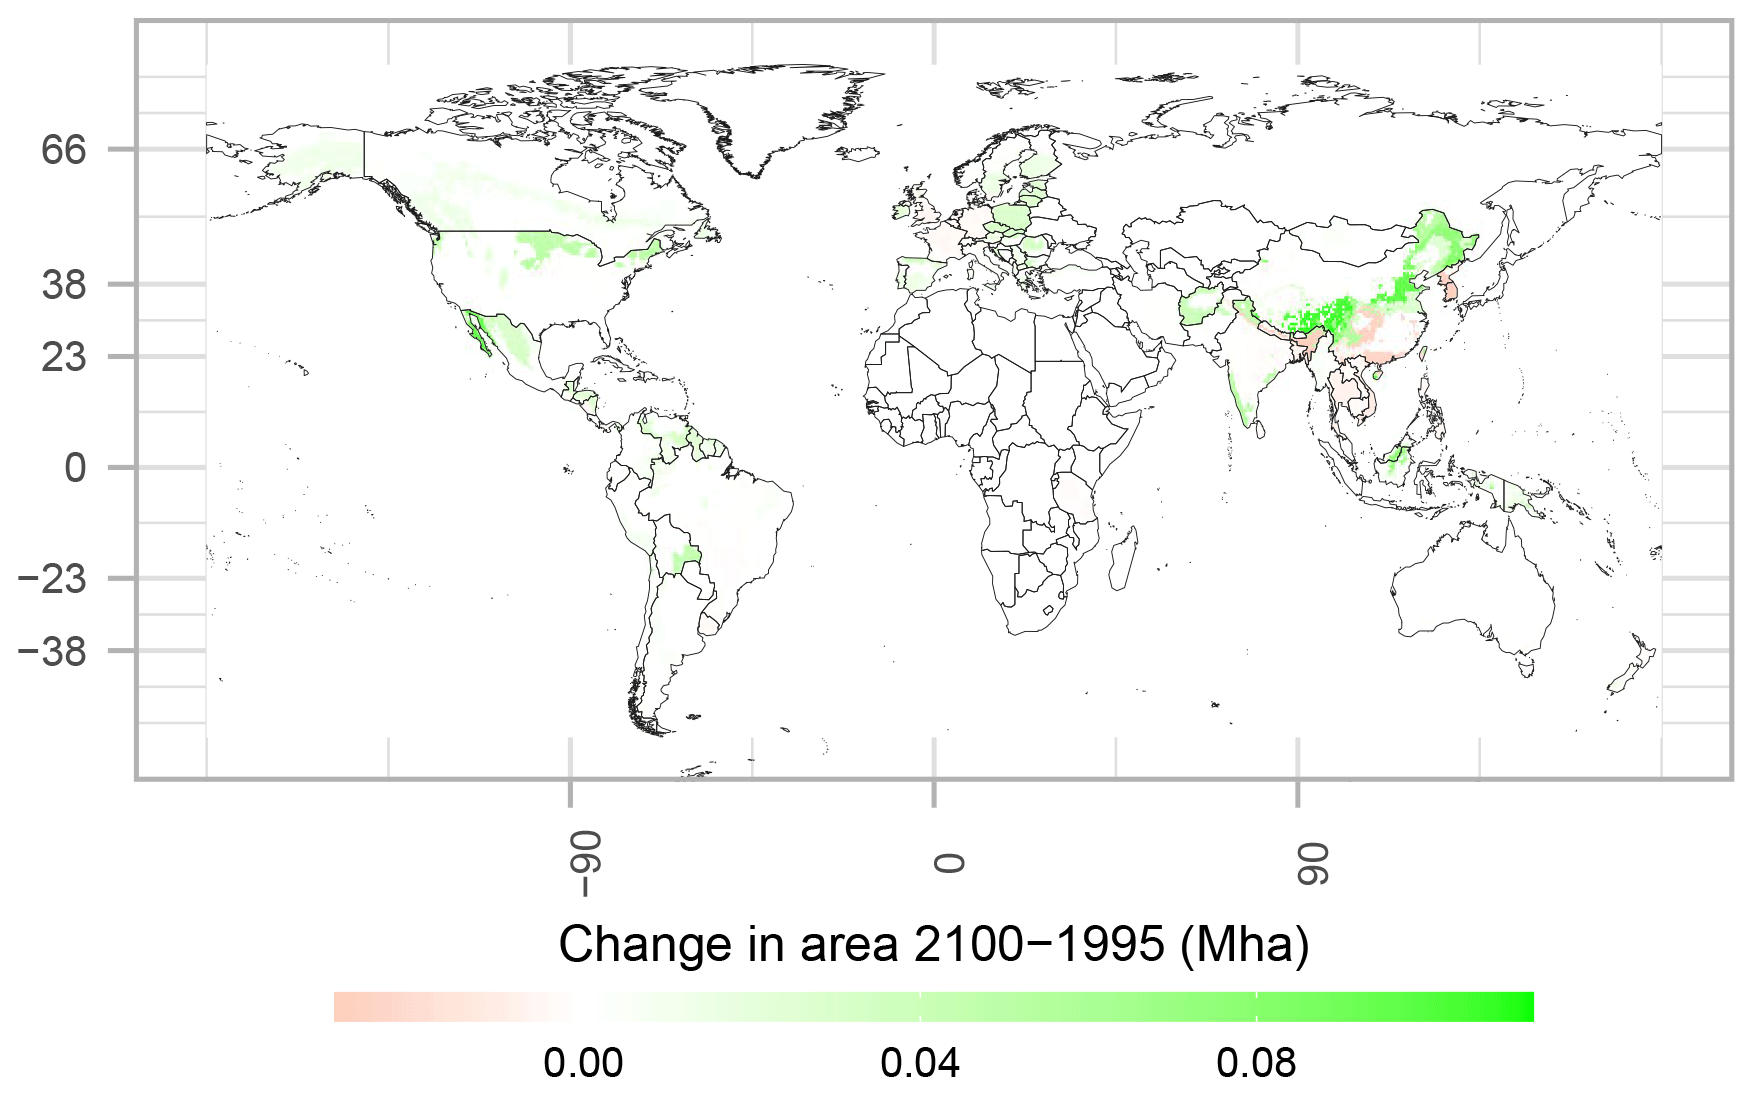
Figure 12Difference in cellular plantation area between 1995 and 2100 for the MAgPIE forestry scenario (in Mha).
The default scenario shows no changes in plantation area over time due to the assumption of static plantations. Figure 12 shows the changes in the timber plantation area for the forestry scenario in 2100 on a 0.5∘ grid. In absolute terms, the highest gains in plantation area are seen in China, which will host about 40 % of the global plantation area in 2100 (105 out of 268 Mha). Changes in natural forest area (primary and secondary forest) in both scenarios, default and forestry, are shown in Fig. A2.
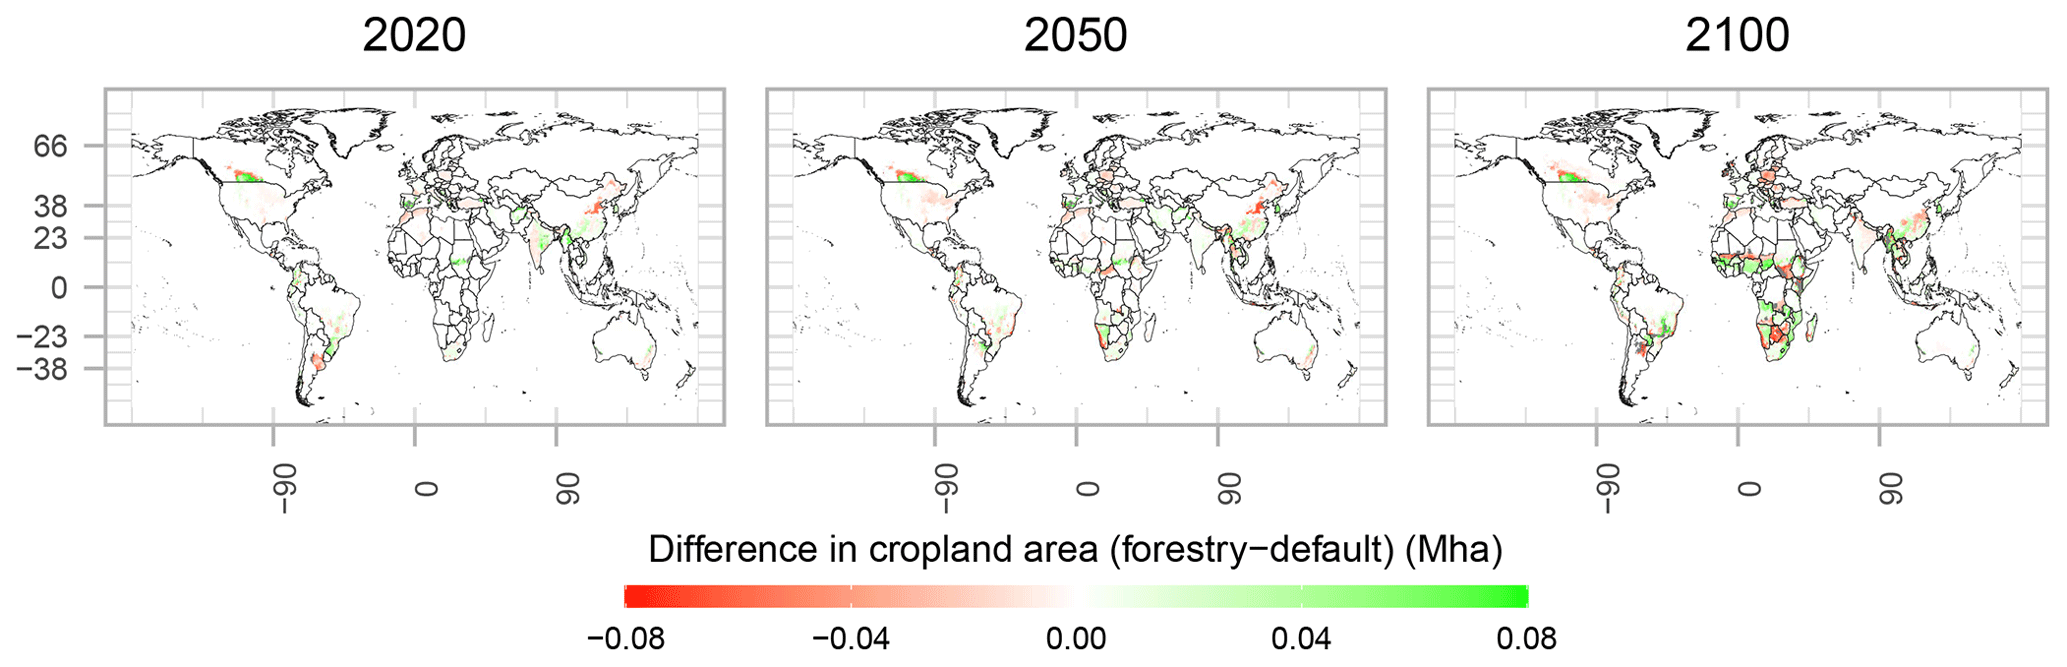
Figure 13Difference in cellular cropland area between the forestry scenario and the default scenario (in Mha) in 2020, 2050 and 2100. Shades of red indicate cropland loss and shades of green indicate cropland increase when timber production is accounted for in MAgPIE.
Table 3Absolute differences in cropland area (in Mha) between the forestry and default scenarios.
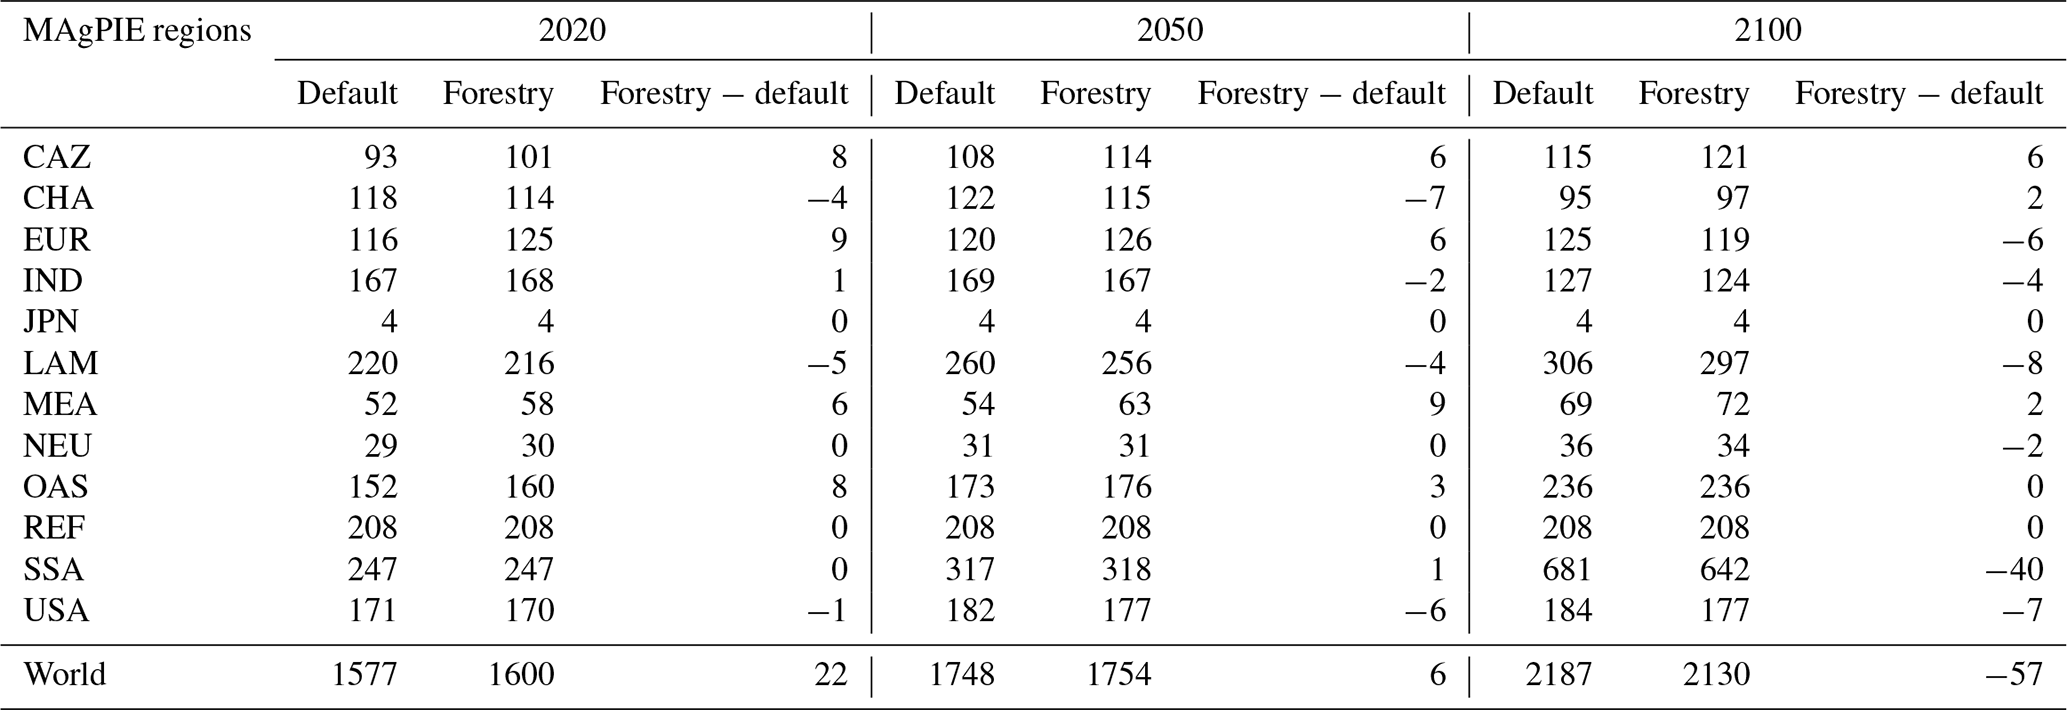
As plantations compete with cropland for limited land resources, it is important to see how the inclusion of roundwood production interacts with cropland usage globally. Figure 13 shows the difference in cellular cropland area between the forestry and default scenarios on a 0.5∘ grid, and Table 3 shows the regional differences for the same.
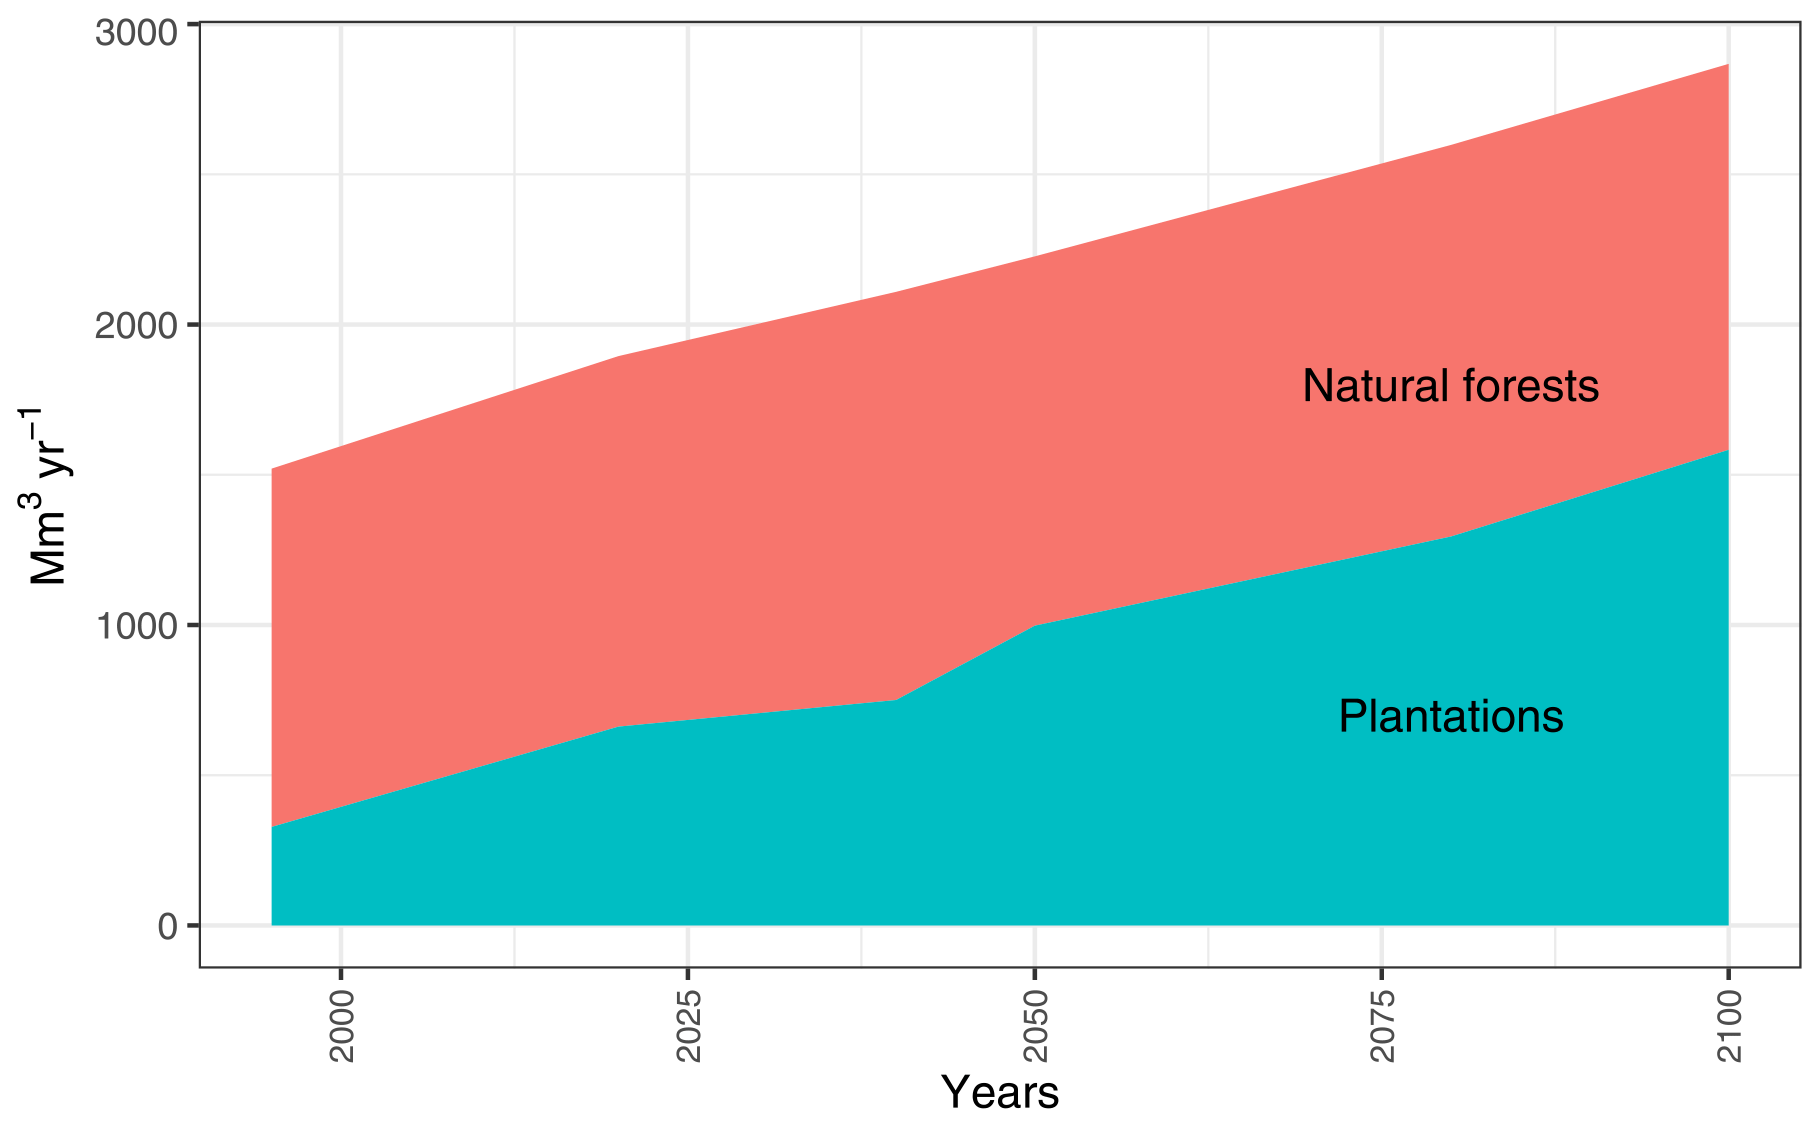
Figure 14Global industrial roundwood production by source for the forestry scenario (1995–2100; in Mm3 yr−1).
3.2 Industrial roundwood production
Figure 14 shows the amount of global industrial roundwood production by production source. In the forestry scenario, we observe plantations providing 328 to 1583 Mm3 yr−1 of the global industrial roundwood production between 1995 and 2100 (contribution to overall share in Fig. A5). As the plantation area increases over time in the forestry scenario, we see an increasing proportion of industrial roundwood and wood fuel demand being fulfilled by harvesting an increasing amount of available plantations.
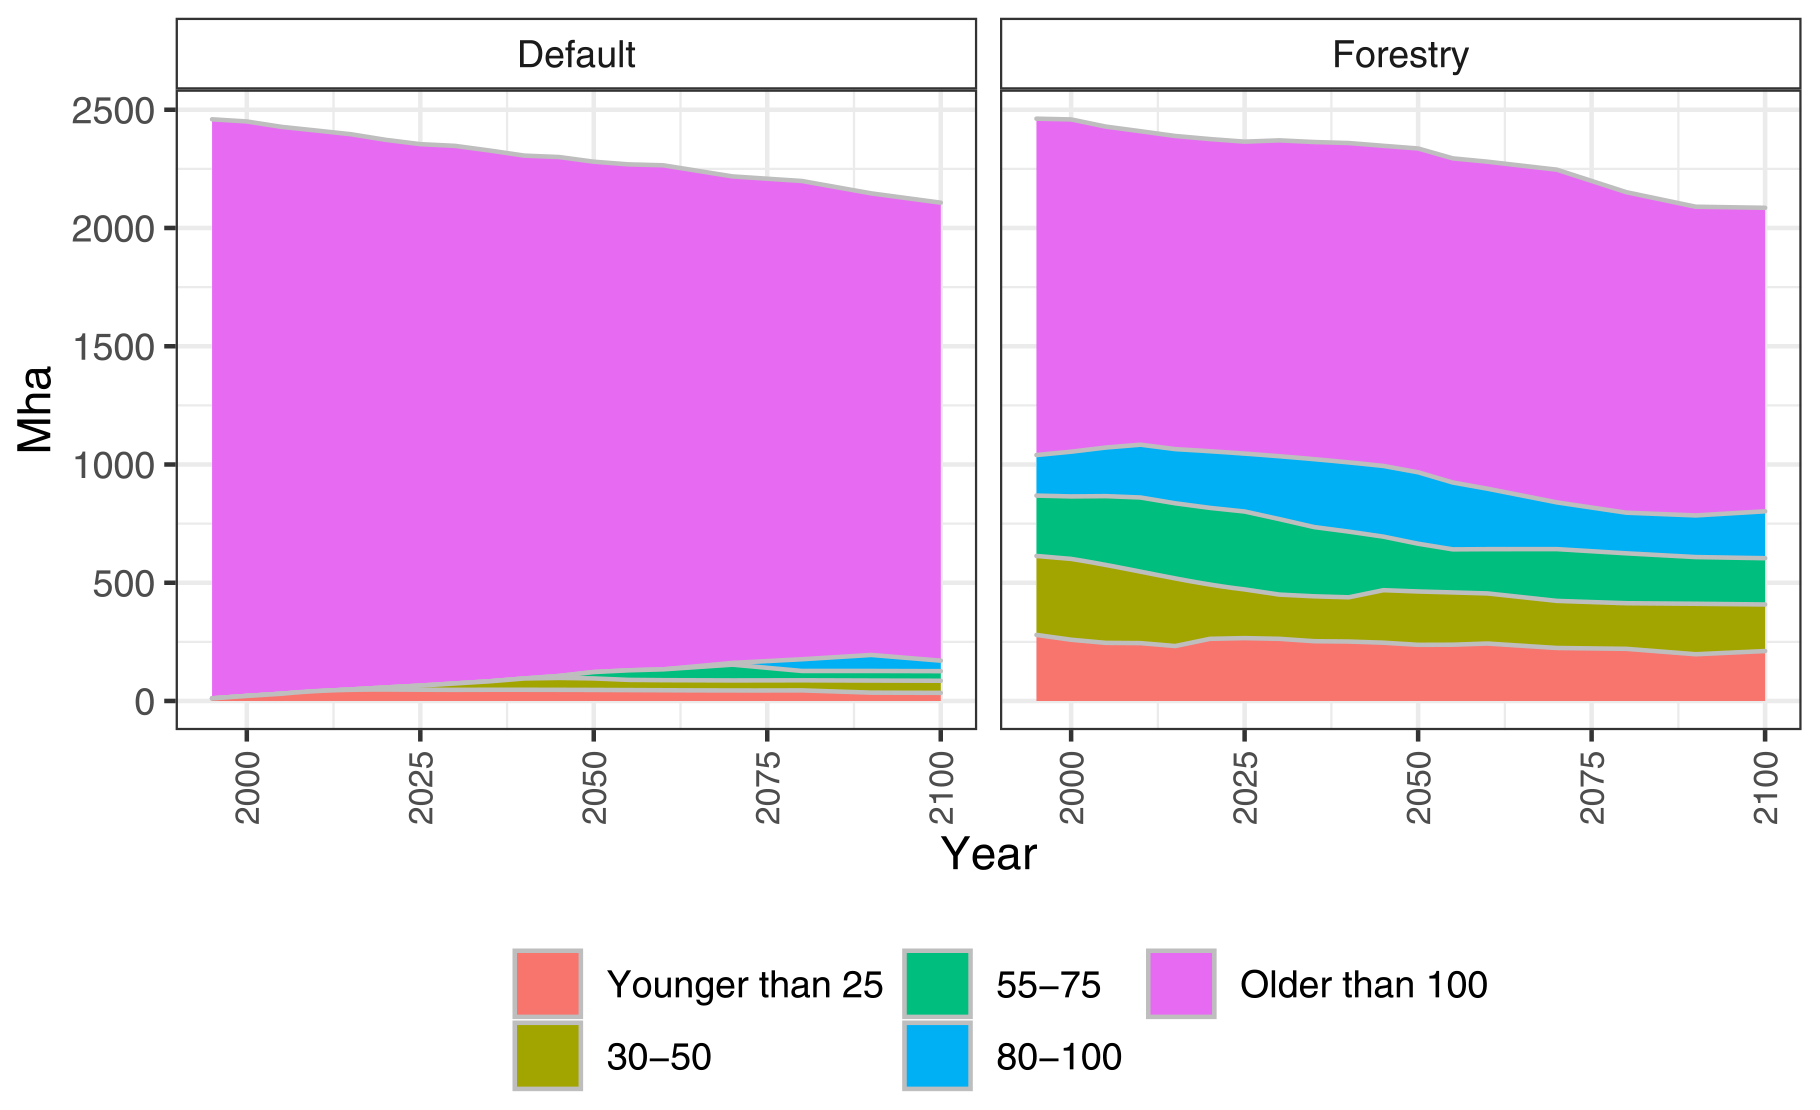
Figure 15Age-class structure in secondary forest. The majority of secondary forest belongs to the highest age class, acx.
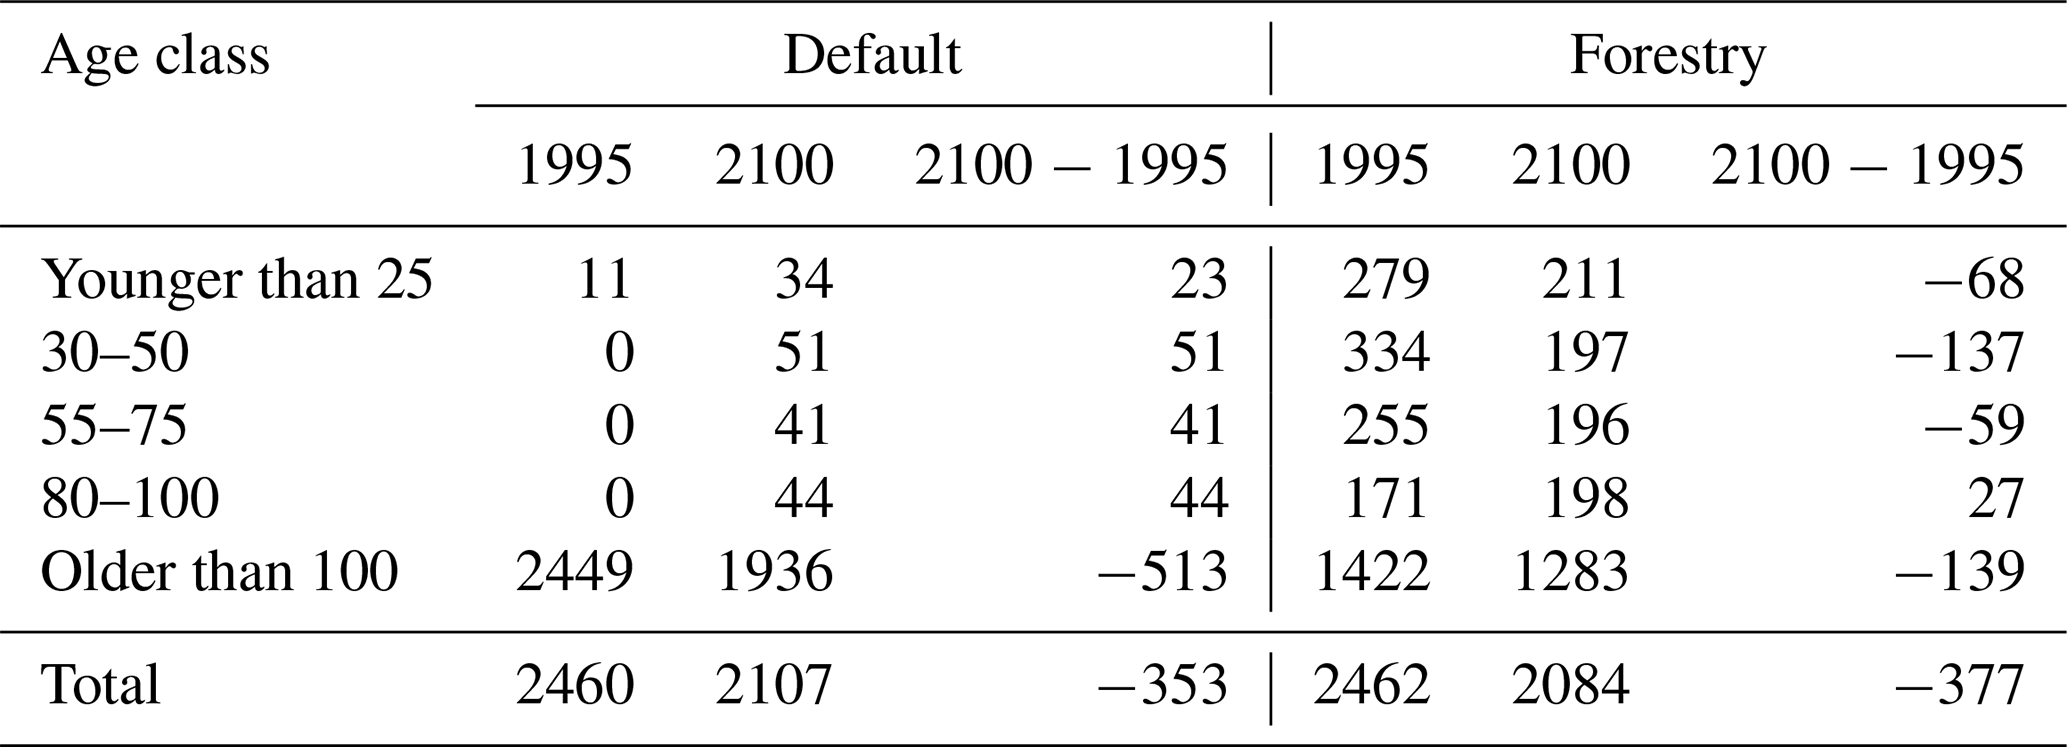
Table 4Difference in secondary forest area between 1995 and 2100 (Mha).
3.3 Secondary forest age-class structure
Secondary forests are initialized in MAgPIE as described in Sect. 2.4. Once harvested (for timber production) or cleared (for cropland or plantations), secondary forests move to the youngest age class (ac0) and are subject to natural regrowth. Primary forests, once harvested, are reclassified as secondary forest of the youngest age class and undergo regrowth. Table 4 shows the difference in secondary forest area between 1995 and 2100. The development of age-class structure in secondary forests for the default and forestry scenarios is also shown in Fig. 15. Selection of the appropriate initial age-class distribution is especially important, as it has a direct relationship to AFOLU emissions (as discussed further in Sect. 3.5).
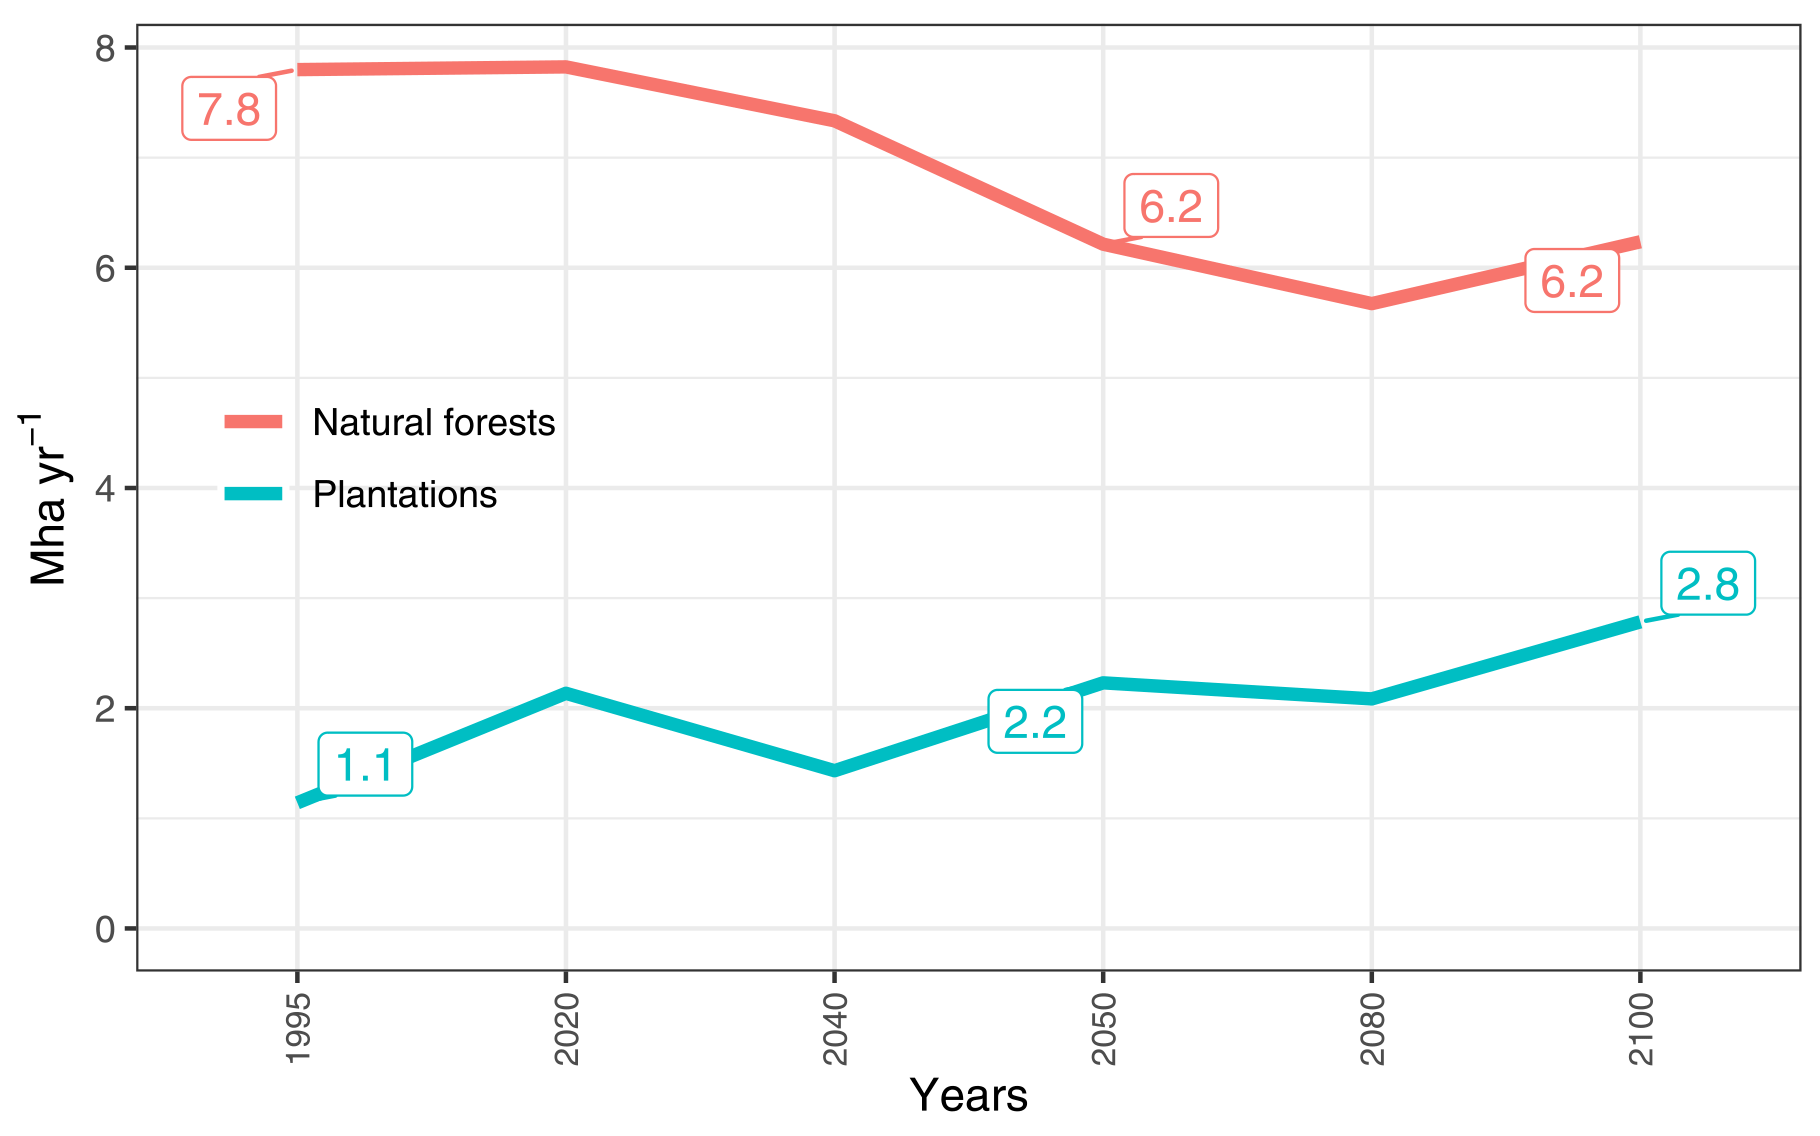
Figure 16Global annual area harvested for roundwood production (in Mha yr−1) by source in the forestry scenario.
3.4 Roundwood harvest
Figure 16 shows the annual amount of forest area harvested to meet roundwood demand globally (forestry scenario; no harvested area in the default scenario). On average, between 1995 and 2100, we observe 2 Mha yr−1 of plantation and 7 Mha yr−1 of natural forest harvested in the forestry scenario. In this scenario, natural forests are harvested more than timber plantations in all periods. In line with the assumptions regarding timber plantation establishment (an increasing share of timber production from plantations in the future), the harvested area from timber plantations increases in the future. Regional details of the annual forest area harvested are shown in Fig. A7.
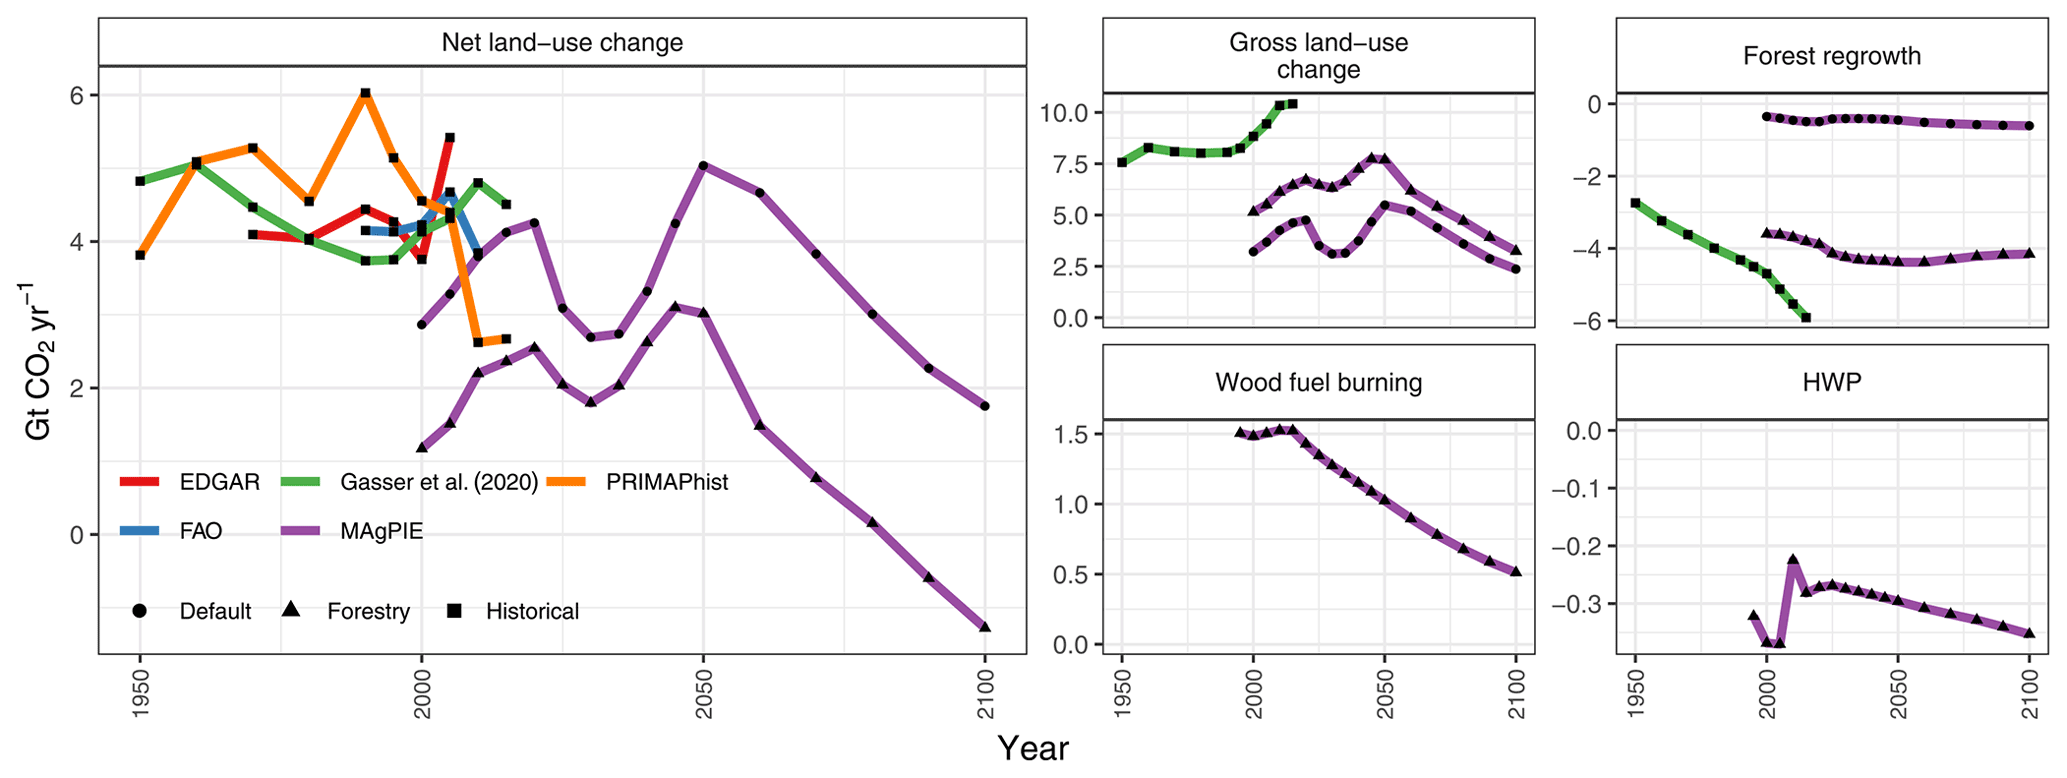
Figure 17Global annual land-use change emissions (in Gt CO2 yr−1; 1995–2100) and their components. Validation data were sourced from the Emissions Database for Global Atmospheric Research (EDGAR; JRC and PBL, 2010), FAO (2017), Gasser et al. (2020), Houghton et al. (2012), Potsdam Real-Time Integrated Model for Probabilistic Assessment of Emission Paths (PRIMAPhist; Gütschow et al., 2016), Lauk et al. (2012), and Johnston and Radeloff (2019). The regional distribution is available in Fig. A6.
3.5 Annual land-use change emissions
Figure 17 shows the annual land-use change emissions from 2000 to 2100. Net land-use change emissions in MAgPIE comprise gross land-use change emissions and emissions from shifting agriculture (positive), emissions from regrowth in forests and other land (negative), and emissions from wood products (negative, calculated as a net flux between long-term carbon storage in harvested wood products and their slow decay over time).
In the default scenario, land-use change emissions decrease from 3.0 in 2000 to 1.8 Gt CO2 yr−1 in 2100. In the forestry scenario, we observe that emissions increase from 1.2 in 2000 to a peak of 3.1 Gt CO2 yr−1 mid-century and then fall gradually back to −1.3 Gt CO2 yr−1 by the end of this century. The gross land-use change emissions are comparable between the default and the forestry scenarios with results from the forestry scenario slightly closer to historically reported numbers from Gasser et al. (2020) than in the default scenario. The net land-use change emissions and removals from regrowth differ substantially between both scenarios; however, in the forestry scenario, removals from regrowth compare much better to values from the literature (Gasser et al., 2020). Overall, we present a historically consistent evolution of regrowth emissions in the forestry scenario by accounting for timber production and age-class structure in timber plantations and natural forests.
Compared with the default scenario, we observe lower CO2 emissions in the forestry scenario during the initial periods due to higher carbon uptake driven by the assumptions of a heterogeneous initial age-class structure in secondary forests (carbon uptake can be interpreted as negative emissions where a mathematically lower value is higher carbon uptake). In the default scenario, carbon uptake is much lower for the following two reasons: (1) during initialization, all secondary forest is assumed to exist in the highest age class, which limits the amount of regrowth, and (2) no secondary forest is harvested for timber production in the default scenario. Without such disturbances, the age-class structure in secondary forests does not shift much towards the younger age classes (also seen in Fig. 15) where regrowth is usually faster than in older forests.
In this paper, we expanded the MAgPIE modeling framework using a detailed representation of land-use dynamics in natural forests and timber plantations while also accounting for roundwood production and competition for land with agriculture. Representing forestry and timber production in a recursive dynamic land-use model is a challenging issue due to the complexities associated with the long-term planning horizons needed for roundwood production and forest management. This explains why major land-use models focus on better representation of the agricultural sector or the forestry sector but not on the competition between both within the same model (Calvin et al., 2019; Wise et al., 2014; Stehfest et al., 2014; Kallio et al., 2004; Havlík et al., 2011; Kindermann et al., 2006; Sohngen et al., 1999). As timber, food and feed production happen simultaneously in the real world, the inclusion of the forestry sector, next to the agricultural sector, substantially improves the representation of land dynamics and GHG emissions in MAgPIE.
While including the forestry sector in MAgPIE, we present a historically consistent development of timber plantation area over time when compared to observed data (FAO, 2020b). We also present a historically consistent development of growing stocks in plantations and natural forests over time (FAO, 2020b). Our results show that the inclusion of timber production and plantation establishment in the MAgPIE modeling framework competes with cropland for limited land resources. While the total global cropland is similar between the default and the forestry scenarios at the global level, the spatial cropland patterns differ substantially between the two scenarios, which indicates that timber plantations compete with cropland for the same scarce land resources. The net effect is a stronger decline in natural forest in the forestry scenario compared with the default scenario. New timber plantations might be partly established on cleared natural forests; however, considering the substantial changes in spatial cropland patterns, it seems likely that plantations are also established on cropland and pasture land, which causes deforestation for cropland expansion elsewhere.
Our land-related CO2 emissions and removals match better with observed data (Houghton et al., 2012; Gasser et al., 2020; FAO, 2017; Gütschow et al., 2016; JRC and PBL, 2010) in the forestry scenario compared with the default scenario, in particular with respect to the gross land-use change emissions, reflecting the higher deforestation for the expansion of managed land and timber production, and the carbon uptake, reflecting regrowth in natural forests and timber plantations.
Our modeling study also indicates that timber plantations are an important source of roundwood production. If timber plantations did not increase, in contrast to our forestry scenario, the projected increase in roundwood demand would need to be fulfilled by wood harvest from natural forests. Of particular importance is the fact that plantations can produce more timber on less area, making them a candidate with respect to reducing roundwood production pressure on natural forests. This opens up a similar question with respect to the land-sharing versus land-sparing debate. Establishing high-yield plantations for roundwood production might provide the benefit of producing a large quantity of timber using a small land area, but such plantations do not synergize well with biodiversity. Species richness in plantation forests is usually significantly lower than in natural forests (Phillips et al., 2017): when plantations are established after clearing natural forests, there is a decline (or even loss) of biodiversity. On the contrary, it is also important to keep in mind that, even when timber plantations embody lower species richness than natural forest in comparable geographic locations, plantations, if established on degraded land, will almost always support higher species richness (Brockerhoff et al., 2008). Plantations may generally be lower with respect to biodiversity, but they eventually spare natural forests for CO2 sequestration, biodiversity and soil preservation purposes (Moomaw et al., 2020; Waring et al., 2020; Buotte et al., 2020).
We are aware that our research may have certain limitations, as extending a recursive dynamic land-use model to include a dynamic forestry sector is not straightforward and includes some strong generalizations. First, we do not account for future climate change impacts in this study. In principle, the modeling framework is capable of accounting for climate change impacts. However, in this study, we deliberately chose to focus on the overall forestry implementation and the implications on land-use dynamics and GHG emissions.
Second, Faustmann rotations are usually preferred in forest economics literature because they maximize land value, which is what plantation owners presumably do. The choice of a rotation length in MAgPIE that maximizes the CAI results in rotation lengths that are only comparable to the Faustmann criteria under a limited range of interest rates (Amacher et al., 2009). Given a higher interest rate, economically optimal Faustmann rotations would be longer than rotation lengths in MAgPIE and vice versa. On the other hand, we choose the maximization of the CAI over the maximization of the MAI because the maximization of the CAI results in rotation lengths that are more comparable to economically optimal Faustmann rotations than the maximization of MAI, which results in longer biologically optimal rotation lengths. Additionally, rotation lengths calculated in MAgPIE are not endogenous and are only affected by the shape of assumed growth curves (Braakhekke et al., 2019) and carbon densities (Humpenöder et al., 2014), but they are unchanged by fluctuations in timber prices and interest rates, which is a simplification of reality.
Third, in forests managed for timber production, thinning is practiced by removing the smaller and poorer-quality trees. This operation generates income from the sale of harvested timber and also makes sure that growth is favorable for the remaining trees. The operation also results in a higher volume and quality of harvested timber, which can generate a higher income in the future as the price for such timber is higher in the market. We do not simulate this activity in our updated modeling framework and, therefore, underestimate the roundwood production capabilities of timber plantations to some extent.
Fourth, we do not account for spatial differences in tree species, as MAgPIE in its current format does not have a mechanism in place to explicitly handle such information. Even though the growth curves used in MAgPIE are parameterized differently for natural forests and plantations, they are not perfect proxies for differences in growth and biomass volume accumulation among different species. As a corollary, we also do not prescribe a minimum diameter constraint for harvesting, as MAgPIE cannot ascertain the thickness of tree trunks at every stage of tree growth.
Fifth, the results presented here are driven by socioeconomic assumptions from the SSP2 scenario, which is considered to be a “middle-of-the road” scenario. Inherently, our results are as uncertain as the future socioeconomic drivers, i.e., the wide range of possible future socioeconomic developments in different SSPs bring a wide range of uncertainty about the future development of the forest sector (Lauri et al., 2019) and associated land-use change. On a spatial scale, there is considerable uncertainty in spatially explicit data on plantation forest with respect to the differentiation between productive and nonproductive plantations; consequently, this uncertainty also has a bearing on the results. Additionally, in reality, the management of plantations also depends on other factors such as the availability of a workforce, investment, research and development, which are not considered for plantations in MAgPIE.
Since the inception of MAgPIE, the modeling framework has evolved with time to include a broad range of land-use processes. In this paper, we describe an extension of the existing MAgPIE framework using a detailed representation of timber demand and production, forest land, and timber plantations. MAgPIE 4.3.5 allows land-use processes for timber production to be simulated with feed, food and livestock demand simultaneously, advancing the land-use representation from previous MAgPIE versions. Given the growing importance of timber plantations with respect to meeting growing global timber demand, it is also imperative that timber plantation systems are modeled explicitly within forest systems in land-use modeling. Timber production has not been a part of the MAgPIE modeling framework since its inception, which means that a major driver of deforestation and land-use change emissions has been missing. With this paper, we bridge this gap and expand the coverage of the representation of the most relevant land-use change drivers in MAgPIE.
Inclusion of the forestry sector in MAgPIE offers an improved understanding of land resources, which plays a vital role in climate change mitigation (Doelman et al., 2018), biodiversity conservation (Gibson et al., 2011; Phillips et al., 2017) and maintaining crucial ecosystem services (Foley et al., 2005). This expanded version of MAgPIE not only provides an improved tool for comprehensive assessments of the Sustainable Development Goals (SDG) but may also contribute to other important scientific processes, such as providing inputs for Earth system models (ESMs) (Hurtt et al., 2020; Luyssaert et al., 2014; Reid et al., 2010; Bonan and Doney, 2018), biodiversity models (Thuiller et al., 2013; Urban et al., 2016), or international networks like the Agricultural Model Intercomparison and Improvement Project (AgMIP) (Ruane and Rosenzweig, 2018) or the Inter-Sectoral Impact Model Intercomparison Project (ISIMIP, https://www.isimip.org, last access: 10 March 2021).
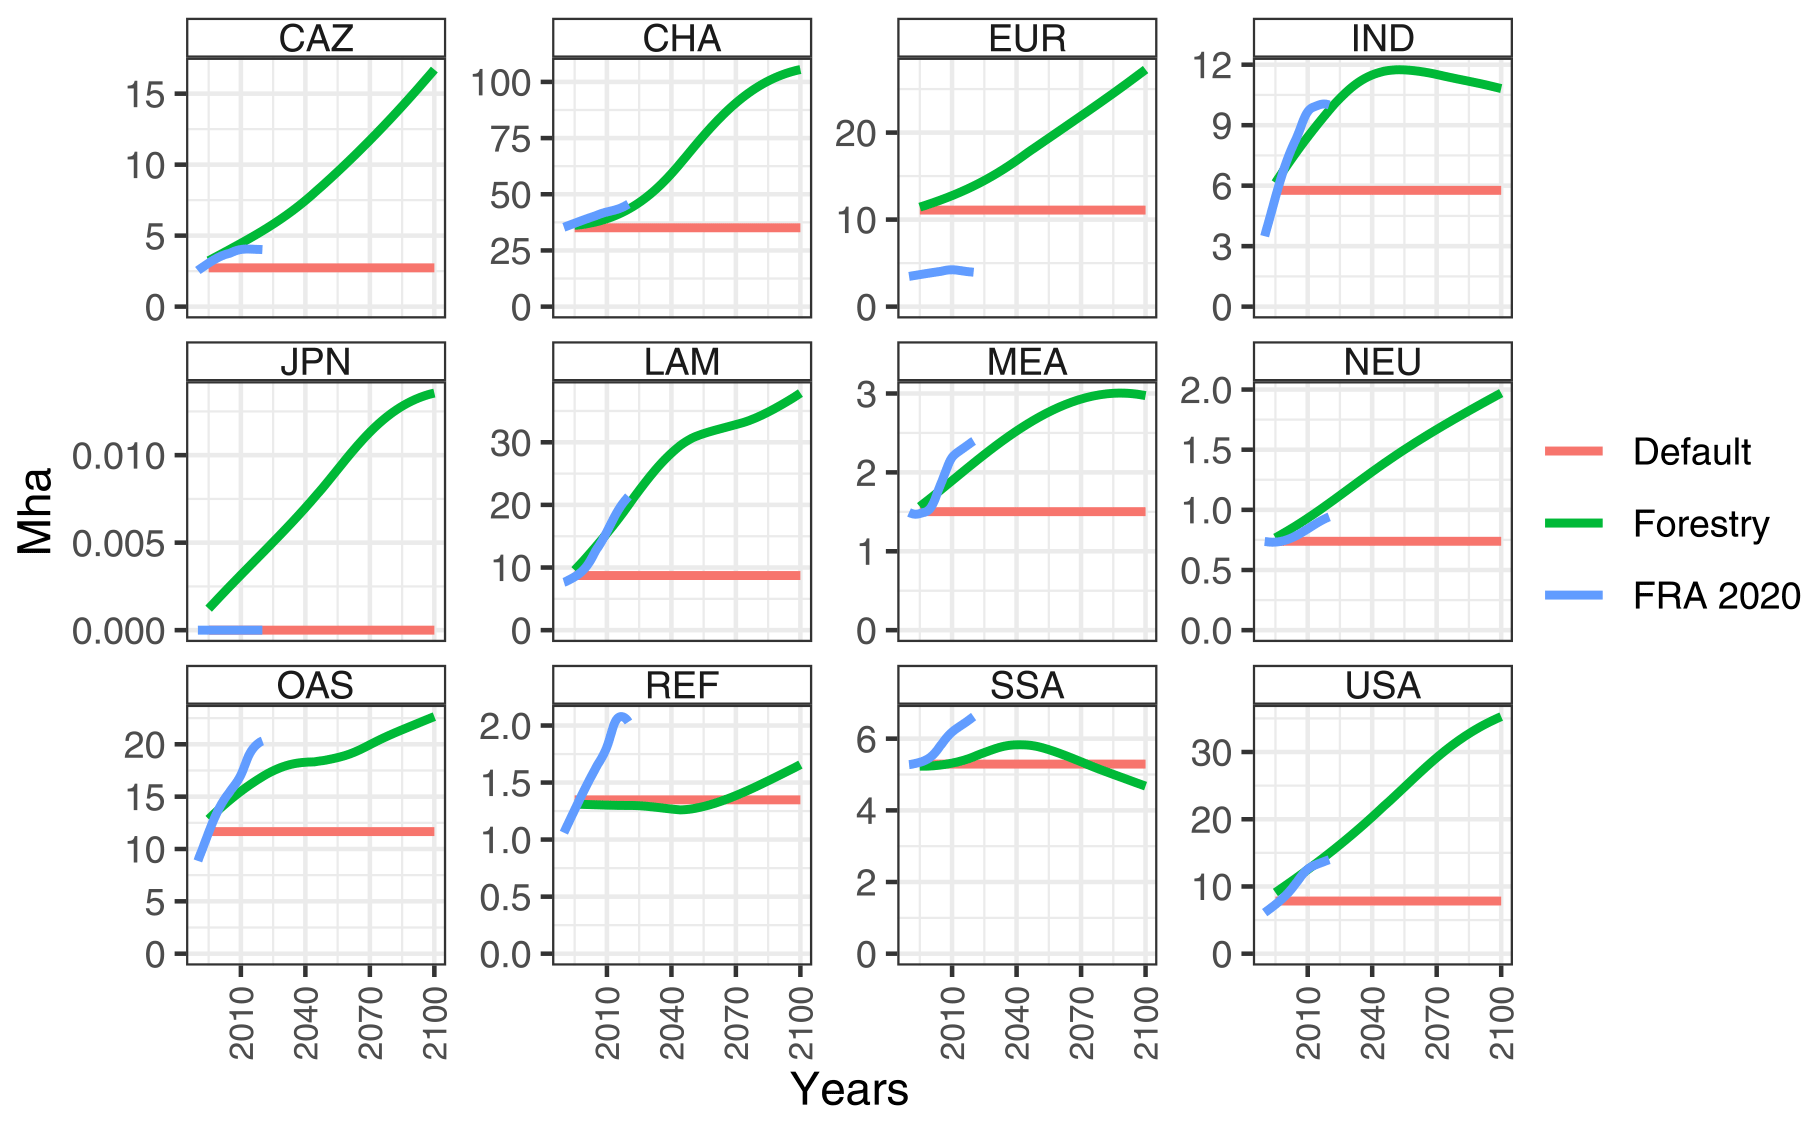

Figure A2Natural forest area difference between 2100 and 1995 in the default and forestry scenarios.
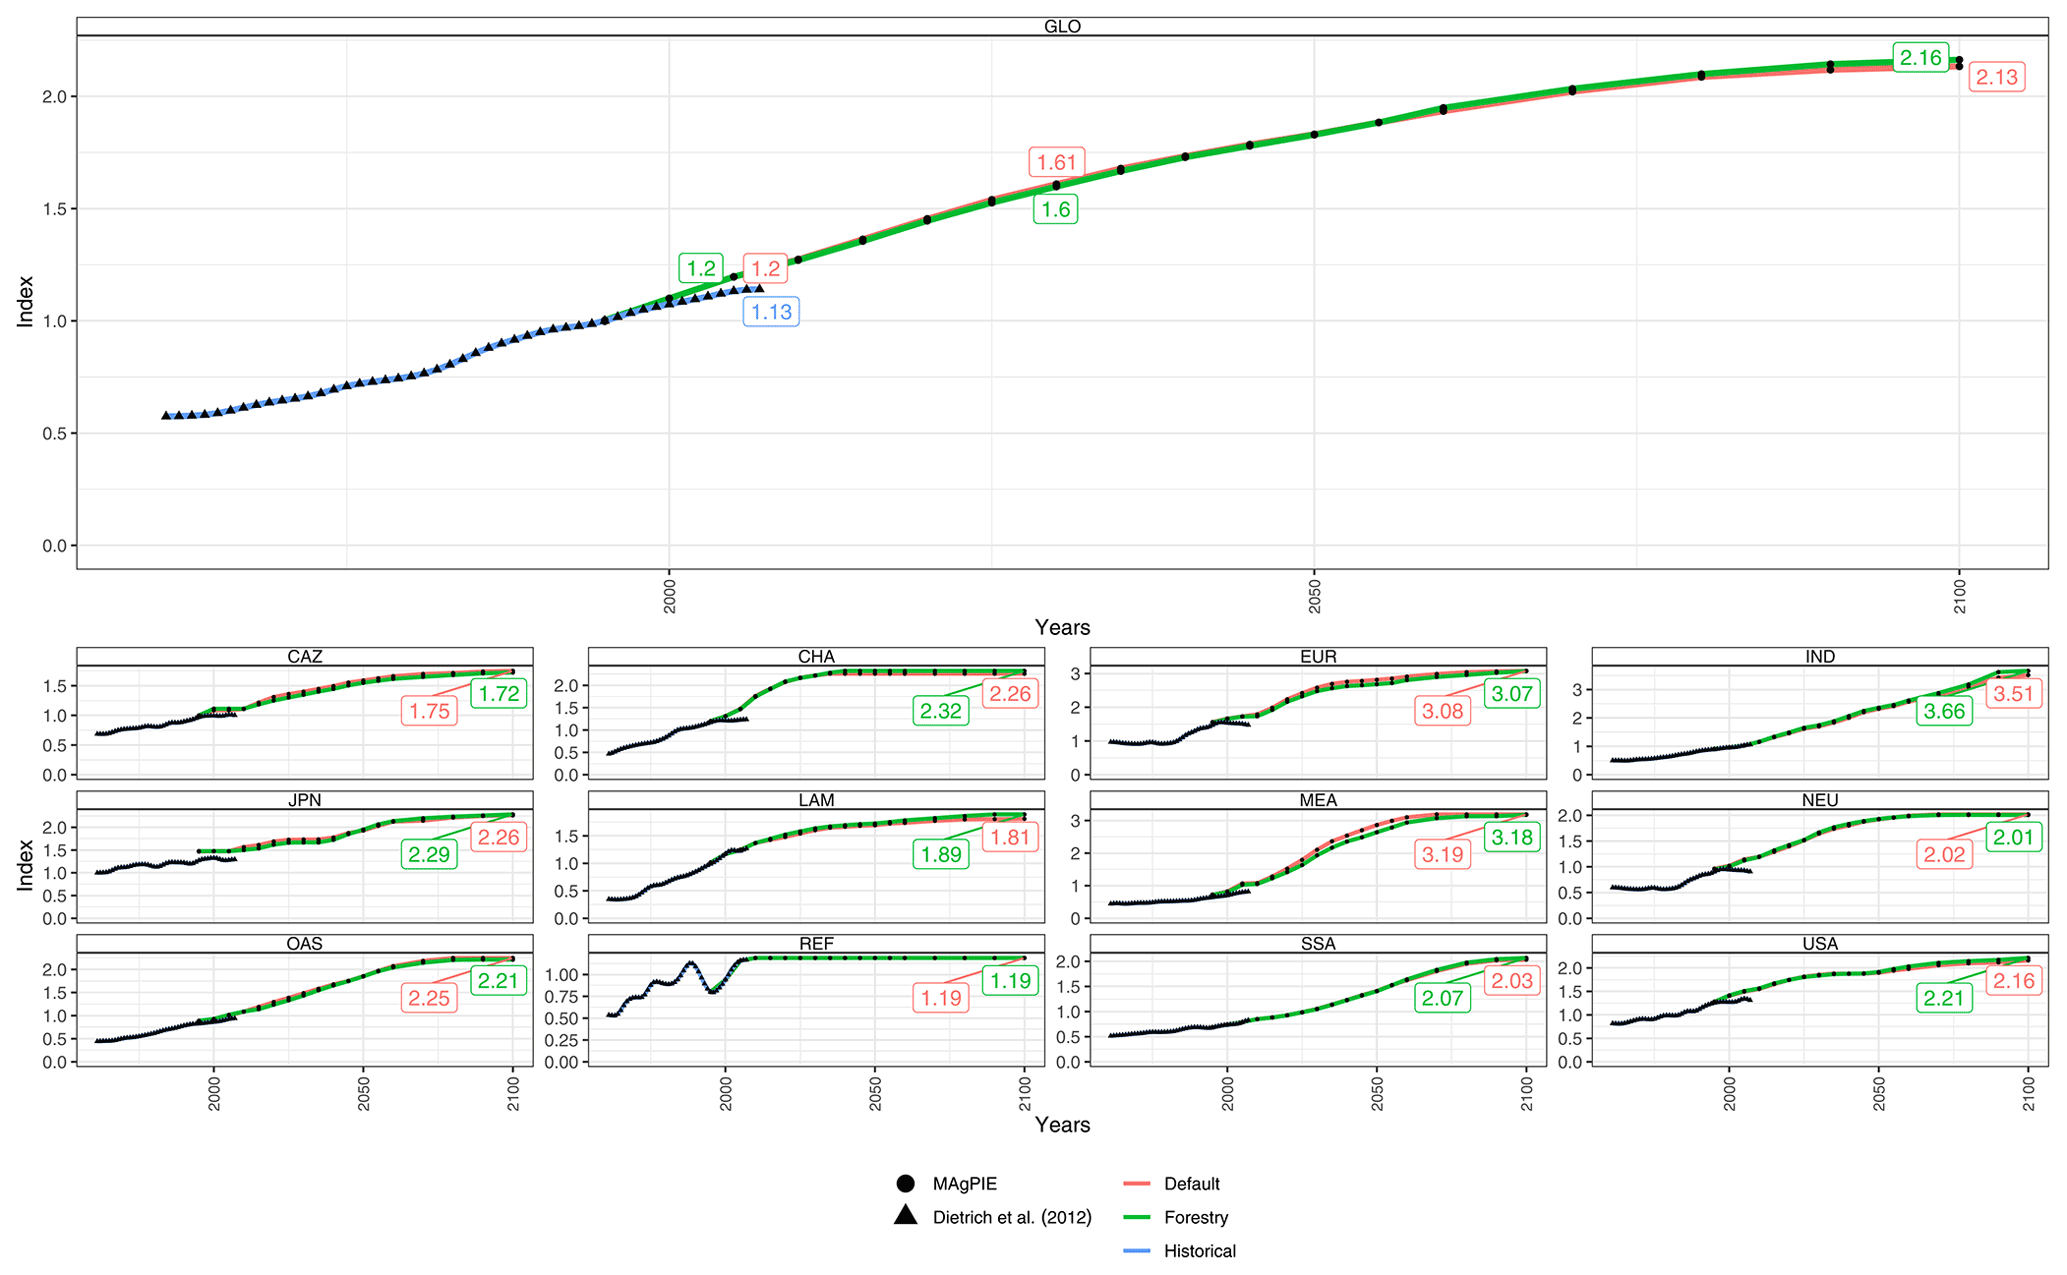
Figure A3Global (upper panel) and regional (bottom panel) land-use intensity indicator (τ) as a productivity measure (index).
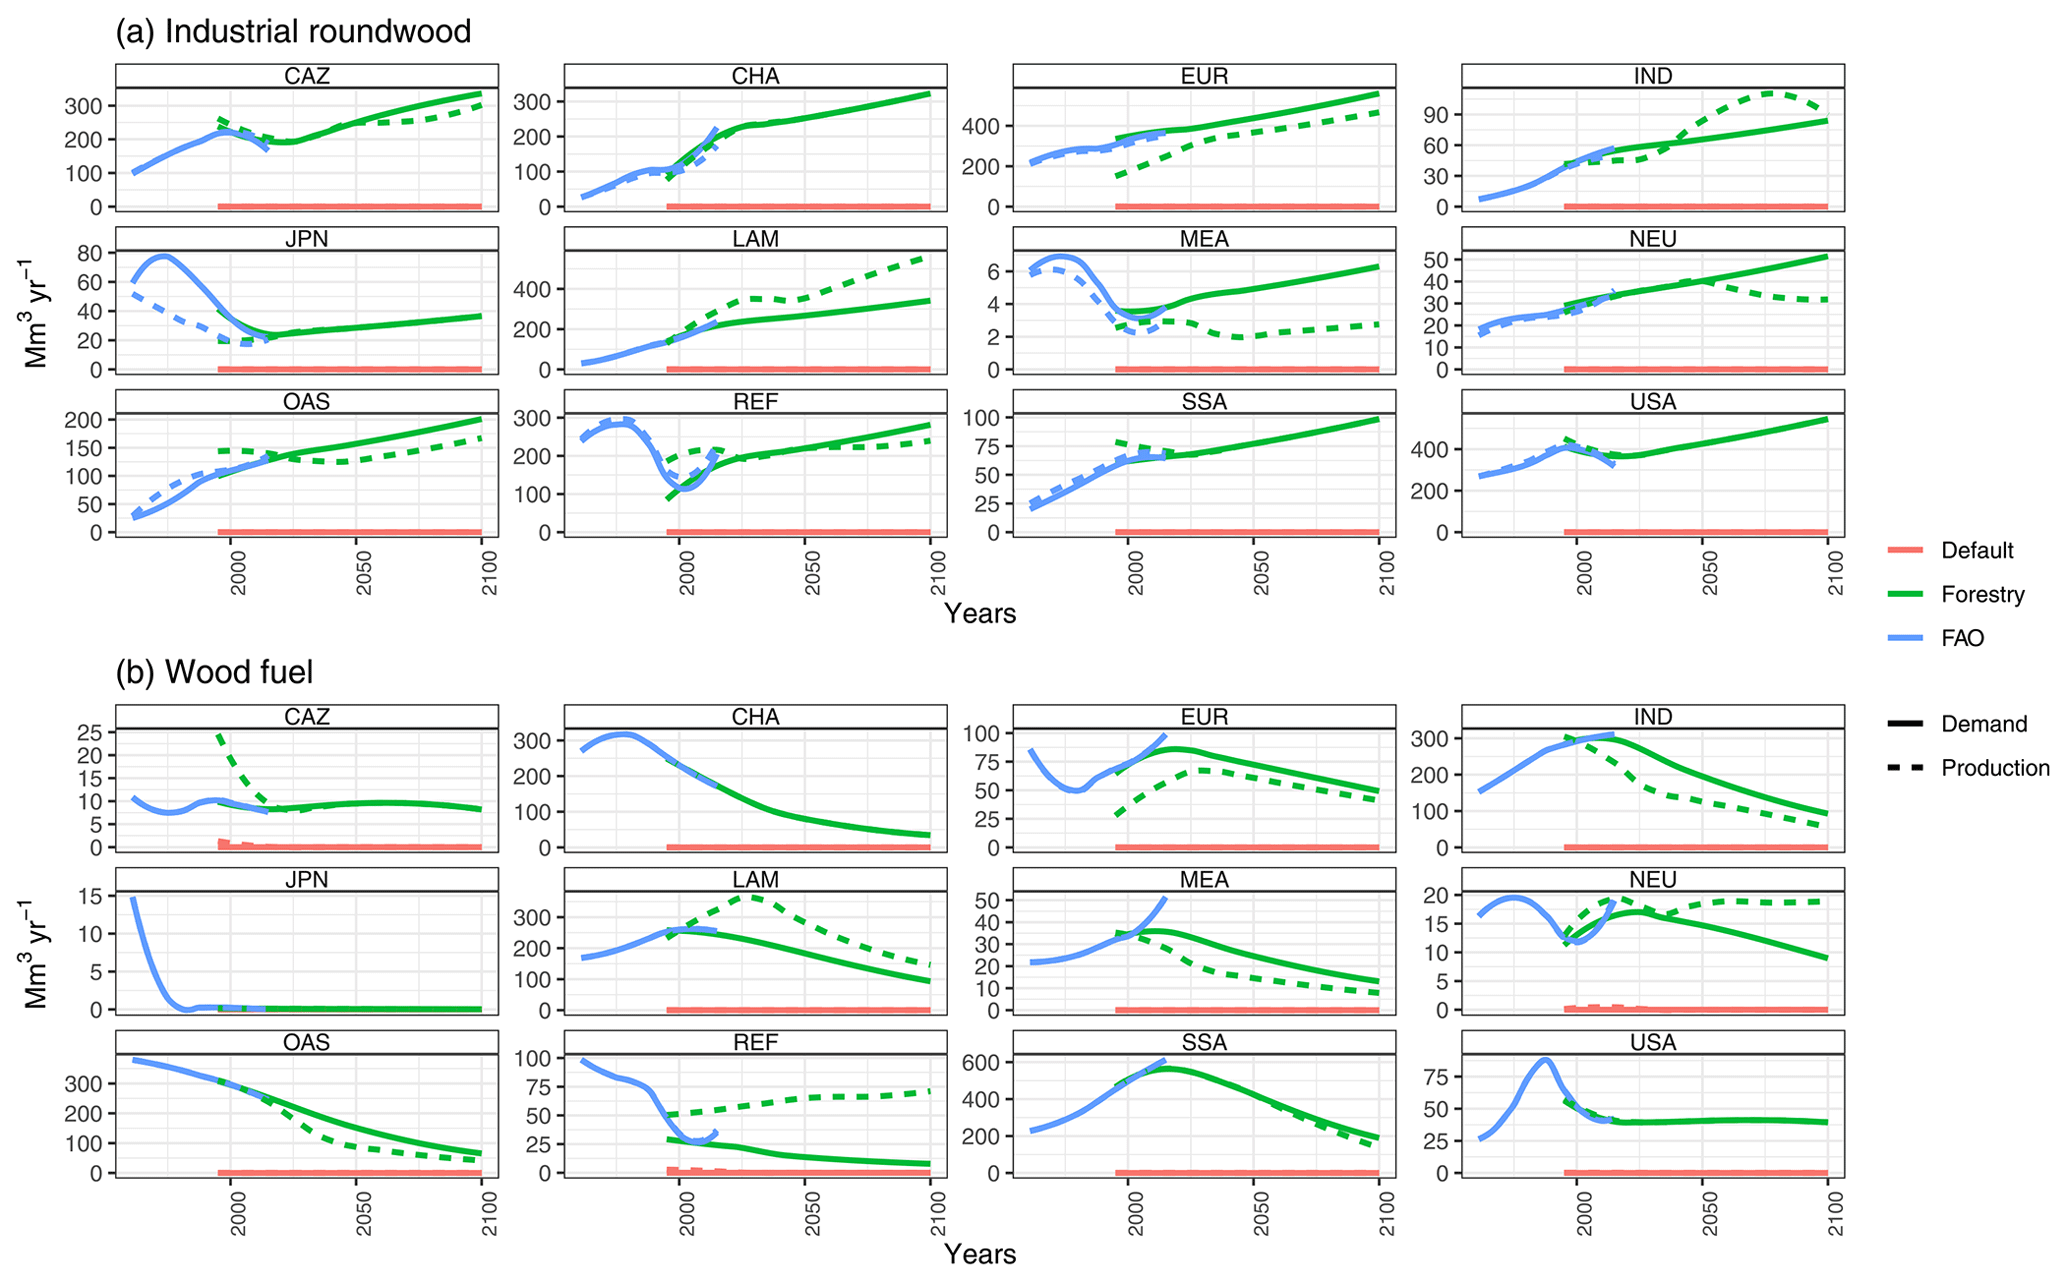
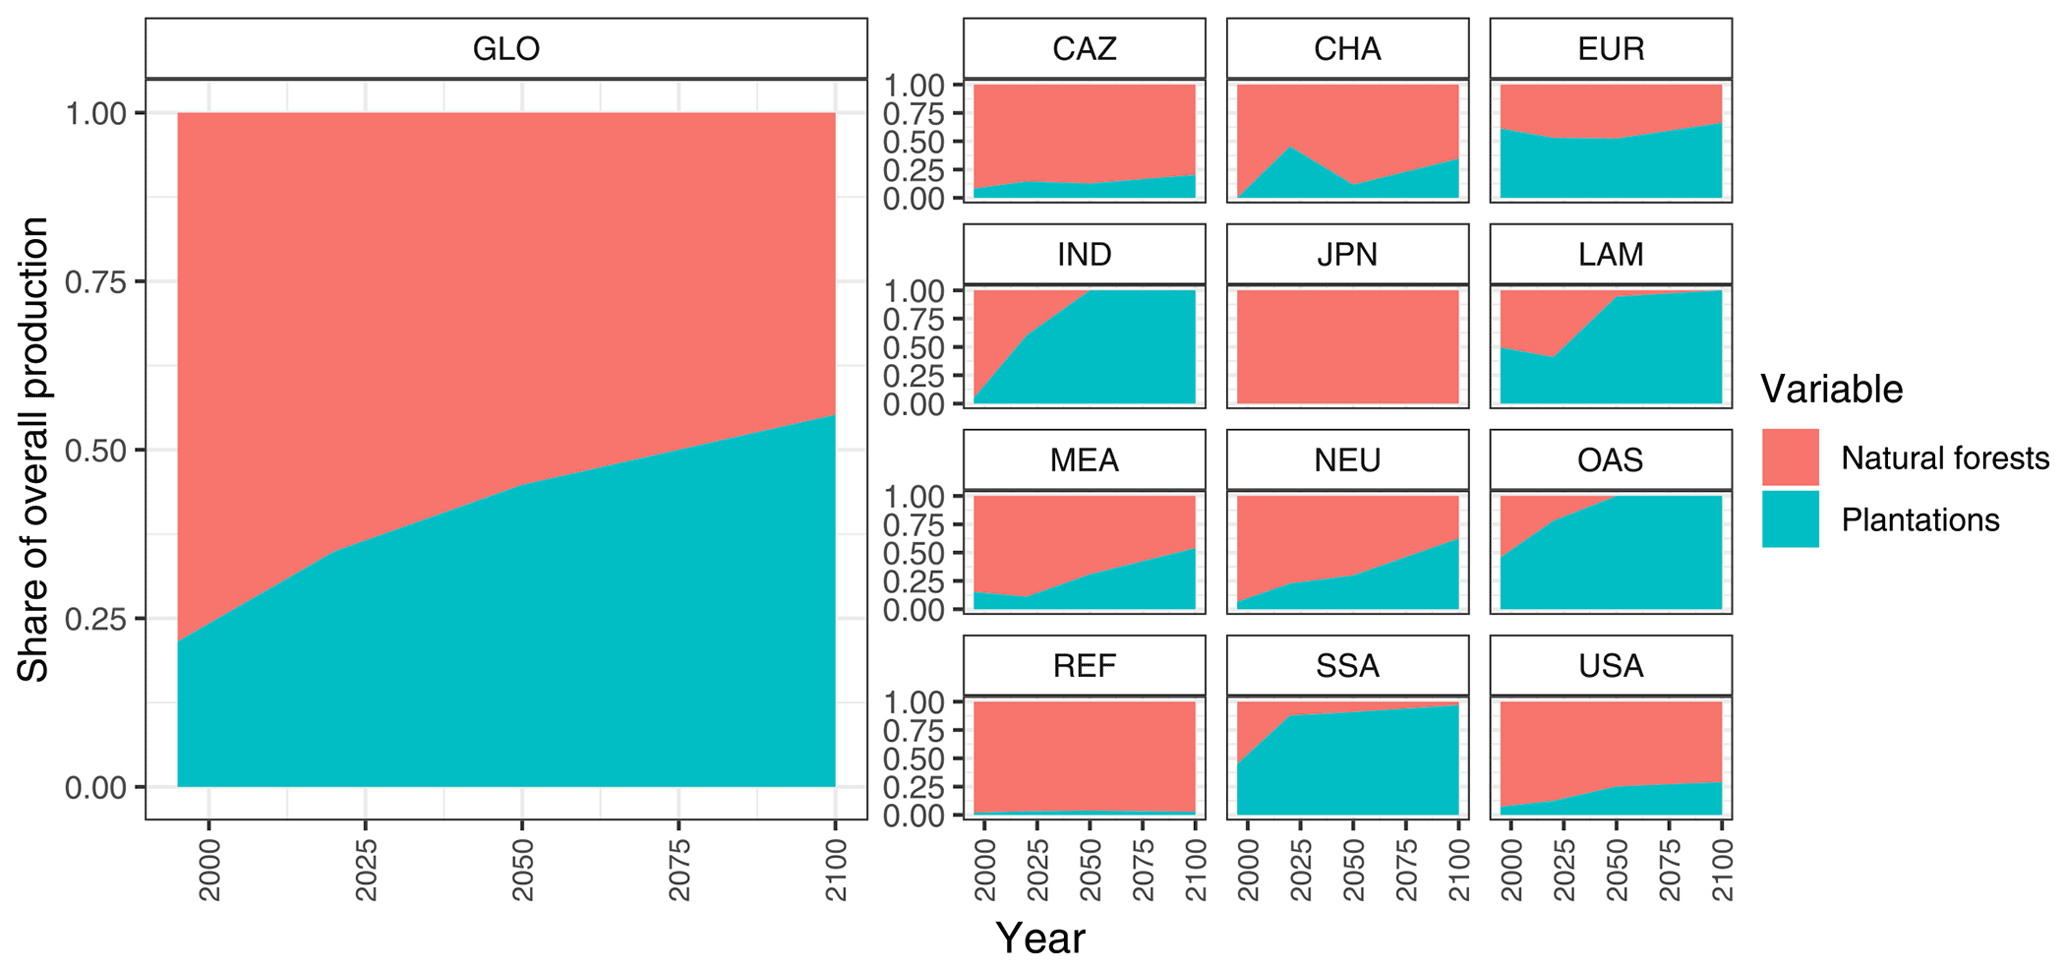
Figure A5Modeled contribution of timber harvested from natural forests and plantations to industrial roundwood and wood fuel production in the forestry scenario (1995–2100).
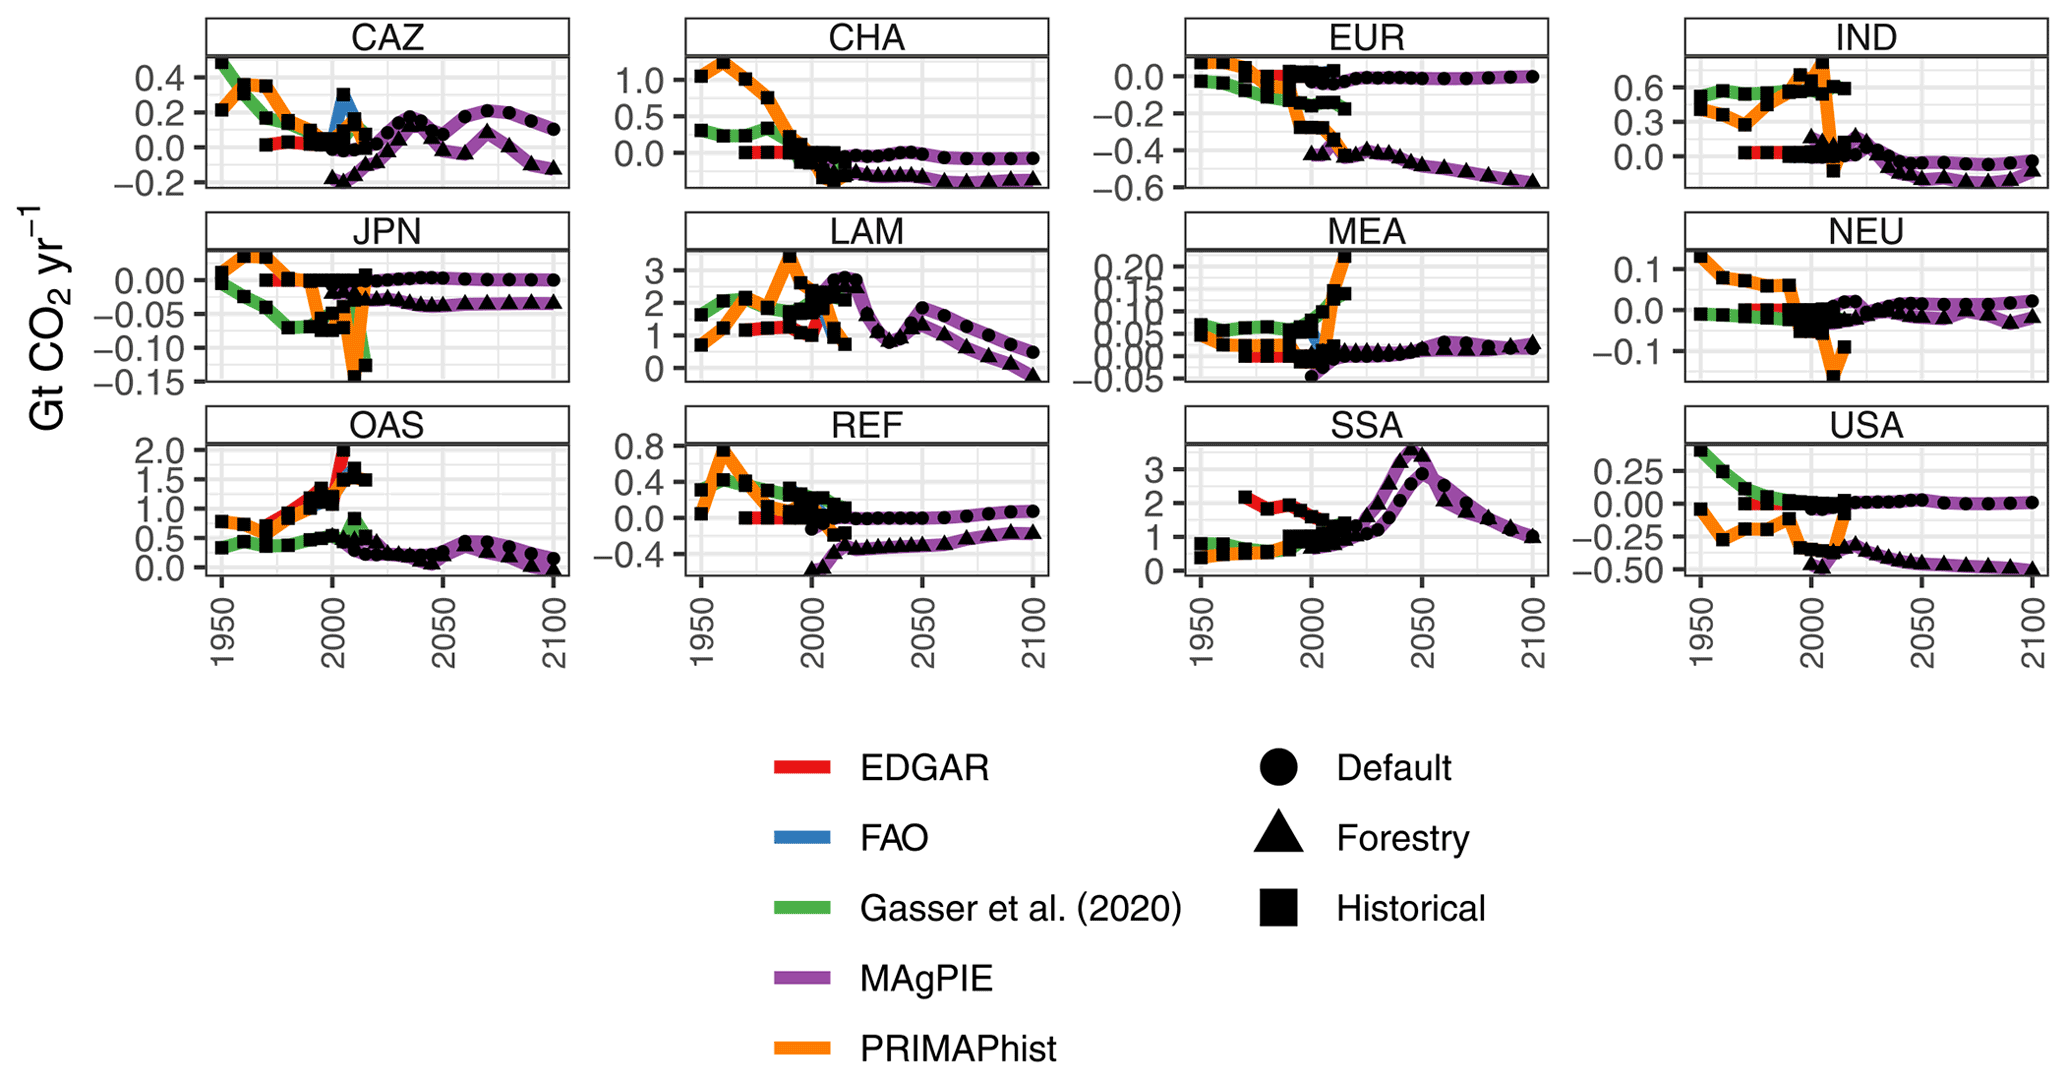
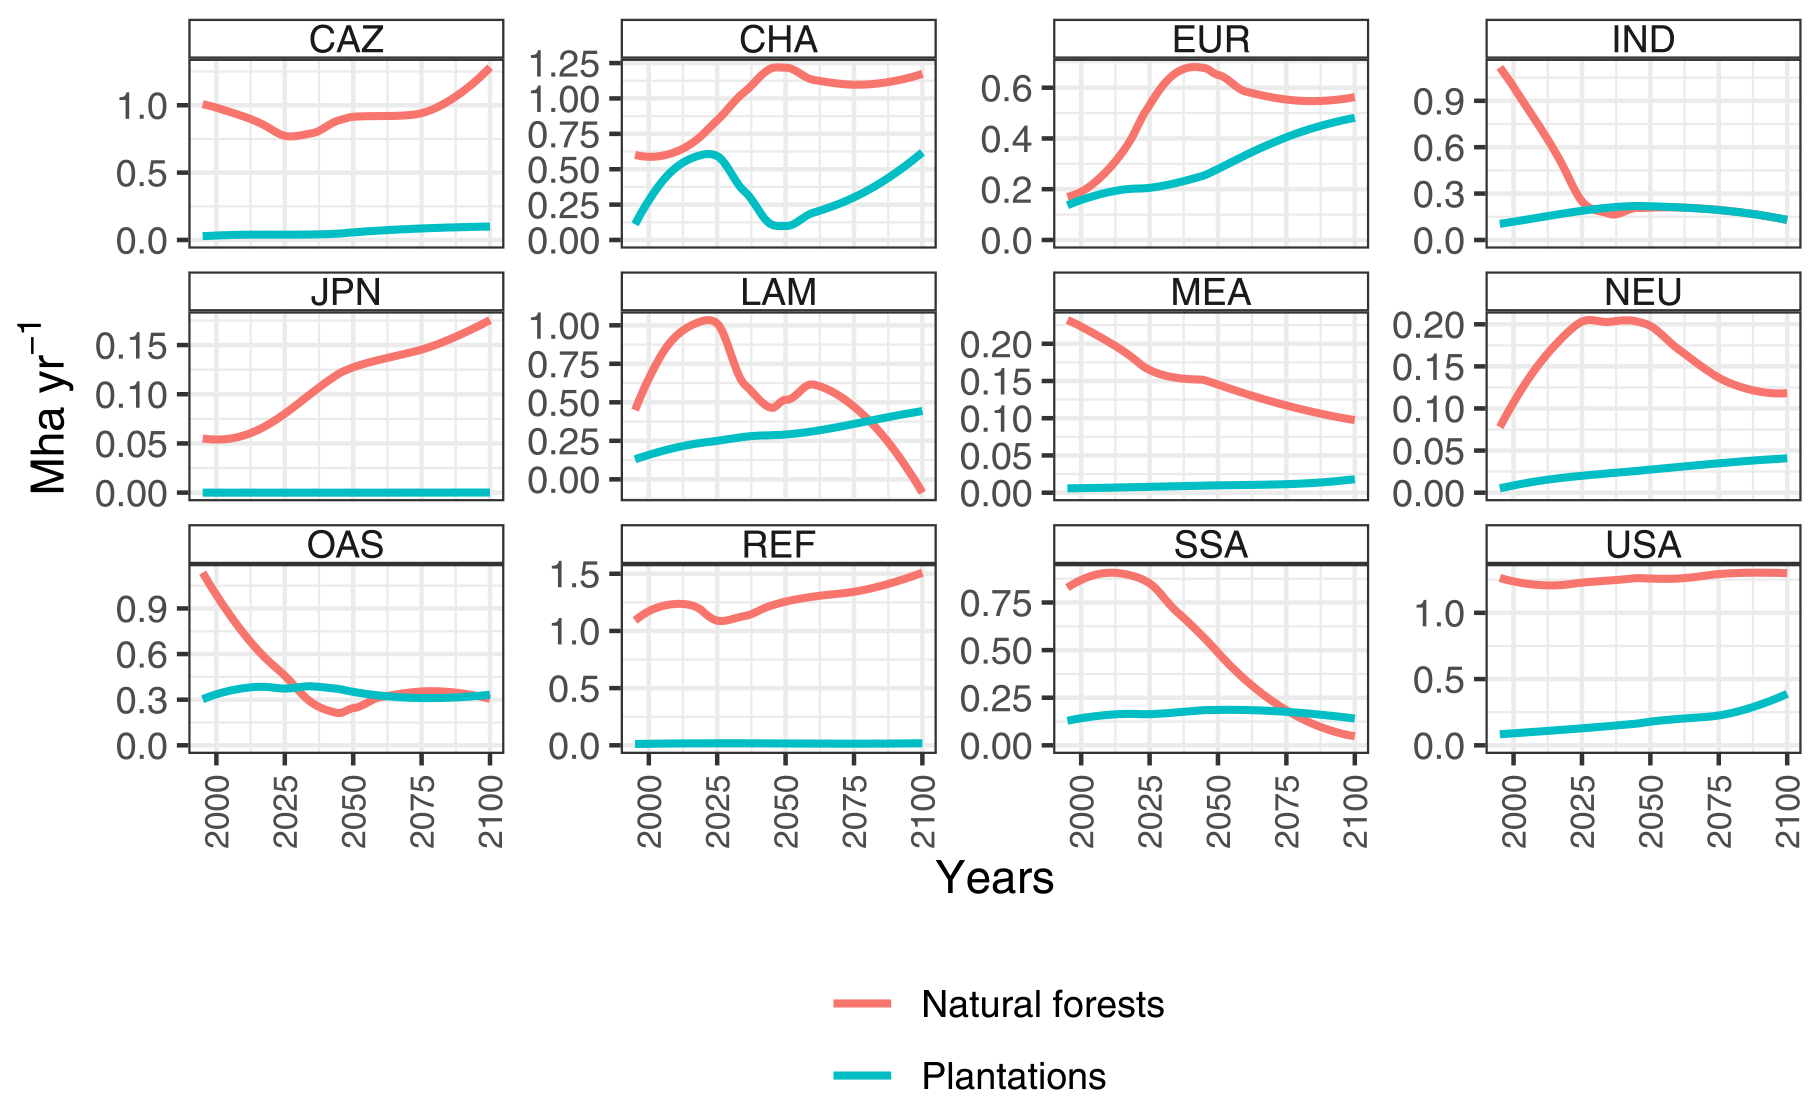

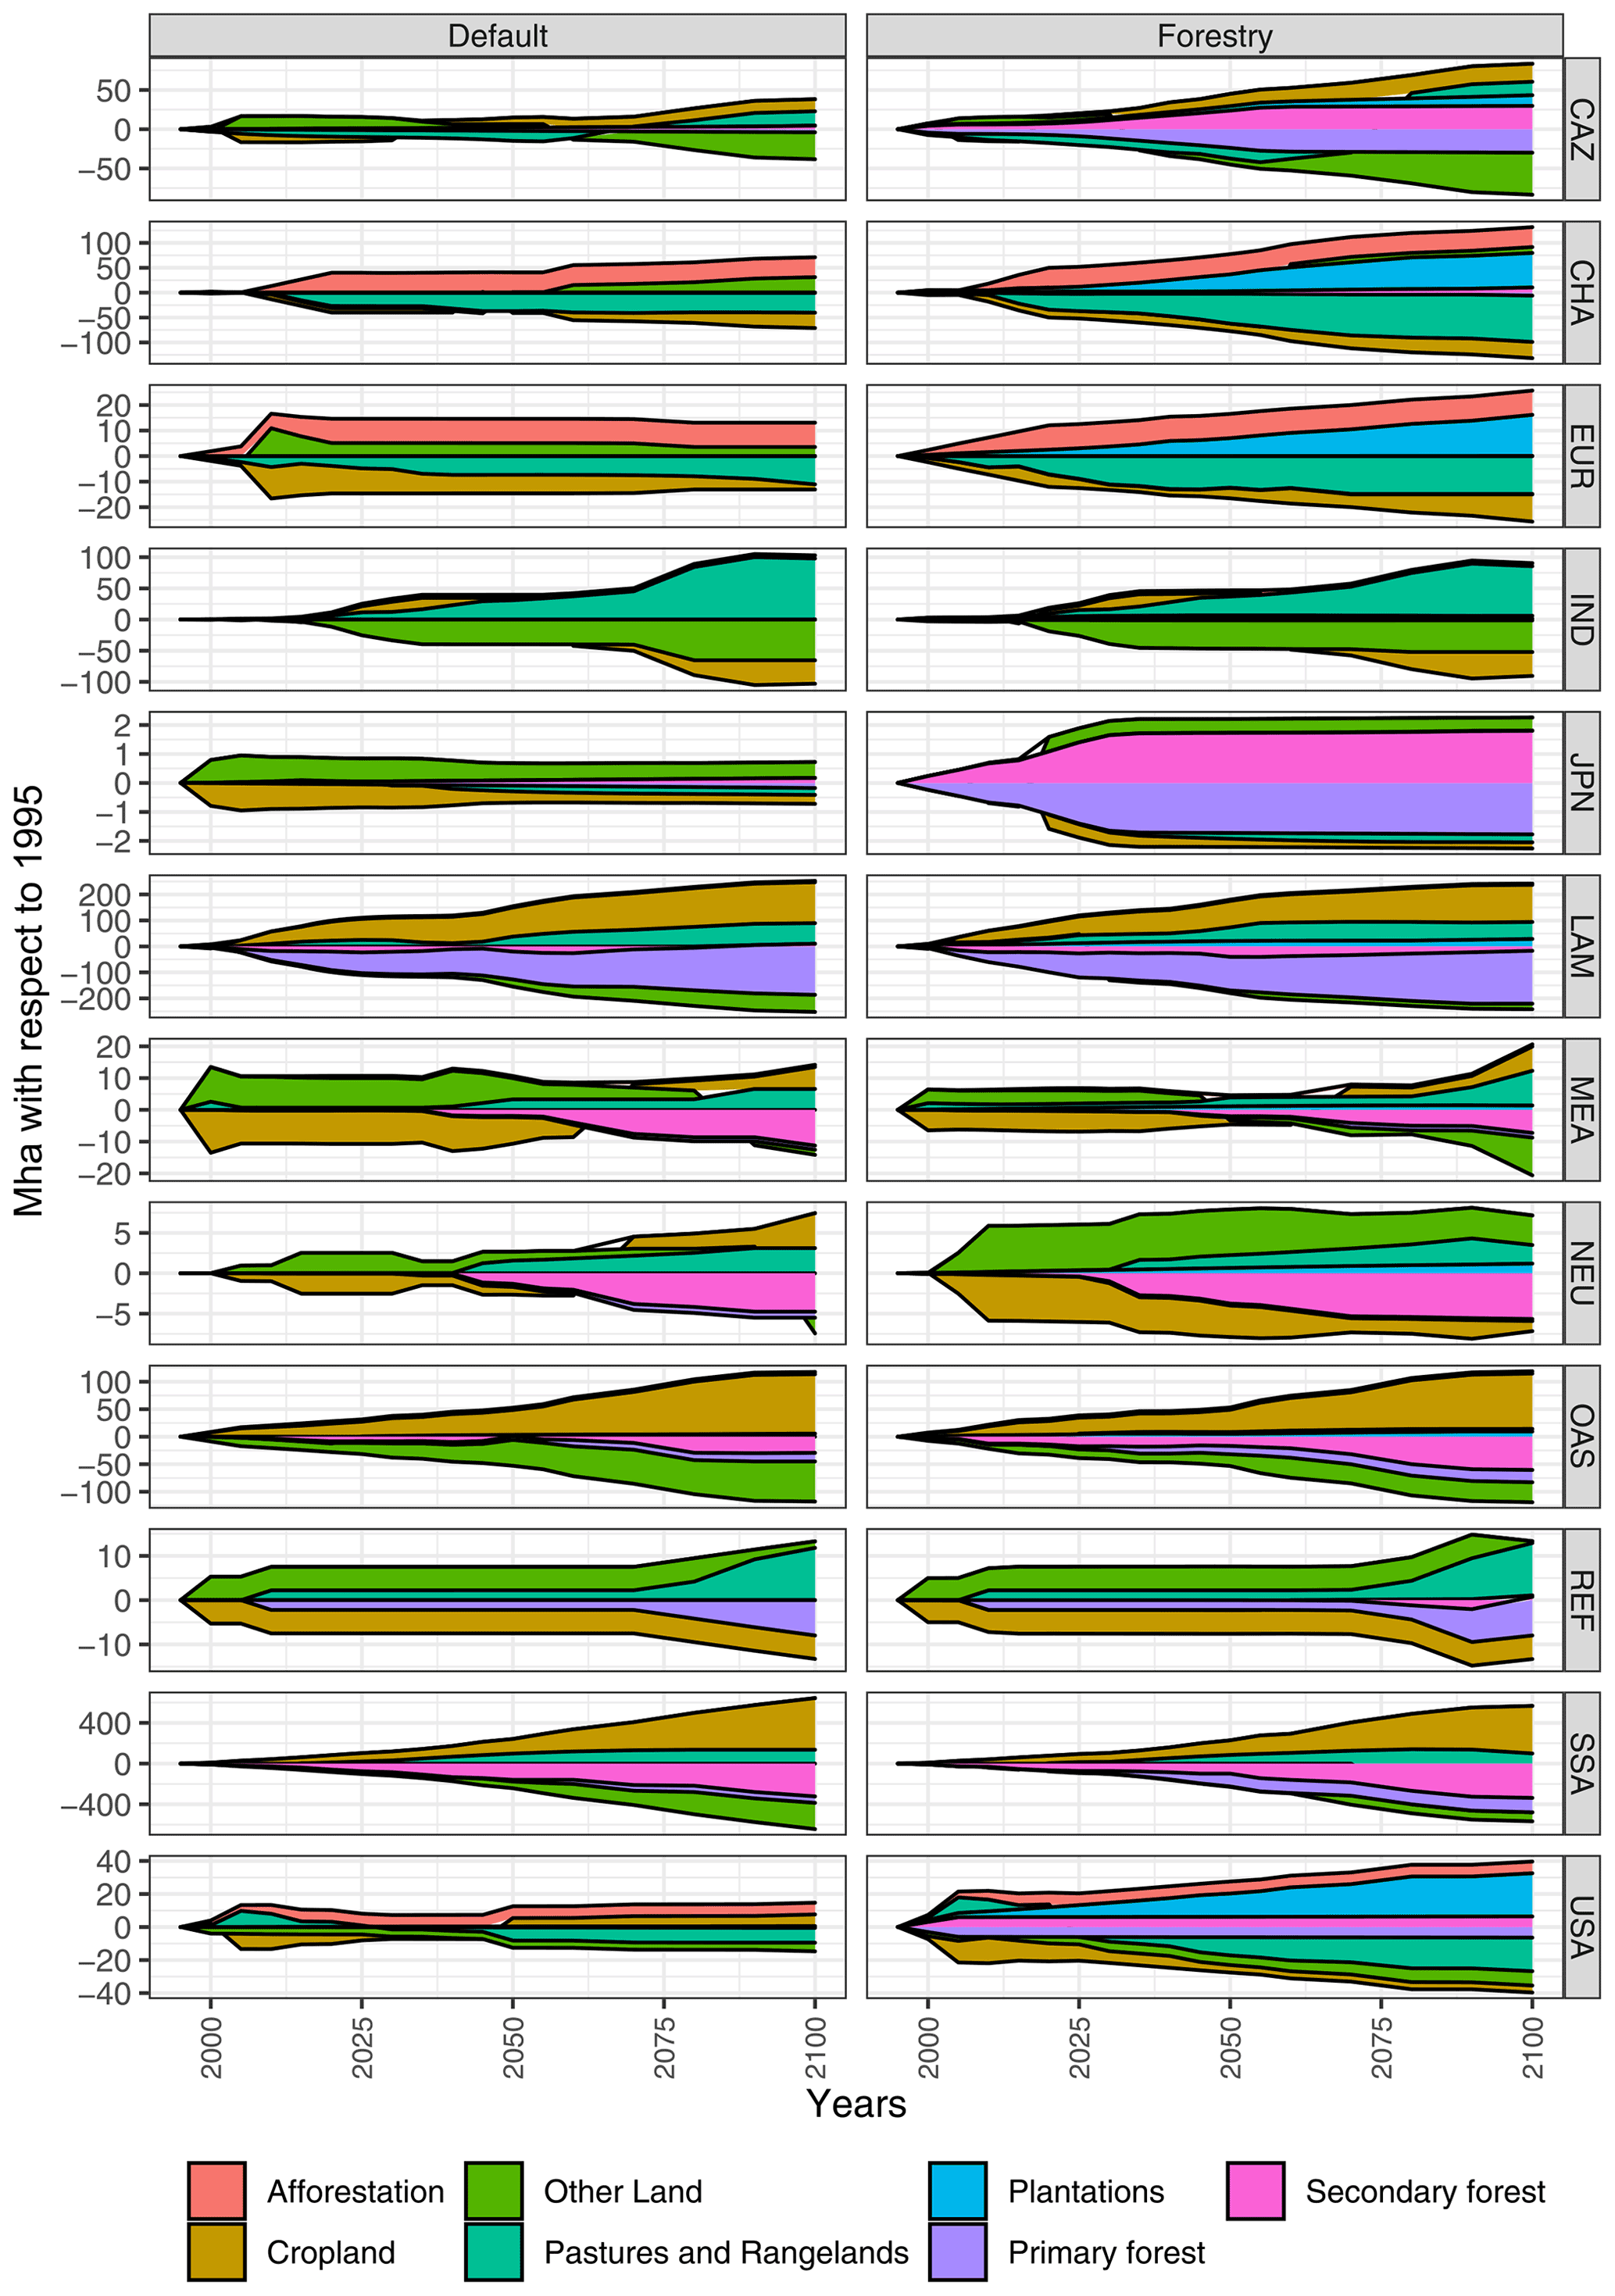
Figure A9Regional relative land-use change between 1995 and 2100 for the default and forestry scenarios. All values with respect to 1995 (in Mha).
Table A1ISO3 codes of countries belonging to standard MAgPIE regions.
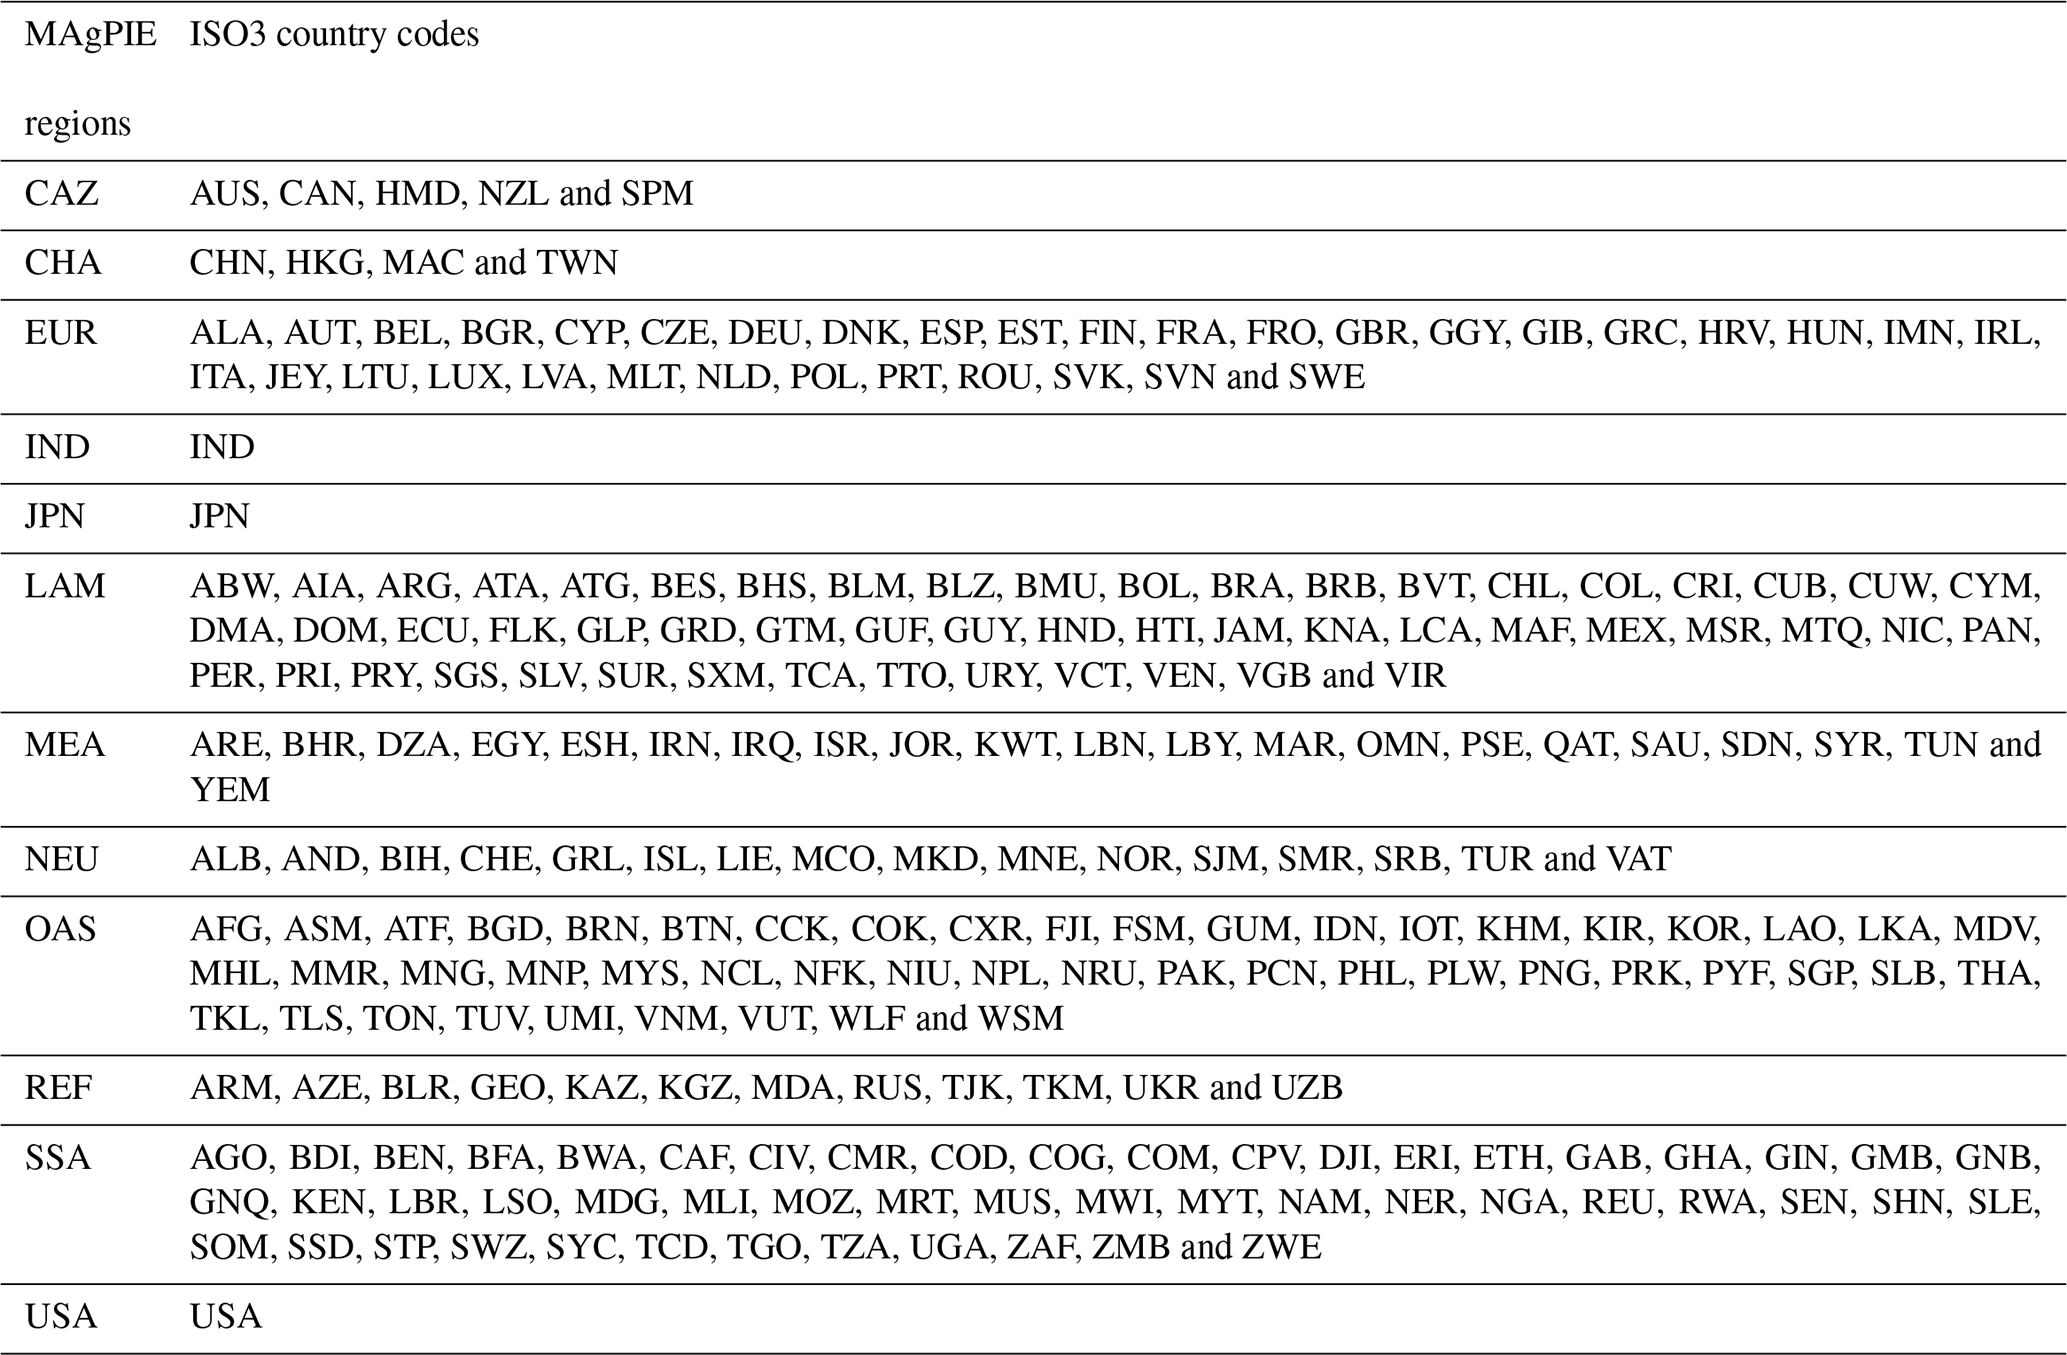
Table A2Interest rates used in MAgPIE for the determination of rotation lengths in plantations.
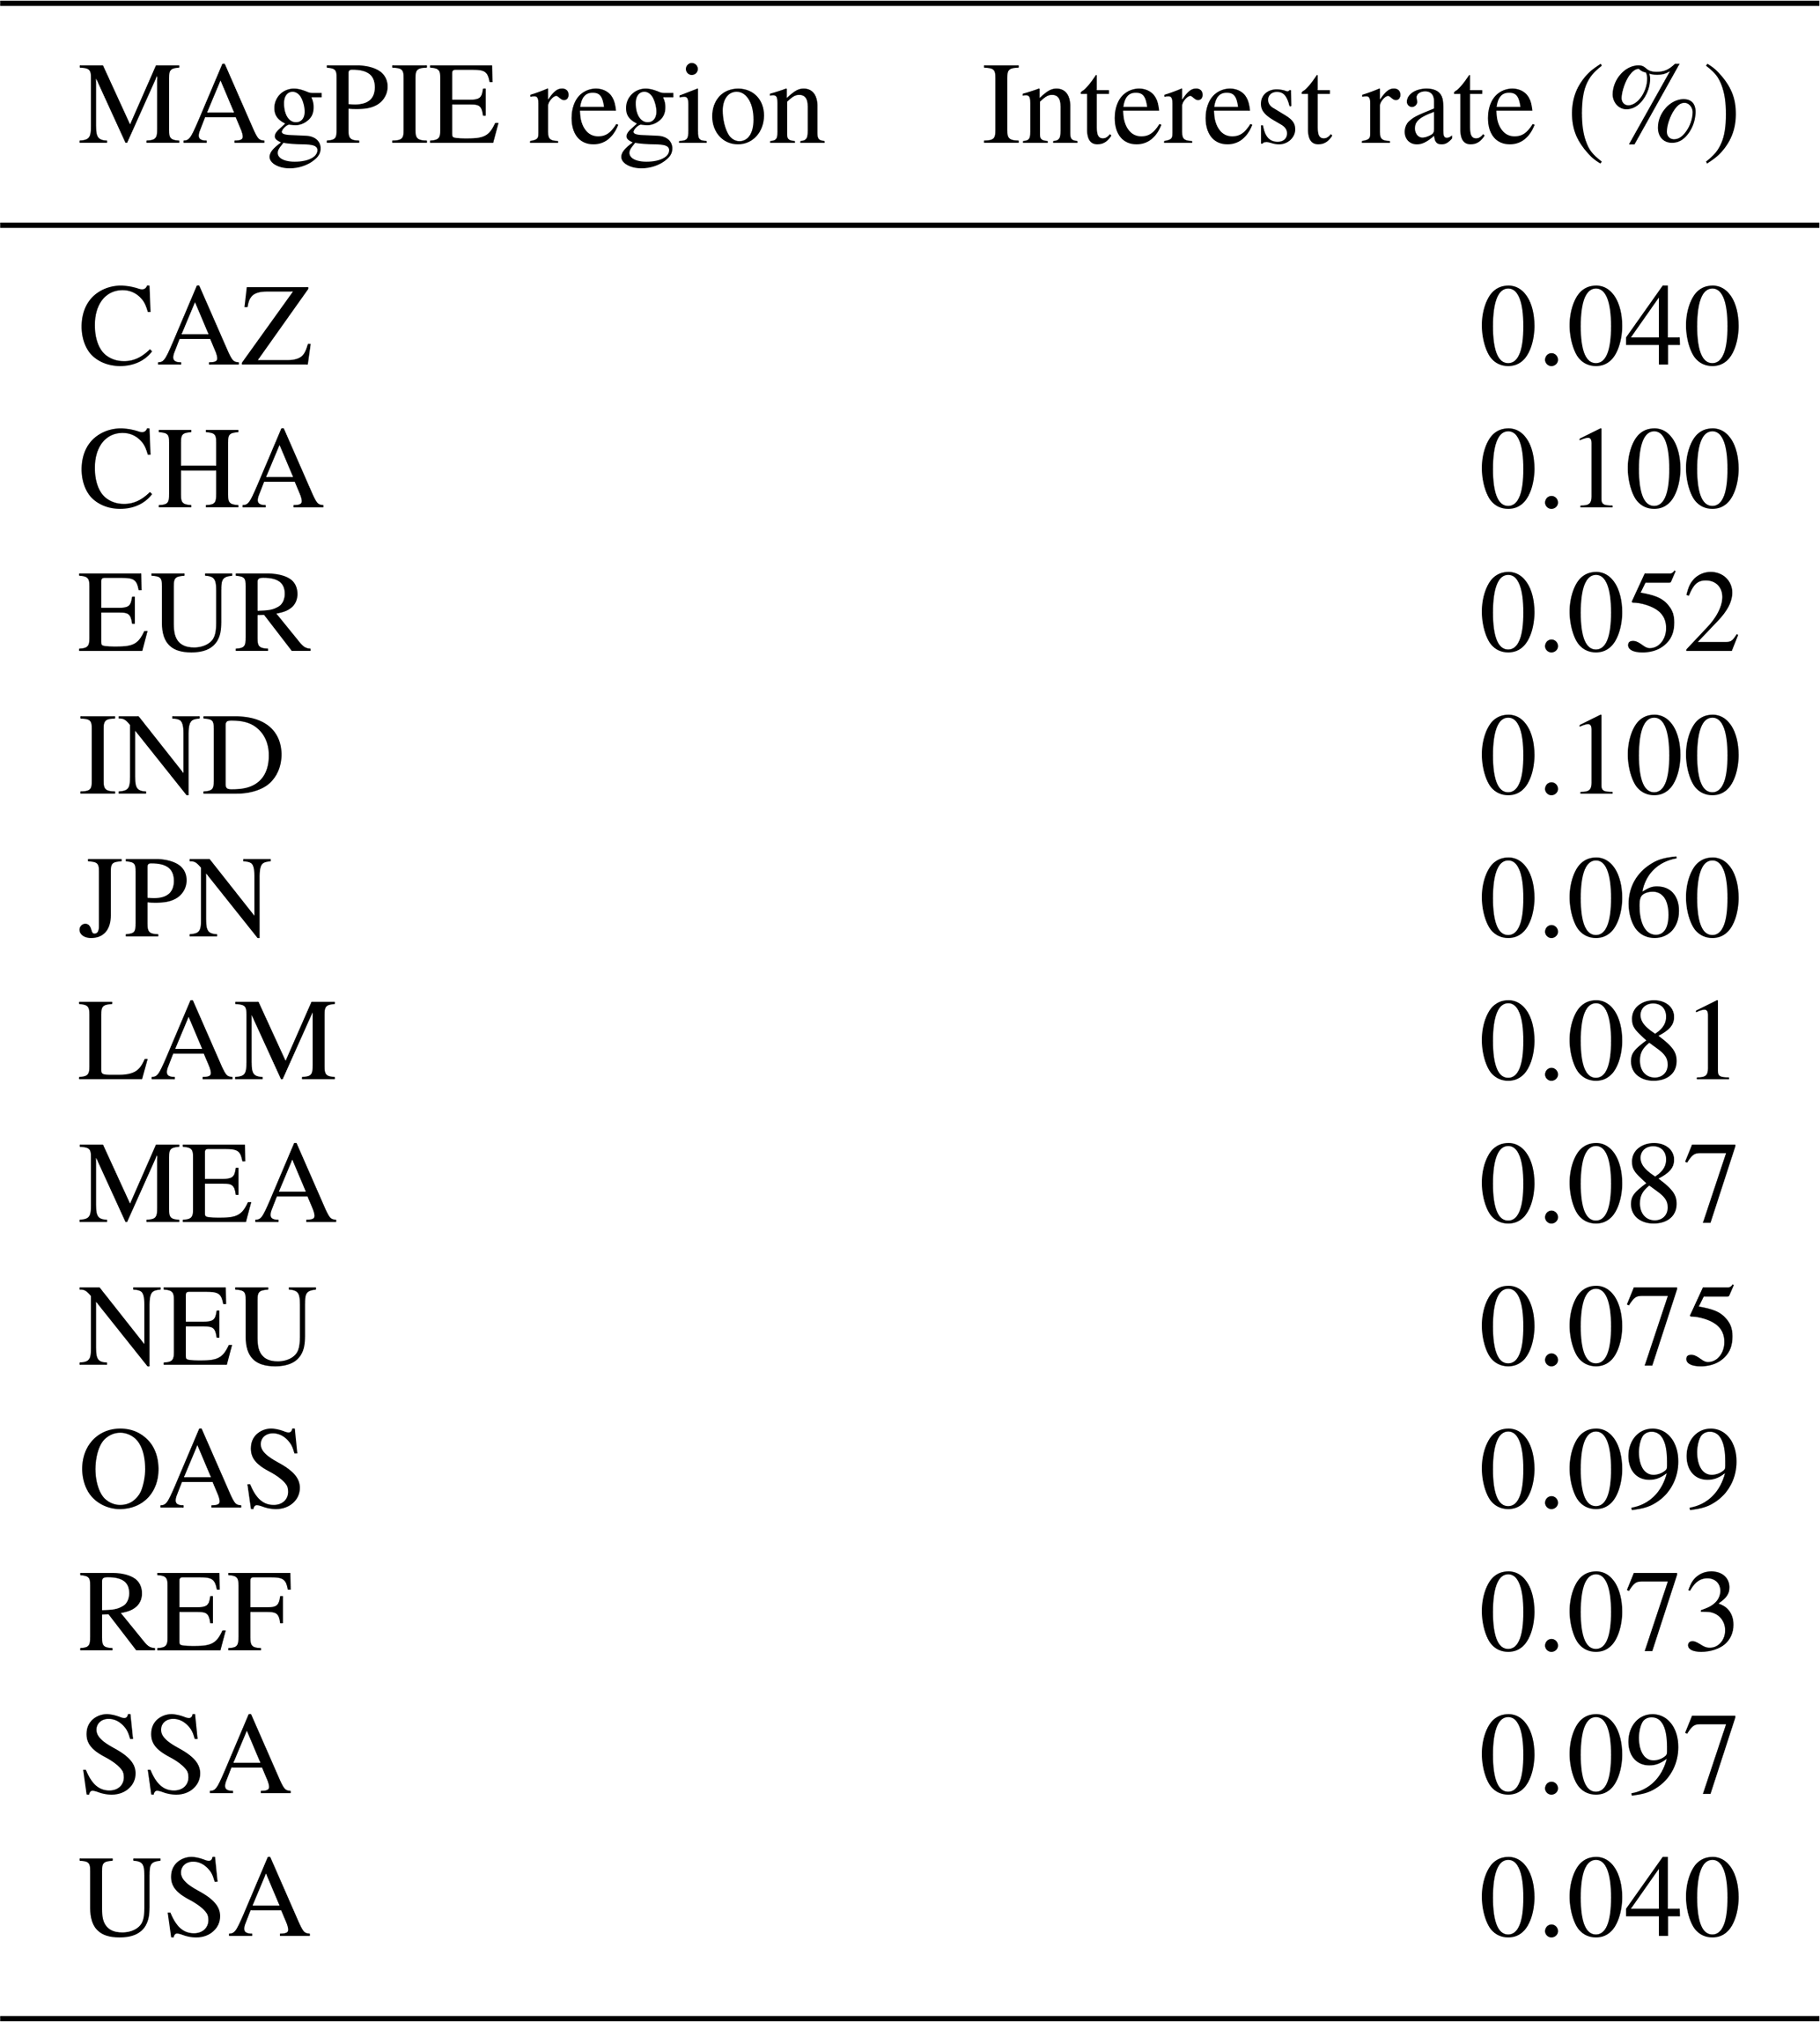
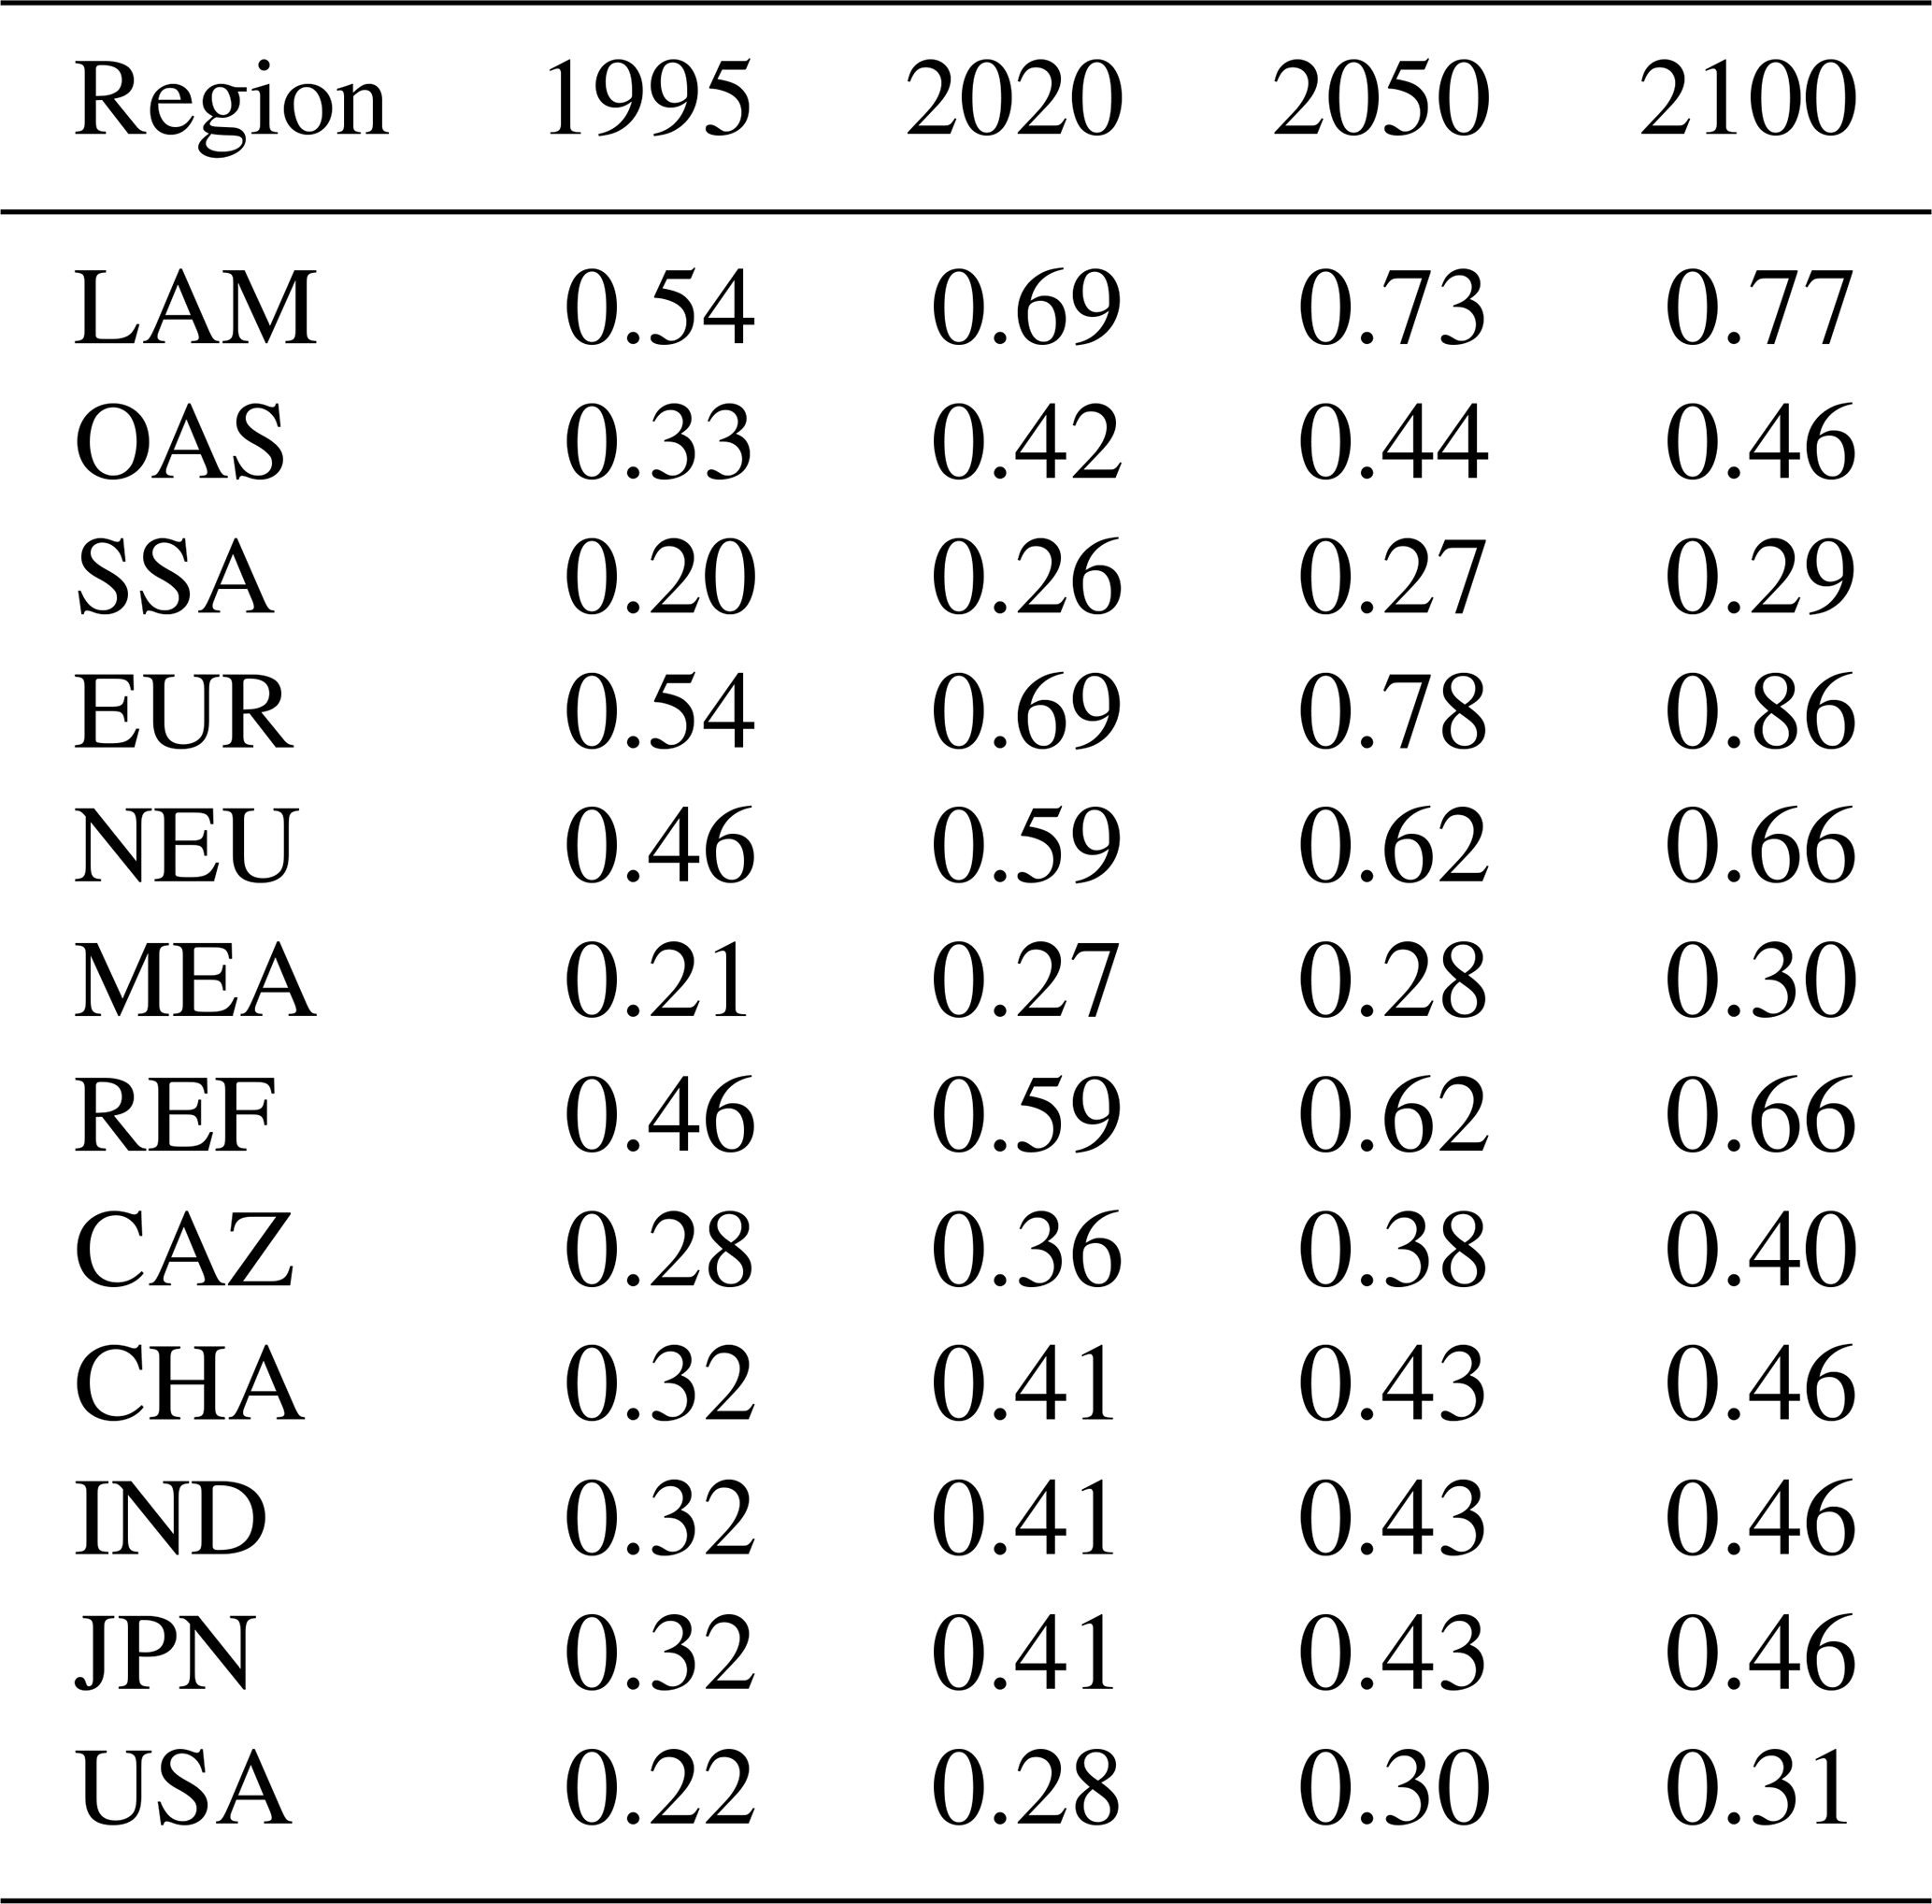
Table A3Self-sufficiency ratios in MAgPIE for industrial roundwood and wood fuel for 1995, 2020, 2050 and 2100.


The MAgPIE code is available under the GNU Affero General Public License as published by the Free Software Foundation, version 3 of the license or later (AGPLv3), via GitHub (https://github.com/magpiemodel/magpie, last access: 2 September 2021). MAgPIE release version v4.3.5, on which this paper is based, is available from Zenodo: https://doi.org/10.5281/zenodo.4231467 (Dietrich et al., 2020b). The technical model documentation is available from https://rse.pik-potsdam.de/doc/magpie/4.3.5/ (last access: 2 September 2021). The MAgPIE model results shown in this paper (including the model code) are archived on Zenodo (https://doi.org/10.5281/zenodo.5417474, Abhijeet and Humpenöder, 2021).
AM, FH and AP proposed and led this study. AM, FH and BLB wrote the original model extension for the forestry and natural vegetation and timber modules. AM, FH and JPD expanded the implementation of the drivers, demand, trade and carbon modules. FH, AP, JPD, BLB, CPOR, BS and HLC guided the model development. AM prepared the model input data. FH, JPD and BLB provided technical support for the development. FH, CPOR, JPD and BLB provided theoretical support for the development. AM carried out the model runs, processed the model output and produced the figures. AM and FH wrote the additional model documentation. AM, FH and JPD prepared the extended model for release. All authors contributed to the writing and editing process.
The contact author has declared that neither they nor their co-authors have any competing interests.
Publisher's note: Copernicus Publications remains neutral with regard to jurisdictional claims in published maps and institutional affiliations.
The authors thank FAOSTAT, World Bank and the SSP scenario modelers for the data provided, which act as major model drivers. We thank Benjamin Poulter (NASA), Kristine Karstens (PIK/HU Berlin, Germany), Felicitas Dorothea Beier (PIK/HU Berlin), Jens Heinke (PIK), Jonathan Doelman (PBL), Thomas Gasser (IIASA), Niklas Forsell (IIASA), Pekka Lauri (IIASA) and other colleagues at PIK for valuable discussions during the development of the modeling framework. The authors are also grateful for the constant support from the IT team managing the high-performance cluster (HPC) computers for scientific calculations at PIK.
We also acknowledge the Leibniz Association's Economic Growth Impacts of Climate Change (ENGAGE) project (grant no. SAW-2016-PIK-1), the Bundesministerium für Bildung und Forschung (BMBF) funded Pathways and Entry Points to Limit Global Warming to 1.5 ∘C (PEP1p5) project (grant no. 01LS1610A), BMBF (DE), BMWFW (AT), NWO (NL), FORMAS (SE) and the European-Union-funded project SENSES (grant no. 01LS1712A) as well as the BMBF-funded Deep Transformation Scenarios for Informing the Climate Policy Discourse (DIPOL) project (grant no. 01LA1809A), which funded the research work of Abhijeet Mishra.
Lastly, we thank Pekka Lauri and Walter Rossi Cervi for their critical reviews and valuable remarks, which led to significant improvements of the paper.
This research has been supported by the Bundesministerium für Bildung und Forschung (grant nos. 01LS1610A, 01LS1712A and 01LA1809A) and by the Leibniz Association's Economic Growth Impacts of Climate Change (ENGAGE) project (grant no. SAW-2016-PIK-1).
The publication of this article was funded by the Open Access Fund of the Leibniz Association.
This paper was edited by Daniel Huppmann and reviewed by Pekka Lauri and Walter Rossi Cervi.
Abhijeet, M. and Humpenöder, F.: MAgPIE v4.3.x model run outputs including dynamic forestry sector (Version 2), Zenodo [data set and code], https://doi.org/10.5281/zenodo.5417474, 2021. a
Amacher, G. S., Ollikainen, M., and Koskela, E.: Economics of forest resources, MIT Press, Cambridge, 2009. a, b, c, d, e
Biber, P., Felton, A., Nieuwenhuis, M., Lindbladh, M., Black, K., Bahýľ, J., Bingöl, Ö., Borges, J.G., Botequim, B., Brukas, V., and Bugalho, M. N: Forest Biodiversity, Carbon Sequestration, and Wood Production: Modelling Synergies and Trade-Offs for Ten Forest Landscapes across Europe, Frontiers in Ecology and Evolution, 8, p. 291, 2020. a
Bodirsky, B. L., Dietrich, J. P., Martinelli, E., Stenstad, A., Pradhan, P., Gabrysch, S., Mishra, A., Weindl, I., Le Mouël, C., Rolinski, S., and Baumstark, L.: The ongoing nutrition transition thwarts long-term targets for food security, public health and environmental protection, Sci. Rep.-UK, 10, 1–14, 2020. a
Bodirsky, B. L., Humpenoeder, F., Dietrich, J. P., Stevanovic, M., Weindl, I., Karstens, K., Wang, X., Mishra, A., Breier, J., Yalew, A. W., Chen, D., Biewald, A., Wirth, S., and von Jeetze, P.: magpie4: MAgPIE outputs R package for MAgPIE version 4.x, R package version 1.83.3, available at: https://github.com/pik-piam/magpie4, last access: 3 March 2021. a
Bonan, G. B. and Doney, S. C.: Climate, ecosystems, and planetary futures: The challenge to predict life in Earth system models, Science, 359, p. 533, 2018. a
Bondeau, A., Smith, P. C., Zaehle, S., Schaphoff, S., Lucht, W., Cramer, W., Gerten, D., Lotze-Campen, H., Müller, C., Reichstein, M., and Smith, B.: Modelling the role of agriculture for the 20th century global terrestrial carbon balance, Glob. Change Biol., 13, 679–706, 2007. a, b
Böttcher, H. and Reise, J.: The climate impact of forest and land management in the EU and the role of current reporting and accounting rules, Öko Institut, Berlin, 2020. a
Braakhekke, M. C., Doelman, J. C., Baas, P., Müller, C., Schaphoff, S., Stehfest, E., and van Vuuren, D. P.: Modeling forest plantations for carbon uptake with the LPJmL dynamic global vegetation model, Earth Syst. Dynam., 10, 617–630, https://doi.org/10.5194/esd-10-617-2019, 2019. a, b, c, d, e
Brockerhoff, E. G., Jactel, H., Parrotta, J. A., Quine, C. P., and Sayer, J.: Plantation forests and biodiversity: oxymoron or opportunity?, Biodivers. Conserv., 17, 925–951, 2008. a
Buotte, P. C., Law, B. E., Ripple, W. J., and Berner, L. T.: Carbon sequestration and biodiversity co-benefits of preserving forests in the western United States, Ecol. Appl., 30, e02039, https://doi.org/10.1002/eap.2039, 2020. a
Calvin, K., Patel, P., Clarke, L., Asrar, G., Bond-Lamberty, B., Cui, R. Y., Di Vittorio, A., Dorheim, K., Edmonds, J., Hartin, C., Hejazi, M., Horowitz, R., Iyer, G., Kyle, P., Kim, S., Link, R., McJeon, H., Smith, S. J., Snyder, A., Waldhoff, S., and Wise, M.: GCAM v5.1: representing the linkages between energy, water, land, climate, and economic systems, Geosci. Model Dev., 12, 677–698, https://doi.org/10.5194/gmd-12-677-2019, 2019. a, b, c
Crate, S., Ulrich, M., Habeck, J. O., Desyatkin, A. R., Desyatkin, R. V., Fedorov, A. N., Hiyama, T., Iijima, Y., Ksenofontov, S., Mészáros, C., and Takakura, H.: Permafrost livelihoods: A transdisciplinary review and analysis of thermokarst-based systems of indigenous land use, Anthropocene, 18, 89–104, 2017. a
Cubbage, F., Mac Donagh, P., Júnior, J. S., Rubilar, R., Donoso, P., Ferreira, A., Hoeflich, V., Olmos, V. M., Ferreira, G., Balmelli, G., and and Siry, J.: Timber investment returns for selected plantations and native forests in South America and the Southern United States, New Forest., 33, 237–255, 2007. a
Curtis, P. G., Slay, C. M., Harris, N. L., Tyukavina, A., and Hansen, M. C.: Classifying drivers of global forest loss, Science, 361, 1108–1111, 2018. a, b
Dietrich, J. P., Schmitz, C., Müller, C., Fader, M., Lotze-Campen, H., and Popp, A.: Measuring agricultural land-use intensity–A global analysis using a model-assisted approach, Ecol. Model., 232, 109–118, 2012. a
Dietrich, J. P., Popp, A., and Lotze-Campen, H.: Reducing the loss of information and gaining accuracy with clustering methods in a global land-use model, Ecol. Model., 263, 233–243, 2013. a
Dietrich, J. P., Bodirsky, B. L., Humpenöder, F., Weindl, I., Stevanović, M., Karstens, K., Kreidenweis, U., Wang, X., Mishra, A., Klein, D., Ambrósio, G., Araujo, E., Yalew, A. W., Baumstark, L., Wirth, S., Giannousakis, A., Beier, F., Chen, D. M.-C., Lotze-Campen, H., and Popp, A.: MAgPIE 4 – a modular open-source framework for modeling global land systems, Geosci. Model Dev., 12, 1299–1317, https://doi.org/10.5194/gmd-12-1299-2019, 2019. a, b, c, d, e, f, g
Dietrich, J. P., Bodirsky, B. L., Weindl, I., Humpenöder, F., Stevanovic, M., Kreidenweis, U., Wang, X., Karstens, K., Mishra, A., Beier, F. D., Molina Bacca, E. J., Klein, D., Ambrósio, G., Araujo, E., Biewald, A., Lotze-Campen, H., and Popp, A.: MAgPIE 4.3.0 Model Documentation, available at: https://rse.pik-potsdam.de/doc/magpie/4.3/index.htm (last access: 10 March 2021), Potsdam Institute for Climate Impact Research, Potsdam, Germany, 2020a. a, b
Dietrich, J. P., Bodirsky, B. L., Weindl, I., Humpenöder, F., Stevanovic, M., Kreidenweis, U., Wang, X., Karstens, K., Mishra, A., Beier, F. D., Molina Bacca, E. J., Klein, D., Ambrósio, G., Araujo, E., Biewald, A., Lotze-Campen, H., and Popp, A.: MAgPIE – An Open Source land-use modeling framework – Version 4.3.1, Zenodo [code]. https://doi.org/10.5281/zenodo.4231467, available at: https://github.com/magpiemodel/magpie (last access: 10 March 2021), 2020b. a, b, c
Doelman, J. C., Stehfest, E., Tabeau, A., van Meijl, H., Lassaletta, L., Gernaat, D. E., Hermans, K., Harmsen, M., Daioglou, V., Biemans, H., and van der Sluis, S.: Exploring SSP land-use dynamics using the IMAGE model: Regional and gridded scenarios of land-use change and land-based climate change mitigation, Global Environ. Chang., 48, 119–135, 2018. a, b
Doelman, J. C., Stehfest, E., van Vuuren, D. P., Tabeau, A., Hof, A. F., Braakhekke, M. C., Gernaat, D. E., van den Berg, M., van Zeist, W.-J., Daioglou, V., and van Meijl, H.: Afforestation for climate change mitigation: Potentials, risks and trade-offs, Glob. Change Biol., 26, 1576–1591, 2020. a
Drud, A.: GAMS/CONOPT4, ARKI Consulting and Development A/S, Bagsvaerd, Denmark, available at: https://www.gams.com/35/docs/S_CONOPT4.html (last access: 3 March 2021), 2015. a
FAO: Accounting for the benefits of forest resources: concepts and experience, Revised Report, Forestry Department Planning and Statistics Branch, Policy and Planning Division, FAO, Rome, Italy, 1997. a
FAO: Global planted forests thematic study, Results and Analysis, FAO, Rome, 2006. a, b
FAO: Guide for country reporting for FRA 2015, Food and Agriculture Organization of the United Nations, Rome, Italy, 2013. a, b
FAO: Global Forest Resources Assessment 2015, available at: http://www.fao.org/forest-resources-assessment/past-assessments/fra-2015/en/ (last access: 3 March 2021), FAO, Rome, Italy, 2015. a, b
FAO: Food and Agriculture Organization Corporate Statistical Database, data retrieved from FAOSTAT Forestry Indicators, available at: http://www.fao.org/faostat/en/#data/FO (last access: 3 March 2021), FAO, Rome, Italy, 2017. a, b, c, d
FAO: Global Forest Resources Assessment 2020: Main report, FAO, https://doi.org/10.4060/ca9825en, FAO, Rome, Italy, 2020a. a, b, c, d
FAO: Global Forest Resources Assessment 2020 – Key findings, https://doi.org/10.4060/ca8753en, FAO, Rome, Italy, 2020b. a, b, c, d, e
Foley, J. A., DeFries, R., Asner, G. P., Barford, C., Bonan, G., Carpenter, S. R., Chapin, F. S., Coe, M. T., Daily, G. C., Gibbs, H. K., and Helkowski, J. H.: Global consequences of land use, Science, 309, 570–574, 2005. a
GAMS, D. C.: The General Algebraic Modeling System, available at: https://www.gams.com/ (last access: 10 March 2021), GAMS Development Corp., Fairfax, USA, 2021. a
Gasser, T., Crepin, L., Quilcaille, Y., Houghton, R. A., Ciais, P., and Obersteiner, M.: Historical CO2 emissions from land use and land cover change and their uncertainty, Biogeosciences, 17, 4075–4101, https://doi.org/10.5194/bg-17-4075-2020, 2020. a, b, c, d
Gibson, L., Lee, T. M., Koh, L. P., Brook, B. W., Gardner, T. A., Barlow, J., Peres, C. A., Bradshaw, C. J., Laurance, W. F., Lovejoy, T. E., and Sodhi, N. S.: Primary forests are irreplaceable for sustaining tropical biodiversity, Nature, 478, 378–381, 2011. a
Gütschow, J., Jeffery, M. L., Gieseke, R., Gebel, R., Stevens, D., Krapp, M., and Rocha, M.: The PRIMAP-hist national historical emissions time series, Earth Syst. Sci. Data, 8, 571–603, https://doi.org/10.5194/essd-8-571-2016, 2016. a, b
Havlík, P., Schneider, U. A., Schmid, E., Böttcher, H., Fritz, S., Skalskỳ, R., Aoki, K., De Cara, S., Kindermann, G., Kraxner, F., and Leduc, S.: Global land-use implications of first and second generation biofuel targets, Energ. Policy, 39, 5690–5702, 2011. a, b, c, d
Houghton, R. A., House, J. I., Pongratz, J., van der Werf, G. R., DeFries, R. S., Hansen, M. C., Le Quéré, C., and Ramankutty, N.: Carbon emissions from land use and land-cover change, Biogeosciences, 9, 5125–5142, https://doi.org/10.5194/bg-9-5125-2012, 2012. a, b
Humpenöder, F., Popp, A., Dietrich, J. P., Klein, D., Lotze-Campen, H., Bonsch, M., Bodirsky, B. L., Weindl, I., Stevanovic, M., and Müller, C.: Investigating afforestation and bioenergy CCS as climate change mitigation strategies, Environ. Res. Lett., 9, 064029, https://doi.org/10.1088/1748-9326/9/6/064029, 2014. a, b, c, d
Humpenöder, F., Popp, A., Bodirsky, B. L., Weindl, I., Biewald, A., Lotze-Campen, H., Dietrich, J. P., Klein, D., Kreidenweis, U., Müller, C., and Rolinski, S: Large-scale bioenergy production: how to resolve sustainability trade-offs?, Environ. Res. Lett., 13, 024011, https://doi.org/10.1088/1748-9326/aa9e3b, 2018. a
Hurtt, G. C., Chini, L., Sahajpal, R., Frolking, S., Bodirsky, B. L., Calvin, K., Doelman, J. C., Fisk, J., Fujimori, S., Klein Goldewijk, K., Hasegawa, T., Havlik, P., Heinimann, A., Humpenöder, F., Jungclaus, J., Kaplan, J. O., Kennedy, J., Krisztin, T., Lawrence, D., Lawrence, P., Ma, L., Mertz, O., Pongratz, J., Popp, A., Poulter, B., Riahi, K., Shevliakova, E., Stehfest, E., Thornton, P., Tubiello, F. N., van Vuuren, D. P., and Zhang, X.: Harmonization of global land use change and management for the period 850–2100 (LUH2) for CMIP6, Geosci. Model Dev., 13, 5425–5464, https://doi.org/10.5194/gmd-13-5425-2020, 2020. a, b, c
IIASA: SSP Database (version 2.0), Tech. rep., available at: https://tntcat.iiasa.ac.at/SspDb/dsd?Action=htmlpage&page=10 (last access: 21 October 2021), International Institute for Applied Systems Analysis, Laxenburg, 2018. a
IPCC: 2006 IPCC guidelines for national greenhouse gas inventories, Intergovernmental Panel on Climate Change, Geneva, Switzerland, 2006. a, b
IPCC: Refinement To the 2006 IPCC Guidelines for National Greenhouse Gas Inventories, Intergovernmental Panel on Climate Change, Geneva, Switzerland, 2019. a, b, c, d, e
Jia, G., Shevliakova, E., Artaxo, P., De Noblet-Ducoudré, N., Houghton, R., House, J., Kitajima, K., Lennard, C., Popp, A., Sirin, A., and Sukumar, R.: Land–Climate Interactions. Climate Change and Land: An IPCC Special Report on Climate Change, Desertification, Land Degradation, Sustainable Land Management, Food Security, and Greenhouse Gas Fluxes in Terrestrial Ecosystems, food security, and greenhouse gas fluxes in terrestrial ecosystems, Intergovernmental Panel on Climate Change, Geneva, Switzerland, pp. 1–186, 2019. a
Johnston, C. M. and Radeloff, V. C.: Global mitigation potential of carbon stored in harvested wood products, P. Natl. Acad. Sci. USA, 116, 14526–14531, 2019. a, b, c, d
JRC and PBL: Emission Database for Global Atmospheric Research (EDGAR), Tech. rep., European Commission, Brussels, Belgium, 2010. a, b
Jürgensen, C., Kollert, W., and Lebedys, A.: Assessment of Industrial Roundwood Production from Planted Forests. Planted Forests and Trees Working Paper Series, No, Tech. rep., FP/48/E, The Food and Agricultural Organization of the United Nations (FAO), Rome, Italy, 2014. a, b
Kallio, A. M. I., Moiseyev, A., and Solberg, B.: The global forest sector model EFI-GTM–the model structure, European Forest Institute-Internal Report, 15, 2004. a, b, c
Kindermann, G. E., Obersteiner, M., Rametsteiner, E., and McCallum, I.: Predicting the deforestation-trend under different carbon-prices, Carbon Balance and Management, 1, 1–17, 2006. a, b
Latta, G. S., Sjølie, H. K., and Solberg, B.: A review of recent developments and applications of partial equilibrium models of the forest sector, J. Forest Econ., 19, 350–360, 2013. a
Lauk, C., Haberl, H., Erb, K.-H., Gingrich, S., and Krausmann, F.: Global socioeconomic carbon stocks in long-lived products 1900–2008, Environ. Res. Lett., 7, 034023, https://doi.org/10.1088/1748-9326/7/3/034023, 2012. a
Lauri, P., Forsell, N., Gusti, M., Korosuo, A., Havlík, P., and Obersteiner, M.: Global woody biomass harvest volumes and forest area use under different SSP-RCP scenarios, J. Forest Econ., 34, 285–309, 2019. a, b, c
Lotze-Campen, H., Müller, C., Bondeau, A., Rost, S., Popp, A., and Lucht, W.: Global food demand, productivity growth, and the scarcity of land and water resources: a spatially explicit mathematical programming approach, Agr. Econ., 39, 325–338, 2008. a, b
Luyssaert, S., Jammet, M., Stoy, P. C., Estel, S., Pongratz, J., Ceschia, E., Churkina, G., Don, A., Erb, K., Ferlicoq, M., and Gielen, B.: Land management and land-cover change have impacts of similar magnitude on surface temperature, Nat. Clim. Change, 4, 389–393, 2014. a
MacDicken, K. G.: Global forest resources assessment 2015: what, why and how?, Forest Ecol. Manag., 352, 3–8, 2015. a
Moomaw, W. R., Law, B. E., and Goetz, S. J.: Focus on the role of forests and soils in meeting climate change mitigation goals: summary, Environ. Res. Lett., 15, 045 009, 2020. a
Morland, C., Schier, F., Janzen, N., and Weimar, H.: Supply and demand functions for global wood markets: specification and plausibility testing of econometric models within the global forest sector, Forest Policy Econ., 92, 92–105, 2018. a, b
Oswalt, S. N., Smith, W. B., Miles, P. D., and Pugh, S. A.: Forest resources of the United States, 2017: A technical document supporting the Forest Service 2020 RPA Assessment, Gen. Tech. Rep. WO-97, US Department of Agriculture, Forest Service, Washington Office, Washington, DC, 97, 2019. a
Payn, T., Carnus, J.-M., Freer-Smith, P., Kimberley, M., Kollert, W., Liu, S., Orazio, C., Rodriguez, L., Silva, L. N., and Wingfield, M. J.: Changes in planted forests and future global implications, Forest Ecol. Manag., 352, 57–67, 2015. a
Phillips, H. R., Newbold, T., and Purvis, A.: Land-use effects on local biodiversity in tropical forests vary between continents, Biodivers. Conserv., 26, 2251–2270, 2017. a, b
Pokharel, R., Grala, R. K., Grebner, D. L., and Grado, S. C.: Factors affecting utilization of woody residues for bioenergy production in the southern United States, Biomass Bioenerg., 105, 278–287, 2017. a
Popp, A., Lotze-Campen, H., and Bodirsky, B.: Food consumption, diet shifts and associated non-CO2 greenhouse gases from agricultural production, Global Environ. Chang., 20, 451–462, 2010. a
Poulter, B., Aragão, L., Andela, N., Bellassen, V., Ciais, P., Kato, T., Lin, X., Nachin, B., Luyssaert, S., Pederson, N., and Peylin, P.: The global forest age dataset and its uncertainties (GFADv1. 1), NASA National Aeronautics and Space Administration, PANGAEA [data set], https://doi.org/10.1594/PANGAEA.889943, 2019. a, b
Pöyry, C. J.: Global Outlook for Plantations, ABARE Research Report, Australian Bureau of Agricultural and Resource Economics, Canberra, Australia, 99, 1999. a, b
Ravindranath, N. H. and Ostwald, M.: Carbon inventory methods: handbook for greenhouse gas inventory, carbon mitigation and roundwood production projects, vol. 29, Springer Science & Business Media, Heidelberg, Germany, 2007. a
Reid, W. V., Chen, D., Goldfarb, L., Hackmann, H., Lee, Y.-T., Mokhele, K., Ostrom, E., Raivio, K., Rockström, J., Schellnhuber, H. J., and Whyte, A.: Earth system science for global sustainability: grand challenges, Science, 330, 916–917, 2010. a
Riahi, K., Van Vuuren, D. P., Kriegler, E., Edmonds, J., O'neill, B. C., Fujimori, S., Bauer, N., Calvin, K., Dellink, R., Fricko, O., and Lutz, W.: The shared socioeconomic pathways and their energy, land use, and greenhouse gas emissions implications: an overview, Global Environ. Chang., 42, 153–168, 2017. a
Ruane, A. C. and Rosenzweig, C.: Climate Change Impacts on Agriculture: Challenges, Opportunities, and AgMIP Frameworks for Foresight, NASA Scientific and Technical Information Program, Virginia, USA, 2018. a
Rubel, F. and Kottek, M.: Observed and projected climate shifts 1901–2100 depicted by world maps of the Köppen-Geiger climate classification, Meteorol. Z., 19, 135–141, 2010. a
Siry, J. P., Cubbage, F. W., Potter, K. M., and McGinley, K.: Current perspectives on sustainable forest management: North America, Current Forestry Reports, 4, 138–149, 2018. a
Smith, P., Clark, H., Dong, H., Elsiddig, E., Haberl, H., Harper, R., House, J., Jafari, M., Masera, O., Mbow, C., and Ravindranath, N. H.: Agriculture, forestry and other land use (AFOLU), Climate Change 2014: Mitigation of Climate Change, IPCC Working Group III Contribution to AR5, Cambridge University Press, Cambridge, United Kingdom and New York, NY, USA, 2014. a
Snyder, A., Calvin, K., Clarke, L., Edmonds, J., Kyle, P., Narayan, K., Di Vittorio, A., Waldhoff, S., Wise, M., and Patel, P.: The domestic and international implications of future climate for US agriculture in GCAM, PloS one, 15, e0237918, 2020. a
Sohngen, B., Mendelsohn, R., and Sedjo, R.: Forest management, conservation, and global timber markets, Am. J. Agr. Econ., 81, 1–13, 1999. a, b
Standard, G.: Afforestation-reforestation requirements, The Gold Standard, Geneva, Switzerland, 2013. a
Stehfest, E., van Vuuren, D., Bouwman, L., and Kram, T.: Integrated assessment of global environmental change with IMAGE 3.0: Model description and policy applications, Netherlands Environmental Assessment Agency (PBL), PBL Netherlands Environmental Assessment Agency, The Hague, NL, 2014. a, b
Stehfest, E., van Zeist, W.-J., Valin, H., Havlik, P., Popp, A., Kyle, P., Tabeau, A., Mason-D'Croz, D., Hasegawa, T., Bodirsky, B. L., and Calvin, K.: Key determinants of global land-use projections, Nat. Commun., 10, 1–10, 2019. a
Thuiller, W., Münkemüller, T., Lavergne, S., Mouillot, D., Mouquet, N., Schiffers, K., and Gravel, D.: A road map for integrating eco-evolutionary processes into biodiversity models, Ecol. Lett., 16, 94–105, 2013. a
UNESCO: World Database on Protected Areas WDPA, UNEP-WCMC, Cambridge, UK, 2011. a
Urban, M. C., Bocedi, G., Hendry, A. P., Mihoub, J.-B., Pe'er, G., Singer, A., Bridle, J., Crozier, L., De Meester, L., Godsoe, W., and Gonzalez, A.: Improving the forecast for biodiversity under climate change, Science, 353, https://doi.org/10.1126/science.aad8466, 2016. a
van de Ven, D.-J., Capellan-Peréz, I., Arto, I., Cazcarro, I., de Castro, C., Patel, P., and Gonzalez-Eguino, M.: The potential land requirements and related land use change emissions of solar energy, Sci. Rep.-UK, 11, 1–12, 2021. a
Verhagen, W., van der Zanden, E. H., Strauch, M., van Teeffelen, A. J., and Verburg, P. H.: Optimizing the allocation of agri-environment measures to navigate the trade-offs between ecosystem services, biodiversity and agricultural production, Environ. Sci. Policy, 84, 186–196, 2018. a
Waring, B., Neumann, M., Prentice, I. C., Adams, M., Smith, P., and Siegert, M.: Forests and Decarbonization–Roles of Natural and Planted Forests, Frontiers in Forests and Global Change, 3, 58, 2020. a
Wise, M., Calvin, K., Kyle, P., Luckow, P., and Edmonds, J.: Economic and physical modeling of land use in GCAM 3.0 and an application to agricultural productivity, land, and terrestrial carbon, Climate Change Economics, 5, 1450003, https://doi.org/10.1142/S2010007814500031, 2014. a, b
Zhang, X., Chen, J., Dias, A. C., and Yang, H.: Improving Carbon Stock Estimates for In-Use Harvested Wood Products by Linking Production and Consumption–A Global Case Study, Environ. Sci. Technol., 54, 2565–2574, 2020. a
The requested paper has a corresponding corrigendum published. Please read the corrigendum first before downloading the article.
- Article
(10793 KB) - Full-text XML