the Creative Commons Attribution 4.0 License.
the Creative Commons Attribution 4.0 License.
 | 18 Oct 2021
A micro-genetic algorithm (GA v1.7.1a) for combinatorial optimization of physics parameterizations in the Weather Research and Forecasting model (v4.0.3) for quantitative precipitation forecast in Korea
Sojung Park
One of the biggest uncertainties in numerical weather predictions (NWPs) comes from treating the subgrid-scale physical processes. For more accurate regional weather and climate prediction by improving physics parameterizations, it is important to optimize a combination of physics schemes and unknown parameters in NWP models. We have developed an interface system between a micro-genetic algorithm (µ-GA) and the WRF model for the combinatorial optimization of cumulus (CU), microphysics (MP), and planetary boundary layer (PBL) schemes in terms of quantitative precipitation forecast for heavy rainfall events in Korea. The µ-GA successfully improved simulated precipitation despite the nonlinear relationship among the physics schemes. During the evolution process, MP schemes control grid-resolving-scale precipitation, while CU and PBL schemes determine subgrid-scale precipitation. This study demonstrates that the combinatorial optimization of physics schemes in the WRF model is one possible solution to enhance the forecast skill of precipitation.
- Article
(4713 KB) - Full-text XML
- BibTeX
- EndNote


For numerical weather forecasting to be accurate, a numerical model should be able to represent real atmospheric conditions in terms of dynamics (i.e., governing equations), physics (i.e., parameterizations), and numerics (e.g., resolution and coordinate system). More accurate initial conditions should also be provided. One of the biggest uncertainties in numerical weather predictions (NWPs) comes from treating the subgrid-scale physical processes that have not been sufficiently understood. The subgrid-scale physical processes are parameterized in NWP models through empirical evidence, such as the derived value from observations and/or theoretical backgrounds. Therefore, the accuracy of physics parameterizations strongly depends on the following: the value of parameters in given uncertainty ranges in parameterization schemes and the choice of parameterization schemes for each corresponding physical process. Note that prior to model simulation the unknown parameters and schemes should be fitted to the regional weather and climate to reduce considerable uncertainties in models.
NWP models have several categories of subgrid-scale physical processes – shortwave and longwave radiation transfer, cumulus (CU), microphysics (MP), planetary boundary layer (PBL), and land surface processes, among others. In general, a model consists of a determined physics package, such as the Unified Model (UM) (Cullen, 1993; Brown et al., 2012), the Global Forecast System (GFS), and the Korean Integrated Model (KIM) (Hong et al., 2018), whereas some models, such as the Weather Research and Forecasting (WRF) model and the community Noah land surface model (LSM) with multiparameterization options (Noah-MP) (Niu et al., 2011), have each physical category with several optional parameterization schemes so that users can select the schemes.
Sensitivity experiments of the WRF model to physical parameterization schemes in simulating rainfall systems have been conducted (e.g., Crétat et al., 2012; Cohen et al., 2015; Evans et al., 2012; Song and Sohn, 2018). Cohen et al. (2015) introduced the various PBL schemes employed by the WRF model and examined sensitivity to PBL schemes in simulating cold season severe weather events occurring in the southeastern United States. Evans et al. (2012) explore the performance of various combinations of PBL, CU, MP, and radiation schemes for rainfall events near east coast lows. They suggest that the Mellor–Yamada–Janjic PBL scheme and the Betts–Miller–Janjic CU scheme can be selected in this region with some robustness.
Previous studies on numerical weather and climate prediction models have manually examined one or several suitable schemes for rainfall events as a sensitivity test; hence, not all schemes can be investigated – only selected combinations of schemes. This is because it takes a lot of computer resources and time to conduct sensitivity tests with all physics schemes. However, in addition to model development, all physics schemes need to be explored to simulate more accurate local weather and climate systems. Combinatorial optimization for a system or model configuration has been applied to the water distribution system (Behzadian et al., 2009; Gupta et al., 1999; Simpson et al., 1994; Weng and Liaw, 2005), groundwater monitoring design (Babbar-Sebens and Minsker, 2010), and multi-reservoir operation (Chen et al., 2017). Many algorithms have been developed for combinatorial optimization such as simplex, integer programming, simulated annealing, and genetic algorithm (GA).
In weather and climate prediction models, most applications of GA have focused on the optimization of empirical parameters in the model to fit the modeled properties (e.g., precipitation) to observed counterparts (e.g., Lee et al., 2006; Yu et al., 2013). However, in this study, we created a micro-GA–WRF (µ-GA–WRF) interface to seek an optimal set of CU, MP, and PBL schemes in the WRF model for rainfall events in terms of quantitative precipitation forecast (QPF). The µ-GA–WRF interface system is designed to automatically extract the optimal scheme combination from physics options in the WRF model. The present study attempts to find the optimal combination of parameterization schemes, which is a new and challenging task. This paper is organized as follows: Sect. 2 illustrates the background of combinatorial optimization; Sect. 3 explains the data and method, including the µ-GA–WRF interface system; a case study is presented in Sect. 4; and Sect. 5 contains concluding remarks.
To select a suitable optimization algorithm, we should consider the characteristics of objective functions, control variables, and optimization problems. Jamil and Yang (2013) reviewed and compiled benchmark functions found from all the available literature for global optimization problems. They focused on the diverse properties of objective functions such as continuity, linearity, modality, separability, and dimensionality. In terms of combinatorial optimization, control variables can be discretized and indexed values, and the value of the control variable itself can be meaningless. These discrete control variables make the solution space of the cost function discontinuous. Therefore, it is important to choose an algorithm that can handle these properties.
The GA as an evolutionary algorithm is based on the natural selection of genes (i.e., parameters in the algorithm) to search for the optimum. Research has adopted the GA to solve network system design optimization problems with a growing trend from the end of the 20th century (e.g., Simpson et al., 1994; Halhal et al., 1997; Savic and Walters, 1997; Pilar et al., 1999; Dandy et al., 2001). Gupta et al. (1999) emphasized the fact that the GA has advantages of using discrete variables for optimization and having an insensitive initial solution (i.e., robustness in the initial solution). Azadivar and Tompkins (1999) applied the GA approach to optimize qualitative variables (e.g., structural design) in a manufacturing system as simulation optimization. The GA coupled with a simulation model generator searches for the different combinations of design configurations and evaluates the simulations. Gupta et al. (1999) show that the GA provided a lower cost design of water distribution networks (e.g., pipe networks) compared to the nonlinear programming technique. Weng and Liaw (2005) established a combinatorial optimization model, called the Sewer System Optimization Model for Layout & Hydraulics, to optimize cost-effective designs for an urban sewer system. Better alternate network layouts were created more productively by applying the GA. Davis et al. (2019) optimized a malaria model with the GA by clustering locations based on the relationships between malaria and environmental drivers (e.g., temperature, precipitation, and vegetation index). To predict environmentally driven malaria outbreaks across a heterogeneous region, the GA optimized the number of clusters and the environmental predictors for the districts in each cluster in the malaria model.
Furthermore, the GA was applied for combinatorial optimization to the Noah-Multiparameterization (Noah-MP) land surface model (LSM), which can be coupled with the numerical weather prediction model (e.g., WRF model), in Hong et al. (2014). Noah-MP was augmented with multiple physics options for 10 different land surface processes such as phenology, snow, and groundwater (Niu et al., 2011). Hong et al. (2014) performed scheme-based model optimizations in simulating evapotranspiration and runoff (i.e., water balance) in Noah-MP over the Han River basin in South Korea. In addition, they showed a potential advantage of the Noah-MP and GA coupled system to model diagnosis – the evolutionary process provides information on the sensitivity and interrelationship of physics schemes with regard to further model calibrations and improvements. Hong et al. (2015) further evaluated the applicability of the coupling system of micro-GA (i.e., an efficient version of GA; µ-GA) and Noah-MP to larger and multiple regions in East Asia.
The GA does not perform a random search of the extrema, but performs a gradual search toward the extrema. However, it does not directly use gradient information on an objective function, but instead mimics the evolutionary method to quickly reach the global optima. The gradual search is based on the fact that the best individual stands for the nearest point to the optima. In the case of temperature as a physical quantity with a continuous nature (e.g., real number), an increase or decrease in temperature is meaningful. On the other hand, for physics schemes in NWP models with a discontinuous nature (e.g., integer), the option of schemes as an index has no physical meaning. The best option for physics schemes is not related to the nearest options. Thus, the random search is more appropriate to optimize each of the schemes; however, the use of evolutionary algorithms is reasonable when looking for a combination of physics schemes. Note that combinatorial optimization must consider randomness to avoid falling to the local optimum. The µ-GA conducts a global search through a random number generator and a crossover operator; hence, the µ-GA is a very useful tool for combinatorial optimization.
3.1 Observation data
Observation data have sometimes strongly affected verification results (Rossa et al., 2008). Merged gauge–radar precipitation has the greatest advantage of the spatially uniform information available. The composite precipitation data produced by the Korea Meteorological Administration (KMA) Radar-Automatic weather station Rain-rate (RAR) system (Suk et al., 2013) using 11 radars was employed to optimize the combination of the physics schemes in the WRF model. The observational domain covers 1241 km × 1761 km on the Korean Peninsula, centered at 38∘ N and 126∘ E in the Lambert conformal conic projection. It has enough horizontal (i.e., 1 km) and temporal resolution (i.e., 10 min) to compare with the precipitation fields obtained by the high-resolution model. The performance of the RAR system was examined for 10 heavy rainfall cases selected during the summer of 2006 in Suk et al. (2013), obtaining a squared correlation coefficient (R2) of 0.84 between RAR-estimated rainfall and the observed daily accumulated rainfall from rain gauges.
For comparison with model output, RAR-estimated rainfall data were aggregated to a 5 km resolution grid. A downscaled grid box represents the average of 25 original grid boxes. For reasonable representativeness of samples, we take the average if more than 80 % of original grid boxes have meaningful values.
3.2 µ-GA–WRF interface system
3.2.1 µ-GA
The GA developed by John Holland in the 1970s is a global optimization approach based on the Darwinian principle of natural selection: stronger individuals in a generation are more likely to produce offspring. The aim of the GA is to find the best individual with either a maximum or minimum fitness by means of a stochastic global search of the solution space, through the generations. The algorithm applies crossover and mutation operators to avoid local maximum and minimum solutions. The µ-GA (Krishnakumar, 1989) is an improved version of GA with smaller population sizes (e.g., five) and simplifies the generation-to-generation evolution, hence efficiently reducing the computational resources. To simplify the algorithm, the mutate operator is not used, but the crossover operator is used to increase the diversity at a rate of 100 %. Furthermore, whenever inner loop convergence is achieved, the new population for the next generation consists of all new random individuals, except one elite individual. Thus, the µ-GA can avoid trapping into the local optimum.
The flowchart of the µ-GA interfaced to the WRF model is provided in Fig. 1. The selection operator in the µ-GA is tournament selection with a shuffling technique to choose random pairs for mating. A fitness function to evaluate each individual is of the utmost importance in the GA, and it should be designed taking into account the perspective of the optimization. If the inner loop does not converge, selection is performed and all populations go through a crossover process; then one of the populations is altered by the elite. Here, the elite individual from the previous generation is saved as one of the populations in the current generation (i.e., the elitism). Since the crossover probability of 1.0 is used without the mutation operator in the µ-GA, each individual quickly resembles the elite through generations (i.e., inner loop). In other words, the optimization within the inner loop has a feature of local search by specifically exploring the solution space around the elite. The µ-GA decides that the inner loop converges upon an optimum when the different chromosomes between the elite individual and all the others are less than 5 % as binary bits. After the inner loop convergence, all individuals in the next generation, except for one surviving elite of the parent generation, are regenerated using a random number generator, thus widening the search space (i.e., outer loop; global search). As a criterion of the outer loop convergence to finalize the algorithm, we commonly set the maximum number of generations.

3.2.2 µ-GA–WRF interface system
We created the µ-GA–WRF interface system to seek the optimal physics set of CU, MP, and PBL schemes in the WRF model for rainfall events in terms of QPF. The WRF model, a mesoscale NWP system, has been developed for atmospheric research and operational forecasting applications from the latter 1990s by a collaborative partnership of the National Center for Atmospheric Research (NCAR), the National Oceanic and Atmospheric Administration (represented by the National Centers for Environmental Prediction (NCEP) and the Earth System Research Laboratory), the US Air Force, the Naval Research Laboratory, the University of Oklahoma, and the Federal Aviation Administration (FAA). The details of model configuration are addressed in Sect. 3.3.
Figure 1 shows the flowchart of the µ-GA–WRF interface system. In the µ-GA–WRF interface system, the µ-GA controls WRF simulations in the process of “Compile and Run WRF”. First, the µ-GA randomly initializes individuals (i.e., combinations of physics schemes) in the first generation. Through the inner and outer loop, the µ-GA evaluates the fitness value calculated by WRF results and RAR observations, then reruns the WRF models with new scheme combinations. Finally, if both the inner loop and outer loop converge, the optimization process in the µ-GA–WRF interface system is finished.
The µ-GA is implemented as input parameters. We set a population size of five, meaning that each generation has five individuals (i.e., model simulations). The maximum value of generations is set to 100, which is typically used in µ-GA experiments. The number of parameters (groups of bits) of each individual for the µ-GA is three, which is the number of schemes to be optimized. We used single-point crossover.
3.2.3 Fitness function
Fitness is the basis for evaluating the superiority among individuals consisting of combinations of chromosomes. Designing a fitness function in the GA is critical for optimizing the model as intended. In this study, we are trying to improve the model simulation in terms of QPF. Thus, we used the equitable threat score (ETS; Hamill, 1999) as the fitness function, also called an objective function. The fitness is computed by a sum of ETSs within each precipitation threshold.
Here, i is a specified threshold of accumulated precipitation in millimeters, and the ETS and chance are defined as
ETS has values in the range from to 1. The closer the ETS is to unity, the better the forecast skill. On the other hand, if ETS is equal to or less than 0, the forecast skill is the same as, or even worse than, that of a random forecast. Here, hits, misses, false alarms, and correct negatives from a 2×2 contingency table are estimated by the joint distribution of binary (yes/no) forecasts and observations (Table 1). Rainfall estimations can be evaluated through the table that explicitly provides prediction capability and types of errors in the prediction.

When focusing on heavy rainfall, the total fitness value is calculated by the sum of ETS at the threshold ranging from 10 to 300 mm with an interval of 10 mm, whereas when focusing on precipitation detection, a precipitation threshold of 3 mm is used. In order to detect precipitation, the threshold of precipitation accumulated over 24 or 12 h is generally used as a value between 0.1 and 0.3 mm (Rossa et al., 2008). Park et al. (2018) obtained the threshold value of 3 mm h−1 for the station average precipitation rate when the cumulative percentage of warm season precipitation events in Korea reached approximately 80 % based on automatic weather station (AWS) observation data. As we would like to improve the forecast accuracy of precipitation in Korea, we selected the threshold value of 3 mm for hourly precipitation for the calculation of ETS. In this study, we also conducted a sensitivity test of the precipitation accumulation period.
3.3 Experimental design
The WRF model (version 4.0.3) was initialized at 00:00 UTC on 5 August 2018 with the 6-hourly initial and boundary conditions given by the National Center for Environmental Prediction (NCEP) Final (FNL) Operational Model Global Tropospheric Analyses data on 1∘ × 1∘ grids. The WRF model configuration is based on the following: horizontal grid spacings of 25 and 5 km for two nested domains (Fig. 2); horizontal grid points of 60×60 and 116×136; the model top of 50 hPa with 33 vertical levels; and the Dudhia shortwave radiation scheme (Dudhia, 1989), Rapid Radiative Transfer Model (RRTM) longwave radiation scheme (Mlawer et al., 1997), revised fifth-generation National Center for Atmospheric Research (NCAR)/Penn State Mesoscale Model (MM5) surface layer scheme (Jimenez et al., 2012), and Unified Noah LSM (Chen et al., 1996; Koren et al., 1999). The control experiment referred to as CTL is simulated with the Kain–Fritsch scheme (KF), the WRF double-moment (WDM) six-class scheme, and the Yonsei University (YSU) scheme as the CU, MP, and PBL scheme, respectively, which are generally used to simulate the precipitation system in Korea. The optimization results from the µ-GA–WRF interface system are referred to as OPT.
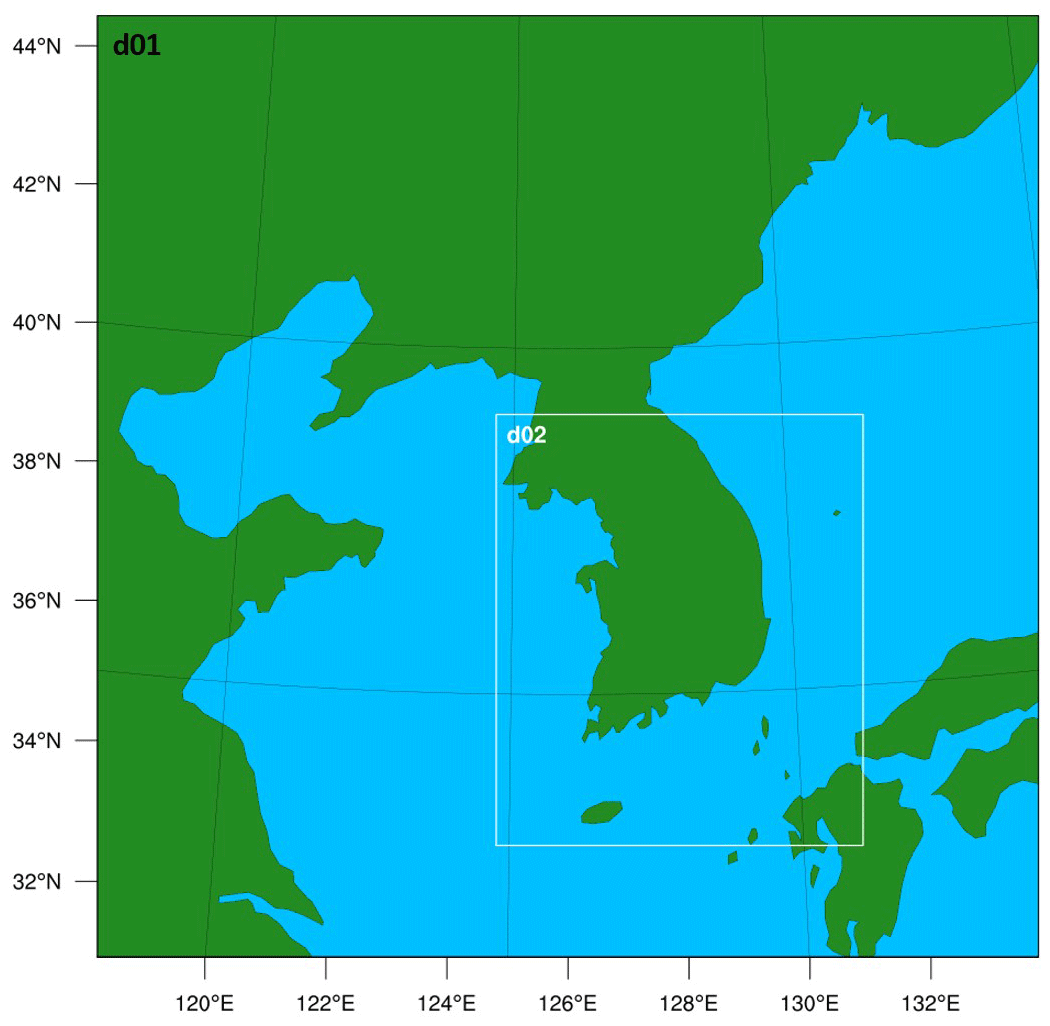
Figure 2WRF nested domains – Domain 1 (d01) and Domain 2 (d02); d01 is centered at 38∘ N and 126∘ E in the Lambert conformal conic projection.
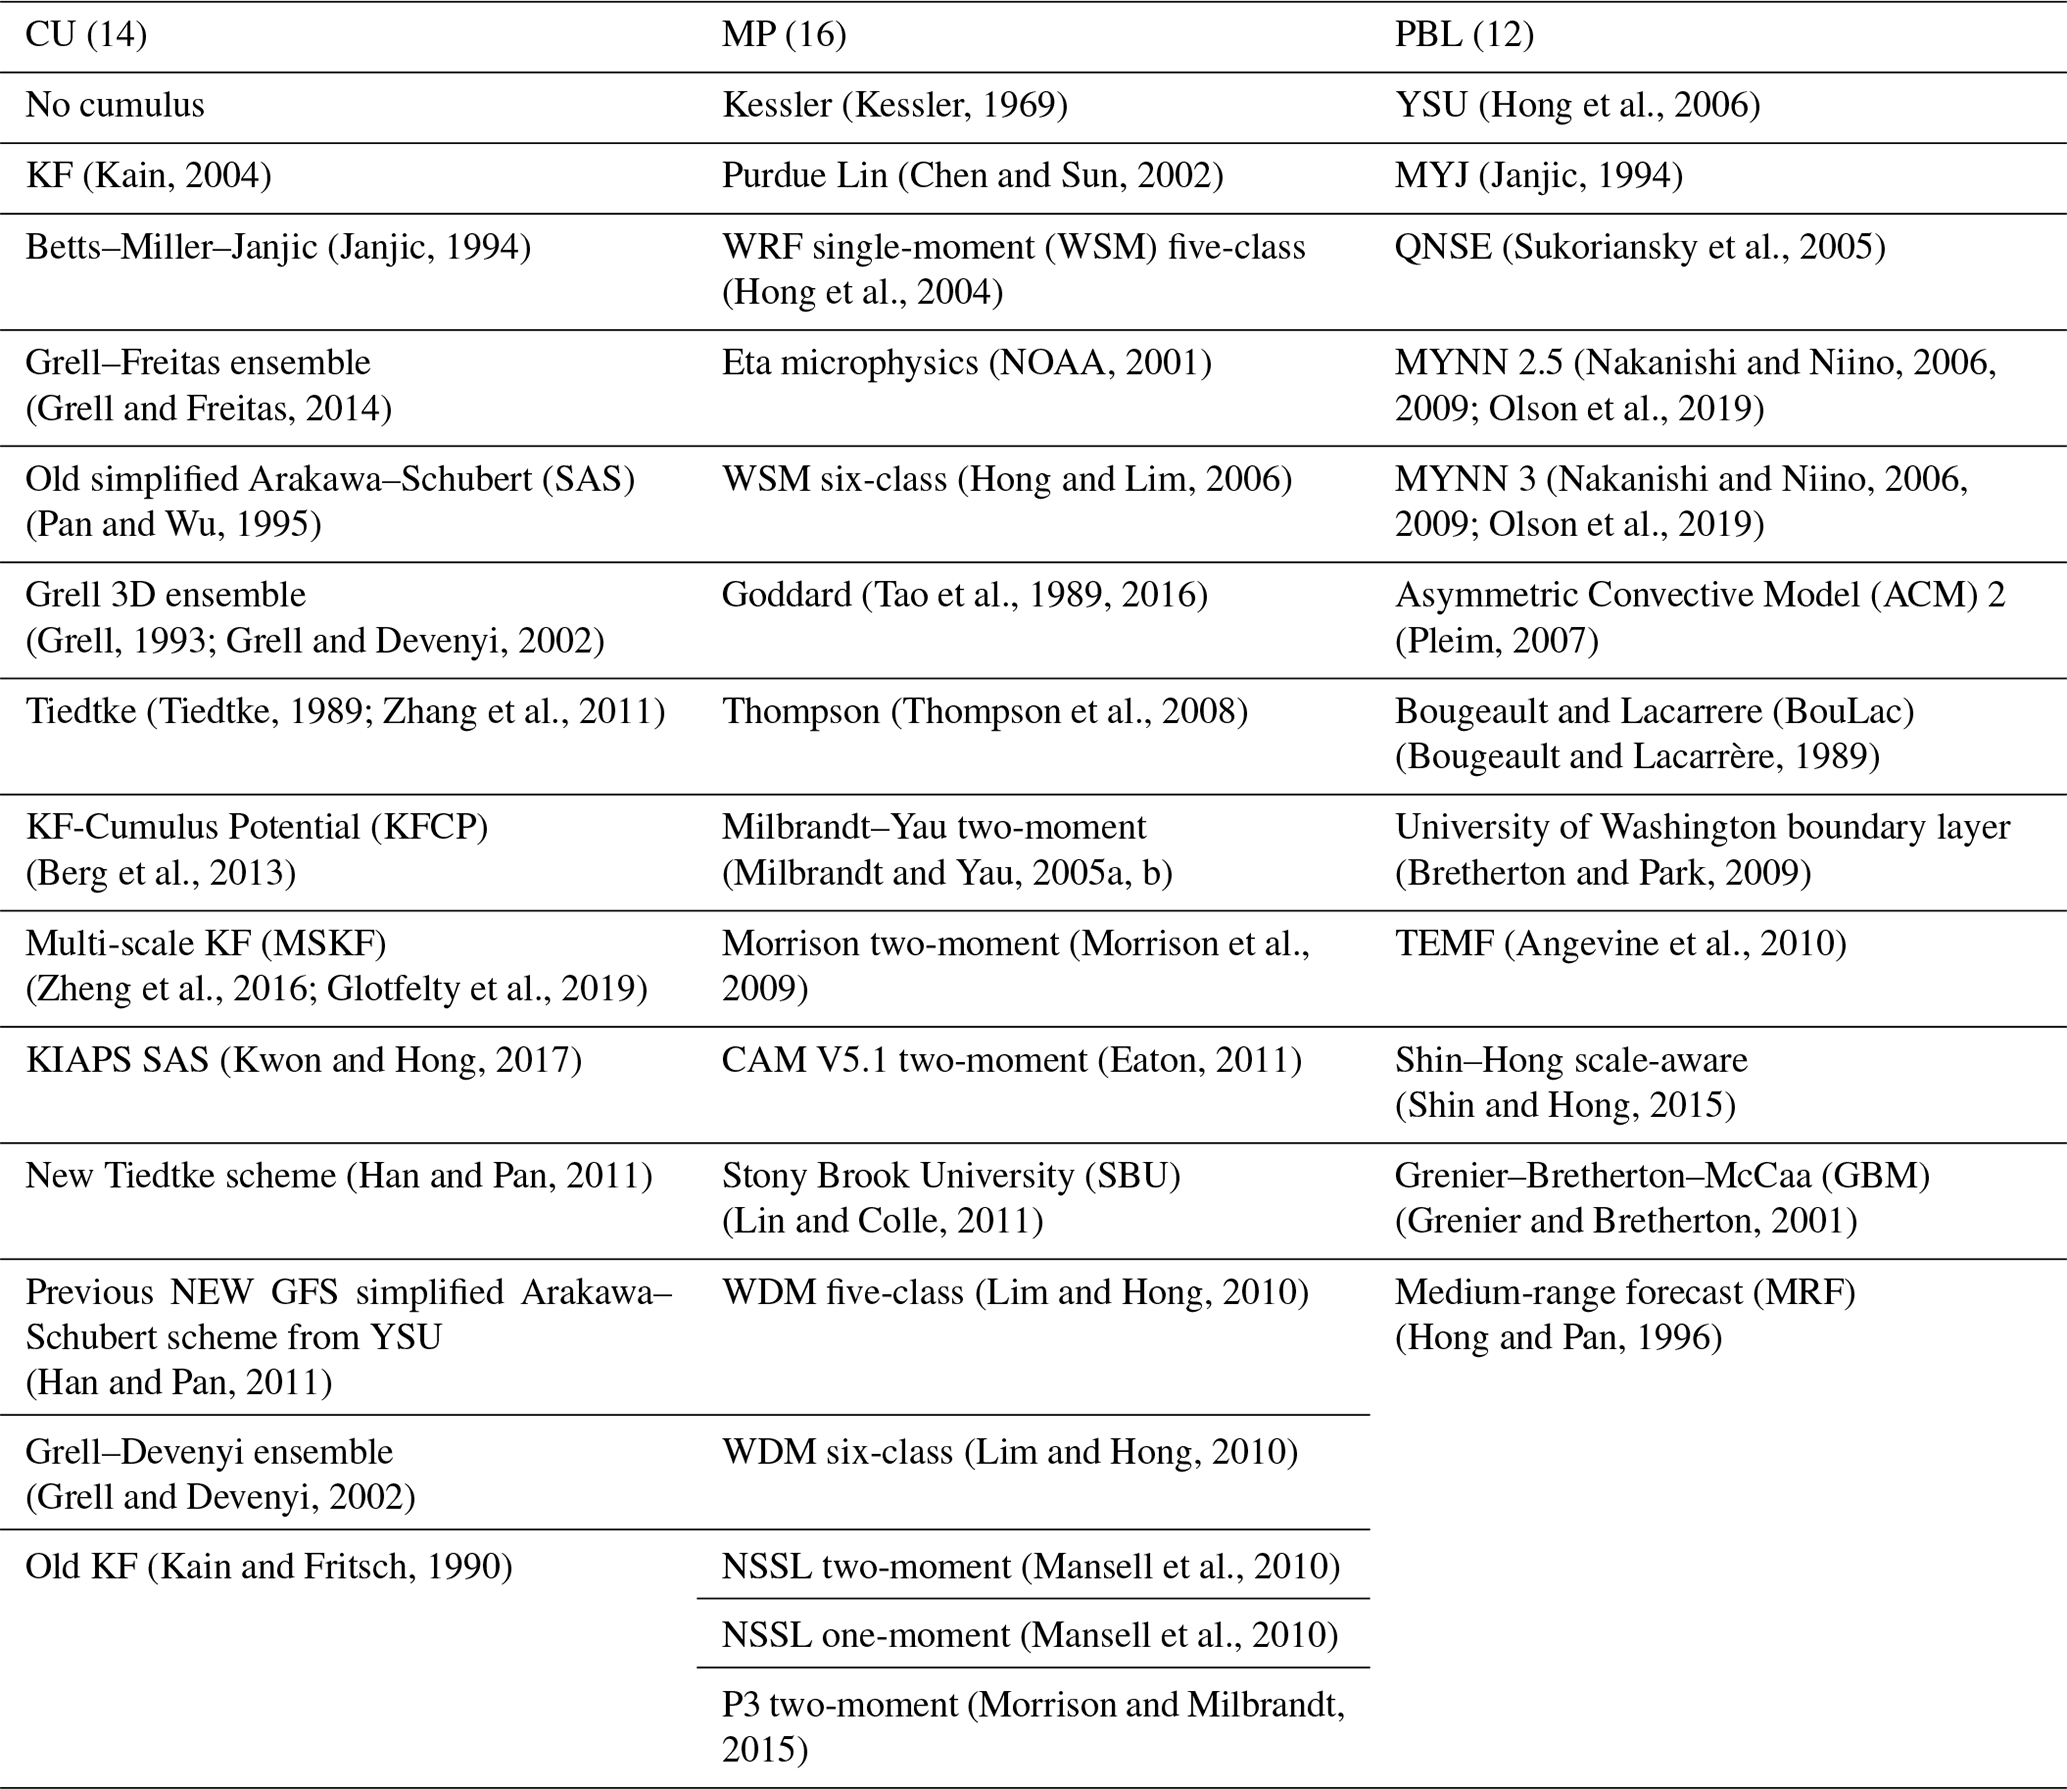
We selected the CU, MP, and PBL physical processes for the combinatorial optimization. The CU parameterization determines the prediction of subgrid-scale processes, associated convective clouds, and precipitation at a coarse resolution. Meanwhile, the MP regulates the grid-resolving processes of clouds. The PBL scheme, which could indirectly influence precipitation by interacting with other physics, can affect temperature and moisture profiles in the lower troposphere via exchanges of moisture, heat, and momentum through the mixing associated with turbulent eddies. The options of the CU, MP, and PBL schemes used for the optimization in the µ-GA–WRF interface system are shown in Table 2. If Mellor–Yamada–Janjic (MYJ), quasi-normal-scale elimination (QNSE), Mellor–Yamada Nakanishi and Niino Level (MYNN) 3, or total energy mass flux (TEMF) is selected as the PBL scheme, eta similarity (Monin and Obukhov, 1954; Janjic, 1994, 1996, 2002), QNSE, MYNN, or TEMF should be set as a surface layer scheme, respectively. The surface layer scheme is the lowest part of the atmospheric boundary layer where the surface fluxes (i.e., surface heat, moisture, and momentum fluxes) can be calculated not only by combining the LSM, but also by itself. We have found the best scheme combination by the µ-GA as the mechanical and objective optimization method without model simulations of 2688 (14 × 16 × 12), which is the total possible number of scheme combinations.
Table 2Summary of CU, MP, and PBL physics schemes used in the µ-GA–WRF interface system for the optimization.
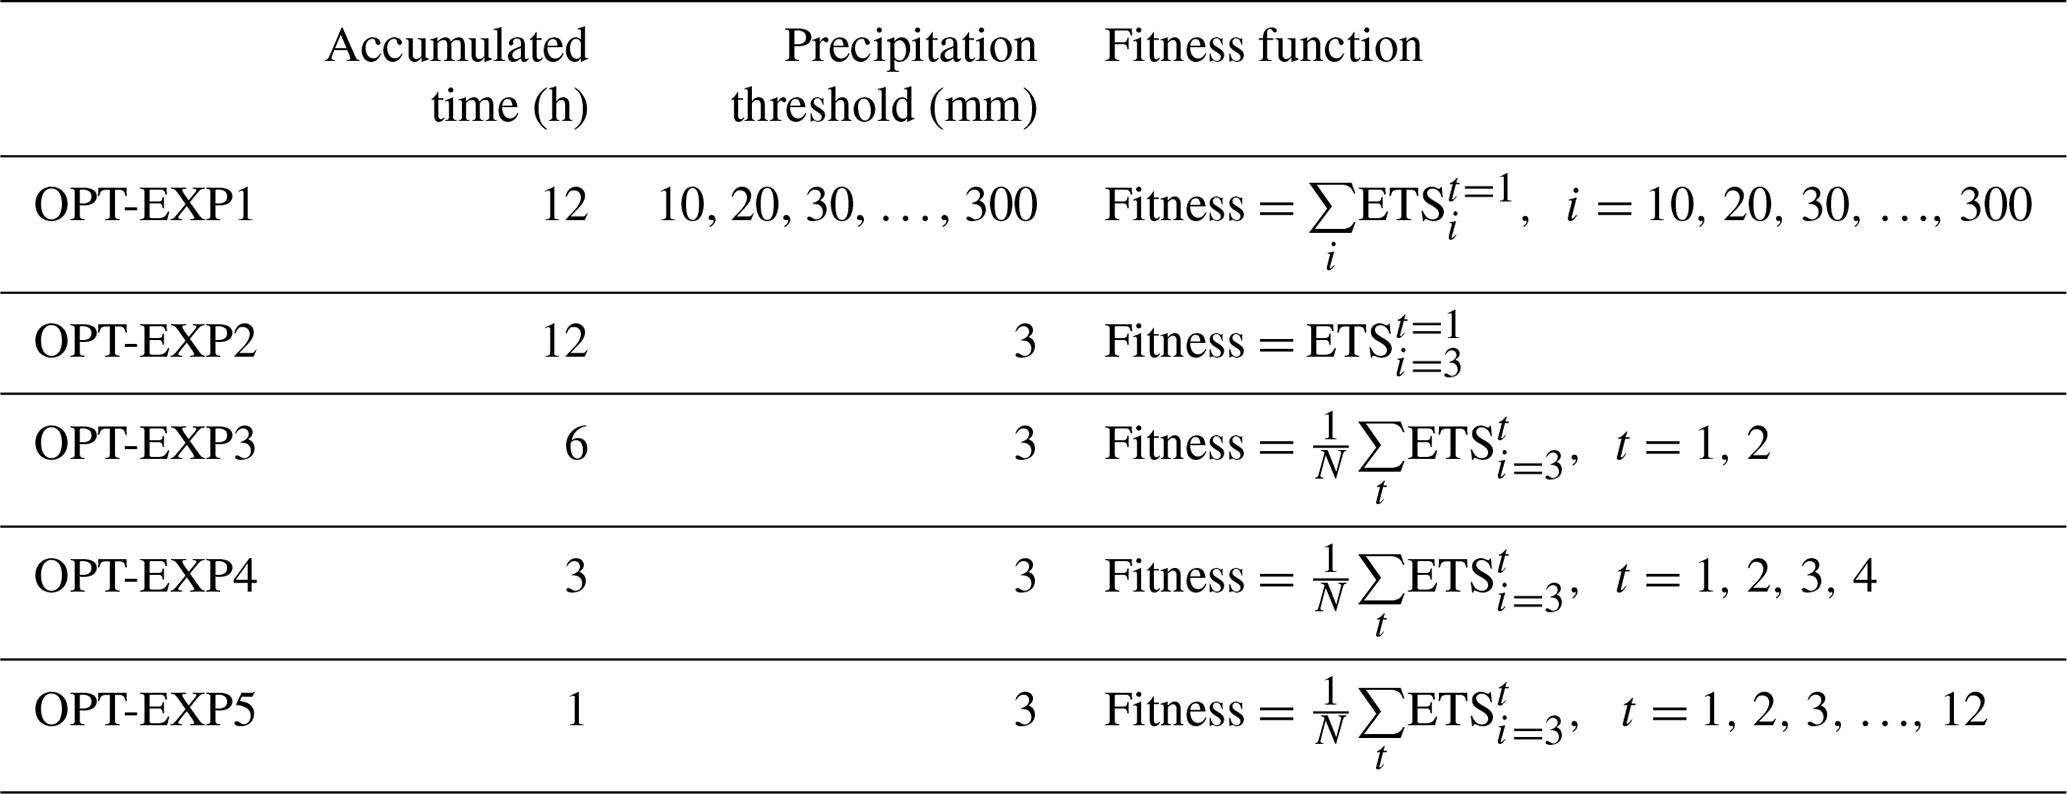
During the 12 h period from 12:00 UTC on 5 August 2018 to 00:00 UTC on 6 August 2018, including the first and second periods of intense rainfall (see Sect. 4.1), precipitation was evaluated by fitness functions. We perform the optimization experiments with five different fitness functions based on ETS in Sect. 3.2.2. Table 3 shows the summary of experiments – OPT-EXP1 for 12-hourly accumulated precipitation with precipitation thresholds ranging from 10 to 300 mm with the interval of 10 mm; OPT-EXP2 for 12-hourly accumulated precipitation with a precipitation threshold of 3 mm; OPT-EXP3 for all 6-hourly accumulated precipitation during the evaluation period with a precipitation threshold of 3 mm; OPT-EXP4 for all 3-hourly accumulated precipitation during the evaluation period with a precipitation threshold of 3 mm; OPT-EXP5 for all hourly accumulated precipitation during the evaluation period with a precipitation threshold of 3 mm. For OPT-EXP1, the total fitness value is calculated as the sum of the ETSs at all thresholds, while for OPT-EXP2–OPT-EXP5 it is calculated as the average of the ETSs for each accumulated time over 12 h.
Table 3The summary of the experiments. In the fitness function, i and t represent the precipitation threshold and the number of accumulated time instants, respectively. N is the total number of accumulated time instants.
4.1 Case description
A coastal flood occurred in Korea due to a quasi-stationary mesoscale convective system (MCS), which produced heavy rainfall on 5–6 August 2018. As the event was unexpected, the back-building MCS was located in the Yeongdong region for about a day; thus, the heavy rainfall caused damage to property estimated at KRW 177 million (KMA, 2018). For the period from 11:00 UTC on 5 August to 14:00 UTC on 6 August, 294.5 mm of precipitation was recorded at Sokcho: the first intense rainfall continued for 4 h (13:00–17:00 UTC 5 August) with a maximum precipitation rate of 35.3 mm h−1 and total rainfall amount of 83.5 mm, whereas the second intense rainfall (17:00 UTC 5 August–00:00 UTC 6 August) recorded a maximum precipitation rate of 54.9 mm h−1 and total rainfall amount of 192 mm due to the quasi-stationary MCS. To predict more accurately, forecasters essentially need the mesoscale information from NWPs as well as synoptic weather charts, vertical soundings, satellite observations, and weather station observation, among others, at the preceding time. NWP models can capture the important triggers, which can hardly be found through observations, to predict rainfall. This heavy rainfall case occurred due to mesoscale factors: (1) low-level convergence, (2) strong vertical wind shear, (3) coastal fronts and back-building convection bands, (4) mid-level advection of cold air and positive relative vorticity, and (5) vigorous updraft releasing potential instability (Park and Park, 2020). Therefore, it is necessary to improve the NWP model to more accurately identify these mesoscale factors.
4.2 Results
4.2.1 Combinatorial optimization of the physics schemes for QPF
The combinatorial optimization of the physics schemes in the WRF model targets the improved quantitative forecasting of heavy rainfall. OPT-EXP1 shows the simulated results using the optimized combination of the MP, CU, and PBL schemes, focusing on strong precipitation intensity. Figure 3 depicts the evolution of generations of the µ-GA, represented by fitness values, for OPT-EXP1. The µ-GA reached the maximized evolution, which was the point that the best individual in each generation converged upon the highest fitness score (here, of 4.292) at the 12th generation. Before that, the local optimum (i.e., intermediate optimum; IMD-OPT) appeared at the fourth generation with a fitness of 2.9896. The optimized schemes of the CU, MP, and PBL for this event are the MSKF, NSSL two-moment, and YSU scheme, respectively. For the IMD-OPT-EXP1, only the MP physics scheme selected as WSM six-class is different from the global optimum. The optimum of the PBL scheme is the same as CTL, and that of the CU scheme is the updated scheme from the CU scheme for CTL. The KF (i.e., the CU scheme for CTL) is suitable for a horizontal resolution of ∼ 25 km, at which convective clouds can be represented explicitly. However, MSKF (i.e., the optimum of the CU scheme) has been improved for use in the so-called gray zone scales (i.e., 12 to 1 km) and at a horizontal grid spacing of 25 km (Glotfelty et al., 2019).
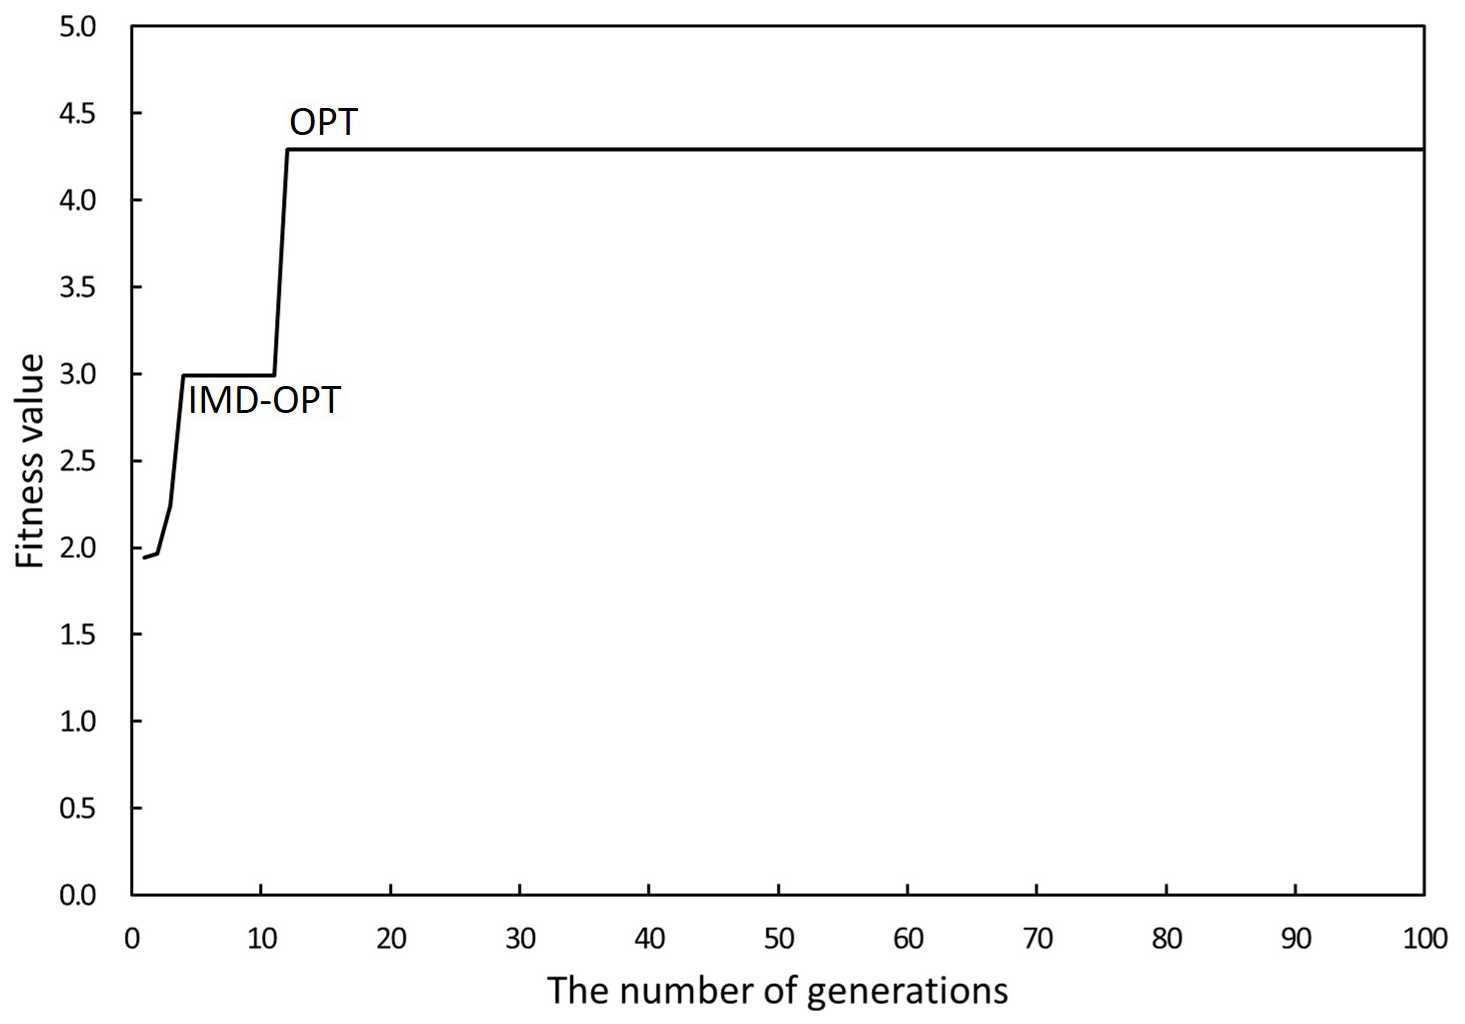
Figure 3Evolution of generations in the optimization process, leading to changes in fitness values. OPT and IMD-OPT represent the final optimized phase and one of the intermediate optimized phases, respectively.
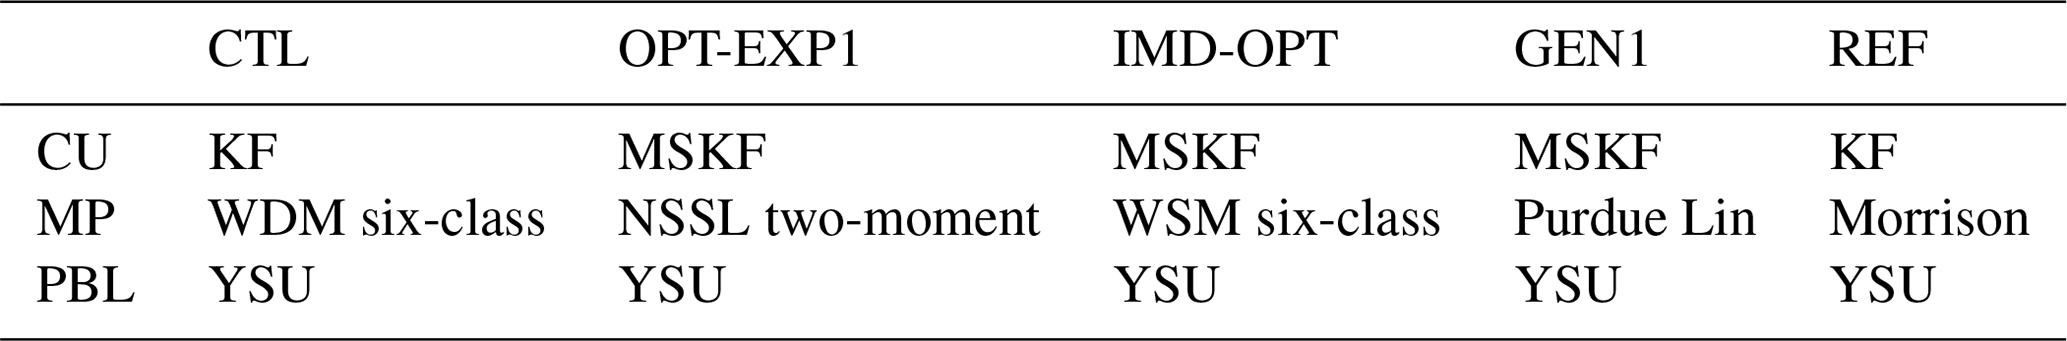
Figure 4 compares the ETSs of each precipitation threshold for CTL, OPT-EXP1, IMD-OPT, the best individual at the first generation (GEN1), and REF. REF is simulated with the CU, MP, and PBL physics schemes validated in Park and Park (2020). The Morrison scheme is chosen as the MP scheme, and the CU and PBL schemes are the same as CTL. The selected schemes for CTL, OPT-EXP1, IMD-OPT, GEN1, and REF are summarized in Table 4. OPT-EXP1 performs significantly better than CTL at precipitation thresholds above 20 mm, indicating a remarkable improvement in the ETSs. Although REF also shows more improved forecasting skill than CTL at all precipitation thresholds, OPT-EXP1 performs better at higher precipitation intensity compared to REF. The optimization process from GEN1 to IMD-OPT, corresponding to the evolution of early generations, shows increases in ETS at precipitation thresholds less than 130 mm, whereas IMD-OPT to OPT-EXP1 shows further enhancements at heavy precipitation thresholds (≥40 mm) and even above 130 mm. For both observations and model output, the maximum amount of 12 h accumulated precipitation in the grid box did not exceed 190 mm.
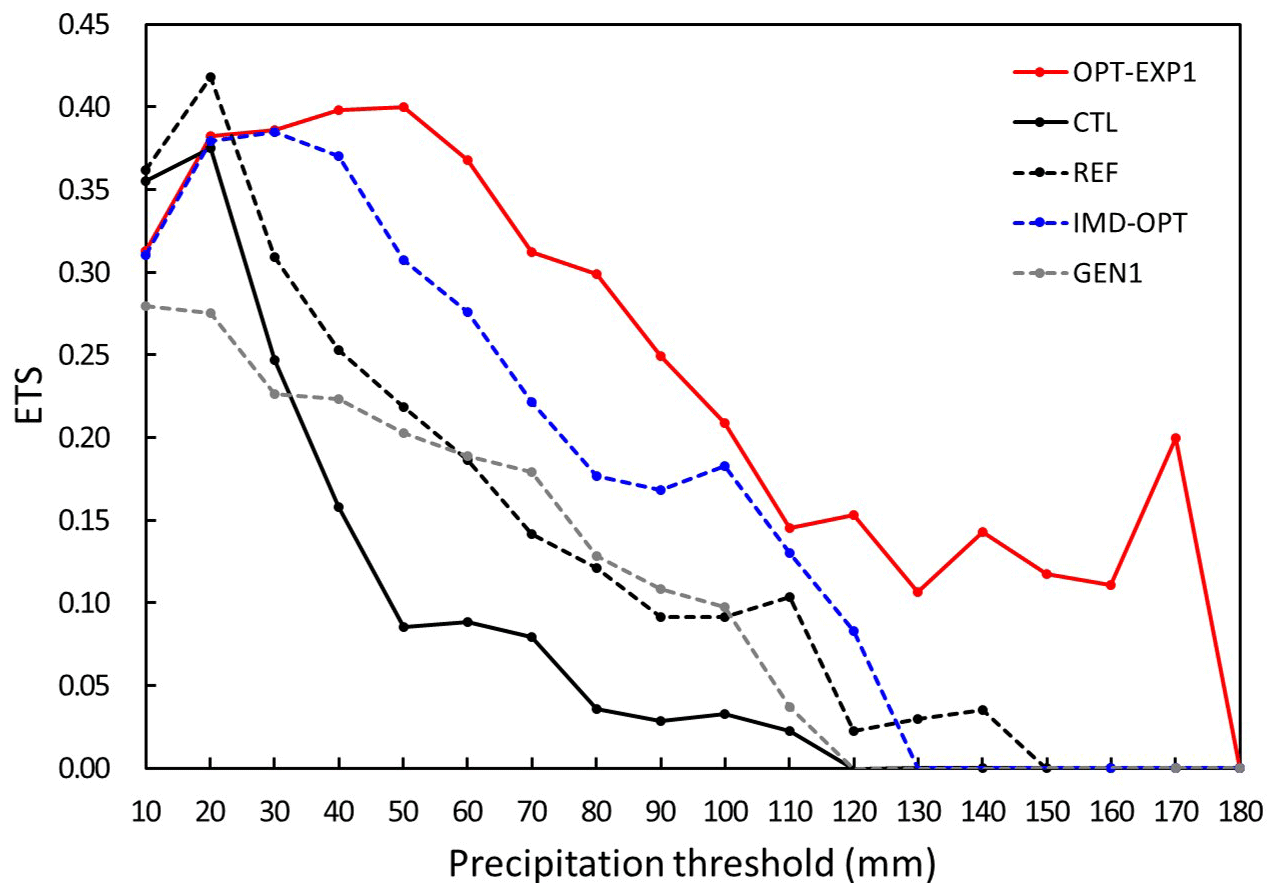
Figure 4ETS for 12 h accumulated precipitation with each precipitation threshold for CTL (black line), OPT-EXP1 (red line), IMD-OPT (dashed blue line), GEN1 (dashed gray line), and REF (dashed black line).
Table 4The summary of selected schemes for CTL, OPT-EXP1, IMD-OPT, GEN1, and REF.
The spatial distribution of 12 h accumulated precipitation for observations (RAR), OPT-EXP1, CTL, and REF is shown in Fig. 5. CTL broadly underestimated precipitation, and REF is better than CTL in terms of both quantity and rain cell development. Rain cells located near both Sokcho and north of Gangneung were well captured in REF and OPT-EXP1, although the amount of precipitation was underestimated over the north of Gangneung. OPT-EXP1 shows improved precipitation simulation for the inland area near Gangneung and Daegwallyeong, but it still underestimated. As the MCS stayed near Sokcho and the north of Gangneung during the period of accumulative precipitation, light rainfall occurred over the inland, whereas heavy rainfall occurred over the sea along the coastal line.
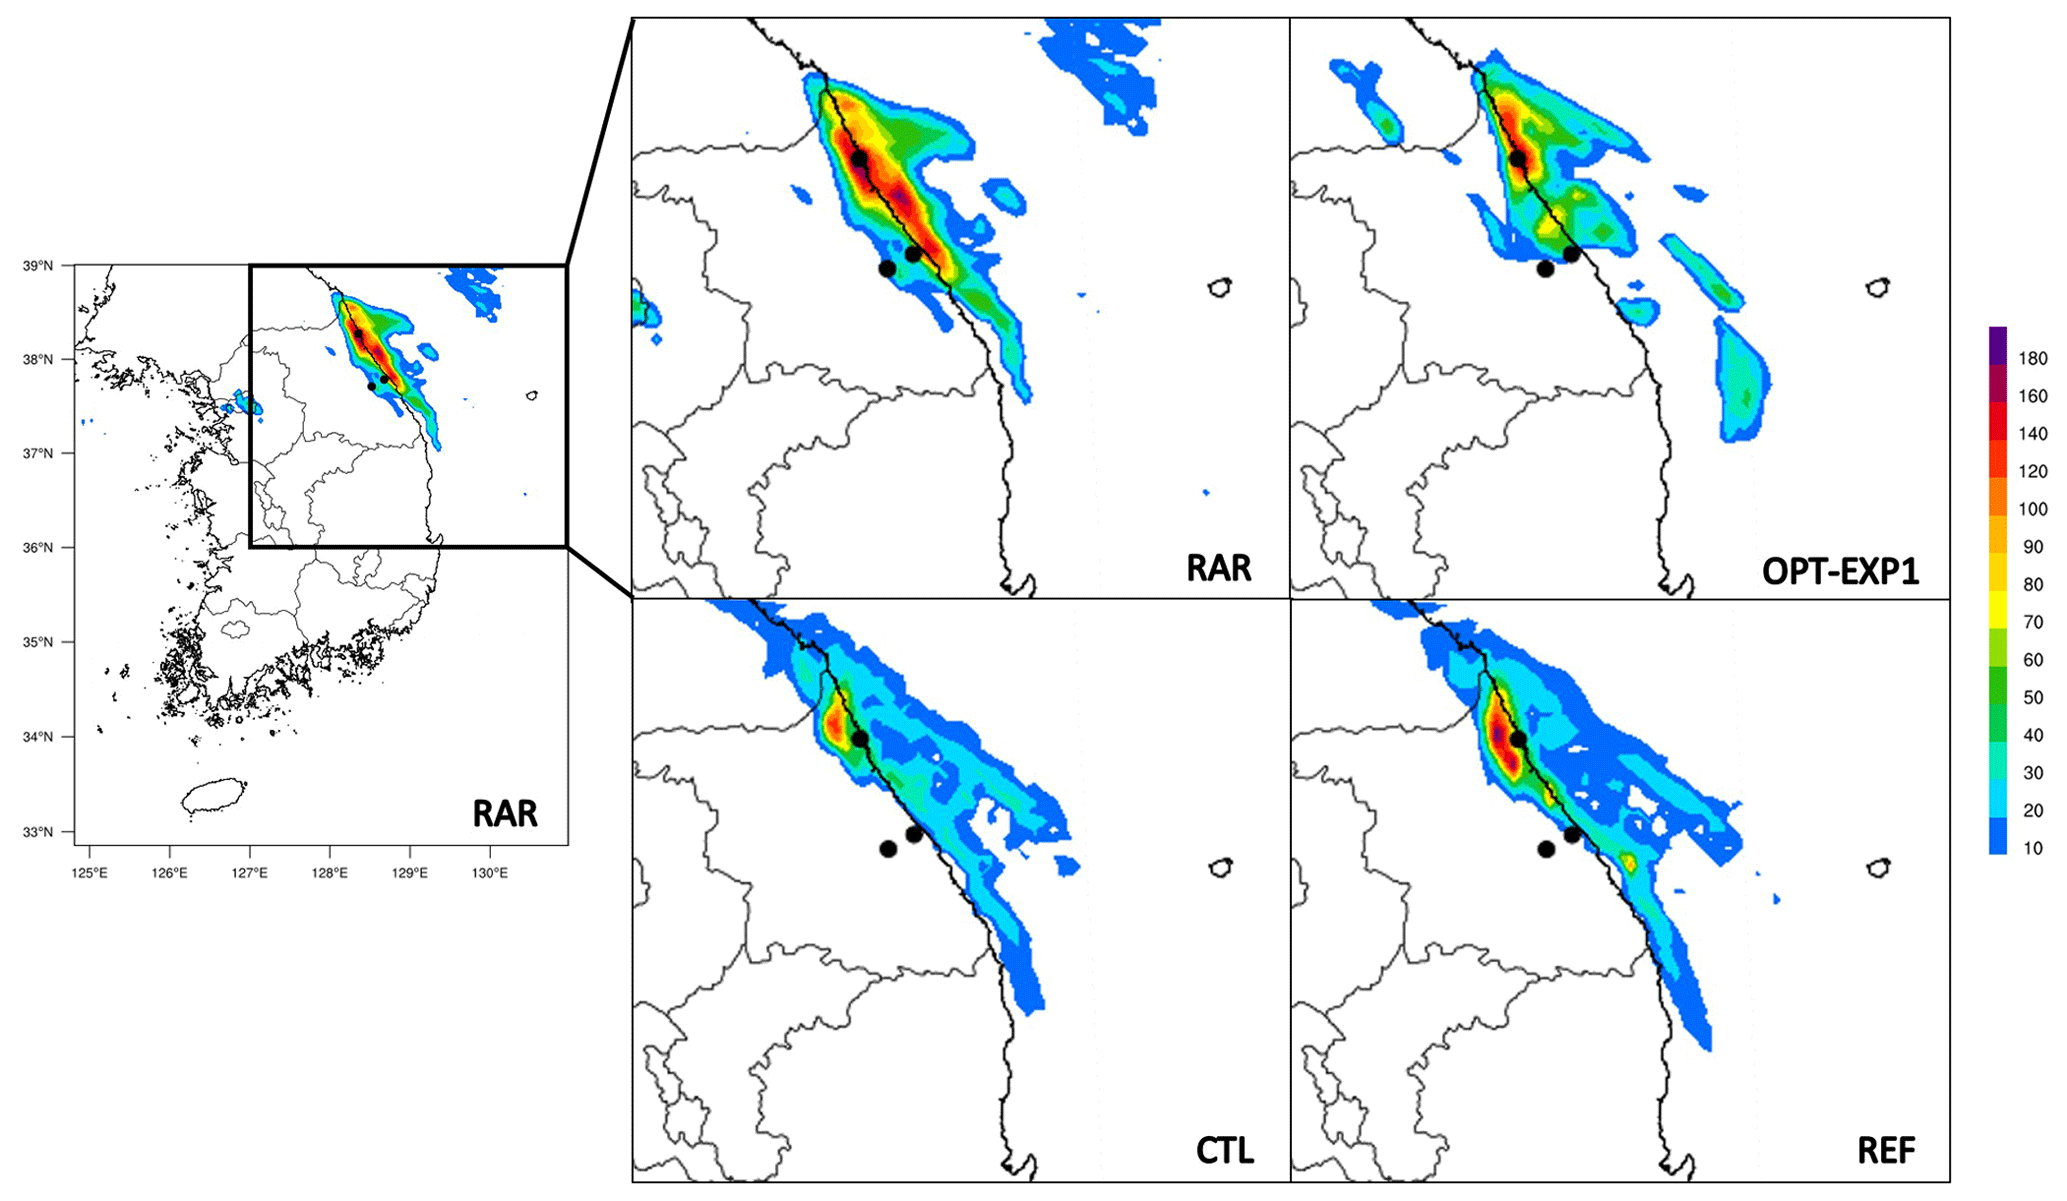
Figure 5The spatial distribution of 12 h accumulated precipitation for RAR, CTL, OPT-EXP1, and REF. Black dots depict locations of weather stations: Sokcho (S; 38.25∘ N, 128.56∘ E; 18.06 m), Gangneung (G; 37.75∘ N, 128.89∘ E; 26.04 m), and Daegwallyeong (D; 37.68∘ N, 128.86∘ E; 772.57 m).
We also verified the effectiveness of the optimization by the continuous statistics for CTL, REF, and OPT-EXP1 (Table 5 and Fig. 6). The scatter plot for OPT-EXP1 exhibits the best performance, with a regression coefficient (R) of 1.01, compared to CTL and REF (Fig. 6). In addition, Table 5 shows that OPT-EXP1 has lower spatial mean bias and root mean square error (RMSE) of precipitation (−7.433 and 21.511) and a greater Pearson's correlation coefficient (PCC) (0.762) than CTL (−8.696, 25.430, and 0.673, respectively). It performs better than REF as well. In conclusion, combinatorial optimization of the physics schemes has enhanced the forecast skill not only in QPF (i.e., ETS) but also in terms of both spatial distribution and continuous statistics.
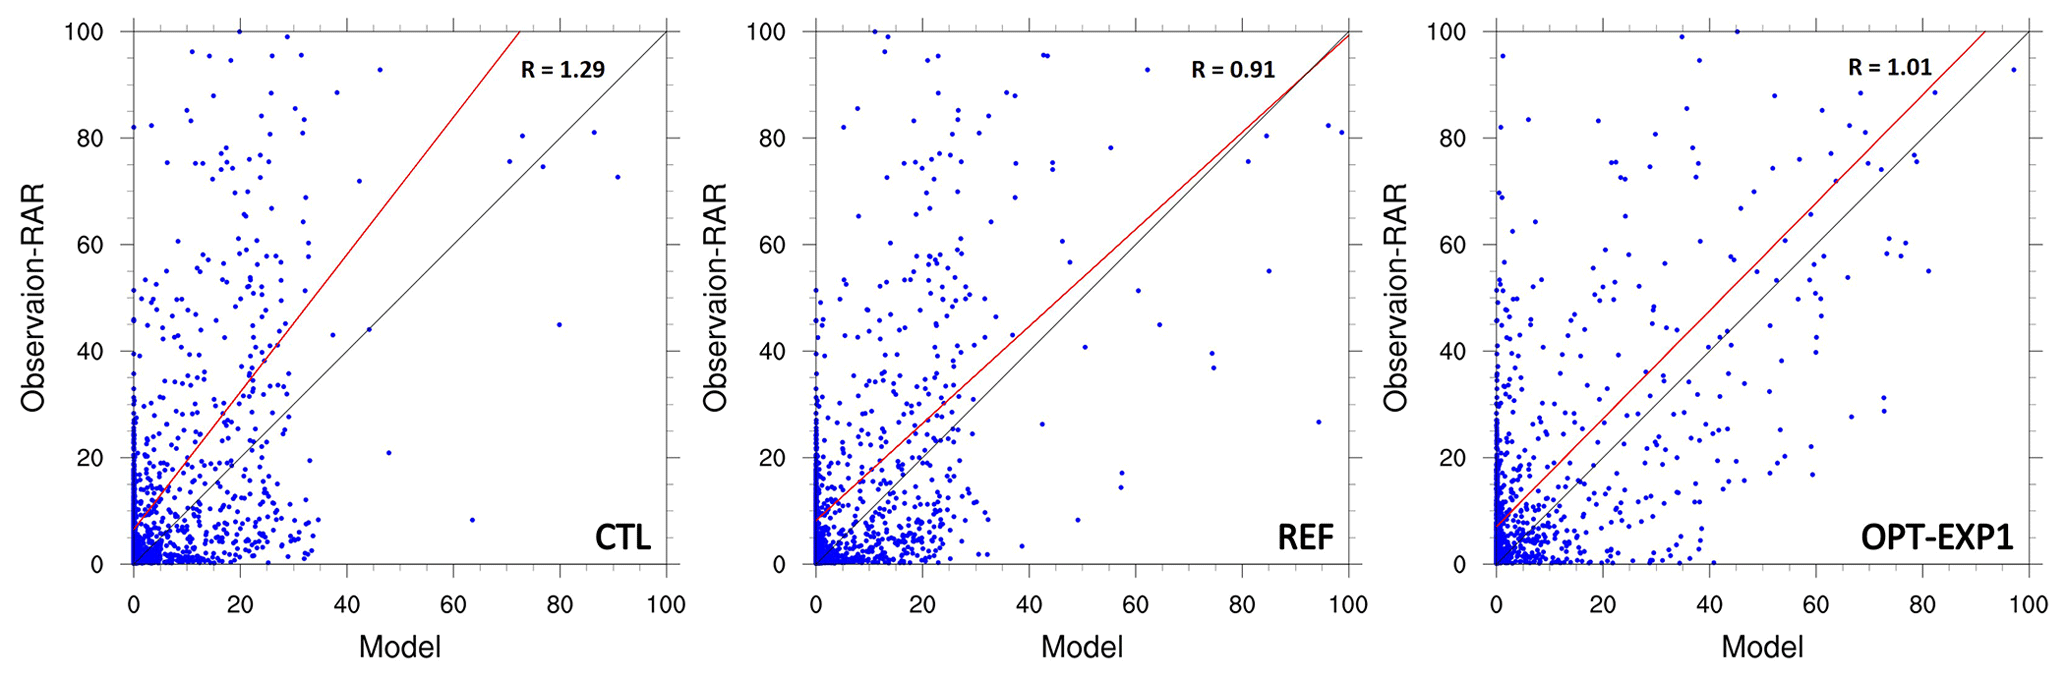
Table 5Continuous statistics for CTL, REF, and OPT-EXP1. The best results are presented in bold.

4.2.2 Sensitivity of fitness functions based on the assessment of precipitation occurrence
For the accuracy of the deep convective precipitation system, we wonder whether it would be effective to increase the accuracy of the precipitation occurrence or to increase the accuracy of precipitation within each precipitation threshold. In this section, we conduct a sensitivity test of the accumulated precipitation time interval used in the fitness function calculation to evaluate precipitation occurrence with the precipitation threshold of 3 mm (see Table 3). The ETSs for 12 h accumulated precipitation, calculated by using 12-hourly (OPT-EXP2), 6-hourly (OPT-EXP3), 3-hourly (OPT-EXP4), and 1-hourly (OPT-EXP5) accumulated precipitation data, were evaluated at each time interval. In contrast to OPT-EXP1, precipitation thresholds for them are set as one criterion (i.e., precipitation threshold of 3 mm), so the maximum value of ETS is equal to 1. When the accumulation time interval becomes shortened (e.g., an hour), precipitation prediction must also be more accurate on a temporal scale in order to have higher fitness because the fitness is computed by the average of ETSs calculated at each time interval. In other words, the shorter the accumulated time intervals, the more ETSs of predicted precipitation are evaluated. Thus, as expected, OPT-EXP2 shows the highest fitness value (i.e., 0.3482), followed by OPT-EXP3 with the fitness of 0.2862 and OPT-EXP5 with the lowest fitness of 0.2249 (Fig. 7). OPT-EXP4 performs similarly as OPT-EXP5, having the fitness of 0.2270. The selected schemes for OPT-EXP2, OPT-EXP3, OPT-EXP4, and OPT-EXP5 are shown in Table 6.

Table 6The selected schemes for OPT-EXP2, OPT-EXP3, OPT-EXP4, and OPT-EXP5.
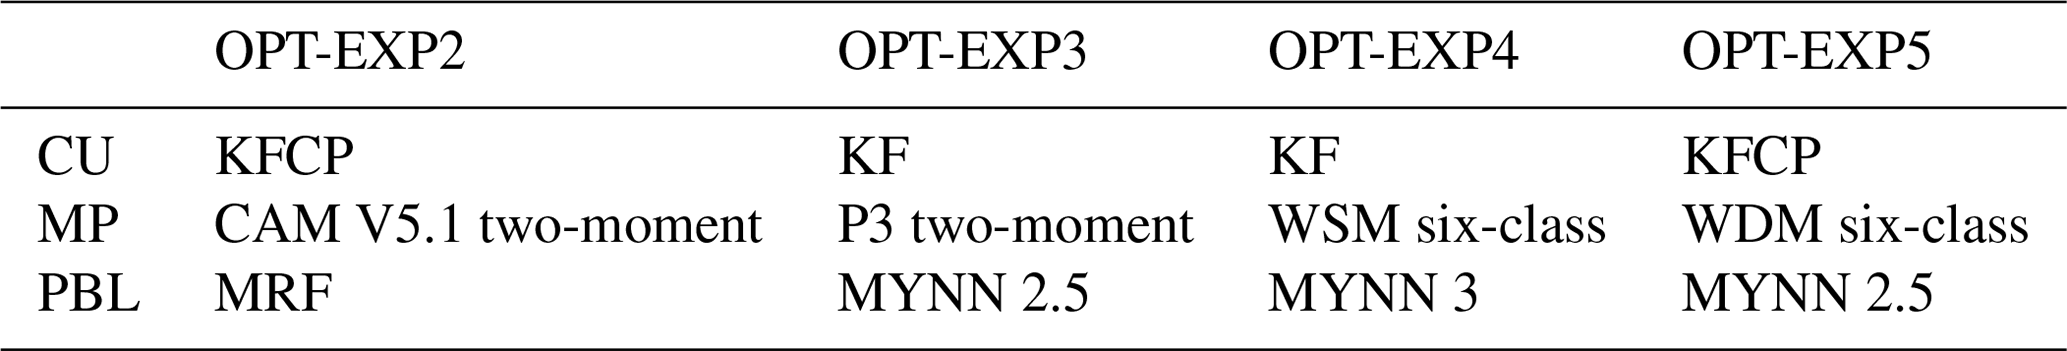
Figure 8 shows the spatial distribution of 12 h accumulated precipitation for OPT-EXP2 to OPT-EXP5. All experiments underestimate the convective system and overestimate very light precipitation over the inland area of the Korean Peninsula (see Figs. 5 and 8). From the ETS perspective, OPT-EXP2 is the best result, but OPT-EXP3 shows the best simulation result in terms of the spatial distribution. Since no method is absolutely superior to others in precipitation evaluation methods such as ETS, critical success index (CSI), probability of detection (POD), and continuous statistics indices, several indices including spatial distribution must be examined together. Rain cells located near both Sokcho and the north of Gangneung were well captured only in OPT-EXP3 and OPT-EXP4 but were still underestimated. Rainfall over the sea along the coastal line was simulated in OPT-EXP3 and OPT-EXP4 as well. On the other hand, the evaluation of the fitness at 1 h intervals results in poor accuracy, possibly because of including the time phase error of the model.
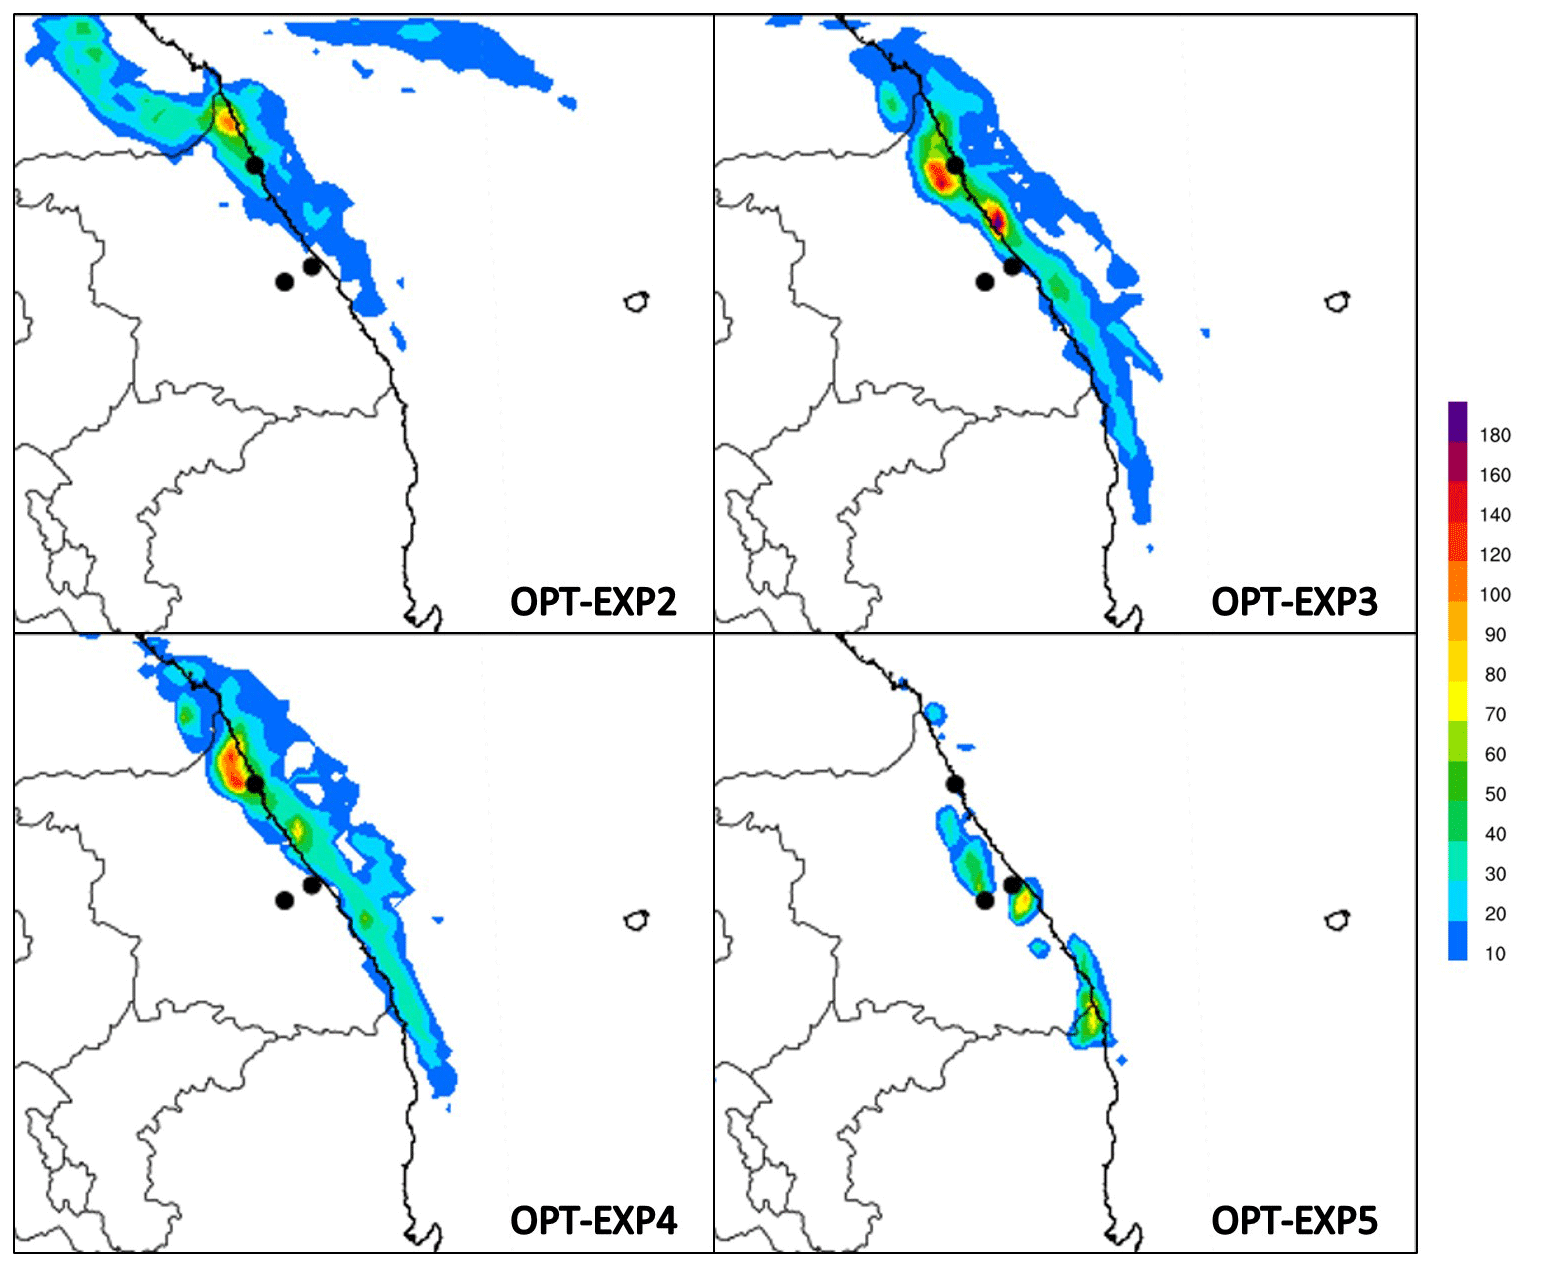
Figure 8Same as Fig. 4 but for OPT-EXP2 to OPT-EXP5.
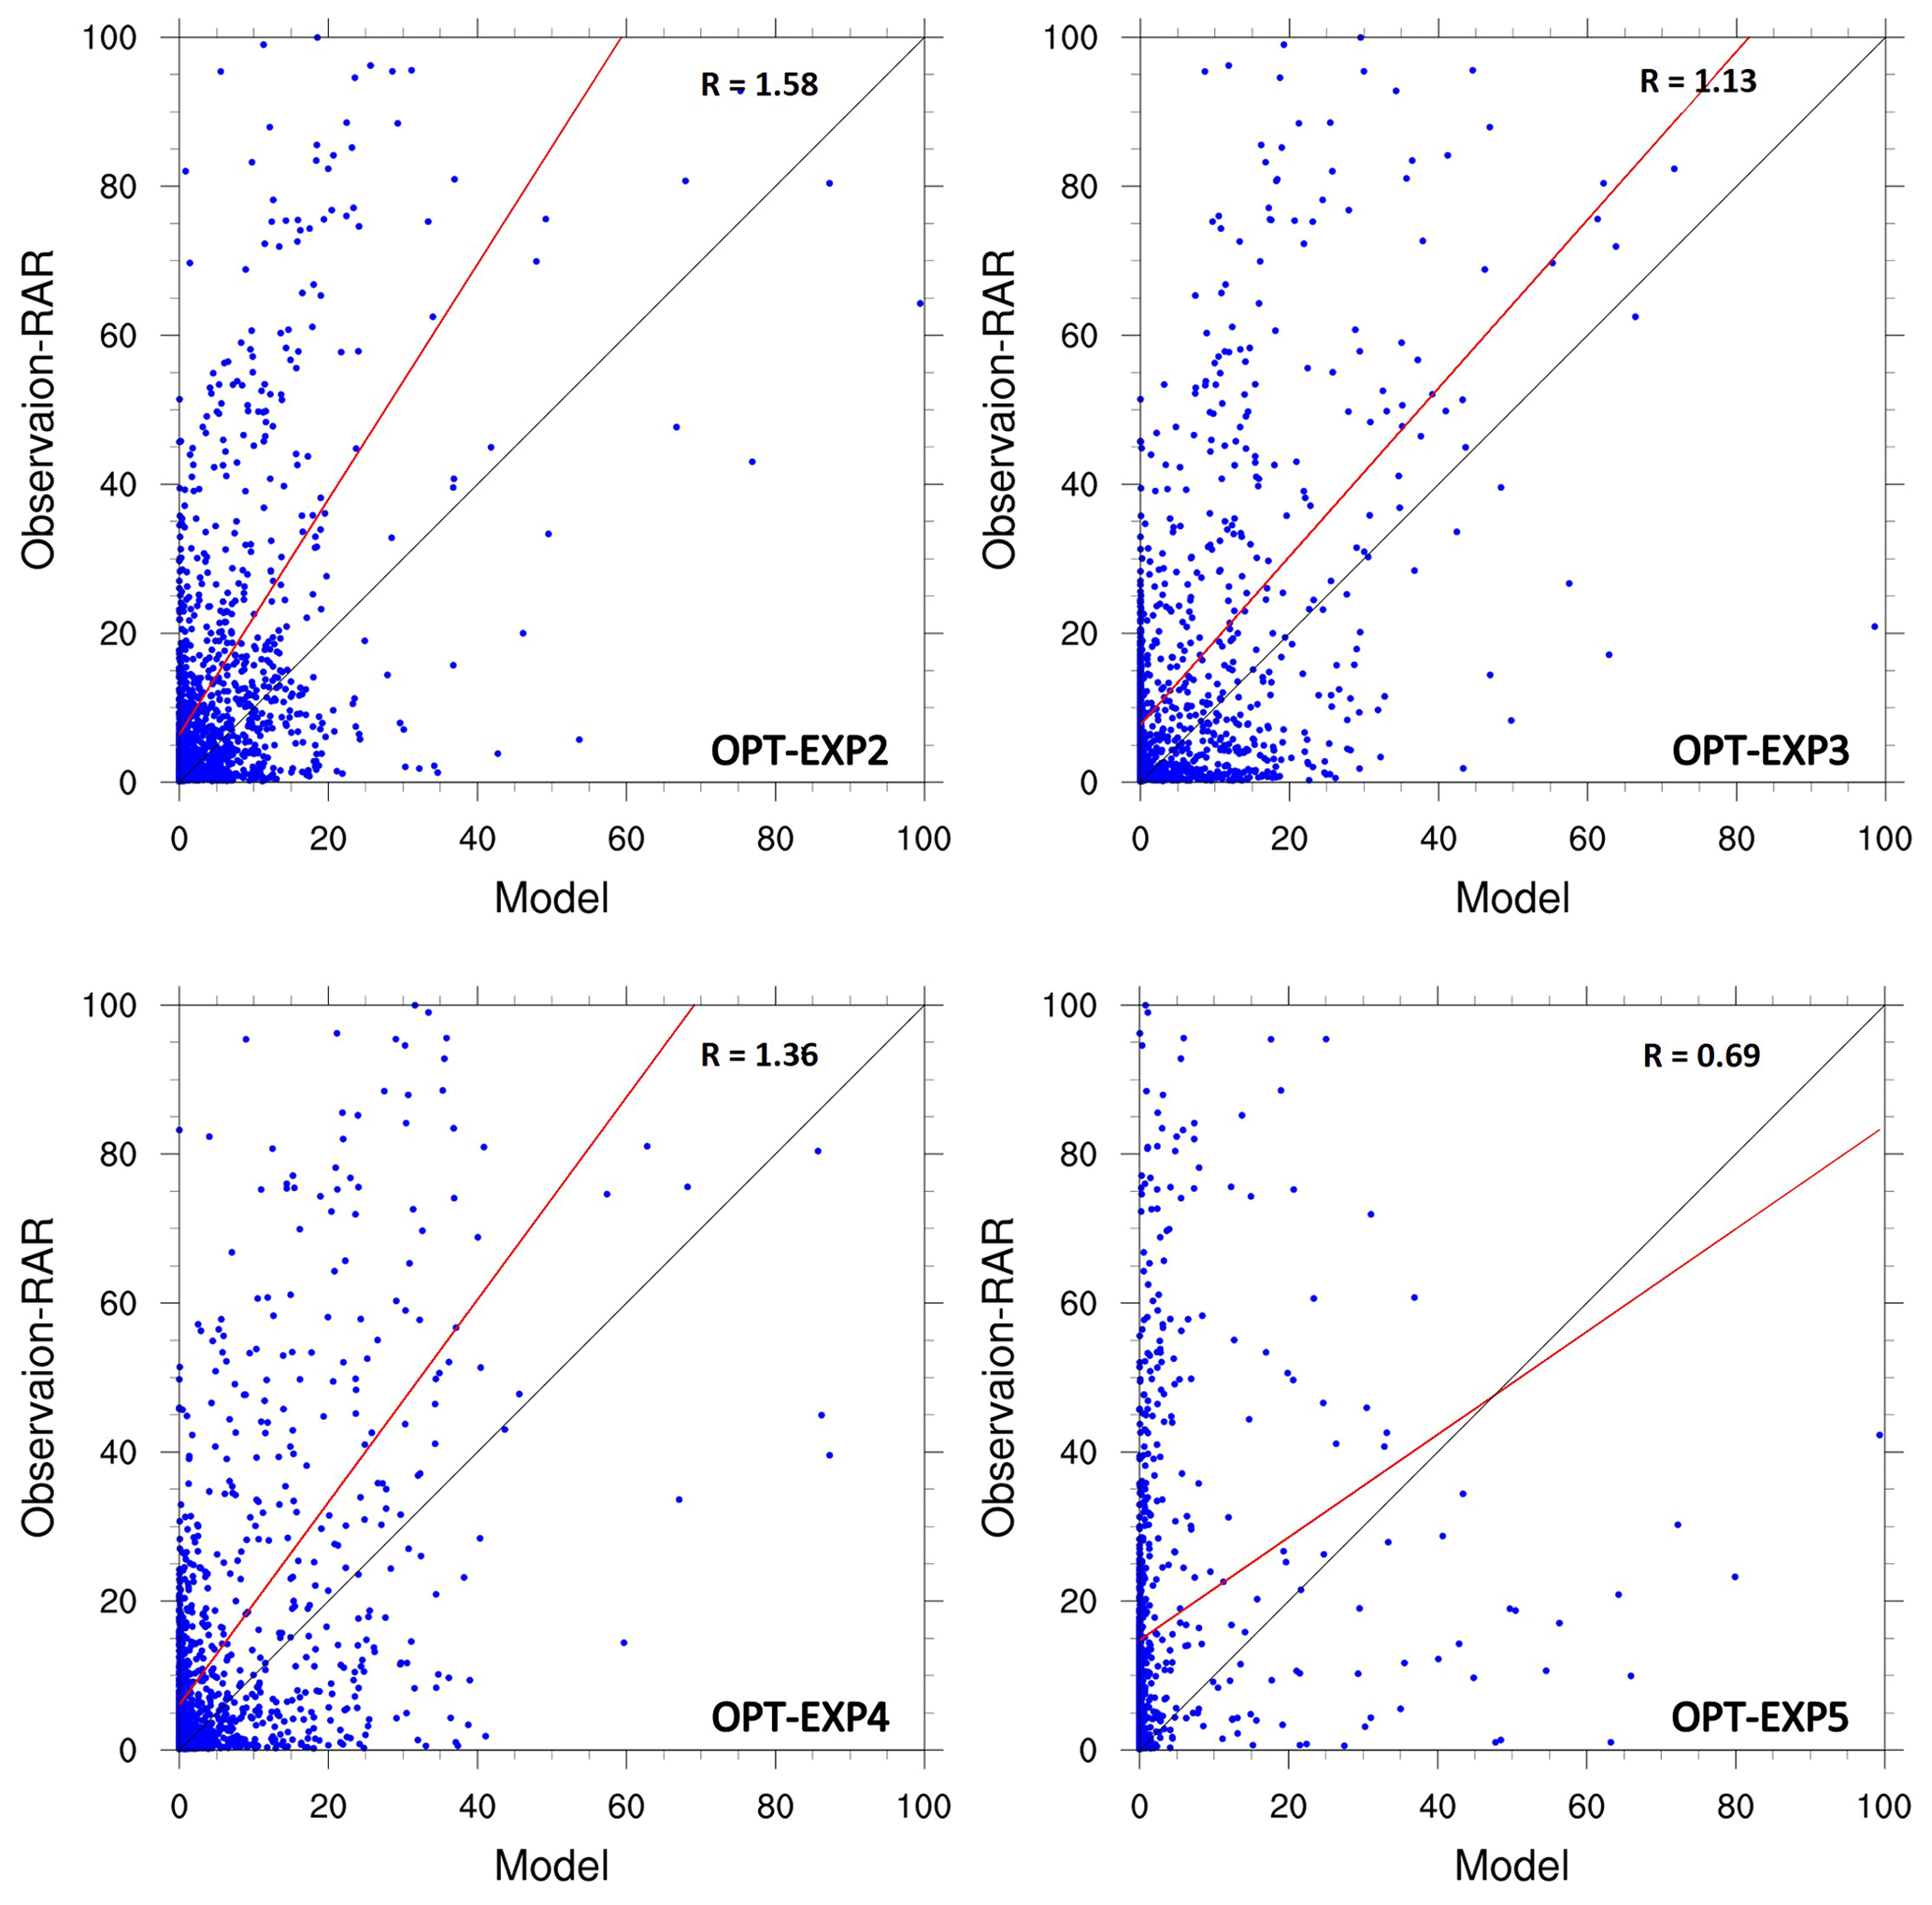
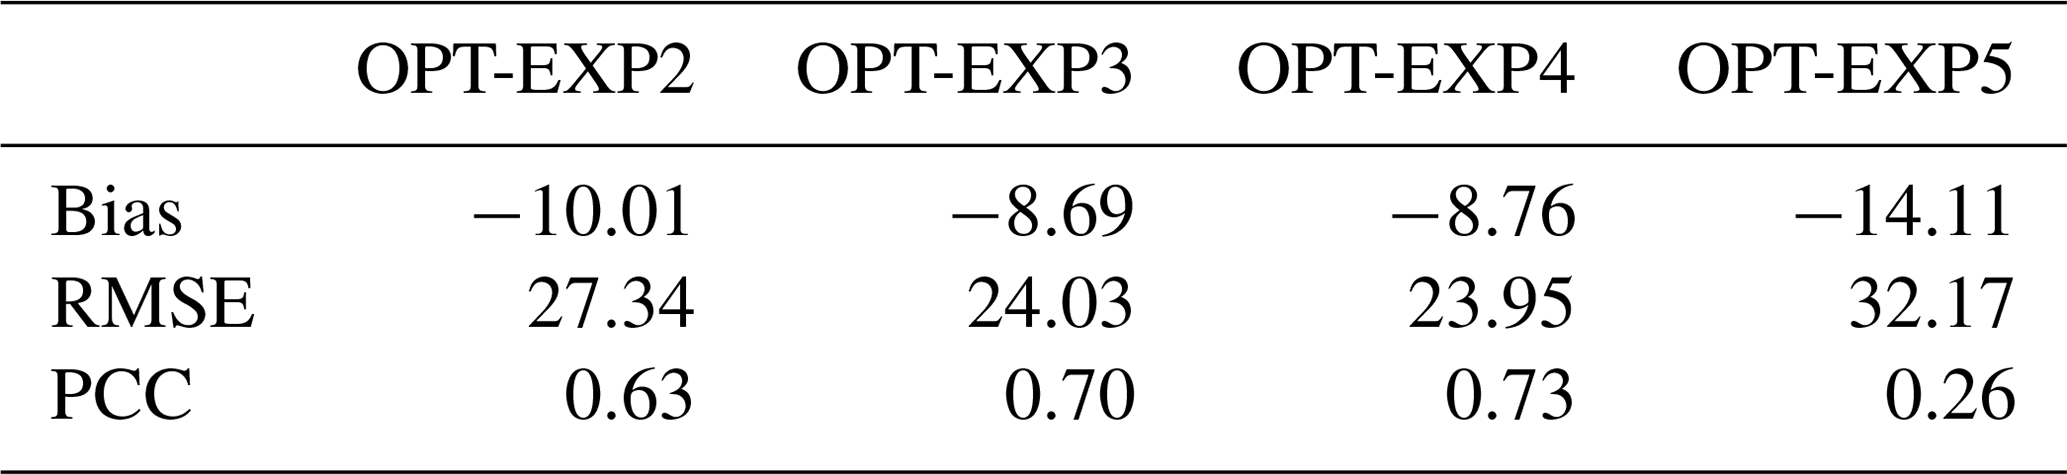
Figure 9 depicts the scatter plot for OPT-EXP2 to OPT-EXP5. In terms of observed precipitation, OPT-EXP3 and OPT-EXP4 have more accuracy than OPT-EXP2. OPT-EXP3 has the best fit for the RAR, showing a regression coefficient of 1.13, followed by OPT-EXP4. Moreover, OPT-EXP4 has the lowest RMSE and the greatest PCC of precipitation (23.952 and 0.731, respectively) (Table 7). OPT-EXP3 has the lowest spatial mean bias (−8.690). In terms of fitness, OPT-EXP2 is superior, but OPT-EXP3 and OPT-EXP4 show better simulations in terms of both the spatial distribution and continuous statistics.
In this section, the sensitivity of the accumulation time interval of precipitation used in the fitness function calculation (i.e., ETS) to the optimization in the µ-GA–WRF interface system was briefly examined. In the current model performance, the best result of the optimization experiments can be obtained by using the 3- or 6-hourly accumulated precipitation in the fitness function when focusing on precipitation detection. However, compared to OPT-EXP1, both the quantitative precipitation and spatial distribution in OPT-EXP1 were much more improved than other experiments (i.e., OPT-EXP2–OPT-EXP5). Therefore, in order to improve the simulations of deep convective systems, it is recommended to evaluate the precipitation accuracy at various precipitation thresholds rather than assessing the accuracy of precipitation occurrence.
4.3 Discussion
All physics schemes including the CU, MP, PBL, radiation, and surface schemes are interrelated, and a nonlinear relationship among them appeared due to the complexity of the atmospheric system. Thus, in order to accurately predict precipitation, it is necessary to explore the combination of physics schemes rather than focusing on an individual scheme. The evolutionary approach to find the optimum combination of the CU, MP, and PBL schemes can provide insightful understanding of the implemented physical schemes and their interrelationships. The accuracy of precipitation of less than 30 mm in large areas has been improved by fitted CU and PBL schemes. On the other hand, the simulation accuracy of high-intensity precipitation occurring in the small area was improved by the MP schemes. It is because the MP schemes control the grid-resolving-scale precipitation, while the CU schemes determine the subgrid-scale precipitation. In other words, a realistic parameterization of cloud microphysics is crucial for precipitation forecast in high-resolution models. Typical cumulus convection can be represented by the CU schemes at a horizontal grid spacing of about 25 km. However, the selected CU scheme (i.e., MSKF) has been improved for use in the so-called gray zone scales (e.g., 5 km used in this study); thus, it can outperform the other CU schemes. On the other hand, the KFCP scheme that is modified to better account for the presence of shallow clouds was selected for OPT-EXP2 and OPT-EXP5, possibly because their fitness functions were focused on the precipitation occurrence. Note that the single-moment MP schemes predict the mixing ratio of hydrometeors by representing the hydrometeor size, while the double-moment schemes also predict the number concentrations of hydrometeors. Thus, the double-moment schemes (e.g., NSSL two-moment, WDM 6, Morrison) can produce a reasonable concentration of large droplets for a heavy precipitation system compared to the single-moment schemes (Lim and Hong, 2010). In addition, the YSU scheme, representing the PBL process, more accurately simulates a deeper vertical mixing in the thermally induced free convection regime covering multiple vertical levels (Hong et al., 2006), thus being superior to the other schemes for the simulated precipitation.
However, it is difficult to insist that the order of fitting scheme is directly related to the importance of the scheme in QPF because of the nonlinear relationship between precipitation and the physics schemes as well as among the physics schemes. Moreover, it can be noted that the combination of the randomly selected schemes in the first generation approaches the optimal solution, allowing the fitness function to converge quickly. For example, in this study, both the PBL and CU scheme are fortunately selected to be the same as the optimum, and this combination has a higher fitness value than the other combinations. Thus, in the µ-GA evolution process, the information on the optimized CU and PBL scheme in the best individual was inherited by the elitism, and the MP scheme of the best individual was changed to be optimized through generations. The GA with a randomly selected initial population is robust in finding solutions as enough generations pass, but still the initial population affects the convergence velocity (i.e., the generation with optimal solution). As a result of sensitivity tests with different initial populations, convergence occurred after the 50th generation in one test, and the MP scheme converged earlier than the CU and PBL scheme in the other. In summary, the optimized results do not depend on the initial population of the first generation, but the initial population may affect which scheme will be optimized first.
The simulation results of Park and Park (2020) are more accurate than REF because of the different domain setting. For this case with localized heavy rainfall, more accurate precipitation simulations can be achieved when a specific region is set as a model domain or when multiple nested domains are used. However, the selected domain in this study may be reasonable to derive a general scheme combination that accurately simulates precipitation over the Korean Peninsula. It is necessary to derive a general set of physics schemes for accurate precipitation simulations through several case studies as a further study.
The uncertainties related to the subgrid-scale parameterizations significantly increase as NWP models become more complex. The accuracy of subgrid-scale parameterizations depends on both parameters in the physics schemes and the choice of the parameterization schemes for each corresponding physical process. In this study, we created the µ-GA–WRF interface to seek the optimal set of physics parameterization schemes in the WRF model. The GA is founded on natural selection and evolution to search for the optimum, and the µ-GA is an efficient version of the GA. In weather and climate studies, most GA applications have focused on optimizing the empirical parameters of NWP models to represent a real atmospheric system, while the current study attempts to find the optimal combination of the parameterization schemes, which is a novel and challenging task. Because of the nonlinear relationship among the physics schemes, it is recommended to optimize several interesting schemes concurrently in the WRF model rather than optimizing the schemes in each physics category sequentially. The GA is an appropriate optimization method in that it can handle the nonlinearity of the parameters to be optimized.
The experiments were conducted on the optimal set of the CU, MP, and PBL schemes in terms of QPF for a heavy rainfall event in Korea through the µ-GA–WRF interface system. The µ-GA successfully improved simulated precipitation in spite of the nonlinear relationship between precipitation and the physics schemes as well as among the physics schemes. The µ-GA reached its maximum evolution in the 12th generation and led to significant improvement in the ETSs, especially at the threshold range of 20–180 mm. The optimized CU, MP, and PBL schemes for this event are the MSKF, NSSL two-moment, and YSU scheme, respectively. During the evolution process, the MP schemes control grid-resolving-scale precipitation, while the CU and PBL schemes determine subgrid-scale precipitation.
We also conduct a sensitivity test of the accumulated precipitation time interval used in the fitness function (i.e., ETS) with a precipitation threshold of 3 mm. The best result of the optimization experiments has been obtained by using the 3- or 6-hourly accumulated precipitation. However, in order to improve the simulation of deep convective systems, it is recommended to evaluate the accuracy of precipitation at various precipitation thresholds (i.e., precipitation thresholds of 10, 20, 30, …, 300 mm) rather than assessing the accuracy of precipitation occurrence (e.g., precipitation threshold of 3 mm).
In recent studies, optimization experiments for parameter estimation for multiple heavy rainfall events have been conducted to obtain a set of optimal parameters to improve precipitation prediction (e.g., Duan et al., 2017; Di et al., 2018). We address the fact that the optimized scheme set obtained in this study is specific to the selected rainfall case or to the rainfall systems that occur under a similar synoptic and geographical environment; thus, it is not robust to all the precipitation cases in Korea, which depend on different mechanisms of initiation and development. As a future study, we plan to perform the combinatorial optimization of physical parameterization schemes for several heavy rainfall cases under the same category in terms of location and synoptic environment, expecting to find an optimal scheme set robust to the heavy rainfall systems in that category.
Note that prior to model simulation unknown parameters and schemes should be fitted to the regional weather and climate to reduce considerable uncertainties in NWP models. In addition, in terms of model development, all physics schemes need to be explored to simulate more accurate local weather and climate systems if sufficient computer resources and time are available. This study has demonstrated that the combinatorial optimization of physics schemes in the WRF model is one possible solution to enhance the forecast skill of regional or local prediction. We also significantly reduced the number of model simulations for optimization using the GA, one of the artificial intelligence methods. Furthermore, experiments for combined scheme-based with parameter-based optimization are essentially required to investigate the effect of parameter calibrations on the model sensitivity to scheme selections. As a further study, we strongly suggest conducting comprehensive parameter and scheme estimation to improve the model performance.
The current version of the WRF model is available from the GitHub website: https://github.com/wrf-model/WRF (last access: 13 October 2021). The GA code used in this study was developed by David L. Carroll and last updated on 2 April 2001. The current version of the GA driver is available from the following website: https://cuaerospace.com/products-services/genetic-algorithm/ga-drive-free-download (last access: 13 October 2021). The exact versions of both the WRF model and the GA driver used to produce the results in this study are archived on Zenodo (https://doi.org/10.5281/zenodo.5076930, Park and Park, 2021), along with the input data, namelist files, and scripts to run the model and produce the plots of all the simulations presented in this study. The NCEP FNL Operational Model Global Tropospheric Analyses data used for the initial and boundary conditions of the WRF model can also be downloaded from the NCAR Research Data Archive: https://doi.org/10.5065/D6M043C6 (NCEP, 2000). The RAR-estimated rainfall data were obtained by the Korea Meteorological Administration (KMA). The KMA does not provide this data set through the public service, called the “Open MET Data Portal” (https://data.kma.go.kr/resources/html/en/ncdci.html, last access: 13 October 2021), but one can obtain the data via separate request to the KMA.
SP contributed to conceptualization, experiment design, performing experiments, writing the submitted paper, data acquisition and handling, software, and graphical and formal analyses. SKP contributed to conceptualization, experiment design, supervision, funding acquisition, and project administration. All authors have read and agreed to the published version of the paper.
The contact author has declared that neither they nor their co-author has any competing interests.
Publisher's note: Copernicus Publications remains neutral with regard to jurisdictional claims in published maps and institutional affiliations.
The authors are grateful to the topical editor for handling this paper in a timely manner and two anonymous reviewers for their valuable comments.
This work was supported by the Basic Science Research Program through the National Research Foundation of Korea (NRF) funded by the Ministry of Education (2018R1A6A1A08025520) and partly funded by the Korea Meteorological Administration Research and Development Program under grant KMIPA2018-06710.
This paper was edited by Axel Lauer and reviewed by two anonymous referees.
Angevine, W. M., Jiang, H., and Mauritsen, T.: Performance of an eddy diffusivity-mass flux scheme for shallow cumulus boundary layers, Mon. Weather Rev., 138, 2895–2912, https://doi.org/10.1175/2010MWR3142.1, 2010.
Azadivar, F. and Tompkins, G.: Simulation optimization with qualitative variables and structural model changes: A genetic algorithm approach, Eur. J. Oper. Res., 113, 169–182, 1999.
Babbar-Sebens, M. and Minsker, B.: A Case-Based Micro Interactive Genetic Algorithm (CBMIGA) for interactive learning and search: Methodology and application to groundwater monitoring design, Environ. Model. Softw., 25, 1176–1187, https://doi.org/10.1016/j.envsoft.2010.03.027, 2010.
Behzadian, K., Kapelan, Z., Savic, D., and Ardeshir, A.: Stochastic sampling design using a multi-objective genetic algorithm and adaptive neural networks, Environ. Model. Softw., 24, 530–541, https://doi.org/10.1016/j.envsoft.2008.09.013, 2009.
Berg, L. K., Gustafson, W. I., Kassianov, E. I., and Deng, L.: Evaluation of a modified scheme for shallow convection: Implementation of CuP and case studies, Mon. Weather Rev., 141, 134–147, 2013.
Bougeault, P. and Lacarrère, P.: Parameterization of orography-induced turbulence in a mesobeta-scale model, Mon. Weather Rev., 117, 1872–1890, https://doi.org/10.1175/1520-0493(1989)117<1872:POOITI>2.0.CO;2, 1989.
Bretherton, C. S. and Park, S.: A new moist turbulence parameterization in the Community Atmosphere Model, J. Climate, 22, 3422–3448, https://doi.org/10.1175/2008JCLI2556.1, 2009.
Brown, A., Milton, S., Cullen, M., Golding, B., Mitchell, J., and Shelly, A.: Unified modeling and prediction of weather and climate: A 25-year journey, B. Am. Meteorol. Soc., 93, 1865–1877, 2012.
Chen, D., Leon, A. S., Engle, S. P., Fuentes, C., and Chen, Q.: Offline training for improving online performance of a genetic algorithm based optimization model for hourly multi-reservoir operation, Environ. Model. Softw., 96, 46–57, https://doi.org/10.1016/j.envsoft.2017.06.038, 2017.
Chen, F., Mitchell, K., Schaake, J., Xue, Y., Pan, H. L., Koren, V., Duan, Q. Y., Ek, M., and Betts, A. Modeling of land surface evaporation by four schemes and comparison with FIFE observations, J. Geophys. Res.-Atmos., 101, 7251–7268, https://doi.org/10.1029/95JD02165, 1996.
Chen, S.-H. and Sun, W.-Y.: A one-dimensional time dependent cloud model, J. Meteorol. Soc. Jpn., 80, 99–118, https://doi.org/10.2151/jmsj.80.99, 2002.
Cohen, A. E., Cavallo, S. M., Coniglio, M. C., and Brooks, H. E.: A review of planetary boundary layer parameterization schemes and their sensitivity in simulating southeastern US cold season severe weather environments, Weather Forecast., 30, 591–612, 2015.
Crétat, J., Pohl, B., Richard, Y., and Drobinski, P.: Uncertainties in simulating regional climate of Southern Africa: sensitivity to physical parameterizations using WRF, Clim. Dynam., 38, 613–634, 2012.
Cullen, M. J. P.: The unified forecast/climate model, Meteorol. Mag., 122, 81–94, 1993.
Dandy, G. C. and Engelhardt, M.: Optimal scheduling of pipe replacement using genetic algorithms, J. Water Resour. Pl., 127, 214–223, 2001.
Davis, J. K., Gebrehiwot, T., Worku, M., Awoke, W., Mihretie, A., Nekorchuk, D., and Wimberly, M. C.: A genetic algorithm for identifying spatially-varying environmental drivers in a malaria time series model, Environ. Model. Softw., 119, 275–284, https://doi.org/10.1016/j.envsoft.2019.06.010, 2019.
Di, Z., Duan, Q., Wang, C., Ye, A., Miao, C., and Gong, W.: Assessing the applicability of WRF optimal parameters under the different precipitation simulations in the Greater Beijing Area, Clim. Dynam., 50, 1927–1948, 2018.
Duan, Q., Di, Z., Quan, J., Wang, C., Gong, W., Gan, Y., Ye, A., Miao, C., Miao, S., Liang, X., and Fan, S.: Automatic model calibration: A new way to improve numerical weather forecasting, B. Am. Meteorol. Soc., 98, 959–970, 2017.
Dudhia, J.: Numerical study of convection observed during the winter monsoon experiment using a mesoscale two-dimensional model, J. Atmos. Sci., 46, 3077–3107, https://doi.org/10.1175/1520-0469(1989)046<3077:NSOCOD>2.0.CO;2, 1989.
Eaton, B.: User's Guide to the Community Atmosphere Model CAM-5.1, available at: http://www.cesm.ucar.edu/models/cesm1.0/cam (last access: 1 May 2021), 2011.
Evans, J. P., Ekström, M., and Ji, F.: Evaluating the performance of a WRF physics ensemble over South-East Australia, Clim. Dynam., 39, 1241–1258, 2012.
Glotfelty, T., Alapaty, K., He, J., Hawbecker, P., Song, X., and Zhang, G.: The Weather Research and Forecasting Model with Aerosol–Cloud Interactions (WRF-ACI): development, evaluation, and initial application, Mon. Weather Rev., 147, 1491–1511, 2019.
Grell, G. A.: Prognostic evaluation of assumptions used by cumulus parameterizations, Mon. Weather Rev., 121, 764–787, https://doi.org/10.1175/1520-0493(1993)121<0764:PEOAUB>2.0.CO;2, 1993.
Grell, G. A. and Devenyi, D.: A generalized approach to parameterizing convection combining ensemble and data assimilation techniques, Geophys. Res. Lett., 29, 38-1–38-4, https://doi.org/10.1029/2002GL015311, 2002.
Grell, G. A. and Freitas, S. R.: A scale and aerosol aware stochastic convective parameterization for weather and air quality modeling, Atmos. Chem. Phys., 14, 5233–5250, https://doi.org/10.5194/acp-14-5233-2014, 2014.
Grenier, H. and Bretherton, C. S.: A moist PBL parameterization for large-scale models and its application to subtropical cloud-topped marine boundary layers, Mon. Weather Rev., 129, 357–377, https://doi.org/10.1175/1520-0493(2001)129<0357:AMPPFL>2.0.CO;2, 2001.
Gupta, I., Gupta, A., and Khanna, P.: Genetic algorithm for optimization of water distribution systems, Environ. Model. Softw., 14, 437–446, 1999.
Halhal, D., Walters, G. A., Ouazar, D., and Savic, D.A.: Water network rehabilitation with structured messy genetic algorithms, J. Water Resour. Pl., 123, 137–146, 1997.
Hamill, T. M.: Hypothesis tests for evaluating numerical precipitation forecasts, Weather Forecast., 14, 155–167, 1999.
Han, J. and Pan, H.-L.: Revision of convection and vertical diffusion schemes in the NCEP Global Forecast System, Weather Forecast., 26, 520–533, https://doi.org/10.1175/WAF-D-10-05038.1, 2011.
Hong, S., Yu, X., Park, S. K., Choi, Y.-S., and Myoung, B.: Assessing optimal set of implemented physical parameterization schemes in a multi-physics land surface model using genetic algorithm, Geosci. Model Dev., 7, 2517–2529, https://doi.org/10.5194/gmd-7-2517-2014, 2014.
Hong, S., Park, S. K., and Yu, X.: Scheme-based optimization of land surface model using a micro-genetic algorithm: Assessment of its performance and usability for regional applications, SOLA, 11, 129–133, https://doi.org/10.2151/sola.2015-030, 2015.
Hong, S.-Y. and Lim, J.-O. J.: The WRF single-moment 6-class microphysics scheme (WSM6), J. Korean Meteor. Soc., 42, 129–151, 2006.
Hong, S.-Y. and Pan, H.-L.: Nonlocal boundary layer vertical diffusion in a medium-range forecast model, Mon. Weather Rev., 124, 2322–2339, https://doi.org/10.1175/1520-0493(1996)124<2322:NBLVDI>2.0.CO;2, 1996.
Hong, S.-Y., Dudhia, J., and Chen, S.-H.: A revised approach to ice microphysical processes for the bulk parameterization of clouds and precipitation, Mon. Weather Rev., 132, 103–120, https://doi.org/10.1175/1520-0493(2004)132<0103:ARATIM>2.0.CO;2, 2004.
Hong, S.-Y., Noh, Y., and Dudhia, J.: A new vertical diffusion package with an explicit treatment of entrainment processes, Mon. Weather Rev., 134, 2318–2341, https://doi.org/10.1175/MWR3199.1, 2006.
Hong, S. Y., Kwon, Y. C., Kim, T. H., Kim, J. E. E., Choi, S. J., Kwon, I. H., Kim, J., Lee, E.-H., Park, R.-S., and Kim, D. I.: The Korean Integrated Model (KIM) system for global weather forecasting, Asia-Pac. J. Atmos. Sci., 54, 267–292, 2018.
Jamil, M. and Yang, X.-S.: A literature survey of benchmark functions for global optimization problems, Int. Journal of Mathematical Modelling and Numerical Optimisation, 4, 150–194, https://doi.org/10.1504/IJMMNO.2013.055204, 2013.
Janjic, Z. I.: The Step-mountain eta coordinate model: further developments of the convection, viscous sublayer, and turbulence closure schemes, Mon. Weather Rev., 122, 927–945, https://doi.org/10.1175/1520-0493(1994)122<0927:TSMECM>2.0.CO;2, 1994.
Janjic, Z. I.: The surface layer in the NCEP Eta Model, Eleventh Conference on Numerical Weather Prediction, 19–23 August 1996, Norfolk, VA, Amer. Meteor. Soc. 354–355, 1996.
Janjic, Z. I.: Nonsingular implementation of the Mellor–Yamada level 2.5 scheme in the NCEP meso model, National Centres for Environmental Prediction (NCEP) Office Note, 437, Camp Springs, 61 pp., 2002.
Jimenez, P. A., Dudhia, J., Gonzalez-Rouco, J. F., Navarro, J., Montavez, J. P., and Garcia-Bustamante, E.: A revised scheme for the WRF surface layer formulation, Mon. Weather Rev., 140, 898–918, https://doi.org/10.1175/MWR-D-11-00056.1, 2012.
Kain, J. S.: The Kain-Fritsch convective parameterization: an update, J. Appl. Meteorol., 43, 170–181, https://doi.org/10.1175/1520-0450(2004)043<0170:TKCPAU>2.0.CO;2, 2004.
Kain, J. S. and Fritsch, J. M.: A one-dimensional entraining/detraining plume model and its application in convective parameterization, J. Atmos. Sci., 47, 2784–2802, https://doi.org/10.1175/1520-0469(1990)047<2784:AODEPM>2.0.CO;2, 1990.
Kessler, E.: On the distribution and continuity of water substance in atmospheric circulations, Meteorol. Monogr., 10, Amer. Meteor. Soc., Boston, https://doi.org/10.1007/978-1-935704-36-2_1, 1969.
KMA: A report on damages by meteorological disasters in 2018, available at: https://www.weather.go.kr/weather/lifenindustry/disaster_01.jsp (last access: 1 May 2021), 2020.
Krishnakumar, K.: Micro-genetic algorithms for stationary and nonstationary function optimization, SPIE intelligent Control and Adaptive Systems, 1196, 289–296, 1989.
Koren, V., Schaake, J., Mitchell, K., Duan, Q. Y., Chen, F., and Baker, J. M.: A parameterization of snowpack and frozen ground intended for NCEP weather and climate models, J. Geophys. Res.-Atmos., 104, 19569–19585, https://doi.org/10.1029/1999JD900232, 1999.
Kwon, Y.-C. and Hong, S.-Y.: A mass-flux cumulus parameterization scheme across gray-zone resolutions, Mon. Weather Rev., 145, 585–598, https://doi.org/10.1175/MWR-D-16-0034.1, 2017.
Lee, Y. H., Park, S. K., and Chang, D.-E.: Parameter estimation using the genetic algorithm and its impact on quantitative precipitation forecast, Ann. Geophys., 24, 3185–3189, https://doi.org/10.5194/angeo-24-3185-2006, 2006.
Lim, K.-S. S. and Hong, S.-Y.: Development of an effective double-moment cloud microphysics scheme with prognostic cloud condensation nuclei (CCN) for weather and climate models, Mon. Weather Rev., 138, 1587–1612, https://doi.org/10.1175/2009MWR2968.1, 2010.
Lin, Y. and Colle, B. A.: A new bulk microphysical scheme that includes riming intensity and temperature-dependent ice characteristics, Mon. Weather Rev., 139, 1013–1035, https://doi.org/10.1175/2010MWR3293.1, 2011.
Mansell, E. R., Ziegler, C. L., and Bruning, E. C.: Simulated electrification of a small thunderstorm with two-moment bulk microphysics, J. Atmos. Sci., 67, 171–194, https://doi.org/10.1175/2009JAS2965.1, 2010.
Milbrandt, J. A. and Yau, M. K.: A multimoment bulk microphysics parameterization. Part I: analysis of the role of the spectral shape parameter, J. Atmos. Sci., 62, 3051–3064, https://doi.org/10.1175/JAS3534.1, 2005a.
Milbrandt, J. A. and Yau, M. K.: A multimoment bulk microphysics parameterization. Part II: a proposed three-moment closure and scheme description, J. Atmos. Sci., 62, 3065–3081, https://doi.org/10.1175/JAS3535.1, 2005b.
Mlawer, E. J., Taubman, S. J., Brown, P. D., Iacono, M. J., and Clough, S. A.: Radiative transfer for inhomogeneous atmospheres: RRTM, a validated correlated-k model for the longwave, J. Geophys. Res.-Atmos., 102, 16663–16682, https://doi.org/10.1029/97JD00237, 1997.
Monin, A. S. and Obukhov, A. M.: Basic laws of turbulent mixing in the surface layer of the atmosphere, Tr. Akad. Nauk SSSR Geophiz. Inst., 24, 163–187, 1954 (in Russian).
Morrison, H. and Milbrandt, J. A.: Parameterization of cloud microphysics based on the prediction of bulk ice particle properties. Part I: scheme description and idealized tests, J. Atmos. Sci., 72, 287–311, https://doi.org/10.1175/JAS-D-14-0065.1, 2015.
Morrison, H., Thompson, G., and Tatarskii, V.: Impact of cloud microphysics on the development of trailing stratiform precipitation in a simulated squall line: comparison of one- and two-moment schemes, Mon. Weather Rev., 137, 991–1007, https://doi.org/10.1175/2008MWR2556.1, 2009.
Nakanishi, M. and Niino, H.: An improved Mellor-Yamada level 3 model: its numerical stability and application to a regional prediction of advecting fog, Bound.-Lay. Meteorol., 119, 397–407, https://doi.org/10.1007/s10546-005-9030-8, 2006.
Nakanishi, M. and Niino, H.: Development of an improved turbulence closure model for the atmospheric boundary layer, J. Meteorol. Soc. Jpn., 87, 895–912, https://doi.org/10.2151/jmsj.87.895, 2009.
NCEP (National Centers for Environmental Prediction/National Weather Service/NOAA/U.S. Department of Commerce): NCEP FNL Operational Model Global Tropospheric Analyses, continuing from July 1999, Research Data Archive at the National Center for Atmospheric Research [data set], Computational and Information Systems Laboratory, https://doi.org/10.5065/D6M043C6, 2000.
Niu, G.-Y., Yang, Z.-L., Mitchell, K. E., Chen, F., Ek, M. B., Barlage, M., Kumar, A., Manning, K., Niyogi, D., Rosero, E., Tewari, M., and Xia, Y.: The community Noah land surface model with multi-parameterization options (Noah-MP): 1. Model description and evaluation with local-scale measurements, J. Geophys. Res., 116, D12109, https://doi.org/10.1029/2010JD015139, 2011.
NOAA: National Oceanic and Atmospheric Administration changes to the NCEP meso eta analysis and forecast system: increase in resolution, new cloud microphysics, modified precipitation assimilation, modified 3DVAR analysis, available at: https://www.emc.ncep.noaa.gov/mmb/research/eta.log.html (last access: 1 May 2021), 2001.
Olson, J. B., Kenyon, J. S., Angevine, W. M., Brown, J. M., Pagowski, M., and Sušelj, K.: A description of the MYNN-EDMF scheme and the coupling to other components in WRF-ARW, NOAA Technical Memorandum OAR GSD, 61, https://doi.org/10.25923/n9wm-be49, 2019.
Pan, H. L. and Wu, W. S.: Implementing a mass flux convective parameterization package for the NMC medium range forecast model, NMC office note, 409, 1–43, available at: https://repository.library.noaa.gov/view/noaa/11429 (last access: 1 May 2021), 1995.
Park, S. and Park, S. K.: Genetic Algorithm and WRF model v4.0.3, Zenodo [code], https://doi.org/10.5281/zenodo.5076930, 2021.
Park, S., Park, S. K., Lee, J. W., and Park, Y.: Geostatistical assessment of warm-season precipitation observations in Korea based on the composite precipitation and satellite water vapor data, Hydrol. Earth Syst. Sci., 22, 3435–3452, https://doi.org/10.5194/hess-22-3435-2018, 2018.
Park, S. K. and Park, S.: On a Flood-Producing Coastal Mesoscale Convective Storm Associated with the Kor'easterlies: Multi-Data Analyses Using Remotely-Sensed and In-Situ Observations and Storm-Scale Model Simulations, Remote Sens., 12, 1532, https://doi.org/10.3390/rs12091532, 2020.
Pleim, J. E.: A combined local and nonlocal closure model for the atmospheric boundary layer. Part I: model description and testing, J. Appl. Meteor. Clim., 46, 1383–1395, https://doi.org/10.1175/JAM2539.1, 2007.
Pilar, M., Adela, G. G., and Jose, L. A.: Water distribution network optimization using a modified genetic algorithms, Water Resour. Res., 35, 3467–3473, 1999.
Rossa A., Nurmi, P., and Ebert, E: Overview of methods for the verification of quantitative precipitation forecasts. Precipitation: Advances in Measurement, Estimation and Prediction, Springer, Berlin, 419–452, https://doi.org/10.1007/978-3-540-77655-0_16, 2008.
Savic, D. A. and Walters, G. A.: Genetic algorithms for least-cost design of water distribution networks, J. Water Res. Pl., 123, 67–77, 1997.
Shin, H. H. and Hong, S.-Y.: Representation of the subgrid-scale turbulent transport in convective boundary layers at gray-zone resolutions, Mon. Weather Rev., 143, 250–271, https://doi.org/10.1175/MWR-D-14-00116.1, 2015.
Simpson, A. R., Dandy, G. C., and Murphy, L. J.: Genetic algorithms compared to other techniques for pipe optimization, J. Water Res. Pl., 120, 423–443, 1994.
Song, H. J. and Sohn, B. J.: An evaluation of WRF microphysics schemes for simulating the warm-type heavy rain over the Korean peninsula, Asia-Pac. J. Atmos. Sci., 54, 225–236, 2018.
Suk, M.-K., Chang, K.-H., Cha, J.-W., and Kim, K.-E.: Operational real-time adjustment of radar rainfall estimation over the South Korea region, J. Meteorol. Soc. Jpn., 91, 545–554, https://doi.org/10.2151/jmsj.2013-409, 2013.
Sukoriansky, S., Galperin, B., and Perov, V.: Application of a new spectral model of stratified turbulence to the atmospheric boundary layer over sea ice, Bound.-Lay. Meteorol., 117, 231–257, https://doi.org/10.1007/s10546-004-6848-4, 2005.
Tao, W.-K., Simpson, J., and McCumber, M.: An ice-water saturation adjustment, Mon. Weather Rev., 117, 231–235, https://doi.org/10.1175/1520-0493(1989)117<0231:AIWSA>2.0.CO;2, 1989.
Tao, W.-K., Wu, D., Lang, S., Chern, J.-D., Peters-Lidard, C., Fridlind, A., and Matsui, T.: High-resolution NU-WRF simulations of a deep convective-precipitation system during MC3E: Further improvements and comparisons between Goddard microphysics schemes and observations, J. Geophys. Res.-Atmos., 121, 1278–1305, https://doi.org/10.1002/2015JD023986, 2016.
Thompson, G., Field, P. R., Rasmussen, R. M., and Hall, W. D.: Explicit forecasts of winter precipitation using an improved bulk microphysics scheme. Part II: implementation of a new snow parameterization, Mon. Weather Rev., 136, 5095–5115, https://doi.org/10.1175/2008MWR2387.1, 2008.
Tiedtke, M.: A comprehensive mass flux scheme for cumulus parameterization in large-scale models, Mon. Weather Rev., 117, 1779–1800, https://doi.org/10.1175/1520-0493(1989)117<1779:ACMFSF>2.0.CO;2, 1989.
Weng, H. T. and Liaw, S. L.: Establishing an optimization model for sewer system layout with applied genetic algorithm, J. Environ. Inform., 5, 26–35, 2005.
Yu, X., Park, S. K., Lee, Y. H., and Choi, Y.-S.: Quantitative precipitation forecast of a tropical cyclone through optimal parameter estimation in a convective parameterization, SOLA, 9, 36–39, 2013.
Zhang, C., Wang, Y., and Hamilton, K.: Improved representation of boundary layer clouds over the southeast Pacific in ARW-WRF using a modified Tiedtke cumulus parameterization scheme, Mon. Weather Rev., 139, 3489–3513, https://doi.org/10.1175/MWR-D-10-05091.1, 2011.
Zheng, Y., Alapaty, K., Herwehe, J. A., Del Genio, A. D., and Niyogi, D.: Improving high-resolution weather forecasts using the Weather Research and Forecasting (WRF) Model with an updated Kain-Fritsch scheme, Mon. Weather Rev., 114, 833–860, https://doi.org/10.1175/MWR-D-15-0005.1, 2016.