the Creative Commons Attribution 4.0 License.
the Creative Commons Attribution 4.0 License.
 | 20 Aug 2021
Improvements to the representation of BVOC chemistry–climate interactions in UKCA (v11.5) with the CRI-Strat 2 mechanism: incorporation and evaluation
Scott Archer-Nicholls
Nathan Luke Abraham
Youngsub M. Shin
Thomas J. Bannan
Carl J. Percival
Asan Bacak
Paulo Artaxo
Michael Jenkin
M. Anwar H. Khan
Dudley E. Shallcross
Rebecca H. Schwantes
Jonathan Williams
Alex T. Archibald
We present the first incorporation of the Common Representative Intermediates version 2.2 tropospheric chemistry mechanism, CRI v2.2, combined with stratospheric chemistry, into the global chemistry–climate United Kingdom Chemistry and Aerosols (UKCA) model to give the CRI-Strat 2 mechanism. A rigorous comparison of CRI-Strat 2 with the earlier version, CRI-Strat, is performed in UKCA in addition to an evaluation of three mechanisms, CRI-Strat 2, CRI-Strat and the standard UKCA chemical mechanism, StratTrop v1.0, against a wide array of surface and airborne chemical data.
CRI-Strat 2 comprises a state-of-the-art isoprene scheme, optimized against the Master Chemical Mechanism v3.3.1, which includes isoprene peroxy radical isomerization, HOx recycling through the addition of photolabile hydroperoxy aldehydes (HPALDs), and isoprene epoxy diol (IEPOX) formation. CRI-Strat 2 also features updates to several rate constants for the inorganic chemistry, including the reactions of inorganic nitrogen and O(1D).
The update to the isoprene chemistry in CRI-Strat 2 increases OH over the lowest 500 m in tropical forested regions by 30 %–50 % relative to CRI-Strat, leading to an improvement in model–observation comparisons for surface OH and isoprene relative to CRI-Strat and StratTrop. Enhanced oxidants also cause a 25 % reduction in isoprene burden and an increase in oxidation fluxes of isoprene and other biogenic volatile organic compounds (BVOCs) at low altitudes with likely impacts on subsequent aerosol formation, atmospheric lifetime, and climate.
By contrast, updates to the rate constants of O(1D) with its main reactants relative to CRI-Strat reduces OH in much of the free troposphere, producing a 2 % increase in the methane lifetime, and increases the tropospheric ozone burden by 8 %, primarily from reduced loss via O(1D)+H2O. The changes to inorganic nitrogen reaction rate constants increase the NOx burden by 4 % and shift the distribution of nitrated species closer to that simulated by StratTrop.
CRI-Strat 2 is suitable for multi-decadal model integrations and the improved representation of isoprene chemistry provides an opportunity to explore the consequences of HOx recycling in the United Kingdom Earth System Model (UKESM1). This new mechanism will enable a re-evaluation of the impact of BVOCs on the chemical composition of the atmosphere and further probe the feedback between the biosphere and the climate.
- Article
(4930 KB) - Full-text XML
-
Supplement
(4570 KB) - BibTeX
- EndNote


Isoprene (2-methyl-1,3-butadiene) makes up 70 % of all non-methane biogenic volatile organic compound (BVOC) emissions, with annual average emissions of 594±34 Tg C yr−1 over the period 1980–2010 (Sindelarova et al., 2014). Isoprene's rapid chemical oxidation in the atmosphere by OH, O3, and NO3 directly affects the tropospheric oxidizing capacity, ozone burden, and the processing of other trace gases like methane (e.g. Archibald et al., 2011; Khan et al., 2020), while also serving as an important source of secondary organic aerosol (SOA) (e.g. Scott et al., 2014; Kelly et al., 2018; Claeys and Maenhaut, 2021). Thus, isoprene has substantial effects on the radiative balance of the atmosphere, both directly via production of SOA and ozone and indirectly via its changes to the oxidizing capacity of the atmosphere, influencing methane lifetime and production of other aerosol species, such as from oxidation of monoterpenes and SO2 (Unger et al., 2014; Makonnen et al., 2012; Sporre et al., 2020). An accurate representation of isoprene chemistry in climate models is essential to understanding the feedbacks between the biosphere and the rest of the Earth system and thus capturing isoprene's climatic impact.
However, the treatment of isoprene in the chemistry schemes of many climate models is outdated or oversimplified (e.g. Squire et al., 2015). The last decade has seen significant advances in our understanding of the isoprene oxidation pathway, principally the concept of rapid, intramolecular hydrogen shifts (H-shifts), also termed isomerization reactions, in the isoprene hydroxy peroxy radicals (frequently termed ISOPOO). Predictions from theoretical work (Peeters et al., 2009; Peeters et al., 2014) and observations (Crounse et al., 2011; Teng et al., 2017; Wennberg et al., 2018) have established this pathway to be competitive with the traditional bimolecular reactions of the peroxy radical with NO, NO3, HO2, and RO2 in certain conditions such as low NO environments. These H-shift reactions lead to the production of HO either directly or indirectly following the degradation of the isomerization products (e.g. Archibald et al., 2011; Jenkin et al., 2015; Wennberg et al., 2018).
This process, termed HOx recycling, has been shown to be important for low-NOx, high-isoprene regions of the atmosphere (Butler et al., 2008; Lelieveld et al., 2008). By adding a simple, fixed-yield OH production pathway from ISOPOO to represent OH production from hydroperoxy aldehydes (HPALDs), Archibald et al. (2011) simulated an 8 %–18 % increase in tropospheric O3 burden, while the tropospheric OH burden increased by 17 % in the present day (PD) and by 50 % in a pre-industrial (PI) atmosphere featuring 1860 emissions of key chemical species such as NOx, CO, and isoprene. Consequently, the lifetime of methane was predicted to decrease by between 11 % (in a future climate scenario) and 35 % (in the PI). This illustrated the significant impact that such a process could have on our understanding of the PI atmosphere (and the radiatively active components therein) and thus the PD–PI change and climate sensitivity. While the greatest change to the chemistry was simulated in the boundary layer (BL), convection of isoprene and its oxidation products into the free troposphere resulted in this added chemistry having global impacts.
The effect on oxidants from HOx recycling influences the lifetimes of isoprene and other BVOCs such as monoterpenes and thus the extent of their dispersion and the location of the subsequent SOA formation. Karset et al. (2018) found that when lower oxidant fields were applied to the PI atmosphere, isoprene, monoterpenes, SO2, and other key aerosol precursors were more dispersed from their sources, reaching higher altitudes and enhancing particle number concentration in the remote free troposphere. The radiative impact of the resulting aerosols was greater due to their enhanced lifetime (from slower deposition) and the highly non-linear relationship between aerosol number and cloud forcing, where the addition of a given concentration of aerosol has a much greater impact in remote regions where the background concentration of aerosol is smaller (Chen et al., 2016). The importance of oxidants to BVOCs and aerosol was also shown in Sporre et al. (2020) where models with an interactive oxidant scheme simulated a BVOC-driven depletion of oxidants and attendant greater dispersion of BVOCs and their oxidation products (including SOA precursors). In contrast, a prescribed oxidant approach saw BVOC oxidation confined far more to source regions, reducing dispersion.
Changes in oxidant fields also perturb the oxidation pathways of SO2. In the United Kingdom Chemistry and Aerosols (UKCA) model, SO2 can be oxidized in the gas phase by OH (to yield H2SO4) or in the aqueous phase by O3 or H2O2 (Mulcahy et al., 2020). This has consequences for the aerosol mass and number distributions because only H2SO4 can nucleate new particles in UKCA; therefore, amplifying the gas-phase pathway over the aqueous pathways leads to a greater number of smaller aerosols. Thus, uneven changes to these pathways can alter the size and number distribution of the aerosol population, affecting the radiative properties of aerosols and clouds. Decreases in OH in other UKCA studies (Weber et al., 2020a; O'Connor et al., 2021) have resulted in simulated reductions in particle number concentration and cloud droplet number concentration. The resulting negative cloud radiative forcing is smaller in magnitude, as the lower cloud droplet number concentration (CDNC) makes the clouds less “bright” (Twomey, 1974). The impact of different oxidant schemes on the burden and lifetime of dimethylsulfide (DMS), an important SO2 precursor, and the impact on sulfate aerosol transport are both highlighted by Mulcahy et al. (2020).
While Archibald et al. (2011) used a relatively simple approach to simulate HOx recycling, further advances in the chemical understanding have led to a near-explicit representation of HOx recycling being incorporated into comprehensive mechanisms, including the Master Chemical Mechanism (MCM v3.3.1) (Jenkin et al., 2015) and the CalTech isoprene scheme (Wennberg et al., 2018). However, such mechanisms are far too large for use in global chemistry–climate models.
There exist a few reduced mechanisms featuring this state-of-the-art isoprene chemistry suitable for use in chemistry–climate models, including the CalTech reduced isoprene scheme (Bates et al., 2019), the MAGRITTE v1.1 model (Müller et al., 2019), the Mainz Organic Mechanism (Sander et al., 2019), the updated ECHAM-MESSy (Novelli et al., 2020), and the Common Representative Intermediates mechanism v2.2 (CRI v2.2) (Jenkin et al., 2019a), the latter of which is the focus of this work. The CRI v2.2 is an update to the Common Representative Intermediate v2.1 mechanism (Jenkin et al., 2008; Utembe et al., 2010; Watson et al., 2008) and was developed from the fully explicit Master Chemical Mechanism (MCM) version 3.3.1 (Jenkin et al., 2015), which describes the degradation of organic compounds in the troposphere. In the CRI framework, species are lumped together into surrogate molecules whose reactivity is optimized against the fully explicit MCM. A description of CRI v2.2 is given in Jenkin et al. (2019a). The CRI v2.1, along with the corresponding stratospheric chemistry, has already been incorporated into UKCA as CRI-Start (CS) (Archer-Nicholls et al., 2021) as an alternative to the simpler but more widely used STRAT-TROP (ST) chemistry scheme (Archibald et al., 2020a), the scheme used for UKESM's contributions to CMIP6 (e.g. Sellar et al., 2020; Thornhill et al., 2021).
Using the reduced Caltech Isoprene Mechanism, which includes H-shifts of ISOPOO in GEOS-CHEM, Bates et al. (2019) simulated significant increases in OH (>100 %) and HO2 (up to 50 %) over the Amazon and other forested tropical regions as a result of the HOx recycling. After implementing updated rate constants for isoprene H-shifts in GEOS-CHEM, Møller et al. (2019) also found that globally around 30 % of all isoprene peroxy radicals undergo at least one H-shift reaction, resulting in an OH yield of 47 % per isoprene molecule, and that adding all isoprene H-shift reactions increased boundary layer OH by up to a factor of 3 in the Amazon. Using CESM and CAM-CHEM and the MOZART-TS2 mechanism, Schwantes et al. (2020) showed reasonable agreement for some isoprene oxidation products over the southeastern USA.
Jenkin et al. (2019a), using CRI v2.2 in the STOCHEM Lagrangian chemistry transport model, showed the significant influence of HOx recycling in CRI v2.2 simulating a 6.4 % increase in the tropospheric OH burden relative to the CRI v2.1 and increases in surface OH of 20 %–50 % over much of the forested tropical regions. Khan et al. (2020), using the same setup, also simulated enhanced surface OH and attendant decreases in methane lifetime (0.5 years) and isoprene burden (17 %).
However, while the reduced mechanisms featuring HOx-recycling chemistry have been tested in chemistry–climate models, less work has been done in terms of multi-species comparison to observations and detailed analysis of the effect to global atmospheric composition. This study introduces the CS2, based on CRIv2.2 and expanded with stratospheric chemistry, as a mechanism in UKCA, evaluates its performance against observational data, and compares its output and key processes to the related CS mechanism and the well-established ST mechanism. By providing a wide-ranging comparison to observations and a detailed description of the changes CS2 causes in global and regional atmospheric chemistry, this current work builds on the existing literature to further develop our understanding of the consequences of HOx recycling.
Table 1Comparison of the CRI-STRAT and CRI-STRAT 2 chemical mechanisms.
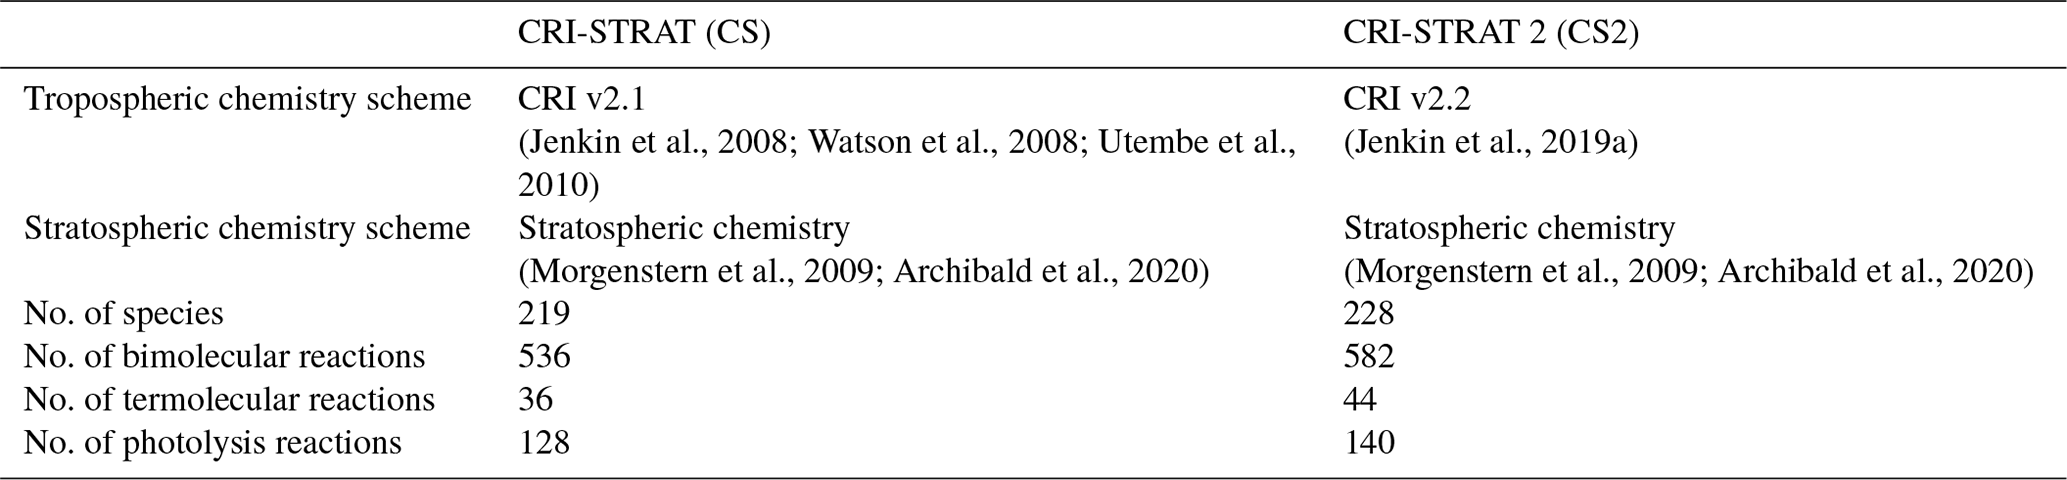
Table 2Species added and removed from the CS mechanism in the development of the CRI-Strat 2 mechanism.

Table 3Shorter runs performed for mechanism–observation comparisons. Identical biogenic (2001–2010 MEGAN-MACC climatology; iBVOC for isoprene and MT) and ocean (1990 time slice) emissions for each run unless otherwise stated.
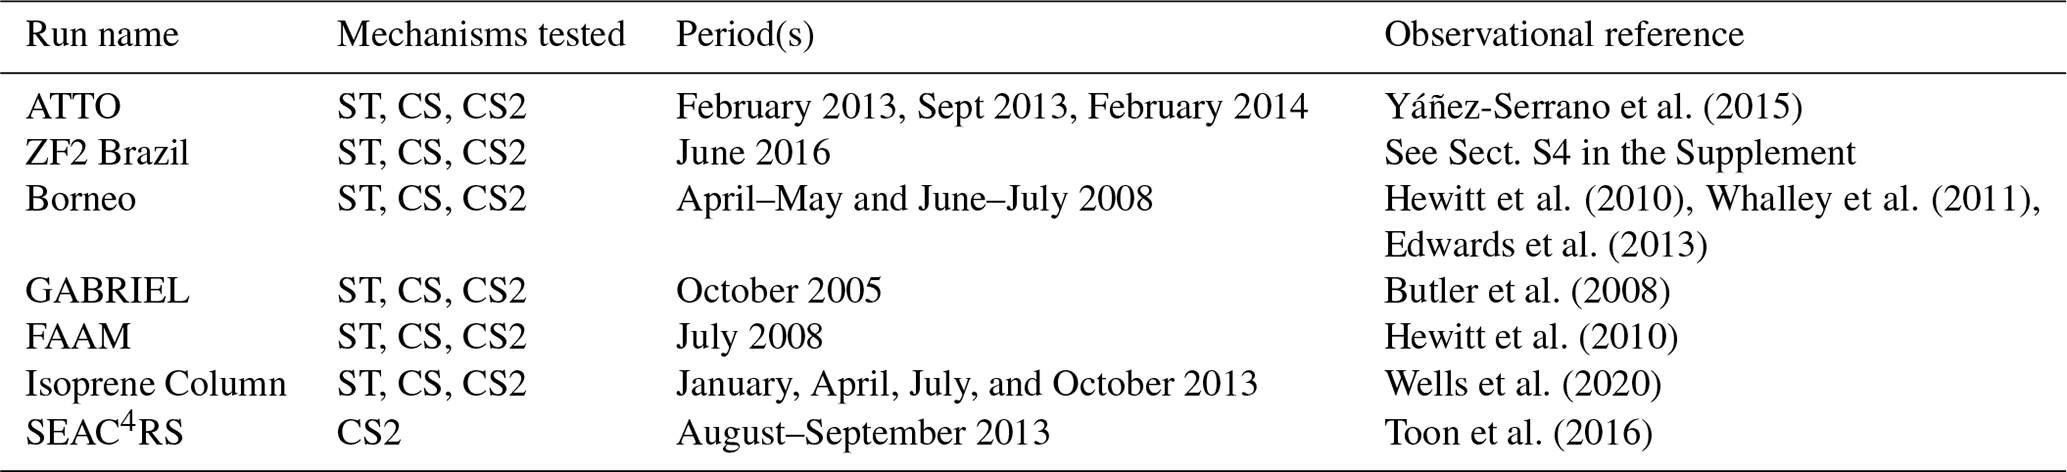
Table 4Longer runs performed for CRI mechanism comparison. Identical emissions for each run (anthropogenic and biomass time slice 2014, biogenic 2001–2010 MEGAN-MACC climatology, and oceanic 1990 time slice).

Table 5Location, reference, time period, and species measured in observational data sets and the corresponding modelling approach. For the ZF2 Brazil, ATTO, Borneo, GABRIEL, FAAM and SE4C4RS data sets, model data was filtered to select only the same days as observational data.

It is important to note that the CRI v2.2 mechanism, like the CRI v2.1 mechanism, is strictly a tropospheric chemistry scheme. In developing the whole atmosphere mechanism CS, Archer-Nicholls et al. (2021) merged the CRI v2.1 mechanism with the stratospheric chemistry scheme (Morgenstern et al., 2009) in UKCA (Table 1) to allow this scheme to be used within UKESM1 (Sellar et al., 2019). The same approach was taken in this work with the stratospheric scheme unchanged and tropospheric scheme switched from CRI v2.1 to CRI v2.2. Therefore, to differentiate the “CRI v2.2” mechanism used in UKCA in this work from the solely tropospheric CRI v2.2 mechanism described on the CRI v2.2 website (http://cri.york.ac.uk/, last access: 10 July 2021), the UKCA mechanism will henceforth be referred to as CRI-Strat 2 (CS2) (Table 1). A full description of the changes made to CS to update it to CS2 is given Sect. 1.1 in the Supplement, and a summary of the changes will now be discussed.
CS2 features a significant update to isoprene oxidation chemistry relative to CS with the incorporation of 1,6 and 1,4 H-shift reactions of isoprene peroxy radicals and an update to the organonitrate scheme (as detailed in Jenkin et al., 2019a). To the best of our understanding, CS2 also features updates to multiple reaction rate constants (which were out of date in CS, Archer-Nicholls et al., 2021), as documented in the IUPAC Task Group on Atmospheric Chemical Kinetic Data Evaluation (http://iupac.pole-ether.fr/, last access: 9 April 2021). Changes were implemented to the rate constants of the reactions of O(1D) with H2O, O2, and N2; rate constants of multiple inorganic nitrogen reactions such as those forming species with the peroxy acyl nitrate moiety, termed PAN-type, and HONO2; and the HO2+NO reaction and the rate constants of organic peroxy radicals (RO2) with NO and NO3. These updates ensure consistency between the CS2 mechanism incorporated in UKCA and that described on the CRI v2.2 website (http://cri.york.ac.uk/, last access: 10 July 2021). The photolysis of glyoxal, formaldehyde, and propionaldehyde was also updated (see Sect. S6 in the Supplement).
CS2 has 9 more species than CS (Tables 1, 2) as well as 46 additional bimolecular reactions, 12 additional photolysis reactions, and 8 additional unimolecular and termolecular reactions (Table 1). This leads to a modest increase in runtime (6 %) compared with CS, whose runtime was already ∼75 % greater than ST. Incorporation of CS2 into UKCA involved extensive use of the UM-UKCA virtual machine environment (Abraham et al., 2018).
The main update to the isoprene chemistry is the inclusion of 1,6 and 1,4 H-shift reactions of the isoprene peroxy radical (termed RU14O2 in CRI nomenclature). The 1,6 H-shift process is well studied (Peeters et al., 2009; Crounse et al., 2011; Teng et al., 2017; Wennberg et al., 2018) and follows the kbulk1,6H rate coefficient described in Jenkin et al. (2019a), capturing the dependence of isomerization on both temperature and the rates of reaction of RU14O2 with the standard bimolecular partners (NO, NO3, HO2, and RO2). This pathway yields hydroperoxy aldehydes (HPALDs, termed HPUCARB12 in CS2) and dihydroperoxy carbonyls peroxy radicals (DHPR12O2). The photolysis of the highly photolabile HPALD (HPUCARB12) and its product HUCARB9 (unsaturated hydroxy carbonyl) are key routes for HOx regeneration.
The production of the isoprene epoxy diol (IEPOX) from the isoprene hydroperoxide (RU14OOH) and the hydroxymethyl-methyl-a-lactone (HMML) also represent important updates (Jenkin et al., 2019a). IEPOX and HMML are known SOA precursors (Nguyen et al., 2014, 2017; Allan et al., 2014), and thus their addition may enable a more explicit representation of SOA formation within the CRI framework, as opposed to the current framework whereby SOA formation is represented by the condensation on existing aerosol of a single inert tracer, Sec_Org, which is made from monoterpene oxidation (Mann et al., 2010; Mulcahy et al., 2020). This is beyond the scope of this paper but will be a focus of future work.
The introduction of HPUCARB12 and HUCARB9 necessitates a careful update to the FASTJX photolysis scheme used by UKCA (Telford et al., 2013). The cross-sectional dependence of wavelength for HPALDs is assumed to be the same as methacrolein (Peeters et al., 2009; Wennberg et al., 2018; Schwantes et al., 2020) but with a significantly larger quantum yield (QY). Prather (2015) recommends a QY of 0.003 for methacrolein, and Liu et al. (2017) recommends a QY of 0.55 for HPALDs (both used by Wennberg et al., 2018). To implement the photolysis of these new species, the photolysis frequency of HPUCARB12 was taken to be the photolysis frequency for methacrolein scaled by the ratio of the QY of HPALDs to the QY of methacrolein, the same approach used by Schwantes et al. (2020) for δ-HPALDs. A scaling of 0.5 was applied to the photolysis frequency of HUCARB9 in agreement with the MCM v3.3.1.
In addition to the updates to isoprene chemistry, CRIv2.2 has had the rate coefficients for many organic and inorganic reactions updated to bring the mechanism into agreement with the MCM v3.3.1 and IUPAC. These affect the overall chemistry in three major ways. The first involves the major reactions of the excited oxygen radical, O(1D). The rate constants of O(1D) with H2O, O2, and N2 changed by −3 %, −1 %, and +20 %, respectively, to bring them into agreement with the current IUPAC values (http://iupac.pole-ether.fr, last access: 9 April 2021). This also means the rate constant of O(1D) with N2 became much closer (within ±1.5 %) to that used in ST (Archibald et al., 2020a) and that rate constants for the reactions with O2 and H2O also move closer to those used by ST. The result of this is a reduction in the fraction of O(1D) reacting with H2O by 10 %–15 %, thus lowering OH production while also reducing Ox loss via this pathway.
The second involves multiple inorganic reactions of nitrated species. The formation rate constants for PAN-type species (species with peroxyacyl nitrate functionality), HONO2, HO2NO2, and N2O5 changed by around −45 %, −15 %, −45 %, and +50 %–75 % in the troposphere, respectively. The change for PAN brought its formation rate constant much closer to that used in ST (within ±7 %), and this was also the case for HONO2 and HO2NO2 formation. The rate constant of HO2+NO, the single biggest production source of Ox, decreased by 4 %.
Finally, the rate constants for most RO2+NO and RO2+NO3 reactions have been changed by +12.5 % and −8 %, respectively, while maintaining the same temperature dependence. This is likely to have a smaller impact than the other chemistry changes but at the margins will make reactions with NO more competitive with the isomerization reactions of the ISOPOO.
The implementation of CRI v2.2 by Khan et al. (2020) in the STOCHEM model, while including the updates to isoprene chemistry and the RO2+NO and RO2+NO3 reactions, did not feature updates to the rate constants for O(1D) with H2O, O2, and N2 or the inorganic nitrogen reactions. Therefore, even in low-altitude terrestrial conditions where isoprene HOx recycling tends to dominate the change in OH, comparison between Khan et al. (2020) and the results of this work must be caveated with the changes to the inorganic chemistry.
In addition to the chemistry changes, updates are made to the photolysis of several species. Two additional photolysis reactions of glyoxal (CARB3 in the CRI mechanisms) were added in addition to updates to the photolysis parameters for HCHO and EtCHO (propionaldehyde). The wavelength bins of the product of the cross section and quantum yield used by FAST-JX (Telford et al., 2013) were updated to the v7.3 values from Prather (2015) for HCHO and EtCHO. The photolysis of CARB3, which had previously been estimated in CS by a scaling of HCHO photolysis (Archer-Nicholls et al., 2021), is replaced with the glyoxal photolysis for 999 hPa from v7.3 of Prather (2015). This reaction does exhibit a modest pressure dependence, but this has not been incorporated into FAST-JX at the current time.
In addition to the changes to the chemistry and photolysis, updates to the wet deposition scheme were implemented to both CS and CS2 schemes. The previous approach of applying parameters for a standard surrogate for other species with the same functional groups (e.g. EtOOH was used for most hydroperoxides), as described in Archer-Nicholls et al. (2021), was updated to use either data for the precise species (taken from Schwantes et al., 2020) or a more closely related surrogate. The changes to the wet deposition parameters are detailed in Table S1 in the Supplement. As they were applied to both CS and CS2 mechanisms, they are unlikely to have a significant influence on the inter-mechanism difference. No changes were made to the dry deposition scheme in this work.
All model runs were performed using the United Kingdom Chemistry and Aerosols Model (UKCA), run at a horizontal resolution of with 85 vertical levels up to 85 km (Walters et al., 2019), and the GLOMAP-mode aerosol scheme, which simulates sulfate, sea salt, BC, organic matter, and dust but does not simulate currently nitrate aerosol (Mulcahy et al., 2020). In this setup, the inert chemical tracer Sec_Org, which condenses irreversibly onto existing aerosol, was produced at a 26 % yield solely from reactions of α-pinene and β-pinene with O3, OH, and NO3 with the enhanced yield applied to account for a lack of SOA formation from isoprene or anthropogenic species (Mulcahy et al., 2020).
The runs in this work fell into two distinct categories. Firstly, short runs (generally 1–2 months, Table 3) with higher-frequency (hourly) output using the ST, CS, and CS2 chemical mechanisms were performed to evaluate each mechanism's performance against the observational data. Secondly, longer runs (2–5 years, Table 4) with monthly output using the CS and CS2 chemical mechanisms (or variants of CS2 for sensitivity tests) were conducted to facilitate a rigorous comparison of the global chemical composition (Table 4).
Temperature and horizontal wind fields were nudged (Telford et al., 2013) in all model runs to atmospheric reanalyses from ECMWF (Dee et al., 2011) to constrain the simulations to consistent meteorology, thus preventing diverging meteorology from adding to the differences resulting from the chemical mechanisms and replicating the atmospheric conditions experienced when the observations were recorded as closely as possible. Nudging only occurred above ∼1200 m in altitude, and thus the majority of the planetary boundary layer was not nudged. The model runs were atmosphere-only runs with prescribed sea surface temperatures (SSTs). CO2 is not emitted but set to a constant field, while methane, CFCs, and N2O are prescribed with constant lower boundary conditions, all at 2014 levels (Archibald et al., 2020a).
The emissions used in this study are the same as those from Archer-Nicholls et al. (2021) and are those developed for the Coupled-Model Intercomparison Project 6 (CMIP6) (Collins et al., 2017). Anthropogenic and biomass burning emissions data for CMIP6 are from the Community Emissions Data System (CEDS), as described by Hoesly et al. (2018). For the short runs, time series anthropogenic and biomass burning emissions were used for all ST runs and all CRI runs up to 2015. For the runs done for the purpose of comparison to the observational date recorded at the ZF2 site near Manaus in 2016 (see Tables 3, 5), time slice 2014 emissions were used due to a lack of post-2015 CRI emissions, but the impact of the difference is expected to be minimal.
All longer runs used time slice 2014 emissions for anthropogenic and biomass burning emissions. Oceanic emissions were from the POET 1990 data set (Olivier et al., 2003), and all biogenic emissions except isoprene and monoterpenes (see Sect. 3.3) were based on 2001–2010 climatologies from Model of Emissions of Gases and Aerosols from Nature under the Monitoring Atmospheric Composition and Climate project (MEGAN-MACC) (MEGAN) version 2.1 (Guenther et al., 2012) and are discussed further in Sect. 3.3. A full description of the emission sources for each emitted species is given in Table S2 in the Supplement.
All mechanisms used the same raw emissions data. However, the additional emitted species required by CS and CS2 means the total mass of emitted organic compounds is greater in CS and CS2, and the lumping of species for emissions is also different. The approach and consequences are discussed in Archer-Nicholls et al. (2021).
3.1 Short runs for model–observation comparisons
The runs performed for comparison to observations are detailed in Table 3 and correspond to an observational data set described in Sect. 4 and Table 5. All runs were spun up for a minimum of 3 months. For most of the runs, hourly model output was used so as to allow for detailed comparison with observations. The only exceptions were the runs performed for the comparison to the isoprene column data (“isoprene column” Table 3) for which monthly means were used.
3.2 Longer runs for mechanistic intercomparison
The longer runs (Table 4) were designed with the primary aim of examining the consequences of the mechanism changes between CS and CS2 and followed an approach similar to that used by Archer-Nicholls et al. (2021). These runs also served a secondary purpose as they enabled longer-term comparisons to observations for several species. We ran two 5-year nudged runs (1-year spin up, 4-year analysis) with the CS and CS2 mechanisms. In addition, five 2-year sensitivity runs (1-year spin up, 1-year analysis) were performed to analyse the impact of the individual changes to the isoprene scheme, O(1D) reactions, inorganic nitrogen reactions, reactions, and photolysis reactions, as discussed in Sect. 2. These sensitivity tests featured mechanisms based on the CS2 mechanism, but each had a different feature that was reverted to that found in CS.
CS2_O1D used the old rate constants from CS for the reaction of O(1D) with N2, O2, and H2O. CS2_inorgN used the rate constants from CS for the formation of HONO2, HO2NO2, PANs, HONO, and N2O5, as well as for the reactions of HO2+NO, OH + MeONO2, OH+PAN, and OH+MPAN.
CS2_isoprene followed the isoprene reactions from CS as closely as possible, with the major change being the omission of the isomerization reactions of RU14O2 and subsequent production of HPALDs and other species that are key for HOx recycling.
In CS2_RO2_N, the rate constants for the RO2+NO and RO2+NO3 reactions were reverted to those used in CS, which led to a 12.5 % decrease and 8 % increase, respectively, for the vast majority of these reactions. Where branching ratios changed between CS and CS2, the CS2 branching ratios were maintained and the rate constants scaled accordingly.
Finally, CS2_photo used the parameters and reactions from CS for the photolysis of CARB3 (glyoxal), HCHO, and EtCHO and was performed to evaluate the impact of update to photolysis (see Sect. S6 in the Supplement).
Each sensitivity test, when compared to the CS2 run, provides information as to the impact of the change of the respective section of the mechanism (when taken in isolation); for example, the impact of the changes to the rate coefficients of O(1D)'s reactions is examined by comparing the CS2 and CS2_O1D runs.
A full description of the changes to reactions and rate constants for each sensitivity test is given Sect. S2 in the Supplement. The changes to the photolysis were found to have a minimal effect on atmospheric composition compared with the other sensitivity tests and are described in their entirety in the Supplement. The analysis of the longer runs is discussed in Sect. 5.
3.3 Biogenic emissions
This work used the interactive biogenic volatile organic compound (iBVOC) emissions system (Pacifico et al.. 2012) for isoprene and monoterpenes, which is the standard approach for UKESM's contributions to CMIP6 (Sellar et al., 2019). Emissions of isoprene and monoterpenes are calculated interactively based on temperature, photosynthetically active radiation (PAR), and plant functional type for each grid cell. While a diel cycle for isoprene is standard in UKESM, iBVOC has the advantage of also simulating a diel cycle of emissions for monoterpenes, leading to improved model performance relative to observation (see Sect. 4). The dependence on temperature and PAR means that emissions of BVOCs differ slightly between runs and thus between mechanisms. However, nudging considerably inhibits divergence of surface temperature between comparative runs, and thus the differences between emissions were <5 % and typically 1 %–2 %, significantly smaller than the differences caused by the mechanisms.
Monoterpene emissions were speciated in a 2:1 α-pinene : β-pinene ratio as used in Archer-Nicholls et al. (2021).
There are temporal and spatial disparities between using iBVOC emissions and offline emissions, such as the MEGAN-MACC data set (Sindelarova et al., 2014, as used by Archer-Nicholls et al., 2021), which could affect conclusions about mechanism observational biases. These differences are discussed in more detail in Sect. S3 in the Supplement. In short, for the ZF2 Brazil, ATTO, and Borneo sites for the periods considered, the isoprene and monoterpene (MT) emissions were higher when using the iBVOC approach than for MEGAN-MACC (Figs. S1 and S2 in the Supplement).
The shorter UKCA models runs listed in Table 3 were used to evaluate mechanism performance against six high frequency observational data sets (three surface or near-surface data sets and three aircraft campaigns) from the Amazon, Borneo, and the southeastern USA, all important regions for BVOC production. In addition, satellite-derived isoprene columns (Wells et al., 2020) were compared to model output (Isoprene Column, Table 3). Monthly mean data from the longer CS and CS2 runs (Table 4) for O3, CO, and HONO2 were also compared to a range of observational data. A summary of the observation data sets is given in Table 5, and locations of the surface and airborne campaigns are shown in Fig. S3 in the Supplement.
Diel profiles for multiple species were calculated from the three surface and near-surface sites, and the vertical profiles were calculated from the ATTO site.
The three flight campaigns considered were the October 2005 Amazon GABRIEL campaign (Butler et al., 2008), the July 2008 Borneo Facility for Airborne Atmospheric Measurements (FAAM) (Hewitt et al., 2010), and the Studies of Emissions and Atmospheric Composition, Clouds and Climate Coupling by Regional Surveys (SEAC4RS) flight campaign over the southeastern USA in August–September 2013 (Toon et al., 2016). Hourly model output corresponding to the days and times of the flights was used for the mechanism–observation comparison for each campaign. Model and observational data were binned into 250 m/500 m altitude bins and median values for the variables of interest across the whole region for a given altitude bin were considered. For the SEAC4RS comparison, observational data were also filtered to exclude urban plumes (NO2>4 ppb), fire plumes (acetonitrile >0.2 ppb), and stratospheric air (), while missing data were not used, and data flagged as a lower limit of detection were set to zero as previously done in Schwantes et al. (2020). Estimated limits of detection are shown for relevant species for the GABRIEL and FAAM campaigns.
The performance of each mechanism is now described for the key species, e.g. O3, HOx, isoprene, certain isoprene oxidation products, and monoterpenes. A brief commentary about other species including HONO2, CO, PAN, HCHO, MeCHO, EtCHO, and acetone is given in the Supplement.
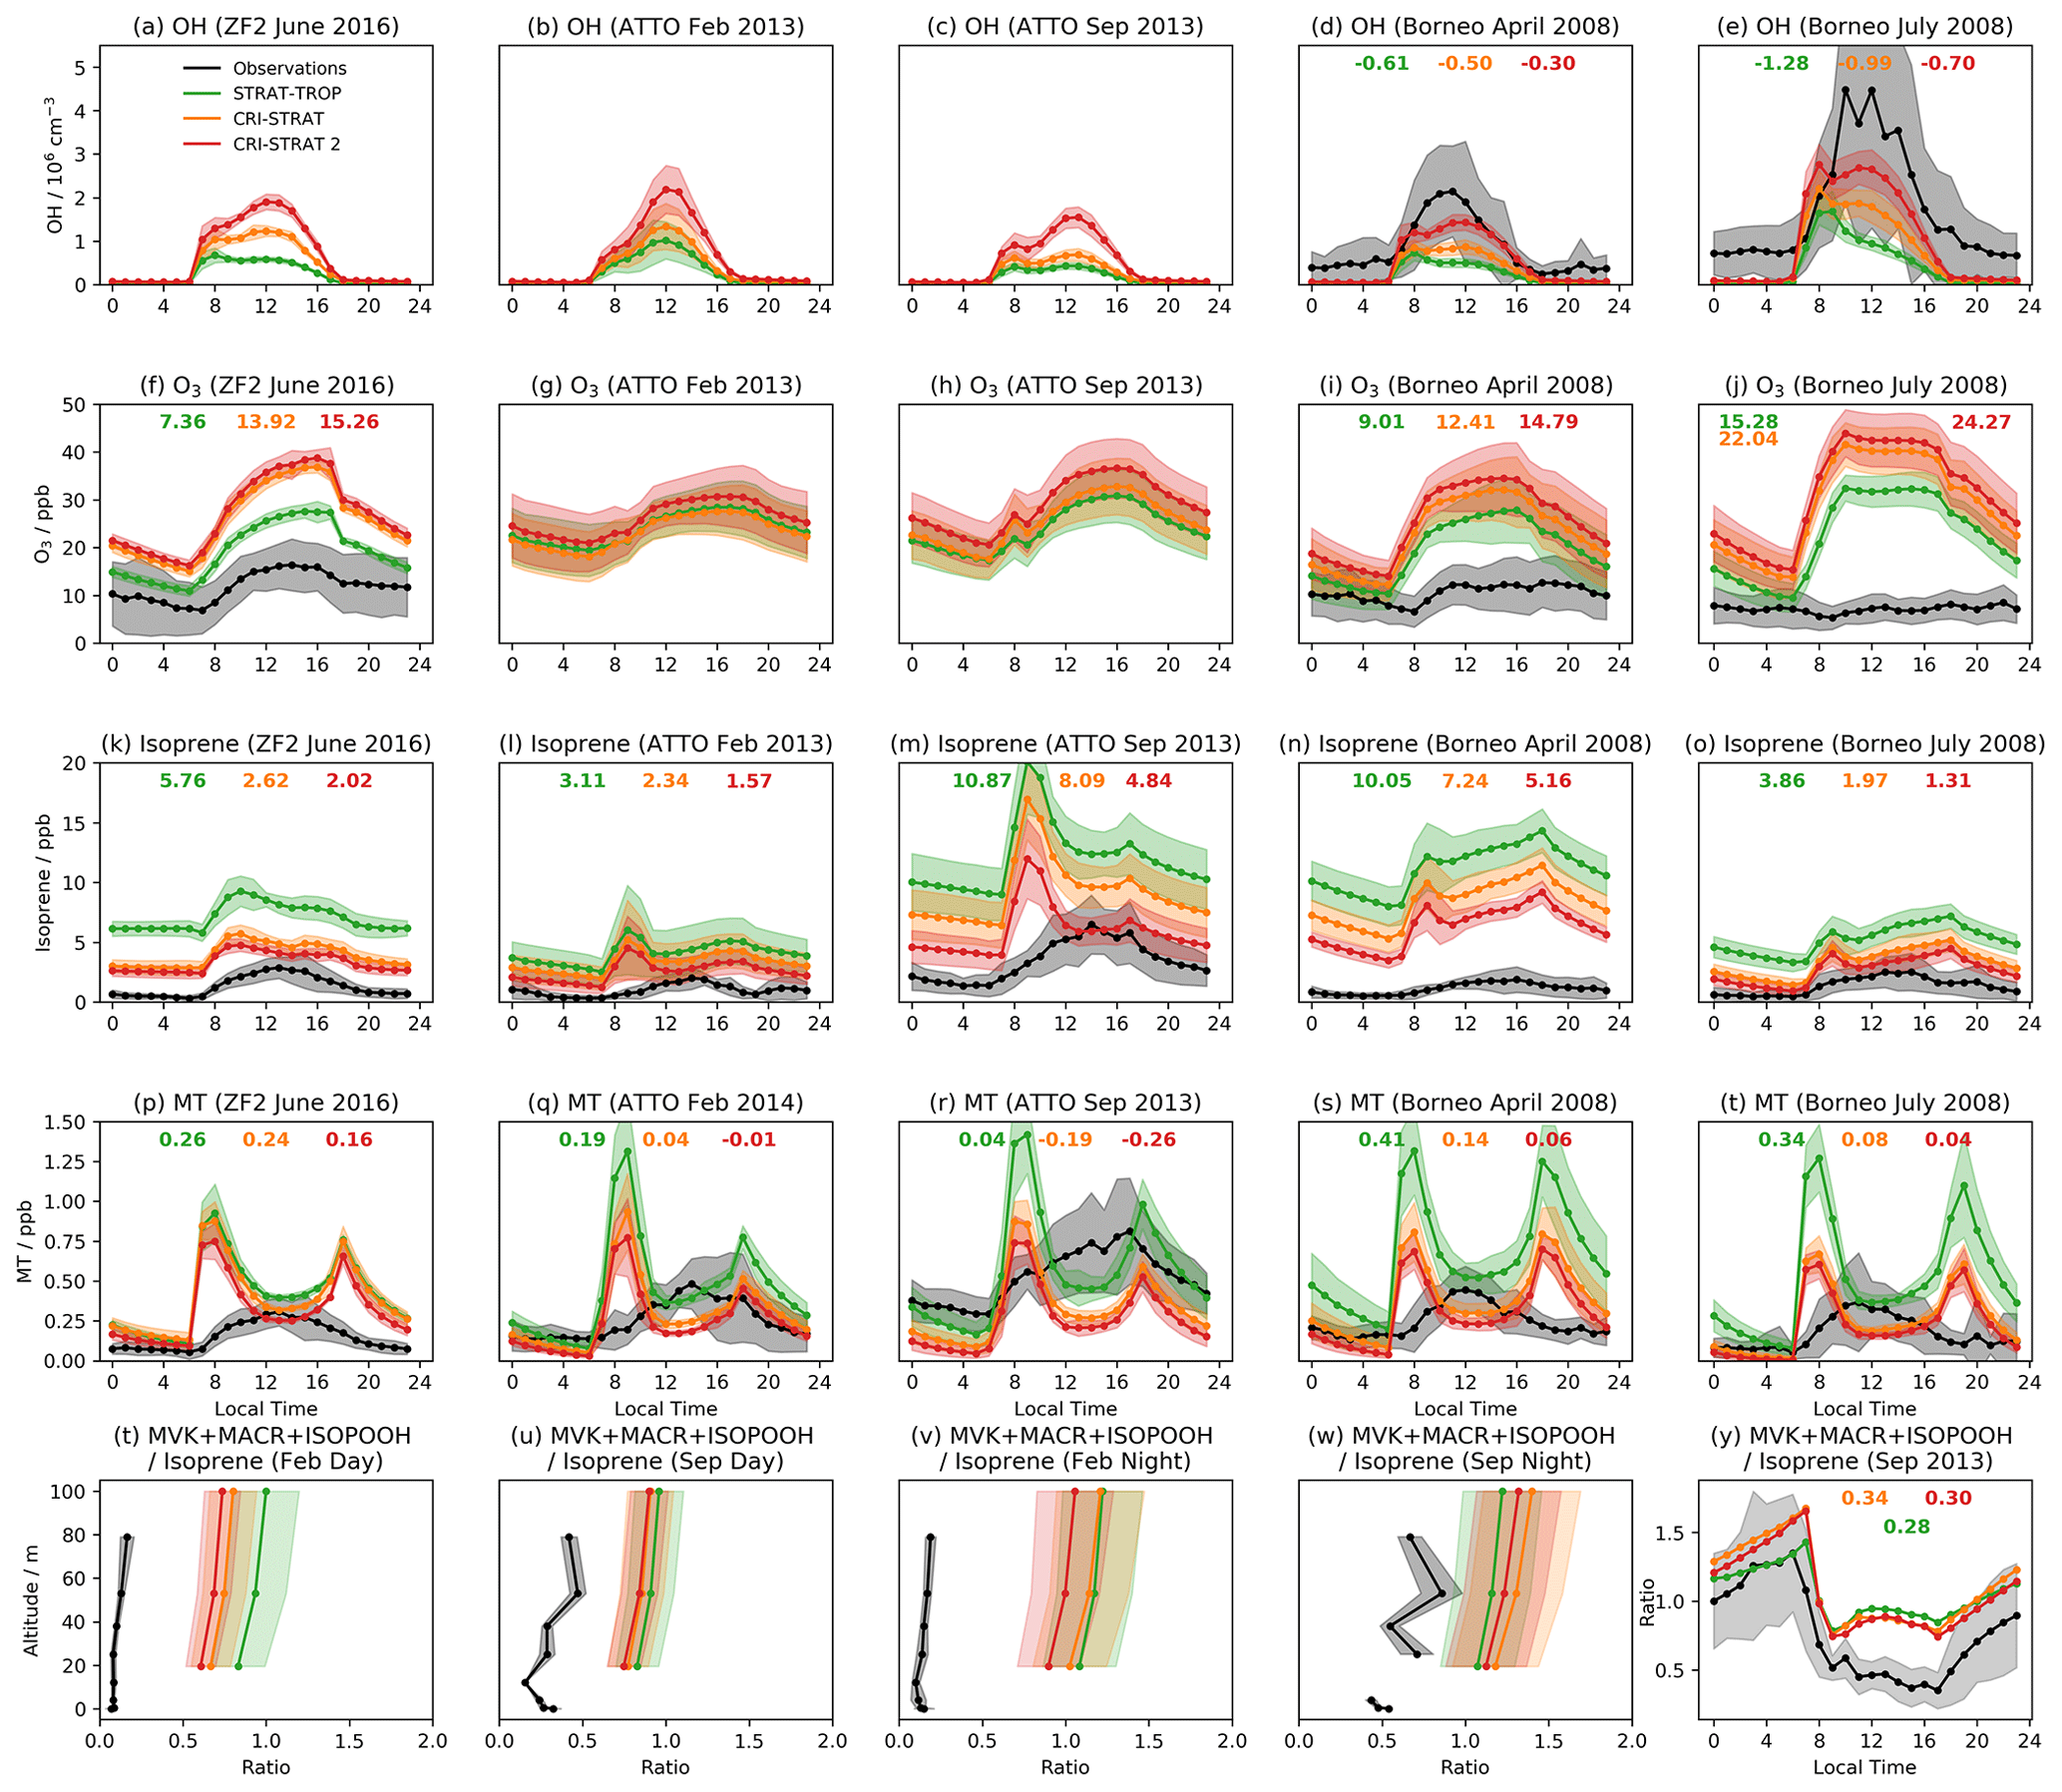
Figure 1Mean diel cycles of observed and modelled OH (top row), O3 (second row), isoprene (third row), and MT ( for the CRI mechanisms) (fourth row) at the three surface and near-surface sites considered. The bottom row shows the vertical profile of the ratio of the isoprene oxidation products MVK + MACR + ISOPOOH to isoprene for daytime (09:00–15:00 LT) and nighttime (21:00–03:00 LT) periods and the diel profile of the ratio at 53 m (all from ATTO tower). Shading indicates ±1 standard deviation from the mean, and the numbers in bold show the mean diel model bias (model–observations) for species or locations where observations were recorded.
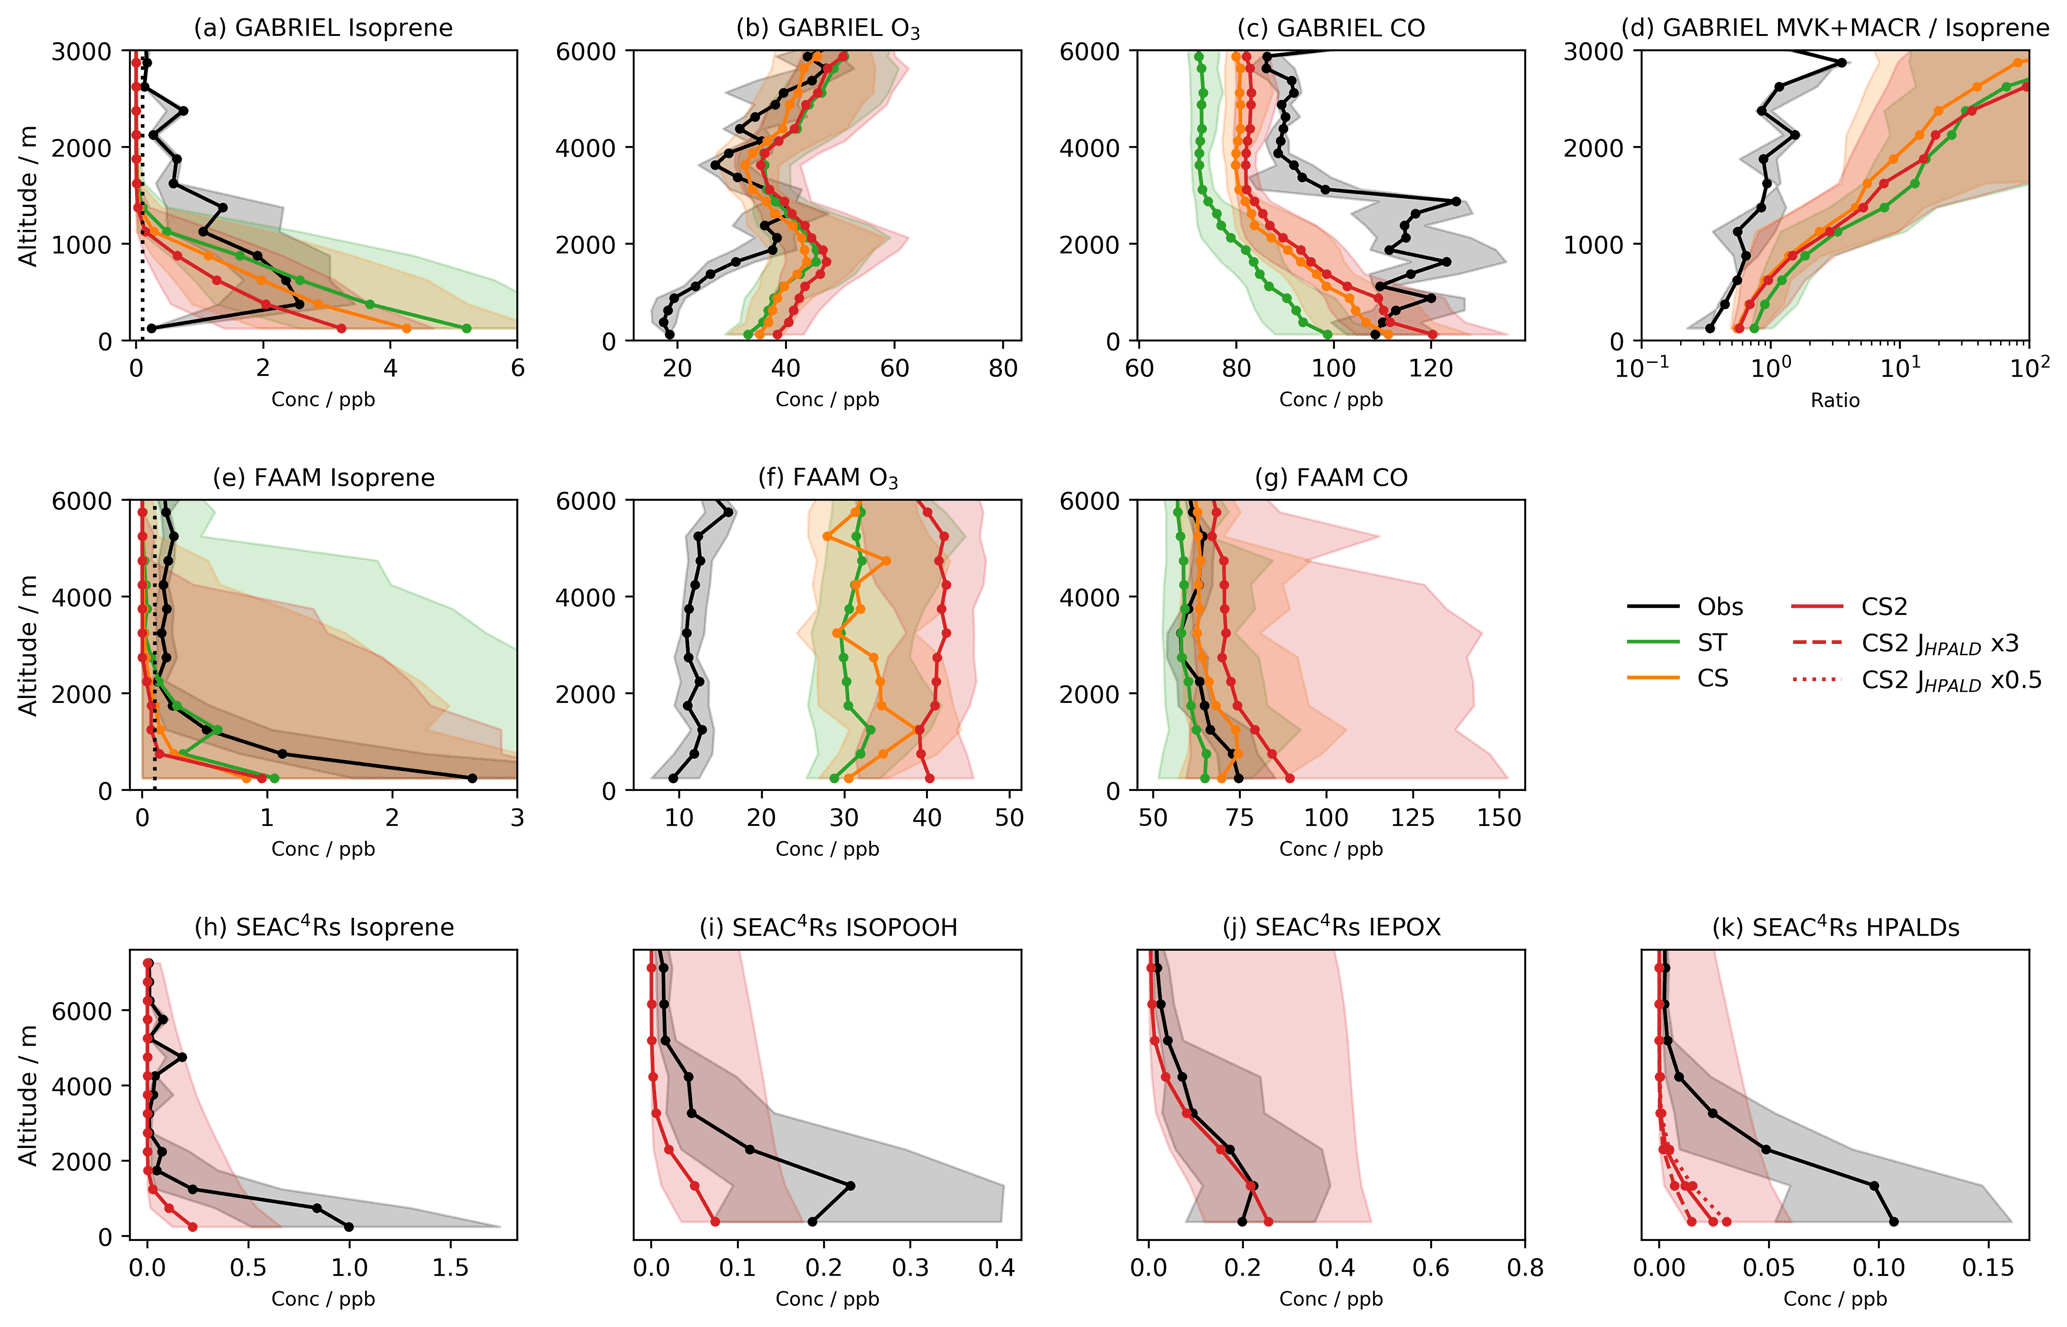
Figure 2Median observed and model concentrations for the GABRIEL campaign in the Amazon for (a) isoprene, (b) O3, (c) CO, and (d) the ratio of the isoprene oxidation products MVK + MACR to isoprene. Median observed and model concentrations for the FAAM campaign over Borneo for (e) isoprene, (f) O3, and (g) CO. Median observed and model concentrations for the SEAC4RS campaign over the southeastern USA for (h) isoprene, (i) isoprene hydroperoxide (ISOPOOH), (j) the isoprene epoxy diol (IEPOX), and (k) hydroperoxy aldehydes (HPALDs). SEAC4RS observational data are also filtered to exclude urban plumes (NO2>4 ppb), fire plumes (acetonitrile >0.2 ppb), and stratospheric air () as previously done in Schwantes et al. (2020). Shading shows inter-quartile range, dotted black lines (a, e) show estimated limits of detection for isoprene, and JHPALD×3 and JHPALD×0.5 lines in (k) show results of the scaling the HPALD photolysis frequency by 3 and 0.5, respectively. Note the logarithmic horizontal scale for (d).
4.1 Ozone
CS2 exhibits a modest increase in O3 (∼1–2 ppb) over CS at all surface sites (Fig. 1), exacerbating the existing high surface bias of CS, whose drivers were discussed in Archer-Nicholls et al. (2021), and the smaller high bias of ST. On a diel basis, the mechanisms are able to replicate the shape of the diel cycle at the ZF2 site (with similar diel profiles at the ATTO site) but perform less well in Borneo, simulating pronounced diel cycles with a high bias compared to much more muted cycles from observation.
An increase of ∼1–4 ppb relative to CS is also exhibited by CS2 for monthly mean O3 when both mechanisms are compared to observational data at 10 locations from pole to pole at four pressure levels (250, 500, 750, and 900 hPa) (Fig. S4 in the Supplement). CS2 reduces the low bias in polar regions but increases the CS's high bias in the tropics and eastern US.
Model high biases are also observed from flight data comparisons (Figs. 2b,f, and S6a in the Supplement). In the Amazon, where the observed and modelled NO vertical profiles agree well (Fig. S6e in the Supplement), there is little difference between the three mechanisms. Each exhibits the greatest high bias at low and a smaller high bias in the free troposphere. CS2 exhibits a high bias of 15–20 ppb for the SEAC4RS campaign (Fig. S6d in the Supplement), with perhaps some influence from the low-altitude NO2 model high bias. In Borneo, all mechanisms exhibit a roughly consistent high bias of ∼20 ppb for ST, increasing to 30 ppb for CS2. Interestingly, all the mechanisms simulate a significant low bias for NO2 (Fig. S6f in the Supplement), which may indicate biomass burning events which are not simulated, something which might be expected to promote higher ozone concentrations.
4.2 HOx
Modelled surface OH increases in all locations from ST through CS to CS2, with a significant increase in midday OH from CS to CS2 (Fig. 1). In Borneo, OH is consistently biased low in the three mechanisms, but the best comparison is exhibited by CS2 where the mean diel bias compared to ST and CS decreases by 43 %–50 % and 24 %–40 %, respectively, over the period considered. The drivers of the HOx change are explored further in Sect. 5.
Surface HO2 was also simulated to increase in all locations from ST to CS to CS2. Significant high bias was simulated in Borneo (the only observational data set) (Fig. S7 in the Supplement) for the CRI mechanisms, including at night. The simulated ratio of HO2 to OH is highly biased in all mechanisms. However, it is best simulated in CS2, indicating that the increase in OH is much larger than that for HO2. It should be noted that none of the mechanisms at present include the heterogenous reactions of HO2 and their inclusion, which will be addressed in future work, should reduce the HO2 high bias.
The comparison of modelled HOx to observation is complicated by large discrepancies in key reaction partners. Relative to observed values of 100–130 ppb, CO in ST in Borneo is highly biased by 13 and 27 ppb, while CO in the CRI mechanisms exhibits larger biases of ∼35–50 and ∼50–60 ppb during April–May and June–July, respectively (Fig. S7). These high biases would enhance modelled HO2 at the expense of OH, potentially explaining the modelled low biases in OH. Indeed, the OH model low bias is greater in the June–July period. This highlights the complexity of model–observation comparisons: the CRI mechanisms may well simulate secondary CO production from isoprene more accurately than ST but other model biases, for example in emissions of CO, NO, and isoprene, can lead to the CRI mechanisms appearing worse. Nevertheless, if the CO high bias is reduced in future, we might reasonably assume that the modelled OH will improve still further.
4.3 Isoprene
Modelled isoprene from all three mechanisms was compared to surface observations, flight campaign data, and isoprene columns measured by satellite.
4.3.1 Isoprene surface measurements
CS2 yields the best model–observation comparison for surface isoprene on a daily basis in all locations (Fig. 1k–o). CS2 reduces the high bias in the diel profiles by 50 %–60 % relative to ST and 20 %–40 % to CS at the ZF2, ATTO, and Borneo sites, driven by the elevated OH concentrations
In most locations the model simulates, to a greater or less extent, a “twin peak” isoprene profile with a sharp rise around 07:00 LT and a second, smaller peak at 19:00 LT. This was most pronounced in the Amazon dry season (ATTO Sept 2013). The morning peak is likely to be due to a combination of the sharp rise in simulated isoprene emissions which starts at 06:00–07:00 LT, outweighing the concurrent rise in OH, and an underestimation in the model of the rate of BL height growth, which can trap isoprene close to the surface, causing a buildup. By contrast, observed isoprene concentrations exhibit a much slower morning growth, reaching a peak in early afternoon. While the “out-of-phase” nature of the profiles is unlikely to be the sole driver of model–observation difference, it will play a role since isoprene chemistry occurs on the timescale of ∼1–2 h and atmospheric oxidizing capacity varies throughout the day.
Over the lowest 80 m at the ATTO site, all mechanisms are biased high in the daytime (09:00–15:00) and nighttime (21:00–03:00) (Fig. S8a–d in the Supplement), with CS2 exhibiting the smallest bias, but produce similar isoprene vertical gradients to observations. The effect of boundary layer height was further considered by looking separately at the periods 06:00–08:00 and 17:00–19:00 LT (Fig. S8e–h in the Supplement). In contrast to the daytime and nighttime periods, during the 06:00–08:00 LT period the simulated isoprene gradient is significantly more negative than the observation, indicating less vertical mixing, and similar results are seen with the MT profile (Fig. S8m–p in the Supplement). This is most noticeable in September where the largest morning peak is seen in the diel profile for both species and lends support to the theory that the simulated BL height is not increasing as quickly as in reality, leading to more isoprene and MT being trapped at low altitude. Smaller differences between observed and simulated isoprene and MT vertical gradients are seen during 17:00–19:00 LT, coinciding with smaller evening peaks in the diel profiles. This suggests the reduction in BL height is more accurately simulated than the morning increase.
The major drivers of the remaining model–observation difference are likely to be the concentrations of oxidants (despite the increases seen in CS2, OH remains low biased in Borneo) and the emissions of isoprene (including the modelled vs. actual diel cycle). The concentrations of isoprene and other species also vary significantly through and above the tree canopy, as shown by the ATTO measurements (Fig. S8), and the global model resolution is not high enough to resolve the vertical gradient of species in the canopy. When testing the CRI v2.2 in STOCHEM-CRI with isoprene emissions from the MEGAN-MACC inventory, Khan et al. (2020) noted that halving the isoprene emissions reduced the model–observation disagreement significantly and attributed the model high bias in their work to high biases in the emissions of isoprene.
4.3.2 Isoprene flight measurements
Model–observation comparisons of isoprene vertical profiles extending into the boundary layer and into the free troposphere reveal quite a different story from the surface analysis (Fig. 2a, e, and h).
Despite being biased high at the surface and at low altitude, simulated isoprene vertical profiles over the Amazon and Borneo rapidly show a low bias as altitude increases. There are likely two reasons for this. The first is the vertical mixing, already discussed in relation to the isoprene and MT surface diel cycles. Secondly, for the Amazon and Borneo campaigns only estimated detection limits (0.1 ppb in both cases) could be used. This has the effect of biassing the median of the observational data to higher values as very low values are ignored. In the SEAC4RS campaign, all data points flagged as below the detection limit were set to zero, mitigating this issue. The enhanced oxidative capacity of CS2 at low altitude results in the lowest simulated vertical concentrations among the three mechanisms, but the general low bias above the surface is an issue faced by all mechanisms, suggesting it is not just down to modelling of the chemistry.
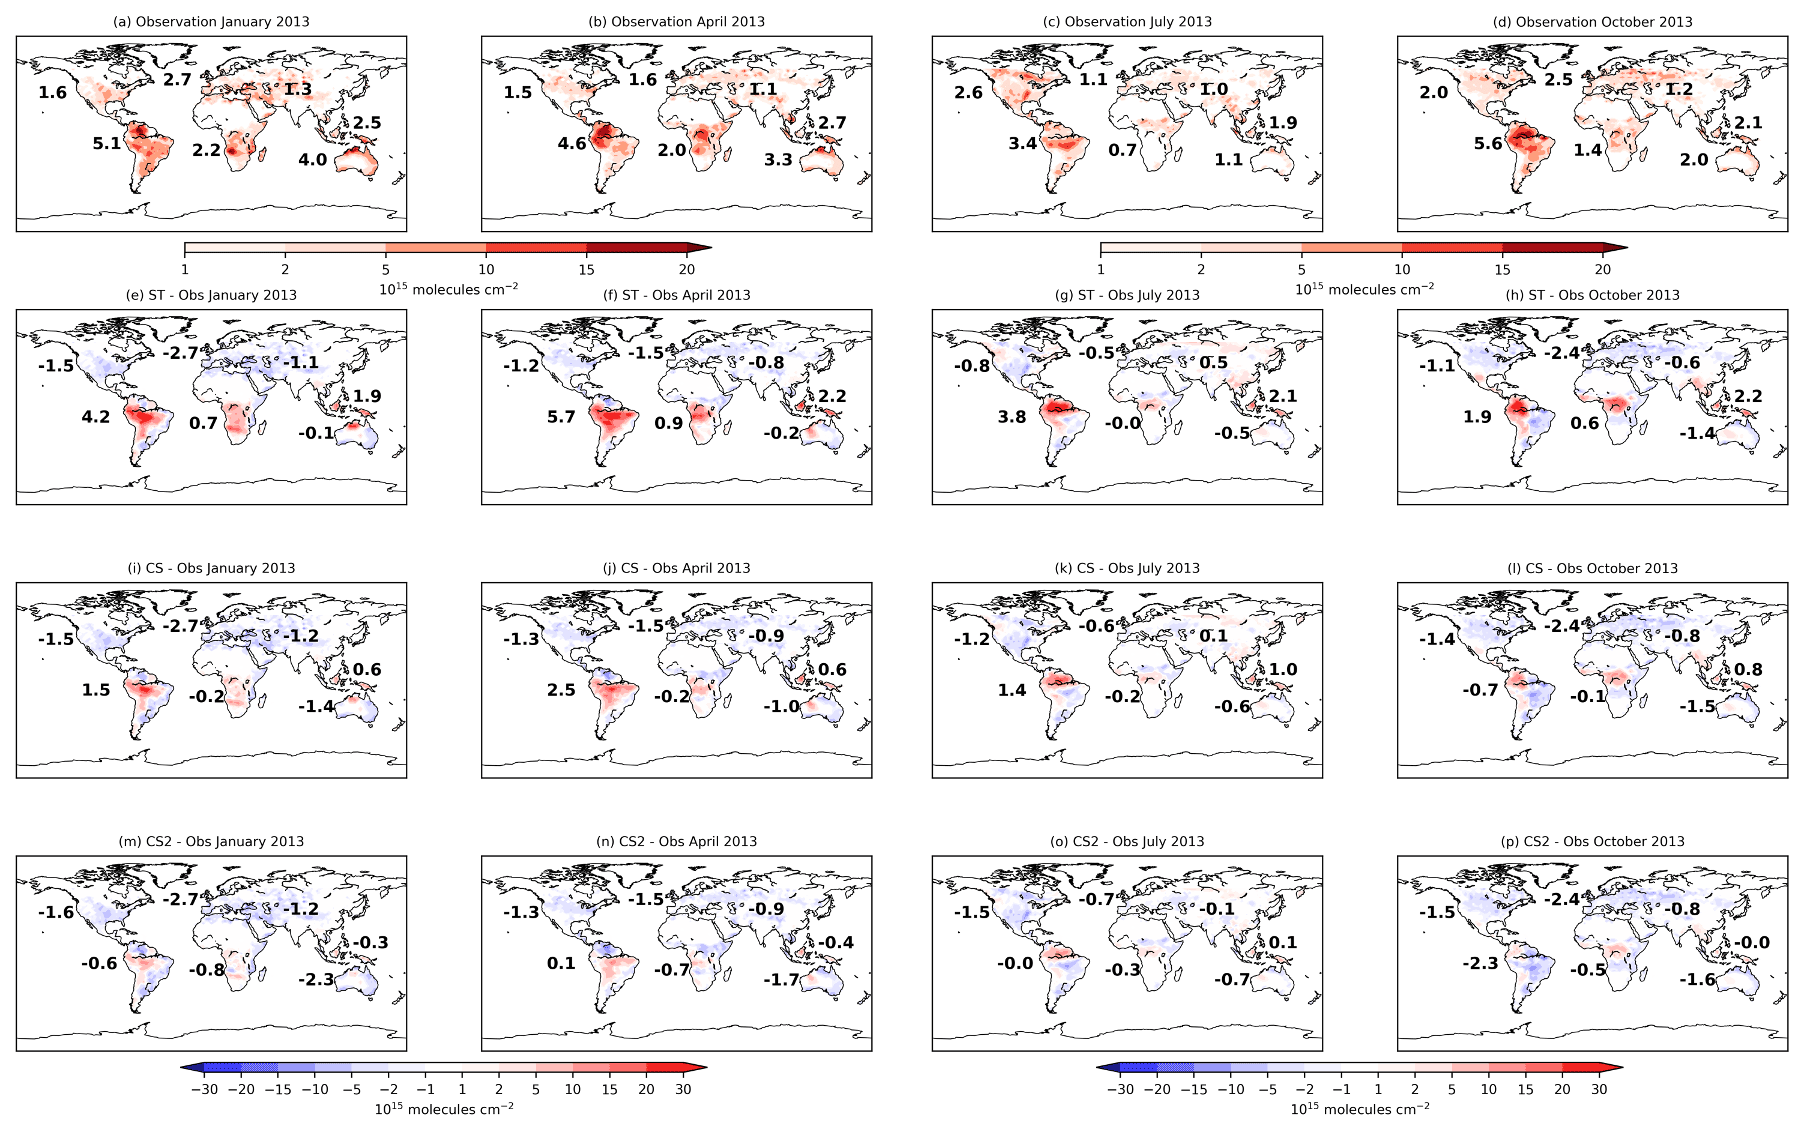
Figure 3Monthly mean isoprene column values from the global isoprene column observational data set (Wells et al., 2020) for (a) January, (b) April, (c) July, and (d) October 2013. Model bias (model–observation) using (d–h) ST, (i–l) CS, and (m–p) CS2. Numbers in (a–d) show the area-weighted mean model column values and in (e–p) show the model bias for individual terrestrial regions (the number in the North Atlantic refers to Europe and that in the South Atlantic refers to Africa).
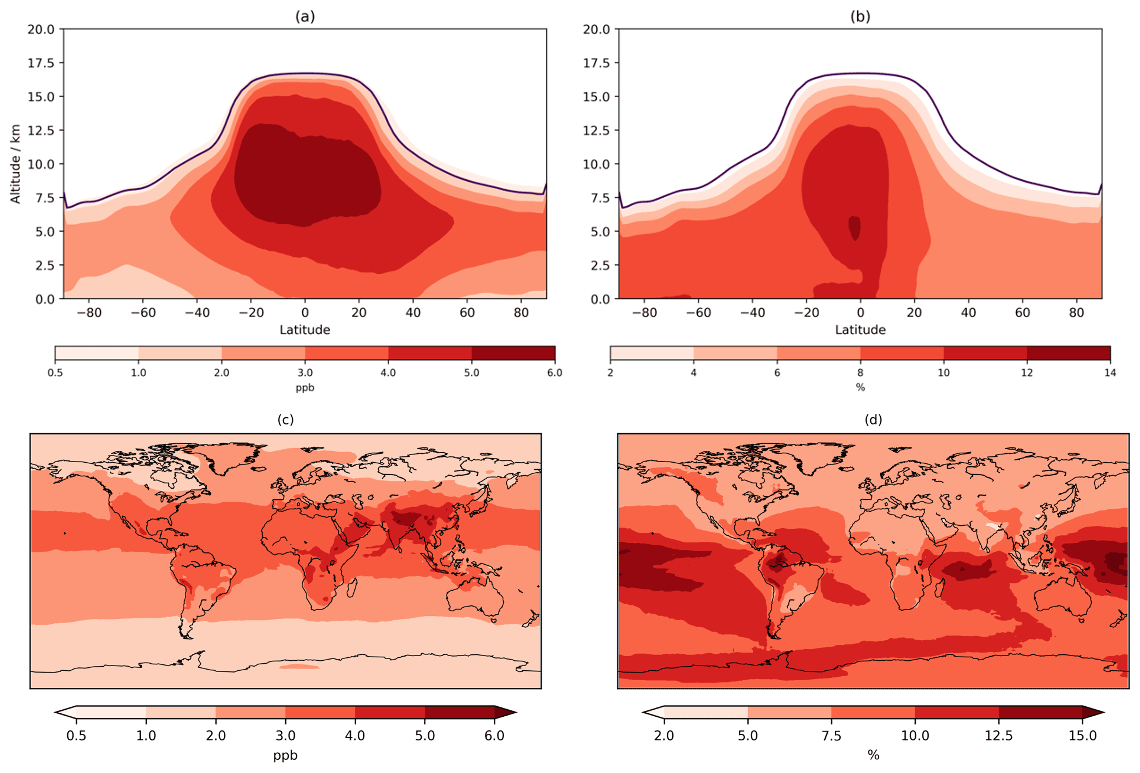
Figure 4Annual mean tropospheric zonal (a, b) and lowest 500 m (c, d) change in O3 mixing ratio (CS2 / CS). Purple line in the zonal mean shows the average height of the tropopause.
4.3.3 Isoprene columns
To consider isoprene on a global scale, monthly modelled isoprene columns for all mechanisms are compared to satellite observations from January, April, July, and October 2013 (Wells et al., 2020) (Fig. 3).
Significant variation in model bias is exhibited between the mechanisms with ST exhibiting the highest isoprene columns and CS2 the lowest. In South America, CS2 exhibits the smallest bias, while the ST columns are over double the observed values for April and July. CS and CS2 exhibit the smallest biases in Africa and Southeast Asia, respectively. The low biases in North America (∼0.7–1.5×10¹⁵ ), Europe (∼0.5–2.7×10¹⁵ ), and Central Asia (∼0.1–1.1×10¹⁵ ) are quite consistent across the mechanisms and are in some cases almost equal in magnitude to the observed columns, which suggests the bias is driven more by insufficient emissions rather than the chemistry scheme in these locations.
CS and CS2 yield lower isoprene columns and generally smaller model biases than ST. This comparison highlights the significant influence of the different chemistry schemes on the simulated isoprene column and thus the considerable challenges of determining isoprene emissions via top-down approaches using back-calculation from observed concentrations or column values: different chemistry schemes will lead to different emission estimates.
4.4 Isoprene oxidation products
During the GABRIEL flight campaign, the major isoprene oxidation products MACR and MVK were measured via PTRMS. At the ATTO tower, isoprene oxidation products were also measured via PTRMS but in this case were defined as the sum of MACR, MVK, and ISOPOOH (Yáñez-Serrano et al., 2015) and to avoid confusion we refer explicitly to the isoprene oxidation products as either MVK + MACR (for Gabriel) or MVK + MACR + ISOPOOH (ATTO). In each case, the observational data are compared with model data.
At the ATTO site, all mechanisms are largely biased high for MVK + MACR + ISOPOOH, but CS2 produces the best comparison to observations for both diel and vertical profiles (Fig. 1 and Figs. S9 and S11 in the Supplement). CS2 also yields the smallest high bias for the ratio of MVK + MACR + ISOPOOH to isoprene (a metric less sensitive to discrepancies between actual and modelled isoprene emissions) in the Amazon (Figs. 1, S9, 11). Despite the greater oxidizing capacity of the planetary boundary layer (PBL) in the CS2 simulations, the MVK + MACR + ISOPOOH concentrations are lower. This is attributed to the fact that in the relatively low-NOx environment around the ATTO tower, the isomerization reactions of the isoprene peroxy radical are particularly important and favour the production of HPALDs and other species over MACR, MVK, and ISOPOOH.
Relative to the GABRIEL flight data (Fig. 2d), the ratio of MVK + MACR to isoprene is biased high in all mechanisms, albeit with the CRI mechanisms exhibiting a smaller bias than ST.
4.5 Isoprene nitrate, IEPOX, and HPALDs
The isoprene oxidation products HPALDs and IEPOX, unique to the CS2 mechanism in this study, are compared, along with isoprene, ISOPOOH, and isoprene nitrate (Fig. S6), to observational data from the SEAC4RS campaign over the southeastern USA. Modelled isoprene (Fig. 2h) exhibits a significant low bias, in line with the isoprene column analysis (Fig. 3), and is attributed to insufficient emissions. Unsurprisingly, ISOPOOH (Fig. 2i), isoprene nitrate (Fig. S4c), and HPALDs (Fig. 2j) are also biased low. However, IEPOX (Fig. 2j) compares favourably to observations.
The apparent good performance of IEPOX, despite the significant low biases of isoprene and its direct precursor ISOPOOH, is likely to be due to a missing sink to the aerosol phase. IEPOX is readily lost to aerosol by reactive uptake (Nguyen et al., 2014, 2015; Allan et al., 2014); a process featured in Schwantes et al. (2020) (who simulated lower IEPOX concentrations) but not in UKCA. The rate constant for IEPOX's production from ISOPOOH is ∼30 % lower than that used by a mechanism of similar complexity, MOZART TS2 (Schwantes et al., 2020), while IEPOX's loss via OH has a similar rate constant to MOZART TS2. Including reactive uptake of IEPOX in future updates may reduce this high bias. The processing of IEPOX is unlikely to affect HOx recycling as much as HPALDs; however, its importance to SOA formation means it will be a focus of future work.
The low bias of HPALDs, also simulated to a lesser extent in Schwantes et al. (2020), who used isoprene emissions from the MEGAN v2.1, is important given its role in HOx recycling via photolysis. There remains uncertainty in HPALD photolysis frequencies. In this work simulated HPALD destruction is dominated by reaction with OH and photolysis, which are roughly equal ascending to 2.5 km, whereupon OH's importance grows rapidly at the expense of photolysis. To test the impact of photolysis uncertainty on the bias, two further runs were performed with the photolysis frequency of HPALDs scaled by 0.5 and 3, respectively. These tests change HPALD concentrations in the lowest 2 km by +30 % and −50 % (Fig. 2k), respectively, suggesting concentration of HPALDs is dependent on the photolysis frequency of HPALDs, which is not currently well constrained.
Interestingly, these scaling tests only change low-altitude OH by ∼2 %–3 % in the southeastern USA, suggesting the uncertainty in HPALD photolysis from the current approach may not have a huge impact on oxidants in this region, although this may in part be due to the modelled isoprene and HPALD low biases (Fig. 2h, k). Furthermore, the fact that the modelled photolysis frequency of methacrolein here is low biased by a factor of 2.5–3 (not shown) suggests that if further changes to the HPALD frequency are made in future, any potential reductions in methacrolein frequency should be scrutinized carefully. Nevertheless, constraining HPALD photolysis further will be a key focus of future work. A lack of OH measurements prevents attempts to constrain the OH loss pathway.
Evaluating HPALD production is also challenging since observations of ISOPO2 were not measured. Over the relevant temperatures, the rate constant for HPALD production in CS2 is 6–14 times greater than the equivalent used by Schwantes et al. (2020), which would, if anything, make a low bias less likely. The sensitivity of HPALD production to the concentrations of the bimolecular reaction partners of ISOPO2 (e.g. NO) can also lead to resolution issues with the model: regions with high and low NO concentrations are treated as a single region within the model (model grids can be up to ∼125 km wide at the Equator) with moderate [NO], suppressing HPALD formation (see Schwantes et al., 2020). A commentary on the global distribution of HPALDs and IEPOX is given in Sect. 5.
4.6 Monoterpenes (MT)
Simulated surface diel monoterpene profiles (Fig. 1) are characterized by early morning and evening peaks that are not present in observations. As discussed in relation to the isoprene diel cycle, the morning peak is probably caused by a combination of the simulated emissions increasing too early and a delayed evolution of the simulated BL height, trapping large quantities of monoterpenes close to the surface (Fig. S8). The evening peak coincides with a reduction of simulated OH to near zero and therefore is probably driven by oxidant reduction and a reduction in the BL height. Around midday the mechanisms do a better job in most locations, with the lower values in the CRI mechanisms driven by the greater oxidant concentrations. In four of the five locations, CS2 yields the smallest model bias, although it is acknowledged that other issues, such as the BL dynamics, need attention.
The performance of the CS mechanism compared to the simpler ST mechanism was discussed in detail in Archer-Nicholls et al. (2021). Here we describe chemical composition of the atmosphere simulated by CS2 relative to that from CS using the longer model runs summarized in Table 2. Particular attention is paid to O3 and its production and loss fluxes, HOx, isoprene and monoterpenes, the isoprene oxidation productions IEPOX and HPALDs, nitrated species (NOy), and the potential impacts to aerosols. Changes to CO and HCHO are discussed in Sect. S5 in the Supplement.
5.1 Ox
As in Archer-Nicholls et al. (2021), the change to O3 was analysed by considering the sum of odd oxygen, NO2 and its reservoir species, termed Ox, defined in Eq. (1).
Tropospheric O3 burden increases by 8 % from 328 Tg in CS to 354 Tg in CS2. Much of the free troposphere exhibits increases of 2–6 ppb (∼6 %–14 %) in O3, with large parts of the tropical troposphere increasing by more than 4 ppb (Fig. 1). This increase is driven chiefly by a 1.3 % decrease in Ox chemical destruction, resulting in a 12 % increase in net chemical Ox production. The sensitivity tests (Table S4) reveal the update to the isoprene mechanism only has a minor effect on O3 burden (∼2 Tg decrease), while the changes to O(1D) and inorganic nitrogen reactions each yield increases of 17 Tg (when considered in isolation) with greater impacts in the lower and upper troposphere, respectively (Fig. S16 in the Supplement). The changes to the O3 burden in the sensitivity tests do not sum to the total 26 Tg increase from CS to CS2, which indicates a degree of interplay between the different updates, an unsurprising result given O3's central role in tropospheric chemistry.
Ox lifetime, defined as the ratio of Ox burden (B) to the sum of chemical (L) and physical (D) Ox loss fluxes (Eq. 2) (Young et al., 2018; Archibald et al., 2020b), increase by 8 % to 18.8 d in CS2, while ozone production efficiency (OPE), defined as moles of Ox produced (P) per mole of NOx emitted (ENO) (Eq. 3) (Archer-Nicholls et al., 2021), increases negligibly from 33.74 to 33.78.
O3 below 500 m increases across almost the entire globe with increases of 2–4 ppb (∼5 %–7.5 %) over much of Europe, Africa, and the Americas and 4–5 ppb over India and China (Fig. 4), exacerbating the existing high bias in CS (Archer-Nicholls et al., 2021). The sensitivity tests allow this change to be partially decomposed into the different drivers (Fig. S13 in the Supplement). The update to isoprene chemistry produces localized increases in O3 over the tropical forested regions of South America, Africa, and East Asia of 2–4 ppb: the increase in Ox production via HO2+NO and MeO2+NO outweighs the reduction in the non-methyl peroxy radical (RO2+NO ) pathway (discussed later). While comparison to Khan et al. (2020) is difficult given the multiple mechanistic differences, Ox production from RO2+NO also decreased in their study. The changes to O(1D) also yield an increase in >1 ppb across the entire globe (due to reduced Ox loss via O(1D)+H2O) with a larger increase (2–3 ppb) encompassing ∼20∘ S–40∘ N. The change to inorganic nitrogen also leads to terrestrial increases of 2–4 ppb from increased Ox production via HO2+NO and RO2+NO.
Table 6Annual mean Ox diagnostics for CRI-STRAT and CRI-STRAT 2 and the difference between the mechanisms (percentage changes in parentheses). UKESM1 CMIP6 1995–2004 using ST: chemical production = 5315 Tg yr−1; chemical loss = 4476 Tg yr−1; dry deposition = 867 Tg yr−1 (Griffiths et al., 2021). Entries in bold show total production, loss and deposition, and entries in plain text show individual components of this production, loss and deposition.
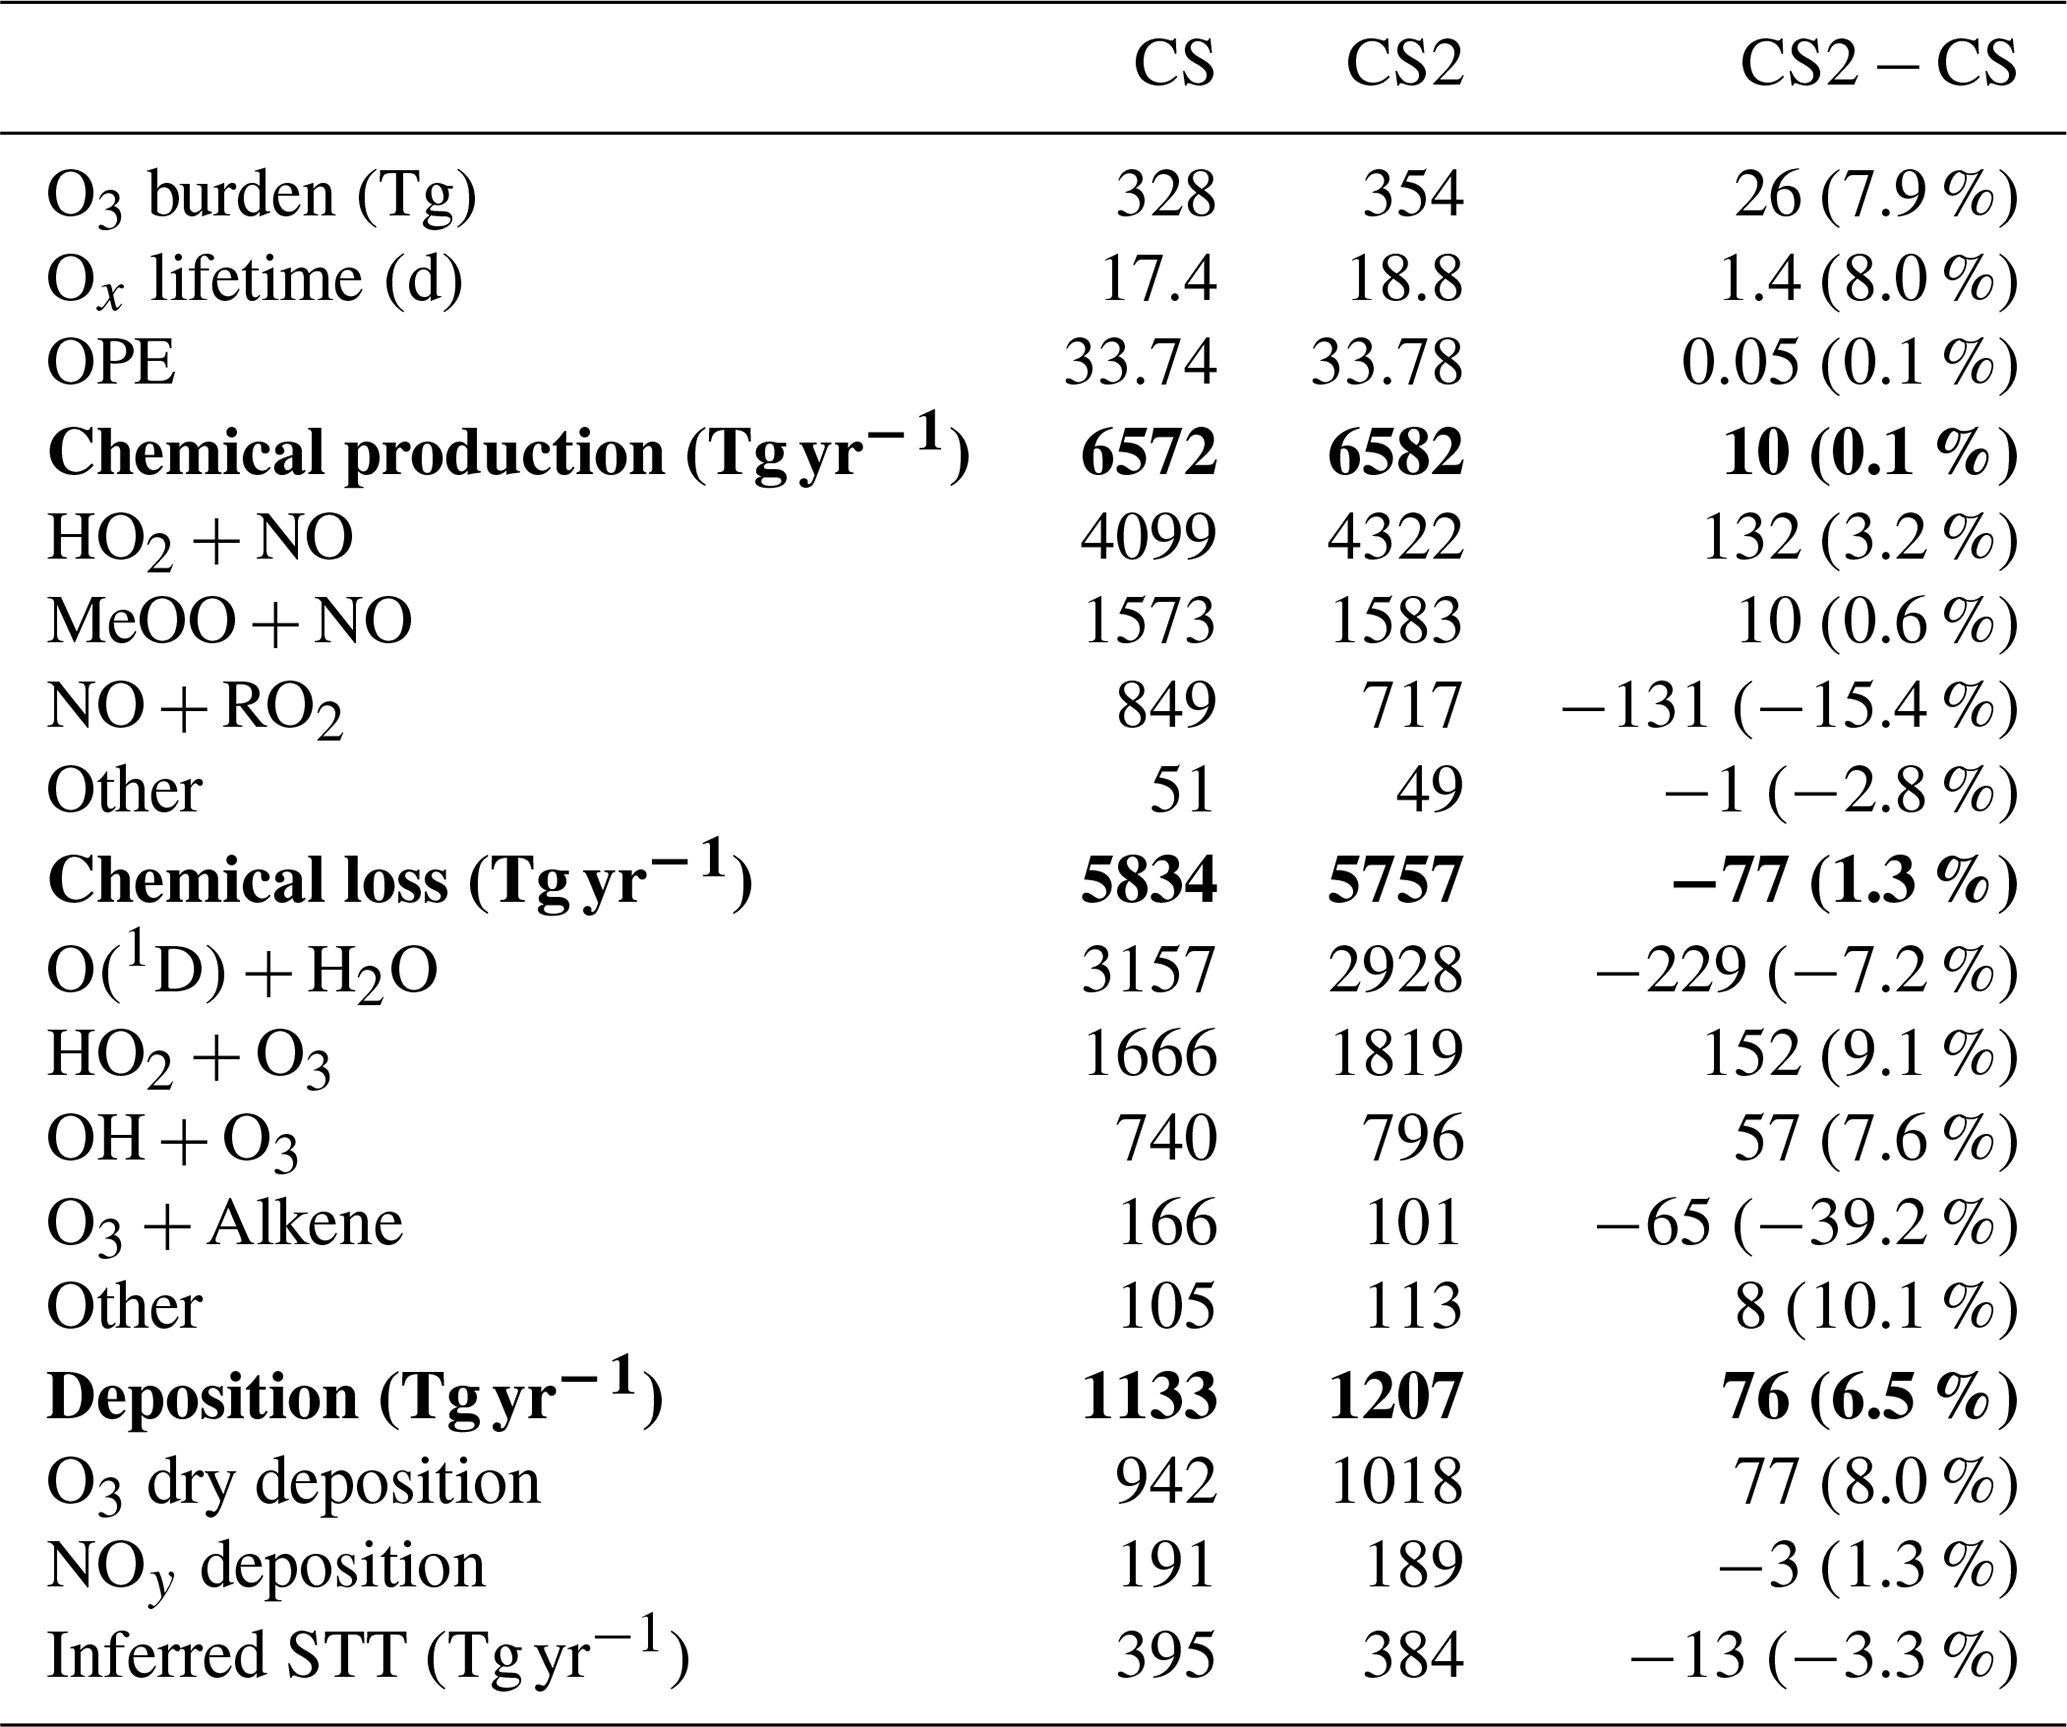
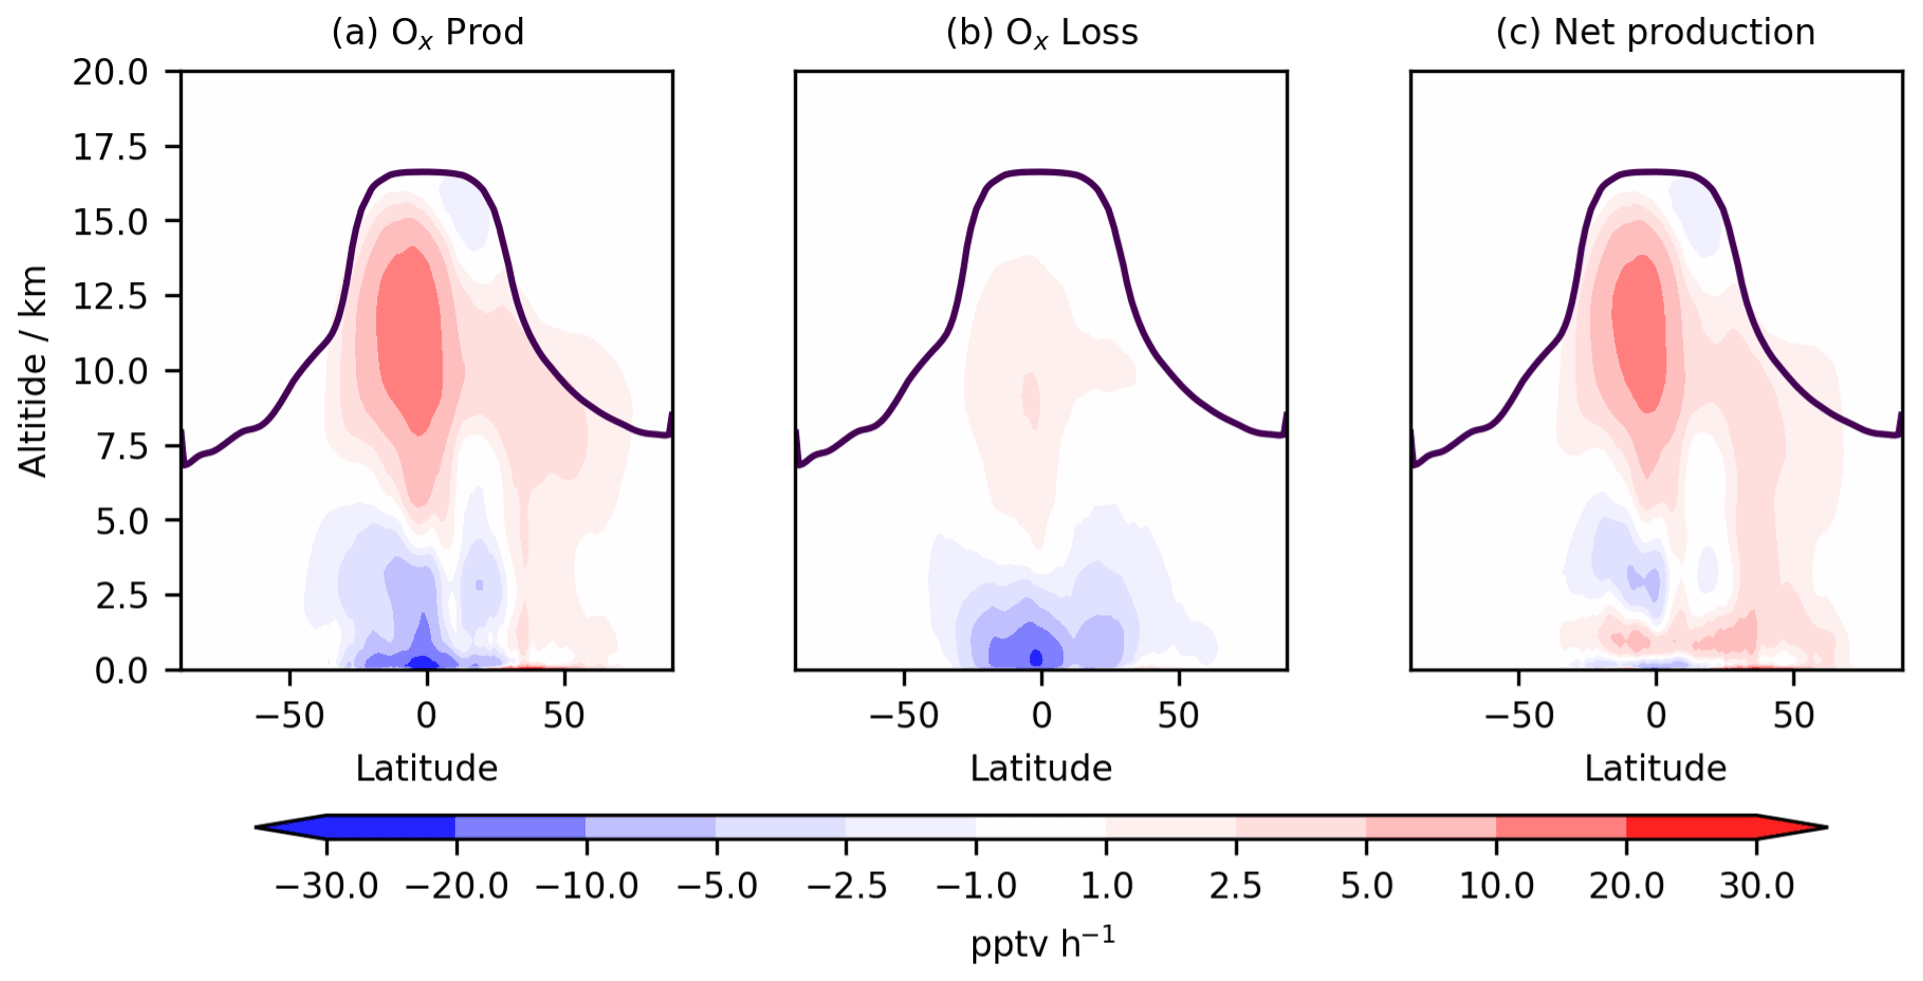
Figure 5Annual zonal mean change in (a) total Ox production flux, (b) total Ox chemical loss flux, and (c) net Ox chemical production flux. The purple line indicates mean tropopause height.
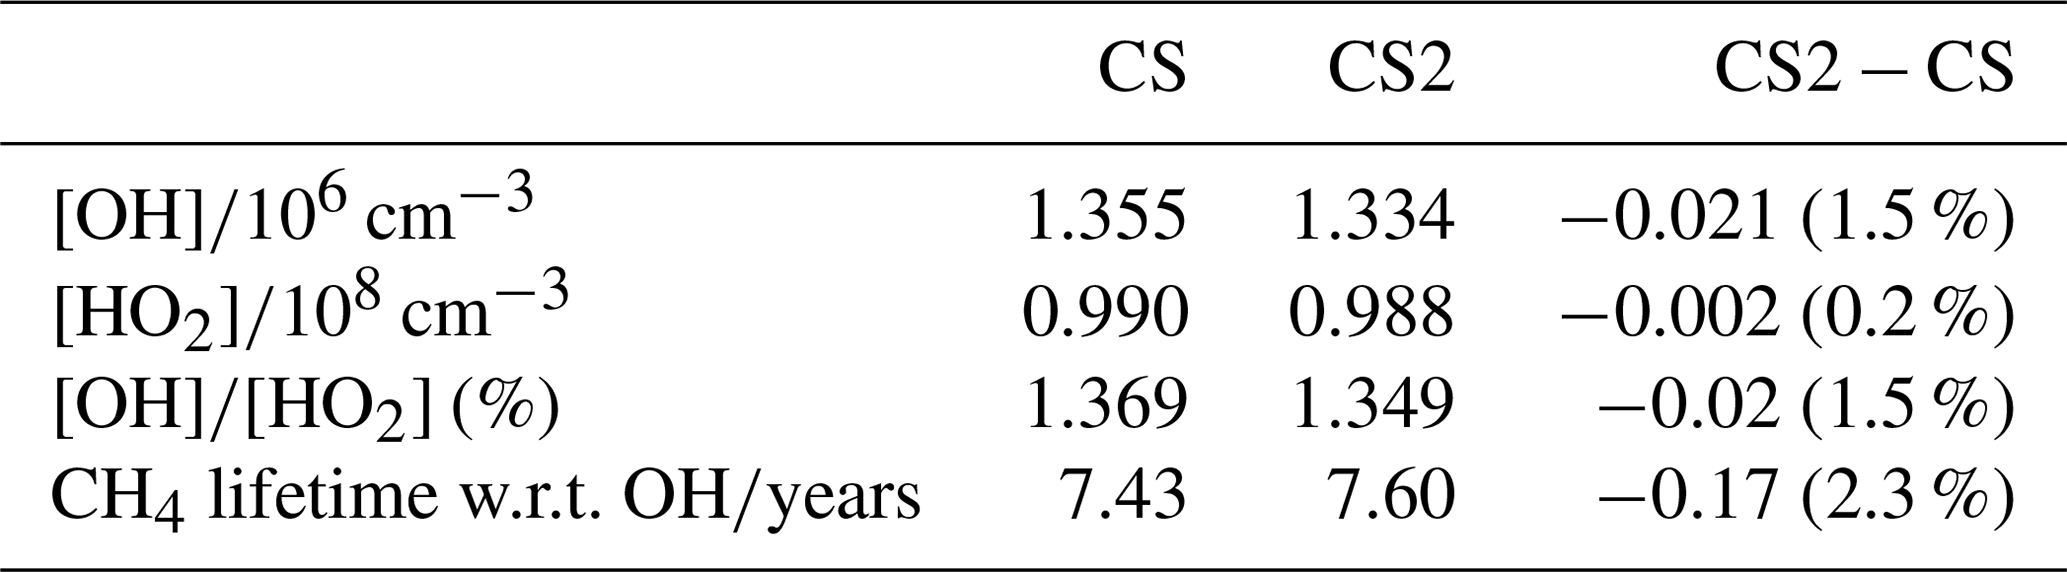
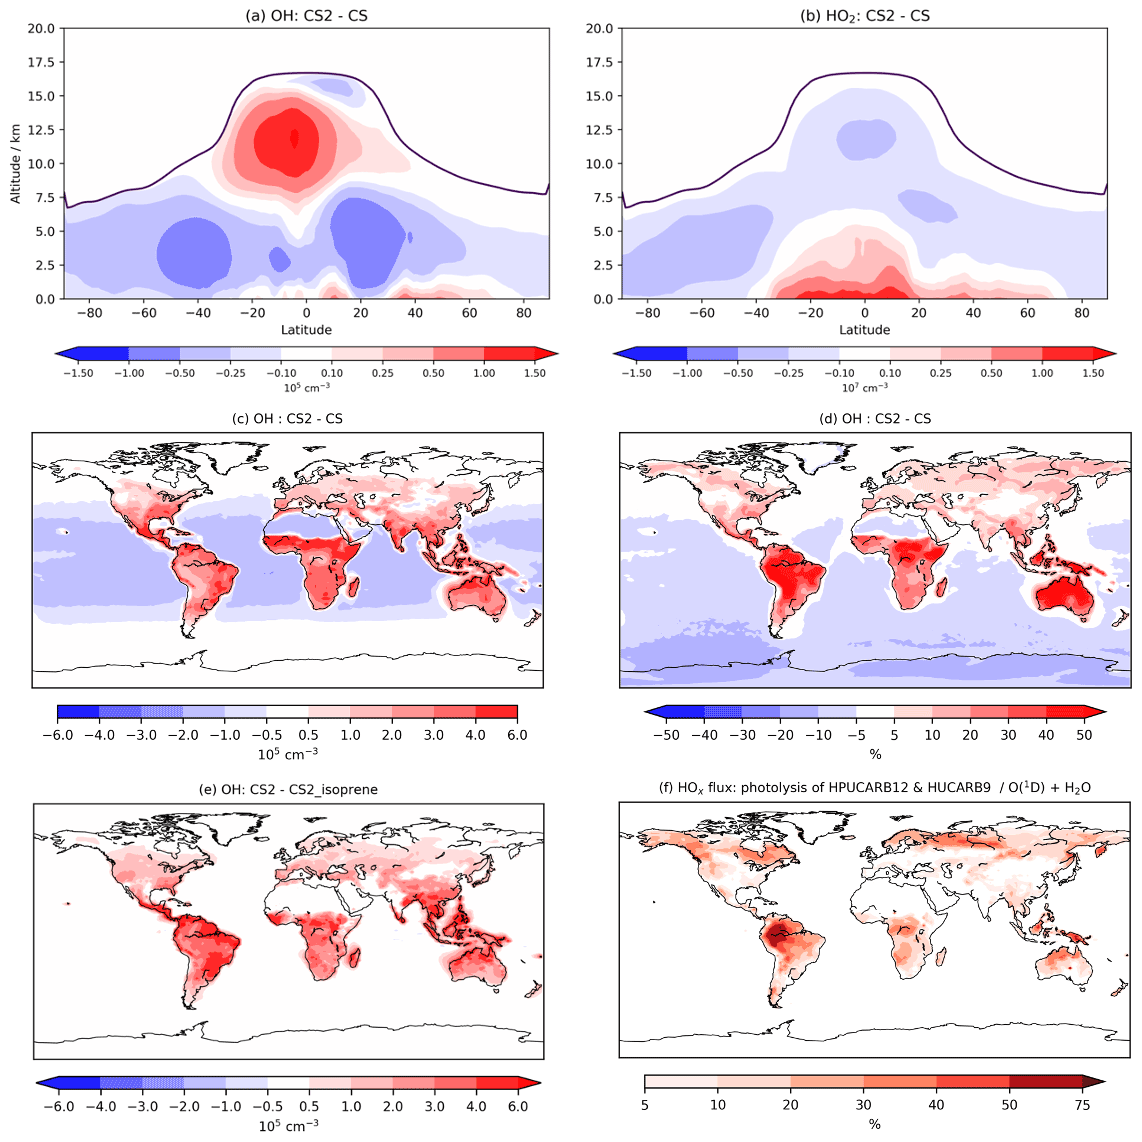
Figure 6Annual zonal mean changes in (a) OH and (b) HO2 between CS2 and CS, (c) absolute and (d) percentage in change in OH in lowest ∼500 m of atmosphere, (e) the change in OH in lowest 500 m between the CS2 and CS2_isoprene sensitivity test, and (f) HOx production flux from HPUCARB12 and HUCARB9 photolysis as a percentage of HOx from O(1D)+H2O. Dark purple lines in (a) and (b) indicate the average height of tropopause.
5.1.1 Ox Budget
Ox production and loss fluxes for CS and CS2 are given in Table 6 and the breakdown for the sensitivity tests is given in Table S4. Ox production decreases in CS2 in much of the tropical and Southern Hemisphere (SH) BL and lower free troposphere but increases in the Northern Hemisphere (NH) mid-latitude BL and tropical high troposphere, while Ox loss decreases strongly in the tropical BL and lower free troposphere (Fig. 5). Despite the modest changes to total Ox production and loss fluxes, the story is more complicated than it first appears due to offsetting changes to the key chemical production and loss fluxes.
5.1.2 Ox production
The HO2+NO pathway represents the largest absolute increase of Ox production (3.2 %, Table 6) with particular increases in the NH tropics and mid-latitude boundary layer and tropical upper troposphere (Fig. S12 in the Supplement). The drivers of this change are complex: the low altitude increases are driven by the significant increases in HO2 (Fig. 6), which exceed 5 % in places, while at higher altitudes the increase is attributed to a localized 15 %–20 % rise in NO. The sensitivity tests suggest the change to the isoprene scheme (CS2_isoprene) is a key driver in the rise of low-altitude HO2 (and thus the flux), while the change to the inorganic nitrogen reactions (CS2_inorgN) also contributes to the increased flux at low altitudes and is chiefly responsible for the increase at higher altitudes.
However, the increase in HO2+NO is offset by a decrease in the NO + RO2 flux (15.4 %, Table 6) where RO2 comprises all peroxy radicals except the methyl peroxy radical, MeO2. This reduction is strongest in the tropical BL and low free troposphere and driven by a significant decrease in the RO2 burden (32 %). This burden reduction arises from the isomerization pathways that inhibit the conversion of the isoprene-derived peroxy radical, RU14O2, to the other peroxy radicals RU12O2 and RU10O2 (via reactions with standard partners such as NO and NO3) by providing competing routes that yield other species whose degradation pathways do not produce further RO2 (Khan et al., 2020). For example, the HPALDs produced are photolysed to hydroxy acetone and unsaturated hydroxy carbonyls that further degrade producing mostly closed-shell products and HO2. This rapid reaction pathway for RU14O2 sees its burden decrease by 35 % in CS2 compared to CS, and tropical low-altitude mixing ratios decline by over 30 %. Similar declines in the RO2 + NO flux (15 %) and RO2 burden (33 %) are seen for CS2 relative to the CS2_isoprene sensitivity test, providing strong evidence that the change to isoprene is driving the change in RO2. Khan et al. (2020) also simulated a reduction in RO2 burden (and a corresponding drop in O3 production via this pathway), although their decrease of 6.5 % is less than half the equivalent value (including MeO2) of 15 % in this work, likely due to the other differences between the mechanisms used in their work and this study (see Sect. 1).
The fluxes of NO with HO2, MeO2, and RO2 account for over 99.5 % of total Ox production in both mechanisms, and the changes in other pathways are an order of magnitude smaller in absolute terms. The reduction in the rate constant for OH + MeONO2 (Sect. 4.1) reduces Ox production from organic nitrate oxidation significantly while also driving the increase in Ox production from organic nitrate photolysis. The addition of the photolysis of isoprene hydroxy nitrate and the other nitrates RU12NO3 and RU10NO3 make smaller contributions.
5.1.3 Ox loss
The change in Ox chemical destruction is dominated by the reduction in O(1D)+H2O reaction (7.2 %), which accounts for 54 % of Ox loss in CS but only 49 % in CS2. In the sensitivity run CS2_O1D, which uses the same O(1D) rate constants as CS, the O(1D)+H2O flux accounts for 54 % of Ox chemical loss. As this reaction involves water, the change is strongest in the tropical BL and low free troposphere (Fig. S14 in the Supplement).
The increase in Ox loss via HO2+O3 (9.1 %, Table 6) is driven predominantly by changes to the inorganic nitrogen and O(1D) reactions, while the isoprene scheme is simulated to have little impact. Ox loss via OH + O3 also increases (7.6 %) despite the decrease in free troposphere HOx with the new isoprene chemistry and revised inorganic nitrogen reactions simulated to play important roles. Ox destruction from O3 + alkene reactions decline significantly (39 %) yet increase at very low altitudes (<500 m) before decreasing at higher altitudes. This altitude dependence may arise from the enhanced O3 low altitude driving a greater O3 + alkene flux, but at higher altitudes the depletion of the volatile organic compounds (VOCs) by O3 and the elevated OH mean O3 destruction is lower.

Figure 7Annual mixing ratio of isoprene averaged over the lowest ∼100 m (a) in CS and (b) the difference between CS2 and CS. Annual zonal mean mixing ratios in (c) CS and (d) the difference between CS2 and CS (note the log scales used for colour maps). Annual average total oxidation flux of isoprene (e) in CS and (f) the difference between CS2 and CS.
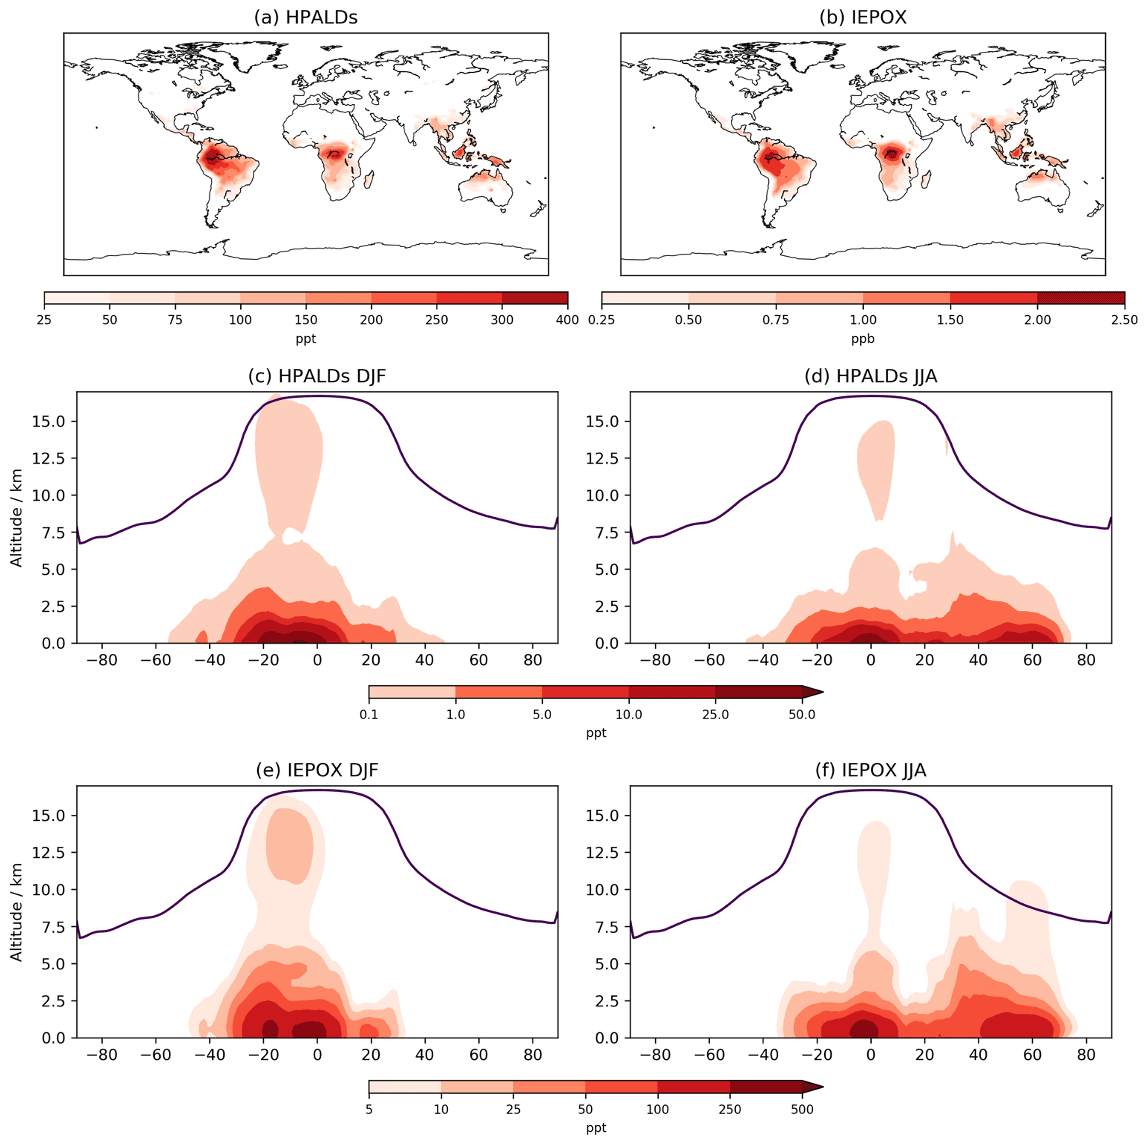
Figure 8Annual mean mixing ratios for (a) HPALDs and (b) IEPOX over lowest ∼100 m. DJF (December–January–February) and JJA (June–July–August) zonal mean mixing ratios for HPALDs (c, d) and IEPOX (e, f); note the differing scales for HPALD and IEPOX plots and log scales for (c–f).
Table 8Burdens of NOy and its constituent species, NOx emissions, NOy deposition, and inferred stratosphere-to-troposphere (STT) transport of NOy. Values in parentheses for burdens show the fraction of total NOy burden represented by each constituent and the fraction of total NOy deposition represented by each pathway for deposition diagnostics.
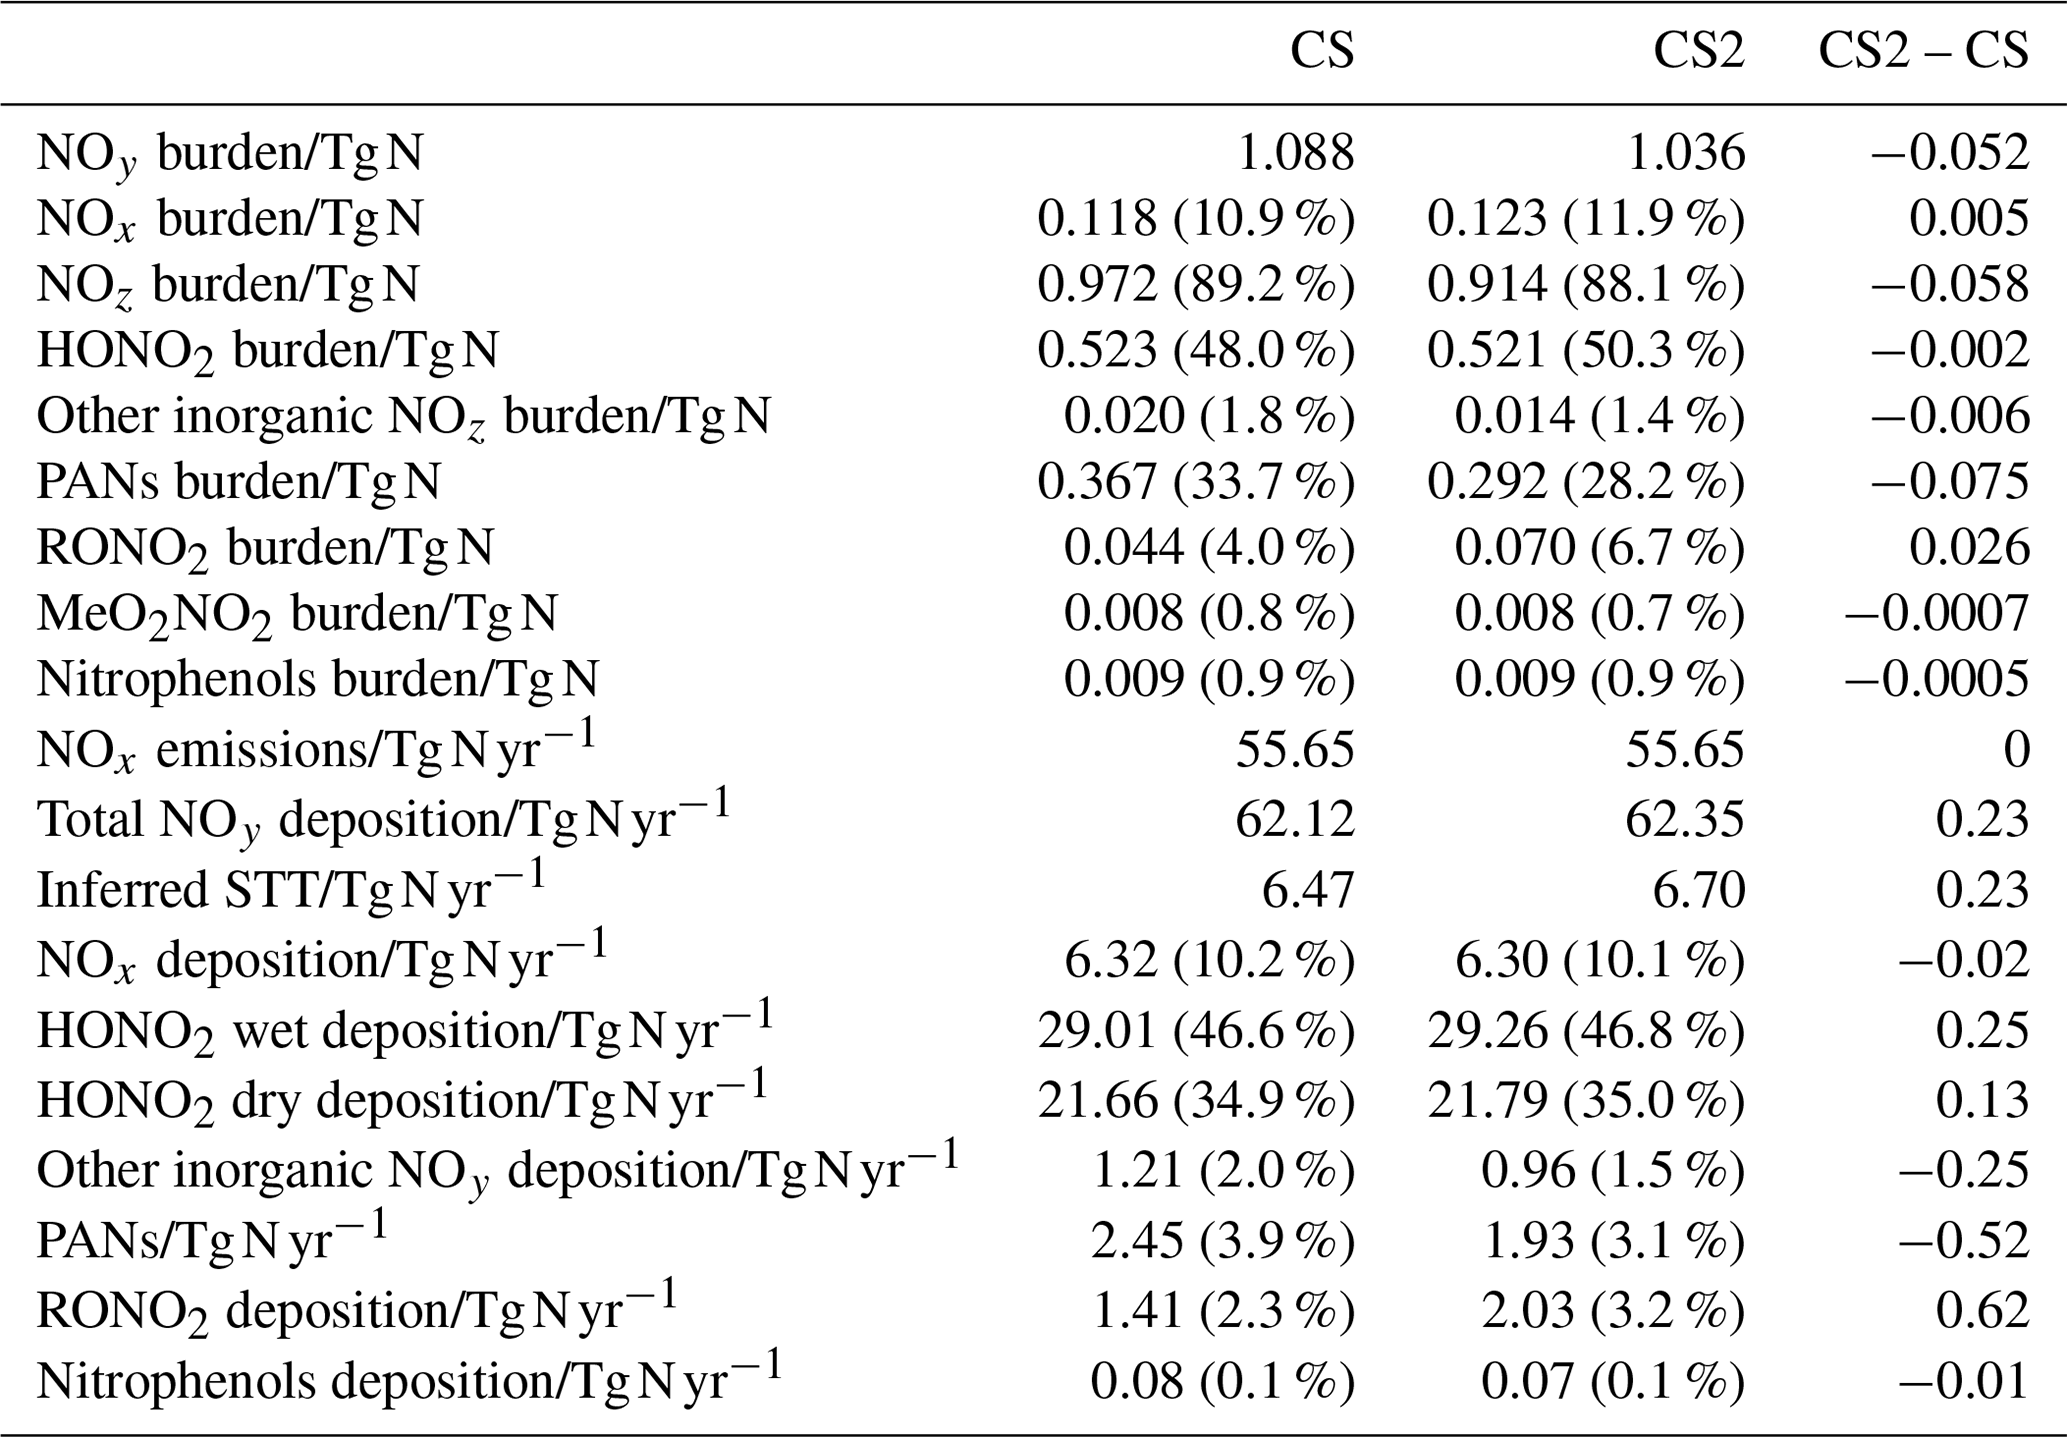

Figure 9Tropospheric annual zonal mean change in (a) NOx, (b) NOz, (c) NOy, (d) HONO2, (e) PANs, and (d) RONO2 between CS2 and CS. The purple line shows the average tropopause height.
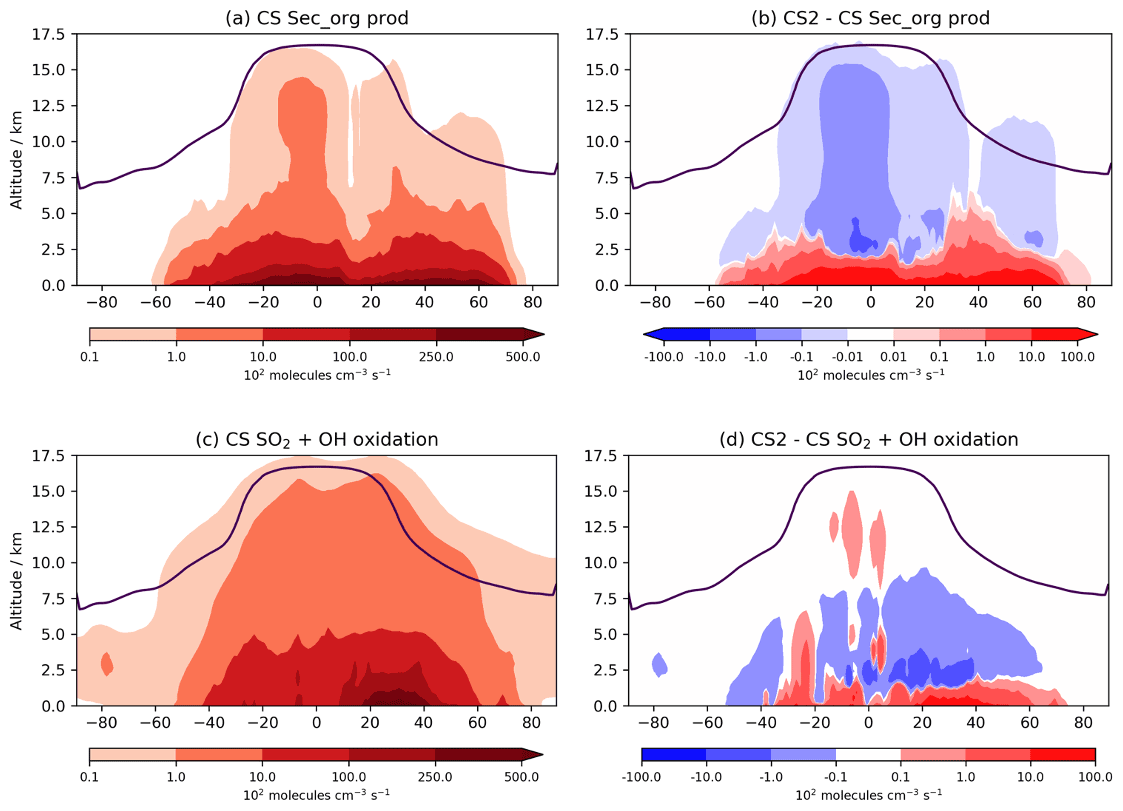
Figure 10Tropospheric annual zonal mean production flux of Sec_Org in (a) CS and (b) the difference between CS2 and CS. Tropospheric annual zonal mean flux of SO2 + OH in (c) CS and (d) the difference between CS2 and CS.
5.2 HO x
The change to OH shows significant spatial and altitudinal variation, increasing at low altitude over land but decreasing over the oceans and in much of the free troposphere. This stems from the different drivers of OH concentrations and their relative importance in different regions.
At low altitude, the terrestrial increases in OH (Fig. 6c, d) are revealed by the sensitivity tests to be driven predominantly by the isoprene scheme: a clear illustration of impact of the HOx-recycling chemistry (Fig. S15 in the Supplement). The inorganic nitrogen changes make a smaller contribution to the low-latitude OH increase, while the O(1D) changes reduce low-altitude OH, but this effect is only noticeable over the oceans.
This significant increase in low terrestrial altitude OH is of particular interest in the context of BVOCs and their impact on the chemical composition of the atmosphere. Concentrations in the lowest 500 m increase by 2–3×105 cm−3 (30 %–50 %) in much of the Amazon, with similar changes seen in other tropical regions and the southeastern USA, the regions with the greatest emissions of isoprene and BVOCs. The boreal forest regions in North America and Eurasia exhibit modest increases of up to 10 % in places since isoprene emissions are lower (Fig. S15). The influence of the updated isoprene chemistry is further apparent when the HOx production flux from two of the key new HOx-recycling pathways, i.e. photolysis of the HPALD and hydroxy unsaturated carbonyl (HUCARB9) species, is compared to that from O(1D)+H2O (Fig. 6f). Over the Amazon and other tropical regions, HOx flux from this pathway amounts to more than 40 % of that from O(1D)+H2O. The difference in BVOC-driven depletion of oxidant concentrations at low altitudes will be even more pronounced when CS2 is compared with ST, which exhibited even lower tropical low-altitude HOx (e.g. Fig. 9, Archer-Nicholls et al., 2021).
However, in much of the free troposphere, OH decreases by 2 %–10 % relative to CS due to the changes made to the O(1D) rate constants (Fig. S20 in the Supplement), which reduces the fraction of O(1D) reacting with H2O (Fig. 6a). This general decline is reversed in the upper tropical troposphere (10–15 km), where OH increases by up to 15 %, driven by an increase in NO stemming from the update to inorganic nitrogen reactions and a smaller contribution from the updated isoprene chemistry (Fig. S16). These free troposphere changes partially reverse the changes simulated between CS and ST (Fig. 6, Archer-Nicholls et al., 2021). In that comparison, tropical free troposphere OH (∼2–6 km) increased in CS relative to ST by 0.5–2×105 cm−3, while here CS2 yields a decrease in the same location of 0.25–1×105 cm−3 compared to CS. In the upper tropical troposphere, CS decreased OH by 1–4×105 cm−3 relative to ST, while CS2 exhibits an increase of 0.25–1.5×105 cm−3 in the same region compared to CS. Thus, the distribution of free troposphere OH in CS2 is more similar to that in ST than the CS distribution is.
Overall, the reduction in the free troposphere OH outweighs the increases elsewhere with the tropospheric air mass-weighted concentration and burden of OH decreasing in CS2 by 1.5 % and 0.49 %, respectively. This is in sharp contrast to the 6.4 % increase in burden simulated by Khan et al. (2020). However, in the CS2_O1D sensitivity test the OH burden increases by 6.6 % relative to CS, allowing us to be confident that the discrepancy between Khan et al. (2020) and this work is predominantly down to the differing O(1D) rate constants. Despite the increase in surface OH, the net reduction in tropospheric OH yields a 2.3 % increase in methane lifetime from 7.43 to 7.60 years (Table 7), also in contrast to the 0.5 years decrease in methane lifetime simulated by Khan et al. (2020). However, the isolated change to isoprene chemistry, given by the comparison of CS2 and CS2_isoprene, causes a methane lifetime decreases of 2.2 % due to the enhanced low-altitude OH.
HO2 also increases at low altitude (up to 6 %–8 % at the surface, Fig. 6b), driven primarily by the new isoprene chemistry, but this increase extends much further into the free troposphere than OH, reaching nearly 5 km above the Equator. HO2 decreases in the rest of the free troposphere, partially from O(1D) changes, and does not exhibit the high increase shown by OH, instead declining by 6 %–8 % in the tropical high troposphere, resulting in a burden decrease of 0.7 %. The greater increase in low-altitude HO2 (than for OH) is likely to be due in part to co-located increases in CO of 3–6 ppb (see the Supplement and Fig. S21a).
5.3 BVOCs
The interactive nature of iBVOC emissions led to average isoprene emissions being 0.36 Tg yr−1 (0.06 %) lower in CS2, while monoterpene emissions were 0.05 Tg yr−1 (0.05 %) lower. However, these differences are dwarfed by the reductions in the burdens of isoprene, α-pinene, and β-pinene of 26 %, 18 %, and 24 %, respectively.
Isoprene mixing ratios averaged over the lowest ∼100 m decrease by 1–3 ppb (∼10 %–30 %) in large parts of South America, Africa, and Southeast Asia (Fig. 7). The greater terrestrial low-altitude HOx increases the OH-initiated oxidative flux of isoprene by 3.5 %, attributable almost entirely to the updated isoprene scheme. However, this is actually outweighed by a 23 % decrease in isoprene destruction by O3, while oxidation via NO3 increased by 3.7 %. Despite the modest global increase, isoprene oxidation is confined even more to low-altitude regions (Fig. 7), a feature also simulated by Karset et al. (2018) (Fig. 8). This also results in lower mixing ratios throughout the whole troposphere (Fig. 7).
α-pinene's chemical destruction by OH, O3, and NO3 changed by 7.5 %, −6.3 %, and −0.8 %, respectively, leading to a total flux increase of 0.05 Tg yr−1 (+0.05 %). The corresponding changes for β-pinene with OH, O3, and NO3 were 3.2 %, −4.3 %, and −0.2 %, with a total increase of 0.70 Tg yr−1 (1.5 %).
The reductions to these BVOC burdens are greater than those simulated by Khan et al. (2020) of 17 %, 4 %, and 9 % for isoprene, α-pinene and β-pinene, respectively. However, Khan et al. (2020) simulated a reduction in O3 over tropical regions and a much smaller increase in NO3 burden (1 %), which would have resulted in significantly lower BVOC destruction fluxes, particularly for the monoterpenes. As discussed in Sect. 4, CS2 simulates a reduction in the model high bias of surface isoprene and (to a lesser extent) monoterpenes when compared to CS and ST.
5.4 HPALDs and IEPOX
While a comparison cannot be made between CS and CS2 for HPALDs and IEPOX, their importance for HOx recycling and SOA formation, respectively, means that examining their global distribution is still useful. Both species follow the surface distribution of isoprene closely (Fig. 8) with IEPOX concentrations typically an order of magnitude greater than HPALDs, something also reflected in their burdens (0.39 and 0.02 Tg, respectively). As discussed in Sect. 4, loss of IEPOX to aerosol via reactive uptake is not currently modelled, and simulated concentrations will decrease once this process is included. Indeed, accurate modelling of IEPOX and its contribution to SOA has been suggested to be important in future climate scenarios (Jo et al., 2021), which highlights the benefits of including IEPOX in CS2 but also the need for careful consideration of how aerosol uptake is modelled. Simulated advection up to the upper tropical troposphere is clearly seen in the DJF zonal means, with potentially important consequences for the IEPOX-derived SOA that has been observed in the lower troposphere in flight campaigns (e.g. Allan et al., 2014).
5.5 NOy
The distribution of nitrated products (NOy) between reactive (NOx) and reservoir species (NOz) changes between CS and CS2 and is detailed in Table 8. Here we use the standard definitions of NOx, NOz, and NOy (Archer-Nicholls et al., 2021) (Eqs. 4–6):
RONO2 comprises alkyl nitrates, hydroxy nitrates, and hydroperoxy nitrates, while PANs comprise all species with peroxyacyl nitrate functionality.
The NOy burden decreases by 4.8 % (in terms of mass of N), driven primarily by a 20 % decline in PANs. However, the NOx burden increases by 4 % with the widespread increase in the tropical high troposphere of 10–20 ppt (up to 25 %), outweighing the reduction in the NH mid-latitude PBL (10–50 ppt, 1 %–2.5 %) (Fig. 9a). The increase in NOx and the reduction in NOy leads to the fraction of NOy as reactive nitrogen increasing by 9 %, and the associated increases to the O3 production, particularly in the free troposphere, are identified in Sect. 5.1. The sensitivity tests revealed the high-altitude NOx rise to be driven predominantly by the change to the inorganic nitrogen, with a smaller contribution from the updated isoprene scheme (Fig. S17 in the Supplement).
The 6 % reduction in NOz burden is dominated by the decrease in PANs, which exceeds 40 ppt in most of the 40∘ N–40∘ S troposphere (Fig. 10e). The decrease in the PAN formation rate constant discussed in Sect. 2 is not the principal driver of this reduction despite reducing by 40 % in much of the troposphere. For the single year used for the sensitivity tests, the PANs burden in CS2_inorgN (featuring the larger formation rate constant) (0.292 Tg N) is much closer to that in CS2 (0.290 Tg N) than in CS (0.364 Tg N). A more important factor is the reduction in the PAN-precursor acyl peroxy radical (MeCO3), driven by the updated isoprene chemistry, whose burden decreases by over 20 % in both CS2 and the sensitivity test CS2_inorgN. This dependency is clearly illustrated by the fact that the isolated change to the inorganic nitrogen reactions (CS2_inorgN) only produces a small decrease to low-altitude PANs, while the change to isoprene scheme (CS2_isoprene) yields a much larger decrease in PANs in spatial agreement with the CS2–CS difference (Fig. S18 in the Supplement). The PANs burden of 0.317 Tg N in the CS2_isoprene test is also closer to that in CS. However, the change in PANs between CS2 and CS is still larger than that simulated from the isolated isoprene chemistry change alone, which suggests there are some synergistic effects occurring.
The 0.4 % increase in HONO2, including increases of up to 30 ppt in the tropical mid-troposphere (Fig. 9d), is driven more by the update to the isoprene scheme than the change to inorganic nitrogen reactions (Fig. S19 in the Supplement).
The 59 % increase in RONO2 burden in CS2 is predominantly due to the significant reduction in the rate constant for the OH-initiated destruction of MeONO2, the principal organonitrate, which brings CS2 into agreement with STRAT-TROP and the most recent IUPAC value. At 290 K, the rate constant is 18 times lower in CS2 and at 250 K it is 50 times lower, yielding a 3-fold MeONO2 burden increase. The update to the isoprene scheme, when isolated, actually reduces RONO2, despite the introduction of the two new organic nitrates (RU12NO3 and RU10NO3). As discussed in the context of the RO2 burden, this is driven by the added competition from the RU14O2 isomerization reactions: the flux of the RU14O2 + NO reaction is 15 % lower in CS2 than CS. The increase in RONO2 is simulated to be 10–20 ppt in the tropical lower altitude and 2–10 ppt for the rest of the troposphere (Fig. 9f, S20).
With the significant drop in PANs as a fraction of NOy (34 % to 28 %) and the increase in HONO2 and NOx, the breakdown of NOy in CS2 is closer to that in ST (Archer-Nicholls et al., 2021). The increase in RONO2 is the only major exception to this since ST, which only has two organonitrate species (isoprene nitrate and MeONO2), has a lower RONO2 burden than CS.
5.6 Impacts on aerosols
A key area of future research with the CRI mechanisms will be on their influence on aerosols. The spatial changes to oxidants are likely to influence secondary organic aerosol (SOA) formation, as discussed in Sect. 1. In UKCA, SOA is produced from the tracer Sec_Org, a surrogate for the oxidized products of α-pinene and β-pinene that adds to existing organic aerosol with an optional boundary layer nucleation scheme involving Sec_Org and H2SO4 based on Metzger et al. (2010) also available. The Sec_Org burden decreases by 7 % in CS2 with noticeable annual variation (DJF −10 %, JJA −4 %). Despite the burden decrease, within the lowest 500 m in the tropics Sec_Org mass concentration increases by 2 %–10 %, driven by an increase its production from α-pinene and β-pinene (Fig. 10a, b). Above this region, Sec_Org production and mass concentration decrease, and thus it appears the greater low-altitude oxidative capacity in CS2 leads to greater production of Sec_Org within the boundary layer but lower concentrations above it. This is likely to have an impact on SOA distribution (and lifetime) since deposition and loss to the aerosol phase is greater in the boundary layer due to the steep decline in aerosol surface aerosol density with altitude. Further detailed analysis involving the fluxes of Sec_Org to aerosol and the resulting changes to size and number distributions are beyond the scope of this work, but examining wider consequences for SOA, in the context of the BVOC-mediated feedback between the biosphere and climate, will form a key area of future research. It is also worth noting an even more pronounced perturbation to SOA may be seen if isoprene is allowed to produce Sec_Org, which is a more realistic approach to simulating SOA (e.g. Scott et al., 2014) and will be explored in future work.
The global perturbation to the oxidation pathways of SO2, another important aerosol precursor, are more modest. From CS to CS2, the oxidative fluxes of SO2 with OH, H2O2, and O3 change by +0.9 %, +0.02 %, and 1.7 %, respectively, while the tropospheric sulfate aerosol burden decreases by just 2.3 %. However, as with isoprene oxidation and Sec_Org production, the burden change belies the more complex perturbations occurring. The increased oxidants at lower altitudes and reduction at greater altitudes result in gas-phase SO2 oxidation increasing by 2.5 %–10 % in the tropical and mid-latitude PBL but decreasing at higher altitudes (Fig. 10c, d). This effect is expected to be even more pronounced when CS2 is compared to ST, which simulates even lower low-altitude OH than CS (Archer-Nicholls et al., 2021) and has been the standard mechanism for investigations into aerosol–oxidant coupling in UKCA (Thornhill et al., 2021; Weber et al., 2020; O'Connor et al., 2021). Therefore, the mechanism-driven changes to oxidants are likely to have consequences for both SOA and sulfate aerosol. While a full investigation into oxidant aerosol coupling is beyond the scope of this paper, it will form a central part of future work with the CRI mechanisms.
The key changes between CS and CS2, driven by the multiple chemistry changes, can be summarized as follows.
-
Ox production increases marginally in CS2, but a larger decrease in Ox destruction, driven by a significant reduction in the O(1D)+H2O flux, leads to a greater O3 tropospheric burden and mixing ratios.
-
The update to the isoprene chemistry increases low-altitude tropical HOx, but the reduction in OH production from O(1D)+H2O results in lower HOx concentrations in much of the free troposphere, increasing methane lifetime.
-
The update to the inorganic nitrogen reactions increases NOx as a fraction of NOy, with a significant increase in the upper tropical free troposphere and a co-located increase in OH. The PAN burden decreases by 20 %.
-
The increase in boundary layer oxidative capacity reduces the burden of BVOCs and confines their oxidation even more to low altitudes, with likely consequences for aerosol production and lifetime.
The radiative impact of isoprene, via its influence on atmospheric chemical composition and organic aerosol, means an accurate description of its chemistry is crucial for advancing our understanding of pre-industrial, present-day and future atmospheres. In this study we describe the incorporation of the Common Representative Intermediates chemistry scheme version 2.2 (CRI v2.2), along with accompanying stratospheric chemistry, into the global chemistry–climate model UKCA to create the mechanism CRI-Strat 2 (CS2). The introduction of CS2 into UKCA facilitates a semi-explicit description of HOx-recycling chemistry during isoprene oxidation via the isomerization of isoprene peroxy radicals to produce HPALDs that yield HOx upon photolysis. This is a key process for reconciling the model low bias of HOx in low-NOx, BVOC-rich regions. In addition, CS2 also features updates to the rate constants of the reactions of O(1D), inorganic nitrogen, and organic peroxy radicals with NO and NO3, bringing the mechanism into agreement with the most recent IUPAC values. CS2 is one of the first mechanisms with this functionality suitable for long-term climate integrations.
A rigorous comparison using UKCA with CS2 and two other chemical mechanisms, STRAT-TROP (ST) (the standard chemistry mechanism used in UKESM1's contributions to CMIP6 experiments) and CRI-STRAT (CS) (which has tropospheric chemistry from an earlier version of the CRI, CRI v2.1), is performed against high-frequency surface and airborne observational data from BVOC-rich regions for multiple chemical species, including O3, OH, HO2, and isoprene, and monoterpene and isoprene oxidation production. The HOx recycling in CS2 results in significantly enhanced surface diel OH (up to 50 % higher than CS at midday) in the Amazon and Borneo (improving model low bias), leading to improved modelling of diel and vertical isoprene profiles and reducing the mean 24 h bias by 50 %–60 % and 20 %–40 % relative to ST and CS, respectively, across the locations considered. However, CRI-Strat 2 exacerbates the existing isoprene model low bias away from the surface, suggesting potential issues with model vertical convection. CS and CS2 yield smaller isoprene column biases compared to observations than ST, in line with the surface and free troposphere observational comparisons, while also illustrating the significant influence the chemical mechanism has on modelled column. This comparison also highlights the significant influence that the different chemistry schemes have on the simulated isoprene column and thus the considerable challenges of determining isoprene emissions via back-calculation.
The low-altitude high biases for O3 in CS increase modestly (1–2 ppb) in CS2. Simulated monoterpene concentrations are biased high at the surface at most of the locations considered, with CS2 returning the smallest bias. As with isoprene, simulated monoterpenes display sharp morning and evening peaks that are believed to be due to boundary layer height issues. Modelled high bias of IEPOX and the low bias of HPALDs suggest further investigation of the key processes of loss to aerosol for IEPOX and HPALD photolysis frequency are needed.
In addition to observational comparisons, a detailed comparison of UKCA model output using CS2 is performed, complementing the earlier comparison of ST and CS (Archer-Nicholls et al., 2021). Sensitivity tests are also performed to help isolate the drivers of the differences between CS and CS2. CS2 simulates an 8 % increase in tropospheric O3 burden this is primarily driven by reduced Ox loss as the changes to rate constants of O(1D) with H2O, O2, and N2 mean that a smaller fraction of O(1D) reacts with H2O to produce OH. Low-altitude O3 increases by 2–4 ppb over much of the globe, driven predominantly by changes to the O(1D) and inorganic nitrogen reactions. More broadly, the widespread influence of the changes to the rate constants of O(1D) and multiple inorganic nitrogen species highlights the importance of having accurate information for these parameters.
Relative to CS, low-altitude OH increases over terrestrial regions, exceeding 50 % in some tropical forested regions, primarily due to the influence of HOx recycling from isoprene. However, OH decreases over the oceans and in much of the free troposphere, driven by updates to the rate constants of the reaction of O(1D) with H2O, O2, and N2. As a result, methane lifetime increases by 1.9 %, which is in stark contrast to previous studies using CRI v2.2 in the STOCHEM model that did not make changes to O(1D) and inorganic nitrogen reactions. When the changes to isoprene chemistry are isolated, methane lifetime decreases by 2.2 %, which is qualitatively in line with previous studies. The addition of isomerization pathways in the updated isoprene scheme reduces the methyl (7 %) and non-methyl peroxy (36 %) radical burdens.
The distribution of nitrated species (NOy) in CS2 is closer to that simulated in ST than CS is with a significant reduction (20 %) in the burden of PANs thatis driven by a reduction in the precursor RO2. The NOx burden increases by 4 %.
The increase in low-altitude OH reduced the burdens of isoprene (25 %) and monoterpenes (11 %–18 %) and the extent of their dispersion: more oxidation takes place in the boundary layer, where loss of oxidation products such as the lumped SOA precursor Sec_Org to existing aerosol is likely to be greater. Enhanced SO2 oxidation in the boundary layer is also simulated. These changes are likely to have implications for SOA and sulfate aerosol, particularly as CS has already been shown to have a more highly oxidizing boundary layer than ST. Therefore, the difference between CS2 and ST (the mechanism used to explore chemical–aerosol coupling in UKESM1 in CMIP6 experiments) is likely to be significant and will be the subject of future work.
The addition of CS2 also lays the groundwork for the incorporation of a novel chemistry scheme that describes the formation of the highly oxidized organic molecules (HOMs) derived from biogenic species such as α-pinene (e.g. CRI-HOM, Weber et al., 2020b). HOMs are crucial for new particle formation without sulfuric acid (Kirkby et al., 2016; Simon et al., 2020), a process which is an important source of new particles in the Amazonian free troposphere (Zhao et al., 2020) and has been simulated to have consequences for our understanding of pre-industrial aerosol burden (Gordon et al., 2016). The influence of isoprene in HOM production (Kiendler-Schaar et al., 2009; McFiggans et al., 2019; Heinritzi et al., 2020) can also be captured by the addition of CRI-HOM, making UKCA one of the very first global chemistry–climate models to feature a semi-explicit representation of HOMs and enabling further investigation into the climatic impact of the interaction between BVOCs. The addition of long-chain terpenes to CS2 is also planned, including sesquiterpenes, which may reduce the surface ozone high bias, form HOMs, and make improvements to the uptake of oxidized species to plant surfaces.
While certain elements of the CRI-STRAT 2 mechanism in UKCA such as the ozone high bias remain problematic, its incorporation represents a major step forward in our ability to simulate isoprene chemistry in low-NOx environments. The simulated changes to oxidants in CRI-Strat 2 will affect the atmosphere's radiative balance by perturbing certain greenhouse gases and aerosols, and investigating the impact of this will be a major topic of future work. In particular, the feedback between the biosphere and climate, mediated by BVOCs, will be evaluated using multiple mechanisms to assess their influence. CRI-Strat 2 can be taken up for use, alongside other mechanisms, to further our understanding of the wide-ranging impact BVOCs have on climate.
Due to intellectual property right restrictions, we cannot provide either the source code or documentation papers for the UM. The Met Office United Model is available for use under licence. A number of research organizations and national meteorological services use the UM in collaboration with the UK Met Office to undertake basic atmospheric process research, produce forecasts, develop the UM code, and build and evaluate Earth system models. For further information on how to apply for a licence, see https://www.metoffice.gov.uk/research/approach/modelling-systems/unified-model (last access: 24 November 2020).
The description of the ZF2 field campaign is given in Sect. S4, and the observational data are available at https://doi.org/10.17863/CAM.65133 (Weber and Bannan, 2021).
The observational data from the SEAC4RS flight campaign are available at https://www-air.larc.nasa.gov/cgi-bin/ArcView/seac4rs?MERGE=1#60_SECOND.DC8_MRG (Chen, 2016).
The observational data from the ATTO tower are available to download at https://www.attodata.org (last access: 9 April 2021). Specific data sets used were https://www.attodata.org/ddm/data/Showdata/72, https://www.attodata.org/ddm/data/Showdata/73, https://www.attodata.org/ddm/data/Showdata/74, and https://www.attodata.org/ddm/data/Showdata/77 (Yáñez-Serrano, 2020a, b, c, d).
The observational data from the FAAM aircraft are available at http://data.ceda.ac.uk/badc/op3/data/op3-aircraft (last access: 27 March 2021), and the Borneo data can be found at http://data.ceda.ac.uk/badc/op3/data (last access: 27 March 2021; Natural Environment Research Council et al., 2010).
Data tables of the full CRI-Strat 2 mechanism and the mechanisms used in the sensitivity test described in this paper are included in the Supplement. The CRI v2.2 mechanism can be viewed and downloaded from http://cri.york.ac.uk (Jenkin et al., 2019b).
Model data and analysis code are available from James Weber on request.
The supplement related to this article is available online at: https://doi.org/10.5194/gmd-14-5239-2021-supplement.
Mechanism incorporation was carried out by JaW with support from SAN and NLA and advice from ATA, YMS, MJ, MAHK, and DES. Observational comparison experiments were designed and carried out by JaW with advice from SAN, NLA, and ATA. Mechanism intercomparison experiments were designed by JaW with advice from ATA, NLA, and SAN and executed by JaW. TJB, CJP, AB, and PA compiled and supplied the ZF2 Brazil observational data, and TJB wrote the field campaign description in the Supplement. RHS advised on the SEAC4RS data and analysis. JaW interpreted the ZF2 Brazil, Borneo, ATTO, FAAM, GABRIEL, and SEAC4RS observational data with advice from SAN, ATA, and JoW. JaW wrote the paper. All co-authors discussed the results and commented on the paper.
The authors declare that they have no conflict of interest.
Publisher's note: Copernicus Publications remains neutral with regard to jurisdictional claims in published maps and institutional affiliations.
This work used Monsoon2, a collaborative high-performance computing facility funded by the Met Office and the Natural Environment Research Council. This work used JASMIN, the UK collaborative data analysis facility.
We are grateful to Horst Fischer, Hartwig Harder, and Pete Edwards for their assistance and advice and to Jason Surratt for providing the calibration standards for the ZF2 Brazil study. We are grateful for the field support from the LBA central office at INPA in Manaus.
James Weber has been funded by a Vice-Chancellor's Award from the Cambridge Trust. Scott Archer-Nicholls and Alex T. Archibald have been funded by NERC PROMOTE (grant no. NE/P016383/1). Nathan Luke Abraham and Alex T. Archibald are supported by NERC and NCAS through the ACSIS project. Youngsub M. Shin has been funded by NERC through the University of Cambridge ESS-DTP. M. Anwar H. Khan and Dudley E. Shallcross are funded by NERC (grant no. NE/K004905/1), Bristol ChemLabS, and the Primary Science Teaching Trust. Thomas J.Bannan, Carl J. Percival, Asan Bacak, and Paulo Artaxo acknowledge funding from FAPESP – Fundação de Amparo à Pesquisa do Estado de São Paulo (grant no. 2017/17047-0).
This paper was edited by Tim Butler and reviewed by two anonymous referees.
Abraham, N. L., Archibald, A. T., Cresswell, P., Cusworth, S., Dalvi, M., Matthews, D., Wardle, S., and Whitehouse, S.: Using a virtual machine environment for developing, testing, and training for the UM-UKCA composition-climate model, using Unified Model version 10.9 and above, Geosci. Model Dev., 11, 3647–3657, https://doi.org/10.5194/gmd-11-3647-2018, 2018.
Allan, J. D., Morgan, W. T., Darbyshire, E., Flynn, M. J., Williams, P. I., Oram, D. E., Artaxo, P., Brito, J., Lee, J. D., and Coe, H.: Airborne observations of IEPOX-derived isoprene SOA in the Amazon during SAMBBA, Atmos. Chem. Phys., 14, 11393–11407, https://doi.org/10.5194/acp-14-11393-2014, 2014.
Archibald, A. T., Levine, J. G., Abraham, N. L., Cooke, M. C., Edwards, P. M., Heard, D. E., Jenkin, M. E., Karunaharan, A., Pike, R. C., Monks, P. S., and Shallcross, D. E.: Impacts of HOx regeneration and recycling in the oxidation of isoprene: Consequences for the composition of past, present and future atmospheres, Geophys. Res. Lett., 38, L05804, https://doi.org/10.1029/2010GL046520, 2011.
Archibald, A. T., O'Connor, F. M., Abraham, N. L., Archer-Nicholls, S., Chipperfield, M. P., Dalvi, M., Folberth, G. A., Dennison, F., Dhomse, S. S., Griffiths, P. T., Hardacre, C., Hewitt, A. J., Hill, R. S., Johnson, C. E., Keeble, J., Köhler, M. O., Morgenstern, O., Mulcahy, J. P., Ordóñez, C., Pope, R. J., Rumbold, S. T., Russo, M. R., Savage, N. H., Sellar, A., Stringer, M., Turnock, S. T., Wild, O., and Zeng, G.: Description and evaluation of the UKCA stratosphere–troposphere chemistry scheme (StratTrop vn 1.0) implemented in UKESM1, Geosci. Model Dev., 13, 1223–1266, https://doi.org/10.5194/gmd-13-1223-2020, 2020a.
Archibald, A. T., Neu, J. L., Elshorbany, Y. F., Cooper, O. R., Young, P. J., Akiyoshi, H., Cox, R. A., Coyle, M., Derwent, R. G., Deushi, M., and Finco, A.: Tropospheric Ozone Assessment ReportA critical review of changes in the tropospheric ozone burden and budget from 1850 to 2100. Elementa: Science of the Anthropocene, 8, 034, https://doi.org/10.1525/elementa.2020.034, 2020b.
Archer-Nicholls, S., Abraham, N. L., Shin, Y. M., Weber, J., Russo, M. R., Lowe, D., Utembe, S., O'Connor, F. M., Kerridge, B., Latter, B., and Siddans, R.: The Common Representative Intermediates Mechanism version 2 in the United Kingdom Chemistry and Aerosols Model, J. Adv. Model. Earth Sy., https://doi.org/10.1029/2020MS002420, 2021.
Bates, K. H. and Jacob, D. J.: A new model mechanism for atmospheric oxidation of isoprene: global effects on oxidants, nitrogen oxides, organic products, and secondary organic aerosol, Atmos. Chem. Phys., 19, 9613–9640, https://doi.org/10.5194/acp-19-9613-2019, 2019.
Butler, T. M., Taraborrelli, D., Brühl, C., Fischer, H., Harder, H., Martinez, M., Williams, J., Lawrence, M. G., and Lelieveld, J.: Improved simulation of isoprene oxidation chemistry with the ECHAM5/MESSy chemistry-climate model: lessons from the GABRIEL airborne field campaign, Atmos. Chem. Phys., 8, 4529–4546, https://doi.org/10.5194/acp-8-4529-2008, 2008.
Chen, J.: Merged data file for SEAC4RS, Flight 01 (20130806), on the dc8 platform, NASA [data set], available at: https://www-air.larc.nasa.gov/cgi-bin/ArcView/seac4rs?MERGE=1#60_SECOND.DC8_MRG (last access: 9 April 2021), 2016.
Chen, J., Liu, Y., Zhang, M., and Peng, Y.: New understanding and quantification of the regime dependence of aerosol-cloud interaction for studying aerosol indirect effects, Geophys. Res. Lett., 43, 1780–1787, https://doi.org/10.1002/2016GL067683, 2016.
Claeys, M. and Maenhaut, W.: Secondary Organic Aerosol Formation from Isoprene: Selected Research, Historic Account and State of the Art, Atmosphere, 12, 728, https://doi.org/10.3390/atmos12060728, 2021.
Collins, W. J., Lamarque, J.-F., Schulz, M., Boucher, O., Eyring, V., Hegglin, M. I., Maycock, A., Myhre, G., Prather, M., Shindell, D., and Smith, S. J.: AerChemMIP: quantifying the effects of chemistry and aerosols in CMIP6, Geosci. Model Dev., 10, 585–607, https://doi.org/10.5194/gmd-10-585-2017, 2017.
Crounse, J. D., Paulot, F., Kjaergaard, H. G., and Wennberg, P. O.: Peroxy radical isomerization in the oxidation of isoprene, Phys. Chem. Chem. Phys., 13, 13607–13613, https://doi.org/10.1039/C1CP21330J, 2011.
Dee, D. P., Uppala, S. M., Simmons, A. J., Berrisford, P., Poli, P., Kobayashi, S., Andrae, U., Balmaseda, M. A., Balsamo, G., Bauer, P., Bechtold, P., Beljaars, A. C. M., van de Berg, L., Bidlot, J., Bormann, N., Delsol, C., Dragani, R., Fuentes, M., Geer, A. J., Haimberger, L., Healy, S. B., Hersbach, H., Hólm, E. V., Isaksen, L., Kållberg, P., Köhler, M., Matricardi, M., McNally, A. P., Monge-Sanz, B. M., Morcrette, J.-J., Park, B.-K., Peubey, C., de Rosnay, P., Tavolato, C., Thépaut, J.-N., and Vitart, F.: The ERA-Interim reanalysis: configuration and performance of the data assimilation system, Q. J. Roy. Meteor. Soc., 137, 553–597, https://doi.org/10.1002/qj.828, 2011.
Edwards, P. M., Evans, M. J., Furneaux, K. L., Hopkins, J., Ingham, T., Jones, C., Lee, J. D., Lewis, A. C., Moller, S. J., Stone, D., Whalley, L. K., and Heard, D. E.: OH reactivity in a South East Asian tropical rainforest during the Oxidant and Particle Photochemical Processes (OP3) project, Atmos. Chem. Phys., 13, 9497–9514, https://doi.org/10.5194/acp-13-9497-2013, 2013.
Gordon, H., Sengupta, K., Rap, A., Duplissy, J., Frege, C., Williamson, C., Heinritzi, M., Simon, M., Yan, C., Almeida, J., and Tröstl, J.: Reduced anthropogenic aerosol radiative forcing caused by biogenic new particle formation, P. Natl. Acad. Sci. USA, 113, 12053–12058, https://doi.org/10.1073/pnas.1602360113, 2016.
Griffiths, P. T., Murray, L. T., Zeng, G., Shin, Y. M., Abraham, N. L., Archibald, A. T., Deushi, M., Emmons, L. K., Galbally, I. E., Hassler, B., Horowitz, L. W., Keeble, J., Liu, J., Moeini, O., Naik, V., O'Connor, F. M., Oshima, N., Tarasick, D., Tilmes, S., Turnock, S. T., Wild, O., Young, P. J., and Zanis, P.: Tropospheric ozone in CMIP6 simulations, Atmos. Chem. Phys., 21, 4187–4218, https://doi.org/10.5194/acp-21-4187-2021, 2021.
Guenther, A. B., Jiang, X., Heald, C. L., Sakulyanontvittaya, T., Duhl, T., Emmons, L. K., and Wang, X.: The Model of Emissions of Gases and Aerosols from Nature version 2.1 (MEGAN2.1): an extended and updated framework for modeling biogenic emissions, Geosci. Model Dev., 5, 1471–1492, https://doi.org/10.5194/gmd-5-1471-2012, 2012.
Heinritzi, M., Dada, L., Simon, M., Stolzenburg, D., Wagner, A. C., Fischer, L., Ahonen, L. R., Amanatidis, S., Baalbaki, R., Baccarini, A., Bauer, P. S., Baumgartner, B., Bianchi, F., Brilke, S., Chen, D., Chiu, R., Dias, A., Dommen, J., Duplissy, J., Finkenzeller, H., Frege, C., Fuchs, C., Garmash, O., Gordon, H., Granzin, M., El Haddad, I., He, X., Helm, J., Hofbauer, V., Hoyle, C. R., Kangasluoma, J., Keber, T., Kim, C., Kürten, A., Lamkaddam, H., Laurila, T. M., Lampilahti, J., Lee, C. P., Lehtipalo, K., Leiminger, M., Mai, H., Makhmutov, V., Manninen, H. E., Marten, R., Mathot, S., Mauldin, R. L., Mentler, B., Molteni, U., Müller, T., Nie, W., Nieminen, T., Onnela, A., Partoll, E., Passananti, M., Petäjä, T., Pfeifer, J., Pospisilova, V., Quéléver, L. L. J., Rissanen, M. P., Rose, C., Schobesberger, S., Scholz, W., Scholze, K., Sipilä, M., Steiner, G., Stozhkov, Y., Tauber, C., Tham, Y. J., Vazquez-Pufleau, M., Virtanen, A., Vogel, A. L., Volkamer, R., Wagner, R., Wang, M., Weitz, L., Wimmer, D., Xiao, M., Yan, C., Ye, P., Zha, Q., Zhou, X., Amorim, A., Baltensperger, U., Hansel, A., Kulmala, M., Tomé, A., Winkler, P. M., Worsnop, D. R., Donahue, N. M., Kirkby, J., and Curtius, J.: Molecular understanding of the suppression of new-particle formation by isoprene, Atmos. Chem. Phys., 20, 11809–11821, https://doi.org/10.5194/acp-20-11809-2020, 2020.
Hewitt, C. N., Lee, J. D., MacKenzie, A. R., Barkley, M. P., Carslaw, N., Carver, G. D., Chappell, N. A., Coe, H., Collier, C., Commane, R., Davies, F., Davison, B., DiCarlo, P., Di Marco, C. F., Dorsey, J. R., Edwards, P. M., Evans, M. J., Fowler, D., Furneaux, K. L., Gallagher, M., Guenther, A., Heard, D. E., Helfter, C., Hopkins, J., Ingham, T., Irwin, M., Jones, C., Karunaharan, A., Langford, B., Lewis, A. C., Lim, S. F., MacDonald, S. M., Mahajan, A. S., Malpass, S., McFiggans, G., Mills, G., Misztal, P., Moller, S., Monks, P. S., Nemitz, E., Nicolas-Perea, V., Oetjen, H., Oram, D. E., Palmer, P. I., Phillips, G. J., Pike, R., Plane, J. M. C., Pugh, T., Pyle, J. A., Reeves, C. E., Robinson, N. H., Stewart, D., Stone, D., Whalley, L. K., and Yin, X.: Overview: oxidant and particle photochemical processes above a south-east Asian tropical rainforest (the OP3 project): introduction, rationale, location characteristics and tools, Atmos. Chem. Phys., 10, 169–199, https://doi.org/10.5194/acp-10-169-2010, 2010.
Hoesly, R. M., Smith, S. J., Feng, L., Klimont, Z., Janssens-Maenhout, G., Pitkanen, T., Seibert, J. J., Vu, L., Andres, R. J., Bolt, R. M., Bond, T. C., Dawidowski, L., Kholod, N., Kurokawa, J.-I., Li, M., Liu, L., Lu, Z., Moura, M. C. P., O'Rourke, P. R., and Zhang, Q.: Historical (1750–2014) anthropogenic emissions of reactive gases and aerosols from the Community Emissions Data System (CEDS), Geosci. Model Dev., 11, 369–408, https://doi.org/10.5194/gmd-11-369-2018, 2018.
Jenkin, M. E., Watson, L. A., Utembe, S. R., and Shallcross, D. E.: A Common Representative Intermediates (CRI) mechanism for VOC degradation. Part 1: Gas phase mechanism development, Atmos. Environ., 42, 7185–7195, https://doi.org/10.1016/j.atmosenv.2008.07.028, 2008.
Jenkin, M. E., Young, J. C., and Rickard, A. R.: The MCM v3.3.1 degradation scheme for isoprene, Atmos. Chem. Phys., 15, 11433–11459, https://doi.org/10.5194/acp-15-11433-2015, 2015.
Jenkin, M. E., Khan, M. A. H., Shallcross, D. E., Bergström, R., Simpson, D., Murphy, K. L. C., and Rickard, A. R.: The CRI v2. 2 reduced degradation scheme for isoprene, Atmos. Environ., 212, 172–182, https://doi.org/10.1016/j.atmosenv.2019.05.055, 2019a.
Jenkin, M., Watson, L., Utembe, S., and Richard, A.: Chemical mechanistic information taken from the CRI mechanism, CRI v2.2 (Jenkin et al., 2019) [data set], available at the Master Chemical Mechanism and CRI websites: http://mcm.york.ac.uk/ and http://cri.york.ac.uk/home.htt (last access: 1 July 2021), 2019b.
Jo, D. S., Hodzic, A., Emmons, L. K., Tilmes, S., Schwantes, R. H., Mills, M. J., Campuzano-Jost, P., Hu, W., Zaveri, R. A., Easter, R. C., Singh, B., Lu, Z., Schulz, C., Schneider, J., Shilling, J. E., Wisthaler, A., and Jimenez, J. L.: Future changes in isoprene-epoxydiol-derived secondary organic aerosol (IEPOX SOA) under the Shared Socioeconomic Pathways: the importance of physicochemical dependency, Atmos. Chem. Phys., 21, 3395–3425, https://doi.org/10.5194/acp-21-3395-2021, 2021.
Karset, I. H. H., Berntsen, T. K., Storelvmo, T., Alterskjær, K., Grini, A., Olivié, D., Kirkevåg, A., Seland, Ø., Iversen, T., and Schulz, M.: Strong impacts on aerosol indirect effects from historical oxidant changes, Atmos. Chem. Phys., 18, 7669–7690, https://doi.org/10.5194/acp-18-7669-2018, 2018.
Kelly, J. M., Doherty, R. M., O'Connor, F. M., and Mann, G. W.: The impact of biogenic, anthropogenic, and biomass burning volatile organic compound emissions on regional and seasonal variations in secondary organic aerosol, Atmos. Chem. Phys., 18, 7393–7422, https://doi.org/10.5194/acp-18-7393-2018, 2018.
Khan, M. A. H., Schlich, B. L., Jenkin, M. E., Cooke, M. C., Derwent, R. G., Neu, J. L., Percival, C. J., and Shallcross, D. E.: Changes to simulated global atmospheric composition resulting from recent revisions to isoprene oxidation chemistry. Atmos. Environ., 244, 117914, https://doi.org/10.1016/j.atmosenv.2020.117914, 2020.
Kiendler-Scharr, A., Wildt, J., Dal Maso, M., Hohaus, T., Kleist, E., Mentel, T. F., Tillmann, R., Uerlings, R., Schurr, U., and Wahner, A.: New particle formation in forests inhibited by isoprene emissions. Nature, 461, 381–384, https://doi.org/10.1038/nature08292, 2009, 2009.
Kirkby, J., Duplissy, J., Sengupta, K., Frege, C., Gordon, H., Williamson, C., Heinritzi, M., Simon, M., Yan, C., Almeida, J., and Tröstl, J.: Ion-induced nucleation of pure biogenic particles, Nature, 533, 521–526, https://doi.org/10.1038/nature17953, 2016.
Lelieveld, J., Butler, T. M., Crowley, J. N., Dillon, T. J., Fischer, H., Ganzeveld, L., Harder, H., Lawrence, M. G., Martinez, M., Taraborrelli, D., and Williams, J.: Atmospheric oxidation capacity sustained by a tropical forest, Nature, 452, 737–740, https://doi.org/10.1038/nature06870, 2008.
Liu, Z., Nguyen, V. S., Harvey, J., Müller, J. F., and Peeters, J.: Theoretically derived mechanisms of HPALD photolysis in isoprene oxidation. Phys. Chem. Chem. Phys., 19, 9096–9106, https://doi.org/10.1039/C7CP00288B, 2017.
Makkonen, R., Asmi, A., Kerminen, V.-M., Boy, M., Arneth, A., Guenther, A., and Kulmala, M.: BVOC-aerosol-climate interactions in the global aerosol-climate model ECHAM5.5-HAM2, Atmos. Chem. Phys., 12, 10077–10096, https://doi.org/10.5194/acp-12-10077-2012, 2012.
Mann, G. W., Carslaw, K. S., Spracklen, D. V., Ridley, D. A., Manktelow, P. T., Chipperfield, M. P., Pickering, S. J., and Johnson, C. E.: Description and evaluation of GLOMAP-mode: a modal global aerosol microphysics model for the UKCA composition-climate model, Geosci. Model Dev., 3, 519–551, https://doi.org/10.5194/gmd-3-519-2010, 2010.
McFiggans, G., Mentel, T. F., Wildt, J., Pullinen, I., Kang, S., Kleist, E., Schmitt, S., Springer, M., Tillmann, R., Wu, C., and Zhao, D.: Secondary organic aerosol reduced by mixture of atmospheric vapours. Nature, 565, 587–593, https://doi.org/10.1038/s41586-018-0871-y, 2019.
Metzger, A., Verheggen, B., Dommen, J., Duplissy, J., Prevot, A. S., Weingartner, E., Riipinen, I., Kulmala, M., Spracklen, D. V., Carslaw, K. S., and Baltensperger, U.: Evidence for the role of organics in aerosol particle formation under atmospheric conditions, P. Natl. Acad. Sci. USA, 107, 6646–6651, https://doi.org/10.1073/pnas.0911330107, 2010.
Møller, K. H., Bates, K. H., and Kjaergaard, H. G.: The importance of peroxy radical hydrogen-shift reactions in atmospheric isoprene oxidation, J. Phys. Chem. A, 123, 920–932, https://doi.org/10.1021/acs.jpca.8b10432, 2019.
Morgenstern, O., Braesicke, P., O'Connor, F. M., Bushell, A. C., Johnson, C. E., Osprey, S. M., and Pyle, J. A.: Evaluation of the new UKCA climate-composition model – Part 1: The stratosphere, Geosci. Model Dev., 2, 43–57, https://doi.org/10.5194/gmd-2-43-2009, 2009.
Mulcahy, J. P., Johnson, C., Jones, C. G., Povey, A. C., Scott, C. E., Sellar, A., Turnock, S. T., Woodhouse, M. T., Abraham, N. L., Andrews, M. B., Bellouin, N., Browse, J., Carslaw, K. S., Dalvi, M., Folberth, G. A., Glover, M., Grosvenor, D. P., Hardacre, C., Hill, R., Johnson, B., Jones, A., Kipling, Z., Mann, G., Mollard, J., O'Connor, F. M., Palmiéri, J., Reddington, C., Rumbold, S. T., Richardson, M., Schutgens, N. A. J., Stier, P., Stringer, M., Tang, Y., Walton, J., Woodward, S., and Yool, A.: Description and evaluation of aerosol in UKESM1 and HadGEM3-GC3.1 CMIP6 historical simulations, Geosci. Model Dev., 13, 6383–6423, https://doi.org/10.5194/gmd-13-6383-2020, 2020.
Müller, J.-F., Stavrakou, T., and Peeters, J.: Chemistry and deposition in the Model of Atmospheric composition at Global and Regional scales using Inversion Techniques for Trace gas Emissions (MAGRITTE v1.1) – Part 1: Chemical mechanism, Geosci. Model Dev., 12, 2307–2356, https://doi.org/10.5194/gmd-12-2307-2019, 2019.
Natural Environment Research Council, Hewitt, N., Edwards, P., Helfter, C., Irwin, M., Karunaharan, A., Lee, J. D., Newton, H., Robinson, N., and Ryder, J.: OP3 Project: Airborne and Ground-based Meteorological Instruments Records as part of the Oxidant and Particle Photochemical Processes above a South-East Asian tropical rain forest, NCAS British Atmospheric Data Centre [data set], available at: http://catalogue.ceda.ac.uk/uuid/9279c7e807a2ef0eb78a03c3821e62c4 (last access: 27 March 2021), 2010.
Nguyen, T. B., Coggon, M. M., Bates, K. H., Zhang, X., Schwantes, R. H., Schilling, K. A., Loza, C. L., Flagan, R. C., Wennberg, P. O., and Seinfeld, J. H.: Organic aerosol formation from the reactive uptake of isoprene epoxydiols (IEPOX) onto non-acidified inorganic seeds, Atmos. Chem. Phys., 14, 3497–3510, https://doi.org/10.5194/acp-14-3497-2014, 2014.
Nguyen, T. B., Bates, K. H., Crounse, J. D., Schwantes, R. H., Zhang, X., Kjaergaard, H. G., Surratt, J. D., Lin, P., Laskin, A., Seinfeld, J. H., and Wennberg, P. O.: Mechanism of the hydroxyl radical oxidation of methacryloyl peroxynitrate (MPAN) and its pathway toward secondary organic aerosol formation in the atmosphere. Phys. Chem. Chem. Phys., 17, 17914–17926, https://doi.org/10.1039/C5CP02001H, 2017.
Novelli, A., Vereecken, L., Bohn, B., Dorn, H.-P., Gkatzelis, G. I., Hofzumahaus, A., Holland, F., Reimer, D., Rohrer, F., Rosanka, S., Taraborrelli, D., Tillmann, R., Wegener, R., Yu, Z., Kiendler-Scharr, A., Wahner, A., and Fuchs, H.: Importance of isomerization reactions for OH radical regeneration from the photo-oxidation of isoprene investigated in the atmospheric simulation chamber SAPHIR, Atmos. Chem. Phys., 20, 3333–3355, https://doi.org/10.5194/acp-20-3333-2020, 2020.
O'Connor, F. M., Abraham, N. L., Dalvi, M., Folberth, G. A., Griffiths, P. T., Hardacre, C., Johnson, B. T., Kahana, R., Keeble, J., Kim, B., Morgenstern, O., Mulcahy, J. P., Richardson, M., Robertson, E., Seo, J., Shim, S., Teixeira, J. C., Turnock, S. T., Williams, J., Wiltshire, A. J., Woodward, S., and Zeng, G.: Assessment of pre-industrial to present-day anthropogenic climate forcing in UKESM1, Atmos. Chem. Phys., 21, 1211–1243, https://doi.org/10.5194/acp-21-1211-2021, 2021
Olivier, J. G. J., Peters, J., Granier, C., Petron, G., Muller, J.-F., and Wallens, S.: Present and future surface emissions of atmospheric compounds, POET Report #3, EU project EVK2-1999-00011, available at: http://www.aero.jussieu.fr/projet/ACCENT/Documents/del2_final.doc (last access: 13 August 2021), 2003.
Pacifico, F., Folberth, G. A., Jones, C. D., Harrison, S. P., and Collins, W. J.: Sensitivity of biogenic isoprene emissions to past, present, and future environmental conditions and implications for atmospheric chemistry, J. Geophys. Res.-Atmos., 117, D22302, https://doi.org/10.1029/2012JD018276, 2012.
Peeters, J., Nguyen, T. L., and Vereecken, L.: HOx radical regeneration in the oxidation of isoprene, Phys. Chem. Chem. Phys., 11, 5935–5939, https://doi.org/10.1039/B908511D, 2009.
Peeters, J., Müller, J. F., Stavrakou, T., and Nguyen, V. S.: Hydroxyl radical recycling in isoprene oxidation driven by hydrogen bonding and hydrogen tunneling: The upgraded LIM1 mechanism, J. Phys. Chem. A, 118, 8625–8643, https://doi.org/10.1021/jp5033146, 2014.
Prather, M. J.: Photolysis rates in correlated overlapping cloud fields: Cloud-J 7.3c, Geosci. Model Dev., 8, 2587–2595, https://doi.org/10.5194/gmd-8-2587-2015, 2015.
Sander, R., Baumgaertner, A., Cabrera-Perez, D., Frank, F., Gromov, S., Grooß, J.-U., Harder, H., Huijnen, V., Jöckel, P., Karydis, V. A., Niemeyer, K. E., Pozzer, A., Riede, H., Schultz, M. G., Taraborrelli, D., and Tauer, S.: The community atmospheric chemistry box model CAABA/MECCA-4.0, Geosci. Model Dev., 12, 1365–1385, https://doi.org/10.5194/gmd-12-1365-2019, 2019.
Schwantes, R. H., Emmons, L. K., Orlando, J. J., Barth, M. C., Tyndall, G. S., Hall, S. R., Ullmann, K., St. Clair, J. M., Blake, D. R., Wisthaler, A., and Bui, T. P. V.: Comprehensive isoprene and terpene gas-phase chemistry improves simulated surface ozone in the southeastern US, Atmos. Chem. Phys., 20, 3739–3776, https://doi.org/10.5194/acp-20-3739-2020, 2020.
Scott, C. E., Rap, A., Spracklen, D. V., Forster, P. M., Carslaw, K. S., Mann, G. W., Pringle, K. J., Kivekäs, N., Kulmala, M., Lihavainen, H., and Tunved, P.: The direct and indirect radiative effects of biogenic secondary organic aerosol, Atmos. Chem. Phys., 14, 447–470, https://doi.org/10.5194/acp-14-447-2014, 2014.
Sellar, A. A., Walton, J., Jones, C. G., Wood, R., Abraham, N. L., Andrejczuk, M., Andrews, M. B., Andrews, T., Archibald, A. T., de Mora, L., and Dyson, H.: Implementation of UK Earth system models for CMIP6, J. Adv. Model. Earth Sy., 12, e2019MS00194, https://doi.org/10.1029/2019MS001946, 2020.
Simon, M., Dada, L., Heinritzi, M., Scholz, W., Stolzenburg, D., Fischer, L., Wagner, A. C., Kürten, A., Rörup, B., He, X.-C., Almeida, J., Baalbaki, R., Baccarini, A., Bauer, P. S., Beck, L., Bergen, A., Bianchi, F., Bräkling, S., Brilke, S., Caudillo, L., Chen, D., Chu, B., Dias, A., Draper, D. C., Duplissy, J., El-Haddad, I., Finkenzeller, H., Frege, C., Gonzalez-Carracedo, L., Gordon, H., Granzin, M., Hakala, J., Hofbauer, V., Hoyle, C. R., Kim, C., Kong, W., Lamkaddam, H., Lee, C. P., Lehtipalo, K., Leiminger, M., Mai, H., Manninen, H. E., Marie, G., Marten, R., Mentler, B., Molteni, U., Nichman, L., Nie, W., Ojdanic, A., Onnela, A., Partoll, E., Petäjä, T., Pfeifer, J., Philippov, M., Quéléver, L. L. J., Ranjithkumar, A., Rissanen, M. P., Schallhart, S., Schobesberger, S., Schuchmann, S., Shen, J., Sipilä, M., Steiner, G., Stozhkov, Y., Tauber, C., Tham, Y. J., Tomé, A. R., Vazquez-Pufleau, M., Vogel, A. L., Wagner, R., Wang, M., Wang, D. S., Wang, Y., Weber, S. K., Wu, Y., Xiao, M., Yan, C., Ye, P., Ye, Q., Zauner-Wieczorek, M., Zhou, X., Baltensperger, U., Dommen, J., Flagan, R. C., Hansel, A., Kulmala, M., Volkamer, R., Winkler, P. M., Worsnop, D. R., Donahue, N. M., Kirkby, J., and Curtius, J.: Molecular understanding of new-particle formation from α-pinene between −50 and +25 ∘C, Atmos. Chem. Phys., 20, 9183–9207, https://doi.org/10.5194/acp-20-9183-2020, 2020.
Sindelarova, K., Granier, C., Bouarar, I., Guenther, A., Tilmes, S., Stavrakou, T., Müller, J.-F., Kuhn, U., Stefani, P., and Knorr, W.: Global data set of biogenic VOC emissions calculated by the MEGAN model over the last 30 years, Atmos. Chem. Phys., 14, 9317–9341, https://doi.org/10.5194/acp-14-9317-2014, 2014.
Sporre, M. K., Blichner, S. M., Schrödner, R., Karset, I. H. H., Berntsen, T. K., van Noije, T., Bergman, T., O'Donnell, D., and Makkonen, R.: Large difference in aerosol radiative effects from BVOC-SOA treatment in three Earth system models, Atmos. Chem. Phys., 20, 8953–8973, https://doi.org/10.5194/acp-20-8953-2020, 2020.
Squire, O. J., Archibald, A. T., Griffiths, P. T., Jenkin, M. E., Smith, D., and Pyle, J. A.: Influence of isoprene chemical mechanism on modelled changes in tropospheric ozone due to climate and land use over the 21st century, Atmos. Chem. Phys., 15, 5123–5143, https://doi.org/10.5194/acp-15-5123-2015, 2015.
Telford, P. J., Abraham, N. L., Archibald, A. T., Braesicke, P., Dalvi, M., Morgenstern, O., O'Connor, F. M., Richards, N. A. D., and Pyle, J. A.: Implementation of the Fast-JX Photolysis scheme (v6.4) into the UKCA component of the MetUM chemistry-climate model (v7.3), Geosci. Model Dev., 6, 161–177, https://doi.org/10.5194/gmd-6-161-2013, 2013.
Teng, A. P., Crounse, J. D., and Wennberg, P. O.: Isoprene peroxy radical dynamics, J. Am. Chem. Soc., 139, 5367–5377, https://doi.org/10.1021/jacs.6b12838, 2017.
Thornhill, G., Collins, W., Olivié, D., Skeie, R. B., Archibald, A., Bauer, S., Checa-Garcia, R., Fiedler, S., Folberth, G., Gjermundsen, A., Horowitz, L., Lamarque, J.-F., Michou, M., Mulcahy, J., Nabat, P., Naik, V., O'Connor, F. M., Paulot, F., Schulz, M., Scott, C. E., Séférian, R., Smith, C., Takemura, T., Tilmes, S., Tsigaridis, K., and Weber, J.: Climate-driven chemistry and aerosol feedbacks in CMIP6 Earth system models, Atmos. Chem. Phys., 21, 1105–1126, https://doi.org/10.5194/acp-21-1105-2021, 2021.
Toon, O. B., Maring, H., Dibb, J., Ferrare, R., Jacob, D. J., Jensen, E. J., Luo, Z. J., Mace, G. G., Pan, L. L., Pfister, L., and Rosenlof, K. H.: Planning, implementation, and scientific goals of the Studies of Emissions and Atmospheric Composition, Clouds and Climate Coupling by Regional Surveys (SEAC4RS) field mission, J. Geophys. Res.-Atmos., 121, 4967–5009, https://doi.org/10.1002/2015JD024297, 2016.
Twomey, S. J. A. E.: Pollution and the planetary albedo, Atmos. Environ., 8, 1251–1256, https://doi.org/10.1016/0004-6981(74)90004-3, 1974.
Unger, N.: On the role of plant volatiles in anthropogenic global climate change, Geophys. Res. Lett., 41, 8563–8569, https://doi.org/10.1002/2014GL061616, 2014.
Utembe, S. R., Cooke, M. C., Archibald, A. T., Jenkin, M. E., Derwent, R. G., and Shallcross, D. E.: Using a reduced Common Representative Intermediates (CRIv2-R5) mechanism to simulate tropospheric ozone in a 3-D Lagrangian chemistry transport model, Atmos. Environ., 44, 1609–1622, https://doi.org/10.1016/j.atmosenv.2010.01.044, 2010.
Walters, D., Baran, A. J., Boutle, I., Brooks, M., Earnshaw, P., Edwards, J., Furtado, K., Hill, P., Lock, A., Manners, J., Morcrette, C., Mulcahy, J., Sanchez, C., Smith, C., Stratton, R., Tennant, W., Tomassini, L., Van Weverberg, K., Vosper, S., Willett, M., Browse, J., Bushell, A., Carslaw, K., Dalvi, M., Essery, R., Gedney, N., Hardiman, S., Johnson, B., Johnson, C., Jones, A., Jones, C., Mann, G., Milton, S., Rumbold, H., Sellar, A., Ujiie, M., Whitall, M., Williams, K., and Zerroukat, M.: The Met Office Unified Model Global Atmosphere 7.0/7.1 and JULES Global Land 7.0 configurations, Geosci. Model Dev., 12, 1909–1963, https://doi.org/10.5194/gmd-12-1909-2019, 2019.
Watson, L. A., Shallcross, D. E., Utembe, S. R., and Jenkin, M. E.: A Common Representative Intermediates (CRI) mechanism for VOC degradation. Part 2: Gas phase mechanism reduction, Atmos. Environ., 42, 7196–7204, https://doi.org/10.1016/j.atmosenv.2008.07.034, 2008.
Weber, J. and Bannan, T.: Z2F Brazil Observational used for CRI-STRAT 2 Evaluation, Apollo [data set], https://doi.org/10.17863/CAM.65133, last access: 9 April 2021.
Weber, J., Shin, Y. M., Staunton Sykes, J., Archer-Nicholls, S., Abraham, N. L., and Archibald, A. T.: Minimal Climate Impacts From Short-Lived Climate Forcers Following Emission Reductions Related to the COVID-19 Pandemic, Geophys. Res. Lett., 47, e2020GL090326, https://doi.org/10.1029/2020GL090326, 2020a.
Weber, J., Archer-Nicholls, S., Griffiths, P., Berndt, T., Jenkin, M., Gordon, H., Knote, C., and Archibald, A. T.: CRI-HOM: A novel chemical mechanism for simulating highly oxygenated organic molecules (HOMs) in global chemistry–aerosol–climate models, Atmos. Chem. Phys., 20, 10889–10910, https://doi.org/10.5194/acp-20-10889-2020, 2020b.
Wells, K. C., Millet, D. B., Payne, V. H., Deventer, M. J., Bates, K. H., de Gouw, J. A., Graus, M., Warneke, C., Wisthaler, A., and Fuentes, J. D.: Satellite isoprene retrievals constrain emissions and atmospheric oxidation, Nature, 585, 225–233, https://doi.org/10.1038/s41586-020-2664-3, 2020.
Wennberg, P. O., Bates, K. H., Crounse, J. D., Dodson, L. G., McVay, R. C., Mertens, L. A., Nguyen, T. B., Praske, E., Schwantes, R. H., Smarte, M. D., and St Clair, J. M.: Gas-phase reactions of isoprene and its major oxidation products, Chem. Rev., 118, 3337–3390, https://doi.org/10.1021/acs.chemrev.7b00439, 2018.
Whalley, L. K., Edwards, P. M., Furneaux, K. L., Goddard, A., Ingham, T., Evans, M. J., Stone, D., Hopkins, J. R., Jones, C. E., Karunaharan, A., Lee, J. D., Lewis, A. C., Monks, P. S., Moller, S. J., and Heard, D. E.: Quantifying the magnitude of a missing hydroxyl radical source in a tropical rainforest, Atmos. Chem. Phys., 11, 7223–7233, https://doi.org/10.5194/acp-11-7223-2011, 2011.
Yáñez-Serrano, A. M.: Acetone canopy gradient concentration, ATTO [data set], available at: https://www.attodata.org/ddm/data/Showdata/72 (last access: 1 April 2021), 2020a.
Yáñez-Serrano, A. M.: Isoprene canopy gradient concentration, ATTO [data set], available at: https://www.attodata.org/ddm/data/Showdata/73 (last access: 1 April 2021), 2020b.
Yáñez-Serrano, A. M.: Isoprene oxidation products canopy gradient concentration, ATTO [data set], available at: https://www.attodata.org/ddm/data/Showdata/74 (last access: 1 April 2021), 2020c.
Yáñez-Serrano, A. M.: Monoterpenes canopy gradient concentration, ATTO [data set], available at: https://www.attodata.org/ddm/data/Showdata/77 (last access: 1 April 2021), 2020d.
Yáñez-Serrano, A. M., Nölscher, A. C., Williams, J., Wolff, S., Alves, E., Martins, G. A., Bourtsoukidis, E., Brito, J., Jardine, K., Artaxo, P., and Kesselmeier, J.: Diel and seasonal changes of biogenic volatile organic compounds within and above an Amazonian rainforest, Atmos. Chem. Phys., 15, 3359–3378, https://doi.org/10.5194/acp-15-3359-2015, 2015.
Young, P. J., Naik, V., Fiore, A. M., Gaudel, A., Guo, J., Lin, M. Y., Neu, J. L., Parrish, D. D., Rieder, H. E., Schnell, J. L., and Tilmes, S.: Tropospheric Ozone Assessment Report: Assessment of global-scale model performance for global and regional ozone distributions, variability, and trends, Elementa, 6, 10, https://doi.org/10.1525/elementa.265, 2018.
Zhao, B., Shrivastava, M., Donahue, N. M., Gordon, H., Schervish, M., Shilling, J. E., Zaveri, R. A., Wang, J., Andreae, M. O., Zhao, C., and Gaudet, B.: High concentration of ultrafine particles in the Amazon free troposphere produced by organic new particle formation, P. Natl. Acad. Sci. USA, 117, 25344–25351, https://doi.org/10.1073/pnas.2006716117, 2020.
- Abstract
- Introduction
- Development of CS2 – incorporation of CRI v2.2 into UKCA
- Model runs
- Comparison with observations
- Comparison to CRI-STRAT
- Summary and synthesis
- Conclusions
- Code availability
- Data availability
- Author contributions
- Competing interests
- Disclaimer
- Acknowledgements
- Financial support
- Review statement
- References
- Supplement