the Creative Commons Attribution 4.0 License.
the Creative Commons Attribution 4.0 License.
 | 17 Aug 2021
COSMO-CLM regional climate simulations in the Coordinated Regional Climate Downscaling Experiment (CORDEX) framework: a review
Roman Brogli
Praveen Kumar Pothapakula
Emmanuele Russo
Jonas Van de Walle
Bodo Ahrens
Ivonne Anders
Edoardo Bucchignani
Edouard L. Davin
Marie-Estelle Demory
Alessandro Dosio
Hendrik Feldmann
Barbara Früh
Beate Geyer
Klaus Keuler
Donghyun Lee
Delei Li
Nicole P. M. van Lipzig
Seung-Ki Min
Hans-Jürgen Panitz
Burkhardt Rockel
Christoph Schär
Christian Steger
Wim Thiery
In the last decade, the Climate Limited-area Modeling Community (CLM-Community) has contributed to the Coordinated Regional Climate Downscaling Experiment (CORDEX) with an extensive set of regional climate simulations. Using several versions of the COSMO-CLM-Community model, ERA-Interim reanalysis and eight global climate models from phase 5 of the Coupled Model Intercomparison Project (CMIP5) were dynamically downscaled with horizontal grid spacings of 0.44∘ (∼ 50 km), 0.22∘ (∼ 25 km), and 0.11∘ (∼ 12 km) over the CORDEX domains Europe, South Asia, East Asia, Australasia, and Africa. This major effort resulted in 80 regional climate simulations publicly available through the Earth System Grid Federation (ESGF) web portals for use in impact studies and climate scenario assessments. Here we review the production of these simulations and assess their results in terms of mean near-surface temperature and precipitation to aid the future design of the COSMO-CLM model simulations. It is found that a domain-specific parameter tuning is beneficial, while increasing horizontal model resolution (from 50 to 25 or 12 km grid spacing) alone does not always improve the performance of the simulation. Moreover, the COSMO-CLM performance depends on the driving data. This is generally more important than the dependence on horizontal resolution, model version, and configuration. Our results emphasize the importance of performing regional climate projections in a coordinated way, where guidance from both the global (GCM) and regional (RCM) climate modeling communities is needed to increase the reliability of the GCM–RCM modeling chain.
- Article
(8680 KB) - Full-text XML
-
Supplement
(25344 KB) - BibTeX
- EndNote


Dynamical downscaling of global climate models (GCMs) with a regional climate model (RCM) is an approach employed to obtain higher spatial and temporal resolved climate information at the regional to local scales (Rummukainen, 2016; Giorgi, 2019; Gutowski et al., 2016; Jacob et al., 2020). These GCM–RCM model chain data are typically used as the basis for impact studies and long-term adaptation planning by impact modeling groups, stakeholders, and national climate assessment reports (Ahrens et al., 2014; Kjellström et al., 2016; Dalelane et al., 2018; Rineau et al., 2019; Sørland et al., 2020; Sterl et al., 2020; Vanderkelen et al., 2020).
GCM simulations are coordinated through international projects such as the Coupled Model Intercomparison Project phase 5 (CMIP5; Taylor et al., 2012), in which the future scenarios, describing emissions, land use, and aerosol changes, are given by representative concentration pathways (RCPs) (IPCC, 2013; Taylor et al., 2012; Moss et al., 2010). The dynamical downscaling of CMIP5 simulations by RCMs has been initiated through the Coordinated Regional Climate Downscaling Experiment (CORDEX; Giorgi et al., 2009). Since 2009, when CORDEX was officially designed and endorsed by the World Climate Research Programme (WCRP), regional climate projections have been produced by several modeling groups over 14 different domains covering nearly all mainlands of the globe. Today, Earth System Grid Federation (ESGF) servers contain more than 370 GCM–RCM model chain simulations (http://htmlpreview.github.io/?http://is-enes-data.github.io/CORDEX_status.html, last access: 24 November 2020), and the number of simulations has increased substantially in recent years. For instance, for Europe, more than 100 GCM–RCM simulations have been produced as part of EURO-CORDEX. Compared to earlier projects such as PRUDENCE (Christensen and Christensen, 2007) and ENSEMBLES (van der Linden and Mitchell, 2009), the number of simulations has increased by more than 400 % (Christensen et al., 2019).
The CORDEX experimental design was initially described in Giorgi et al. (2009), where a minimum horizontal grid spacing of around 0.44∘ (∼ 50 km) was recommended. However, it was left to the modeling groups within each CORDEX domain to establish a simulation protocol and to coordinate the simulations. Over Europe, groups were encouraged to perform additional simulations at 0.11∘ (∼ 12 km) horizontal resolution (Jacob et al., 2020), although Kotlarski et al. (2014) for Europe as well as Panitz et al. (2014) for Africa found no significant added value in the mean fields with an increase in horizontal resolution. However, added value is found for extreme events and over complex terrain when the grid is refined from 0.44 to 0.11∘ over Europe (Prein et al., 2016; Torma et al., 2015).
The ensemble size of CORDEX simulations varies greatly amongst domains. The main reason is the limited resources from the modeling centers to perform model simulations on multiple domains. To overcome this issue, CORDEX has prioritized regions that are particularly vulnerable to climate variability and change and for which RCM-based climate projections are rare, such as Africa (Giorgi et al., 2009). Still, Europe has the largest ensemble size, while other domains have a smaller number of available simulations (Spinoni et al., 2020).
A new framework within CORDEX was presented by Gutowski et al. (2016) (Coordinated Output for Regional Evaluations, CORDEX-CORE), with the goal of producing a set of homogeneous high-resolution regional climate projections covering all continents. A core set of three GCMs from CMIP5 was suggested to be dynamically downscaled for two emission scenarios, with a recommended horizontal grid spacing of 0.22∘ (∼ 25 km), which is half the horizontal resolution considered in the first CORDEX framework (Giorgi et al., 2009). To participate in the CORDEX-CORE initiative, each RCM group needs to produce more than 6000 model years, which results in over 400 TB of data, as each domain generates 10 model integrations, including 1 evaluation (30 years), 3 historical (3 × 55 years), 3 RCP2.6 (3 × 95 years), and 3 RCP8.5 (3 × 95 years) simulations. This is a huge effort that most RCM groups are not able to perform alone, and until today only the groups using the regional models REMO and RegCM have been able to conduct all required simulations following the CORDEX-CORE protocol (Remedio et al., 2019; Ciarlo et al., 2020; Teichmann et al., 2020).
The regional climate model COSMO-CLM (or CCLM) is an example of a model developed and used by a community of scientists, the CLM-Community (http://www.clm-community.eu/, last access: 12 August 2021). The COSMO-CLM model has been used for a large set of experiments and run over a wide range of timescales (up to a century) and resolutions (1–50 km) (e.g., Ban et al., 2014; Brisson et al., 2015; Chatterjee et al., 2017; Wouters et al., 2017; Leutwyler et al., 2017; Schultze and Rockel, 2018; Schlemmer et al., 2018; Imamovic et al., 2019; Panosetti et al., 2019; Hentgen et al., 2019; Brogli et al., 2019). COSMO-CLM has been used to perform regional climate simulations over Europe for more than 15 years (Rockel et al., 2008), has today been extensively used for climate simulations over multiple domains around the globe (e.g., Panitz et al., 2014; Asharaf and Ahrens, 2015; Bucchignani et al., 2016b; Keuler et al., 2016; Sørland et al., 2018; Hirsch et al., 2019; Li et al., 2018; Termonia et al., 2018; Di Virgilio et al., 2019; Russo et al., 2020; Drobinski et al., 2020; Evans et al., 2020), and in this way contributed to the CORDEX initiative. Rockel and Geyer (2008) investigated how COSMO-CLM performs over various domains and climate zones when keeping intentionally the same setup as for its “home domain”, which was introduced as model transferability (Takle et al., 2007). One of the main findings was that the model has difficulties over domains with a climate substantially different from that of Europe, where the RCM has been developed, and the model may need to be re-tuned for specific domains. This re-tuning can for instance be the use of an objective model calibration (Bellprat et al., 2016; Russo et al., 2020) or the use of a different physical parameterization scheme (e.g., convection after Bechtold et al., 2008, instead of Tiedtke, 1989, as was done in CCLM for Australasia) or a higher model top, which is necessary for tropical regions because of the higher tropopause. In CORDEX, COSMO-CLM was re-tuned for each of the CORDEX domains (see Sect. 2.3).
Table 1Number of COSMO-CLM simulations available for the different domains (EUR: Europe, AFR: Africa, AUS: Australasia, EAS: East Asia, WAS: South Asia), driven by ERA-Interim (Dee et al., 2011), CanESM2 (Arora et al., 2011; Von Salzen et al., 2013), CNRM-CM5 (Voldoire et al., 2013), EC-EARTH (Hazeleger et al., 2012), HadGEM (HadGEM2-ES, Collins et al., 2011; The HadGEM2 Development Team, 2011; HadGEM-AO, Baek et al., 2013), MIROC5 (Watanabe et al., 2011), MPI-ESM-LR (Stevens et al., 2013), and NorESM1-M (Iversen et al., 2013). The respective ERA-Interim simulation is the evaluation run and is typically from 1979 to 2010. The GCM-driven simulations include a historical simulation (1950–2005) and one or more scenarios RCP2.6/4.5/8.5 (2006–2099). For each domain, up to two different horizontal grid spacings are used: 0.44∘ (50 km) and 0.11∘ (12 km, only for Europe) or 0.22∘ (25 km, for all the other domains). From the GCM's ensembles the first realization (r1) is used for all the GCMs, except for EC-EARTH (r12) and for MPI-ESM (three members: r1, r2, and r3). The HadGEM-ES GCM is used for all domains, except for East Asia, where HadGEM-AO is used.
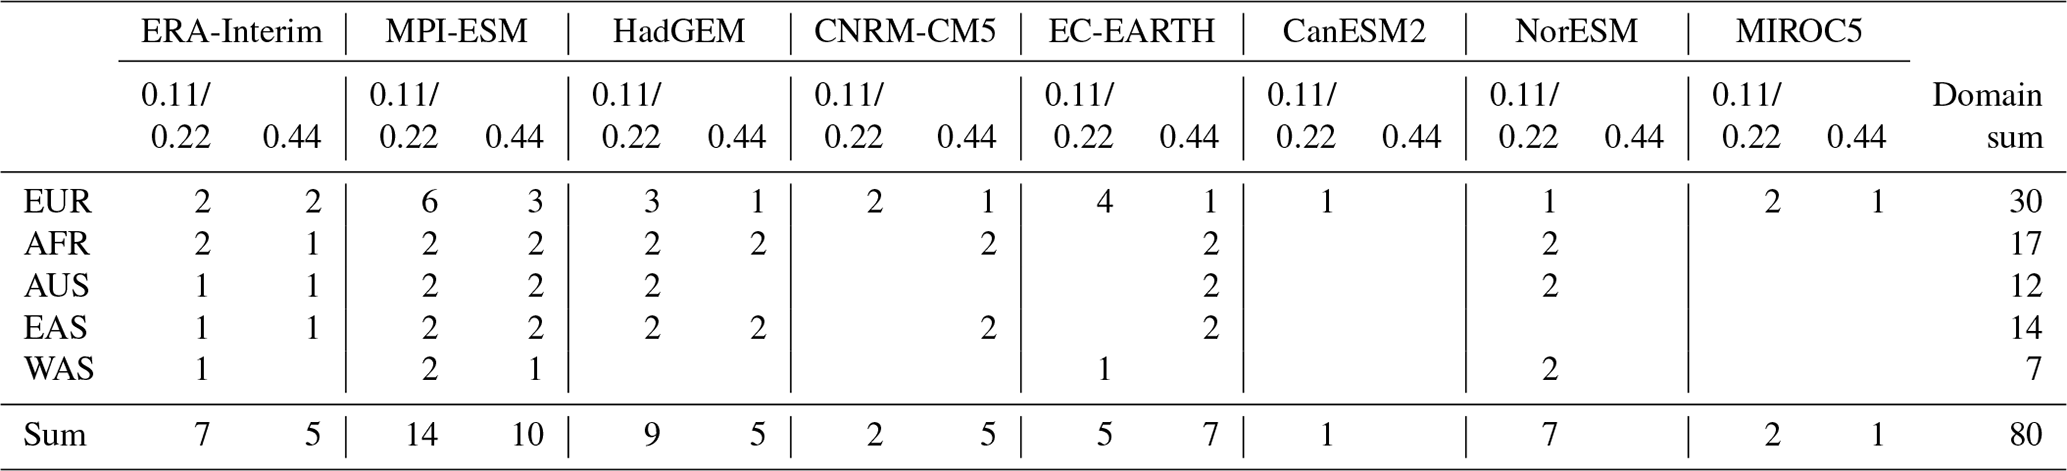
Since the CMIP5 scenario simulations became available, the CLM-Community has downscaled eight GCMs (see Sect. 3.2). The majority of the dynamical downscaling experiments with COSMO-CLM have been performed following the EURO-CORDEX framework at 0.11 and 0.44∘ horizontal grid spacings. There are also numerous simulations for other CORDEX domains at 0.44∘ horizontal resolution, such as Africa (Panitz et al., 2014; Dosio et al., 2015; Dosio and Panitz, 2016), East Asia (Li et al., 2018, 2020), South Asia (Asharaf and Ahrens, 2015), and Australasia (Di Virgilio et al., 2019; Hirsch et al., 2019). Recently, as part of the CORDEX-CORE initiative, the CLM-Community has contributed with a set of downscaling experiments over Africa, East Asia, Australasia, and South Asia, using a horizontal grid spacing of 0.22∘. The total number of simulations conducted by the CLM-Community sums up to 80 simulations (Table 1 lists the number of simulations available for each domain with different resolutions and various RCPs).
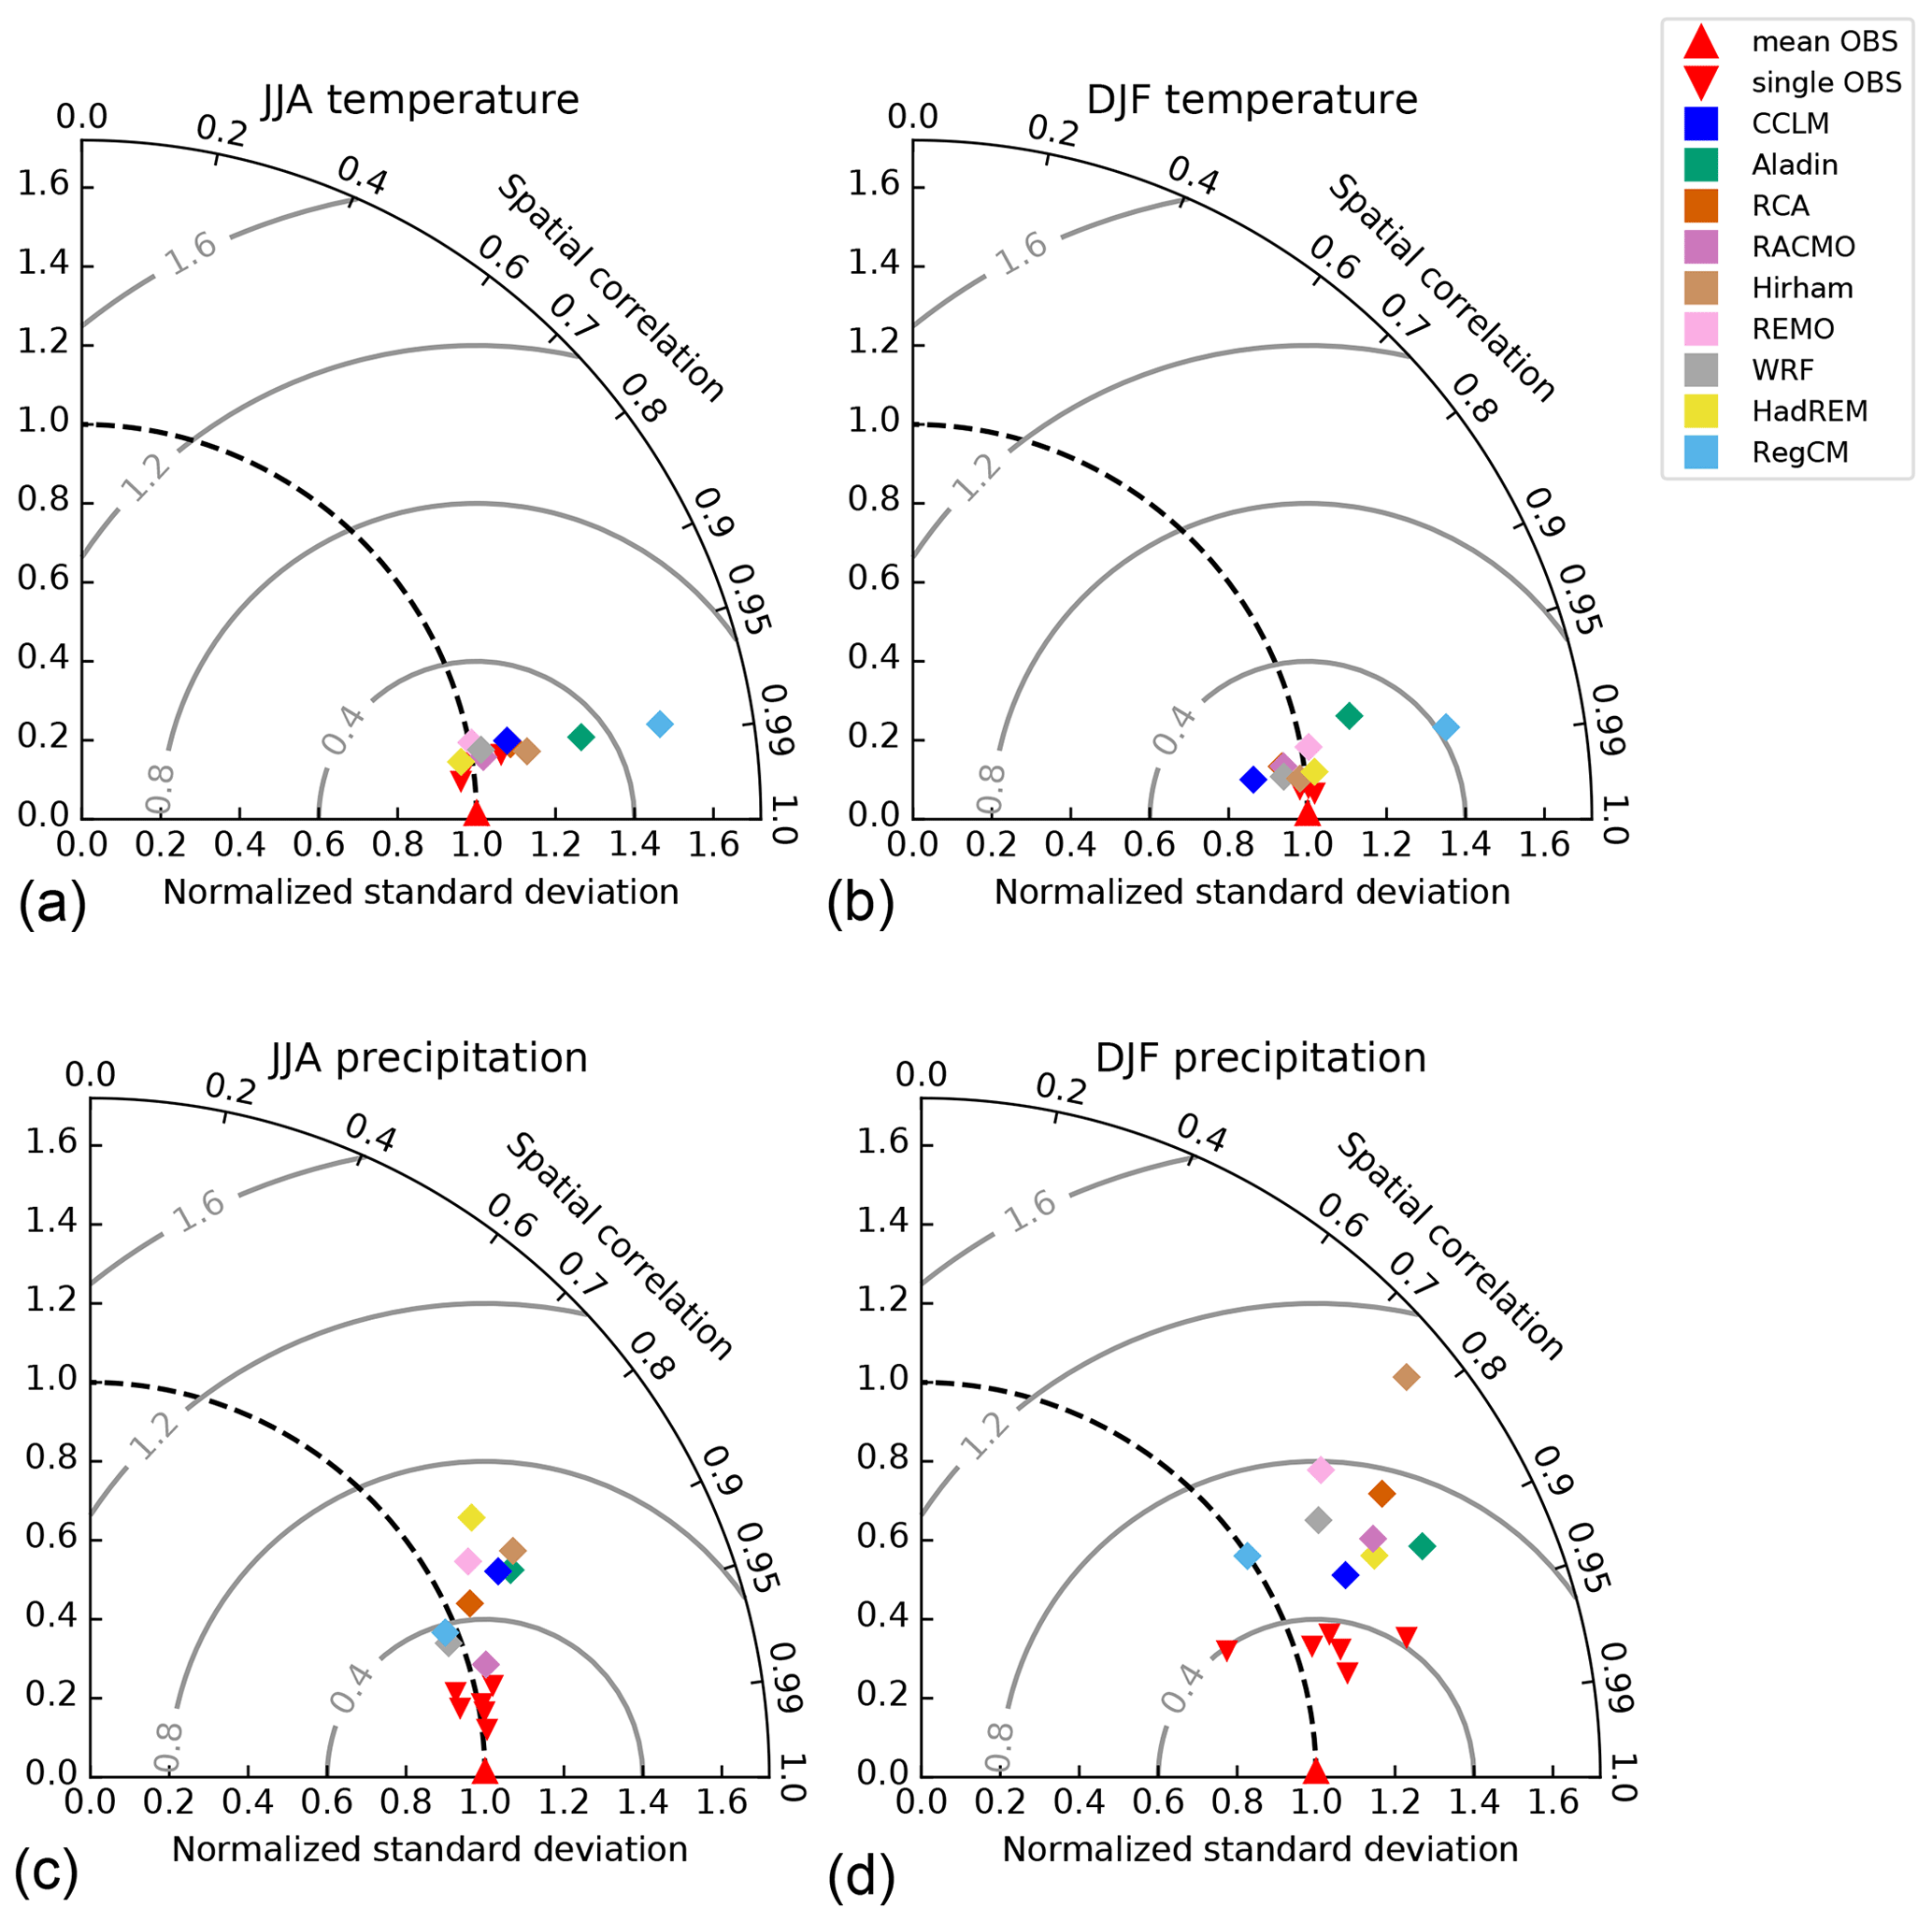
Figure 1Spatial Taylor diagram exploring the model performance of the EUR-11 RCM ensemble, for temperature (a, b) and precipitation (c, d) for the boreal summer (June–July–August, JJA; a, c) and boreal winter (December–January–February, DJF; b, d) seasons. The reference observation is the ensemble mean of the products listed in Sect. 3.1, and the downward-facing red triangles indicate every single observational product. The colors represent different ERA-Interim (Dee et al., 2011)-driven RCM simulations, whereby the different RCM versions shown in the legend are Aladin53, RCA4, RACMO22E, HIRHAM5, REMO2015, WRF331F, HadREM3-GA7-05, RegCM4-6 and CCLM. The latter is represented here by COSMO-crCLIM-v1-1. See Kotlarski et al. (2014) or Vautard et al. (2020) for a documentation and comprehensive comparison of the different RCMs. More details about the evaluation metrics are given in Sect. 3.3.
This study presents the contribution from the CLM-Community to regional climate projections following the directives of the CORDEX framework. Much of the development of COSMO-CLM is done to improve the model performance over Europe, and COSMO-CLM today realistically simulates the European climate, which is confirmed in different studies (e.g., Kotlarski et al., 2014; Vautard et al., 2020, and Fig. 1). That the RCMs tend to have the best performance over their home domain has been noted previously (Takle et al., 2007). Thus, in this study we assess and compare the model performance over Europe with the four CORDEX-CORE domains Africa, East Asia, Australasia, and South Asia. Since the existing COSMO-CLM CORDEX simulations differ in more than one way (i.e., versions, configurations, and resolutions), we do not perform a systematic analysis of each simulation, but we rather focus on sharing our experiences, as we anticipate we can learn a lot from this extensive ensemble, which is based on all model integrations that are available as of February 2020. Such an analysis will support the future design of model simulations in the community. The dependence of the model results on the driving GCM is also discussed.
The following Sect. 2 gives an overview of the CLM-Community, the model development, and a description of the model configurations used for the CORDEX simulations. Section 3 describes the methods and data. The results are presented in Sect. 4, and we end with a summary and discussion in Sect. 5.
2.1 The CLM-Community and its community effort
The Climate Limited-area Modeling Community (CLM-Community, https://www.clm-community.eu, last access: 12 August 2021) is an open, international network of scientists, joining efforts to develop and use community models. For the last 15 years, the community model employed has been COSMO-CLM (Rockel et al., 2008). COSMO-CLM is the climate version of the COSMO model (Baldauf et al., 2011), a limited-area numerical weather prediction model developed by the Deutscher Wetterdienst (DWD) in the 1990s for weather forecasting applications. COSMO itself is the further developed and renamed version of the DWD’s “Lokalmodell (LM)” (Steppeler et al., 2003). Based on LM, a climate version of LM, called CLM, was developed at the end of the 1990s. In 2007 LM and CLM were reunified, and, due to the renaming of LM to COSMO, CLM was renamed COSMO-CLM (CCLM: COSMO model in CLimate Model; see, e.g., Rockel et al., 2008; Steger and Bucchignani, 2020). The two model branches (COSMO and COSMO-CLM) are developed separately and merged regularly. This practice is recognizable in the model version number, where the whole digit (e.g., 5.0) marks a unified version and the decimal digit indicates the developments that have occurred independently within the CLM-Community and the COSMO consortium. The new releases include model improvements, extensions, or bug fixes. A new major version is always quality-checked and compared to the previous one by means of evaluation of the climatology over the European domain.
The CLM-Community was founded in 2004 and currently includes 212 members from 72 institutions located all over the world (as of November 2020). The aim of the CLM-Community is to coordinate the model development, to evaluate it, and to recommend model configurations. Additionally, the community ensures an efficient use of resources with the objective of providing the best possible long-term climate simulations and to help answer key questions of climate change at the regional and local scales.
2.2 COSMO-CLM description, developments, and versions
COSMO-CLM is a non-hydrostatic, limited-area atmospheric model designed for applications from the meso-β to meso-γ scales (Steppeler et al., 2003). The model describes compressible flow in a moist atmosphere, thereby relying on the primitive thermodynamical equations. These equations are solved numerically with a Runge–Kutta time-stepping scheme (Wicker and Skamarock, 2002) on a three-dimensional Arakawa-C grid (Arakawa and Lamb, 1977). This grid is based on rotated geographical coordinates and a generalized, terrain-following height coordinate (Doms and Baldauf, 2013). The current standard version has 40 non-equidistant vertical levels up to the top boundary of the model domain at 22.7 km, though the number of levels and height tops can be changed by the user. At the upper levels, a sponge layer with Rayleigh damping is used, whereby the default model version is damping all the fields against the driving boundary fields above 11 km. Alternative upper level damping can be chosen (e.g., Klemp et al., 2008) as well as the height where the damping occurs. The standard physical parameterizations include the radiative transfer scheme by Ritter and Geleyn (1992), the Tiedtke parameterization for convection (Tiedtke, 1989), and a turbulent kinetic energy-based surface transfer and planetary boundary layer parameterization (Raschendorfer, 2001). The parameterization of precipitation is based on a four-category microphysics scheme that includes cloud water, rain water, snow, and ice (Doms et al., 2013). The soil processes are simulated by the soil–vegetation–atmosphere-transfer sub-model TERRA (Schrodin and Heise, 2001; Schulz et al., 2016). Here, prognostic equations are solved for soil water content, temperature, and ice in 10 soil layers by default. Alternative parameterizations can be employed (e.g., the parameterization of convection by Bechtold et al., 2008 or land-surface models such as VEG3D or the Community Land Model; Will et al., 2017).
The model versions used for CORDEX simulations are COSMO-CLM4-8-17 (Panitz et al., 2014; Keuler et al., 2016; Di Virgilio et al., 2019; Hirsch et al., 2019), multiple versions of COSMO-CLM5 (Sørland et al., 2018; Li et al., 2018), and the accelerated version COSMO-crCLIM (Vautard et al., 2020; Pothapakula et al., 2020). The following sections give short descriptions of the different versions, their main model developments, and new options for different configurations.
2.2.1 COSMO-CLM4
Most developments of COSMO-CLM4 were driven by the goal of reducing a cold bias present in the regional climate simulations over Europe. Sensitivity simulations were carried out with different model configurations at a resolution of 0.44∘ following the ENSEMBLES (van der Linden and Mitchell, 2009) framework over Europe. The main improvements and developments were related to an introduction of the new RCP scenarios (van Vuuren et al., 2011; Moss et al., 2010) and a new option for a modified albedo treatment adjusting the albedo according to soil moisture between values for dry and saturated soils (Lawrence and Chase, 2007). Furthermore, activating a formulation of soil thermal conductivity dependent on soil moisture was shown to improve the simulated diurnal cycles of the surface temperature, particularly in arid regions (Schulz et al., 2016). For the first CORDEX simulations carried out by the CLM-Community (Keuler et al., 2016), the resulting COSMO-CLM4-8-17 version was used. This version was applied over Europe for an ensemble of simulations with horizontal grid spacings of 0.11∘ (EUR-11) and 0.44∘ (EUR-44). The same model version was also used over Africa (Panitz et al., 2014; Dosio et al., 2015; Dosio and Panitz, 2016), South Asia (Asharaf and Ahrens, 2015), and Australasia (Di Virgilio et al., 2019; Hirsch et al., 2019) but with a modified configuration (see Sect. 2.3).
2.2.2 COSMO-CLM5
The developments occurring from COSMO-CLM4 to COSMO-CLM5 comprise the possibility of using, besides the standard temporally constant aerosol optical depths (AODs) described in Tanré et al. (1991), two alternative AOD datasets, namely Tegen (Tegen et al., 1997) and Aerocom (Kinne et al., 2006), which both vary monthly. In addition, the possibility of choosing different parameterizations of bare soil evaporation (see, e.g., Schulz and Vogel, 2020) was also included in COSMO-CLM5. With COSMO-CLM5, a coordinated parameter testing effort together with an objective model calibration (Bellprat et al., 2012) was performed to test new model options and to find a satisfactory model setup for climate simulations over Europe at the 50 km horizontal grid spacing. This led to the recommended model version of COSMO-CLM5-0-6. Most of the latest CORDEX simulations are performed with COSMO-CLM5, with minor changes that did not influence the model performance significantly from versions 5-0-6 to 5-0-16 (e.g., minor bug fixes or additional output variables).
2.2.3 COSMO-crCLIM
COSMO-crCLIM (Convection-resolving climate modeling on future supercomputing platforms) is an accelerated version of the COSMO model (based on version 4) that has been developed to run on heterogeneous hardware architectures including multicore central processing units (CPUs) and graphics processing units (GPUs) (Fuhrer et al., 2014; Schär et al., 2020). COSMO-crCLIM was adapted for climate applications (Leutwyler et al., 2017), and the current configuration includes a new groundwater formulation (Schlemmer et al., 2018). COSMO-crCLIM has been extensively tested over Europe for convection-resolving simulations (Leutwyler et al., 2017; Hentgen et al., 2019; Vergara-Temprado et al., 2020). Other adjustments include changing the upper-level damping to only relax the vertical velocity instead of all dynamical fields (Klemp et al., 2008). COSMO-crCLIM has been used to produce CORDEX simulations over Europe (EUR-11) and over South Asia (WAS-22). All the developments done on COSMO-crCLIM are currently fed back into the COSMO/COSMO-CLM branch, so version COSMO-CLM6.0 will be available on both CPUs and GPUs.
2.3 Model configurations and general specifics for CORDEX domains
The CLM-Community coordinates the development of COSMO-CLM and provides a community model with a standard setup, as described in Sect. 2.2. However, the model configuration can vary depending on the simulation domain and experimental design. For the CORDEX simulations, the model domains and protocols are provided (see https://cordex.org/, last access: 12 August 2021), but some changes in the model configuration have been applied depending on the domain and resolution to obtain an optimal model performance. Table S1 in the Supplement summarizes the main differences in the configurations of each model version for each domain. The specific decisions made for each model configuration are described in the following sections. In each case, an evaluation run has been performed, where the boundary conditions are taken from the ERA-Interim reanalysis (Dee et al., 2011), resulting in 12 evaluation simulations.
2.3.1 CORDEX-Europe
As most of the model development is done to improve European simulation performances, the EUR-11 and EUR-44 CORDEX simulations are performed with the configuration of the model versions described in Sect. 2.2 and the specific configurations listed in Table S1. At the time of writing, 30 simulations performed with COSMO-CLM exist for the EURO-CORDEX domain, 21 simulations of which performed with the horizontal grid spacing of 0.11∘ and 9 simulations with 0.44∘. These simulations are forced by either ERA-Interim (Dee et al., 2011) or seven GCMs under three RCPs (see Tables 1 and S2). The results of these simulations have been included in several scientific studies as well as national climate change assessment reports (e.g., Kotlarski et al., 2014; Keuler et al., 2016; Prein et al., 2016; Sørland et al., 2018; Dalelane et al., 2018; Bülow et al., 2019; Shatwell et al., 2019; Sørland et al., 2020; Vanderkelen et al., 2020; Vautard et al., 2020; Demory et al., 2020; Coppola et al., 2020a).
2.3.2 CORDEX-Africa
The first CORDEX-Africa simulations were performed with a horizontal grid spacing of 0.44∘ (AFR-44) using COSMO-CLM4-8-17, following the CORDEX-Africa domain configurations (Giorgi et al., 2009; see also Fig. 1 in Panitz et al., 2014). Thirty-five vertical levels were used and, to allow the free development of deep convection throughout the whole tropical troposphere, the height of the uppermost level was increased from about 23 to 30 km above sea level. In addition, the bottom height of the Rayleigh-damping layer (Rayleigh, 1877) was increased from its standard value of about 11 to 18 km. Together, these settings are referred to as the COSMO-CLM's tropical configuration (Thiery et al., 2015), a configuration used in several subsequent experiments over tropical domains (e.g., Thiery et al., 2016; Brousse et al., 2019; Van de Walle et al., 2019). Furthermore, the land-surface albedo was replaced by a new dataset based on monthly satellite-derived fields for dry and saturated soil (Lawrence and Chase, 2007), which gave more realistic model results over the deserts. Vegetation parameters (leaf area index and plant cover) were also prescribed by monthly climatological fields derived from the ECOCLIMAP dataset (Masson et al., 2003). These simulations were analyzed by Panitz et al. (2014), Dosio et al. (2015), and Dosio and Panitz (2016), used for climate impact assessments (e.g., Vanderkelen et al., 2018a, b), and compared to the other CORDEX-Africa RCMs in a number of studies (e.g., Dosio et al., 2019, 2020). In Panitz et al. (2014), an additional evaluation simulation at 0.22∘ was performed to investigate the effect of increasing the horizontal resolution (from 0.44 to 0.22∘) and decreasing the time step (from 240 to 120 s), respectively (see Table S1).
For the next-generation CORDEX-CORE simulations over Africa, a horizontal grid spacing of 0.22∘ (AFR-22) was required. The AFR-44 setup was used as a starting point but updated with a new model version, COSMO-CLM5-0-15. The number of vertical levels was increased from 35 to 57 to allow for a more detailed representation of the vertical extent. Several tuning parameters were changed according to the findings of Bucchignani et al. (2016a), and two tuning parameters affecting the thickness of the laminar boundary layer for heat (rlam_heat) and the vertical variation of the critical humidity for sub-grid clouds (uc1) were changed to reduce precipitation and temperature biases. The applied aerosol climatology was also changed from Tanré et al. (1991) to Tegen et al. (1997). At the time of writing, 17 COSMO-CLM CORDEX simulations exist over the African domain (8 for AFR-22 and 9 for AFR-44; see Table 1).
2.3.3 CORDEX-Australasia
The northern part of the CORDEX-Australasia domain extends into the tropics; therefore, the tropical setup used over the CORDEX-Africa domain was employed for the simulation at 0.44∘ horizontal grid spacing (AUS-44). For convection, the Bechtold scheme (Bechtold et al., 2008) was used instead of the default Tiedtke scheme (Tiedtke, 1989). For these simulations, CCLM4-8-17 was used, but instead of applying the standard TERRA scheme (Schrodin and Heise, 2001) mainly developed for mid-latitude climate, CCLM4-8-17 was coupled to the Community Land Model version 3.5 (CLM3.5, Oleson et al., 2008; Davin et al., 2011) to reduce warm biases over the Australian arid areas present in the standard version. The CCLM4-8-17-CLM3-5 simulations are analyzed in model comparison studies (Di Virgilio et al., 2019; Hirsch et al., 2019) over the Australian part of the CORDEX-Australasia domain.
For the CORDEX-CORE simulations (AUS-22), CCLM-5-0-15 was used, in which a new computation of bare soil evaporation using a resistance formulation was implemented (Schulz and Vogel, 2020). As this implementation substantially improved the near-surface temperature biases, a coupling to CLM3.5 was no longer necessary. Fifty-seven vertical levels are employed for the AUS-22 simulations, otherwise the configuration is identical to the AUS-44 simulations.
For the Australian domain, currently a total of 12 CORDEX simulations exist, 7 with the AUS-22 configurations and 5 with the AUS-44 configurations.
2.3.4 CORDEX-East Asia
The CORDEX-EAS-44 simulations use CCLM-5-0-2, with 45 vertical levels where the uppermost level is at a height of 30 km. A time step of 300 s is used. Considering the substantial extension of troposphere height across the tropical areas, the lower boundary of the Rayleigh-damping layer in the model was set to 18 km rather than the typical value of 11 km, similar to the tropical setup. The tuning parameters are default except for the vertical diffusion coefficient (wichfakt) that was increased. The standard aerosol dataset was replaced with the Tegen (Tegen et al., 1997) aerosol climatology. These simulations have been applied in scientific studies focusing on model evaluation or projected change in surface temperature, precipitation, and wind speed/energy over CORDEX-EAS (Li et al., 2018, 2019, 2020).
For EAS-22, CCLM-5-0-9 was employed. Compared to CCLM-5-0-2, a minor bug for soil water content transpiration was fixed. Several namelist parameters are set differently from their default values (Table S1, type of turbulence, microphysics, convection, and surface schemes). Spectral nudging based on von Storch et al. (2000) was employed for zonal and meridional winds above 850 hPa to reduce systematic biases in surface air temperature, precipitation, and monsoon circulation over East Asia while retaining the observed large-scale variations (Lee et al., 2016), supporting previous RCM studies for East Asia (e.g., Cha et al., 2011; Hong and Chang, 2011). A time step of 150 s is used.
Fourteen COSMO-CLM simulations currently exist for the East Asian domain, of which five were performed following the EAS-22 framework and nine following the EAS-44 framework. It should be noted that the CORDEX-East Asia domain has slightly changed since its initial configuration, and thus EAS-22 and EAS-44 cover slightly different domains (Zhou et al., 2016).
2.3.5 CORDEX-South Asia
Over South Asia, COSMO-CLM has been tested and used in various downscaling experiments with a horizontal grid spacing of 0.44∘ (Rockel and Geyer, 2008; Dobler and Ahrens, 2010, 2011). Yet the first COSMO-CLM simulation following the CORDEX protocol for South Asia at 0.44∘ horizontal grid spacing (WAS-44) was carried out in Asharaf and Ahrens (2015). A total of 35 vertical levels were used in this configuration with a time step of 240 s. The standard physical schemes were employed, except for the Kessler-type microphysics scheme (Kessler, 1969). The GCM MPI-ESM-LR was downscaled for the historical and RCP4.5 emission scenarios.
Within the CORDEX-CORE framework, COSMO-crCLIM-v1-1 was used at a horizontal grid spacing of 0.22∘, using the tropical configuration (height top of 30 km) including 57 vertical levels and a time step of 150 s, as suggested by Asharaf and Ahrens (2015). Except for changes in the horizontal and vertical resolutions and changes in tuning parameter values based on expert tuning to improve the model performance, the configuration and parameterization schemes were identical to that over Europe (see Table S1).
For the South Asian domain, a total of six COSMO-CLM simulations exist following the WAS-22 framework. Note that for the WAS-44 simulation with CCLM4-8-17, no official evaluation run was performed, and thus the downscaled MPI-ESM-LR (Asharaf and Ahrens, 2015) is only included when analyzing the GCM-driven simulations in Sect. 4.2.
3.1 Observational datasets
All simulations are evaluated against a number of global observation datasets, allowing for a fair comparison between the different domains. The main focus is on the performance of near-surface temperature and precipitation. The datasets with their temporal and horizontal resolutions and their references are listed in Table S2.
3.1.1 Near-surface temperature
Three global near-surface temperature datasets are considered for the evaluation of the simulations: first, the Global Historical Climatology Network version 2 and the Climate Anomaly Monitoring System (GHCN2+CAMS, Fan and van den Dool, 2008), which combine two large individual datasets of station observations; second, a dataset collected by the University of DELaware (UDEL), including a large number of station temperature data, both from the GHCN2 and, more extensively, from the archive of Willmott and Matsuura (2001); third, time-series datasets produced by the Climatic Research Unit (CRU) at the University of East Anglia, which is based on an archive of monthly mean temperatures provided by more than 4000 weather stations distributed around the world (University of East Anglia Climatic Research Unit et al., 2008). The three temperature datasets are given as a monthly mean and at a horizontal resolution of 0.5∘ (Table S2).
3.1.2 Precipitation
For precipitation, besides the UDEL (Willmott and Matsuura, 2001) and CRU gridded (University of East Anglia Climatic Research Unit et al., 2008) station data described above, the following datasets are used: the Global Precipitation Climatology Center (GPCC, Schneider et al., 2018), providing monthly gridded precipitation data at 0.25∘ horizontal grid spacing from quality-controlled weather stations worldwide; the Multi-Source Weighted-Ensemble Precipitation (MSWEP, Beck et al., 2019), including rain-gauge, satellite, and reanalysis data given at 3-hourly temporal resolution and 0.1∘ horizontal grid spacing; the Global Precipitation Climatology Project (GPCP, Adler et al., 2003), where data from rain-gauge stations, satellites, and sounding observations have been merged to estimate monthly rainfall on a 2.5∘ global grid; and finally the NOAA Climate Prediction Center (CPC, Chen et al., 2008), providing global daily gauge-based precipitation data on a 0.5∘ grid.
3.2 Model simulation domains, initial and lateral boundary conditions
We present COSMO-CLM simulations performed by the CLM-Community that follow the CORDEX framework (Giorgi et al., 2009; Gutowski et al., 2016) for the domains Europe, Africa, Australasia, East Asia, and South Asia. Additional COSMO-CLM simulations have been performed for other CORDEX domains (e.g., central Asia, Russo et al., 2019, 2020; Antarctica, Zentek and Heinemann, 2020; Souverijns et al., 2019; Mediterranean basin, Obermann et al., 2018; South America, Lejeune et al., 2015; and Middle East–northern Africa, Bucchignani et al., 2016a, b). However, as those simulations have not downscaled any of the GCMs used in the current study or are not yet published on an ESGF node, they are not considered here. All simulations were carried out in a rotated longitude–latitude spherical coordinate system with grid spacings of 0.11, 0.22, or 0.44∘ over the standard CORDEX domains. The simulated COSMO-CLM model domain contains a lateral relaxation zone (between 8 and 12 grid spacings), which is required by the dynamical downscaling technique to transfer the data of the driving global climate simulation to the regional model simulation.
Soil moisture is initialized by a climatological mean value representative of the starting date of the simulation, taken from an evaluation simulation driven by the ERA-Interim reanalysis (Dee et al., 2011). Following the CORDEX framework, an evaluation simulation driven by the ERA-Interim reanalysis is performed over each domain, where all the evaluation simulations cover the time period 1979–2010, except CCLM4-8-17 for EUR-11 and AFR-44 which is simulated for 1989–2008 and AFR-22 CCLM4-8-17 for 1989–2000.
Arora et al. (2011)Von Salzen et al. (2013)Voldoire et al. (2013)Hazeleger et al. (2012)Collins et al. (2011)The HadGEM2 Development Team (2011)Baek et al. (2013)Watanabe et al. (2011)Stevens et al. (2013)Iversen et al. (2013)Table 2List of the various CMIP5 GCMs that have been downscaled with COSMO-CLM for the CORDEX domains assessed in this study.
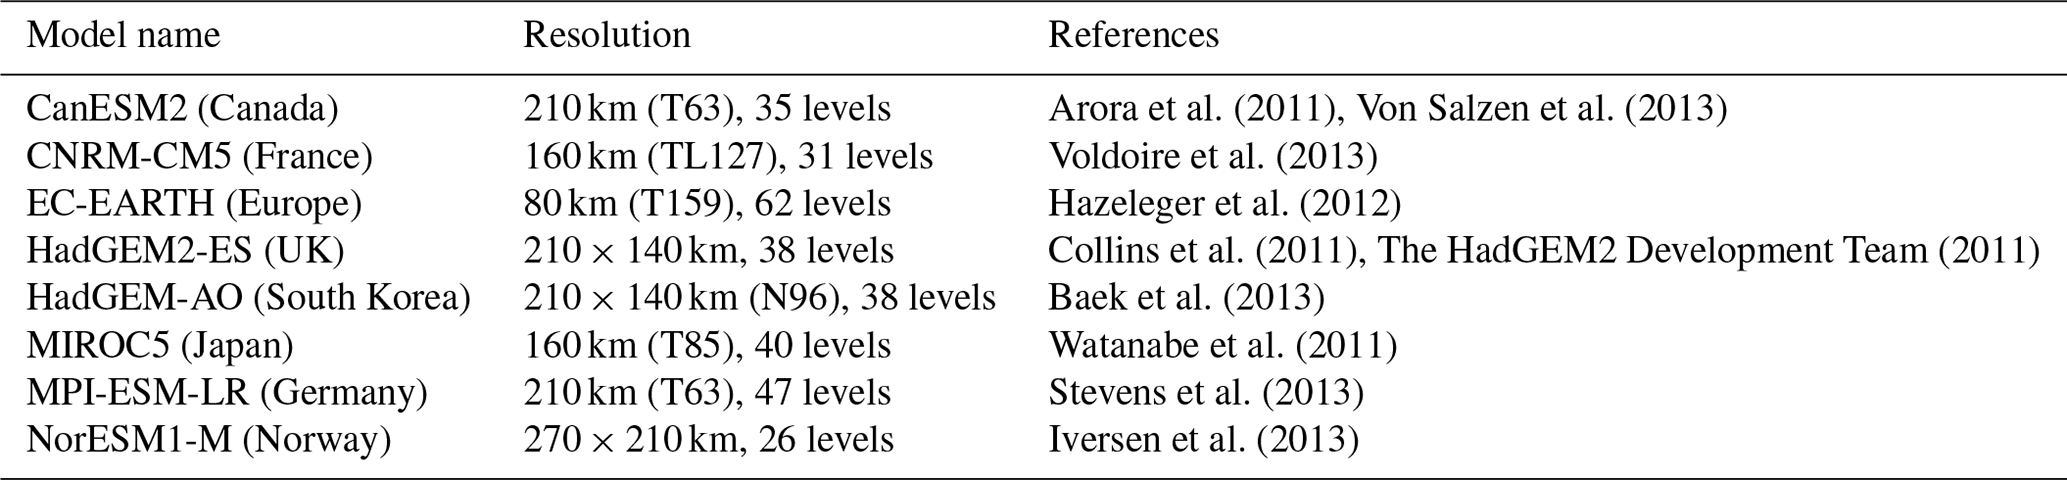
A total of eight GCMs were downscaled for a continuous transient time period covering the historical period (1950–2005) and the future period (2006–2099) under RCP2.6, RCP4.5, or RCP8.5 (Moss et al., 2010; van Vuuren et al., 2011). Table S3 gives an overview of the simulations performed for each domain, GCM, and scenario, similar to Table 1 but including information on the model versions. The various GCMs used as driving data for COSMO-CLM in this study are listed in Table 2; they include those selected for the CORDEX simulations (chosen in order to provide a wide range of climate changes over Europe) and those parts of the CORDEX-CORE framework or external projects (e.g., ReKLIS, Dalelane et al., 2018; PRINCIPLES, Vautard et al., 2020).
3.3 Evaluation metrics
Near-surface temperature and precipitation are evaluated via the spatial distribution of climatological seasonal means for December–January–February (DJF), March–April–May (MAM), June–July–August (JJA), and September–October–November (SON). The observational datasets are regridded to the CORDEX domains by bilinear and conservative remapping for near-surface temperature and precipitation, respectively. For both variables, biases are calculated as absolute and relative differences between the model and the ensemble mean of the observational products on a grid box level. Accounting for the uncertainty in the observations, the bias is masked, where white areas indicate areas where model values are within the observational range, which contains the minimum and maximum observational values at each grid point.
To allow an easy comparison of the model performance across domains, we summarize the spatial deviations of the climatological means by Taylor diagrams (Taylor, 2001), which combine the spatial pattern correlation with the ratio of spatial variances. The ensemble mean of the observation datasets is used again as a reference. Every data point's distance from the reference corresponds to the normalized and centered root-mean-square difference. The data's standard deviation is normalized relative to the reference, for which the standard deviation is set to 1. For the creation of Taylor diagrams, simulations and observations were regridded to a common 0.5∘ grid, and the diagrams were compiled for all land points of the whole regional simulation domain to avoid a subjective area choice for assessing the model performance.
We focus our discussion on near-surface temperature and precipitation for DJF and JJA, while MAM and SON results are included in the Supplement. We first describe the reanalysis-driven evaluation runs (analyzed for the period of 1981–2010), thereby assessing performance in terms of the importance of model development and configuration vs. model resolution for each of the considered CORDEX domains. In the next step, the results of the GCM-driven historical simulations (1981–2010, whereby RCP85 is used for 2006–2010) are analyzed, whereby we extend the discussion to include the choice of forcing data and the effect of various model configurations and resolutions.
4.1 Evaluation of the reanalysis-driven simulations
As much of the development of COSMO-CLM is done to improve the model performance over Europe, we start by comparing the performance of the evaluation simulations from COSMO-CLM with nine different RCMs that have been developed independently at different European institutions, shown in Fig. 1. The COSMO-CLM evaluation simulation is represented by the version COSMO-crCLIM-v1-1. The model performance is assessed in terms of spatial variability over land for the seasonal temperature and precipitation by using a Taylor diagram (see Sect. 3.3). It can clearly be seen that the performance of COSMO-CLM typically lies in the range of the best-performing RCMs over Europe. Motivated by this, we then investigate the performance of the COSMO-CLM model over other CORDEX domains, namely Africa, East Asia, Australasia, and South Asia.
Figures 2 and 3 show the near-surface temperature and precipitation biases as derived from the ERA-Interim-driven COSMO-CLM simulations for the five considered domains for JJA and DJF. Table S4 summarizes the mean absolute biases over land for each evaluation simulation. For reference, the seasonal mean (DJF, MAM, JJA, SON) temperature and precipitation for the different observational datasets are shown in the Supplement (Figs. S1–S10). In the following, a discussion of the characteristic biases for each region is given, seeking to assess whether any aspects of the evinced biases in each case could be related to the different model versions or horizontal resolutions. Figure 4 summarizes the model performance for the different domains in a Taylor diagram.
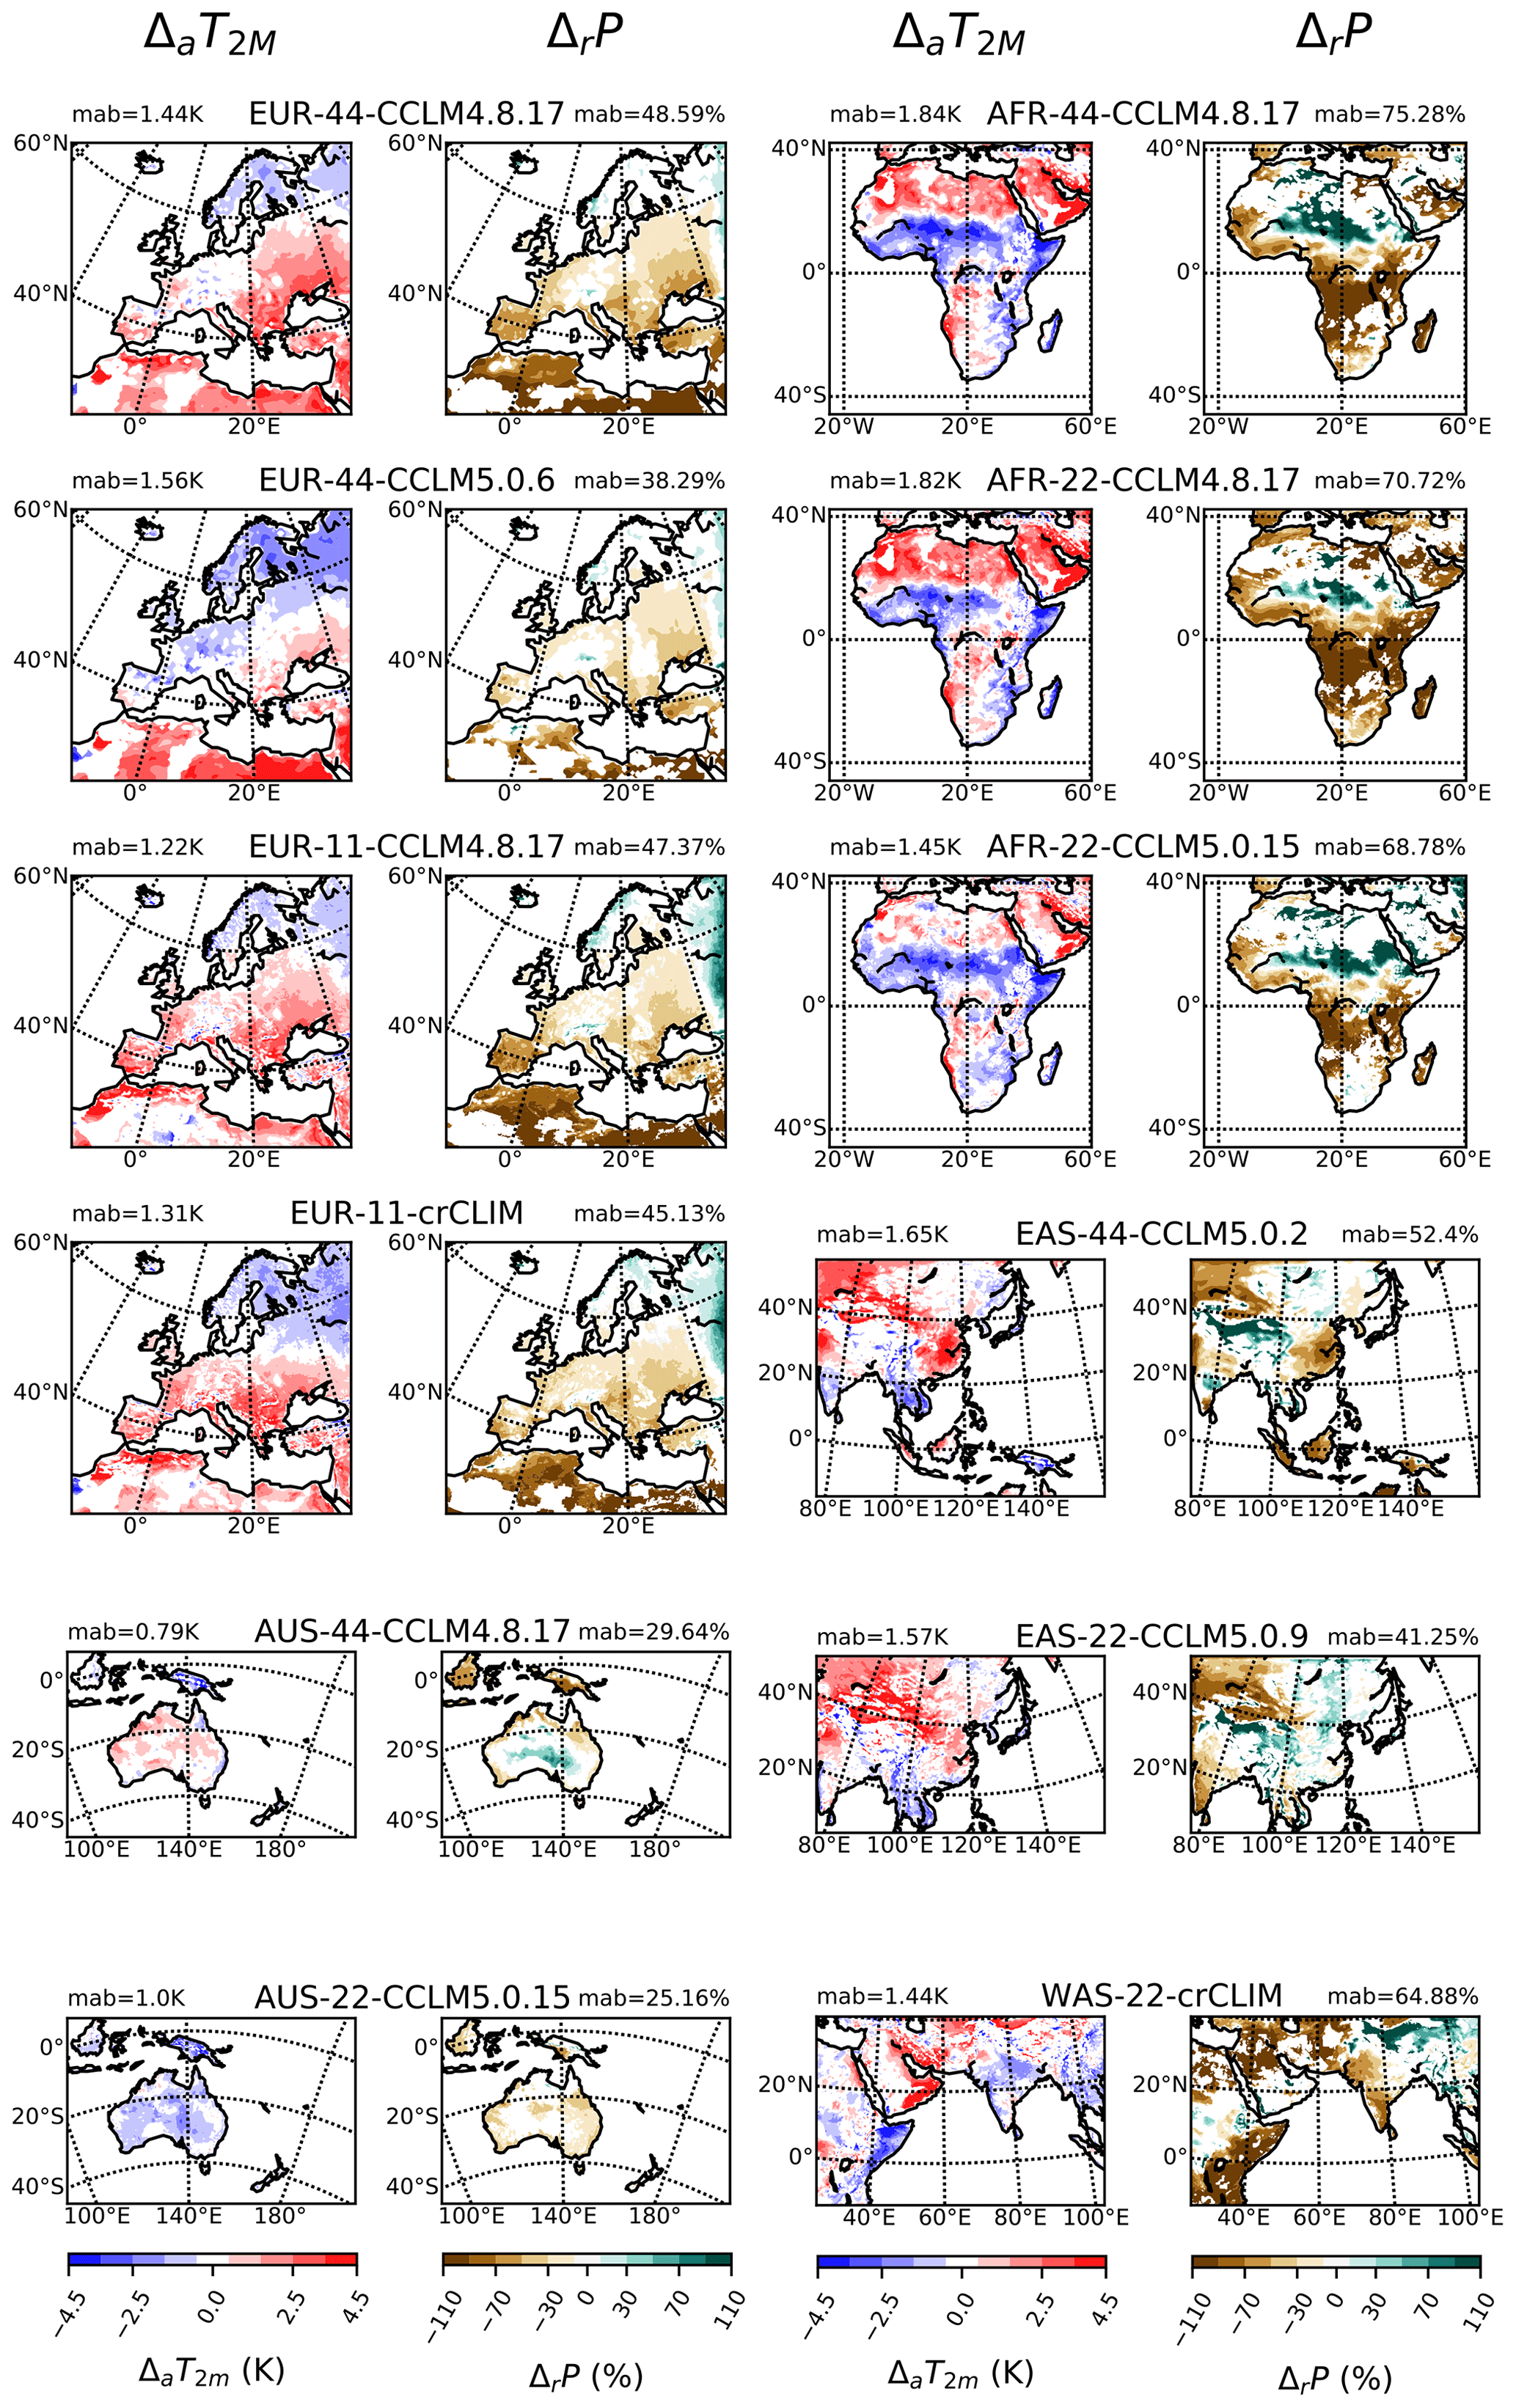
Figure 22 m air temperature absolute bias (ΔaT2 m; columns 1 and 3) and total seasonal precipitation relative bias (ΔrP; columns 2 and 4) of the evaluation runs for JJA for the different domains and model resolutions and versions. The evaluation period is from 1981 to 2010, except EUR-11-CCLM4-8-17 and AFR-44-CCLM4-8-17, which is for the years 1989–2008, and AFR-22-CCLM4-8-17, which covers the years 1989–2000. The bias is masked white when the model value falls within the observational range. The mean absolute bias is given on top of each sub-figure (and in Table S4). See Table S1 for the model configurations and Table S3 for the full simulation overview.
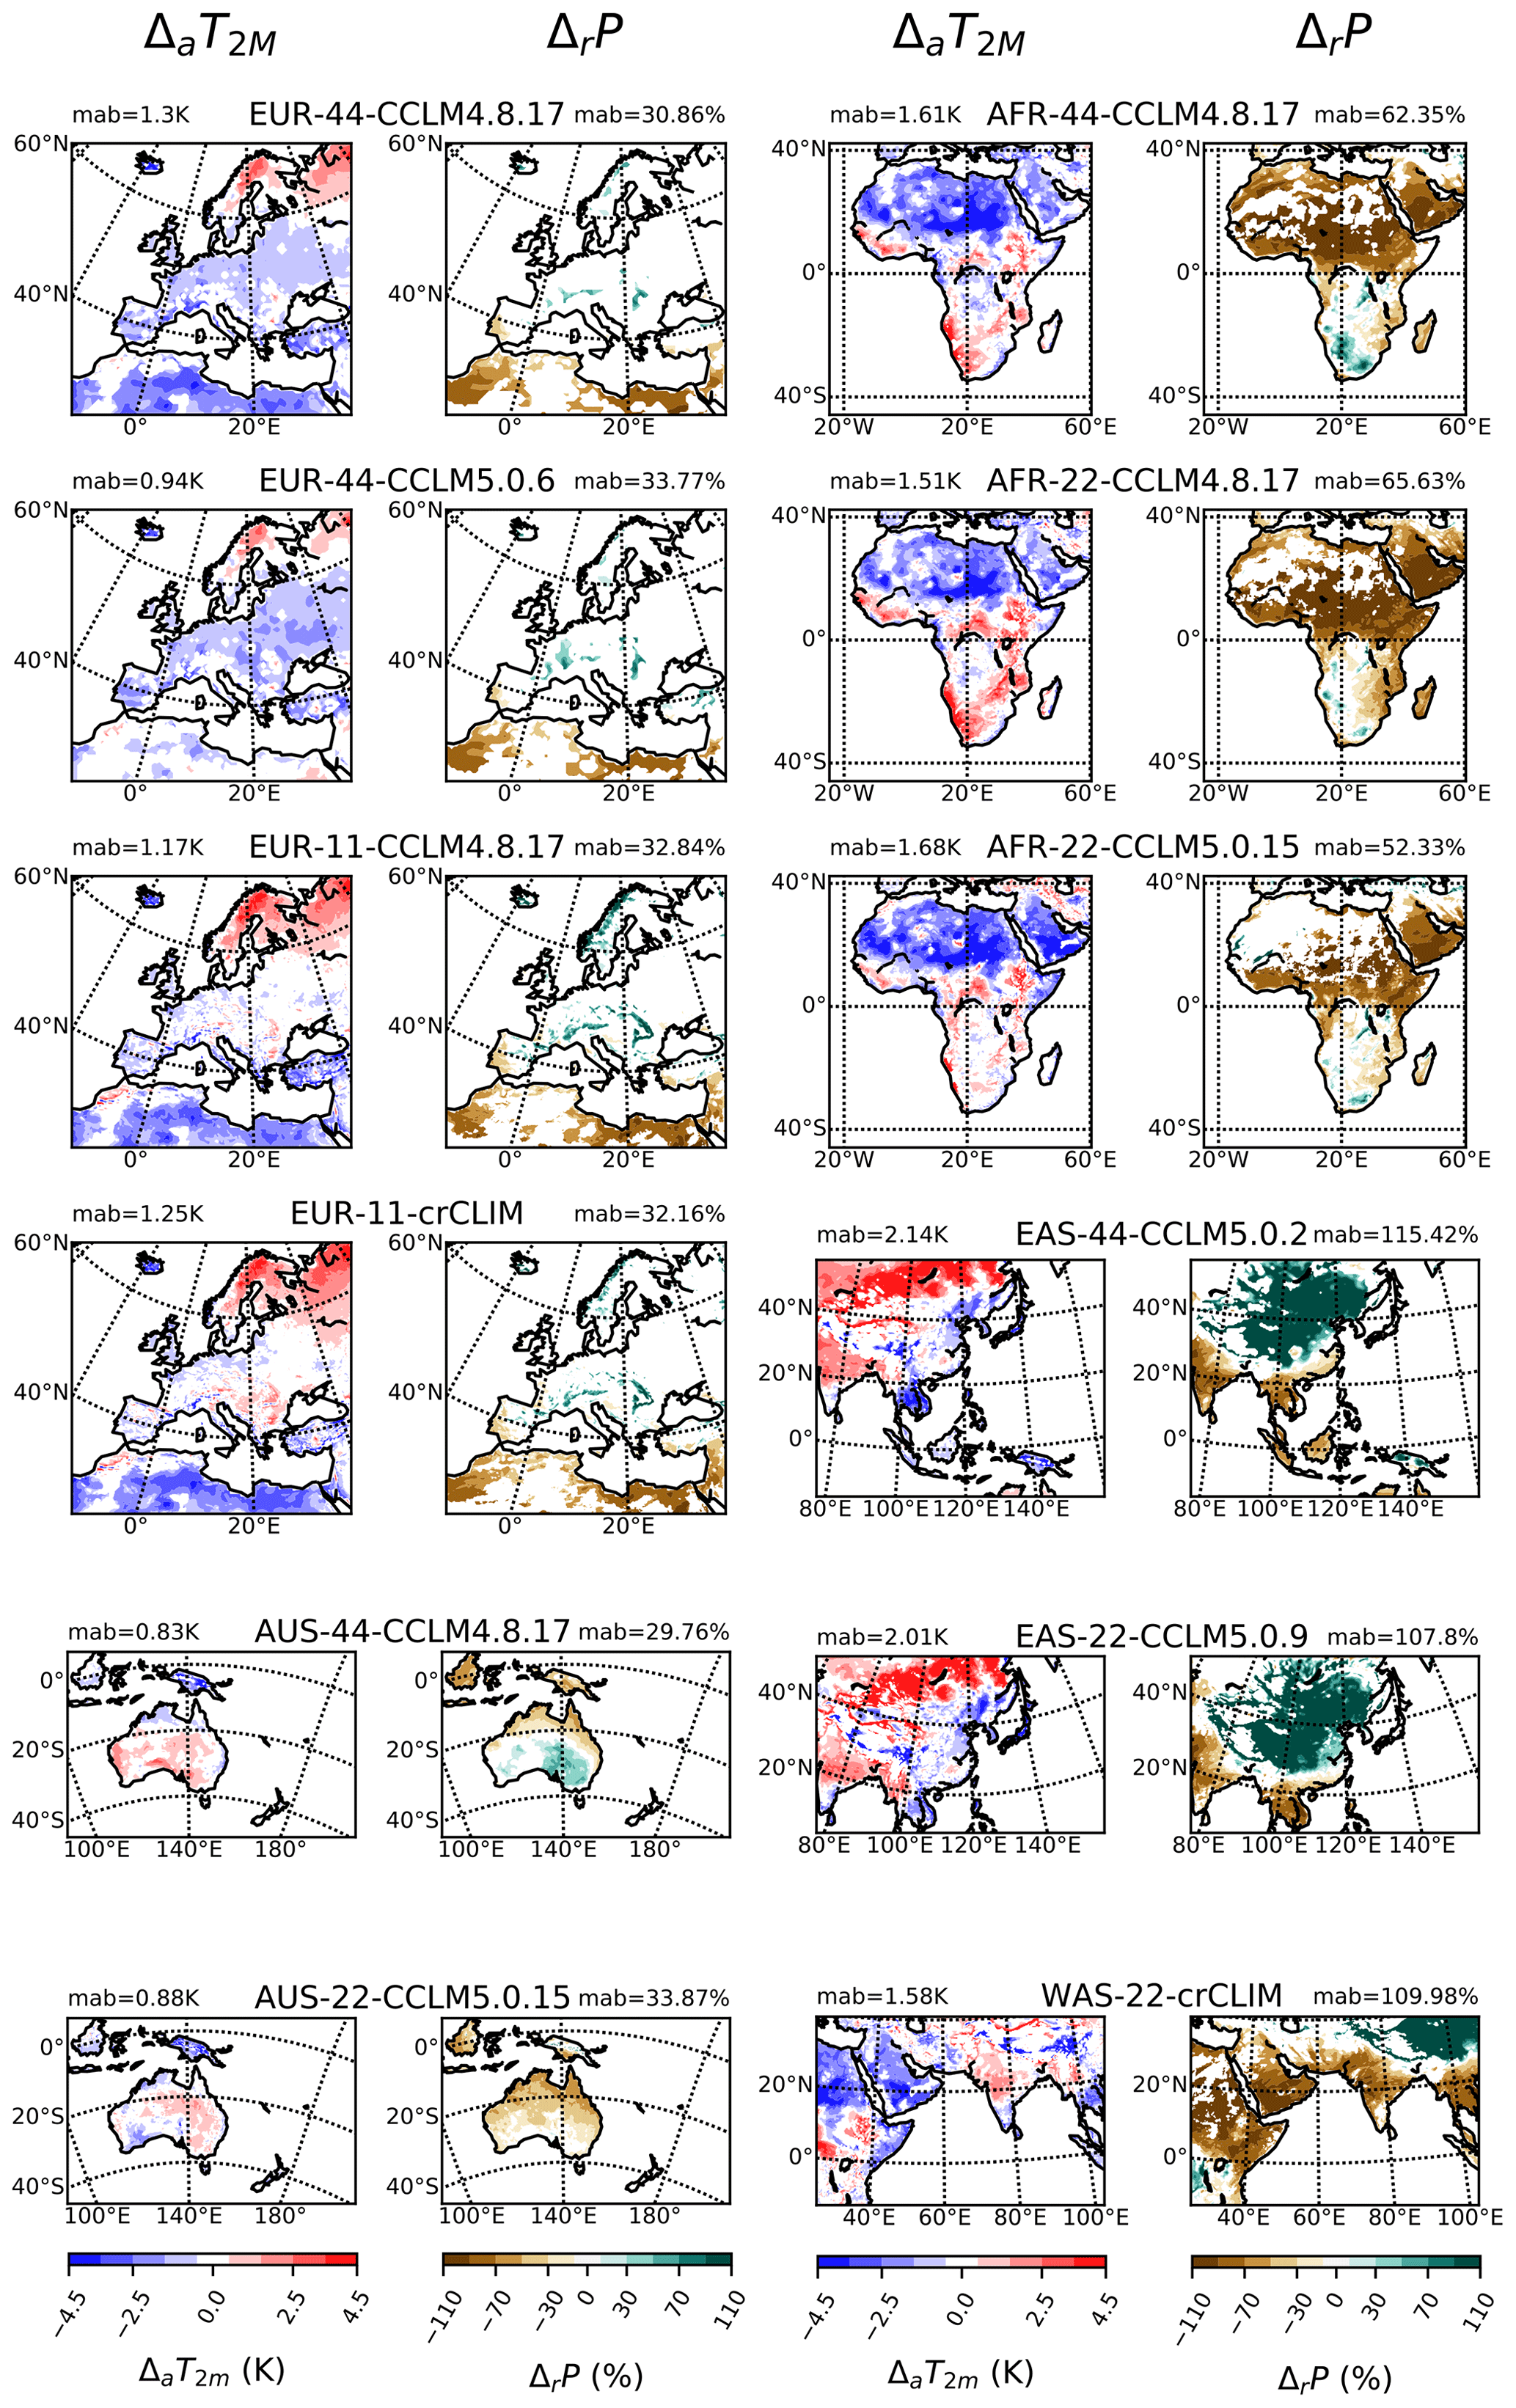
Figure 3Same as Fig. 2 but for DJF.
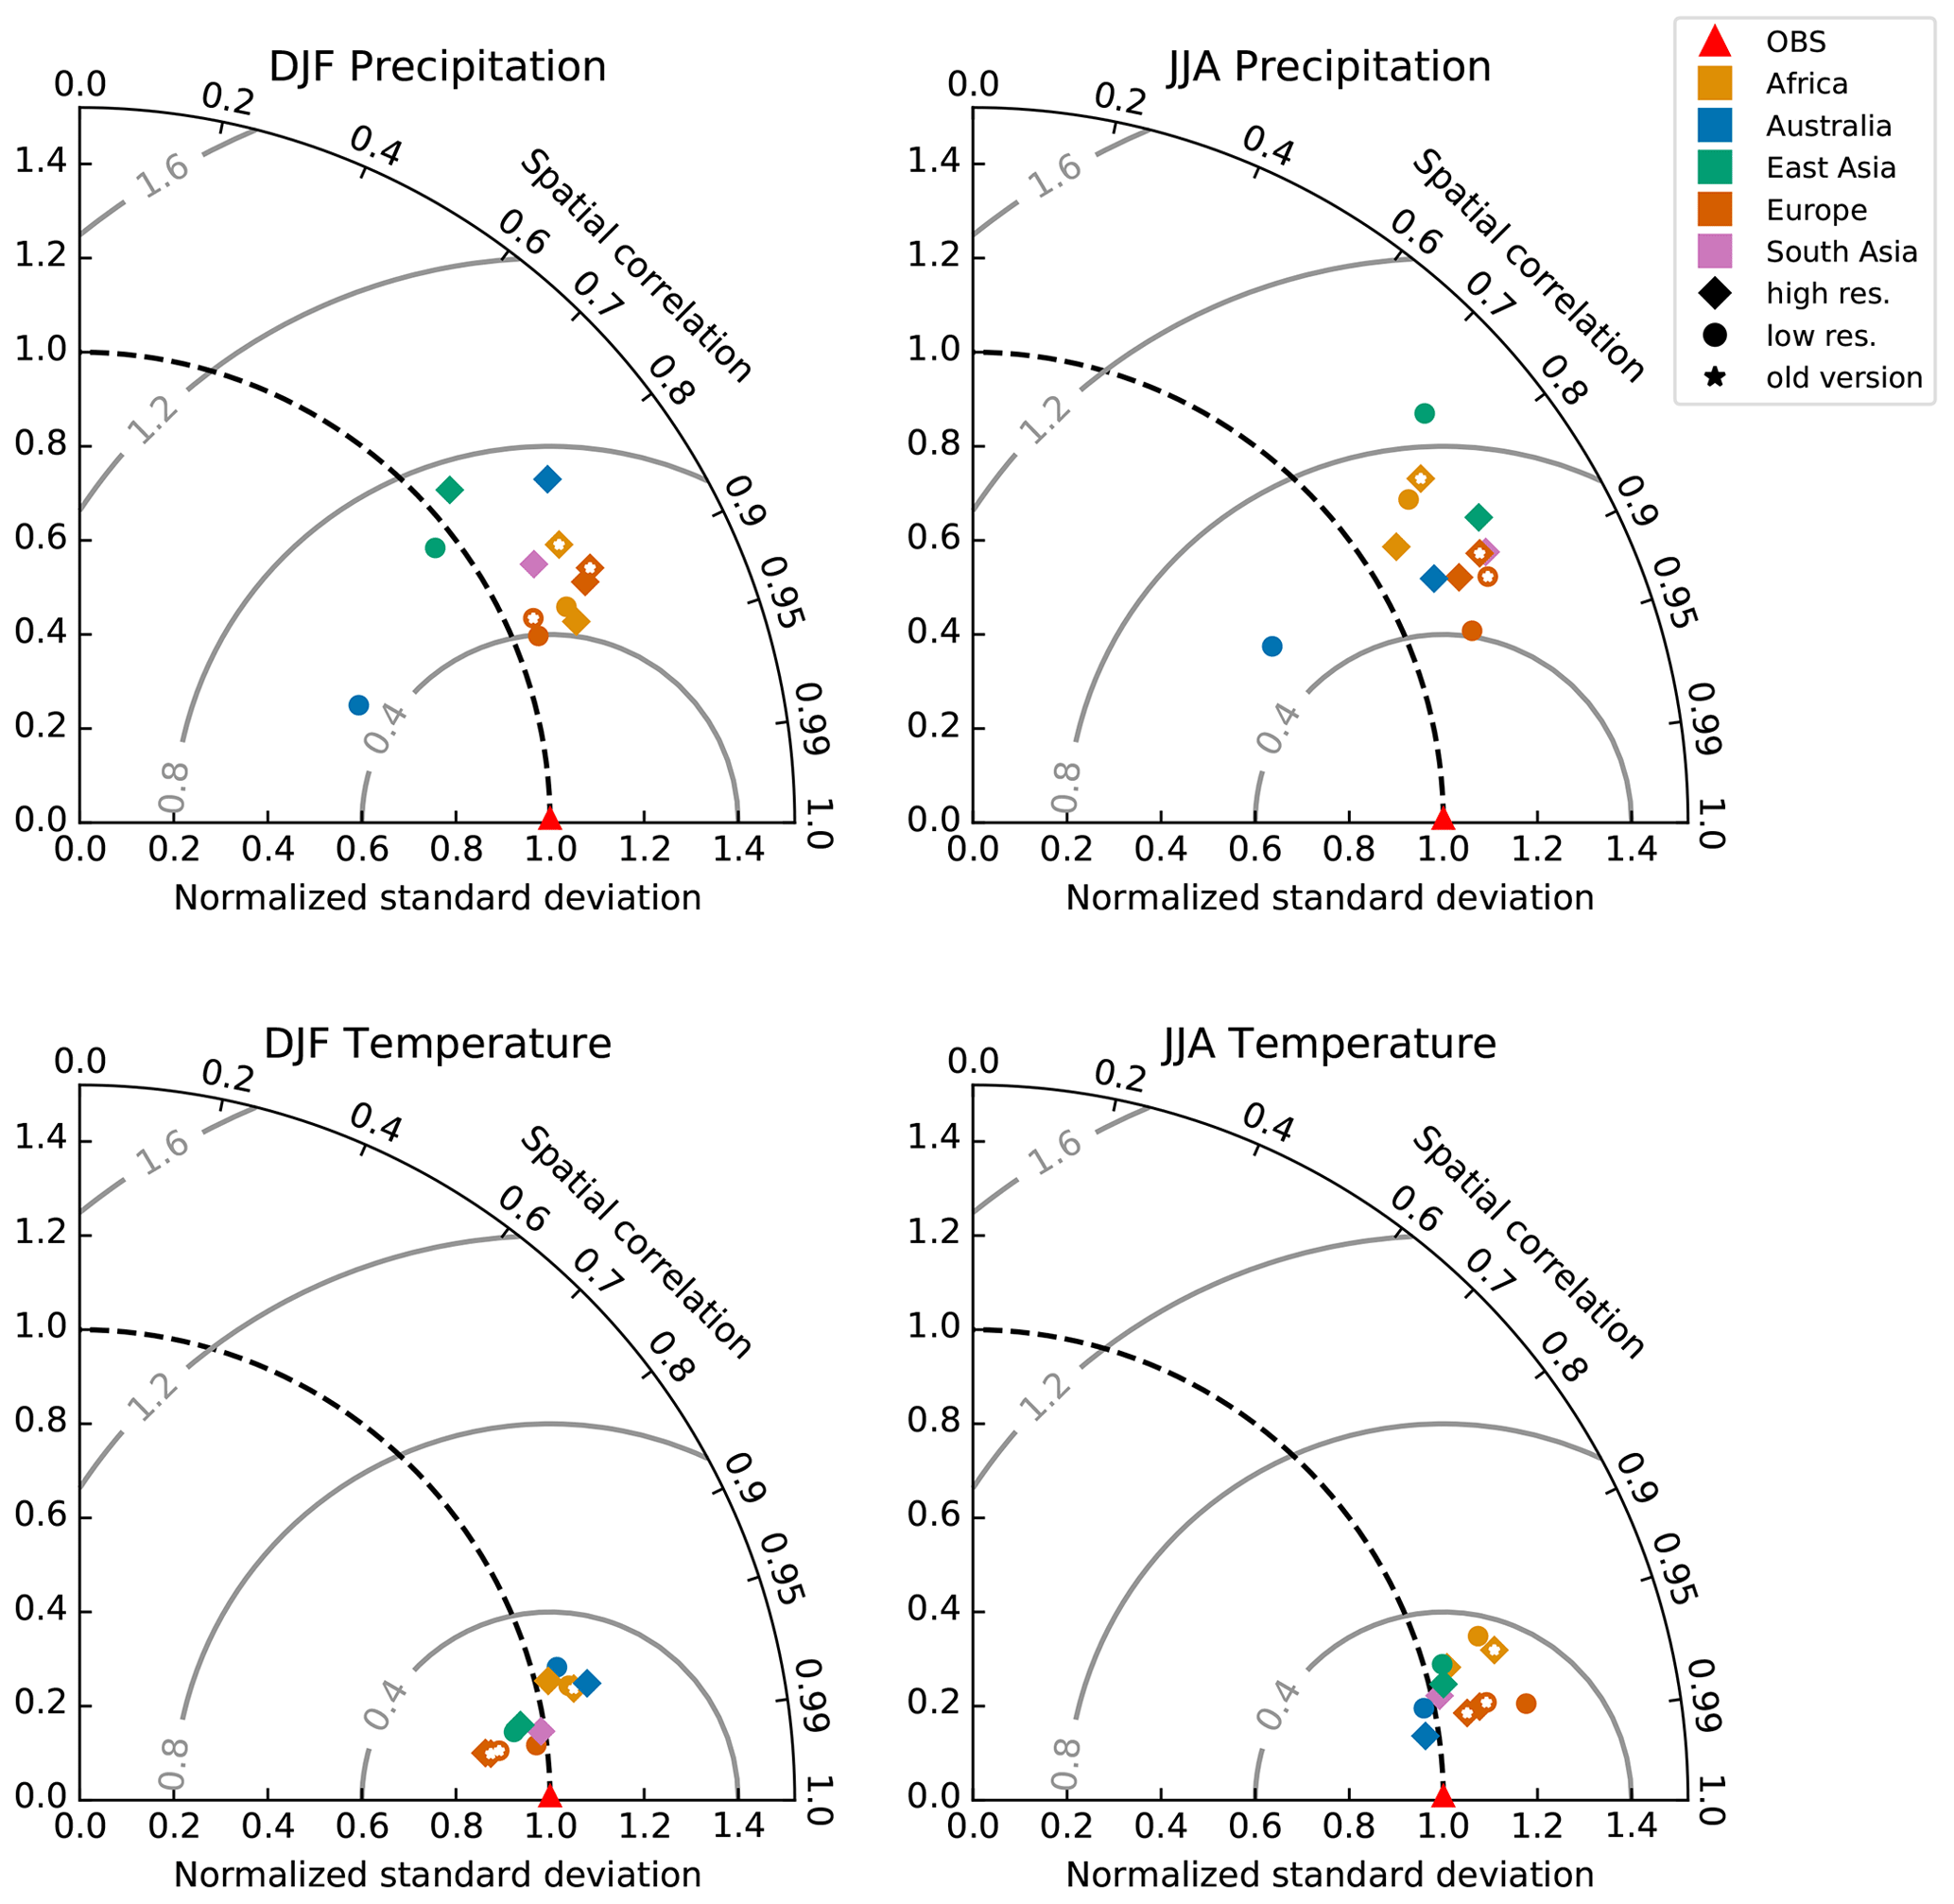
Figure 4Spatial Taylor diagram exploring the model performance for JJA and DJF for precipitation and 2 m air temperature for each domain (labeled with colors) by considering the ERA-Interim-driven simulations. The diamonds (circles) are the 12 km or 24 km, respectively (50 km), simulations. The older model version is marked with a white star inside the symbols. The triangle is the mean of all observations.
4.1.1 Bias characteristic for the individual domains
Europe
The EURO-CORDEX domain covers most of the pan-European region and thus includes climates characterized by cold continental winters in the northeast, large areas which are influenced by coastal climate, and a dry and warm Mediterranean summer climate. COSMO-CLM has been used to perform regional climate projections over Europe for more than a decade as part of ENSEMBLES, PRUDENCE, and now EURO-CORDEX projects. In most evaluation studies over Europe, either the E-OBS dataset is used (Kotlarski et al., 2014; Sørland et al., 2018) or the evaluation is performed on higher-resolution observations from different countries (Prein et al., 2016). However, here we are using global datasets in order to compare the model simulations to a common dataset, i.e., with the same horizontal resolution and underlying methodology. Nevertheless, the bias pattern shown in Figs. 2 and 3 for Europe agrees with earlier studies of COSMO-CLM (Kotlarski et al., 2014), with a warm and dry (cold and wet) bias during the summer season over southern/southeastern (northern/northeastern) Europe. During the winter, there is a pronounced cold and wet bias over the whole of Europe, except in northern parts of Scandinavia. For the winter precipitation bias shown in Fig. 3, often the spread between the observation datasets is larger than the magnitude of the bias. These bias patterns are also seen in the majority of the European RCMs (Kotlarski et al., 2014) and have been suggested to be related to using outdated aerosol climatology or improperly parameterized processes (e.g., convection, microphysics, or land-surface processes; Vautard et al., 2013; Davin et al., 2016; Sørland et al., 2020).
Following the EURO-CORDEX framework, COSMO-CLM has contributed with simulations using four different model configurations and resolutions, two EUR-44 simulations (CCLM4-8-17 and CCLM5-0-6) and two EUR-11 simulations (CCLM4-8-17 and COSMO-crCLIM). With this ensemble, we can explore the differences between model versions and horizontal resolutions. For the summer temperature bias, changing the horizontal resolution has very little impact on the spatial bias pattern when comparing the version CCLM4-8-17 between EUR-11 and EUR-44. However, during the winter season, the cold bias is slightly reduced in EUR-11, but a larger warm bias is seen over the northern areas. When comparing the model versions, the newer versions tend to have a colder climate than the older model version, so some of the warm bias is removed (e.g., over southeastern Europe), but this then enhances the cold bias elsewhere (e.g., over northern/northeastern Europe).
The precipitation bias is similar between the model versions, configurations, and resolutions, but there is a tendency for the higher-resolution simulations to be wetter, which reduces the dry bias over, e.g., eastern Europe in summer, but then the wet bias is increased, seen over the northeastern parts.
The mean absolute biases over land for temperature and precipitation (Figs. 2 and 3 and Table S4) suggest that there is no clear configuration that has a lower absolute bias for both parameters for all seasons. For instance, EUR-44-CCLM4-8-17 (EUR-44-CCLM5-0-6) simulations have the largest (smallest) absolute mean winter temperature bias but at the same time the lowest (highest) absolute mean winter precipitation bias.
Africa
Africa is among the regions most vulnerable to climate change (Giorgi et al., 2009; Niang et al., 2014), and in recent years there has been a huge effort to produce regional climate projections across Africa (e.g., Nikulin et al., 2012; Kothe et al., 2014; Dosio et al., 2015; Thiery et al., 2016; Schulz et al., 2016). However, due to the African continent's large and cross-equatorial extent, the CORDEX model domain covers multiple climatic zones, from southern mid latitudes over moist tropical to desert climates, yielding a challenge for RCM groups to set up an optimal model configuration. The COSMO-CLM ensemble over Africa consists of two model versions, CCLM4-8-17 following the AFR-44 framework and CCLM5-0-15 for AFR-22 (Table S1). Moreover, as part of the study by Panitz et al. (2014), CCLM4-8-17 was used to simulate over the African domain with a higher resolution (AFR-22), mainly to investigate the effect of increased horizontal resolution while keeping most of the configuration unchanged (only the time step was changed; see Table S1). Thus, with the three-member CCLM ensemble over Africa, we can investigate the effect of employing different model versions (i.e., AFR-22 CCLM4-8-17 vs. AFR-22 CCLM-5-0-15) and the effect of increased resolution (i.e., AFR-44 vs. AFR-22). The general performance of COSMO-CLM over Africa shows that the summer (winter) hemisphere tends to exhibit a warm (cold) temperature bias (Figs. 2–3), which is assumed to be caused by a wrong representation of clouds, especially at the Intertropical Convergence Zone (ITCZ) (Kothe et al., 2014). The most striking result is that the model performance is very little influenced when using the same model version with almost the same configuration but different horizontal resolution, consistent with the findings in Panitz et al. (2014). When the horizontal resolution is increased together with using an updated model version and modifying the configurations, the results for AFR-22 and AFR-44 differ more. Thus, the model performance seems to be more sensitive to model version and configuration than to the horizontal resolution, and this is seen for both the temperature and precipitation for all the seasons. The AFR-22 simulation with CCLM5-0-15 has been run with an increased number of vertical levels and changes in the aerosol climatology and some of the tuning parameters compared to the simulations with the older model version. These results suggest that it is not enough to only change the horizontal resolution but that it is also important to re-tune the model configuration to the new resolution employed, and similar findings are found when using other RCMs (Wu et al., 2020).
The newer and higher-resolution model (AFR-22 CCLM5-0-15) has the lowest model bias in terms of JJA temperature bias, where for instance the warm bias over the Sahara is reduced. Nevertheless, the reduction in the warm bias enhances the cold bias in the winter season. The JJA precipitation bias is also lower in the AFR-22 CCLM5-0-15 simulation, but the bias dipole due to poor ITCZ representation is still present. A lower DJF precipitation bias is also observed for the AFR-22 CCLM5-0-15 simulations.
Australasia
The Australasian CORDEX domain is centered around the mainland Australian continent, covering different climate zones due to the large extent. The northern part has a tropical climate, while the southern part is more sub-tropical with mild winters. While a large part of Australia is categorized as arid or semi-arid regions and this dry surface state amplifies heat waves (Hirsch et al., 2019), the southern coast and New Zealand have a temperate climate. The COSMO-CLM ensemble over Australasia consists of two horizontal resolutions (AUS-22 and AUS-44) with two model versions with quite different configurations, as the AUS-44 CCLM4-8-17-CLM3-5 simulation is coupled to the Community Land Model (Davin et al., 2011), compared to the AUS-22 CCLM-5-0-15, which uses the standard TERRA-ML scheme (Schrodin and Heise, 2001). These differences in both resolution and configuration should be kept in mind when comparing the two sets of simulations. The two evaluation runs exhibit quite different temperature biases, in particular during the austral winter season (i.e., JJA), where the AUS-44 simulation has a warm bias over most of the Australian continent, compared to a cold bias in the AUS-22 simulation (Figs. 2–3). The winter precipitation bias is more similar between the two simulations, with a dry bias over large areas, except over central Australia, which has a wet bias for the AUS-44 simulation. During austral summer (i.e., DJF), a cold temperature bias and dry precipitation bias are seen for both simulations over the tropical regions (i.e., the northern part of the model domain). Elsewhere AUS-44 shows a warm bias and AUS-22 a warm bias except for the southern coast. The precipitation bias during the summer resembles the winter pattern but with larger magnitudes. Based on visual inspection, no simulation seems to perform better than the other, and the bias is sometimes within the range of the spread of the observations, in particular for the winter precipitation and summer temperature. When comparing mean absolute land biases, AUS-44 CCLM4-8-17-CLM3-5 (AUS-22 CCLM5-0-15) simulation exhibits the best performance for DJF (JJA) (Table S4).
East Asia
East Asia features high population density, a great variety of topography and vegetation, and complex climate systems, being a region vulnerable to climate change (Konapala et al., 2020). It is strongly influenced by the monsoon system, characterized by a cold dry winter season, with dominant northerly flow from the northern interior, and a warm rainy summer season, with southerly flow advecting moisture from the ocean.
Great efforts have been made to understand the regional monsoon climate over East Asia using regional climate models, starting with the Regional Climate Model Intercomparison Project (RMIP) for Asia (Fu et al., 2005). COSMO-CLM has been used extensively over the region to study different atmospheric processes, such as surface wind (Feser and von Storch, 2008; Li et al., 2016), as well as the regional climate (Wang et al., 2013; Huang et al., 2015; Zhou et al., 2016; Li et al., 2018).
CORDEX simulations over East Asia at 0.44∘ (EAS-44) and 0.22∘ (EAS-22) have been performed with versions CCLM5-0-2 and CCLM5-0-9, respectively. Due to an updated EAS-CORDEX domain, the domains are not identical: while EAS-44 follows the CORDEX framework for the first phase, which covers a large area including Southeast Asia and northern Australia, EAS-22 follows the second phase with a smaller domain excluding tropical Southeast Asia (Zhou et al., 2016). Note that a Southeast Asia CORDEX domain has been established (Tangang et al., 2020). Thus, the different domains might have an influence on the model performance. Keeping this effect of the different domains in mind together with EAS-22 applying spectral nudging, we compare simulations over East Asia conducted with a similar model version at different horizontal resolutions and with different model configurations.
During boreal summer (Fig. 2), EAS-44-CCLM5-0-2 tends to feature a warm bias over eastern China and part of northwestern China and Kazakhstan, while a cold bias is found over southern India and Indochina. In winter (Fig. 3), warm biases are widely distributed over the northern part of the East Asian domain and large parts of India, while a cold bias is seen over eastern China, Indochina, and the tropical islands. The precipitation during summer shows a dry bias in the same region as with warm bias, while the wet bias occurs mainly over the Tibetan Plateau. During winter, there is a wet bias of more than 70 % over the northern interior and a dry bias of similar magnitude over India and Indochina.
The EAS-22 simulation shows similar summer bias patterns to EAS-44, including the warm and dry bias in the northwestern inland area and the cold bias in the Indochina Peninsula. However, the strong warm and dry bias in EAS-44 over eastern China is not present in EAS-22. This warm and dry bias in the EAS-44 simulation might be a result of a deficient summer monsoon circulation, where the precipitation over land is not properly simulated. In EAS-22 the bias is reduced, which seems to be due to the use of spectral nudging that constrains the CCLM simulation to be closer to the large-scale flow from ERA-Interim (Lee et al., 2016). In contrast, EAS-22 shows a stronger dry bias over India than seen in EAS-44, which might be associated with the different spatial domains (i.e., the larger part of the Indian Ocean in EAS-44). During the winter, when the large-scale forcing is stronger, the biases in EAS-44 and EAS-22 are quite similar, suggesting that these biases are related to the physical parameterization schemes used, for instance the deep convection or the land-surface scheme. The mean biases over land for the two simulations for the different seasons are of similar magnitude, seen both for temperature and precipitation. However, it should be noted that the magnitude of the precipitation bias is among the largest of the considered domains (see Table S4), suggesting that the model experiences particular deficiencies in simulating the climate of East Asia.
South Asia
The South Asian domain (WAS) comprises several challenging features to simulate properly with a regional model, such as the complex topography from the Himalayan and Hindu-Kush mountain chains in the north or the tropical climate represented by a strong seasonal rainfall from the South Asian monsoon circulation. For the CORDEX WAS domain, only one evaluation integration exists, performed with COSMO-crCLIM-v1-1 at 0.22∘ grid spacing (WAS-22). During the boreal summer, a cold bias over northern parts of India, the Horn of Africa, and Myanmar (Fig. 2) is seen. Interestingly, this cold bias is connected with a dry bias as seen over India and parts of the African region. The dry bias over the interior of the Indian subcontinent is also observed in earlier studies where COSMO-CLM is forced with other reanalysis products (e.g., ERA-40 reanalysis in Dobler and Ahrens, 2010, and NCEP reanalysis II data in Rockel and Geyer, 2008). The dry bias in the summer monsoon rainfall has been attributed to the lack of moisture transport into the interior parts of the Indian subcontinent due to the excess rainfall over the Western Ghats and its nearby warm southeastern Arabian Sea and also plausible inconsistencies in the representation of convection (Ahrens et al., 2020). The dry bias is also present in the EAS-22 simulation, with its East Asian domain partly overlapping with the South Asian domain. Moreover, over the Horn of Africa, the JJA precipitation bias in WAS-22 is similar to the CCLM biases in the AFR-22 and -44 simulations. Thus, it seems that these biases are not due to the choice of the model configuration or location of the domain but rather due to some processes being wrongly represented in COSMO-CLM.
During the winter season, there is a warm bias over northwestern India and the Ethiopian Highlands and a cold bias over northern Africa and the Middle East (Fig. 3). A similar cold bias is also seen over Africa and the Middle East in the AFR-22 and AFR-44 simulations. For precipitation, a dry bias is seen over most parts of the domain, except for a wet bias in the northeastern Himalaya (Fig. 3). This wet bias is also seen in the EAS-22 and EAS-44 simulations.
4.1.2 Summarizing the model performance with a Taylor diagram
To compare the model performance in terms of spatial variability between the five domains, we explore Taylor diagrams for all the ERA-Interim-driven simulations (12 in total). Figure 4 shows the normalized spatial Taylor diagram for precipitation and temperature for the summer and winter seasons. Note that here we use the ensemble mean over all observational datasets, whereas in Figs. 2 and 3 the spread between the observations is taken into account. Moreover, it should be stressed that the spatial variability varies substantially between the domains and also the quality of the observations (e.g., very sparse observational coverage in Africa compared to Europe), which again influences model performance displayed with the Taylor diagram in Fig. 4. Thus, Fig. 4 is merely meant to facilitate a visual comparison of the model results, which can be challenging to detect in Figs. 2–3. A more detailed investigation of the spatial variability for each domain separately is given in Sect. 4.2.
The COSMO-CLM simulations over Europe tend to have the best performance of the spatial variability, which is expected since most of the model development for CCLM is done on the European domain. When considering the different seasons and variables, it is not evident that increasing the horizontal resolution has a positive impact on model performance. In contrast, a clear improvement can be found for a newer model version, as seen for instance in the precipitation performance for Africa and Europe.
Another element to notice from Fig. 4 is that the individual model performance for the simulations for Africa and Europe is not so different, but the same cannot be said for East Asia and Australasia. The model configurations for Africa and Europe only differ in terms of changing the tuning parameters, aerosol climatology, and horizontal or vertical resolution (see Table S1). The simulations for Australasia and East Asia differ more in their configurations, resulting in larger differences in the performance score shown by the Taylor diagram, especially seen for the precipitation. AUS-44 is coupled to the Community Land Model, CLM, and this simulation has a better DJF precipitation performance in terms of spatial pattern correlation but underestimates the spatial variability (see Sect. 2.3). The configuration used for AUS-22 is closer to the standard COSMO-CLM configuration. Over East Asia, the EAS-22 simulation uses spectral nudging, which is not used in EAS-44, and this seems to also improve performance, in particular for summer monsoon precipitation. Note that the benefit of using spectral nudging has a strong dependency on the forcing data (e.g., Leps et al., 2019).
4.2 Evaluation of the GCM-driven simulations
The dynamical downscaling of the CMIP5 GCMs provides a great opportunity to produce regional climate projections for the major continental domains globally. While the choice of which GCM to downscale is not trivial, some studies advise on which GCM to prioritize based on the model performance (McSweeney et al., 2015; Jury et al., 2015; Sooraj et al., 2015). In addition, the GCMs used for CORDEX-CORE are chosen based on capturing a large range of the climate sensitivity of the CMIP5 models (https://cordex.org/experiment-guidelines/cordex-core/cordex-core-simulation-framework/, last access: 12 August 2021).

Figure 5Spatial Taylor diagrams exploring the ERA-Interim- and GCM-driven simulations for DJF air temperature where only land points are included for the domains Europe, Africa, East Asia, Australasia, and South Asia. The colors indicate the forcing data, and the diamond (circle) represents the 12 km or 24 km, respectively (50 km), simulations. The older model version is marked with a small white star within the colored data points. All the different simulations are listed in Table S1. The triangle is the ensemble mean of all the observations, while the upside triangles represent each single observation dataset. The raw ERA-Interim reanalysis is included as a green cross. Zoomed results indicated by the boxes are shown at the top and bottom of the respective panels.
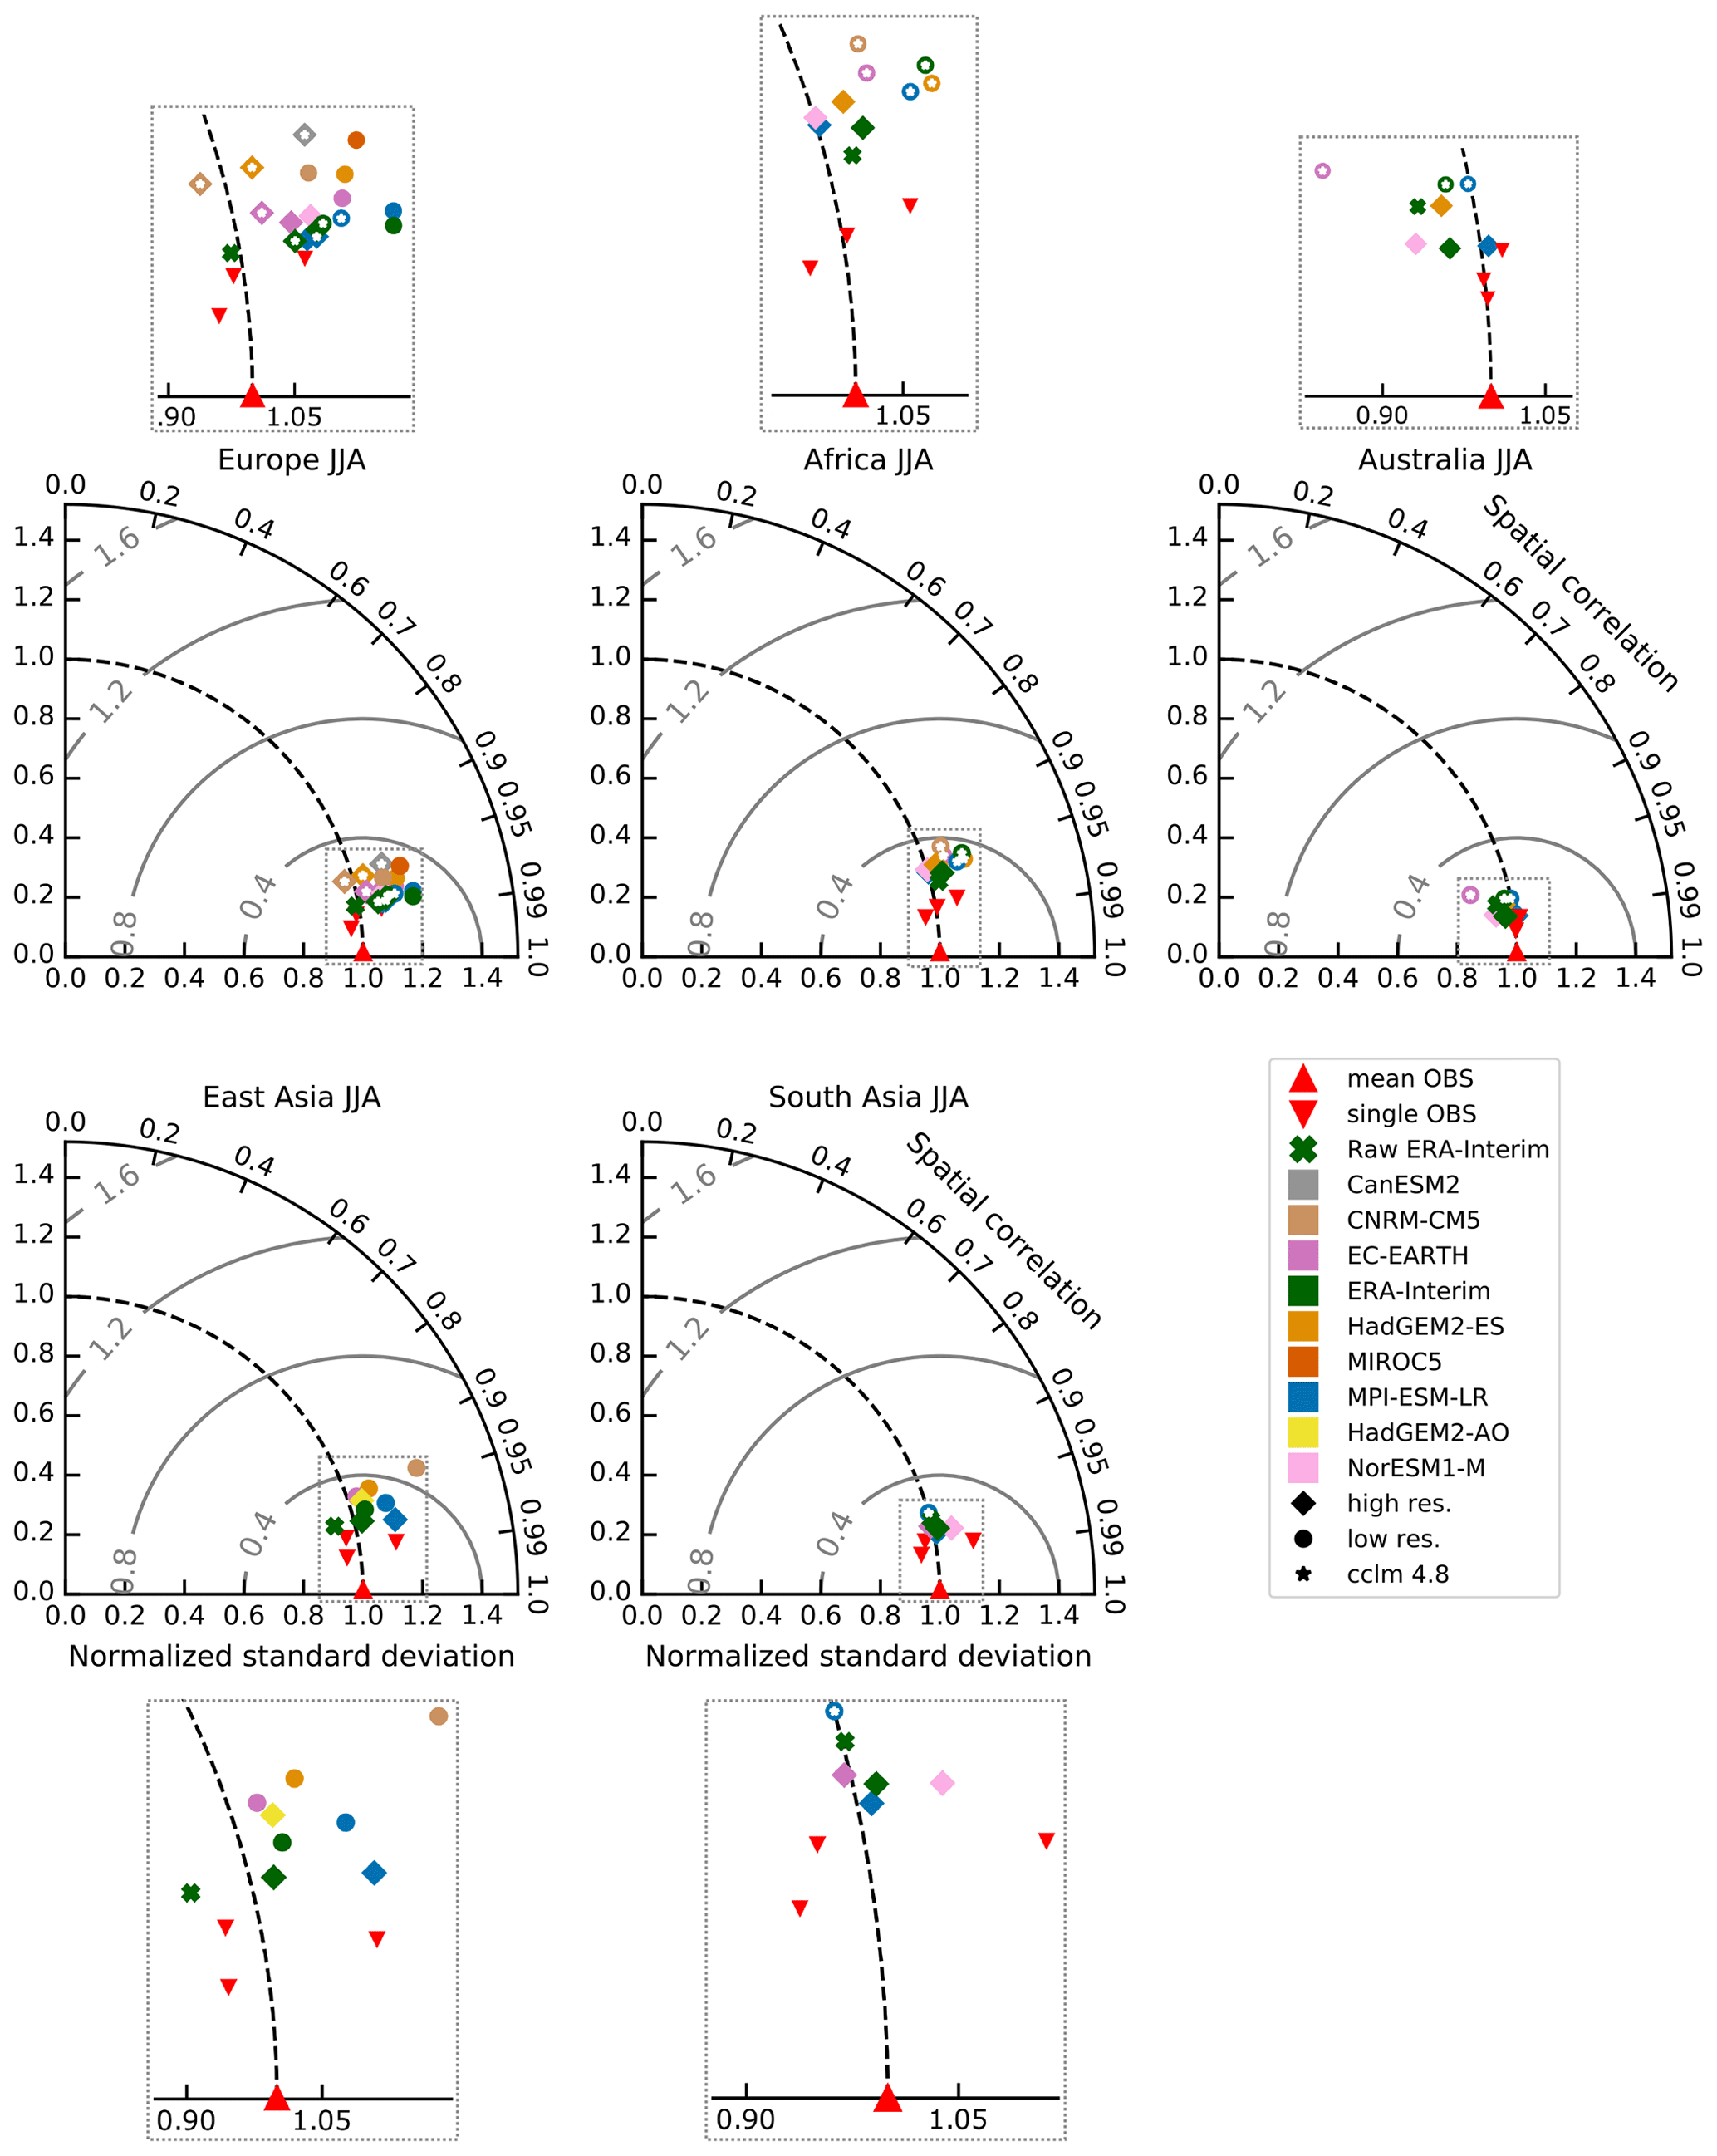
One of the main benefits of being a community is that the workload can be distributed among, and computing time contributed by, the different groups. A total of eight distinctive GCMs have been dynamically downscaled with COSMO-CLM for five CORDEX domains (see Sect. 3.2), yielding 80 simulations in total. Even though the size of the model ensemble varies for each domain, this is an extensive contribution. Figures 5–8 show all model results for each domain displayed in Taylor diagrams, which explore the performance of temperature and precipitation for the seasons DJF and JJA. All the ERA-Interim evaluation runs are shown in comparison to the GCM-driven runs, as is the spread of the observations. Note that we cannot in general discuss the performance of GCM-driven simulations without comparing to the GCM itself. However, displaying the downscaled results in Taylor diagrams facilitates a standard metric to compare how the model results differ with various forcing data.
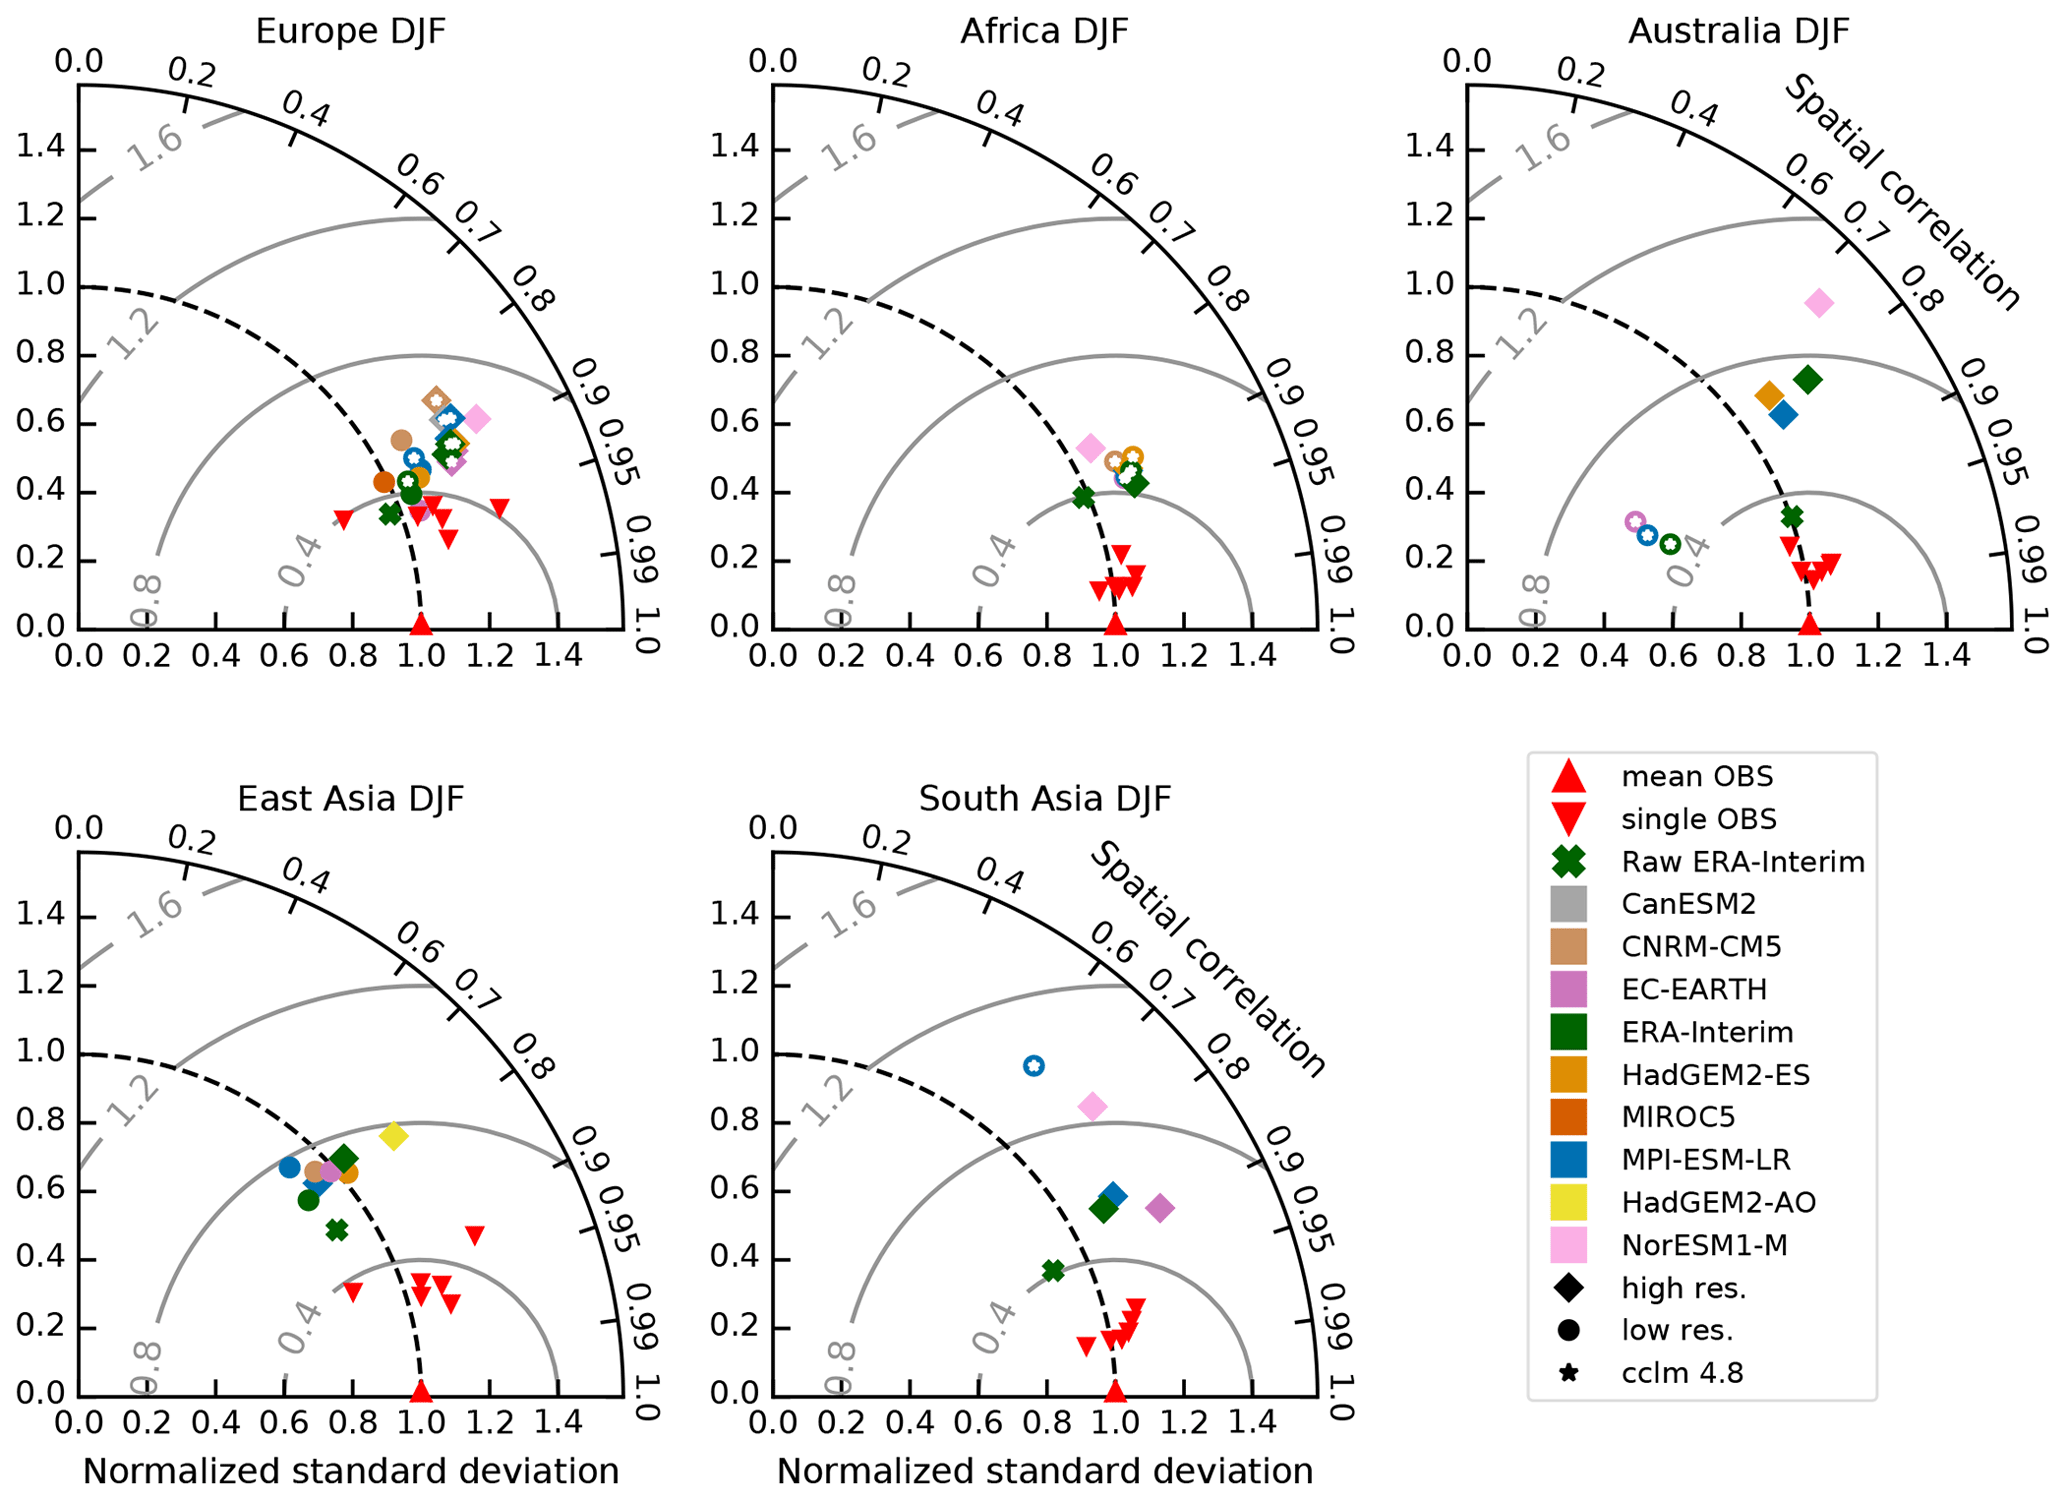

A general result is that the spatial correlation is quite high between the observed temperature and model result, with values larger than 0.9 for most of the domains and simulations. The spatial temperature pattern is dominated by topographical and geographical influences and tends to be insensitive to the driving GCM, model version, and resolution, in particular for DJF, across all domains (Fig. 5). For JJA, higher-resolution simulations are usually closer to the observations (e.g., for Europe, Africa, and Australasia; see Fig. 6). Moreover, the performance of the GCM-driven simulations is typically in the same range as for the ERA-Interim-driven simulations.
For precipitation, the spatial correlation has values down to 0.6 for some simulations, and the spread between the observations is larger for precipitation than for the temperature (Figs. 7 and 8). The individual simulations show a stronger dependency on the choice of driving data, model version, and resolution, which is apparent for both seasons and all domains.
If we consider the individual domains in more detail, we note that for, e.g., Europe, which has the largest model ensemble, the coarser simulations tend to overestimate the temperature spatial variability during winter, while the higher-resolution simulations underestimate it. During summer, almost all model simulations overestimate the spatial variability, and the overestimation is largest for the coarser simulations. This is not a consistent result across the different domains, where for instance for Australasia, the higher-resolution simulations have a weak tendency to overestimate the spatial variability for DJF, while this overestimation is lower or even an underestimation of the spatial variability is seen for some of the coarse-resolution simulations.
For precipitation, simulations often overestimate spatial variability. However, as there is a large spread between the observations, with many of the observations having a normalized standard deviation larger than 1, it might be that this overestimation is closer to reality. If we consider the individual domains, we see that for Australasia, the two model versions and resolutions have a quite different performance, as also noted in Sect. 4.1, since the coarser simulation is coupled to the CLM. This coupling in the old model version seems to lead to a systematic underestimation of the spatial variance in both seasons independently of the driving model. That the precipitation results depend on the driving data is most clearly seen for Europe, where the downscaled GCM ensemble is largest. However, for the East Asian domain, when we consider all the GCM-driven simulations, we see that the difference is larger when changing driving data than when changing model version and configuration, even though the two model versions and their configuration also give different results, as noted in Fig. 4.
To summarize, for the temperature results, there is a weak tendency for the higher-resolution simulations to have a performance closer to the observations, in particular for JJA, and the choice of driving data has a limited impact on the model results. For precipitation, the choice of the driving data has a bigger influence on the simulated results compared to the model version and resolution, which only alters the performance measured in the Taylor diagram slightly but not at the same magnitude as when changing the driving data. We see this for all domains, except for Australasia, where the coupling to a different land-surface model can be one of the reasons for a change in performance.
If we consider the simulations that have downscaled the same GCMs but with different model versions and configurations, for the two horizontal resolutions, there is a tendency for the higher-resolution simulation to have a performance closer to observations (see, e.g., for the downscaled MPI-ESM-LR simulations). This is visible for all domains except for Europe, where the coarser-resolution integrations perform closer to observation. This can be due to the fact that COSMO-CLM has been developed and targeted to have a good performance over Europe at exactly the coarser resolution. Nevertheless, since not all of the same GCMs have been downscaled for all domains, it is difficult to make a general conclusion regarding how COSMO-CLM with various resolutions and model configurations responds to different driving data.
4.3 Added value of the COSMO-CLM simulations
Until now we have mainly described how the model results and performance are influenced by changing the model configuration, model version, horizontal resolution, or driving data across the five CORDEX domains. An added value in terms of model performance is not necessarily gained by solely increasing the horizontal resolution, but to change the model configuration that is optimal for the domain has advantages, and this study is meant to document these re-tuning experiences that can be used when designing future CORDEX simulations. Our results also show that investing efforts in model development in terms of improving the physics or adding new features can add value. This is in particular the case for the European domain. Most of the model development has been done on the EUR-44 domain, and the coarser-resolution simulations have a performance which is as good as or often better than the higher-resolution simulations. However, it should be stressed that we are here only looking into the mean climate, and it has been shown that higher-resolution simulations add value when it comes to representing, e.g., the diurnal cycle, the extremes, complex topography, or the land–sea contrast (Ban et al., 2014; Torma et al., 2015; Prein et al., 2016; Thiery et al., 2016; Park et al., 2016; Vanden Broucke et al., 2018; Obermann et al., 2018; Helsen et al., 2019; Lee et al., 2020).
The ERA-Interim-driven simulation is used to evaluate the performance of the RCM, and whether there is an added value over the reanalysis depends on the parameter investigated (e.g., Thiery et al., 2016). Nevertheless, it is hoped that the RCMs should have a similar performance or improve the results of the reanalysis, in particular for the tropical precipitation, where reanalyses have poorer skill (Bosilovich et al., 2008). To assess how the performance of the ERA-Interim-driven simulations compares to the skill of ERA-Interim, we have included the reanalysis in the Taylor diagrams, shown in Figs. 5–8. The spatial pattern of the ERA-Interim bias compared to the different observation datasets is included in the Supplement (Figs. S13–S16). A general result is that the reanalysis is typically closer to the observations than the evaluation simulation. This is not a surprising result, as ERA-Interim is constrained by observations by using a sequential data assimilation scheme (Dee et al., 2011). ERA-Interim agrees well with the spatial variability of the temperature observations, seen mostly for summer, while in winter the reanalysis tends to underestimate the spatial variability (Figs. 5 and 6). The temperature in the COSMO-CLM evaluation simulations has a performance similar to the raw ERA-Interim data in terms of the spatial pattern correlation, but the CCLM simulations tend to overestimate the spatial variance. For precipitation, COSMO-CLM has typically a poorer performance than ERA-Interim, seen both for spatial pattern correlation and variability (Figs. 7 and 8). In terms of the spatial pattern of the biases from the reanalysis (Figs. S13–S16) and CCLM simulations (Figs. 2–3), it can be seen that in some areas for the individual domains, COSMO-CLM has a lower or opposite sign bias than ERA-Interim (e.g., for DJF Africa (Southern Hemisphere) and India, ERA-Interim has a cold and wet bias, while COSMO-CLM has a warm and dry bias). However, in most areas ERA-Interim performs better, seen for both temperature and precipitation.
Whether an RCM adds value to the driving GCM data is one of the main motivations to perform dynamical downscaling (Rummukainen, 2016). Investigating whether RCM results add value to the driving GCMs should be done when comparing the downscaled results with the forcing data, and an assessment of the GCMs should also be done to determine whether the GCM has a realistic representation of the large-scale atmosphere and ocean patterns (e.g., Pothapakula et al., 2020). An RCM inherits its large-scale circulation from the driving data, and any missing information from the boundary conditions is difficult to regenerate by the RCM within the simulation domain (Diaconescu and Laprise, 2013; Hall, 2014; Leps et al., 2019). To assess whether there is an added value of the downscaled results compared to the GCMs is beyond the scope of this study, as we are focusing on presenting the RCM results and how they are different depending on various configurations and resolutions. However, it should be noted from Figs. 5 to 8 that the performance of the GCM-driven simulations, estimated in the Taylor diagrams, is typically in the same range as for the evaluation simulations for temperature. For precipitation the evaluation simulations generally perform closer to the observations than the GCM-driven simulations. These results indicate that there is no error compensation between the GCMs and the RCMs.
We have presented regional climate simulations performed with the COSMO-CLM following the CORDEX framework (Giorgi et al., 2009). During this decade of CORDEX, the COSMO-CLM results were influenced by several model upgrades, developments or bug fixes, and model tuning such as parameter testing and objective calibration, and all these advancements had an impact on the model performance. At the same time, as more computing power became available, modeling groups were able to run their model at a higher horizontal resolution, resulting in the CORDEX framework also recommending the RCMs to be run with a horizontal grid spacing of 25 km (12 km for Europe) instead of 50 km, which was initially suggested by Giorgi et al. (2009). When counting the simulations with the distinctive model versions and resolutions, different forcing data, and emission scenarios, the CLM-Community has contributed to the CORDEX effort with 80 publicly available simulations in the ESGF database spanning five CORDEX domains over the last decade (as of February 2020). This highlights what a comprehensive contribution a community model such as COSMO-CLM can make to the regional climate model ensemble. However, it should be stressed that the COSMO-CLM ensemble is complex and differs in terms of version, configuration, resolution, or driving data, making it challenging to present generic conclusions. Nevertheless, our analysis of all the available model runs can provide guidance for the future design of regional climate projections by the CLM-Community as well as by other RCM groups. Moreover, as the focus on downscaling CMIP5 GCMs will be replaced by CMIP6 in the near future, we anticipate this will be a good time to reflect how coordinated RCM simulations can contribute in an optimal way. Even though there are increasing research activities aiming at producing continental-scale model ensembles with convection-resolving simulations (Coppola et al., 2020b) or at running global models at a similar resolution to the RCMs (Demory et al., 2020), the use of the dynamical downscaling technique with an RCM at a resolution of 12–25 km will continue to fill an important research need for at least another 5–10 years.
We have focused on the evaluation simulations (i.e., the ERA-Interim-driven simulations) and the GCM-driven simulations in the historical period. One of our main findings is that there is a tendency for higher-resolution simulations to improve model performance in terms of temperature and precipitation, but much of this improvement is due to model development or model re-tuning to the given domain and resolution and not only because of better-resolved climate processes from an increase in the horizontal resolution. This latter finding is supported by other studies (e.g., Wu et al., 2020). Nevertheless, the positive effect of the higher-resolution grid can be disguised as we have only investigated the mean climate, whereas it is expected that a higher resolution will better represent the whole hydrological cycle and extremes (Ban et al., 2014; Torma et al., 2015; Sunyer et al., 2017; Hentgen et al., 2019). Thus, we emphasize the potential for re-tuning the model for the target domain and horizontal resolution, for example, by increasing the number of vertical levels, by changing the height of the model top, or by performing an objective parameter calibration. Other studies also suggest that the convection parameterization could be considered to be switched off at a coarser resolution than previously thought (Vergara-Temprado et al., 2020). There are additional opportunities to improve model performance by addressing missing or insufficiently represented processes. In particular, using the most up-to-date aerosol climatology and including transient aerosol forcing should be considered (Schultze and Rockel, 2018; Gutiérrez et al., 2020; Boé et al., 2020). Similarly, land-surface process representation is an area of regional climate modeling with a lot of room for improvement (Davin et al., 2016). For instance, improving land processes in COSMO-CLM has been shown to positively influence model performance, either through adjustments to the native land-surface model in COSMO-CLM (Bellprat et al., 2016; Schlemmer et al., 2018; Akkermans et al., 2012) or by coupling COSMO-CLM to the Community Land Model (Davin et al., 2011, 2016; Thiery et al., 2015, 2016; Hirsch et al., 2019; Vanden Broucke et al., 2015; Vanden Broucke and Van Lipzig, 2017). In addition, some specific processes such as the plant physiological response to CO2 increase have been shown to critically influence climate change feedbacks, in particular related to extreme heat (Schwingshackl et al., 2019). The inclusion of land-use change forcing is also an area where RCMs lag behind global climate models, despite the recognition that land-use impacts are typically stronger at the scales targeted by RCMs and are relevant for decision making (Davin et al., 2020). Finally, future RCM developments should consider more explicitly the coupling of the atmospheric model to other components of the climate system, thus transitioning to regional Earth system modeling (Giorgi, 2019; Will et al., 2017). An ensemble of regional ocean–atmosphere climate simulations has been performed already within Med-CORDEX for the Mediterranean basin (Somot et al., 2018).
The COSMO-CLM simulations perform better for Europe and to a lesser extent for Africa than for the other domains. As most of the coordinated model development and testing within the CLM-Community has been done to improve the model performance over Europe, this is a confirming and encouraging result. Through different RCM transferability studies, it has been shown that RCMs may respond differently when used over non-native domains, and in particular over regions with contrasting climates (Russo et al., 2020; Takle et al., 2007; Bellprat et al., 2016). Thus, these results suggest that the CLM-Community should improve the coordinated research in the non-European domains, in particular if the goal is to contribute with dynamical downscaling projections with a global extent. Ideally, coordinated effort should be put into parameter testing for different model resolutions and for new model versions, for all the domains, and not only for Europe.
Another finding is that for the GCM-driven simulations, the model results have a dependency on the driving data, seen in particular for the precipitation. When changing the resolution or slightly altering the model configuration, the simulated results are only marginally modified. However, if a substantial adjustment is done in the model configuration (such as coupling to a different land model as done for AUS-44), the model results differ more. An RCM modeler can do a lot when it comes to improving the model performance, but if there is information missing in the large-scale GCM forcing on the RCM boundaries, it should not be expected that the RCMs can improve on that (Hall, 2014; Pothapakula et al., 2020; Rana et al., 2020). Thus, a coordinated and goal-oriented strategy within CORDEX is needed for selection of the GCM data. Such a strategy could address for instance whether only the GCM performance for each region should be considered or whether the spread to include GCM sensitivity to increasing greenhouse gases and other forcings (Rineau et al., 2019) should also be evaluated when selecting driving data. We propose that the planning of the GCM–RCM model chain should be done through coordination between the GCM and RCM modelers so that we can obtain a model chain that we trust in and that captures the range of possible future scenarios (Knutti, 2008).
This paper describes a central and important part of the activities in the CLM-Community within the last decade. COSMO-CLM was the main workhorse for the contributions of the CLM-Community to CORDEX and to many other projects and activities in the past. Currently, the main developers of the COSMO model, the Deutscher Wetterdienst and its partners in the consortium for small-scale modeling, are moving to ICOsahedral Nonhydrostatic Weather and Climate Mode (ICON)-based forecasting systems (Zängl et al., 2015). As a consequence, the development of the COSMO model has slowed down over the last years and meanwhile nearly stopped completely. The integration of recent developments and improvements is ongoing as well as the unification of the numerical weather prediction and CLM-Community branches. COSMO version 6.0 will be released in 2021, and this will be the last official version of the COSMO model.
COSMO-CLM 6.0 will be a state-of-the-art regional climate model, and the GPU version especially already enables long-term simulations at convection-resolving resolutions. The model will certainly still be used in several groups of the CLM-Community in the next few years. However, the CLM-Community has to prepare for the future. Members of the CLM-Community already started to develop a regional climate mode of ICON some years ago in a coordinated effort. A first version of this new regional climate model called ICON-CLM was prepared in 2019, and a reference simulation was conducted and analyzed (Pham et al., 2021). The results show that ICON-CLM already performs as well as COSMO-CLM in many aspects and is computationally more efficient. This is very promising, because the model has not been fully optimized for regional climate applications so far, and of course the long-term experience which has been built up in the setup and use of the COSMO-CLM model are not available yet. This highlights the room for improvement in the near future. However, there are still many technical developments in the model and the infrastructure (mainly pre- and post-processing) to be done before the modeling system will have the same functionality as COSMO-CLM today.
The transition to ICON will be one of the central topics for the CLM-Community in the next few years. Besides this already challenging task, the community will certainly contribute to the downscaling of CMIP6 simulation within the framework of CORDEX, and possible contributions are currently discussed together with new strategies for the next 5 years. Some of the overarching goals are related to requirements set by new computer architectures, the fact that global climate models will in the next years be able to run at the same resolutions as regional models today, and possible extensions of the modeling system towards regional Earth system models that include oceans, dynamic vegetation, a carbon cycle, surface runoff schemes, as well as ice sheet and glacier models.
All the official COSMO-CLM CORDEX simulations (except the WAS-44 simulations) used in this study can be downloaded from the Earth System Grid Federation node. The different groups that performed the various simulations are given in Table S2. Details on how to access the data through the ESGF-node are available at https://cordex.org/data-access/esgf/ (last access: 12 August 2021). The WAS-44 simulations are available from http://cccr.tropmet.res.in/home/ftp_data.jsp (last access: 17 August 2021; Centre for Climate Change Research, 2021). The YUSPECIF-log files that provide the namelist settings for the different configurations are given in the Supplement. The documentation of the COSMO model is developed by the COSMOConsortium, consists of scientific documentation and a user guide, and is permanently available: https://www.dwd.de/EN/ourservices/cosmo_documentation/cosmo_documentation.html (last access: 12 August 2021). The COSMO-CLM model is free of charge for all research applications; however, access is license-restricted: http://www.cosmo-model.org/content/consortium/licencing.htm (last access: 12 August 2021). To download, the user needs to become a member of the CLM-Community or the respective institute needs to hold an institutional license. All observational datasets are publicly available from GHCN-CAMS (Fan and van den Dool, 2008) available at https://psl.noaa.gov/data/gridded/data.ghcncams.html (last access: 12 August 2021), CRU (University of East Anglia Climatic Research Unit et al., 2008) available at https://climatedataguide.ucar.edu/climate-data/cru-ts-gridded-precipitation-and-other-meteorological-variables-1901 (last access: 12 August 2021), UDEL (Willmott and Matsuura, 2001) available at https://psl.noaa.gov/data/gridded/data.UDel_AirT_Precip.html (last access: 12 August 2021), GPCC (Schneider et al., 2018) available at https://www.dwd.de/EN/ourservices/gpcc/gpcc.html (last access: 12 August 2021), MSWEP (Beck et al., 2019) available at http://www.gloh2o.org/ (last access: 12 August 2021), GPCP (Adler et al., 2003) available at https://psl.noaa.gov/data/gridded/data.gpcp.html (last access: 12 August 2021), and CPC (Chen et al., 2008) available at https://climatedataguide.ucar.edu/climate-data/cpc-unified-gaugebased-analysis-global-daily-precipitation (last access: 12 August 2021).
The supplement related to this article is available online at: https://doi.org/10.5194/gmd-14-5125-2021-supplement.
The COSMO-CLM simulations were performed by the institutes given in Table S1, which are represented by all the co-authors of the paper. The model development was done as part of a community effort. The model simulation data were collected by SLS and the observation data by JVdW. The figures were produced by JVdW and RB with input from SLS, ER, PKP, NPMvL, and WT. The paper's structure was prepared by SLS with input from JVdW, RB, ER, and PKP. AD, BR, BA, and NPMvL gave input on a preliminary version of the manuscript. All the co-authors contributed to the final version of the manuscript.
The authors declare that they have no conflict of interest.
Publisher’s note: Copernicus Publications remains neutral with regard to jurisdictional claims in published maps and institutional affiliations.
The different groups listed in Table S1 that performed the COSMO-CLM climate simulations are grateful for their respective supercomputers: ETH simulations at the Swiss Center for Scientific Computing (CSCS, Lugano) using resources from a PRACE allocation, and HZG, BTU, and DWD simulations using the high-performance computing facilities at the German Climate Research Centre (DKRZ). Some of the simulations provided by the KIT were performed at the HLRS High Performance Computing Center Stuttgart. GUF simulations were performed at the Center for Scientific Computing, Goethe University Frankfurt am Main. Seung-Ki Min and Donghyun Lee were supported by the Korea Meteorological Administration Research and Development Program under grant KMI2020-01413. The authors thank the World Climate Research Programme’s Working Group on Regional Climate for coordinating CORDEX and the Working Group on Coupled Modelling panel responsible for CMIP5. The authors also thank the Earth System Grid Federation (ESGF), which hosts and coordinates the data provision. We also thank the NOAA, UCAR, DWD, and Princeton University for providing the observational datasets.
This research has been supported by the Korea Meteorological Administration Research and Development Program (grant no. KMI2020-01413).
This paper was edited by Olivier Marti and reviewed by two anonymous referees.
Adler, R. F., Huffman, G. J., Chang, A., Ferraro, R., Xie, P.-P., Janowiak, J., Rudolf, B., Schneider, U., Curtis, S., Bolvin, D., Gruber, A., Susskind, J., Arkin, P., and Nelkin, E.: The version-2 global precipitation climatology project (GPCP) monthly precipitation analysis (1979–present), J. Hydrometeorol., 4, 1147–1167, 2003 (data available at: https://psl.noaa.gov/data/gridded/data.gpcp.html, last access: 12 August 2021). a, b
Ahrens, B., Formayer, H., Gobiet, A., Heinrich, G., Hofstätter, M., Matulla, C., Prein, A. F., Truhetz, H., Anders, I., Haslinger, K., Nadeem, I., Suklitsch, M., and Themessl, M.: Future Climate Developments, Verlag der Österreichischen Akademie der Wissenschaften, Wien, Österreich, https://doi.org/10.1553/aar14s301, 2014. a
Ahrens, B., Meier, T., and Brisson, E.: Diurnal Cycle of Precipitation in the Himalayan Foothills – Observations and Model Results, in: Himalayan Weather and Climate and their impact on the environment, chap. 5, edited by: Dimri, A. P., Bookhagen, B., Stoffel, M., and Yasunari, T., Springer Nature Switzerland AG 2020, 73–89, https://doi.org/10.1007/978-3-030-29684-1, 2020. a
Akkermans, T., Lauwaet, D., Demuzere, M., Vogel, G., Nouvellon, Y., Ardö, J., Caquet, B., Grandcourt, A. D., Merbold, L., Kutsch, W., and Lipzig, N. V.: Validation and comparison of two soil-vegetation-atmosphere transfer models for tropical Africa, J. Geophys. Res., 117, G02013, https://doi.org/10.1029/2011JG001802, 2012. a
Arakawa, A. and Lamb, V.: Computational design of the basic dynamical processes in the UCLA general circulation model, Methods in Computational Physics: Advances in Research and Applications, edited by: Chang, J., Academic Press, New York, NY, USA, 17, 173–265, https://doi.org/10.1016/B978-0-12-460817-7.50009-4, 1977. a
Arora, V. K., Scinocca, J. F., Boer, G. J., Christian, J. R., Denman, K. L., Flato, G. M., Kharin, V. V., Lee, W. G., and Merryfield, W. J.: Carbon emission limits required to satisfy future representative concentration pathways of greenhouse gases, Geophys. Res. Lett., 38, L05805, https://doi.org/10.1029/2010GL046270, 2011. a, b
Asharaf, S. and Ahrens, B.: Indian summer monsoon rainfall processes in climate change scenarios, J. Climate, 28, 5414–5429, https://doi.org/10.1175/JCLI-D-14-00233.1, 2015. a, b, c, d, e, f
Baek, H. J., Lee, J., Lee, H. S., Hyun, Y. K., Cho, C., Kwon, W. T., Marzin, C., Gan, S. Y., Kim, M. J., Choi, D. H., Lee, J., Lee, J., Boo, K. O., Kang, H. S., and Byun, Y. H.: Climate change in the 21st century simulated by HadGEM2-AO under representative concentration pathways, Asia-Pac. J. Atmos. Sci., 49, 603–618, https://doi.org/10.1007/s13143-013-0053-7, 2013. a, b
Baldauf, M., Seifert, A., Förstner, J., Majewski, D., Raschendorfer, M., and Reinhardt, T.: Operational convective-scale numerical weather prediction with the COSMO model: Description and sensitivities, Mon. Weather Rev., 139, 3887–3905, https://doi.org/10.1175/MWR-D-10-05013.1, 2011. a
Ban, N., Schmidli, J., and Schär, C.: Evaluation of the convection-resolving regional climate modeling approach in decade-long simulations, J. Geophys. Res., 119, 7889–7907, https://doi.org/10.1002/2014JD021478, 2014. a, b, c
Bechtold, P., Köhler, M., Jung, T., Doblas-Reyes, F., Leutbecher, M., Rodwell, M., Vitart, F., and Balsamo, G.: Advances in simulating atmospheric variability with the ECMWF model: From synoptic to decadal time-scales, Quart. J. Roy. Met. Soc., 134, 1337–1351, https://doi.org/10.1002/qj.289, 2008. a, b, c
Beck, H. E., Wood, E. F., Pan, M., Fisher, C. K., Miralles, D. G., Van Dijk, A. I., McVicar, T. R., and Adler, R. F.: MSWEP V2 global 3-hourly 0.1 precipitation: methodology and quantitative assessment, B. Am. Meteorol. Soc., 100, 473–500, 2019 (data available at: http://www.gloh2o.org/, last access: 12 August 2021). a, b
Bellprat, O., Kotlarski, S., Lüthi, D., and Schär, C.: Objective calibration of regional climate models, J. Geophys. Res.-Atmos., 117, D23115, https://doi.org/10.1029/2012JD018262, 2012. a
Bellprat, O., Kotlarski, S., Lüthi, D., De Elía, R., Frigon, A., Laprise, R., and Schär, C.: Objective calibration of regional climate models: Application over Europe and North America, J. Climate, 29, 819–838, https://doi.org/10.1175/JCLI-D-15-0302.1, 2016. a, b, c
Boé, J., Somot, S., Corre, L., and Nabat, P.: Large discrepancies in summer climate change over Europe as projected by global and regional climate models: causes and consequences, Clim. Dynam., 54, 2981–3002, https://doi.org/10.1007/s00382-020-05153-1, 2020. a
Bosilovich, M. G., Chen, J., Robertson, F. R., and Adler, R. F.: Evaluation of Global Precipitation in Reanalyses, J. Appl. Meteorol. Clim., 47, 2279–2299, https://doi.org/10.1175/2008JAMC1921.1, 2008. a
Brisson, E., Demuzere, M., and Van Lipzig, N.: Modelling strategies for performing convection-permitting climate simulations, Met. Zeit., 25, 149–163, https://doi.org/10.1127/metz/2015/0598, 2015. a
Brogli, R., Kröner, N., Lund Sørland, S., Lüthi, D., and Schär, C.: The Role of Hadley Circulation and Lapse-Rate Changes for the Future European Summer Climate, J. Climate, 32, 385–404, https://doi.org/10.1175/JCLI-D-18-0431.1, 2019. a
Brousse, O., Wouters, H., Demuzere, M., Thiery, W., Van de Walle, J., and van Lipzig, N. P. M.: The local climate impact of an African city during clear-sky conditions – Implications of the recent urbanization in Kampala (Uganda), Int. J. Climatol., 40, 4586–4608, https://doi.org/10.1002/joc.6477, 2019. a
Bucchignani, E., Cattaneo, L., Panitz, H. J., and Mercogliano, P.: Sensitivity analysis with the regional climate model COSMO-CLM over the CORDEX-MENA domain, Meteorol. Atmos. Phys., 128, 73–95, https://doi.org/10.1007/s00703-015-0403-3, 2016a. a, b
Bucchignani, E., Mercogliano, P., Rianna, G., and Panitz, H. J.: Analysis of ERA-Interim-driven COSMO-CLM simulations over Middle East – North Africa domain at different spatial resolutions, Int. J. Climatol., 36, 3346–3369, https://doi.org/10.1002/joc.4559, 2016b. a, b
Bülow, K., Huebener, H.and Keuler, K., Menz, C., Pfeifer, S., Ramthun, H., Spekat, A., Steger, C.and Teichmann, C., and Warrach-Sagi, K.: User tailored results of a regional climate model ensemble to plan adaption to the changing climate in Germany, Adv. Sci. Res, 16, 241–249, https://doi.org/10.5194/asr-16-241-2019, 2019. a
Centre for Climate Change Research: CORDEX-South Asia Multi Model Output, Indian Institute of Tropical Meteorology, Pune, India [data set], available at: http://cccr.tropmet.res.in/home/ftp_data.jsp, last access: 17 August 2021. a
Cha, D., Jin, C., Lee, D., and Kuo, Y.: Impact of intermittent spectral nudging on regional climate simulation using Weather Research and Forecasting model, J. Geophys. Res., 116, D10103, https://doi.org/10.1029/2010JD015069, 2011. a
Chatterjee, F., Allaerts, D., Blahak, U., Meyers, J., and Van Lipzig, N.: Evaluation of a wind-farm parametrization in a regional climate model using large eddy simulations, Quart. J. Roy. Met. Soc., 142, 3152–3161, https://doi.org/10.1002/qj.2896, 2017. a
Chen, M., Shi, W., Xie, P., Silva, V. B., Kousky, V. E., Wayne Higgins, R., and Janowiak, J. E.: Assessing objective techniques for gauge-based analyses of global daily precipitation, J. Geophys. Res.-Atmos., 113, D04110, https://doi.org/10.1029/2007JD009132, 2008 (data available at: https://climatedataguide.ucar.edu/climate-data/cpc-unified-gaugebased-analysis-global-daily-precipitation, last access: 12 August 2021). a, b
Christensen, J. H. and Christensen, O. B.: A summary of the PRUDENCE model projections of changes in European climate by the end of this century, Climatic Change, 81, 7–30, https://doi.org/10.1007/s10584-006-9210-7, 2007. a
Christensen, J. H., Larsen, M. A. D., Christensen, O. B., Drews, M., and Stendel, M.: Robustness of European climate projections from dynamical downscaling, Clim. Dynam., 53, 4857–4869, https://doi.org/10.1007/s00382-019-04831-z, 2019. a
Ciarlo, J. M., Coppola, E., Fantini, A., Giorgi, F., Gao, X., Tong, Y., Glazer, R. H., Abraham, J., Alavez, T., Sines, T., Pichelli, E., Raffaele, F., Das, S., Bukovsky, M., Ashfaq, M., Im, E., Nguyen-Xuan, T., Teichmann, C., Remedio, A., Remke, T., Bülow, K., Weber, T., Buntemeyer, L., Sieck, K., Rechid, D., and Jacob, D.: A new spatially distributed added value index for regional climate models: the EURO-CORDEX and the CORDEX-CORE highest resolution ensembles, Clim. Dynam., https://doi.org/10.1007/s00382-020-05400-5, online first, 2020. a
Collins, W. J., Bellouin, N., Doutriaux-Boucher, M., Gedney, N., Halloran, P., Hinton, T., Hughes, J., Jones, C. D., Joshi, M., Liddicoat, S., Martin, G., O'Connor, F., Rae, J., Senior, C., Sitch, S., Totterdell, I., Wiltshire, A., and Woodward, S.: Development and evaluation of an Earth-System model – HadGEM2, Geosci. Model Dev., 4, 1051–1075, https://doi.org/10.5194/gmd-4-1051-2011, 2011. a, b
Coppola, E., Nogherotto, R., Ciarlò, J. M., Giorgi, F., van Meijgaard, E., Kadygrov, N., Iles, C., Corre, L., Sandstad, M., Somot, S., Nabat, P., Vautard, R., Levavasseur, G., Schwingshackl, C., Sillmann, J., Kjellström, E., Nikulin, G., Aalbers, E., Lenderink, G., Christensen, O. B., Boberg, F., Sørland, S. L., Demory, M., Bülow, K., Teichmann, C., Warrach-Sagi, K., and Wulfmeyer, V.: Assessment of the European climate projections as simulated by the large EURO-CORDEX regional and global climate model ensemble, J. Geophys. Res.-Atmos., 126, e2019JD032356, https://doi.org/10.1029/2019JD032356, 2020a. a
Coppola, E., Sobolowski, S., Pichelli, E., Raffaele, F., Ahrens, B., Anders, I., Ban, N., Bastin, S., Belda, M., Belusic, D., Caldas-Alvarez, A., Cardoso, R. M., Davolio, S., Dobler, A., Fernandez, J., Fita, L., Fumiere, Q., Giorgi, F., Goergen, K., Güttler, I., Halenka, T., Heinzeller, D., Hodnebrog, Jacob, D., Kartsios, S., Katragkou, E., Kendon, E., Khodayar, S., Kunstmann, H., Knist, S., Lavín-Gullón, A., Lind, P., Lorenz, T., Maraun, D., Marelle, L., van Meijgaard, E., Milovac, J., Myhre, G., Panitz, H. J., Piazza, M., Raffa, M., Raub, T., Rockel, B., Schär, C., Sieck, K., Soares, P. M., Somot, S., Srnec, L., Stocchi, P., Tölle, M. H., Truhetz, H., Vautard, R., de Vries, H., and Warrach-Sagi, K.: A first-of-its-kind multi-model convection permitting ensemble for investigating convective phenomena over Europe and the Mediterranean, Clim. Dynam., 55, 3–34, https://doi.org/10.1007/s00382-018-4521-8, 2020b. a
Dalelane, C., Früh, B., Steger, C., and Walter, A.: A pragmatic approach to build a reduced regional climate projection ensemble for Germany using the EURO-CORDEX 8.5 ensemble, J. Appl. Meteorol. Clim., 57, 477–491, https://doi.org/10.1175/JAMC-D-17-0141.1, 2018. a, b, c
Davin, E. L., Stöckli, R., Jaeger, E. B., Levis, S., and Seneviratne, S. I.: COSMO-CLM2: a new version of the COSMO-CLM model coupled to the Community Land Model, Clim. Dynam., 37, 1889–1907, https://doi.org/10.1007/s00382-011-1019-z, 2011. a, b, c
Davin, E. L., Maisonnave, E., and Seneviratne, S. I.: Is land surface processes representation a possible weak link in current Regional Climate Models?, Environ. Res. Lett., 11, 074027, https://doi.org/10.1088/1748-9326/11/7/074027, 2016. a, b, c
Davin, E. L., Rechid, D., Breil, M., Cardoso, R. M., Coppola, E., Hoffmann, P., Jach, L. L., Katragkou, E., de Noblet-Ducoudré, N., Radtke, K., Raffa, M., Soares, P. M. M., Sofiadis, G., Strada, S., Strandberg, G., Tölle, M. H., Warrach-Sagi, K., and Wulfmeyer, V.: Biogeophysical impacts of forestation in Europe: first results from the LUCAS (Land Use and Climate Across Scales) regional climate model intercomparison, Earth Syst. Dynam., 11, 183–200, https://doi.org/10.5194/esd-11-183-2020, 2020. a
Dee, D. P., Uppala, S. M., Simmons, A. J., Berrisford, P., Poli, P., Kobayashi, S., Andrae, U., Balmaseda, M. A., Balsamo, G., Bauer, P., Bechtold, P., Beljaars, A. C. M., van de Berg, L., Bidlot, J., Bormann, N., Delsol, C., Dragani, R., Fuentes, M., Geer, A. J., Haimberger, L., Healy, S. B., Hersbach, H., Hólm, E. V., Isaksen, L., Kållberg, P., Köhler, M., Matricardi, M., McNally, A. P., Monge-Sanz, B. M., Morcrette, J.-J., Park, B.-K., Peubey, C., de Rosnay, P., Tavolato, C., Thépaut, J.-N., and Vitart, F.: The ERA-Interim reanalysis: configuration and performance of the data assimilation system, Q. J. Roy. Meteor. Soc., 137, 553–597, https://doi.org/10.1002/qj.828, 2011. a, b, c, d, e, f
Demory, M.-E., Berthou, S., Fernández, J., Sørland, S. L., Brogli, R., Roberts, M. J., Beyerle, U., Seddon, J., Haarsma, R., Schär, C., Buonomo, E., Christensen, O. B., Ciarlo ̀, J. M., Fealy, R., Nikulin, G., Peano, D., Putrasahan, D., Roberts, C. D., Senan, R., Steger, C., Teichmann, C., and Vautard, R.: European daily precipitation according to EURO-CORDEX regional climate models (RCMs) and high-resolution global climate models (GCMs) from the High-Resolution Model Intercomparison Project (HighResMIP), Geosci. Model Dev., 13, 5485–5506, https://doi.org/10.5194/gmd-13-5485-2020, 2020. a, b
Diaconescu, E. and Laprise, R.: Can added value be expected in RCM-simulated large scales?, Clim. Dynam., 41, 1769–1800, https://doi.org/10.1007/s00382-012-1649-9, 2013. a
Di Virgilio, G., Evans, J. P., Di Luca, A., Olson, R., Argüeso, D., Kala, J., Andrys, J., Hoffmann, P., Katzfey, J. J., and Rockel, B.: Evaluating reanalysis-driven CORDEX regional climate models over Australia: model performance and errors, Clim. Dynam., 53, 2985–3005, https://doi.org/10.1007/s00382-019-04672-w, 2019. a, b, c, d, e
Dobler, A. and Ahrens, B.: Analysis of the Indian summer monsoon system in the regional climate model COSMO-CLM, J. Geophys. Res.-Atmos., 115, D16101, https://doi.org/10.1029/2009JD013497, 2010. a, b
Dobler, A. and Ahrens, B.: Four climate change scenarios for the Indian summer monsoon by the regional climate model COSMO-CLM, J. Geophys. Res.-Atmos., 116, D24104, https://doi.org/10.1029/2011JD016329, 2011. a
Doms, G. and Baldauf, M.: A Description of the Nonhydrostatic Regional COSMO-Model – Part I: Dynamics and Numerics, Tech. rep., COSMO – Consortium for Small-Scale Modelling, https://doi.org/10.5676/DWD_pub/nwv/cosmo-doc_5.00_I, 2013. a
Doms, G., Föster, J., Heise, E., Herzog, H., Mironov, D., Raschendorfer, M., Reinhardt, T., Ritter, B., Schrodin, R., Schulz, J., and Vogel, G.: A Description of the Nonhydrostatic Regional COSMO-Model – Part II: Physical Parameterizations, Tech. rep., COSMO – Consortium for Small-Scale Modelling, https://doi.org/10.5676/DWD_pub/nwv/cosmo-doc_5.00_II, 2013. a
Dosio, A. and Panitz, H. J.: Climate change projections for CORDEX-Africa with COSMO-CLM regional climate model and differences with the driving global climate models, Clim. Dynam., 46, 1599–1625, https://doi.org/10.1007/s00382-015-2664-4, 2016. a, b, c
Dosio, A., Panitz, H. J., Schubert-Frisius, M., and Lüthi, D.: Dynamical downscaling of CMIP5 global circulation models over CORDEX-Africa with COSMO-CLM: evaluation over the present climate and analysis of the added value, Clim. Dynam., 44, 2637–2661, https://doi.org/10.1007/s00382-014-2262-x, 2015. a, b, c, d
Dosio, A., Jones, R. G., Jack, C., Lennard, C., Nikulin, G., and Hewitson, B.: What can we know about future precipitation in Africa? Robustness, significance and added value of projections from a large ensemble of regional climate models, Clim. Dynam., 53, 5833–5858, https://doi.org/10.1007/s00382-019-04900-3, 2019. a
Dosio, A., Turner, A. G., Tamoffo, A. T., Sylla, M. B., Lennard, C., Jones, R. G., Terray, L., Nikulin, G., and Hewitson, B.: A tale of two futures: contrasting scenarios of future precipitation forWest Africa from an ensemble of regional climate models, Environ. Res. Lett., 15, 064007, https://doi.org/10.1088/1748-9326/ab7fde, 2020. a
Drobinski, P., Silva, N. D., Bastin, S., Mailler, S., Muller, C., Ahrens, B., Christensen, O., and Lionello, P.: How much warmer and drier will the Mediterranean region be at the end of the 21st century?, Reg. Environ. Change, 20, 78, https://doi.org/10.1007/s10113-020-01659-w, 2020. a
Evans, J. P., Di Virgilio, G., Hirsch, A. L., Hoffmann, P., Remedio, A. R., Ji, F., Rockel, B., and Coppola, E.: The CORDEX-Australasia ensemble: evaluation and future projections, Clim. Dynam., https://doi.org/10.1007/s00382-020-05459-0, online first, 2020. a
Fan, Y. and van den Dool, H.: A global monthly land surface air temperature analysis for 1948–present, J. Geophys. Res., 113, D01103, https://doi.org/10.1029/2007JD008470, 2008 (data available at: https://psl.noaa.gov/data/gridded/data.ghcncams.html, last access: 12 August 2021). a, b
Feser, F. and von Storch, H.: A Dynamical Downscaling Case Study for Typhoons in Southeast Asia Using a Regional Climate Model, Mon. Weather Rev., 136, 1806–1815, https://doi.org/10.1175/2007MWR2207.1, 2008. a
Fu, C., Wang, S., Xiong, Z., Gutowski, W. J., Lee, D.-K., McGregor, J. L., Sato, Y., Kato, H., Kim, J.-W., and Suh, M.-S.: Regional Climate Model Intercomparison Project for Asia, B. Am. Meteorol. Soc., 86, 257–266, https://doi.org/10.1175/BAMS-86-2-257, 2005. a
Fuhrer, O., Osuna, C., Lapillonne, X., Gysi, T., Cumming, B., Bianco, M., Arteaga, A., and Schulthess, T.: Towards a performance portable, architecture agnostic implementation strategy for weather and climate models, Supercomputing Frontiers and Innovations, 1, available at: https://superfri.org/superfri/article/view/17 (last access: 16 August 2021), 2014. a
Giorgi, F.: Thirty Years of Regional Climate Modeling: Where Are We and Where Are We Going next?, J. Geophys. Res.-Atmos., 124, 5696–5723, https://doi.org/10.1029/2018JD030094, 2019. a, b
Giorgi, F., Jones, C., and Arsar, G. R.: Addressing climate information needs at the regional level: the CORDEX framework, WMO Bulletin, 58, 175–183, 2009. a, b, c, d, e, f, g, h, i
Gutiérrez, C., Somot, S., Nabat, P., Mallet, M., Corre, L., van Meijgaard, E., Perpiñán, O., and Gaertner, M.: Future evolution of surface solar radiation and photovoltaic potential in Europe: investigating the role of aerosols, Environ. Res. Lett, 15, 034035, https://doi.org/10.1088/1748-9326/ab6666, 2020. a
Gutowski Jr., W. J., Giorgi, F., Timbal, B., Frigon, A., Jacob, D., Kang, H.-S., Raghavan, K., Lee, B., Lennard, C., Nikulin, G., O'Rourke, E., Rixen, M., Solman, S., Stephenson, T., and Tangang, F.: WCRP COordinated Regional Downscaling EXperiment (CORDEX): a diagnostic MIP for CMIP6, Geosci. Model Dev., 9, 4087–4095, https://doi.org/10.5194/gmd-9-4087-2016, 2016. a, b, c
Hall, A.: Projecting regional change, Science, 346, 1461–1462, https://doi.org/10.1126/science.aaa0629, 2014. a, b
Hazeleger, W., Wang, X., Severijns, C., Ştefǎnescu, S., Bintanja, R., Sterl, A., Wyser, K., Semmler, T., Yang, S., van den Hurk, B., van Noije, T., van der Linden, E., and van der Wiel, K.: EC-Earth V2.2: Description and validation of a new seamless earth system prediction model, Clim. Dynam., 39, 2611–2629, https://doi.org/10.1007/s00382-011-1228-5, 2012. a, b
Helsen, S., Van Lipzig, N., Demuzere, M., Vanden Broucke, S., Caluwaerts, S., De Cruz, L., De Troch, R., Hamdi, R., Termonia, P., Van Schaeybroeck, B., and Wouters, H.: Consistent scale-dependency of future increases in hourly extreme precipitation in two convection-permitting models, Clim. Dynam., 54, 1267–1280, https://doi.org/10.1007/s00382-019-05056-w, 2019. a
Hentgen, L., Ban, N., Kröner, N., Leutwyler, D., and Schär, C.: Clouds in Convection-Resolving Climate Simulations Over Europe, J. Geophys. Res.-Atmos., 124, 3849–3870, https://doi.org/10.1029/2018JD030150, 2019. a, b, c
Hirsch, A. L., Evans, J. P., Virgilio, G. D., Perkins-Kirkpatrick, S. E., Argüeso, D., Pitman, A. J., and Carouge, C. C.: Amplification of Australian Heatwaves via Local Land-Atmosphere Coupling, J. Geophys. Res.-Atmos., 124, 13625–13647, https://doi.org/10.1029/2019JD030665, 2019. a, b, c, d, e, f, g
Hong, S. and Chang, E.: Spectral nudging sensitivity experiments in a regional climate model, Asia-Pac. J. Atmos. Sci., 48, 345–355, https://doi.org/10.1007/s13143-012-0033-3, 2011. a
Huang, B., Polanski, S., and Cubasch, U.: Assessment of precipitation climatology in an ensemble of CORDEX-East Asia regional climate simulations, Clim. Res., 64, 141–158, https://doi.org/10.3354/cr01302, 2015. a
Imamovic, A., Schlemmer, L., and Schär, C.: Mountain Volume Control on Deep-Convective Rain Amount during Episodes of Weak Synoptic Forcing, J. Atmos. Sci., 76, 605–626, https://doi.org/10.1175/JAS-D-18-0217.1, 2019. a
IPCC: Climate Change 2013: The Physical Science Basis. Contribution of Working Group I to the Fifth Assessment Report of the Intergovernmental Panel on Climate Change, Cambridge University Press, Cambridge, UK and New York, NY, USA, 1535 pp., https://doi.org/10.1017/CBO9781107415324, 2013. a
Iversen, T., Bentsen, M., Bethke, I., Debernard, J. B., Kirkevåg, A., Seland, Ø., Drange, H., Kristjansson, J. E., Medhaug, I., Sand, M., and Seierstad, I. A.: The Norwegian Earth System Model, NorESM1-M – Part 2: Climate response and scenario projections, Geosci. Model Dev., 6, 389–415, https://doi.org/10.5194/gmd-6-389-2013, 2013. a, b
Jacob, D., Teichmann, C., Sobolowski, S., Katragkou, E., Anders, I., Belda, M., Benestad, R., Boberg, F., Buonomo, E., Cardoso, R. M., Casanueva, A., Christensen, O. B., Christensen, J. H., Coppola, E., De Cruz, L., Davin, E. L., Dobler, A., Domínguez, M., Fealy, R., Fernandez, J., Gaertner, M. A., García-Díez, M., Giorgi, F., Gobiet, A., Goergen, K., Gómez-Navarro, J. J., Alemán, J. J. G., Gutiérrez, C., Gutiérrez, J. M., Güttler, I., Haensler, A., Halenka, T., Jerez, S., Jiménez-Guerrero, P., Jones, R. G., Keuler, K., Kjellström, E., Knist, S., Kotlarski, S., Maraun, D., van Meijgaard, E., Mercogliano, P., Montávez, J. P., Navarra, A., Nikulin, G., de Noblet-Ducoudré, N., Panitz, H.-J., Pfeifer, S., Piazza, M., Pichelli, E., Pietikäinen, J.-P., Prein, A. F., Preuschmann, S., Rechid, D., Rockel, B., Romera, R., Sánchez, E., Sieck, K., Soares, P. M. M., Somot, S., Srnec, L., Sørland, S. L., Termonia, P., Truhetz, H., Vautard, R., Warrach-Sagi, K., and Wulfmeyer, V.: Regional climate downscaling over Europe: perspectives from the EURO-CORDEX community, Reg. Environ. Change, 20, 51, https://doi.org/10.1007/s10113-020-01606-9, 2020. a, b
Jury, M. W., Prein, A. F., Truhetz, H., and Gobiet, A.: Evaluation of CMIP5 models in the context of dynamical downscaling over Europe, J. Climate, 28, 5575–5582, https://doi.org/10.1175/JCLI-D-14-00430.1, 2015. a
Kessler, E.: On Distribution and Continuity of Water Sub- stance in Atmospheric Circulations, Meteorological Monographs, vol 10. American Meteorological Society, Boston, MA, USA, https://doi.org/10.1007/978-1-935704-36-2_1, 1969. a
Keuler, K., Radtke, K., Kotlarski, S., and Lüthi, D.: Regional climate change over Europe in COSMO-CLM: Influence of emission scenario and driving global model, Meteorol. Z., 25, 121–136, https://doi.org/10.1127/metz/2016/0662, 2016. a, b, c, d
Kinne, S., Schulz, M., Textor, C., Guibert, S., Balkanski, Y., Bauer, S. E., Berntsen, T., Berglen, T. F., Boucher, O., Chin, M., Collins, W., Dentener, F., Diehl, T., Easter, R., Feichter, J., Fillmore, D., Ghan, S., Ginoux, P., Gong, S., Grini, A., Hendricks, J., Herzog, M., Horowitz, L., Isaksen, I., Iversen, T., Kirkevåg, A., Kloster, S., Koch, D., Kristjansson, J. E., Krol, M., Lauer, A., Lamarque, J. F., Lesins, G., Liu, X., Lohmann, U., Montanaro, V., Myhre, G., Penner, J., Pitari, G., Reddy, S., Seland, O., Stier, P., Takemura, T., and Tie, X.: An AeroCom initial assessment – optical properties in aerosol component modules of global models, Atmos. Chem. Phys., 6, 1815–1834, https://doi.org/10.5194/acp-6-1815-2006, 2006. a
Kjellström, E., Bärring, L., Nikulin, G., Nilsson, C., Persson, G., and Strandberg, G.: Production and use of regional climate model projections – A Swedish perspective on building climate services, Climate Services, 2–3, 15–29, https://doi.org/10.1016/j.cliser.2016.06.004, 2016. a
Klemp, J. B., Dudhia, J., and Hassiotis, A. D.: An Upper Gravity-Wave Absorbing Layer for NWP Applications, Mon. Weather Rev., 136, 3987–4004, https://doi.org/10.1175/2008MWR2596.1, 2008. a, b
Knutti, R.: Should we believe model predictions of future climate change?, Philos. T. R. Soc. A, 366A, 4647–4664, https://doi.org/10.1098/rsta.2008.0169, 2008. a
Konapala, G., Mishra, A. K., Wada, Y., and Mann, M. E.: Climate change will affect global water availability through compounding changes in seasonal precipitation and evaporation, Nat. Commun., 11, 3044, https://doi.org/10.1038/s41467-020-16757-w, 2020. a
Kothe, S., Panitz, H.-J., and Ahrens, B.: Analysis of the radiation budget in regional climate simulations with COSMO-CLM for Africa, Meteorol. Z., 23, 123–141, https://doi.org/10.1127/0941-2948/2014/0527, 2014. a, b
Kotlarski, S., Keuler, K., Christensen, O. B., Colette, A., Déqué, M., Gobiet, A., Goergen, K., Jacob, D., Lüthi, D., van Meijgaard, E., Nikulin, G., Schär, C., Teichmann, C., Vautard, R., Warrach-Sagi, K., and Wulfmeyer, V.: Regional climate modeling on European scales: a joint standard evaluation of the EURO-CORDEX RCM ensemble, Geosci. Model Dev., 7, 1297–1333, https://doi.org/10.5194/gmd-7-1297-2014, 2014. a, b, c, d, e, f, g
Lawrence, P. and Chase, T.: Representing a new MODIS consistent land surface in the community land model (CLM 3.0), J. Geophys. Res., 112, G01023, https://doi.org/10.1029/2006JG000168, 2007. a, b
Lee, D., Park, C., Kim, Y.-H., , and Min, S.-K.: Evaluation of the COSMO-CLM for East Asia Climate simulations: Sensitivity to Spectral Nudging, J. Clim. Res., 11, 69–85, https://doi.org/10.14383/cri.2016.11.1.69, 2016. a, b
Lee, M., Cha, D.-H., Suh, M.-S., Chang, E.-C., Ahn, J.-B., Min, S.-K., and Byun, Y.-H.: Comparison of Tropical Cyclone Activities over the Western North Pacific in CORDEX-East Asia Phase I and II Experiments, J. Climate, 33, 10593–10607, https://doi.org/10.1175/JCLI-D-19-1014.1, 2020. a
Lejeune, Q., Davin, E., Guillod, B., and Seneviratne, S.: Influence of Amazonian deforestation on the future evolution of regional surface fluxes, circulation, surface temperature and precipitation, Clim. Dynam., 44, 2769–2786, https://doi.org/10.1007/s00382-014-2203-8, 2015. a
Leps, N., Brauch, J., and Ahrens, B.: Sensitivity of Limited Area Atmospheric Simulations to Lateral Boundary Conditions in Idealised Experiments, J. Adv. Model. Earth Syst., 11, 2694–2707, https://doi.org/10.1029/2019MS001625, 2019. a, b
Leutwyler, D., Lüthi, D., Ban, N., Fuhrer, O., and Schär, C.: Evaluation of the convection-resolving climate modeling approach on continental scales, J. Geophys. Res., 122, 5237–5258, https://doi.org/10.1002/2016JD026013, 2017. a, b, c
Li, D., von Storch, H., and Geyer, B.: High-resolution wind hindcast over the Bohai Sea and the Yellow Sea in East Asia: Evaluation and wind climatology analysis, J. Geophys. Res.-Atmos., 121, 111–129, https://doi.org/10.1002/2015JD024177, 2016. a
Li, D., Yin, B., Feng, J., Dosio, A., Geyer, B., Qi, J. F., Shi, H., and Xu, Z.: Present climate evaluation and added value analysis of dynamically downscaled simulations of CORDEX-East Asia, J. Appl. Meteorol. Clim., 57, 2317–2341, https://doi.org/10.1175/JAMC-D-18-0008.1, 2018. a, b, c, d, e
Li, D., Feng, J., Xu, Z., Yin, B., Shi, H., and Qi, J.: Statistical Bias Correction for Simulated Wind Speeds Over CORDEX-East Asia, Earth Space Sci., 6, 200–211, https://doi.org/10.1029/2018EA000493, 2019. a
Li, D., Feng, J., Dosio, A., Qi, J., Xu, Z., and Yin, B.: Historical Evaluation and Future Projections of 100-m Wind Energy Potentials Over CORDEX-East Asia, J. Geophys. Res.-Atmos., 125, e2020JD032874, https://doi.org/10.1029/2020JD032874, 2020. a, b
Masson, V., Champeaux, J., Chauvin, F., Meriguet, C., and Lacaze, R.: A global database of land surface parameters at 1-km resolution in meteorological and climate models, J. Climate., 16, 1261–1282, https://doi.org/10.1175/1520-0442-16.9.1261, 2003. a
McSweeney, C. F., Jones, R. G., Lee, R. W., and Rowell, D. P.: Selecting CMIP5 GCMs for downscaling over multiple regions, Clim. Dynam., 44, 3237–3260, https://doi.org/10.1007/s00382-014-2418-8, 2015. a
Moss, R. H., Edmonds, J. A., Hibbard, K. A., Manning, M. R., Rose, S. K., van Vuuren, D. P., Carter, T. R., Emori, S., Kainuma, M., Kram, T., Meehl, G. A., Mitchell, J. F. B., Nakicenovic, N., Riahi, K., Smith, S. J., Stouffer, R. J., Thomson, A. M., Weyant, J. P., and Wilbanks, T. J.: The next generation of scenarios for climate change research and assessment, Nature, 463, 747–756, https://doi.org/10.1038/nature08823, 2010. a, b, c
Niang, I., Ruppel, O., Abdrabo, M., Essel, A., Lennard, C., Padgham, J., and Urquhart, P.: Africa. In: Climate Change 2014: Impacts, Adaptation, and Vulnerability. Part B: Regional Aspects. Contribution of Working Group II to the Fifth Assessment Report of the Intergovernmental Panel on Climate Change, edited by: Barros, V. R., Field, C. B., Dokken, D. J., Mastrandrea, M. D., Mach, K. J., Bilir, T. E., Chatterjee, M., Ebi, K. L., Estrada, Y. O., Genova, R. C., Girma, B., Kissel, E. S., Levy, A. N., MacCracken, S., Mastrandrea, P. R., and White, L. L., Cambridge University Press, Cambridge, UK and New York, NY, USA, 1199–1265, available at: https://www.ipcc.ch/site/assets/uploads/2018/02/WGIIAR5-PartB_FINAL.pdf (last access: 16 August 2021), 2014. a
Nikulin, G., Jones, C., Giorgi, F., Asrar, G., Büchner, M., Cerezo-Mota, R., Christensen, O. B., Déqué, M., Fernandez, J., Hänsler, A., van Meijgaard, E., Samuelsson, P., Sylla, M. B., and Sushama, L.: Precipitation Climatology in an Ensemble of CORDEX-Africa Regional Climate Simulations, J. Climate, 25, 6057–6078, https://doi.org/10.1175/JCLI-D-11-00375.1, 2012. a
Obermann, A., Bastin, S., Belamari, S., Conte, D., Gaertner, M. A., Li, L., and Ahrens, B.: Mistral and Tramontane wind speed and wind direction patterns in regional climate simulations, Clim. Dynam., 51, 1069–1076, https://doi.org/10.1007/s00382-016-3053-3, 2018. a, b
Oleson, K. W., Niu, G.-Y., Yang, Z.-L., Lawrence, D. M., Thornton, P. E., Lawrence, P. J., Söckli, R., Dickinson, R. E., Bonan, G. B., Levis, S., Dai, A., and Qian, T.: Improvements to the Community Land Model and their impact on the hydrological cycle, J. Geophys. Res., 113, G01021, https://doi.org/10.1029/2007JG000563, 2008. a
Panitz, H. J., Dosio, A., Büchner, M., Lüthi, D., and Keuler, K.: COSMO-CLM (CCLM) climate simulations over CORDEX-Africa domain: Analysis of the ERA-Interim driven simulations at 0.44∘ and 0.22∘ resolution, Clim. Dynam., 42, 3015–3038, https://doi.org/10.1007/s00382-013-1834-5, 2014. a, b, c, d, e, f, g, h, i, j
Panosetti, D., Schlemmer, L., and Schär, C.: Bulk and structural convergence at convection-resolving scales in real-case simulations of summertime moist convection over land, Q. J. Roy. Meteor. Soc., 145, 1427–1443, https://doi.org/10.1002/qj.3502, 2019. a
Park, C., Min, S.-K., Lee, D., Cha, D.-H., Suh, M.-S., Kang, H.-S., Hong, S.-Y., Lee, D.-K., Baek, H.-J., Boo, K.-O., and Kwon, W.-T.: Evaluation of multiple regional climate models for summer climate extremes over East Asia, Clim. Dynam., 46, 2469–2486, https://doi.org/10.1007/s00382-015-2713-z, 2016. a
Pham, T. V., Steger, C., Rockel, B., Keuler, K., Kirchner, I., Mertens, M., Rieger, D., Zängl, G., and Früh, B.: ICON in Climate Limited-area Mode (ICON release version 2.6.1): a new regional climate model, Geosci. Model Dev., 14, 985–1005, https://doi.org/10.5194/gmd-14-985-2021, 2021. a
Pothapakula, P. K., Primo, C., Sørland, S., and Ahrens, B.: The synergistic impact of ENSO and IOD on Indian summer monsoon rainfall in observations and climate simulations – an information theory perspective, Earth Syst. Dynam., 11, 903–923, https://doi.org/10.5194/esd-11-903-2020, 2020. a, b, c
Prein, A. F., Gobiet, A., Truhetz, H., Keuler, K., Goergen, K., Teichmann, C., Maule, C. F., van Meijgaard, E., Déqué, M., Nikulin, G., Vautard, R., Colette, A., Kjellström, E., and Jacob, D.: Precipitation in the EURO-CORDEX 0.11∘ and 0.44∘ simulations: high resolution, high benefits?, Clim. Dynam., 46, 383–412, https://doi.org/10.1007/s00382-015-2589-y, 2016. a, b, c, d
Rana, A., Nikulin, G., Kjellström, E., Strandberg, G., Kupiainen, M., Hansson, U., and Kolax, M.: Contrasting regional and global climate simulations over South Asia, Clim. Dynam., 54, 2883–2901, https://doi.org/10.1007/s00382-020-05146-0, 2020. a
Raschendorfer, M.: The new turbulence parameterization of LM, COSMO newsletter, 1, 89–97, 2001. a
Rayleigh, J. W. S.: Theory of Sound (two volumes), 2nd edition, Dover Publications, New York, USA, 1945 re-issue, 1877. a
Remedio, A., Teichmann, C., Buntemeyer, L., Sieck, K., Weber, T., Rechid, D., Hoffmann, P., Nam, C., Kotova, L., and Jacob, D.: Evaluation of New CORDEX Simulations Using an Updated Köppen–Trewartha Climate Classification, Atmosphere, 10, 726, https://doi.org/10.3390/atmos10110726, 2019. a
Rineau, F., Malina, R., Beenaerts, N., Arnauts, N., Bardgett, R., Berg, M., Boerema, A., Bruckers, L., Clerinx, J., Davin, E., De Boeck, H., De Dobbelaer, T., Dondini, M., De Laender, F., Ellers, J., Franken, O., Gilbert, L., Gudmundsson, L., Janssens, I., Johnson, D., Lizin, S., Longdoz, B., Meire, P., Meremans, D., Milbau, A., Moretti, M., Nijs, I., Nobel, A., Pop, S., Puetz, T., Reyns, W., Roy, J., Schuetz, J., Seneviratne, S., Smith, P., Solmi, F., Staes, J., Thiery, W., Vanderkelen, I., Van Landuyt, W., Verbruggen, E., Witters, N., Zscheischler, J., and Vangronsveld, J.: Improving the predictive power and interdisciplinarity of climate change experiments, Nat. Clim. Change, 9, 809–816, https://doi.org/10.1038/s41558-019-0609-3, 2019. a, b
Ritter, B. and Geleyn, J. F.: A comprehensive radiation scheme for numerical weather prediction models with potential applications in climate simulations, Mon. Weather Rev., 120, 303–325, https://doi.org/10.1175/1520-0493(1992)120<0303:ACRSFN>2.0.CO;2, 1992. a
Rockel, B. and Geyer, B.: The performance of the regional climate model CLM in different climate regions, based on the example of precipitation, Meteorol. Z., 17, 487–498, https://doi.org/10.1127/0941-2948/2008/0297, 2008. a, b, c
Rockel, B., Will, A., and Hense, A.: The regional climate model COSMO-CLM (CCLM), Meteorol. Z., 17, 347–348, https://doi.org/10.1127/0941-2948/2008/0309, 2008. a, b, c
Rummukainen, M.: Added value in regional climate modeling, WIRES Clim. Change, 7, 145–159, https://doi.org/10.1002/wcc.378, 2016. a, b
Russo, E., Kirchner, I., Pfahl, S., Schaap, M., and Cubasch, U.: Sensitivity studies with the regional climate model COSMO-CLM 5.0 over the CORDEX Central Asia Domain, Geosci. Model Dev., 12, 5229–5249, https://doi.org/10.5194/gmd-12-5229-2019, 2019. a
Russo, E., Sørland, S. L., Kirchner, I., Schaap, M., Raible, C. C., and Cubasch, U.: Exploring the parameter space of the COSMO-CLM v5.0 regional climate model for the Central Asia CORDEX domain, Geosci. Model Dev., 13, 5779–5797, https://doi.org/10.5194/gmd-13-5779-2020, 2020. a, b, c, d
Schär, C., Fuhrer, O., Arteaga, A., Ban, N., Charpilloz, C., Di Girolamo, S., Hentgen, L., Hoefler, T., Lapillonne, X., Leutwyler, D., Osterried, K., Panosetti, D., Rüdisühli, S., Schlemmer, L., Schulthess, T. C., Sprenger, M., Ubbiali, S., and Wernli, H.: Kilometer-Scale Climate Models: Prospects and Challenges, B. Am. Meteorol. Soc., 101, E567–E587, https://doi.org/10.1175/BAMS-D-18-0167.1, 2020. a
Schlemmer, L., Schär, C., Lüthi, D., and Strebel, L.: A Groundwater and Runoff Formulation for Weather and Climate Models, J. Adv. Model. Earth Syst., 10, 1809–1832, https://doi.org/10.1029/2017MS001260, 2018. a, b, c
Schneider, U., Becker, A., Finger, P., Meyer-Christoffer, A., and Ziese, M.: GPCC Full Data Monthly Product Version 2018 at 0.25∘: Monthly Land-Surface Precipitation from Rain-Gauges built on GTS-based and Historical Data, https://doi.org/10.5676/DWD_GPCC/FD_M_V2018_025, 2018 (data available at: https://www.dwd.de/EN/ourservices/gpcc/gpcc.html, last access: 12 August 2021). a, b
Schrodin, R. and Heise, E.: The Multi-Layer Version of the DWD Soil Model TERRA-LM, COSMO Tech. Rep., 2, available at: http://www.cosmo-model.org/content/model/documentation/techReports/cosmo/docs/techReport02.pdf (last access: 16 August 2021), 2001. a, b, c
Schultze, M. and Rockel, B.: Direct and semi-direct effects of aerosol climatologies on long-term climate simulations over Europe, Clim. Dynam., 50, 3331–3354, https://doi.org/10.1007/s00382-017-3808-5, 2018. a, b
Schulz, J.-P. and Vogel, G.: Improving the Processes in the Land Surface Scheme TERRA: Bare Soil Evaporation and Skin Temperature, Atmosphere, 11, 5, https://doi.org/10.3390/atmos11050513, 2020. a, b
Schulz, J.-P., Vogel, G., Becker, C., Kothe, S., Rummel, U., and Ahrens, B.: Evaluation of the ground heat flux simulated by a multi-layer land surface scheme using high-quality observations at grass land and bare soil, Meteorol. Z., 25, 607–620, https://doi.org/10.1127/metz/2016/0537, 2016. a, b, c
Schwingshackl, C., Davin, E. L., Hirschi, M., Sørland, S. L., Wartenburger, R., and Seneviratne, S. I.: Regional climate model projections underestimate future warming due to missing plant physiological CO2 response, Environ. Res. Lett., 14, 114019, https://doi.org/10.1088/1748-9326/ab4949, 2019. a
Shatwell, T., Thiery, W., and Kirillin, G.: Future projections of temperature and mixing regime of European temperate lakes, Hydrol. Earth Syst. Sci., 23, 1533–1551, https://doi.org/10.5194/hess-23-1533-2019, 2019. a
Somot, S., Ruti, P., Ahrens, B., Coppola, E., Jordà, G., Sannino, G., and Solmon, F.: Editorial for the Med-CORDEX special issue, Environ. Res. Lett., 51, 771, https://doi.org/10.1007/s00382-018-4325-x, 2018. a
Sooraj, K. P., Terray, P., and Mujumdar, M.: Global warming and the weakening of the Asian summer monsoon circulation: assessments from the CMIP5 models, Clim. Dynam., 45, 233–252, https://doi.org/10.1007/s00382-014-2257-7, 2015. a
Sørland, S. L., Schär, C., Lüthi, D., and Kjellström, E.: Bias patterns and climate change signals in GCM-RCM model chains, Environ. Res. Lett., 13, 074017, https://doi.org/10.1088/1748-9326/aacc77, 2018. a, b, c, d
Sørland, S. L., Fischer, A. M., Kotlarski, S., Künsch, H. R., Liniger, M. A., Rajczak, J., Schär, C., Spirig, C., Strassmann, K., and Knutti, R.: CH2018 – National climate scenarios for Switzerland: How to construct consistent multi-model projections from ensembles of opportunity, Climate Services, 20, 100196, https://doi.org/10.1016/j.cliser.2020.100196, 2020. a, b, c
Souverijns, N., Gossart, A., Demuzere, M., Lenaerts, J. T. M., Medley, B., Gorodetskaya, I. V., Vanden Broucke, S., and van Lipzig, N. P. M.: A New Regional Climate Model for POLAR-CORDEX: Evaluation of a 30-Year Hindcast with COSMO-CLM2 Over Antarctica, J. Geophys. Res.-Atmos., 124, 1405–1427, https://doi.org/10.1029/2018JD028862, 2019. a
Spinoni, J., Barbosa, P., Bucchignani, E., Cassano, J., Cavazos, T., Christensen, J. H., Christensen, O. B., Coppola, E., Evans, J., Geyer, B., Giorgi, F., Hadjinicolaou, P., Jacob, D., Katzfey, J., Koenigk, T., Laprise, R., Lennard, C. J., Kurnaz, M. L., Li, D., Llopart, M., McCormick, N., Naumann, G., Nikulin, G., Ozturk, T., Panitz, H.-J., Porfirio da Rocha, R., Rockel, B., Solman, S. A., Syktus, J., Tangang, F., Teichmann, C., Vautard, R., Vogt, J. V., Winger, K., Zittis, G., and Dosio, A.: Future Global Meteorological Drought Hot Spots: A Study Based on CORDEX Data, J. Climate, 33, 3635–3661, https://doi.org/10.1175/JCLI-D-19-0084.1, 2020. a
Steger, C. and Bucchignani, E.: Regional Climate Modelling with COSMO-CLM: History and Perspectives, Atmosphere, 11, 1250, https://doi.org/10.3390/atmos11111250, 2020. a
Steppeler, J., Doms, G., Schättler, U., Bitzer, H. W., Gassmann, A., Damrath, U., and Gregoric, G.: Meso-gamma scale forecasts using the non-hydrostatic model LM. Meteorol, Atmos. Phys., 82, 75–96, https://doi.org/10.1007/s00703-001-0592-9, 2003. a, b
Sterl, S., Vanderkelen, I., Chawanda, C., Russo, D., Brecha, R., van Griensven, A., van Lipzig, N., and Thiery, W.: Smart renewable electricity portfolios in West Africa, Nature Sustainability, 3, 710–719, https://doi.org/10.1038/s41893-020-0539-0, 2020. a
Stevens, B., Giorgetta, M., Esch, M., Mauritsen, T., Crueger, T., Rast, S., Salzmann, M., Schmidt, H., Bader, J., Block, K., Brokopf, R., Fast, I., Kinne, S., Kornblueh, L., Lohmann, U., Pincus, R., Reichler, T., and Roeckner, E.: Atmospheric component of the MPI-M earth system model: ECHAM6, J. Adv. Model. Earth Syst., 5, 146–172, https://doi.org/10.1002/jame.20015, 2013. a, b
Sunyer, M., Luchner, J., Onof, C., Madsen, H., and Arnbjerg-Nielsen, K.: Assessing the importance of spatio-temporal RCM resolution when estimating sub-daily extreme precipitation under current and future climate conditions, Int. J. Climatol., 37, 688–705, https://doi.org/10.1002/joc.4733, 2017. a
Takle, E. S., Roads, J., Rockel, B., Gutowski, W. J., J., Arritt, R. W., Meinke, I., Jones, C. G., and Zadra, A.: Transferability Intercomparison: An Opportunity for New Insight on the Global Water Cycle and Energy Budget, B. Am. Meteorol. Soc., 88, 375–384, https://doi.org/10.1175/BAMS-88-3-375, 2007. a, b, c
Tangang, F., Chung, J. X., Juneng, L., Supari, Salimun, E., Ngai, S. T., Jamaluddin, A. F., Mohd, M. S. F., Cruz, F., Narisma, G., Santisirisomboon, J., Ngo-Duc, T., Tan, P. V., Singhruck, P., Gunawan, D., Aldrian, E., Sopaheluwakan, A., Grigory, N., Remedio, A. R. C., Sein, D. V., Hein-Griggs, D., McGregor, J. L., Yang, H., Sasaki, H., and Kumar, P.: Projected future changes in rainfall in Southeast Asia based on CORDEX–SEA multi-model simulations, Clim. Dynam., 55, 1247–1267, https://doi.org/10.1007/s00382-020-05322-2, 2020. a
Tanré, D., Geleyn, J.-F., and Slingo, J.: First results of the introduction of an advanced aerosol-radiation interaction in the ECMWF low resolution global model, in: Aerosols and Their Climatic Effects, edited by: Gerber, H. E., A. Deepak Pub., Hampton, Va., USA, 133–177, 1991. a, b
Taylor, K. E., Stouffer, R., and Meehl, G. A.: An Overview of CMIP5 and the Experiment Design, B. Am. Meteorol. Soc., 93, 485–498, https://doi.org/10.1175/BAMS-D-11-00094.1, 2012. a, b
Taylor, K. E.: Summarizing multiple aspects of model performance in a single diagram, J. Geophys. Res.-Atmos., 106, 7183–7192, https://doi.org/10.1029/2000JD900719, 2001. a
Tegen, I., Hollrig, P., Chin, M., Fung, I., Jacob, D., and Penner, J.: Contribution of different aerosol species to the global aerosol extinction optical thickness: Estimates from model results, J. Geophys. Res., 102, 23895–23915, https://doi.org/10.1029/97JD01864, 1997. a, b, c
Teichmann, C., Jacob, D., Remedio, A. R., Remke, T., Buntemeyer, L., Hoffmann, P., Kriegsmann, A., Lierhammer, L., Bülow, K., Weber, T., Sieck, K., Rechid, D., Langendijk, G. S., Coppola, E., Giorgi, F., Ciarlo, J. M., Raffaele, F., Giuliani, G., Xuejie, G., Sines, T. R., Torres-Alavez, J. A., Das, S., Sante, F. D., Pichelli, E., Glazer, R., Ashfaq, M., Bukovsky, M., and Im, E.-S.: Assessing mean climate change signals in the global CORDEX-CORE ensemble, Clim. Dynam., https://doi.org/10.1007/s00382-020-05494-x, online first, 2020. a
Termonia, P.and Van Schaeybroeck, B., De Cruz, L., De Troch, R., Caluwaerts, S., Giot, O., Hamdi, R., Vannitsem, S., Duchêne, F., Willems, P., Tabari, H., Van Uytven, E., Hosseinzadehtalaei, P., Van Lipzig, N., Wouters, H., Vanden Broucke, S., van Ypersele, J., Marbaix, P., Villanueva-Birriel, C., Fettweis, X., Wyard, C., Scholzen, C., Doutreloup, S., De Ridder, K., Gobin, A., Lauwaet, D., Stavrakou, T., Bauwens, M., Müller, J., Luyten, P., Ponsar, S., Van den Eynde, D., and Pottiaux, E.: The CORDEX.be initiative as a foundation for climate services in Belgium, Climate Services, 11, 49–61, https://doi.org/10.1016/j.cliser.2018.05.001, 2018. a
The HadGEM2 Development Team: G. M. Martin, Bellouin, N., Collins, W. J., Culverwell, I. D., Halloran, P. R., Hardiman, S. C., Hinton, T. J., Jones, C. D., McDonald, R. E., McLaren, A. J., O'Connor, F. M., Roberts, M. J., Rodriguez, J. M., Woodward, S., Best, M. J., Brooks, M. E., Brown, A. R., Butchart, N., Dearden, C., Derbyshire, S. H., Dharssi, I., Doutriaux-Boucher, M., Edwards, J. M., Falloon, P. D., Gedney, N., Gray, L. J., Hewitt, H. T., Hobson, M., Huddleston, M. R., Hughes, J., Ineson, S., Ingram, W. J., James, P. M., Johns, T. C., Johnson, C. E., Jones, A., Jones, C. P., Joshi, M. M., Keen, A. B., Liddicoat, S., Lock, A. P., Maidens, A. V., Manners, J. C., Milton, S. F., Rae, J. G. L., Ridley, J. K., Sellar, A., Senior, C. A., Totterdell, I. J., Verhoef, A., Vidale, P. L., and Wiltshire, A.: The HadGEM2 family of Met Office Unified Model climate configurations, Geosci. Model Dev., 4, 723–757, https://doi.org/10.5194/gmd-4-723-2011, 2011. a, b
Thiery, W., Davin, E., Panitz, H.-J., Demuzere, M., Lhermitte, S., and van Lipzig, N.: The impact of the African Great Lakes on the regional climate, J. Climate, 28, 4061–4085, https://doi.org/10.1175/JCLI-D-14-00565.1, 2015. a, b
Thiery, W., Davin, E. L., Seneviratne, S. I., Bedka, K., Lhermitte, S., and van Lipzig, N. P. M.: Hazardous thunderstorm intensification over Lake Victoria, Nat. Commun., 7, 12786, https://doi.org/10.1038/ncomms12786, 2016. a, b, c, d, e
Tiedtke, M.: A comprehensive mass flux scheme for cumulus parameterization in large-scale models, Mon. Weather Rev., 117, 1779–1800, https://doi.org/10.1175/1520-0493(1989)117<1779:ACMFSF>2.0.CO;2, 1989. a, b, c
Torma, C., Giorgi, F., and Coppola, E.: Added value of regional climate modeling over areas characterized by complex terrain-precipitation over the Alps, J. Geophys. Res., 120, 3957–3972, https://doi.org/10.1002/2014JD022781, 2015. a, b, c
University of East Anglia Climatic Research Unit, Jones, P. D., and Harris, I. C.: Climatic Research Unit (CRU): Time-series (TS) datasets of variations in climate with variations in other phenomena v3, NCAS British Atmospheric Data Centre, available at: http://catalogue.ceda.ac.uk/uuid/3f8944800cc48e1cbc29a5ee12d8542d (last access: 16 August 2021), 2008 (data available at: https://climatedataguide.ucar.edu/climate-data/cru-ts-gridded-precipitation-and-other-meteorological-variables-1901, last access: 12 August 2021). a, b, c
Vanden Broucke, S. and Van Lipzig, N.: Do convection-permitting models improve the representation of the impact of LUC?, Clim. Dynam., 49, 2749–2763, https://doi.org/10.1007/s00382-016-3489-5, 2017. a
Vanden Broucke, S., Luyssaert, S., Davin, E., Janssens, I., and Van Lipzig, N.: New insights in the capability of climate models to simulate the impact of LUC based on temperature decomposition of paired site observations, J. Geophys. Res., 120, 5417–5436, https://doi.org/10.1002/2015JD023095, 2015. a
Vanden Broucke, S., Wouters, H., Demuzere, M., and van Lipzig, N. M.: The influence of convection-permitting regional climate modeling on future projections of extreme precipitation: dependency on topography and timescale, Clim. Dynam., 52, 5303–5324, https://doi.org/10.1007/s00382-018-4454-2, 2018. a
Vanderkelen, I., van Lipzig, N. P. M., and Thiery, W.: Modelling the water balance of Lake Victoria (East Africa) – Part 1: Observational analysis, Hydrol. Earth Syst. Sci., 22, 5509–5525, https://doi.org/10.5194/hess-22-5509-2018, 2018a. a
Vanderkelen, I., van Lipzig, N. P. M., and Thiery, W.: Modelling the water balance of Lake Victoria (East Africa) – Part 2: Future projections, Hydrol. Earth Syst. Sci., 22, 5527–5549, https://doi.org/10.5194/hess-22-5527-2018, 2018b. a
Vanderkelen, I., Zscheischler, J., Gudmundsson, L., Keuler, K., Rineau, F., Beenaerts, N., Vangronsveld, J., and Thiery, W.: A novel method for assessing climate change impacts in ecotron experiments, Int. J. Biometeorol., 64, 1709–1727, https://doi.org/10.1007/s00484-020-01951-8, 2020. a, b
van der Linden, P. and Mitchell, J.: ENSEMBLES: Climate Change and its Impacts: Summary of research and results from the ENSEMBLES project, Tech. rep., available at: http://ensembles-eu.metoffice.com/docs/Ensembles_final_report_Nov09.pdf (last access: 16 August 2021), 2009. a, b
Van de Walle, J., Thiery, W., Brousse, O., Souverijns, N., Demuzere, M., and van Lipzig, N.: A convection-permitting model for the Lake Victoria Basin: Evaluation and insight into the mesoscale versus synoptic atmospheric dynamics, Clim. Dynam., 54, 1779–1799, https://doi.org/10.1007/s00382-019-05088-2, 2019. a
van Vuuren, D. P., Edmonds, J., Kainuma, M., Riahi, K., Thomson, A., Hibbard, K., Hurtt, G. C., Kram, T., Krey, V., Lamarque, J.-F., Masui, T., Meinshausen, M., Nakicenovic, N., Smith, S. J., and Rose, S. K.: The representative concentration pathways: an overview, Climatic Change, 109, 5, https://doi.org/10.1007/s10584-011-0148-z, 2011. a, b
Vautard, R., Gobiet, A., Jacob, D., Belda, M., Colette, A., Déqué, M., Fernández, J., García-Díez, M., Goergen, K., Güttler, I., Halenka, T., Karacostas, T., Katragkou, E., Keuler, K., Kotlarski, S., Mayer, S., van Meijgaard, E., Nikulin, G., Patarčić, M., Scinocca, J., Sobolowski, S., Suklitsch, M., Teichmann, C., Warrach-Sagi, K., Wulfmeyer, V., and Yiou, P.: The simulation of European heat waves from an ensemble of regional climate models within the EURO-CORDEX project, Clim. Dynam., 41, 2555–2575, https://doi.org/10.1007/s00382-013-1714-z, 2013. a
Vautard, R., Kadygrov, N., Iles, C., Boberg, F., Buonomo, E., Buelow, K., Coppola, E., Corre, L., van Meijgaard, E., Nogherotto, R., Sandstad, M., Schwingshakl, C., Somot, S., Aalbers, E. E., Christensen, O., Ciarlo, J., Demory, M.-E., Giorgi, F., Jacob, D., Jones, R. G., Keuler, K., Kjellström, E., Lenderink, G., Levavasseur, G., Nikulin, G., Sillmann, J., Solidoro, C., Sørland, S., Steger, C., Teichmann, C., Warrach-Sagi, K., and Wulfmeyer, V.: Evaluation of the large EURO-CORDEX regional climate model ensemble, J. Geophys. Res.-Atmos., 125, e2019JD032344, https://doi.org/10.1029/2019JD032344, 2020. a, b, c, d, e
Vergara-Temprado, J., Ban, N., Panosetti, D., Schlemmer, L., and Schär, C.: Climate Models Permit Convection at Much Coarser Resolutions Than Previously Considered, J. Climate, 33, 1915–1933, https://doi.org/10.1175/JCLI-D-19-0286.1, 2020. a, b
Voldoire, A., Sanchez-Gomez, E., Salas y Mélia, D., Decharme, B., Cassou, C., Sénési, S., Valcke, S., Beau, I., Alias, A., Chevallier, M., Déqué, M., Deshayes, J., Douville, H., Fernandez, E., Madec, G., Maisonnave, E., Moine, M. P., Planton, S., Saint-Martin, D., Szopa, S., Tyteca, S., Alkama, R., Belamari, S., Braun, A., Coquart, L., and Chauvin, F.: The CNRM-CM5.1 global climate model: Description and basic evaluation, Clim. Dynam., 40, 2091–2121, https://doi.org/10.1007/s00382-011-1259-y, 2013. a, b
Von Salzen, K., Scinocca, J. F., McFarlane, N. A., Li, J., Cole, J. N., Plummer, D., Verseghy, D., Reader, M. C., Ma, X., Lazare, M., and Solheim, L.: The Canadian fourth generation atmospheric global climate model (CanAM4). Part I: Representation of physical processes, Atmos.-Ocean, 51, 104–125, https://doi.org/10.1080/07055900.2012.755610, 2013. a, b
von Storch, H., Langenberg, H., and Feser, F.: A Spectral Nudging Technique for Dynamical Downscaling Purposes, Mon. Weather Rev., 128, 3664–3673, https://doi.org/10.1175/1520-0493(2000)128<3664:ASNTFD>2.0.CO;2, 2000. a
Wang, D., Menz, C., Simon, T., Simmer, C., and Ohlwein, C.: Regional dynamical downscaling with CCLM over East Asia, Meteorol. Atmos. Phys., 121, 39–53, https://doi.org/10.1007/s00703-013-0250-z, 2013. a
Watanabe, S., Hajima, T., Sudo, K., Nagashima, T., Takemura, T., Okajima, H., Nozawa, T., Kawase, H., Abe, M., Yokohata, T., Ise, T., Sato, H., Kato, E., Takata, K., Emori, S., and Kawamiya, M.: MIROC-ESM 2010: model description and basic results of CMIP5-20c3m experiments, Geosci. Model Dev., 4, 845–872, https://doi.org/10.5194/gmd-4-845-2011, 2011. a, b
Wicker, L. J. and Skamarock, W. C.: Time-splitting methods for elastic models using forward time schemes, Mon. Weather Rev., 130, 2088–2097, https://doi.org/10.1175/1520-0493(2002)130<2088:TSMFEM>2.0.CO;2, 2002. a
Will, A., Akhtar, N., Brauch, J., Breil, M., Davin, E., Ho-Hagemann, H. T. M., Maisonnave, E., Thürkow, M., and Weiher, S.: The COSMO-CLM 4.8 regional climate model coupled to regional ocean, land surface and global earth system models using OASIS3-MCT: description and performance, Geosci. Model Dev., 10, 1549–1586, https://doi.org/10.5194/gmd-10-1549-2017, 2017. a, b
Willmott, C. J. and Matsuura, K.: Terrestrial air temperature and precipitation: Monthly and annual time series (1950–1999) Version 1.02, Center for Climatic Research, University of Delaware, Newark, USA, 2001 (data available at: https://psl.noaa.gov/data/gridded/data.UDel_AirT_Precip.html, last access: 12 August 2021). a, b, c
Wouters, H., De Ridder, K., Poelmans, L., Willems, P., Brouwers, J., Hosseinzadehtalaei, P., Tabari, H., Vanden Broucke, S., Van Lipzig, N., and Demuzere, M.: Heat stress increase under climate change twice as large in cities as in rural areas: a study for a densely populated midlatitude maritime region, Geophys. Res. Lett., 44, 8997–9007, https://doi.org/10.1002/2017GL074889, 2017. a
Wu, M., Nikulin, G., Kjellström, E., Belušić, D., Jones, C., and Lindstedt, D.: The impact of regional climate model formulation and resolution on simulated precipitation in Africa, Earth Syst. Dynam., 11, 377–394, https://doi.org/10.5194/esd-11-377-2020, 2020. a, b
Zängl, G., Reinert, D., Rípodas, P., and Baldauf, M.: The ICON (ICOsahedral Non-hydrostatic) modelling framework of DWD and MPI-M: Description of the non-hydrostatic dynamical core, Q. J. R. Meteorol. Soc., 141, 563–579, https://doi.org/10.1002/qj.2378, 2015. a
Zentek, R. and Heinemann, G.: Verification of the regional atmospheric model CCLM v5.0 with conventional data and lidar measurements in Antarctica, Geosci. Model Dev., 13, 1809–1825, https://doi.org/10.5194/gmd-13-1809-2020, 2020. a
Zhou, W., Tang, J., Wang, X., Wang, S., Niu, X., and Wang, Y.: Evaluation of regional climate simulations over the CORDEX-EA-II domain using the COSMO-CLM model, Asia-Pac. J. Atmos. Sci., 52, 107–127, https://doi.org/10.1007/s13143-016-0013-0, 2016. a, b, c