the Creative Commons Attribution 4.0 License.
the Creative Commons Attribution 4.0 License.
 | 12 Aug 2021
iNRACM: incorporating 15N into the Regional Atmospheric Chemistry Mechanism (RACM) for assessing the role photochemistry plays in controlling the isotopic composition of NOx, NOy, and atmospheric nitrate
Huan Fang
Wendell W. Walters
David Mase
Nitrogen oxides, classified as NOx (nitric oxide (NO) + nitrogen dioxide (NO2)) and NOy (NOx+ NO3, N2O5 HNO3, + HNO4+ HONO + Peroxyacetyl nitrate (PAN) + organic nitrates + any oxidized N compound), are important trace gases in the troposphere, which play an important role in the formation of ozone, particulate matter (PM), and secondary organic aerosols (SOA). There remain many uncertainties in the origin and fate of atmospheric N compounds including the understanding of NOy cycling, NOx emission budgets, unresolved issues within the heterogeneous uptake coefficients of N2O5, and the formation of organic nitrates in urban forests, to name a few. A potential tool to resolve some of these uncertainties are using natural abundance N isotopes in NOy compounds. Here we have developed a photochemical mechanism used to simulate tropospheric photochemistry to include 15N compounds and reactions as a means to simulate δ15N values in NOy compounds. The 16 N compounds and 96 reactions involving N used in the Regional Atmospheric Chemistry Mechanism (RACM) were replicated using 15N in a new mechanism called iNRACM. The 192 N reactions in iNRACM were tested to see if isotope effects were relevant with respect to significantly changing the δ15N values (±1 ‰) of NOx, HONO, and/or HNO3. The isotope fractionation factors (α) for relevant reactions were assigned based on recent experimental or calculated values. Each relevant reaction in the iNRACM mechanism was tested individually and in concert in order to assess the controlling reactions. The controlling reactions and their diurnal importance are discussed. A comparison between iNRACM predictions and observed δ15N NO in particulate matter from Tucson, Arizona, suggests the model, and isotope fractionation factors incorporated into it, are accurately capturing the isotope effects occurring during the photochemistry of NOy. The implication is that measurements of δ15N in NOy compounds may be a new way of tracing in situ N chemistry and a means of assessing NOx emission budgets.
- Article
(6102 KB) - Full-text XML
-
Supplement
(1493 KB) - BibTeX
- EndNote


Modeling nitrogen isotope fractionation during the photochemical oxidation of nitrogen oxides into atmospheric nitrate. Incorporation of N isotopes of NOy into the Regional Atmospheric Chemistry Mechanism. Implications for quantifying NOx sources and oxidation pathways using nitrogen isotopes.
Nitrogen oxides are an integral part of atmospheric chemistry, controlling the oxidation state of the troposphere, influencing aerosol formation, altering the pH of rainwater, and facilitating the movement of nitrogen through the N cycle. Nitrogen oxides are classified as NOx (nitric oxide (NO) + nitrogen dioxide (NO2)) and NOy (NOx+ NO3, N2O5 HNO3, + HNO4+ HONO + Peroxyacetyl nitrate (PAN) + organic nitrates + any oxidized N compound) (Day et al., 2003; Hegglin et al., 2006; Ma et al., 2013). NOx produces ozone (O3) through NO2 photolysis, and NOx acts as a catalyst in O3 production when volatile organic compounds (VOCs) are present. In turn, O3 photolysis generates OH radicals, which initiates a radical chain reaction involving HO2 and organic peroxide propagators that results in the oxidation of chemically reduced compounds in the troposphere making them more soluble (Finlayson-Pitts and Pitts, 2000; Seinfeld and Pandis, 1998). Thus, NOx facilitates the cleansing of the atmosphere through the production of O3 and OHx (OH + HO2), which together define the troposphere's oxidation state (Bloss et al., 2005; Lelieveld et al., 2008; Prinn, 2003). These oxidants play an important role in the formation of particulate matter (PM) (Bauer et al., 2007; Pye et al., 2010), forming secondary organic aerosols (SOA) via VOC oxidation (Hoyle et al., 2011; Shrivastava et al., 2017). They also generate secondary inorganic PM through NOx, sulfur oxide (SOx), and ammonia (NH3) neutralization, which leads to ammonium nitrate (NH4NO3) and ammonium sulfate ((NH4)2SO4) production (Cao et al., 2017; Pan et al., 2018; Pusede et al., 2016). The production of PM has important consequences for air quality aerosols (Andreae and Crutzen, 1997), human health (Bruningfann and Kaneene, 1993; Hall et al., 1992), and radiative forcing (Charlson et al., 1992; Chen et al., 2007). Termination reactions in NOy cycling produces HNO3 and facilitates the production of sulfuric acid (H2SO4), two strong acids that decrease the pH of rain, known colloquially as acid rain, and impact aerosol pH, both of which trigger a number of negative impacts on the environment (Brimblecombe et al., 2007; Lajtha and Jones, 2013). When NOy is deposited to the surface by wet and dry deposition, it transfers bioavailable N to ecosystems that may be bereft of, or saturated with, bioavailable N. This process can shift the balance of both terrestrial and aquatic ecosystems and impact the goods and services that those ecosystems can normally deliver (Du et al., 2019; Elliott et al., 2019; Fowler et al., 2013). Thus, understanding NOy sources and their chemistry is important for an array of scientific disciplines and evaluating their social, economic, and cultural impact on the environment.
Despite this importance, there are numerous knowledge gaps in the understanding of the cycling of NOy in the atmosphere. The NOx emission budget is still poorly constrained. Most emission inventories rely on fixed emission factors for some sources that may, in fact, be variable. For example, power plant NOx emissions are based on an assumed efficiency of catalytic converters that may not be accurate (Srivastava et al., 2005; Felix et al., 2012). Soil NO emissions are highly dependent on soils moisture, redox conditions, fertilizer application rates, type, and timing, making them challenging to constrain (Shepherd et al., 1991; Galloway et al., 2004; Hudman et al., 2012; Houlton et al., 2013; Pilegaard, 2013). There are several unresolved issues with the heterogeneous uptake coefficients of N2O5 (Brown et al., 2001, 2006; Chang et al., 2011) and the formation of organic nitrates in urban forests (Lee et al., 2016; Romer et al., 2016; Kastler and Ballschmiter, 1998). The relative importance and mechanism of HONO formation versus HONO emissions are also hotly debated. Likewise, reactions of NOy in the aqueous-phase and mixed aerosols are not fully understood. Chemical transport models (CTMs) do not accurately predict aerosol nitrate concentrations or other NOy mixing ratios (Spak and Holloway, 2009; Zhang et al., 2009). Therefore, it is important that these uncertainties in NOy cycling be resolved if we aim to have accurate air quality forecasting and accurate chemistry–climate models that use CTMs.
It has been suggested that stable N isotopes can provide clues as to the origin of NOx (Elliott et al., 2009; Felix and Elliott, 2014; Walters et al., 2015b) and the oxidation pathways that transform in NOy (Freyer et al., 1993; Walters and Michalski, 2015, 2016). Isotopic measurements of NOy compounds show a wide range of δ15N values (Eq. 1), which has been suggested to indicate variability in NOx emission sources, chemical processing, and/or a combination of these effects. δ15N is defined by the relative difference between the ratio in a NOy compound and the ratio in air N2 (the arbitrary reference compound) and is typically reported in parts per thousand, i.e., per mill (‰).
A number of studies have measured the δ15N values of NOx collected from NOx sources such as power plants (Felix et al., 2012), automobiles (Walters et al., 2015a), biomass burning (Fibiger and Hastings, 2016), and non-road sources (Felix and Elliott, 2014).
Many studies have measured the δ15N values of various NOy compounds collected from the troposphere. Most of the NOy δ15N data are for nitrate that has been collected on filters (PM2.5, PM10, TSP) (Moore, 1977; Savard et al., 2017), as the dissolved NO anion in rain (Heaton, 1987; Hastings et al., 2003; Felix et al., 2015; Yu and Elliott, 2017), or as gas-phase HNO3 (Elliott et al., 2009; Savard et al., 2017). The range of tropospheric NOy δ15N values span −50 ‰ to +15 ‰ but the average is ∼0 ‰. Two hypotheses have been offered to explain these ranges: source and photochemistry. The source hypothesis (Elliott et al., 2007; Hastings et al., 2013) suggests that the tropospheric NOy δ15N value range reflects the spatial and temporal mixing of NOx sources with different δ15N values that is then converted into NOy. The photochemistry hypothesis (Freyer, 1991; Freyer et al., 1993; Walters et al., 2018) suggests that the observed NOy δ15N variations arise via isotope effects occurring when photochemical cycling partitions N into the myriad of NOy compounds. These two hypotheses are not mutually exclusive. Indeed, it is likely to be a combination of both processes, but their relative importance likely shifts depending on environmental conditions such as a region's NOx source diversity, plume versus dispersed chemistry, photolysis intensity, and oxidant load. In turn, the δ15N data might be a new key to reconciling some of the current uncertainties in NOy sources and chemistry, if they can be properly interpreted.
What has become clear is that the temporal–spatial heterogeneity of NOx sources and the complex photochemistry of NOy presents a serious challenge to deciphering the observed NOy δ15N values. Except for a few isolated cases, a proper assessment of NOy δ15N values will require incorporating isotope effects into 3-D chemical transport models. This will include emission modeling of 15NOx, meteorological mixing, factoring in isotope effects during NOy removal processes, and developing chemical mechanisms that incorporate 15N compounds and their relative rate constants. Here we take the first step in this endeavor by developing a chemical mechanism (0-D photochemical box model) that explicitly includes 15NOy compounds and the isotope effects that occur during their cycling through photolysis, equilibrium, and kinetic reactions.
2.1 Chemical and isotopic compounds and reactions included in iNRACM
The iNRACM model incorporates 15N into the Regional Atmospheric Chemistry Mechanism (RACM) detailed in Stockwell et al. (1997). RACM is an extension of the chemical mechanism used in the Regional Acid Deposition Model (RADM2) (Stockwell et al., 1990), but with updated inorganic and organic chemistry. There are 17 stable inorganic compounds, 4 inorganic intermediates, 32 stable organic compounds (including 4 biogenic organics), and 24 organic intermediates in the RACM mechanism. The RACM mechanism uses 237 chemical reactions, including 23 photolysis reactions (Atkinson, 1990; Atkinson et al., 1992). The rate constants, photolysis cross sections, and quantum yields for the inorganic compounds were taken from DeMore et al. (1994). The RACM mechanism aggregates the thousands of VOCs in the atmosphere into 16 anthropogenic and 3 biogenic organic compounds. Part of the aggregation criteria is based on the reactivity of a VOC towards the hydroxyl radical (•OH). Full details on how •OH reacts with alkanes, alkenes, aromatics, and other VOCs, and the aggregation rationale, can be found in Stockwell et al. (1997). The actinic flux model used in RACM was developed by Madronich (1987) and calculates the wavelength-dependent photon flux as a function of solar zenith angle, which is a function of time (hourly), date, latitude, and longitude. Inputs to the model include temperature, water vapor content, pressure, initial gas mixing ratios and primary pollutant emission rates. Complete details on the RACM mechanism can be found in Stockwell et al. (1997).
Our iNRACM (isotope N in RACM) mechanism was generated by adding 15N isotopologues for the 2 primary (NO, NO2) and the 14 secondary N pollutants found in the original RACM mechanism (Table S1a). By definition, an isotopologue is a compound with the same chemical formula but a different mass (e.g., NO = 30 amu and 15NO = 31 amu, with N = 14N). This is different from isotopomers, which are isotopic isomers, compounds with the same mass but a different structure caused by isotopic substitution (e.g., 15NNO5=109 amu and N15NO5=109 amu). Of all the reactive N compounds only N2O5 has multiple possible 15N substitutions, and 2 isotopologues were defined in the iNRACM: 15NNO5 and N15NO5. The 15N compounds are numbered (Table S1a) and subscripted (a, b) in order to maintain a compound numbering scheme that is consistent with that in Stockwell et al. (1997). The non-N compounds found in both RACM and iNRACM mechanisms have been excluded from Table S1a for the sake of brevity but can be found in Stockwell et al. (1997). The 16 15N compounds (Table S1a) were added to the original RACM FORTRAN code provided by Stockwell by using Z=15N (e.g., 15NO is defined as ZO).
The 96 chemical reactions involving N compounds (Table S2a–f) were inspected and replicated for 15N based on classification as the reaction being either “N-only” or “multiple-N” reactions. Single N reactions are those where only one N compound was found in the products and reactants, for example NO + O3 → NO2 + O2. Multiple N reactions could have multiple N compounds in the reactants, the products, or both. Examples of these possible multiple N reactions are NO2 + NO3 → N2O5, N2O5 → NO2 + NO3, and NO3 + NO → NO2 + NO2 respectively. For these multiple N reactions, a reaction probability was factored into the isotopologue/isotopomer rate constants (discussed below). For example, the N isotopologue/isotopomer equivalent of the N2O5 → NO2 + NO3 reaction has two isotopomer reactions: 15NNO5 →15NO2 + NO3 and 15NNO5 → NO2 + 15NO3. These two isotopologue rate constants (R54a, R54b) are multiplied by a factor of to account for this statistical probability. Similar statistical factors were considered when N compounds or intermediates decomposed or reacted to form multiple N products (R52a, R52b, R52c, R52d). All N isotopologue reaction stoichiometry is given in Table S2a–f.
2.2 Isotope effects included in iNRACM
The main challenge for developing realistic isotopologue chemistry in iNRACM is quantifying the differences in rate constants caused by isotopic substitution. These isotope effects can be classified into four general types: Equilibrium isotope effects (EIEs), kinetic isotope effects (KIEs), photo-induced isotope fractionation effects (PHIFEs), and vapor pressure isotope effects (VPIEs). For this study, the most up-to-date isotope fractionations were used when establishing the framework for modeling their effect associated with NOx oxidation chemistry. The established framework will easily enable an adjustment of isotope effects as we improve our understanding of isotope fractionation factors.
Urey (1947) and Bigelesien and Mayer (1947) showed that EIEs are driven by the sensitivity of molecular and condensed-phase vibrational frequencies to isotopic substitutions (Bigeleisen and Mayer, 1947; Urey, 1947). Because vibrations are used in the molecular partition function (Q) to calculate equilibrium constants, isotopic substitution results in isotopologues having different equilibrium constants. Urey (1947) defined the reduced partition function ratio for two isotopologues of the same compound as a β value. For example, the reduced partition function ratio of nitric oxide N isotopologues is , with the heavy isotope placed in the numerator by convention. The ratio of two β values is denoted as , the isotope fractionation factor. For example, is the temperature-dependent isotope fractionation factor (EIE) for NO + 15NO2 15NO + NO2. In this case, at 298 K βNO=1.0669, , and (Walters and Michalski, 2015).
A KIE is the relative change in the rate of a unidirectional chemical reaction when one of the atoms of the reactants is substituted with an isotope (Bigeleisen and Wolfsberg, 1958). KIEs are driven by the change in energy required to proceed over the reaction barrier (transition state) as well as changes in the probability of quantum mechanical tunneling (Wolfsberg et al., 2010). This generally results in a lighter isotopologue reacting faster than a heavier isotopologue. Much of the early research on KIEs were investigations of the KIE in reactions containing hydrogen isotopes and these studies usually defined a KIE = , where the k values are the rate constants for the light and heavy isotopologues. This is the inverse of the definition of α usually used in research dealing with EIE, VPIE, and PHIFE, and this inversion can lead to confusion. In this paper, in order to maintain consistency between the α values for EIE, KIE, VPIE, and PHIFE, α will be defined as heavy or light for all four effects.
The α values for EIE and KIE can be determined using a number of approaches. The α values for EIE can be calculated if molecular constants (e.g., harmonic frequencies and anharmonicity constants) of the isotopologue pair are known. Accurate molecular constants are difficult to accurately measure for large molecules, and as a result, they primarily exist only for diatomic and triatomic isotopologues (Richet et al., 1977). The only experimental EIE values for 15N isotopologues of NOy is for the EIE between NO and NO2 (Sharma et al., 1970; Walters et al., 2016). To determine the EIE in other NOy compounds we must rely on quantum chemistry computation methods to estimate the molecular constants and anharmonicity constants. Recent works utilizing these methods have estimated the EIE for most non-organic NOy compounds (Walters and Michalski, 2015). For KIE, in addition to molecular constants, the transition state vibrational frequencies are also needed. The only 15N KIE calculation to date for an NOy compound is for the KIE for the NO + O3 reaction (Walters and Michalski, 2016).
These EIE and KIE values have been incorporated in iNRACM in this study (Table S2a–c). If there is no isotope effect associated with any of the NOy reactions, then α is set to be equal to 1. The 15N isotopologue rate constant for any reaction is then α14k, where 14k is the rate constant for any 14N reaction in RACM, and these are given in Table S2a–f. It is useful to define the magnitude of EIE and KIE in the same per mill (‰) notation used to quantify a δ15N values by defining an enrichment factor ε (‰) = (α−1)1000. For example, in the NOx isotope exchange equilibrium mentioned above, the ‰. This means that the ratio would be 35.7 ‰ smaller than the ratio if the isotopes in two gases were equilibrated (Table S2b).
PHIFE is the relative change in photolysis rates of isotopologues due to the substitution of a heavier isotope (Yung and Miller, 1997). In the atmospheric N cycle, NO2, NO3, N2O5, and HONO readily undergo photolysis at wavelengths of light that penetrate into the troposphere. The PHIFE can be estimated using a simple zero-point energy shift model (ΔZPE). In this approximation, the absorption spectra of the heavier isotopologue is generated by applying a uniform blue shift (equal to ΔZPE) to the measured spectral absorbance of the light (major) isotopologue (Blake et al., 2003; Liang et al., 2004; Miller and Yung, 2000). This results in isotopic fractionation because the wavelength-dependent (λ-dependent) photolysis rate constant (J(λ)) is dependent on the convolution of the absorption cross section (σ(λ)), actinic flux (F(λ)), and quantum yield (ϕ(λ)) (Eq. 2):
The overall photolysis rate constant (zJ) can be calculated by integrating σ, F, and ϕ over a range of wavelengths that can cause dissociation (λ1 and λ2):
The N isotopologue fractionation (α) resulting from photolysis (of NO2 isotopologues) is calculated by Eq. (4).
It is important to note that there are limitations in the ΔZPE-shift model (Blake et al., 2003; Liang et al., 2004; Miller and Yung, 2000). These include the failure to account for changes in the shape and intensity of absorption spectra upon isotopic substitution, and the same quantum yield (as a function of wavelength) is assumed for all isotopologues. Despite these limitations, this approach should still give a rough estimate of photolytic fractionation until experimentally determined PHIFEs become available (Blake et al., 2003; Liang et al., 2004; Miller and Yung, 2000).
Isotopologues partition differently between phases giving rise to the VPIE. This is most notable in gas–liquid systems (Van Hook et al., 2001) but can also occur in gas–solid equilibrium. Both of these may ultimately be important for understanding δ15N variability in NOy compounds. For example, solid–gas VPIE may be relevant for the HNO3(g)+ NH3(g) NH4NO3(s) reaction, whose temperature-dependent equilibrium can shift dramatically diurnally (Morino et al., 2006) and seasonally (Paulot et al., 2016). It is likely that this VPIE will result in the particle-phase NO having a different δ15N value compared to the gas-phase HNO3 (Heaton, 1987). Additionally, possible VPIE occurring during wet and dry deposition, such as HNO3(g) → HNO3(aq), may be relevant for δ15N variations NO in precipitation (Freyer et al., 1993). Multiphase reactions are not included in RACM since it is only concerned with gas-phase reactions. These effects may be important for accurate δ15N predictions and should be addressed in more complex models, but this is a limitation in any “gas-phase-only” photochemical box model. Similarly, NOy aqueous-phase reactions, such as 2NO2 + H2O → HNO3 + HNO2, are not included in RACM, which may limit iNRACM's ability to accurately predict the δ15N values of dissolved NO in rainfall samples.

Figure 1The time evolution of δ15N values of NO, NO2, HONO, and HNO3, caused by the NO3+ NO → NO2+ NO2 reaction (Reaction R51, 51a). This reaction only induces a δ15N variation of ±0.005 ‰ in the relevant compounds. Thus, this reaction is considered irrelevant and iNRACM sets R51a α=1.0.
2.3 Sensitivity analysis: determining the “reaction relevance” of NOy isotopologues
The objective of the iNRACM model is to make predictions about the temporal and spatial variation of δ15N values in various N compounds caused by EIE, KIE, and PHIFE, and compare them to observations. Currently, the δ15N observations are largely limited to HNO3, as either particulate or dissolved NO, but there are a few recent measurements of the δ15N values of NOx (Walters et al., 2018) and HONO (Chai and Hastings, 2018). The δ15N values of organic nitrates and PAN may be made in the not-so-distant future, but there are no published data to date. Thus, a given isotopologue reaction pair in iNRACM was considered “relevant” if it significantly changed the δ15N value (±1 ‰) of NOx, HONO, or HNO3. This relevance was determined by conducting a sensitivity analysis on the PHIFE, KIE, and EIE effects for all N reactions. This was done by arbitrarily setting α=0.98 ( ‰) for one isotopologue reaction and α=1.0 for all others, then running a test case. This test case is a 5 d simulation, beginning at 03:00 local time (LT) on 1 March 2007, and simulates mid-latitude suburban chemistry using the trace gas and meteorology parameters given in Table S3a and b. This simulation was repeated 96 times until every N-containing reaction was tested. For example, NOx, HONO, or HNO3 δ15N values are not sensitive to Reaction (R51) (Fig. 1). The following section discusses which iNRACM reactions are relevant and the approaches used to determine the appropriate α values for those reactions. These simulations were also used to test whether iNRACM achieves N isotope mass balance via Σ15N/Σ14N, where the sums are the ending abundances of all N compounds. This resulted in δ15N = 0 for all simulations. We also tested whether the addition of 15N isotopologues had any effect on the RACM's predictions of trace gases over time. Plots of mixing ratios of trace gases such as HNO3 and O3 predicted by RACM versus those iNRACM run under the same conditions (see Stockwell's 24 simulation tests) yield a slope of 1 with an R2>0.99, which is expected since the addition of 15N compounds is only about 0.3 % of total NOx and thus should not differ from the RACM predictions.
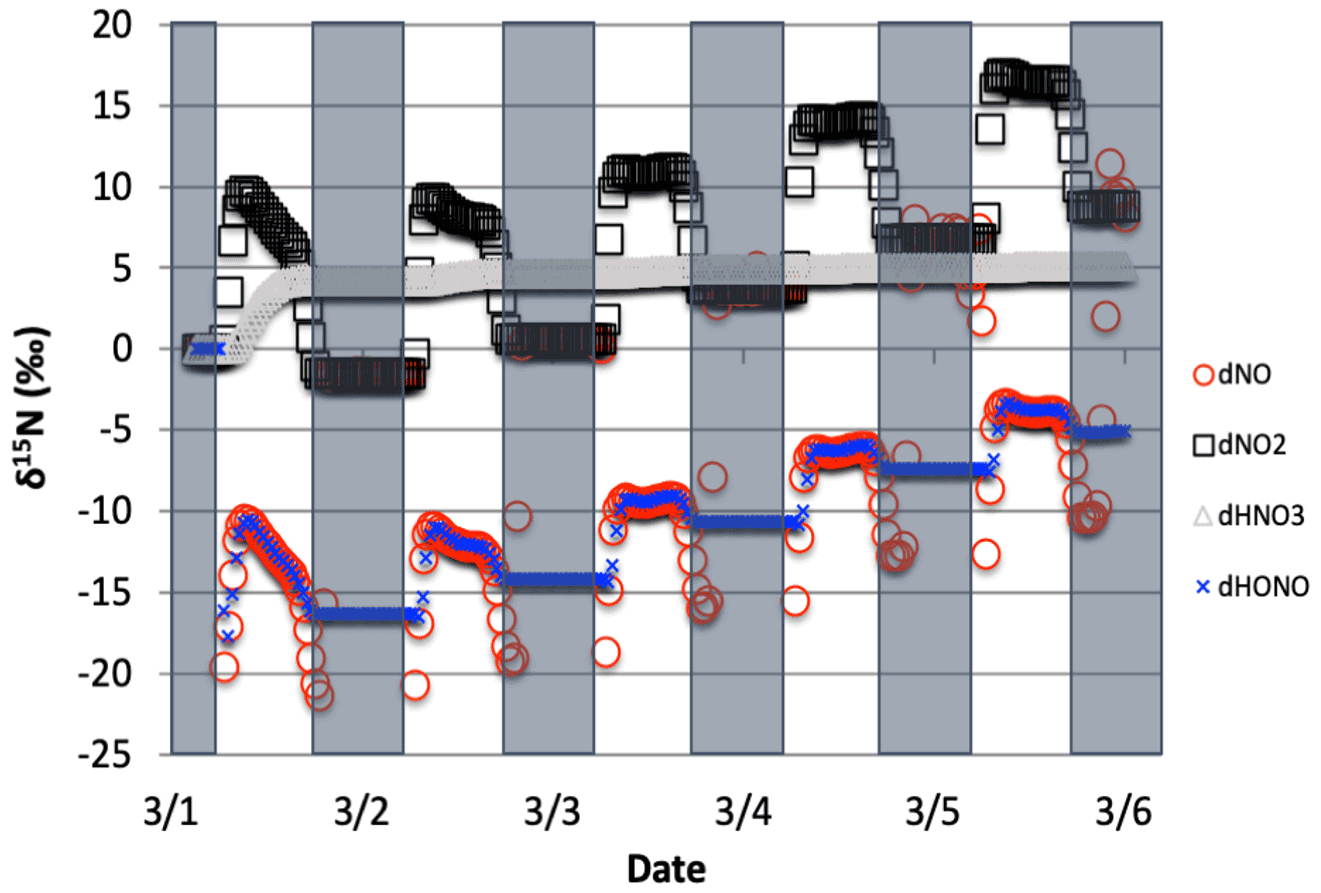
Figure 2The time evolution of δ15N values of NO, NO2, HNO3, and HONO caused by PHIFE during NO2 photolysis.
2.3.1 PHIFE relevant in the iNRACM mechanism
Only 1 of the 6 photolysis reactions involving N compounds was found to be relevant. NO2 photolysis (Reaction R1) had a significant impact on the δ15N value of NOx, HONO, and HNO3 (Fig. 2). The initial difference between the δ15N of NO and NO2 values is roughly equal to the arbitrarily set −20 ‰ enrichment factor. The nature of the diurnal oscillation in δ15N values on the three relevant NOy compounds and the dampening effect over time will be discussed in the results section.
Figure 3The time evolution of δ15N values of NO3, and N2O5 caused by PHIFE during NO3 photolysis.
When there is sufficient photolysis of any single NOy compound, then the δ15N value of that compound tends to significantly change, but often neither the HNO3, HONO, nor NOx δ15N values are affected. For example, the arbitrary α for NO3 photolysis (Reactions R7 and R8) alters the δ15N value of HNO3 and NOx by less than 0.1 ‰ (not shown), but it induces large diurnal changes in the δ15N value of NO3 and N2O5, with sharp transitions occurring during sunrise and sunset (Fig. 3). This is easily understood. For our test case, during the day 15NO3 would be left behind because 14NO3 is preferentially being photolyzed. The daytime N2O5 formed from this NO3 (positive δ15N) and NO2 (δ15N ∼0) thus has a δ15N value halfway between these two reactants (isotope mass balance). However, there is so little NO3 and N2O5 during the day that essentially no HNO3 is being formed through these precursors, and the NO3 PHIFE is not manifested in the NOx or HNO3 δ15N value. During the night, photolysis and the PHIFE ceases and any NO3 and N2O5 formed by NO2 oxidation have δ15N values equal to the NO2.
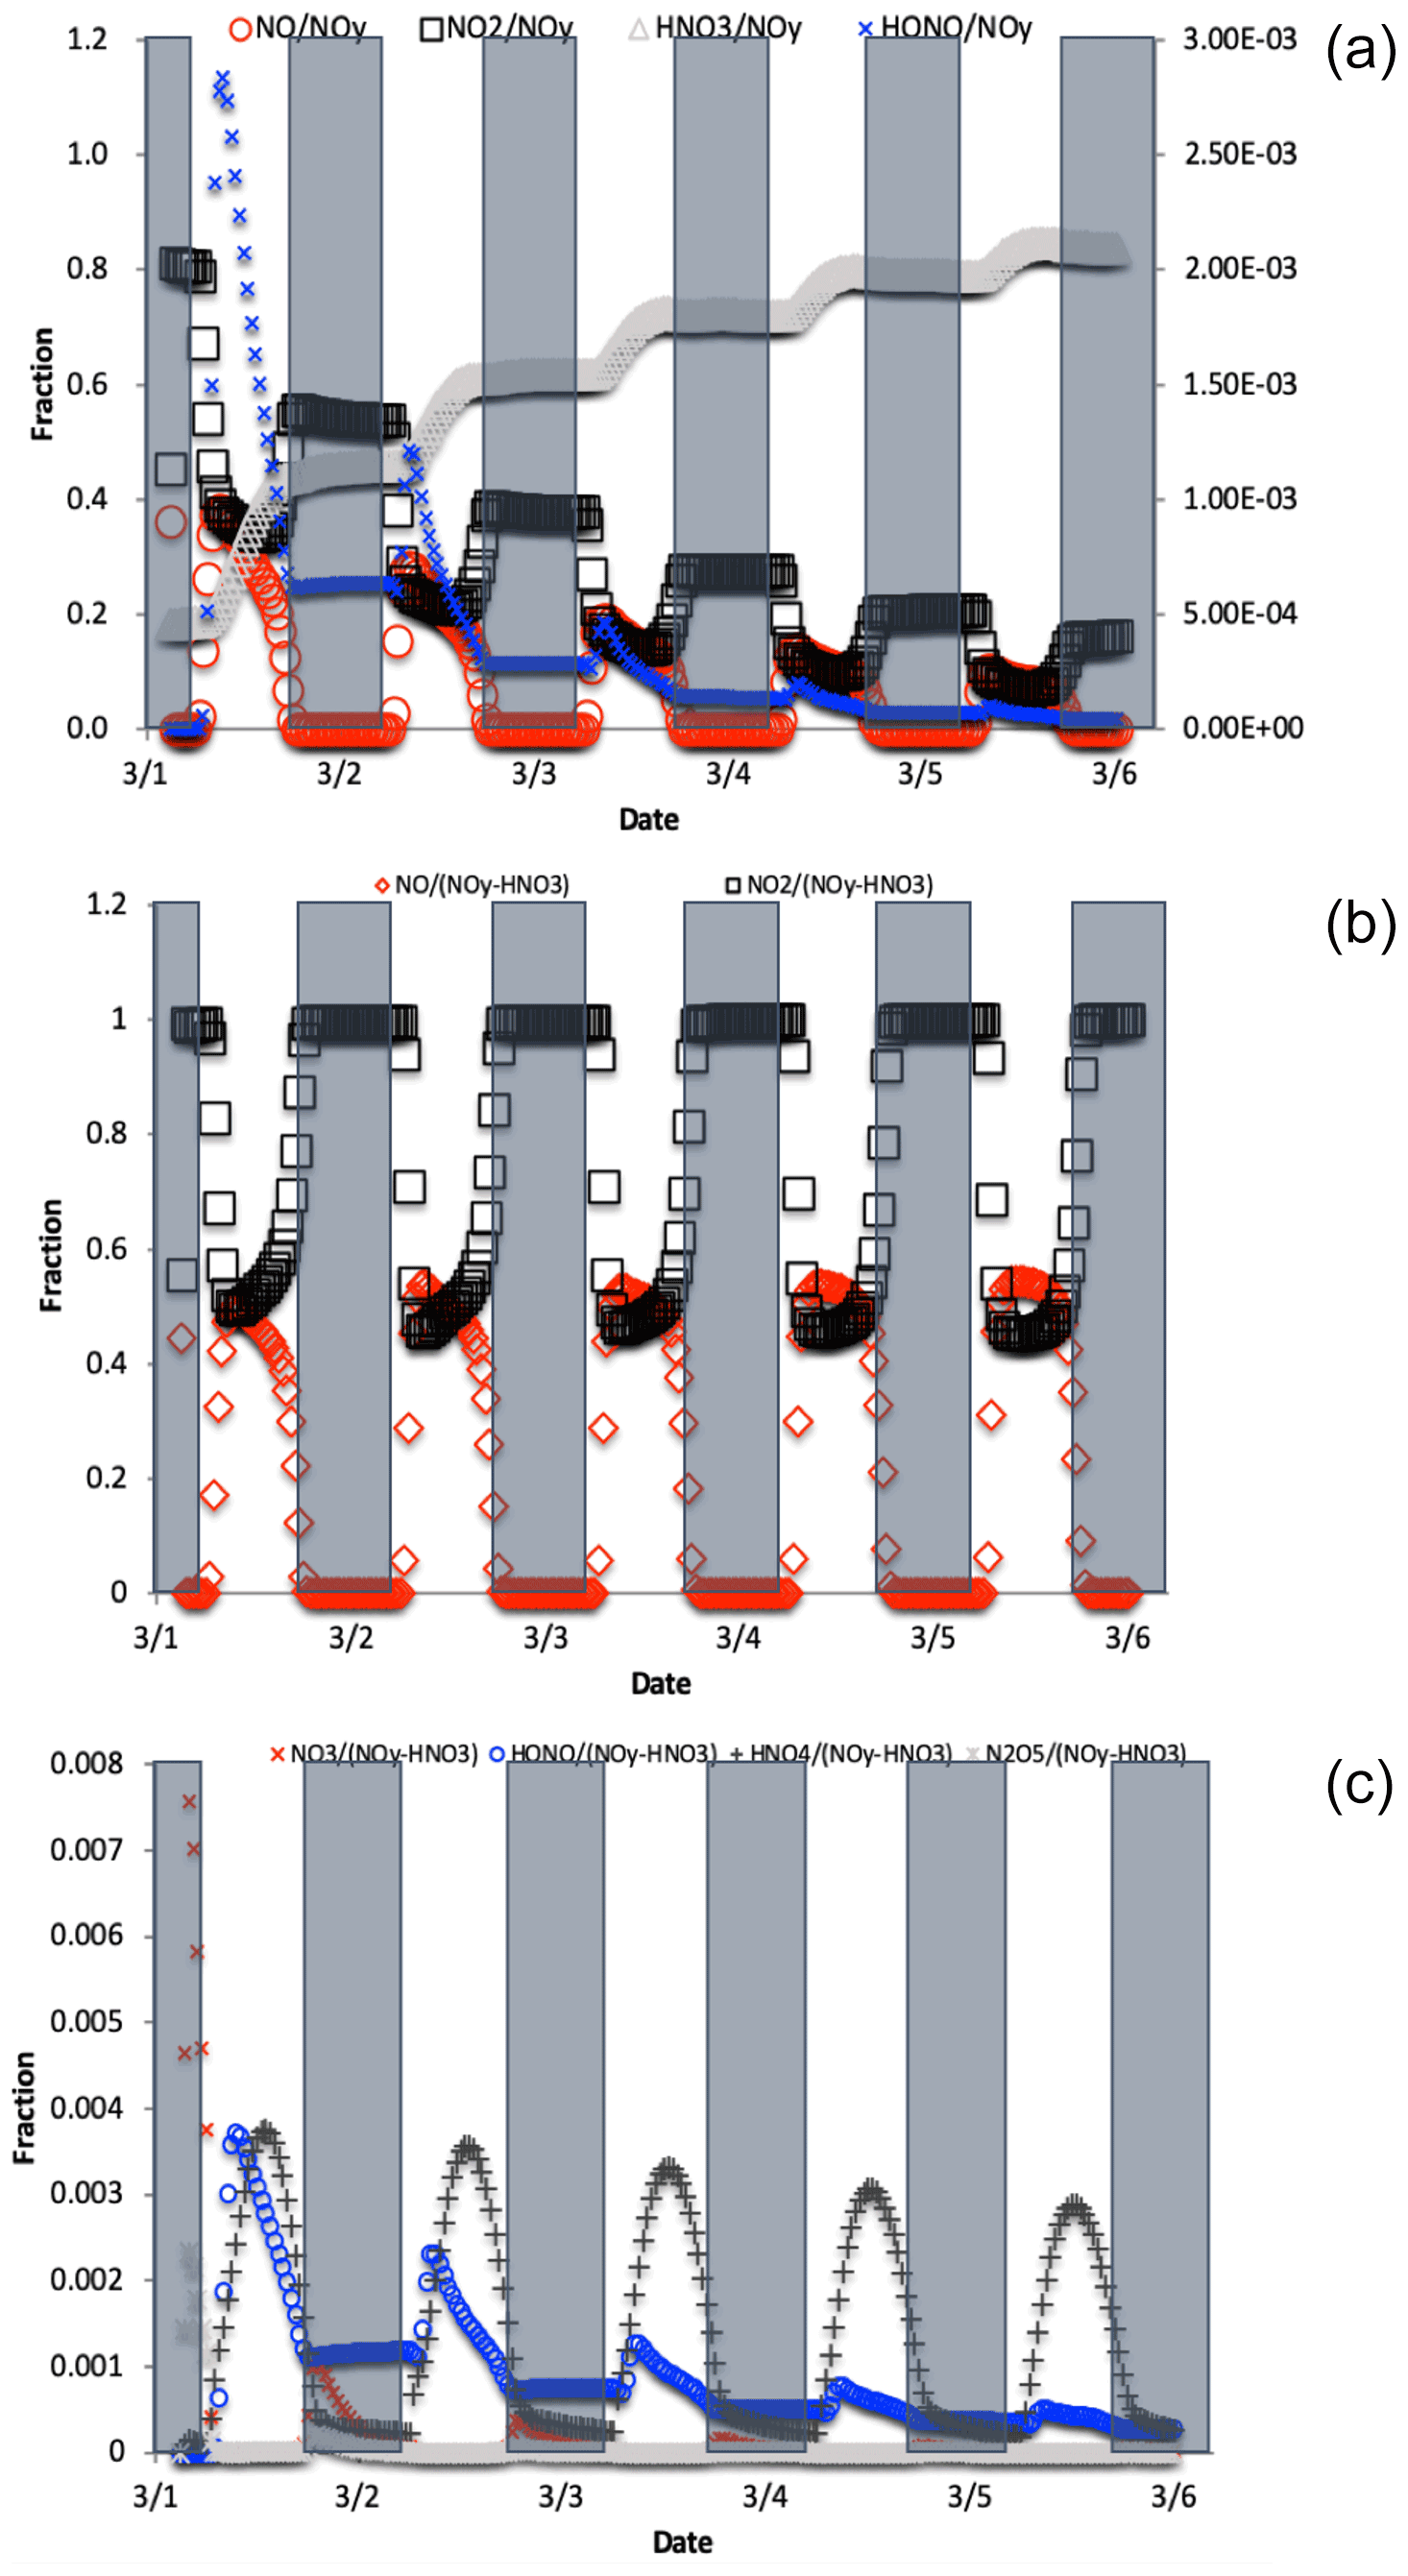
Figure 4The change in fNO, , , and fHONO (right axis) over the 5 d simulation shows the transition from NOy as mostly NOx to predominately HNO3 (a). For reactive NOy (NOy–HNO3) large diurnal changes in fNO and (b) caused by photolysis minimize the other values, none of which exceeds 0.01 (c).
NOx, HONO, and HNO3 are not sensitive to the other NOy photolysis reactions because of this isotope mass balance effect.
where is the mole fraction of any NOyi compound relative to total NOy, δ15N is the δ15N value of that compound, and δ15N is the value of total N, which in these simulations is arbitrarily set to 0 ‰. For an ‰ and a threshold of “importance” set to ±1 ‰, isotope mass balance requires that . Only NO, NO2, HONO, and HNO3 compounds meet this threshold (Fig. 4). All other values are an order of magnitude smaller, the largest being , and it only reaches a maximum value of 0.005. By the end of the second simulation day the has approached 1 and effectively minimizes the other values because it is the only stable N compound, as the other NOy compounds are very photochemically active. If we exclude this buildup in HNO3 from the sum of NOy, then fNO and (and HONO during some hours; see discussion) become the dominant fractions (Fig. 4), and they control the other . Even under this constraint, the only reaches 0.001 (Fig. 4). Thus, in iNRACM, the α values of αR4−αR8 were set to be equal to 1 and only the αR1 was assigned a non-1 value, which was determined using a PHIFE theory (discussed below).
2.3.2 KIE relevant in iNRACM mechanism
The KIE for 12 N-containing compounds and their 96 reactions were evaluated using the same sensitivity analysis. The vast majority of reactions had little influence on the δ15N values of NOx, HONO, and HNO3 (Fig. 1). Similar to the photolysis sensitivity, either reaction proximity or isotope mass balance were controlling δ15N relevance. For example, NO2 + OH is a reaction that directly produces a significant fraction of HNO3 and therefore Reaction (R39) is relevant in the iNRACM mechanism. In contrast, Reaction (R95) produces very little HNO3 so it has a negligible influence on the predicted HNO3 δ15N value. Therefore, the only relevant KIE reactions that have α≠1 in the iNRACM mechanism are Reactions (R39), (R91)–(R97), and (R48) (Table S2b).
2.3.3 EIE relevant in iNRACM mechanism
While some EIEs are naturally handled in the iNRACM mechanism, such as the NO2–NO3–N2O5 equilibrium, other potentially important N isotope exchange reactions are not directly expressed in RACM and must be considered. From a thermodynamic perspective, the EIE for any two N-containing compounds can be calculated. The rate at which these compounds can achieve equilibrium, however, needs careful consideration. For example, the EIE for the isotope exchange reaction NO + 15HNO3 NO + HNO3 has been calculated and measured (Brown and Begun, 1959). Yet, steric considerations would suggest it would be very improbable for a gas-phase reaction pathway or transition state to exist where two O atoms and a hydrogen atom from a HNO3 could quickly migrate to a NO molecule during a collision. The result is that isotope exchange for this gas-phase reaction is likely kinetically too slow to be relevant but is valid in a highly concentrated liquid phase (Brown and Begun, 1959). The larger the N-containing molecule the more difficult it is to envision gas-phase EIE occurring on a timescale comparable to the residence time tropospheric N of about a week. On the other hand, the isotope exchange reaction NO + 15NO2 NO + NO2 rapidly occurs (Sharma et al., 1970) because it can form an ONONO (N2O3) stable intermediate. As such, iNRACM only considers N isotope equilibrium between NO, NO2, NO3, and N2O5. Since the latter three compounds are already chemically equilibrated in RACM, they are by default isotopically equilibrated in iNRACM. Therefore, the only new isotope exchange reaction added to iNRACM was NO + 15NONO + NO2 (Reactions R238, R238a).
2.4 Isotopologue fraction factors (α) used in iNRACM
In this section we discuss the methodology used to determine the values for the relevant PHIFE, KIE, and EIE. These are Reactions (R1), (R39), (R48), (R91)–(R97), and (R238).
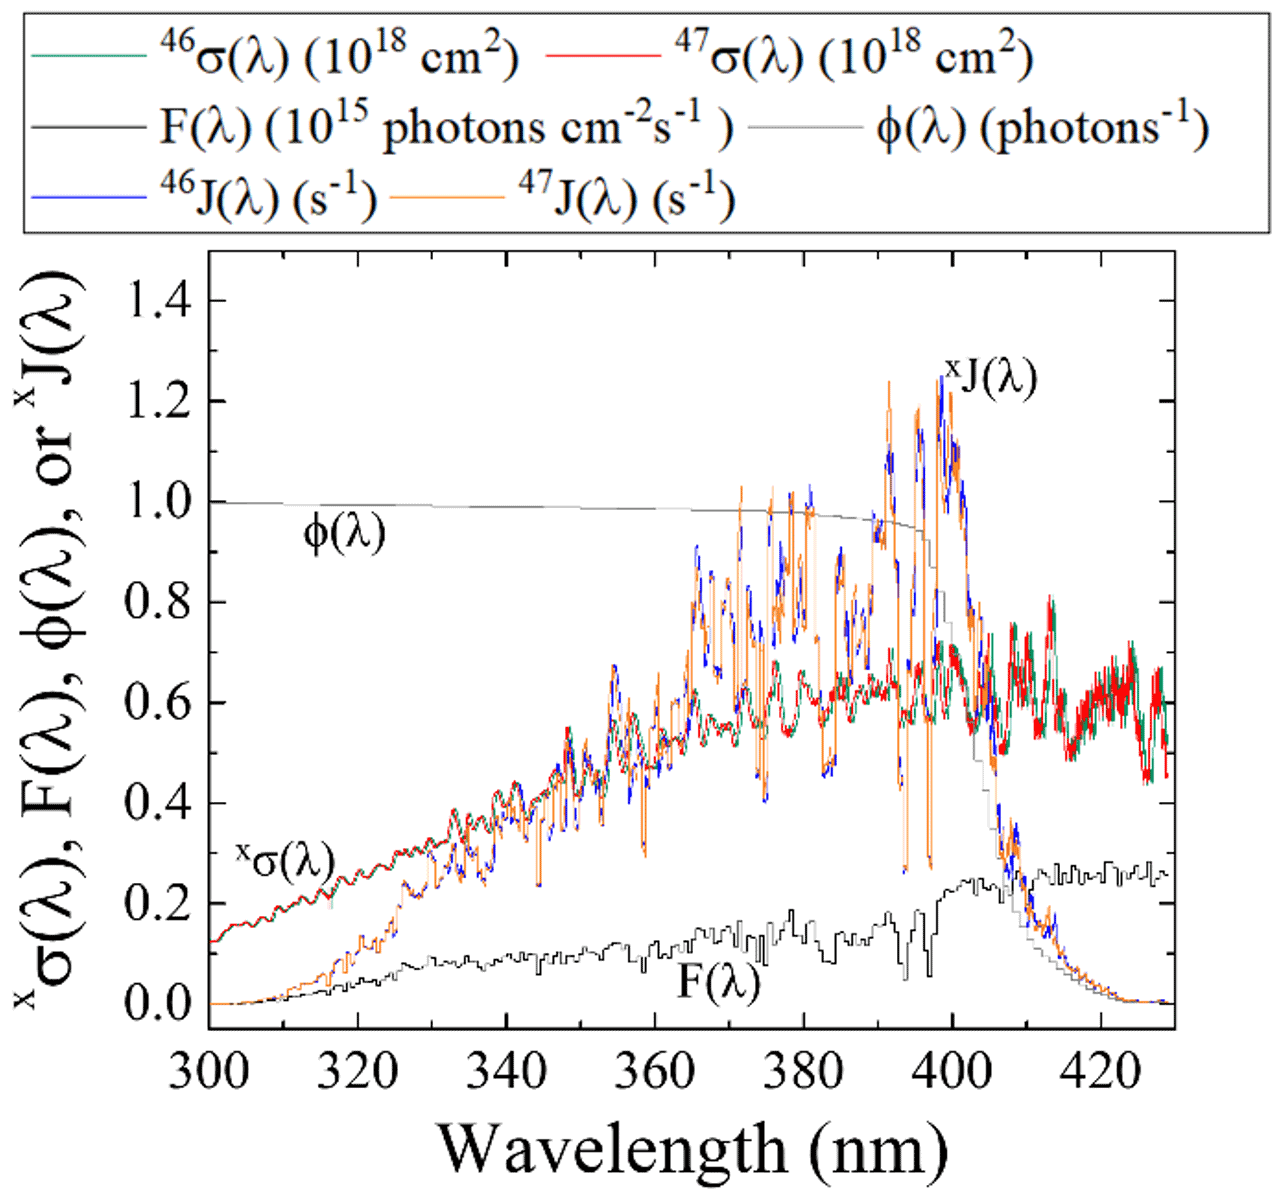
Figure 5Literature-reported 46σ(λ) (Vandaele et al., 2002) F(λ) (at SZA of 60∘; TUV model), and NO2ϕ(λ) (Roehl et al., 1994) and calculated 47σ(λ) derived from the ZPE shift model for wavelengths relevant for tropospheric conditions for NO2 photolysis. From these parameters, both 46J(λ) and 47J(λ) have been calculated (Eq. 2).
2.4.1 PHIFE-derived α used in the iNRACM mechanism
The PHIFE for Reaction (R1) was calculated using an existing NO2 experimental photolysis cross section of 14NO2 for tropospheric relevant wavelengths (300 to 450 nm) (Vandaele et al., 2002). Using the experimentally determined ΔZPE for the 15NO2 isotopologue of 29.79 cm−1 (Michalski et al., 2004), the 47σ(λ) was blue shifted by roughly 0.3 nm from the experimentally measured 46σ(λ) (Vandaele et al., 2002) (Fig. 5). The wavelength-dependent actinic flux, F(λ), was taken from the TUV model (NCAR) for solar zenith angles from 0 to 90∘ in 15∘ increments. The ϕ(λ) values were taken from experimental data at 298 K (Roehl et al., 1994), and it was assumed that there is no significant quantum yield isotope effect. Based on these assumptions the 46J(λ) and 47J(λ) values were calculated (Fig. 5). An important feature of NO2 the wavelength-dependent J includes a peak near 390–400 nm that subsequently decreases at longer wavelengths until NO2 photolysis ceases beyond 420 nm due to a ϕ=0 (Roehl et al., 1994). Overall, the NO2 PHIFE α value was found to be consistent for the wide range of solar zenith angles, ranging between 1.002 and 1.0042 with higher values occurring at lower solar zenith angles. We used an α=1.0042 for daylight hours.
2.4.2 KIE-derived α used in the iNRACM mechanism
KIE for the NO + O3 reaction
The 15α48 for the NO + O3→ NO2 + O2 reaction was determined by ab initio calculations (Walters and Michalski, 2016). Generally, in a normal KIE the heavy 15NO would react with O3 slower than the light 14NO, which is consistent with the calculated effect; however, it is relatively small ( ‰ at 298 K). The 15α48 was determined to have the following temperature-dependent relationship (Walters and Michalski, 2016) over the temperature range of 220 to 320 K (Eq. 6):
KIE for the NO3 + VOC reactions
The most influential reactions that impacted the δ15N of HNO3 were the three reaction pathways that generate HNO3. This is because the isotope effect associated with this last step is largely retained in the product HNO3 because photolysis of HNO3 back into photochemically active compounds that could re-scramble N isotopes is slow, effectively “locking in” these final isotope effects. Two gas-phase reaction groups are important for HNO3 production. Nitric acid is produced mainly by Reaction (R39) during the daytime (Seinfeld and Pandis, 1998) but this reaction is treated as an EIE as discussed below in the EIE section. During the nighttime, when the photolysis sink for NO3 vanishes, NO3 can react with VOCs to form HNO3 via hydrogen abstraction reactions (Atkinson, 2000). Any individual NO3 + VOC reaction had a small “relevance” for the δ15N values of NOx, and HNO3, but given there are 7 such reactions (Reactions R91–R97) their sum may be important.
The KIE for each of the NO3 + VOC → HNO3 reaction (Reactions R91–R97) was determined by assuming collisional frequency was the key KIE factor in such reactions. In these reactions (Reactions R91–R97) NO3 abstracts hydrogen from a hydrocarbon, acting through a transition state involving the oxygen atoms in the nitrate radical C–H–ONO2. Since N is not directly participating in the bond formation it is classified as a secondary KIE (Wolfsberg, 1960). Secondary KIEs are typically much smaller than primary KIEs that occur at bond-breaking and bond-forming positions within a molecule (Wolfsberg, 1960). Therefore, we assumed that the secondary KIE was negligible and did not factor into the α values for these 7 reactions. On the other hand, isotope substitution does change the relative rate of collisions for N isotopologues because of the change in molecular mass. The collisional frequency (Eq. 7) for any of the NO3 + VOC reaction pairs was calculated assuming a hard sphere approximation via
where μ is the reduced mass of either NO3 or 15NO3 and the specific hydrocarbon in a given reaction (Reactions R91–R97). When taking the isotopologue collision ratio, the constants, collision cross section (d2), and temperature cancel out giving a temperature-independent KIE of
The α for each NO3 + VOC reaction (Reactions R91–R97) is calculated using the hydrocarbon mass (Table S1b) and the NO3 isotopologue masses (62, 63 amu) and using Eq. (8).
2.4.3 EIE-derived α used in the iNRACM mechanism
EIE of NO + NO2 exchange
The NO + NO2 exchange was added to iNRACM by defining a forward and reverse reaction (Reactions R238, R238a) and an equilibrium constant . The forward rate constant (k238) was based on the NO-NO2 isotope exchange rate determined by Sharma et al. (1970) (3.6×1014 cm3 s−1 molecule−1). The reverse rate was calculated using . The temperature-dependence of EIE of NO + NO2 exchange (Eq. 9) was calculated using quantum mechanical techniques (Walters and Michalski, 2015) that matched well with recent experimental values (Walters et al., 2016).
EIE used in the NO2+OH reaction
The 15α39 for the NO2 + OH + M → HNO3 reaction (R39) was determined by assuming equilibrium between NO2 and HNO3. The third body and the negative temperature dependence of the rate constant shows that, similar to O3 formation, this reaction is an association reaction (Golden and Smith, 2000). It proceeds through an excited intermediate, *HNO3, that can undergo collisional deactivation by a third body M (Eq. 10).
in which kf and kr are the forward and reverse rate constants for the association step, and kq is the rate constant for collisional quenching and deactivation of the activated complex. We have calculated that is on the order of 5.5 (see SA), and thus the assumption about reactant-complex isotopic equilibrium appears to be valid since only a single decomposition would cause isotopic equilibrium. The HNO3 production rate constant is then kfkd[M]/kr=Keqkd[M]. This general form can be used to write two isotopologue equilibrium constants K:
Since •OH is not participating in the N isotope chemistry, these two EIEs effectively reduce the isotope chemistry to the temperature-dependent 15N EIE:
The fundamental vibration frequencies for HNO3* were taken to be the same as ground-state HNO3, similar to RRKM theory approaches used to calculate the uni-molecular decay rate of HNO3* (Golden and Smith, 2000). The temperature-dependent and values for this exchange were taken from Walters and Michalski (2015). Since the reaction has a negative activation energy and has a fairly rapid rate constant at 101 kPa (1×1011 cm−3 s−1) and the isotope effect due to the collisional deactivation frequency (Eq. 7) is minimal (∼2 ‰) compared to the equilibrium effect (∼40 ‰), the deactivation rate constants kd were set to be equal (). Setting kr14=kr15, and using the equilibrium value, k39a for the 15NO2+ OH → H15NO3 reaction is
The temperature dependence of is derived from the tables in Walters and Michalski (2015) and α39 is then
For typical tropospheric temperatures the suggesting the δ15N of HNO3 produced by the NO2+ OH reaction will be +40 ‰ relative to tropospheric NO2. This α value is larger and opposite the sign of the 15α=0.9971 assumed by Freyer (1991). Freyer's α was approximated by using the reduced mass of the OH–NO2 activated complex. There two problems with this approach. First, the activation complex's reduced mass approximation should be viewed in terms of the decomposition rate constant, not the product formation rate constant as assumed by Freyer, because transition state theory assumes equilibrium between the stable reactants and the transition state (Bigeleisen and Wolfsberg, 1958; Wolfsberg et al., 2010). In other words, Freyer's α=0.9971 should indicate that the 15NO2-OH decomposes more slowly than 14NO2-OH and is therefore more likely to form HNO3 at +2.9 ‰ (not −2.9 ‰ determined in Freyer). Secondly, the reduced mass approximation of the complex pair ignores the thermodynamic contribution of the reactants and the vibrations in the transition state other than the bond forming (imaginary) vibration. Our approach overcomes both of these assumptions and incorporates the temperature dependence of the EIE for this reaction.
EIE used in heterogeneous reactions of N2O5
During the nighttime, the heterogeneous HNO3 formation pathway becomes important (Chang et al., 2011; Dentener and Crutzen, 1993; Riemer et al., 2003). During the night, NO is nearly completely oxidized to NO2 leading to the buildup of the NO3 radical (Reaction R48), the formation of N2O5 (Reaction R53), and heterogeneous N2O5 hydrolysis becomes a major source of HNO3 production (discussed below). This is particularly true in regions that have high NOx mixing ratios and large aerosol surface areas such as urban centers (Chang et al., 2011; Riemer et al., 2003). In order to assess the 15N partitioning of this reaction pathway, both EIE and KIE were considered.
It was assumed that the fractionation factor for the N2O5 → 2HNO3 reaction was mainly controlled by nighttime equilibrium between N2O5 and (Reactions R53, R54). When factoring the isotopologue dynamics, this equilibrium can be viewed as an EIE via
where 15N2O5 is represented as the transition state ON–O–NO2 to highlight the relative ease of N isotope exchange via oxygen migration during N2O5 formation and decomposition. The symmetry of 15NNO5 and N15NO5 is also why they were not treated as isotopomers since they are structurally identical.
The N2O5 equilibrium in the RACM model is dealt with as a forward Reaction (R53) (k53) and a decomposition Reaction (R54) (k54) that are derived from the measured equilibrium constant (K53) = (). In iNRACM the N2O5 isotopologue has two formation pathways, with two forward rate constants (k53 a,b) and two decomposition rate constants (k54a,b) that were used to write their respective equilibrium constants K:
Dividing K53a and K53b by K53 yields isotopologue product and reactant ratios that can be evaluated using β(α) values from Walters and Michalski (2015). These were used to determine the α value for the N2O5 isotopologue equilibrium, which is simply a function of the formation and decomposition rate constants and temperature:
The N2O5 decomposition rate constants were arbitrarily set to be equal (), and the decomposition rate constants were then derived using the temperature-dependent α values:
The α for the doubly substituted 15N2O5 isotopologue was determined using , and the value for (1.272) was approximated using the principle of the geometric mean (Bigeleisen, 1958; Snyder et al., 1999), yielding a temperature-independent α=1.057. However, the N2O5 system is insensitive to this α value because of the low probability of a 15N + 15N reaction () relative to a 14N + 15N reaction (), and thus the small temperature dependence was also ignored.
Because RACM is a gas-phase chemical mechanism, it does not include heterogeneous reactions of N2O5 on aerosols, which would limit iNRACM to accurately predict the δ15N values, particularly at night. Gas chemical mechanisms are often used in larger 1-D, 2-D, and 3-D chemical transport models that usually also include aerosol modules that calculate heterogeneous chemistry using inputs from the gas-phase chemical mechanism (i.e., N2O5 concentrations). However, if the objective is to use a 0-D chemical box model to simulate local chemistry the N2O5 heterogeneous hydrolysis will need to be included. iNRACM was modified to use a first-order rate constant to calculate N2O5 heterogeneous hydrolysis (Yvon et al., 1996; Riemer et al., 2003). The rate constant is a function of N2O5 molecular speed (c), the N2O5 uptake coefficient (γ), and the aerosol surface area density S.
The values were assessed based on the different pollutant loadings and emission scenarios (Fig. 6). The was calculated as a function of γ (Anttila et al., 2006; Bertram and Thornton, 2009; Davis et al., 2008; Riemer et al., 2003, 2009) and S (Cai et al., 2017; Kuang et al., 2010; McMurry et al., 2005) values that span clean to highly polluted environments. This range yielded , 0.1, and 0.01 for high, medium, and low polluted environments (Fig. 6).
Figure 6Contour lines of the same values as a function of γ and S values. The γ values depend on aerosol composition and range from (relatively dry sulfuric acid) to 1 (aqueous aerosol in the winter polar stratosphere). S values are a function of aerosol number density and size distribution and range from 52 (low scavenging rate, low particle growth rate) to 1140.1 (high scavenging rate, high particle growth rate).
Only the uptake coefficient (γ) and molecular speed (c) could have a KIE during aerosol uptake of N2O5 (Reactions R239, R239a, R239b). The γ term was ignored because ab initio work suggests that N2O5 hydrolysis activates through hydrogen bonding between water molecules on the aerosol surface and O atom in the N2O5 (Snyder et al., 1999), making it a secondary (small) KIE for N. The c term is a function of the root of the N2O5 molecular mass, and when the ratio is taken there is no temperature dependence yielding and .
An online version of this iNRACM model is available for public use at https://mygeohub.org/tools/sbox/ (last access: 30 June 2021).
2.4.4 Addition of O3 deposition to iNRACM
Photochemical mechanisms such as RACM are validated by comparing model predictions with observed trace gas concentration evolution in chambers studies, which has its limitations. For example, Stockwell et al. (1997) compared RACM, RADM2, and SPARC mechanisms' ability to predict trace gas concentrations (e.g., O3, NO2, toluene) with those observed in chamber experiments (see Stockwell et al., 1997, Figs. 3–9) and achieve good agreement between the model and experiments. These experiment–model comparisons essentially validate the rate constant assumptions in the chemical mechanism. Box models are, however, limited in their ability to predict real-world concentrations because many do not account for pollutant deposition (dry or wet) since these are handled when the mechanism is incorporated into 1-D, 2-D, and 3-D transport models. Similarly, dilution by of trace gases due to vertical (or horizontal) transport is typically not incorporated into 0-box models. This can lead to the buildup (or depletion) of key oxidants, particularly O3 (see Fig. 6 in Stockwell et al., 1997). This in turn will significantly alter NOx oxidation pathways, and since the δ15N in iNRACM is effectively a function on changing oxidation pathways, this would impact iNRACM ability to accurately predict the observations of δ15N in the real world. In order to eliminate this bias, we added a O3 deposition reaction and adjusted the rate until O3 mixing ratios were in line with typical suburban mixing ratios (20–30 ppb) and exhibited a typical O3 diurnal mixing ratio variation (low nighttime and high midday) that is observed in most environments (Fig. S2). This results in simulated daytime maximum OH concentrations on the order of molecules cm−3 and daytime averages of molecules cm−3 (Fig. S2) that are typical of overserved concentrations in urban and suburban environments (see references in the review by Monks, 2005). This gives us confidence that iNRACM is accurately capturing boundary layer photochemistry and can be used to predict δ15N in NOy compounds.
2.4.5 iNRACM simulations
A number of iNRACM simulations were run with two different purposes. The first set of simulations iteratively changed the α values from 1 to their values discussed above. These simulations aimed at investigating the importance of each α as they aggregated together. These include photolysis only, Leighton cycle, daytime chemistry, nighttime chemistry, and full chemistry using the same test case (Table S3a–f). These were run with all α values activated but with varied initialized chemistry and primary pollutant emissions.
It is important to first test iNRACM by turning on and off individual relevant isotope effects and then combining their cumulative effects. This is advantageous relative to simply running the full mechanism under different pollution scenarios because it would be a challenge to disentangle which isotope effects in the full mechanism were mainly responsible for δ15N change in NOx, HONO, or HNO3 without such a systematic investigation. For example, it is likely that the δ15N value of NO2 will be a significant factor in the δ15N value of HNO3 because it is the reactant in Reactions (R39) and (R239). Thus, understanding which isotope effects control the δ15N of NO2 helps with interpreting the δ15N value of HNO3 and vice versa. Thus, this discussion section is divided into three sections. The first is the examination of the relevant isotope effects occurring during daytime photochemistry and their impact on NOx, HONO, and HNO3 δ15N values. The second is the examination of the relevant isotope effects occurring during nighttime chemistry (EIE and KIE) and their effect on NOx, HONO, and HNO3 δ15N values. These first two discussion sections focus mainly on the relative importance of each isotope effect when the photochemical conditions are constant. Finally, the full iNRACM mechanism will be tested under different atmospheric conditions such as variations in trace gas concentrations, aerosol loading, and hours of sunlight. This tests how changes in photochemical oxidation pathways result in differences in the δ15N values of NOx, HONO, and HNO3.
3.1 The δ15N of NOx, HONO, and HNO3 due to daytime chemistry
The role that daytime chemistry plays in determining the δ15N values of NOx, HONO, and HNO3 was investigated by iteratively adding relevant fractionation factors to iNRACM. The sensitivity of NOx, HONO, and HNO3 δ15N values to NO2 photolysis (Reactions R1a) was tested. The initial trace gas concentrations and emissions were set to the 1 March test cases (Table S3a–f) and simulations were run with, and without, NO emissions. All subsequent test simulations will also use the 1 March test case in order to have a consistent comparison of δ15N values between different simulations. It is noted that the initial HNO3 and O3 mixing ratios are set to zero and that the start time of the simulations is 03:00 LT. The main daytime-only effects will be NO2 photolysis (Reaction R1), O3 oxidation (Reaction R8), and reaction OH (Reaction R39) since both photolysis and OH chemistry are only relevant during the daytime. However, NOx isotope exchange and NO + O3 will also play a vital role despite no being exclusively daytime reactions.
Figure 7The δ15N values of NO, NO2, HONO, and HNO3 with only the photolysis isotope fractionations active. The 5 d simulation was under the conditions list in Table S3a–b. The gray boxes span night hours and the white span daytime. The top (a) is the simulation with NOx emissions and the bottom (b) is without NOx emissions.
3.1.1 The δ15N values of NOx, HONO, and HNO3 due to the photolysis only
The simulations with only R1 isotope effect activated (with NOx emissions) shows a clear diurnal cycle in NOx and HONO δ15N values and a multiday trend moving towards an approximate steady state for HNO3 δ15N values, which can be explained by the PHIFE (Fig. 7a). Initially all NOy has δ15N of zero (by default) and there is no photolysis at 03:00 LT. At sunrise the δ15N value of NO2 goes negative and NO value positive since 15NO2 is preferentially photolyzed (αR1=1.0042). The difference between the δ15N values of NO and NO2 (Δδ15NN NO − δ15N NO2) at all times during the day is 4 ‰, which is the εR1a value. During the night both the NO and NO2 δ15N values approach 0 ‰ because most NO is oxidized to NO2 and NO emissions (0 ‰) dominate the NO nighttime budget (relative to residual day NO). Over the week-long simulation, the NOx δ15N value slowly increases by about one per mill. This is because 15N-depleted NO2 is converted into HNO3 leaving the residual NON enriched. This is also the reason for the δ15N values of HNO3 that initially mimic the daytime NO2 values and trends towards 0 ‰ by the end of the simulation week. The δ15N values of HONO mimic the NO values during the daytime since the main reaction pathway forming HONO is OH + NO, which peaks in the morning (∼10:00). HONO retains the evening δ15N values through the night since most of the HONO is destroyed in the afternoon via photolysis and again follows NO δ15N the next morning as its production again reaches a maximum (Fig. 7a).
The simulation without NO emissions shows a similar behavior but with some clear differences relative to the emission case. The NOx and HONO δ15N values exhibit the same diurnal Δδ15N ‰ value. Unlike the emission case, however, the diurnal NOx δ15N value peaks and troughs trend downward during the week-long simulation, with NO approaching 0 ‰ and NO2 approaching −4 ‰. The HNO3 δ15N values reach a steady-state value of roughly −1.7 ‰ after about a day and NOx is ‰ (Fig. 7b). This difference between the emission and non-emission case is a consequence of isotope mass balance (fx= mole fraction of compound x relative to total NOy).
The positive δ15N NOy compound that effectively offsets the −1.7 ‰ in HNO3 and −1.8 ‰ in NOx is organic nitrate that is +2 ‰ and makes about half the NOy pool and is roughly equal to HNO3+ NOx (, , fONIT=0.53). In the NOx emission case only about 5 % of NOy is as organic nitrate (, , fONIT=0.05), indicating a shift in oxidation pathways when NO and VOCs are emitted during the simulation relative to when they are not. In the emissions case the NOx mixing ratios at the end of the simulation are actually slightly higher than their initial ratios, in contrast to the no-NOx-emission case where 90 % of NOx has been lost via oxidization into organic nitrate and HNO3. This loss of N in the no-emission scenario effectively shuts down the oxidation chemistry. For example, the day 5 mixing ratio of O3 is 45 ppbv (reasonable) for the emission case but only 2 ppbv for the non-emission case (unreasonable). Therefore, we exclude no-emission simulations for the chemistry analysis discussed in this section and restrict them to the no emission simulations to 48 h in the final test case analysis (see Sect. 4).
Figure 8The δ15N values of NOx, HONO, and HNO3 when isotope effects associated Reactions (R1) and (R48) are combined, with NOx emission. The 5 d simulation was under the conditions list in Table S3a and b. The diurnal patterns are reflecting the relative importance of photolysis and O3 chemistry during the day and night.
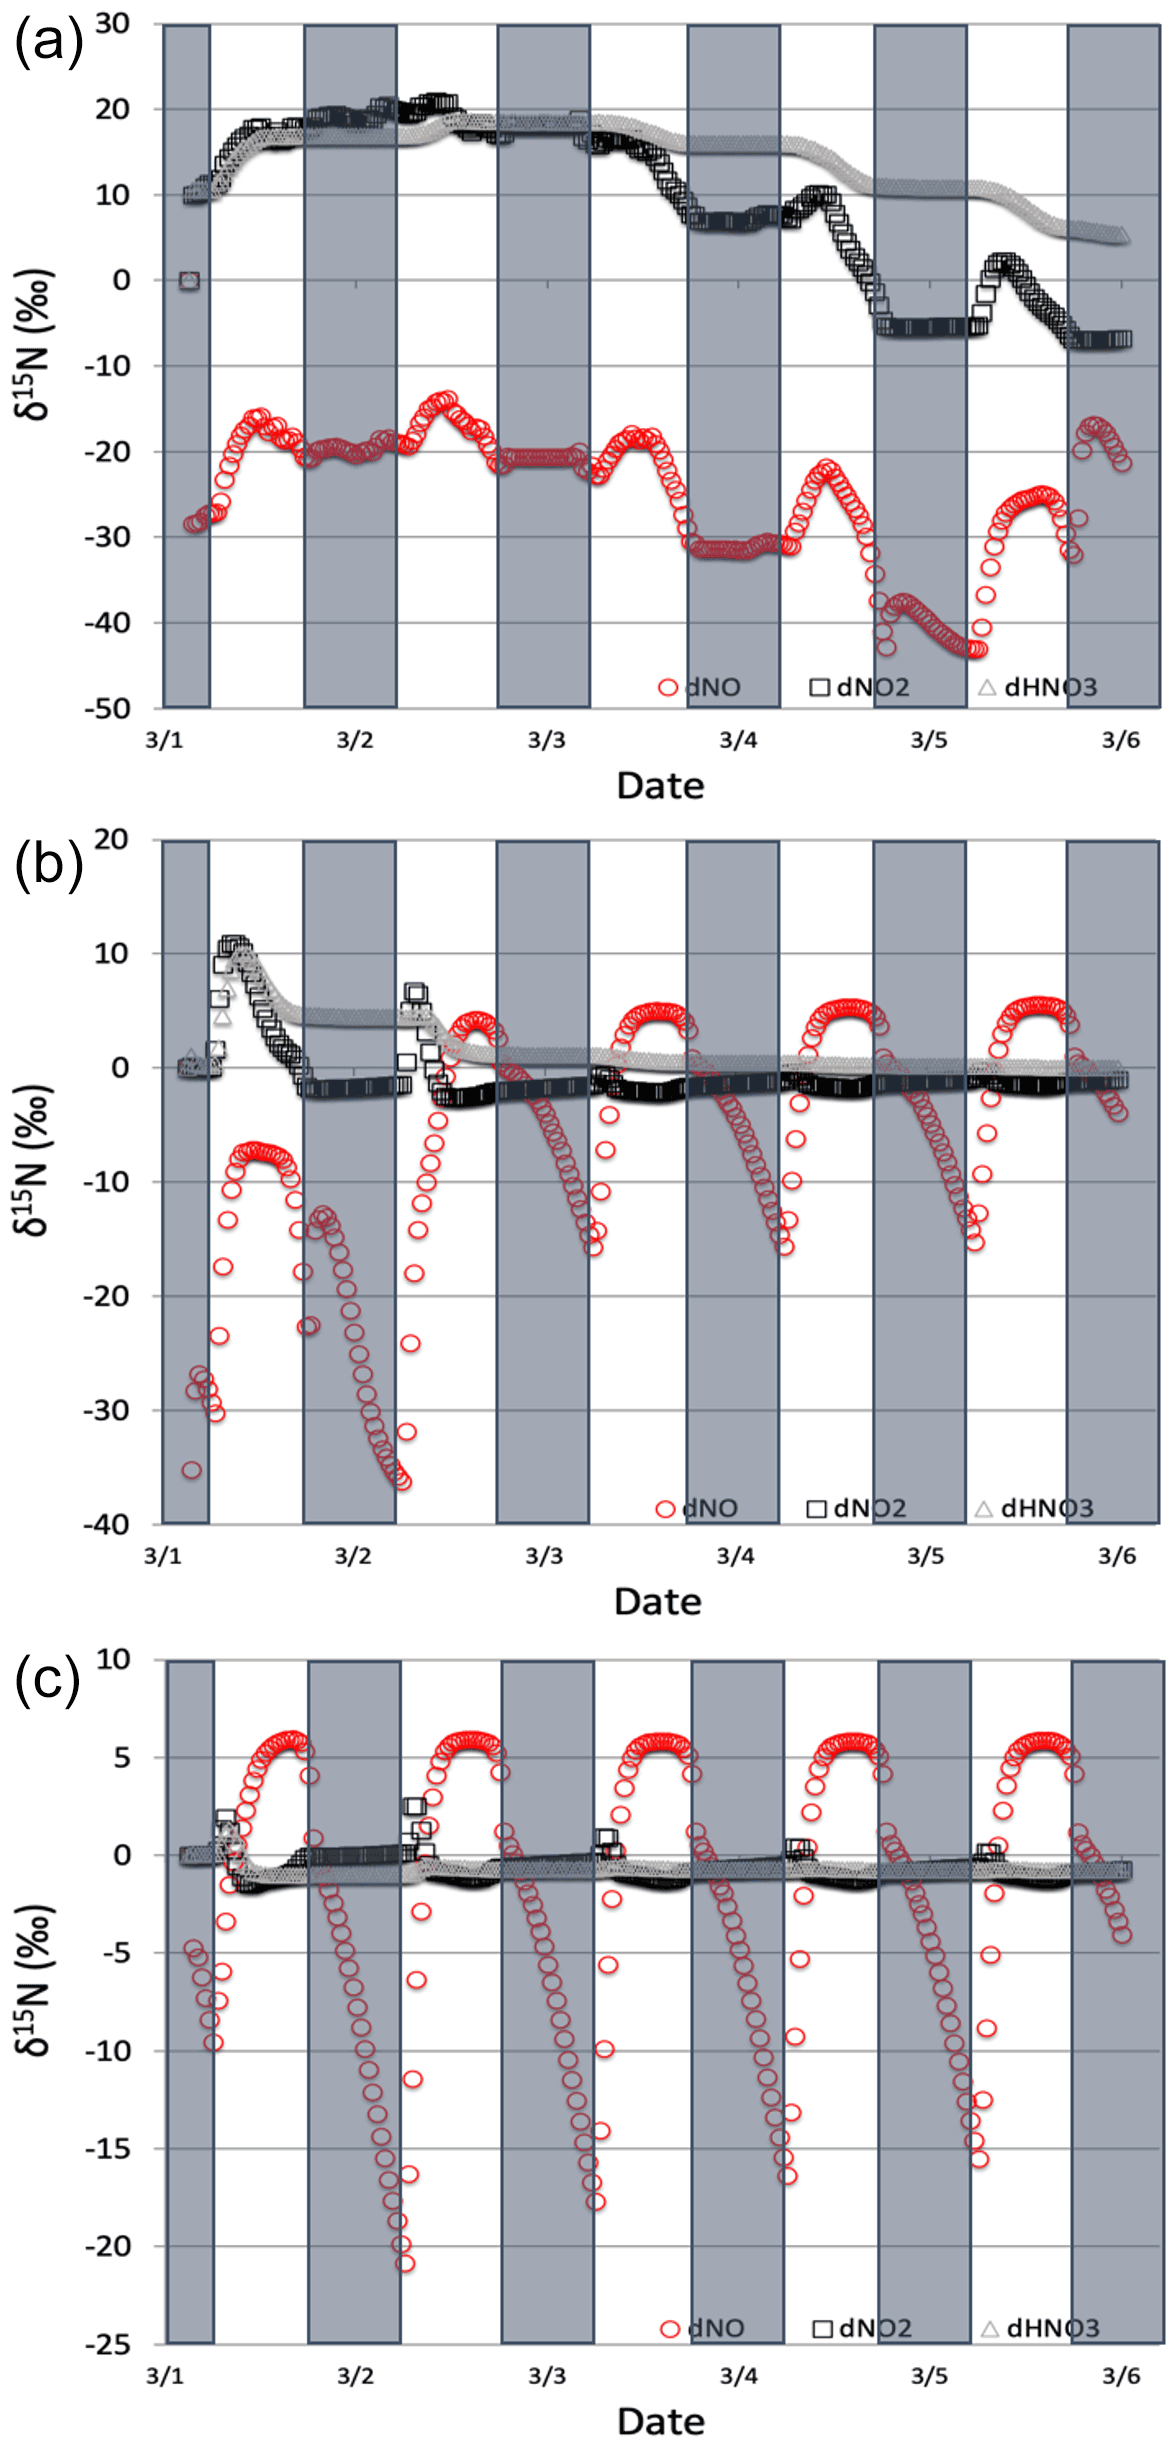
Figure 9The δ15N values of NOx and HNO3 when isotope effects in Reactions (R1), (R48), and (R238) are included under high (a), medium (b), and low (c) NOx scenarios. The 5 d simulation was under the conditions list in Table S3d–f. The NOy δ15N values are mainly controlled by NOx isotope exchange (Reactions R238) under high NOx conditions and Leighton (Reactions R1 and R58) under low NOx conditions.
3.1.2 The δ15N values of NOx, HONO, and HNO3 due to the combined Leighton cycle
The simulations with both NO2 photolysis (Reaction R1) and O3+ NO (Reaction R48) isotope effects active shows similar diurnal and multiday trends to the photolysis-only simulations; they are just slightly amplified (Fig. 8). The daytime Δδ15N is now ∼9.5 ‰, which is close to the additive of the two isotope effects ( ‰, εR1a=4.2 ‰). This is logical since 15NO is reacting with O3 slower than 14NO, preferentially leaving behind 15NO and thus the higher NO δ15N value. The HNO3 δ15N values reach the mean of the daytime NO2 δ15N values via the NO2+ OH reaction. The slight (1 ‰) upward trends of NOx and HNO3 are due to isotope mass balance as detailed in the photolysis-only case. Similar to the photolysis-only case the δ15N of HONO is mimicking daytime NO δ15N values.
Figure 10The time evolution of δ15N values of NO, NO2, HNO3, and HONO caused by isotope effects of Leighton reactions, NOx isotope exchange, and NO2+ OH reaction, with NO emission. The simulation starts from 1 March. The 5 d simulation was under the conditions list in Table S3c.
3.1.3 The δ15N values of NOx, HONO, and HNO3 due to the combined Leighton cycle and NOx isotope exchange
The δ15N values of NOx produced when both the Leighton cycle and NOx isotope exchange are active exhibit a very dynamic diurnal range that is a function of the NOx mixing ratios. At high NOx mixing ratios (150 ppb, one-third NO, two-thirds NO2, Fig. 9a) the Δδ15N is −40 ‰ at night as expected for NOx isotopic equilibrium ( ‰ at 298 K). During the daytime the Δδ15N shifts −30 ‰ to −35 ‰ as the photolysis and O3 isotope effects begin to influence the Δδ15N. HNO3 δ15N values during the high NOx mixing ratio simulation initially follow the δ15N of NO2 (via NO2+ OH) before approaching 0 ‰, the defined NOx source values.
At low NOx mixing ratios (1.5 ppb, one-third NO, two-thirds NO2, Fig. 9c) the Δδ15N and HNO3 δ15N is very different from the high NOx simulation. The nighttime Δδ15N ranges from −15 ‰ to −20 ‰ and during the daytime it is around +7 ‰, while the HNO3 δ15N values hover around zero throughout the simulation. The difference between the NOy δ15N values in the high and low NOx cases can be explained as a competition between the NOx EIE and the Leighton isotope effect. At high NOx mixing ratios, the NOx EIE achieves equilibrium quickly at night (Δδ15N) because the rate of NOx isotope exchange (Reaction R238) is proportional to its concentration. In contrast, isotope exchange is slow in the low-NOx case and the timescale to reach equilibrium is much longer. Indeed, at the low NOx mixing ratios the nighttime equilibrium only reaches about 40 %–50 % of completion by 06:30. Afterwards sunlight begins to erase the NOx EIE effect until around noon when the δ15N values of NO are mostly due to the Leighton effect and there is only a small contribution from EIE (about 5 %). For the intermediate NOx mixing ratio case (15 ppb, one-third NO, two-thirds NO2, Fig. 9b) the diurnal and week-long NOy δ15N trends fall somewhere in between the high and low NOx simulations.
The changes in δ15N values of HNO3 during the 1 March simulations at differing NOx mixing ratios can be explained in terms of HNO3 production pathways. Over the course of day 1 the δ15N of HNO3 mirrors that of NO2 because of HNO3 produced by NO2+ OH (Reaction R39); thus the product HNO3 δ15N values are similar to those in NO2. This varies depending on the NOx mixing ratio scenario for two reasons. First, as the NOx mixing ratio gets bigger, the closer the NOx gets to achieving the EIE and the bigger the split between NO and NO2 δ15N values (40 ‰ versus 10 ‰ for Leighton + O3). Second, differences in the amount of NOx result in different ratios as the simulations progress. For example, under low NOx mixing ratios the nighttime , which means the δ15N value of NO2 will be close to that of total NOx, which will be close to 0 ‰. At the same time the δ15N value of NO will be close to the fraction of the EIE achieved, which is about 50 % under low NOx conditions, resulting in a NO δ15N of about −15 ‰. These two effects control the δ15N of NO2 and that in turn controls the δ15N value of HNO3. In all scenarios the diurnal cycle repeats itself over the subsequent 4 d and a greater fraction of total NO emitted has been turned into HNO3, so that by the end of the 5 d simulation the HNO3 δ15N values converge towards 0 ‰, the defined value of NOx emissions in the simulations.
The modeled δ15N values of HONO also have a diurnal pattern that can also be traced to diurnal chemistry and isotope mass balance. Similar to the photolysis and photolysis + O3 cases, the HONO δ15N values mirror the oscillation of the NO δ15N values (data not shown). This is a result of HONO production by the NO + OH reaction (Reaction R38). In contrast, the HONO δ15N values at night remain nearly constant despite the fact that the δ15N of NO is changing dramatically. This is because the absence of OH at night halts Reaction (R38) and thus HONO production ceases and the δ15N values are simply the same as the residual daytime HONO reservoir. There is a repeated minimum in HONO δ15N values occurring each morning at 07:00 LT over the subsequent 4 d. This is a result of the fact that, unlike HNO3, HONO is effectively destroyed by photolysis (Reaction R4) and OH (Reaction R45). Thus, HONO does not build up in the model over the 5 d simulation, but rather mixing ratio peaks daily (30 ppb) at around 09:00 LT each day. This is when the HONO production–destruction rate is greatest, and its mixing ratio then deceases to a low of 2 ppt by sunset. Since the nighttime HONO, with δ15N ‰, only contributes about 7 % (f=0.07) of the morning HONO spike, it does not greatly impact the control that NO δ15N has on the HONO δ15N value. This daily isotope effect should be contrasted with the HNO3 δ15N trends with time. Initially HNO3 δ15N values are influenced by NO2 δ15N variations by NO2-OH-HNO3 coupling, similar to the NO-OH-HONO coupling. But since there is no significant photochemical sink of HNO3, the control on HNO3 δ15N values by HNO3 accumulation increases with time, so that by day 5 the diurnal changes in NO2 δ15N have almost no impact on the HNO3 δ15N values (Fig. 9).
3.1.4 The δ15N values of NOx, HONO, and HNO3 due to the combined Leighton cycle, NOx isotope exchange, and NO2 + OH
The effect of the NO2 + OH reaction has on δ15N values of NOx and HNO3 associated was then examined (Table S3c). Since Reaction (R39) is the last step in HNO3 production, the instantaneous δ15N HNO3=δ15N(NO2) + ε39, and thus the δ15N is initially 40 ‰ higher than the NO2 (Fig. 10). This in turn depletes 15N in the residual NO2 leading to more negative δ15N values in NO2 relative to the Leighton + exchange simulations (Fig. 10). These latter two effects are still in play, as is made evident by the diurnal NOx δ15N cycling and Δδ15N. As the 5 d simulation progresses, the HNO3 δ15N value approaches 0 ‰, approaching the δ15N of NO emissions, as expected based on isotope mass balance. We point out that this convergence to the source NOx δ15N value is much slower in this case than the Leighton and exchange cases. This highlights the importance of knowing the correct ε48. If ε39∼0 as suggested by Freyer (1991) then daytime the δ15N HNO3 ≅δ15N NO2, demonstrably lower than the ε39∼40 ‰ case. In the end the average daytime δ15N value of HNO3 for the entire simulation is about 10 ‰ higher than the δ15N of the NOx source (here defined as 0 ‰).
3.2 The δ15N values of NOx, HONO, and HNO3 due to nighttime chemistry
The role that nighttime chemistry plays in determining the δ15N values of NOx, HONO, and HNO3 was investigated by iteratively adding relevant fractionation factors to iRACM. The nighttime chemistry effect was assessed by separating the effects of NO3 radical chemistry and N2O5 heterogeneous hydrolysis. NO3 radical chemistry is only relevant at night because of its short daytime lifetime with respect to photolysis, which keeps its daytime mixing ratios at the sub-pptv levels (Platt et al., 1984). At night NO3 builds up and produces HNO3 (Aldener et al., 2006; Finlayson-Pitts and Pitts, 1997; Horowitz et al., 1998) via reactions with hydrocarbons (Reactions R91–97). The magnitude of this isotope effect was tested by adding NO3 to the isotope fractionation factors for Reactions (R91)–(R97) (see methods) and altering VOC emission rates to simulate clean, moderate, and extreme VOC pollution environments. Likewise, N2O5 only accumulates at night when it begins producing HNO3 on aerosol surfaces (Chang et al., 2011). The magnitude of this isotope effect was tested by adding the N2O5 EIE (see methods) and adding the first-order N2O5 heterogeneous pathway (see Methods) to iNRACM. The first-order rate constant was adjusted to simulate clean, polluted, and extreme pollution environments where aerosol surface area density largely controls the rate constant (Riemer et al., 2003; Chang et al., 2011).
3.2.1 The δ15N values of NOx, HONO, and HNO3 due to NO3+ VOC reactions
The effect on the δ15N values of NOx, HNO3, and HONO associated with the KIE occurring during NO3+ VOC nighttime reactions (Reactions R91–R97) were first examined. Four simulations were run that included the isotope effects (α values in Table S4) of the Leighton cycle (Reactions R1 and R48), NOx isotope exchange (Reaction R238), NO2+ OH production of HNO3 (Reaction R39), and the KIE effects (Reactions R91–R97), as well as NO emissions. The simulation tested first was the March test case (medium VOC ∼360 ppbv). Then, two simulations were run for 1 June (extended sunlight, warm temperatures), one with high initial VOC concentrations and a high VOC emission rate (2 ppbv h−1) and one with a low emission rate of VOCs (0.4 ppbv h−1). The same two initial conditions were used in the 1 January test case to assess if the extended nighttime and cold temperatures significantly affected the NOx of HNO3 δ15N values produced by NO3 radicals. The impact of NO3 reactions on NOy δ15N values was determined by subtracting these simulated δ15N values from those same simulations when only the Leighton cycle, exchange, and OH + NO2 reaction were considered (Sect. 3.1).
Figure 11The difference between the δ15N values of NO2, HONO, and HNO3 when NO3+ VOC → HNO3 reactions are included and excluded (NO was omitted for clarity). The 5 d simulation was under the conditions list in Table S3e. Total VOC mixing ratios during the last day of the 1 March simulation was 550–670 ppb C.
The NO3+ VOC KIE induced a minor diurnal pattern on the δ15N values of NOx and HONO, and a trend for HNO3 for the March test case, but the size of the effect was relatively small (e.g., <0.4 ‰; Fig. 11). At the start of the simulation (03:00 LT) there is no HNO3, and therefore the initial HNO3 is produced via OH production of HNO3 (Reaction R39); δ15N values of HNO3 decreased from 0.35 ‰ to 0.2 ‰ during the night. The pattern is because of increasing the importance of Reactions (R91)–(R97) in HNO3 production at night. The smallness of the effect is because α values are all relatively small, the average δ for the NO3+ VOC is about −4 ‰, and the amount of HNO3 produced via these pathways is relatively small (around 2.6 % of 24 h HNO3). The first source of the HNO3 in the simulation (03:00 to 06:00 LT) is the NO3 + VOC reactions and results in a slight negative δ15N in HNO3 values (−0.01 ‰). This leaves the residual NO 15N enriched that is then photolyzed into NO2 at sunrise and used NO2+ OH → HNO3 production resulting in slight positive δ15N values (+0.35 ‰) (Fig. 11). The range of the diurnal HNO3 δ15N oscillation dampens as the fraction of emitted NO that has been converted to HNO3 has increased over time. The diurnal and multiday values in δ15N of HNO3 did not significantly change during the winter and summer simulations (Fig. 12) run with and without the KIE for Reactions (R91)–(R97), similar to those in Fig. 11. In conclusion, although there is some δ15N effect associated with NO3+ VOC chemistry, it is much smaller than the effects associated with the Leighton cycle, NO2+ OH, and NOx equilibrium.
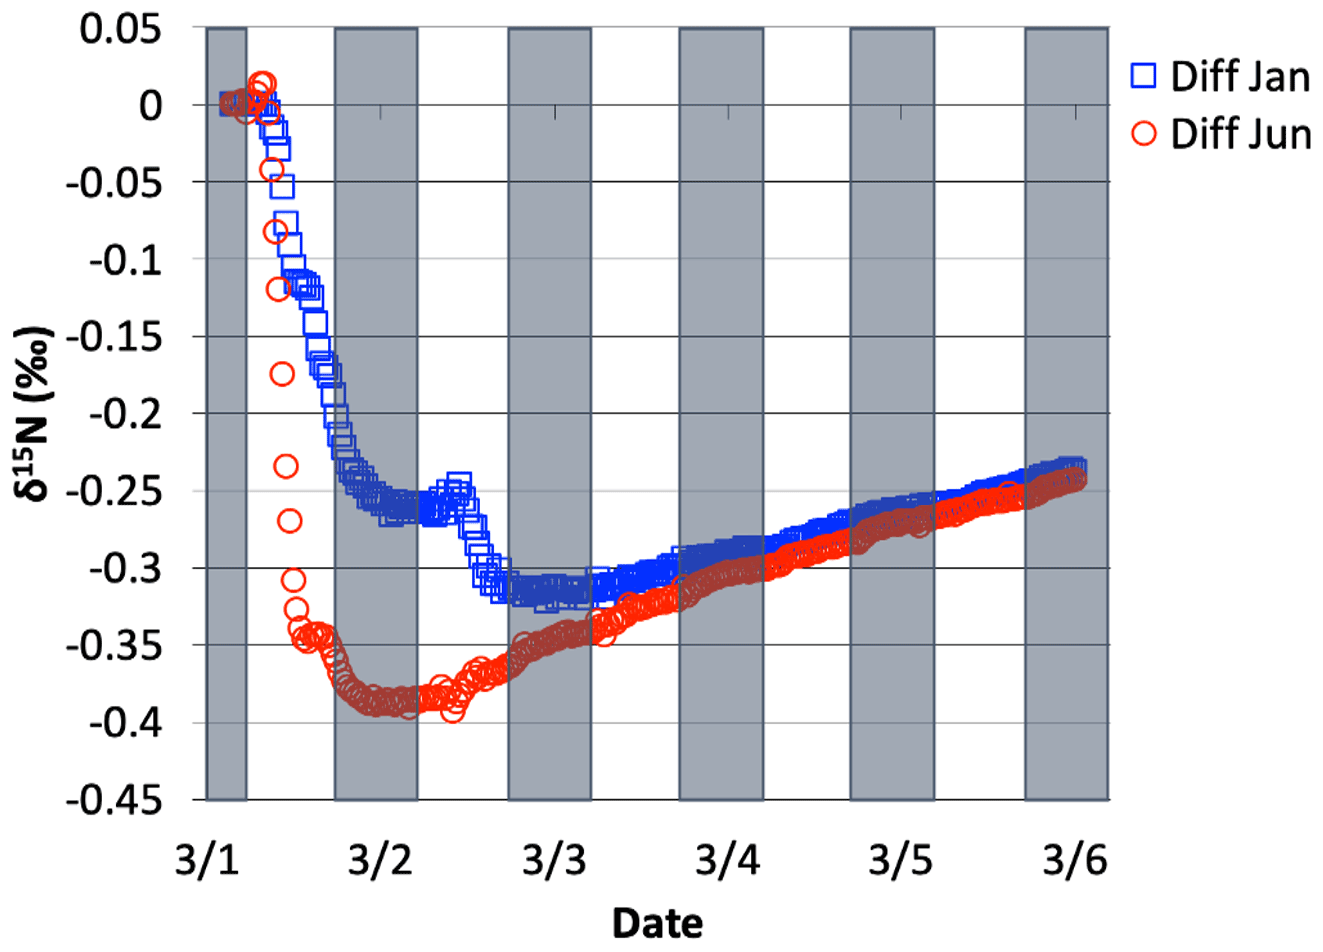
Figure 12The difference in δ15N(HNO3) values when NO3+ VOC → HNO3 reactions are included and excluded, for 1 March simulation, relative to 1 June simulation and 1 Jan simulation. The 5 d simulation was under the conditions list in Table S3e.
3.2.2 The δ15N values of NOx, HONO, and HNO3 due to N2O5 reactions
The effect on the δ15N values of NOx, HNO3, and HONO associated with the EIE of N2O5 heterogeneous hydrolysis was also tested. 1 March simulations with N emissions and s−1 were run that included the isotope effects of the Leighton cycle (Reactions R1 and R48), NOx isotope exchange (Reaction R238), OH production of HNO3 (Reaction R39), and the N2O5 EIE (Reactions R53–R54) KIE (Reaction R239) (Table S5), as well as NO emissions. These simulations were compared to an identical simulation but where the was set to be equal to 1.0. This ensured that the NOy chemistry was not altered when comparing the two simulations (i.e., vs. ). The effect of N2O5 chemistry on the δ15N values of NO2 and HNO3 was investigated. Similar to the 1 March NO3+ VOC tests, simulations with Reactions (R1), (R39), (R48), (R238), and (R239) isotope effects active were run and then compared to simulations with the same conditions but with Reaction (R239) turned off. In addition, March simulations were run using three different values (0.01, 0.1, and 1) and compared to each other in order to test the range of NO2 and HNO3 δ15N values that could be generated solely by heterogeneous N2O5 hydrolysis.
The average daily δ15N values of HNO3 exhibit some diurnal oscillations that roughly reach a steady-state average value after simulation day 2. At that point HNO3 has a δ15N = +2.5 ‰ relative to the simulation. In contrast the NO2 δ15N values oscillate diurnally by about ±2 ‰ around an average daily difference of about −8 ‰. This change is due to the Reactions (R53)–(R54) equilibrium, which predicts 15N enrichment in N2O5 (and thus HNO3) and depletion in NO3 and NO2. The N2O5 produces HNO3 with the highest δ15N difference ( ‰) during the first simulation morning. This is because all of the initial HNO3 is produced by N2O5 due to the 03:00 LT simulation start time. The roughly steady-state HNO3 δ15N value of +2.5 ‰ is a consequence of the fact that when HNO3 is being produced by N2O5 at 0 ‰ and when it is being produced at +29 ‰. The ratio of this simulated +2.5 ‰ value and N2O5 enrichment factor of +29 ‰ yields 0.086, the fraction of HNO3 produced by N2O5. This is similar to the fraction of HNO3 produced in simulations when the N2O5 reaction was active and where it is inactive, which yielded a fraction of 0.064. The difference in these fractions is because deactivating N2O5 chemistry changes overall NOy chemistry and HNO3 production (Dentener and Crutzen, 1993).
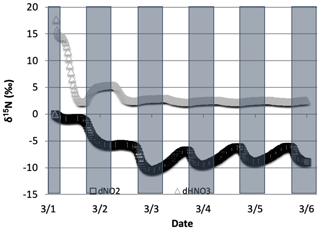
Figure 13The difference in δ15N values of NO2 and HNO3 when the isotopic effect during N2O5 heterogeneous reactions (Reactions R53–R54, R239) is included () and when it is excluded (). The 5 d simulation was under the conditions list in Table S3e.
The effect of N2O5 chemistry on the δ15N values of NO2 is more dynamic than HNO3 (Fig. 13). This is mainly due to the fact that HNO3 is continually building up over time and thus its δ15N is less susceptible to change by small additions. The oscillation in the NO2 δ15N value becomes more negative at night, which corresponds to the increase in the HNO3 δ15N values. This is a reflection of 15N preferentially incorporating into N2O5 resulting in NO2 depleted in 15N. Similar oscillations are found in NO and HONO (data not shown) as they are connected to NO2 buildup and decay diurnally. This suggests that nighttime partitioning of NOy will have a small but measurable influence on daytime NOy δ15N values. The effect of using different values had a small but measurable effect on the NO2 and HNO3 δ15N values. Simulations that used a resulted in HNO3 δ15N values that were about 2 ‰ lower than those run at and 1 ‰ heavier than when (Fig. 14). This makes sense because the mean EIE for N2O5 (29 ‰) is lower than that for NO2+ OH (40 ‰); therefore as N2O5 produces more HNO3 its δ15N value would decrease with respect to that of daytime HNO3 production. Thus, the model predicts lower HNO3 δ15N values in cold, dark polluted regions (relative to the tropics) where N2O5 heterogeneous hydrolysis may be the main HNO3 production pathway (Dentener and Crutzen, 1990).

Figure 14The difference in δ15N(HNO3) values when the isotopic effect during N2O5 heterogeneous reactions is included and when it is excluded, for the simulation of , relative to 0.01 and 1.0. The 5 d simulation was under the conditions list in Table S3e.
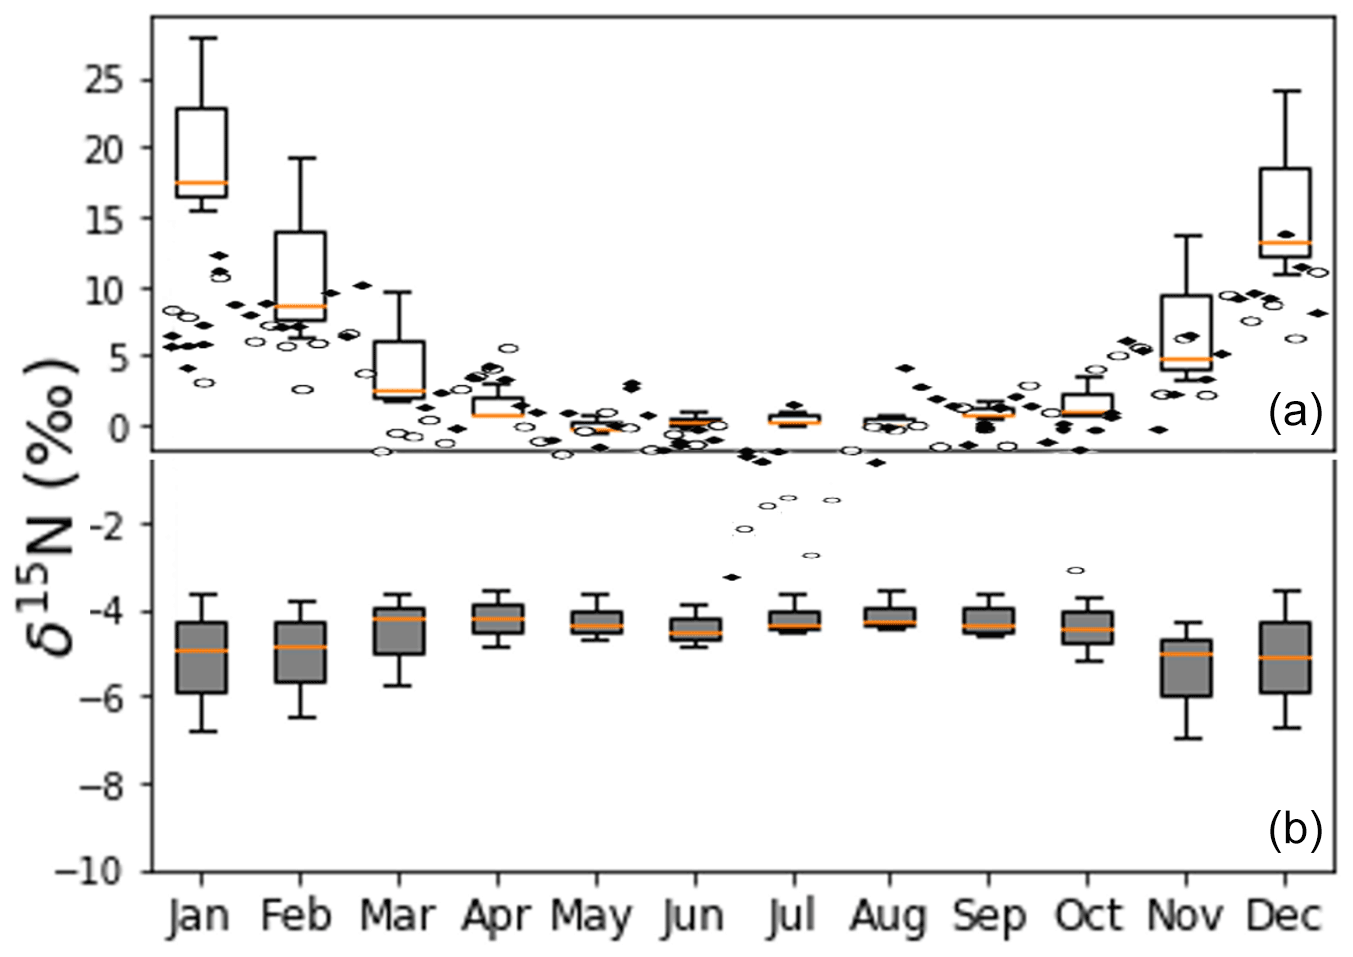
Figure 15Panel (a) shows the observed NO δ15N values of PM in the city of Tucson (Riha, 2013) and box and whisker plots values predicted by iNRACM (1-week simulation, red line: median, box: first and third quantile, whisker is minimum and maximum). Panel (b) shows whisker plots for iNRACM simulations with Reaction (R39) 15α=0.9971 from Freyer (1991).
3.3 Assessing iNRACM's ability to predict in particulate NO
There are a number of challenges when trying to compare the iNRACM model predictions of NOy δ15N values with observations in real world. First, there has yet to be a study where the δ15N values of NO, NO2, and NO have been simultaneously measured. The most abundant data are on the δ15N value of NO in aerosols or rainwater. Even with these studies, a direct comparison is difficult because the δ15N value of the source NOx may be variable in space and time. The δ15N value of NOx sources can range from −40 ‰ to +20 ‰, and both NOx sources and NO deposition will be a strong function of the transport history of the air mass that is sampled. Without a 3-D chemical transport model that includes the iNRACM mechanism, a direct comparison with most NO δ15N studies would be tenuous. In addition, most NOy δ15N studies provide neither trace gas concentrations (NOx, O3, CO, VOC) nor local trace gas emissions that would be required to constrain iNRACM for it to make an accurate prediction of secondary pollutants or δ15N values.
The most complete data set for which to evaluate the iNRACM mechanism is from Riha (2013) in a study in Tucson, AZ, USA. In that study PM2.5 and PM10 were collected weekly (24 h period) for 1 year (2006), and the δ15N value of water soluble NO from was determined (Fig. 15). It contains PM mass and NO δ15N and concentration data, local measurements of the main trace gases (except VOCs) and meteorology (temperature, relative humidity, wind) were available. In addition, detailed local primary pollutant emission inventories have been developed (Diem and Comrie, 2001). Tucson is a city with little industry or power generation, so roughly 80 % of the NOx is due to vehicles and the relative proportion of all NOx sources is invariant throughout the year (Fig. S1). Further, Tucson is surrounded by a desert landscape and by and large not influenced by regional pollution sources outside the city. iNRACM was initialized with observed trace gas concentrations, and NOx and VOC emissions were based on previous work (Riha, 2013). The source NOx δ15N value was set to −3 ‰, typical of vehicle emissions (Walters et al., 2015a) and run for 1 week from the first day of each month. The aerosol surface area used to calculate was based on monthly average PM mass (Fig. S2).
The predicted NO (as HNO3) δ15N values (after 36±12 h) matched remarkably well with the observed δ15N values in PM2.5 and PM10 (Fig. 15). Observed maximums were in the winter months, peaking in January at 15 ‰, close to the model maximum in January of 17 ‰. The minimum δ15N values (−2 ‰) are measured in July, similar to model predictions of 0 ‰ during July. The model captures the seasonal trend quite well, including the spring plateau. This suggests that at this location, the observed seasonal variation in PM NO δ15N values can be explained by isotope effects associated with the photochemical conversion of NOx into HNO3. The wider range in HNO3 δ15N values in the winter months relative to summer months is due to the difference in sunlight and oxidant loads. In winter sunlight hours are at a minimum (8.5 h versus 12.8 in June), and ozone mixing ratios are a factor of 4–5 lower compared to the summer months (Riha, 2013). This results in rapid conversion of NOx into HNO3 in the summer, and the exceeds 0.90 within 2 d whereas it requires 6 d during the winter (Fig. S3). The result is that in the summer HNO3 δ15N values rapidly approach the δ15N of the NOx source, whereas in the winter there is greater diurnal and daily variability until the very end of the simulation. The rapid swings in HNO3 δ15N values are thus a function of the chemical lifetime of NOx and physical lifetime of HNO3 with respect to wet (and dry) deposition. Thus, when the atmosphere is cleansed by regional rainfall, the isotope effects associated with photochemical oxidation will have a greater influence relative to NOx sources, and this is a plausible explanation of rapid changes in the δ15N of rain nitrate over the course of a storm (Rose et al., 2019). Analysis of hourly HNO3 production revealed that ∼80 % of HNO3 is produced in the daytime, mainly by the NO2+ OH reaction, and 20 % is produced during the night (N2O5 heterogenous hydrolysis). The model reproduces O3 and NOx concentrations rather accurately (Fig. S2), but HNO3 concentrations are about 10 times the PM NO concentration. This is not surprising because the 0-D models do not account for HNO3 deposition, its dilution as it mixes into to the top of the boundary layer, or partitioning between aerosol and the gas phase. Indeed, seasonal differences in boundary layer height alone can dilute by a factor of 5 or higher (Riha, 2013).
We have developed the first 0-D photochemical box model for 15N compounds in the tropospheric NOx–NOy cycle. It was shown that of the hundreds of N reactions in the RACM mechanism only a handful significantly impact the δ15N of the main NOy compounds (NOx, HONO, HNO3). Primarily these reactions are Leighton cycle reactions, NO2 + OH, and NOx isotope exchange, with N2O5 and nitrate radical reactions having a significant but minor influence on NOy δ15N values. The model accuracy and its validation could be improved with additional research. The iNRACM model could be refined by additional theoretical and/or experimental determination of the isotope fractionation factors for the N reactions. First and foremost, the fractionation factor for the NO2+ OH reaction needs to be evaluated in a more robust manner. Likewise, the fractionation factor for the NO + OH, another three-body reaction, will have a large influence on HONO δ15N values, and determining its value will be key for interesting future HONO δ15N data. The fractionation factor for NO2 photolysis requires attention given the limitation of the ΔZPE PHIFE model (Blake et al., 2003; Liang et al., 2004; Miller and Yung, 2000). On the validation end, the simultaneous measurement of δ15N in multiple NOy compounds would expose the accuracy or limitations of the iNRACM model in a quantitative way. The iNRACM model reproduced observed δ15N data from a year-long study on the isotopic composition of particulate nitrate collected in Tucson, AZ. This suggests that the model, which is publicly available, could be used as an analytical tool for researchers using 15N to gain insight into NOx sources and transformation chemistry.
The iNRACM model is the first step in our development of a N-isotope-enabled 3-D chemical transport model (iNCMAQ). That model will couple iNRACM with a 15NOx emissions model (iNNEI) and WRF-generated transport. The iNRACM results show that photochemistry is an important control on the δ15N of the NOy compounds, in particular NO, for which there is a large and growing data set that can be used to validate the model. This is important because this suggests that δ15N in NOy compounds could be used as a validation of different photochemical mechanisms. Further, if the photochemical effect can be deconvoluted from the observations then observed NOy δ15N could be used as a constraint and validation of NOx emissions inventories. Expanded to the global scale, such a model could potentially be used to investigate the cause of δ15N versions in NO found in Antarctic and Greenland ice cores (Hastings et al., 2009) and linked to historical changes in NOx emission and NOy chemistry.
Fortran code and associated input files are archived on Zenodo.org (https://doi.org/10.5281/zenodo.3834914, Fang, 2020) An online version of this iNRACM model is available for public use at https://mygeohub.org/tools/sbox/ (last access: 30 June 2021).
The supplement related to this article is available online at: https://doi.org/10.5194/gmd-14-5001-2021-supplement.
GM was the lead investigator for the project, designed the modeling experiments, organized the tasks, and wrote the manuscript. HF and DM modified the RACM code to include 15N isotopes and assisted in writing and editing the manuscript. WW derived EIE, KIE, and PHIFE used in the model and assisted in writing and editing the paper.
The authors declare that they have no conflict of interest.
Publisher's note: Copernicus Publications remains neutral with regard to jurisdictional claims in published maps and institutional affiliations.
We would like to thank the Purdue Research Foundation and the Purdue Climate Change Research Center for providing funding for the project. We would like to thank Bo Sun for helping with the FORTRAN coding and data generation.
This paper was edited by Christoph Knote and reviewed by Lei Geng and one anonymous referee.
Aldener, M., Brown, S. S., Stark, H., Williams, E. J., Lerner, B. M., Kuster, W. C., Goldan, P. D., Quinn, P. K., Bates, T. S., Fehsenfeld, F. C., and Ravishankara, A. R.: Reactivity and loss mechanisms of NO3 and N2O5 in a polluted marine environment: Results from in situ measurements during New England Air Quality Study 2002, J. Geophys. Res., 111, D23S73, https://doi.org/10.1029/2006JD007252, 2006.
Andreae, M. O. and Crutzen, P. J.: Atmospheric aerosols: biogeochemical sources and role in atmospheric chemistry, Science, 276, 1052–1058, 1997.
Anttila, T., Kiendler-Scharr, A., Tillmann, R., and Mentel, T. F.: On the reactive uptake of gaseous compounds by organic-coated aqueous aerosols: Theoretical analysis and application to the heterogeneous hydrolysis of N2O5, J. Phys. Chem. A, 110, 10435–10443, 2006.
Atkinson, R.: Gas-phase tropospheric chemistry of organic-compounds – a review, Atmos. Environ., 24, 1–41, https://doi.org/10.1016/0960-1686(90)90438-s, 1990.
Atkinson, R.: Atmospheric chemistry of VOCs and NOx, Atmos. Environ., 34, 2063–2101, 2000.
Atkinson, R., Baulch, D. L., Cox, R. A., Hampson Jr., R. F., Kerr, J. A., and Troe, J.: Evaluated kinetic and photochemical data for atmospheric chemistry supplement-iv – IUPAC subcommittee on gas kinetic data evaluation for atmospheric chemistry, J. Phys. and Chem. Ref. Data, 21, 1125–1568, https://doi.org/10.1063/1.555918, 1992.
Bauer, S. E., Koch, D., Unger, N., Metzger, S. M., Shindell, D. T., and Streets, D. G.: Nitrate aerosols today and in 2030: a global simulation including aerosols and tropospheric ozone, Atmos. Chem. Phys., 7, 5043–5059, https://doi.org/10.5194/acp-7-5043-2007, 2007.
Bertram, T. H. and Thornton, J. A.: Toward a general parameterization of N2O5 reactivity on aqueous particles: the competing effects of particle liquid water, nitrate and chloride, Atmos. Chem. Phys., 9, 8351–8363, https://doi.org/10.5194/acp-9-8351-2009, 2009.
Bigeleisen, J.: Second-Order Sum Rule for the Vibrations of Isotopic Molecules and the Second Rule of the Mean, J. Chem. Phys., 28, 694–699, 1958.
Bigeleisen, J. and Mayer, M. G.: Calculation of Equilibrium Constants for Isotopic Exchange Reactions, J. Chem. Phys., 15, 261–267, 1947.
Bigeleisen, J. and Wolfsberg, M.: Theoretical and experimental aspects of isotope effects in chemical kinetics, Adv. Chem. Phys., 1, 15–76, 1958.
Blake, G. A., Liang, M. C., Morgan, C. G., and Yung, Y. L.: A born-oppenheimer photolysis model of N2O fractionation, Geophys. Res. Lett., 30, 58/51–58/54, 2003.
Bloss, W. J., Evans, M. J., Lee, J. D., Sommariva, R., Heard, D. E., and Pilling, M. J.: The oxidative capacity of the troposphere: Coupling of field measurements of OH and a global chemistry transport model, Faraday Discuss., 130, 425–436, 2005.
Brimblecombe, P., Hara, H., Houle, D., and Novak, M.: Acid Rain – Deposition to Recovery, Springer, 2007.
Brown, L. L. and Begun, G. M.: Nitrogen isotopic fractionation between nitric acid and the oxides of nitrogen, J. Chem. Phys., 30, 1206–1209, 1959.
Brown, S. S., Burkholder, J. B., Talukdar, R. K., and Ravishankara, A. R.: Reaction of hydroxyl radical with nitric acid: insights into its mechanism, J. Phys. Chem. A, 105, 1605–1614, 2001.
Brown, S. S., Ryerson, T. B., Wollny, A. G., Brock, C. A., Peltier, R., Sullivan, A. P., Weber, R. J., Dube, W. P., Trainer, M., Meagher, J. F., Fehsenfeld, F. C., and Ravishankara, A. R.: Variability in nocturnal nitrogen oxide processing and its role in regional air quality, Science, 311, 67–70, 2006.
Bruning-Fann, C. S., and Kaneene, J. B.: The Effects of Nitrate, Nitrite and N-Nitroso Compounds on Human Health – A Review, Vet. Human Toxic., 35, 521–538, 1993.
Cai, R., Yang, D., Fu, Y., Wang, X., Li, X., Ma, Y., Hao, J., Zheng, J., and Jiang, J.: Aerosol surface area concentration: a governing factor in new particle formation in Beijing, Atmos. Chem. Phys., 17, 12327–12340, https://doi.org/10.5194/acp-17-12327-2017, 2017.
Cao, Z., Zhou, X., Ma, Y., Wang, L., Wu, R., Chen, B., and Wang, W.: The Concentrations, Formations, Relationships and Modeling of Sulfate, Nitrate and Ammonium (SNA) Aerosols over China, Aerosol Air Quality Res., 17, 84–97, https://doi.org/10.4209/aaqr.2016.01.0020, 2017.
Chai, J. and Hastings, M. G.: Collection Method for Isotopic Analysis of Gaseous Nitrous Acid, Anal. Chem., 90, 830–838, https://doi.org/10.1021/acs.analchem.7b03561, 2018.
Chang, W. L., Bhave, P. V., Brown, S. S., Riemer, N., Stutz, J., and Dabdub, D.: Heterogeneous Atmospheric Chemistry, Ambient Measurements, and Model Calculations of N2O5: A Review, Aero. Sci. Tech., 45, 665–695, 2011.
Charlson, R. J., Schwartz, S. E., Hales, J. M., Cess, R. D., Coakley, J. J., Hansen, J. E., and Hofmann, D. J.: Climate Forcing by Anthropogenic Aerosols, Science, 255, 423–430, 1992.
Chen, W. T., Liao, H., and Seinfeld, J. H.: Future climate impacts of direct radiative forcing of anthropogenic aerosols, tropospheric ozone, and long-lived greenhouse gases, J. Geophys. Res., 112, D14209, https://doi.org/10.1029/2006JD00805, 2007.
Davis, J. M., Bhave, P. V., and Foley, K. M.: Parameterization of N2O5 reaction probabilities on the surface of particles containing ammonium, sulfate, and nitrate, Atmos. Chem. Phys., 8, 5295–5311, https://doi.org/10.5194/acp-8-5295-2008, 2008.
Day, D. A., Dillon, M. B., Wooldridge, P. J., Thornton, J. A., Rosen, R. S., Wood, E. C., and Cohen, R. C.: On alkyl nitrates, O3, and the “missing NOy”, J. Geophys. Res., 108, 4501, https://doi.org/10.1029/2003jd003685, 2003.
DeMore, W. B., Sander, S. P., Golden, D. M., Hampson, R. F., Kurylo, M. J., Howard, C. J., Ravishankara, A. R., Kolb, C. E., and Molina, M. J.: Chemical kinetics and photochemical data for use in stratospheric modeling, Eval. 11, Natl. Aeronaut. and Space Admin., Jet Propul. Lab., 1994.
Dentener, F. J. and Crutzen, P. J.: Reaction of nitrogen pentoxide on tropospheric aerosols: Impact on the global distributions of NOx, ozone, and hydroxyl, J. Geophys. Res., 98, 7149–7163, 1993.
Diem, J. E. and Comrie, A. C.: Allocating anthropogenic pollutant emissions over space: application to ozone pollution management, J. Environ. Manag., 63, 425–447, 2001.
Du, E., Fenn, M. E., De Vries, W., and Ok, Y. S.: Atmospheric nitrogen deposition to global forests: Status, impacts and management options, Environ. Poll., 250, 1044–1048, https://doi.org/10.1016/j.envpol.2019.04.014, 2019.
Elliott, E. M., Kendall, C., Wankel, S. D., Burns, D. A., Boyer, E. W., Harlin, K., Bain, D. J., and Butler, T. J.: Nitrogen isotopes as indicators of NOx source contributions to atmospheric nitrate deposition across the Midwestern and northeastern United States, Environ. Sci. Technol., 41, 7661–7667, 2007.
Elliott, E. M., Kendall, C., Boyer, E. W., Burns, D. A., Lear, G. G., Golden, H. E., Harlin, K., Bytnerowicz, A., Butler, T. J., and Glatz, R.: Dual nitrate isotopes in dry deposition: Utility for partitioning NOx source contributions to landscape nitrogen deposition, J. Geophys. Res., 114, G04020, https://doi.org/10.1029/2008JG000889, 2009.
Elliott, E. M., Yu, Z., Cole, A. S., and Coughlin, J. G.: Isotopic advances in understanding reactive nitrogen deposition and atmospheric processing, Sci. Total Environ., 662, 393–403, https://doi.org/10.1016/j.scitotenv.2018.12.177, 2019.
Fang, H.: iNRACM: Incorporating 15N into the Regional Atmospheric Chemistry Mechanism (RACM) for assessing the role photochemistry plays in controlling the isotopic composition of NOx, NOy, and atmospheric nitrate (Version 1.0), Zenodo [code], https://doi.org/10.5281/zenodo.3834921, 2020.
Felix, J. D. and Elliott, E. M.: Isotopic composition of passively collected nitrogen dioxide emissions: Vehicle, soil and livestock source signatures, Atmos. Environ., 92, 359–366, https://doi.org/10.1016/j.atmosenv.2014.04.005, 2014.
Felix, J. D., Elliott, E. M., and Shaw, S. L.: Nitrogen Isotopic Composition of Coal-Fired Power Plant NOx: Influence of Emission Controls and Implications for Global Emission Inventories, Environ. Sci. Technol., 46, 3528–3535, 2012.
Felix, J. D., Elliott, E. M., Avery, G. B., Kieber, R. J., Mead, R. N., Willey, J. D., and Mullaugh, K. M.: Isotopic composition of nitrate in sequential Hurricane Irene precipitation samples: implications for changing NOx sources, Atmos. Environ., 106, 191–195, 2015.
Fibiger, D. L., and Hastings, M. G.: First Measurements of the Nitrogen Isotopic Composition of NOx from Biomass Burning, Environ. Sci. Technol., 50, 11569–11574, https://doi.org/10.1021/acs.est.6b03510, 2016.
Finlayson-Pitts, B. J. and Pitts Jr., J. N.: Chemistry of the Upper and Lower Atmosphere, Academic Press, San Diego, 2000.
Fowler, D., Coyle, M., Skiba, U., Sutton, M. A., Cape, J., Reis, S., Sheppard, L. J., Jenkins, A., Grizzetti, B., Galloway, J. N., Vitousek, P., Leach, A., Bouwman, A. F., Butterbach-Bahl, K., Dentener, F., Stevenson, D., Amann, M., and Voss, M.: The global nitrogen cycle in the twenty-first century, Phil. T. Roy. Soc. B, 368, 20130164, https://doi.org/10.1098/rstb.2013.0164, 2013.
Freyer, H. D.: Seasonal variation of 15N/14N ratios in atmospheric nitrate species, Tellus B, 43, 30–44, 1991.
Freyer, H. D., Kley, D., Volz-Thomas, A., and Kobel, K.: On the interaction of isotopic exchange processes with photochemical-reactions in atmospheric oxides of nitrogen, J. Geophys. Res., 98, 14791–14796, https://doi.org/10.1029/93jd00874, 1993.
Galloway, J. N., Dentener, F. J., Capone, D. G., Boyer, E. W., Howarth, R. W., Seitzinger, S. P., Asner, G. P., Cleveland, C. C., Green, P. A., Holland, E. A., Karl, D. M., Michaels, A. F., Porter, J. H., Townsend, A. R., and Vorosmarty, C. J.: Nitrogen cycles: past, present, and future, Biogeochemistry, 70, 153–226, 2004.
Golden, D. M. and Smith, G. P.: Reaction of OH + NO2+ M: A new view, J. Phys. Chem. A, 104, 3991–3997, 2000.
Hall, J. V., Winer, A. M., Kleinman, M. T., Lurmann, F. W., Brajer, V., and Colome, S. D.: Valuing the Health Benefits of Clean Air, Science, V255, 812–817, 1992.
Hastings, M. G., Sigman, D. M., and Lipschultz, F.: Isotopic evidence for source changes of nitrate in rain at Bermuda, J. Geophys. Res.-Atmos., 108, 4790, https://doi.org/10.1029/2003JD003789, 2003.
Hastings, M. G., Jarvis, J. C., and Steig, E. J.: Anthropogenic impacts on nitrogen isotopes of ice-core nitrate, Science, 324, 1288–1288, 2009.
Hastings, M. G., Casciotti, K. L., and Elliott, E. M.: Stable Isotopes as Tracers of Anthropogenic Nitrogen Sources, Deposition, and Impacts, Elements, 9, 339–344, 2013.
Heaton, T. H. E.: 15N/14N ratios of nitrate and ammonium in rain at Pretoria, South Africa, Atmos. Environ., 21, 843–852, 1987.
Hegglin, M. I., Brunner, D., Peter, T., Hoor, P., Fischer, H., Staehelin, J., Krebsbach, M., Schiller, C., Parchatka, U., and Weers, U.: Measurements of NO, NOy, N2O, and O3 during SPURT: implications for transport and chemistry in the lowermost stratosphere, Atmos. Chem. Phys., 6, 1331–1350, https://doi.org/10.5194/acp-6-1331-2006, 2006.
Horowitz, L. W., Liang, J., Gardner, G. M., and Jacob, D. J.: Export of reactive nitrogen from North America during summertime: sensitivity to hydrocarbon chemistry, J. Geophys. Res., 103, 13451–13476, 1998.
Houlton, B. Z., Boyer, E., Finzi, A. C., Galloway, J., Leach, A., Liptzin, D., Melillo, J., Rosenstock, T. S., Sobota, D., and Townsend, A. R.: Intentional versus unintentional nitrogen use in the United States: trends, efficiency and implications, Biogeochemistry, 114, 11–23, 2013.
Hoyle, C. R., Boy, M., Donahue, N. M., Fry, J. L., Glasius, M., Guenther, A., Hallar, A. G., Huff Hartz, K., Petters, M. D., Petäjä, T., Rosenoern, T., and Sullivan, A. P.: A review of the anthropogenic influence on biogenic secondary organic aerosol, Atmos. Chem. Phys., 11, 321–343, https://doi.org/10.5194/acp-11-321-2011, 2011.
Hudman, R. C., Moore, N. E., Mebust, A. K., Martin, R. V., Russell, A. R., Valin, L. C., and Cohen, R. C.: Steps towards a mechanistic model of global soil nitric oxide emissions: implementation and space based-constraints, Atmos. Chem. Phys., 12, 7779–7795, https://doi.org/10.5194/acp-12-7779-2012, 2012.
Kastler, J. and Ballschmiter, K.: Bifunctional alkyl nitrates–trace constituents of the atmosphere, J. Anal. Chem., 360, 812–816, 1998.
Kuang, C., Riipinen, I., Sihto, S.-L., Kulmala, M., McCormick, A. V., and McMurry, P. H.: An improved criterion for new particle formation in diverse atmospheric environments, Atmos. Chem. Phys., 10, 8469–8480, https://doi.org/10.5194/acp-10-8469-2010, 2010.
Lajtha, K. and Jones, J.: Trends in cation, nitrogen, sulfate and hydrogen ion concentrations in precipitation in the United States and Europe from 1978 to 2010: a new look at an old problem, Biogeochemistry, 116, 303–334, https://doi.org/10.1007/s10533-013-9860-2, 2013.
Lee, S. H., Uin, J., Guenther, A. B., de Gouw, J. A., Yu, F. Q., Nadykto, A. B., Herb, J., Ng, N. L., Koss, A., Brune, W. H., Baumann, K., Kanawade, V. P., Keutsch, F. N., Nenes, A., Olsen, K., Goldstein, A., and Ouyang, Q.: Isoprene suppression of new particle formation: Potential mechanisms and implications, J. Geophys. Res., 121, 14621–14635, 2016.
Lelieveld, J., Butler, T. M., Crowley, J. N., Dillon, T. J., Fischer, H., Ganzeveld, L., Harder, H., Lawrence, M. G., Martinez, M., Taraborrelli, D., and Williams, J.: Atmospheric oxidation capacity sustained by a tropical forest, Nature, 452, 737–740, 2008.
Liang, M. C., Blake, G. A., and Yung, Y. L.: A semianalytic model for photo-induced isotopic fractionation in simple molecules, J. Geophys. Res., 109, D10308, https://doi.org/10.1029/2004JD004539, 2004.
Ma, J., Liu, Y., Han, C., Ma, Q., Liu, C., and He, H.: Review of heterogeneous photochemical reactions of NOy on aerosol – A possible daytime source of nitrous acid (HONO) in the atmosphere, J. Environ. Sci. China, 25, 326–334, https://doi.org/10.1016/s1001-0742(12)60093-x, 2013.
Madronich, S.: Photodissociation in the atmosphere: 1. Actinic flux and the effects of ground reflections and clouds, J. Geophys. Res., 92, 9740–9752, 1987.
McMurry, P. H., Fink, M., Sakurai, H., Stolzenburg, M. R., Mauldin, R. L., Smith, J., Eisele, F., Moore, K., Sjostedt, S., Tanner, D., Huey, L. G., Nowak, J. B., Edgerton, E., and Voisin, D.: A criterion for new particle formation in the sulfur-rich Atlanta atmosphere, J. Geophys. Res., 110, D22S02, https://doi.org/:10.1029/2005JD005901, 2005.
Michalski, G., Jost, R., Sugny, D., Joyeux, M., and Thiemens, M.: Dissociation energies of six NO2 isotopologues by laser induced fluorescence and zero point energy of some triatomic molecules, J. Chem. Phys., 121, 7153–7161, 2004.
Miller, C. E. and Yung, Y. L.: Photo-induced isotopic fractionation, J. Geophys. Res., 105, 29039–29051, 2000.
Monks, P. S.: Gas-phase radical chemistry in the troposphere, Chem. Soc. Rev., 34, 376–395, https://doi.org/10.1039/b307982c, 2005.
Moore, H.: The isotopic composition of ammonia, nitrogen dioxide and nitrate in the atmosphere, Atmos. Environ., 11, 1239–1243, 1977.
Morino, Y., Kondo, Y., Takegawa, N., Miyazaki, Y., Kita, K., Komazaki, Y., Fukuda, M., Miyakawa, T., Moteki, N., and Worsnop, D. R.: Partitioning of HNO3 and particulate nitrate over Tokyo: Effect of vertical mixing, J. Geophys. Res., 111, D15215, https://doi.org/10.1029/2005jd006887, 2006.
Pan, Y., Tian, S., Liu, D., Fang, Y., Zhu, X., Gao, M., Gregory, G. R., Michalski, G., Huang, X., and Wang, Y.: Source Apportionment of Aerosol Ammonium in an Ammonia-Rich Atmosphere: An Isotopic Study of Summer Clean and Hazy Days in Urban Beijing, J. Geophys. Res., 123, 5681–5689, https://doi.org/10.1029/2017jd028095, 2018.
Paulot, F., Ginoux, P., Cooke, W. F., Donner, L. J., Fan, S., Lin, M.-Y., Mao, J., Naik, V., and Horowitz, L. W.: Sensitivity of nitrate aerosols to ammonia emissions and to nitrate chemistry: implications for present and future nitrate optical depth, Atmos. Chem. Phys., 16, 1459–1477, https://doi.org/10.5194/acp-16-1459-2016, 2016.
Pilegaard, K.: Processes regulating nitric oxide emissions from soils, Philos. T. R. Soc. B, 368, 20130126, https://doi.org/10.1098/rstb.2013.0126, 2013.
Platt, U. F., Winer, A. M., Biermann, H. W., Atkinson, R., and Pitts, J. N.: Measurement of Nitrate Radical Concentrations in Continental Air, Environ. Sci. Technol., 18, 365–369, 1984.
Prinn, R. G.: The cleansing capacity of the atmosphere, Ann. Rev. Env. Res., 28, 29–57, 2003.
Pusede, S. E., Duffey, K. C., Shusterman, A. A., Saleh, A., Laughner, J. L., Wooldridge, P. J., Zhang, Q., Parworth, C. L., Kim, H., Capps, S. L., Valin, L. C., Cappa, C. D., Fried, A., Walega, J., Nowak, J. B., Weinheimer, A. J., Hoff, R. M., Berkoff, T. A., Beyersdorf, A. J., Olson, J., Crawford, J. H., and Cohen, R. C.: On the effectiveness of nitrogen oxide reductions as a control over ammonium nitrate aerosol, Atmos. Chem. Phys., 16, 2575–2596, https://doi.org/10.5194/acp-16-2575-2016, 2016.
Pye, H. O. T., Chan, A. W. H., Barkley, M. P., and Seinfeld, J. H.: Global modeling of organic aerosol: the importance of reactive nitrogen (NOx and NO3), Atmos. Chem. Phys., 10, 11261–11276, https://doi.org/10.5194/acp-10-11261-2010, 2010.
Richet, P., Bottinga, Y., and Javoy, M.: Review of hydrogen, carbon, nitrogen, oxygen, sulfur, and chlorine stable isotope fractionation among gaseous molecules, Annu. Rev. Earth Planet. Sci., 5, 65–110, 1977.
Riemer, N., Vogel, H., Vogel, B., Schell, B., Ackermann, I., Kessler, C., and Hass, H.: Impact of the heterogeneous hydrolysis of N2O5 on chemistry and nitrate aerosol formation in the lower troposphere under photosmog conditions, J. Geophys. Res., 108, 4144, https://doi.org/10.1029/2002JD002436, 2003.
Riemer, N., Vogel, H., Vogel, B., Anttila, T., Kiendler-Scharr, A., and Mentel, T. F.: Relative importance of organic coatings for the heterogeneous hydrolysis of N2O5 during summer in Europe, J. Geophys. Res., 114, https://doi.org/10.1029/2008JD011369, 2009.
Riha, K. M.: The use of stable isotopes to constrain the nitrogen cycle, PhD Dissertation, Purdue University, West Lafayette, IN, 2013.
Roehl, C. M., Orlando, J. J., Tyndall, G. S., Shetter, R. E., Vazquez, G. J., Cantrell, C. A., and Calvert, J. G.: Temperature-dependence of the quantum yields for the photolysis of NO2 near the dissociation limit, J. Phys. Chem., 98, 7837–7843, https://doi.org/10.1021/j100083a015, 1994.
Romer, P. S., Duffey, K. C., Wooldridge, P. J., Allen, H. M., Ayres, B. R., Brown, S. S., Brune, W. H., Crounse, J. D., de Gouw, J., Draper, D. C., Feiner, P. A., Fry, J. L., Goldstein, A. H., Koss, A., Misztal, P. K., Nguyen, T. B., Olson, K., Teng, A. P., Wennberg, P. O., Wild, R. J., Zhang, L., and Cohen, R. C.: The lifetime of nitrogen oxides in an isoprene-dominated forest, Atmos. Chem. Phys., 16, 7623–7637, https://doi.org/10.5194/acp-16-7623-2016, 2016.
Rose, L. A., Yu, Z., Bain, D. J., and Elliott, E. M.: High resolution, extreme isotopic variability of precipitation nitrate, Atmos. Environ., 207, 63–74, 2019.
Savard, M. M., Cole, A., Smirnoff, A., and Vet, R.: δ15N values of atmospheric N species simultaneously collected using sector-based samplers distant from sources–Isotopic inheritance and fractionation, Atmos. Environ., 162, 11–22, 2017.
Seinfeld, J. H. and Pandis, S. N.: Atmospheric composition, global cycles, and lifetimes, Atmospheric chemistry and physics: From air pollution to climate change, 2, 98–101, 1998.
Seinfeld, J. H. and Pandis, S. N.: Atmospheric Chemistry and Physics: from air pollution to climate change, John Wiley & Sons, 2016.
Sharma, H. D., Jervis, R. E., and Wong, K. Y.: Isotopic exchange reactions in nitrogen oxides, J. Phys. Chem., 74, 923–933, 1970.
Shrivastava, M., Cappa, C. D., Fan, J. W., Goldstein, A. H., Guenther, A. B., Jimenez, J. L., Kuang, C., Laskin, A., Martin, S. T., Ng, N. L., Petaja, T., Pierce, J. R., Rasch, P. J., Roldin, P., Seinfeld, J. H., Shilling, J., Smith, J. N., Thornton, J. A., Volkamer, R., Wang, J., Worsnop, D. R., Zaveri, R. A., Zelenyuk, A., and Zhang, Q.: Recent advances in understanding secondary organic aerosol: Implications for global climate forcing, Rev. Geophys., 55, 509–559, 2017.
Snyder, J. A., Hanway, D., Mendez, J., Jamka, A. J., and Tao, F. M.: A density functional theory study of the gas-phase hydrolysis of dinitrogen pentoxide, J. Phys. Chem. A, 103, 9355–9358, 1999.
Spak, S. N. and Holloway, T.: Seasonality of speciated aerosol transport over the Great Lakes region, J. Geophys. Res., 114, D08302, https://doi.org/10.1029/2008JD010598, 2009.
Srivastava, R. K., Neuffer, W., Grano, D., Khan, S., Staudt, J. E., and Jozewicz, W.: Controlling NOx emission from industrial sources, Environ. Prog., 24, 181–197, 2005.
Stockwell, W. R., Middleton, P., Chang, J. S., and Tang, X.: The second generation regional acid deposition model chemical mechanism for regional air quality modeling, J. Geophys. Res., 95, 16343–16367, 1990.
Stockwell, W. R., Kirchner, F., Kuhn, M., and Seefeld, S.: A new mechanism for regional atmospheric chemistry modeling, J. Geophys. Res., 102, 25847–25879, 1997.
Urey, H. C.: Thermodynamic properties of isotopic substances, J. Chem. Soc., 562–581, 1947.
Vandaele, A. C., Hermans, C., Fally, S., Carleer, M., Colin, R., Merienne, M. F., Jenouvrier, A., and Coquart, B.: High-resolution Fourier transform measurement of the NO2 visible and near-infrared absorption cross sections: Temperature and pressure effects, J. Geophys. Res., 107, 4348, https://doi.org/10.1029/2001jd000971, 2002.
Van Hook, W. A., Rebelo, L. P. N., and Wolfsberg, M.: An interpretation of the vapor phase second virial coefficient isotope effect: Correlation of virial coefficient and vapor pressure isotope effects, J. Phys. Chem. A, 105, 9284–9297, https://doi.org/10.1021/jp004302z, 2001.
Walters, W. W. and Michalski, G.: Theoretical calculation of nitrogen isotope equilibrium exchange fractionation factors for various NOy molecules, Geochim. Cosmochim. Ac., 164, 284–297, https://doi.org/10.1016/j.gca.2015.05.029, 2015.
Walters, W. W. and Michalski, G.: Ab initio study of nitrogen and position-specific oxygen kinetic isotope effects in the NO + O3 reaction, J. Chem. Phys., 145, 224311, https://doi.org/10.1063/1.4968562, 2016.
Walters, W. W., Goodwin, S. R., and Michalski, G.: Nitrogen Stable Isotope Composition of Vehile Emitted NOx, Environ. Sci. Technol., 49, 2278–2285, 2015a.
Walters, W. W., Tharp, B. D., Fang, H., Kozak, B. J., and Michalski, G.: Nitrogen Isotope Composition of Thermally Produced NOx from Various Fossil-Fuel Combustion Sources, Environ. Sci. Technol., 49, 11363–11371, https://doi.org/10.1021/acs.est.5b02769, 2015b.
Walters, W. W., Simonini, D. S., and Michalski, G.: Nitrogen isotope exchange between NO and NO2 and its implications for 15N variations in tropospheric NOx and atmospheric nitrate, Geophys. Res. Lett., 43, 440–448, https://doi.org/10.1002/2015gl066438, 2016.
Walters, W. W., Fang, H., and Michalski, G.: Summertime diurnal variations in the isotopic composition of atmospheric nitrogen dioxide at a small midwestern United States city, Atmos. Environ., 179, 1–11, https://doi.org/10.1016/j.atmosenv.2018.01.047, 2018.
Wolfsberg, M.: Note on secondary isotope effects in reaction rates, J. Chem. Phys., 33, 2–6, https://doi.org/10.1063/1.1731078, 1960.
Wolfsberg, M., Van Hook, W. A., and Paneth, P.: Isotope effects on equilibrium constants of chemical reactions; transition state theory of isotope effects, in: Isotope Effects, Springer, Dordrecht, 77–137, 2010.
Yu, Z. and Elliott, E. M.: Novel method for nitrogen isotopic analysis of soil-emitted nitric oxide, Environ. Sci. Technol., 51, 6268–6278, 2017.
Yung, Y. L. and Miller, C. E.: Isotopic fractionation of stratospheric nitrous oxide, Science, 278, 1778–1780, 1997.
Yvon, S. A., Plane, J. M. C., Nien, C. F., Cooper, D. J., and Saltzman, E. S.: Interaction between nitrogen and sulfur cycles in the polluted marine boundary layer, J. Geophys. Res.-Atmos., 101, 1379–1386, 1996.
Zhang, Y., Vijayaraghavan, K., Wen, X. Y., Snell, H. E., and Jacobson, M. Z.: Probing into regional ozone and particulate matter pollution in the United States: 1. A 1-year CMAQ simulation and evaluation using surface and satellite data, J. Geophys. Res., 114, D22304, https://doi.org/10.1029/2009JD011898, 2009.