the Creative Commons Attribution 4.0 License.
the Creative Commons Attribution 4.0 License.
 | 23 Jul 2021
Oil palm modelling in the global land surface model ORCHIDEE-MICT
Philippe Ciais
Xiuzhi Chen
Haicheng Zhang
Kasturi Kanniah
Arthur P. Cracknell
Peng Gong
Oil palm is the most productive oil crop that provides ∼ 40 % of the global vegetable oil supply, with 7 % of the cultivated land devoted to oil plants. The rapid expansion of oil palm cultivation is seen as one of the major causes for deforestation emissions and threatens the conservation of rain forest and swamp areas and their associated ecosystem services in tropical areas. Given the importance of oil palm in oil production and its adverse environmental consequences, it is important to understand the physiological and phenological processes of oil palm and its impacts on the carbon, water and energy cycles. In most global vegetation models, oil palm is represented by generic plant functional types (PFTs) without specific representation of its morphological, physical and physiological traits. This would cause biases in the subsequent simulations. In this study, we introduced a new specific PFT for oil palm in the global land surface model ORCHIDEE-MICT (v8.4.2, Organising Carbon and Hydrology in Dynamic Ecosystems–aMeliorated Interactions between Carbon and Temperature). The specific morphology, phenology and harvest process of oil palm were implemented, and the plant carbon allocation scheme was modified to support the growth of the branch and fruit component of each phytomer. A new age-specific parameterization scheme for photosynthesis, autotrophic respiration and carbon allocation was also developed for the oil palm PFT, based on observed physiology, and was calibrated by observations. The improved model generally reproduces the leaf area index, biomass density and fruit yield during the life cycle at 14 observation sites. Photosynthesis, carbon allocation and biomass components for oil palm also agree well with observations. This explicit representation of oil palm in a global land surface model offers a useful tool for understanding the ecological processes of oil palm growth and assessing the environmental impacts of oil palm plantations.
- Article
(5782 KB) - Full-text XML
-
Supplement
(840 KB) - BibTeX
- EndNote


Oil palm is one of the most important vegetative oil crops in the world. It provides 39 % of the global supply of vegetable oil and occupies 7 % of the agricultural land devoted to oil-producing plants (Caliman, 2011; Rival and Levang, 2014). With the increasing demand for palm oil as a biofuel and a feedstock for industrial products, oil palm plantation continuously expanded from 5.59 to 19.50 × 10⁶ ha during 2001–2016 in the world's top two palm oil producers, Malaysia and Indonesia (Xu et al., 2020). This rapid expansion brought about high ecological and social costs. About half of the oil palm cultivation lands were converted from biodiverse tropical forests during 1990–2005 (Koh and Wilcove, 2008), leading to losses of habitats (Fitzherbert et al., 2008), peatlands (Koh et al., 2011; Miettinen et al., 2016) and carbon emissions from land use change (Guillaume et al., 2018). Land use change (LUC) from peat swamp forest to oil palm plantation contributed about 16 %–28 % of the total national greenhouse gas (GHG) emissions in Southeastern Asia (Cooper et al., 2020). A comprehensive understanding of fruit production, land use change, carbon emissions and other environmental consequences of oil palm is urgently needed for guiding more sustainable management practices.
Many field-based studies underpinned the specific phenology and growth of oil palm and its key physiological processes (Noor and Harun, 2004; Lamade and Bouillet, 2005; Sunaryathy et al., 2015; Ahongshangbam et al., 2019). Models developed based on these field observations provide a useful tool for large-scale simulation of oil palm growth and yields and their impacts on the regional carbon, water and energy budgets. Oil palm growth models have been developed to simulate the biomass yields of oil palm based on the physiological processes and phenological characteristics such as flowering and rotation dynamics (Van Kraalingen et al., 1989; Henson, 2009; Combres et al., 2013; Hoffmann et al., 2014; Huth et al., 2014; Paterson et al., 2015; Teh and Cheah, 2018). Although these models can generally reproduce the observed yields, they are usually applied for fruit production simulation without the whole carbon, water and energy cycle; do not allow the representation of land-use changes; and thus usually cannot be integrated for regional and global gridded simulations like land surface models.
Alternatively, process-based land surface models (LSMs) can simulate spatially explicit plant growth, biomass density and yield, and a full set of carbon, nutrient, water and energy fluxes and storage pools (Fisher et al., 2014). Vegetation in most LSMs is represented by a discrete number of plant functional types (PFTs) and oil palm is approximated by tropical broadleaved evergreen (TBE) trees without a specific representation in LSMs (except the Community Land Model-Palm, CLM-Palm), although the physiological characteristics of oil palm differ from generic TBE trees. For example, the maximum leaf area index (LAI) of oil palm is up to 6 m2 m−2 depending on the genotypes and locations, which is lower than TBE (8 m2 m−2) in Indonesia and other plantations such as rubber (9 m2 m−2) (Vernimmen et al., 2007; Propastin, 2009; Rusli and Majid, 2014). The maximum rate of carboxylation, Vcmax25, of mature oil palm, by contrast, is higher than in natural tropical forests (Carswell et al., 2000; Kattge et al., 2009; Teh Boon Sung and See Siang, 2018). Oil palm has a shallower rooting system and lower aboveground biomass compared to forests (Carr, 2011), and its above- and belowground biomass ratio is lower than in the natural forests (Kotowska et al., 2015). To maintain a huge fruit productivity with shallow roots, a large amount of water is required by oil palm for evapotranspiration (∼ 4–6 mm d−1), typically 25 % higher than in tropical forests in the same region (Meijide et al., 2017; Manoli et al., 2018). Ignoring those differences in the parameterizations of LSMs would cause biases when simulating oil palm growth, yields and the biophysical processes in a large-scale model application, which calls for new parameterizations dedicated to oil palm as a specific PFT in those models.
Oil palm has a specific morphology, phenology and management practice compared to other perennial crops and tropical evergreen forests. Oil palm has a solitary columnar stem with phytomers (palm branches supporting leaves and fruit bunches) produced in succession at the top of stem. Fruit bunches are developed in the axil of each phytomer and each phytomer experiences a life cycle from leaf initiation, inflorescences and fruit development to harvest and pruning (Corley and Tinker, 2015; Lewis et al., 2020). At the maturity stage, one oil palm tree holds ∼ 40 visible expanded phytomers from the youngest to the oldest, and 40–60 initiating phytomers within the apical buds (Combres et al., 2013). It takes about 2–3 years for the reproductive organ to develop before flower initiation and fruit harvest (Corley and Tinker, 2015). Currently, the biomass pool of phytomers is not included in the generic tree PFTs of most land surface models (except CLM-Palm), which prevents us from modelling phytomer-specific development, monthly harvest and pruning. In addition, the closest PFT of oil palm in the model, known as TBE, has a different leaf phenology – with a higher old leaf turnover and increased new leaf production in the dry season, based on the satellite and ground-based observations (Wu et al., 2016). This leaf phenology scheme was parameterized for leaf age cohorts in ORCHIDEE (Organising Carbon and Hydrology in Dynamic Ecosystems, one of the commonly used LSMs) for Amazonian evergreen forest (Chen et al., 2020), but whether it can be adapted to the oil palm or not needs further investigations. At the productive stage, regular harvest and pruning are applied to maintain the optimal number of phytomers and maximize harvested yields. Also, oil palm planted in mineral soil is managed in a rotation cycle of 25–30 years (manually cut) due to the difficulties in harvesting and the potential decline of fruit production (Hoffmann et al., 2014; Röll et al., 2015). Thus, oil palm cannot be described neither as an annual crop nor as a natural tree PFT with a longevity of decades to centuries. Therefore, including forest age dynamics (Yue et al., 2018) is needed in an LSM to represent the management practice and cycle of growth, fruit harvest and rotation of oil palm at different age stages. CLM-Palm was the first LSM that introduced oil-palm-specific PFT with a sub-canopy and sub-PFT framework for modelling oil palm's phytomer-based structure and phenological and physiological traits in CLM4.5 (Fan et al., 2015). This work provides an important conceptual framework for implementing oil palm modelling in other LSMs.
In this study, we aimed to model oil palm growth from young to mature plants and the specific morphology, phenology and management characteristics in the ORCHIDEE LSM. Incorporating an oil palm PFT into ORCHIDEE would contribute to modelling the carbon, water and energy cycle of this perennial crop in a variety of LSMs except for CLM, which already implements oil palm modelling. The oil palm integration was based on an existing leaf-age-cohort-based phenology of TBE and distinct age classes of the model, but significant modifications have been made to accommodate the phenology, physiological and management characteristics of oil palm. The oil palm growth from leaf initiation, fruit development and maturity to the clear-cutting of oil palm PFT at rotation was represented in the ORCHIDEE LSM. A sub-PFT structure – phytomer with branch and fruit (a leaf component was implemented at the PFT level with four leaf age cohorts) – for oil palm was implemented in ORCHIDEE based on the sub-PFT structure incorporated in CLM-Palm (Fan et al., 2015). The plant carbon allocation scheme was modified to support the growth of the branch and fruit component of each phytomer. Management practices of pruning, fruit harvest and rotation were also implemented. The objectives of this study are to (1) implement growth (especially phytomer development), phenology and harvest processes for oil palm as a new PFT of the ORCHIDEE LSM, (2) adjust physiological and phenological parameters using field measurements, and (3) evaluate simulated biomass and oil palm yields at a range of sites across Indonesia, Malaysia and Benin.
2.1 Observation data
Data from 14 sites with reported coordinates were collected from published literatures for model validation (Table S1 in the Supplement). Since a tropical humid climate is favourable for oil palm growth, most of the in situ measurements are located in Indonesia (six sites) and Malaysia (seven sites) except for one site in Benin (Fig. 1). The observation sites have high mean annual precipitation (MAP, 574.2–3598.8 mm yr−1) and high mean annual temperatures (MATs) between 24.3 and 28.8 ∘C throughout the year, which covers 97.27 % and 85.14 % of the range of MAP and MAT, respectively, in the global oil palm plantation area in 2010 (Cheng et al., 2018) (Fig. S1 in the Supplement). The MAT, MAP and clay fraction (CF) for the global oil palm plantation area were based on the climate data from the Climatic Research Unit National Centers for Environmental Prediction (CRUNCEP) gridded dataset (Viovy, 2011) and the Harmonized World Soil Database (HWSD v1.2, Nachtergaele et al., 2010). The observation sites include six smaller plantations (< 50 ha, Sites 1 and 2 for smallholders and Sites 4, 5, 7 and 12 as research sites; Fig. 1) and seven industrial plantations of up to 23 625 ha. Site 12 and Site 14 were covered by very deep peat soil before oil palm cultivation, where the former natural vegetation was peat swamp forest. The natural vegetation at other sites was dominated by tropical rainforest and the clay fraction varied from 0 %–11 % (Fig. S1). LAI, gross primary productivity (GPP), net primary productivity (NPP), fruit bunches (yield) and biomass at different ages including young and mature oil palms were collected from these sites for model validation. Annual data of total biomass and yields were available for Site 3 and Site 12. The biomass data at Site 3 were calculated by an allometric equation using the measured diameter at breast height (DBH) and height of the stem (Corley and Tinker, 2015), while yield data at Site 12 were obtained from measurements of the harvested fruit bunch every time. Sites 1, 2, 12 and 13 provide observations of different NPP components by quantifying all the plant pool change for a specified time interval. Fractions of different biomass parts were collected by combining measurements of biomass partition and calculations using empirical equations at Site 12 and Site 3 (see details in Table S1). Due to the lack of accessible continuous observations at one or two sites, we have to utilize the existing knowledge regarding oil palm growth phenology and plantation management, together with the range of field observations from all the sites to constrain the model. We also added a test by recalibrating the model using data from Site 12 with more observations compared to other sites, and we then validated the model using data at the remaining sites (Figs. S4 and S5). Facing the difficulty in acquiring the original harvest records for independent sites, we also ran simulations at the same site as previous studies (Fig. 11 in Teh and Cheah, 2018, and Fig. 6 in Fan et al., 2015) and visually compared the temporal dynamics of simulated yields.
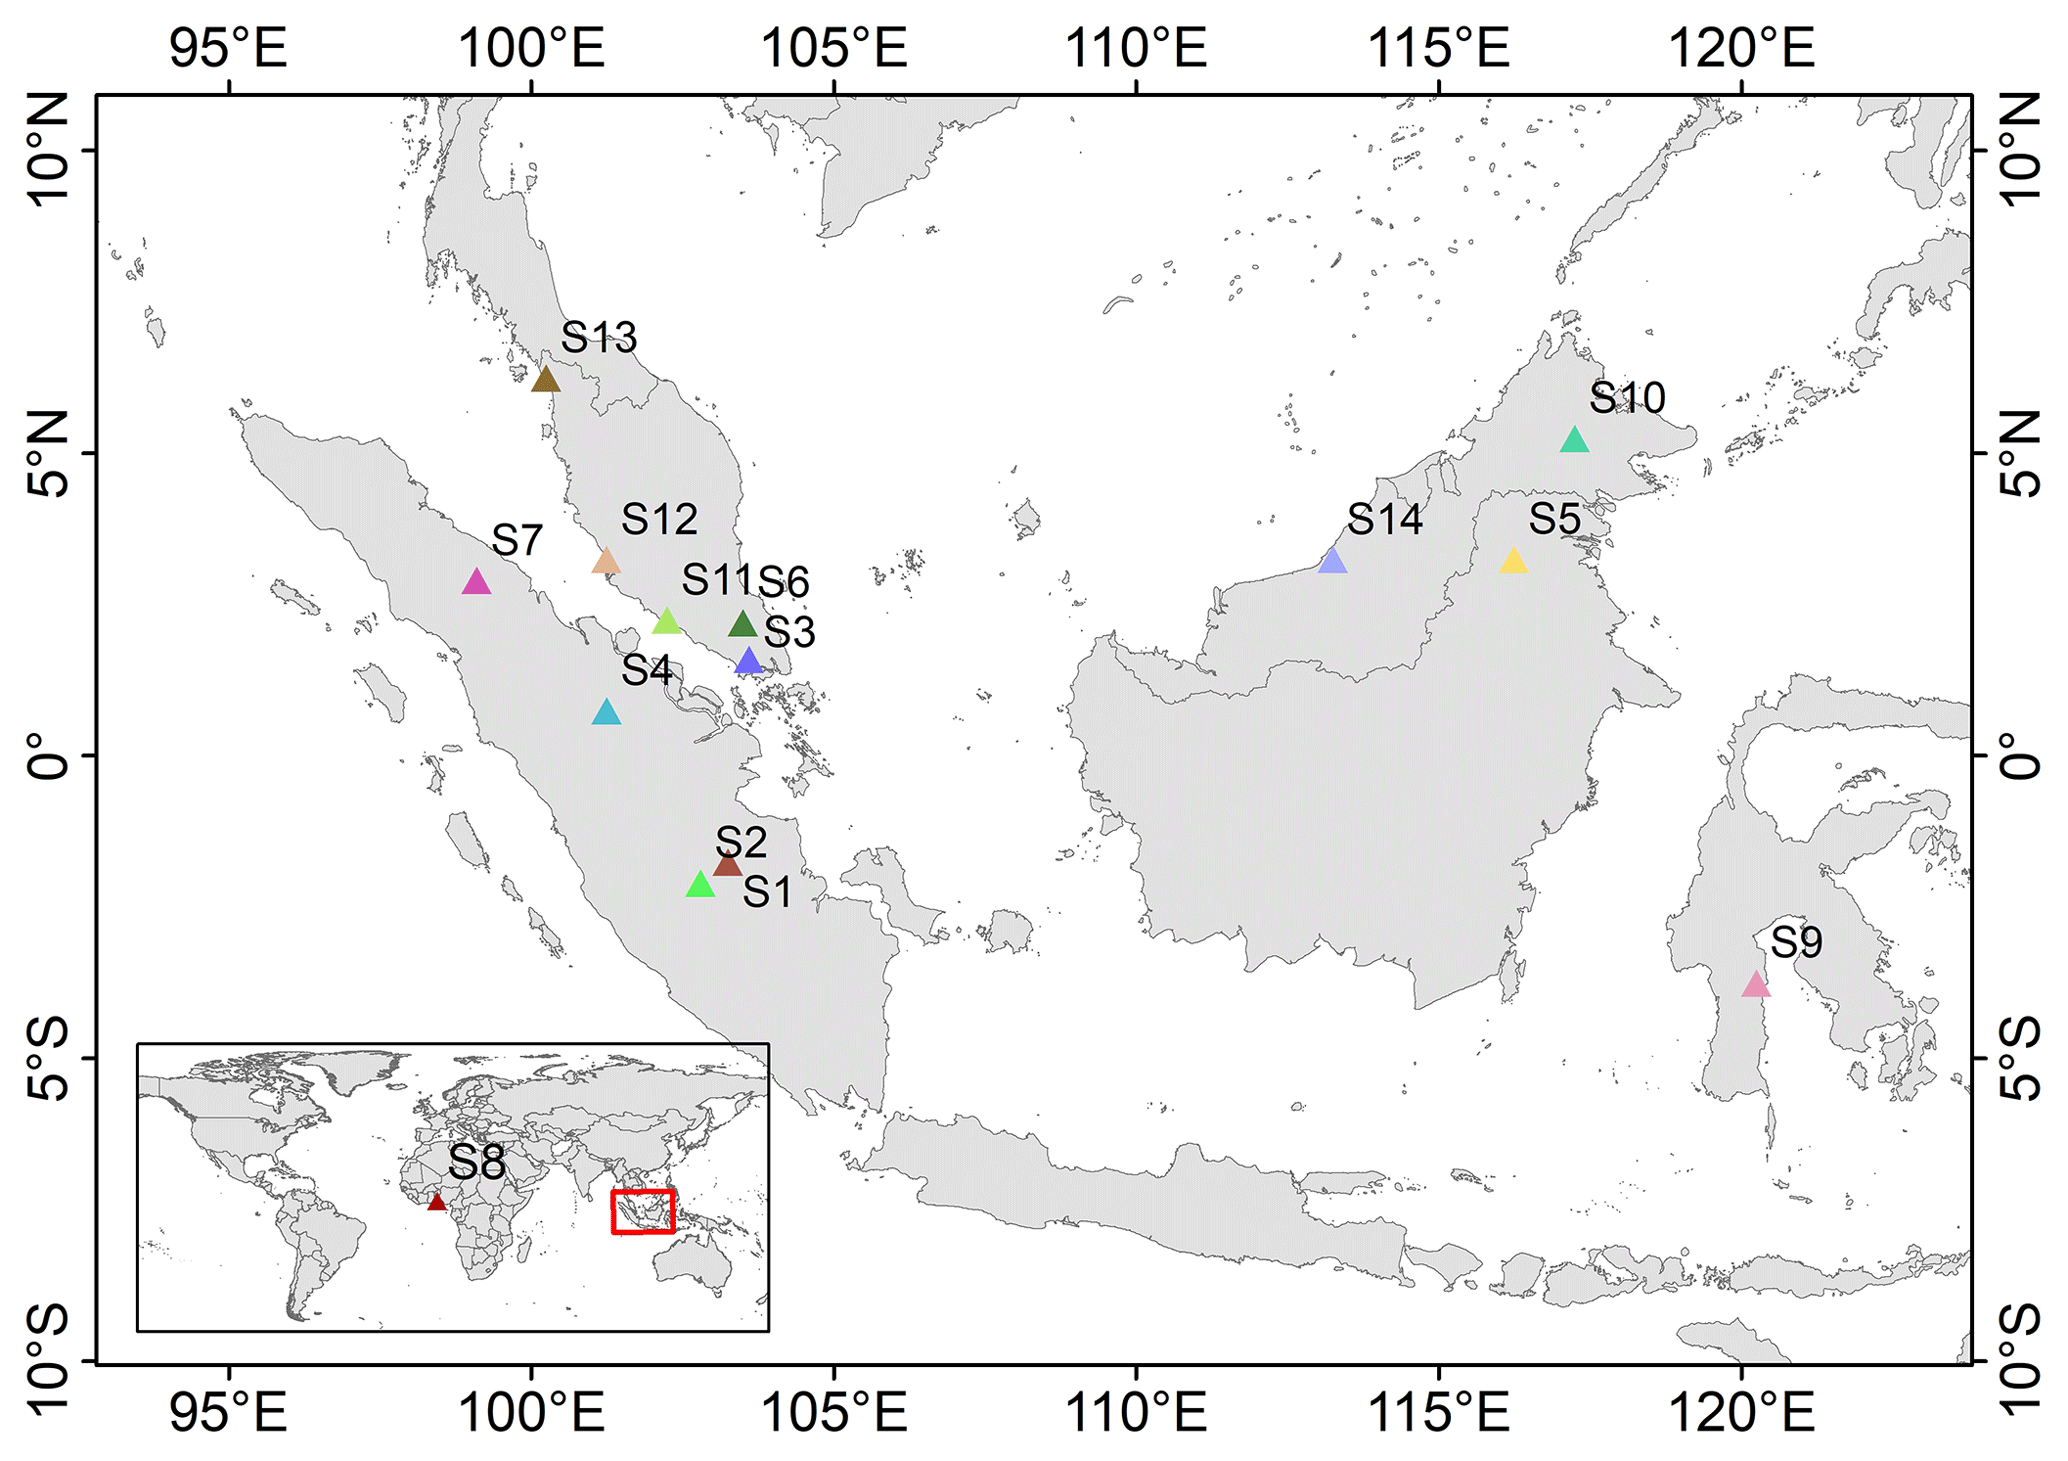
Figure 1Spatial distribution of the 14 observation sites used for model calibration and evaluation. The red rectangle in the inserted map shows the location of the main map (Malaysia and Indonesia).
2.2 Model description
Organising Carbon and Hydrology in Dynamic Ecosystems (ORCHIDEE) is the land surface component of the French Institut Pierre Simon Laplace (IPSL) Earth system model (ESM) and capable of simulating water, energy and carbon processes (Krinner et al., 2005). ORCHIDEE-MICT (aMeliorated Interactions between Carbon and Temperature) is a branch of ORCHIDEE with a better representation of high-latitude processes with new vertical soil parameterization, snow processes and fires (Guimberteau et al., 2018). The recent ORCHIDEE-MICT v8.4.2 also includes modifications in wood harvest, forest age class and gross land use changes (Yue et al., 2018). The need to represent age-specific physiological and phenological characteristics for young and mature oil palm can thus benefit from this pre-existing forest age dynamics representation. Therefore, our development of oil palm modelling started from ORCHIDEE-MICT v8.4.2.
Processes related to the carbon cycle in ORCHIDEE include photosynthesis, respiration, carbon allocation, litterfall, plant phenology and decomposition (Krinner et al., 2005). We added a new PFT for oil palm starting from the default setting of the closest PFT: TBE trees. The major modification brought was for the carbon allocation, by including a new phytomer organ for oil palm, and a new fruit harvest module for fresh fruit bunch harvesting (Fig. 2). The new model called ORCHIDEE-MICT-OP (oil palm) is schematized in Fig. S2.
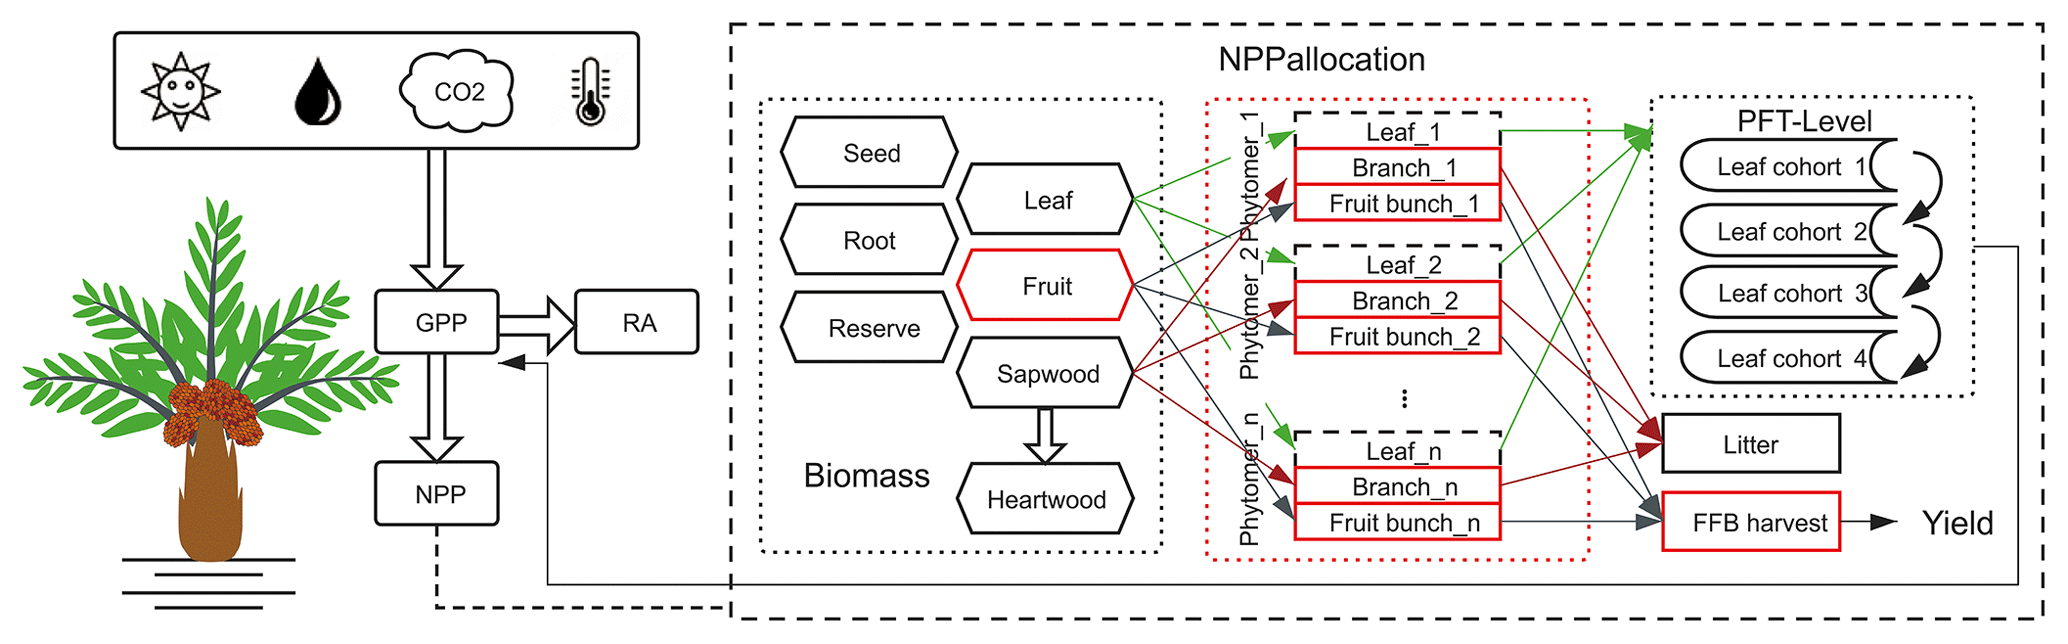
Figure 2Schematic diagram showing the implementation of oil palm in ORCHIDEE-MICT-OP. The major modifications, new plant organs and harvest module are highlighted using the red blocks. The branch and fruit components (solid lines) were implemented at the phytomer level, while the leaf component (dashed lines) was simulated as the entirety of all phytomers at the PFT level to remain consistent with the four leaf age cohorts of the modelled phenological equations. RA refers to autotrophic respiration. FFB harvest refers to fresh fruit bunch harvest.
2.3 Introduction of the phytomer structure
2.3.1 New phytomer structure
Oil palm has a monopodial architecture and sequential phenology. The phytomers are produced in succession, each bearing a big leaf with a number of leaflets, rachis and a bunch of fruits (Corley and Tinker, 2015; Fan et al., 2015). To represent the major morphology and phenological process, we introduce a new phytomer structure in the model frame. In the model, only branches and fruit bunches were specifically simulated at each phytomer while leaf was simulated as the entirety of all phytomers at the PFT level to remain consistent with the four leaf age cohorts of the modelled phenological equations. Phytomers are initiated successively and developed in parallel on the same tree. Although each phytomer has its own sequence of initiation, allocation, fruit production and pruning, they share the same stem and root biomass and the same carbon assimilation process. In the default version of ORCHIDEE-MICT, there were eight biomass pools namely leaves, sapwood above and below ground, heartwood above and below ground, roots, seed and carbon reserve pools. To simplify the modification and parameterization of phytomers and stay consistent with the model structure, the branch and fruit bunch belonging to each phytomer were linked with the original sapwood and fruit biomass pools, although the fruit bunch biomass pool was modified from the original model (Fig. 2). The the number of fruit and branch components was set corresponding to phytomer number but the leaf linked with the leaf biomass pool was divided into four age classes without duplication in each phytomers (Fig. 2).
2.3.2 Phytomer phenology
Here we describe the phytomer dynamics related to planting, vegetative maturity and rotation at plant level and the sequential initiation and pruning at phytomer level. The modification of leaf seasonality is also presented. A schematic diagram of oil palm tree, phytomer and leaf phenology is shown in Fig. 3. Since the phytomer phenology is closely related to the age of the tree, the age of the phytomer and the age of the leaf, three temporal variables of tree age (the age of the oil palm tree in years), the phytomer age (the age for each phytomer counted from its initiation, in days) and the leaf ages (the age of leaves in days) were used to compute tree, phytomer and leaf dynamics (Fig. 3).
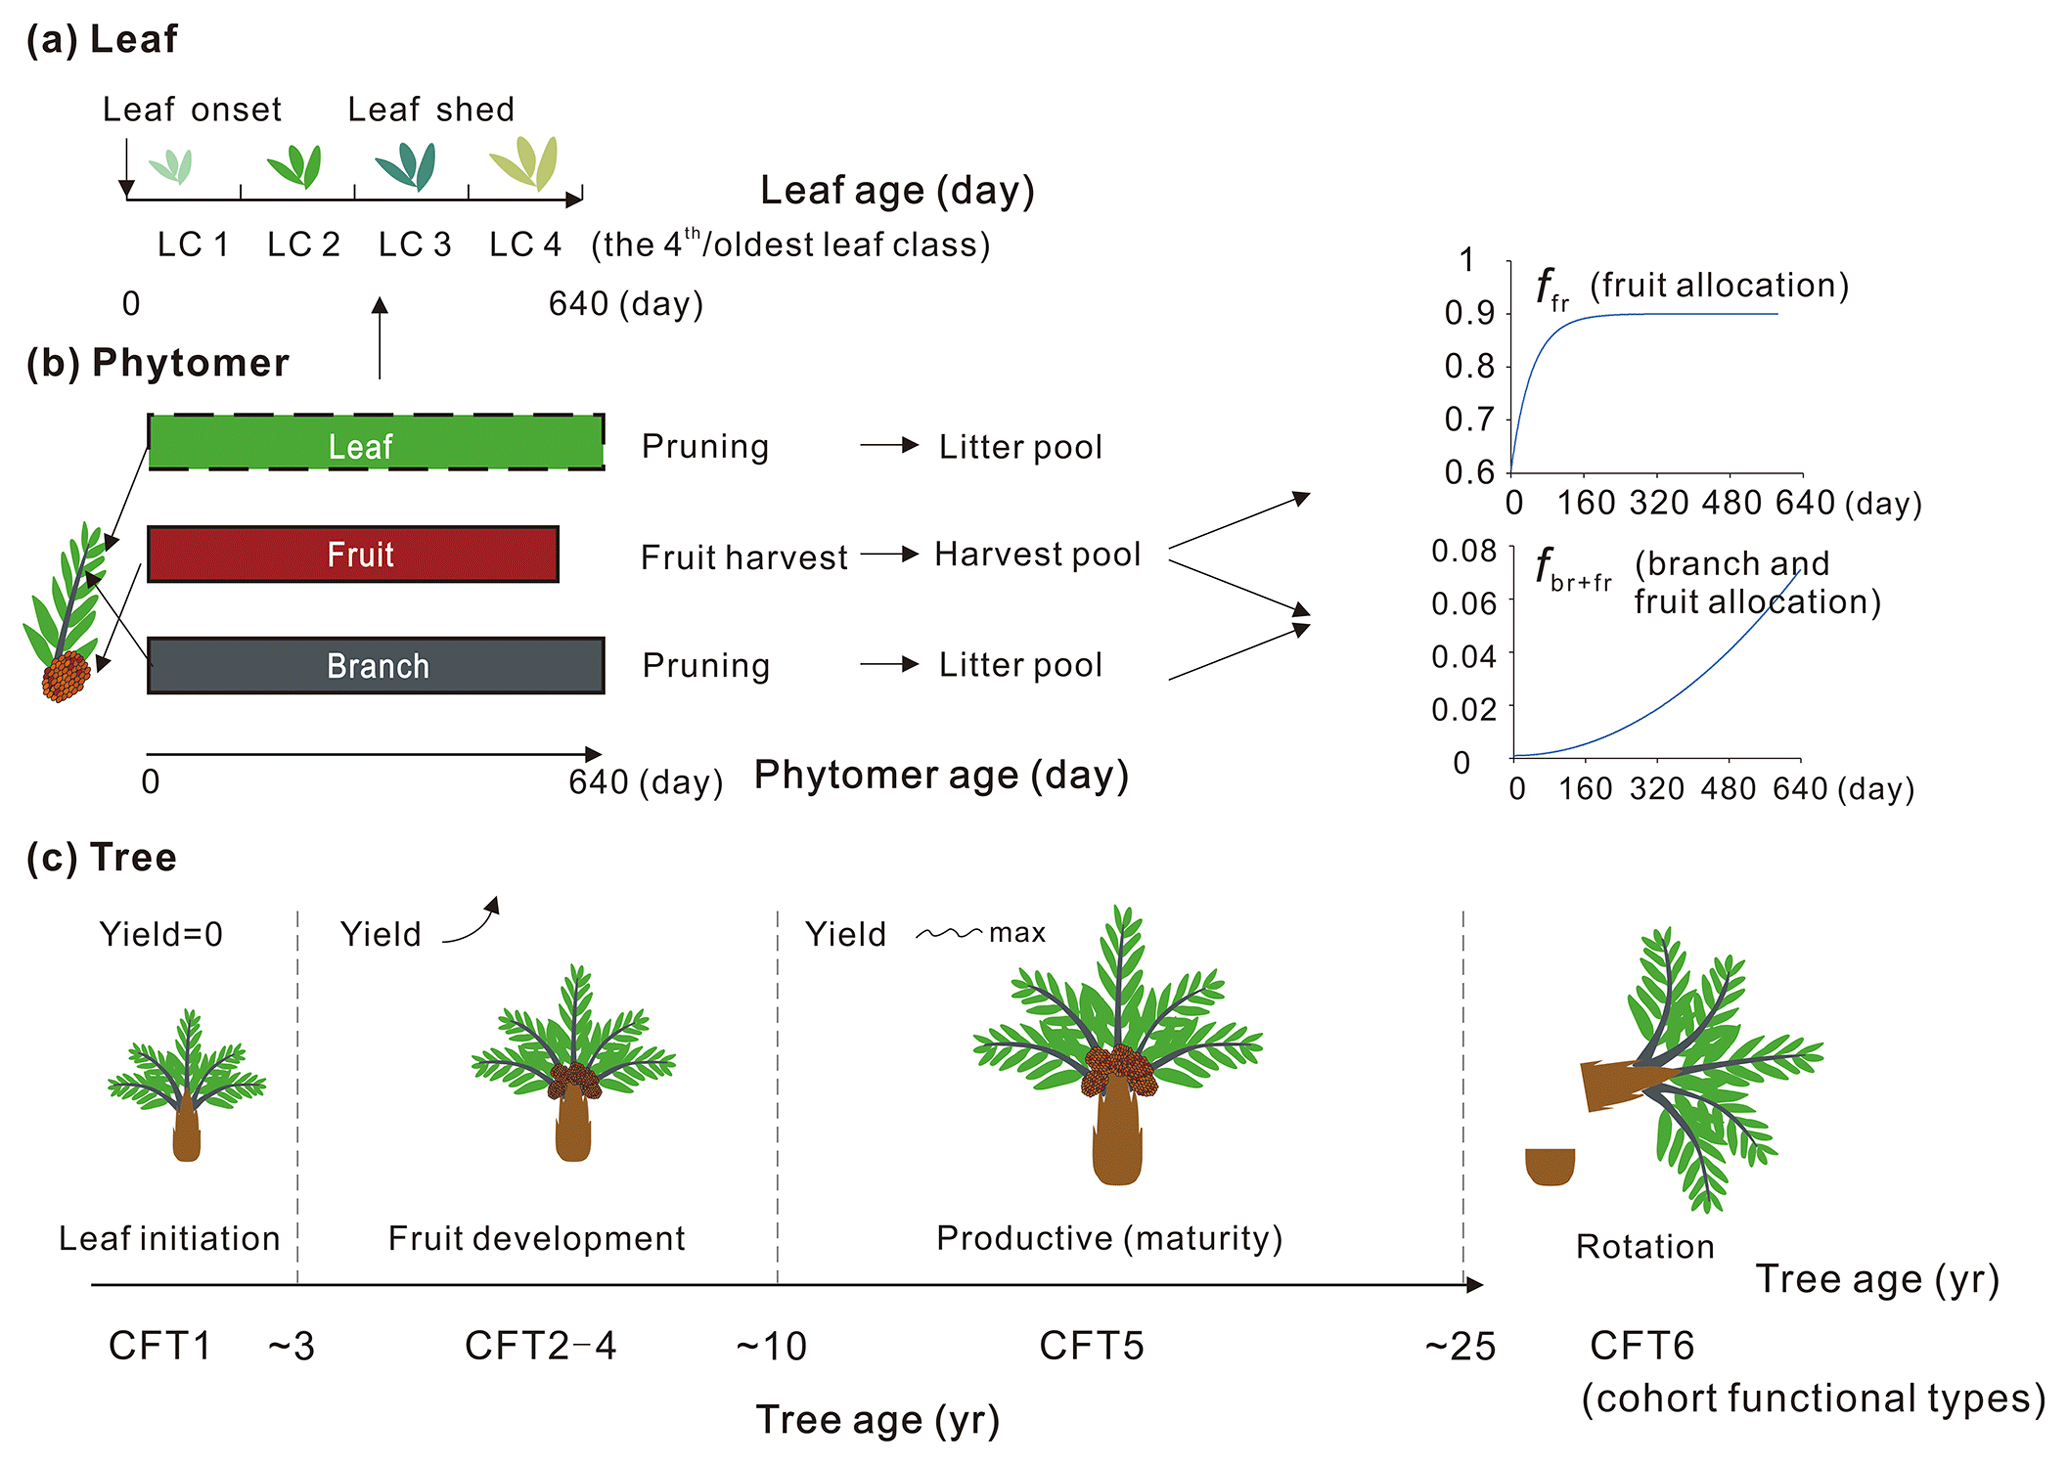
Figure 3Schematic of (a) leaf, (b) phytomer and (c) plant dynamics with leaf, phytomer and tree ages. The branch and fruit allocation is a function of phytomer age. The oil palm PFT experiences an increase in fruit yield during CFT 2–4 and reaches the maximum and steady yield at the most productive period (CFT5). The leaf component is not specifically simulated for each phytomer (dashed rectangle) but implemented at the PFT level with four leaf age cohorts. The major phenological phases for phytomer during the oil palm life cycle are presented with tree ages. LC and CFT refer to leaf cohort and cohort functional type, respectively.
Based on the field evidence, there are three major phenological phases for phytomers during a tree life cycle. The first phase is the first 2 years between oil palm planting and the beginning of fruit fill. In this period, the leaf and branch begin to flourish and expand without fruit production. The second phase is the fruit development phase when fruit begins to grow and harvest begins, while fruit and branch biomass continue to increase. The third phase is the productive phase with high and stable yields that will last until the age of 25–30 years old. This phase ends when the tree grows very tall (harvesting of fruit bunches becomes difficult) and the fruit yield starts to decrease. The modified subroutines of phytomer dynamics are adopted from the forest age cohorts simulated in ORCHIDEE-MICT v8.4.2. The forest age cohort module was originally designed for modelling forest management such as wood harvest and gross land use changes (Yue et al., 2018). This module allows us to represent photosynthesis, allocation and harvest practice for different forest age classes (each tree PFT is divided into six age “cohort functional types” called CFTs) by setting CFT-specific parameters. This module is adopted to represent the rotation cycle of oil palm and the land conversion to or from oil palm. Here, the first phase of oil palm growth from age 0–2 corresponds to CFT1, and the second phase corresponding to CFT2-4 starts from the end of age 2. The most productive phase corresponds to CFT5 from age ∼ 10–25 (Fig. 3). Detailed parameterization for the new oil palm CFTs is presented in Sect. 2.4.
For an adult oil palm tree, the number of newly produced phytomers is stable at around 20–24 per year (Corley and Tinker, 2015). Phytomers are manually pruned twice a month to keep a maximum number of 40 phytomers, while fresh fruit bunches are harvested every 15–20 d (Combres et al., 2013; Corley and Tinker, 2015). Considering the regular development of phytomers and the periodic harvest and pruning practices, the initiation of new phytomers occurs every 16 d, and the phytomer longevity (, Fig. 3) is set by this fixed initiation interval and by the maximum number of expanded phytomers of 40 in the model. Thereafter, we introduce two temporal variables in unit of days, i.e. the critical phytomer age or phytomer longevity (Agephycrit) and the age of each phytomer (). The former defines the time length between phytomer initiation and pruning, while the latter records the age of each phytomer. When the phytomer age reaches the critical value, the pruning practice is triggered and the pruned branch from the phytomer and a group of old leaves from total leaf biomass go into the litter pool of the model. Subsequently, another new phytomer is initiated to maintain the total number of phytomers. The carbon allocation and harvest related to phytomer dynamics is discussed in Sect. 2.3.3 and 2.3.4.
The leaf phenology of a TBE forest is important for seasonal carbon and water fluxes. In another version of ORCHIDEE-MICT, the leaf phenology of TBE forests was implemented using four leaf age cohorts (See Fig. 3) by Chen et al. (2020). Different photosynthetic efficiencies were used for leaf age cohorts to represent the leaf ageing process. In this new canopy phenology scheme, NPP allocation to new leaves is driven by short-wave downwelling radiation (SWdown) and the vegetation optical depth of old leaves (Eq. 1 in Chen et al., 2020), and weekly vapour pressure deficit (VPD) is used to trigger the shedding of old leaves (Eq. 3 in Chen et al., 2020). In the leaf shedding, the leaf longevity used in the VPD-triggered leaf shedding scheme (Eqs. 2 and 3 in Chen et al., 2020) is modified to be the same as phytomer longevity (640 d) to approximate the old leaves' removal in phytomers (it means than when all the “leaves” dies, the phytomer dies). Here, we simplified the leaf growth without considering the “spear leaf” stage. We also ran a test simulation using a shorter Ageleafcrit (620 d, Test1) in the Supplement (Fig. S8). The shedding leaf then enters the litter pool. Here, we adopted this leaf phenology scheme for oil palm modelling.
2.3.3 Phytomer allocation
In ORCHIDEE-MICT, carbon is allocated to leaf, sapwood and root in response to water, light and nitrogen limitation (Krinner et al., 2005). The allocation of carbon to phytomers was simulated following this framework. The allocation to the fruit and branch component for each phytomer was calculated as a fraction of the aboveground sapwood and the reproductive organ, whereas the allocation to leaves was unchanged. For each phytomer, the fraction of aboveground sapwood and reproductive organ allocated to branch and fruit components (, where nphs is the total number of phytomers and i is the index of the phytomer) is a function of phytomer age as follows (Eq. 1). This fraction is further adjusted by the oil palm tree age to account for yield increase with tree growth ( Eq. 2).
where and are prescribed values of minimum and maximum aboveground sapwood and reproductive organ allocation fractions to branch and fruit, which is increased with tree age. Agephy (day) is the age of the phytomer, and Agetree (yr) is the age of the oil palm tree. P1, P2 and P3 are empirical coefficients (set at 0.265, 2 and 0.8; unitless), respectively, based on yield calibration against observations. All abbreviations and parameter values are shown in Table S2. Note that the modifier () range (0–0.07) is for one phytomer, and the total allocation fraction (a range of 0–1) should be the sum of modifiers in all phytomers.
After fruit initiation started (second phase, corresponding to CFT2-4), the allocation strategy changes with more resources shifted to the fruit than the leaf, and the rate of fruit assimilation is accelerated (Corley and Tinker, 2015). This is represented by Eq. (1) with more carbon allocated to old and ripening phytomers to achieve the largest amount of yield. The further separation of branch and fruit () and fruit fractions () follows a similar scheme, i.e. an increase with phytomer age to accelerate fruit accumulation (Eq. 3).
where ffr,min and ffr,max are the tree-age-specific value of minimum and maximum fruit allocation. stands for the branch fraction in the total branch and fruit fraction (), and F1 is an empirical coefficient, set at 0.02 (unitless). The change in and with phytomer age is shown in Fig. 3. The initiation of fruit begins when the phytomer age exceeds the pre-defined ffblagday (16 d). Also notice there is no fruit allocation during the first phase (CFT1).
The total phytomer allocation fraction is a sum of leaf, branch and fruit allocation:
where fleaf is the leaf fraction and fsab+rep is the aboveground sapwood and the reproductive organ allocation fraction.
2.3.4 Fruit harvest
The default wood harvest in ORCHIDEE-MICT is based on the different forest age classes (implemented as CFTs). For each CFT, when the stem biomass reaches the prescribed maximum woody biomass of current CFT, it will move to the next CFT. Wood harvest can start from any CFT by the user's choice, and the default wood harvest sequence starts from the second-youngest CFT to the oldest one and back to the youngest until reaching the required harvest amount (Yue et al., 2018). Unlike wood harvest, oil palm fruit is produced in sequence and harvested regularly. Here we assume the harvested fruits were taken from the oldest phytomer before pruning. The duration between fruit initiation and harvest is prescribed (Ageffbcrit (day), Table S2), and fruits will be harvested after the phytomer age in the oldest phytomer reaches the Ageffbcrit. The harvested fruit biomass is then added to a new separate harvest pool.
2.4 Parameter calibrations for oil palm
Since most parameters vary across different PFTs, we systematically adjusted parameters related to photosynthesis, respiration, carbon allocation and morphology for oil palm according to the observed values from field measurement literature. Some parameters are CFT-specific values in accordance with the tree age cohorts in the model. Details of the parameters for oil palm are summarized in Table S2.
2.4.1 Photosynthesis parameters
The photosynthesis module of ORCHIDEE-MICT is based on an extended version (Yin and Struik, 2009) of the Farquhar, von Caemmerer and Berry model (FvCB model; Farquhar et al., 1980). Leaf age class is introduced to take into account the fact that the photosynthetic capacity depends on leaf age (Ishida et al., 1999). The maximum rate of Rubisco activity (Vcmax) is defined by the prescribed Vcmax25 and weighted leaf efficiency (erel; unitless: 0–1). The relative leaf efficiency (erel) is a function of relative leaf age (Arel), where Arel is the ratio of the leaf age to the critical leaf age (the same as Agephycrit), also known as leaf longevity (Fig. 4, red line). The erel change with Arel in the default ORCHIDEE-MICT version is shown in Fig. 4 (black dashed line), which increases from a low initial value to 1 (reaching the prescribed optimal Vcmax25) for a given period and then decreases to a low level for the old leaves. This was modified by setting the minimum efficiency to 0 at both leaf flushing and longevity based on observations of the leaf phenology of Amazonian TBE forest in another ORCHIDEE-MICT version with leaf cohorts (ORCHIDEE-MICT-AP; blue dashed line) (Chen et al., 2020). However, unlike the natural TBE forest, the old leaves in the old phytomers of oil palm are probably more productive to sustain the high fruit amount because of the sequential growth, phytomer pruning and fruit harvest. Thus, erel for the old leaves of oil palms is maintained the same as the value in the default ORCHIDEE-MICT version (red line in Fig. 4). We also adjusted Vcmax25 for each tree age class of oil palm according to the experimental evidence (Fan et al., 2015; Meijide et al., 2017; Teh Boon Sung and See Siang, 2018) (Table S2). Vcmax25 for oil palm increases with tree age (from 35 to 70 ) corresponding to the increase in gross assimilation (Breure, 1988). Another two important parameters for photosynthesis are maximum leaf area index (LAImax, controlling the maximum carbon allocation to leaf biomass) and specific leaf area (SLA). The observed maximum LAI varies from 4 to 7 m2 m−2 across different genotypes, plant densities and soil types (e.g. peat) according to nine observation-based publications listed in Table S2, and LAImax was found to increase with oil palm tree age (Kallarackal, 1996; Kotowska et al., 2015; Legros et al., 2009). SLA, by contrast, generally decreases with oil palm tree age from 0.0015 to 0.0008 m2 g−1C (Van Kraalingen et al., 1989; Legros et al., 2009; Kotowska et al., 2015). We thus used a CFT-specific value which is close to the median values of LAI and SLA obtained from observational data (Table S2).

Figure 4Relative leaf efficiency (erel) as a function of relative leaf age (Arel) used in (1) this study, ORCHIDEE-MICT with oil palm (ORCHIDEE-MICT-OP), (2) the default ORCHIDEE-MICT version (ORCHIDEE-MICT) and (3) the ORCHIDEE-MICT version with the new leaf phenology scheme in Chen et al. (2020) (ORCHIDEE-MICT-AP).
2.4.2 Respiration parameters
Autotrophic respiration (AR, including maintenance and growth respiration, MR and GR) in ORCHIDEE-MICT is based on the work of Ruimy et al. (1996). MR is a function of the temperature and biomass for each plant part (Eqs. 6–7), whereas GR is prescribed as 28 % of the allocable assimilates for the TBE tree PFT (Krinner et al., 2005). Field evidence shows that MR in gross assimilation of palm increases with oil palm tree age but MR per unit of tree biomass decreases (Breure, 1988). In total, AR represents 60 %–75 % of GPP for oil palms (Henson and Harun, 2005). Based on this prior knowledge, we adjusted both the constant S1 in Eq. (7) and the fraction of GR in GPP (fGR). The former parameter (S1) increases with age and the latter does the opposite (fGR) (Table S2). The parameter values were calibrated to match the observation of GR/MR, AR/GPP and GPP.
where j is the different plant parts. C0 is prescribed for each plant part for each PFT. T is the 2 m temperature/root temperature for above-/belowground compartments. Tl is the long-term (annual) mean temperature. Slope is the second-degree polynomial dependency of Tl. S1, S2 and S3 are empirical coefficients.
2.4.3 Carbon allocation parameters
Carbon allocation to new leaves in the ORCHIDEE-MICT-OP was modified following the ORCHIDEE-MICT-AP by Chen et al. (2020) as described in Sect. 2.3.2. The leaf allocation (fleaf) is both related to the amount of sunlight available at the top of canopy and the light transmission of old leaves so that the fleaf is expressed as a function of higher short-wave downwelling radiation (SWdown) and LAI of the old leaves as follows:
where fleaf,min and fleaf,max are the prescribed values for minimum and maximum leaf allocation. LAI4 is the LAI of the oldest leaf age cohort 4. L1, L2 and L3 are empirical coefficients, set to be 0.45, 100 and 3 (unitless), based on the calibrations using observed NPP allocation among leaf, sapwood and fruit (Henson and Dolmat, 2003; Van Kraalingen et al., 1989).
The original leaf (fleaf,ori), root (froot,ori), and sapwood and reproductive tissue () allocation scheme in response to water, light and nitrogen in the ORCHIDEE-MICT-OP was modified from the default ORCHIDEE-MICT. To harmonize the new leaf allocation fraction (fleaf) and the original one (fleaf,ori), root, sapwood and reproductive organ allocation fractions were further rescaled:
where froot,min and froot,max are the prescribed values of minimum and maximum root allocation according to Kotowska et al. (2015). R1 is an empirical coefficient (= 0.95).
NPP partitioning between the aboveground part of sapwood, reproductive organ and belowground sapwood biomass is a function of tree age. Older trees get more allocation to the aboveground part than younger ones (Krinner et al., 2005). In the default ORCHIDEE-MICT version, the values of minimum and maximum NPP partitioning to aboveground biomass are constant. By contrast, observed oil palm gross assimilation increases with age (Breure, 1988), and most of the assimilates go into the phytomer to sustain fruit production. In ORCHIDEE-MICT-OP, we adopted the original model equation of allocation to aboveground sapwood and the reproductive organ (fsab+rep) increasing with age (Eq. 9) but adjusted parameters to match the observations.
where and are prescribed tree-age-specific values of minimum and maximum allocation to the aboveground sapwood and the reproductive organ, which increases with tree age. Agetree is the oil palm tree age, and θ is the empirical CFT-dependent coefficients (Table S2).
2.4.4 Other parameters
Other adjustments of parameter values include morphological, phenological and turnover parameters. The maximum number of phytomers (nphs) is set as 40 according to observations (Combres et al., 2013; Corley and Tinker, 2015). Given the phytomer initiation rate of 20–24 per year, the pruning frequency of twice a month and the number of phytomers (Combres et al., 2013; Corley and Tinker, 2015), the critical phytomer age (Agephycrit) is estimated to be around 600 to 720 d. Based on previous studies (Van Kraalingen et al., 1989; Corley and Tinker, 2015; Fan et al., 2015), the leaf longevity for oil palm is 600–700 d, shorter than the 730 d used for the default TBE tree PFT in ORCHIDEE-MICT. As a result, both the critical leaf age (leaf longevity) and the critical phytomer age (Agephycrit) are set to be 640 d. The critical fruit age (Ageffbcrit), defined as the duration between the fruit initiation and harvest, is set as 600 d, that is, shorter than the critical phytomer age, allowing leaf senescence after the fruit harvest.
After pruning, cut branches in a pruned phytomer are transferred to the litter pool. Considering that the removal of leaves is not very well represented at the time of phytomer pruning, we further added an extra leaf loss () of the old leaves (using the leaf age cohort) at the time when the oldest phytomer is manually pruned as follows:
where is the leaf biomass for leaf cohort m and LO1 is an empirical leaf loss coefficient.
In the default ORCHIDEE-MICT version, the carbon residence time (τ) of biomass is set as 70 years for natural tropical forests to represent the natural mortality. Oil palms, on the other hand, are managed and are clear-cut at ∼ 25 years for the next rotation cycle. The natural tree mortality is thus not applicable for oil palms. In ORCHIDEE-MICT-OP, we assumed that oil palm is manually cut down for rotation before the natural mortality without considering the disease and other causes of tree loss as well (clear-cutting every 25 years, Fig. 5).

Figure 5Tree age classes of oil palm along with the temporal change in total biomass. (a) An example of oil palm tree age class dynamics: (1) keep growing and move to the older tree age class; (2) move to the youngest age class after clear-cutting for rotation. (b) The growing curve of total biomass for the oil palm tree. The labelled numbers are the biomass boundary of each CFT.
2.4.5 Sensitivity analysis
Because of the distinct age cohorts of oil palm and age-based parameterizations for photosynthesis and allocation in ORCHIDEE-MICT-OP, performing the sensitivity analysis on every age-specific parameter would be too CPU intensive. Instead, we performed sensitivity tests of the major parameters related to oil palm photosynthesis and allocation, particularly for the phytomer-related allocation parameters without enough constraints from field observations. For the age-specific parameters (e.g. Vcmax25, sla), the calibrated value for CFT5 (the most productive phase with the maximum yield) was tested. The sensitivity tests were conducted by changing the selected parameters (variables with * in Table S2) by ±5 %, ±10 % and ±20 % from the originally calibrated value while keeping the other parameters unchanged. Their impacts on the cumulative yields at the most productive phase ageing from 10–25 (corresponded to CFT5) were evaluated. For the grouped parameters such as the phytomer allocation coefficient (), the sensitivity was tested by changing ±5 %, ±10 % and ±20 % of the target function () using different combinations of P1–P3.
2.5 Site simulation setup
The 6-hourly 0.5∘ global climatic data, CRUNCEP v8 and the 0.08∘ global soil texture map were used as forcing data in the simulations (Reynolds et al., 2000). The vegetation cover of the 14 sites (Fig. 1 and Table S1) was all set to the oil palm PFT with a coverage of 100 %. Biomass boundary values for each age class (Fig. 5) are prescribed for oil palm based on the prior knowledge from observation (Tan et al., 2014). When the total biomass reaches the lower boundary of the oldest tree age class (CFT6, Figs. 3 and 5) and moves to CFT6, wood harvesting will be performed, and oil palm trees will thus be cut down. New oil palms will be established in the youngest tree class (CFT1) for the next rotation cycle. Site simulations were run for 30 years, which is consistent with the rotation duration of ∼ 25 years, and the climatic forcings for the period between 1986 to 2015 were used. Spin-up simulation was not performed since we did not focus on the soil organic carbon and there is no feedback of soil carbon to plant growth in the model. Oil palm yields at maturity were calculated using the average values during 11–20 years for comparison. Fruit yields are converted to kg dry matter (DM) ha−1 yr−1 using a carbon ratio of 0.45.
3.1 LAI and leaf phenology
Figure 6 shows the annual dynamics of observed and simulated LAI vs. tree age averaged over the 14 observation sites (black line). For each age, we collected observational LAI values from different field measurement studies and presented the medians and ranges (the red marker and error bar) in Fig. 6. Since there are no continuous LAI measurements available (to the best of our knowledge), we combined single LAI measurements at a certain age from different studies. The simulated LAI increases from 0.3 to 5.3 in the first ∼ 10 years and then stays stable at the maximum value (5.5, Fig. 6). The simulated LAI trajectory can generally reproduce the trend from observations. Although simulated LAI ranges overlap with the ranges of LAI observations at most ages, some observations are not reproduced at Age 13 and Age 19 when the model achieved a stable and maximum LAI (Fig. 6). This variability of LAI measurements reflects the use of different sites with different oil palm species and management practices. In the model, however, genotypes and practices are uniform. The detailed intra-annual variations in LAI, combined with leaf biomass and Vcmax for each leaf age cohort, are shown in Fig. S3 with significant seasonality after merging the leaf phenology scheme from Chen et al. (2020). Compared to the ORCHIDEE-MICT version with no seasonality in LAI (dashed line in Fig. S3a), the LAI of young leaves increases but decreases for old leaves during the canopy rejuvenation period (January to May, solid line in Fig. S3a). The opposite behaviour is shown in the rest of the year. Similarly, the default ORCHIDEE-MICT version shows no seasonality of leaf age and leaf photosynthetic efficiency in different leaf age classes (dashed line in Fig. S3b and c), while the seasonality of leaf age and leaf efficiency is successfully captured in this version (solid lines in Fig. S3b and c).
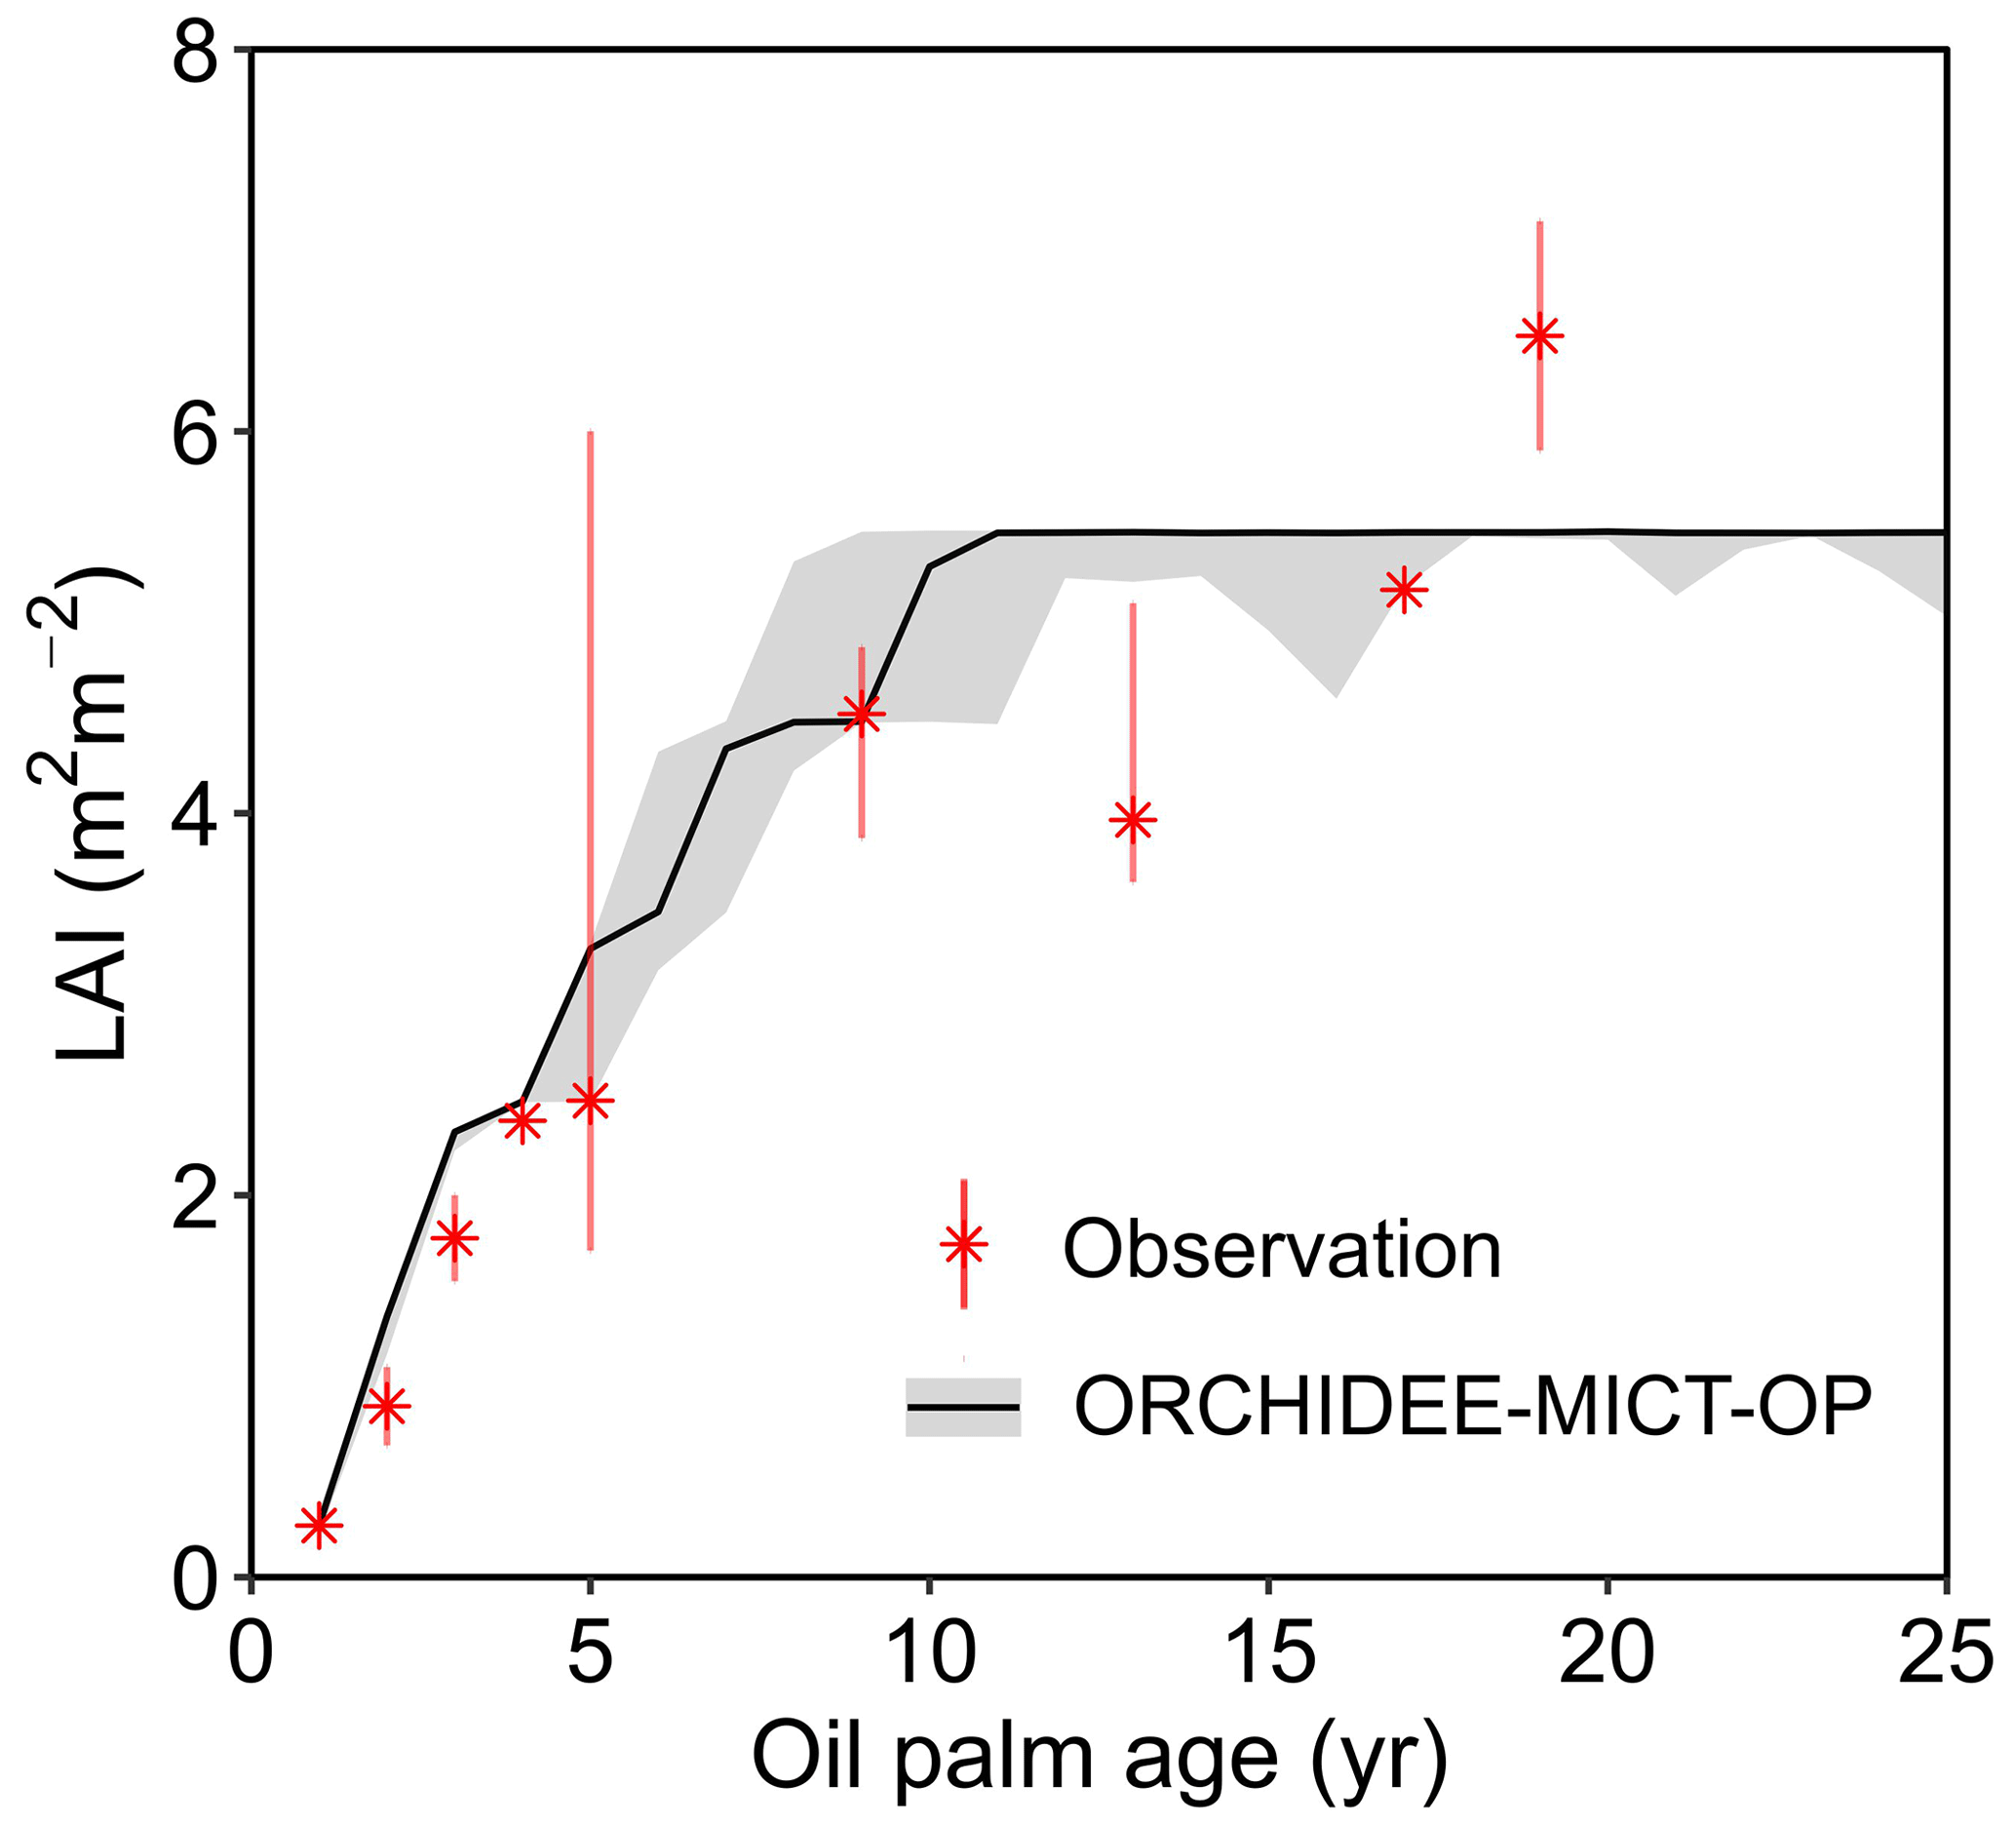
Figure 6Temporal dynamics of LAI for oil palm. The black solid line and the grey shade indicate the median and range of simulated LAI for oil palm across all sites in ORCHIDEE-MICT-OP. The error bars of observations represent the range of different observations at a certain age from various locations, treatments and species.
3.2 Productivity and fruit yield
The simulated GPP, NPP and fruit yield in comparison with field measurements are shown in Fig. 7. Compared to the default ORCHIDEE-MICT version, NPP can be better reproduced by ORCHIDEE-MICT-OP (solid squares closer to the 1:1 line than the open square, Fig. 7a) with a normalized mean bias error (NMBE, defined as the sum of biases divided by the sum of field values) of 12.87 % and r2 of 0.9 across sites. Among the 14 sites with NPP observations, simulated NPP at Sites 1, 7 and 12 is comparable with observations with an NMBE of only 4.0 % while simulated results from other sites are relatively higher than observations (NMBE of 28.8 %). For GPP, there are only three observations available, and simulated values by ORCHIDEE-MICT-OP are relatively higher than the observed values with an NMBE of 25.4 %.
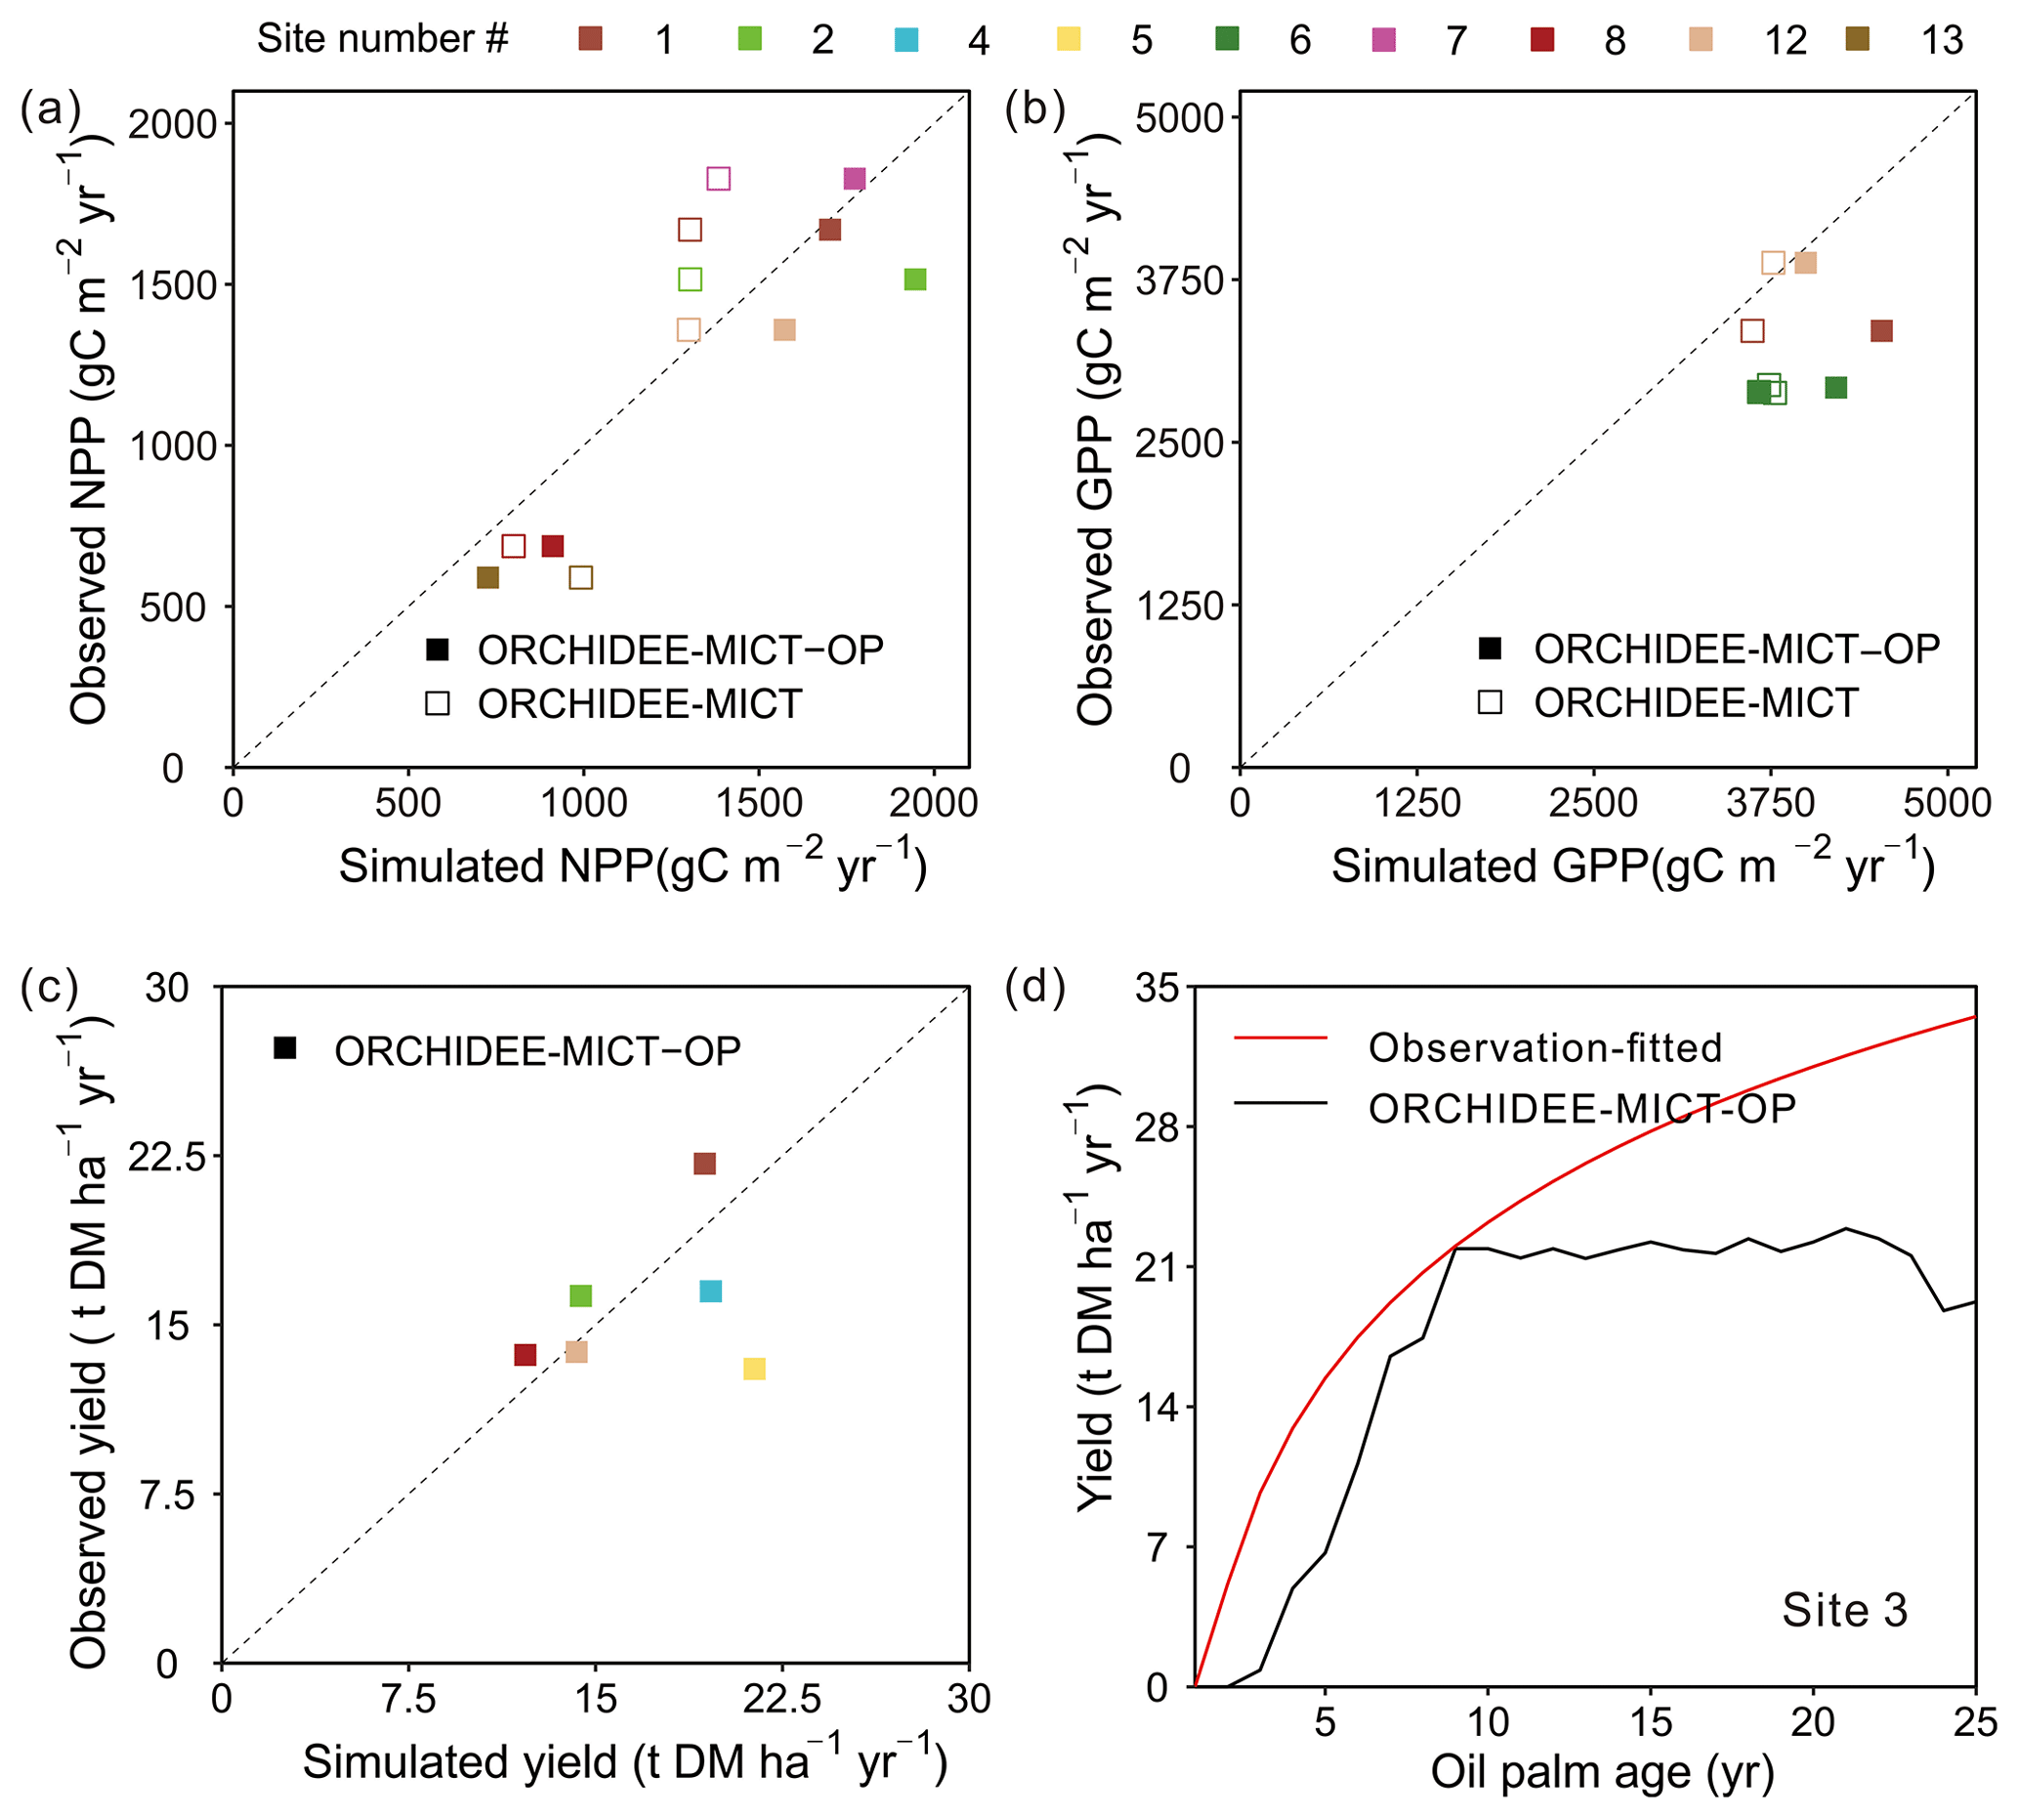
Figure 7Comparison of simulated (a) NPP, (b) GPP, (c) fruit yield and (d) temporal dynamics of yields against observations. “ORCHIDEE-MICT-OP” refers to the simulation results by the ORCHIDEE-MICT-OP version using the newly added oil palm PFT. “ORCHIDEE-MICT” refers to the simulation results by the default ORCHIDEE-MICT version using the TBE tree PFT. The dashed line indicates the 1:1 ratio line.
For fruit yields, we collected six single-year observations at different sites for oil palm plantations aged from 10–15 years, except for one site where yield data cover ages 4 to 16. The observed oil palm yields at maturity vary from 13.0 to 22.1 t DM ha−1 yr−1 with a median of 15.0 t DM ha−1 yr−1, and the simulated yields show a similar range of 12.2–21.4 t DM ha−1 yr−1 with a median of 16.9 t DM ha−1 yr−1. Thus, simulated fruit yields show an overall good agreement with site observations with an NMBE of 6.1 % (Fig. 7c). There is only one site (Site 3) with available yield estimates for successive years (Fig. 7d). It should be noted that it is not real observations but a fitted curve with oil palm age of yield data provided by the Malaysian Palm Oil Board (MPOB) research station at Keratong (Tan et al., 2014). This yield-age curve shows a strong yield increase after Age 10 and even Age 25 (Fig. 7d), which goes against the field evidence that fruit yields for oil palms reach a maximum at ∼ 10 years, stay relatively stable and decrease after ∼ 25 years (Goh et al., 1994; van Ittersum et al., 2013). The reduction in yields after ∼ 25 years is also one of the reasons for clear-cutting for the next rotation. Still, we compared our simulated yields with that yield-age curve (Fig. 7d). The simulated annual fruit yield at Site 3 is generally consistent with data during the first 9 years but lower than the curve in the subsequent years, probably due to the uncertainties in the yield-age curve. Besides, the simulated annual and cumulative yields also showed good agreement with observations at the two independent sites (site in the Merlimau estate in Fig. 11, Teh and Cheah, 2018, and site PTPN-VI in Fig. 6, Fan et al., 2015), indicating the model's ability to capture yield dynamics (Figs. S6 and S7).
3.3 Biomass
Figure 8 shows the comparison of simulated biomass and time series with observations. The biomass here includes the developing fruit but excludes the harvested fruit biomass. Note that some sites have several observed values (Sites 1, 2, 9 and 10 in Fig. 8a) at different ages and for biomass components, e.g. total biomass (TB), aboveground biomass (AGB) and belowground biomass (BGB). A total of 13 biomass observations were collected for different age groups (three in the young age group, eight at maturity, and the remaining two for averaged biomass among several years, Table S1). Compared to the default ORCHIDEE-MICT version, simulated biomass by ORCHIDEE-MICT-OP is more consistent with observations (Fig. 8a). Of the 13 sites, 10 are distributed close to the 1:1 line, except for Site 2 (TB at age 10), Site 9 (AGB at age 16) and Site 10 (AGB at maturity). The NMBE of oil palm biomass is 10.4 % after excluding Site 9 with the largest bias, compared with 156.7 % by the default ORCHIDEE-MICT. We further compared the simulated above- and belowground biomass and their ratio with observations (Fig. 8b). Similarly, the ORCHIDEE-MICT-OP version can better reproduce the observations than the default ORCHIDEE-MICT version. The NMBE for above- and belowground biomass between ORCHIDEE-MICT-OP and observations is 12.1 % and 55.3 %, respectively. The ratio of AGB and BGB is calculated as being 1.7, which is much closer than the observation (1.1–3.0) compared with that of the default ORCHIDEE-MICT (0.7–0.8).
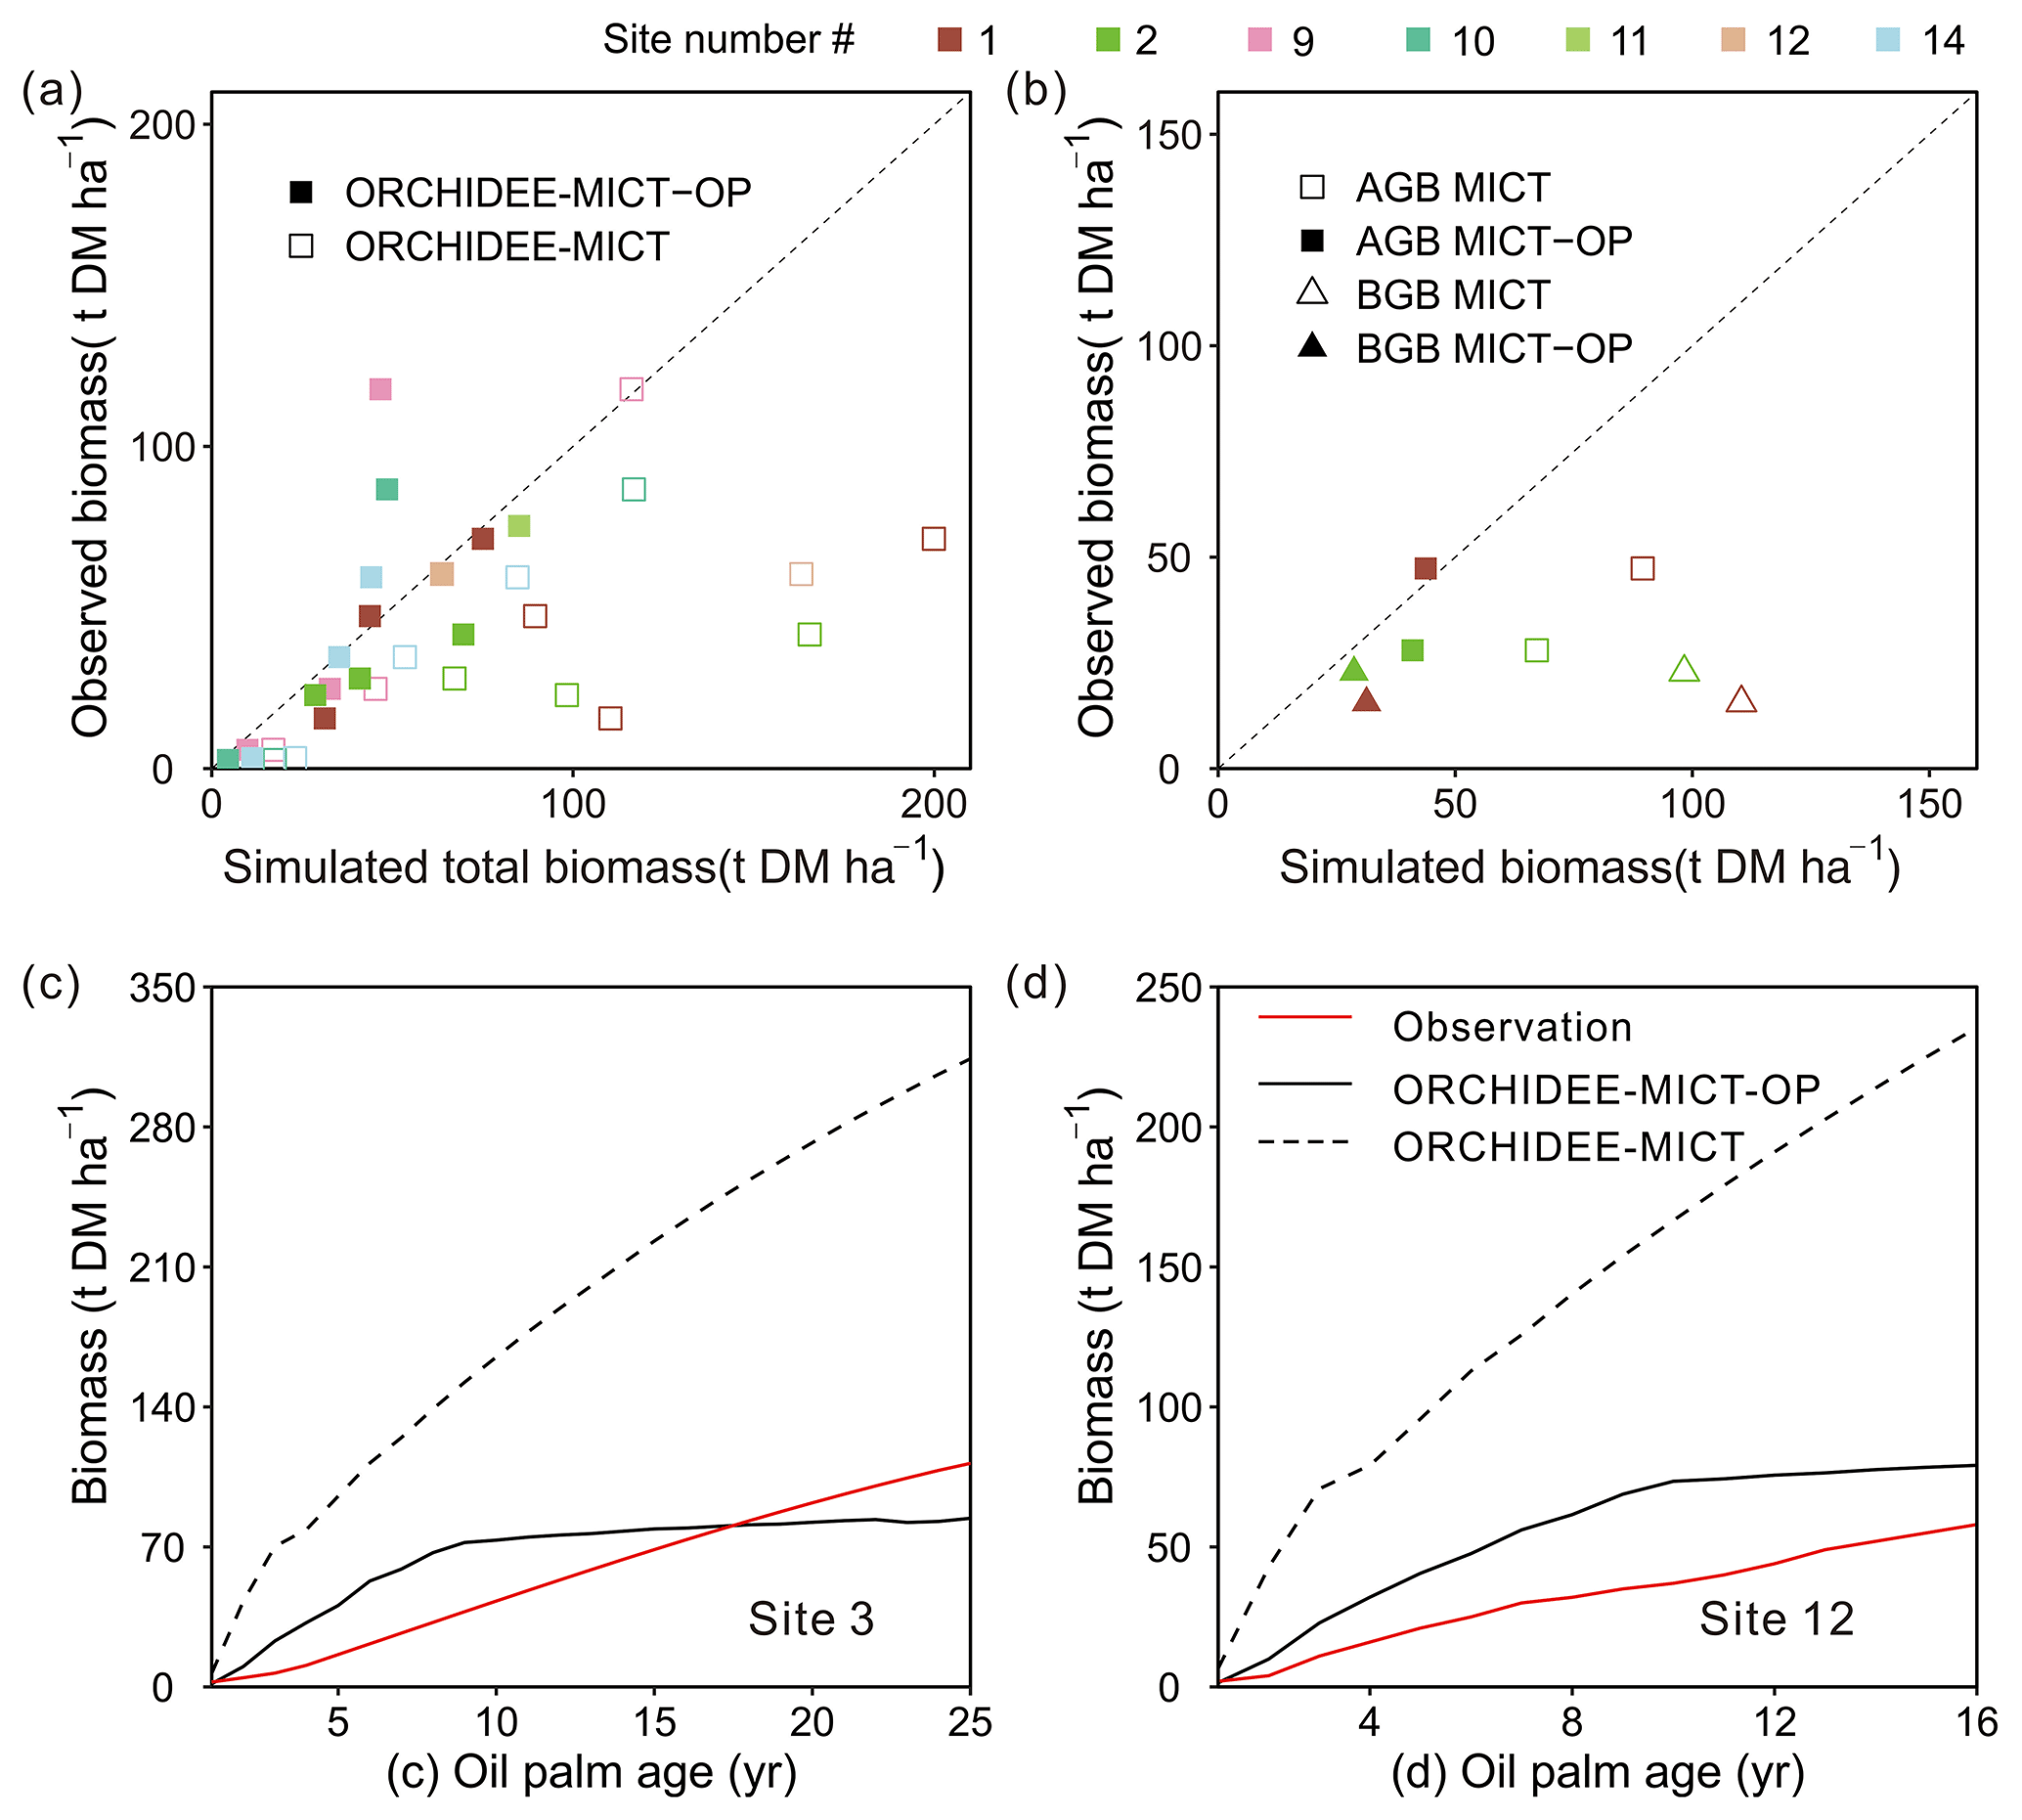
Figure 8Comparison of simulated (a) total biomass, (b) aboveground biomass (AGB) and belowground biomass (BGB), and temporal dynamics of estimated biomass for oil palm at (c) Site 3 and (d) Site 12 against observations. The observations from Site 3 and Site 12 were calculated by an allometric equation using the measured diameter at breast height (DBH) and height of the stem. “ORCHIDEE-MICT-OP” refers to the simulation results by the ORCHIDEE-MICT-OP version using the newly added oil palm PFT. “ORCHIDEE-MICT” refers to the simulation results by the default ORCHIDEE-MICT version using the TBE tree PFT. The dashed line in (a) and (b) indicates the 1:1 ratio line.
There are only two sites (Sites 3 and 12, Fig. 8c and d) with time series of biomass. Similar to the fruit yields (Fig. 8d) simulated biomass by ORCHIDEE-MICT-OP generally agrees with observed values but is higher in the first 18 years and lower afterward (Fig. 8c). At Site 12, ORCHIDEE-MICT-OP-simulated biomass is higher than observations for the whole oil palm life cycle. This is probably because Site 12 was covered by very deep peat soil (> 3 m) with a high soil water table and high C density, and the potential impact on the oil palm production is not considered (e.g. different nutrient availability in peat and mineral soil and palm leaning in peat soil which may cause the decline of yield). A detailed discussion of the oil palm on peat is presented in Sect. 4.2 and 4.3. Also, the calibration is based on the observations from all sites and no calibration was applied for this site, which may cause the higher estimation. The NMBE is 16.2 % and 15.5 % at Site 3 and Site 12. The default ORCHIDEE-MICT version largely overestimated the biomass at both sites (dashed line in Fig. 8c, d).
3.4 Partitioning of GPP, NPP and biomass
Comparison of oil palm GPP and biomass partitioning between simulations and observations is shown in Fig. 9. Compared to the default ORCHIDEE-MICT version (grey bars), simulated results from the ORCHIDEE-MICT-OP version (black bars) are closer to the observations (red bars, Fig. 9). GPP is partitioned into GR, MR and NPP, whereas NPP is further divided into allocation to stem and frond, root and fruit (Fig. 9a). The simulated growth and MR fraction in GPP ranges from 17.1 %–28.8 % and 28.1 %–54.3 %, respectively, which is comparable with observations (21 %–31 % and 34 %–44 %) from Henson and Dolmat (2003). The simulated fraction of autotrophic respiration in GPP (60.87 %) is also consistent with the observed fraction (60 %–75 %, Henson and Harun, 2005). In the simulation by ORCHIDEE-MICT-OP, stem and leaf (median of 18.9 % in GPP) occupies the largest parts of NPP, followed by fruit allocation (17.5 %) and root allocation (2.8 %). The differences between the simulated NPP fraction for stem and leaf, root and yield by ORCHIDEE-MICT-OP and observed fraction are 10.9 %, −1.4 % and −2.0 %, respectively, indicating a good representation of NPP allocation to different biomass components in the new model.
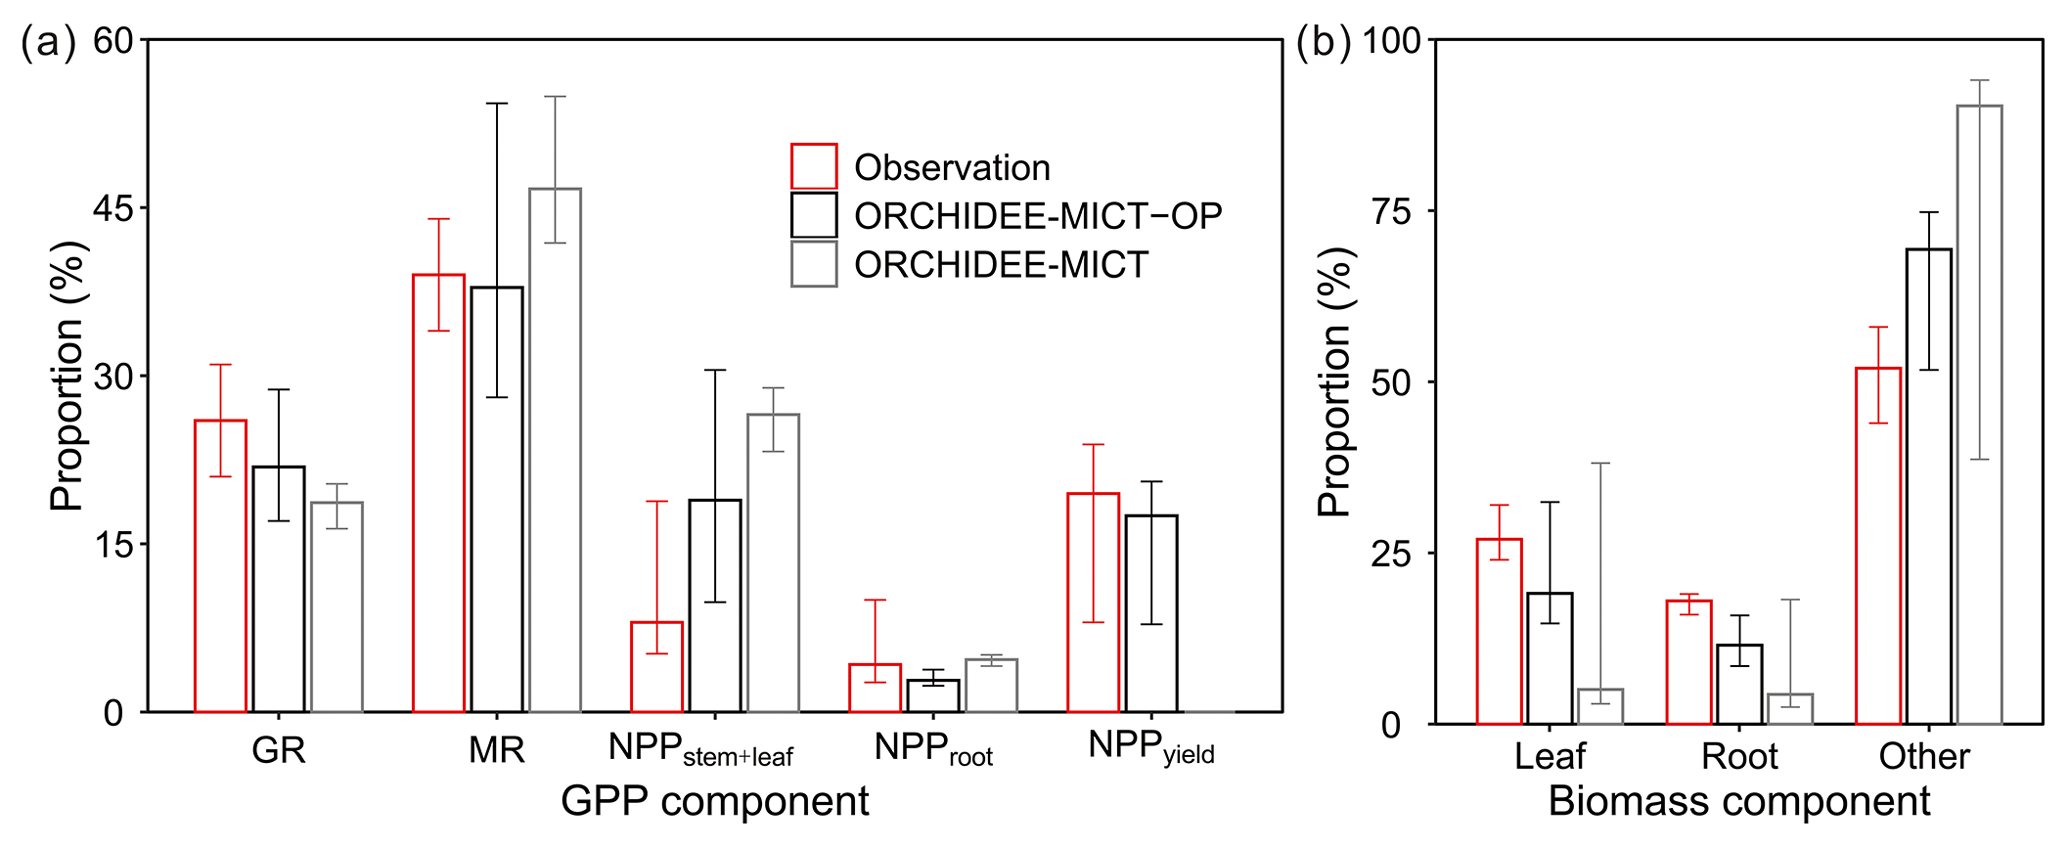
Figure 9Components of (a) GPP and (b) standing biomass. The fruit component in (b) is the developing fruit in the phytomer and the harvested fruit is not accounted for in the total biomass. Error bars show the ranges across different sites and ages. GR and MR stand for growth respiration and maintenance respiration.
Simulated partitioning of biomass by ORCHIDEE-MICT-OP is closer to observations (Breure, 1988; Henson and Dolmat, 2003; Tan et al., 2014) than the default ORCHIDEE-MICT version (Fig. 9b). The simulated leaf and root and other organs (stem, fruit and branch biomass) proportion of total biomass varies between 51.7 %–75.1 %, 14.7 %–32.4 % and 8.5 %–16.0 %. The simulated fraction to other organs is higher (14.7 %) than observations, and correspondingly it is lower for leaf (−6.1 %) and root (−5.6 %) fractions; the improvements reach 18.8 %, 13.0 % and 6.2 % compared to the biases in the default ORCHIDEE-MICT. Note that the proportion of fruit bunch and branch of a phytomer is not separated but added in the stem proportion because most of the studies presented fruit and branch biomass fraction as a part of stem biomass (Van Kraalingen et al., 1989; Henson and Dolmat, 2003). Also, the time and frequency of collecting fruits and measuring biomass are usually not synchronous. There is only one field study showing that the phytomer (fruit and branch) fraction varies between 5.0 %–14.5 % of the total biomass after fruit harvest (Breure, 1988), which is comparable with the simulated median proportion of 14.4 % by ORCHIDEE-MICT-OP.
3.5 Phytomer development
The growth of phytomers during the life cycle (initiation, fruit development and productive phases) of oil palm is presented in Fig. 10. Figure 10a and b show the fruit and branch growth in single phytomer (8 in 40 phytomers were shown for a better visualization), while Fig. 10c is the total biomass for all the 40 phytomers as a sum of leaf, branch and fruit components. The initiation phase roughly corresponds to an oil palm tree age between 0 to 2 without any fruit production. Subsequently, age 2–10 is the fruit development phase. After 10 years old, an oil palm reaches the productive phase with maximum and steady fruit yields. This phenological characteristic is consistent with the oil palm development observed in previous studies (Sunaryathy et al., 2015). One study even shows that the productive phase can start as early as at ∼ 7 years old (Henson and Dolmat, 2003).
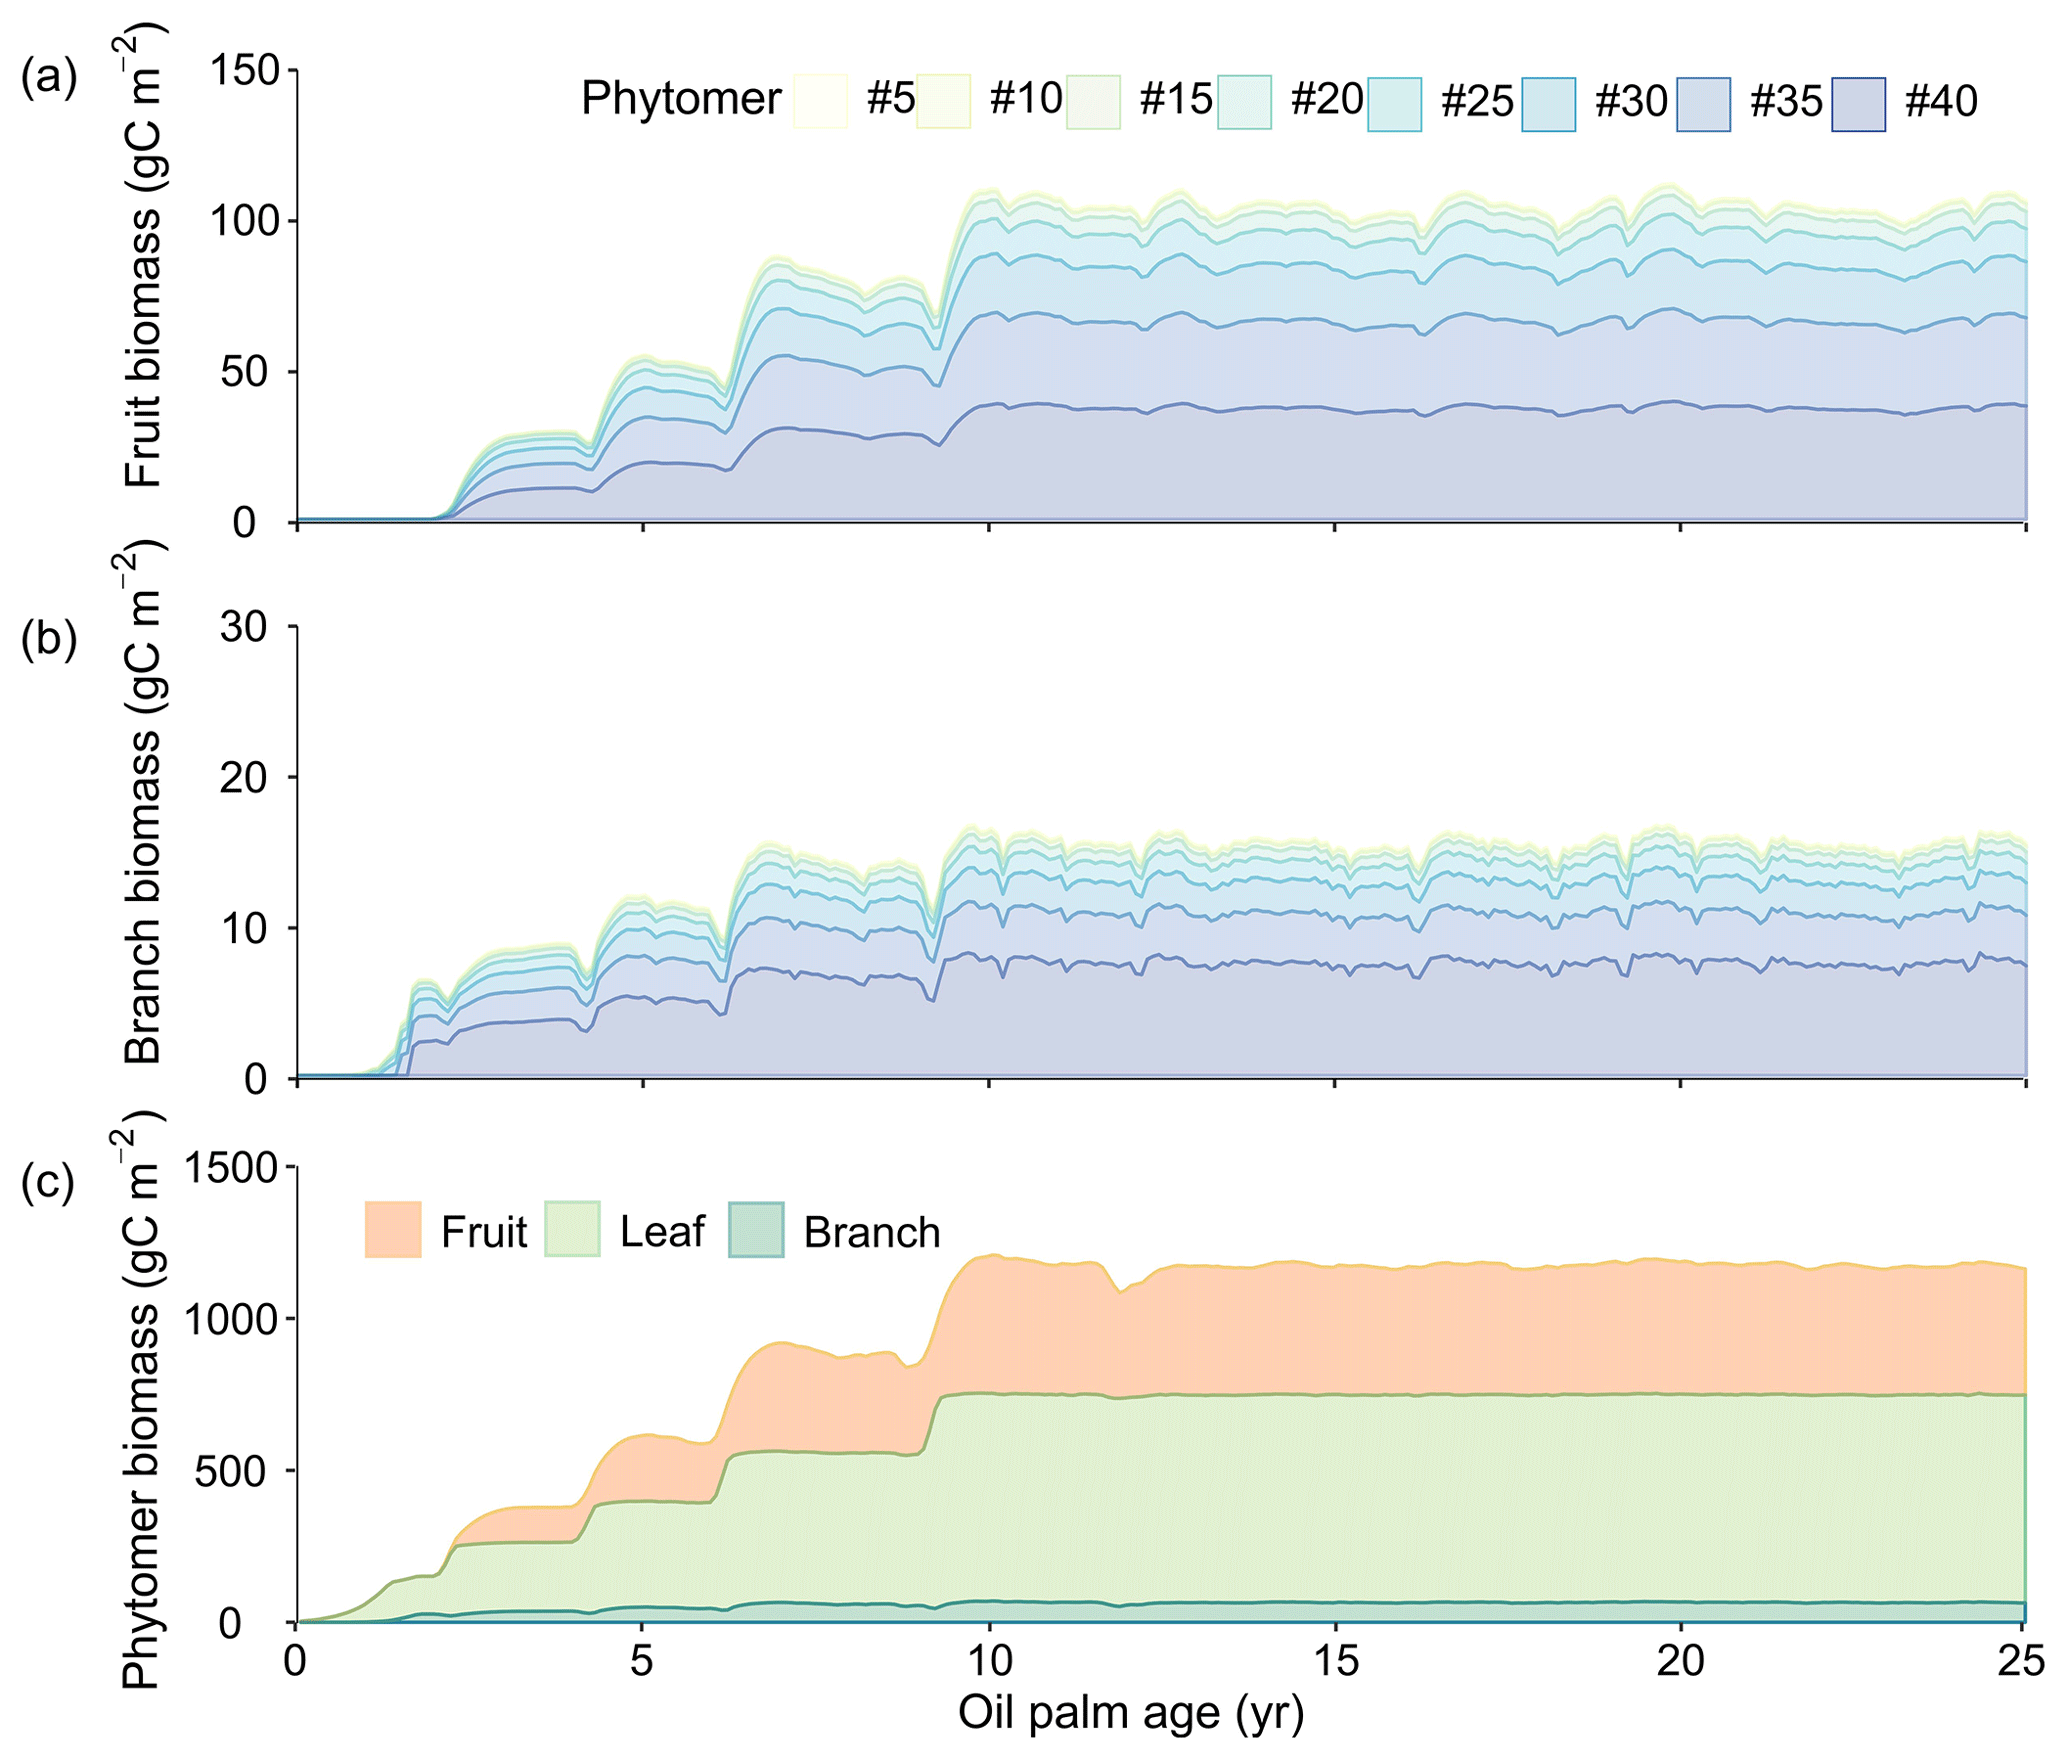
Figure 10Temporal development of phytomer biomass: (a) fruit (b) branch and (c) phytomer biomass. The colours in (a) and (b) represent the fruits and branches from the eight representative phytomers. Only eight representative phytomers (no. 5, no. 10, no. 15, no. 20, no. 25, no. 30, no. 35 and no. 40) are shown in (a) and (b) for better visualization. The total phytomer biomass in (c) is split into fruit, leaf and branch biomass for all the 40 phytomers aggregated.
The biomass of leaf and branch of all the phytomers starts to increase after planting (Fig. 10c) and reaches about 211.3 and 28.6 gC m−2 at the end of age 2. The fruit production and harvest begin after entering the fruit development phase (the end of age 2) (Fig. 10a), whereas the total fruit biomass increases rapidly to 367.6 gC m−2 at age ≈ 10. From age 2 to 10, phytomer biomass increases with a step shape, and fruit and branch biomass slightly decline when moving from one tree age class to the next older class. This is because values for some parameters (e.g. Vcmax and LAImax, Table S2) are different among the CFT 2–4 in the fruit development phase. For example, LAImax increases from 3.5 in CFT3 to 4.5 in CFT4. In the ORCHIDEE framework, biomass will preferentially be allocated to the leaf to reach LAImax in order to grow more leaves to increase GPP and then be allocated to other biomass parts when LAI reaches LAImax (Krinner et al., 2005). Therefore, when oil palms move from CFT3 to CFT4, the increased LAImax drives more biomass going to leaf (Fig. 10c) and less to the fruit and branch at the beginning of CFT4, resulting in the small decline in the fruit and branch biomass. We acknowledge that this model behaviour may contradict the reality, but the small magnitude and short duration of the decline (Fig. 10c) may have little impact on the modelling results. At the productive (maturity) phase after age 10, the average leaf, fruit and branch biomass is 683.8, 424.0 and 64.8 gC m−2, which consists to 58.3 %, 36.1 % and 5.5 % of the total phytomer biomass (40 in total), respectively.
3.6 Sensitivity analysis results
The maximum rate of carboxylation (Vcmax25) is the most sensitive photosynthesis parameter because it determines the photosynthesis rates of the leaf, followed by sla. Changes of ±20 % of the baseline value of Vcmax25 lead to 13.8 %20.5 % increase/decrease in the cumulative yields from age 10 to 25 (Fig. 11). The maximum leaf area index (LAImax), a threshold beyond which there is no allocation of biomass to leaves, has a smaller influence on the yields than Vcmax25 and sla. Yields are not changed linearly with changes in the LAImax value since it is a threshold parameter by definition.
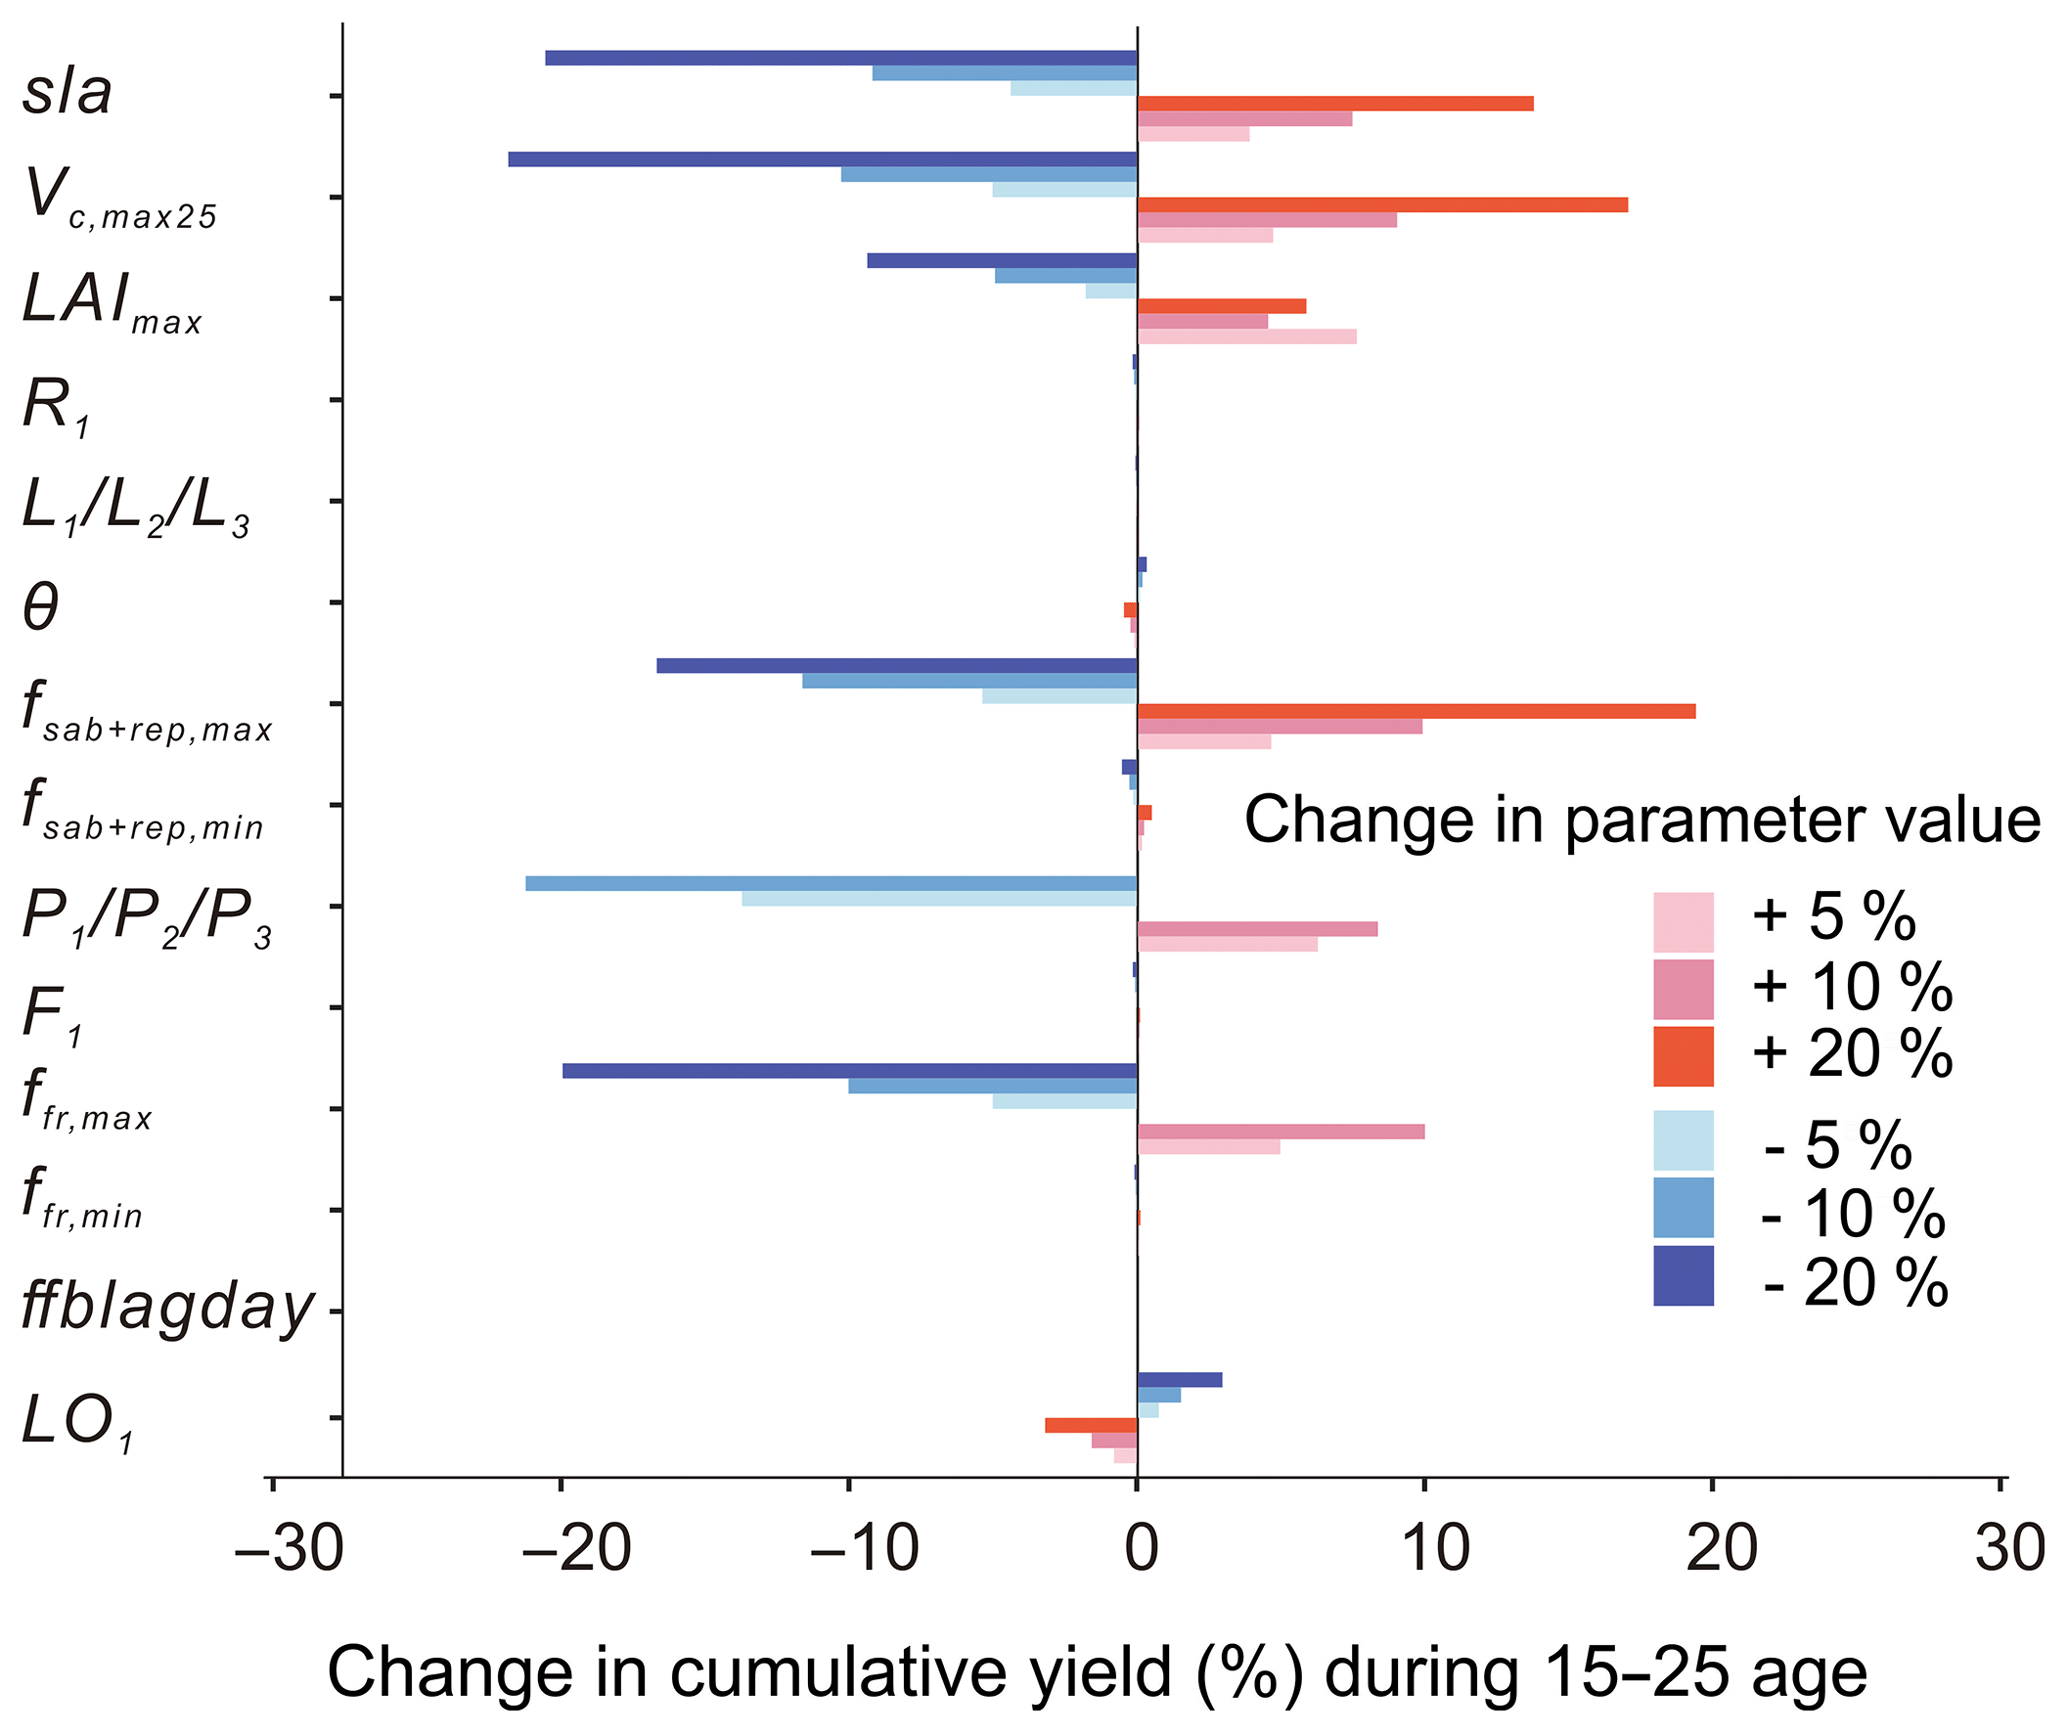
Figure 11Change in cumulative yields by varying ±5, ±10 and ±20 % of the key parameters related to photosynthesis, allocation and turnover in the oil palm modelling. Parameters are changed one by one, while the others are kept the same.
For the allocation parameters, the empirical coefficients for the leaf () (Eq. 8) and root (R1) (Eq. 9) allocation have a very small impact on the fruit yields. The other allocation parameters are more or less related to the NPP allocation to aboveground sapwood and the reproductive pool, which influence the dynamics of the phytomer biomass and fruit yields. Among these parameters, yields are most sensitive to the phytomer allocation coefficients () (Eqs. 1 and 2) which determine the NPP partitioning to phytomer (10 % decrease in leads to a decline of 21.23 % in yield). The parameter controls the upper boundary of allocation to the aboveground sapwood and the reproductive organ (Eq. 11) and brings a 19.4 % increase in yields by changing +20 % of the default value. Similarly, increasing/decreasing (10 %) maximum fresh fruit bunch allocation fraction (ffr,max) results in a significant increase/decrease (10 %) in yields. By contrast, changing the baseline values of , ffr,min, F1 (fruit bunch allocation coefficient), θ (the coefficient of partitioning allocation between above- and belowground sapwood) and ffblagday leads to little influence on the final cumulative yields. The turnover-related parameter LO1 has a negative impact on cumulative yields. The increase in LO1 increased the old leaf loss throughout phytomer pruning and results in a lower yield.
4.1 Model performance before and after oil palm implementation
Based on the default ORCHIDEE-MICT version and the leaf age cohort scheme in the ORCHIDEE-MICT-AP version, the oil palm PFT has a new phytomer organ and a yield harvest pool (Fig. S2), with other model parameters recalibrated. The new ORCHIDEE-MICT-OP version allows for simulating oil palm morphology, phenology, biomass growth and yields. We evaluated the LAI, GPP, NPP, yields and biomass of oil palm in ORCHIDEE-MICT-OP using available observations from previous field measurement studies (Table S1).
In the default ORCHIDEE-MICT version, oil palm is taken as the TBE tree PFT, which causes biases in the simulation. For example, it is impossible to realize regular fruit harvest and phytomer dynamics in the default ORCHIDEE-MICT version without the phytomer structure and the fruit harvest pool. The introduction of the phytomer structure and the sequential developing processes allows the reproduction of variable developmental stages for each phytomer including the initiation, fruit production, harvest and pruning in the model. Besides, the modification of the carbon allocation scheme improves the allocation of the assimilated carbon and partitioning of biomass pools (Fig. 9). Oil palm trees have specific physiological characteristics which are different from other tropical forests. The evolution of physiology with age is implemented by a new tree-age-specific parameterization scheme based on the tree age cohort module of ORCHIDEE MICT. Carbon assimilation is accelerated with increasing oil palm age. Carbon allocation to the phytomer shifts more resources to the fruit than the leaf and branches as fruits mature. Consistent with observations, the fruit yields also show an increase from young to old trees. To our best knowledge, distinct age classes of oil palm and the age-based parameterizations for photosynthesis and autotrophic respiration dynamics have not yet been implemented in the previous LSMs aiming to simulate oil palm biophysical variables. The leaf age cohort-based phenology scheme from ORCHIDEE-MICT-AP was also adapted for oil palms to improve the seasonality of leaf and photosynthesis (Fig. S3). This process was not included in any previous oil palm models either. Moreover, the calibration for age-specific parameters is based on the 14 individual observation sites with variable climate and soil conditions, and we also compared the simulation results with observations for a range of variables including biomass, yield, LAI, GPP, NPP, biomass component and GPP component. Therefore, our parameterizations of oil palm (Table S2) can also be a reference for other LSMs.
4.2 Uncertainty in the model
Although the simulation of oil palm shows a significant improvement in the new model, there are some limitations in this version. The growth of oil palm is simplified to be incorporated into the model structure. For example, we assumed a constant maximum phytomer number of 40 for each oil palm through its whole life cycle. However, the expanded phytomer number may decrease with age according to some studies, and the maximum number is lower than the actual value in some areas (e.g. 32) (Corley and Tinker, 2015). The maximum number of phytomers is externalized as an input parameter in the model, making it flexible to be changed by the users' choice. Some factors related to oil palm yields such as the gender of inflorescence and the rate of inflorescence abortion are not considered because of the limited understanding of underlying mechanisms (Breure and Menendez, 1990; Henson and Mohd, 2004). Instead, a simplified structure of one phytomer carrying one fruit bunch is used. Also, considering that the oil palm is a highly managed plantation unlike natural forest, a rigid parameterization is adopted such as phytomer initiation interval, fruit harvest interval, phytomer pruning interval and leaf longevity. According to the field observations, the average temperature of the coldest month of the year for oil palm growth should not fall below 15 ∘C, and the optimal temperature condition ranges between 24 and 28 ∘C (Corley and Tinker, 2015). Oil palm stomata began to close when air temperature rose above 32 ∘C (Rees, 1961). In the main oil palm growing areas, temperatures are relatively uniform throughout the year (fluctuating around ∼ 27 ∘C) and rarely falling below 22 ∘C (see the monthly temperature variations in Fig. S9). Therefore, growing degree day and low temperature may not be the major limitations for oil palm growth. In addition, regular harvest and pruning practice (about twice a month) are conducted in the commercial oil palm plantations, which regulates the total number of phytomers. Based on these, the phytomer initiation in sequence is determined by a fixed time interval (16 d). This assumption in our model is thus a balance between the plant growth and human management practices. A previous study also used the period of thermal time (Fan et al., 2015) to regulate the phytomer initiation. In our model, we adopted the leaf phenology scheme from Chen et al. (2020), which is preliminarily developed for tropical forests. We also added an extra old leaf turnover at the time of oldest phytomer pruning according to the regular management practice of phytomer pruning. However, whether the leaf initiation and leaf shedding schemes are suitable for oil palm requires further investigation, and more field evidence and control experiments are needed to reveal the mechanism of leaf shedding. Because of the limited understanding of oil palm leaf shedding mechanisms other than leaf removal along with phytomer pruning, these two leaf shedding schemes were both implemented in our model. Either or both schemes can be easily chosen using an external switch (pruning- or VPD-triggered leaf shedding scheme or combined). With more field observations becoming available in the future, the model is flexible to adapt the emergent mechanism, but some parameter calibrations may be needed.
The accessibility and data sources of observations also vary from site to site, which influences the calibration of parameters and the evaluation of model performance. Without direct annual observations for parameters related to LAI and autotrophic respiration, some age-specific parameters are empirically calibrated based on multiple observations like GPP, NPP and biomass. The observations used for calibration and evaluation such as yields, biomass and GPP also vary from genotypes, management practices and measurement methods. For example, the annual fruit yield data at Site 3 (red line in Fig. 7d) is a fitted curve using fruit yields from a nearby research station (Tan et al., 2014), while some others are the measured fruit weight after every fruit harvest (Henson and Dolmat, 2003). Destructive and non-destructive methods were used to obtain the AGB for different sites, and different allometric equations applied in the non-destructive method may cause up to 10 % biases (Corley and Tinker, 2015). At Site 6, the simulated GPP by ORCHIDEE-MICT-OP is 50 % higher than the observed value. The mismatch between model and observation may also be caused by the uncertainty in observations or non-resolved soil fertility effects. Specifically, since the model can generally capture NPP (simulated NPP = 1700 gC m−2 yr−1 at Site 1; only Site 1 has both GPP and NPP observations), and the proportion of autotrophic respiration in GPP is 60 %–75 % (Henson and Harun, 2005), the estimated GPP at Site 1 should be 4256.6–6810.5 gC m−2 yr−1, much higher than the observed value of ≈ 3360 gC m−2 yr−1. Moreover, the yield of oil palm usually ranges from 587 to 996 gC m−2 yr−1, so the low observed GPP at Site 1 may not be consistent with this yield range. Factors such as genotypes, management practices (excepted fruit harvest and phytomer pruning) and plantation scales that influence oil palm biomass and fruit yield are not fully included in the model, and thus it is impossible to perfectly reproduce all site-level observations using our model. The reported fruit yields of different genotypes vary from 114.4–112.2 to 81.7–98.5 kg plant−1 yr−1 in Kandista and Batu Mulia (Lewis et al., 2020), and leading plantation companies in Indonesia and Malaysia have achieved average fruit yields of 173.7 kg plant−1 yr−1 (Donough et al., 2009). The amount and types of fertilizers used in oil palm plantation also vary from site to site. In some area, the fertilizer amount applied is according to the leaflet nutrient contents, while regular fertilization was applied in some other places (Legros et al., 2009; Kotowska et al., 2015). In the current ORCHIDEE-MICT version, however, nitrogen and phosphorus cycles are not explicitly included, limiting the implementation of fertilization effects on plant growth in the model. The scales of plantation also impact oil palm biomass and yields due to the differences in managements (e.g. dedicated managements in the large industrial plantation and extensive practices in smallholders). Another important factor is the difference between oil palms grown on mineral and peat soils. Although our model was generally able to reproduce the yield, GPP and NPP at one peat-based oil palm site (Site 12), the biomass is overestimated throughout the life cycle, indicating further work is needed to implement the peat oil palm in the LSMs (and other data from peat soils for yields). Previous studies suggested that the frond biomass of oil palm grown on peat soils was lower than on mineral soils in all age classes (Henson, 2005). On peat soil, oil palm allocates less biomass to the root system (Corley et al., 1971; Othman et al., 2010). Further decomposition of peat subsidence after peatland drainage combined with poor anchorage of oil palm may cause palm leaning and even palm falling and hence increase mortality (Henson et al., 2003; Othman et al., 2010). Based on the yield and tree mortality, the rotation cycle also varies in mineral- (25–30 years) and peat- (18–20 years) based oil palms. A better representation of peat oil palm could be reached by using a separate parameterization scheme for peat oil palm (e.g. adjusting the partition between AGB and BGB and decreasing the carbon assimilation rate), adopting a lower biomass threshold for oil palm rotation (Fig. 5), modifying the carbon emission rate at the beginning years of oil palm conversion and so on. However, it would be a great challenge to implement some factors such as a disease in the current stage without enough knowledge of the processes and impacts of disease on oil palm growth. Also, we note the optimal planting density is different between the two soil types (110–148 palms ha−1 on mineral soil and 160–200 palms ha−1 on peat soil) (Henson and Dolmat, 2003; Othman et al., 2010; Lewis et al., 2020). The mineral-based oil palm suffers a decline in frond biomass and production, while that of the peat oil palm is less influenced (Lewis et al., 2020). These would also cause biases in simulated biomass and yield due to no separation between mineral- and peat-based oil palms.
4.3 Implication and application of ORCHIDEE-MICT-OP
The newly developed ORCHIDEE-MICT-OP can be a useful tool to predict future oil palm yields, simulate LUC carbon emissions and estimate the impact on ecosystem services. Malaysia and Indonesia experienced the highest oil palm expansion (3.8 and 9.7 × 10⁶ ha) in the world from 2001 to 2016 (Xu et al., 2020). The drainage and replacement of peatland (3.1 × 10⁶ ha, 27 %) in Malaysia and Indonesia by oil palm expansion turned this carbon-rich region to a carbon source (Miettinen et al., 2016). It is thus important to simulate the carbon budget and calculate the carbon changes after oil palm expansion. Previous studies calculated the potential carbon emissions from forest conversion by oil palm using a uniform carbon density value without considering spatial heterogeneity and temporal variations (Carlson et al., 2013; Cooper et al., 2020). In reality, the biomass loss from deforestation is fast, but soil carbon change may take a long time in mineral soil. A more complex condition would happen in the conversion to oil palm plantation on the peat soil, where huge carbon emissions were observed in the first 5 years following conversion (Hooijer et al., 2012; Cooper et al., 2020). Based on the framework of gross land use changes, the grid-based ORCHIDEE-MICT-OP could thus contribute to the quantification of spatial and temporal dynamics of LUC carbon emissions from oil palm expansion. Moreover, one of the ORCHIDEE branches, ORCHIDEE-PEAT, has already implemented the peat processes for high latitudes (Qiu et al., 2018). Merging the oil-palm-specific morphology, phenology and harvest processes of oil palm and the peat-related processes in these two branches would help characterize the oil palm yields as well as carbon, water and energy fluxes on peat soil palms. Given the high rate of oil palm expansion in Malaysia and Indonesia, there is an urgent need to evaluate the potential impacts on the water and energy cycles in the tropics (Fan et al., 2019). Further modifications of the oil-palm-specific canopy structure can help to understand the biophysical changes after oil palm conversion. Moreover, although the expansion of oil palm cultivation is seen as a severe threat for the conservation of rainforest and swamp areas and their associated ecosystem services (Koh and Wilcove, 2008; Koh et al., 2011), oil palm is admittedly the most productive oil crop with 3–5 times the yields of other oil crops. To replace oil palm, much more land will thus be needed for other oil crops to produce the same amount of oil production. This is also disputed among policymakers. The model with an explicit representation of oil palm and calibration using site-level data can provide spatial oil palm biomass density, yield and water consumption in future land use scenarios and would help to identify the most suitable areas for growing oil palms as well as helping to contribute to the policy formulation for the sustainability of oil palm plantation, although the effects of soil carbon and nutrient content and fertilization management on oil palm growth and yields still require further investigation.
In this study, oil palm was incorporated into the ORCHIDEE-MICT LSM as a new PFT by introducing the phytomer structure and a fruit harvest pool, modifying carbon allocation, and implementing a systematic parameterization scheme. The leaf seasonality represented by different leaf age cohorts was also merged into this model. The developed MICT-OP version performs reasonably well in simulating photosynthesis, carbon allocation, biomass stock and fruit yields at multiple observation sites. Compared with the default ORCHIDEE-MICT version, ORCHIDEE-MICT-OP shows improved performance of GPP partitioning, NPP allocation and biomass components. The new oil palm version, parameterized with age-specific parameters, generally captures temporal dynamics of oil palm biomass and yields. The implementation of more management practices (e.g. fertilization and irrigation) and the parameterization of biophysical variables are further needed. Generally, our model improved the representation of oil palm in LSMs and further applications of ORCHIDEE-MICT-OP include but are not limited to the regional carbon budget and water demand estimation, yield prediction and the sustainable development of the oil palm industry.
The source code for ORCHIDEE-MICT-OP revision 6850 is available via https://forge.ipsl.jussieu.fr/orchidee/wiki/GroupActivities/CodeAvalaibilityPublication/ORCHIDEE-MICT-OP-r6850 (last access: 23 July 2020; Xu, 2020). This software is governed by the CeCILL licence under French law and abides by the rules of the distribution of free software. You can use, modify, and/or redistribute the software under the terms of the CeCILL licence as circulated by CEA, CNRS and INRIA at the following URL: http://www.cecill.info (last access: 20 July 2021).
The CRUNCEP data and the HWSD v1.2 data (Nachtergaele et al., 2010) are available at ftp://nacp.ornl.gov/synthesis/2009/frescati/temp/land_use_change/original/readme.htm (Viovy, 2011) and at http://www.fao.org/fileadmin/user_upload/soils/HWSD Viewer/HWSD_RASTER.zip (Nachtergaele et al., 2010).
The supplement related to this article is available online at: https://doi.org/10.5194/gmd-14-4573-2021-supplement.
PC, LY and WL designed the project. YX developed the model code with help from WL, PC, XC, CY and HZ. YX wrote an initial draft of the paper. All authors participated in interpreting the results and refining the paper.
The authors declare that they have no conflict of interest.
Publisher's note: Copernicus Publications remains neutral with regard to jurisdictional claims in published maps and institutional affiliations.
Wei Li and Philippe Ciais acknowledge support by the European Research Council through Synergy Grant ERC-2013-SyG-610028 “IMBALANCE-P”.
This research has been supported by the National Key Research and Development Program of China (grant nos. 2019YFA0606601, 2019YFA0606604 and 2017YFA0604401).
This paper was edited by Tomomichi Kato and reviewed by two anonymous referees.
Ahongshangbam, J., Khokthong, W., Ellsäßer, F., Hendrayanto, H., Hölscher, D., and Röll, A.: Drone-based photogrammetry-derived crown metrics for predicting tree and oil palm water use, Ecohydrology, 12, e2115, https://doi.org/10.1002/eco.2115, 2019.
Breure, C. J.: The Effect of Palm Age and Planting Density on the Partitioning of Assimilates in Oil Palm (Elaeis guineensis), Exp. Agric., 24, 53–66, https://doi.org/10.1017/S0014479700015696, 1988.
Breure, C. J. and Menendez, T.: The Determination of Bunch Yield Components in the Development of Inflorescences in Oil Palm (Elaeis Guineensis), Exp. Agric., 26, 99–115, https://doi.org/10.1017/S0014479700015441, 1990.
Caliman, J.-P.: Palmier à huile: le management environnemental des plantations: le cheminement de PT, Smart, OCL, Oléagineux Corps gras Lipides, 18, 123–131, 2011.
Carlson, K. M., Curran, L. M., Asner, G. P., Pittman, A. M., Trigg, S. N., and Adeney, J. M.: Carbon emissions from forest conversion by Kalimantan oil palm plantations, Nat. Clim. Change, 3, 283–287, https://doi.org/10.1038/nclimate1702, 2013.
Carr, M. K. V.: The water relations and irrigation requirements of oil palm (Elaeis Guineensis): a review, Exp. Agric., 47, 629–652, https://doi.org/10.1017/S0014479711000494, 2011.
Carswell, F. E., Meir, P., Wandelli, E. V., Bonates, L. C. M., Kruijt, B., Barbosa, E. M., Nobre, A. D., Grace, J., and Jarvis, P. G.: Photosynthetic capacity in a central Amazonian rain forest, Tree Physiol., 20, 179–186, https://doi.org/10.1093/treephys/20.3.179, 2000.
Chen, X., Maignan, F., Viovy, N., Bastos, A., Goll, D., Wu, J., Liu, L., Yue, C., Peng, S., Yuan, W., da Conceição, A. C., O'Sullivan, M., and Ciais, P.: Novel Representation of Leaf Phenology Improves Simulation of Amazonian Evergreen Forest Photosynthesis in a Land Surface Model, J. Adv. Model. Earth Sy., 12, e2018MS001565, https://doi.org/10.1029/2018ms001565, 2020.
Cheng, Y., Yu, L., Xu, Y., Liu, X., Lu, H., Cracknell, A. P., Kanniah, K., and Gong, P.: Towards global oil palm plantation mapping using remote-sensing data, Int. J. Remote Sens., 39, 5891–5906, 2018.
Combres, J.-C., Pallas, B., Rouan, L., Mialet-Serra, I., Caliman, J.-P., Braconnier, S., Soulié, J.-C., and Dingkuhn, M.: Simulation of inflorescence dynamics in oil palm and estimation of environment-sensitive phenological phases: a model based analysis, Funct. Plant Biol., 40, 263–279, 2013.
Cooper, H. V., Evers, S., Aplin, P., Crout, N., Dahalan, M. P. B., and Sjogersten, S.: Greenhouse gas emissions resulting from conversion of peat swamp forest to oil palm plantation, Nat. Commun., 11, 407, https://doi.org/10.1038/s41467-020-14298-w, 2020.
Corley, R. H. V. and Tinker, P. B.: The oil palm, 5th Edn., John Wiley and Sons, https://doi.org/10.1002/9781118953297, 2015.
Corley, R. H. V., Gray, B. S., and Kee, N. S.: Productivity of the oil palm (Elaeis guineensis Jacq.) in Malaysia, Exp. Agric., 7, 129–136, 1971.
Donough, C., Witt, C., and Fairhurst, T.: Yield intensification in oil palm plantations through best management practice, Better Crops, 93, 12–14, 2009.
Fan, Y., Roupsard, O., Bernoux, M., Le Maire, G., Panferov, O., Kotowska, M. M., and Knohl, A.: A sub-canopy structure for simulating oil palm in the Community Land Model (CLM-Palm): phenology, allocation and yield, Geosci. Model Dev., 8, 3785–3800, https://doi.org/10.5194/gmd-8-3785-2015, 2015.
Fan, Y., Meijide, A., Lawrence, D. M., Roupsard, O., Carlson, K. M., Chen, H.-Y., Röll, A., Niu, F., and Knohl, A.: Reconciling Canopy Interception Parameterization and Rainfall Forcing Frequency in the Community Land Model for Simulating Evapotranspiration of Rainforests and Oil Palm Plantations in Indonesia, J. Adv. Model. Earth Sy., 11, 732–751, https://doi.org/10.1029/2018ms001490, 2019.
Farquhar, G. D., von Caemmerer, S., and Berry, J. A.: A biochemical model of photosynthetic CO2 assimilation in leaves of C3 species, Planta, 149, 78–90, https://doi.org/10.1007/BF00386231, 1980.
Fisher, J. B., Huntzinger, D. N., Schwalm, C. R., and Sitch, S.: Modeling the terrestrial biosphere, Annu. Rev. Env. Resour., 39, 91–123, 2014.
Fitzherbert, E. B., Struebig, M. J., Morel, A., Danielsen, F., Brühl, C. A., Donald, P. F., and Phalan, B.: How will oil palm expansion affect biodiversity?, Trends Ecol. Evol., 23, 538–545, https://doi.org/10.1016/j.tree.2008.06.012, 2008.
Goh, K. H., Chew, P. S., and Kee, K. K.: Maximising and maintaining oil palm yield on commercial scale in Malaysia, International Planters Conference, 121–141, 1994.
Guillaume, T., Kotowska, M. M., Hertel, D., Knohl, A., Krashevska, V., Murtilaksono, K., Scheu, S., and Kuzyakov, Y.: Carbon costs and benefits of Indonesian rainforest conversion to plantations, Nat. Commun., 9, 2388, https://doi.org/10.1038/s41467-018-04755-y, 2018.
Guimberteau, M., Zhu, D., Maignan, F., Huang, Y., Yue, C., Dantec-Nédélec, S., Ottlé, C., Jornet-Puig, A., Bastos, A., Laurent, P., Goll, D., Bowring, S., Chang, J., Guenet, B., Tifafi, M., Peng, S., Krinner, G., Ducharne, A., Wang, F., Wang, T., Wang, X., Wang, Y., Yin, Z., Lauerwald, R., Joetzjer, E., Qiu, C., Kim, H., and Ciais, P.: ORCHIDEE-MICT (v8.4.1), a land surface model for the high latitudes: model description and validation, Geosci. Model Dev., 11, 121–163, https://doi.org/10.5194/gmd-11-121-2018, 2018.
Henson, I. and Mohd, H. H.: Seasonal variation in oil palm fruit bunch production: ist origins and extent, Planter, 80, 201–212, 2004.
Henson, I. E.: Modelling vegetative dry matter production of oil palm, Oil Palm Bulletin, 52, 25–47, 2005.
Henson, I. E.: Modelling dry matter production, partitioning and yield of oil palm: OPRODSIM: a mechanistic simulation model for teaching and research: technical manual and users' guide, Kuala Lumpur: Malaysian Palm Oil Board, 2009.
Henson, I. E. and Dolmat, M. T.: Physiological analysis of an oil palm density trial on a peat soil, J. Oil Palm Res., 15, 73–91, 2003.
Henson, I. E. and Harun, M. H.: The influence of climatic conditions on gas and energy exchanges above a young oil palm stand in north Kedah, Malaysia, J. Oil Palm Res., 17, 1–27, 2005.
Hoffmann, M., Vera, A. C., Van Wijk, M., Giller, K. E., Oberthür, T., Donough, C., and Whitbread, A. M.: Simulating potential growth and yield of oil palm (Elaeis guineensis) with PALMSIM: Model description, evaluation and application, Agric. Sys., 131, 1–10, 2014.
Hooijer, A., Page, S., Jauhiainen, J., Lee, W. A., Lu, X. X., Idris, A., and Anshari, G.: Subsidence and carbon loss in drained tropical peatlands, Biogeosciences, 9, 1053–1071, https://doi.org/10.5194/bg-9-1053-2012, 2012.
Huth, N. I., Banabas, M., Nelson, P. N., and Webb, M.: Development of an oil palm cropping systems model: Lessons learned and future directions, Environ. Modell. Softw., 62, 411–419, 2014.
Ishida, A., Uemura, A., Koike, N., Matsumoto, Y., and Hoe, A. L.: Interactive effects of leaf age and self-shading on leaf structure, photosynthetic capacity and chlorophyll fluorescence in the rain forest tree, Dryobalanops aromatica, Tree Physiol., 19, 741–747, https://doi.org/10.1093/treephys/19.11.741, 1999.
Kallarackal, J.: Water relations and photosynthesis of the oil palm in Peninsular India, KFRI Research Report, 1996.
Kattge, J., Knorr, W., Raddatz, T., and Wirth, C.: Quantifying photosynthetic capacity aistits relationship to leaf nitrogen content for global-scale terrestrial biosphere models, Glob. Change Biol., 15, 976–991, https://doi.org/10.1111/j.1365-2486.2008.01744.x, 2009.
Koh, L. P. and Wilcove, D. S.: Is oil palm agriculture really destroying tropical biodiversity?, Conservation Letters, 1, 60–64, 2008.
Koh, L. P., Miettinen, J., Liew, S. C., and Ghazoul, J.: Remotely sensed evidence of tropical peatland conversion to oil palm, P. Natl. Acad. Sci. USA, 108, 5127–5132, https://doi.org/10.1073/pnas.1018776108, 2011.
Kotowska, M. M., Leuschner, C., Triadiati, T., Meriem, S., and Hertel, D.: Quantifying above-and belowground biomass carbon loss with forest conversion in tropical lowlands of S umatra (Indonesia), Glob. Change Biol., 21, 3620–3634, 2015.
Krinner, G., Viovy, N., de Noblet-Ducoudré, N., Ogée, J., Polcher, J., Friedlingstein, P., Ciais, P., Sitch, S., and Prentice, I. C.: A dynamic global vegetation model for studies of the coupled atmosphere-biosphere system, Global Biogeochem. Cy., 19, GB1015, https://doi.org/10.1029/2003gb002199, 2005.
Lamade, E. and Bouillet, J.-P.: Carbon storage and global change: the role of oil palm, OCL – Oilseeds and Fats, Crops Lipids, 12, 154–160, 2005.
Legros, S., Mialet-Serra, I., Caliman, J.-P., Siregar, F. A., Clément-Vidal, A., and Dingkuhn, M.: Phenology and growth adjustments of oil palm (Elaeis guineensis) to photoperiod and climate variability, Ann. Botany, 104, 1171–1182, https://doi.org/10.1093/aob/mcp214, 2009.
Lewis, K., Rumpang, E., Kho, L. K., McCalmont, J., Teh, Y. A., Gallego-Sala, A., and Hill, T. C.: An assessment of oil palm plantation aboveground biomass stocks on tropical peat using destructive and non-destructive methods, Sci. Rep., 10, 2230, https://doi.org/10.1038/s41598-020-58982-9, 2020.
Manoli, G., Meijide, A., Huth, N., Knohl, A., Kosugi, Y., Burlando, P., Ghazoul, J., and Fatichi, S.: Ecohydrological changes after tropical forest conversion to oil palm, Environ. Res. Lett., 13, 064035, https://doi.org/10.1088/1748-9326/aac54e, 2018.
Meijide, A., Röll, A., Fan, Y., Herbst, M., Niu, F., Tiedemann, F., June, T., Rauf, A., Hölscher, D., and Knohl, A.: Controls of water and energy fluxes in oil palm plantations: Environmental variables and oil palm age, Agr. Forest Meteorol., 239, 71–85, https://doi.org/10.1016/j.agrformet.2017.02.034, 2017.
Miettinen, J., Shi, C., and Liew, S. C.: Land cover distribution in the peatlands of Peninsular Malaysia, Sumatra and Borneo in 2015 with changes since 1990, Global Ecology and Conservation, 6, 67–78, 2016.
Nachtergaele, F., van Velthuizen, H., Verelst, L., Batjes, N., Dijkshoorn, K., van Engelen, V., Fischer, G., Jones, A., and Montanarela, L.: The harmonized world soil database, Proceedings of the 19th World Congress of Soil Science, Soil Solutions for a Changing World, Brisbane, Australia, 1–6 August 2010, 34–37, 2010.
Noor, M. R. M. and Harun, M. H.: The role of leaf area index (LAI) in oil palm, Oil Palm Bulletin, 48, 11–16, 2004.
Othman, H. A. S. N. O. L., Mohammed, A. T., Harun, M. H., Darus, F. M., and Mos, H. A. S. I. M. A. H.: Best management practises for oil palm planting on peat: optimum groundwater table, MPOB Information Series, 528, 1–7, 2010.
Paterson, R. R. M., Kumar, L., Taylor, S., and Lima, N.: Future climate effects on suitability for growth of oil palms in Malaysia and Indonesia, Sci. Rep., 5, 14457, https://doi.org/10.1038/srep14457, 2015.
Propastin, P. A.: Spatial non-stationarity and scale-dependency of prediction accuracy in the remote estimation of LAI over a tropical rainforest in Sulawesi, Indonesia, Remote Sens. Environ., 113, 2234–2242, https://doi.org/10.1016/j.rse.2009.06.007, 2009.
Qiu, C., Zhu, D., Ciais, P., Guenet, B., Krinner, G., Peng, S., Aurela, M., Bernhofer, C., Brümmer, C., Bret-Harte, S., Chu, H., Chen, J., Desai, A. R., Dušek, J., Euskirchen, E. S., Fortuniak, K., Flanagan, L. B., Friborg, T., Grygoruk, M., Gogo, S., Grünwald, T., Hansen, B. U., Holl, D., Humphreys, E., Hurkuck, M., Kiely, G., Klatt, J., Kutzbach, L., Largeron, C., Laggoun-Défarge, F., Lund, M., Lafleur, P. M., Li, X., Mammarella, I., Merbold, L., Nilsson, M. B., Olejnik, J., Ottosson-Löfvenius, M., Oechel, W., Parmentier, F.-J. W., Peichl, M., Pirk, N., Peltola, O., Pawlak, W., Rasse, D., Rinne, J., Shaver, G., Schmid, H. P., Sottocornola, M., Steinbrecher, R., Sachs, T., Urbaniak, M., Zona, D., and Ziemblinska, K.: ORCHIDEE-PEAT (revision 4596), a model for northern peatland CO2, water, and energy fluxes on daily to annual scales, Geosci. Model Dev., 11, 497–519, https://doi.org/10.5194/gmd-11-497-2018, 2018.
Rees, A. R.: Midday Closure of Stomata in the Oil Palm Elaeis guineensis. Jacq, J. Exp. Bot., 12, 129–146, https://doi.org/10.1093/jxb/12.1.129, 1961.
Reynolds, C. A., Jackson, T. J., and Rawls, W. J.: Estimating soil water-holding capacities by linking the Food and Agriculture Organization Soil map of the world with global pedon databases and continuous pedotransfer functions, Water Resour. Res., 36, 3653–3662, https://doi.org/10.1029/2000wr900130, 2000.
Rival, A. and Levang, P.: Palms of controversies: Oil palm and development challenges, CIFOR, Bogor, Indonesia, 2014.
Röll, A., Niu, F., Meijide, A., Hardanto, A., Hendrayanto, Knohl, A., and Hölscher, D.: Transpiration in an oil palm landscape: effects of palm age, Biogeosciences, 12, 5619–5633, https://doi.org/10.5194/bg-12-5619-2015, 2015.
Ruimy, A., Dedieu, G., and Saugier, B.: TURC: A diagnostic model of continental gross primary productivity and net primary productivity, Global Biogeochem. Cy., 10, 269–285, https://doi.org/10.1029/96gb00349, 1996.
Rusli, N. and Majid, M. R.: Monitoring and mapping leaf area index of rubber and oil palm in small watershed area, IOP Conference Series: Earth and Environmental Science, 18, 012036, 2014.
Sunaryathy, P. I., Suhasman, S., Kanniah, K. D., and Tan, K. P.: Estimating Aboveground Biomass of Oil Palm Trees by Using the Destructive Method, World Journal of Agricultural Research, 3, 17–19, 2015.
Tan, K. P., Kanniah, K. D., and Cracknell, A. P.: On the upstream inputs into the MODIS primary productivity products using biometric data from oil palm plantations, Int. J. Remote Sens., 35, 2215–2246, https://doi.org/10.1080/01431161.2014.889865, 2014.
Teh Boon Sung, C. and See Siang, C.: Modelling crop growth and yield in palm oil cultivation: Achieving sustainable cultivation of oil palm, Volume 1, Burleigh Dodds Science Publishing, 199–244, 2018.
Van Ittersum, M. K., Cassman, K. G., Grassini, P., Wolf, J., Tittonell, P., and Hochman, Z.: Yield gap analysis with local to global relevance – A review, Field Crops Res., 143, 4–17, https://doi.org/10.1016/j.fcr.2012.09.009, 2013.
Van Kraalingen, D. W. G., Breure, C. J., and Spitters, C. J. T.: Simulation of oil palm growth and yield, Agr. Forest Meteorol., 46, 227–244, https://doi.org/10.1016/0168-1923(89)90066-X, 1989.
Vernimmen, R. R. E., Bruijnzeel, L. A., Romdoni, A., and Proctor, J.: Rainfall interception in three contrasting lowland rain forest types in Central Kalimantan, Indonesia, J. Hydrol., 340, 217–232, https://doi.org/10.1016/j.jhydrol.2007.04.009, 2007.
Viovy, N.: CRUNCEP dataset, available at: ftp://nacp.ornl.gov/synthesis/2009/frescati/temp/land_use_change/original/readme.htm (last access: 20 July 2008) , 2011.
Wu, J., Albert, L. P., Lopes, A. P., Restrepo-Coupe, N., Hayek, M., Wiedemann, K. T., Guan, K., Stark, S. C., Christoffersen, B., Prohaska, N., Tavares, J. V., Marostica, S., Kobayashi, H., Ferreira, M. L., Campos, K. S., da Silva, R., Brando, P. M., Dye, D. G., Huxman, T. E., Huete, A. R., Nelson, B. W., and Saleska, S. R.: Leaf development and demography explain photosynthetic seasonality in Amazon evergreen forests, Science, 351, 972–976, https://doi.org/10.1126/science.aad5068, 2016.
Xu, Y., Yu, L., Li, W., Ciais, P., Cheng, Y., and Gong, P.: Annual oil palm plantation maps in Malaysia and Indonesia from 2001 to 2016, Earth Syst. Sci. Data, 12, 847–867, https://doi.org/10.5194/essd-12-847-2020, 2020.
Yin, X. and Struik, P. C.: C3 and C4 photosynthesis models: An overview from the perspective of crop modelling, NJAS – Wageningen Journal of Life Sciences, 57, 27–38, https://doi.org/10.1016/j.njas.2009.07.001, 2009.
Yue, C., Ciais, P., Luyssaert, S., Li, W., McGrath, M. J., Chang, J., and Peng, S.: Representing anthropogenic gross land use change, wood harvest, and forest age dynamics in a global vegetation model ORCHIDEE-MICT v8.4.2, Geosci. Model Dev., 11, 409–428, https://doi.org/10.5194/gmd-11-409-2018, 2018.