the Creative Commons Attribution 4.0 License.
the Creative Commons Attribution 4.0 License.
 | 03 Jun 2021
Improvement of modeling plant responses to low soil moisture in JULESvn4.9 and evaluation against flux tower measurements
Karina E. Williams
Patrick C. McGuire
Maria Carolina Duran Rojas
Debbie Hemming
Anne Verhoef
Chris Huntingford
Lucy Rowland
Toby Marthews
Cleiton Breder Eller
Camilla Mathison
Rodolfo L. B. Nobrega
Nicola Gedney
Pier Luigi Vidale
Fred Otu-Larbi
Divya Pandey
Sebastien Garrigues
Azin Wright
Darren Slevin
Martin G. De Kauwe
Eleanor Blyth
Jonas Ardö
Andrew Black
Damien Bonal
Nina Buchmann
Benoit Burban
Kathrin Fuchs
Agnès de Grandcourt
Ivan Mammarella
Lutz Merbold
Leonardo Montagnani
Yann Nouvellon
Natalia Restrepo-Coupe
Georg Wohlfahrt
Drought is predicted to increase in the future due to climate change, bringing with it myriad impacts on ecosystems. Plants respond to drier soils by reducing stomatal conductance in order to conserve water and avoid hydraulic damage. Despite the importance of plant drought responses for the global carbon cycle and local and regional climate feedbacks, land surface models are unable to capture observed plant responses to soil moisture stress. We assessed the impact of soil moisture stress on simulated gross primary productivity (GPP) and latent energy flux (LE) in the Joint UK Land Environment Simulator (JULES) vn4.9 on seasonal and annual timescales and evaluated 10 different representations of soil moisture stress in the model. For the default configuration, GPP was more realistic in temperate biome sites than in the tropics or high-latitude (cold-region) sites, while LE was best simulated in temperate and high-latitude (cold) sites. Errors that were not due to soil moisture stress, possibly linked to phenology, contributed to model biases for GPP in tropical savanna and deciduous forest sites. We found that three alternative approaches to calculating soil moisture stress produced more realistic results than the default parameterization for most biomes and climates. All of these involved increasing the number of soil layers from 4 to 14 and the soil depth from 3.0 to 10.8 m. In addition, we found improvements when soil matric potential replaced volumetric water content in the stress equation (the “soil14_psi” experiments), when the critical threshold value for inducing soil moisture stress was reduced (“soil14_p0”), and when plants were able to access soil moisture in deeper soil layers (“soil14_dr*2”). For LE, the biases were highest in the default configuration in temperate mixed forests, with overestimation occurring during most of the year. At these sites, reducing soil moisture stress (with the new parameterizations mentioned above) increased LE and increased model biases but improved the simulated seasonal cycle and brought the monthly variance closer to the measured variance of LE. Further evaluation of the reason for the high bias in LE at many of the sites would enable improvements in both carbon and energy fluxes with new parameterizations for soil moisture stress. Increasing the soil depth and plant access to deep soil moisture improved many aspects of the simulations, and we recommend these settings in future work using JULES or as a general way to improve land surface carbon and water fluxes in other models. In addition, using soil matric potential presents the opportunity to include plant functional type-specific parameters to further improve modeled fluxes.
- Article
(3676 KB) - Full-text XML
-
Supplement
(3962 KB) - BibTeX
- EndNote


Drought has a range of impacts on terrestrial ecosystems (Allen et al., 2010; Choat et al., 2012), plays a role in feedbacks on the weather and climate systems across scales (Seneviratne et al., 2013; Lemordant et al., 2016; Miralles et al., 2019; Lian et al., 2020), and affects the global carbon cycle (Green et al., 2017; Humphrey et al., 2018; Peters et al., 2018). These impacts and feedbacks have the potential to affect society, either directly through moisture availability effects on crops or indirectly by adjusting near-surface temperatures or forcing large-scale variations to the climate system. Roughly 40 % of the vegetated land surface is limited by seasonal water deficits (Nemani et al., 2003; Beer et al., 2010), which are a major control on gross primary productivity (GPP) in sub-humid, semi-arid, and arid regions (Stocker et al., 2018). In the future, soil moisture stress for ecosystems is predicted to increase over large regions (Berg et al., 2016; Ukkola et al., 2020). In this paper, we define “soil moisture stress” as the physiological stress experienced by vegetation due to its interactions with dry soils. For these reasons, accurate process-based models of plant response to soil moisture stress are needed in coupled land–atmosphere climate models. However, the models used to represent biogeophysical and biogeochemical processes in Earth system models (ESMs) are often unable to properly capture observed responses to soil moisture stress (Beer et al., 2010; Powell et al., 2013; Medlyn et al., 2016; Restrepo-Coupe et al., 2017; De Kauwe et al., 2017; Peters et al., 2018; Paschalis et al., 2020).
Plants respond to reductions in soil moisture content (SMC) through a range of drought tolerance and prevention strategies. Commonly, plants respond to low SMC by reducing their stomatal aperture to conserve water and protect the xylem from damage (Field and Holbrook, 1989; Sparks and Black, 1999). Embolism is caused by low soil and/or leaf water potential due to dry climatic conditions, and it causes water tension inside the plant to increase enough to drive the formation of air bubbles within the xylem vessels (Lambers et al., 2008; Choat et al., 2012). Embolized xylem is unable to transport water, and for some vegetation types, this is a dominant cause of plant mortality under drought conditions (Brodribb and Cochard, 2009; Choat et al., 2018). To avoid this, many plants limit water loss by reducing their stomatal conductance when soil moisture levels reach a certain threshold (Tyree and Sperry, 1989; Sperry et al., 1998; Choat et al., 2012) or by shedding leaves (Wolfe et al., 2016). High atmospheric vapor pressure deficits (VPD), which sometimes occur in conjunction with meteorological drought, may also result in stomatal closure. The reduced stomatal conductance triggers a cascade of other responses, beginning with reduced rates of photosynthesis (Ball et al., 1987), which reduce carbon uptake and possibly growth and change allocation between above- and below-ground stocks (Merbold et al., 2009b; Doughty et al., 2015). Lower stomatal conductance will reduce transpiration, which causes more surface-available energy to be converted into sensible heat. This transference of latent to sensible heat can contribute to further desiccation of soils, increased land surface temperature, and amplification of heat waves (Seneviratne et al., 2010). Over the long term, droughts can lead to changes in plant species composition (Liu et al., 2018) or large-scale forest mortality (Mcdowell et al., 2008), sometimes causing a transient situation where large ecosystems switch from being a sink of carbon dioxide to a source (Ciais et al., 2005; Gatti et al., 2015).
There is a spectrum of mechanisms through which species tolerate or acclimate to drought, meaning a “one-size-fits-all” approach to modeling can be inadequate. Explicit model representations of the xylem hydraulics are complex and difficult to parameterize globally. The emergence of plant trait databases has enabled early models to represent the hydraulic properties of the soil–plant–atmosphere continuum (Sperry et al., 2016; Eller et al., 2018, 2020; De Kauwe et al., 2020; Sabot et al., 2020). In addition, new approaches are emerging that focus on “plant profit maximization”, where photosynthetic uptake of CO2 is optimally traded against plant hydraulic function as an alternative to the empirical functions commonly used in models to regulate gas exchange during periods of water stress (Sperry et al., 2017; Sabot et al., 2020).
For now, land surface models (LSMs) more often represent the regulation of stomatal conductance as a simple generic function of SMC, generally expressed in terms of volumetric water content (θ, m3 m−3). This simple generic function is the so-called “beta” function, where β is a factor between zero and one that limits photosynthesis in some way (depending on the model, see Sect. 2). Above a critical SMC, there is no stress (β=1), and below the critical threshold value, stress increases as SMC decreases until the wilting point is reached (β=0). Alternative, yet related, expressions are available whereby stomatal regulation occurs through changes in the soil matric potential (ψ, expressed in pressure units, such as MPa); θ and matric potential (a measure of how tightly the water is held in the soil pores, thereby affecting water uptake by the roots) are closely related via the water retention curve. However, using one function for all plant responses to drying soils can result in errors; for example, the parameters describing plant and soil hydraulic responses to soil moisture may change in time (Robinson et al., 2019) and can vary between ecosystem types (Teuling et al., 2010). Such variation may be in response to climate change or evolving vegetation and soil properties and their structure.
In this study, we focus on the effects of droughts on vegetation that occur due to low SMC. Although droughts are often associated with changes beyond low precipitation levels, including high air temperatures and VPD, these climate drivers have their own set of impacts on vegetation, adding to the effects of low SMC, which will not be addressed here. We explore different ways in which soil moisture stress can be represented in a widely used model of the terrestrial biosphere, the Joint UK Land Environment Simulator (JULES) (Best et al., 2011; Clark et al., 2011). JULES is a community model and is used in coupled or stand-alone mode forced by meteorological variables. Its applications are on timescales ranging from weather forecasting to climate projections, and the model is the terrestrial component of the UK Earth System Model and the HadGEM family of models (The HadGEM2 Development Team, 2011). The spatial scales are similarly diverse. Studies range from single-point modeling of crop yield at one site (Williams et al., 2017), which requires detailed knowledge of one crop variety under carefully controlled conditions, to global predictions of land sources and sinks of CO2 for the annually updated Global Carbon Project (Friedlingstein et al., 2019), which requires reliable performance for all vegetation types across the globe. The aim of this study is to find an improved general model equation and parameters for global applications of JULES.
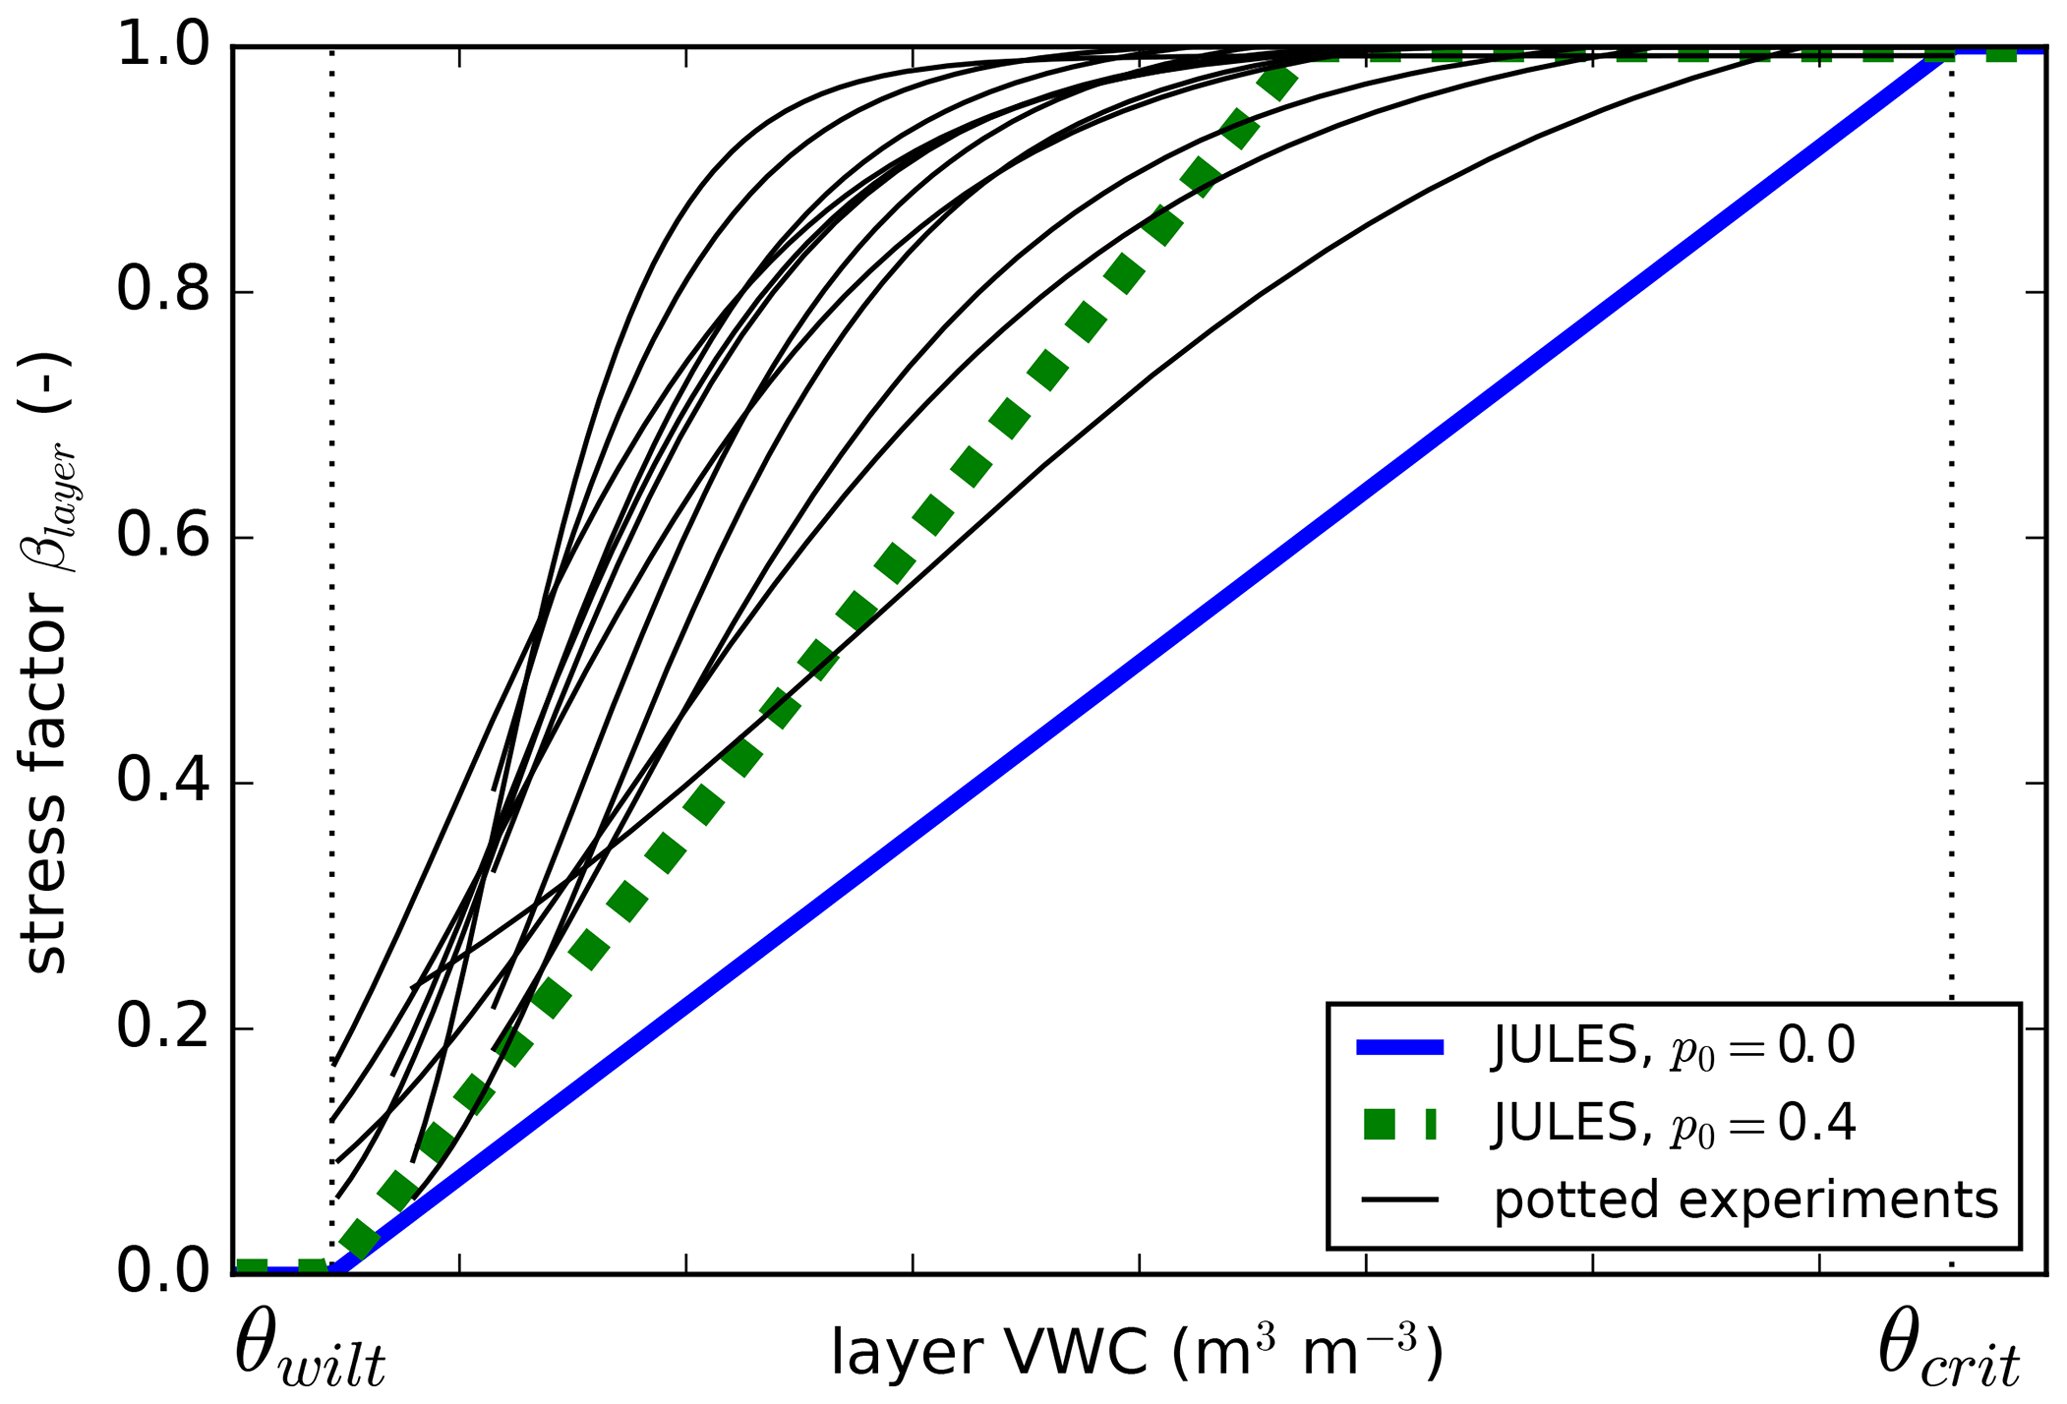
Figure 1Comparison of JULES soil moisture stress factor (β) to measurements from various potted experiments from Verhoef and Egea (2014). β is calculated from Eq. (4). Two different values of p0 (Eq. 5) are shown: p0 = 0.4 was used for the “soil14_p0” and “p0” soil moisture stress experiments.
Soil moisture stress has been identified as a key driver of variability in JULES projections (Blyth et al., 2011). Verhoef and Egea (2014) showed that the standard β function in JULES and similar LSMs needs urgent attention as to whether it is the most appropriate functional form and/or if it has been parameterized correctly. For example, JULES calculates β based on θ, but using soil matric potential instead results in a curvilinear increase in stress as soils dry, which may be more realistic (Fig. 1; Verhoef and Egea, 2014). In an evaluation of the model across 10 flux tower sites, Blyth et al. (2011) showed that the “dry-down” of the sites in semi-arid areas was too quick and the seasonal variation of evaporation in the tropics was too great, possibly due to the roots being modeled as too shallow (Blyth et al., 2011) or due to modeled stress beginning when soils were still relatively wet. Other studies have suggested that the root depths of LSMs were too shallow (Teuling et al., 2006; Wang and Dickinson, 2012). Indeed, some LSMs (CLM, SiB3, TERRA-ML) were able to improve model performance by representing deeper (e.g., 10 m) and more efficient roots (Baker et al., 2008; Akkermans et al., 2012; Liu et al., 2020).
Evaluating the impact of simulated soil moisture stress on vegetation requires that other model errors that also affect CO2 and water fluxes are minimized. For instance, it is possible that the rapid drying found in Blyth et al. (2011) was due to overestimation of soil evaporation. The fact that land surface models in general overestimate evapotranspiration during wet periods is well documented (Blyth et al., 2011; Mueller and Seneviratne, 2014; Martínez-De La Torre et al., 2019) and leads to unrealistically low soil moisture after long dry periods (Ukkola et al., 2016). The high evaporation (and subsequent low SMC) could be due to errors in factors not being addressed in this study, such as radiation absorption or turbulent exchanges with the atmosphere. Leaf area index (LAI) also strongly affects the magnitude and seasonality of fluxes coming from vegetation and soil (via variations in shading).
This study aimed to evaluate the simulation of GPP and latent energy flux (LE) for a range of biomes and climates, to diagnose sites and seasons when soil moisture stress affects the results, and to evaluate different methods for representing soil moisture stress in JULES as a first step in improving the simulated plant responses to low SMC in global applications of JULES. To do this, we chose a subset of sites in the FLUXNET2015 database and from the Large Scale Biosphere-Atmosphere Experiment in Amazonia (LBA) experiment based on availability of data. Where possible we prescribed soil moisture and LAI from site measurements to differentiate the roles of SMC, β parameterization, or modeled phenology in model biases. We used the GPP calculated before soil moisture stress is applied to understand seasons and locations where the β parameterization was contributing to model errors. We also reviewed other commonly used approaches for modeling soil moisture stress, presented in Sect. 2.2, to motivate the representations evaluated in the remainder of the paper. This work is one of the first published results from a JULES community-wide focus group (called a JULES Process Evaluation Group, or JPEG) on understanding soil moisture stress impacts on vegetation, which began in 2016.
2.1 Photosynthesis and stomatal conductance in JULES
The Joint UK Land Environment Simulator (JULES) (Best et al., 2011; Clark et al., 2011) is a process-based model that simulates the fluxes of carbon, water, energy, and momentum between the land surface and the atmosphere. JULES treats each vegetation type as existing on a separate tile within a grid box. Energy and carbon flux calculations are performed separately for each tile, depending on plant functional type (PFT)-dependent parameters. The tiles share a common soil column. Leaf-level net photosynthesis is integrated over the canopy, according to the canopy radiation scheme specified. In the present study, we used 10 canopy layers of equal LAI (in JULES this is “canopy radiation model 6”), although another option in JULES is to use a “big leaf” approach (Clark et al., 2011). Potential (non-stressed) photosynthesis is calculated based on three limiting rates: Wc (a RuBisCO-limited rate), Wl (a light-limited rate), and We (a transport-limited rate for C3 plants and a PEP carboxylase limitation for C4 plants). For full details on the photosynthesis scheme in JULES, see Clark et al. (2011) and Harper et al. (2016).
Stomatal conductance to water vapor gs (in m s−1) is related to net photosynthesis A (in mol CO2 m−2 s−1) through
where ca and ci are the atmospheric and intercellular CO2 concentrations, respectively, in Pa and 1.6 is the molar diffusivity ratio of CO2 to H2O in air (Guerrieri et al., 2019). R is the universal gas constant (8.314 J K−1 mol−1), and T* is the leaf temperature (K). Vapor deficit at the leaf surface (D, kg kg−1) affects stomatal conductance through the gradient between ca and ci:
Here, Γ* is the photorespiration compensation point (Pa) and Dcrit and f0 are PFT-dependent parameters (Cox et al., 1998; Best et al., 2011).
2.2 Soil moisture stress in JULES and other terrestrial biosphere models
Many land surface, terrestrial biosphere, and crop models include a β function to represent the effect of soil moisture stress on vegetation. The implementation of the stress factor can generally be split into two categories: stomatal and biochemical limitation (Bonan et al., 2014; De Kauwe et al., 2015). JULES falls under the latter category, with potential leaf-level carbon assimilation, Ap, being converted to the water-limited net leaf photosynthesis through multiplication with the stress factor:
Other land surface models apply biochemical limitation through reducing RuBisCO or reducing electron transport (e.g., ORCHIDEE, Krinner et al., 2005). CABLE applies limits to both the stomata (via reducing gs) and A (De Kauwe et al., 2015).
In JULES, soil moisture stress (β, unitless) for each soil layer k is a function of volumetric water content (θ) in each layer (θk, m3 m−3) using
where θwilt and θupp are the water contents at the wilting point and at which the plant starts to become water stressed, respectively (Cox et al., 1998). θupp is a function of θcrit, the critical water content (usually defined as the field capacity), and p0, a PFT-dependent parameter:
The parameter p0 was added to JULES in version 4.6 to allow β=1 for θ<θcrit, in other words delaying the critical threshold value for inducing stress as soils dry below the field capacity. In the default configuration, p0 is set to 0 (meaning θupp=θcrit), and θwilt and θcrit correspond to soil matric potentials of −1.5 and −0.033 MPa, respectively. Equation (4) means that, for each soil layer, soil moisture stress completely limits root water extraction from that layer if θk is at or below the wilting point (βk=0), while there is no soil moisture stress (βk=1) if θk is at or above θupp,k. In between these points, there is a linear increase in stress (decrease in βk) as water content decreases (blue line in Fig. 1). An effective root fraction per layer (rk) is used to calculate the overall soil moisture stress factor:
where
In Eq. (7), z is the depth of each soil layer, and dr is a PFT-specific parameter that weighs the effective root fraction within each layer. rk is an effective root fraction and is not the same as the actual root mass distribution, as it accounts for other traits and processes not present in JULES, such as the surface area of roots, conductivity, and hydraulic redistribution. JULES has four soil layers (nsoil=4) that together extend to 3 m depth (Fig. 2a). The smaller the dr, the more emphasis is given to shallow layers, while deeper layers are emphasized with a larger dr. As a specific example, with JULES default soil depth of 3 m, 87 % of the root water extraction is from the top 1 m for C3 and C4 grasses (dr=0.5), compared to 45 % in the top 1 m for tropical broadleaf evergreen trees (dr=3.0). As Fig. 2 shows, dr is not the root depth because roots are present in every soil layer, even though the fraction of roots is very small towards the bottom of the column for small values of dr.
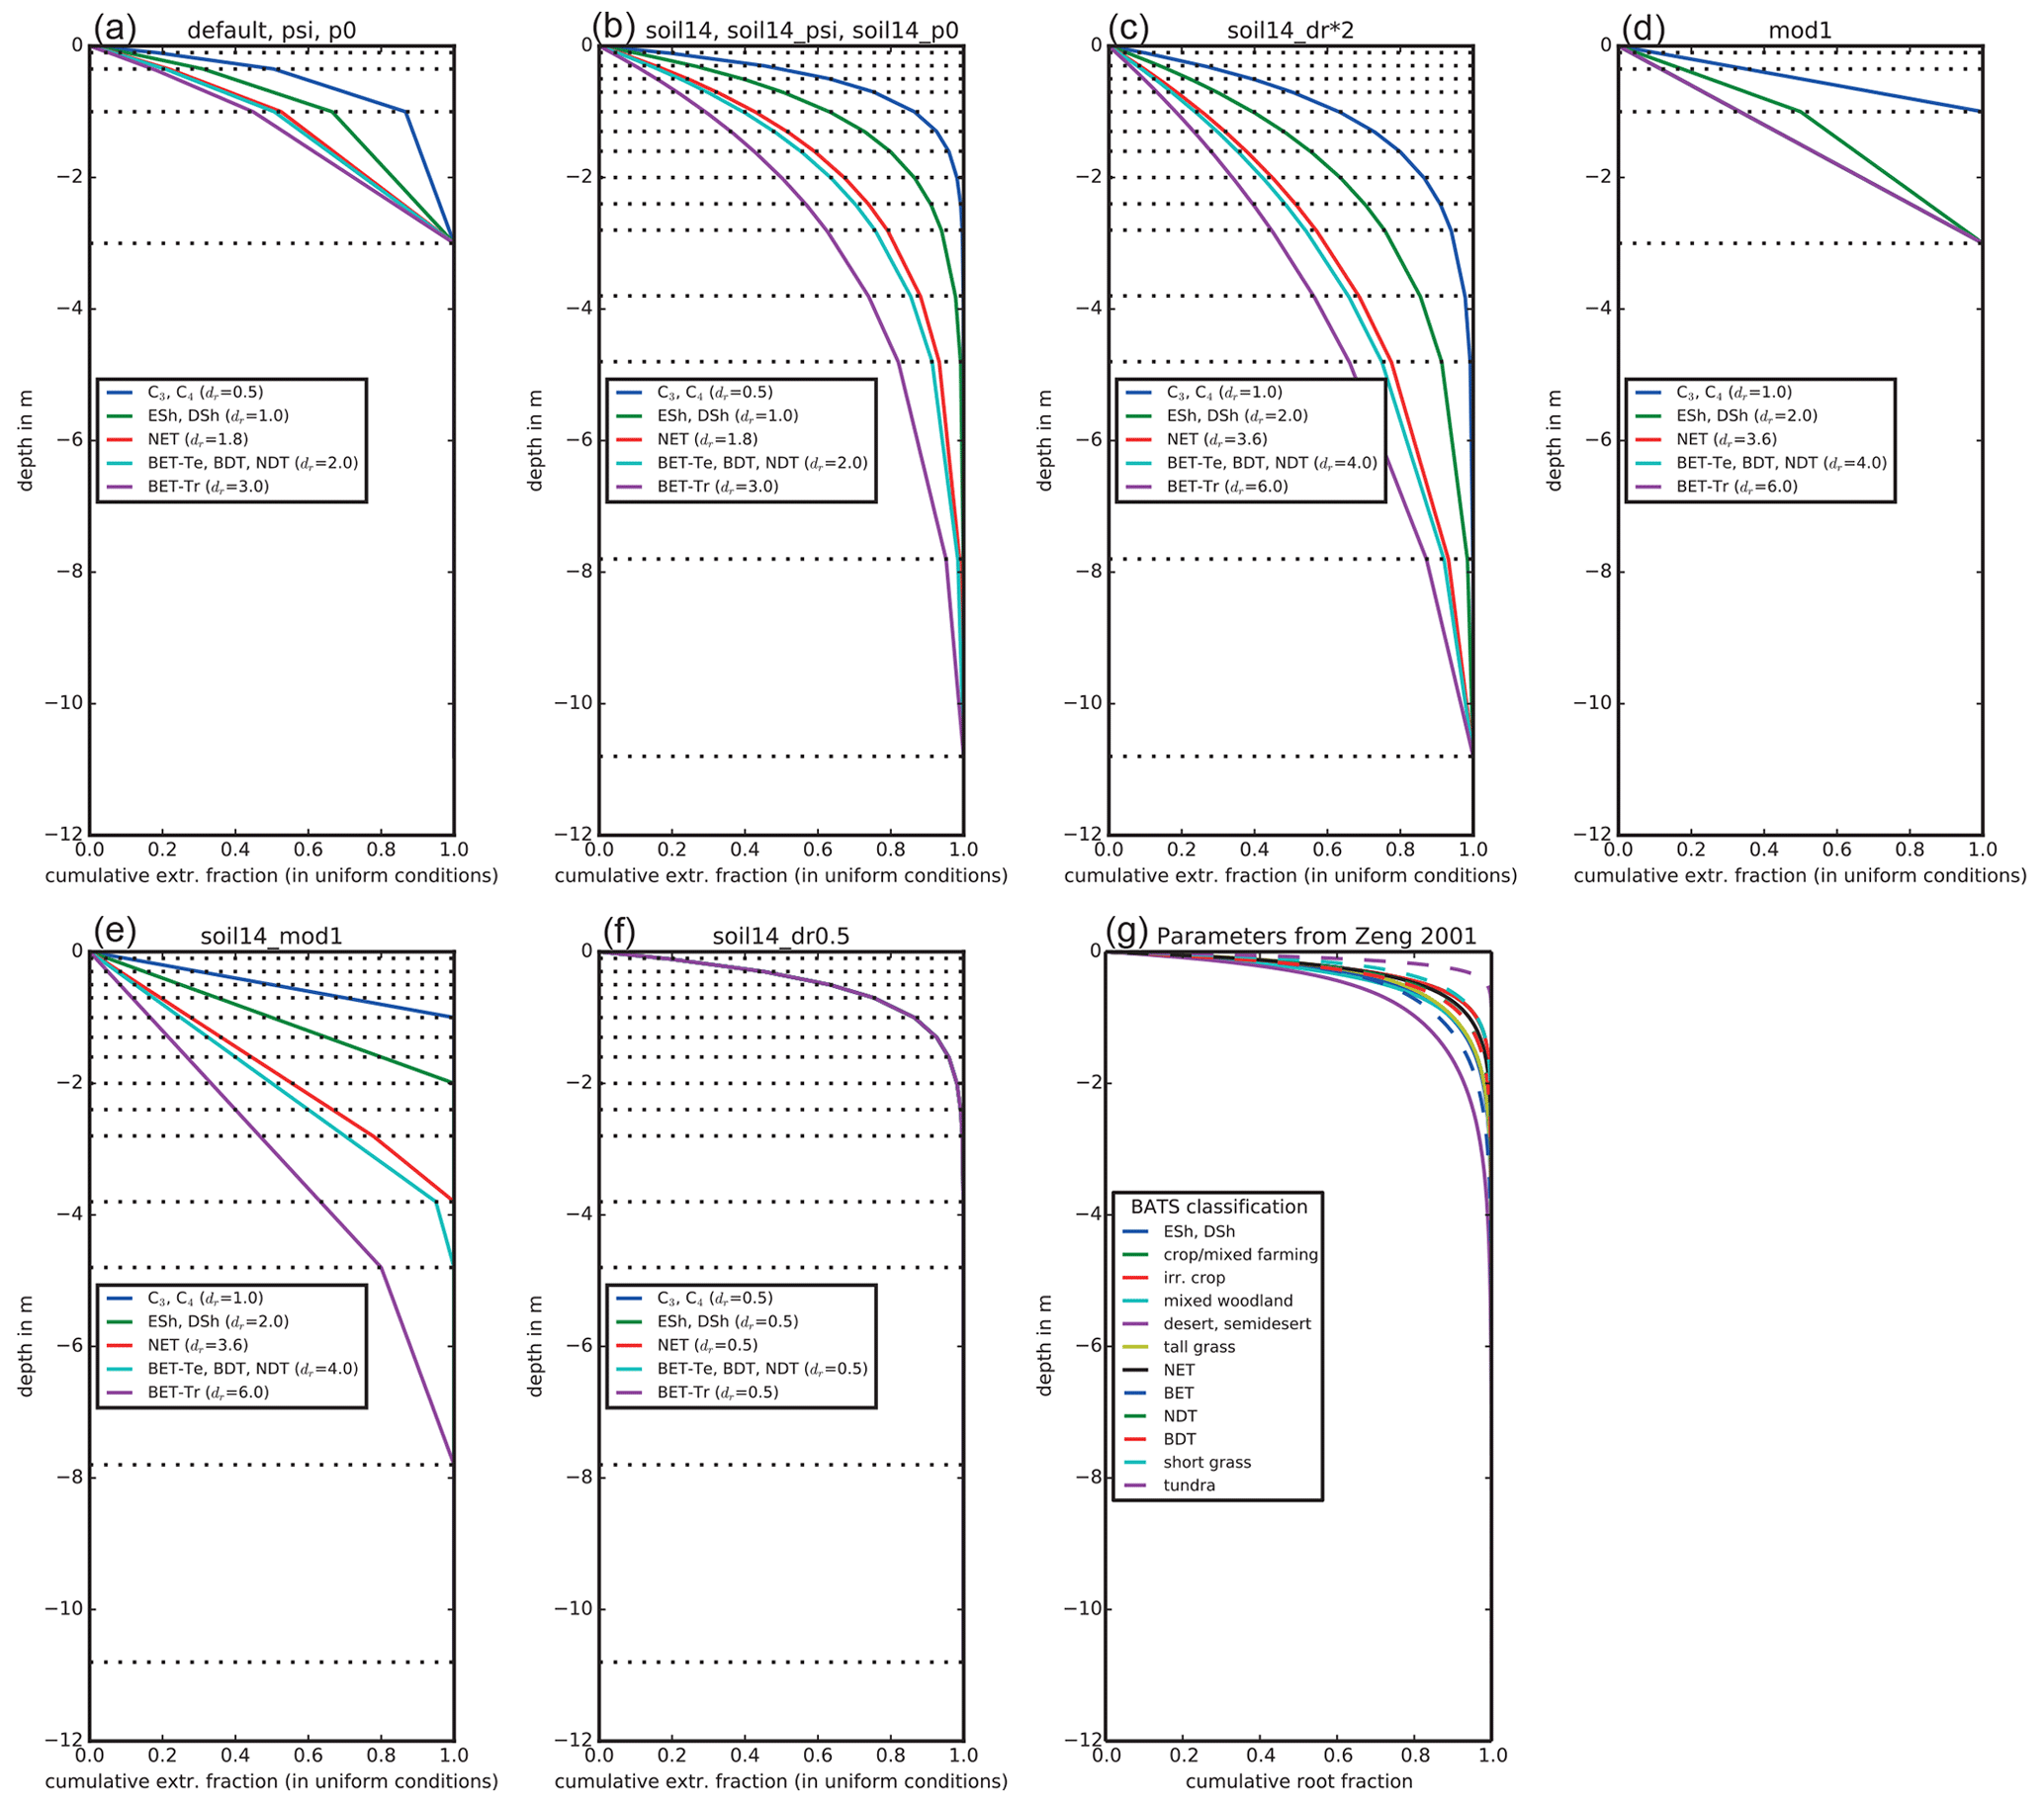
Figure 2Effective root water extraction profiles for JULES. The parameter dr is the e-folding depth for weighing root water extraction and soil moisture stress. The plant functional types (PFTs) are C3 and C4 grasses, evergreen and deciduous shrubs (ESh, DSh), needleleaf evergreen trees (NET), temperate broadleaf evergreen trees (BET-Te), broadleaf deciduous trees (BDT), needleleaf deciduous trees (NDT), and tropical broadleaf evergreen trees (BET-Tr). The horizontal dotted lines show the bottom depth of each layer. Profiles for the experiments in this study are shown: with the default 3 m deep, 4-layer soil (a); with an updated 10.8 m deep, 14-layer soil (b); with the 10.8 m deep soil and doubled dr (c); with water extraction weighted by layer thickness and 3 m deep soils (d); with water extraction weighted by layer thickness and 10.8 m deep soils (e); and with all PFTs having dr= 0.5 and the 10.8 m deep soil (f). For comparison, panel (g) shows root fractions from Zeng (2001), where distributions were calculated based on available measurements of root profiles.
The stress factor is also applied to leaf maintenance respiration (and optionally to stem and root maintenance respiration). The effective root distribution and stress factor also affect the fraction of total plant transpiration extracted from each soil layer, ϵk:
Although not used in this study, it is worth noting that many land surface and terrestrial biosphere models apply soil moisture stress through limiting stomatal conductance (the “stomatal” grouping from Bonan et al., 2014) (Egea et al., 2011; Fatichi et al., 2012; De Kauwe et al., 2015). These include JSBACH and DLEM (Raddatz et al., 2007; Tian et al., 2010). For example, CABLE uses β to modify the slope of the relationship between stomatal conductance and net photosynthesis (De Kauwe et al., 2015). In other models (e.g., crop model WOFOST), they interact through allowing the actual or potential evapotranspiration to impact the soil moisture threshold for unstressed vegetation (Tardieu and Davies, 1993). Models that limit stomatal conductance from soil moisture stress can include the explicit consideration of the plant or soil hydraulics (Williams et al., 1996; Zhou et al., 2013; Bonan et al., 2014; Mirfenderesgi et al., 2016; Eller et al., 2018; Kennedy et al., 2019; De Kauwe et al., 2020) and/or chemical signalling, such as the abscisic acid (ABA) concentration in the xylem sap (Tardieu and Davies, 1993; Dewar, 2002; Verhoef and Egea, 2014; Huntingford et al., 2015; Takahashi et al., 2018). In other models, β can affect root growth and leaf senescence (Arora and Boer, 2005; Song et al., 2013; Wang et al., 2016) or reduce mesophyll conductance (Keenan et al., 2010).
Table 1Summary of the 10 JULES model experiments related to the treatment of soil moisture stress.

Table 2Default parameter settings (changed in experiments summarized in Table 1). In the JULES code, p0 is called fsmc_p0, nsoil is called sm_levels, dr is called rootd, ψopen is psi_open, and ψclose is psi_close.

2.3 Alternative representations of soil moisture stress
In this study, we evaluated JULES GPP and LE using alternative parameterizations for β based on a review of methods found in the literature and supported by measurements. The 10 experiments are summarized in Tables 1 and 2, including settings in the default configuration. To summarize, these experiments aim to capture the impact of the following variables:
-
using deeper soils and roots (“soil14” and “soil14_dr*2” experiments, Sect. 2.3.1);
-
reducing the critical soil moisture content below which stress begins to increase (“p0” experiments, Sect. 2.3.2);
-
using soil matric potential rather than θ to calculate soil moisture stress (“psi” experiments, Sect. 2.3.3);
-
emphasizing deep roots that may have small fraction of total root biomass but can extract large amounts of soil water (“mod1” experiments, Sect. 2.3.4);
-
assuming a strong decay rate of root functioning for all PFTs (“soil14_dr0.5”, Sect. 2.3.5).
2.3.1 Deeper soil column and roots (soil14 and soil14_dr*2)
Several studies have found that deep roots are an essential part of modeling plant drought responses (Canadell et al., 1996; Teuling et al., 2006; Baker et al., 2008; Akkermans et al., 2012; Wang and Dickinson, 2012). Canadell et al. (1996) found that the global average maximum root depth is 7±1.2 m for trees and 2.6±0.1 m for herbaceous plants, although maximum rooting depth is difficult to ascertain. For example, one study found that only 9 % of 475 rooting profiles extended to depths where roots were no longer present (Schenk and Jackson, 2005). We evaluated the impact of deeper soils by using a 14-layer soil, extending to 10.8 m depth. The 14-layer soil is being evaluated for use in future global configurations of JULES both offline and coupled in the UK Earth System Model. For example, it has been used for studying freeze–thaw dynamics in permafrost regions (Chadburn et al., 2015), but the impacts on surface fluxes in the middle and low latitudes have not yet been evaluated. In the “soil14” experiments, nsoil increased from 4 to 14 and the thickness of each soil layer (dzsoil) was changed as in Table 1 to give a total depth of 10.8 m. This also increased the vertical resolution of layers in the top 2.8 m of soil, which is more accurate for solving the nonlinear Richards' equation (Mu et al., 2021). The parameter dr remained unchanged, resulting in the effective root profiles shown in Fig. 2b. As a result, for C3 and C4 grasses (dr=0.5), 99 % of root water extraction was from the top 2.4 m, while for tropical broadleaf evergreen trees (dr=3), 95 % of root water extraction was from the top 7.8 m (the remaining 5 % was from the bottom soil layer, which extended from 7.8 to 10.8 m). These numbers compare well to the observed maximum rooting depths (Canadell et al., 1996).
To evaluate the impact of placing more emphasis on deeper soil layers (in Eqs. 6 and 8), we doubled dr in an additional experiment (“soil14_dr*2”) (Fig. 2c). In these experiments, 99 % of root water extraction was from the top 4.8 m for C3 and C4 grasses (dr=1), and for tropical evergreen trees (dr=6), 87 % of root water extraction was from the top 7.8 m.
2.3.2 Delayed onset of stress (p0 and soil14_p0)
Measurements of transpiration rates show that plants do not limit transpiration until intermediate levels of soil dryness occur (Fig. 1) (Verhoef and Egea, 2014). In JULES, having no stress until soils dry below field capacity can be represented with the parameter p0 (Eq. 5), where a value of 0.4–0.5 for p0 would capture the range of responses found in Verhoef and Egea (2014). In the “p0” experiments, we used p0=0.4. This was done with both the 4-layer (p0) and 14-layer (soil14_p0) soils.
2.3.3 Curvilinear response (psi and soil14_psi)
While Eq. (4) assumes a linear increase in stress as water content decreases, some models assume a curvilinear increase in stress (Sinclair, 2005; Oleson et al., 2010; Egea et al., 2011) or an S-shaped curve (Tardieu and Davies, 1993; De Kauwe et al., 2015). Nonlinear responses can be represented by a parameter to induce curvature (Egea et al., 2011) or through using the soil matric potential, ψ, rather than θ:
Here, ψopen is the soil matric potential above which β=1, and ψopen is the soil matric potential below which β=0. We set ψopen and ψclose to −0.033 and −1.5 MPa, respectively, which are typical values for field capacity and wilting point. Models that use soil water potential include (Verhoef and Egea, 2014; Fatichi et al., 2012; Manzoni et al., 2013; Lawrence et al., 2019), while other models use leaf water potential (Tuzet et al., 2003; Christina et al., 2017). In the “psi” experiments, we replaced Eq. (4) with Eq. (9). This was done with both the 4-layer (psi) and 14-layer (soil14_psi) soils.
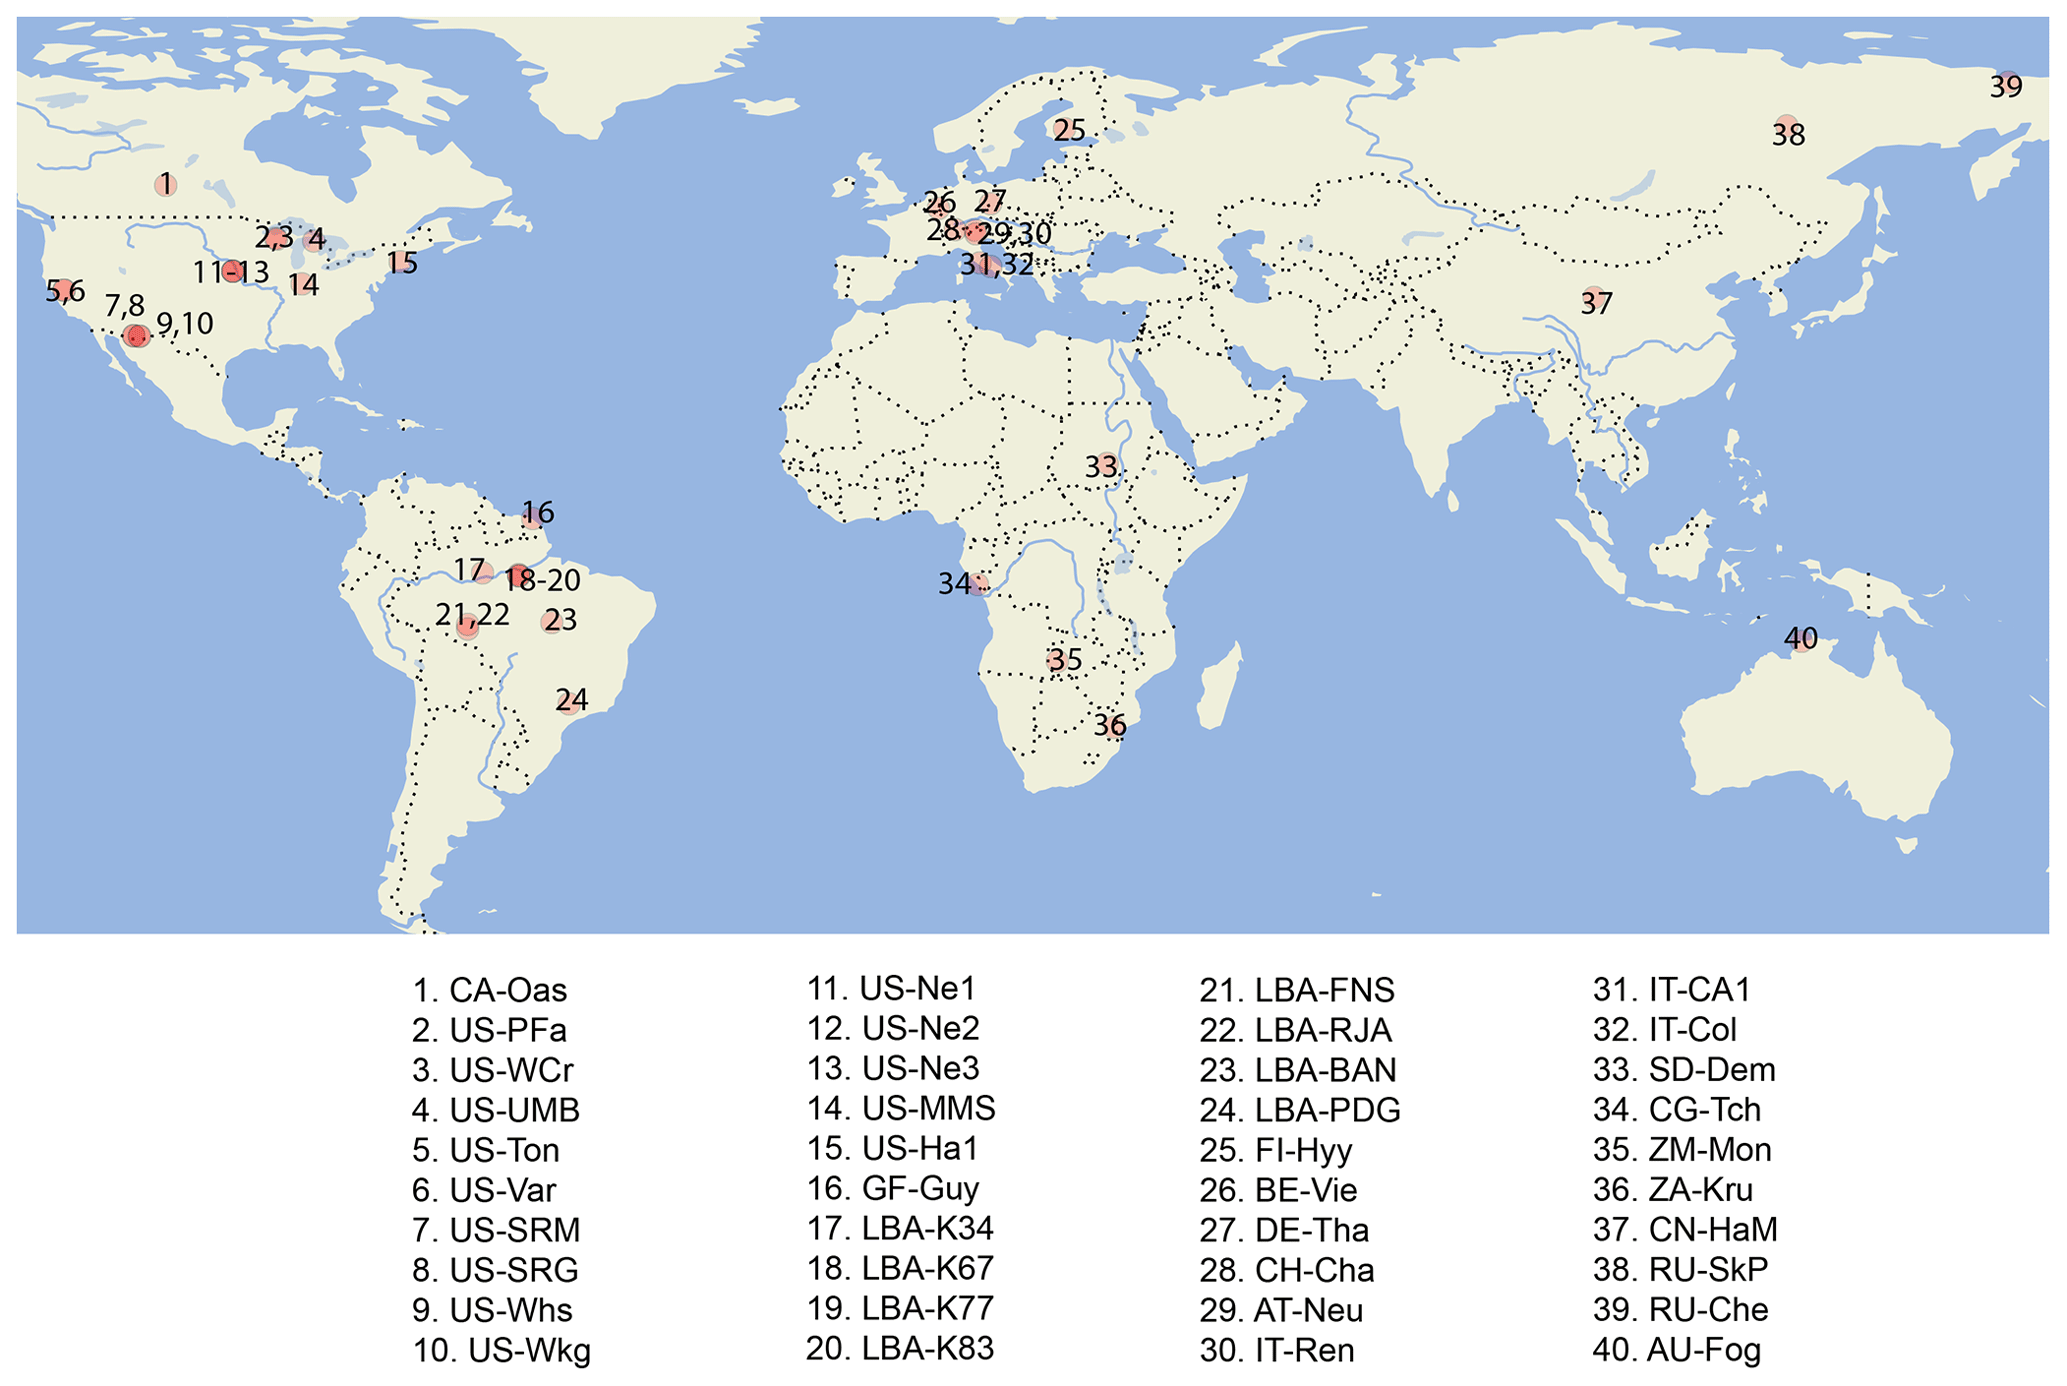
Figure 3Location of sites used in this study. Details on site characteristics are provided in the Supplement.
2.3.4 Remove root-weighted access to soil moisture (mod1 and soil14_mod1)
The measure of water availability for β can be a function of each layer's water content (Eq. 6), water in the wettest layer (Martens et al., 2017), or the contribution of the water in each layer can be weighted by the root density or plant and soil hydraulics (Oleson et al., 2010; Christina et al., 2017). Another approach is to use a function of water in the whole root column (), rather than layer-by-layer, which is equivalent to assuming that plants can access water anywhere in the soil column if there are roots present (Baker et al., 2008; Harper et al., 2013):
In this approach, root water extraction per layer is weighted by layer thickness (dzsoil) rather than by beta:
In the “mod1” experiments, Eqs. (4) and (6) were replaced with Eq. (10) and Eq. (8) was replaced with Eq. (11). In addition, dr was implemented as the maximum root depth instead of the e-folding depth and was double its default value (with a maximum depth of 3 m). The effective root fraction in each soil layer was set equal to the proportional thickness of each layer, up to the maximum depth of roots (Fig. 2d). In “soil14_mod1”, dr was double its default value (Table 2) but without enforcing a maximum depth of 3 m (Fig. 2e). With the default interpretation of dr, roots are present in every layer, but in these experiments plants could not access water at depths below the parameter dr. Therefore, this approach should benefit deep-rooted PFTs, as they could access more of the soil column than shallow-rooted grasses and shrubs.
2.3.5 Exponential decline of roots with depth (soil14_dr0.5)
The effective root profile from grasses with nsoil=14 and depth of 10.8 m more closely resembles the observed rapid decay of root biomass with depth than the profiles for other PFTs (Zeng, 2001) (Fig. 2g). We evaluated the impact of using more realistic root distributions by setting dr to 0.5 for all PFTs in the “soil14_dr0.5” experiment (Fig. 2f). Essentially, this gave more emphasis to shallow layers in calculating root water extraction and β and was an opposite approach of the “mod1” experiments, which gave more emphasis to the thickest soil layers.
2.4 Model set up and evaluation
We evaluated JULES at 40 sites covering eight general biome types from the tropics to the Arctic (Fig. 3, Table S1). Each JULES simulation was run with meteorological measurements taken at each site (i.e., point-scale runs rather than simulating the entire grid box). The meteorological and flux tower observations were obtained from the LBA Model Intercomparison Project (sites with “LBA” in the name) or FLUXNET2015 dataset (Pastorello et al., 2020). We selected sites with soil moisture measurements at the time of our original data request (26 July 2016). At each site, we extracted temperature, precipitation, wind speed, surface pressure, specific humidity, and longwave and shortwave radiation for running JULES at either half-hourly or hourly resolution, depending on the data available. We then used measured LE and calculated GPP as supplied in both datasets (for the FLUXNET2015 data, these are variables LE_F_MDS and GPP_NT_VUT_REF, respectively). Details of the data pre-processing are provided in the Supplement.
We individually contacted site principal investigators (PIs) to gather details on LAI; the depth of soil moisture measurements (where available); and other details on soil texture, physical properties, and root depth. Based on the responses, this resulted in a subset of 21 sites with soil moisture measurements plus the additional information necessary for prescribing soil moisture in JULES. Of these sites, 14 also had the information necessary for prescribing LAI (these are listed in Table S1). Often the time period of LAI/SM measurements was shorter than the full record, and we only ran JULES for the time periods with the most data to avoid the need for gap-filling. The time periods of the simulations and soil layers for prescribing data are provided in Table S1.
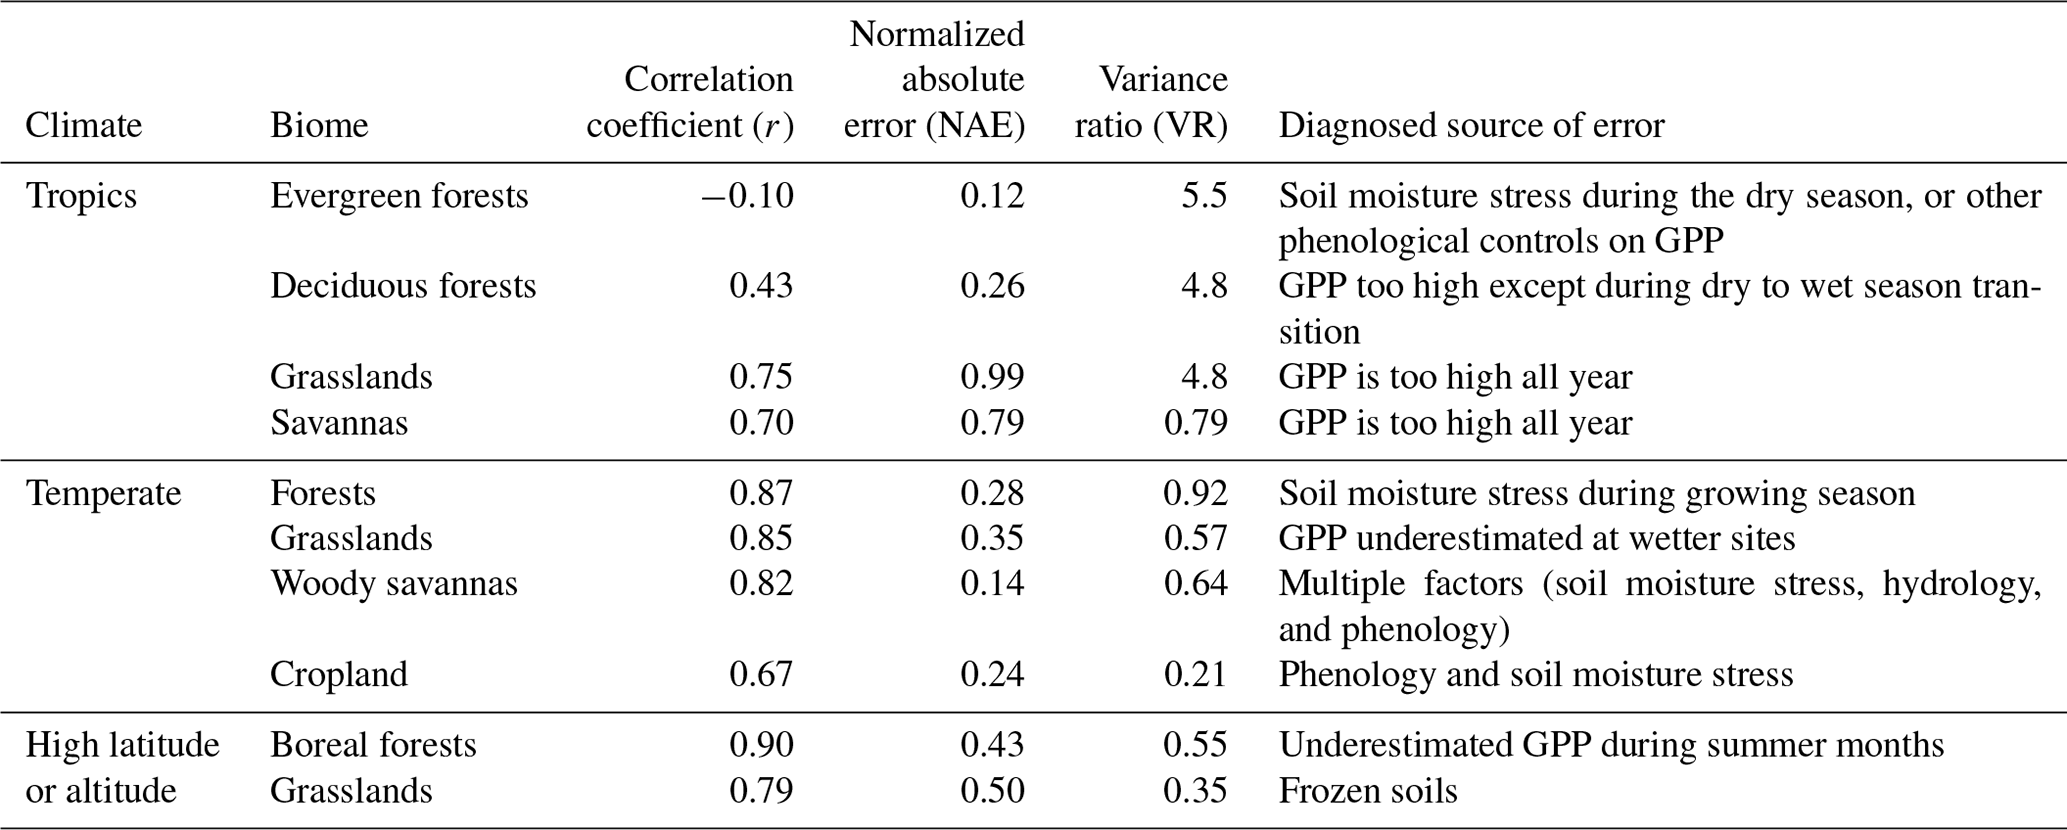
Table 3Summary of model performance for GPP with no prescribed data. The statistics are averages for each biome: Pearson's correlation coefficient (r), normalized absolute annual error (NAE), and variance ratio (VR).
The default plant parameter set was taken from Harper et al. (2016). When LAI was not prescribed, we used the JULES phenology scheme to predict LAI. This scheme predicts leaf growth and senescence based on temperature alone. Fractions of each PFT (or bare soil) present at the site were determined from the vegetation class (Tables S1, S2). We calculated soil properties from information supplied by site PIs where possible; otherwise, we used the grid box sand, silt, clay fractions of the Met Office Central Ancillary Program (CAP) high-resolution input file (Dharssi et al., 2009) to derive the Brooks and Corey (1964) parameters, along with the approximations of the parameters (via pedotransfer function) required for the soil hydraulic properties as detailed in Cosby et al. (1984) (Table S3). Each simulation began with a 50-year spin-up of the soil moisture using recycled meteorology.
This evaluation focused on seasonal and annual timescales of fluxes. We started with daily measurements from the sites, then masked any modeled outputs on days when measurements were not available and calculated monthly means when > 50 % of the data was present. To evaluate the model performance, we used four metrics: normalized absolute error (NAE), variance ratio (VR), correlation coefficient (r), and root-mean-squared error (RMSE). The NAE gives an indication of the average model–data mismatch:
where Xobs is the observed flux, Xmod is the modeled flux, and the overbar denotes an average taken over the entire simulation period. The other metrics were calculated from monthly mean fluxes. The VR is the ratio of variance in the simulations to the observations. For a perfect fit, the VR would be 1: lower values mean the model variance is too low and vice versa (Carvalhais et al., 2008). R is the Pearson's correlation coefficient and it gives an indication of model–data agreement on both a seasonal and year-to-year timescale. For the soil moisture stress experiments, we used Taylor diagrams based on monthly mean fluxes to evaluate the best fit, along with RMSE from fluxes averaged over daily and monthly periods and VR and correlation calculated from monthly fluxes.
3.1 Simulated GPP and ET
On average, JULES matched the pattern of observed seasonal cycle of GPP well for sites in non-agricultural biomes in temperate and cold climates (mean r> 0.79) (Fig. 4, Table 3). The correlation was fairly good for sites in tropical grasslands and savannas (mean r> 0.70) and cropland (r= 0.67). However, the seasonal cycle was not well represented for sites in tropical dry forests (mean r= 0.43) or tropical evergreen forests (mean r= −0.10).
In terms of model biases, the NAE was lowest (mean < 0.2) for GPP at tropical evergreen forest and temperate woody savanna sites, while NAE was highest in tropical grassland, tropical savanna, and cold grassland sites (mean > 0.50) (Fig. 5). The variance ratio (VR) indicates the amount of simulated variability in comparison to observations, a perfect simulation would have a VR of 1.0. A low VR indicates that simulated variability (either magnitude of seasonal cycle or interannual variability) was too low – this was the case for sites in cold grasslands and cropland (average VR of 0.35 and 0.21, respectively). On average, VR was between 0.55–0.92 for sites in tropical savannas, temperate non-agricultural biomes, and boreal forest. Conversely, a high VR indicates that simulated variability was higher than observed. Sites in tropical dry and evergreen forests and tropical grasslands had an average VR of 4.8, 5.5, and 4.8, respectively, due to an overestimated seasonal cycle (ie LBA-K67 in Fig. 6).
The model tended to perform best in temperate midlatitude climates. The average NAE and correlation (r) for temperate forest sites was 0.15 and 0.92, compared to 0.51 and 0.75 for the three sites in a Mediterranean climate (IT-CA1, IT-Ren, and IT-Col). Sites in temperate grasslands had an average NAE of 0.35 and were better simulated than those in cold and tropical grasslands (NAE = 0.50 and 0.99, respectively). NAE also was significantly higher for sites in tropical savannas (NAE = 0.79) compared to those in temperate savannas in the US (NAE = 0.14).
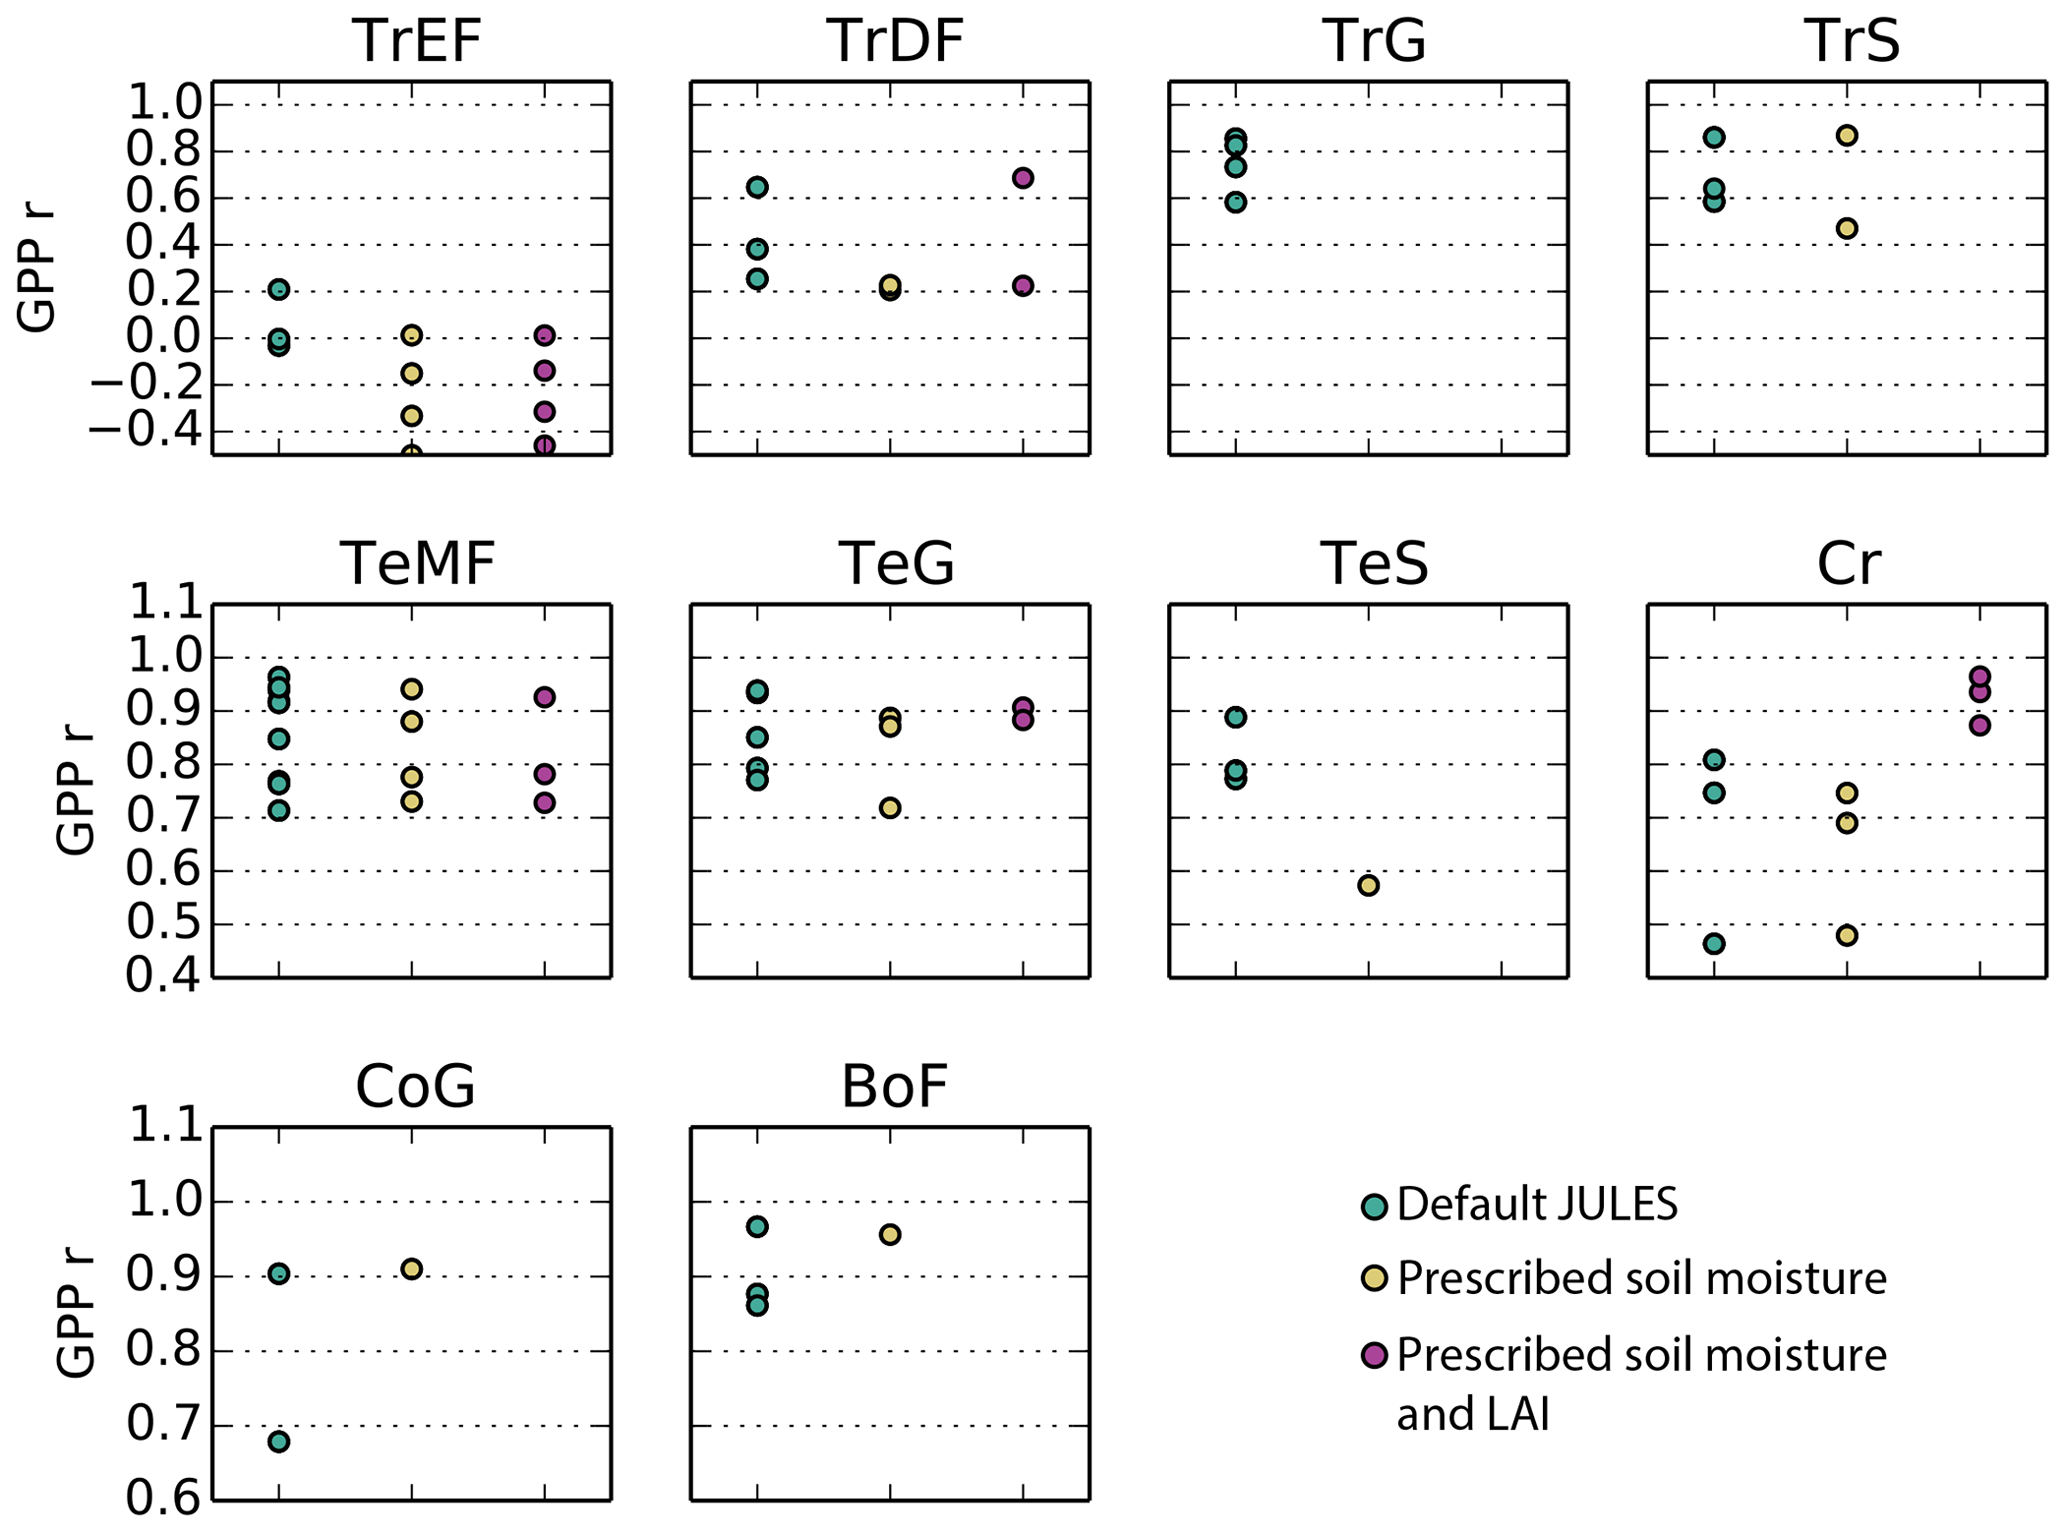
Figure 4Correlation coefficient for simulated monthly mean GPP at Fluxnet sites for the following 10 biomes: TrEF stands for tropical evergreen forests, TrDF stands for tropical deciduous forests, TrG stands for tropical grasslands, TrS stands for tropical savannas, TeMF stands for temperate mixed forests, TeG stands for temperate grasslands, TeS stands for temperate savannas, Cr stands for cropland, CoG stands for continental or high-altitude grasslands, and BoF stands for boreal forests. The sites that fall into each category are listed in the Supplement.
The model performance was also more related to climate than biome for LE. On average, the seasonal cycle of LE was well simulated for sites outside of the tropics (mean r per biome > 0.84) and for sites in tropical savannas (r= 0.79) (Table 4, Fig. S1). However, in tropical dry and evergreen forests and tropical grasslands, the seasonal cycle was overestimated, as indicated by low correlations (mean r= 0.52, 0.29, 0.35, respectively) and high variance ratios (mean VR = 1.9, 3.8, 5.2, respectively). Model variance was close to observed for the tropical savanna sites (VR = 0.99). Unlike for GPP, the highest NAE occurred in temperate mixed forests (NAE = 0.55) (Fig. S2). The NAE was lowest for the cropland sites (NAE = 0.03), followed by tropical evergreen and dry forest sites (NAE = 0.13 for both).
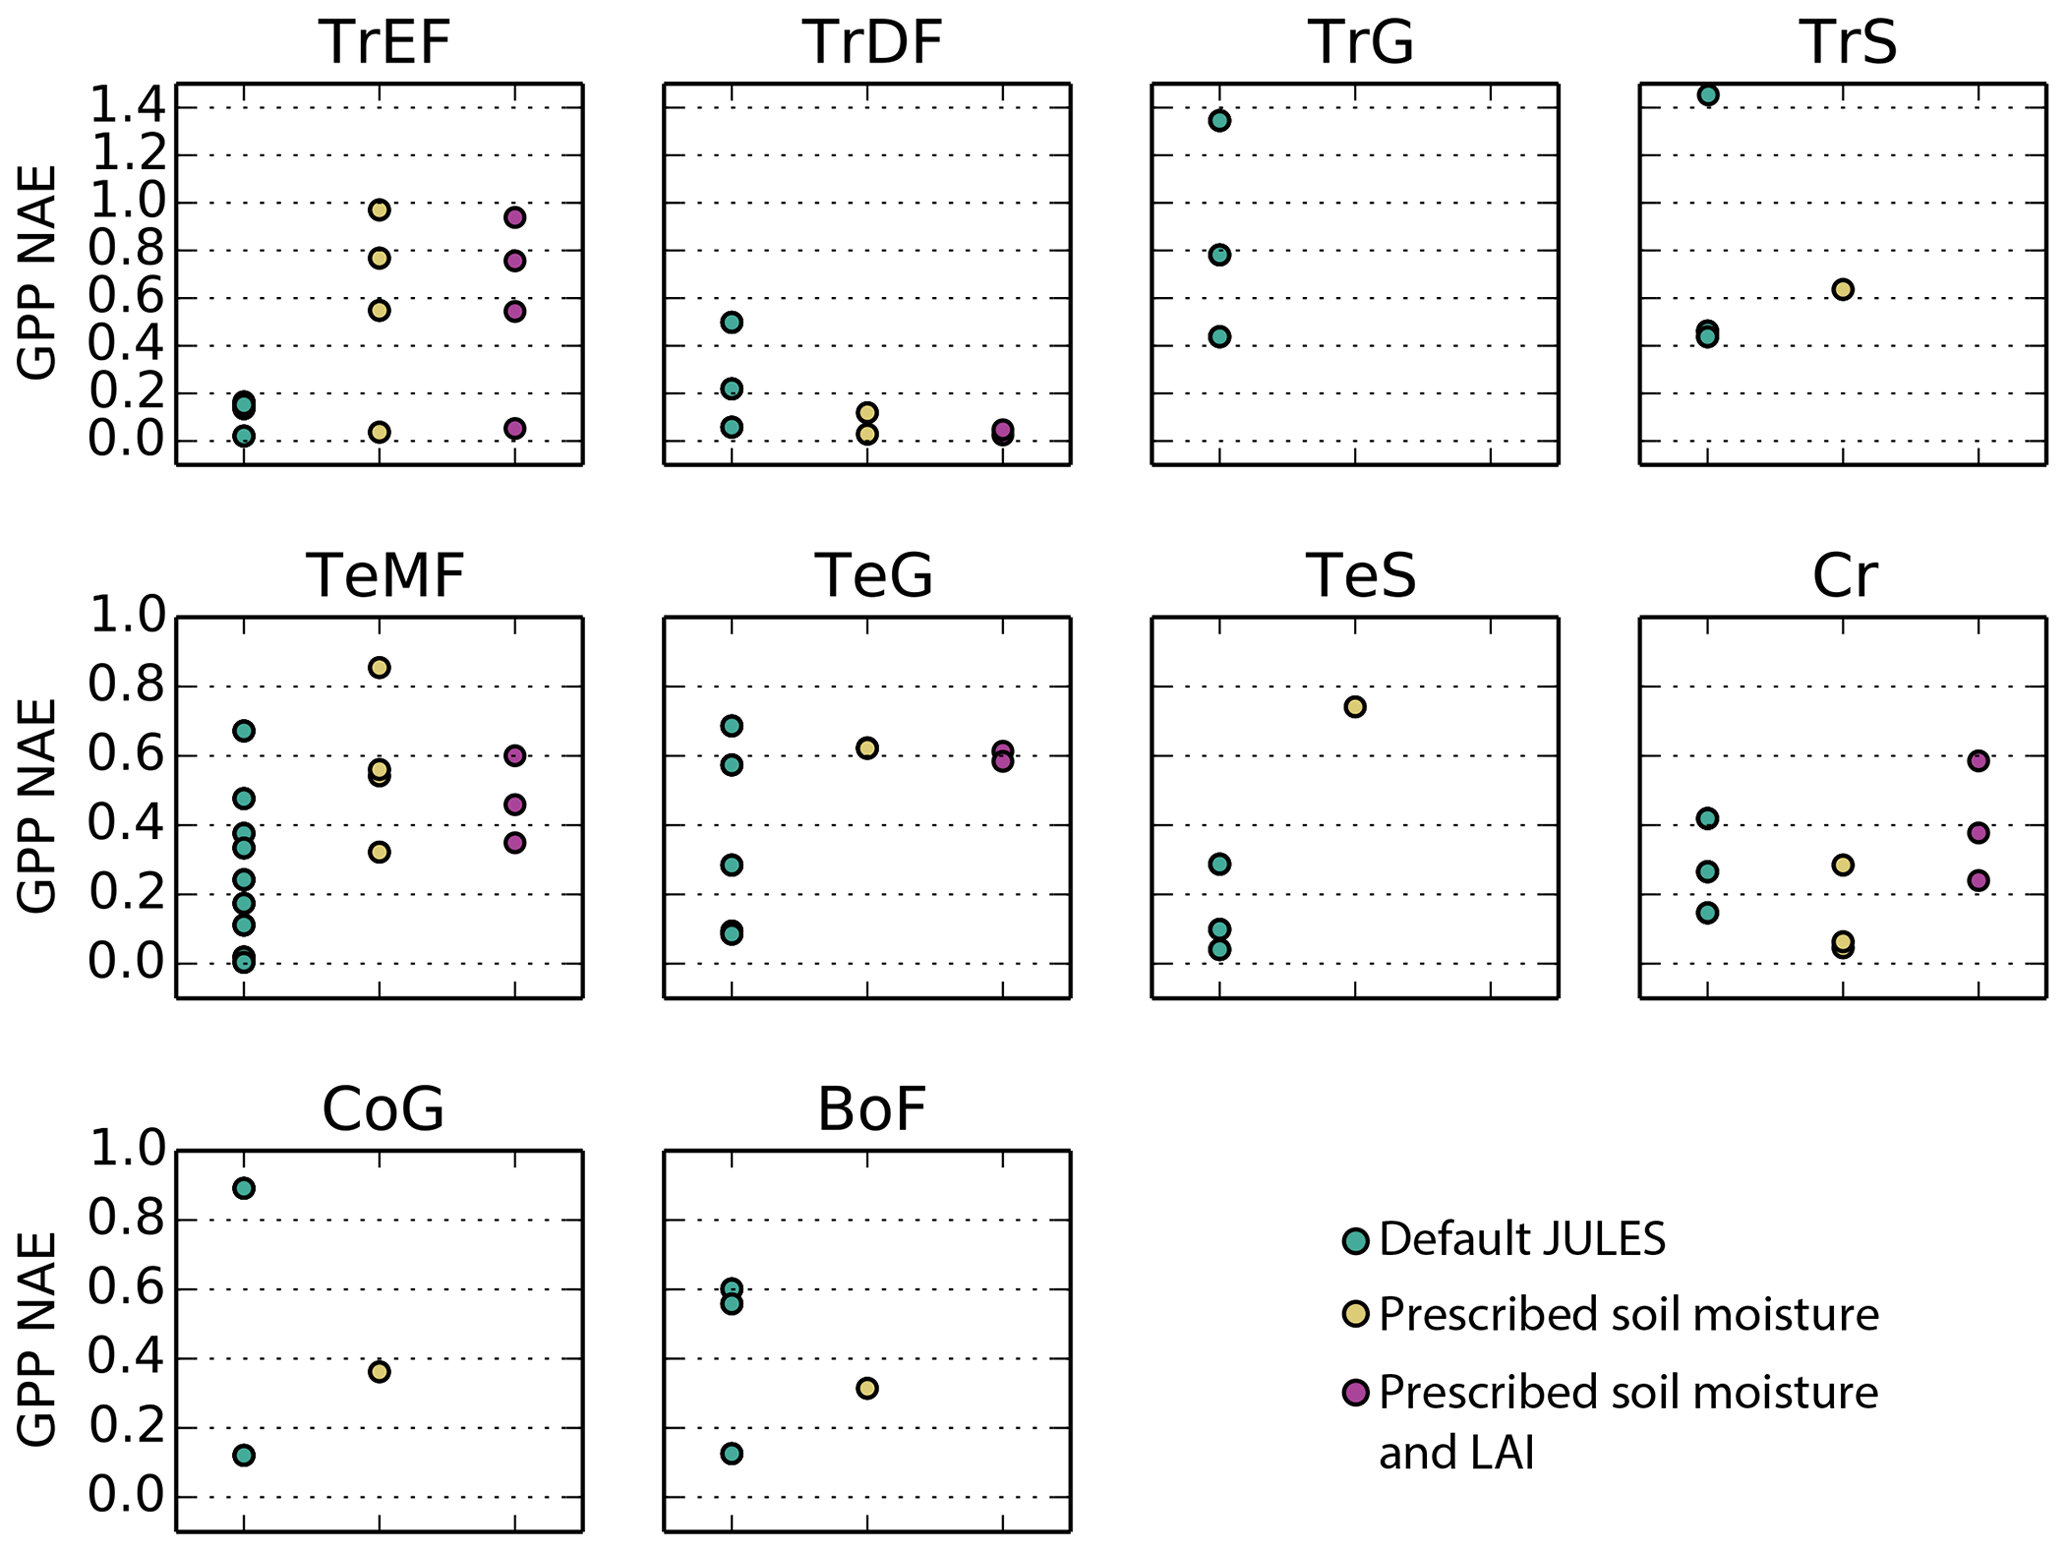
Figure 5Normalized absolute errors for simulated GPP at Fluxnet sites for the following 10 biomes: TrEF stands for tropical evergreen forests, TrDF stands for tropical deciduous forests, TrG stands for tropical grasslands, TrS stands for tropical savannas, TeMF stands for temperate mixed forests, TeG stands for temperate grasslands, TeS stands for temperate savannas, Cr stands for cropland, CoG stands for continental or high-altitude grasslands, and BoF stands for boreal forests. The sites that fall into each category are listed in the Supplement.
Table 4Summary of model performance for LE with no prescribed data. The statistics are averages for each biome: Pearson's correlation coefficient (r), normalized absolute annual error (NAE), and variance ratio (VR).
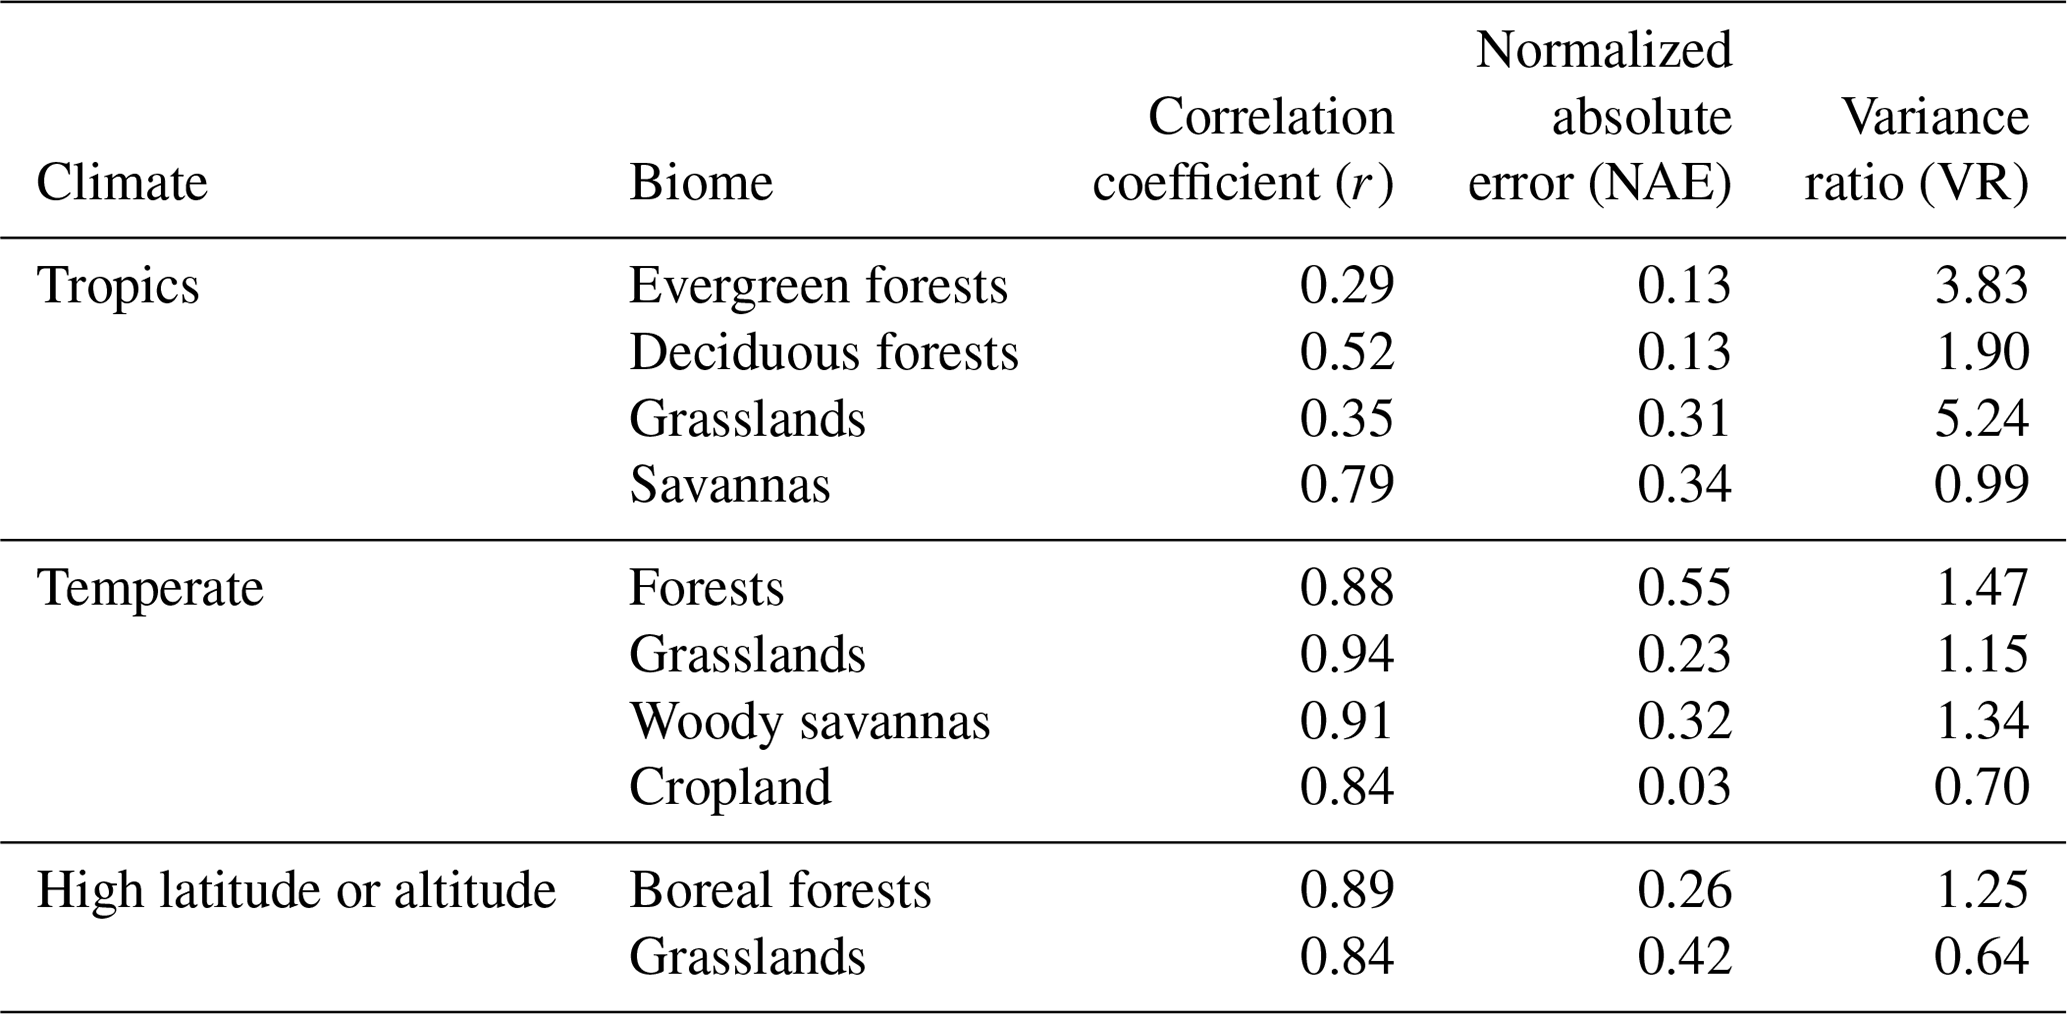
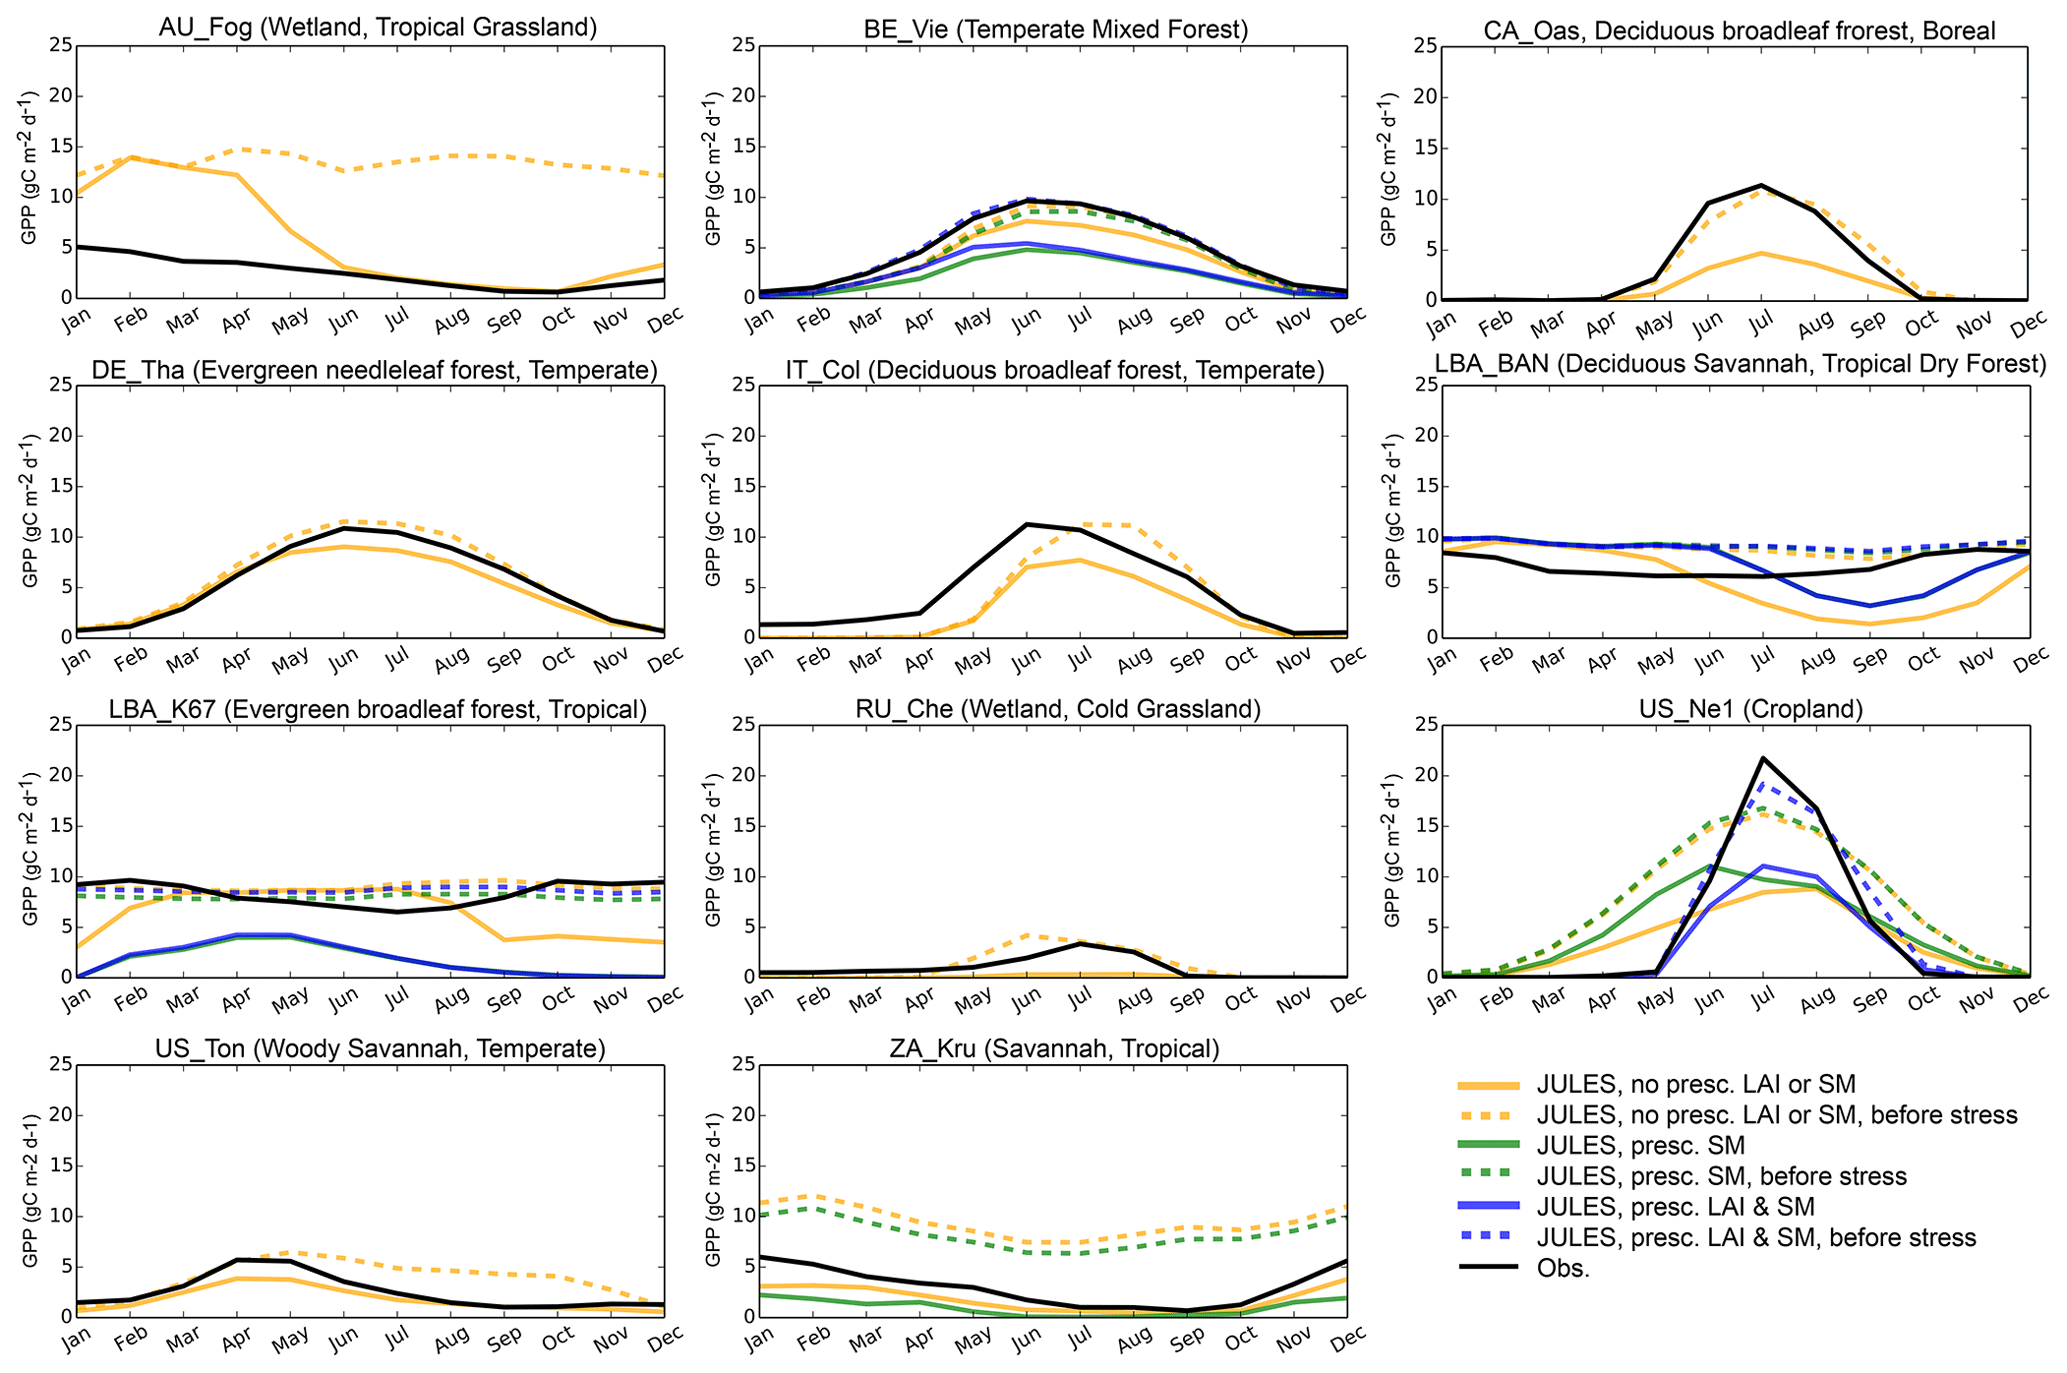
Figure 6Average seasonal cycle of GPP (g C m−2 d−1) for representative sites in biomes with large biases. Full dates of simulations are provided in the Supplement; here we give the years that are included in each simulation: AU-Fog (2006–2008), BE-Vie (1996–2006), CA-Oas (1996–2010), DE-Tha (1996–2014), IT-Col (1996–2014), LBA-BAN (2004–2006), LBA-K67 (2002–2003), RU-Che (2002–2005), US-Ne1 (2001–2012), US-Ton (2001–2014), ZA-Kru (2000–2013).
3.2 Role of soil moisture stress in GPP errors
Based on the above analysis, on average the model performance is poorest for evergreen broadleaf sites, Mediterranean climates, cold and tropical grasslands, and tropical savannas. We compared the GPP that JULES would calculate if there was no soil moisture stress to the actual simulated GPP (Figs. 6, S3) to elucidate the role of soil moisture stress in generating model bias from 3.1. This was possible through a new diagnostic added to the model, which output GPP prior to multiplication by β. At the tropical evergreen forest sites (GF-Guy, LBA-K34, LBA-K67, LBA-K83, and LBA-BAN), simulated GPP decreased during the dry season, while the unstressed GPP and observed GPP remained high or even increased during dry seasons (Fig. S3), which indicates that the model was overestimating soil moisture stress during the dry season. At the tropical grassland and savanna sites (AU-Fog, CG-Tch, LBA-PDG, LBA-K77, and LBA-FNS), the modeled GPP was often too high, and the unstressed GPP was even higher. An exception was ZA-Kru, where the observed GPP was somewhere in between simulated GPP and unstressed GPP. There were mixed results for the sites with a Mediterranean climate (IT-CA1 deciduous broadleaf forest, US-Ton woody savanna, and US-Var grassland): stress was impacting the GPP but other processes were also affecting the simulation. For example, at IT-CA1 the modeled GPP was very close to measured values when observed soil moisture and LAI were used, indicating that errors in soil hydrology and phenology were important at this site. At other semi-arid sites (IT-Col deciduous broadleaf forest, US-Ton, and US-Var), the bias occurred during the peak growing season, when JULES GPP was lower than observed but unstressed GPP was closer to observations, indicating that soil moisture stress was impacting results at these sites. In the cold grassland sites, soil moisture stress sometimes resulted in underestimated GPP (e.g., RU-Che), possibly due to JULES not simulating enough unfrozen soil moisture at these sites. Conversely, at two temperate climate grasslands (AT-Neu and CH-Cha), the simulated GPP was too low even with soil moisture stress removed. Other sites where JULES showed a large improvement with the unstressed GPP were the aspen site in Canada (CA-Oas), Tharandt evergreen needleleaf forest in Germany (DE-Tha), the deciduous broadleaf forest in Belgium (BE-Vie), and the cropland site (US-Ne1). This analysis gives a list of sites that are useful for further exploring the role of soil moisture status in vegetation functioning: all sites with a Mediterranean climate or in tropical evergreen forests, as well as ZA-Kru, RU-Che, CA-Oas, DE-Tha, BE-Vie, and US-Ne1. These sites are further evaluated in Sect. 3.3.
When prescribing soil moisture and LAI (see Sect. 2.4), the general trends in model performance were similar to prior simulations, although often the simulated GPP was less realistic with more prescribed data. This could be due to other errors within the soil physical parameterizations related to infiltration or soil evaporation (Van Den Hoof et al., 2013). The simulations at the tropical evergreen forest sites still did not resemble the measured GPP (as indicated by very low or negative correlations), even with prescribed LAI and soil moisture. It is possible that soil layers below those typically measured are influencing the forests soil water balance and canopy exchange processes, so more data are needed to accurately prescribe the full soil moisture profile. Only 14 sites had enough data to prescribe both soil moisture and LAI from site observations (Sect. 2.4), and often the time resolution of data was monthly, which for soil moisture could miss impact of extremely wet or dry periods. However, most often adding the LAI data resulted in an improved simulation of GPP, indicating biases resulting from the JULES phenology scheme. The improvements with incorporation of prescribed LAI were particularly large for the cropland sites and at LBA-RJA, which is a seasonally dry tropical forest.
We categorize the sites depending on the impact of soil moisture stress on their simulation of GPP with the most available prescribed data (for example, in the simulation with soil moisture and LAI prescribed at LBA-BAN, and for the simulation with soil moisture only at CN-HaM). The four categories are as follows.
-
Sites with underestimated GPP. Simulated GPP was lower than observed. However, β was often 1 and removing soil moisture stress had a small effect on the simulation, indicating the importance of other processes in regulating GPP at these sites. Two tropical (LBA-K34, LBA-RJA) and two temperate grasslands (AT-Neu, CH-Cha) sites fall into this category
-
Sites with overestimated GPP. Simulated GPP was higher than observed, so removing soil moisture stress increased GPP and made the simulation worse. This category includes one tundra site (CN-HaM), a Mediterranean woodland (IT-CA1), two coniferous evergreen forests in Finland and Italy (FI-Hyy and IT-Ren), an arid grassland (US-SRG), and two tropical savanna sites (CG-Tch, SD-Dem).
-
Soil-moisture-stressed sites. As in the first set of sites, there was a low bias in GPP but removing soil moisture stress improved the simulation. The “stressed” sites include three temperate mixed forests (BE-Vie, DE-Tha, and US-UMB), a Mediterranean deciduous forest (IT-Col), a boreal aspen forest (CA-Oas), a tropical evergreen forest (GF-Guy), and a cropland site (US-Ne1).
-
Stressed sites plus other errors. At several sites, removing soil moisture stress made the simulation slightly better, but other missing processes also apparently affect the simulation. The difference between this category and the soil-moisture-stressed sites is the fact that there would still be a large bias even without soil moisture stress. Sites in this category include tropical forests (LBA-Ban, LBA-K83, LBA-K67), cropland (US-Ne2, US-Ne3), two savanna sites (ZA-Kru and US-SRM), and a tundra site (RU-Che).
The challenge is to determine a representation of soil moisture stress which improves the simulations at sites falling into categories 3 and 4 without degrading the simulation at the other sites. Clearly, we do not want to completely remove soil moisture stress as this plays an important role in regulating seasonal cycles in many ecosystems. In the remainder of the paper, we will focus on examples of changes at some of these sites.
3.3 New treatments of soil moisture stress
We ran the 10 experiments (Sect. 2.3, Table 1) at a subset of 11 sites that span the categories listed in Sect. 3.2. This included four sites where soil moisture stress was the main contributor to model biases (soil-moisture-stressed sites: GF-Guy, BE-Vie, DE-Tha, and CA-Oas), sites with a Mediterranean climate (IT-Col, US-Var, US-Ton), and sites with soil moisture stress plus other errors (LBA-K67, LBA-BAN, ZA-Kru, and RU-Che). Because some experiments focused on extending the soils far below the deepest soil moisture measurements available, we were unable to use prescribed data for these experiments. Taylor diagrams for GPP and LE for all sites are shown in Figs. S5 and S7, respectively, and seasonal cycles of GPP, simulated β, and LE are shown in Figs. S6 and S8.
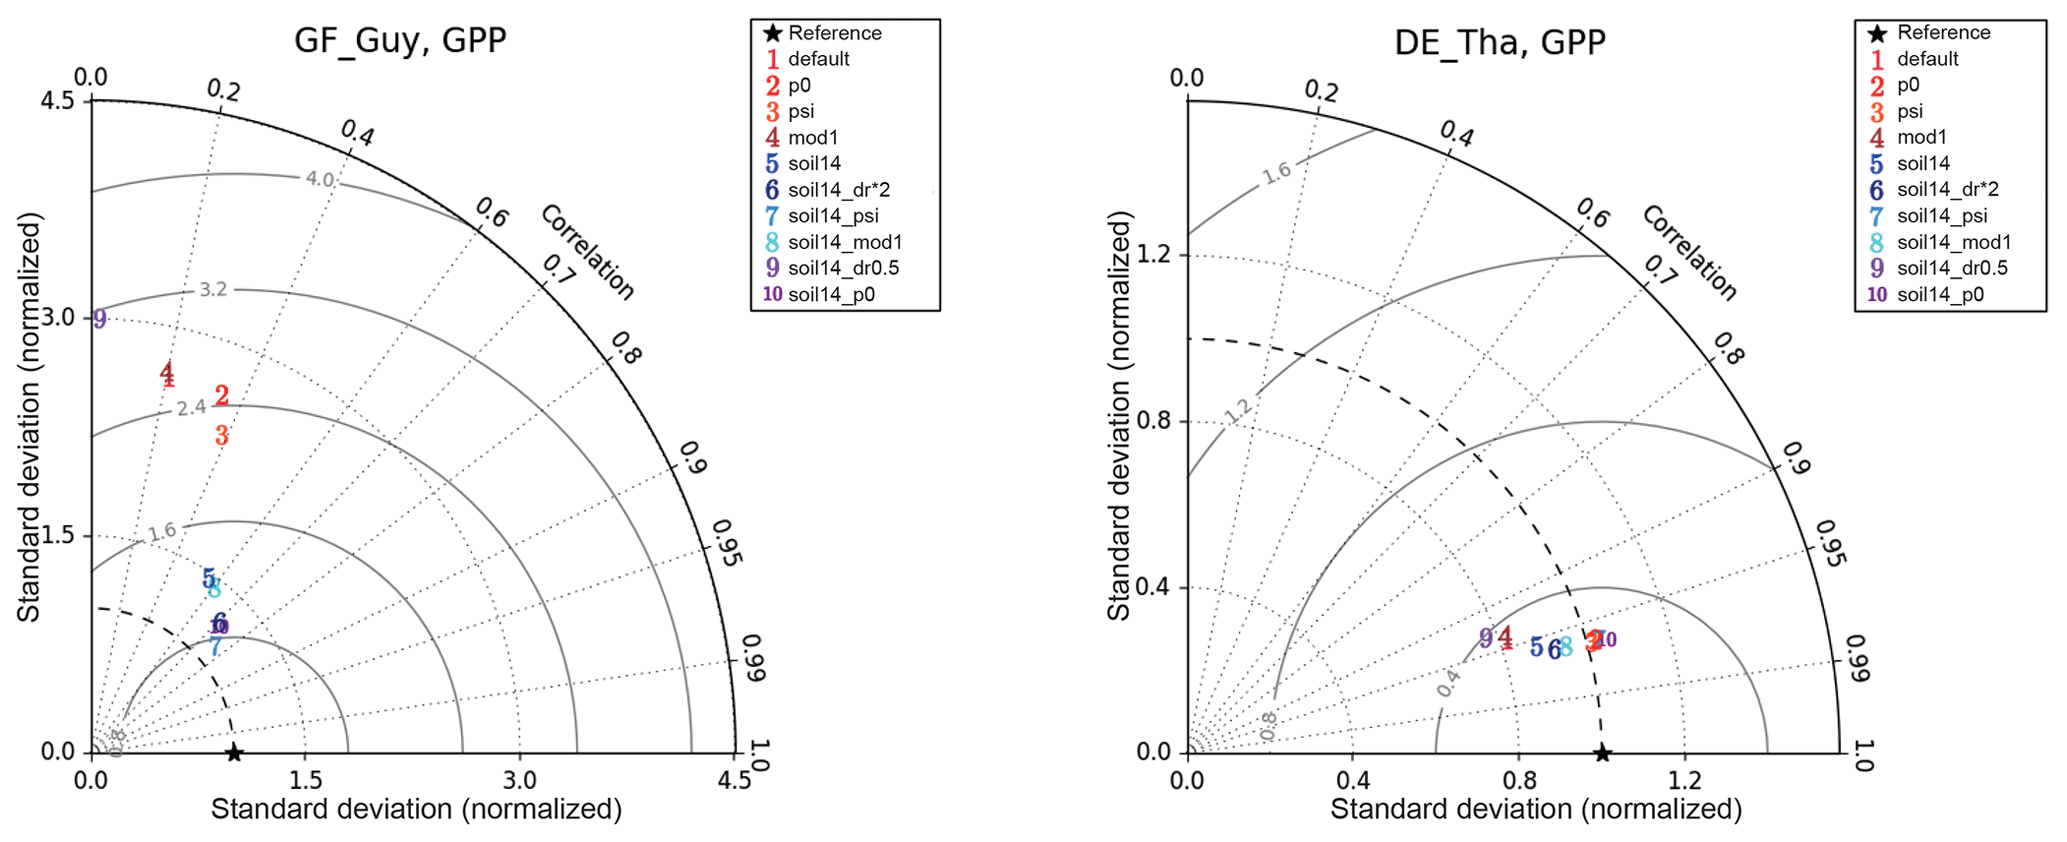
Figure 7Example of impacts of soil moisture stress representations on GPP model skill for two soil-moisture-stressed sites: GF-Guy (tropical evergreen forest) and DE-Tha (temperate evergreen needleleaf forest). The GF-Guy simulations included the years 2007–2009, and the DE-Tha simulations included the years 1996–2014. Details of the simulations are provided in Sect. 2.3 and Tables 1–2. The solid lines indicate the centered rms error (based on the normalized standard deviations).
3.3.1 Soil-moisture-stressed sites
At these sites, there was an improvement when the 14-layer soil was combined with model settings p0, psi, or dr*2 (representing, respectively, setting p0 in Eq. (3) to 0.4; using Eq. (9), which depends on the soil matric potential, to represent β; and doubling the parameter dr). Monthly RMSE decreased from 2.30 g C m−2 d−1 on average to 1.59, 1.54, and 1.73 g C m−2 d−1, respectively, in the soil14_p0, soil14_psi, and soil14_dr*2 experiments, averaged across the four sites. There was also an improvement in the VR and the correlation coefficient (Table 5). The VR reduced from 2.15 in the default simulation to nearly 1 in the soil14, soil14_p0, and soil14_mod1 experiments. For LE, the RMSE was slightly higher in these experiments (22.57, 22.49, and 20.77 W m−2, respectively, for soil14_p0, soil14_psi, and soil14_dr*2) compared to the default experiment (19.78 W m−2), and the correlation coefficient was > 0.81 (Table S4).
Table 5Average results of soil moisture stress experiments for GPP at the soil-moisture-stressed sites GF-Guy, BE-Vie, DE-Tha, and CA-Oas.
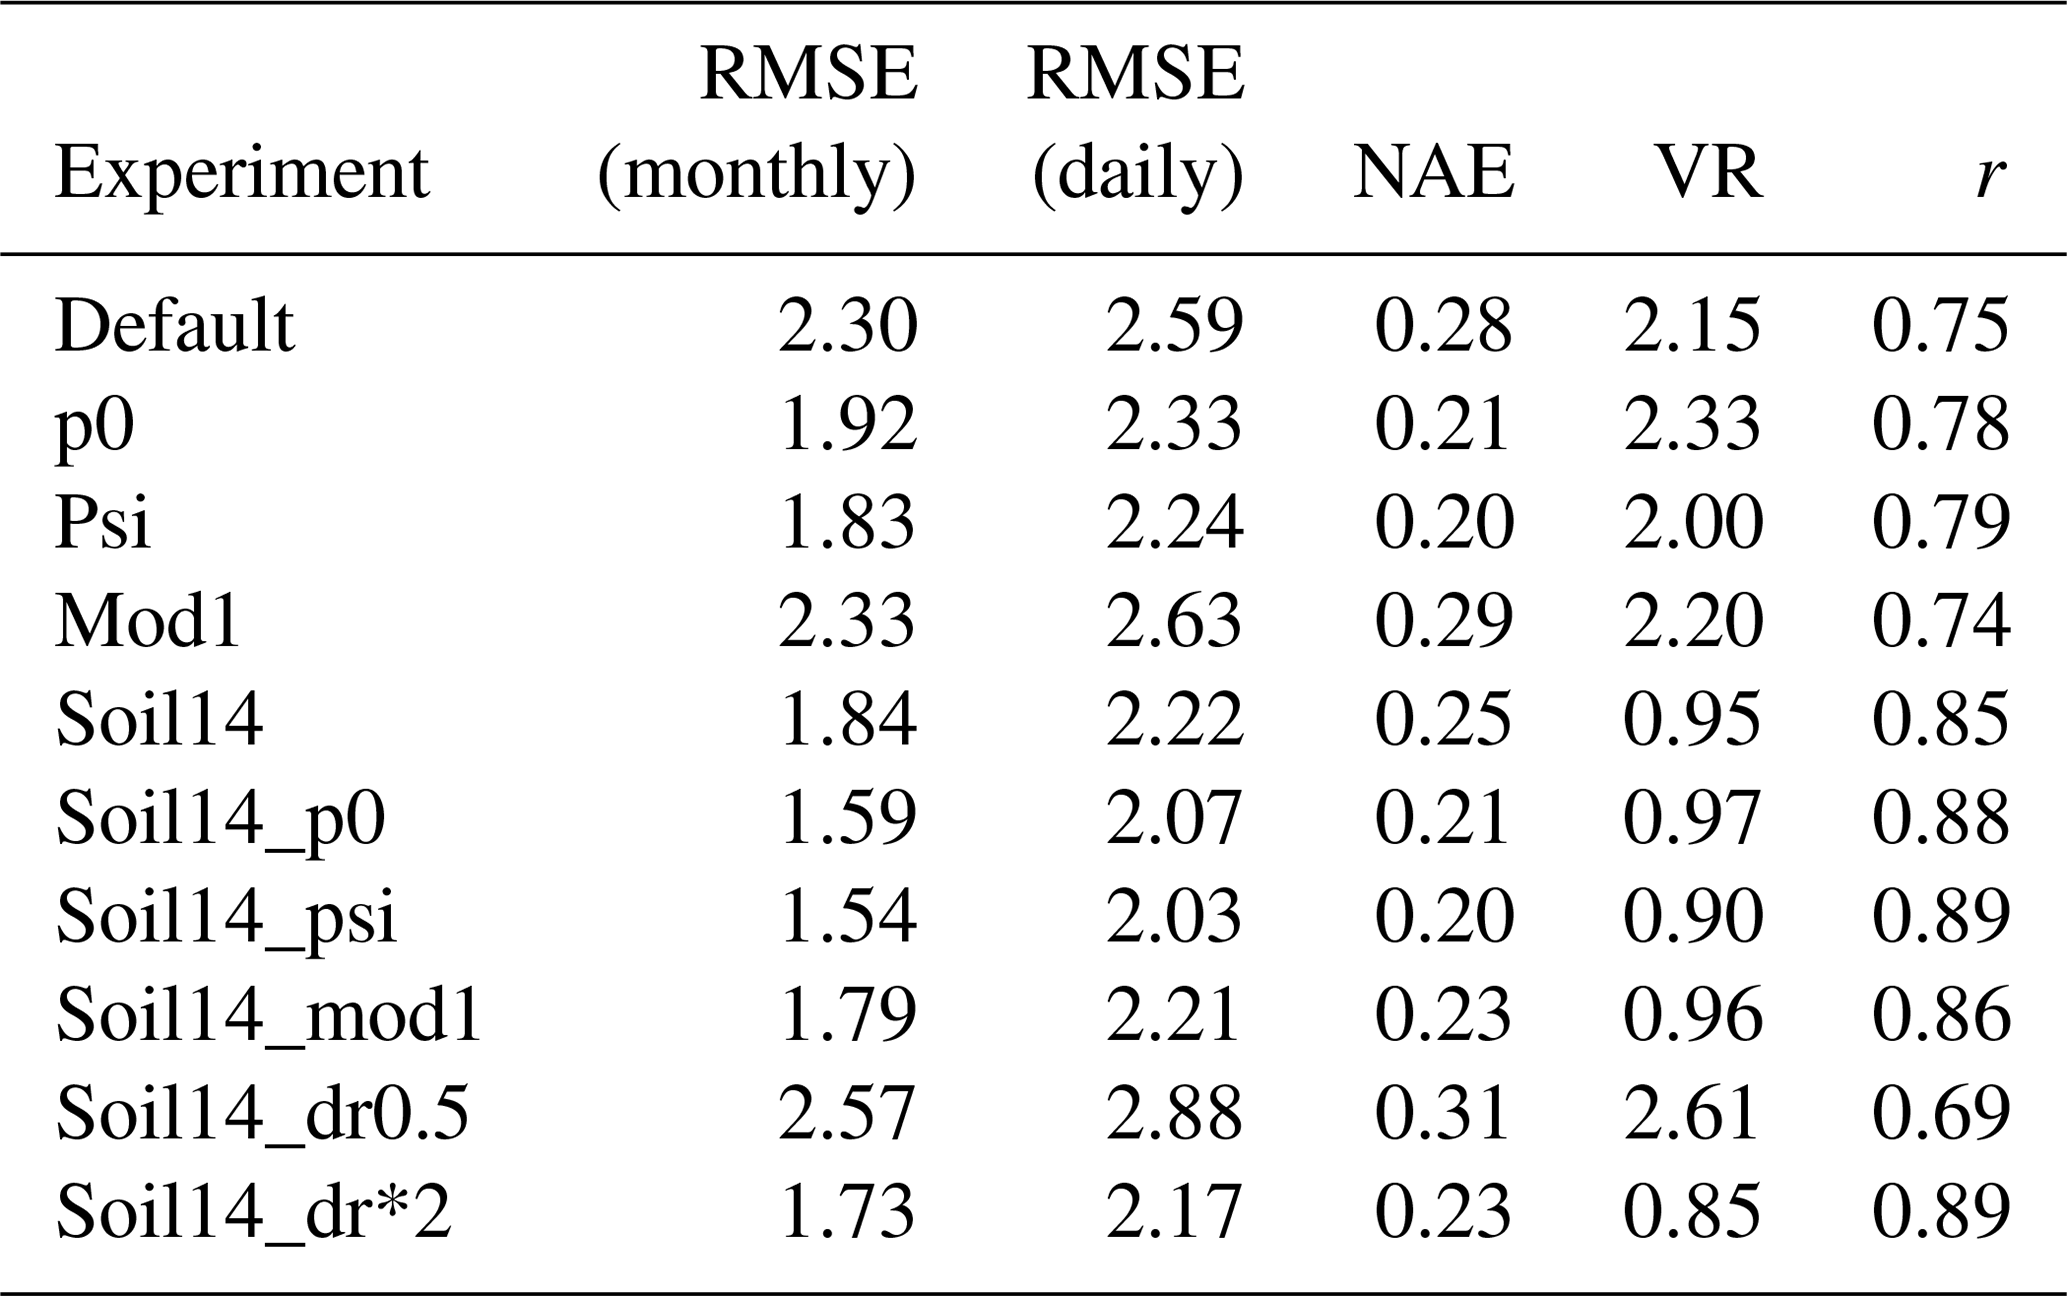
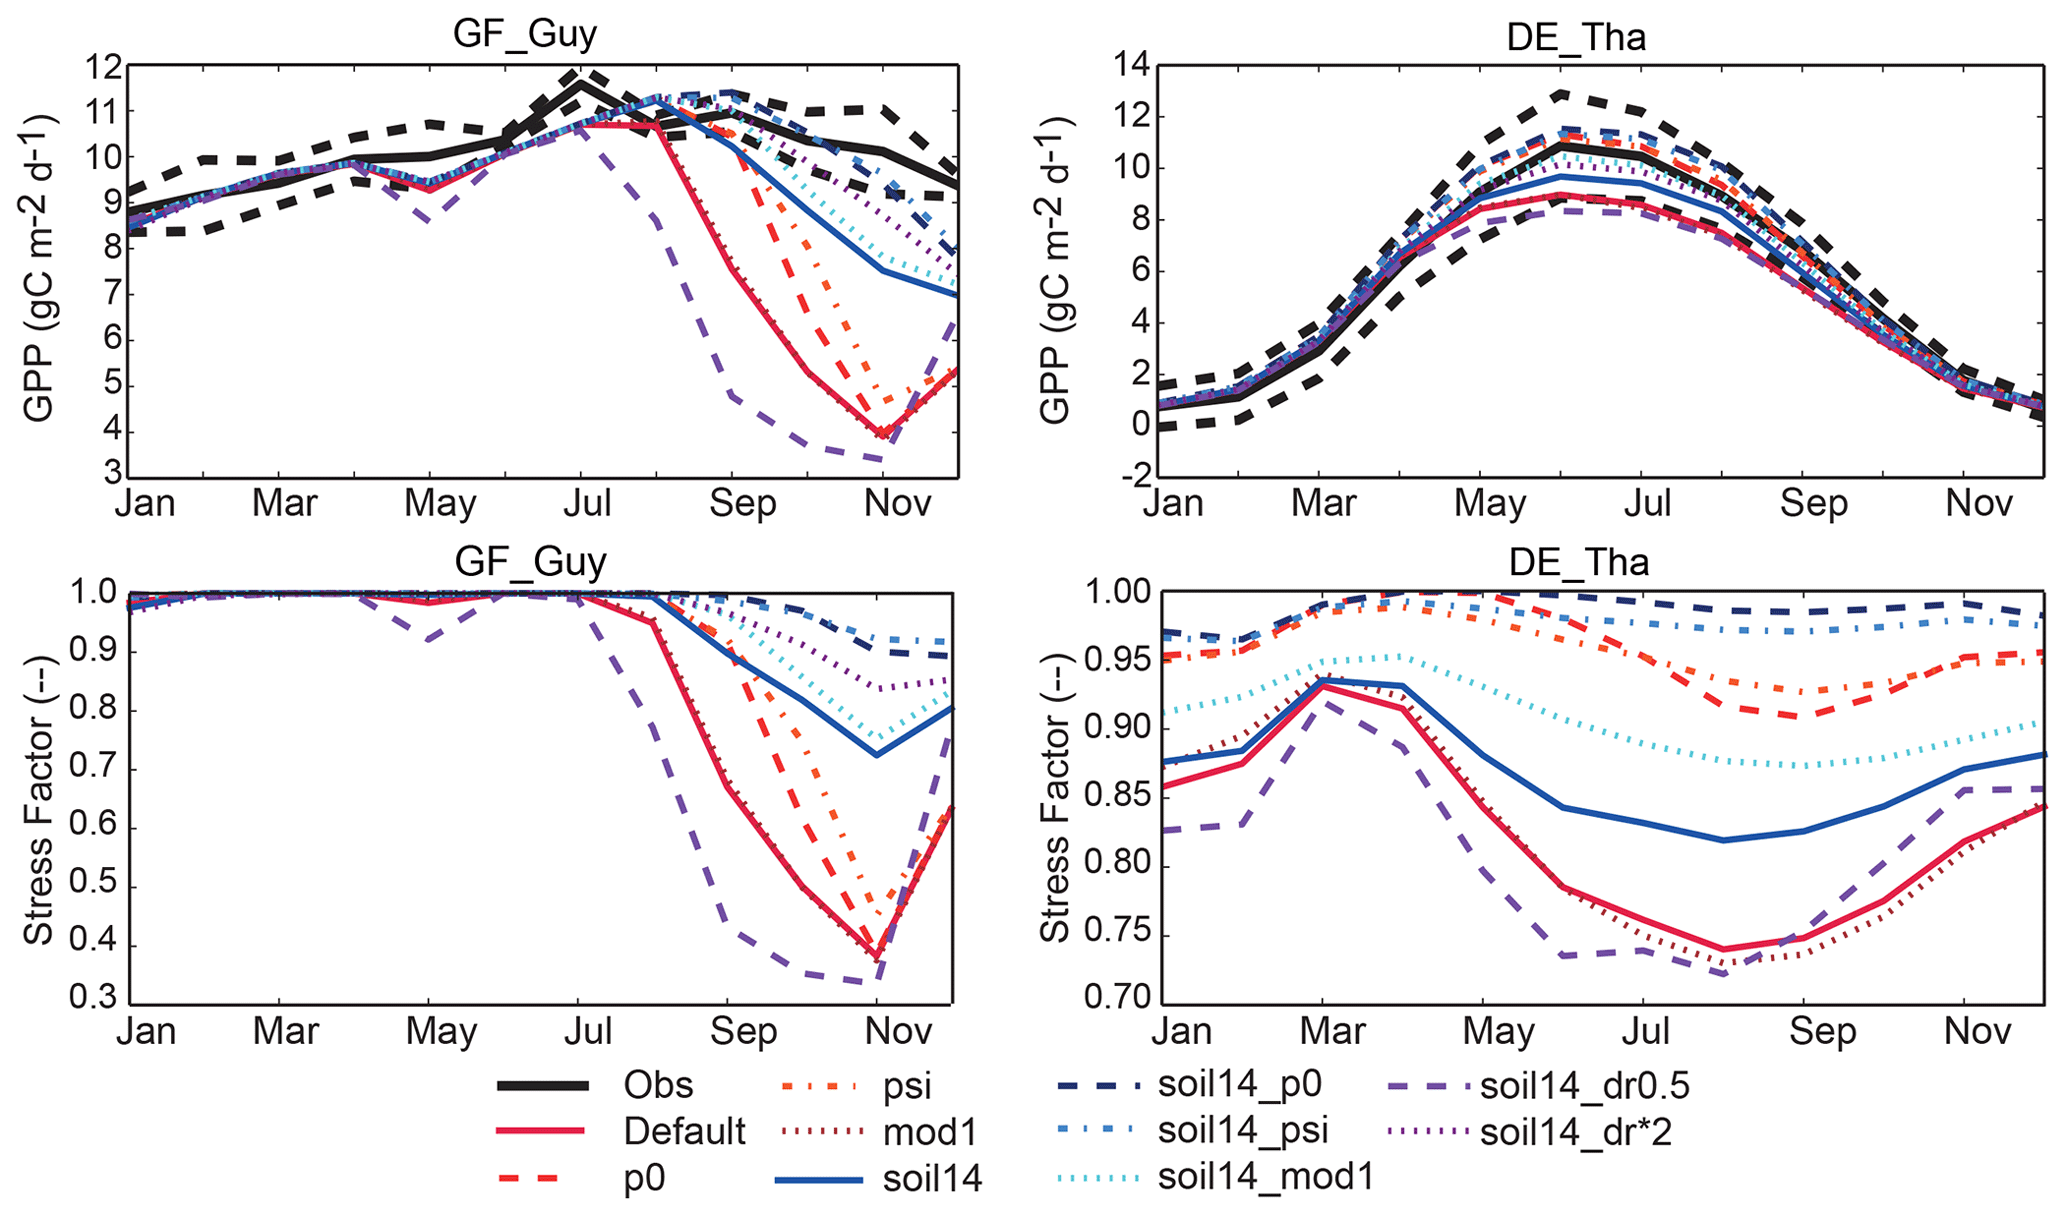
Figure 8Example of impacts of changes to the representation of soil moisture stress (see Table 1) on simulated seasonal cycle of GPP at two soil-moisture-stressed sites (see Sect. 3.3; similar examples for BE-Vie and CA-Oas are given in Fig. S9a). The GF-Guy simulations included the years 2007–2009, and the DE-Tha simulations included the years 1996–2014. GF-Guy is a tropical evergreen broadleaf forest and DE-Tha is an evergreen needleleaf forest. Details of the simulations are provided in Sect. 2.3 and Tables 1–2.
At the tropical forest site (GF-Guy), experiments with default 3 m soil depth had correlation coefficients r<0.4 and an exaggerated seasonal cycle, as indicated by the high normalized standard deviation in the Taylor diagrams (Fig. 7). In the soil14_p0, soil14_psi, and soil14_dr*2 experiments, the correlation r was > 0.7 (compared to 0.2 in the default configuration), and the standard deviation was closer to observed. The GF-Guy site experienced the lowest amount of soil moisture stress in the soil14_p0 and soil14_psi experiments, which led to a more realistic simulation of GPP at this site (Fig. 8). Using a shallower effective root profile (setting dr to 0.5) produced the worst results, and β was very low during the dry season at the tropical forest sites in the “soil14_dr0.5” experiments (Fig. 8). In the “soil14_dr0.5” simulation, β was still weighted by root distribution, so the dry top soil layers had a relatively large impact on the stress experienced by the plants. Another site in the soil-moisture-stressed category was DE-Tha, where most simulations yielded reasonable results (r> 0.9) (Fig. 7). Only the default and soil14_dr0.5 simulations produced results outside the standard deviation of measured GPP (Fig. 8). Variability (denoted by standard deviation in the Taylor diagram as well as VR close to 1) was best in the soil14_p0, p0, soil14_psi, and psi simulations.
3.3.2 Mediterranean climate sites
At the sites with a Mediterranean climate (IT-Col, US-Var, US-Ton), soil14_psi and soil14_p0 removed the most stress, but p0 and psi with the default soil depth also produced a good fit for GPP (Figs. S5b, S6b, Table 6). However, the RMSE for LE was significantly higher in these four experiments (RMSE = 22.55, 23.59, 25.52, and 26.09 W m−2 for the p0, psi, soil14_p0 and soil14_psi experiments, respectively, compared to 19.67 W m−2 in the default simulation), while the correlation coefficient was high (r= 0.85–0.87 compared to 0.88 in the default) (Fig. S7b, Table S5). US-Var and US-Ton are dominated by grass and shrubs, which have an effective root depth dr of 0.5 and 1 m, respectively. At these sites, the “soil14_mod1” experiments had β<0.5, and GPP was underestimated during the growing season (Fig. S6b). In these experiments, access to soil moisture was not weighted by effective root fractions, and dr was double its default value and was interpreted as the maximum root depth. This meant that grasses and shrubs could not access water below 1 and 2 m depth, respectively, resulting in the strong soil moisture stress seen at the US-Ton and US-Var sites.
Table 6Average results of soil moisture stress experiments for GPP at the sites with Mediterranean climate (IT-Col, US-Var, and US-Ton).
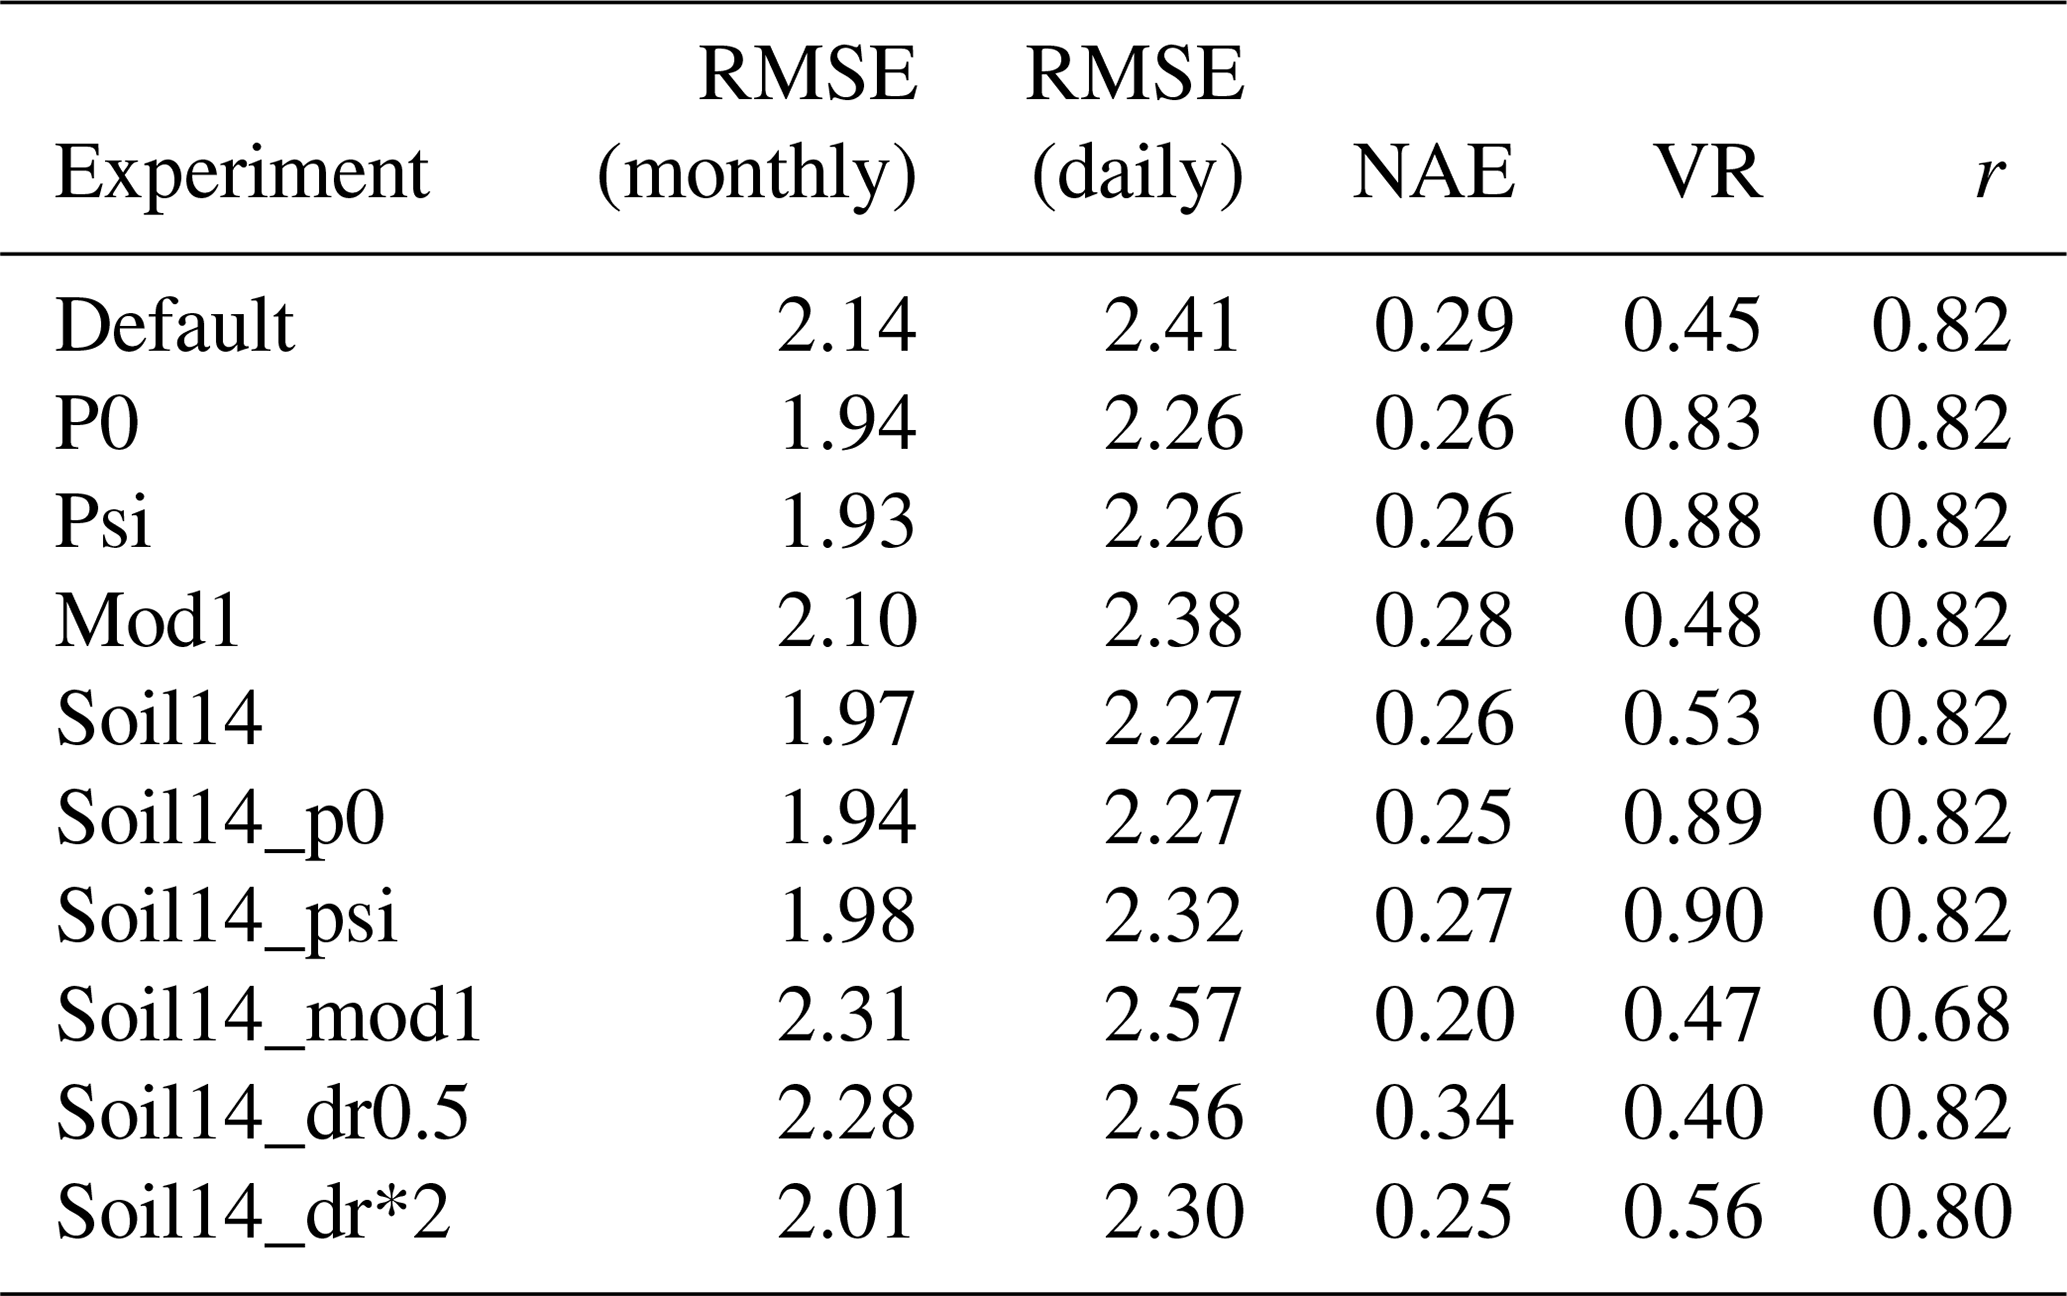
Table 7Average results of soil moisture stress experiments for GPP at sites with soil moisture stress plus other errors (LBA-K67, LBA-BAN, RU-Che, ZA-Kru).
3.3.3 Sites with soil moisture stress and other errors
At the sites with soil moisture stress plus other errors, there were fewer improvements; however, RMSE decreased from 2.81 g C m−2 d−1 in the default simulation to 2.08, 2.14, and 2.17 g C m−2 d−1 in the soil14_psi, soil14_p0, and soil14_dr*2 simulations, respectively (Figs. S5c, S6c, Table 7). These sites are LBA-K67, LBA-BAN, ZA-Kru, and RU-Che. The VR was best captured in the soil14_dr*2 simulations, while the correlation coefficient was highest in the default simulation and in the soil14_dr0.5 simulation. At LBA-K67 (a tropical forest site), soil14_psi and soil14_p0 had the lowest RMSE and seasonal variation in GPP, although for all experiments the correlation coefficient was negative (Fig. S5c). When dr=0.5 m (as in “soil14_dr0.5”), there were proportionally more roots in the top soil layers, and as these dried out, there was a sharp decline in β. This is further illustrated in Fig. S9 at the LBA-K67 site, which plots β against soil moisture in the top 1 m. In comparison, with dr=3 m (the default value) the trees were able to access water from deeper layers, so β did not decline as rapidly. At ZA-Kru, all results were within the range of the measurements, although the growing season GPP was underestimated (Fig. S6c). At LBA-BAN, soil14_dr*2, soil14_psi, and soil14_p0 gave the lowest RMSE, but VR was very high (> 3), and the correlation coefficient was low (r<0.4) for all simulations. There was very little difference between any of the simulations at RU-Che, and β was < 0.25 year-round for all experiments. For LE, there was a significant reduction in RMSE from 22.54 W m−2 to < 18 W m−2 for all experiments with 14-layer soil at these sites (Table S6). The correlation coefficient was also significantly improved in these experiments (from 0.48 in the default simulation to > 0.67). The exception to these improvements was the “soil14_dr0.5” experiment, where the RMSE increased to 25.17 W m−2 and correlation coefficient decreased to 0.35.
3.3.4 Average response across sites
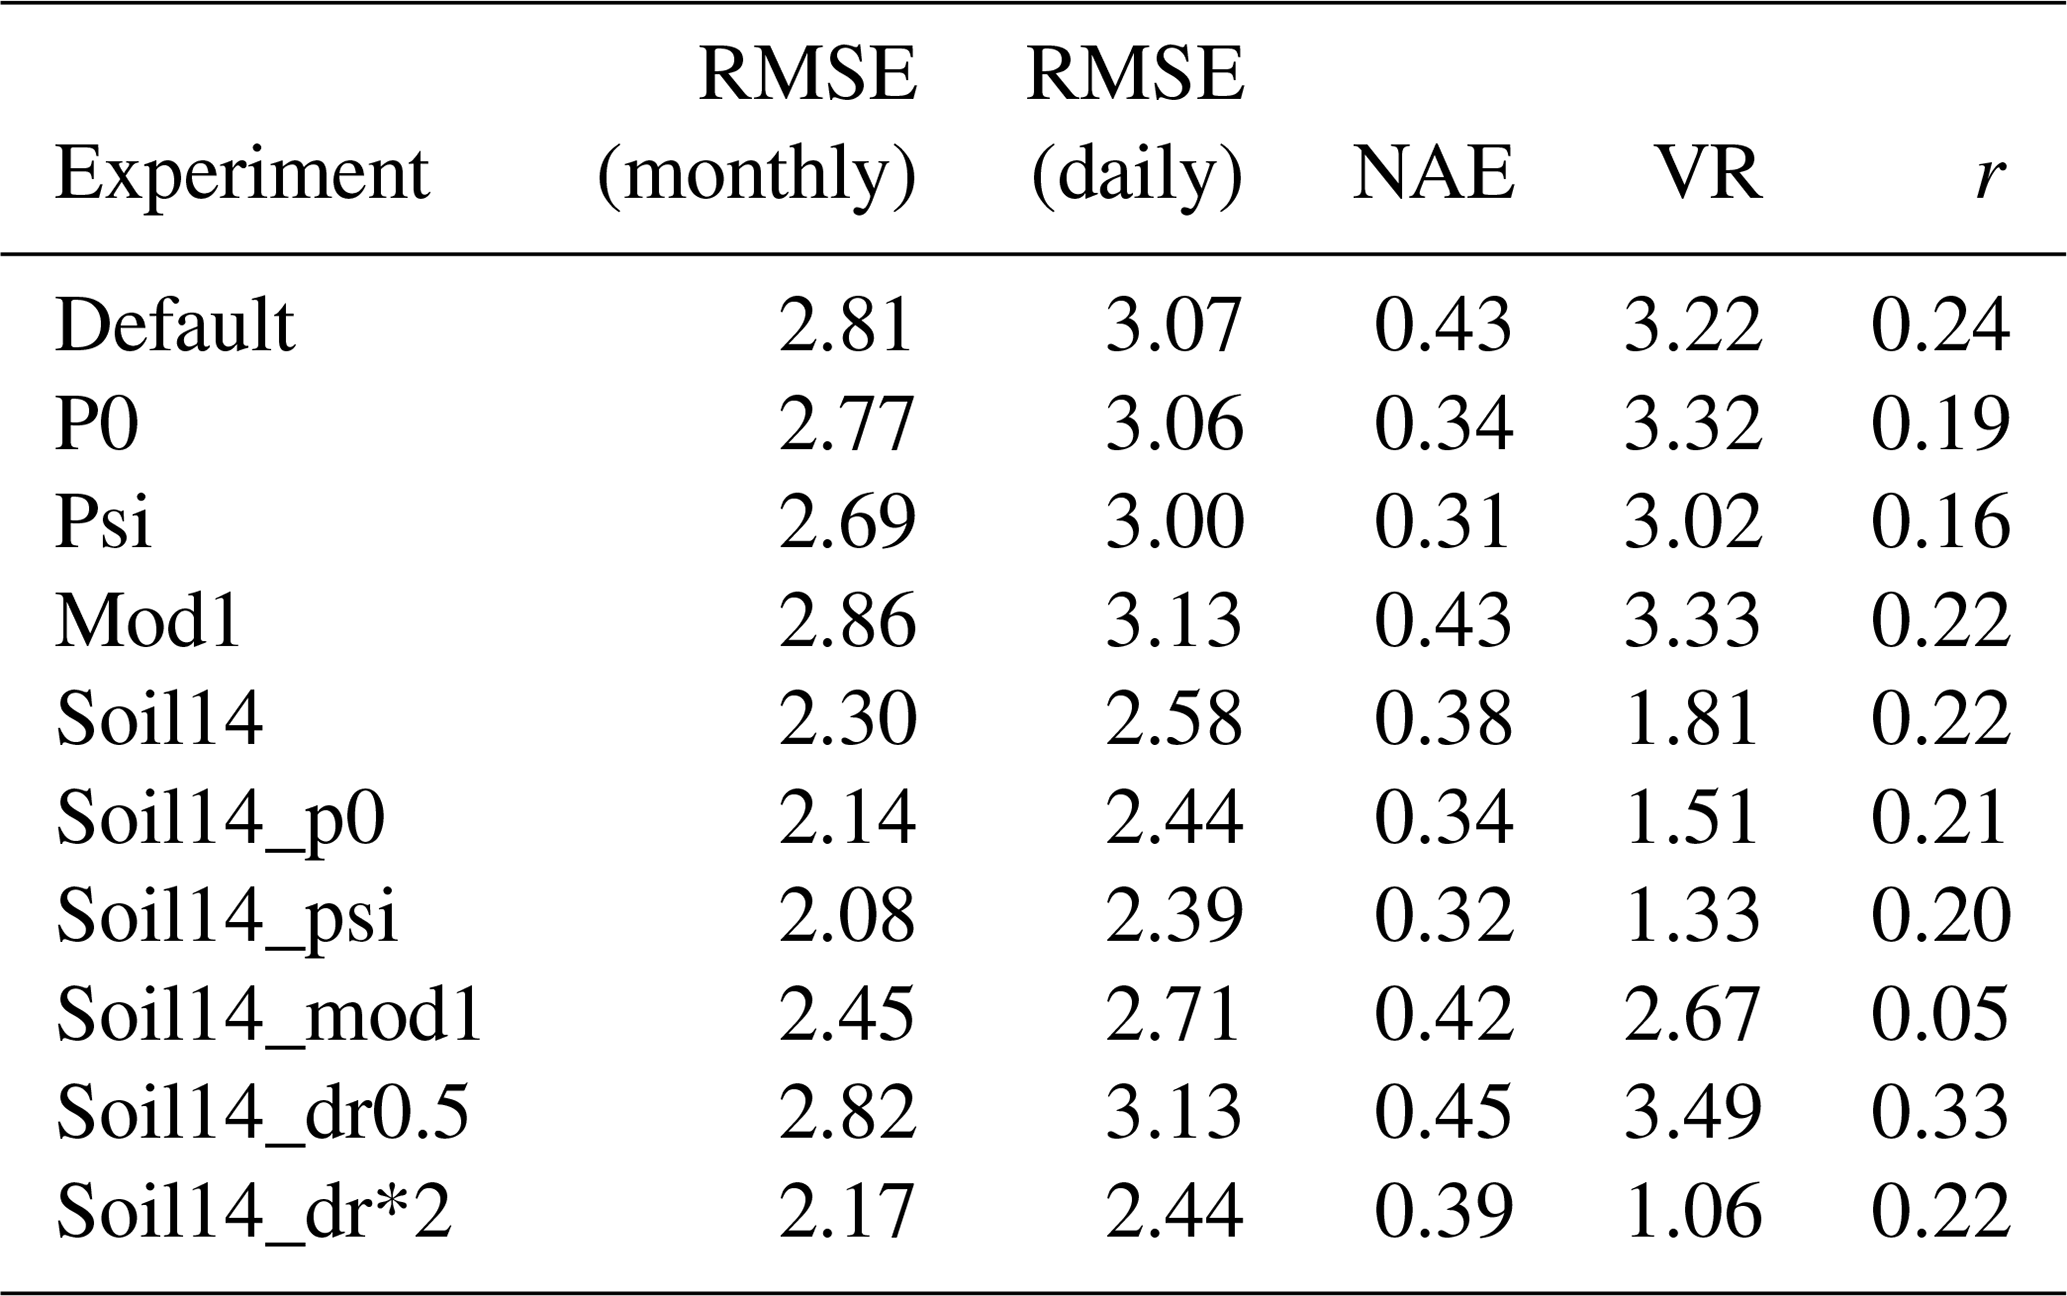
Averaging across the 11 sites where we performed additional experiments, the lowest RMSE for GPP occurred in the soil14_p0, soil14_psi, and soil14_dr*2 experiments (on both daily and monthly timescales). The variability was best captured by the soil14, soil14_p0, and soil14_psi experiments (as denoted by VR of 1.06, 1.06, and 0.98, respectively). The mean correlation coefficient was similar across all experiments (0.50–0.57). All of the experiments were an improvement compared to the default configuration, except for the p0, mod1, and soil14_dr0.5 experiments.
For LE, averaged across all sites, the daily and monthly RMSE was lowest for the soil14 experiment, and this was the only experiment with RMSE lower than the default configuration. There was an improvement in the VR for the soil14, soil14_p0, soil14_psi, soil14_mod1, and soil14_dr*2 experiments compared to the default (with VR between 1.26–1.44 compared to 1.58 in the default). The correlation was highest (r∼0.74–0.76 compared to default r= 0.70) for all experiments with 14-layer soil except for soil14_dr0.5.
4.1 Default model configuration
Tables 3–4 summarize some of the key findings from this study pertaining to the default configuration. JULES-simulated GPP was more realistic in temperate biome sites than in the tropics or high-latitude (cold-region) sites, as indicated by three statistics to measure annual biases (NAE), seasonal cycles (r), and variability (VR). LE was best simulated in temperate and high-latitude (cold) sites based on the same statistics (except for temperate mixed forests). For sites in the tropics, the default β parameterization contributed to an exaggerated seasonal cycle of GPP compared to the measurements, especially in tropical evergreen forests. Although the NAE was low in tropical evergreen forest sites (e.g., LBA sites K34, K83, K67, and BAN), the seasonal cycle was overestimated (despite LAI being nearly constant all year), as indicated by high VR and low correlation coefficients. A similar result was observed with LE in most tropical sites: the seasonal cycle was incorrect and the VR was high. For example, at LBA-K67, the measurements show an increasing trend in GPP from August to October (coinciding with the dry season), while JULES predicted a decreasing trend during this time. Even with soil moisture and LAI prescribed for the four tropical evergreen forest sites, the correlation coefficients were negative. At these sites, it is possible that including a seasonally varying photosynthetic capacity would improve the results, as in Wu et al. (2017). The dry season is often accompanied by enhanced carbon uptake in Amazon forests, due to a combination of fewer clouds and increased incoming solar radiation (Saleska et al., 2003; Restrepo-Coupe et al., 2013; Von Randow et al., 2013; Zeri et al., 2014) and seasonal leaf flushing (Wu et al., 2016). The observed seasonality in GPP is enabled by deep roots that can access ample soil moisture and by the relatively high photosynthetic capacity of new leaves (Wu et al., 2017), a process not yet represented in JULES.
Other errors, possibly linked to phenology, also contributed to model biases in tropical savanna and deciduous forest sites. The improvements seen when LAI was prescribed at LBA-RJA (a seasonally dry tropical forest site) further suggest that JULES' lack of a moisture-driven phenology scheme could be affecting the results at this site. LBA-RJA serves as interesting comparison to LBA-K67: RJA receives a similar amount of annual rainfall, but the dry season is more intense, with about half as much rainfall during the dry season compared to K67 (Restrepo-Coupe et al., 2013). The bedrock is relatively shallow at RJA (2–3 m) (Christoffersen et al., 2014); therefore, deep soil moisture is not present. At this site, measured GPP drops steadily from January until reaching a minimum in the middle of the dry season. JULES captured this seasonal cycle very well, although the amplitude was slightly dampened with predicted GPP being higher than observed during most of the year (with prescribed LAI and soil moisture).
In cold grassland sites, JULES underpredicted the variability of GPP and had high annual biases. The biases were due to very little GPP being simulated, with β being low year-round. At RU-Che, giving more emphasis to deeper layers (with “soil14_dr*2”) did not increase GPP, which is not unexpected due to the presence of frozen soils both in the simulations and in reality at this site (Merbold et al., 2009a). The C3 grass PFT at this site has the most roots in the top 0.5 m, which indicates that evaporation or sublimation could be drying the soils too much in the layers with the most roots and unfrozen soil moisture content.
4.2 Overview of alternative approaches for representing soil moisture stress
We found that three alternative approaches to calculating soil moisture stress produced more realistic results than the default parameterization for most biomes and climates: 14-layer soil with a curvilinear stress response function (“soil14_psi”, Eq. 9), 14-layer soil with delayed induction of stress (“soil14_p0”, Eq. 3), and 14-layer soil with deeper roots (“soil14_dr*2”). Within the default configuration, LE biases were greatest in temperate mixed forests, with overestimation occurring during Spring–Autumn. At these sites, reducing soil moisture stress (i.e., with soil14_psi, soil14_p0, and soil14_dr*2) increased LE and increased RMSE, but improved the simulated seasonal cycle and variance. Further evaluation into the reason for the high bias in LE at many of the sites would enable improvements in both carbon and energy fluxes with new parameterizations for β.
There is ample justification for having deeper soils and roots in JULES. Total soil column depth and root distribution determine the total amount of water and nutrients available to plants. Deep roots can access soil moisture at depth (Christina et al., 2017) and potentially the water table and hence contribute to tree transpiration during dry periods, e.g., for GF-Guy where many canopy trees are not impacted by dry season droughts (Stahl et al., 2013a, b). Deep roots have been found to be important for many vegetation types and ecosystems (Canadell et al., 1996; Pierret et al., 2016; Germon et al., 2020): for multiple tree species in tropical forests (Nepstad et al., 1994; Jipp et al., 1998; Strey et al., 2017; Brum et al., 2019), for Acacias in semi-arid savannas such as SD-Dem (Ardö et al., 2008), and for fast-growing Eucalypt and Acacia mangium plantations in Brazil (Christina et al., 2011; Laclau et al., 2013; Germon et al., 2018), to name a few examples. In particular, in tropical forests, the global average maximum rooting depth is approximately 7 m (Canadell et al., 1996). Although estimates of maximum rooting depth are uncertain (Schenk and Jackson, 2005; Pierret et al., 2016), these examples contrast with the shallow soils (3 m) in the default JULES simulations. In addition, weighting root water uptake or soil moisture stress by fraction of roots in each layer could produce too much stress if the shallow layers (with the most roots) dry out too quickly. Deep roots are very efficient at moving water, for example, specific hydraulic conductivities (Ks) of deep roots can be as much as 15 times higher than Ks of superficial roots for Banksia sp. (Pate et al., 1995), and deep roots can redistribute water from deep to shallow layers (Caldwell et al., 1998; Burgess et al., 2001; Oliveira et al., 2005). However, not all plants rely on deep roots during a drought (Prechsl et al., 2015; Brinkmann et al., 2019), and at sites dominated by grasses and shrubs there were high biases in the “soil14_mod1” experiments (weighting the contribution of each layer's βi by the thickness of that layer rather than by the effective root fraction in that layer). Studies with other land surface models have drawn similar conclusions. Increasing the soil column from 3.5 to 10 m and allowing roots to access this entire reservoir improved the fit of the SiB3 model to observations at the LBA-K83 site (Baker et al., 2008). Similarly, the ability of the G'DAY model to accurately simulate wood production in fast-growing sub-tropical plantations was considerably improved by accounting for tree ability to uptake water in deep soil layers (Marsden et al., 2013). On the other hand, using the default calculation for β with an e-folding depth dr=0.5 m emphasized shallow layers, and the overall soil moisture stress increased at most sites, resulting in a poor fit to measured GPP and LE in the “soil14_dr0.5” experiments.
4.3 Outlook for modeling soil moisture stress in JULES and other land surface models
In this study, we used flux tower observations and detailed site information when possible. Working with site researchers enabled us to narrow down reasons for model biases by prescribing soil moisture and LAI at some sites and to better understand mechanisms of drought responses at others. These are invaluable benefits of working with site-level data. Future studies could benefit from incorporating more sites (the full FLUXNET2015 dataset includes 212 sites), particularly if the focus is reducing biome-scale model biases. There is potential to extract even more information from available datasets to improve the representation of soil moisture–vegetation interactions (Gentine et al., 2019). This includes better utilization of satellite data, and one particular opportunity is to consider soil moisture measurements in parallel with those of solar-induced fluorescence, which is used to estimate photosynthesis (Lee et al., 2013). Satellite records have large spatial coverage, and modern machine learning algorithms could be used to characterize Earth observation datasets of drought conditions (Huntingford et al., 2019). Such methods could address the difficulty in modeling the high complexity and geographical diversity of plant adaptive responses to soil moisture deficits that exist in nature.
Future work should build upon these results to further evaluate JULES response with these parameterizations, focusing on deeper soils and either using a non-zero p0 (we used 0.4 in this study) or using the soil matric potential (ψ) rather than volumetric water content for calculating β. We note that such alternative parameterizations are not a replacement for improved representations of the soil–plant hydraulic system that have been developed for many models (Bonan et al., 2014; Christoffersen et al., 2016; Kennedy et al., 2019), including JULES (Eller et al., 2020). Instead, they provide a practical, alternative way to represent some aspects of the soil–plant hydraulic system, including hydraulic differences between PFTs through the parameters ψopen and ψclose (Eq. 9), which can be adopted by any model that uses the β function to represent vegetation responses to soil moisture. Several other land surface models use soil water potential (e.g., CLM; Oleson et al., 2010; Lawrence et al., 2019) for calculating soil moisture stress, and a further benefit of this approach is the ability to set PFT-specific values for ψopen and ψclose (Eq. 9), with measured turgor loss points serving as a starting point for ψclose (Bartlett et al., 2012). Whereas our new parametrization generally improves JULES skill to simulate GPP and LE, it remains to be tested if similar results would be achieved by other models, including models that apply the β function at different parts of their photosynthesis and stomatal conductance schemes (e.g., Keenan et al., 2010; De Kauwe et al., 2015).
Currently, the land partially offsets anthropogenic CO2 emissions by photosynthetic drawdown, but this could be reversed if droughts increase in frequency or intensity in the future. Feedbacks from the land surface can amplify and lock-in existing drought conditions (Morillas et al., 2017), and land surface responses to regional drought can affect precipitation and circulation in other regions (Harper et al., 2013; Lian et al., 2020). Improving responses of vegetation to drought in land surface models such as JULES would have far-reaching implications for global climate modeling and are therefore of utmost importance.
Both the model code and the files for running it are available from the Met Office Science Repository Service: https://code.metoffice.gov.uk/ (last access: 13 April 2021). Registration is required and code is freely available subject to completion of a software license. The results presented in this paper were obtained from running JULES branch https://code.metoffice.gov.uk/trac/jules/browser/main/branches/dev/karinawilliams/r9227_add_gpp_unstressed_diagnostic (last access: 13 April 2021, Williams, 2020) which is a branch of JULESv4.9 with the additional unstressed GPP diagnostic added. The runs were completed with the Rose suite https://code.metoffice.gov.uk/trac/roses-u/browser/a/l/7/5/2/u-al752-jpegpaper (last access: 13 April 2021, Williams et al., 2020), which also includes Python scripts for creating the plots. The Taylor diagrams (Figs. 7, S5 and S7) were made with Python scripts from Yannick Copin (https://gist.github.com/ycopin/3342888, last access: 13 April 2021, Copin, 2018).
The FLUXNET2015 data used to run JULES are available for download from https://fluxnet.org/data/fluxnet2015-dataset/ (last access: 16 August 2020, Pastorello et al., 2020).
The supplement related to this article is available online at: https://doi.org/10.5194/gmd-14-3269-2021-supplement.
This study is the result of a large effort within the JULES community to better understand soil moisture stress and simulated responses to soil moisture deficits. All co-authors contributed at some point to writing or improving the manuscript. Flux tower researchers provided particular insight into their sites: LeM (IT-Ren); IM (FI-Hyy); DB (GF-Guy); AG and YN (CG-Tch); GW (AT-Neu); NB, LuM, and KF (CH-Cha); and LuM (RU-Che, Za-Kru).
The authors declare that they have no conflict of interest.
Flux tower measurements used in this study are from FLUXNET2015 and the LBA project. Several site PIs contributed data for the soil moisture and LAI prescribed runs, we gratefully acknowledge their contribution here: Simone Sabbatini (IT-CA1), Sabina Keller (CH-Cha), Todd Schimelfenig, David Scoby, and Tim Arkebauer (US-Ne1, US-Ne2, US-Ne3), Caroline Vincke (BE-Vie), Chris Gough (US-UMB), Tanguy Manise (BE-Vie), Pasi Kolari (FI-Hyy), Russ Scott (US-SRG and US-SRM, US-Whs, US-Wkg), and Alessandro Araujo (LBA). The JULES soil moisture stress group gratefully acknowledges Colin Prentice and Peter Cox for input along the way.
LBA data was provided with support from National Aeronautics and Space Administration (NASA) LBA investigation CD-32, NASA LBA-DMIP project (no. NNX09AL52G), and the Gordon and Betty Moore Foundation “Simulations from the Interactions between Climate, Forests, and Land Use in the Amazon Basin: Modeling and Mitigating Large Scale Savannization” project. The authors also acknowledge the following funding sources: EPSRC Living with Environmental Change Fellowship EP/N030141/1 (Anna B. Harper); the Met Office Hadley Centre Climate Programme (HCCP) funded by BEIS and Defra (Karina E. Williams, Debbie Hemming, Camilla Mathison); Natural Environment Research Council's projects: “IMPETUS” (NE/L010488/1) (Anne Verhoef, Azin Wright) and “Newton/NERC/FAPESP Nordeste” (NE/N012488/1) (Rodolfo L. B. Nobrega, Anne Verhoef); Newton Fund through the Met Office Climate Science for Service Partnership Brazil (CSSP Brazil) (Karina E. Williams, Nicola Gedney, Camilla Mathison, Anna B. Harper, Lucy Rowland); the Research Endowment Trust Fund of the University of Reading (Patrick C. McGuire); Province of South Tyrol “Cycling of carbon and water in mountain ecosystems under changing climate and land use (CYCLAMEN)” (Georg Wohlfahrt); European Commision Horizon 2020 research and innovation programme (project SUPER-G, no. 774124 and project REALM, no. 787203) and the SNF project M4P (40FA40_154245) (Nina Buchmann); European project “Quantification, understanding and prediction of carbon cycle, and other GHG gases, in Sub-Saharan Africa” (CarboAfrica, STREP-CT-037132) (Yann Nouvellon).
The GF-Guy site is supported by an Investissement d’Avenir grant from the Agence Nationale de la Recherche (CEBA: ANR-10-LABX-0025; ARBRE: ANR-11-LABX-0002-01). CA-Oas is part of the Fluxnet Canada network, supported by the Natural Science and Engineering Research Council of Canada (NSERC) and the Canadian Foundation for Climate and Atmospheric Science (CFCAS).
This paper was edited by Jatin Kala and reviewed by two anonymous referees.
Akkermans, T., Lauwaet, D., Demuzere, M., Vogel, G., Nouvellon, Y., Ardö, J., Caquet, B., De Grandcourt, A., Merbold, L., Kutsch, W., and Van Lipzig, N.: Validation and comparison of two soil-vegetation-atmosphere transfer models for tropical Africa, J. Geophys. Res.-Biogeo., 117, G02013, https://doi.org/10.1029/2011JG001802, 2012.
Allen, C. D., Macalady, A. K., Chenchouni, H., Bachelet, D., McDowell, N., Vennetier, M., Kitzberger, T., Rigling, A., Breshears, D. D., Hogg, E. H., Gonzalez, P., Fensham, R., Zhang, Z., Castro, J., Demidova, N., Lim, J.-H., Allard, G., Running, S. W., Semerci, A., and Cobb, N.: A global overview of drought and heat-induced tree mortality reveals emerging climate change risks for forests, Forest Ecol. Manage., 259, 660–684, https://doi.org/10.1016/j.foreco.2009.09.001, 2010.
Ardö, J., Mölder, M., El-Tahir, B. A., and Elkhidir, H. A. M.: Seasonal variation of carbon fluxes in a sparse savanna in semi arid Sudan, Carbon Balance Manage., 3, 7, https://doi.org/10.1186/1750-0680-3-7, 2008.
Arora, V. K. and Boer, G. J.: A parameterization of leaf phenology for the terrestrial ecosystem component of climate models, Glob. Change Biol., 11, 39–59, https://doi.org/10.1111/j.1365-2486.2004.00890.x, 2005.
Baker, I. T., Prihodko, L., Denning, A. S., Goulden, M., Miller, S., and da Rocha, H. R.: Seasonal drought stress in the Amazon: Reconciling models and observations, J. Geophys. Res.-Biogeo., 113, G00B01, https://doi.org/10.1029/2007jg000644, 2008.
Ball, J. T., Woodrow, I. E., and Berry, J. A.: A Model Predicting Stomatal Conductance and its Contribution to the Control of Photosynthesis under Different Environmental Conditions, in: Progress in Photosynthesis Research, edited by: Biggins, J., Springer, Dordrecht, https://doi.org/10.1007/978-94-017-0519-6_48, 1987.
Bartlett, M. K., Scoffoni, C., and Sack, L.: The determinants of leaf turgor loss point and prediction of drought tolerance of species and biomes: a global meta-analysis, Ecol. Lett., 15, 393–405, https://doi.org/10.1111/j.1461-0248.2012.01751.x, 2012.
Beer, C., Reichstein, M., Tomelleri, E., Ciais, P., Jung, M., Carvalhais, N., Rödenbeck, C., Arain, M. A., Baldocchi, D., Bonan, G. B., Bondeau, A., Cescatti, A., Lasslop, G., Lindroth, A., Lomas, M., Luyssaert, S., Margolis, H., Oleson, K. W., Roupsard, O., Veenendaal, E., Viovy, N., Williams, C., Woodward, F. I., and Papale, D.: Terrestrial Gross Carbon Dioxide Uptake: Global Distribution and Covariation with Climate, Science, 329, 834–838, https://doi.org/10.1126/science.1184984, 2010.
Berg, A., Findell, K., Lintner, B., Giannini, A., Seneviratne, S. I., van den Hurk, B., Lorenz, R., Pitman, A., Hagemann, S., Meier, A., Cheruy, F., Ducharne, A., Malyshev, S., and Milly, P. C. D.: Land–atmosphere feedbacks amplify aridity increase over land under global warming, Nat. Clim. Change, 6, 869–874, https://doi.org/10.1038/nclimate3029, 2016.
Best, M. J., Pryor, M., Clark, D. B., Rooney, G. G., Essery, R. L. H., Ménard, C. B., Edwards, J. M., Hendry, M. A., Porson, A., Gedney, N., Mercado, L. M., Sitch, S., Blyth, E., Boucher, O., Cox, P. M., Grimmond, C. S. B., and Harding, R. J.: The Joint UK Land Environment Simulator (JULES), model description – Part 1: Energy and water fluxes, Geosci. Model Dev., 4, 677–699, https://doi.org/10.5194/gmd-4-677-2011, 2011.
Blyth, E., Clark, D. B., Ellis, R., Huntingford, C., Los, S., Pryor, M., Best, M., and Sitch, S.: A comprehensive set of benchmark tests for a land surface model of simultaneous fluxes of water and carbon at both the global and seasonal scale, Geosci. Model Dev., 4, 255–269, https://doi.org/10.5194/gmd-4-255-2011, 2011.
Bonan, G. B., Williams, M., Fisher, R. A., and Oleson, K. W.: Modeling stomatal conductance in the earth system: linking leaf water-use efficiency and water transport along the soil–plant–atmosphere continuum, Geosci. Model Dev., 7, 2193–2222, https://doi.org/10.5194/gmd-7-2193-2014, 2014.
Brinkmann, N., Eugster, W., Buchmann, N., and Kahmen, A.: Species-specific differences in water uptake depth of mature temperate trees vary with water availability in the soil, Plant Biol., 21, 71–81, https://doi.org/10.1111/plb.12907, 2019.
Brodribb, T. J. and Cochard, H.: Hydraulic Failure Defines the Recovery and Point of Death in Water-Stressed Conifers, Plant Physiol., 149, 575–584, https://doi.org/10.1104/pp.108.129783, 2009.
Brooks, R. H. and Corey, A. T.: Hydraulic properties of porous media, Hydrology Papers 3, Colorado State University, Colorado, USA, 1964.
Brum, M., Vadeboncoeur, M. A., Ivanov, V., Asbjornsen, H., Saleska, S., Alves, L. F., Penha, D., Dias, J. D., Aragão, L. E. O. C., Barros, F., Bittencourt, P., Pereira, L., and Oliveira, R. S.: Hydrological niche segregation defines forest structure and drought tolerance strategies in a seasonal Amazon forest, J. Ecol., 107, 318–333, https://doi.org/10.1111/1365-2745.13022, 2019.
Burgess, S. S. O., Adams, M. A., Turner, N. C., White, D. A., and Ong, C. K.: Tree roots: conduits for deep recharge of soil water, Oecologia, 126, 158–165, https://doi.org/10.1007/s004420000501, 2001.
Caldwell, M. M., Dawson, T. E., and Richards, J. H.: Hydraulic lift: consequences of water efflux from the roots of plants, Oecologia, 113, 151–161, https://doi.org/10.1007/s004420050363, 1998.
Canadell, J., Jackson, R. B., Ehleringer, J. B., Mooney, H. A., Sala, O. E., and Schulze, E. D.: Maximum rooting depth of vegetation types at the global scale, Oecologia, 108, 583–595, https://doi.org/10.1007/BF00329030, 1996.
Carvalhais, N., Reichstein, M., Seixas, J., Collatz, G. J., Pereira, J. S., Berbigier, P., Carrara, A., Granier, A., Montagnani, L., Papale, D., Rambal, S., Sanz, M. J., and Valentini, R.: Implications of the carbon cycle steady state assumption for biogeochemical modeling performance and inverse parameter retrieval, Global Biogeochem. Cy., 22, GB2007, https://doi.org/10.1029/2007gb003033, 2008.
Chadburn, S., Burke, E., Essery, R., Boike, J., Langer, M., Heikenfeld, M., Cox, P., and Friedlingstein, P.: An improved representation of physical permafrost dynamics in the JULES land-surface model, Geosci. Model Dev., 8, 1493–1508, https://doi.org/10.5194/gmd-8-1493-2015, 2015.
Choat, B., Brodribb, T. J., Brodersen, C. R., Duursma, R. A., López, R., and Medlyn, B. E.: Triggers of tree mortality under drought, Nature, 558, 531–539, https://doi.org/10.1038/s41586-018-0240-x, 2018.
Choat, B., Jansen, S., Brodribb, T. J., Cochard, H., Delzon, S., Bhaskar, R., Bucci, S. J., Feild, T. S., Gleason, S. M., Hacke, U. G., Jacobsen, A. L., Lens, F., Maherali, H., Martínez-Vilalta, J., Mayr, S., Mencuccini, M., Mitchell, P. J., Nardini, A., Pittermann, J., Pratt, R. B., Sperry, J. S., Westoby, M., Wright, I. J., and Zanne, A. E.: Global convergence in the vulnerability of forests to drought, Nature, 491, 752–755, https://doi.org/10.1038/nature11688, 2012.
Christina, M., Laclau, J. P., Gonçalves, J. L. M., Jourdan, C., Nouvellon, Y., and Bouillet, J. P.: Almost symmetrical vertical growth rates above and below ground in one of the world's most productive forests, Ecosphere, 2, 1–10, 2011.
Christina, M., Nouvellon, Y., Laclau, J. P., Stape, J. L., Bouillet, J. P., Lambais, G. R., and le Maire, G.: Importance of deep water uptake in tropical eucalypt forest, Funct. Ecol., 31, 509–519, 2017.
Christoffersen, B. O., Gloor, M., Fauset, S., Fyllas, N. M., Galbraith, D. R., Baker, T. R., Kruijt, B., Rowland, L., Fisher, R. A., Binks, O. J., Sevanto, S., Xu, C., Jansen, S., Choat, B., Mencuccini, M., McDowell, N. G., and Meir, P.: Linking hydraulic traits to tropical forest function in a size-structured and trait-driven model (TFS v.1-Hydro), Geosci. Model Dev., 9, 4227–4255, https://doi.org/10.5194/gmd-9-4227-2016, 2016.
Christoffersen, B. O., Restrepo-Coupe, N., Arain, M. A., Baker, I. T., Cestaro, B. P., Ciais, P., Fisher, J. B., Galbraith, D., Guan, X., Gulden, L., van den Hurk, B., Ichii, K., Imbuzeiro, H., Jain, A., Levine, N., Miguez-Macho, G., Poulter, B., Roberti, D. R., Sakaguchi, K., Sahoo, A., Schaefer, K., Shi, M., Verbeeck, H., Yang, Z.-L., Araújo, A. C., Kruijt, B., Manzi, A. O., da Rocha, H. R., von Randow, C., Muza, M. N., Borak, J., Costa, M. H., Gonçalves de Gonçalves, L. G., Zeng, X., and Saleska, S. R.: Mechanisms of water supply and vegetation demand govern the seasonality and magnitude of evapotranspiration in Amazonia and Cerrado, Agric. For. Meteorol., 191, 33–50, https://doi.org/10.1016/j.agrformet.2014.02.008, 2014.
Ciais, P., Reichstein, M., Viovy, N., Granier, A., Ogée, J., Allard, V., Aubinet, M., Buchmann, N., Bernhofer, C., Carrara, A., Chevallier, F., De Noblet, N., Friend, A. D., Friedlingstein, P., Grünwald, T., Heinesch, B., Keronen, P., Knohl, A., Krinner, G., Loustau, D., Manca, G., Matteucci, G., Miglietta, F., Ourcival, J. M., Papale, D., Pilegaard, K., Rambal, S., Seufert, G., Soussana, J. F., Sanz, M. J., Schulze, E. D., Vesala, T., and Valentini, R.: Europe-wide reduction in primary productivity caused by the heat and drought in 2003, Nature, 437, 529–533, https://doi.org/10.1038/nature03972, 2005.
Clark, D. B., Mercado, L. M., Sitch, S., Jones, C. D., Gedney, N., Best, M. J., Pryor, M., Rooney, G. G., Essery, R. L. H., Blyth, E., Boucher, O., Harding, R. J., Huntingford, C., and Cox, P. M.: The Joint UK Land Environment Simulator (JULES), model description – Part 2: Carbon fluxes and vegetation dynamics, Geosci. Model Dev., 4, 701–722, https://doi.org/10.5194/gmd-4-701-2011, 2011.
Copin, Y.: Taylor diagram for Python [code], GitHub Gist, availabe at: https://gist.github.com/ycopin/3342888 (last access: 13 April 2021), 2018.
Cosby, B. J., Hornberger, G. M., Clapp, R. B., and Ginn, T. R.: A Statistical Exploration of the Relationships of Soil Moisture Characteristics to the Physical Properties of Soils, Water Resour. Res., 20, 682-690, https://doi.org/10.1029/WR020i006p00682, 1984.
Cox, P. M., Huntingford, C., and Harding, R. J.: A canopy conductance and photosynthesis model for use in a GCM land surface scheme, J. Hydrol., 212–213, 79–94, https://doi.org/10.1016/S0022-1694(98)00203-0, 1998.
De Kauwe, M. G., Zhou, S.-X., Medlyn, B. E., Pitman, A. J., Wang, Y.-P., Duursma, R. A., and Prentice, I. C.: Do land surface models need to include differential plant species responses to drought? Examining model predictions across a mesic-xeric gradient in Europe, Biogeosciences, 12, 7503–7518, https://doi.org/10.5194/bg-12-7503-2015, 2015.
De Kauwe, M. G., Medlyn, B. E., Walker, A. P., Zaehle, S., Asao, S., Guenet, B., Harper, A. B., Hickler, T., Jain, A. K., Luo, Y., Lu, X., Luus, K., Parton, W. J., Shu, S., Wang, Y.-P., Werner, C., Xia, J., Pendall, E., Morgan, J. A., Ryan, E. M., Carrillo, Y., Dijkstra, F. A., Zelikova, T. J., and Norby, R. J.: Challenging terrestrial biosphere models with data from the long-term multifactor Prairie Heating and CO2 Enrichment experiment, Glob. Change Biol., 23, 3623–3645, https://doi.org/10.1111/gcb.13643, 2017.
De Kauwe, M. G., Medlyn, B. E., Ukkola, A. M., Mu, M., Sabot, M. E. B., Pitman, A. J., Meir, P., Cernusak, L., Rifai, S. W., Choat, B., Tissue, D. T., Blackman, C. J., Li, X., Roderick, M., and Briggs, P. R.: Identifying areas at risk of drought-induced tree mortality across South-Eastern Australia, Glob. Change Biol., 26, 5716–5733, https://doi.org/10.1111/gcb.15215, 2020.
Dewar, R. C.: The Ball–Berry–Leuning and Tardieu–Davies stomatal models: synthesis and extension within a spatially aggregated picture of guard cell function, Plant Cell Environ., 25, 1383–1398, https://doi.org/10.1046/j.1365-3040.2002.00909.x, 2002.
Dharssi, I., Vidale, P. L., Verhoef, A., Macpherson, B., Jones, C., and Best, M.: New soil physical properties implemented in the Unified Model at PS18, Forecasting Research Technical Report 528, UK Met Office, Exeter, UK, 2009.
Doughty, C. E., Metcalfe, D. B., Girardin, C. A. J., Amézquita, F. F., Cabrera, D. G., Huasco, W. H., Silva-Espejo, J. E., Araujo-Murakami, A., da Costa, M. C., Rocha, W., Feldpausch, T. R., Mendoza, A. L. M., da Costa, A. C. L., Meir, P., Phillips, O. L., and Malhi, Y.: Drought impact on forest carbon dynamics and fluxes in Amazonia, Nature, 519, 78–82, https://doi.org/10.1038/nature14213, 2015.
Egea, G., Verhoef, A., and Vidale, P.: Towards an improved and more flexible representation of water stress in coupled photosynthesis-stomatal conductance models, Agr. Forest Meteorol., 151, 1370–1384, https://doi.org/10.1016/j.agrformet.2011.05.019, 2011.
Eller, C. B., Rowland, L., Oliveira, R. S., Bittencourt, P. R. L., Barros, F. V., da Costa, A. C. L., Meir, P., Friend, A. D., Mencuccini, M., Sitch, S., and Cox, P.: Modelling tropical forest responses to drought and El Niño with a stomatal optimization model based on xylem hydraulics, Philos. T. R. Soc. B, 373, 20170315, https://doi.org/10.1098/rstb.2017.0315, 2018.
Eller, C. B., Rowland, L., Mencuccini, M., Rosas, T., Williams, K., Harper, A., Medlyn, B. E., Wagner, Y., Klein, T., Teodoro, G. S., Oliveira, R. S., Matos, I. S., Rosado, B. H. P., Fuchs, K., Wohlfahrt, G., Montagnani, L., Meir, P., Sitch, S., and Cox, P. M.: Stomatal optimization based on xylem hydraulics (SOX) improves land surface model simulation of vegetation responses to climate, New Phytol., 226, 1622–1637, https://doi.org/10.1111/nph.16419, 2020.
Fatichi, S., Ivanov, V. Y., and Caporali, E.: A mechanistic ecohydrological model to investigate complex interactions in cold and warm water-controlled environments: 1. Theoretical framework and plot-scale analysis, J. Adv. Model. Earth Sy., 4, M05002, https://doi.org/10.1029/2011MS000086, 2012.
Field, C. B. and Holbrook, N. M.: Catastrophic xylem failure: Tree life at the brink, Trends Ecol. Evol., 4, 124–126, https://doi.org/10.1016/0169-5347(89)90209-7, 1989.
Friedlingstein, P., Jones, M. W., O'Sullivan, M., Andrew, R. M., Hauck, J., Peters, G. P., Peters, W., Pongratz, J., Sitch, S., Le Quéré, C., Bakker, D. C. E., Canadell, J. G., Ciais, P., Jackson, R. B., Anthoni, P., Barbero, L., Bastos, A., Bastrikov, V., Becker, M., Bopp, L., Buitenhuis, E., Chandra, N., Chevallier, F., Chini, L. P., Currie, K. I., Feely, R. A., Gehlen, M., Gilfillan, D., Gkritzalis, T., Goll, D. S., Gruber, N., Gutekunst, S., Harris, I., Haverd, V., Houghton, R. A., Hurtt, G., Ilyina, T., Jain, A. K., Joetzjer, E., Kaplan, J. O., Kato, E., Klein Goldewijk, K., Korsbakken, J. I., Landschützer, P., Lauvset, S. K., Lefèvre, N., Lenton, A., Lienert, S., Lombardozzi, D., Marland, G., McGuire, P. C., Melton, J. R., Metzl, N., Munro, D. R., Nabel, J. E. M. S., Nakaoka, S.-I., Neill, C., Omar, A. M., Ono, T., Peregon, A., Pierrot, D., Poulter, B., Rehder, G., Resplandy, L., Robertson, E., Rödenbeck, C., Séférian, R., Schwinger, J., Smith, N., Tans, P. P., Tian, H., Tilbrook, B., Tubiello, F. N., van der Werf, G. R., Wiltshire, A. J., and Zaehle, S.: Global Carbon Budget 2019, Earth Syst. Sci. Data, 11, 1783–1838, https://doi.org/10.5194/essd-11-1783-2019, 2019.
Gatti, R. C., Castaldi, S., Lindsell, J. A., Coomes, D. A., Marchetti, M., Maesano, M., Di Paola, A., Paparella, F., and Valentini, R.: The impact of selective logging and clearcutting on forest structure, tree diversity and above-ground biomass of African tropical forests, Ecol. Res., 30, 119–132, https://doi.org/10.1007/s11284-014-1217-3, 2015.
Gentine, P., Green, J. K., Guerin, M., Humphrey, V., Seneviratne, S. I., Zhang, Y., and Zhou, S.: Coupling between the terrestrial carbon and water cycles-a review, Environ. Res. Lett., 14, 083003, https://doi.org/10.1088/1748-9326/ab22d6, 2019.
Germon, A., Laclau, J. P., Robin, A., and Jourdan, C.: Tamm Review: Deep fine roots in forest ecosystems: Why dig deeper?, Forest Ecol. Manage., 466, 118135, https://doi.org/10.1016/j.foreco.2020.118135, 2020.
Germon, A., Guerrini, I. A., Bordron, B., Bouillet, J. P., Nouvellon, Y., de Moraes Gonçalves, J. L., Jourdan, C., Paula, R. R., and Laclau, J. P.: Consequences of mixing Acacia mangium and Eucalyptus grandis trees on soil exploration by fine-roots down to a depth of 17 m, Plant Soil, 424, 203–220, 2018.
Green, J. K., Konings, A. G., Alemohammad, S. H., Berry, J., Entekhabi, D., Kolassa, J., Lee, J.-E., and Gentine, P.: Regionally strong feedbacks between the atmosphere and terrestrial biosphere, Nat. Geosci., 10, 410–414, https://doi.org/10.1038/ngeo2957, 2017.
Guerrieri, R., Belmecheri, S., Ollinger, S. V., Asbjornsen, H., Jennings, K., Xiao, J., Stocker, B. D., Martin, M., Hollinger, D. Y., Bracho-Garrillo, R., Clark, K., Dore, S., Kolb, T., Munger, J. W., Novick, K., and Richardson, A. D.: Disentangling the role of photosynthesis and stomatal conductance on rising forest water-use efficiency, P. Natl. Acad. Sci. USA, 116, 16909–16914, https://doi.org/10.1073/pnas.1905912116, 2019.
Harper, A., Baker, I. T., Denning, A. S., Randall, D. A., Dazlich, D., and Branson, M.: Impact of evapotranspiration on dry season climate in the Amazon forest, J. Climate, 27, 574–591, 2013.
Harper, A. B., Cox, P. M., Friedlingstein, P., Wiltshire, A. J., Jones, C. D., Sitch, S., Mercado, L. M., Groenendijk, M., Robertson, E., Kattge, J., Bönisch, G., Atkin, O. K., Bahn, M., Cornelissen, J., Niinemets, Ü., Onipchenko, V., Peñuelas, J., Poorter, L., Reich, P. B., Soudzilovskaia, N. A., and Bodegom, P. V.: Improved representation of plant functional types and physiology in the Joint UK Land Environment Simulator (JULES v4.2) using plant trait information, Geosci. Model Dev., 9, 2415–2440, https://doi.org/10.5194/gmd-9-2415-2016, 2016.
Humphrey, V., Zscheischler, J., Ciais, P., Gudmundsson, L., Sitch, S., and Seneviratne, S. I.: Sensitivity of atmospheric CO2 growth rate to observed changes in terrestrial water storage, Nature, 560, 628–631, https://doi.org/10.1038/s41586-018-0424-4, 2018.
Huntingford, C., Jeffers, E. S., Bonsall, M. B., Christensen, H. M., Lees, T., and Yang, H.: Machine learning and artificial intelligence to aid climate change research and preparedness, Environ. Res. Lett., 14, 124007, https://doi.org/10.1088/1748-9326/ab4e55, 2019.
Huntingford, C., Smith, D. M., Davies, W. J., Falk, R., Sitch, S., and Mercado, L. M.: Combining the [ABA] and net photosynthesis-based model equations of stomatal conductance, Ecol.l Model., 300, 81–88, https://doi.org/10.1016/j.ecolmodel.2015.01.005, 2015.
Jipp, P. H., Nepstad, D. C., Cassel, D. K., and De Carvalho, C. R.: Deep soil moisture storage and transpiration in forests and pastures of seasonally-dry amazonia, Clim. Change, 39, 395–412, https://doi.org/10.1023/a:1005308930871, 1998.
Keenan, T., Sabate, S., and Gracia, C.: The importance of mesophyll conductance in regulating forest ecosystem productivity during drought periods, Glob. Change Biol., 16, 1019–1034, https://doi.org/10.1111/j.1365-2486.2009.02017.x, 2010.
Kennedy, D., Swenson, S., Oleson, K. W., Lawrence, D. M., Fisher, R., Lola da Costa, A. C., and Gentine, P.: Implementing Plant Hydraulics in the Community Land Model, Version 5, J. Adv. Model. Earth Sy., 11, 485–513, https://doi.org/10.1029/2018MS001500, 2019.
Krinner, G., Viovy, N., de Noblet-Ducoudré, N., Ogée, J., Polcher, J., Friedlingstein, P., Ciais, P., Sitch, S., and Prentice, I. C.: A dynamic global vegetation model for studies of the coupled atmosphere-biosphere system, Global Biogeochem. Cy., 19, GB1015, https://doi.org/10.1029/2003gb002199, 2005.
Laclau, J.-P., Silva, E., Rodrigues Lambais, G., Bernoux, M., le Maire, G., Stape, J. L., Bouillet, J.-P., Gonçalves, J. l., Jourdan, C., and Nouvellon, Y.: Dynamics of soil exploration by fine roots down to a depth of 10 m throughout the entire rotation in Eucalyptus grandis plantations, Front. Plant Sci. 4, 243, https://doi.org/10.3389/fpls.2013.00243, 2013.
Lambers, H., Chapin, H., Stuart, F., and Pons, T. L.: Plant Physiological Ecology, Springer-Verlag New York, XXIX, 605 pp., https://doi.org/10.1007/978-0-387-78341-3, 2008.
Lawrence, D. M., Fisher, R. A., Koven, C. D., Oleson, K. W., Swenson, S. C., Bonan, G., Collier, N., Ghimire, B., van Kampenhout, L., Kennedy, D., Kluzek, E., Lawrence, P. J., Li, F., Li, H., Lombardozzi, D., Riley, W. J., Sacks, W. J., Shi, M., Vertenstein, M., Wieder, W. R., Xu, C., Ali, A. A., Badger, A. M., Bisht, G., van den Broeke, M., Brunke, M. A., Burns, S. P., Buzan, J., Clark, M., Craig, A., Dahlin, K., Drewniak, B., Fisher, J. B., Flanner, M., Fox, A. M., Gentine, P., Hoffman, F., Keppel-Aleks, G., Knox, R., Kumar, S., Lenaerts, J., Leung, L. R., Lipscomb, W. H., Lu, Y., Pandey, A., Pelletier, J. D., Perket, J., Randerson, J. T., Ricciuto, D. M., Sanderson, B. M., Slater, A., Subin, Z. M., Tang, J., Thomas, R. Q., Val Martin, M., and Zeng, X.: The Community Land Model Version 5: Description of New Features, Benchmarking, and Impact of Forcing Uncertainty, J. Adv. Model. Earth Sy., 11, 4245–4287, https://doi.org/10.1029/2018MS001583, 2019.
Lee, J.-E., Frankenberg, C., van der Tol, C., Berry, J. A., Guanter, L., Boyce, C. K., Fisher, J. B., Morrow, E., Worden, J. R., Asefi, S., Badgley, G., and Saatchi, S.: Forest productivity and water stress in Amazonia: observations from GOSAT chlorophyll fluorescence, P. Roy. Soc. B-Biol. Sci., 280, 20130171, https://doi.org/10.1098/rspb.2013.0171, 2013.
Lemordant, L., Gentine, P., Stéfanon, M., Drobinski, P., and Fatichi, S.: Modification of land-atmosphere interactions by CO2 effects: Implications for summer dryness and heat wave amplitude, Geophys. Res. Lett., 43, 10240–10248, https://doi.org/10.1002/2016GL069896, 2016.
Lian, X., Piao, S., Li, L. Z. X., Li, Y., Huntingford, C., Ciais, P., Cescatti, A., Janssens, I. A., Peñuelas, J., Buermann, W., Chen, A., Li, X., Myneni, R. B., Wang, X., Wang, Y., Yang, Y., Zeng, Z., Zhang, Y., and McVicar, T. R.: Summer soil drying exacerbated by earlier spring greening of northern vegetation, Sci. Adv., 6, eaax0255, https://doi.org/10.1126/sciadv.aax0255, 2020.
Liu, H., Mi, Z., Lin, L., Wang, Y., Zhang, Z., Zhang, F., Wang, H., Liu, L., Zhu, B., Cao, G., Zhao, X., Sanders, N. J., Classen, A. T., Reich, P. B., and He, J.-S.: Shifting plant species composition in response to climate change stabilizes grassland primary production, P. Natl. Acad. Sci. USA, 115, 4051–4056, https://doi.org/10.1073/pnas.1700299114, 2018.
Liu, X., Chen, F., Barlage, M., and Niyogi, D.: Implementing Dynamic Rooting Depth for Improved Simulation of Soil Moisture and Land Surface Feedbacks in Noah-MP-Crop, J. Adv. Model. Earth Sy., 12, e2019MS001786, https://doi.org/10.1029/2019MS001786, 2020.
Manzoni, S., Vico, G., Palmroth, S., Porporato, A., and Katul, G.: Optimization of stomatal conductance for maximum carbon gain under dynamic soil moisture, Adv. Water Resour., 62, 90–105, https://doi.org/10.1016/j.advwatres.2013.09.020, 2013.
Marsden, C., Nouvellon, Y., Laclau, J.-P., Corbeels, M., McMurtrie, R. E., Stape, J. L., Epron, D., and le Maire, G.: Modifying the G'DAY process-based model to simulate the spatial variability of Eucalyptus plantation growth on deep tropical soils, Forest Ecol. Manage., 301, 112–128, https://doi.org/10.1016/j.foreco.2012.10.039, 2013.
Martens, B., Miralles, D. G., Lievens, H., van der Schalie, R., de Jeu, R. A. M., Fernández-Prieto, D., Beck, H. E., Dorigo, W. A., and Verhoest, N. E. C.: GLEAM v3: satellite-based land evaporation and root-zone soil moisture, Geosci. Model Dev., 10, 1903–1925, https://doi.org/10.5194/gmd-10-1903-2017, 2017.
Martínez-de la Torre, A., Blyth, E. M., and Robinson, E. L.: Evaluation of Drydown Processes in Global Land Surface and Hydrological Models Using Flux Tower Evapotranspiration, Water, 11, 356, https://doi.org/10.3390/w11020356, 2019.
McDowell, N., Pockman, W. T., Allen, C. D., Breshears, D. D., Cobb, N., Kolb, T., Plaut, J., Sperry, J., West, A., Williams, D. G., and Yepez, E. A.: Mechanisms of plant survival and mortality during drought: why do some plants survive while others succumb to drought?, New Phytol., 178, 719–739, https://doi.org/10.1111/j.1469-8137.2008.02436.x, 2008.
Medlyn, B. E., De Kauwe, M. G., Zaehle, S., Walker, A. P., Duursma, R. A., Luus, K., Mishurov, M., Pak, B., Smith, B., Wang, Y.-P., Yang, X., Crous, K. Y., Drake, J. E., Gimeno, T. E., Macdonald, C. A., Norby, R. J., Power, S. A., Tjoelker, M. G., and Ellsworth, D. S.: Using models to guide field experiments: a priori predictions for the CO2 response of a nutrient- and water-limited native Eucalypt woodland, Glob. Change Biol., 22, 2834–2851, https://doi.org/10.1111/gcb.13268, 2016.
Merbold, L., Kutsch, W. L., Corradi, C., Kolle, O., Rebmann, C., Stoy, P. C., Zimov, S. A., and Schulze, E.-D.: Artificial drainage and associated carbon fluxes (CO2/CH4) in a tundra ecosystem, Glob. Change Biol., 15, 2599–2614, https://doi.org/10.1111/j.1365-2486.2009.01962.x, 2009a.
Merbold, L., Ardö, J., Arneth, A., Scholes, R. J., Nouvellon, Y., de Grandcourt, A., Archibald, S., Bonnefond, J. M., Boulain, N., Brueggemann, N., Bruemmer, C., Cappelaere, B., Ceschia, E., El-Khidir, H. A. M., El-Tahir, B. A., Falk, U., Lloyd, J., Kergoat, L., Le Dantec, V., Mougin, E., Muchinda, M., Mukelabai, M. M., Ramier, D., Roupsard, O., Timouk, F., Veenendaal, E. M., and Kutsch, W. L.: Precipitation as driver of carbon fluxes in 11 African ecosystems, Biogeosciences, 6, 1027–1041, https://doi.org/10.5194/bg-6-1027-2009, 2009b.
Miralles, D. G., Gentine, P., Seneviratne, S. I., and Teuling, A. J.: Land-atmospheric feedbacks during droughts and heatwaves: state of the science and current challenges, Annals of the New York Academy of Sciences, 1436, 19–35, https://doi.org/10.1111/nyas.13912, 2019.
Mirfenderesgi, G., Bohrer, G., Matheny, A. M., Fatichi, S., de Moraes Frasson, R. P., and Schäfer, K. V. R.: Tree level hydrodynamic approach for resolving aboveground water storage and stomatal conductance and modeling the effects of tree hydraulic strategy, J. Geophys. Res.-Biogeo., 121, 1792–1813, https://doi.org/10.1002/2016JG003467, 2016.
Morillas, L., Pangle, R. E., Maurer, G. E., Pockman, W. T., McDowell, N., Huang, C.-W., Krofcheck, D. J., Fox, A. M., Sinsabaugh, R. L., Rahn, T. A., and Litvak, M. E.: Tree Mortality Decreases Water Availability and Ecosystem Resilience to Drought in Piñon-Juniper Woodlands in the Southwestern U.S, J. Geophys. Res.-Biogeo., 122, 3343–3361, https://doi.org/10.1002/2017jg004095, 2017.
Mu, M., De Kauwe, M. G., Ukkola, A. M., Pitman, A. J., Gimeno, T. E., Medlyn, B. E., Or, D., Yang, J., and Ellsworth, D. S.: Evaluating a land surface model at a water-limited site: implications for land surface contributions to droughts and heatwaves, Hydrol. Earth Syst. Sci., 25, 447–471, https://doi.org/10.5194/hess-25-447-2021, 2021.
Mueller, B. and Seneviratne, S. I.: Systematic land climate and evapotranspiration biases in CMIP5 simulations, Geophys. Res. Lett., 41, 128–134, https://doi.org/10.1002/2013GL058055, 2014.
Nemani, R. R., Keeling, C. D., Hashimoto, H., Jolly, W. M., Piper, S. C., Tucker, C. J., Myneni, R. B., and Running, S. W.: Climate-Driven Increases in Global Terrestrial Net Primary Production from 1982 to 1999, Science, 300, 1560–1563, https://doi.org/10.1126/science.1082750, 2003.
Nepstad, D. C., Decarvalho, C. R., Davidson, E. A., Jipp, P. H., Lefebvre, P. A., Negreiros, G. H., Dasilva, E. D., Stone, T. A., Trumbore, S. E., and Vieira, S.: The role of deep roots in the hydrological and carbon cycles of Amazonian forests and pastures, Nature, 372, 666-669, https://doi.org/10.1038/372666a0, 1994.
Oleson, K. W., Lawrence, D. M., Bonan, G. B., Flanner, M. G., Kluzek, E., Lawrence, P. J., Levis, S., Swenson, S. C., Thornton, P. E., Dai, A., Decker, M., Dickinson, R., Feddema, J., Heald, C. L., Hoffman, F., Lamarque, J.-F., Mahowald, N., Niu, G.-Y., Qian, T., Randerson, J., Running, S., Sakaguchi, K., Slater, A., Stockli, R., Wang, A., Yang, Z.-L., Zeng, X., and Zeng, X.: Technical Description of version 4.0 of the Community Land Model (CLM), NCAR478, https://doi.org/10.5065/D6FB50WZ, 2010.
Oliveira, R. S., Dawson, T. E., Burgess, S. S. O., and Nepstad, D. C.: Hydraulic redistribution in three Amazonian trees, Oecologia, 145, 354–363, https://doi.org/10.1007/s00442-005-0108-2, 2005.
Paschalis, A., Fatichi, S., Zscheischler, J., Ciais, P., Bahn, M., Boysen, L., Chang, J., De Kauwe, M., Estiarte, M., Goll, D., Hanson, P. J., Harper, A. B., Hou, E., Kigel, J., Knapp, A. K., Larsen, K. S., Li, W., Lienert, S., Luo, Y., Meir, P., Nabel, J. E. M. S., Ogaya, R., Parolari, A. J., Peng, C., Peñuelas, J., Pongratz, J., Rambal, S., Schmidt, I. K., Shi, H., Sternberg, M., Tian, H., Tschumi, E., Ukkola, A., Vicca, S., Viovy, N., Wang, Y.-P., Wang, Z., Williams, K., Wu, D., and Zhu, Q.: Rainfall manipulation experiments as simulated by terrestrial biosphere models: Where do we stand?, Glob. Change Biol., 26, 3336–3355, https://doi.org/10.1111/gcb.15024, 2020.
Pastorello, G., Trotta, C., Canfora, E., Chu, H., Christianson, D., Cheah, Y.-W., Poindexter, C., Chen, J., Elbashandy, A., Humphrey, M., Isaac, P., Polidori, D., Ribeca, A., van Ingen, C., Zhang, L., Amiro, B., Ammann, C., Arain, M. A., Ardö, J., Arkebauer, T., Arndt, S. K., Arriga, N., Aubinet, M., Aurela, M., Baldocchi, D., Barr, A., Beamesderfer, E., Marchesini, L. B., Bergeron, O., Beringer, J., Bernhofer, C., Berveiller, D., Billesbach, D., Black, T. A., Blanken, P. D., Bohrer, G., Boike, J., Bolstad, P. V., Bonal, D., Bonnefond, J.-M., Bowling, D. R., Bracho, R., Brodeur, J., Brümmer, C., Buchmann, N., Burban, B., Burns, S. P., Buysse, P., Cale, P., Cavagna, M., Cellier, P., Chen, S., Chini, I., Christensen, T. R., Cleverly, J., Collalti, A., Consalvo, C., Cook, B. D., Cook, D., Coursolle, C., Cremonese, E., Curtis, P. S., D'Andrea, E., da Rocha, H., Dai, X., Davis, K. J., De Cinti, B., de Grandcourt, A., De Ligne, A., De Oliveira, R. C., Delpierre, N., Desai, A. R., Di Bella, C. M., di Tommasi, P., Dolman, H., Domingo, F., Dong, G., Dore, S., Duce, P., Dufrêne, E., Dunn, A., Dušek, J., Eamus, D., Eichelmann, U., ElKhidir, H. A. M., Eugster, W., Ewenz, C. M., Ewers, B., Famulari, D., Fares, S., Feigenwinter, I., Feitz, A., Fensholt, R., Filippa, G., Fischer, M., Frank, J., Galvagno, M., Gharun, M., Gianelle, D., Gielen, B., Gioli, B., Gitelson, A., Goded, I., Goeckede, M., Goldstein, A. H., Gough, C. M., Goulden, M. L., Graf, A., Griebel, A., Gruening, C., Grünwald, T., Hammerle, A., Han, S., Han, X., Hansen, B. U., Hanson, C., Hatakka, J., He, Y., Hehn, M., Heinesch, B., Hinko-Najera, N., Hörtnagl, L., Hutley, L., Ibrom, A., Ikawa, H., Jackowicz-Korczynski, M., Janouš, D., Jans, W., Jassal, R., Jiang, S., Kato, T., Khomik, M., Klatt, J., Knohl, A., Knox, S., Kobayashi, H., Koerber, G., Kolle, O., Kosugi, Y., Kotani, A., Kowalski, A., Kruijt, B., Kurbatova, J., Kutsch, W. L., Kwon, H., Launiainen, S., Laurila, T., Law, B., Leuning, R., Li, Y., Liddell, M., Limousin, J.-M., Lion, M., Liska, A. J., Lohila, A., López-Ballesteros, A., López-Blanco, E., Loubet, B., Loustau, D., Lucas-Moffat, A., Lüers, J., Ma, S., Macfarlane, C., Magliulo, V., Maier, R., Mammarella, I., Manca, G., Marcolla, B., Margolis, H. A., Marras, S., Massman, W., Mastepanov, M., Matamala, R., Matthes, J. H., Mazzenga, F., McCaughey, H., McHugh, I., McMillan, A. M. S., Merbold, L., Meyer, W., Meyers, T., Miller, S. D., Minerbi, S., Moderow, U., Monson, R. K., Montagnani, L., Moore, C. E., Moors, E., Moreaux, V., Moureaux, C., Munger, J. W., Nakai, T., Neirynck, J., Nesic, Z., Nicolini, G., Noormets, A., Northwood, M., Nosetto, M., Nouvellon, Y., Novick, K., Oechel, W., Olesen, J. E., Ourcival, J.-M., Papuga, S. A., Parmentier, F.-J., Paul-Limoges, E., Pavelka, M., Peichl, M., Pendall, E., Phillips, R. P., Pilegaard, K., Pirk, N., Posse, G., Powell, T., Prasse, H., Prober, S. M., Rambal, S., Rannik, Ü., Raz-Yaseef, N., Reed, D., de Dios, V. R., Restrepo-Coupe, N., Reverter, B. R., Roland, M., Sabbatini, S., Sachs, T., Saleska, S. R., Sánchez-Cañete, E. P., Sanchez-Mejia, Z. M., Schmid, H. P., Schmidt, M., Schneider, K., Schrader, F., Schroder, I., Scott, R. L., Sedlák, P., Serrano-Ortíz, P., Shao, C., Shi, P., Shironya, I., Siebicke, L., Šigut, L., Silberstein, R., Sirca, C., Spano, D., Steinbrecher, R., Stevens, R. M., Sturtevant, C., Suyker, A., Tagesson, T., Takanashi, S., Tang, Y., Tapper, N., Thom, J., Tiedemann, F., Tomassucci, M., Tuovinen, J.-P., Urbanski, S., Valentini, R., van der Molen, M., van Gorsel, E., van Huissteden, K., Varlagin, A., Verfaillie, J., Vesala, T., Vincke, C., Vitale, D., Vygodskaya, N., Walker, J. P., Walter-Shea, E., Wang, H., Weber, R., Westermann, S., Wille, C., Wofsy, S., Wohlfahrt, G., Wolf, S., Woodgate, W., Li, Y., Zampedri, R., Zhang, J., Zhou, G., Zona, D., Agarwal, D., Biraud, S., Torn, M., and Papale, D.: The FLUXNET2015 dataset and the ONEFlux processing pipeline for eddy covariance data, Sci. Data, 7, 225, https://doi.org/10.1038/s41597-020-0534-3, 2020.
Pate, J. S., Jeschke, W. D., and Aylward, M. J.: Hydraulic architecture and xylem structure of the dimorphic root systems of South-West Australian species of Proteaceae, J. Exp. Botany, 46, 907–915, 1995.
Peters, W., van der Velde, I. R., van Schaik, E., Miller, J. B., Ciais, P., Duarte, H. F., van der Laan-Luijkx, I. T., van der Molen, M. K., Scholze, M., Schaefer, K., Vidale, P. L., Verhoef, A., Wårlind, D., Zhu, D., Tans, P. P., Vaughn, B., and White, J. W. C.: Increased water-use efficiency and reduced CO2 uptake by plants during droughts at a continental scale, Nat. Geosci., 11, 744–748, https://doi.org/10.1038/s41561-018-0212-7, 2018.
Pierret, A., Maeght, J.-L., Clément, C., Montoroi, J.-P., Hartmann, C., and Gonkhamdee, S.: Understanding deep roots and their functions in ecosystems: an advocacy for more unconventional research, Ann. Botany, 118, 621–635, https://doi.org/10.1093/aob/mcw130, 2016.
Powell, T. L., Galbraith, D. R., Christoffersen, B. O., Harper, A., Imbuzeiro, H. M. A., Rowland, L., Almeida, S., Brando, P. M., da Costa, A. C. L., Costa, M. H., Levine, N. M., Malhi, Y., Saleska, S. R., Sotta, E., Williams, M., Meir, P., and Moorcroft, P. R.: Confronting model predictions of carbon fluxes with measurements of Amazon forests subjected to experimental drought, New Phytol., 200, 350–365, 2013.
Prechsl, U. E., Burri, S., Gilgen, A. K., Kahmen, A., and Buchmann, N.: No shift to a deeper water uptake depth in response to summer drought of two lowland and sub-alpine C3-grasslands in Switzerland, Oecologia, 177, 97–111, https://doi.org/10.1007/s00442-014-3092-6, 2015.
Raddatz, T. J., Reick, C. H., Knorr, W., Kattge, J., Roeckner, E., Schnur, R., Schnitzler, K. G., Wetzel, P., and Jungclaus, J.: Will the tropical land biosphere dominate the climate–carbon cycle feedback during the twenty-first century?, Clim. Dynam., 29, 565–574, https://doi.org/10.1007/s00382-007-0247-8, 2007.
Restrepo-Coupe, N., Levine, N. M., Christoffersen, B. O., Albert, L. P., Wu, J., Costa, M. H., Galbraith, D., Imbuzeiro, H., Martins, G., da Araujo, A. C., Malhi, Y. S., Zeng, X., Moorcroft, P., and Saleska, S. R.: Do dynamic global vegetation models capture the seasonality of carbon fluxes in the Amazon basin? A data-model intercomparison, Glob. Change Biol., 23, 191–208, https://doi.org/10.1111/gcb.13442, 2017.
Restrepo-Coupe, N., da Rocha, H. R., Hutyra, L. R., da Araujo, A. C., Borma, L. S., Christoffersen, B., Cabral, O. M. R., de Camargo, P. B., Cardoso, F. L., da Costa, A. C. L., Fitzjarrald, D. R., Goulden, M. L., Kruijt, B., Maia, J. M. F., Malhi, Y. S., Manzi, A. O., Miller, S. D., Nobre, A. D., von Randow, C., Sá, L. D. A., Sakai, R. K., Tota, J., Wofsy, S. C., Zanchi, F. B., and Saleska, S. R.: What drives the seasonality of photosynthesis across the Amazon basin? A cross-site analysis of eddy flux tower measurements from the Brasil flux network, Agr. Forest Meteorol., 182–183, 128–144, https://doi.org/10.1016/j.agrformet.2013.04.031, 2013.
Robinson, D. A., Hopmans, J. W., Filipovic, V., van der Ploeg, M., Lebron, I., Jones, S. B., Reinsch, S., Jarvis, N., and Tuller, M.: Global environmental changes impact soil hydraulic functions through biophysical feedbacks, Glob. Change Biol., 25, 1895–1904, https://doi.org/10.1111/gcb.14626, 2019.
Sabot, M. E. B., De Kauwe, M. G., Pitman, A. J., Medlyn, B. E., Verhoef, A., Ukkola, A. M., and Abramowitz, G.: Plant profit maximization improves predictions of European forest responses to drought, New Phytol., 226, 1638–1655, https://doi.org/10.1111/nph.16376, 2020.
Saleska, S. R., Miller, S. D., Matross, D. M., Goulden, M. L., Wofsy, S. C., da Rocha, H. R., de Camargo, P. B., Crill, P., Daube, B. C., de Freitas, H. C., Hutyra, L., Keller, M., Kirchhoff, V., Menton, M., Munger, J. W., Pyle, E. H., Rice, A. H., and Silva, H.: Carbon in amazon forests: Unexpected seasonal fluxes and disturbance-induced losses, Science, 302, 1554–1557, https://doi.org/10.1126/science.1091165, 2003.
Schenk, H. J. and Jackson, R. B.: Mapping the global distribution of deep roots in relation to climate and soil characteristics, Geoderma, 126, 129–140, https://doi.org/10.1016/j.geoderma.2004.11.018, 2005.
Seneviratne, S. I., Corti, T., Davin, E. L., Hirschi, M., Jaeger, E. B., Lehner, I., Orlowsky, B., and Teuling, A. J.: Investigating soil moisture–climate interactions in a changing climate: A review, Earth-Sci. Rev., 99, 125–161, https://doi.org/10.1016/j.earscirev.2010.02.004, 2010.
Seneviratne, S. I., Wilhelm, M., Stanelle, T., van den Hurk, B., Hagemann, S., Berg, A., Cheruy, F., Higgins, M. E., Meier, A., Brovkin, V., Claussen, M., Ducharne, A., Dufresne, J.-L., Findell, K. L., Ghattas, J., Lawrence, D. M., Malyshev, S., Rummukainen, M., and Smith, B.: Impact of soil moisture-climate feedbacks on CMIP5 projections: First results from the GLACE-CMIP5 experiment, Geophys. Res. Lett., 40, 5212–5217, https://doi.org/10.1002/grl.50956, 2013.
Sinclair, T. R.: Theoretical Analysis of Soil and Plant Traits Influencing Daily Plant Water Flux on Drying Soils, Agronom. J., 97, 1148–1152, https://doi.org/10.2134/agronj2004.0286, 2005.
Song, Y., Jain, A. K., and McIsaac, G. F.: Implementation of dynamic crop growth processes into a land surface model: evaluation of energy, water and carbon fluxes under corn and soybean rotation, Biogeosciences, 10, 8039–8066, https://doi.org/10.5194/bg-10-8039-2013, 2013.
Sparks, J. P. and Black, R. A.: Regulation of water loss in populations of Populus trichocarpa: the role of stomatal control in preventing xylem cavitation, Tree Physiol., 19, 453–459, https://doi.org/10.1093/treephys/19.7.453, 1999.
Sperry, J. S., Adler, F. R., Campbell, G. S., and Comstock, J. P.: Limitation of plant water use by rhizosphere and xylem conductance: results from a model, Plant Cell Environ., 21, 347p-359, https://doi.org/10.1046/j.1365-3040.1998.00287.x, 1998.
Sperry, J. S., Venturas, M. D., Anderegg, W. R. L., Mencuccini, M., Mackay, D. S., Wang, Y., and Love, D. M.: Predicting stomatal responses to the environment from the optimization of photosynthetic gain and hydraulic cost, Plant Cell Environ., 40, 816p-830, https://doi.org/10.1111/pce.12852, 2017.
Sperry, J. S., Wang, Y., Wolfe, B. T., Mackay, D. S., Anderegg, W. R. L., McDowell, N. G., and Pockman, W. T.: Pragmatic hydraulic theory predicts stomatal responses to climatic water deficits, New Phytol., 212, 577-p589, https://doi.org/10.1111/nph.14059, 2016.
Stahl, C., Burban, B., Wagner, F., Goret, J.-Y., Bompy, F., and Bonal, D.: Influence of Seasonal Variations in Soil Water Availability on Gas Exchange of Tropical Canopy Trees, Biotropica, 45, 155p-164, https://doi.org/10.1111/j.1744-7429.2012.00902.x, 2013a.
Stahl, C., Hérault, B., Rossi, V., Burban, B., Bréchet, C., and Bonal, D.: Depth of soil water uptake by tropical rainforest trees during dry periods: does tree dimension matter?, Oecologia, 173, 1191p-1201, https://doi.org/10.1007/s00442-013-2724-6, 2013b.
Stocker, B. D., Zscheischler, J., Keenan, T. F., Prentice, I. C., Peñuelas, J., and Seneviratne, S. I.: Quantifying soil moisture impacts on light use efficiency across biomes, New Phytol., 218, 1430-p1449, https://doi.org/10.1111/nph.15123, 2018.
Strey, S., Boy, J., Strey, R., Welpelo, A., Sch önenberg, R., Schumann, C., and Guggenberger, G.: Digging deeper: The value of deep soil carbon for potential REDD+ projects in tropical forest communities in Amazonia, Erkunde, 71, 231p-239, https://doi.org/10.3112/erdkunde.2017.03.05, 2017.
Takahashi, F., Suzuki, T., Osakabe, Y., Betsuyaku, S., Kondo, Y., Dohmae, N., Fukuda, H., Yamaguchi-Shinozaki, K., and Shinozaki, K.: A small peptide modulates stomatal control via abscisic acid in long-distance signalling, Nature, 556, 235–238, https://doi.org/10.1038/s41586-018-0009-2, 2018.
Tardieu, F. and Davies, W.: Root-shoot communication and whole-plant regulation of water flux, in: Water deficits: plant responses from cell to community, edited by: Griffiths, H. and Smith, J. A. C., Bios Scientific Publishers, Oxford, 147–162, 1993.
Teuling, A. J., Uijlenhoet, R., Hupet, F., and Troch, P. A.: Impact of plant water uptake strategy on soil moisture and evapotranspiration dynamics during drydown, Geophys. Res. Lett., 33, L03401, https://doi.org/10.1029/2005GL025019, 2006.
Teuling, A. J., Seneviratne, S. I., Stöckli, R., Reichstein, M., Moors, E., Ciais, P., Luyssaert, S., van den Hurk, B., Ammann, C., Bernhofer, C., Dellwik, E., Gianelle, D., Gielen, B., Grünwald, T., Klumpp, K., Montagnani, L., Moureaux, C., Sottocornola, M., and Wohlfahrt, G.: Contrasting response of European forest and grassland energy exchange to heatwaves, Nat. Geosci., 3, 722–727, https://doi.org/10.1038/ngeo950, 2010.
The HadGEM2 Development Team: G. M. Martin, Bellouin, N., Collins, W. J., Culverwell, I. D., Halloran, P. R., Hardiman, S. C., Hinton, T. J., Jones, C. D., McDonald, R. E., McLaren, A. J., O'Connor, F. M., Roberts, M. J., Rodriguez, J. M., Woodward, S., Best, M. J., Brooks, M. E., Brown, A. R., Butchart, N., Dearden, C., Derbyshire, S. H., Dharssi, I., Doutriaux-Boucher, M., Edwards, J. M., Falloon, P. D., Gedney, N., Gray, L. J., Hewitt, H. T., Hobson, M., Huddleston, M. R., Hughes, J., Ineson, S., Ingram, W. J., James, P. M., Johns, T. C., Johnson, C. E., Jones, A., Jones, C. P., Joshi, M. M., Keen, A. B., Liddicoat, S., Lock, A. P., Maidens, A. V., Manners, J. C., Milton, S. F., Rae, J. G. L., Ridley, J. K., Sellar, A., Senior, C. A., Totterdell, I. J., Verhoef, A., Vidale, P. L., and Wiltshire, A.: The HadGEM2 family of Met Office Unified Model climate configurations, Geosci. Model Dev., 4, 723–757, https://doi.org/10.5194/gmd-4-723-2011, 2011.
Tian, H., Chen, G., Liu, M., Zhang, C., Sun, G., Lu, C., Xu, X., Ren, W., Pan, S., and Chappelka, A.: Model estimates of net primary productivity, evapotranspiration, and water use efficiency in the terrestrial ecosystems of the southern United States during 1895–2007, Forest Ecol. Manage., 259, 1311–1327, https://doi.org/10.1016/j.foreco.2009.10.009, 2010.
Tuzet, A., Perrier, A., and Leuning, R.: A coupled model of stomatal conductance, photosynthesis and transpiration, Plant Cell Environ., 26, 1097–1116, https://doi.org/10.1046/j.1365-3040.2003.01035.x, 2003.
Tyree, M. T. and Sperry, J. S.: Vulnerability of Xylem to Cavitation and Embolism, Annu. Rev. Plant Phys., 40, 19–36, https://doi.org/10.1146/annurev.pp.40.060189.000315, 1989.
Ukkola, A. M., De Kauwe, M. G., Roderick, M. L., Abramowitz, G., and Pitman, A. J.: Robust Future Changes in Meteorological Drought in CMIP6 Projections Despite Uncertainty in Precipitation, Geophys. Res. Lett., 47, e2020GL087820, https://doi.org/10.1029/2020GL087820, 2020.
Ukkola, A. M., De Kauwe, M. G., Pitman, A. J., Best, M. J., Abramowitz, G., Haverd, V., Decker, M., and Haughton, N.: Land surface models systematically overestimate the intensity, duration and magnitude of seasonal-scale evaporative droughts, Environ. Res. Lett., 11, 104012, https://doi.org/10.1088/1748-9326/11/10/104012, 2016.
Van den Hoof, C., Vidale, P. L., Verhoef, A., and Vincke, C.: Improved evaporative flux partitioning and carbon flux in the land surface model JULES: Impact on the simulation of land surface processes in temperate Europe, Agr. Forest Meteorol., 181, 108–124, https://doi.org/10.1016/j.agrformet.2013.07.011, 2013.
Verhoef, A. and Egea, G.: Modeling plant transpiration under limited soil water: Comparison of different plant and soil hydraulic parameterizations and preliminary implications for their use in land surface models, Agr. Forest Meteorol., 191, 22–32, https://doi.org/10.1016/j.agrformet.2014.02.009, 2014.
von Randow, C., Zeri, M., Restrepo-Coupe, N., Muza, M. N., de Gonçalves, L. G. G., Costa, M. H., Araujo, A. C., Manzi, A. O., da Rocha, H. R., Saleska, S. R., Arain, M. A., Baker, I. T., Cestaro, B. P., Christoffersen, B., Ciais, P., Fisher, J. B., Galbraith, D., Guan, X., van den Hurk, B., Ichii, K., Imbuzeiro, H., Jain, A., Levine, N., Miguez-Macho, G., Poulter, B., Roberti, D. R., Sahoo, A., Schaefer, K., Shi, M., Tian, H., Verbeeck, H., and Yang, Z.-L.: Inter-annual variability of carbon and water fluxes in Amazonian forest, Cerrado and pasture sites, as simulated by terrestrial biosphere models, Agr. Forest Meteorol., 182–183, 145–155, https://doi.org/10.1016/j.agrformet.2013.05.015, 2013.
Wang, K. and Dickinson, R. E.: A review of global terrestrial evapotranspiration: Observation, modeling, climatology, and climatic variability, Rev. Geophys., 50, RG2005, https://doi.org/10.1029/2011RG000373, 2012.
Wang, Y., Xie, Z., and Jia, B.: Incorporation of a dynamic root distribution into CLM4.5: Evaluation of carbon and water fluxes over the Amazon, Adv. Atmos. Sci., 33, 1047–1060, https://doi.org/10.1007/s00376-016-5226-8, 2016.
Williams, K.: JULES branch for soil moisture stress JPEG evaluation paper [code], Met Office Science Repository Service, available at: https://code.metoffice.gov.uk/trac/jules/browser/main/branches/dev/karinawilliams/r9227_add_gpp_unstressed_diagnostic (last access: 13 April 2021), 2020.
Williams, K., Gornall, J., Harper, A., Wiltshire, A., Hemming, D., Quaife, T., Arkebauer, T., and Scoby, D.: Evaluation of JULES-crop performance against site observations of irrigated maize from Mead, Nebraska, Geosci. Model Dev., 10, 1291–1320, https://doi.org/10.5194/gmd-10-1291-2017, 2017.
Williams, K., Harper, A. B., McGuire, P., Duran Rojas, C., and Otu-Larbi, F.: JULES suite for FLUXNET2015 and LBA sites, Met Office Science Repository Service [code], available at: https://code.metoffice.gov.uk/trac/roses-u/browser/a/l/7/5/2/u-al752-jpegpaper?rev=168493 (last access: 13 April 2021), 2020.
Williams, M., Rastetter, E. B., Fernandes, D. N., Goulden, M. L., Wofsy, S. C., Shaver, G. R., Melillo, J. M., Munger, J. W., Fan, S. M., and Nadelhoffer, K. J.: Modelling the soil-plant-atmosphere continuum in a Quercus–Acer stand at Harvard Forest: the regulation of stomatal conductance by light, nitrogen and soil/plant hydraulic properties, Plant Cell Environ., 19, 911–927, https://doi.org/10.1111/j.1365-3040.1996.tb00456.x, 1996.
Wolfe, B. T., Sperry, J. S., and Kursar, T. A.: Does leaf shedding protect stems from cavitation during seasonal droughts? A test of the hydraulic fuse hypothesis, New Phytol., 212, 1007–1018, 2016.
Wu, J., Serbin, S. P., Xu, X., Albert, L. P., Chen, M., Meng, R., Saleska, S. R., and Rogers, A.: The phenology of leaf quality and its within-canopy variation is essential for accurate modeling of photosynthesis in tropical evergreen forests, Glob. Change Biol., 23, 4814–4827, https://doi.org/10.1111/gcb.13725, 2017.
Wu, J., Albert, L. P., Lopes, A. P., Restrepo-Coupe, N., Hayek, M., Wiedemann, K. T., Guan, K., Stark, S. C., Christoffersen, B., Prohaska, N., Tavares, J. V., Marostica, S., Kobayashi, H., Ferreira, M. L., Campos, K. S., da Silva, R., Brando, P. M., Dye, D. G., Huxman, T. E., Huete, A. R., Nelson, B. W., and Saleska, S. R.: Leaf development and demography explain photosynthetic seasonality in Amazon evergreen forests, Science, 351, 972–976, https://doi.org/10.1126/science.aad5068, 2016.
Zeng, X.: Global Vegetation Root Distribution for Land Modeling, J. Hydrometeorol., 2, 525–530, https://doi.org/10.1175/1525-7541(2001)002<0525:GVRDFL>2.0.CO;2, 2001.
Zeri, M., Sá, L. D. A., Manzi, A. O., Araújo, A. C., Aguiar, R. G., von Randow, C., Sampaio, G., Cardoso, F. L., and Nobre, C. A.: Variability of Carbon and Water Fluxes Following Climate Extremes over a Tropical Forest in Southwestern Amazonia, PLOS ONE, 9, e88130, https://doi.org/10.1371/journal.pone.0088130, 2014.
Zhou, S., Duursma, R. A., Medlyn, B. E., Kelly, J. W. G., and Prentice, I. C.: How should we model plant responses to drought? An analysis of stomatal and non-stomatal responses to water stress, Agr. Forest Meteorol., 182–183, 204–214, https://doi.org/10.1016/j.agrformet.2013.05.009, 2013.