the Creative Commons Attribution 4.0 License.
the Creative Commons Attribution 4.0 License.
 | 17 Mar 2021
Sensitivity of surface solar radiation to aerosol–radiation and aerosol–cloud interactions over Europe in WRFv3.6.1 climatic runs with fully interactive aerosols
Laura Palacios-Peña
Claudia Gutiérrez
Pedro Jiménez-Guerrero
Jose María López-Romero
Enrique Pravia-Sarabia
Juan Pedro Montávez
The amount of solar radiation reaching the Earth's surface can be highly determined by atmospheric aerosols, which have been pointed to as the most uncertain climate forcing agents through their direct (scattering and absorption), semi-direct (absorption implying a thermodynamic effect on clouds) and indirect (modification of cloud properties when aerosols act as cloud condensation nuclei) effects. Nonetheless, regional climate models hardly ever dynamically model the atmospheric concentration of aerosols and their interactions with radiation (ARIs) and clouds (ACIs). The objective of this work is to evince the role of modeling ARIs and ACIs in Weather Research and Forecast (WRF) model simulations with fully interactive aerosols (online resolved concentrations) with a focus on summer mean surface downward solar radiation (RSDS) over Europe. Under historical conditions (1991–2010), both ARIs and ACIs reduce RSDS by a few percentage points over central and northern regions. This reduction is larger when only ARIs are resolved, while ACIs counteract the effect of the former by up to half. The response of RSDS to the activation of ARIs and ACIs is mainly led by the aerosol effect on cloud coverage, while the aerosol effect on atmospheric optical depth plays a very minor role, which evinces the importance of semi-direct and indirect aerosol effects. In fact, differences in RSDS among experiments with and without aerosols are smaller under clear-sky conditions. In terms of future projections (2031–2050 vs. 1991–2010), the baseline pattern (from an experiment without aerosols) shows positive signals southward and negative signals northward. While ARIs enhance the former and reduce the latter, ACIs work in the opposite direction and provide a flatter RSDS change pattern, further evincing the opposite impact from semi-direct and indirect effects and the nontrivial influence of the latter.
- Article
(14677 KB) - Full-text XML
-
Supplement
(10071 KB) - BibTeX
- EndNote


Regional climate models (RCMs) are powerful tools providing high-resolution climate information by dynamically downscaling coarser datasets, e.g., from global circulation models (GCMs). Their added value comes not only from the increased resolution, but also from the fact that such an increased resolution allows modeling and considering fine-scale processes and features that are missed or misrepresented otherwise, e.g., local circulations and land uses (Rummukainen, 2010; Jacob et al., 2014, 2020; Schewe et al., 2019). Still, certain phenomena need to be parameterized, e.g., the turbulence within the planetary boundary layer, microphysics processes and convective phenomena. However, there are relevant processes that GCMs usually model dynamically but which are not usually included in RCM runs. This is the case of the atmospheric aerosol concentration and the multiple nonlinear interactions of aerosols (e.g., Taylor et al., 2012 vs. Ruti et al., 2016), the so-called aerosol–radiation and aerosol–cloud interactions (ARIs and ACIs, respectively; Boucher, 2015).
Depending on their nature and the ambient conditions, aerosols can act to scatter and/or absorb solar radiation through ARIs, which may result in less or more solar radiation reaching the surface through direct and semi-direct effects. Direct effects might involve less solar radiation reaching the surface due to its scattering and absorption (Giorgi et al., 2002; Nabat et al., 2015a; Li et al., 2017; Kinne, 2019) or more if, for instance, absorption warms aloft atmospheric layers, thereby leading to more stable atmospheric situations (lower surface temperatures than upward) and thus to the inhibition of cloud formation via convective phenomena (Giorgi et al., 2002; Nabat et al., 2015a). Absorption itself can also lead to cloud inhibition and/or burn-off through thermodynamic effects, i.e., by heating the air (semi-direct effects), thus increasing the amount of solar radiation reaching the surface (Allen and Sherwood, 2010). Aerosols also act as cloud condensation nuclei (indirect effect or ACIs), which may also result in less or more solar radiation reaching the surface. An abundance of cloud condensation nuclei rebounds on enhanced scattering via whitened clouds of smaller drops with an increased size and lifetime, as well as on drizzle suppression, which reduces below-cloud wet deposition processes (Seinfeld et al., 2016; Kinne, 2019). In contrast, in-cloud aerosol scavenging processes lead to out-of-cloud cleaner atmospheres (Croft et al., 2012). All these processes can potentially alter local and regional circulations, therefore having an impact beyond the radiative balance (Kloster et al., 2010; Wilcox et al., 2013; Nabat et al., 2014; Wang et al., 2016; Pavlidis et al., 2020).
In the current context of climate crisis, the scientific challenge is twofold: (1) to gain a good understanding of the processes that occur in the atmosphere and of what will occur in the future because this is crucial (IPCC, 2013) in order (2) to advance effective measures at both global and regional scales (IPCC, 2014). In particular, climate change mitigation strategies require low-carbon energies to grow rapidly in the coming decades (Rohrig et al., 2019; IRENA, 2019). This rapid transition of the energy sector towards renewably powered decarbonized systems makes energy production, transmission and distribution increasingly sensitive to weather and climate variability (Bloomfield et al., 2016; Collins et al., 2018; Jerez et al., 2019). Thus, several works have been devoted to assessing this issue through the use of climate modeling tools. In particular, for the solar resource, Crook et al. (2011), Gaetani et al. (2014), Wild et al. (2015) and Müller et al. (2019) showed a generalized increase in Europe by making use of GCM simulations, while Jerez et al. (2015), Gil et al. (2019) and Tobin et al. (2018) reported a different behavior, with RCM simulations projecting a slight general decrease in the amount of solar radiation reaching the surface over Europe.
From the previous literature, we point out three key features that motivated the present work. The first is the increasing use of RCMs to evaluate renewable energy resources and their supply potential (e.g., Jerez et al., 2013, 2015, 2019; Gil et al., 2019; Soares et al., 2019; van der Wiel et al., 2019). The second is the key role of aerosols regarding the accuracy of the simulated solar resource by climate models (Gaetani et al., 2014; Nabat et al., 2015b; Pavlidis et al., 2020), particularly attributed to their direct and semi-direct effects, which would help to explain the aforementioned discrepancy between GCM and RCM future projections (Boé et al., 2020; Gutiérrez et al., 2020). Third, none of the previous studies have so far dealt with the non-evident RCM sensitivity to interactively modeled atmospheric aerosol concentrations and the resulting aerosol–radiation and aerosol–cloud interactions in order to simulate the solar resource under historical and future climate scenarios.
Hence, our objective here is to shed light on the third point above by assessing the sensitivity of long-term RCM simulations to the inclusion of ARIs and ACIs using fully interactive (online diagnosed) aerosols. For this, we made use of a widely applied RCM, the Weather Research and Forecasting (WRF) model (Skamarock et al., 2008), and its coupled form with Chemistry (WRF-Chem; Grell et al., 2005) to perform sets of historical (period 1991–2010) and future (period 2031–2050) simulations over Europe in three ways: (1) without including atmospheric aerosols, (2) with dynamic aerosols and aerosol–radiation interactions activated, and (3) with dynamic aerosols and both aerosol–radiation and aerosol–cloud interactions activated.
Section 2 describes the experiments and methods, Sect. 3 presents the results, and the discussion and conclusions are provided in Sect. 4.
2.1 General description of the WRF simulations
We performed three experiments using the WRF model version 3.6.1 (Skamarock et al., 2008; available at https://www.mmm.ucar.edu/weather-research-and-forecasting-model, last access: 11 March 2021). In all cases, the simulated periods were 1991–2010 (historical) and 2031–2050 (future). Initial and boundary conditions were taken from GCM simulations: the r1i1p1 MPI-ESM-LR historical and RCP8.5-forced runs (Giorgetta et al., 2012a, b; available at https://cera-www.dkrz.de, last access: 11 March 2021) from the Coupled Model Intercomparison Project Phase 5 (CMIP5; https://pcmdi.llnl.gov/mips/cmip5/, last access: 11 March 2021; Taylor et al., 2012). The Representative Concentration Pathway (RCP) 8.5 (Moss et al., 2010) depicts the highest radiative forcing along the 21st century among all RCPs, with doubled CO2, CH4 and N2O concentrations by 2050 compared to the last record of the historical period. Both the observed (past) and estimated (future) temporal evolution of the concentration of these species was appropriately considered in the WRF executions (Jerez et al., 2018).
The three experiments are described in the following.
-
BASE. Aerosols are not considered in the simulations. No aerosol climatology is used, and no aerosol interactions are taken into account by the model. WRF alone considers a constant number of cloud condensation nuclei (250 per cm3, set in the model by default) to enable the formation of clouds.
-
ARIs. Aerosols are estimated online and aerosol–radiation interactions are activated in the model (both direct and semi-direct effects are included in the simulations).
-
ARCI. Aerosols are estimated online and both aerosol–radiation and aerosol–cloud interactions are activated in the model (direct, semi-direct and indirect effects are included in the simulations).
The WRF spatial configuration consisted of two one-way nested domains (Supplement Fig. S1). The inner one (target domain) is a EURO-CORDEX-compliant (https://www.euro-cordex.net/, last access: 11 March 2021; Jacob et al., 2014, 2020) domain covering Europe with a horizontal resolution of 0.44∘ in latitude and longitude. The outer one has a horizontal resolution of 1.32∘ and covers the most important areas of Saharan dust emissions, as in Palacios-Peña et al. (2019). This configuration was necessary to generate and include the information on Saharan dust intrusions through the boundaries of our target domain for the ARI and ARCI experiments because the boundary conditions from the GCM do not provide this information. In the vertical dimension, 29 unevenly spaced eta levels were specified in the two domains, with more levels near the surface than upward, and the model top was set to 50 hPa. The physics configuration of the WRF model consisted of the Lin microphysics scheme (Lin et al., 1983), the RRTM longwave and shortwave radiative scheme (Iacono et al., 2008), the Grell 3D ensemble cumulus scheme (Grell, 1993; Grell and Dévényi, 2002), the University of Yonsei boundary layer scheme (Hong et al., 2006), and the Noah land surface model (Chen and Dudhia, 2001; Tewari et al., 2004). Boundary conditions from the GCM were updated every 6 h, including the low boundary condition for the sea surface temperature. Nudging was applied to the outer domain but not to the target domain.
2.2 Including aerosols in WRF
To perform the ARI and ARCI experiments, we used the WRF model coupled with Chemistry (WRF-Chem) version 3.6.1 (Grell et al., 2005; Chin et al., 2002). WRF-Chem runs with the GOCART aerosol module (Ginoux et al., 2001). This scheme includes five species, namely sulfate, mineral dust, sea salt aerosol, organic matter and black carbon, and was coupled with RACM–KPP (KPP: kinetics preprocessor; Stockwell et al., 1997; Geiger et al., 2003) as the chemistry option. Chemical reactions in the GOCART model include several oxidation processes by the three main oxidants in the troposphere: OH, NO3 and O3. The OH radical dominates oxidation during the daytime, but at night its concentration drops and NO3 becomes the primary oxidant (Archer-Nicholls et al., 2014). So, the oxidation pathways represented in GOCART include (a) dimethyl sulfide (DMS) oxidation by the hydroxyl radical (OH) during the day to form sulfur dioxide (SO2) and methanesulfonic acid (MSA), (b) oxidation by nitrate radicals (NO3) at night to form SO2, and (c) SO2 oxidation by OH in air and by H2O2 and tropospheric ozone (O3) in clouds (aqueous chemistry) to form sulfate (Chin et al., 2000). Henceforth, the skillful characterization of gas-phase radicals such as OH and NO3 or compounds like O3 is essential for the representation of oxidation pathways in the atmosphere leading to the formation of secondary aerosols (Jiménez et al., 2003). Therefore, in this contribution the RACM (Stockwell et al., 1997; Geiger et al., 2003) mechanism was coupled to GOCART through the kinetics preprocessor (KPP) in WRF-Chem in order to provide the concentrations of radical and gas-phase pollutants needed by the GOCART aerosol model. The Fast-J module (Wild et al., 2000) was used as the photolysis option. Biogenic emissions were calculated using the Guenther scheme (Guenther et al., 2006). Anthropogenic emissions from the Atmospheric Chemistry and Climate Model Intercomparison Project (ACCMIP; Lamarque et al., 2010) were kept unchanged in the simulation periods (we considered the 2010 monthly values). Natural emissions depend on ambient conditions and varied accordingly in our simulations following Ginoux et al. (2001) for dust and Chin et al. (2002) for sea salt.
The inclusion of aerosol–radiation interactions in the ARI simulations follows Fast et al. (2006) and Chapman et al. (2009). The overall refractive index for a given size bin was determined by volume averaging and associating each chemical constituent of aerosol with a complex index of refraction. The Mie theory and a summation over all size bins were used to determine the composite aerosol optical properties assuming wet particle diameters, taking into account the humidity variations to allow variations of optical properties. Finally, aerosol optical properties were transferred to the shortwave radiation scheme. Aerosol–cloud interactions were implemented by linking the simulated cloud droplet number with the microphysics schemes (Chapman et al., 2009), affecting both the calculated droplet mean radius and the cloud optical depth. Although this WRF-Chem version (3.6.1) does not allow a full coupling with aerosol–cloud interactions that includes the aerosols exerting the highest influence from a climatic point of view, i.e., sea salt and desert dust, the microphysics scheme implemented here is a modified version of a single-moment scheme that turns it into a two-moment scheme in the simulations denoted ARCI. One-moment microphysical schemes are unsuitable for assessing aerosol–cloud interactions as they only predict the mass of cloud droplets and do not represent the number or concentration of cloud droplets (Li et al., 2008). The prediction of two moments provides a more robust treatment of the particle size distributions, which is key for computing the microphysical process rates and cloud–precipitation evolution. In this sense, although the Lin microphysics scheme is originally presented as a single-moment scheme (Lin et al., 1983), a modified Lin double-moment microphysical scheme is implemented in WRF-Chem (Lin et al., 2008) and used here to conduct the ARCI simulations. In this scheme, both the mass and the total number of cloud droplets are predicted. The prognostic treatment of cloud droplet number involves water vapor, cloud water, rain, cloud ice, snow and graupel (Ghan et al., 1997), and it is activated through the “mixactivate” module of WRF-Chem. In that module, WRF-Chem calculates the aerosol number per volume concentration by using, for each aerosol type, information about the size (the mean volume diameter of each aerosol mode, obtained from the aerosol mechanism implemented in the simulation), fixed densities and molecular weight of each type of aerosol. With all this information and the total mass, WRF-Chem estimates the aerosol number for each mode, assuming spherical particles. The autoconversion of cloud droplets to rain droplets depends on the droplet number (Liu et al., 2005). Droplet number nucleation and (complete) evaporation rates correspond to the aerosol activation and resuspension rates. Ice nuclei based on predicted particulates are not treated. However, ice clouds are included via the prescribed ice nuclei distribution, following the Lin et al. (2008) scheme. Thus, the droplet number will affect both the calculated droplet mean radius and cloud optical depth. Finally, the interactions of clouds and incoming solar radiation were implemented by linking the simulated cloud droplet number with the Goddard shortwave radiation scheme, representing the first indirect effect (i.e., increase in droplet number associated with increases in aerosols), and with the Lin microphysics, representing the second indirect effect (i.e., decrease in precipitation efficiency associated with increases in aerosols).
An important aspect of the differences in the model setup between experiments is that the autoconversion scheme necessarily changes in the ARCI simulations compared to the model configuration used for the ARI and BASE simulations. The flag progn of the WRF namelist should be set to 0 for running ARI experiments in order to keep the interaction of online-estimated aerosols with cloud microphysics disabled. Conversely, progn should be set to 1 for running ARCI experiments in order to feed the cloud microphysics scheme with the online-estimated number and physicochemical properties of aerosols (this effectively turns the Lin scheme into a second-moment microphysical scheme).
2.3 Data and methods
The WRF and WRF-Chem outputs were recorded every hour for surface downward solar radiation (RSDS), total cloud cover (CCT) and the concentrations of various aerosol species (dust, black carbon, organic carbon and sea salt). The concentration of sulfates was indirectly computed from the recorded concentrations of SO2 and OH using the same kinetic reaction implemented in the RACM–KPP module. From the concentrations of the five aerosol species, the atmospheric optical depth (AOD) at 550 nm was estimated using the reconstructed mass extinction method (Malm et al., 1994), as in Palacios-Peña et al. (2020). The RSDS and CCT data simulated by the driving GCM runs were used for comparison purposes. We also retrieved the AOD at 550 nm as seen by the GCM from the MACv2 data (Kinne et al., 2019), whose anthropogenic changes are in accordance with RCP8.5, while its coarse mode (of natural origin) was not allowed to change. Also, RSDS values from the ERA5 reanalysis (Hersbach et al., 2020) were used for validation purposes. Seasonal means of all the variables were used in the analysis. These means involve all the records within each season in the series.
We also studied the sensitivity to resolving aerosol interactions of RSDS and AOD under clear-sky conditions. The analysis in the absence of cloudiness will tell us more about the relevance of the direct radiative effect of aerosols. RSDS and AOD clear-sky (RSDScs and AODcs, respectively) mean seasonal series were constructed as follows. First, hourly series of CCT, RSDS and AOD were time-averaged up to the daily timescale. Second, days with CCT values lower than 1 % were retained (this criterion is applied at the grid box level for each grid box individually); otherwise, we put in a missing value. These clear-sky daily series were then time-averaged up to the seasonal timescale. When pairs of experiments were compared, only coincident clear-sky dates (days) in the series were selected (missing values were also assigned in this case to the non-coincident dates with clear-sky conditions) before performing the seasonal time average. This restriction aims to avoid the masking effect of Earth-orbit-related issues, large-scale climate drivers and/or local forcings such as water vapor content, since different days may have different daytime lengths and different atmospheric compositions (different atmospheric optical depth or atmospheric transmissivity) that may mask the AOD effect under clear-sky conditions. The analysis involving RSDScs and AODcs was carried out only over grid points for which at least 75 % of the summer mean values in the series (i.e., at least 15 records per period) were not missing (which, according to our methodology, would occur only if all days within a summer season had CTT values ≥ 1 %).
Spatial correlations between climatological patterns were computed excluding sea grid points, considering absolute values in the case that they involved differences (while these were depicted in the figures in relative terms, i.e., in percent), using the CDO fldcor function (https://code.mpimet.mpg.de/projects/cdo/embedded/cdo.pdf, last access: 11 March 2021). Temporal correlations were computed at the grid point level between the seasonal series, considering absolute values in the case that they involved differences, using the R cor function (https://www.rdocumentation.org/packages/stats/versions/3.6.2/topics/cor, last access: 11 March 2021; Pearson correlation coefficient selected). The statistical significance of any signal was assessed with a t test imposing p<0.05.
We focus on the summer season (JJA) when solar energy is at its maximum, AOD typically reaches high values and the aerosol radiative effect has been proven to be strongest (Pavlidis et al., 2020).
In order to investigate the underlying mechanisms explaining the signals found in RSDS and CCT, additional variables and statistics were used, namely JJA mean top-of-the-atmosphere outgoing shortwave radiation (RSOT), surface (2 m height) air temperature (TAS), surface (1000 hPa pressure level) relative humidity (RH), total precipitation (PR), convective precipitation (PRC), the number of cloudy days (CLD, defined as days with mean CCT > 75 %) in the summer series, the 90th percentile of the JJA daily mean PR series, and the number of rainy days (RD, defined as days with mean precipitation > 1 mm) in the JJA daily PR series. Vertical profiles of air temperature (T) and cloud fraction (CLFR) were also considered.
3.1 Historical patterns
3.1.1 Brief validation of the simulated RSDS patterns
As a first test, Supplement Fig. S2 provides the GCM, ERA5 BASE, ARI and ARCI JJA climatologies of RSDS in the historical period and the results of a brief validation exercise. Although the five patterns depict similar structures (Fig. S2a, b, d–f), Fig. S2g–i reveal significant deviations of the climatologies from the WRF experiments with respect to the GCM: positive values (higher RSDS values in the RCM experiments) south and northward (up to 20 % and 30 %, respectively) and negative values in between (10 %–15 %, eventually up to 25 %). These differences are very similar to those obtained when WRF climatologies are compared with the ERA5 pattern (Fig. S2j–l), with a notable exception over the Scandinavian region where the agreement between the WRF experiments and ERA5 is higher than between the WRF experiments and the GCM. In fact, the GCM pattern strongly underestimates RSDS over such a region (over 30 %; Fig. S2c), while it shows better agreement with ERA5 elsewhere compared to the WRF simulations.
3.1.2 Aerosols impact on the simulated RSDS patterns
Although the three WRF experiments (BASE, ARI and ARCI) perform similarly when compared to the GCM or ERA5, there are still noticeable differences between them (Figs. 1a–c and S3a–c), and it is there that this research focuses. The inclusion of aerosols (ARI and ARCI experiments) reduces the JJA mean values of RSDS in the central and northern parts of our domain by a few percentage points (i.e., by ∼ 10 W m−2) compared to the BASE experiment (Figs. 1a, b and S3a–b). This reduction is generally stronger in ARI than in ARCI. Consequently, the ARCI minus ARI pattern (Figs. 1c and S3c) depicts mostly positive values (by ∼ 5 W m−2) over the central and southern regions. This result indicates that indirect aerosol effects tend to counteract the joint direct and semi-direct effects seen in the ARI minus BASE pattern, reducing them by up to half over most of the domain, which is in agreement with previously reported findings (Pavlidis et al., 2020).
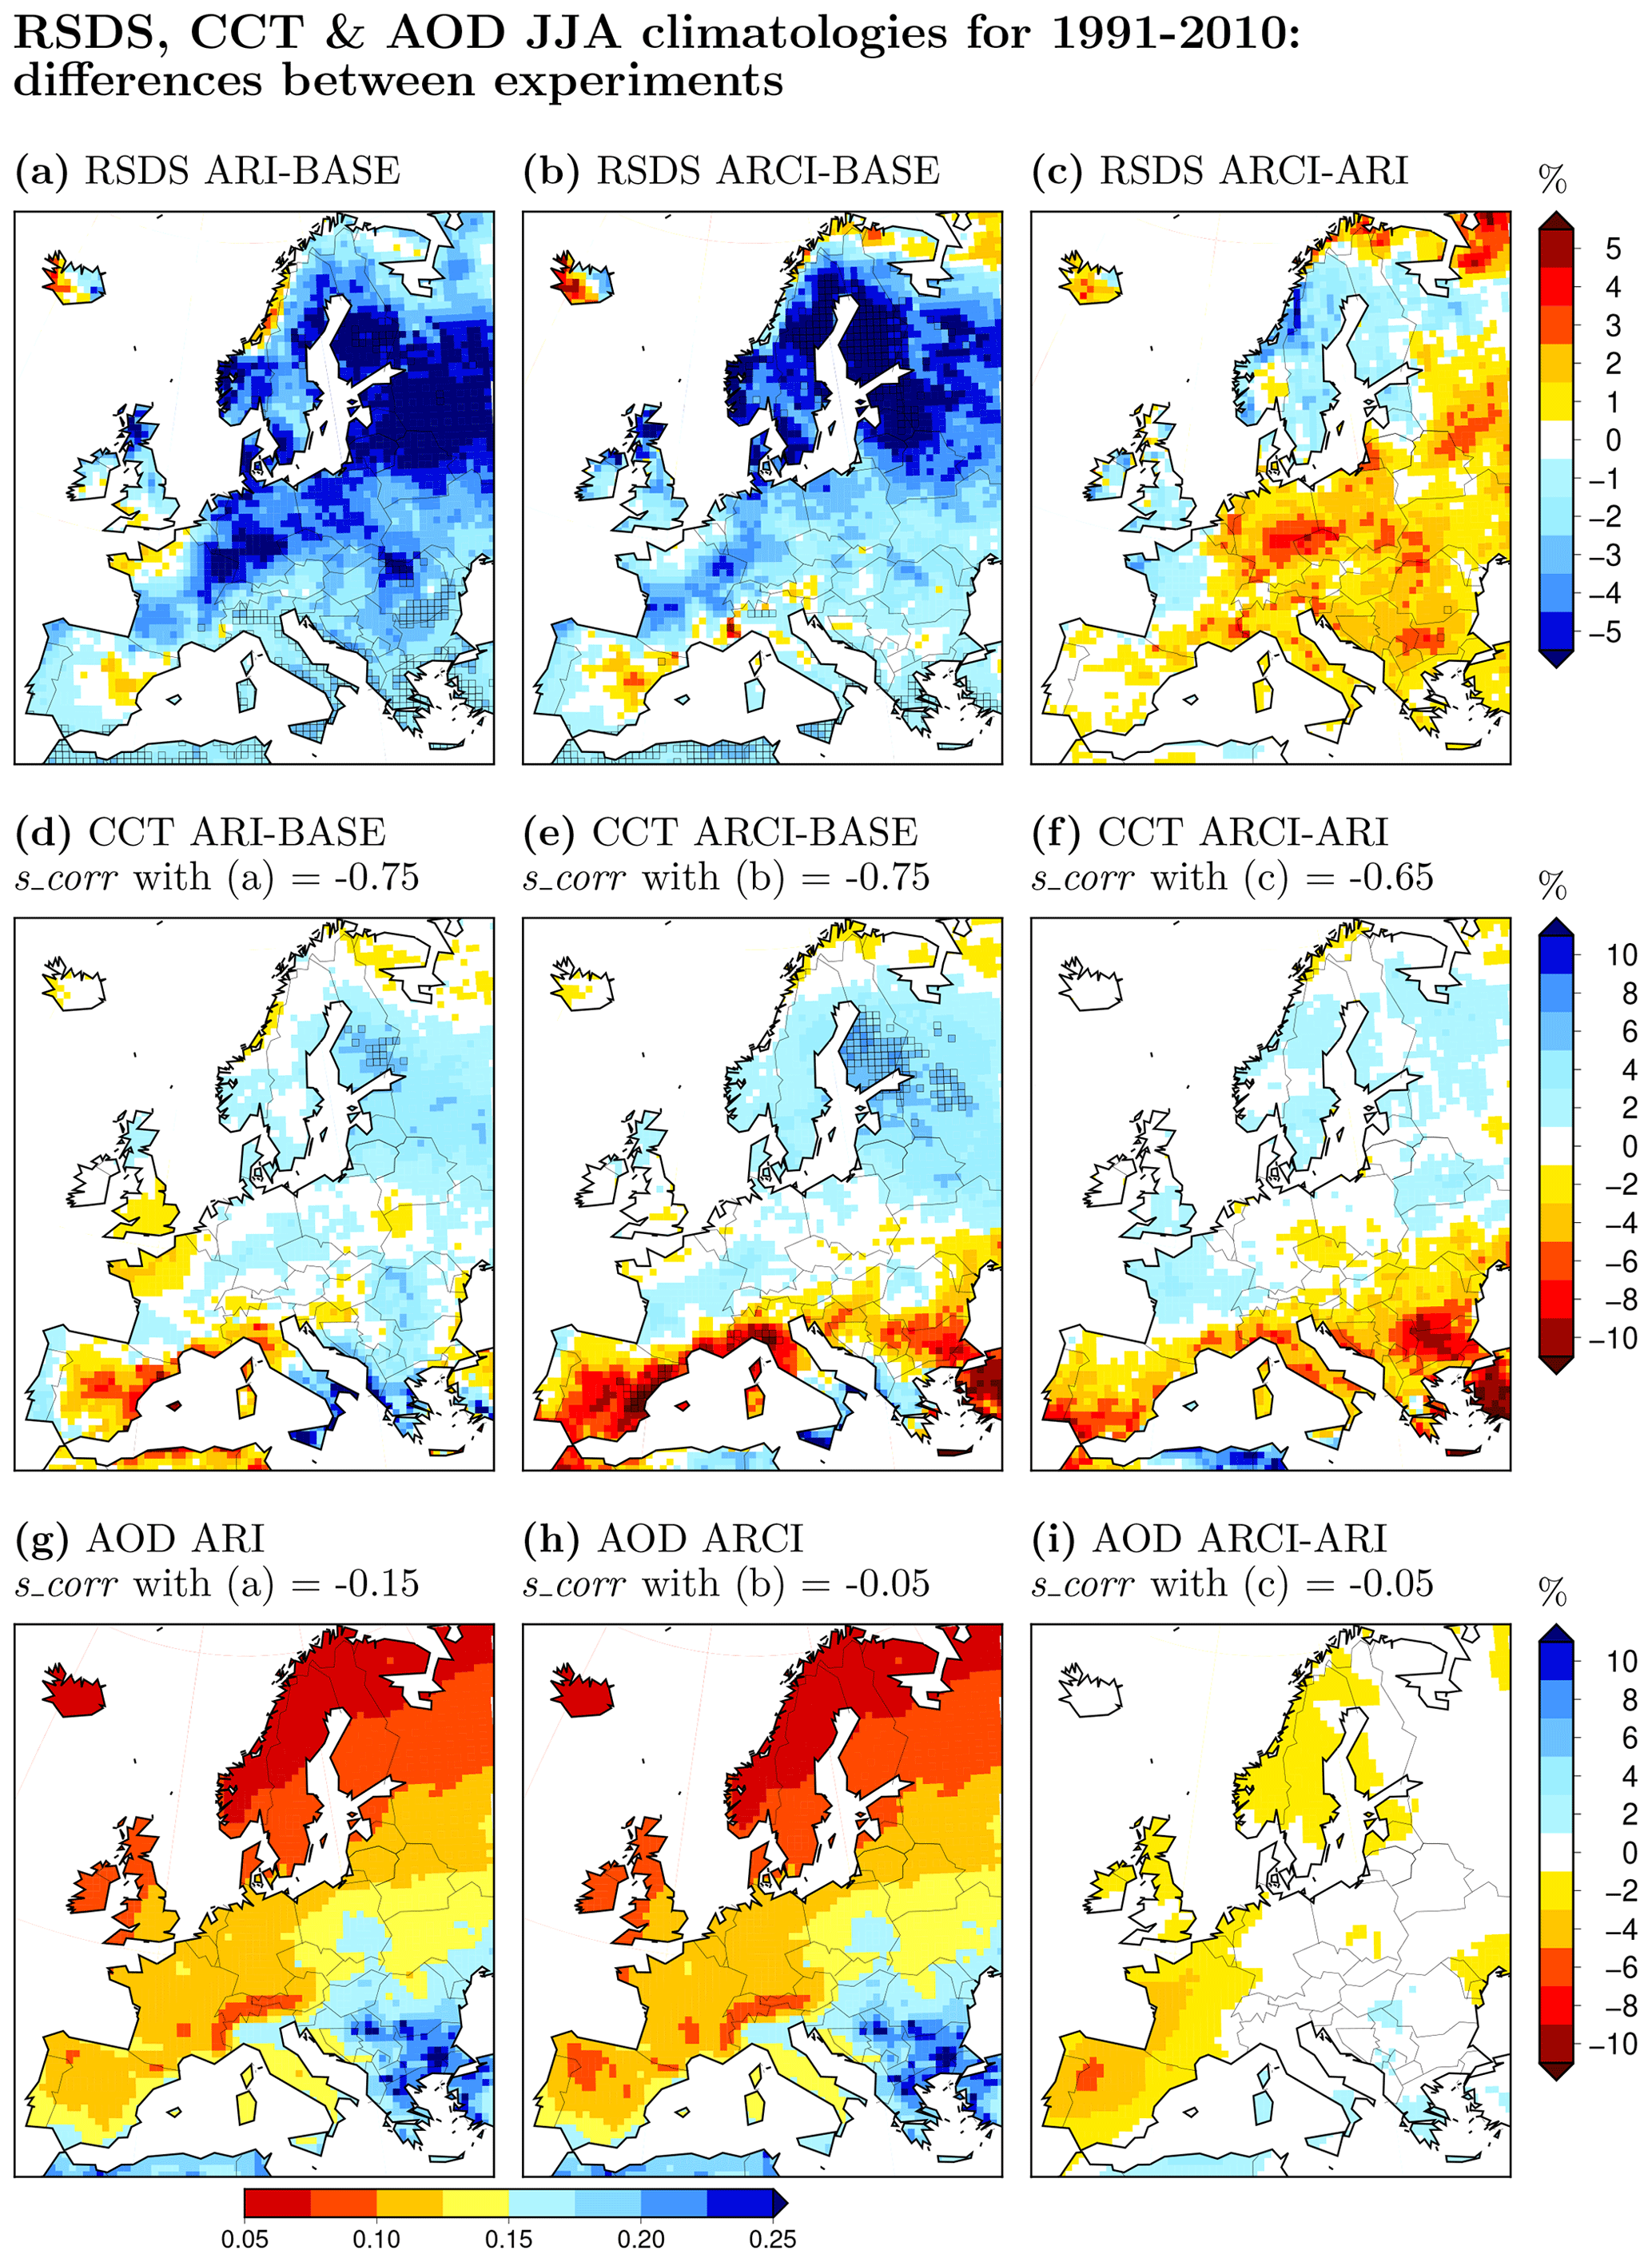
Figure 1Relative differences between the WRF simulations in the RSDS (a–c), CCT (d–f) and AOD (at 550 nm) (g–i) summer (JJA) climatologies in the historical period (1991–2010); squared if statistically significant (p<0.05; units: percent). Note that panels (g) and (h) refer to the horizontal color bar just below them and simply represent the AOD summer climatologies in ARI and ARCI, respectively. Spatial correlations (s_corr) between the patterns in the second and third rows and the respective patterns in the first row are indicated in the headers.
In order to better understand the patterns of differences in RSDS between experiments, Fig. 1 (and Fig. S3) also provides differences in CCT and AOD (panels d to f and g to i, respectively) as well as the spatial correlations (s_corr) between these patterns and those of RSDS differences.
3.1.3 The role of CCT
Compared to BASE, both ARI and ARCI lead to more cloudiness in the central and northern regions (although with only slight increases well below 5 %). This could be a response to the direct effect of the scattering of solar radiation due to the high presence of sea salt, dust and sulfate over these areas (Fig. 2), as an increase in RSOT over these areas is also seen in both ARI and ARCI simulations (Fig. 3a–b). In addition, this direct effect could be triggering the following feedback mechanism: the cooling effect downward (whereby less solar radiation is received because of its scattering) cools down surface temperatures (Fig. 3d–e), thus increasing relative humidity (Fig. 3g–h), which may favor the formation of clouds (these should be non-convective, mostly low-level clouds as the decrease in TAS leads to more stable atmospheric layers; Fig. 4a, b). Thus, less radiation reaches the surface, and thus there are lower surface temperatures and so on. It is noteworthy that both the reduction in RSDS and the accompanying increase in RSOT are more marked in ARI than in ARCI over the central regions (Figs. 1c and 3c), where the indirect effects included in the ARCI simulation, such as in-cloud aerosol scavenging processes, could lead to cleaner atmospheres than ARI simulates.
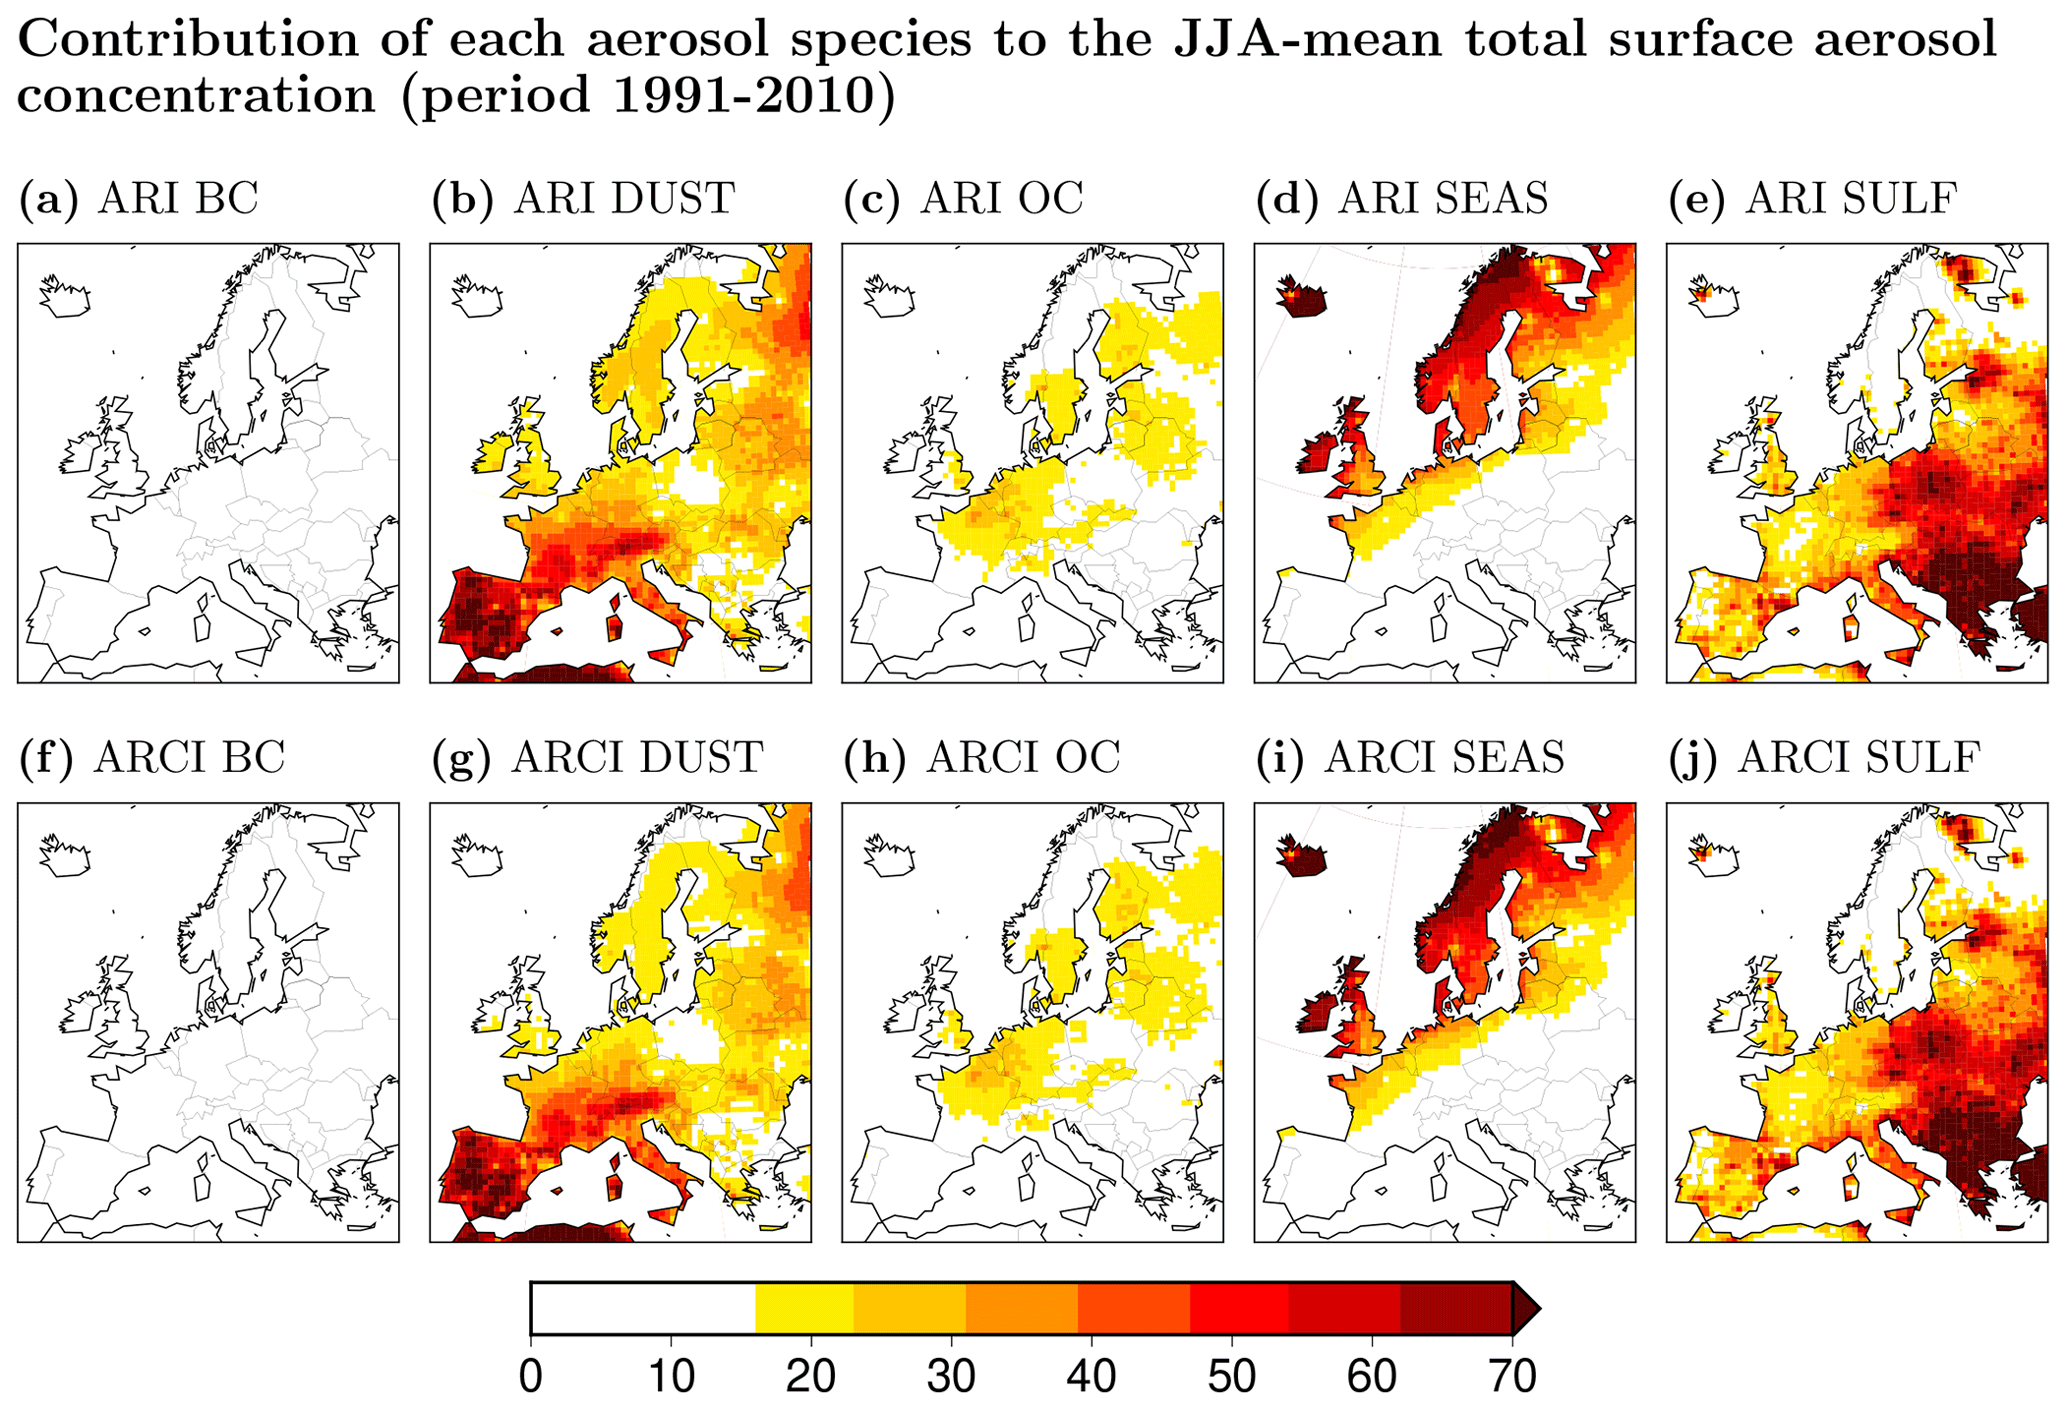
Figure 2Contribution of each aerosol species (BC: black carbon, DUST and OC: organic carbon, SEAS: sea salt, SULF: sulfate) to the JJA mean total surface aerosol mass concentration in ARI and ARCI simulations in the period 1991–2010. Units: percent.
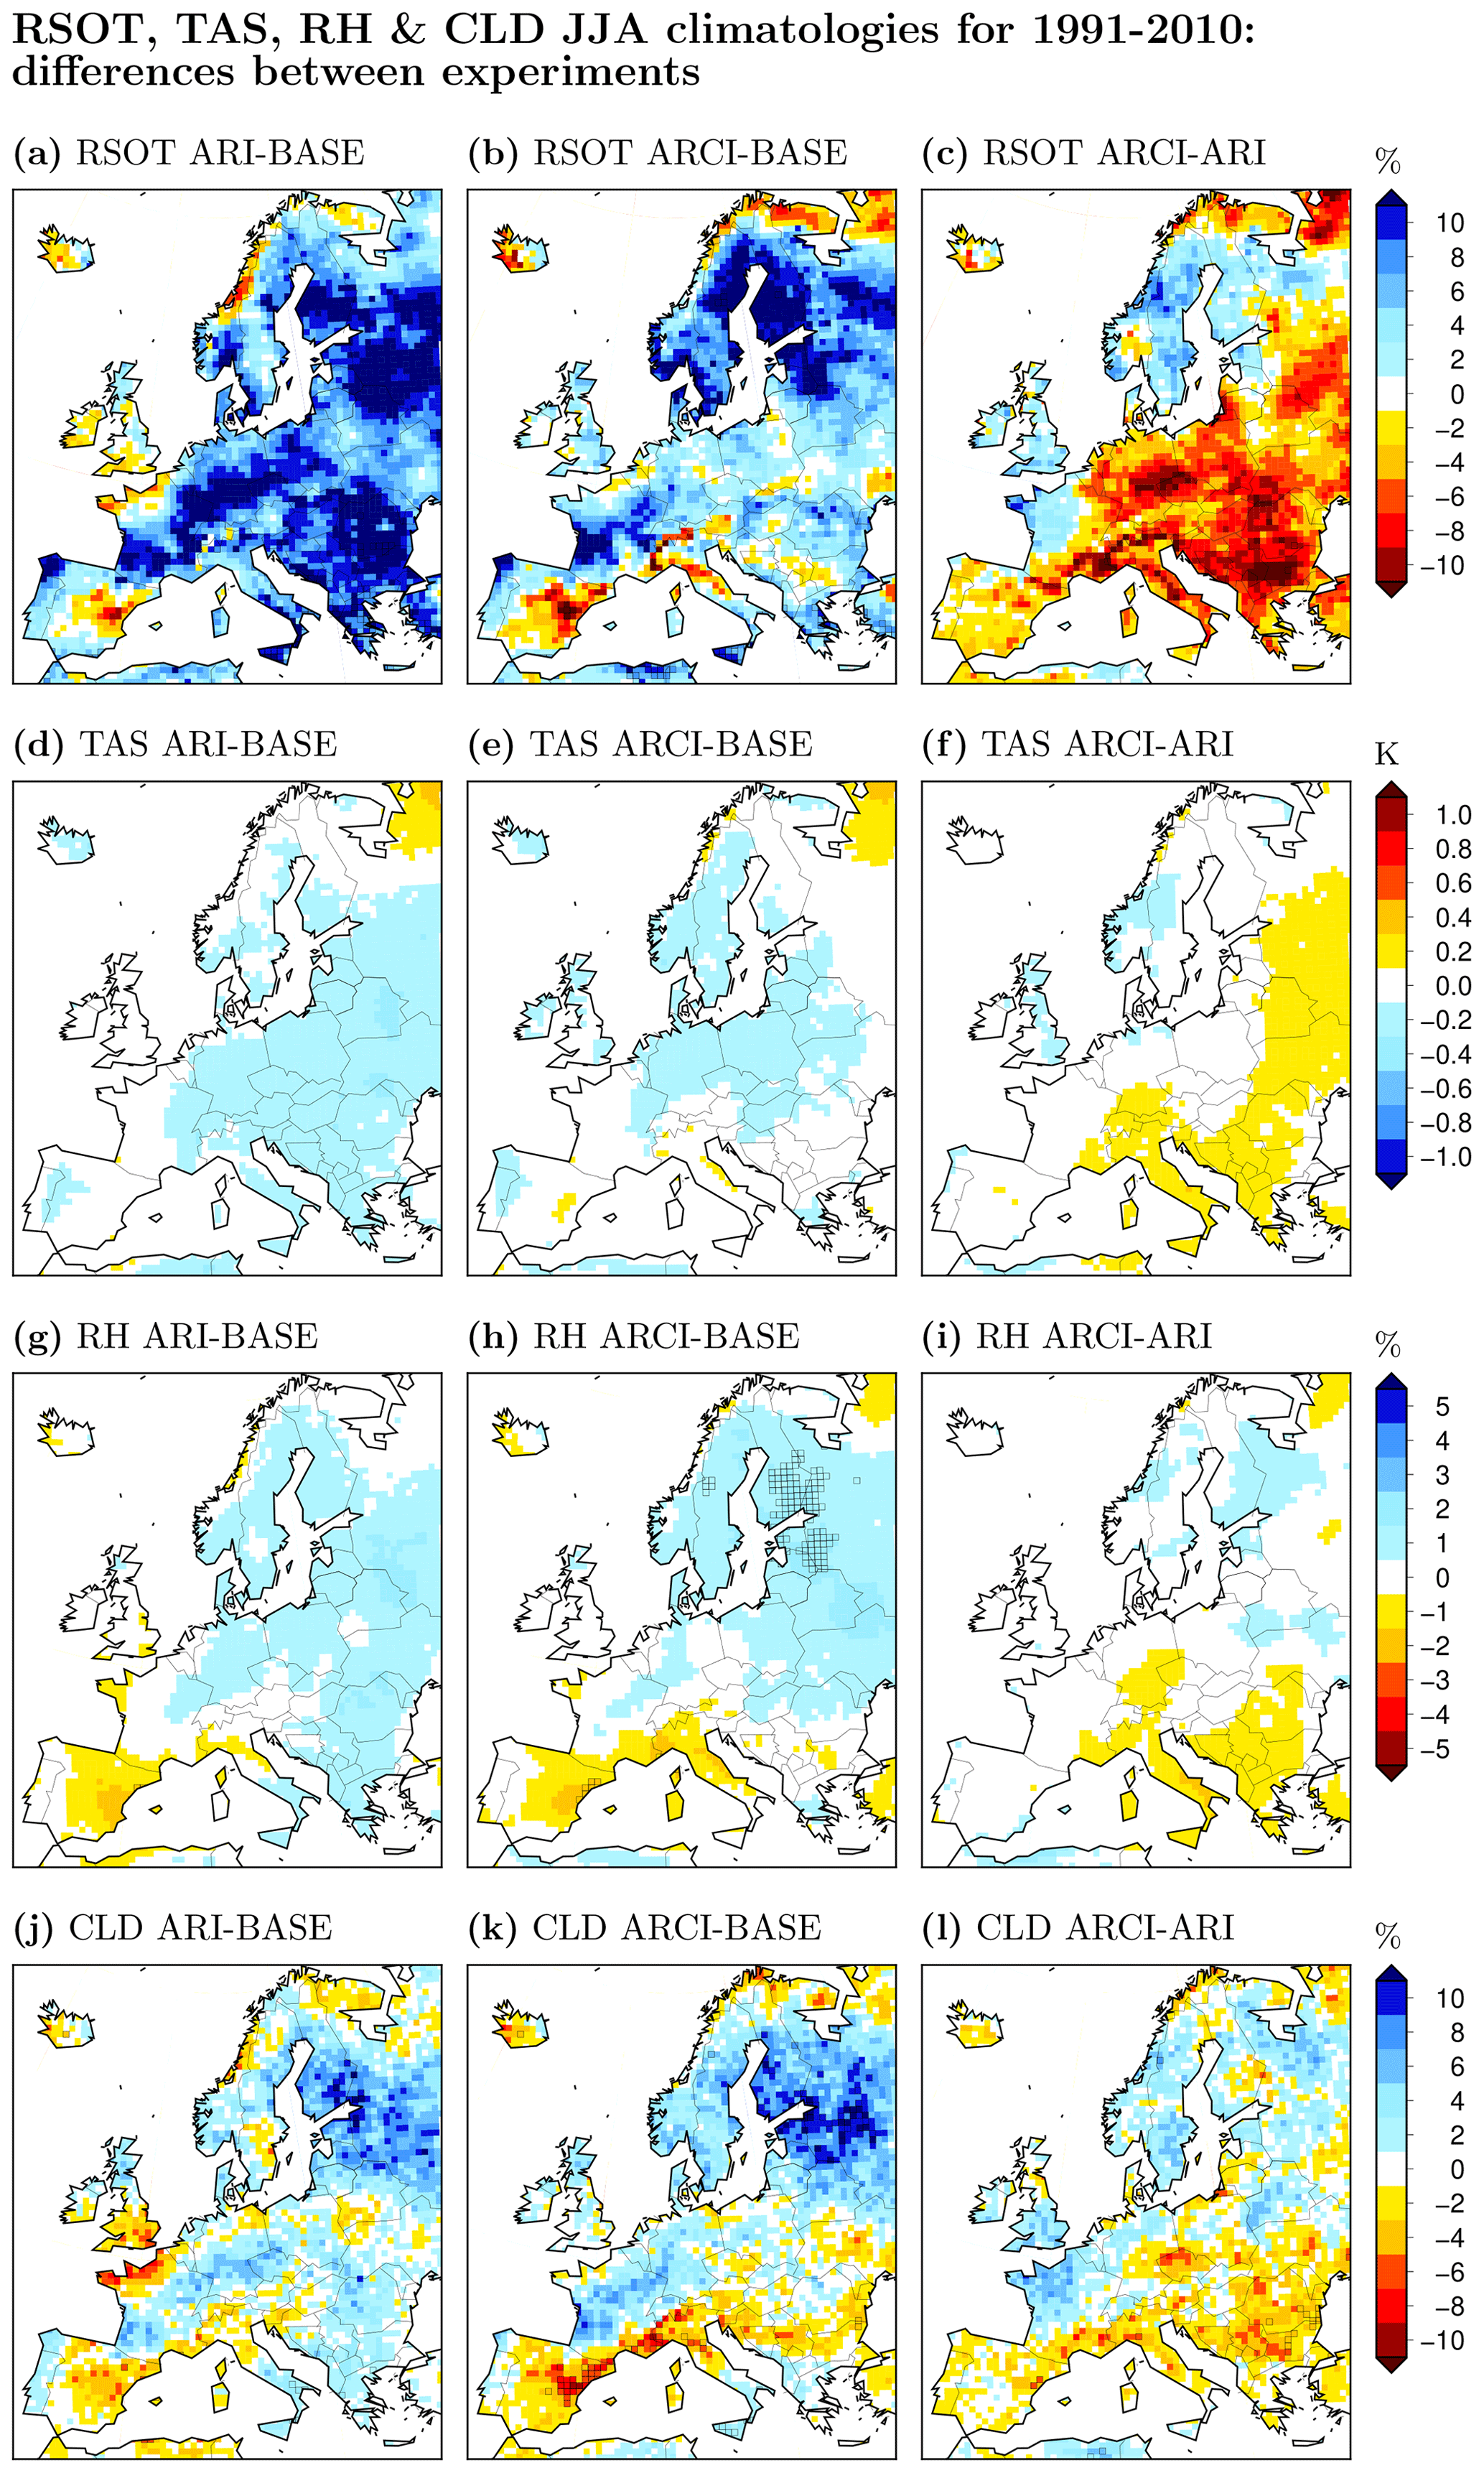
Figure 3Relative differences between the WRF simulations in the top-of-the-atmosphere outgoing shortwave radiation (RSOT, a–c), surface (2 m height) air temperature (TAS, d–f), surface (1000 hPa pressure level) relative humidity (RH, g–i) and number of cloudy days (CLD; defined as days with mean CCT > 75 %, j–l) for summer (JJA) climatologies in the historical period (1991–2010); squared if statistically significant (p<0.05). Units: Kelvin (K) for TAS and percent for RSOT, RH and CLD.
Conversely, both ARI and ARCI lead to less cloudiness southward compared to BASE, especially ARCI (reductions up to 10 % in Mediterranean regions; Fig. 1d–e). Consistently, the ARCI minus ARI pattern (Fig. 1f) depicts negative values (around 5 %) along the Mediterranean strip. Therefore, both semi-direct and indirect aerosol effects would tend to diminish cloudiness southward, with the latter (indirect effect) having the greatest impact. This could be due to the fact that a high presence of large aerosols over southern Europe, in the form of both dust and sulfate in our case (Fig. 2), can accelerate collision–coalescence processes, hastening precipitation occurrence and thus shortening the lifetime of clouds (Lee et al., 2008), which is most plausible in the warm season over warm areas (Yin et al., 2000) as long as aerosol–cloud interactions are resolved by the model. However, we did not find such an enhanced precipitation effect in our simulations (maybe the signal does not hold at the climatic scales assessed here); we found only a decrease in both mean cloudiness and the number of cloudy days (Fig. S3j–l) together with consistent pictures of lower mean precipitation, lower mean convective precipitation, fewer rainy days and lower extreme precipitation values emerging over areas where the aerosol effects diminish cloudiness (Fig. 5). The reduction in convective precipitation (the prevailing form of precipitation over this area during the summer season) suggests that absorption might be creating more stable atmospheric situations (by heating aloft layers), thus preventing cloud formation via convective phenomena and increasing the incoming surface solar radiation. But we did not find any clear evidence of that either (Fig. 4c). So the thermodynamic effect of aerosols on cloud inhibition and burn-off might justify the reduction in CCT (mainly at low levels; Fig. 4d) and the accompanying increase in RSDS in the southernmost areas. These signals are intensified when we add the indirect aerosols effects, likely due to the removal of aerosols via scavenging processes, which cleans the atmosphere and favors solar radiation reaching the surface.

Figure 4Vertical profiles of the spatial mean differences in summer (JJA) mean air temperature (T, a, c) and cloud fraction (CLFR, b, d) in the historical period (1991–2010) between experiments over two small areas: a northern one (region N; a, b) and a southern one (region S; c, d), which are shaded gray in the respective maps. These are plain differences, with units of Kelvin (K) for T and percent for CLFR.
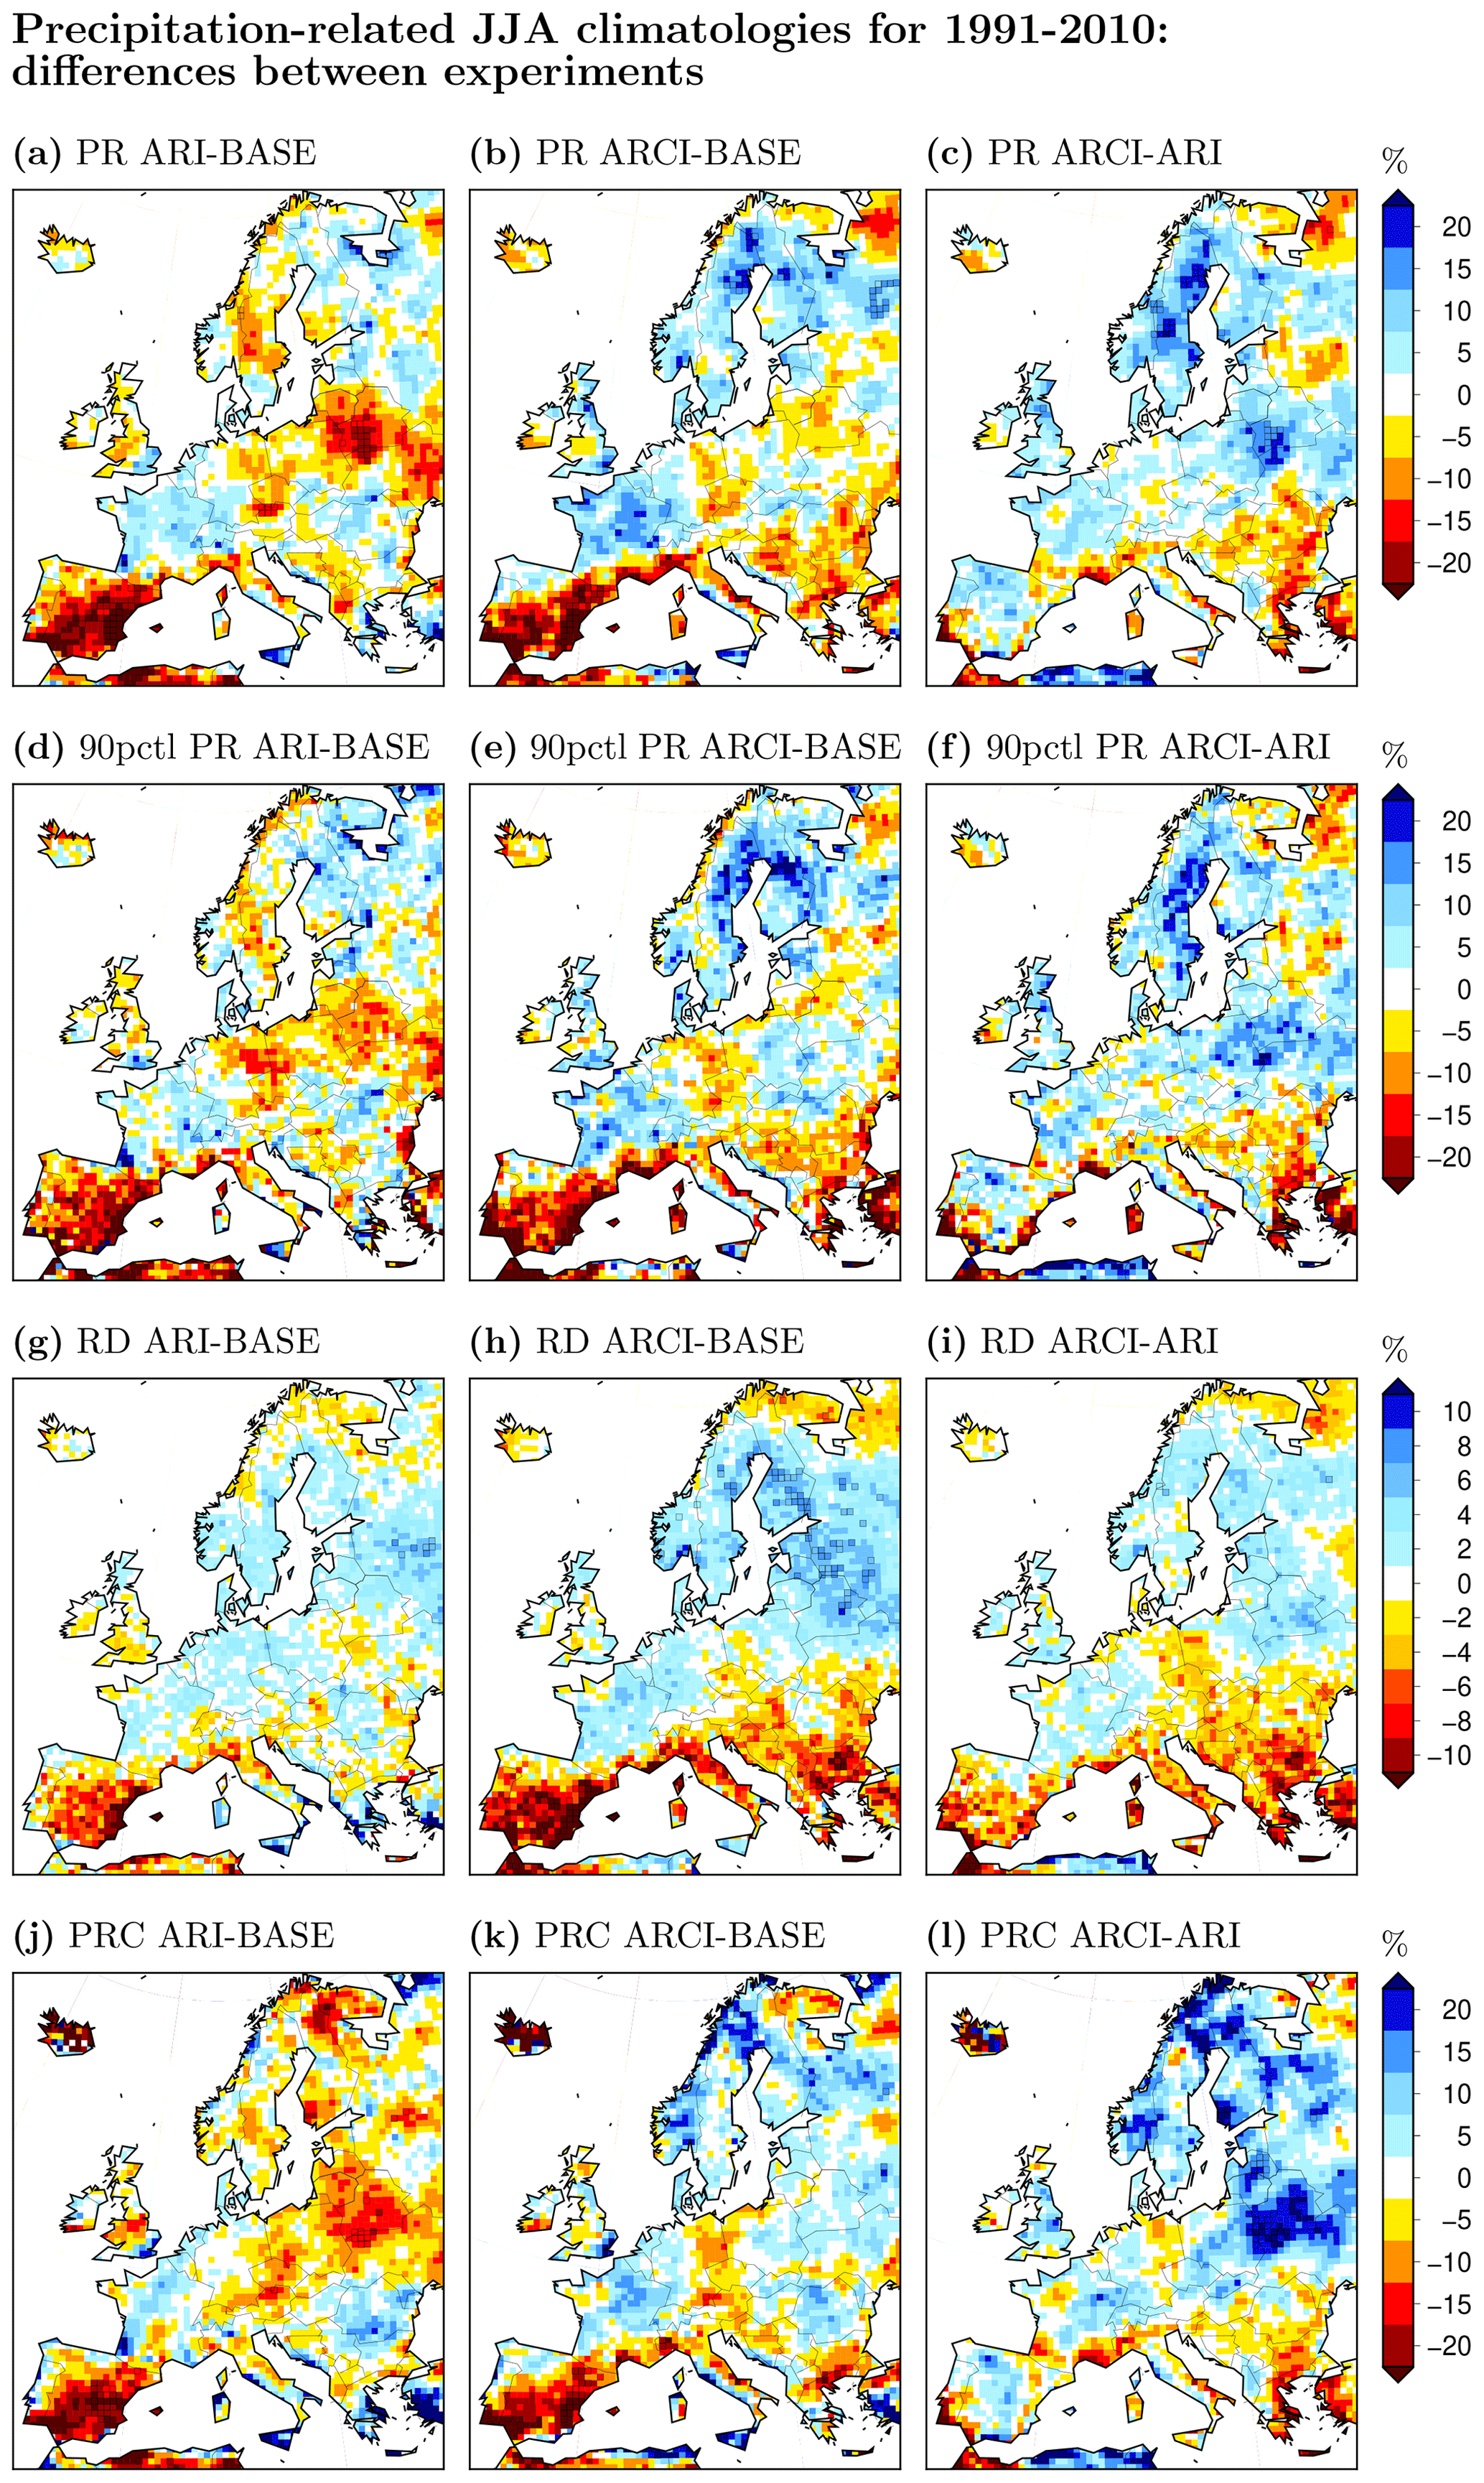
Figure 5Relative differences between the WRF simulations in the summer (JJA) climatologies of various precipitation (PR) statistics in the historical period (1991–2010); squared if statistically significant (p<0.05). Mean PR (a–c), 90th percentile of the JJA daily PR series (d–f), number of rainy days (RD) in the JJA daily PR series (defined as days with mean precipitation > 1 mm, g–i) and mean convective precipitation (PRC, j–l). Units: percent.
Whatever the underlying mechanisms are, the patterns of differences between experiments in CCT are well correlated with the corresponding patterns of differences in RSDS, thus indicating a key role of CCT in driving the latter. Indeed, the temporal correlation at the grid point level between the seasonal series of RSDS and CCT differences is above 0.8 (negative) in most of the domain (Fig. S4a–c).
3.1.4 The role of AOD
The inclusion of aerosols also leads to differences of a few percentage points (2 %–5 %) in the AOD values between ARCI and ARI simulations over western areas (Fig. 1i), and the AOD climatologies from these two experiments provide a consistently non-null picture (Fig. 1g, h; null values can be considered for BASE). However, the patterns for AOD do not correlate with those for RSDS, and the seasonal series of differences in AOD hardly correlates with the seasonal series of differences in RSDS except for certain locations in central and southeastern Europe (Fig. S4d–f). Interestingly, over these locations, the temporal correlation between differences in RSDS and differences in AOD are positive, indicating the secondary role of the direct radiative effect of the aerosols there. If the RSDS is larger with a larger AOD, it is because semi-direct and indirect effects counteract the impact of the direct scattering effect.
3.1.5 Clear-sky analysis
An overall predominant link between the aerosol effect on cloudiness and its impact on the amount of solar radiation reaching the surface, which totally masks any other mechanism related to the variation in AOD and its direct impact on RSDS, has been detected so far. In contrast, as expected, under clear-sky conditions, the negative spatial correlations between the patterns of AODcs and RSDScs differences between experiments (Fig. 6), as well as the negative temporal correlations between the respective series computed at the grid point level (Fig. S4g–i), support the relevant role of the AODcs variable for the simulation of RSDScs. The differences in RSDScs between ARI or ARCI and BASE are negative (around 5 W m−2; Figs. 6 and 5) over the study area (restricted to the southern half of the domain since the clear-sky series northward lack sufficient records to perform a robust statistical analysis), illustrating the direct radiative effect of aerosols and further supporting the important role of semi-direct and indirect effects (that make the negative clear-sky signals softer and even positive over some southern locations, as shown in Fig. 1a, b). ARCI minus ARI differences in RSDScs are basically null since semi-direct and indirect effects are largely irrelevant in the absence of cloudiness.

Figure 6Relative differences between the WRF simulations in the RSDScs (a–c) and AODcs (at 550 nm) (d–f) summer (JJA) climatologies; this is under clear-sky conditions in the historical period (1991–2010) and squared if statistically significant (p<0.05; units: percent). Note that panels (d) and (e) refer to the horizontal color bar just below them and simply represent the AOD summer climatologies in ARI and ARCI, respectively. Gray shaded areas depict grid points for which less than 75 % of the summer mean values in the time series of RSDScs and AODcs were not missing. Spatial correlations (s_corr) between the patterns in the second row and the respective patterns in the first row are indicated in the headers.
3.2 Future projections
3.2.1 Future climatologies
The overall results described above also hold under future climate conditions, while some differences were identified and deserve mention. The inclusion of aerosols reduces RSDS over most of the domain due to direct, semi-direct and indirect effects (Fig. S6a–c). In particular, this occurs significantly southward along the Mediterranean strip, in contrast to previous results. Over some locations, mainly in central Europe, this reduction is stronger in ARI than in ARCI, as detected under historical conditions. However, the opposite (larger RSDS reduction in ARCI than in ARI) occurs elsewhere, interestingly over the Mediterranean strip, which also contrasts with the results found under historical conditions. These results further support the sensitivity of the simulations to both aerosol–radiation and aerosol–cloud interactions under changed climates in such a way that cloudiness still appears to be the most important explanatory variable for the differences in RSDS between experiments, although the role of AOD gains relevance compared to the analysis under historical conditions (see the spatial and temporal correlation values in Figs. S6d–i and S7a–f, respectively). Under clear-sky conditions (Figs. S7g–i and S8), the results are identical to those reported in the previous section.
Therefore, what contrasts most with previous results is that (1) both ARI and ARCI simulations provide diminished values of RSDS (of a few percentage points but with statistical significance) over southern locations compared to BASE (Fig. S6a, b), which should primarily respond to the direct aerosol effect of scattering radiation (enhanced RSOT can be seen in Fig. S9a, b), since it occurs there in particular in spite of the diminished CCT values simulated by the ARI experiment (Fig. S6d). (2) Also, such a reduction in RSDS over southern locations is reinforced when indirect effects are included (Fig. S6c), as these cause higher CCT values than BASE (Fig. S6e) and consequently higher RSOT values there than ARI (Fig. S9a–c). The latter could also respond to the added role of aerosols in modifying the optical properties of clouds. When ACIs are considered, aerosols act as cloud condensation nuclei, which can lead to whiter clouds with higher albedo. Interestingly, but out of the scope of this study, different PR shifts east and west across Mediterranean Europe were detected when ARCI and ARI experiments were compared between them, and then ARCI and ARI were compared with BASE (Fig. S10). Over the Balkan Peninsula (southeast of the domain), ACI enhances precipitation, whether in the form of convective precipitation, total precipitation, intense precipitation or the number of rainy days, more than ARI does, whereas over the Iberian Peninsula (southwest of the domain), ARI leads to higher precipitation rates and intensity while reducing the frequency of rainy days compared to ARCI. These signals suggest that the fact that different aerosol species prevail in these areas (the concentration of sulfate is larger eastward, while the concentration of dust particles is larger westward; Fig. S11), as well as how this affects the ratio between large and fine particulate matter, might have an impact along with the aforementioned mechanisms in this case (López-Romero et al., 2021).
Since the patterns of differences in the analyzed variables show different structures under historical and future climate conditions, the RSDS change patterns vary when ARIs and ACIs are taken into account by the model, as described below.
3.2.2 Future projections
The change patterns for RSDS are similar in both the BASE and ARI experiments (Figs. 7b, c and S12b, c), showing negative signals in the northernmost regions (up to 10 %, ∼ 15 W m−2) and positive signals southward (up to 5 %, again ∼ 15 W m−2). The latter are more widespread in ARI than in BASE, which makes the ARI pattern the most similar to the change pattern from the GCM (Figs. 7a and S12a). However, when aerosol–cloud interactions are included in the WRF runs, such positive RSDS change signals mostly disappear, while the northern negative ones are reinforced in some parts compared to the ARI pattern (Figs. 7d and S12d). These results are in quite good agreement with the corresponding change patterns for CCT (Figs. 7e–h and S12e–h) – including the fact that the negative change signals for CCT appearing southward in the GCM, BASE and ARI experiments are much less evident in ARCI – and occur in spite of two constraining facts regarding the AOD simulation approach in our WRF experiments: (1) AOD remains unchanged in the BASE experiment (as illustrated by Fig. 7j), and (2) AOD changes from the ARI and ARCI experiments are hardly realistic because their anthropogenic component is disregarded (as specified in Sect. 2), and they thus depict patterns (Fig. 7k, l) that have nothing to do with the GCM projection in Fig. 7i (which does consider time-evolving anthropogenic aerosols). In fact, the spatial correlation between the patterns of AOD and RSDS changes is lower than between those of CTT and RSDS changes. Therefore, direct and semi-direct aerosol effects have a limited impact on the RSDS future projections here, while indirect effects play a major role by reducing the future decrease in CCT southward within our domain, thereby dispelling the future increase in RSDS in this region.
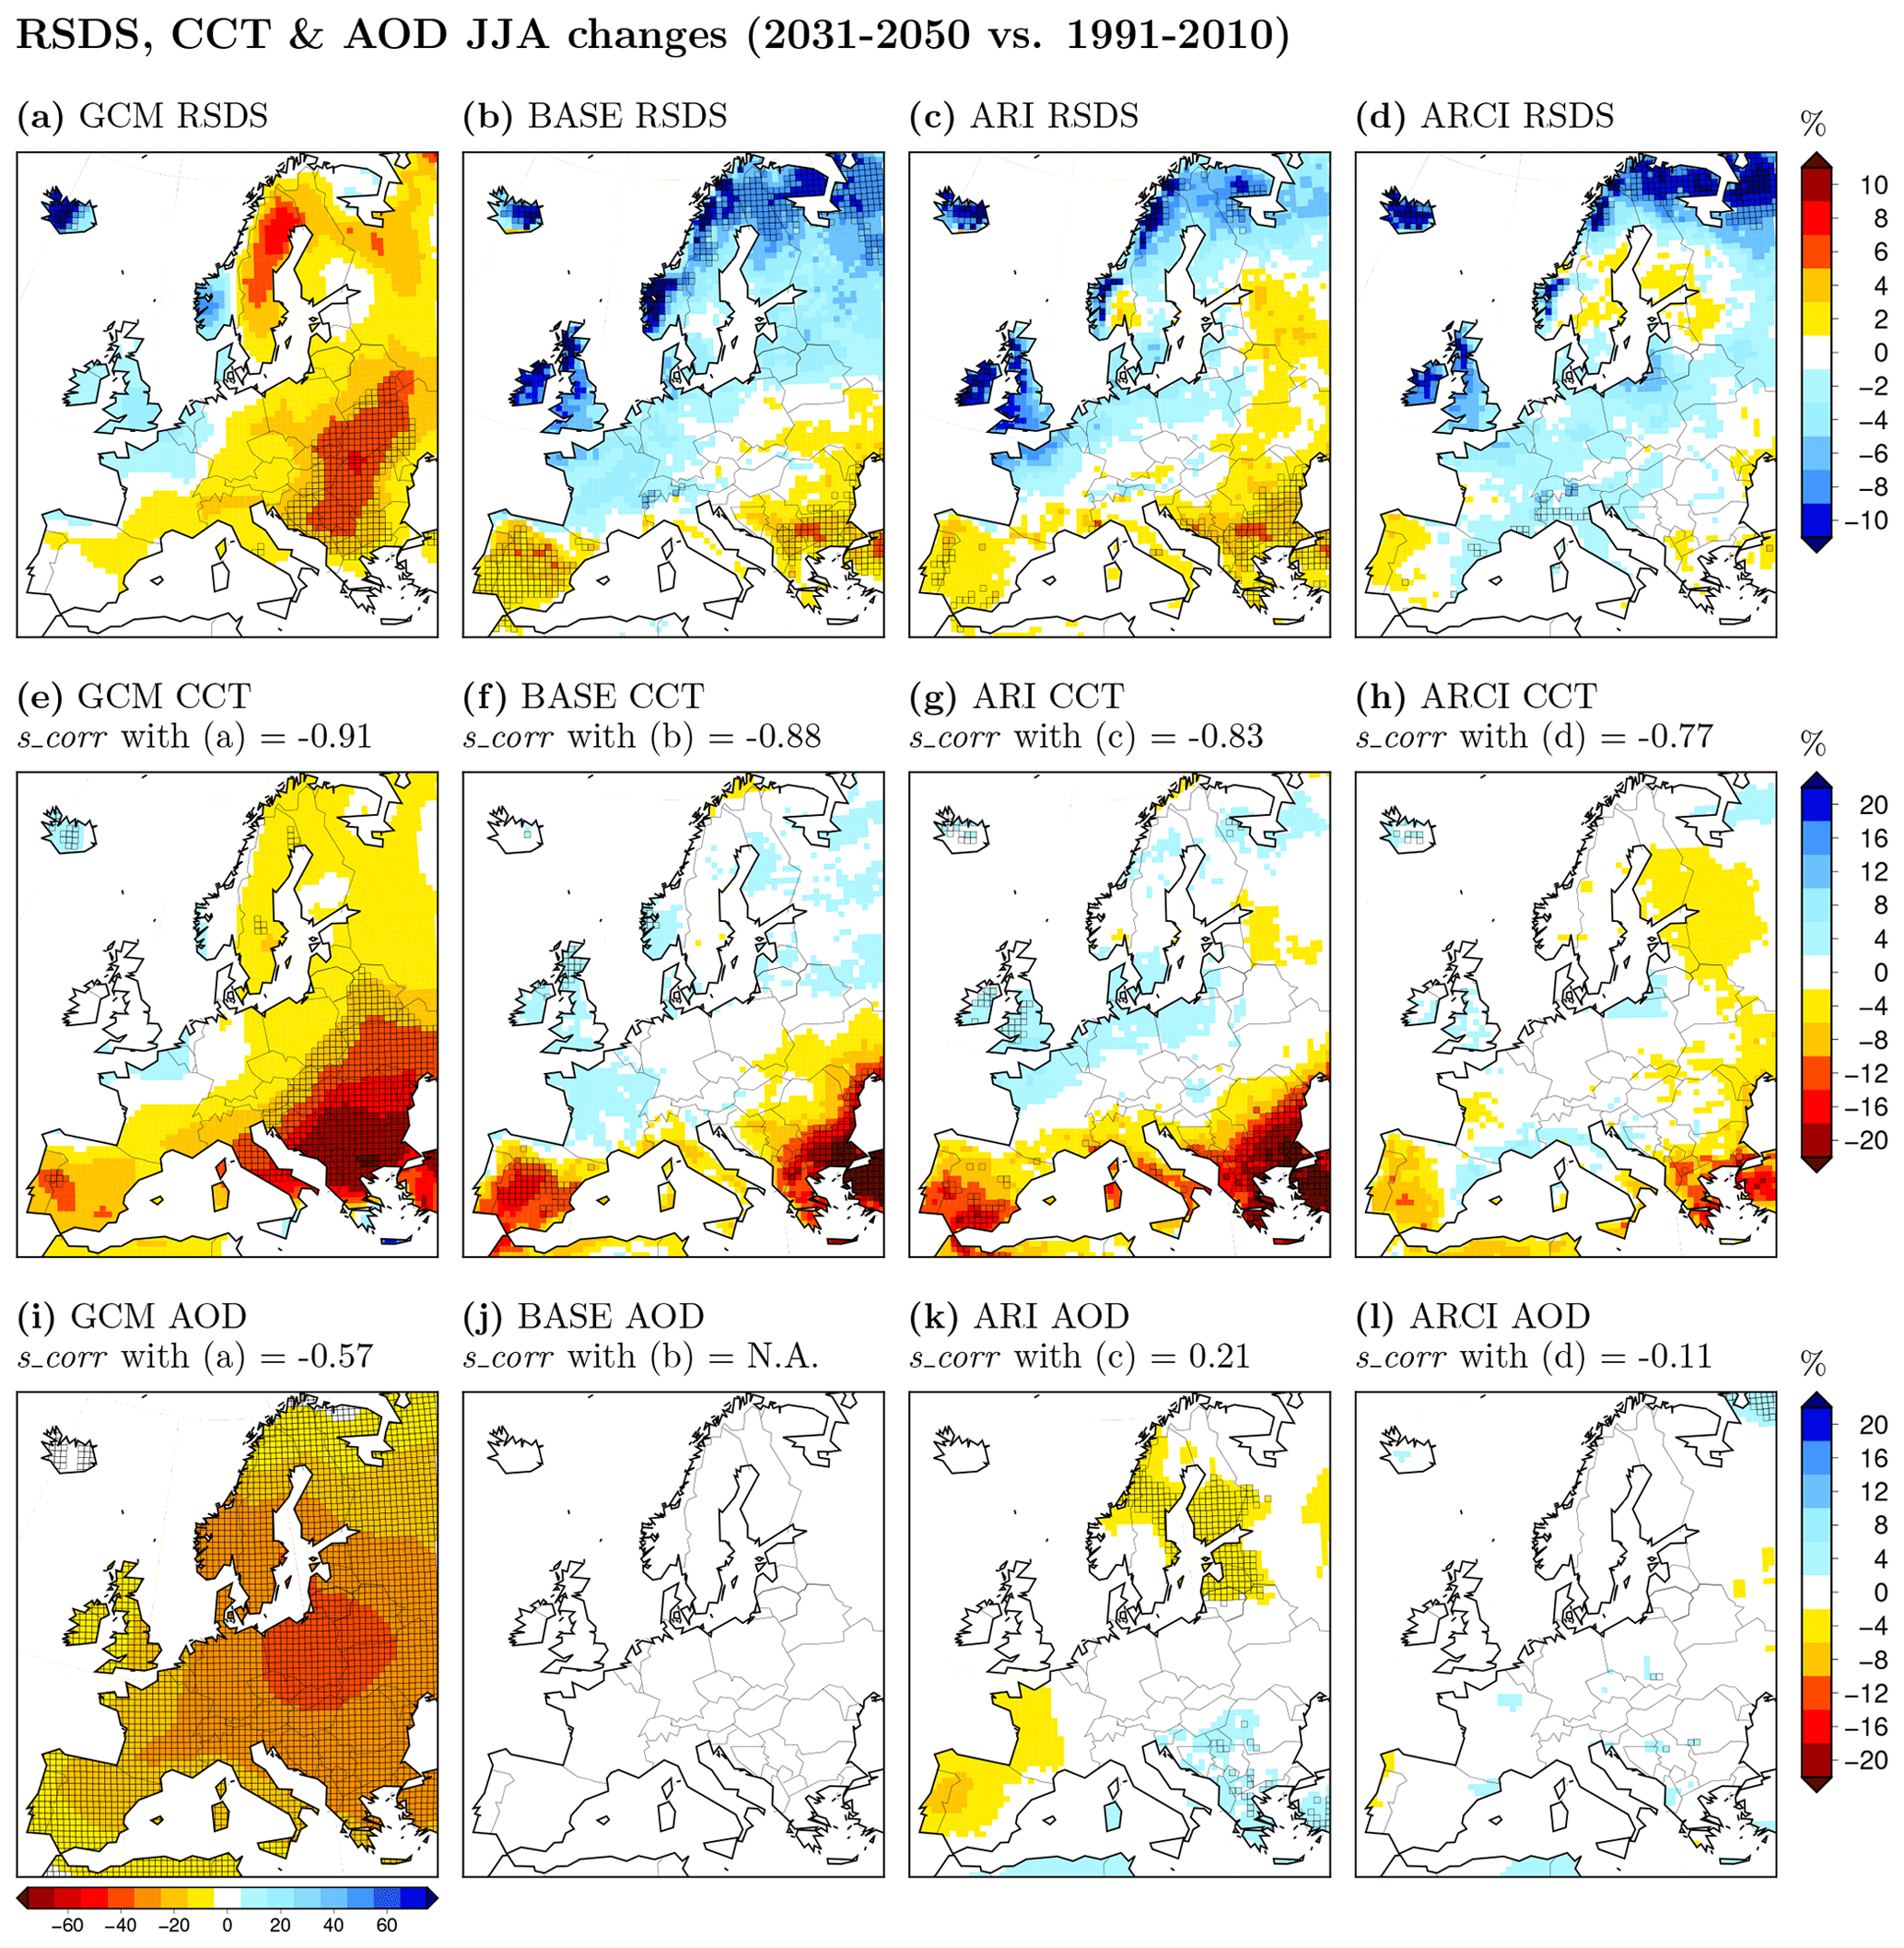
Figure 7Projected changes for the RSDS (a–d), CCT (e–h) and AOD (at 550 nm) (i–l) summer (JJA) climatologies by the GCM (first column) and the WRF experiments (second to fourth columns; units: percent). Squares highlight statistically significant signals (p<0.05). Note that panel (i) refers to the horizontal color bar just below it. Spatial correlations (s_corr) between the patterns in the second and third rows and the respective patterns in the first row are indicated in the headers.
The change signals for RSDScs and AODcs (Figs. 8 and S13) depict different spatial structures than those for RSDS and AOD, turning mostly negative southward and positive northward for RSDScs (with negative signals around 5 % and positive up to 10 %, in both cases implying changes up to 20 W m−2). Although this occurs similarly in the three experiments (BASE, ARI and ARCI), BASE provides the softest signals, which does evince a certain role of the direct aerosol effect. However, there is not a clear relationship between AODcs change patterns and RSDScs changes (low spatial correlation), except for some local signals in the northeast where the direct aerosol effect enhances RSDScs in areas with reduced AODcs. However, as discussed above, the role of retaining (or not) coincident clear-sky dates between pairs of experiments is important in filtering out the true role of AODcs on RSDScs. Thus, the fact that change patterns are constructed over different dates could partially explain the apparently negligible role of AODcs for RSDScs in this case, but only partially, as the BASE change pattern for RSDScs (simulated on the basis of null AODcs changes) resembles the respective patterns from the ARI and ARCI experiments.
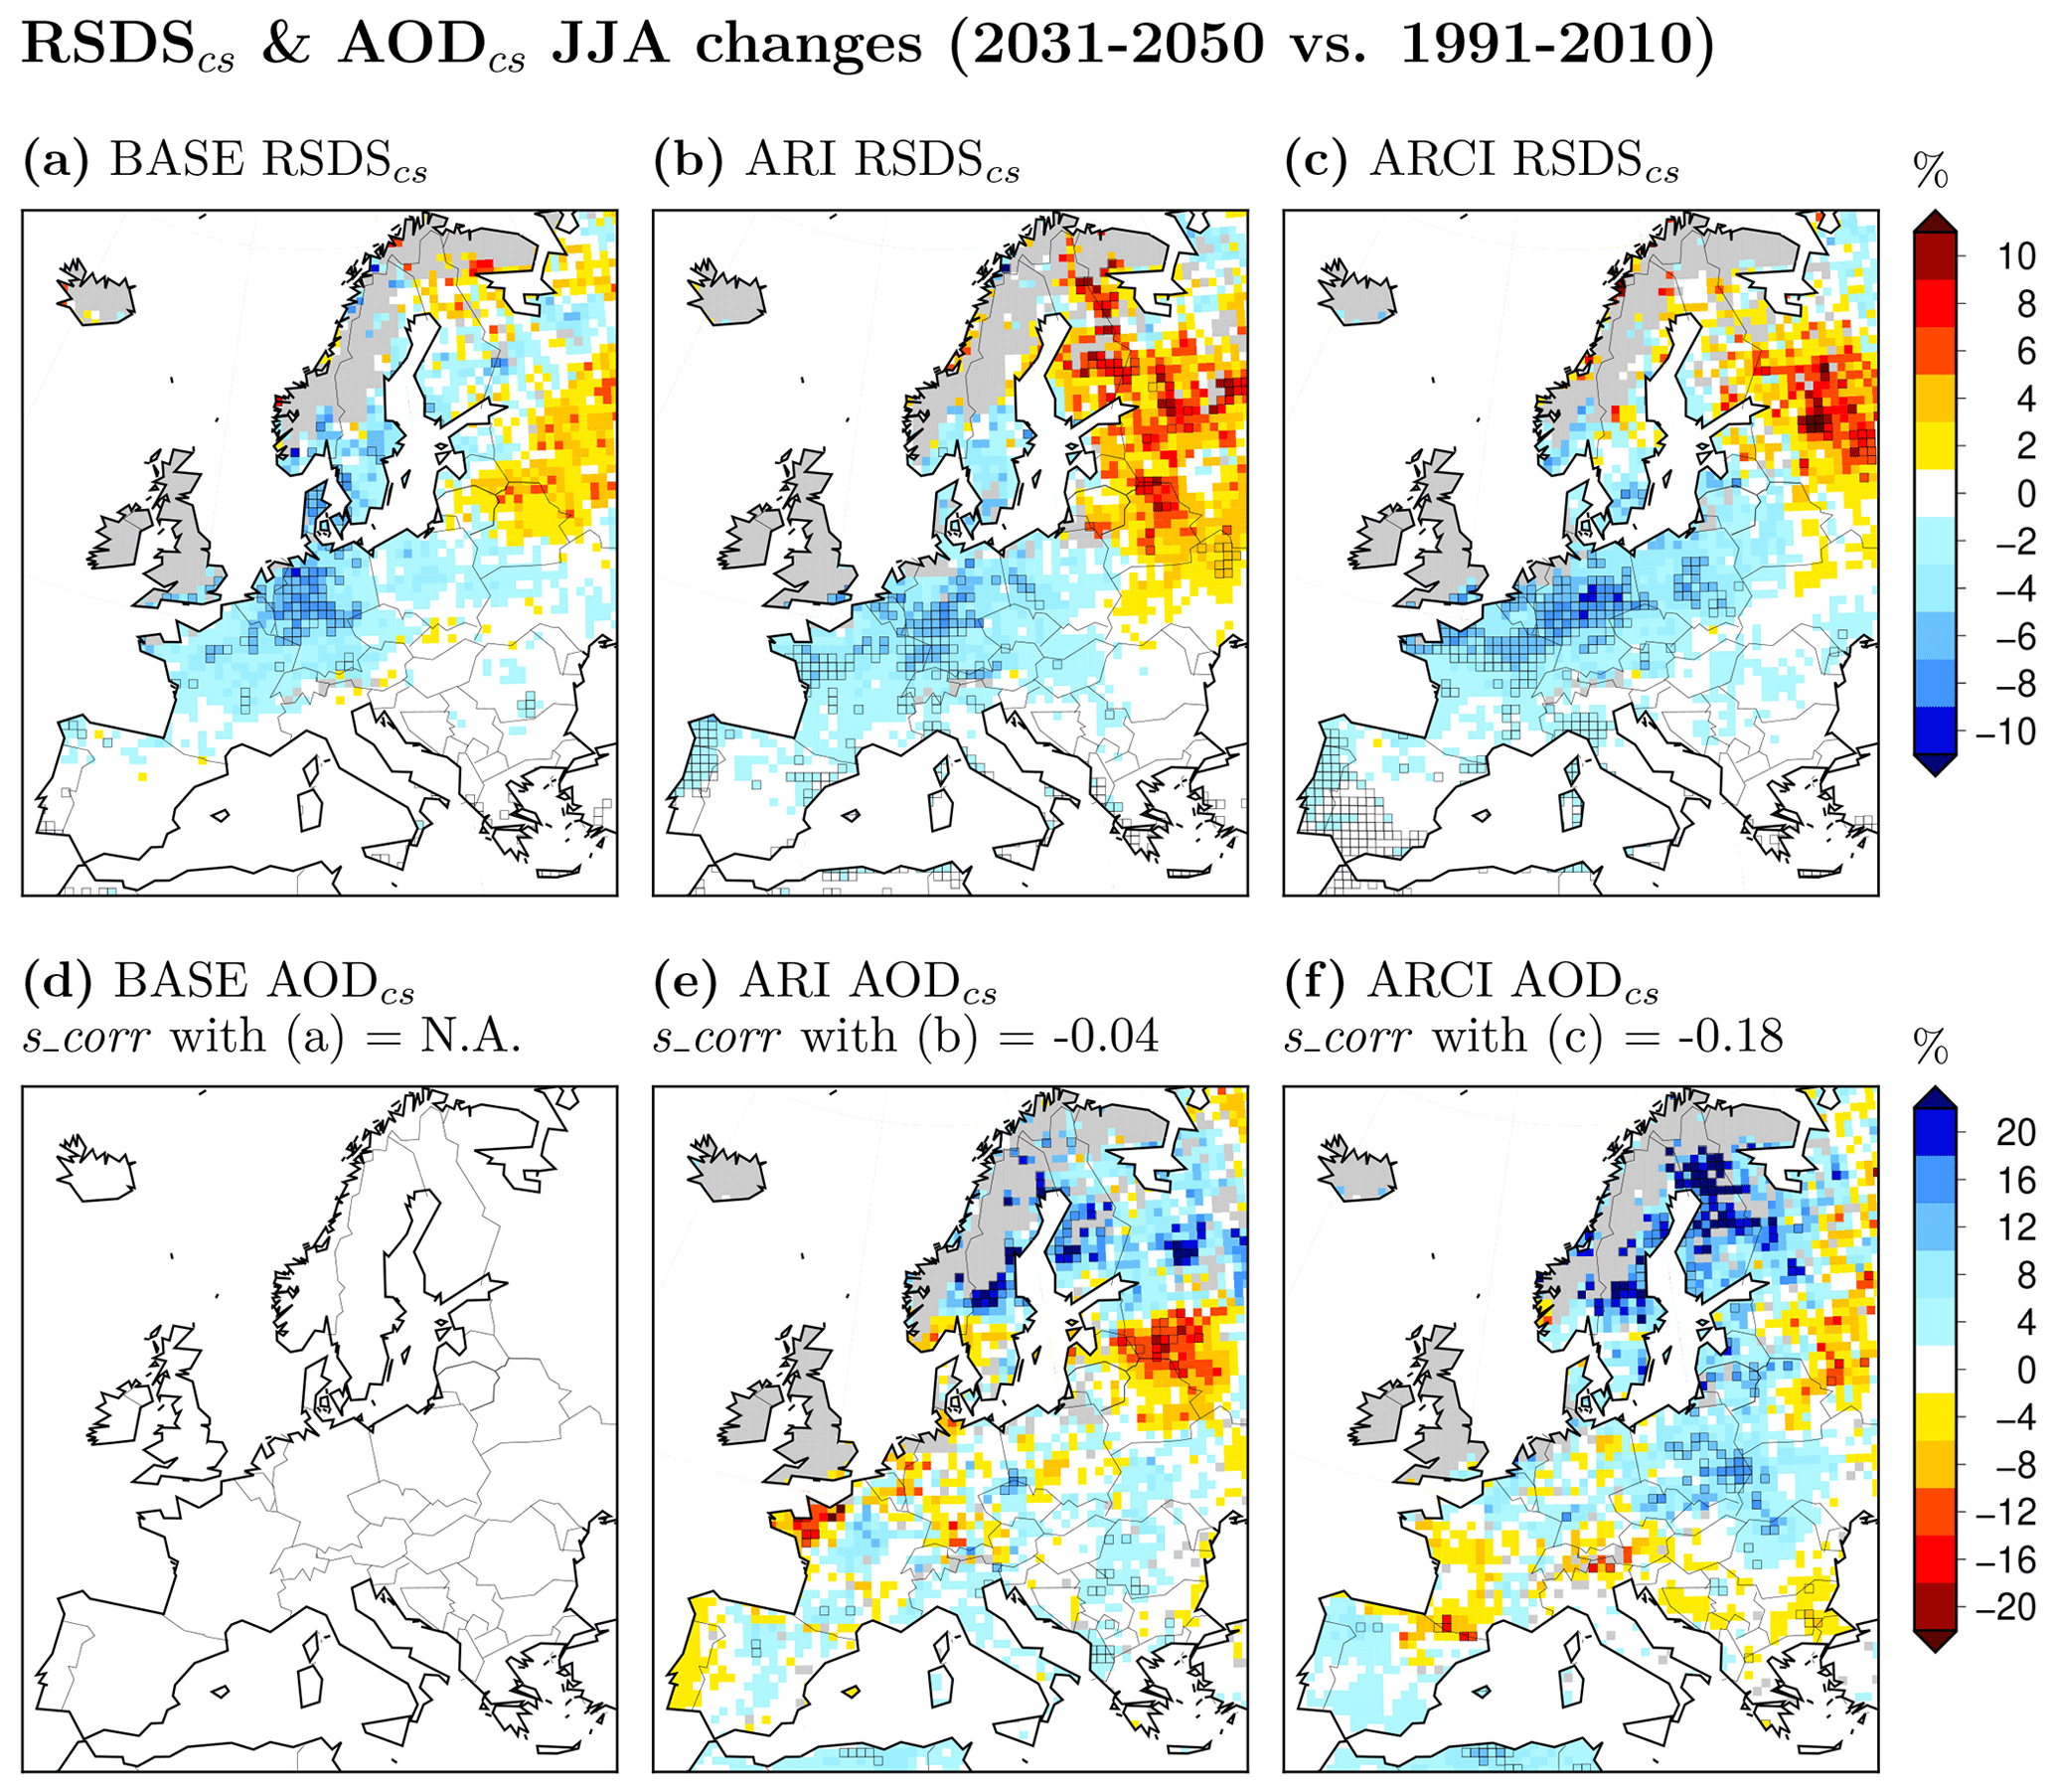
Figure 8Projected changes for the RSDScs (a–c) and AODcs (at 550 nm) (d–f) summer (JJA) climatologies; this is under clear-sky conditions for the WRF experiments and squared if statistically significant (p<0.05; units: percent). The gray shaded areas depict grid points for which less than 75 % of the summer mean values in the time series of RSDScs and AODcs were not missing in either the historical or the future period. Spatial correlations (s_corr) between the patterns in the second row and the respective patterns in the first row are indicated in the headers.
We have presented research on the role of dynamically modeled atmospheric aerosols in regional climate simulations with a focus on the impacts on the solar resource during the summer season from a climatic perspective, including projected changes to a medium-range horizon and analysis under clear-sky conditions. For this, we evaluated a set of 20-year-long runs (spanning both historical and future periods) without including aerosols and with resolved aerosol–radiation and aerosol–radiation–cloud interactive (two-way) interactions performed with the WRF model (BASE, ARI and ARCI experiments, respectively).
We interpreted the signals on the basis that the differences between ARI and BASE can be attributed to direct and semi-direct aerosol effects, and the differences between ARCI and ACI can be attributed to the indirect aerosol effect. Nonetheless, we should acknowledge that the autoconversion scheme called so that cloud droplets can turn into rain droplets in the ARCI simulations is different than the autoconversion scheme activated in the ARI (and BASE) simulations. This change in the WRF-Chem configuration can lead to differences between ARCI and ARI experiments that do not necessarily come from aerosol–cloud interactions from a physical point of view (Liu et al., 2005). In fact, the activation of aerosol–cloud interactions requires further changes in the model configuration (compared to the configuration used for the simulations labeled ARI) beyond the autoconversion scheme, such as the activation of aqueous chemistry processes, which could also have an added impact to the effect that it can be strictly attributed to the aerosol–cloud interactions. However, technically, the encoding of the WRF-Chem model hampers better isolation of the effect of aerosol–cloud interactions (the mentioned aspects necessarily change between ARI and ARCI modes). Therefore, ARCI–ARI differences cannot be attributed to aerosol–cloud interactions from a purely physical point of view but to the activation of aerosol–cloud interactions from a modeling point of view. It should also be borne in mind that the set of experiments performed allows any attribution to the interactive aerosol modeling approach adopted here to be made, while it is a distinct feature with respect to previous studies aimed at providing more consistent signals from a physical point of view. More generally, internal variability plays a role in the simulations (e.g., Gómez-Navarro et al., 2012), and a single member with a single physics configuration, as was used for the sensitivity experiment, may not be sufficient to obtain generally occurring responses. Last, we kept the anthropogenic aerosol emissions unchanged throughout the simulation period. This approach permits us to better isolate the signals from aerosol–radiation–cloud interactions due to the climate variability alone and the so-called climate change penalty alone, but at the expense of the reliability of the simulated patterns. Anthropogenic emissions have been dramatically reduced since the 1980s and are expected to continue in that pathway to the future (IPCC, 2013, 2014), so keeping 2010 values (as we did) could lead to an underestimation of AOD in the historical period (in fact, it does; reference AOD climatologies can be found in Pavlidis et al., 2020) and to its overestimation in the future period. Under these constraints, we draw the following conclusions.
The inclusion of aerosols in the WRF simulations generally reduces the amount of solar radiation reaching the surface by a few percentage points (∼ 5 %) under both historical and future climate scenarios, as expected (Nabat et al., 2015a; Gutiérrez et al., 2018; Pavlidis et al., 2020). Under historical conditions, this effect is larger when the aerosol–cloud interaction remains turned off because its activation leads to less cloudiness (over Mediterranean Europe) and lower AOD values (over Atlantic Europe), as evidenced when ARCI and ARI simulations were compared. The differences in RSDS between experiments are in overall good agreement with those found in cloudiness, while they seem to be unlinked with the differences in AOD in many parts of the domain. In agreement with Pavlidis et al. (2020), AOD plays a major role under clear-sky conditions. However, the differences in JJA mean values of RSDS under clear skies between experiments with and without dynamic aerosols are about 1 %, while they are still significant in some of the southernmost parts of our European domain and almost null between ARCI and ARI.
Our results suggest a variety of drivers underlying the mechanisms to explain the signals obtained, depending on the region (and season; winter plots are provided in Figs. S14–S17 as an example for interested readers) and varying under future climate conditions. These involve the scattering of solar radiation with consequent cooling downward, suppression of cloudiness due to thermodynamic effects, and modification of cloud optical properties or in-cloud scavenging processes. As these prevailing mechanisms change (up to a point) in the future, the sensitivity of the WRF simulations under future climate conditions, represented by the patterns of differences in RSDS, is somehow depicted differently than under historical conditions. Therefore, the future projections also show sensitivity to the way the model considers aerosols.
The patterns of change for RSDS and CCT again show high spatial correlations in all the GCM and RCM (BASE, ARI and ARCI) projections. Although lower, still high spatial correlations define the match between the RSDS change patterns and those for AOD in the GCM, while this is not the case in either the ARI or ARCI experiments. The GCM, BASE and ARI experiments agree in projecting positive RSDS change signals in southern and eastern areas (around 5 %), while clear differences are found between the GCM and the BASE or ARI RSDS change patterns (with the latter two very similar) in central and northeastern areas, where the positive signals from the GCM turn notably negative in both BASE and ARI. ARCI provides the most singular and negative picture of RSDS changes among all those shown, with widespread decreasing signals of a few percentage points, further reinforcing the fact that the indirect effect tends to counteract the direct and semi-direct effect of aerosols and enlarges the distance between the RCM and the GCM projections.
Previous works (Jerez et al., 2015; Sørland et al., 2018; Bartók et al., 2017) detected inconsistencies in the change signals between RCM projections and those from their driving GCM, which have been related to the way aerosols were represented in the RCM through their impact on the simulated AOD (Gutiérrez et al., 2020; Boé et al., 2020), in particular to their direct and semi-direct effects and their reduced concentrations in the future as long as anthropogenic emissions are projected to decrease. In agreement with these previous findings, insofar as we kept the anthropogenic aerosol emissions unchanged throughout the simulation period, our projections differ from those obtained with the GCM. Nevertheless, the ARI experiment brings our results slightly closer to those of the GCM compared to the BASE experiment, perhaps also indicating the key role of direct and semi-direct aerosol effects in reducing GCM–RCM discrepancies, as reported in previous works. However, pushing our understanding further, by turning off the already reported effect of reduced aerosol concentrations in the future via direct and semi-direct effects, our approach made it possible to identify the prevailing role of CCT changes (over the dynamically simulated natural changes in AOD) to explain our signals of change in RSDS and the capacity of aerosol–radiation–cloud interactions to significantly alter our RSDS change patterns (much more than aerosol–radiation interactions alone). Thus, although change patterns for RSDS certainly look uniform among experiments under clear-sky conditions (likely because we suppressed the anthropogenic component for the changes in AOD, which was identified by Boé et al., 2020, as a main factor for these signals), the results presented here further indicate that the joint effect of aerosol–radiation–cloud interactions should be considered in RCM simulations that serve to build up action-oriented messages in the challenging context of current climate change, calling for caution otherwise and for future research efforts along this line.
All data (NetCDF files) and relevant codes (scripts for data analysis and WRF namelists) for reproducing this study are publicly accessible at https://doi.org/10.23728/b2share.a65d25c2b3ba49e1a46e970783e9476e (Jerez et al., 2020).
The supplement related to this article is available online at: https://doi.org/10.5194/gmd-14-1533-2021-supplement.
SJ conceived this study. LPP, PJG and JPM designed the experiments, and JMLR and EPS carried them out. SJ performed the analysis and prepared the paper with contributions from all co-authors.
The authors declare that they have no conflict of interest.
The authors thank the WRF-Chem development community, the G-MAR research group at the University of Murcia for the fruitful scientific discussions, Dr. S. Kinne for providing the MACv2 data and the EURO-CORDEX community for providing the framework for this study. Special thanks to the editor and the anonymous reviewers for their time and constructive comments during the difficult COVID-19 times.
This study was supported by the Spanish Ministry of Science, Innovation and Universities–Agencia Estatal de Investigación and the European Regional Development Fund through the projects EASE (RTI2018-100870-A-I00, MCI/AEI/FEDER, UE) and ACEX (CGL2017-87921-R, MINECO/AEI/FEDER, UE), as well as by the Fundación Séneca–Agencia de Ciencia y Tecnología de la Región de Murcia through the project CLIMAX (20642/JLI/18). Sonia Jerez received funding from the Plan Propio de Investigación of the University of Murcia (grant no. UMU-2017-10604). Laura Palacios-Peña is grateful for the FPU14/05505 scholarship and thanks the Spanish Ministry of Education, Culture and Sports. Jose María López-Romero acknowledges the FPI-BES-2015-074062 grant from the Spanish Ministry of Science.
This paper was edited by Christina McCluskey and reviewed by three anonymous referees.
Allen, R. J. and Sherwood, S. C.: Aerosol-cloud semi-direct effect and land-sea temperature contrast in a GCM, Geophys. Res. Lett., 37, L07702, https://doi.org/10.1029/2010GL042759, 2010.
Archer-Nicholls, S., Lowe, D., Utembe, S., Allan, J., Zaveri, R. A., Fast, J. D., Hodnebrog, Ø., Denier van der Gon, H., and McFiggans, G.: Gaseous chemistry and aerosol mechanism developments for version 3.5.1 of the online regional model, WRF-Chem, Geosci. Model Dev., 7, 2557–2579, https://doi.org/10.5194/gmd-7-2557-2014, 2014.
Bartók, B., Wild, M., Folini, D., Lüthi, D., Kotlarski, S., Schär, C., Vautard, R., Jerez, S., and Imecs, Z.: Projected changes in surface solar radiation in CMIP5 global climate models and in EURO-CORDEX regional climate models for Europe, Clim. Dynam., 49, 2665–2683, https://doi.org/10.1007/s00382-016-3471-2, 2017.
Bloomfield, H. C., Brayshaw, D. J., Shaffrey, L. C., Coker, P. J., and Thornton, H. E.: Quantifying the increasing sensitivity of power systems to climate variability, Environ. Res. Lett., 11, 124025, https://doi.org/10.1088/1748-9326/11/12/124025, 2016.
Boé, J., Somot, S., Corre, L., and Nabat, P.: Large discrepancies in summer climate change over Europe as projected by global and regional climate models: causes and consequences, Clim. Dynam., 54, 2981–3002, https://doi.org/10.1007/s00382-020-05153-1, 2020.
Boucher, O.: Atmospheric aerosols, in: Atmospheric Aerosols, Springer, Dordrecht, 9–24, 2015.
Chapman, E. G., Gustafson Jr., W. I., Easter, R. C., Barnard, J. C., Ghan, S. J., Pekour, M. S., and Fast, J. D.: Coupling aerosol-cloud-radiative processes in the WRF-Chem model: Investigating the radiative impact of elevated point sources, Atmos. Chem. Phys., 9, 945–964, https://doi.org/10.5194/acp-9-945-2009, 2009.
Chen, F. and Dudhia, J.: Coupling an advanced land surface–hydrology model with the Penn State–NCAR MM5 modeling system. Part I: Model implementation and sensitivity. Mon. Weather Rev., 129, 569–585, https://doi.org/10.1175/1520-0493(2001)129<0569:CAALSH>2.0.CO;2, 2001.
Chin, M., Rood, R. B., Lin, S.-J., Müller, J.-F., and Thompson, M.: Atmospheric sulfur cycle simulated in the global model GOCART: Model description and global properties, J. Geophys. Res., 105, 24671–24687, https://doi.org/10.1029/2000JD900384, 2000.
Chin, M., Ginoux, P., Kinne, S., Torres, O., Holben, B. N., Duncan, B. N., Martin, R. V., Logan, J. A., Higurashi, A., and Nakajima, T.: Tropospheric aerosol optical thickness from the GOCART model and comparisons with satellite and Sun photometer measurements, J. Atmos. Sci., 59, 461–483, https://doi.org/10.1175/1520-0469(2002)059<0461:TAOTFT>2.0.CO;2, 2002.
Collins, S., Deane, P., Gallachóir, B. Ó., Pfenninger, S., and Staffell, I.: Impacts of inter-annual wind and solar variations on the European power system, Joule, 2, 2076–2090, https://doi.org/10.1016/j.joule.2018.06.020, 2018.
Croft, B., Pierce, J. R., Martin, R. V., Hoose, C., and Lohmann, U.: Uncertainty associated with convective wet removal of entrained aerosols in a global climate model, Atmos. Chem. Phys., 12, 10725–10748, https://doi.org/10.5194/acp-12-10725-2012, 2012.
Crook, J. A., Jones, L. A., Forster, P. M., and Crook, R.: Climate change impacts on future photovoltaic and concentrated solar power energy output, Energy Environ. Sci., 4, 3101–3109, https://doi.org/10.1039/C1EE01495A, 2011.
Fast, J. D., Gustafson Jr, W. I., Easter, R. C., Zaveri, R. A., Barnard, J. C., Chapman, E. G., Grell, G. A., and Peckham, S. E.: Evolution of ozone, particulates, and aerosol direct radiative forcing in the vicinity of Houston using a fully coupled meteorology-chemistry-aerosol model, J. Geophys. Res., 111, D21305, https://doi.org/10.1029/2005JD006721, 2006.
Gaetani, M., Huld, T., Vignati, E., Monforti-Ferrario, F., Dosio, A., and Raes, F.: The near future availability of photovoltaic energy in Europe and Africa in climate-aerosol modeling experiments, Renew. Sustain. Energ. Rev., 38, 706–716, https://doi.org/10.1016/j.rser.2014.07.041, 2014.
Geiger, H., Barnes, I., Bejan, I., Benter, T., and Spittler, M.: The tropospheric degradation of isoprene: an updated module for the regional atmospheric chemistry mechanism, Atmos. Environ., 37, 1503–1519, https://doi.org/10.1016/S1352-2310(02)01047-6, 2003.
Ghan, S. J., Leung, L. R., Easter, R. C., and Abdul-Razzak, H.: Prediction of cloud droplet number in a general circulation model, J. Geophys. Res., 102, 21777–21794, https://doi.org/10.1029/97JD01810, 1997.
Gil, V., Gaertner, M. A., Gutierrez, C., and Losada, T.: Impact of climate change on solar irradiation and variability over the Iberian Peninsula using regional climate models, Int. J. Climatol., 39, 1733–1747, https://doi.org/10.1002/joc.5916, 2019.
Ginoux, P., Chin, M., Tegen, I., Prospero, J. M., Holben, B., Dubovik, O., and Lin, S. J.: Sources and distributions of dust aerosols simulated with the GOCART model, J. Geophys. Res., 106, 20255–20273, https://doi.org/10.1029/2000JD000053, 2001.
Giorgetta, M., Jungclaus, J., Reick, C., Legutke, S., Brovkin, V., Crueger, T., Esch, M., Fieg, K., Glushak, K., Gayler, V., Haak, H., Hollweg, H.-D., Kinne, S., Kornblueh, L., Matei, D., Mauritsen, T., Mikolajewicz, U., Müller, W., Notz, D., Raddatz, T., Rast, S., Roeckner, E., Salzmann, M., Schmidt, H., Schnur, R., Segschneider, J., Six, K., Stockhause, M., Wegner, J., Widmann, H., Wieners, K.-H., Claussen, M., Marotzke, J., and Stevens, B.: Forcing Data for Regional Climate Models Based on the MPI-ESM-LR Model of the Max Planck Institute for Meteorology (MPI-M): The CMIP5 Historical Experiment, World Data Center for Climate (WDCC) at DKRZ, https://doi.org/10.1594/WDCC/RCM_CMIP5_historical-LR, 2012a.
Giorgetta, M., Jungclaus, J., Reick, C., Legutke, S., Brovkin, V., Crueger, T., Esch, M., Fieg, K., Glushak, K., Gayler, V., Haak, H., Hollweg, H.-D., Kinne, S., Kornblueh, L., Matei, D., Mauritsen, T., Mikolajewicz, U., Müller, W., Notz, D., Raddatz, T., Rast, S., Roeckner, E., Salzmann, M., Schmidt, H., Schnur, R., Segschneider, J., Six, K., Stockhause, M., Wegner, J., Widmann, H., Wieners, K.-H., Claussen, M., Marotzke, J., and Stevens, B.: Forcing data for Regional Climate Models Based on the MPI-ESM-LR model of the Max Planck Institute for Meteorology (MPI-M): The CMIP5rcp85 experiment, World Data Center for Climate (WDCC) at DKRZ, https://doi.org/10.1594/WDCC/RCM_CMIP5_rcp85-LR, 2012b.
Giorgi, F., Bi, X., and Qian, Y.: Direct radiative forcing and regional climatic effects of anthropogenic aerosols over East Asia: A regional coupled climate-chemistry/aerosol model study, J. Geophys. Res., 107, 4439, https://doi.org/10.1029/2001JD001066, 2002.
Gómez-Navarro, J. J., Montávez, J. P., Jiménez-Guerrero, P., Jerez, S., Lorente-Plazas, R., González-Rouco, J. F., and Zorita, E.: Internal and external variability in regional simulations of the Iberian Peninsula climate over the last millennium, Clim. Past, 8, 25–36, https://doi.org/10.5194/cp-8-25-2012, 2012.
Grell, G. A.: Prognostic evaluation of assumptions used by cumulus parameterizations, Mon. Weather Rev., 121, 764–787, https://doi.org/10.1175/1520-0493(1993)121<0764:PEOAUB>2.0.CO;2, 1993.
Grell, G. A. and Dévényi, D.: A generalized approach to parameterizing convection combining ensemble and data assimilation techniques. Geophys. Res. Lett., 29, 14, https://doi.org/10.1029/2002GL015311, 2002.
Grell, G. A., Peckham, S. E., Schmitz, R., McKeen, S. A., Frost, G., Skamarock, W. C., and Eder, B.: Fully coupled “online” chemistry within the WRF model, Atmos. Environ., 39, 6957–6975, https://doi.org/10.1016/j.atmosenv.2005.04.027, 2005.
Guenther, A., Karl, T., Harley, P., Wiedinmyer, C., Palmer, P. I., and Geron, C.: Estimates of global terrestrial isoprene emissions using MEGAN (Model of Emissions of Gases and Aerosols from Nature), Atmos. Chem. Phys., 6, 3181–3210, https://doi.org/10.5194/acp-6-3181-2006, 2006.
Gutiérrez, C., Somot, S., Nabat, P., Mallet, M., Gaertner, M. Á., and Perpiñán, O.: Impact of aerosols on the spatiotemporal variability of photovoltaic energy production in the Euro-Mediterranean area, Sol. Energy, 174, 1142–1152, https://doi.org/10.1016/j.solener.2018.09.085, 2018.
Gutiérrez, C., Somot, S., Nabat, P., Mallet, M., Corre, L., van Meijgaard, E., Perpiñán, O., and Gaertner, M. Á.: Future evolution of surface solar radiation and photovoltaic potential in Europe: investigating the role of aerosols, Environ. Res. Lett., 15, 034035, https://doi.org/10.1088/1748-9326/ab6666, 2020.
Hersbach, H., Bell, B., Berrisford, P., Hirahara, S., Horányi, A., Muñoz-Sabater, J., Nicolas, J., Peubey, C., Radu, R., Schepers, D., Simmons, A., Soci, C., Abdalla, S., Abellan, X., Balsamo, G., Bechtold, P., Biavati, G., Bidlot, J., Bonavita, M., De Chiara, G., Dahlgren, P., Dee, D., Diamantakis, M., Dragani, R., Flemming, J., Forbes, R., Fuentes, M., Geer, A., Haimberger, L., Healy, S., Hogan, R. J., Hólm, E., Janisková, M., Keeley, S., Laloyaux, P., Lopez, P., Lupu, C., Radnoti, G., de Rosnay, P., Rozum, I., Vamborg, F., Villaume, S., and Thépaut, J.-N.: The ERA5 global reanalysis, Q. J. Roy. Meteor. Soc., 146, 1999–2049, https://doi.org/10.1002/qj.3803, 2020.
Hong, S. Y., Noh, Y., and Dudhia, J.: A new vertical diffusion package with an explicit treatment of entrainment processes, Mon. Weather Rev., 134, 2318–2341, https://doi.org/10.1175/MWR3199.1, 2006.
Iacono, M. J., Delamere, J. S., Mlawer, E. J., Shephard, M. W., Clough, S. A., and Collins, W. D.: Radiative forcing by long-lived greenhouse gases: Calculations with the AER radiative transfer models, J. Geophys. Res., 113, D13103, doi:https://doi.org/10.1029/2008JD009944, 2018.
IPCC: Climate Change 2013: The Physical Science Basis. Contribution of Working Group I to the Fifth Assessment Report of the Intergovernmental Panel on Climate Change, edited by: Stocker, T. F., Qin, D., Plattner, G.-K., Tignor, M., Allen, S. K., Boschung, J., Nauels, A., Xia, Y., Bex, V., and Midgley, P. M., Cambridge University Press, Cambridge, United Kingdom and New York, NY, USA, 1535 pp., 2013.
IPCC: Climate Change 2014: Mitigation of Climate Change. Contribution of Working Group III to the Fifth Assessment Report of the Intergovernmental Panel on Climate Change, edited by: Edenhofer, O., Pichs-Madruga, R., Sokona, Y., Farahani, E., Kadner, S., Seyboth, K., Adler, A., Baum, I., Brunner, S., Eickemeier, P., Kriemann, B., Savolainen, J., Schlömer, S., von Stechow, C., Zwickel T., and Minx, J. C., Cambridge University Press, Cambridge, United Kingdom and New York, NY, USA, 2014.
IRENA: Global energy transformation: A roadmap to 2050 (2019 edition), International Renewable Energy Agency, Abu Dhabi, 2019.
Jacob, D., Petersen, J., Eggert, B., Alias, A., Christensen, O. B., Bouwer, L. M., Braun, A., Colette, A., Déqué, M., Georgievski, G., Georgopoulou, E., Gobiet, A., Menut, L., Nikulin, G., Haensler, A., Hempelmann, N., Jones, C., Keuler, K., Kovats, S., Kröner, N., Kotlarski, S., Kriegsmann, A., Martin, E., van Meijgaard, E., Moseley, C., Pfeifer, S., Preuschmann, S., Radermacher, C., Radtke, K., Rechid, D., Rounsevell, M., Samuelsson, P., Somot, S., Soussana, J.-F., Teichmann, C., Valentini, R., Vautard, R., Weber, B., and Yiou, P.: EURO-CORDEX: new high-resolution climate change projections for European impact research, Reg. Environ. Change, 14, 563–578, https://doi.org/10.1007/s10113-013-0499-2, 2014.
Jacob, D., Teichmann, C., Sobolowski, S., Katragkou, E., Anders, I., Belda, M., Benestad, R., Boberg, F., Buonomo, E., Cardoso, R. M., Casanueva, A., Christensen, O. B., Christensen, J. H., Coppola, E., De Cruz, L., Davin, E. L., Dobler, A., Domínguez, M., Fealy, R., Fernandez, J., Gaertner, M. A., García-Díez, M., Giorgi, F., Gobiet, A., Goergen, K., Gómez-Navarro, J. J., González-Alemán, J. J., Gutiérrez, C., Gutiérrez, J. M., Güttler, I., Haensler, A., Halenka, T., Jerez, S., Jiménez-Guerrero, P., Jones, R. G., Keuler, K., Kjellström, E., Knist, S., Kotlarski, S., Maraun, D., van Meijgaard, E., Mercogliano, P., Montávez, J. P., Navarra, A., Nikulin, G., de Noblet-Ducoudré, N., Panitz, H.-J., Pfeifer, S., Piazza, M., Pichelli, E., Pietikäinen, J.-P., Prein, A. F., Preuschmann, S., Rechid, D., Rockel, B., Romera, R., Sánchez, E., Sieck, K., Soares, P. M. M., Somot, S., Srnec, L., Sørland, S. L., Termonia, P., Truhetz, H., Vautard, R., Warrach-Sagi, K., and Wulfmeyer, V.: Regional climate downscaling over Europe: perspectives from the EURO-CORDEX community, Reg. Environ. Change, 20, 51, https://doi.org/10.1007/s10113-020-01606-9, 2020.
Jerez, S., Trigo, R. M., Vicente-Serrano, S. M., Pozo-Vázquez, D., Lorente-Plazas, R., Lorenzo-Lacruz, J., Santos-Alamillos, F., and Montávez, J. P.: The impact of the North Atlantic Oscillation on renewable energy resources in southwestern Europe, J. Appl. Meteorol. Clim., 52, 2204–2225, https://doi.org/10.1175/JAMC-D-12-0257.1, 2013.
Jerez, S., Tobin, I., Vautard, R., Montávez, J. P., López-Romero, J. M., Thais, F., Bartok, B., Christensen, O. B., Colette, A., Déqué, M., Nikulin, G., Kotlarski, S., van Meijgaard, E., Teichmann, C., and Wild, M.: The impact of climate change on photovoltaic power generation in Europe, Nat. Commun., 6, 10014, https://doi.org/10.1038/ncomms10014, 2015.
Jerez, S., López-Romero, J. M., Turco, M., Jiménez-Guerrero, P., Vautard, R., and Montávez, J. P.: Impact of evolving greenhouse gas forcing on the warming signal in regional climate model experiments, Nat. Commun., 9, 1304, https://doi.org/10.1038/s41467-018-03527-y, 2018.
Jerez, S., Tobin, I., Turco, M., Jiménez-Guerrero, P., Vautard, R., and Montávez, J. P.: Future changes, or lack thereof, in the temporal variability of the combined wind-plus-solar power production in Europe, Renew. Energ., 139, 251–260, https://doi.org/10.1016/j.renene.2019.02.060, 2019.
Jerez, S., Palacios-Peña, L., Gutiérrez, C., Jiménez-Guerrero, P., López-Romero, J. M., Pravia-Sarabia, E., and Montávez J. P.: Sensitivity of surface solar radiation to aerosol-radiation and aerosol-clouds interactions over Europe in WRFv3.6.1 climatic runs with fully interactive aerosols, B2SHARE EUDAT, https://doi.org/10.23728/b2share.a65d25c2b3ba49e1a46e970783e9476e, 2020.
Jiménez, P., Baldasano, J. M., and Dabdub, D.: Comparison of photochemical mechanisms for air quality modeling, Atmos. Environ., 37, 4179–4194, https://doi.org/10.1016/S1352-2310(03)00567-3, 2003.
Kinne, S.: Aerosol radiative effects with MACv2, Atmos. Chem. Phys., 19, 10919–10959, https://doi.org/10.5194/acp-19-10919-2019, 2019.
Kloster, S., Dentener, F., Feichter, J., Raes, F., Lohmann, U., Roeckner, E., and Fischer-Bruns, I.: A GCM study of future climate response to aerosol pollution reductions, Clim. Dynam., 34, 1177–1194, https://doi.org/10.1007/s00382-009-0573-0, 2010.
Lamarque, J.-F., Bond, T. C., Eyring, V., Granier, C., Heil, A., Klimont, Z., Lee, D., Liousse, C., Mieville, A., Owen, B., Schultz, M. G., Shindell, D., Smith, S. J., Stehfest, E., Van Aardenne, J., Cooper, O. R., Kainuma, M., Mahowald, N., McConnell, J. R., Naik, V., Riahi, K., and van Vuuren, D. P.: Historical (1850–2000) gridded anthropogenic and biomass burning emissions of reactive gases and aerosols: methodology and application, Atmos. Chem. Phys., 10, 7017–7039, https://doi.org/10.5194/acp-10-7017-2010, 2010.
Lee, S. S., Donner, L. J., Phillips, V. T., and Ming, Y.: Examination of aerosol effects on precipitation in deep convective clouds during the 1997 ARM summer experiment, Q. J. Roy. Meteor. Soc., 134, 1201–1220, https://doi.org/10.1002/qj.287, 2008.
Li, G., Wang, Y., and Zhang, R.: Implementation of a two-moment bulk microphysics scheme to the WRF model to investigate aerosol-cloud interaction, J. Geophys. Res., 113, D15211, doi:https://doi.org/10.1029/2007JD009361, 2008.
Li, X., Wagner, F., Peng, W., Yang, J., and Mauzerall, D. L.: Reduction of solar photovoltaic resources due to air pollution in China, P. Natl. Acad. Sci. USA, 114, 11867–11872, https://doi.org/10.1073/pnas.1711462114, 2017.
Lin, Y. L., Farley, R. D., and Orville, H. D.: Bulk parameterization of the snow field in a cloud model, J. Appl. Meteorol. Clim., 22, 1065–1092, https://doi.org/10.1175/1520-0450(1983)022<1065:BPOTSF>2.0.CO;2, 1983.
Liu, Y., Daum, P. H., and McGraw, R. L.: Size truncation effect, threshold behavior, and a new type of autoconversion parameterization, Geophys. Res. Lett., 32, L11811, https://doi.org/10.1029/2005GL022636, 2005.
López-Romero, J. M., Montávez, J. P., Jerez, S., Lorente-Plazas, R., Palacios-Peña, L., and Jiménez-Guerrero, P.: Precipitation response to aerosol–radiation and aerosol–cloud interactions in regional climate simulations over Europe, Atmos. Chem. Phys., 21, 415–430, https://doi.org/10.5194/acp-21-415-2021, 2021.
Malm, W. C., Sisler, J. F., Huffman, D., Eldred, R. A., and Cahill, T. A.: Spatial and seasonal trends in particle concentration and optical extinction in the United States, J. Geophys. Res., 99, 1347–1370, https://doi.org/10.1029/93JD02916, 1994.
Moss, R. H., Edmonds, J. A., Hibbard, K. A., Manning, M. R., Rose, S. K., Van Vuuren, D. P., Carter, T. R., Emori, S., Kainuma, M., Kram,T., Meehl, G. A., Mitchell, J. F. B., Nakicenovic, N., Riahi, K., Smith, S. J., Stouffer, R. J., Thomson,A. M., Weyant, J. P., and Wilbanks, T. J.: The next generation of scenarios for climate change research and assessment, Nature, 463, 747–756, https://doi.org/10.1038/nature08823, 2010.
Müller, J., Folini, D., Wild, M., and Pfenninger, S.: CMIP-5 models project photovoltaics are a no-regrets investment in Europe irrespective of climate change, Energy, 171, 135–148, https://doi.org/10.1016/j.energy.2018.12.139, 2019.
Nabat, P., Somot, S., Mallet, M., Sanchez-Lorenzo, A., and Wild, M.: Contribution of anthropogenic sulfate aerosols to the changing Euro-Mediterranean climate since 1980, Geophys. Res. Lett., 41, 5605–5611, doi:https://doi.org/10.1002/2014GL060798, 2014.
Nabat, P., Somot, S., Mallet, M., Sevault, F., Chiacchio, M., and Wild, M.: Direct and semi-direct aerosol radiative effect on the Mediterranean climate variability using a coupled regional climate system model, Clim. Dynam., 44, 1127–1155, https://doi.org/10.1007/s00382-014-2205-6, 2015a.
Nabat, P., Somot, S., Mallet, M., Michou, M., Sevault, F., Driouech, F., Meloni, D., di Sarra, A., Di Biagio, C., Formenti, P., Sicard, M., Léon, J.-F., and Bouin, M.-N.: Dust aerosol radiative effects during summer 2012 simulated with a coupled regional aerosol–atmosphere–ocean model over the Mediterranean, Atmos. Chem. Phys., 15, 3303–3326, https://doi.org/10.5194/acp-15-3303-2015, 2015b.
Palacios-Peña, L., Lorente-Plazas, R., Montávez, J. P., and Jiménez-Guerrero, P.: Saharan Dust Modeling Over the Mediterranean Basin and Central Europe: Does the Resolution Matter?, Front. Earth Sci., 7, 290, https://doi.org/10.3389/feart.2019.00290, 2019.
Palacios-Peña, L., Montávez, J. P., López-Romero, J. M., Jerez, S., Gómez-Navarro, J. J., Lorente-Plazas, R., Ruiz, J., and Jiménez-Guerrero, P.: Added Value of Aerosol-Cloud Interactions for Representing Aerosol Optical Depth in an Online Coupled Climate-Chemistry Model over Europe, Atmosphere-Basel, 11, 360, https://doi.org/10.3390/atmos11040360, 2020.
Pavlidis, V., Katragkou, E., Prein, A., Georgoulias, A. K., Kartsios, S., Zanis, P., and Karacostas, T.: Investigating the sensitivity to resolving aerosol interactions in downscaling regional model experiments with WRFv3.8.1 over Europe, Geosci. Model Dev., 13, 2511–2532, https://doi.org/10.5194/gmd-13-2511-2020, 2020.
Rohrig, K., Berkhout, V., Callies, D., Durstewitz, M., Faulstich, S., Hahn, B., Jung, M., Pauscher, L., Seibel, A., Shan, M., Siefert, M., Steffen, J., Collmann, M., Czichon, S., Dörenkämper, M., Gottschall, J., Lange, B., Ruhle, A., Sayer, F., Stoevesandt, B., and Wenske J.: Powering the 21st century by wind energy – Options, facts, figures, Appl. Phys. Rev., 6, 031303, https://doi.org/10.1063/1.5089877, 2019.
Rummukainen, M.: State-of-the-art with regional climate models, WIRES Clim. Change, 1, 82–96, https://doi.org/10.1002/wcc.8, 2010.
Ruti, P. M., Somot, S., Giorgi, F., Dubois, C., Flaounas, E., Obermann, A., Dell'Aquila, A., Pisacane, G., Harzallah, A., Lombardi, E., Ahrens, B., Akhtar, N., Alias, A., Arsouze, T., Aznar, R., Bastin, S., Bartholy, J., Béranger, K., Beuvier, J., Bouffies-Cloché, S., Brauch, J., Cabos, W., Calmanti, S., Calvet, J.-C., Carillo, A., Conte, D., Coppola, E., Djurdjevic, V., Drobinski, P., Elizalde-Arellano, A., Gaertner, M., Galàn, P., Gallardo, C., Gualdi, S., Goncalves, M., Jorba, O., Jordà, G., L'Heveder, B., Lebeaupin-Brossier, C., Li, L., Liguori, G., Lionello, P., Maciàs, D., Nabat, P., Önol, B., Raikovic, B., Ramage, K., Sevault, F., Sannino, G., Struglia, M. V., Sanna, A., Torma, C., and Vervatis, V.: MED-CORDEX initiative for Mediterranean climate studies, B. Am. Meteorol. Soc., 97, 1187–1208, https://doi.org/10.1175/BAMS-D-14-00176.1, 2016.
Schewe, J., Gosling, S. N., Reyer, C., Zhao, F., Ciais, P., Elliott, J., Francois, L., Huber, V., Lotze, H. K., Seneviratne, S. I., van Vliet, M. T. H., Vautard, R., Wada, Y., Breuer, L., Büchner, M., Carozza, D. A., Chang, J., Coll, M., Deryng, D., de Wit, A., Eddy, T. D., Folberth, C., Frieler, K., Friend, A. D., Gerten, D., Gudmundsson, L., Hanasaki, N., Ito, A., Khabarov, N., Kim, H., Lawrence, P., Morfopoulos, C., Müller, C., Schmied, H. M., Orth, R., Ostberg, S., Pokhrel, Y., Pugh, T. A. M., Sakurai, G., Satoh, Y., Schmid, E., Stacke, T., Steenbeek, J., Steinkamp, J., Tang, Q., Tian, H., Tittensor, D.P., Volkholz, J., Wang, X., and Warszawski, L.: State-of-the-art global models underestimate impacts from climate extremes, Nat. Commun., 10, 1005, https://doi.org/10.1038/s41467-019-08745-6, 2019.
Seinfeld, J. H., Bretherton, C., Carslaw, K. S., Coe, H., DeMott, P. J., Dunlea, E. J., Feingold, G., Ghan, S., Guenther, A. B., Kahn, R., Kraucunas, I., Kreidenweis, S. M., Molina, M J., Nenes, A., Penner, J. E., Prather, K. A., Ramanathan, V., Ramaswamy, V., Rasch, P. J., Ravishankara, A. R., Rosenfeld, D., Stephens, G., and Wood, R.: Improving our fundamental understanding of the role of aerosol-cloud interactions in the climate system, P. Natl. Acad. Sci. USA, 113, 5781–5790, https://doi.org/10.1073/pnas.1514043113, 2016.
Skamarock, W. C., Klemp, J. B., Dudhia, J., Gill, D. O., Barker, D. M., Wang, W., and Powers, J. G.:. A description of the Advanced Research WRF version 3, Technical report, NCAR Tech. Note TN-475+STR, https://doi.org/10.5065/D68S4MVH, 2008.
Soares, P. M. M., Brito, M. C., and Careto, J. A.: Persistence of the high solar potential in Africa in a changing climate, Environ. Res. Lett., 14, 124036, https://doi.org/10.1088/1748-9326/ab51a1, 2019.
Sørland, S. L., Schär, C., Lüthi, D., and Kjellström, E.: Bias patterns and climate change signals in GCM-RCM model chains, Environ. Res. Lett., 13, 074017, https://doi.org/10.1088/1748-9326/aacc77, 2018.
Stockwell, W. R., Kirchner, F., Kuhn, M., and Seefeld, S.: A new mechanism for regional atmospheric chemistry modeling, J. Geophys. Res., 102, 25847–25879, https://doi.org/10.1029/97JD00849, 1997.
Taylor, K. E., Stouffer, R. J., and Meehl, G. A.: An overview of CMIP5 and the experiment design, B. Am. Meteorol. Soc., 93, 485–498, https://doi.org/10.1175/BAMS-D-11-00094.1, 2012.
Tewari, M., Chen, F., Wang, W., Dudhia, J., LeMone, M. A., Mitchell, K., Ek, M., Gayno, G., Wegiel, J. W., and Cuenca, R. H.: Implementation and verification of the unified NOAH land surface model in the WRF model, 20th conference on weather analysis and forecasting/16th conference on numerical weather prediction (Vol. 1115), American Meteorological Society, Seattle, WA, 14 January 2004, Paper Number 17.5, 2004.
Tobin, I., Greuell, W., Jerez, S., Ludwig, F., Vautard, R., Van Vliet, M. T. H., and Breón, F. M.: Vulnerabilities and resilience of European power generation to 1.5∘C, 2∘C and 3∘C warming, Environ. Res. Lett., 13, 044024, https://doi.org/10.1088/1748-9326/aab211, 2018.
van der Wiel, K., Bloomfield, H. C., Lee, R. W., Stoop, L. P., Blackport, R., Screen, J. A., and Selten, F. M.: The influence of weather regimes on European renewable energy production and demand, Environ. Res. Lett., 14, 094010, https://doi.org/10.1088/1748-9326/ab38d3, 2019.
Wang, H., Xie, S. P., Tokinaga, H., Liu, Q., and Kosaka, Y.: Detecting cross-equatorial wind change as a fingerprint of climate response to anthropogenic aerosol forcing, Geophys. Res. Lett., 43, 3444–3450, https://doi.org/10.1002/2016GL068521, 2016.
Wilcox, L. J., Highwood, E. J., and Dunstone, N. J.: The influence of anthropogenic aerosol on multi-decadal variations of historical global climate, Environ. Res. Lett., 8, 024033, https://doi.org/10.1088/1748-9326/8/2/024033, 2013.
Wild, M., Folini, D., Henschel, F., Fischer, N., and Müller, B.: Projections of long-term changes in solar radiation based on CMIP5 climate models and their influence on energy yields of photovoltaic systems, Sol. Energy, 116, 12–24, https://doi.org/10.1016/j.solener.2015.03.039, 2015.
Wild, O., Zhu, X., and Prather, M. J.: Fast-J: Accurate Simulation of In-and Below-Cloud Photolysis in Tropospheric Chemical Models, J. Atmos. Chem., 37, 245–282, https://doi.org/10.1023/A:1006415919030, 2000.
Yin, Y., Levin, Z., Reisin, T., and Tzivion, S.: Seeding convective clouds with hygroscopic flares: Numerical simulations using a cloud model with detailed microphysics, J. Appl. Meteorol., 39, 1460–1472, https://doi.org/10.1175/1520-0450(2000)039<1460:SCCWHF>2.0.CO;2, 2000.