the Creative Commons Attribution 4.0 License.
the Creative Commons Attribution 4.0 License.
 | 11 Jan 2021
Calibration of temperature-dependent ocean microbial processes in the cGENIE.muffin (v0.9.13) Earth system model
Katherine A. Crichton
Jamie D. Wilson
Andy Ridgwell
Paul N. Pearson
Temperature is a master parameter in the marine carbon cycle, exerting a critical control on the rate of biological transformation of a variety of solid and dissolved reactants and substrates. Although in the construction of numerical models of marine carbon cycling, temperature has been long recognised as a key parameter in the production and export of organic matter at the ocean surface, its role in the ocean interior is much less frequently accounted for. There, bacteria (primarily) transform sinking particulate organic matter (POM) into its dissolved constituents and consume dissolved oxygen (and/or other electron acceptors such as sulfate). The nutrients and carbon thereby released then become available for transport back to the surface, influencing biological productivity and atmospheric pCO2, respectively. Given the substantial changes in ocean temperature occurring in the past, as well as in light of current anthropogenic warming, appropriately accounting for the role of temperature in marine carbon cycling may be critical to correctly projecting changes in ocean deoxygenation and the strength of feedbacks on atmospheric pCO2.
Here we extend and calibrate a temperature-dependent representation of marine carbon cycling in the cGENIE.muffin Earth system model, intended for both past and future climate applications. In this, we combine a temperature-dependent remineralisation scheme for sinking organic matter with a biological export production scheme that also includes a dependence on ambient seawater temperature. Via a parameter ensemble, we jointly calibrate the two parameterisations by statistically contrasting model-projected fields of nutrients, oxygen, and the stable carbon isotopic signature (δ13C) of dissolved inorganic carbon in the ocean with modern observations. We additionally explore the role of temperature in the creation and recycling of dissolved organic matter (DOM) and hence its impact on global carbon cycle dynamics.
We find that for the present day, the temperature-dependent version shows a fit to the data that is as good as or better than the existing tuned non-temperature-dependent version of the cGENIE.muffin. The main impact of accounting for temperature-dependent remineralisation of POM is in driving higher rates of remineralisation in warmer waters, in turn driving a more rapid return of nutrients to the surface and thereby stimulating organic matter production. As a result, more POM is exported below 80 m but on average reaches shallower depths in middle- and low-latitude warmer waters compared to the standard model. Conversely, at higher latitudes, colder water temperature reduces the rate of nutrient resupply to the surface and POM reaches greater depth on average as a result of slower subsurface rates of remineralisation. Further adding temperature-dependent DOM processes changes this overall picture only a little, with a slight weakening of export production at higher latitudes.
As an illustrative application of the new model configuration and calibration, we take the example of historical warming and briefly assess the implications for global carbon cycling of accounting for a more complete set of temperature-dependent processes in the ocean. We find that between the pre-industrial era (ca. 1700) and the present (year 2010), in response to a simulated air temperature increase of 0.9 ∘C and an associated projected mean ocean warming of 0.12 ∘C (0.6 ∘C in surface waters and 0.02 ∘C in deep waters), a reduction in particulate organic carbon (POC) export at 80 m of just 0.3 % occurs (or 0.7 % including a temperature-dependent DOM response). However, due to this increased recycling nearer the surface, the efficiency of the transfer of carbon away from the surface (at 80 m) to the deep ocean (at 1040 m) is reduced by 5 %. In contrast, with no assumed temperature-dependent processes impacting production or remineralisation of either POM or DOM, global POC export at 80 m falls by 2.9 % between the pre-industrial era and the present day as a consequence of ocean stratification and reduced nutrient resupply to the surface. Our analysis suggests that increased temperature-dependent nutrient recycling in the upper ocean has offset much of the stratification-induced restriction in its physical transport.
- Article
(8351 KB) - Full-text XML
- BibTeX
- EndNote


The cycle of carbon through the ocean is dominated by the production, destruction, and transformation of both dissolved and particulate organic matter (DOM and POM, respectively) (Legendre et al., 2015; Heinze et al., 2015). The “biological carbon pump” (Fig. 1) is central in this – acting through phytoplankton growth to remove carbon (and nutrients) from the surface and mixed layer waters and subsequently transferring it to the deep, principally via the sinking of POM (see Hülse et al., 2017, for a review) and to a lesser extent via the subduction of DOM. Export of POM out of the near-surface euphotic zone is principally controlled by photosynthesis rates (primary production) together with zooplankton grazing, respiration, and other food web processes (Steinberg and Landry, 2017; Mari et al., 2017). Of this export, only a fraction ultimately reaches the deep ocean as the initial export flux is filtered through a series of further processes and transformations involving feeding and remineralisation by microbes and other biota; it is further modulated by the sinking speeds and composition of the sinking matter itself (Bach et al., 2016; Rosengard et al., 2015; Turner, 2015). At the ocean floor, organic matter undergoes further microbial degradation and transformation before the residual is buried in accumulating marine sediments. Removing carbon from surface waters and storing it for centuries (intermediate depths), millennia (deep ocean), or multi-millennia (sediments) exerts an important control on atmospheric pCO2, which would otherwise be some 150 to 200 ppm higher than present in the absence of any biological activity in the ocean (Parekh et al., 2005; Sarmiento and Gruber, 2006). Ocean circulation generally acts against the biological pump, geochemically homogenising the ocean interior and returning carbon (and nutrients) back to the surface. Surface-to-deep geochemical gradients and storage of carbon in the ocean are hence a function of the rate of ocean ventilation in conjunction with the rate of biological export of carbon from the surface and, importantly, the rate at which the organic matter is remineralised in the ocean interior.
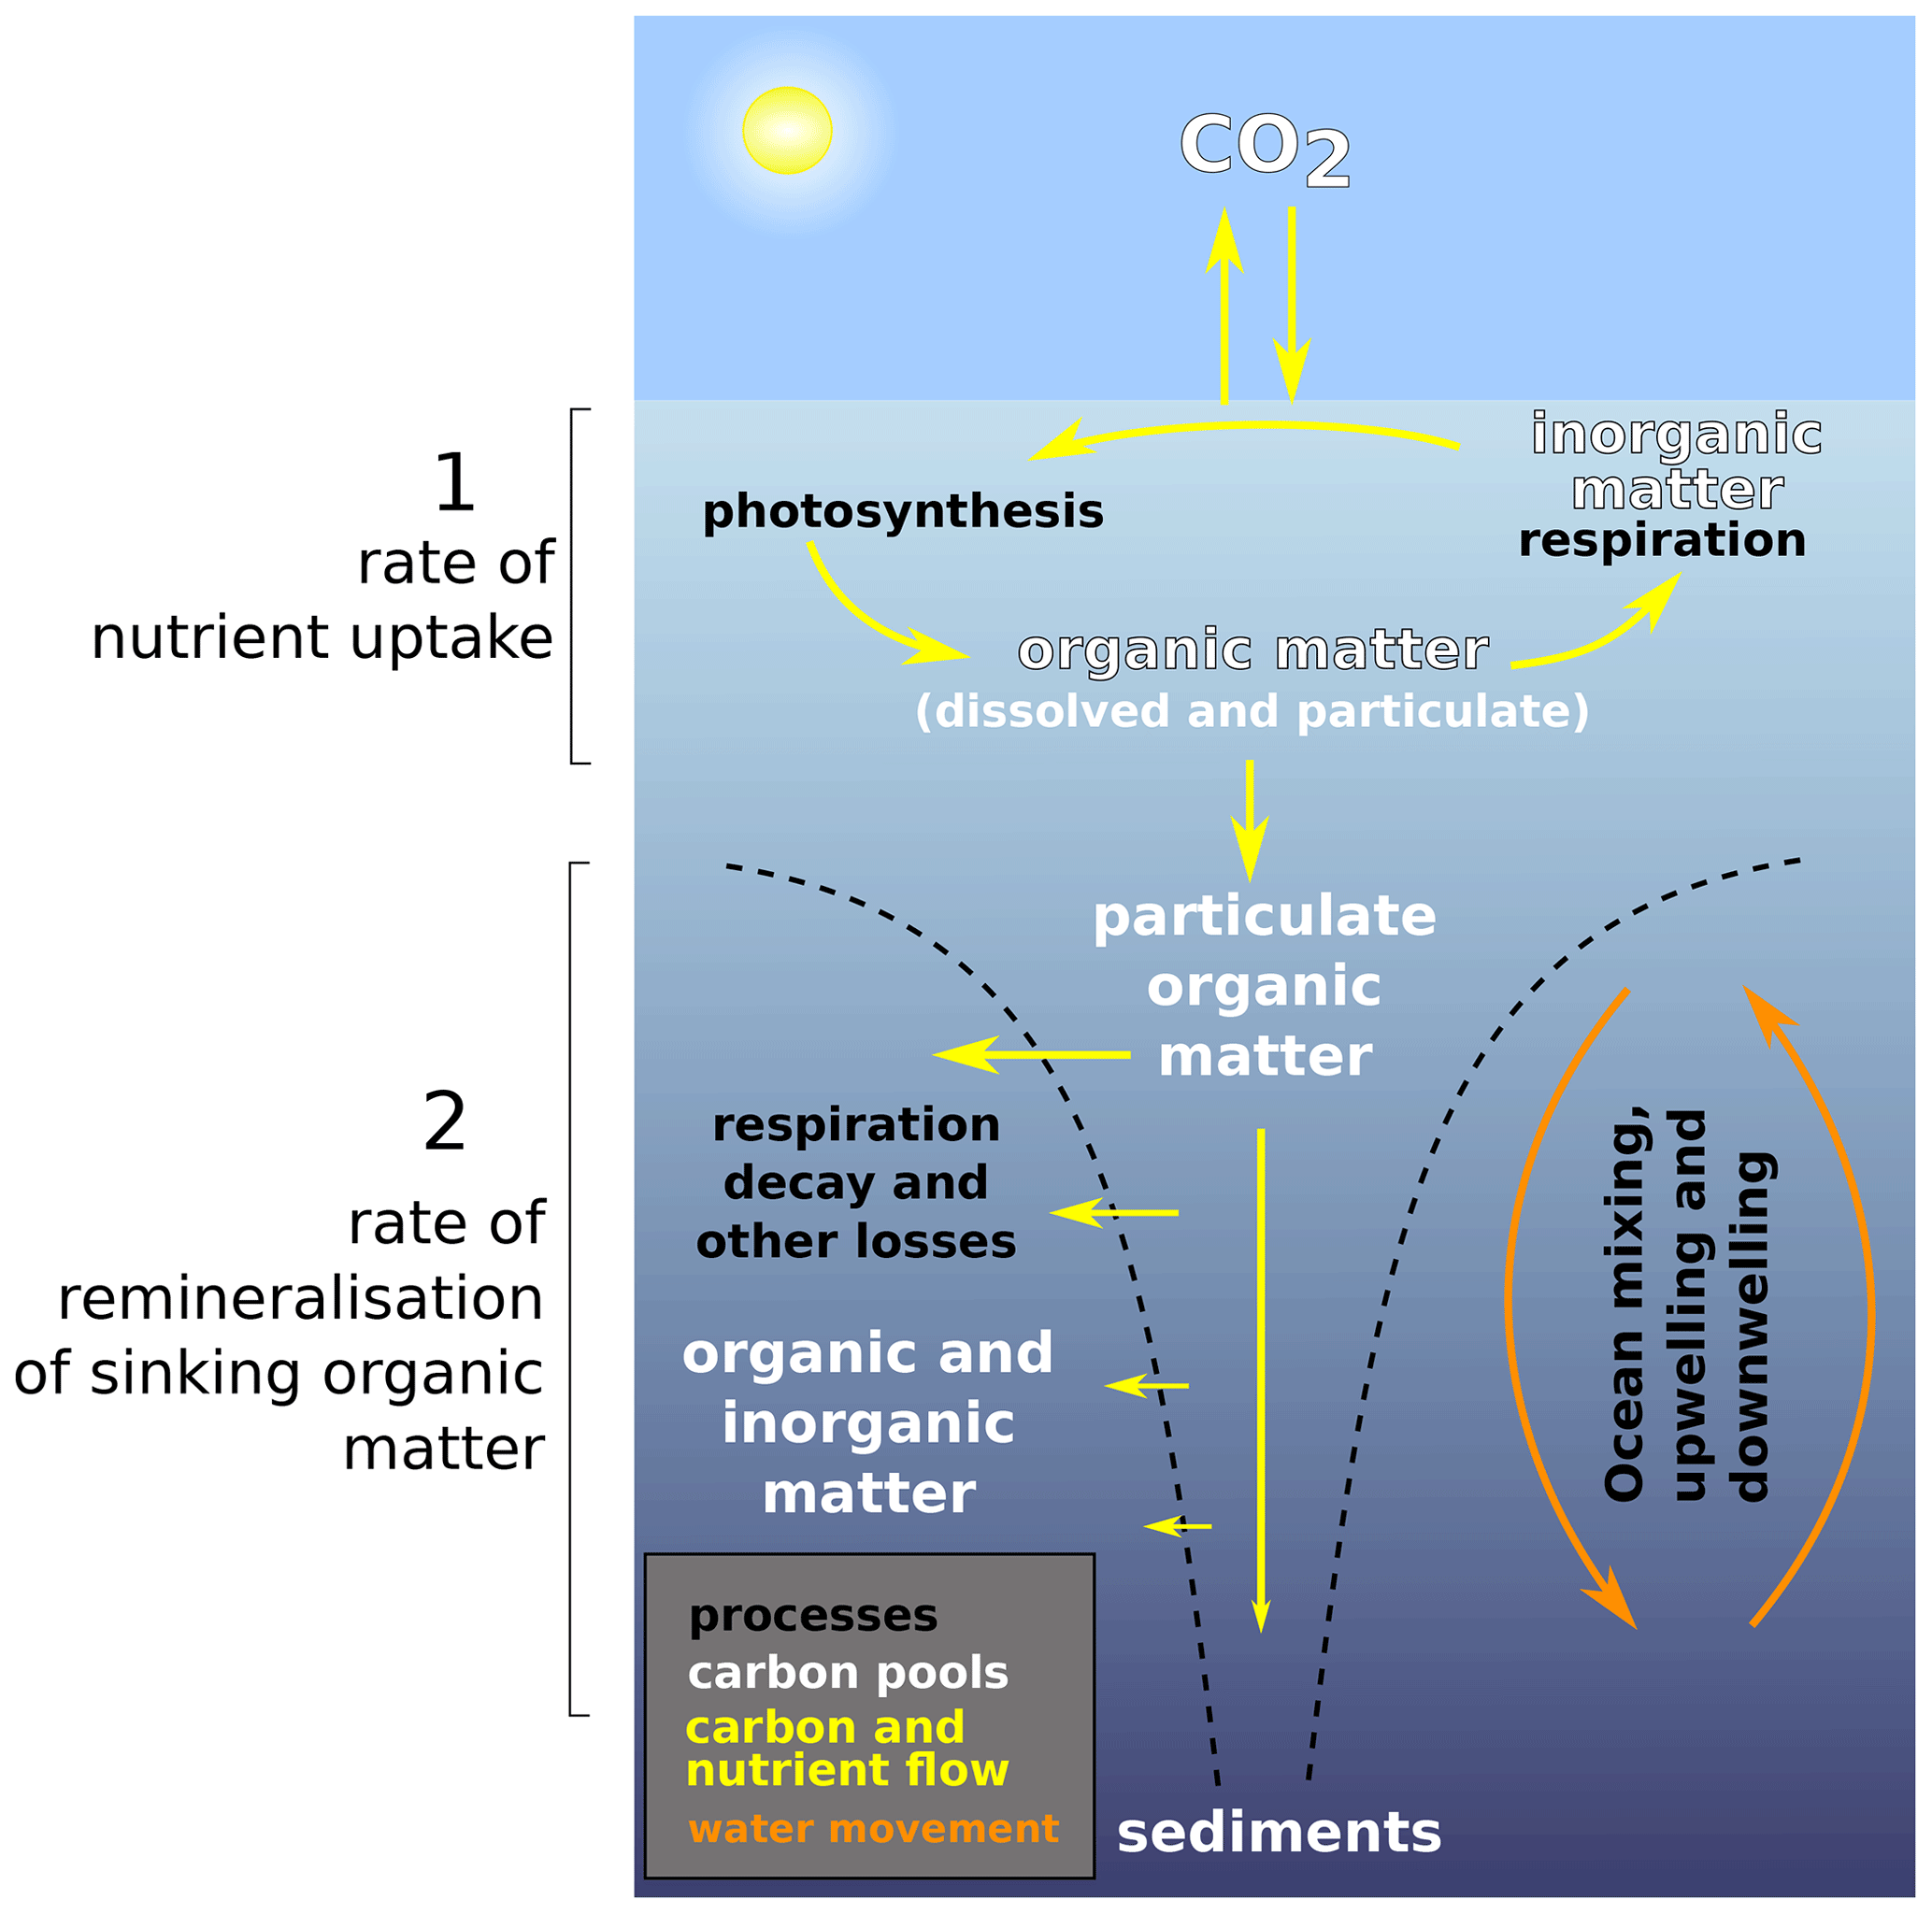
Figure 1Simplified schematic of the ocean biological pump and dissolved nutrient movements, as well as the two temperature-dependent processes that are considered in this study. (1) Nutrient uptake rate and (2) remineralisation rate. In the style of the U.S. DOE (2008). We do not model sediments in this study, but they appear in the figure for completeness.
To a first order, export of carbon out of the mixed layer in a warming world will be reduced as a consequence of increased ocean stratification reducing nutrient resupply to surface waters (Pörtner et al., 2014; Reusch and Boyd, 2013). However, the export of carbon is only one of the pertinent factors in marine carbon cycling. Also important is the “transfer efficiency” of the biological pump – the fraction of exported carbon that reaches the inner ocean or, alternatively, the mean depth below the surface at which this carbon is remineralised and dissolved inorganic carbon (DIC) returned to the ocean. A deeper mean remineralisation depth equates to a more transfer-efficient biological carbon pump. The subsurface processes that affect the biological carbon pump efficiency are also temperature-dependent (Bendtsen et al., 2015; Turner, 2015; Boscolo-Galazzo et al., 2018), complicating the net response of the biological carbon pump and carbon sequestration in the ocean interior to changes in global warming.
Not all ocean biogeochemical models and associated global carbon cycle studies account for temperature controls on (and hence the efficiency of) the biological carbon pump (some that do include the following: Kvale et al., 2019; Yamamoto et al., 2018; Cao and Zhang, 2017; Laufkötter et al., 2016; Kvale et al., 2015; Segschneider and Bendtsen, 2013; Chikamoto et al., 2012; Moore et al., 2002). Hülse et al. (2017) presented an extensive review of how EMICs (Earth system models of intermediate complexity) and box models treat ocean carbon cycle processes and summarised how inner ocean processes are less well constrained than surface processes in many models and how their treatment in models is much more variable. This is also the case for more complex ocean models, such as those participating in CMIP5 (Coupled Model Intercomparison Project 5) and used to inform the recent IPCC assessment (Bopp et al., 2013; Burd et al., 2016). However, the temperature dependency of inner ocean processes has been found to have an important impact on nutrient distribution and therefore on primary production (Taucher and Oschlies, 2011) as well as biological pump efficiency (Laufkötter et al., 2017), arguing for the necessity of their inclusion in models.
All things being equal, higher ocean temperatures should drive a greater fraction of remineralisation to occur in the upper water column, facilitating increased carbon and nutrient return to the ocean surface. Higher surface temperature will also increase the ability of phytoplankton to take up and assimilate the resulting increased nutrient availability and hence re-export POM, although grazing pressure would also increase. However, higher temperatures also lower the solubility of CO2 at the surface and hence loss to the atmosphere. Furthermore, for a geologically rapid and transient warming at the surface such as is currently occurring, increased ocean stratification and reduced physical transport of carbon and nutrients back to the surface will occur. The multiple conflicting influences of temperature mean that even the net sign of the feedback between greenhouse warming and ocean carbon cycling is uncertain (Yamamoto et al., 2018). How carbon fixed at the surface is recycled via partitioning into DOM rather than exported as POM, and the rate at which DOM itself is recycled back into dissolved carbon and nutrients as temperatures rise, adds another complicating layer of temperature response and feedback.
To help tease apart the varying influences of temperature on marine carbon cycling and atmospheric CO2, we present and calibrate a temperature-dependent representation of the biological pump in the current “muffin” release of the cGENIE EMIC (Cao et al., 2009) (see the statement in the “Code availability” section). Our calibrated configuration is intended for use in global biogeochemical cycling studies that require a fuller consideration of the role of temperature in both the geological past and the future. For completeness, we additionally develop and test a pair of parameterisations for temperature dependency in the production and decay of DOM.
The basic framework of the cGENIE EMIC consists of a 3D frictional–geostrophic approximation ocean circulation model (Edwards and Marsh, 2005) coupled to a 2D dynamic–thermodynamic sea ice model (Marsh et al., 2011). As per previous calibrations of ocean biogeochemical cycles (e.g. Ridgwell et al., 2007), we employ the ocean circulation and sea ice model on a 36 x 36 equal area grid (10∘ longitude and uniform in the sine of latitude) and couple these with a 2D energy–moisture balance atmosphere model (EMBM) (Marsh et al., 2011) (an alternative to this – a 3D atmospheric general circulation model as in Holden et al., 2016 – also exists but is not employed in this study). For traceability, we employ a commonly used physical configuration with 16 vertical levels in the ocean and a present-day bathymetry following Cao et al. (2009) and retain all physics parameter values and boundary conditions controlling the climate system. The representation of the ocean carbon and other biogeochemical cycles together with ocean–atmosphere gas exchange, unless otherwise noted, also follow Cao et al. (2009) and are summarised in more detail below. The various temperature-dependent parameterisations that we substitute for the equivalent non-temperature-dependent processes in Cao et al. (2009) are described in full in this paper.
It is likely that both increased grazing pressure by zooplankton and primary production by phytoplankton will have an impact on export production in a warmer world (Paul et al., 2015; Turner, 2015). However, in the simplified biologically induced export flux (Maier-Reimer, 1993) scheme (Fig. 2) that we apply in cGENIE, we cannot explicitly consider the impact of increased grazing pressure in the surface waters. Regardless, we are interested in the wider question of the interaction of (any) temperature-dependent community production (as export production) with temperature-dependent microbial remineralisation in the ocean interior and its impact on the global ocean carbon cycle. We hence represent only the direct effect of temperature on large-scale metabolic processes (plankton photosynthesis (growth) and microbial respiration). Other factors such as particle size distributions, particle density (Cram et al., 2018), “ballasting” (e.g. Wilson et al., 2012), and sinking speed (determined by particle characteristics) (McDonnell et al., 2015) are generally determined within the food web and may be considered to be of secondary importance in the context of the gross role of temperature in global carbon cycling. Recently, Boyd et al. (2019) defined additional particle pumps in the ocean involving eddy subduction, diel vertical migration, mesopelagic migration, and seasonal lipid pumps. These processes are also outside the scope of this study, particularly in the absence of a sufficiently high-resolution ocean circulation model component, the absence of (fully coupled GCM) ocean–atmosphere dynamics and inter-annual variability, and without an explicit ecosystem including multiple trophic layers and explicit zooplankton behaviours.
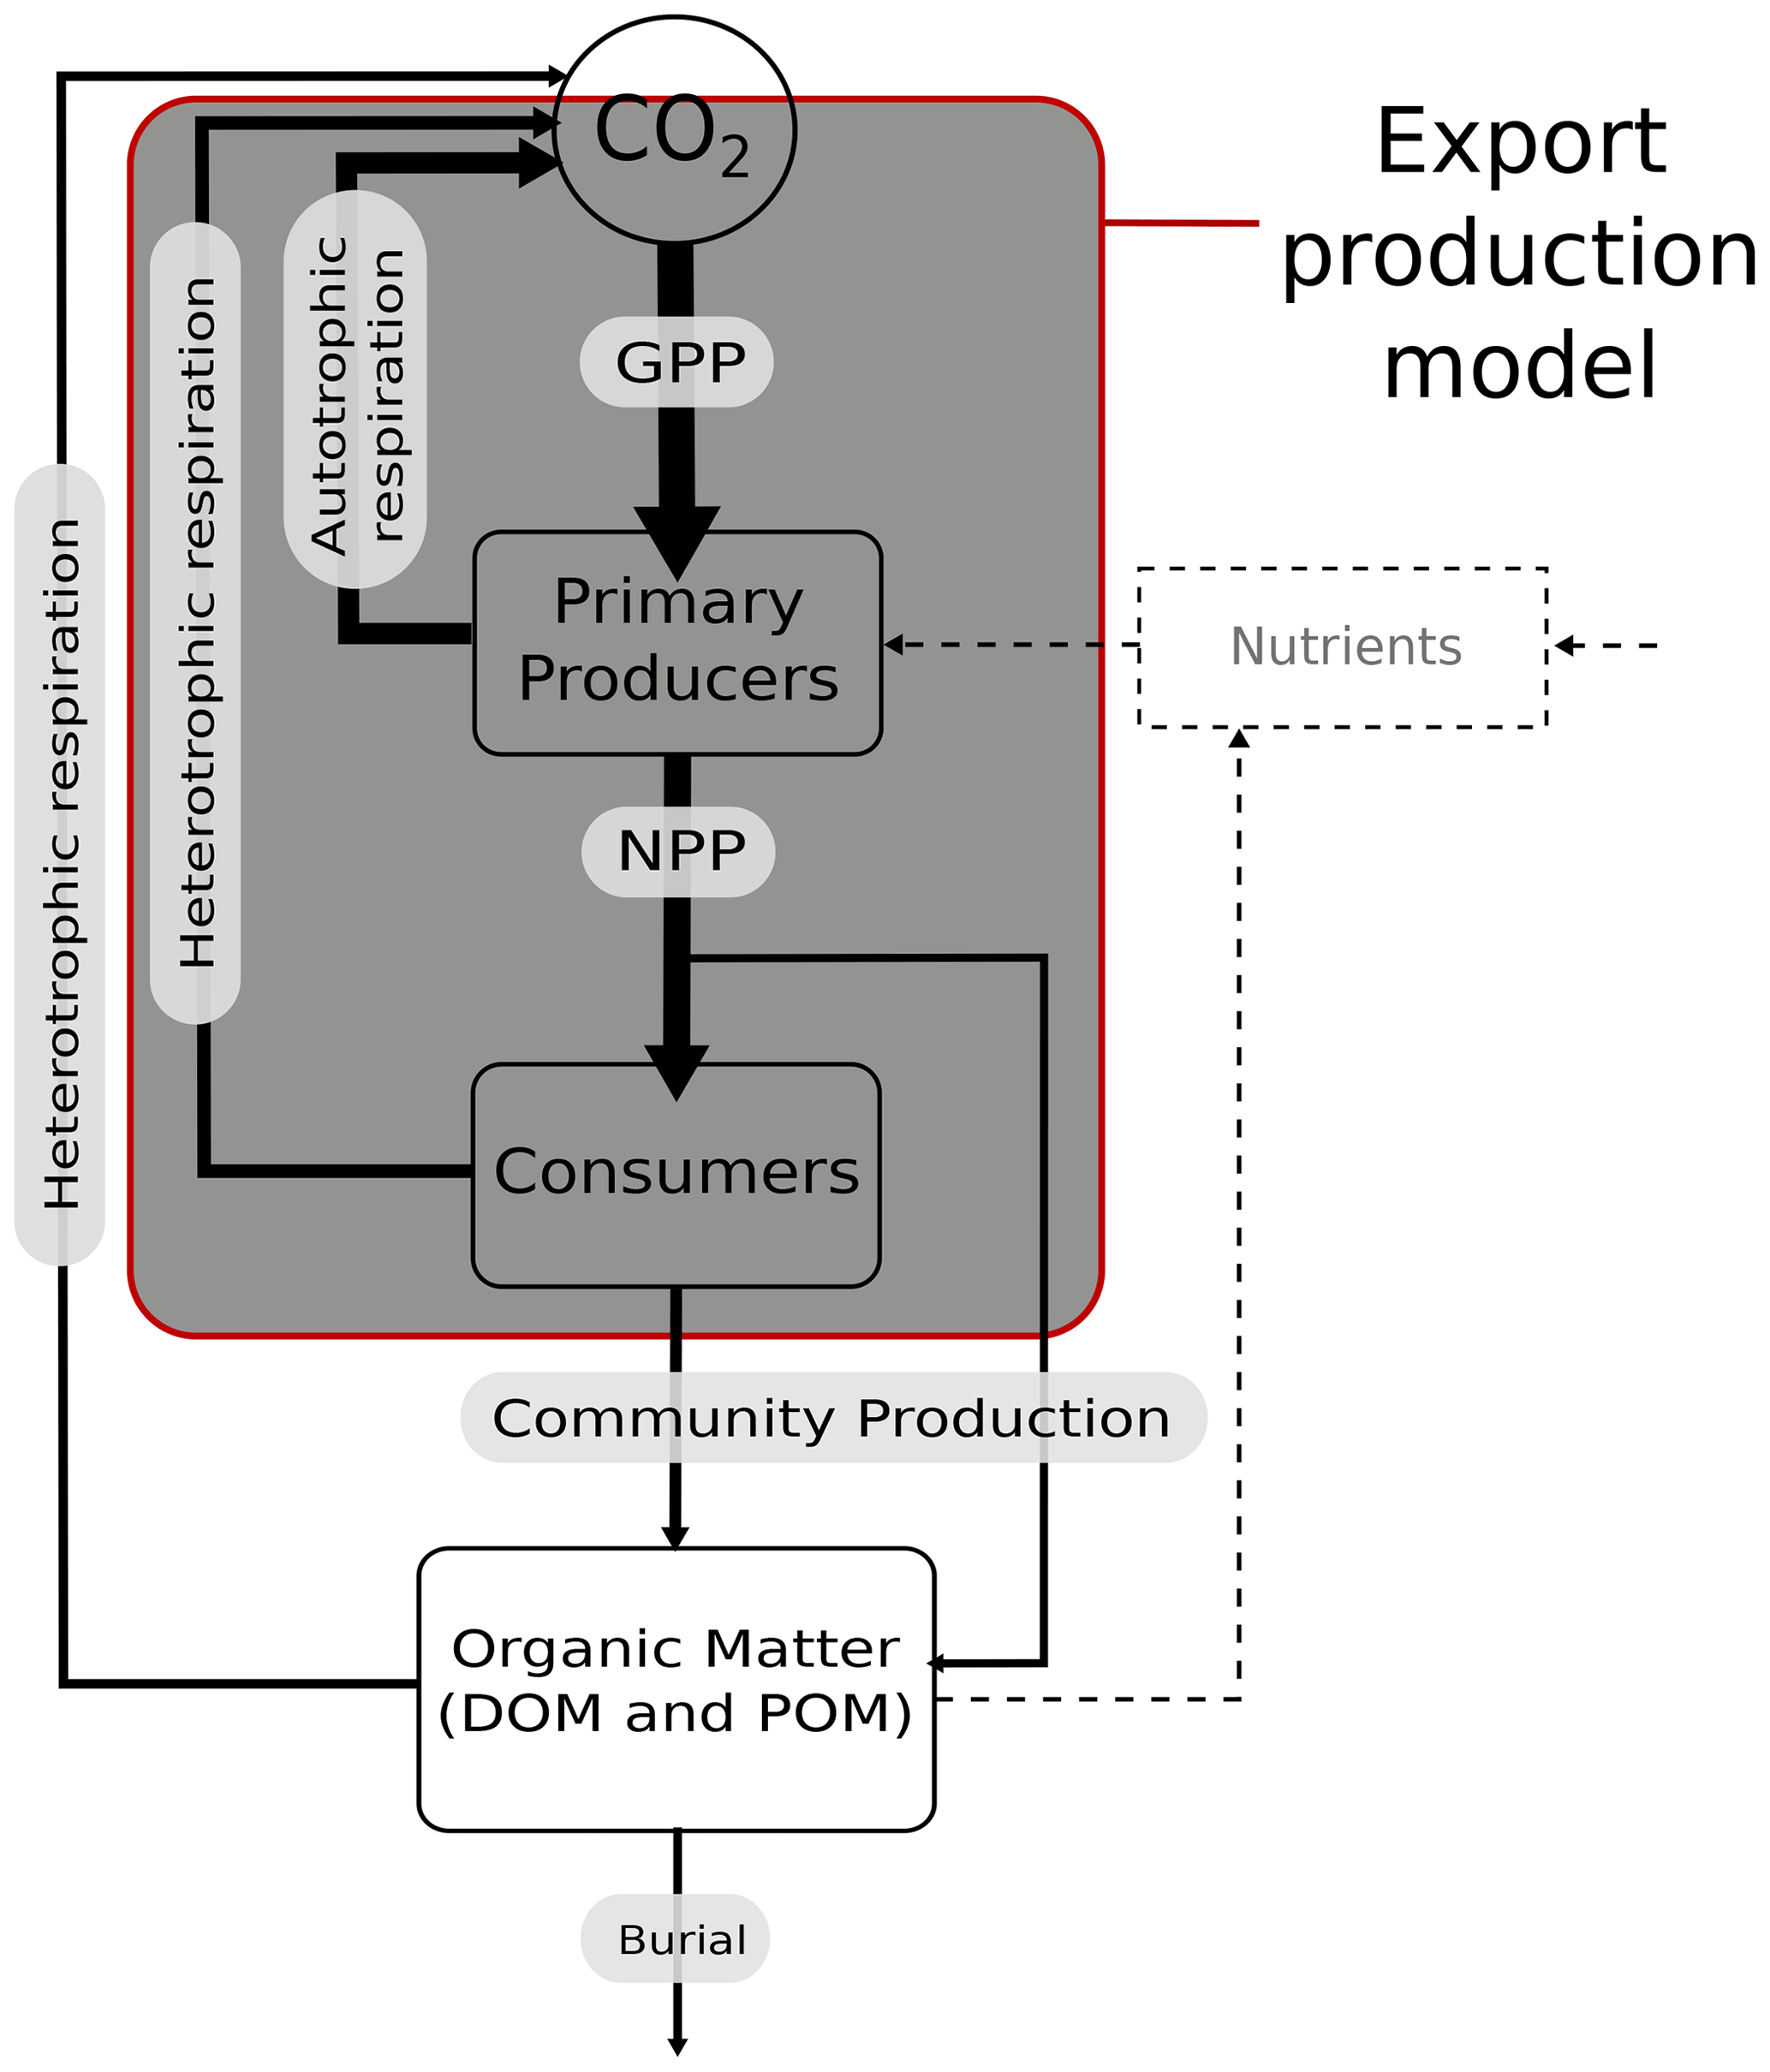
Figure 2Schematic of biological pump processes showing where cGENIE export production operates. In the export production model, no mechanistic consideration of the effects of temperature within the mixed layer (i.e. GPP vs. NPP vs. community production) can be considered, but heterotrophic respiration (as remineralisation) vs. community production (as export production) can be considered, as can nutrient recycling. In this study we apply temperature dependency to organic matter production and remineralisation that drives the biological carbon pump. We do not model burial in this version of cGENIE (but it is here for completeness). In this cGENIE configuration, the nutrient is phosphate. The dashed line indicates the cycling (and resupply due to circulation) of nutrients. Solid lines indicate the cycling of carbon.
2.1 Standard, non-temperature-dependent model formulation (STND)
In the original version of the biological uptake scheme (Ridgwell et al., 2007), nutrients are taken out of the surface ocean layer according to several factors including light incidence, ice fraction, nutrient uptake limitation (Michaelis–Menten type), and a prescribed maximum uptake rate (Eq. 1). In this, Γ, the net nutrient uptake (mol PO4 kg−1 yr−1) and hence net primary production in the surface ocean layer of the model, is described as
where is the maximum uptake rate (mol kg−1 yr−1), is the nutrient limitation term, PO4 is the local nutrient concentration (mol kg−1), is the Michaelis–Menten half-saturation value (mol kg−1), 1−Aice is the ice-free fraction of the sea surface (with Aice being the ice-covered fraction of a grid cell), and is the light limitation (based on incidence angle) term.
Here, a maximum uptake rate, (maximum rate of conversion of dissolved PO4, phosphate, into organic matter by phytoplankton) is prescribed and assigned a calibrated value of mol kg−1 yr−1 (Cao et al., 2009), while the calibrated Michaelis–Menten half-saturation value is mol kg−1 (Cao et al., 2009).
Nutrient uptake is instantaneously converted into organic matter export, both particulate organic matter (POM) and a fraction as dissolved organic matter (DOM), in a ratio of 1:2 following Najjar et al. (2007), and this represents community production (see Fig. 2). This production encompasses the entire surface food web, including the action of primary producers (phytoplankton) and the effect of consumers (e.g. grazers). In this export production model, dissolved inorganic carbon (DIC) is taken out of solution in the surface layer at a molar ratio of 106:1 to PO4 and O2 at a ratio of with PO4 (Redfield et al., 1963). POM is partitioned into two fractions, which conceptually are labile (fraction 1, POM1) and recalcitrant POM (fraction 2, POM2) (Ridgwell et al., 2007). POM sinks vertically out of the surface layer and settles with a given velocity (here 125 m d−1). POM is remineralised throughout the water column using a prescribed remineralisation “curve” reflecting the decay of POM as it sinks, first using dissolved oxygen and then sulfate. The prescribed remineralisation curve of relative sinking flux vs. depth (see e.g. Hülse et al., 2017) is always adhered to (Eq. 2a for POM1, Eq. 2b for POM2). In the sinking curve, the relative flux at each layer (z) is calculated according to an exponential decay function (Ridgwell et al., 2007).
is POM exported out of the surface layer (at 80 m), lPOM is the length scale (556 m for POM1; 1×10⁶ m for POM2 – effectively infinite and hence no water column decay), and rPOM is the initial proportion of POM into fraction 2 (0.055).
Any POM not remineralised within the water column is instead remineralised at the ocean floor – a “reflective” boundary condition assumption (see Hülse et al., 2017, for a discussion). DOM is degraded with a lifetime of 0.5 years following Najjar et al. (2007).
2.2 Temperature-dependent processes (TDEP)
In an alternative representation of biological export production in the model, a temperature-dependent growth rate limiter is applied to a characteristic timescale of ambient nutrient depletion (Eq. 3). A similar scheme (but without the addition of temperature-dependent remineralisation in the ocean) has been previously applied by Meyer et al. (2016) for PO4-only uptake and for two nutrients (PO4 and NO3) by Monteiro et al. (2012). In this, net nutrient uptake (mol PO4 kg−1 yr−1) is
where γT is the temperature growth limitation term (see below), Vmax is the maximum net depletion rate multiplier (yr−1), PO4 is local PO4 concentration (mol kg−1), is the nutrient limitation term, is the Michaelis–Menten half-saturation value (mol kg−1), 1−Aice is the ice-free fraction of the cell, and is the light limitation (based on incidence angle) term.
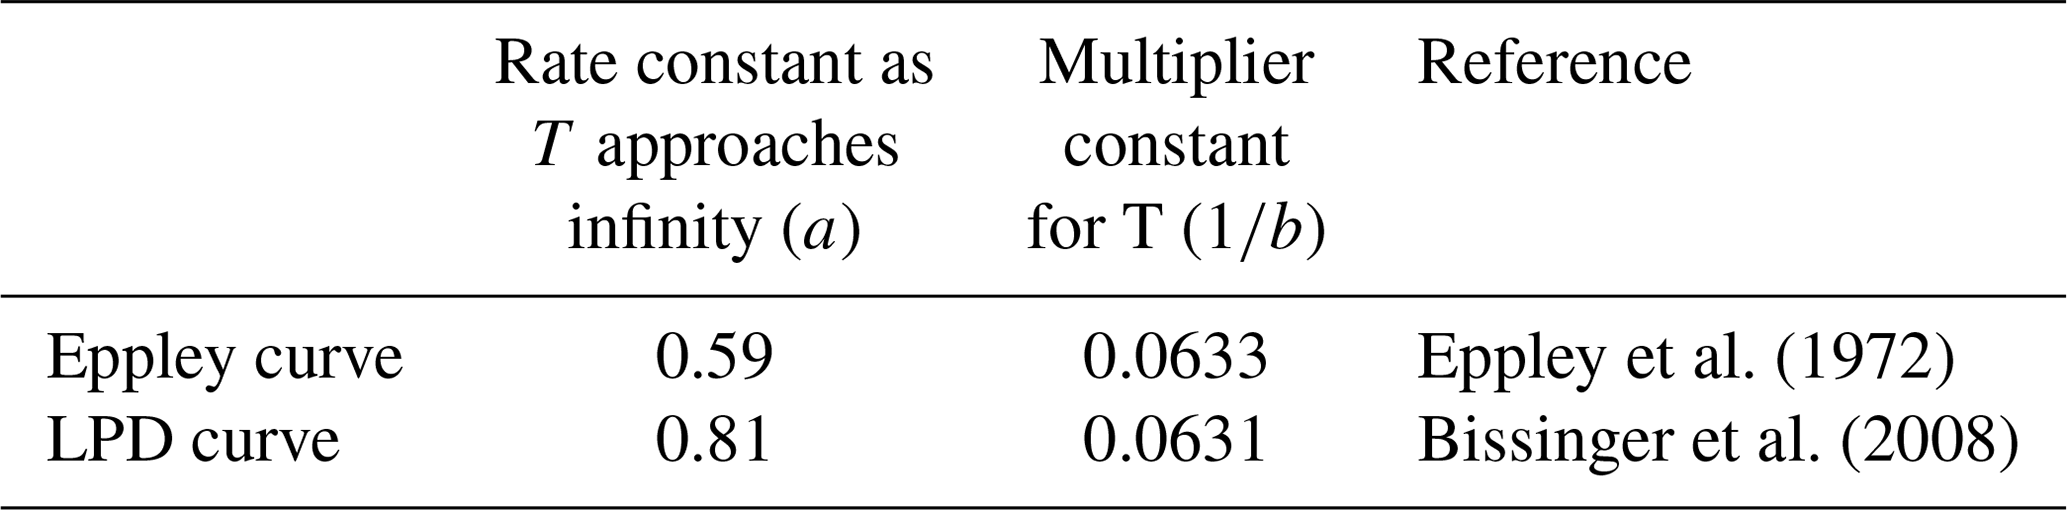
Temperature growth limitation is represented by the Arrhenius equation, where T is local temperature (Eq. 4).
This is the Eppley curve, commonly applied to model metabolic response to temperature change (Table 1). An improved fitted curve was proposed by Bissinger et al. (2008) (the LPD or Liverpool Plankton Database curve), with both being based on fitting the model to data from empirical studies. The largest difference between the Bissinger curve and the Eppley curve is the value of a (Eq. 4, Table 1). It makes little difference which curve we use because we calibrate Vmax (Eq. 3), which is also a multiplier for the temperature growth limitation term (in Eq. 4). We use the original Eppley et al. (1972) values for a (0.59) and b (75.80), and as per Monteiro et al. (2012). Both the Eppley and Bissinger curves gives a Q10 value (where Q10 is the increase in the rate of the metabolic process with a 10 ∘C increase in temperature) for nutrient uptake of 1.88 (Bissinger et al., 2008).
To calculate the remineralisation rate of POM (mol yr−1), an Arrhenius-type equation is applied (as in John et al., 2014) (Eq. 5):
where Ea is activation energy (J mol−1), R is the gas constant (J K−1 mol−1), T is absolute temperature (K), and βPOMn is the rate constant for POM remineralisation (yr−1) as T approaches infinity (for each POM fraction).
This rate is calculated in each ocean layer (and model grid point) according to the local temperature for each of the two POM fractions. For both fractions, the sinking rate is assumed to be 125 m d−1 (Ridgwell, 2001), so for cGENIE's non-uniform ocean depths, the fractional loss of POM due to remineralisation in each layer (z) is as in Eq. (6):
where n denotes POM fraction (either labile (1) or recalcitrant (2) – distinguished as these have different k(T) values), and Δt(z) is the time that sinking particles spend on average in layer z.
We will describe and evaluate the impact of processes accounting for the influence of temperature on both the production (ratioed to POM) and degradation of DOM in Sect 5.2.
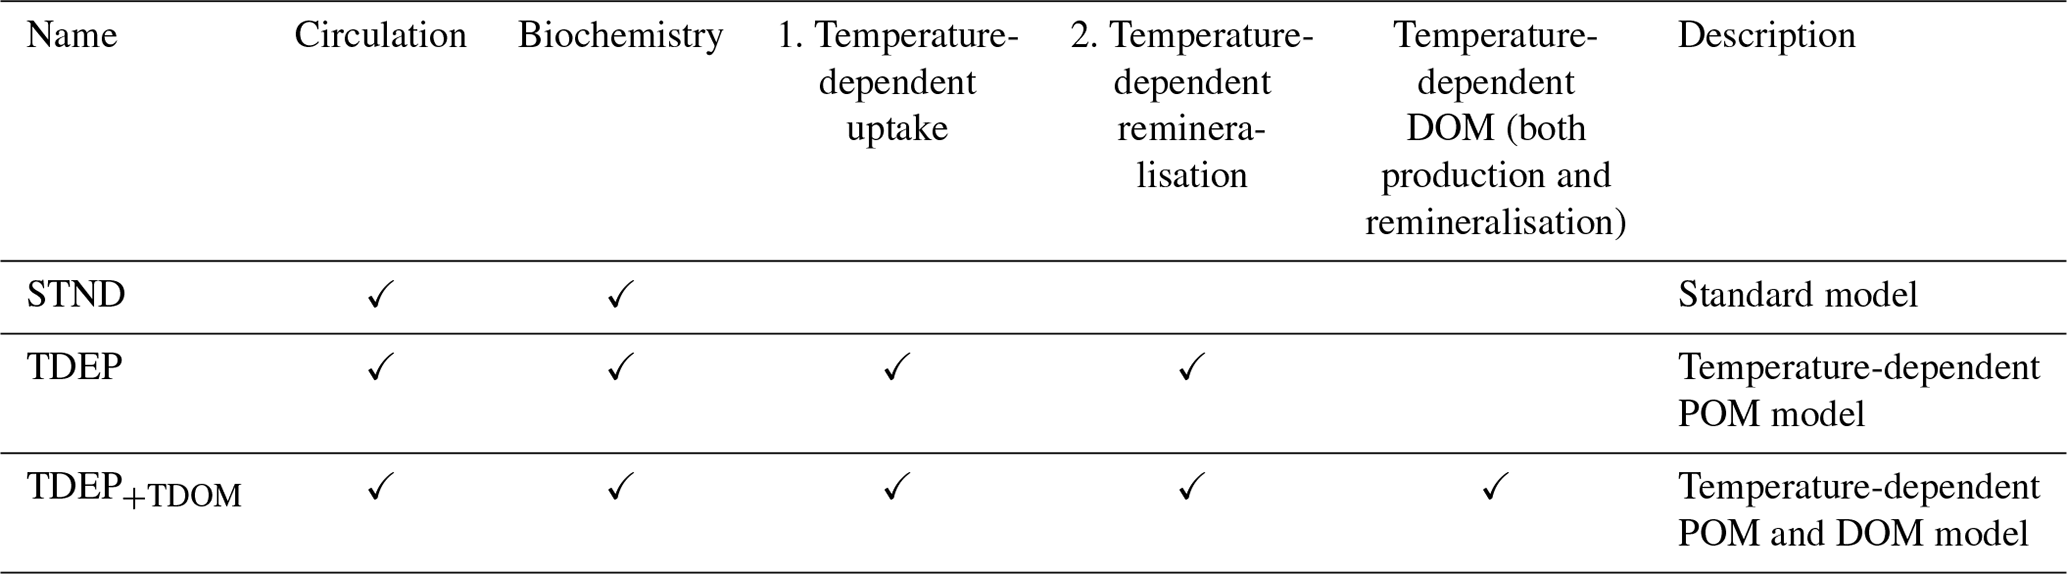
In previous published applications of the cGENIE model, either a temperature dependence in calculating export (but not ocean interior mineralisation) (e.g. Meyer et al., 2016; Monteiro et al., 2012) or a temperature dependence in remineralisation (but not biological productivity) (John et al., 2014) has been utilised to address varying paleo-questions. More commonly, neither has been utilised (e.g. Ridgwell and Schmidt, 2010). Here, we explore both temperature dependencies together (Table 2). Although in John et al. (2014) the temperature-dependent remineralisation scheme was calibrated to approximate the global mean POM decay profile in the default model (i.e. Ridgwell et al., 2007) under pre-industrial boundary conditions, here we adopt a more formal re-tuning against observations of the primary scaling factors in each scheme.
Table 2Model settings and processes included in each set-up. Column numbering corresponds to numbering in Fig. 1.
We identify three primary parameters requiring joint re-tuning: (1) the maximum nutrient uptake rate Vmax (Eq. 3) that scales export production; (2) the activation energy, Ea(1) (Eq. 5) (the minimum energy required for the transformation of organic carbon into inorganic carbon through respiration processes for the remineralisation of labile POC1, particulate organic carbon type 1), for which the labile POC1 dominates the export from the surface; and (3) the fraction of recalcitrant POC2 (denoted as rPOM in Eq. 2a and 2b) formed at the surface that reaches the very deep ocean.
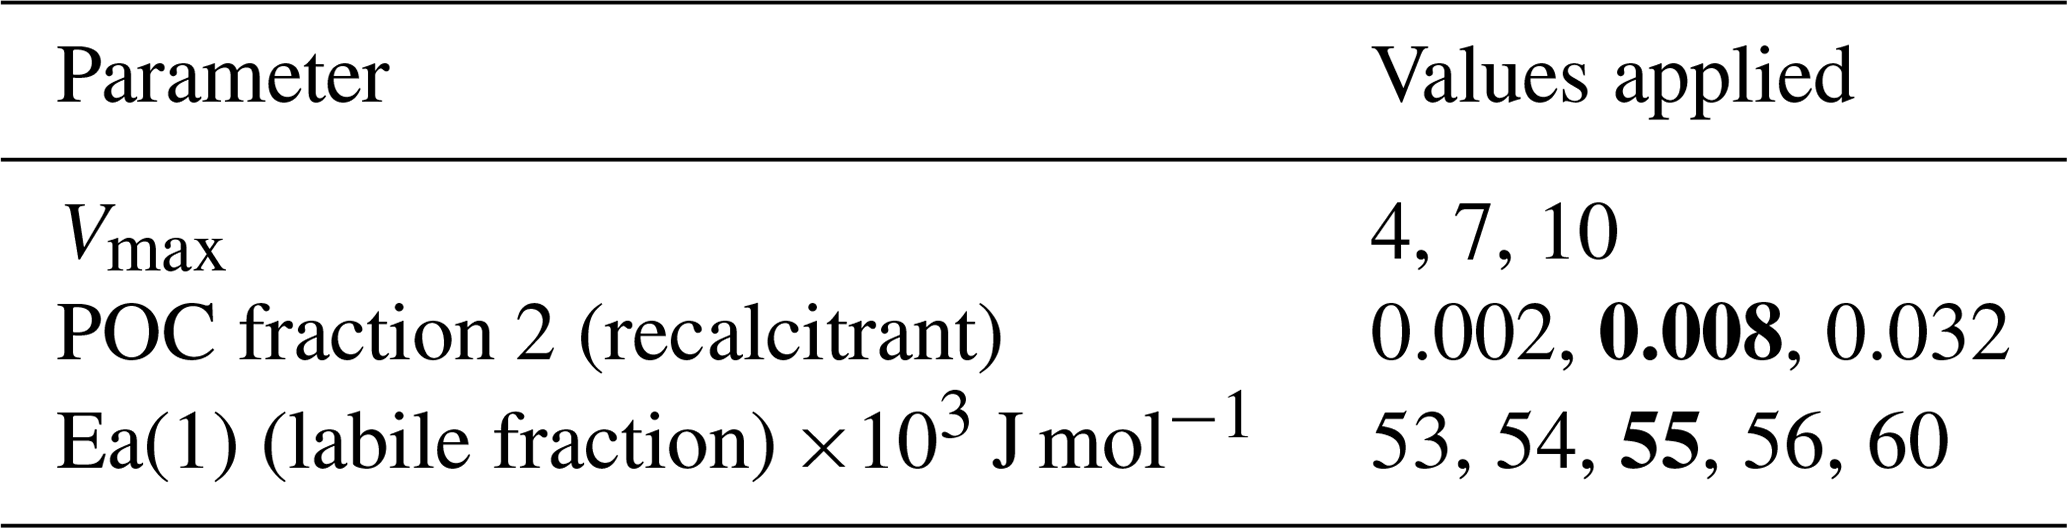
The Vmax range was chosen by running a series of test simulations (a 10 kyr spin-up with pre-industrial boundary conditions followed by the historical transient simulation forced with CO2 data to the present day) varying Vmax while retaining the temperature-dependent remineralisation scheme adopted in John et al. (2014). From these results we selected a range of values for the multiplier Vmax that gave reasonable agreement with PO4 and O2 distributions; these Vmax values are 4, 7, and 10. For the initial fraction of POC2, we took the John et al. (2014) value (with a POC2 fraction of 0.008) and applied a range that encompassed 25 % to 400 % around that value. For the Ea(1) (Eq. 5) setting, John et al. (2014) used a value of 55 kJ mol−1, the median of a range of 50 to 60 kJ mol−1 for labile POC identified in Arndt et al. (2013). We test a series of values for Ea(1) within the range (Table 3). Our ensemble hence consisted of three different choices for Vmax, three different choices for initial fraction of POC2, and five different choices for Ea(1), for a total of different parameter combinations and hence model ensemble member experiments. Values for the two rate constants, βPOMn (Eq. 5, for POC1 at 9×10¹¹ yr−1, for POC2 at 1×10¹⁴ yr−1), that were calibrated for the modern ocean and the sinking speed of 125 m d−1 in John et al. (2014) are retained.
Table 3Settings for parameters in TDEP (temperature-dependent). Values in bold are those applied in John et al. (2014)
Each of the 45 experiments in the ensemble is spun up for 10 000 years under pre-industrial boundary conditions: atmospheric pCO2 is restored to 280 ppm with a δ13CO2 isotopic value of −6.5 ‰. To contrast the model ensemble members with observations, a model–data comparison based on a simulated pre-industrial steady state creates a mismatch because global datasets are based on modern (i.e. the past few decades) oceanographic observations, wherein (especially shallow) distributions of nutrients and oxygen have already been impacted by historical warming. Therefore, following on from each respective spin-up, each model ensemble member is then forced from the year 1700 to 2010 in a transient simulation with atmospheric composition conforming to the observed mean annual trend in CO2. Direct atmospheric measurements and ice core data have shown that atmospheric δ13CO2 has dropped with increasing CO2 due to fossil fuel emissions (that have a characteristic low δ13C) known as the Suess effect (Keeling, 1979; Rubino et al., 2013). This affects ocean δ13C in a non-uniform manner, impacting (in general) nearer-surface waters more strongly due to ocean physics and circulation patterns. We hence additionally force atmospheric composition in the transient simulations with declining δ13CO2 (Francey et al., 1999).
Model–data comparison method
For the model–data comparison, World Ocean Atlas 2009 (WOA 2009; Levitus et al., 2010) 5∘ gridded climatological data for phosphate (PO4) and dissolved oxygen (O2) were interpolated to a grid (with a simple linear upscaling) and then to the cGENIE model depth scale by averaging over the data depth points that most closely correspond to the cGENIE ocean model depth layer distribution. This depth rescaling produced a global mean depth uncertainty of 2.2 % (of the targeted cGENIE depth). The depth rescaling resulted in minor additional uncertainties of ±0.01 µmols L−1 (at 1 standard deviation) for PO4 and ±0.02 µmols L−1 for dissolved O2 in addition to the error inherent in the gridded climatology product. For a direct comparison with the data, cGENIE model output from the year 2010 of the transient experiments was also interpolated to and converted to units of µmols L−1 (from mol kg−1 using modelled water density) to match the units of the WOA data. Latitudes higher than 80∘ were neglected due to higher uncertainties in both data and model outputs. For PO4, we statistically compared the surface concentration, which is important for constraining nutrient uptake rates, and the global ocean distribution, which strongly reflects remineralisation and hence the strength and efficiency of the biological pump (plus ocean circulation). For dissolved O2, we statistically compared the model and data between 283 and 411 m (cGENIE ocean level 4 centred at 346 m) as an indication of the dissolved oxygen depletion caused by remineralisation near the bottom of the mixed layer and how well the model can represent this. As with phosphate, we additionally compared the model global ocean dissolved oxygen distribution with data. Finally, given that we are utilising model-derived temperature distributions in the ocean to project nutrient and oxygen concentrations (plus δ13C distributions) which we then contrast with the respective observed data, we interpolated temperature data (producing an uncertainty of ±0.1 ∘C) in the same way as O2 and PO4 so as to elucidate biogeochemical biases arising from model–data temperature mismatch.
To evaluate the model skill, we compared the model to data standard deviation (SD), calculated the centred root mean square (CRMSD) difference between the model and data, and calculated model–data correlation; these parameters can then be presented on a Taylor plot. On this plot the general proximity of the model point to the data point indicates the goodness of fit and provides a visual comparison of how the changing parameters affect the model skill.
For assessing water column profiles, we defined a set of ocean regions as shown in Fig. 3. These regions are similar to those used by Weber et al. (2016), but with some regions reduced in size or separated (subtropical Pacific limited to South Pacific and north Indian Ocean added). This was done so that within each region, ocean water characteristics (including temperature, nutrients, oxygen, salinity) and particle fluxes (as Weber et al., 2016) are broadly similar. We compare the model distribution of δ13C of DIC with data from Schmittner et al. (2013) by grouping these data into regions (Fig. 3) and creating representative (mean with standard deviation) down-column profiles for δ13C for visual comparison with model outputs in the matching region. In all cases, model output units are converted to match those of the data for model–data comparison, which do not always match those units used in Sect.2.
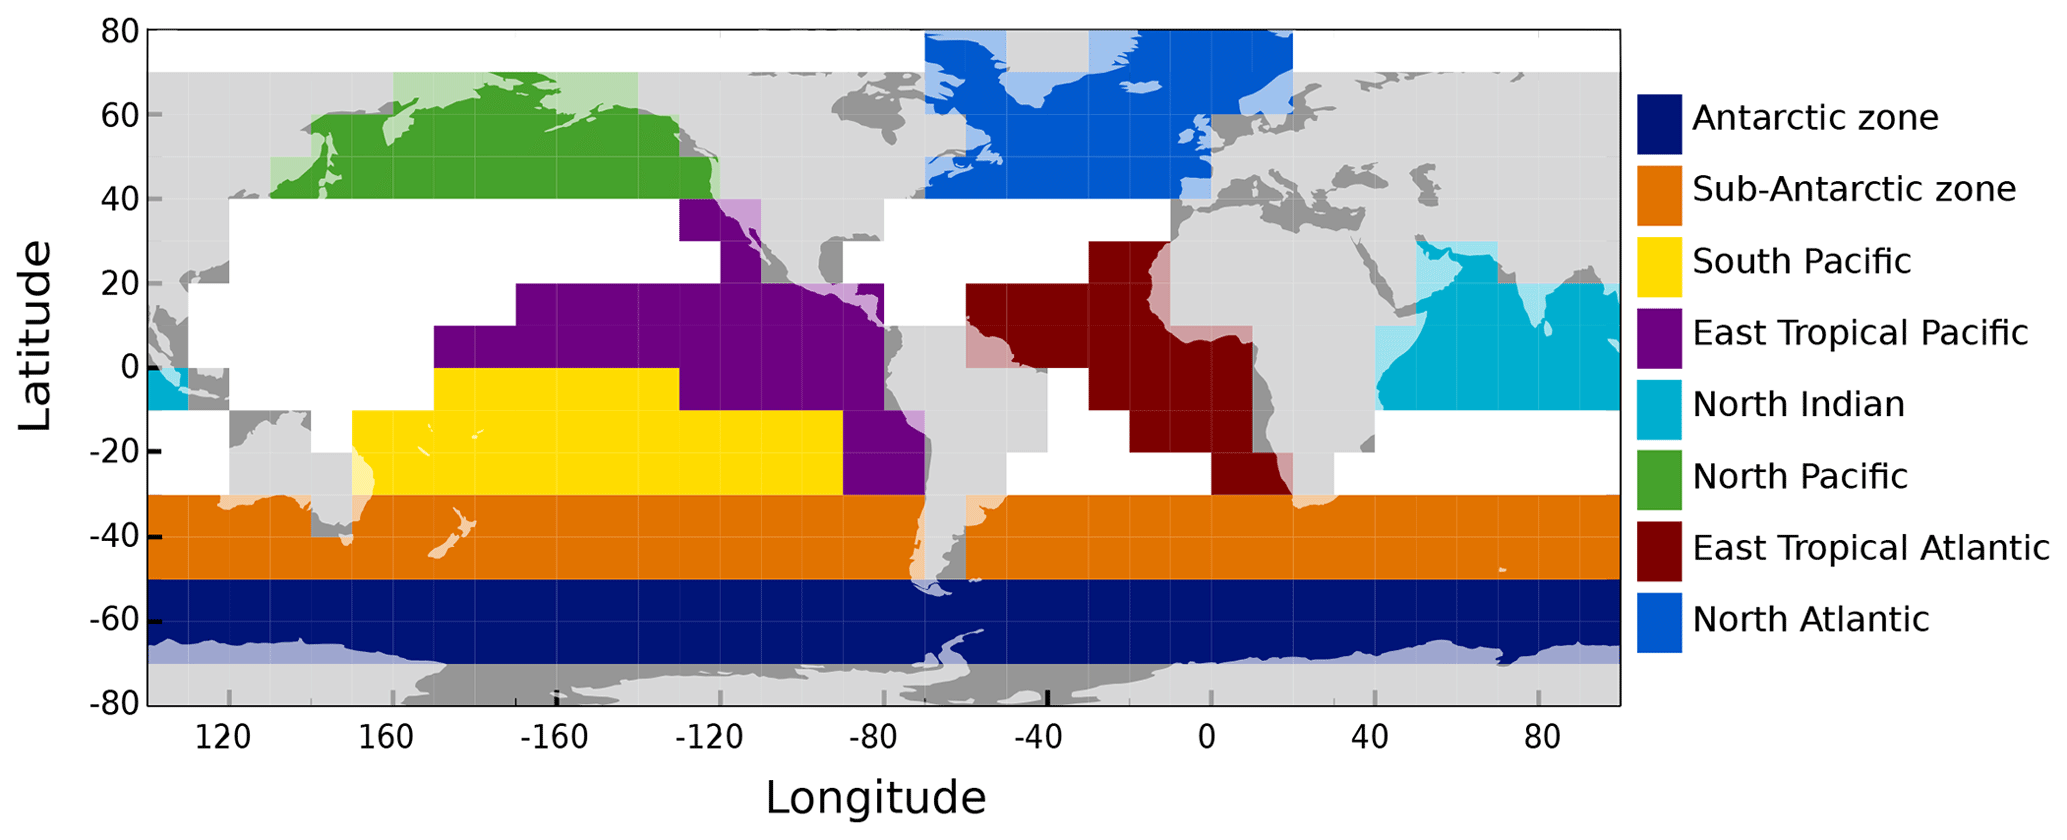
Figure 3Selected ocean regions for model–data comparison (on a 10×10∘ grid, with land masses overlaid for indication) based on Weber et al. (2016) and WOA 2009 data (Levitus et al., 2010).
4.1 Tuning the temperature-dependent version – model vs. data
We first assess model skill in simulating the temperature distribution in the ocean, given its critical importance in the temperature-dependent calculations of metabolic processes (Fig. 4). We find a generally reasonable model fit to ocean temperature data in middle- and low-latitude near-surface waters and in capturing the first-order patterns in benthic temperatures. At high latitudes, cGENIE shows larger differences compared with observations due to deficiencies in modelled ocean circulation and/or the surface climate as simulated in the simple 2D EMBM. For instance, the temperature discrepancy throughout the water column in the North Atlantic may be due to an overly strong AMOC (Atlantic Meridional Overturning Circulation) in the model that delivers too high a volume of warmer surface waters to depth. For the North Pacific, the model overestimation of near-surface temperatures by cGENIE likely reflects insufficient surface stratification: downward mixing that is too deep transporting surface waters that are too warm to mid-depths in this location.
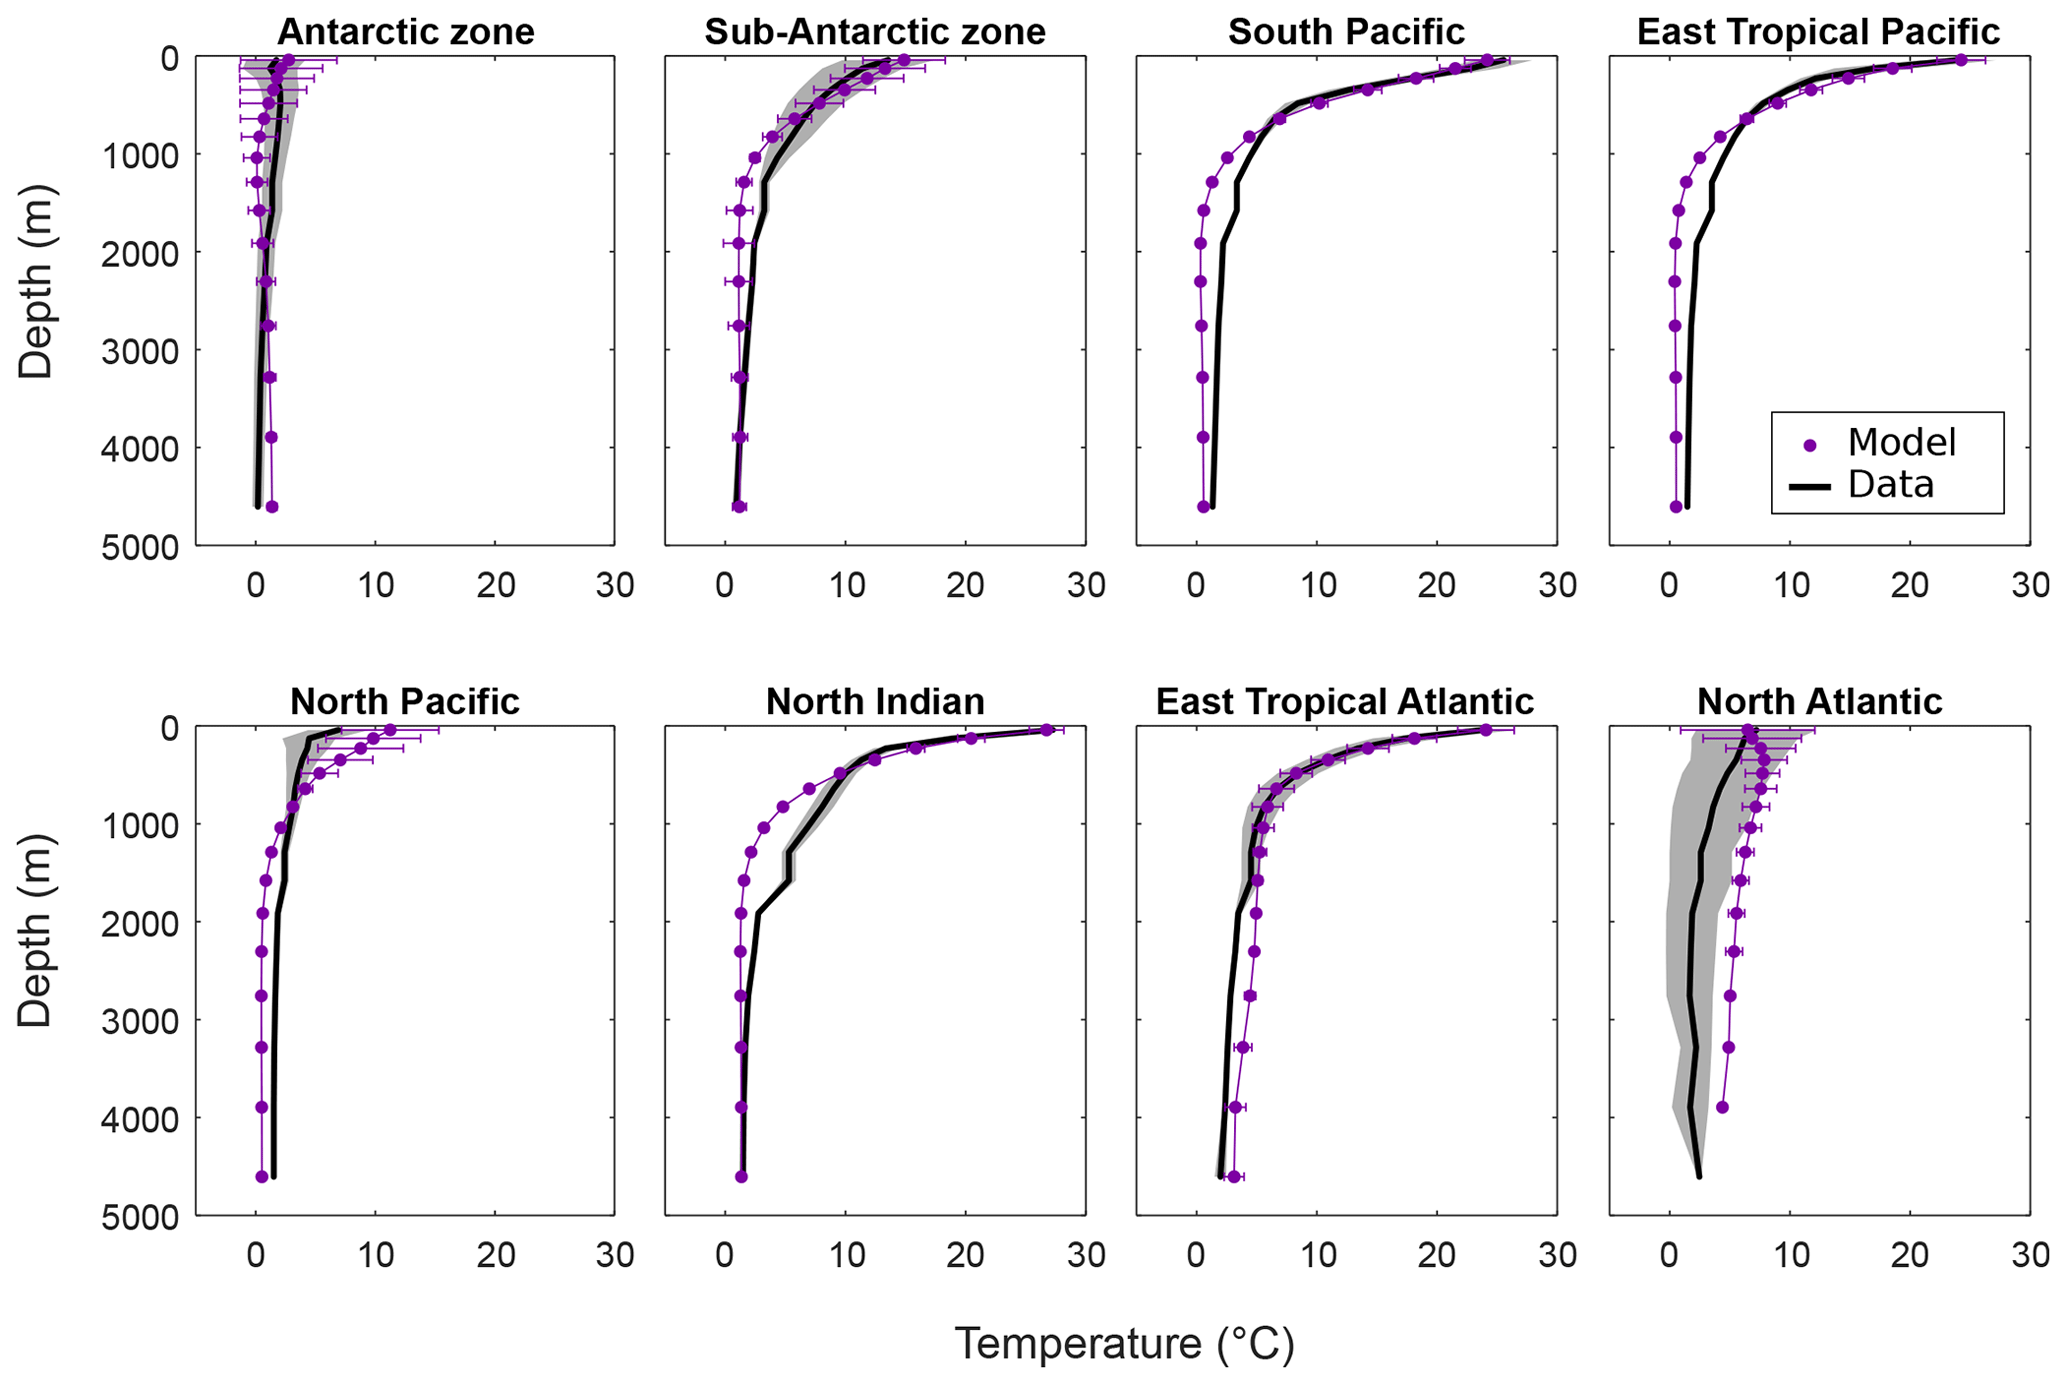
Figure 4Temperature (∘C) per depth by region for the model and data (mean and standard deviation). Data from WOA 2009 (Levitus et al., 2010).
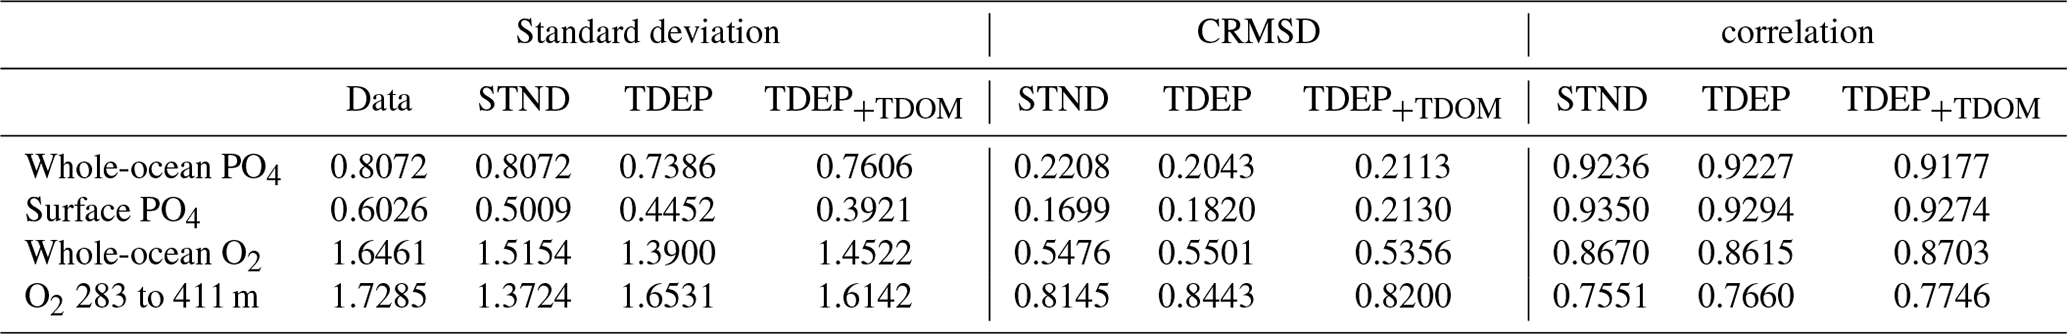
The ensemble simulation results (year 2010 of the transient experiments) for the ocean geochemistry are shown in Fig. 5 on Taylor diagrams for their fit to observed distributions of dissolved PO4 and O2 in the ocean. Points in Fig. 5 are shaded according to the Ea(1) (Eq. 5) value, which has the strongest control on PO4 and O2 distribution of the three variables. The overall best fit to the data for the final TDEP setting was selected as Vmax=10, Ea(1) =54 kJ mol−1, initial fraction POC2 =0.008; the best fit is determined as the setting with the combined overall lowest CRMSD for the PO4 and O2 distributions. The CRMSD for each variable is shown in Fig. 5 as the radial distance from the data point (the radial axis coloured green). In general the parameter value combinations with the lowest CRMSD values correspond to the highest correlations in the model fit to data (Fig. 5). The statistics for the STND and best-fit TDEP are listed in Table 4.
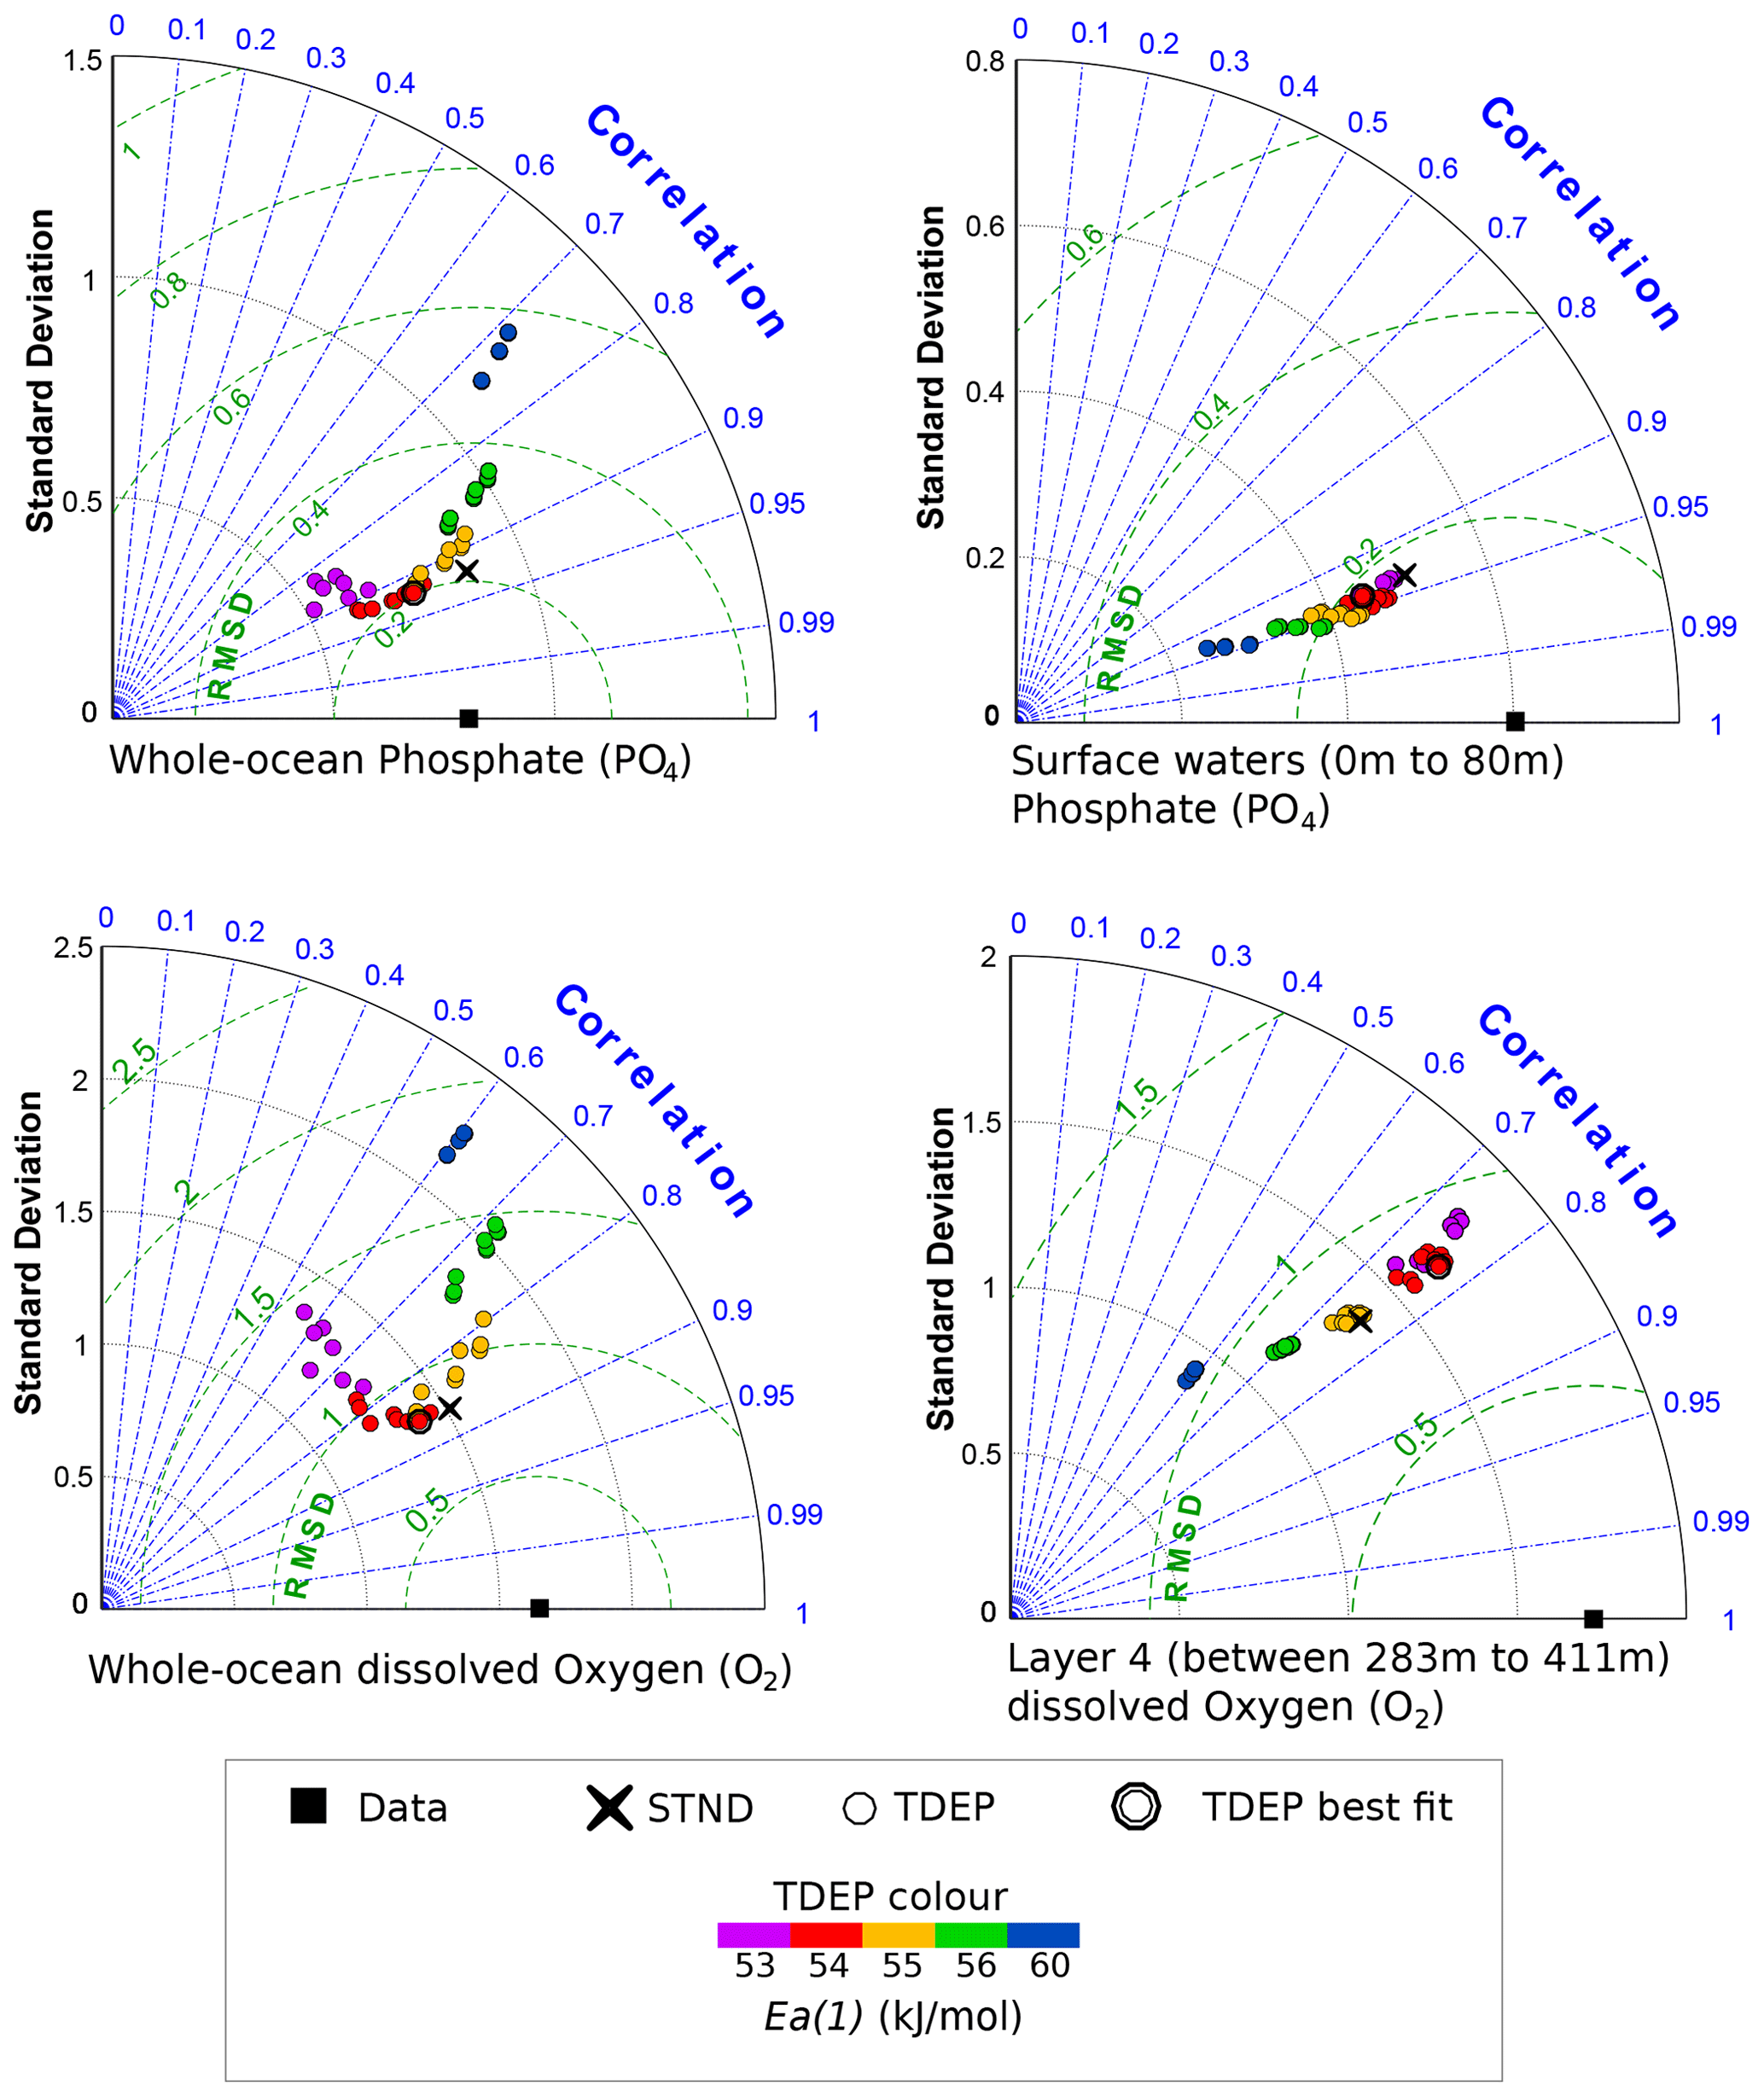
Figure 5Taylor diagrams for the model fit to data for PO4 and O2 concentrations, showing the standard deviation (standard deviation is not normalised), correlation, and centred root means square difference (RMSD). Data from WOA 2009 (Levitus et al., 2010). The best-fit TDEP setting is double circled.
Table 4Statistics for the fit of the model to phosphate and oxygen distribution in the present day for the STND, TDEP (best fit), and TDEP+TDOM simulations. Statistics are shown as standard deviation (SD) in µmol L−1, centred root mean square difference (CRMSD) in µmol L−1, and correlation to data. TDEP+TDOM is described in Sect. 5.2.
4.2 Performance of the temperature-dependent model compared to the standard model
In this section we evaluate and compare the performance of the existing tuned, but non-temperature-dependent, biological scheme (STND) to the new tuned temperature-dependent scheme (TDEP).
Figure 6 shows cross-plots for surface PO4 concentration (an important constraint on export production) for the best-fit TDEP and the standard model for the selected ocean regions. The addition of temperature dependence in TDEP generally increases surface PO4 concentrations and comes into better agreement with data than the standard model (STND). The high-surface-nutrient regions, the Antarctic and the North Pacific, are lower than data in all model cases, and this is likely due to the lack of iron limitation in this version of the model, as biological activity removes too much nutrient content from the surface waters. However, in these regions, the temperature-dependent version shows a slightly better fit to data than does the standard model, as the colder surface water reduces nutrient uptake rates. In contrast, the lowest-nutrient regions (e.g. some South Pacific and some eastern tropical Atlantic) have slightly higher PO4 concentrations compared to data in TDEP.
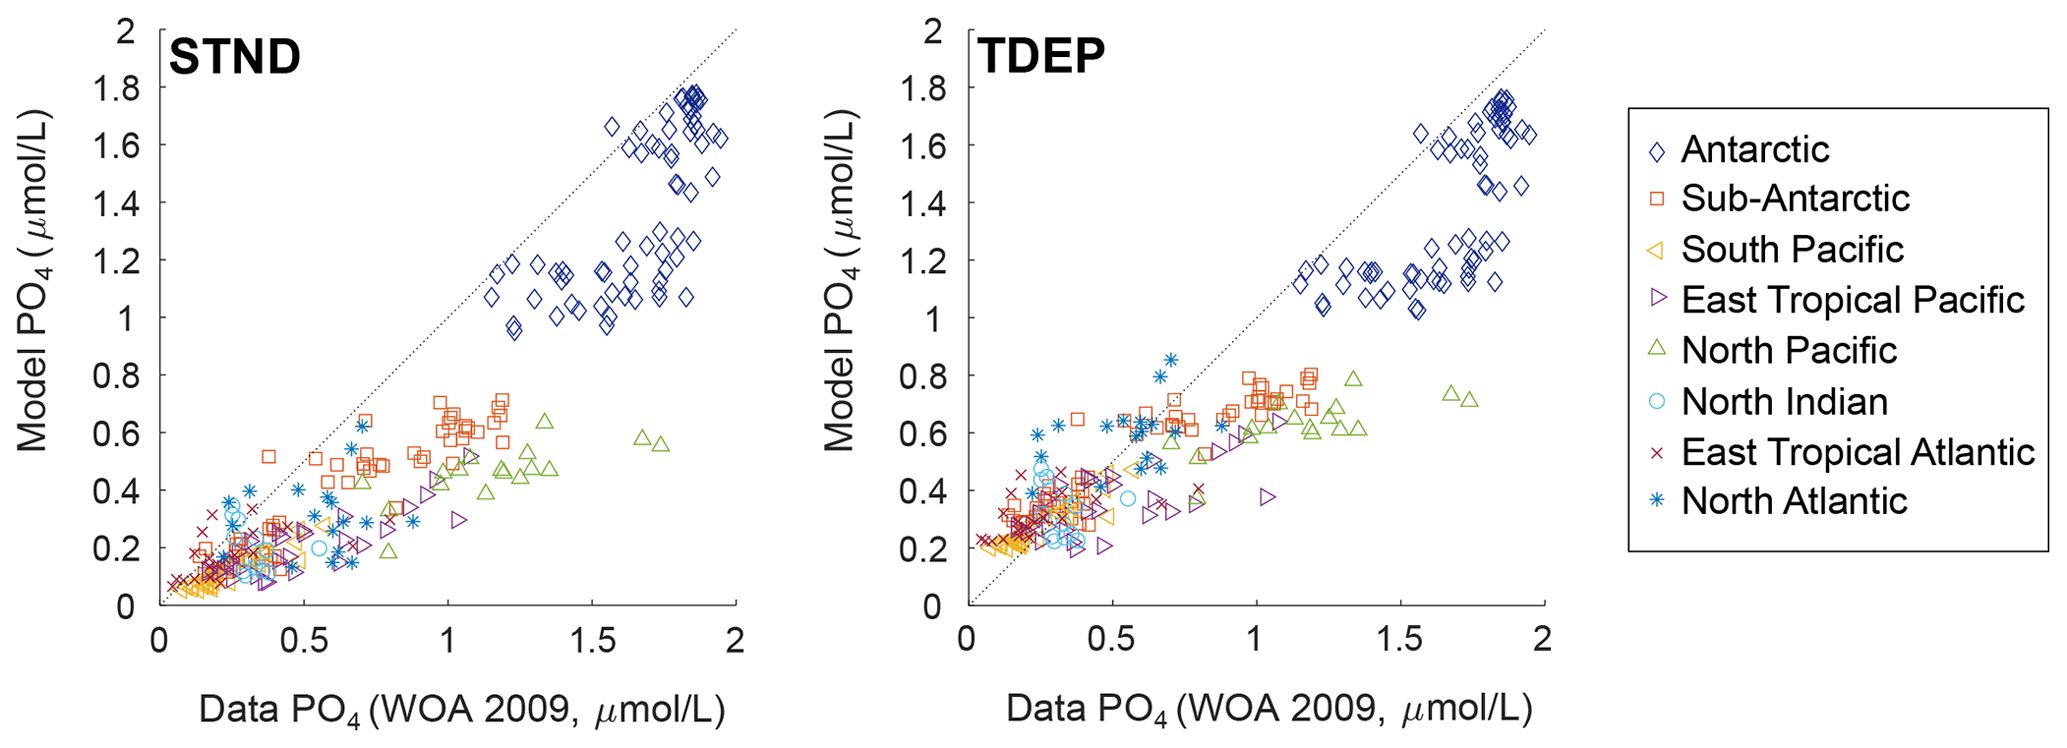
Figure 6Cross-plot for surface (0 to 80 m) PO4 concentrations (µmol L−1) for the data and model labelled by ocean region. Data from WOA 2009 (Levitus et al., 2010).
Regional water column profile model outputs for TDEP and STND are plotted against PO4 data (Levitus et al., 2010) in Fig. 7. In both schemes, the model was tuned according to its fit to PO4 (and O2), and both TDEP and STND show a visually reasonable fit to data. Some differences can be seen between TDEP and STND in surface middle- and low-latitude waters, e.g. in the north Indian Ocean and eastern tropical Pacific, where nutrients are higher in TDEP in better agreement with data. In higher-latitude waters, model–data mismatch may be more closely related to ocean circulation (as for temperature; Fig. 4), with STND and TDEP distributions very similar to each other in the Southern Ocean and North Pacific, but with TDEP a better fit to data in the North Atlantic.
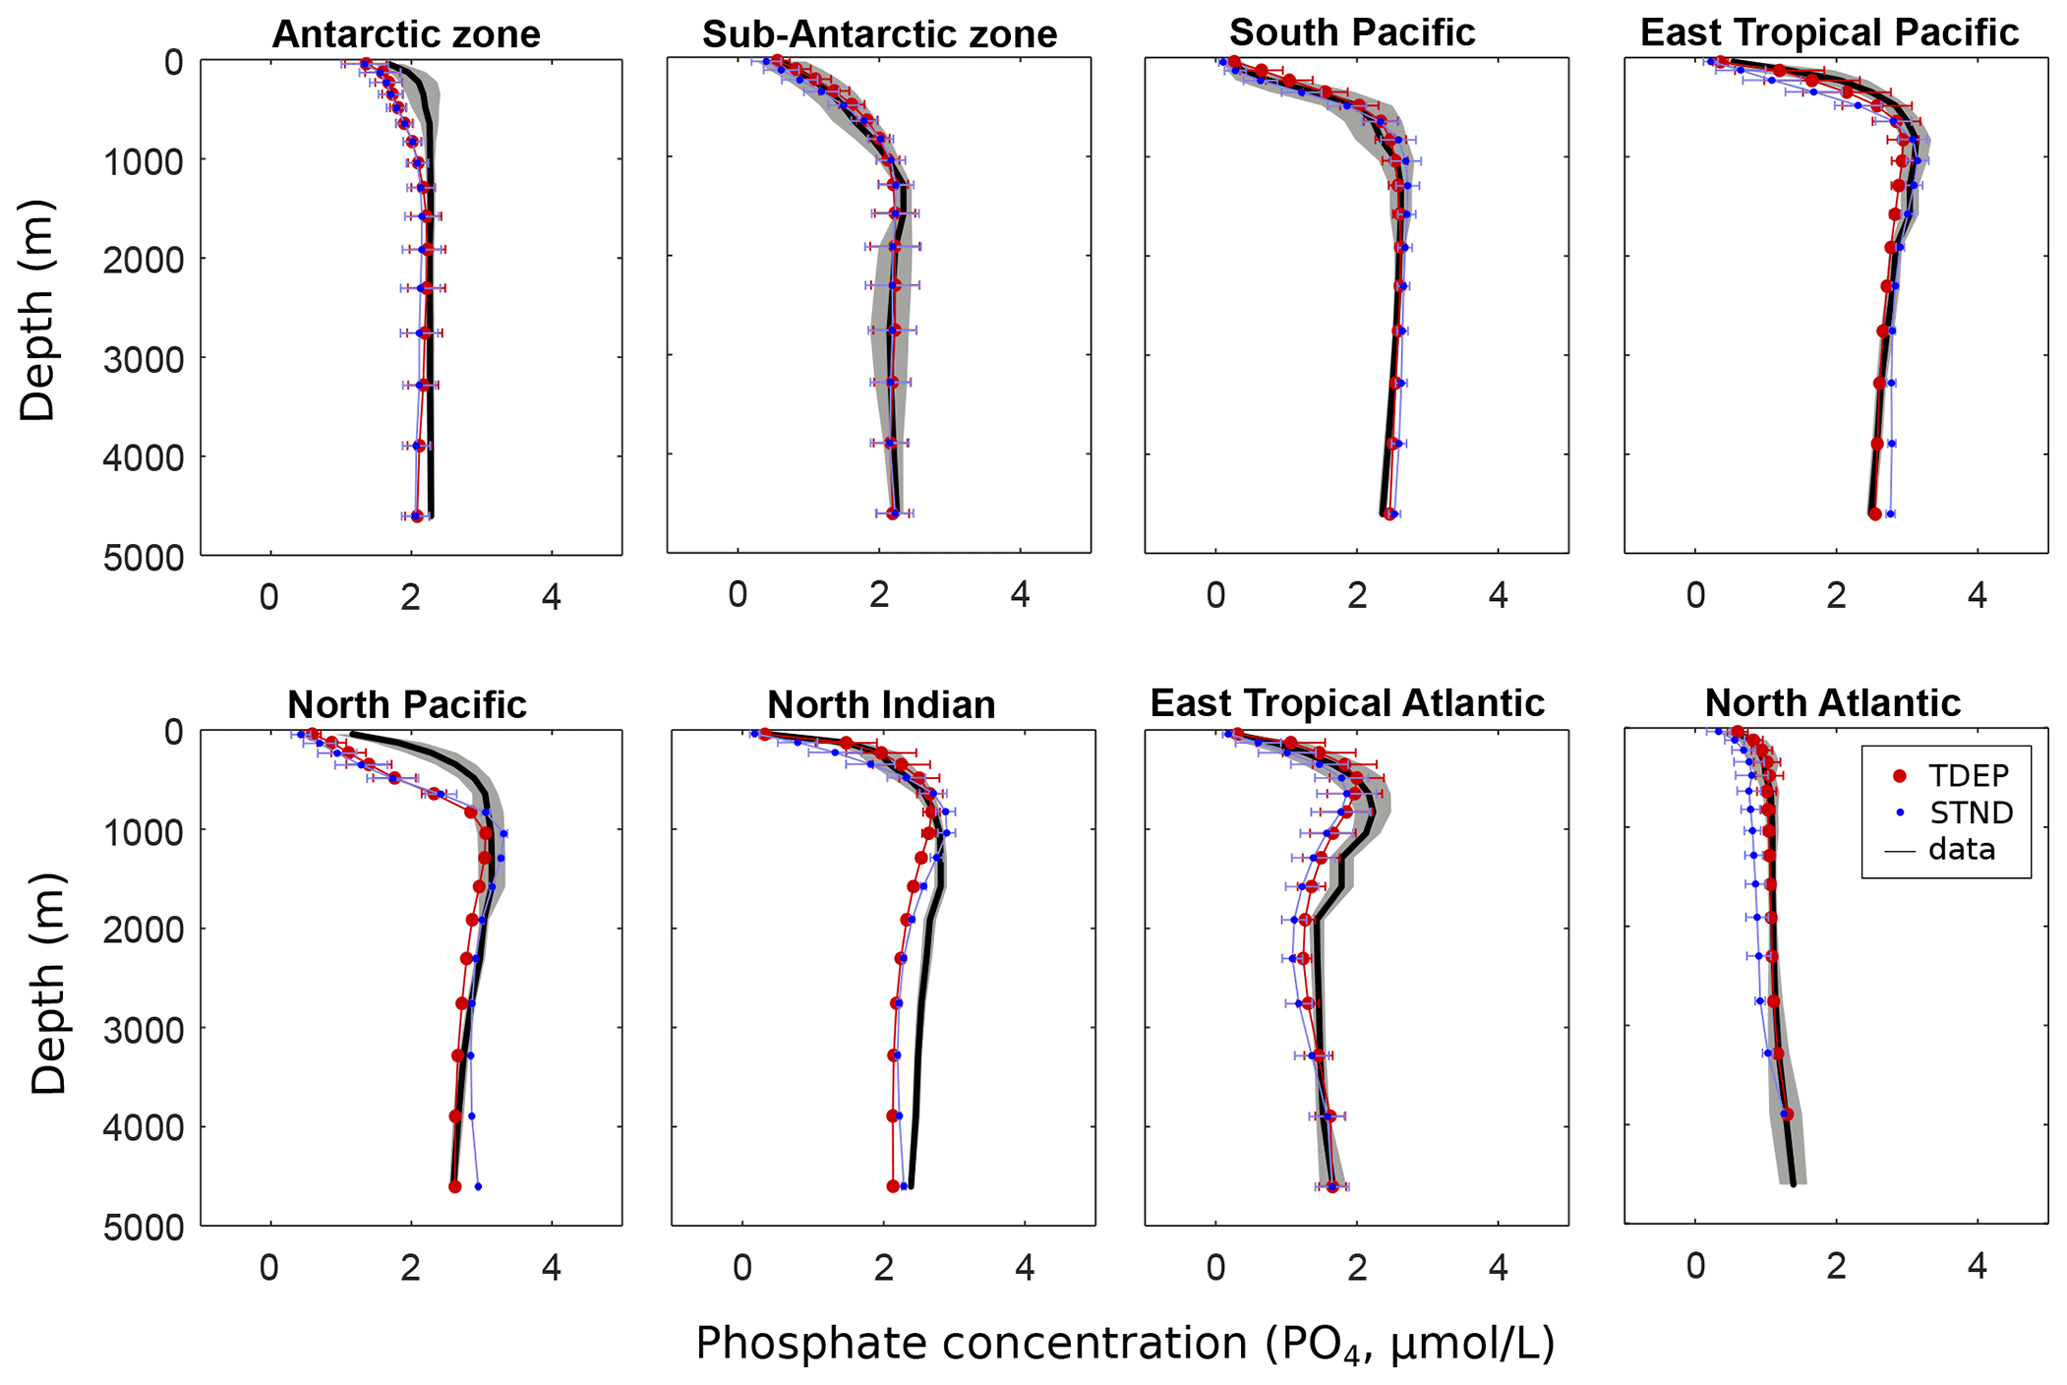
Figure 7PO4 (µmol L−1) per depth by region for the model and data (mean and standard deviation). Data from WOA 2009 (Levitus et al., 2010). STND is the standard model, an TDEP is the temperature-dependent model.
With the exception of the high southern latitudes (higher than ∼60∘ S), the addition of temperature-dependent microbial processes generally increases surface nutrient concentrations (as shown in Fig. 8a and b) compared to the standard model. This is particularly apparent in the low-nutrient gyres, with up to 4 times higher PO4 concentrations in TDEP compared to STND (Fig. 8b). In the deeper ocean (Fig. 8c and d), nutrient concentrations are reduced in the temperature-dependent version except for the North Atlantic (where higher surface nutrients are delivered to the deep via the AMOC) and the high southern latitudes (with slightly higher PO4 than the standard model).
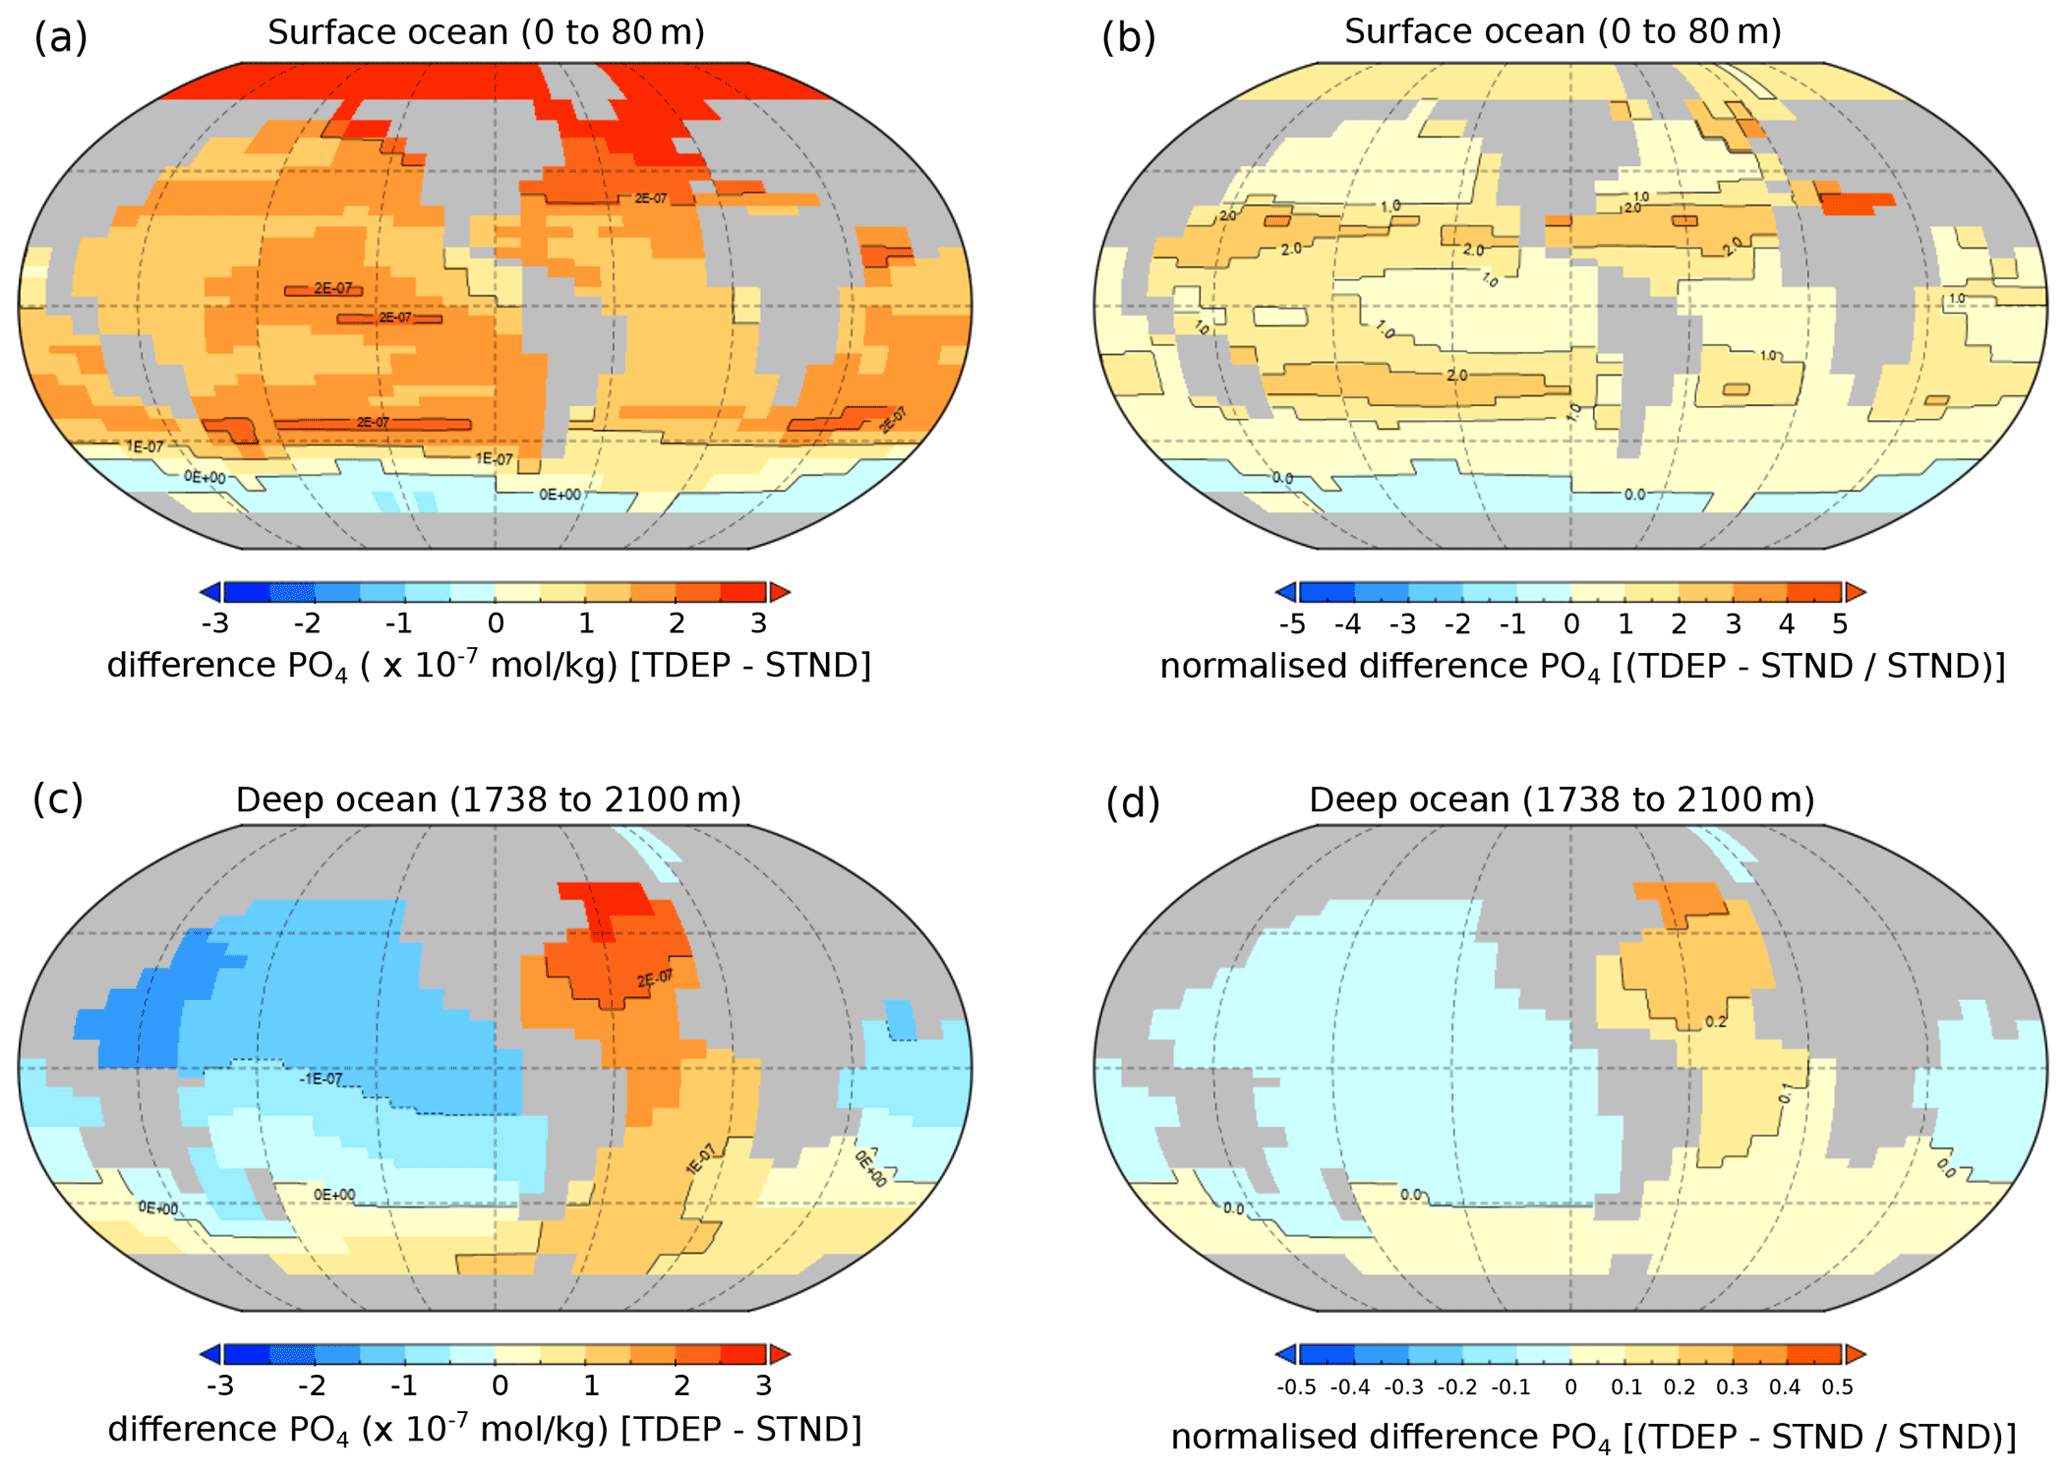
Figure 8Difference in PO4 concentration for best-fit TDEP compared to STND, (a, b) surface waters (0 to 80 m), and (c, d) deep waters (1738 to 2100 m). (a, c) Absolute difference (mol kg−1) and (b, d) normalised difference. All are the present day; note the scale difference in terms of the normalised difference between surface and deep water. STND is the standard model, and TDEP is the temperature-dependent model.
The distribution of dissolved oxygen also provides important information about the biological pump. Photosynthesis removes CO2 from ocean waters and adds O2 (where CO2 and O2 are also exchanged with the atmosphere at the surface ocean), while respiration does the opposite. As a general pattern, respiration progressively reduces dissolved oxygen concentrations down the water column until a minimum is reached. Below that depth – the oxygen minimum zone (OMZ) – ocean circulation reintroduces more oxygenated water masses from below. Dissolved oxygen concentrations then slightly increase again with further depth as the flux of organic matter and hence respiration decline, and oxygen is supplied through deep ocean circulation and via ventilation at the poles. In the Antarctic zone (Fig. 9), circulation patterns appear to dominate oxygen content (as STND and TDEP are very similar, but fairly dissimilar to data indicators). The North Pacific region also shows offsets between the model and data for O2, PO4, and temperature, also suggesting deficiencies in simulated deep ocean circulation. In low-latitude waters, TDEP shows a better fit to data between the surface and 500 m than STND, suggesting that oxygen depletion rates due to respiration are better described here. Overall, the intensity of the OMZ in both STND and TDEP appear visually in reasonable agreement with data, although in low- and middle-latitude warmer waters the OMZ occurs higher in the water column in TDEP than STND.
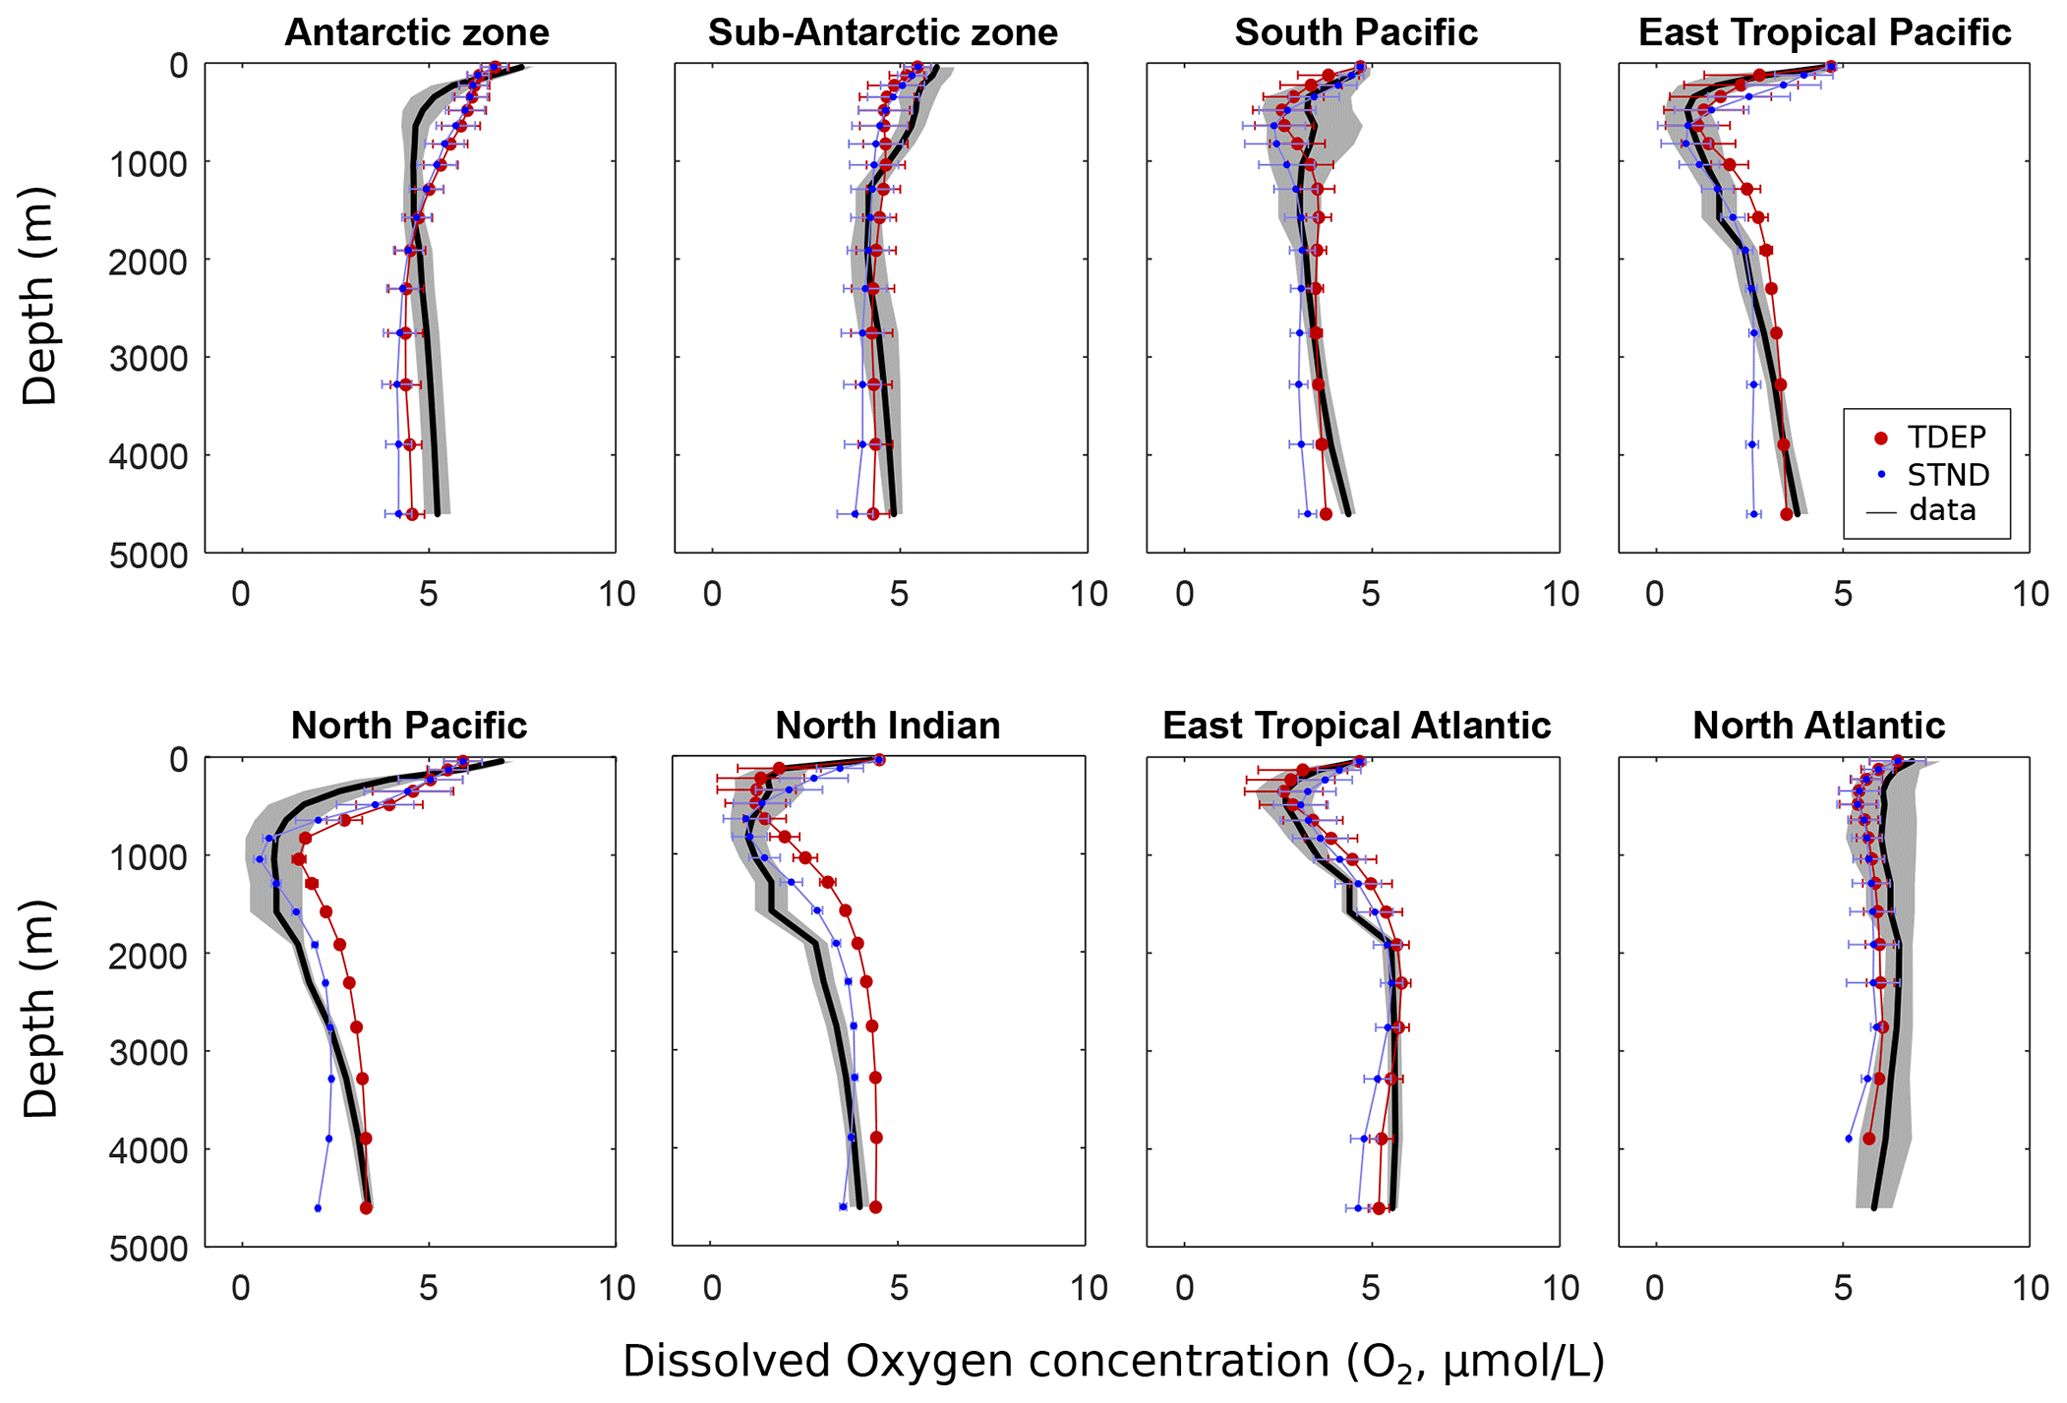
Figure 9Dissolved O2 (µmol L−1) per depth by region for the model and data (mean and standard deviation). Data from WOA 2009 (Levitus et al., 2010). STND is the standard model, and TDEP is the temperature-dependent model.
4.3 Tracing carbon-13
In studying paleoclimates and, in particular, past states of ocean circulation and carbon cycling, carbon-13 data are widely used as a tracer (Lynch-Stieglitz, 2003). Surface waters have characteristic carbon-13 signatures with a pronounced mostly latitudinal gradient, so changes in δ13C measured at any one location on the ocean floor may be at least partially attributed to changes in the strength and location of deepwater formation. The biological pump also affects the δ13C signature of seawater. The process of photosynthesis fractionates the carbon that is exchanged (from the dissolved inorganic to the organic form); carbon-12 is preferentially taken up, leaving more carbon-13 in the surface waters (Schmittner et al., 2013). As summarised by Kirtland Turner and Ridgwell (2016), in the cGENIE model, fractionation between POC (and DOC) and δ13C of CO2(aq) is a function of the CO2(aq) concentration based on an approximation of the model of Rau et al. (1996) and Ridgwell (2001). This gives rise to a spatial distribution in the δ13C of exported organic carbon, with lower (more negative) values at higher latitudes and higher (less negative) values towards the Equator, primarily reflecting the temperature control on the concentration of CO2(aq) in surface waters. The mean flux-weighted δ13C of POC is around −23 ‰ for the pre-industrial period and around −26 ‰ by the year 2010 due to the impact of increasing CO2(aq) on organic carbon 13C fractionation and the Suess effect. As POC is remineralised in the water column, low δ13C carbon is released, modifying the ambient δ13C of DIC. The δ13C of the ocean interior then represents a balance between the input of light δ13C via the biological pump and the ingress of heavier δ13C supplied in deep waters and ultimately sourced from high latitudes at the surface.
The regional mean and standard deviation for data δ13C as well as model TDEP and STND are shown in Fig. 10. For almost all regions, the broad patterns are similar to those seen in the dissolved O2 concentration, with benthic and deepwater absolute δ13C values generally similar to data for both model configurations. One exception is the Antarctic zone where δ13C shows a good fit to data indicators nearer the surface, and modelled oxygen shows a poorer fit to data nearer the surface. The offset in mid-depth waters (∼800 m) in the sub-Antarctic zone may be due to a reduced Antarctic intermediate water contribution in the model. This may also explain similar model offsets at this depth in the southern and eastern tropical Pacific regions. In warm surface waters, δ13C is reduced more quickly with depth in TDEP than STND, as nutrient recycling occurs faster.
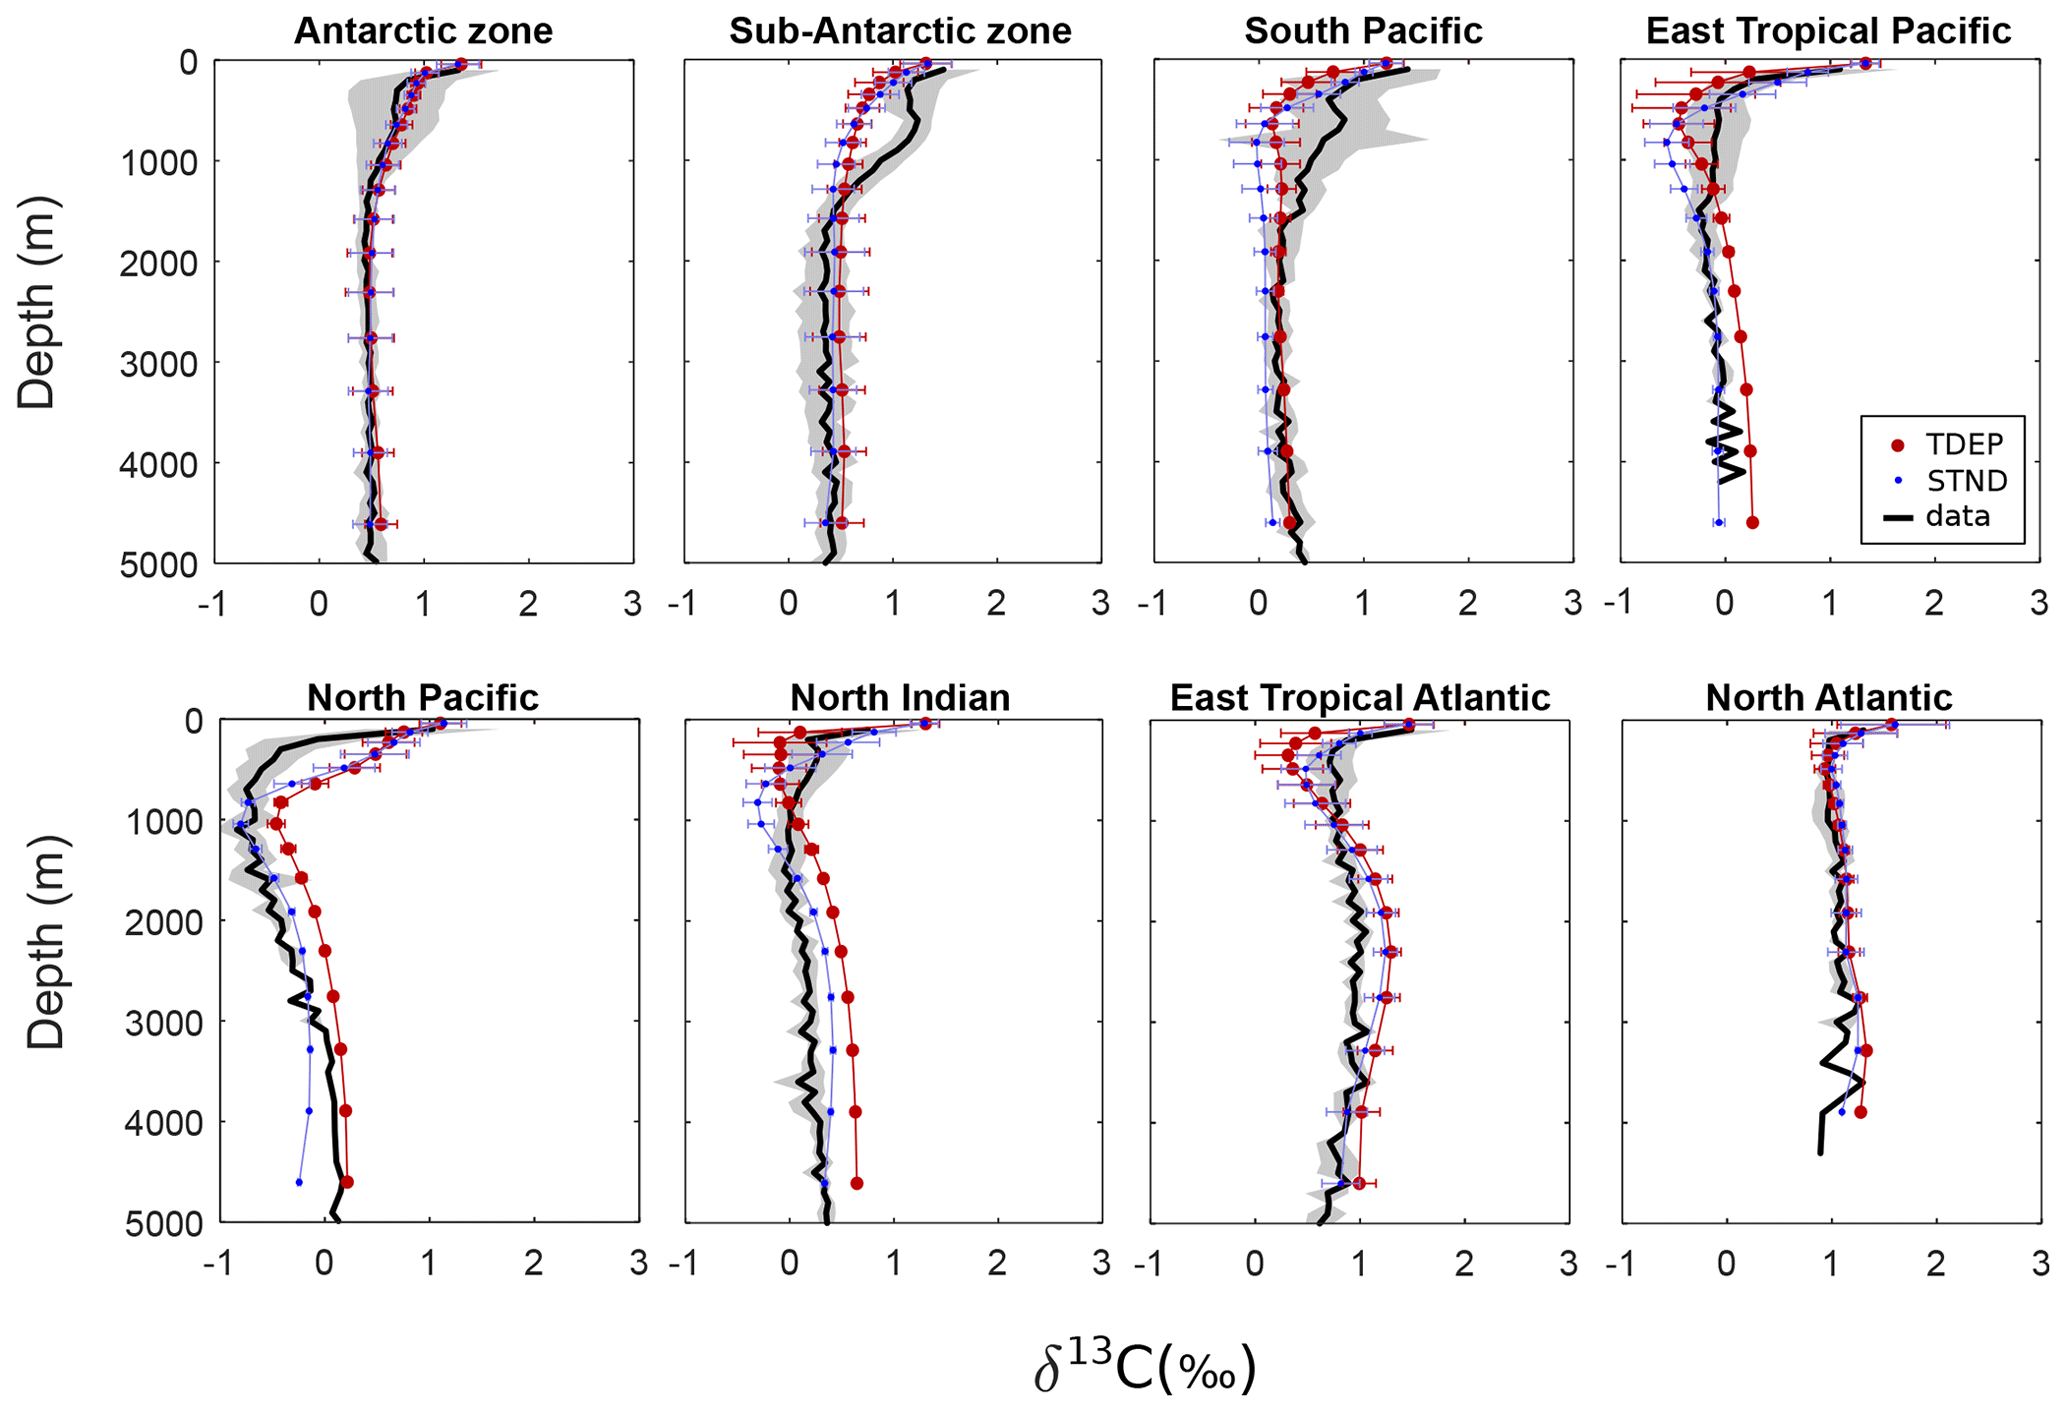
Figure 10δ13C of DIC (‰ VPDB) per depth by region for the model and data (mean and standard deviation). Data from Schmittner et al. (2013). STND is the standard model, and TDEP is the temperature-dependent model.
4.4 POC export and implications for biological carbon pump efficiency
The inclusion of a temperature dependence term in remineralisation strongly affects both the export of POM via changes in the rate of nutrient recycling and the efficiency of the biological carbon pump. To demonstrate the impact of each varied parameter, the export flux of POC (modelled at 80 m) for every simulation (not only the best-fit TDEP) is shown in Fig. 11. With a lower activation energy requirement (low Ea(1) value), less energy is needed for the remineralisation process to occur; this means nutrients are returned to surface waters more quickly, production is higher, and so the POC flux at 80 m is higher. Conversely, the higher the Ea(1) value, the more energy is required to remineralise organic carbon. So, at higher Ea(1), proportionally more organic carbon reaches depth, making surface processes less important. The fraction of the POC exported that is recalcitrant and the maximum nutrient uptake rate at the surface become less important as Ea(1) increases. This trend occurs because there is no variation in ocean temperature between runs in Fig. 11a; i.e. atmospheric CO2 and climate are fixed. It is important to note, however, that a larger Ea(1) leads to a larger sensitivity of remineralisation rates to changes in temperature, e.g. a higher Q10 (Fig. 11b, c). The Q10 for remineralisation rates in Fig. 11 ranges from below 2.3 (Ea(1) =53 kJ mol−1) to over 2.5 (Ea(1) =60 kJ mol−1) for a change in temperature from 0 to 10 ∘C (Fig. 11c).
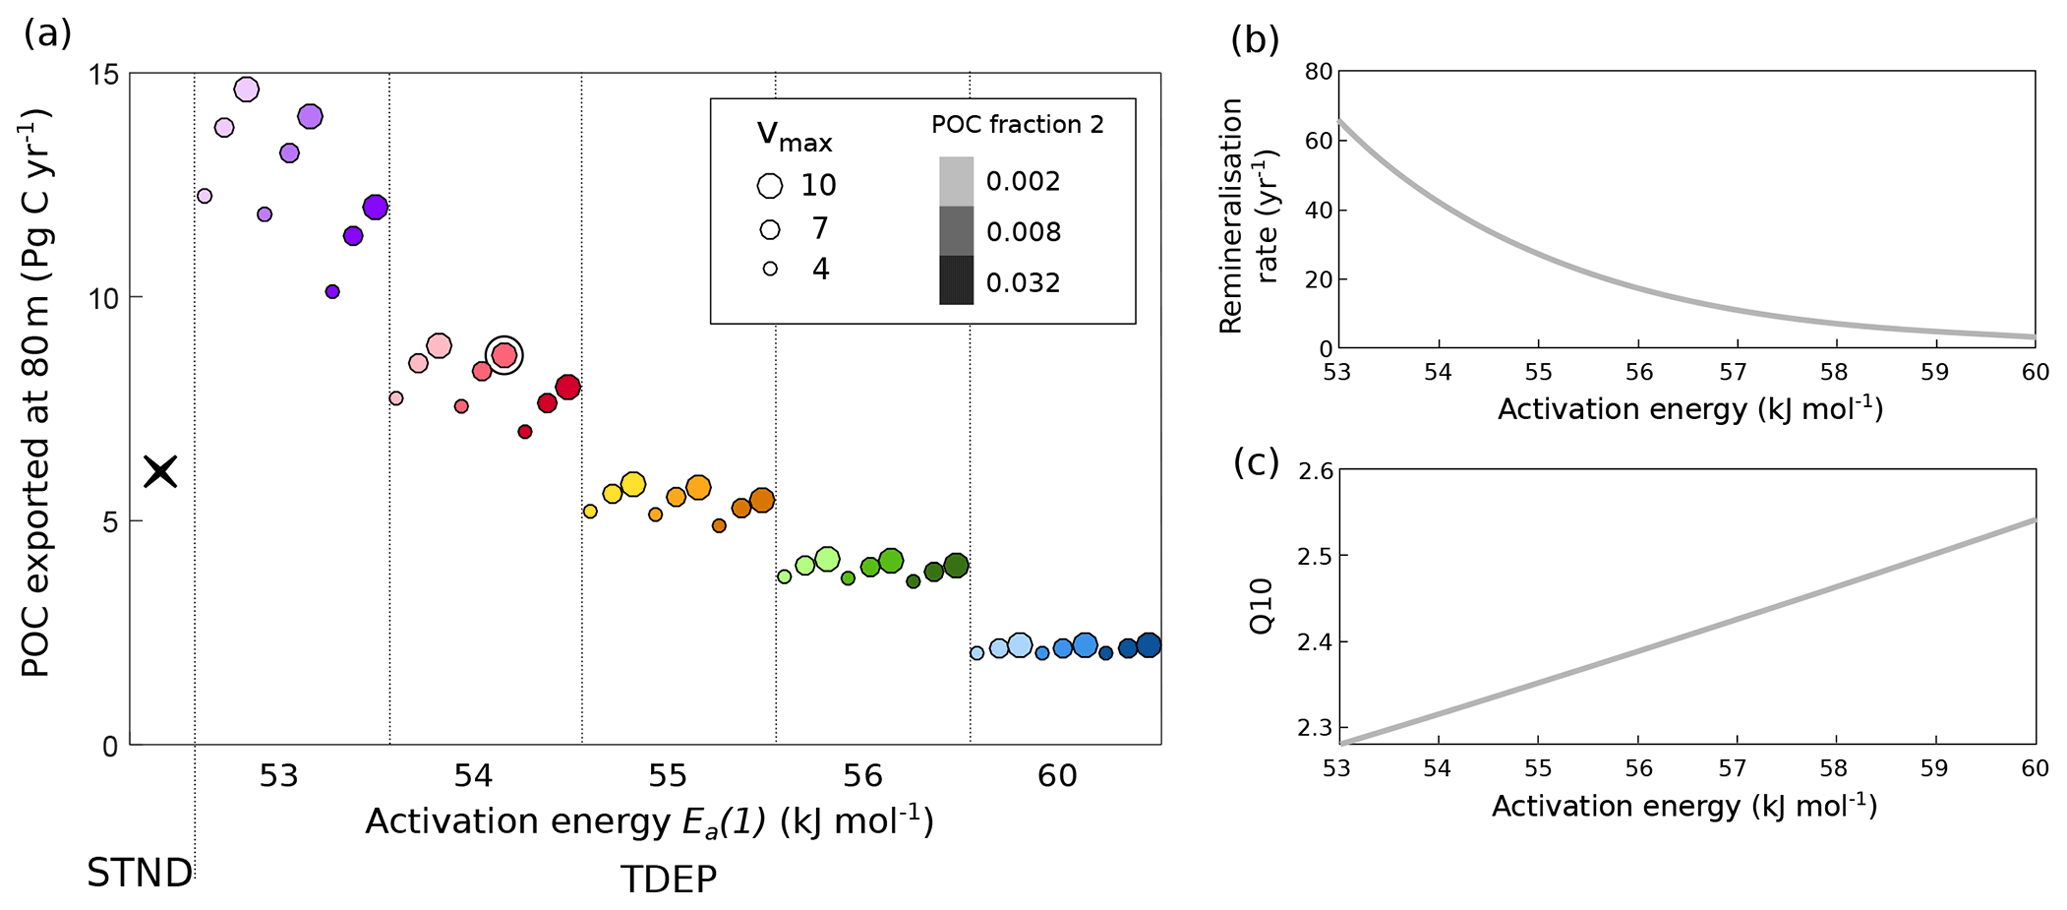
Figure 11Global POC flux (Pg C yr−1) at 80 m (a) and the effect of activation energy on (b) remineralisation rate and (c) Q10 (for a 0 to 10 ∘C change). In (a) the STND model is shown as a black cross, and the TDEP model is indicated by circles. The best-fit TDEP setting is double circled. STND is the standard model, and TDEP is the temperature-dependent model. Colours in (a) reflect those used in Fig. 5.
The remineralisation curves for each ocean region are shown in Fig. 12 for the best-fit TDEP and STND model for POC (in gC m−2 d−1). TDEP and STND have differing initial POC export fluxes, with lower-latitude warmer waters showing higher export in TDEP due to the increased nutrient recycling there. A dataset of POC flux (Mouw et al., 2016a) is overlaid on the remineralisation curves (Fig. 12). In both model configurations, the measured Antarctic zone POC flux at shallow and intermediate depths (<1500 m) is significantly lower than in the model. We do not account for iron limitation in the Southern Ocean (or elsewhere) in this particular configuration of the cGENIE model, which would tend to limit productivity and POC export there and hence could potentially explain some of the mismatch we observe at shallower depths. In general, the measured flux at depth appears reasonably represented with the exception of warmer regions, where the measured POC flux (e.g. eastern tropical Pacific, north Indian, eastern tropical Atlantic) is generally higher than in the model. This likely reflects additional processes that may increase POC fluxes to depth such as ballasting by minerals (Klaas and Archer, 2002; Wilson et al., 2012) and the lower reactivity of POC associated with increased recycling in low-latitude plankton ecosystems (Aumont et al., 2017).

Figure 12POC flux (gC m−2 d−1) for the model (mean and standard deviation) and data. Data from Mouw et al. (2016a). STND is the standard model, and TDEP is the temperature-dependent model.
Overall, the pattern of the efficiency of the transfer of particles from 80 to 1040 m (Fig. 13) in TDEP is similar to that found in Weber et al. (2016), wherein the efficiency of transfer is essentially a measure of the rate of remineralisation or what fraction of the POC exported at 80 m reaches 1040 m. Colder waters show higher transfer efficiency, with the lowest transfer efficiency seen in the subtropical gyres. The STND model has a fixed decay rate for all locations, so the transfer efficiency at any particular depth has a global uniform value. The global export-weighted mean remineralisation depth for STND is 627 m and for TDEP 378 m ±236 m.
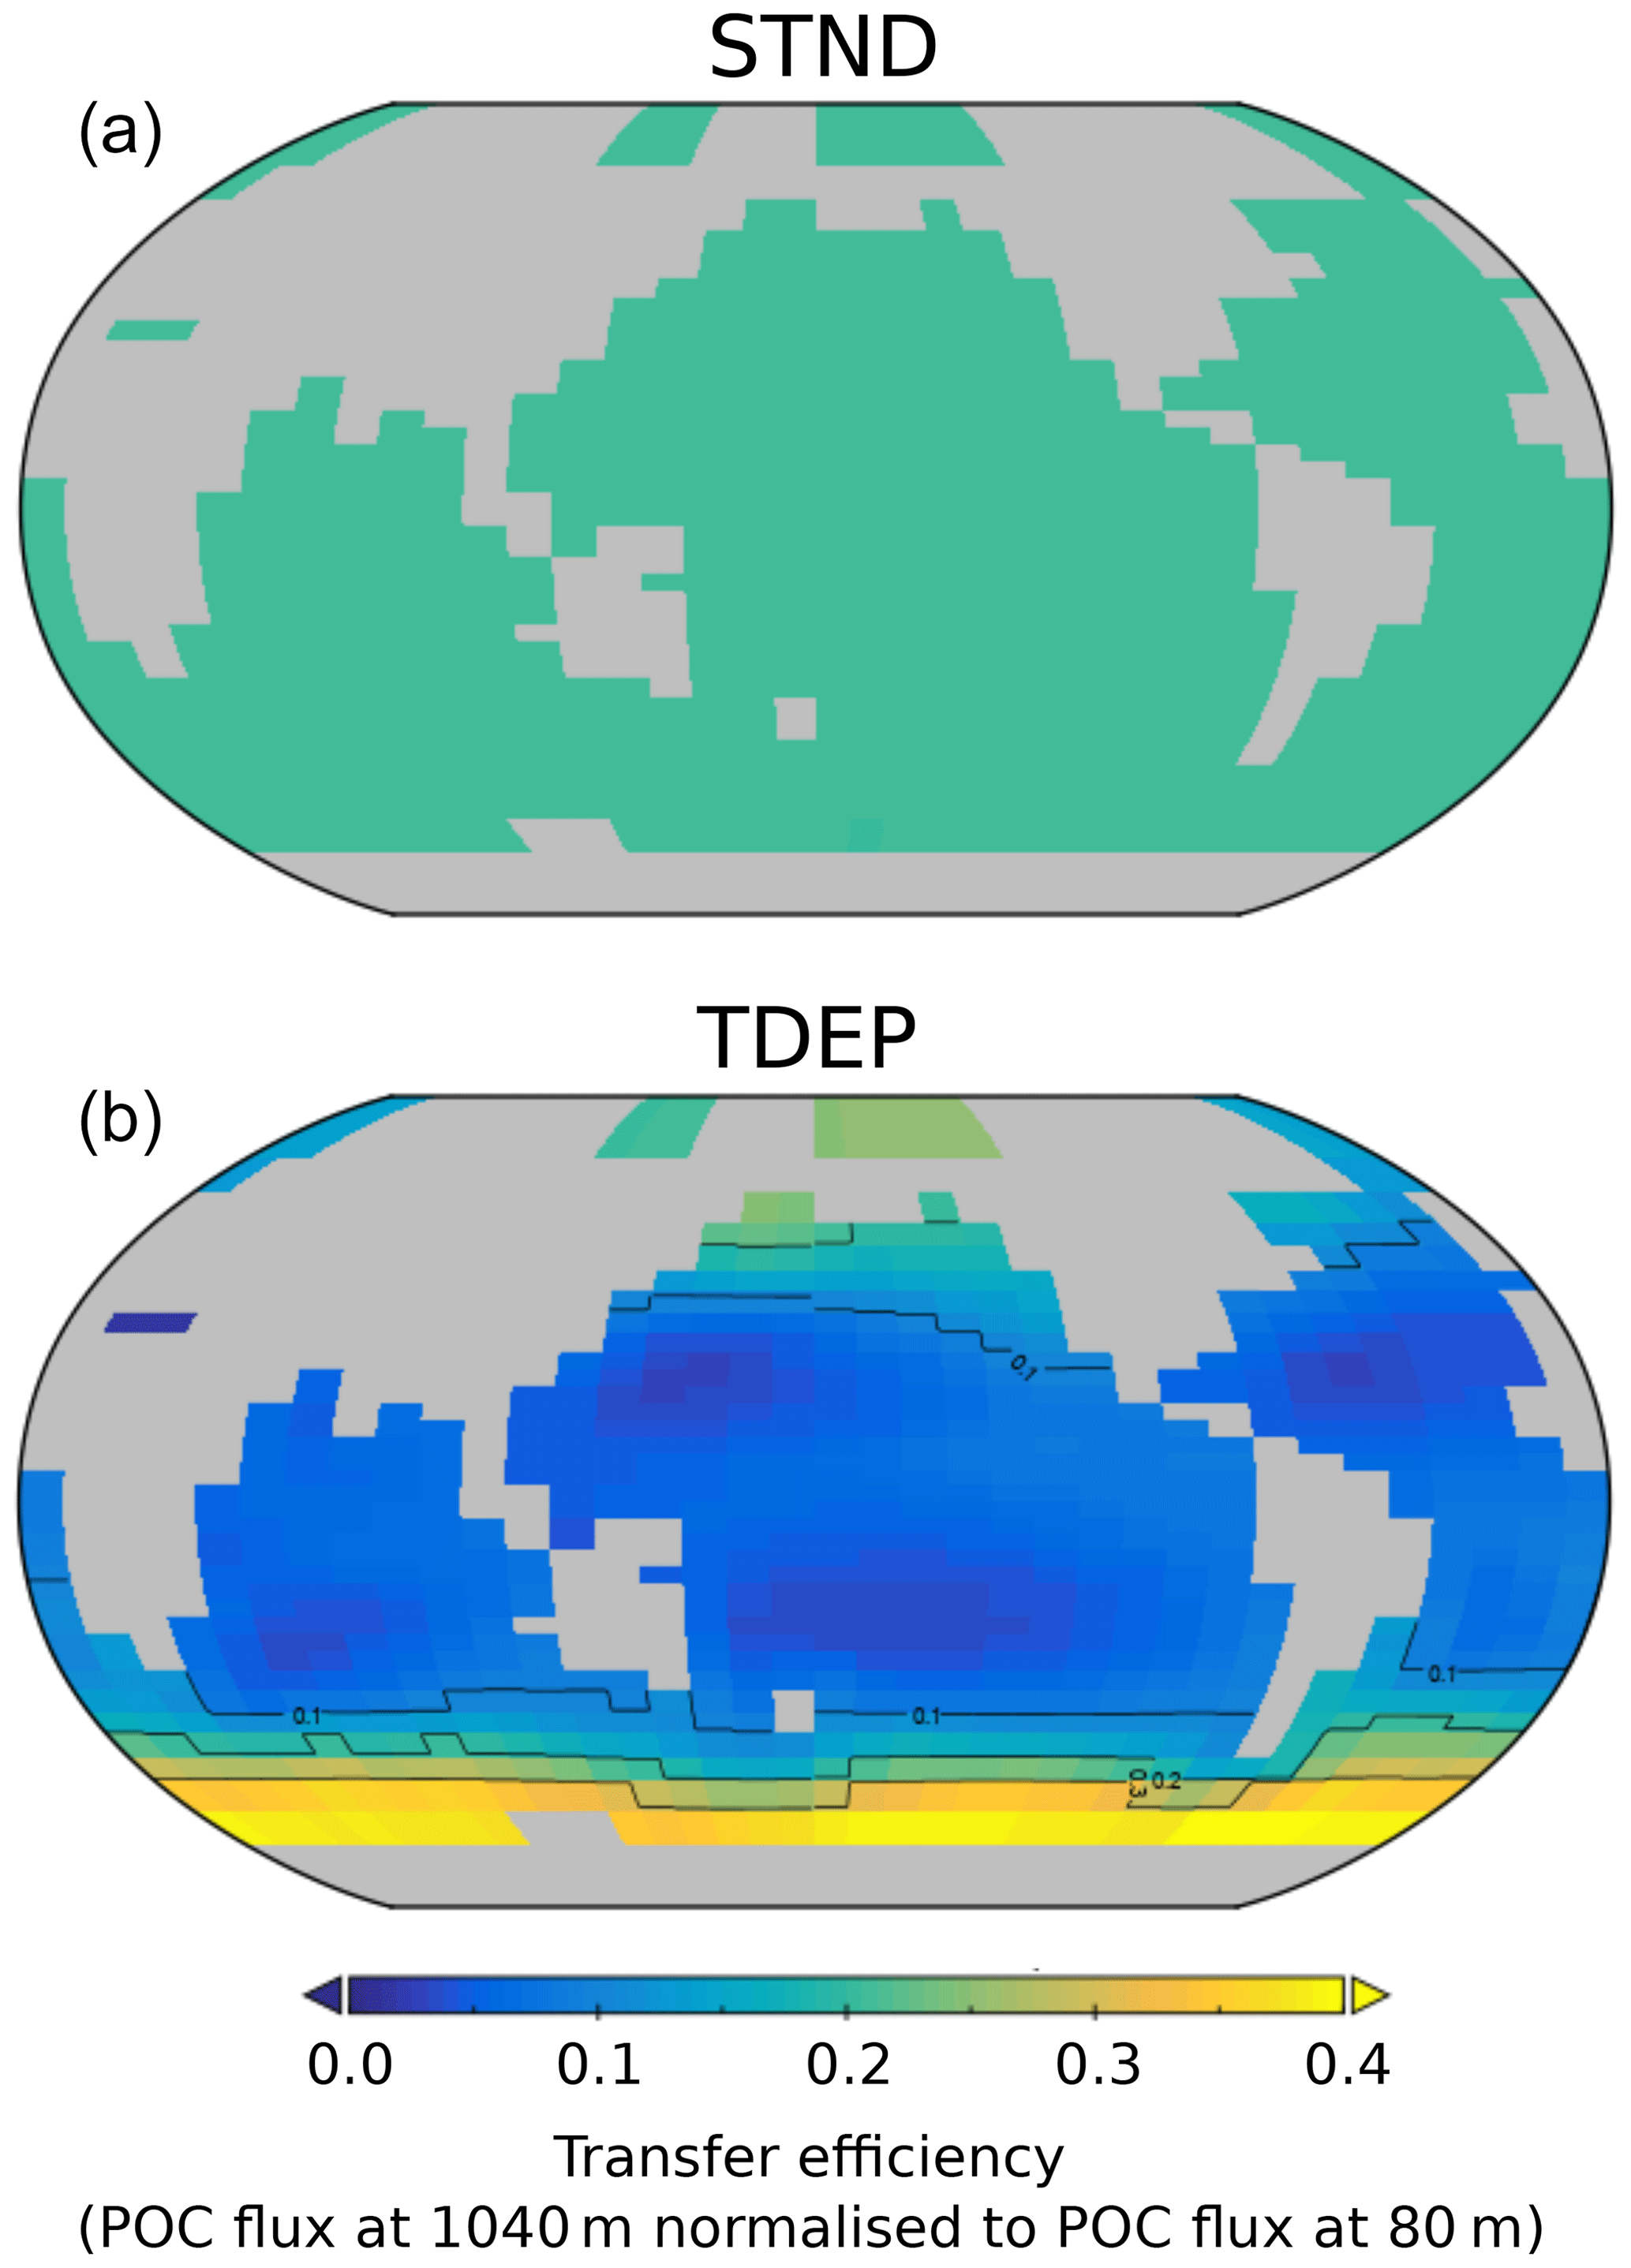
Figure 13Model POC transfer efficiency (also used as a measure of biological carbon pump efficiency here) for STND (a) and best-fit TDEP (b). Transfer efficiency is the fraction of POC exported at 80 m that reaches 1040 m for the year 2010. The global transfer efficiency value for STND is 0.208.
It should be noted that here we have included all available data from Mouw et al. (2016a) without any attempt to ensure these data are representative of the annual mean (for which the model output represents the annual mean). POC flux measurements can be highly dependent on the time of year and number of data measurement points available. Some of the model–data mismatch may then be due to a mismatch between the interval in time represented by the data and the annual mean of the model. For instance, blooms, which are not well represented in the model, may explain some of the very high POC flux values (for example, 0.2 gC m−2 d−1) in the North Atlantic and hence why the model annual mean appears to underestimate the flux.
5.1 The role of temperature in the marine carbon cycle response to historical warming
In this study we have focused on the two main components of the biological carbon pump. The first is nutrient uptake rates due to the metabolic temperature dependence of photosynthesising marine biota, and the second is remineralisation rates of sinking particulate organic matter due to the metabolic temperature dependence of respiring marine biota feeding on that sinking organic matter. We find that the calibrated temperature response of the respiration-based mechanism of remineralisation in the water column is more sensitive to temperature change (a mean Q10 of 2.28 over a range of temperatures from 0 to 26 ∘C, from Eq. 5 using 54 kJ mol−1 for Ea(1)) than the photosynthesis-based one (the Eppley curve has a Q10 of 1.88, in Eqs. 3 and 4, Bissinger et al., 2008), in agreement with fundamental studies (Brown et al., 2004). Historical temperature rise, which we induced in the cGENIE.muffin Earth system model by prescribing the observed CO2 in the atmosphere, provides an illustrative example of the role and importance of including sufficient temperature-dependent processes in models. In this section we therefore discuss in more detail the transient differences between STND and TDEP model configurations.
Between the years 1700 and 2010, global mean air temperature in cGENIE increases by 0.94 ∘C. In turn, warming at the ocean surface induces stratification in the water column, reducing nutrient resupply to the surface from subsurface waters. In the STND model, this results in a pronounced drop in POC export at 80 m of 2.9 % (Fig. 14), in agreement with the average of the CMIP5 models (Bopp et al., 2013). However, the transfer efficiency is additionally affected in TDEP, with a drop of over 5 % in the proportion of POC exported at 80 m that reaches 1040 m (equivalent to a shoaling of the global mean remineralisation depth of 16 m) (Fig. 15). This reduction in biological pump transfer efficiency is a result of increased rates of remineralisation in the warming water column, principally in surface and near-surface waters (while whole-ocean, volumetrically weighted warming is 0.12 ∘C over this period, 0.6 ∘C occurs on a global mean basis in surface waters and 0.02 ∘C in the deepest waters). The result is that for TDEP this stratification-induced nutrient limitation effect on export is largely offset by the intensified recycling of nutrients in warmer surface and near-surface waters.

Figure 14POC export at 80 m (percent change with respect to the year 1700): (a) global mean POC export at 80 m and (b) latitudinal mean POC export change at 2100 with respect to 1700 CE. STND is the standard model, and TDEP is the temperature-dependent model, TDEP+TDOM is temperature-dependent POM and DOM and is described in Sect. 5.2.
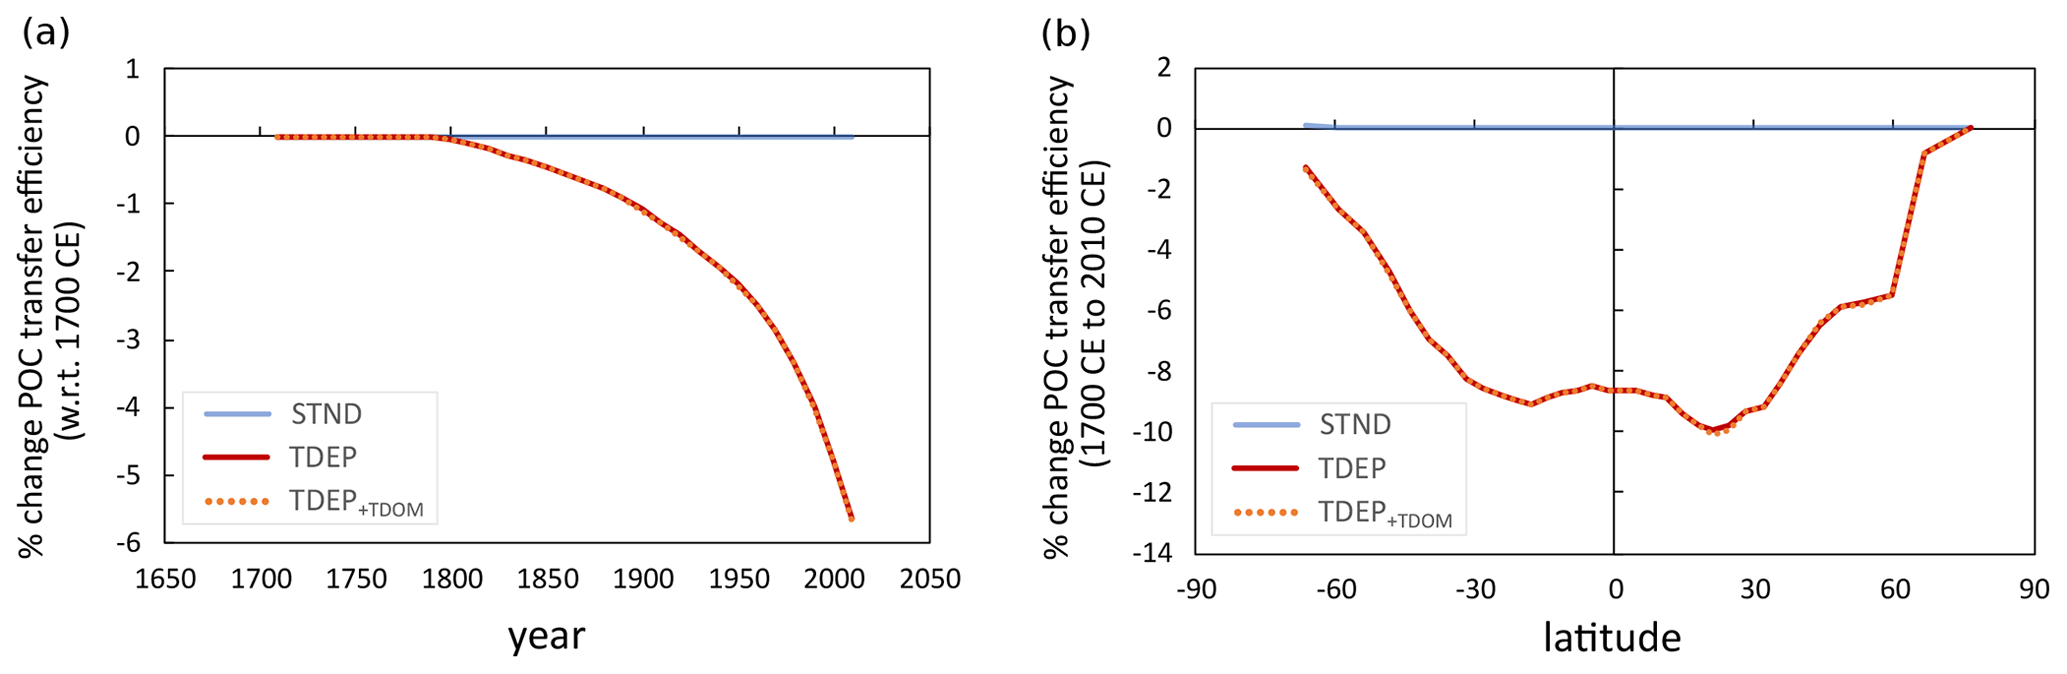
Figure 15TDEP biological pump transfer efficiency (the proportion of POC exported at 80 m that reaches 1040 m; percent change with respect to 1700 CE): (a) global mean change per year with respect to 1700 and (b) latitudinal change at the year 2010 with respect to 1700. STND is the standard model, and TDEP is the temperature-dependent model, TDEP+TDOM is temperature-dependent POM and DOM and is described in Sect. 5.2.
Between simulated pre-industrial and present-day model states, we found a substantially smaller drop in POC flux at 80 m when temperature dependence was included (TDEP) compared to the standard model (STND). Global POC flux at 80 m is reduced by 0.3 % between the pre-industrial era and the present day in TDEP, but with increases in the Southern Ocean of around 10 % and in the tropics of around 1 %, suggesting an increase in NPP (net primary productivity) in the tropics. Kwiatkowski et al. (2017) identified a reduction in NPP with warming in the tropical ocean of 3±1 % per degree of warming based on responses to ENSO (El Niño–Southern Oscillation), which at face value is inconsistent with our simulation of a possible increase in NPP in the tropics. Their estimate utilised satellite-based NPP products from data on chlorophyll and light incidence, and they found that in no data constraint did NPP increase in the tropics (although the data constraint varied according to the NPP product used). However, Behrenfeld et al. (2016) noted that a reduction in chlorophyll does not necessarily represent a reduction in productivity due to photoacclimation. The satellite-based NPP products do not account or correct for this effect, so they may well underestimate NPP in warming conditions. In an earlier study, Taucher and Oschlies (2011) found an increased NPP when temperature dependence was included in modelled future projections. Laufkötter et al. (2017) also found that when including a temperature dependence and oxygen-content-dependent remineralisation, NPP increased on warming due to intensified nutrient recycling in near-surface water. However, they suggested this was largely due to an initial positive bias in surface ocean nutrients. In a second model set-up, they reduced nutrient recycling in surface waters and found little impact on NPP between the temperature-sensitive and temperature-independent model in a future projection to 2100 CE.
In this study we make no distinction between dissolved oxygen and sulfate in terms of controlling the remineralisation rate of POC (unlike, for instance, Laufkötter et al., 2017). Cavan et al. (2017) concluded that the large oxygen minimum zone in the eastern tropical Pacific reduces the rate of remineralisation due to the almost complete absence of zooplankton particle disaggregation within and provides a negative feedback to warming. However, Cram et al. (2018) explained most of the regional variability in the flux of POC in the deep sea via particle size and the effect of temperature on remineralisation, with oxygen concentration providing a small improvement (by reducing nutrient recycling in the eastern tropical Pacific). Particle size plays a role in sinking speeds, as larger particles sink faster (generally), and particle size is a factor in export and transfer efficiency (Mouw et al, 2016b). The configuration of cGENIE we employ here does not account for particle size and has a fixed sinking speed globally (by default, 125 m d−1). The lack of particle size variability and oxygen concentration's role in remineralisation may explain some of the increased POC flux at 80 m that the model shows since the pre-industrial period in tropical waters. This tropical POC export increase may also be partly due to initial higher nutrient concentrations compared to data or to the increased remineralisation rates resupplying nutrients to the surface, but it may also be linked to changes in DOM cycling (see Sect. 5.2). Predicted changes (and changes that may have already occurred) in NPP in low-nutrient warm waters are still subject to large uncertainties (Turner, 2015; Cross et al., 2015).
There is also still uncertainty as to the causes, and even patterns, in POC flux differences across different ocean regions (Henson et al., 2012; Marsay et al., 2015; Weber et al., 2016; Cram et al., 2018). We find that the patterns of transfer efficiency (Fig. 13) for TDEP are in broad agreement with Marsay et al. (2015) and Weber et al. (2016). This transfer efficiency is not dependent on surface water NPP patterns or on how much POC is exported at 80 m in cGENIE; however, the absolute amount of carbon reaching the deep ocean does depend on NPP and export. On warming since the pre-industrial period we found a reduced POC flux at 80 m and a reduction in transfer efficiency, combining to produce a reduction in the strength of the biological carbon pump with warming. This further implies an increased carbon pump strength in cooler climates, as per Heinze et al. (2016).
We note that circulation states and upwelling–downwelling changes can also have an impact on the distribution of carbon, oxygen, and nutrients between the surface and the deep (Kvale et al., 2019; Löptien and Dietze, 2019), and they are also model-dependent. Circulation changes are small between the pre-industrial era and the present day compared to the simulations in Kvale et al. (2019) wherein very high CO2 (up to 1200 ppm) and high surface temperature result in large ocean circulation pattern changes; increased nutrient storage in the deep ocean was due to a longer residence time of deep ocean water in that study (see Chikamoto et al., 2008, for the effect of Atlantic Overturning Circulation shutdown in cGENIE). In our study we have found that the temperature-dependent biological pump offsets some of the effects of physical ocean response to warming (in increased near-surface nutrient recycling, thereby offsetting the effect of increased ocean stratification that otherwise reduces surface nutrients in the STND simulation). However, this is not to suggest that a temperature-dependent biological pump could offset the effect of extreme changes in circulation, such as an AMOC shutdown, or far more extreme warming scenarios than that applied here. We do not test such scenarios here.
5.2 Temperature and the cycle of dissolved organic matter in the ocean
In this paper and associated model calibration, we have focused on the role of temperature in the production and fate of POM. However, the relative partitioning of primary production into DOM (rather than POM) together with its mean residence time at (or close to) the ocean surface modulates nutrient recycling. The temperature sensitivity of these two processes thereby adds an additional set of feedbacks between climate and the biological carbon pump.
To explore the wider role of temperature in the marine carbon cycle and as a further option in the model, we add a similar temperature dependence to the remineralisation of DOM as for POM (Eq. 5):
where Ea is the activation energy assigned a value of 54 000 J mol−1, and R and T are the gas constant (J K−1 mol−1) and absolute temperature (K), respectively. k(T)DOM is the rate constant (year−1) controlling the decay of DOM and replaces the previous fixed lifetime value of 2.0 year−1.
The assumption that the same activation energy applies to DOM as for POM (i.e. setting in Eq. 7) leads to a global mean DOM lifetime of approximately 0.02 years compared to the value of 0.5 years in the standard model (Ridgwell et al., 2007) that follows Najjar et al. (2007). This might (i) reflect a different mean quality (and hence a different activation energy) of the organic matter assumed to constitute DOM as opposed to POM, (ii) reflect the dispersed nature of DOM versus the more concentrated POM and/or differences in the associated bacterial biomass, and/or (iii) reflect that fact that the assumed sinking speed of 125 m d−1 is simply too unrealistically fast. However, to simplify the model re-tuning of the DOM cycle, we only adjust the value of βDOM. For a fixed production fraction of 0.66, setting gives a mean (flux weighted) DOM lifetime in the model that matches the fixed (0.5 years) value of the original model configuration.
The production of DOM (vs. POM) is also likely to be influenced by ambient temperature. Dunne et al. (2005) describe a multiple linear regression analysis of observed ocean surface properties, as well as primary and export production, across a range of different ocean environments and deduce a role for sea surface temperature in predicting the observed particle export ratio. Although the Dunne et al. (2005) regression based on temperature and net primary productivity has previously been employed by Ma and Tian (2014) to formulate the production of DOM vs. POM (and coincidentally, also in a version of the cGENIE Earth system model), the default biological scheme of “induced fluxes” (Maier-Reimer, 1993) does not provide a value of primary productivity, which is required by the regression model. Additionally, the default configuration of the ocean circulation model does not calculate a mixed layer depth, which is required to convert between units for primary production in the regression formula. Dunne et al. (2005) also provide an alternative and slightly improved regression model based on mixed layer Chl a concentrations (and temperature), but this would require use of the Ward et al. (2018) ECOGEM ecological model component in the cGENIE Earth system model and is outside the scope of the present study.
Rather than attempting to reformulate (and re-fit) the Dunne et al. (2005) regression model as a function of the environmental parameters simulated by the cGENIE model, we simply extract the temperature sensitivity term in isolation (while recognising that it was derived by Dunne et al., 2005, jointly alongside primary production – or Chl a) in order to derive a temperature-dependent equation for the partitioning of POM vs. total organic matter export (DOM+POM), γ:
where d is the temperature sensitivity of 0.0101 ∘C−1 from Dunne et al. (2005), and c is a constant (0.512), whose value is chosen such that the global mean (production-weighted) export of DOM vs. POM occurs in a 2:1 ratio (i.e. γ=0.34).
This completes the implementation of an option for temperature dependency in both the creation and remineralisation of DOM, with the exception that the two parameterisations interact. In order to configure cGENIE such that the mean production fraction of DOM and mean lifetime both align with the values (0.66 and 0.5 years, respectively) in the original model (i.e. Ridgwell et al., 2007; Cao et al., 2009), we make a final adjustment to (keeping the initial calibrated value of a=0.512 in Eq. 8).
A further simulation (a pre-industrial spin-up followed by a transient simulation forced by CO2 and δ13CO2 data indicated changes from 1700 to the year 2010) – called TDEP+TDOM – was conducted that includes the best-fit TDEP parameters but now adds the temperature-dependent production and decay of DOM as described above. For the present day, TDEP+TDOM slightly improves the model fit to the oxygen distribution compared to TDEP, with lower CRMSD and higher correlation, whilst the model fit to PO4 is slightly worsened (Table 4).
The inclusion of temperature-dependent DOM processes also affects the response of ocean carbon cycling to historical warming. The global mean export-weighted remineralisation depth for the present day in TDEP+TDOM is 399±255 m (21 m deeper than TDEP), and the change in depth since 1700 is a shallowing of 16 m (the same as for TDEP). Slightly less POC is exported at 80 m in TDEP+TDOM compared to TDEP by 2010 (Fig. 14), indicating that although increases in surface nutrient recycling (due to temperature-dependent POC processes) significantly offset the effects of warming-induced ocean stratification in TDEP, this is counterbalanced but to a lesser extent by temperature dependence in DOM production and remineralisation in TDEP+TDOM.
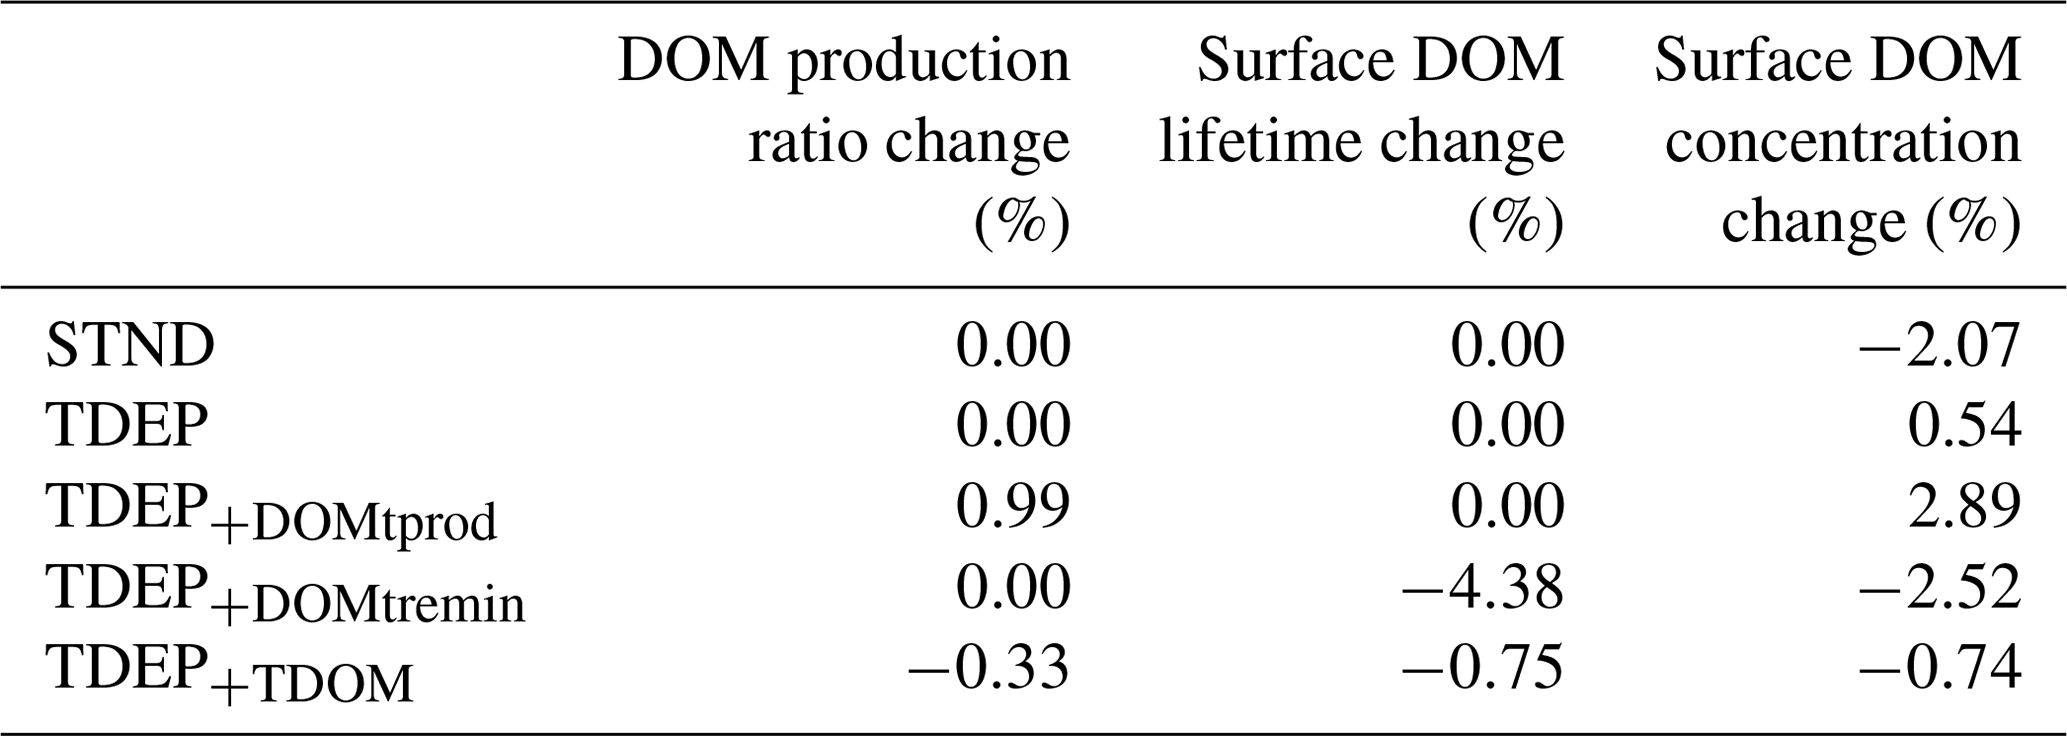
In response to warming and compared to STND and TDEP, TDEP+TDOM exhibits a slightly increased global DOM production ratio (the fraction of organic matter produced that is dissolved rather than particulate; Fig. 1) driven by temperature-dependent DOM production (Table 5). This is countered, however, by a (global) shorter DOM lifetime at the surface driven by temperature-dependent DOM remineralisation. The net result is a decline of 0.74 % in the mean global surface DOM concentration between 1700 and 2010 CE in TDEP+TDOM. In comparison, there is an increase of 0.54 % in the mean global surface DOM concentration for TDEP and a decrease of 2.07 % in STND (Tables 5 and 6).
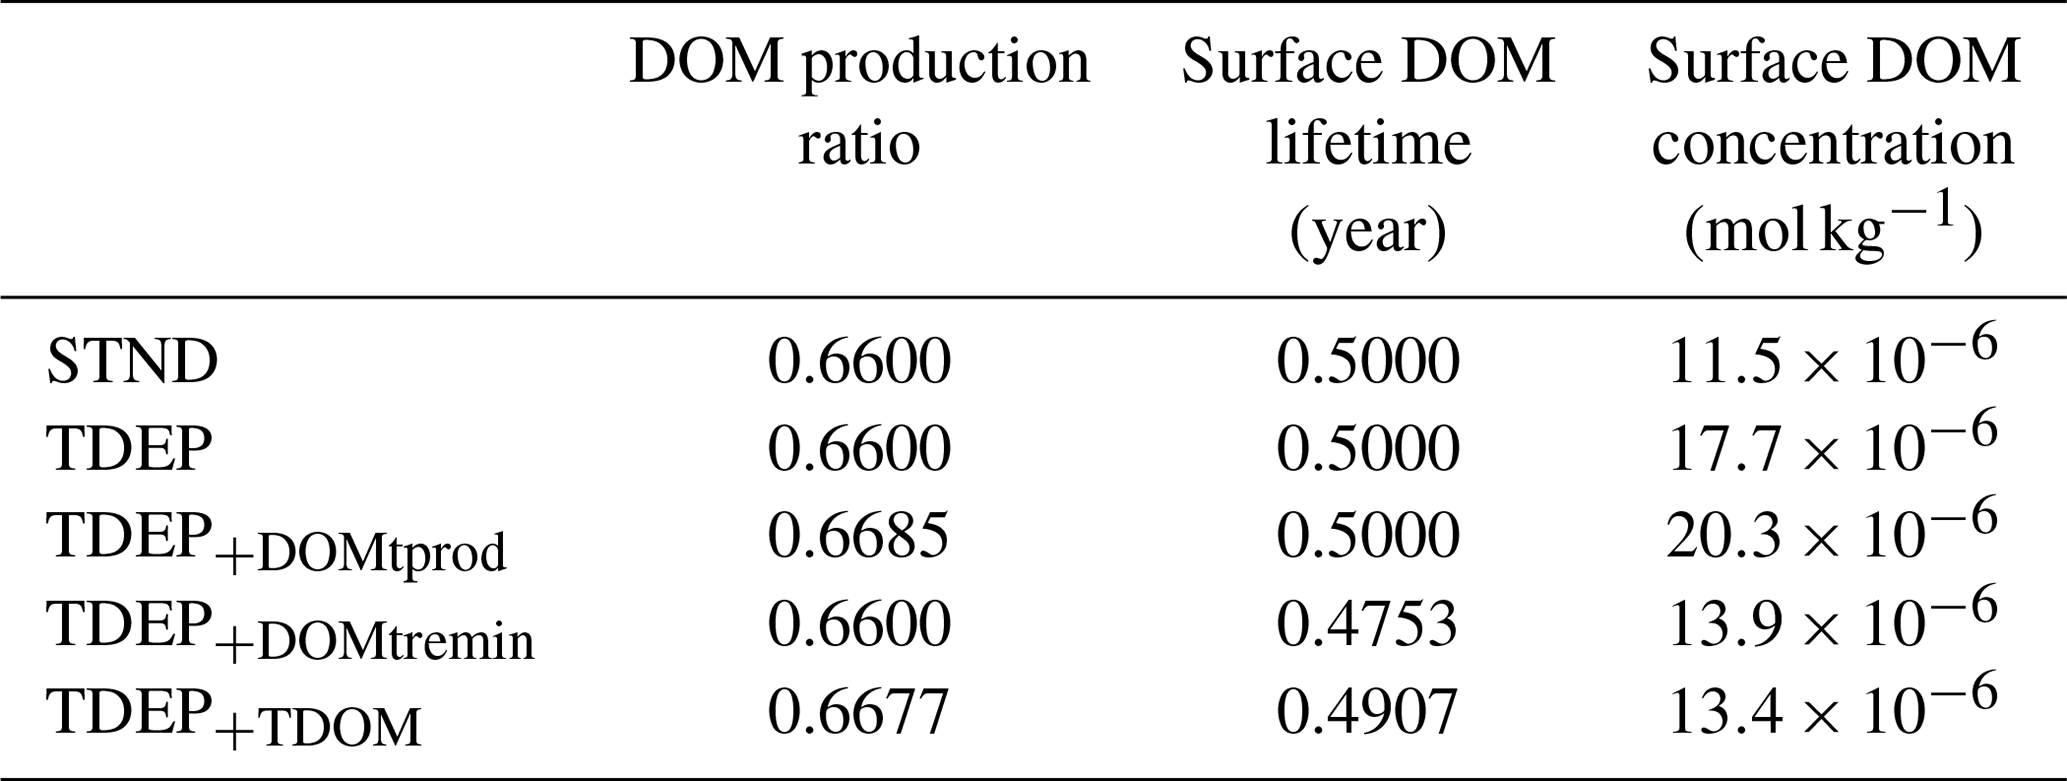
Table 6Anomaly (%) DOM parameters for 2010 with respect to 1700.
Appendix Figs. A1 and A2 provide a view of the spatial changes in DOM dynamics taking place between 1700 and 2100 for each DOM process being individually temperature-enabled as well as both together. A summary is that the effect of temperature-dependent DOM is to increase the DOM production ratio in low latitudes and decrease the production ratio in high latitudes compared to TDEP, with historical warming resulting in a general increase in DOM production between 1700 and 2010 in TDEP+TDOM. The TDEP+TDOM DOM lifetime at the surface is decreased in low latitudes, increased in high latitudes compared to TDEP (with a general decrease in DOM lifetime in response to historical warming), and more pronounced in higher latitudes. TDEP+TDOM has lower surface DOM concentrations in the tropics compared to TDEP in the present day. Since 1700, the surface DOM concentration has increased in the southern high latitudes in all model configurations, but TDEP+TDOM results in a slightly decreased surface DOM concentration in the tropics compared to a slight increase in TDEP.
Overall, the combined effects of temperature-dependent POM and DOM processes still result in a smaller reduction in modelled POC export at 80 m compared to STND (Fig. 14a) of 0.7 % since 1700, although when only POM processes are enable as temperature-dependent, the decrease is smaller still (0.3 %). Compared to TDEP, the TDEP+TDOM shows lower export production in middle and high latitudes (Fig. 14b) but affects almost no change in the transfer efficiency of the biological pump (Fig. 15).
The STND and TDEP variants of the cGENIE.muffin model are tuned to observed PO4 and O2 distributions and achieve comparable statistical fits to ocean climatologies. However, substituting temperature-dependent particulate organic matter (POM) export and remineralisation parameterisations into cGENIE.muffin changes the patterns of PO4, dissolved oxygen, and carbon-13 distributions in the ocean compared to the standard model, and substantive differences between models occur in response to warming since the pre-industrial period. Specifically, in response to warming, inclusion of a temperature dependency on the production and remineralisation of POM increases the efficiency of nutrient and carbon recycling to the surface. In the case of a transient and geologically rapid warming, this temperature-driven increase in recycling is sufficient to largely offset a decrease in nutrient resupply due to enhanced physical stratification of the upper ocean, leaving global POM export relatively unaffected by historical warming. Additionally accounting for temperature dependency in both the production and remineralisation of dissolved organic matter (DOM) further modifies the global carbon cycle response to historical warming, but to a much lesser extent than did the inclusion of POM-linked processes. Finally, the temperature-dependent biological pump results in a large reduction in the efficiency of the transfer of carbon from the surface to the deep ocean over the historical period simulation compared to the standard model.
We combined the processes of temperature-dependent uptake and remineralisation for the POC-driven biological pump as each process has been individually applied in previous published work. However, for the newly developed temperature-dependent DOM processes we show here (for each model configuration discussed in the text) the separate effects of temperature-dependent DOM production and temperature-dependent DOM remineralisation mapped as global surface distributions for the DOM production ratio, DOM lifetime, and DOM surface concentration (Fig. A1). We further show for each parameter the anomaly at 2010 with respect to the year 1700 (Fig. A2).
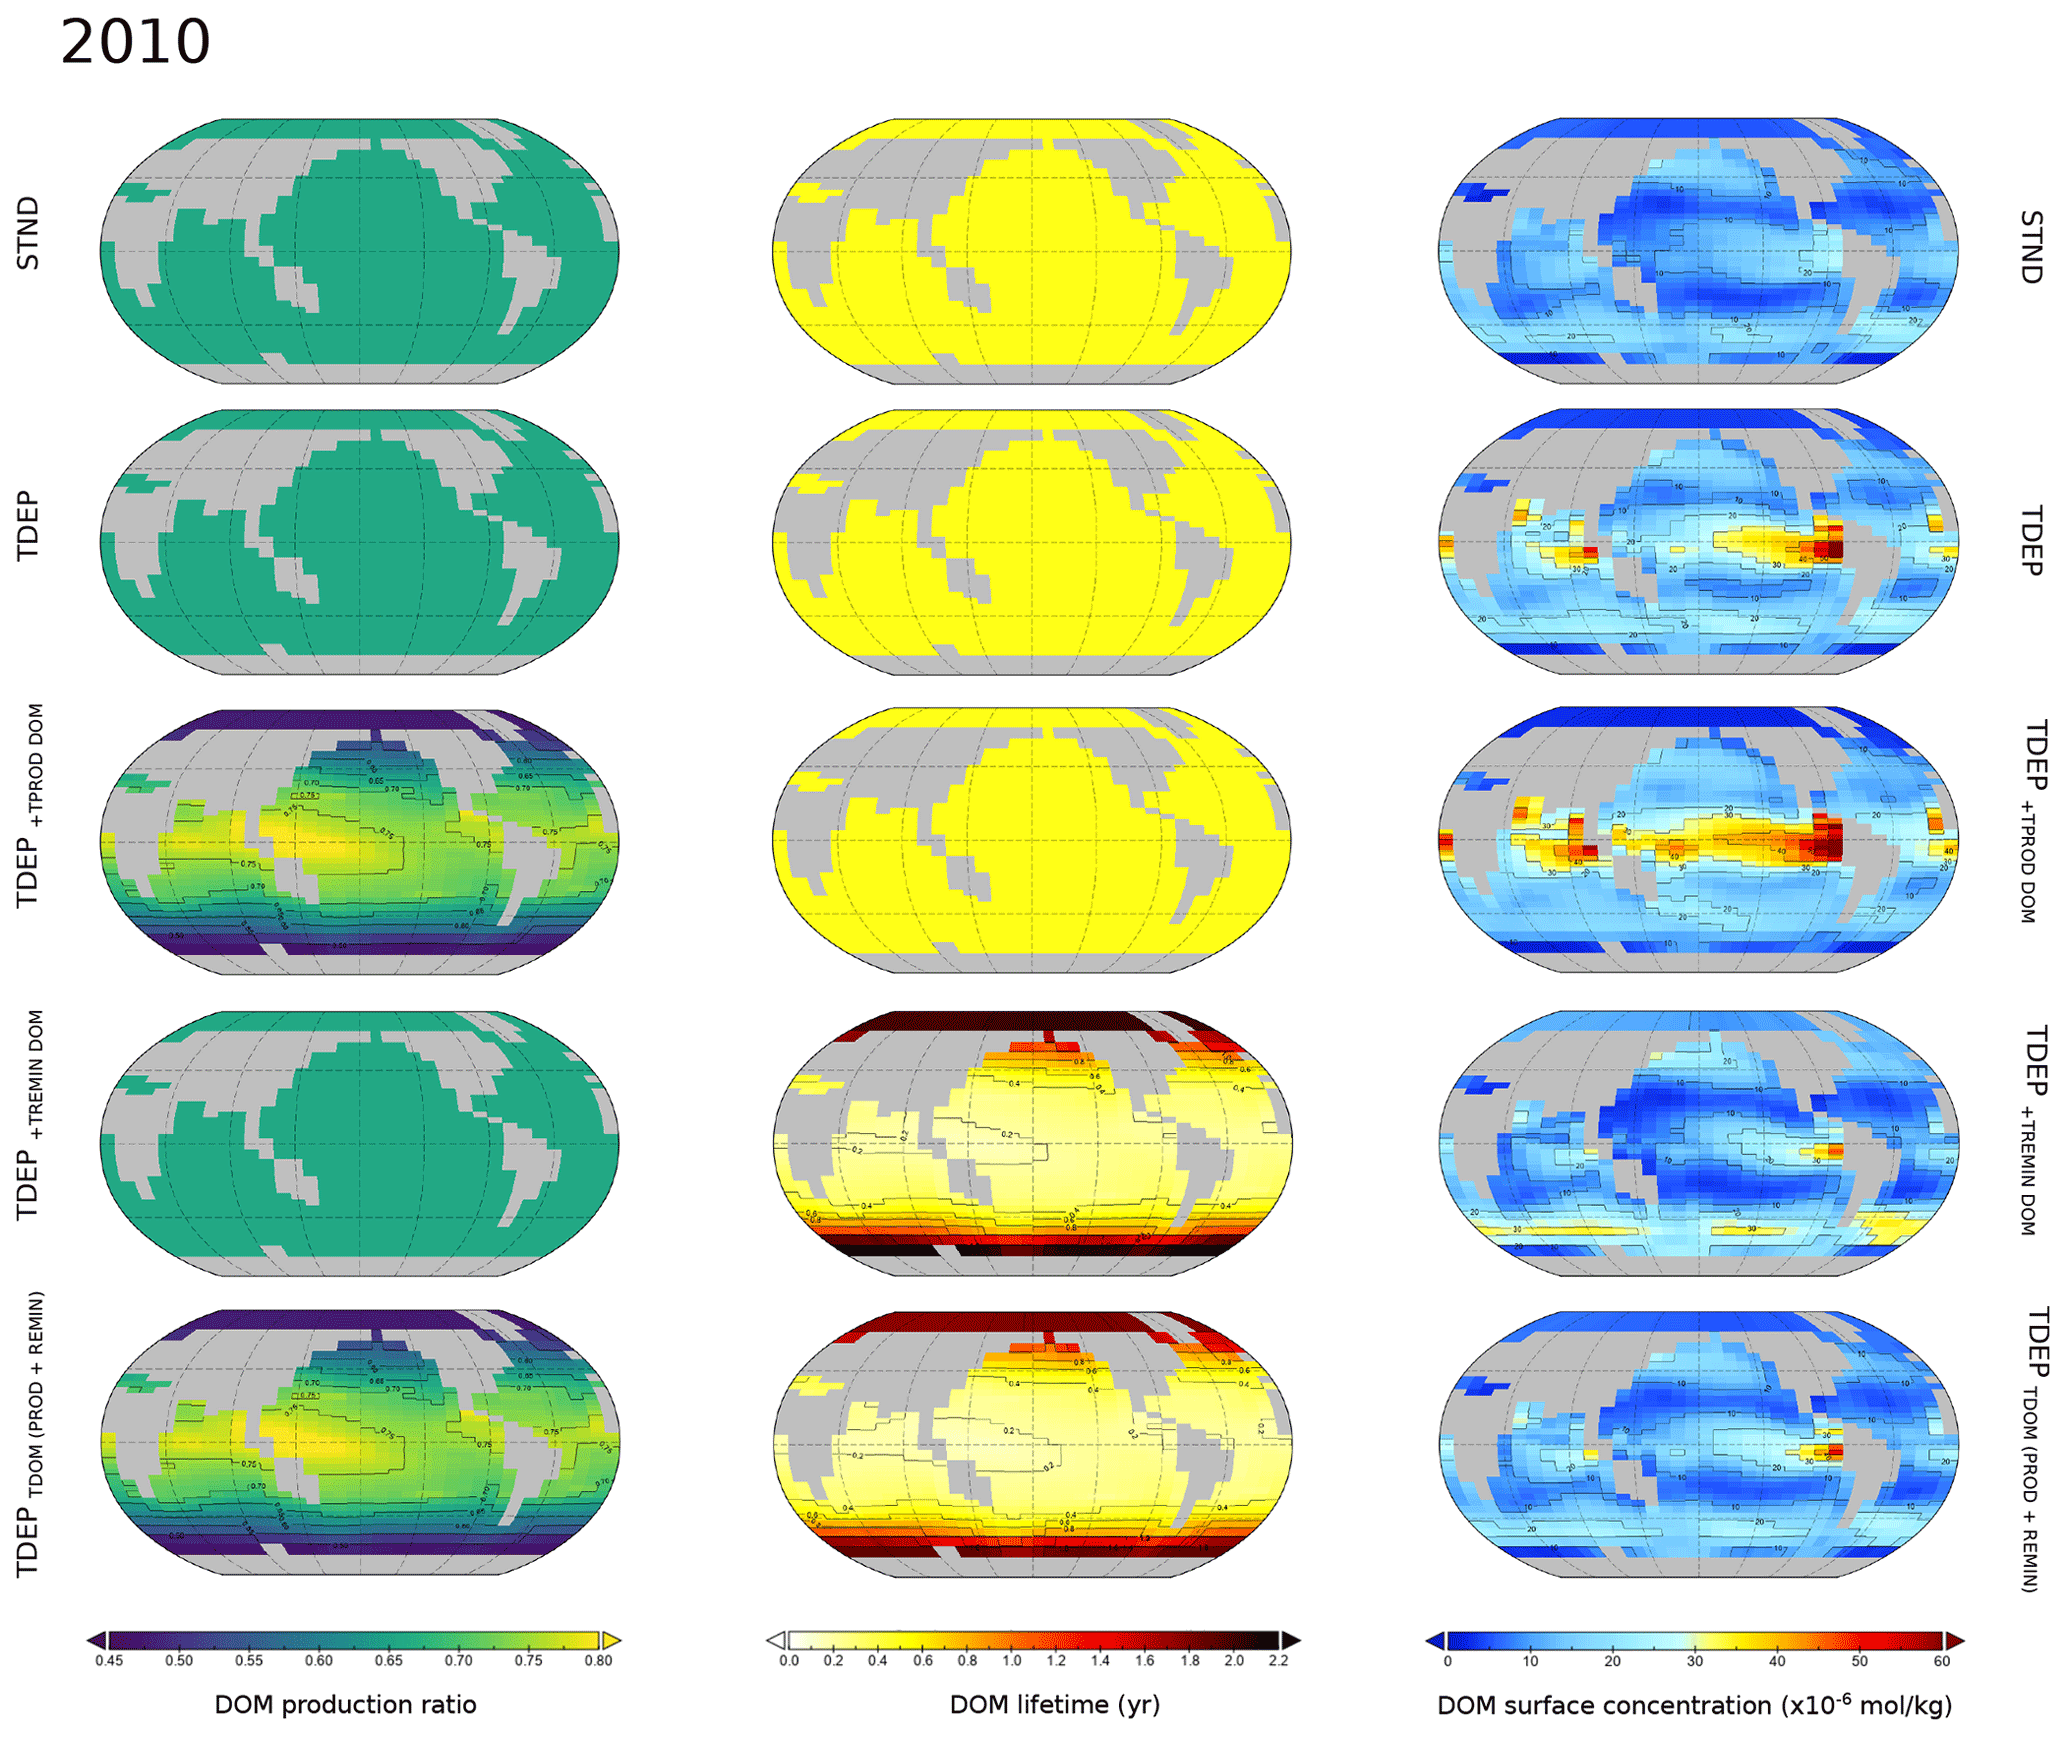
Figure A1Surface ocean DOM production ratio, DOM lifetime, and DOM concentration for the modelled present day (year 2010). Labelled simulations include those discussed in the main text (STND, TDEP, and TDEP+TDOM); TDEP+TDOM is labelled here as TDEPTDOM(PROD+REMIN) for clarity. Also mapped are DOM production and remineralisation temperature dependence separately applied as TDEP+TPROD DOM TDEP+TREMIN DOM.
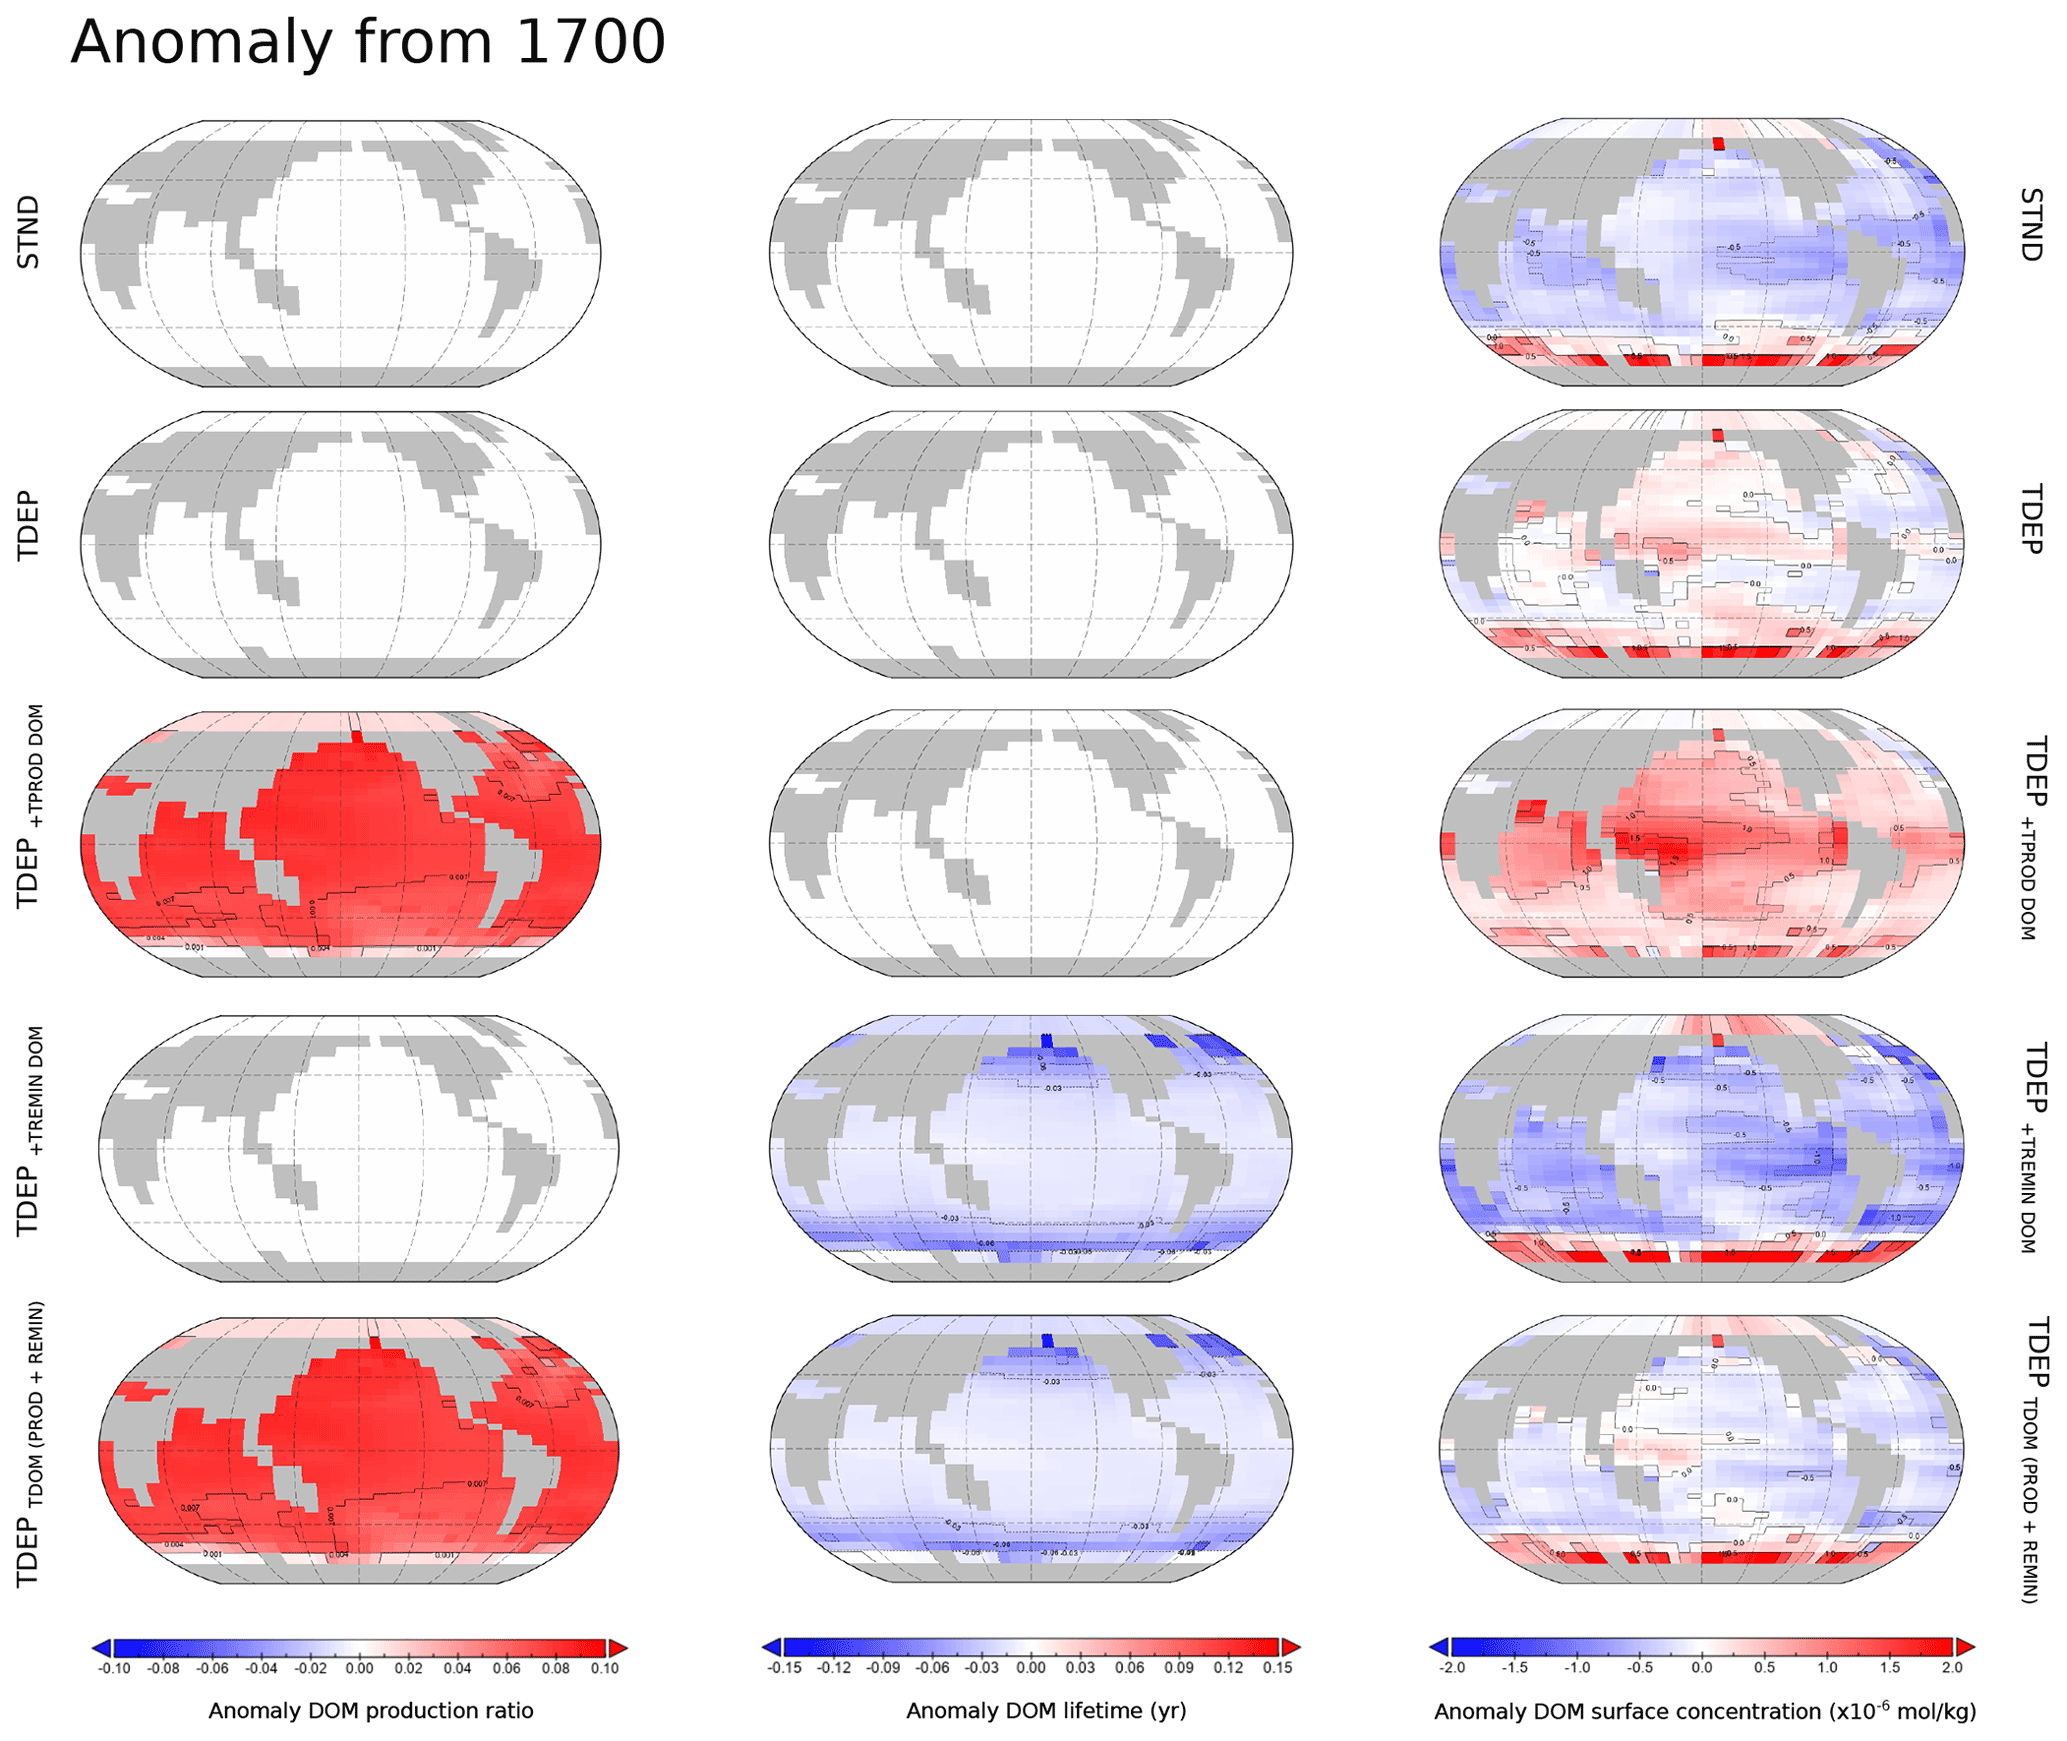
Figure A2Anomalies for the present day against the year 1700 for surface ocean DOM production ratio, DOM lifetime, and DOM concentration for the modelled present day. Labelled simulations include those discussed in the main text (STND, TDEP, and TDEP+TDOM); TDEP+TDOM is labelled here as TDEPTDOM(PROD+REMIN) for clarity. Also mapped are DOM production and remineralisation temperature dependence separately applied as TDEP+TPROD DOM TDEP+TREMIN DOM.
The specific version of the cGENIE.muffin model used in this paper is tagged as release v0.9.13 and has been assigned a DOI: https://doi.org/10.5281/zenodo.3999080 (Ridgwell et al., 2020a).
Configuration files for the specific experiments presented in the paper can be found in the directory genie-userconfigs\MS\crichtonetal.GMD.2020 (Ridgwell et al., 2020a).
Details on the experiments, plus the command line needed to run each one, are given in the readme.txt file in that directory. All other configuration files and boundary conditions are provided as part of the release.
A manual detailing code installation, basic model configuration (plus an extensive series of tutorials covering various aspects of muffin capability and experimental design), and results output and processing is provided on GitHub. The latex source of the manual, along with a pre-built PDF file, is tagged as release v0.9.13 and has been assigned a DOI: https://doi.org/10.5281/zenodo.4305997 (Ridgwell et al., 2020b).
KAC devised, ran, and analysed the model ensemble and data. JDW and AR developed the temperature-dependent POM remineralisation process. AR developed the temperature-dependent DOM processes, and all authors co-wrote the paper.
The authors declare that they have no conflict of interest.
Thanks to the reviewers for their helpful comments and to the journal editors during these strange times.
This research has been supported by the Natural Environment Research Council (grant no. NE/N001621/1), the European Research Council (grant no. ERC-2013-CoG-617313), and the National Science Foundation (grant nos. 1702913 and 1736771).
This paper was edited by Andrew Yool and reviewed by two anonymous referees.
Arndt, S., Jørgensen, B. B., LaRowe, D. E., Middelburg, J. J., Pancost, R. D., and Regnier, P.: Quantifying the degradation of organic matter in marine sediments: a review and synthesis, Earth-Sci. Rev., 123, 53-86, https://doi.org/10.1016/j.earscirev.2013.02.008, 2013.
Aumont, O., van Hulten, M., Roy-Barman, M., Dutay, J.-C., Éthé, C., and Gehlen, M.: Variable reactivity of particulate organic matter in a global ocean biogeochemical model, Biogeosciences, 14, 2321–2341, https://doi.org/10.5194/bg-14-2321-2017, 2017
Bach, L. T., Boxhammer, T., Larsen, A., Hildebrandt, N., Schulz, K. G., and Riebesell, U.: Influence of plankton community structure on the sinking velocity of marine aggregates, Global Biogeochem. Cy., 30, 1145–1165, https://doi.org/10.1002/2016GB005372, 2016.
Behrenfeld, M. J., O'Malley, R. T., Boss, E. S., Westberry, T. K., Graff, J. R., Halsey, K. H., Milligan, A. J., Siegel, D. A., and Brown, M. B.: Revaluating ocean warming impacts on global phytoplankton, Nat. Clim. Change, 6, 323–330, https://doi.org/10.1038/nclimate2838, 2016.
Bendtsen, J., Hilligsøe, K. M., Hansen, J. L., and Richardson, K.: Analysis of remineralisation, lability, temperature sensitivity and structural composition of organic matter from the upper ocean, Prog. Oceanogr., 130, 125–145, https://doi.org/10.1016/j.pocean.2014.10.009, 2015.
Bissinger, J. E., Montagnes, D. J., harples, J., and Atkinson, D.: Predicting marine phytoplankton maximum growth rates from temperature: Improving on the Eppley curve using quantile regression, Limnol. Oceanogr., 53, 487–493, https://doi.org/10.4319/lo.2008.53.2.0487, 2008.
Bopp, L., Resplandy, L., Orr, J. C., Doney, S. C., Dunne, J. P., Gehlen, M., Halloran, P., Heinze, C., Ilyina, T., Séférian, R., Tjiputra, J., and Vichi, M.: Multiple stressors of ocean ecosystems in the 21st century: projections with CMIP5 models, Biogeosciences, 10, 6225–6245, https://doi.org/10.5194/bg-10-6225-2013, 2013.
Boscolo-Galazzo, F., Crichton, K. A., Barker, S., and Pearson, P. N.: Temperature dependency of metabolic rates in the upper ocean: A positive feedback to global climate change?, Global Planet. Change, 170, 201–212, https://doi.org/10.1016/j.gloplacha.2018.08.017, 2018.
Boyd, P. W., Claustre, H., Levy, M., Siegel, D. A., and Weber, T.: Multi-faceted particle pumps drive carbon sequestration in the ocean, Nature, 568, 327–335, https://doi.org/10.1038/s41586-019-1098-2, 2019.
Brown, J. H., Gillooly, J. F., Allen, A. P., Savage, V. M., and West, G. B.: Toward a metabolic theory of ecology, Ecology, 85, 1771–1789, 2004.
Burd, A. B., Frey, S., Cabre, A., Ito, T., Levine, N. M., Lønborg, C., Long, M., Mauritz, M., Thomas, R. Q., Stephens, B. M., and Vanwalleghem, T.: Terrestrial and marine perspectives on modeling organic matter degradation pathways, Glob. Change Biol., 22, 121–136, https://doi.org/10.1111/gcb.12987, 2016.
Cao, L., Eby, M., Ridgwell, A., Caldeira, K., Archer, D., Ishida, A., Joos, F., Matsumoto, K., Mikolajewicz, U., Mouchet, A., Orr, J. C., Plattner, G.-K., Schlitzer, R., Tokos, K., Totterdell, I., Tschumi, T., Yamanaka, Y., and Yool, A.: The role of ocean transport in the uptake of anthropogenic CO2, Biogeosciences, 6, 375–390, https://doi.org/10.5194/bg-6-375-2009, 2009.
Cao, L. and Zhang, H.: The role of biological rates in the simulated warming effect on oceanic CO2 uptake, J. Geophys. Res.-Biogeo., 122, 1098–1106,https://doi.org/10.1002/2016JG003756, 2017.
Cavan, E. L., Trimmer, M., Shelley, F., and Sanders, R.: Remineralization of particulate organic carbon in an ocean oxygen minimum zone, Nature Commun., 8, 14847, https://doi.org/10.1038/ncomms14847, 2017.
Chikamoto, M. O., Abe-Ouchi, A., Oka, A., and Smith, S. L.: Temperature-induced marine export production during glacial period, Geophys. Res. Lett., 39, G03017, https://doi.org/10.1029/2012GL053828, 2012.
Chikamoto, M. O., Matsumoto, K., and Ridgwell, A.: Response of deep-sea CaCO3 sedimentation to Atlantic meridional overturning circulation shutdown, J. Geophys. Res. Biogeo., 113, G03017, https://doi.org/10.1029/2007JG000669, 2008.
Cram, J. A., Weber, T., Leung, S. W., McDonnell, A. M., Liang, J. H., and Deutsch, C.: The role of particle size, ballast, temperature, and oxygen in the sinking flux to the deep sea, Global Biogeochem. Cy., 32, 858–876, https://doi.org/10.1029/2017GB005710, 2018.
Cross, W. F., Hood, J. M., Benstead, J. P., Huryn, A. D., and Nelson, D.: Interactions between temperature and nutrients across levels of ecological organization, Glob. Change Biol., 21, 1025–1040, https://doi.org/10.1111/gcb.12809, 2015.
Dunne, J. P., Armstrong, R. A., Gnanadesikan, A., and Sarmiento, J. L.: Empirical and mechanistic models for the particle export ratio, Global Biogeochem. Cy., 19, GB4026, https://doi.org/10.1029/2004GB002390. 2005.
Eppley, R. W.: Temperature and phytoplankton growth in the sea, Fish. Bull., 70, 1063–1085, 1972.
Edwards, N. R. and Marsh, R.: Uncertainties due to transport-parameter sensitivity in an efficient 3-D ocean-climate model, Clim. Dynam., 24, 415–433, https://doi.org/10.1007/s00382-004-0508-8, 2005.
Francey, R. J., Allison, C. E., Etheridge, D. M., Trudinger, C. M., Enting, I. G., Leuenberger, M., Langenfelds, R. L., Michel, E., and Steele, L. P.: A 1000-year high precision record of δ13C in atmospheric CO2, Tellus B, 51, 170–193, https://doi.org/10.3402/tellusb.v51i2.16269, 1999
Heinze, C., Hoogakker, B. A. A., and Winguth, A.: Ocean carbon cycling during the past 130 000 years – a pilot study on inverse palaeoclimate record modelling, Clim. Past, 12, 1949–1978, https://doi.org/10.5194/cp-12-1949-2016, 2016.
Heinze, C., Meyer, S., Goris, N., Anderson, L., Steinfeldt, R., Chang, N., Le Quéré, C., and Bakker, D. C. E.: The ocean carbon sink – impacts, vulnerabilities and challenges, Earth Syst. Dynam., 6, 327–358, https://doi.org/10.5194/esd-6-327-2015, 2015.
Henson, S. A., Sanders, R., and Madsen, E.: Global patterns in efficiency of particulate organic carbon export and transfer to the deep ocean, Global Biogeochem. Cy., 26, GB1028, https://doi.org/10.1029/2011GB004099, 2012.
Holden, P. B., Edwards, N. R., Fraedrich, K., Kirk, E., Lunkeit, F., and Zhu, X.: PLASIM–GENIE v1.0: a new intermediate complexity AOGCM, Geosci. Model Dev., 9, 3347–3361, https://doi.org/10.5194/gmd-9-3347-2016, 2016.
Hülse, D., Arndt, S., Wilson, J. D., Munhoven, G., and Ridgwell, A.: Understanding the causes and consequences of past marine carbon cycling variability through models, Earth-Sci. Rev., 171, 349–382, https://doi.org/10.1016/j.earscirev.2017.06.004, 2017.
John, E. H., Wilson, J. D., Pearson, P. N., and Ridgwell, A.: Temperature-dependent remineralization and carbon cycling in the warm Eocene oceans, Palaeogeogr. Palaeocl., 413, 158–166, https://doi.org/10.1016/j.palaeo.2014.05.019, 2014.
Keeling, C. D.: The Suess effect: 13Carbon-14Carbon interrelations, Environ. Int., 2, 229–300, https://doi.org/10.1016/0160-4120(79)90005-9, 1979.
Kirtland Turner, S. and Ridgwell, A.: Development of a novel empirical framework for interpreting geological carbon isotope excursions, with implications for the rate of carbon injection across the PETM, Earth Planet. Sc. Lett., 435, 1–13, https://doi.org/10.1016/j.epsl.2015.11.027, 2016.
Klaas, C. and Archer, D. E.: Association of sinking organic matter with various types of mineral ballast in the deep sea: Implications for the rain ratio, Global Biogeochem. Cy., 16, 1116, https://doi.org/10.1029/2001GB001765, 2002.
Kvale, K. F., Meissner, K. J., and Keller, D. P.: Potential increasing dominance of heterotrophy in the global ocean, Environ. Res. Lett., 10, 074009, https://doi.org/10.1088/1748-9326/10/7/074009, 2015.
Kvale, K. F., Turner, K. E., Landolfi, A., and Meissner, K. J.: Phytoplankton calcifiers control nitrate cycling and the pace of transition in warming icehouse and cooling greenhouse climates, Biogeosciences, 16, 1019–1034, https://doi.org/10.5194/bg-16-1019-2019, 2019.
Kwiatkowski, L., Bopp, L., Aumont, O., Ciais, P., Cox, P. M., Laufkötter, C., Li, Y., and Séférian, R.: Emergent constraints on projections of declining primary production in the tropical oceans, Nat. Clim. Change, 7, 355–358, https://doi.org/10.1038/nclimate3265, 2017.
Laufkötter, C., John, J. G., Stock, C. A., and Dunne, J. P.: Temperature and oxygen dependence of the remineralization of organic matter, Global Biogeochem. Cy., 31, 1038–1050, https://doi.org/10.1002/2017GB005643, 2017.
Laufkötter, C., Vogt, M., Gruber, N., Aumont, O., Bopp, L., Doney, S. C., Dunne, J. P., Hauck, J., John, J. G., Lima, I. D., Seferian, R., and Völker, C.: Projected decreases in future marine export production: the role of the carbon flux through the upper ocean ecosystem, Biogeosciences, 13, 4023–4047, https://doi.org/10.5194/bg-13-4023-2016, 2016.
Legendre, L., Rivkin, R. B., Weinbauer, M. G., Guidi, L., and Uitz, J.: The microbial carbon pump concept: Potential biogeochemical significance in the globally changing ocean, Prog. Oceanogr., 134, 432–450, https://doi.org/10.1016/j.pocean.2015.01.008, 2015.
Levitus, S., Locarnini, R. A., Boyer, T. P., Mishonov, A. V., Antonov, J. I., Garcia, H. E., Baranova, O. K., Zweng, M. M., Johnson, D. R., and Seidov, D.: World ocean atlas 2009, National Oceanographic Data Center (U.S.), Ocean Climate Laboratory, United States, National Environmental Satellite, Data, and Information Service, Silver Spring, MD, USA, 2010.
Löptien, U. and Dietze, H.: Reciprocal bias compensation and ensuing uncertainties in model-based climate projections: pelagic biogeochemistry versus ocean mixing, Biogeosciences, 16, 1865–1881, https://doi.org/10.5194/bg-16-1865-2019, 2019.
Lynch-Stieglitz, J.: Tracers of past ocean circulation, Treatise on Geochemistry, 6, 433–451, https://doi.org/10.1016/B0-08-043751-6/06117-X, 2003.
Ma, W. and Tian, J.: Modeling the contribution of dissolved organic carbon to carbon sequestration during the last glacial maximum, Geo-Marine Letters, 34, 471–482, https://doi.org/10.1007/s00367-014-0378-y, 2014.
Mari, X., Passow, U., Migon, C., Burd, A. B., and Legendre, L.: Transparent exopolymer particles: Effects on carbon cycling in the ocean, Prog. Oceanogr., 151, 13–37, https://doi.org/10.1016/j.pocean.2016.11.002, 2017.
Marsay, C. M., Sanders, R. J., Henson, S. A., Pabortsava, K., Achterberg, E. P., and Lampitt, R. S.: Attenuation of sinking particulate organic carbon flux through the mesopelagic ocean, P. Natl. Acad. Sci. USA, 112, 1089–1094, https://doi.org/10.1073/pnas.1415311112, 2015.
Marsh, R., Müller, S. A., Yool, A., and Edwards, N. R.: Incorporation of the C-GOLDSTEIN efficient climate model into the GENIE framework: “eb_go_gs” configurations of GENIE, Geosci. Model Dev., 4, 957–992, https://doi.org/10.5194/gmd-4-957-2011, 2011.
McDonnell, A. M., Boyd, P. W., and Buesseler, K. O.: Effects of sinking velocities and microbial respiration rates on the attenuation of particulate carbon fluxes through the mesopelagic zone, Global Biogeochem. Cy., 29, 175–193, https://doi.org/10.1002/2014GB004935, 2015.
Meyer, K. M., Ridgwell, A., and Payne, J. L.: The influence of the biological pump on ocean chemistry: implications for long-term trends in marine redox chemistry, the global carbon cycle, and marine animal ecosystems, Geobiology, 14, 207–219, https://doi.org/10.1111/gbi.12176, 2016.
Maier-Reimer, E.: Geochemical cycles in an ocean general circulation model. Preindustrial tracer distributions, Global Biogeochem. Cy., 7, 645–677, https://doi.org/10.1029/93GB01355, 1993.
Monteiro, F. M., Pancost, R. D., Ridgwell, A., and Donnadieu, Y.: Nutrients as the dominant control on the spread of anoxia and euxinia across the Cenomanian-Turonian oceanic anoxic event (OAE2): Model-data comparison, Paleoceanography, 27, PA4209, https://doi.org/10.1029/2012PA002351, 2012.
Moore, J. K., Doney, S. C., Kleypas, J. A., Glover, D. M., and Fung, I. Y.: An intermediate complexity marine ecosystem model for the global domain, Deep-Sea Res. Pt. II, 49, 403–462, https://doi.org/10.1016/S0967-0645(01)00108-4, 2002.
Mouw, C. B., Barnett, A., McKinley, G. A., Gloege, L., and Pilcher, D.: Global ocean particulate organic carbon flux merged with satellite parameters, Earth Syst. Sci. Data, 8, 531–541, https://doi.org/10.5194/essd-8-531-2016, 2016a.
Mouw, C. B., Barnett, A., McKinley, G.A., Gloege, L., and Pilcher, D.: Phytoplankton size impact on export flux in the global ocean, Global Biogeochem. Cy., 30, 1542–1562, https://doi.org/10.1002/2015GB005355, 2016b.
Najjar, R. G., Jin, X., Louanchi, F., Aumont, O., Caldeira, K., Doney, S. C., Dutay, J. C., Follows, M., Gruber, N., Joos, F., and Lindsay, K.: Impact of circulation on export production, dissolved organic matter, and dissolved oxygen in the ocean: Results from Phase II of the Ocean Carbon-cycle Model Intercomparison Project (OCMIP-2), Global Biogeochem. Cy., 21, GB3007, https://doi.org/10.1029/2006GB002857, 2007.
Parekh, P., Follows, M. J., and Boyle, E. A.: Decoupling of iron and phosphate in the global ocean, Global Biogeochem. Cy., 19, GB2020, https://doi.org/10.1029/2004GB002280, 2005.
Paul, C., Matthiessen, B., and Sommer, U.: Warming, but not enhanced CO2 concentration, quantitatively and qualitatively affects phytoplankton biomass, Mar. Ecol. Prog. Ser., 528, 39–51, https://doi.org/10.3354/meps11264, 2015.
Pörtner, H. O., Karl, D. M., Boyd, P. W., Cheung, W., Lluch-Cota, S. E., Nojiri, Y., Schmidt, D. N., Zavialov, P. O., Alheit, J., Aristegui, J., and Armstrong, C.: Ocean systems. In Climate change 2014: impacts, adaptation, and vulnerability. Part A: global and sectoral aspects. contribution of working group II to the fifth assessment report of the intergovernmental panel on climate change, Cambridge University Press, Cambridge, UK, 411–484, 2014.
Rau, G. H., Riebesell, U., and Wolf-Gladrow, D.: A model of photosynthetic 13C fractionation by marine phytoplankton based on diffusive molecular CO2 uptake, Mar. Ecol. Prog. Ser., 133, 275–285, https://doi.org/10.3354/meps133275, 1996.
Redfield, A. C., Ketchum, B. H., and Richards, F. A.: The influence of organisms on the composition of sea-water, in: The composition of seawater: Comparative and descriptive oceanography, edited by: Hill, M. N., The sea: ideas and observations on progress in the study of the seas, 2, 26–77, 1963.
Reusch, T. B. and Boyd, P. W.: Experimental evolution meets marine phytoplankton, Evolution, 67, 1849–1859, https://doi.org/10.1111/evo.12035, 2013.
Ridgwell, A. J.: Glacial-interglacial perturbations in the global carbon cycle, PhD thesis, University of East Anglia, Norwich, 2001.
Ridgwell, A. and Schmidt, D. N.: Past constraints on the vulnerability of marine calcifiers to massive carbon dioxide release, Nat. Geosci., 3, 196–200, https://doi.org/10.1038/ngeo755, 2010.
Ridgwell, A., Hargreaves, J. C., Edwards, N. R., Annan, J. D., Lenton, T. M., Marsh, R., Yool, A., and Watson, A.: Marine geochemical data assimilation in an efficient Earth System Model of global biogeochemical cycling, Biogeosciences, 4, 87–104, https://doi.org/10.5194/bg-4-87-2007, 2007.
Ridgwell, A., Reinhard, C., van de Velde, S., Adloff, M., DomHu, Wilson, J., Ward, B., Monteiro, F., and Vervoort, P.: derpycode/cgenie.muffin: Crichton et al. [revised for GMD], Zenodo, https://doi.org/10.5281/zenodo.3999080, 2020a.
Ridgwell, A., DomHu, Peterson, C., Ward, B., sjszas, evansmn, and Jones, R.: derpycode/muffindoc: Crichton et al. [2020] (GMD) (version v0.9.13), Zenodo, https://doi.org/10.5281/zenodo.4305997, 2020b.
Rosengard, S. Z., Lam, P. J., Balch, W. M., Auro, M. E., Pike, S., Drapeau, D., and Bowler, B.: Carbon export and transfer to depth across the Southern Ocean Great Calcite Belt, Biogeosciences, 12, 3953–3971, https://doi.org/10.5194/bg-12-3953-2015, 2015.
Rubino, M., Etheridge, D. M., Trudinger, C. M., Allison, C. E., Battle, M. O., Langenfelds, R. L., Steele, L. P., Curran, M., Bender, M., White, J. W. C., and Jenk, T. M.: A revised 1000 year atmospheric δ13C−CO2 record from Law Dome and South Pole, Antarctica, J. Geophys. Res.-Atmos., 118, 8482–8499, https://doi.org/10.1002/jgrd.50668, 2013.
Sarmiento, J. L. and Gruber, N. N.: Ocean Biogeochemical Dynamics, Princeton University Press Princeton, US, ISBN: 9780691017075, 2006.
Schmittner, A., Gruber, N., Mix, A. C., Key, R. M., Tagliabue, A., and Westberry, T. K.: Biology and air–sea gas exchange controls on the distribution of carbon isotope ratios (δ13C) in the ocean, Biogeosciences, 10, 5793–5816, https://doi.org/10.5194/bg-10-5793-2013, 2013.
Segschneider, J. and Bendtsen, J.: Temperature-dependent remineralization in a warming ocean increases surface pCO2 through changes in marine ecosystem composition, Global Biogeochem. Cy., 27, 1214–1225, https://doi.org/10.1002/2013GB004684, 2013.
Steinberg, D. K. and Landry, M. R.: Zooplankton and the ocean carbon cycle, Annu. Rev. Mar. Sci., 9, 413–444, https://doi.org/10.1146/annurev-marine-010814-015924, 2017.
Taucher, J. and Oschlies, A.: Can we predict the direction of marine primary production change under global warming?, Geophys. Res. Lett., 38, L02603, https://doi.org/10.1029/2010GL045934, 2011.
Turner, J. T.: Zooplankton fecal pellets, marine snow, phytodetritus and the ocean's biological pump, Prog. Oceanogr., 130, 205–248, https://doi.org/10.1016/j.pocean.2014.08.005, 2015.
U.S. DOE.: Carbon Cycling and Biosequestration: Report from the March 2008 Workshop, DOE/SC-108, U.S. Department of Energy Office of Science, p. 81, 2008.
Ward, B. A., Wilson, J. D., Death, R. M., Monteiro, F. M., Yool, A., and Ridgwell, A.: EcoGEnIE 1.0: plankton ecology in the cGEnIE Earth system model, Geosci. Model Dev., 11, 4241–4267, https://doi.org/10.5194/gmd-11-4241-2018, 2018.
Weber, T., Cram, J. A., Leung, S. W., DeVries, T., and Deutsch, C.: Deep ocean nutrients imply large latitudinal variation in particle transfer efficiency, P. Natl. Acad. Sci USA, 113, 8606–9611, https://doi.org/10.1073/pnas.1604414113, 2016.
Wilson, J. D., Barker, S., and Ridgwell, A.: Assessment of the spatial variability in particulate organic matter and mineral sinking fluxes in the ocean interior: Implications for the ballast hypothesis, Global Biogeochem. Cy., 26, GB4011, https://doi.org/10.1029/2012GB004398, 2012.
Yamamoto, A., Abe-Ouchi, A., and Yamanaka, Y.: Long-term response of oceanic carbon uptake to global warming via physical and biological pumps, Biogeosciences, 15, 4163–4180, https://doi.org/10.5194/bg-15-4163-2018, 2018.
- Abstract
- Introduction
- The cGENIE.muffin Earth system model framework
- Model tuning methodology
- Model–data and model–model comparison
- Implications of including temperature-dependent microbial processes
- Summary
- Appendix A: Further information on the temperature-dependent DOM
- Code availability
- Author contributions
- Competing interests
- Acknowledgements
- Financial support
- Review statement
- References