the Creative Commons Attribution 4.0 License.
the Creative Commons Attribution 4.0 License.
 | 14 Dec 2020
Incoming data quality control in high-resolution urban climate simulations: a Hong Kong–Shenzhen area urban climate simulation as a case study using the WRF/Noah LSM/SLUCM model (Version 3.7.1)
Bingcheng Wan
Yulun Zhou
Hokit Wong
The growth of computational power unleashed the potential of high-resolution urban climate simulations using limited-area models in recent years. This trend empowered us to deepen our understanding of urban-scale climatology with much finer spatial–temporal details. However, these high-resolution models would also be particularly sensitive to model uncertainties, especially in urbanizing cities where natural surface texture is changed artificially into impervious surfaces with extreme rapidity. These artificial changes always lead to dramatic changes in the land surface process. While models capturing detailed meteorological processes are being refined continuously, the input data quality has been the primary source of biases in modeling results but has received inadequate attention. To address this issue, we first examine the quality of the incoming static data in two cities in China, i.e., Shenzhen and Hong Kong SAR, provided by the WRF ARW model, a widely applied state-of-the-art mesoscale numerical weather simulation model. Shenzhen has gone through an unprecedented urbanization process in the past 30 years, and Hong Kong SAR is another well-urbanized city. A significant proportion of the incoming data is outdated, highlighting the necessity of conducting incoming data quality control in the region of Shenzhen and Hong Kong SAR. Therefore, we proposed a sophisticated methodology to develop a high-resolution land surface dataset in this region. We conducted urban climate simulations in this region using both the developed land surface dataset and the original dataset utilizing the WRF ARW model coupled with Noah LSM/SLUCM and evaluated the performance of modeling results. The performance of modeling results using the developed high-resolution urban land surface datasets is significantly improved compared to modeling results using the original land surface dataset in this region. This result demonstrates the necessity and effectiveness of the proposed methodology. Our results provide evidence of the effects of incoming land surface data quality on the accuracy of high-resolution urban climate simulations and emphasize the importance of the incoming data quality control.
- Article
(10986 KB) - Full-text XML
- Companion paper
-
Supplement
(5566 KB) - BibTeX
- EndNote


With numerical weather prediction models increasingly applied in climate studies in past decades (Warner, 2011), many scientists (such as Anthes, 1983; Keyser and Uccellini, 1987; Oreskes et al., 1994; Kain et al., 2008; Warner, 2011; Teutschbein and Seibert, 2012; Hong and Kanamitsu, 2014) have argued about the best modeling practices or provided suggestions related to modeling. Warner introduced the concept of quality assurance for improving modeling practices based on the summarization of wisdom in the previous studies (Warner, 2011). In recent years, with rapidly developing computational capabilities, researchers become capable of applying high-resolution limited-area models to produce detailed meteorological scenarios. This capability empowers the studies of urban-scale climatology that require finer grid spacing. At the same time, this kind of high-resolution urban modeling also poses a significant challenge to the assurance of modeling quality. High-resolution urban climate simulation is sensitive to the quality of input of urban land surface data (Bruyère et al., 2014). An essential process that many pieces of research have overlooked is the incoming quality control, which guarantees the quality of input data for climate modeling. The incoming data quality control (IDQC), the procedure that ensures the accuracy of input data, is often ignored in modeling practices. In the manufacturing process, incoming quality control (IQC) is one of the quality assurance activities because it is “a proactive upstream approach that controls and manages the upstream activities to prevent problems from arising” (World Meteorological Organization, 2014). By analogy with the manufacturing process, IDQC of climate modeling resembles the incoming material quality control. It is also a proactive activity of controlling and managing the quality of the input data before the model run rather than a “correction after problems occur” (World Meteorological Organization, 2014). Modeling practices using inaccurate input usually lead to significant modeling bias. However, sometimes, such modeling practices may still lead to seemingly correct but scientifically misleading modeling. Therefore, a more sophisticated IDQC procedure is needed, which is a critical action of quality assurance.
Urban climate modeling is notoriously sensitive to land surface characters (Chen et al., 2004; Sertel et al., 2010). The fallacious spatial distribution of the land surface data causes inaccurate values to be assigned to boundary layer variables. So the fallaciousness would be finally propagated to the modeling results, including temperature, wind fields, precipitation, and humidity (Chen et al., 2004). High-resolution models are more sensitive to incoming data quality for producing more refined details in finer spatial grids (Chen et al., 2004; Sertel et al., 2010).
Despite the close association between the quality of land surface dataset and the quality of modeling results, IDQC has received inadequate attention in many existing modeling practices. Many urban climate systems provide a default and elemental input land surface dataset, the quality of which varies dramatically over space and time. For example, the WRF ARW model only provides detailed urban information for some large US cities. In most areas except these big cities, not only the recording date of the default input land surface dataset for the WRF ARW model is long before 2010, but also the grid sizes of these areas are far larger than 1 km. First, respective land surface datasets need to be developed if the study period is out of the default dataset's temporal coverage. Second, while the quality of the default dataset in these large US cities is found to be acceptable, the quality of the same dataset in many other parts of the world can be quite problematic, especially in the rapidly urbanizing China. In the developing world, dramatic artificial interferences change natural surface texture into impervious surfaces with extreme rapidity. A compelling example would be Shenzhen, China, a city that went through dramatic urbanization in the past 30 years.
In this study, a sensitivity test was conducted to examine the influence of urban land surface data accuracy on the urban climate modeling quality. Moreover, the article also proposed an explanation of why urban land surface data accuracy affected urban climate modeling accuracy and stated the importance of the incoming data quality control in urban climate modeling.
The remainder of the paper is organized as follows. Section 2 introduces the methodologies used in this paper. Section 3 presents the comparison results between the default land surface dataset and the developed high-resolution dataset and compares the corresponding modeling results. Section 4 sums up the discussions and concludes the paper.
2.1 Experimental design
In this study, we took the Hong Kong–Shenzhen area in the Pearl River Delta (PRD) as the study area and delineated it in the modeling as the innermost domain (domain 4, Fig. 1). We conduct two modeling experiments using the default land surface dataset and the developed high-resolution urban land surface dataset, respectively, to examine if the IDQC improves urban climate modeling results. We compared the quality of the incoming data in the two urban climate simulation cases and the quality of the modeling results to demonstrate the effects of the incoming data quality on high-resolution urban climate modeling. In this study, two comparative urban climate simulation cases were designed for evaluating the impacts of the refinement using the urban land surface dataset on the quality of the modeled results. So, the modeled results from simulations using the WRF ARW/Noah LSM/SLUCM model with and without a refinement by the urban land surface dataset on the primary data would be compared. Case-NCAR is a 1-year climate simulation using the default land surface dataset provided by NCAR. Case-ULSD is a comparative experimental case using the developed high-resolution urban land surface dataset. Both cases are utilizing the same lateral boundary conditions from 2010 and the same model settings.
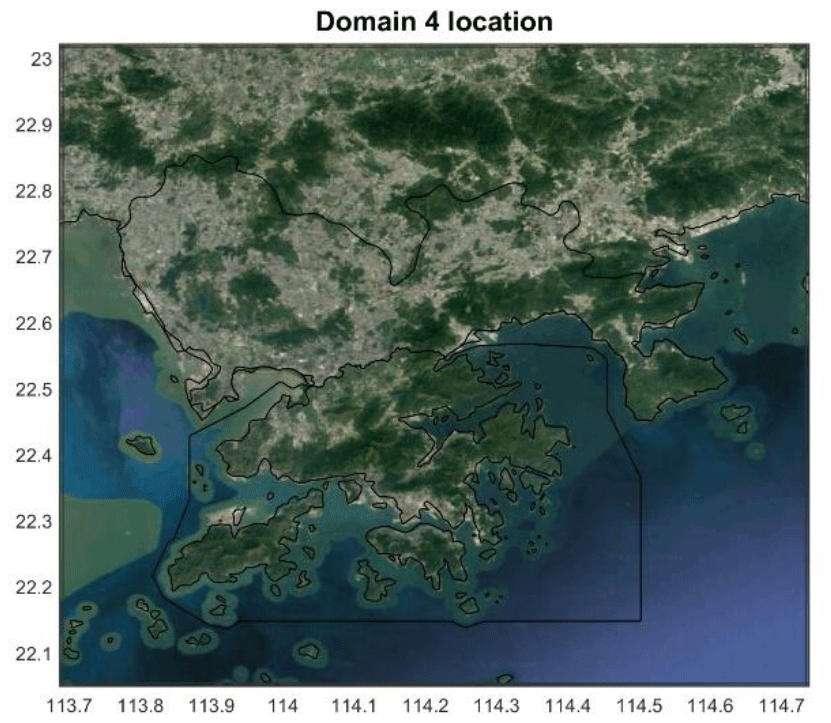
Figure 1The study area was delineated in the modeling as the innermost domain (domain 4). Base map source: © Google Maps.
2.2 Evaluation methods for incoming data quality
We compared the original and refined land surface dataset by analyzing its four major components – land cover, vegetation coverage, urban morphology, and anthropogenic heat fluxes. These components are meteorological variables that are involved in most of the urban climate processes at the intra-urban scale.
We also compared the simulation results using land surface data before and after the refinement to investigate the impact of incoming data quality on the accuracy and granularity of simulation results. Typically, the quality of urban climate modeled results should be evaluated by comparing the modeled near-surface variables with their corresponding observed ones (Li et al., 2019a). We extracted and compared five near-surface meteorological variables – surface temperature and near-surface air temperature, wind speed, precipitation, and relative humidity – along the spatial and temporal dimension. Moreover, these critical modeled near-surface variables are also compared with their corresponding observed ones using the statistic tools suggested by Li et al. (2019a), which include a temporal comparison of spatial variation (TCSV), Perkins skill score (PSS), and probability density function of difference (PDFD). For more details on the TCSV, PSS, and PDFD, please refer to the companion paper – “Model evaluation of high-resolution urban climate simulations: using the WRF/Noah LSM/SLUCM model (Version 3.7.1) as a case study” (Li et al., 2019b). Furthermore, the near-surface variables of two experimental cases are compared spatially to analyze the difference between the two cases in the spatial dimension.
2.3 Data
The primary data include the “Completed Dataset and the New Static Data Released With v3.7 of WRF Preprocessing System (WPS) Geographical Input Data” and the “2010 NCEP FNL (Final) Operational Global Analysis Dataset with 1-degree grid spatial resolution and the 6-hour temporal resolution” (National Center for Atmospheric Research, 2016). Moreover, to demonstrate the effectiveness of the proposed methodology, we developed a high-resolution urban land surface dataset for the Hong Kong–Shenzhen area in 2010. This dataset includes six kinds of data, including land cover data, vegetation coverage data, urban morphology data, artificial impervious area data, and anthropogenic heat data, describing different urban land surface characters. Furthermore, the “2010 MODIS/Aqua Land Surface Temperature and Emissivity (LST/E) product” (MODIS, 2012) and the “2010 near-surface meteorological observation data in PRD” (Li, 2020b) were used for modeled results' quality evaluation. In a physical meaning, the land surface temperature in the MODIS/Aqua product and the surface skin temperature in the WRF simulation are two different concepts. The land surface temperature is the grid-mean brightness temperature of the Earth, which is calculated based on the black-body radiation theory. The surface skin temperature is a land's state variable in WRF, which is adjusted iteratively in each calculation based on the balance of the radiation, the sensible heat flux, the latent heat flux, and the soil heat conduction flux. The value of the surface skin temperature may deviate a bit from one of the land surface temperatures in the same grid. However, these two variables are highly correlated. Therefore, we use the land surface temperature to evaluate the quality of the surface skin temperature in the WRF simulation. Finally, the comparative meteorological variables are listed in Table 1.
Table 1Comparative meteorological variables.
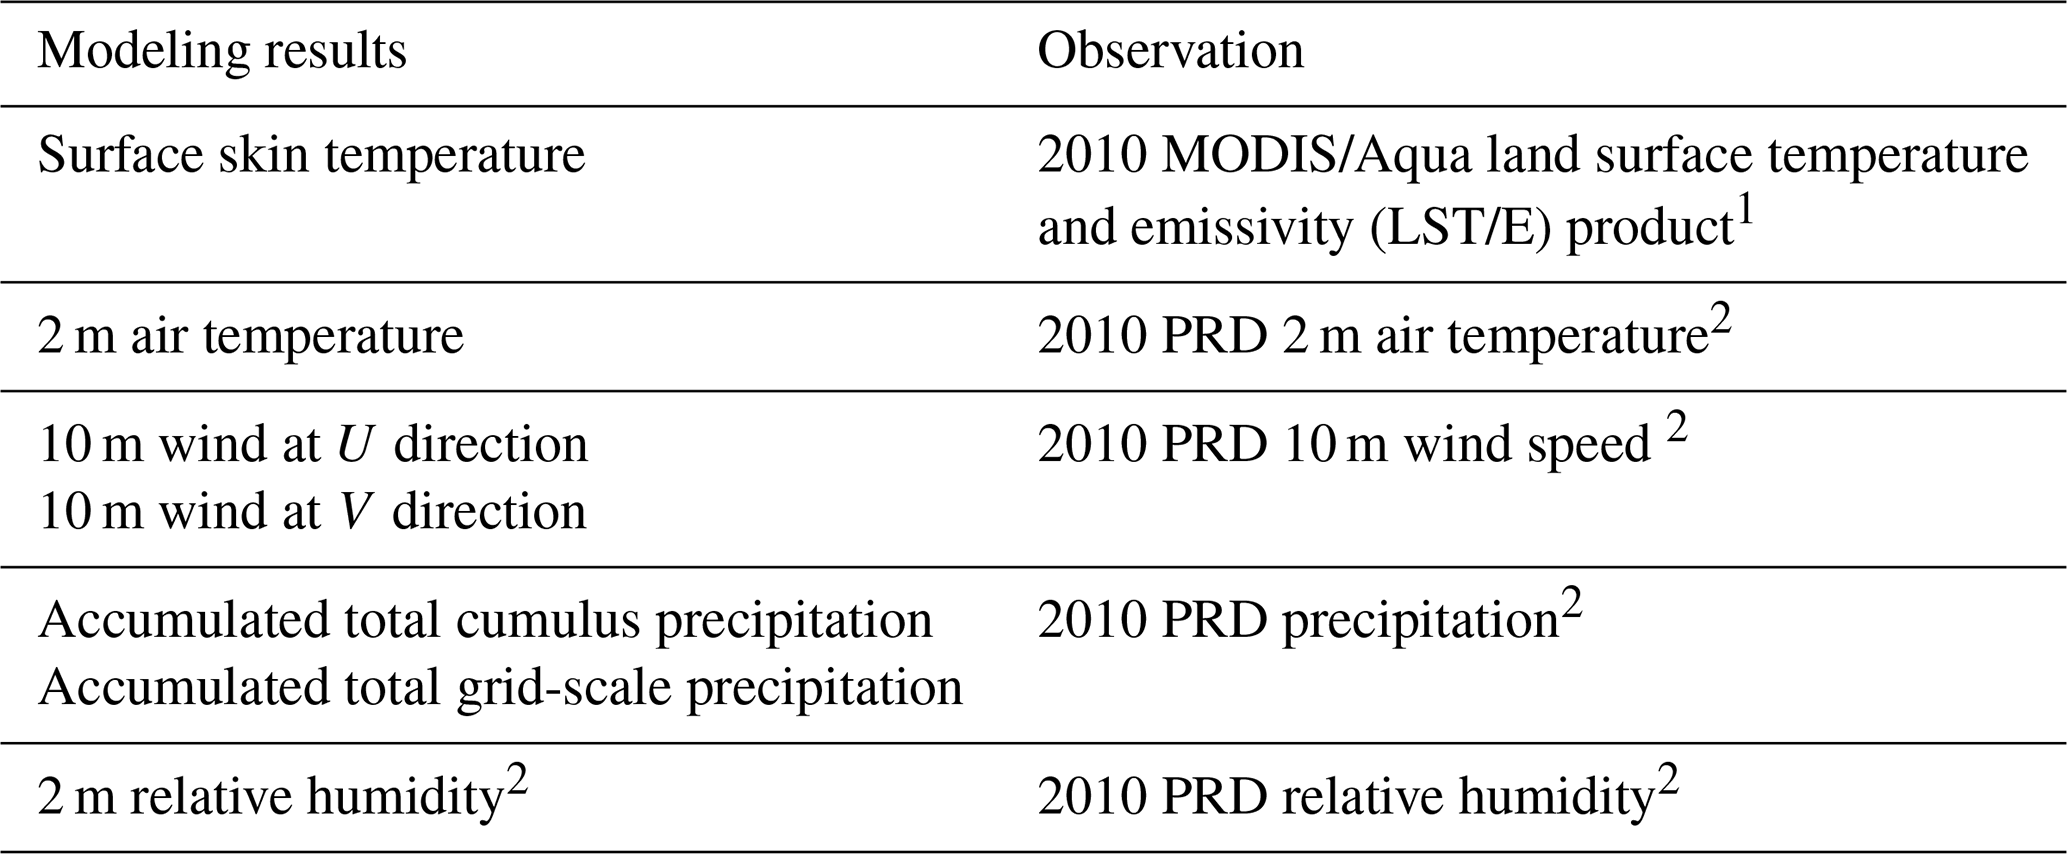
1 The data were provided by the MODIS (2012). 2 The data were provided by the Meteorological Bureau of Shenzhen Municipality.
3.1 Refinements in urban land surface data
Through the comparison between two cases, we found the default terrestrial input data missed many details in land cover (Fig. 2), the vegetation coverage (Fig. 3), urban morphology (Fig. 4), and anthropogenic heat (Fig. 5).
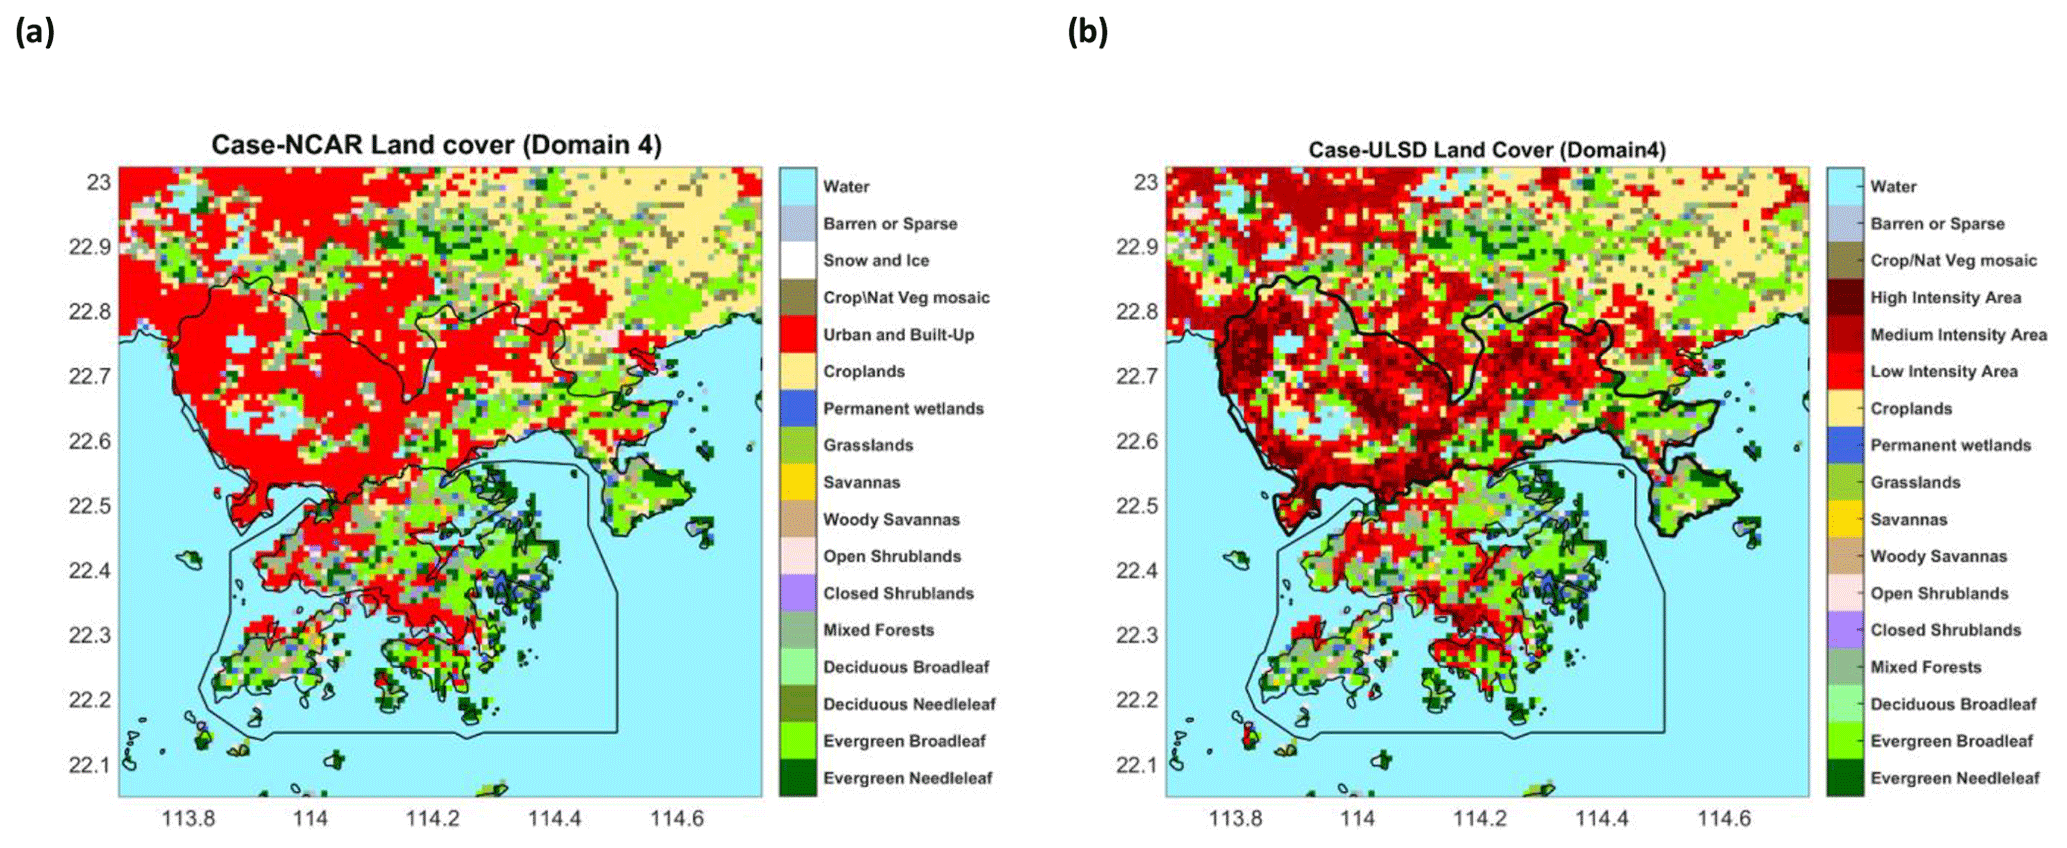
Figure 2The land covers provided by NCAR originally (a), and the adjusted land covers based on the urban land surface dataset (b). Data source: Li et al. (2019a, b).
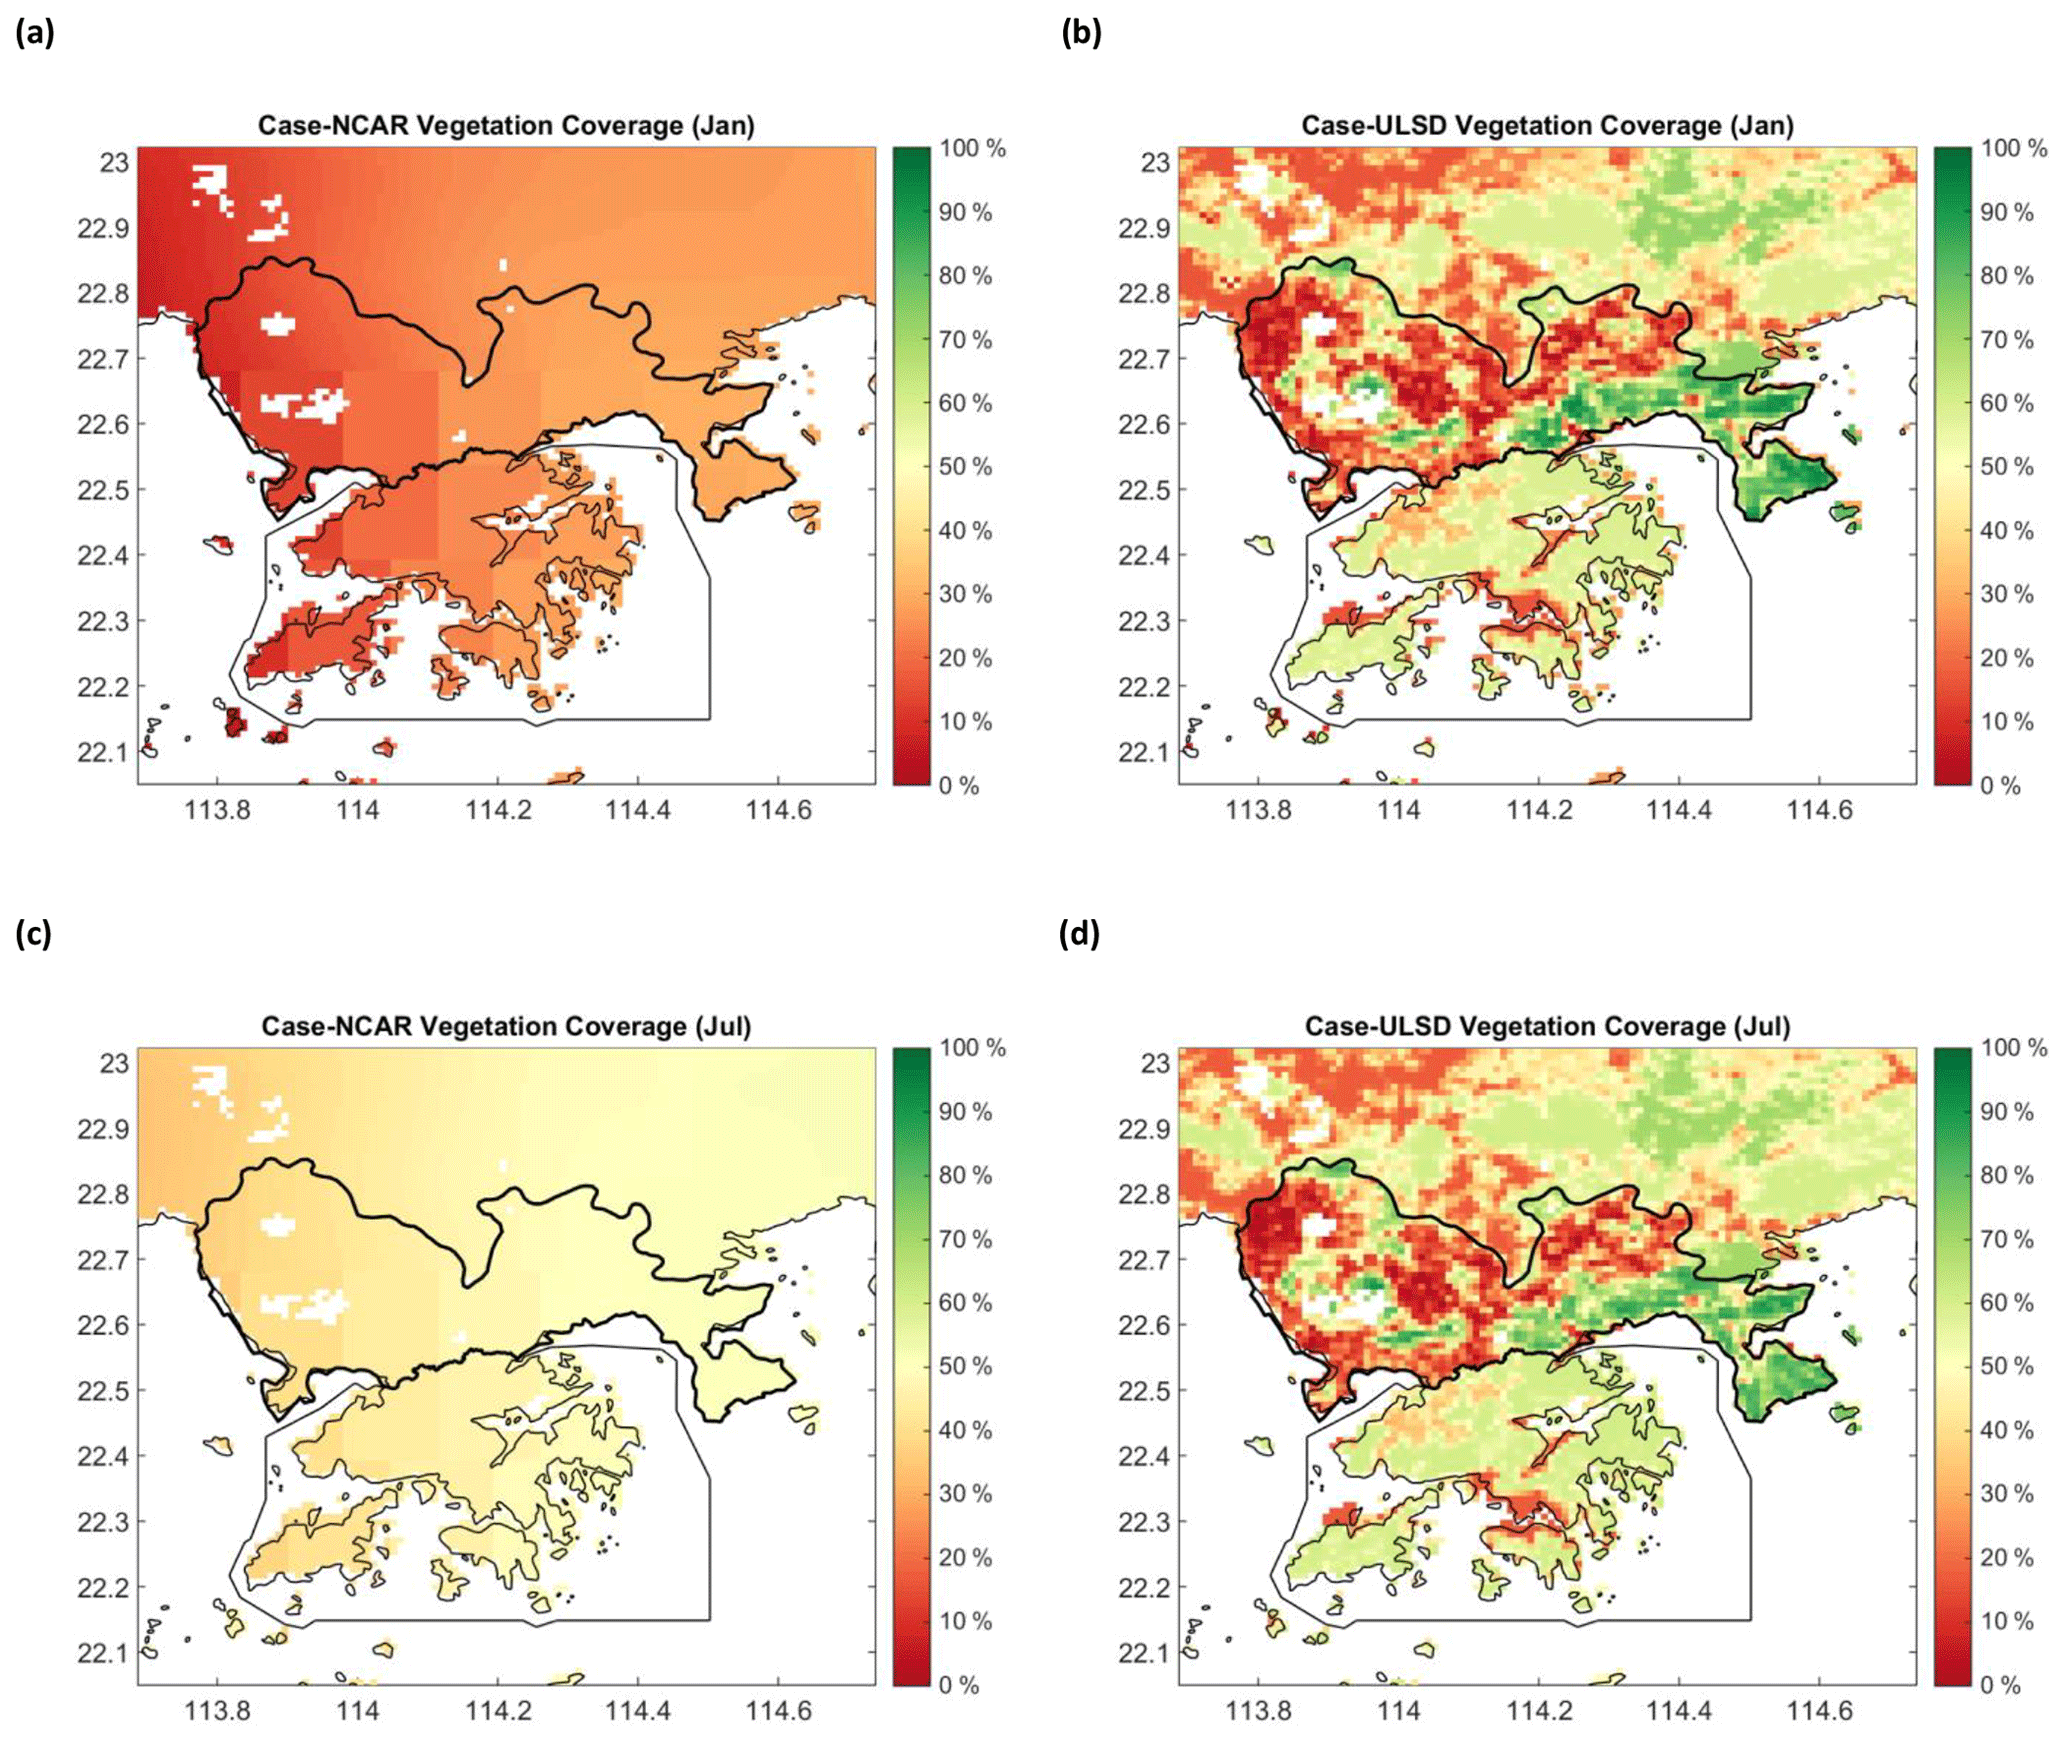
Figure 3The original (a, c) and refined (b, d) vegetation coverage data product in January (a, b, local winter) and July (c, d, local summer). Data source: Li et al. (2019a, b).
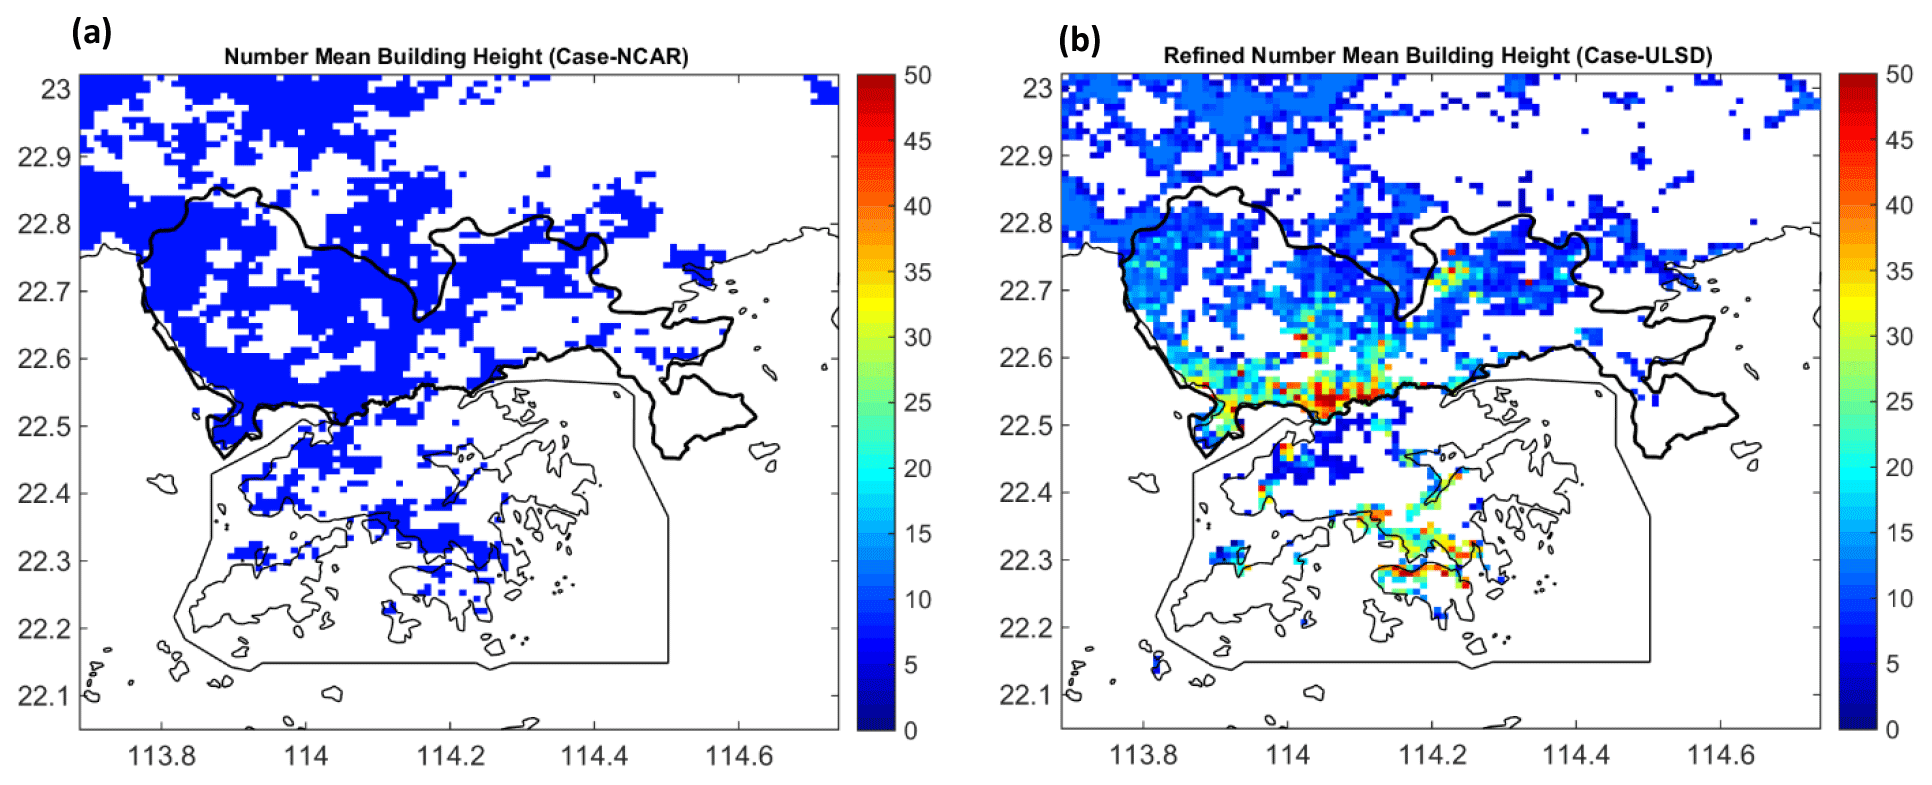
Figure 4The number mean building height before (a) and after refinement (b). Data source: Li et al. (2019a, b). For other urban morphology indicators, please refer to Sect. S1 of the Supplement.
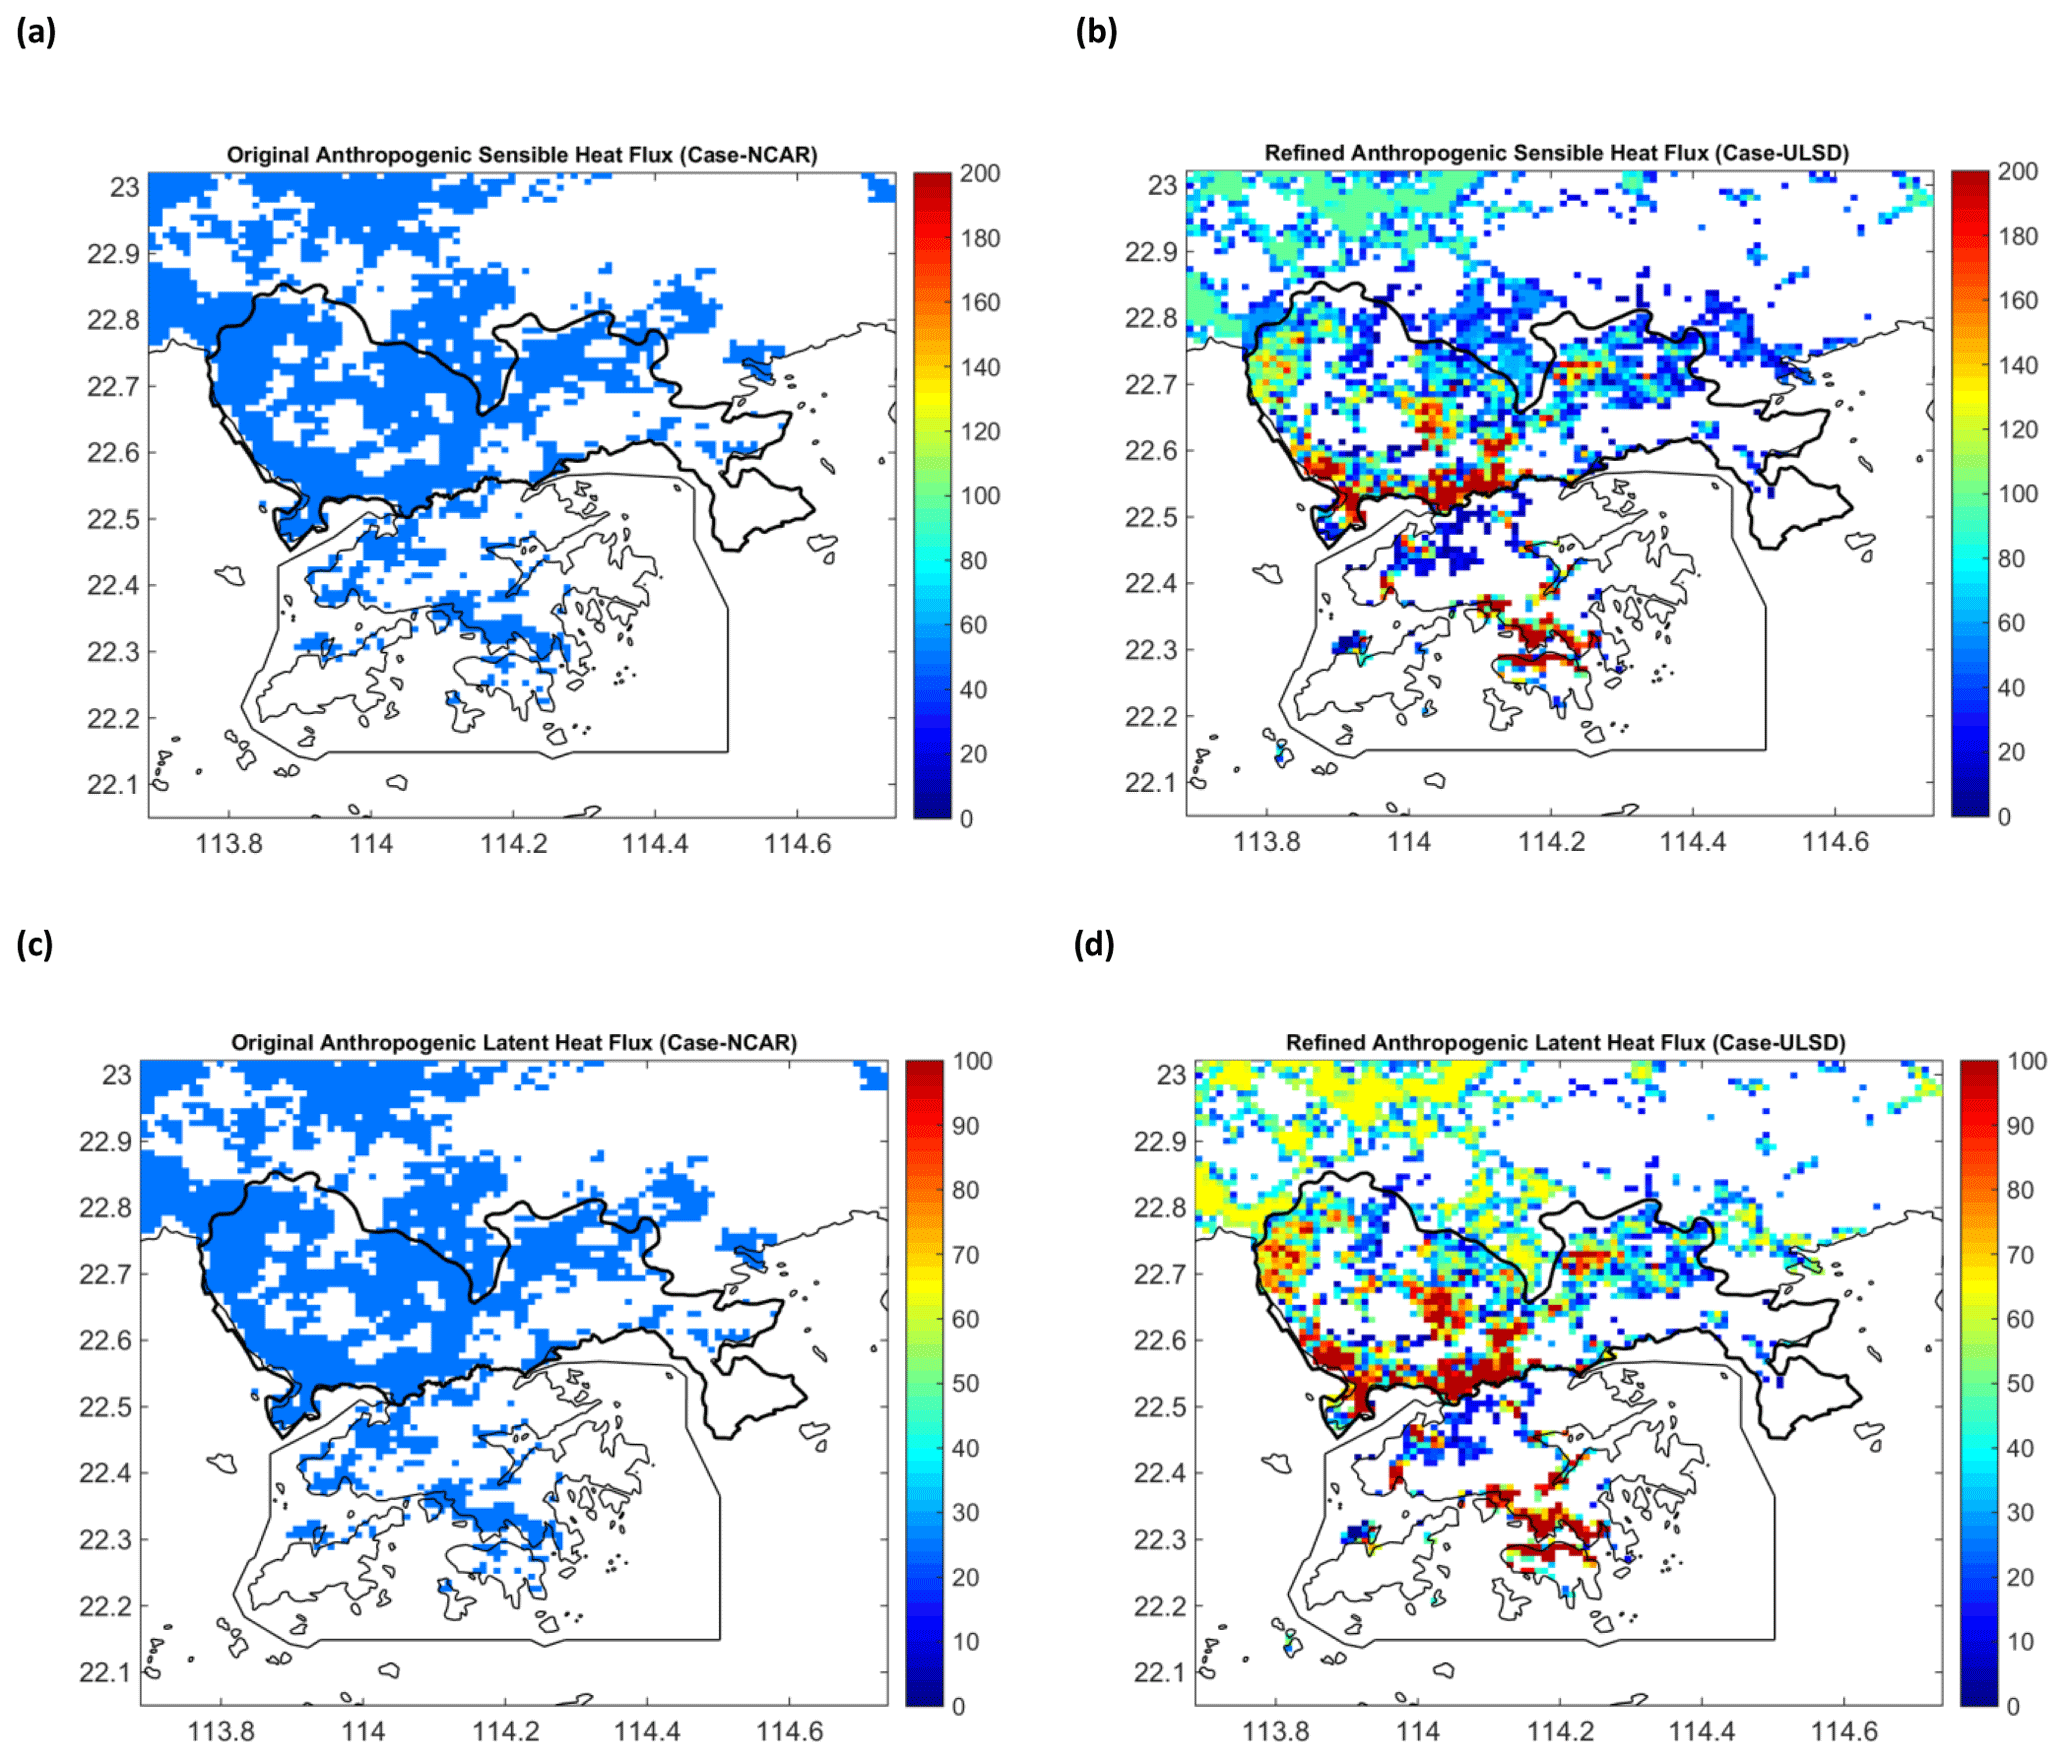
Figure 5Maps of the anthropogenic sensible (a, b) and latent (c, d) heat fluxes before (a, c) and after (b, d) refinement. Data source: Li et al. (2019a, b).
3.2 Quality of simulation results
With the TCSV figure, the temporal patterns of the simulation results using the land surface data before and after the refinement were examined against the temporal patterns in observations. By temporal patterns, we refer to both the diurnal and monthly variations of the selected meteorological variables. As evidenced by Fig. 6, both simulation results, using the original and refined land surface data respectively, reproduced the diurnal and monthly patterns that agreed with the observed data. Other meteorological variables of both cases, such as land surface temperature and relative humidity, precipitation, and wind speed, also have similar temporal variation patterns to the corresponding observed ones.
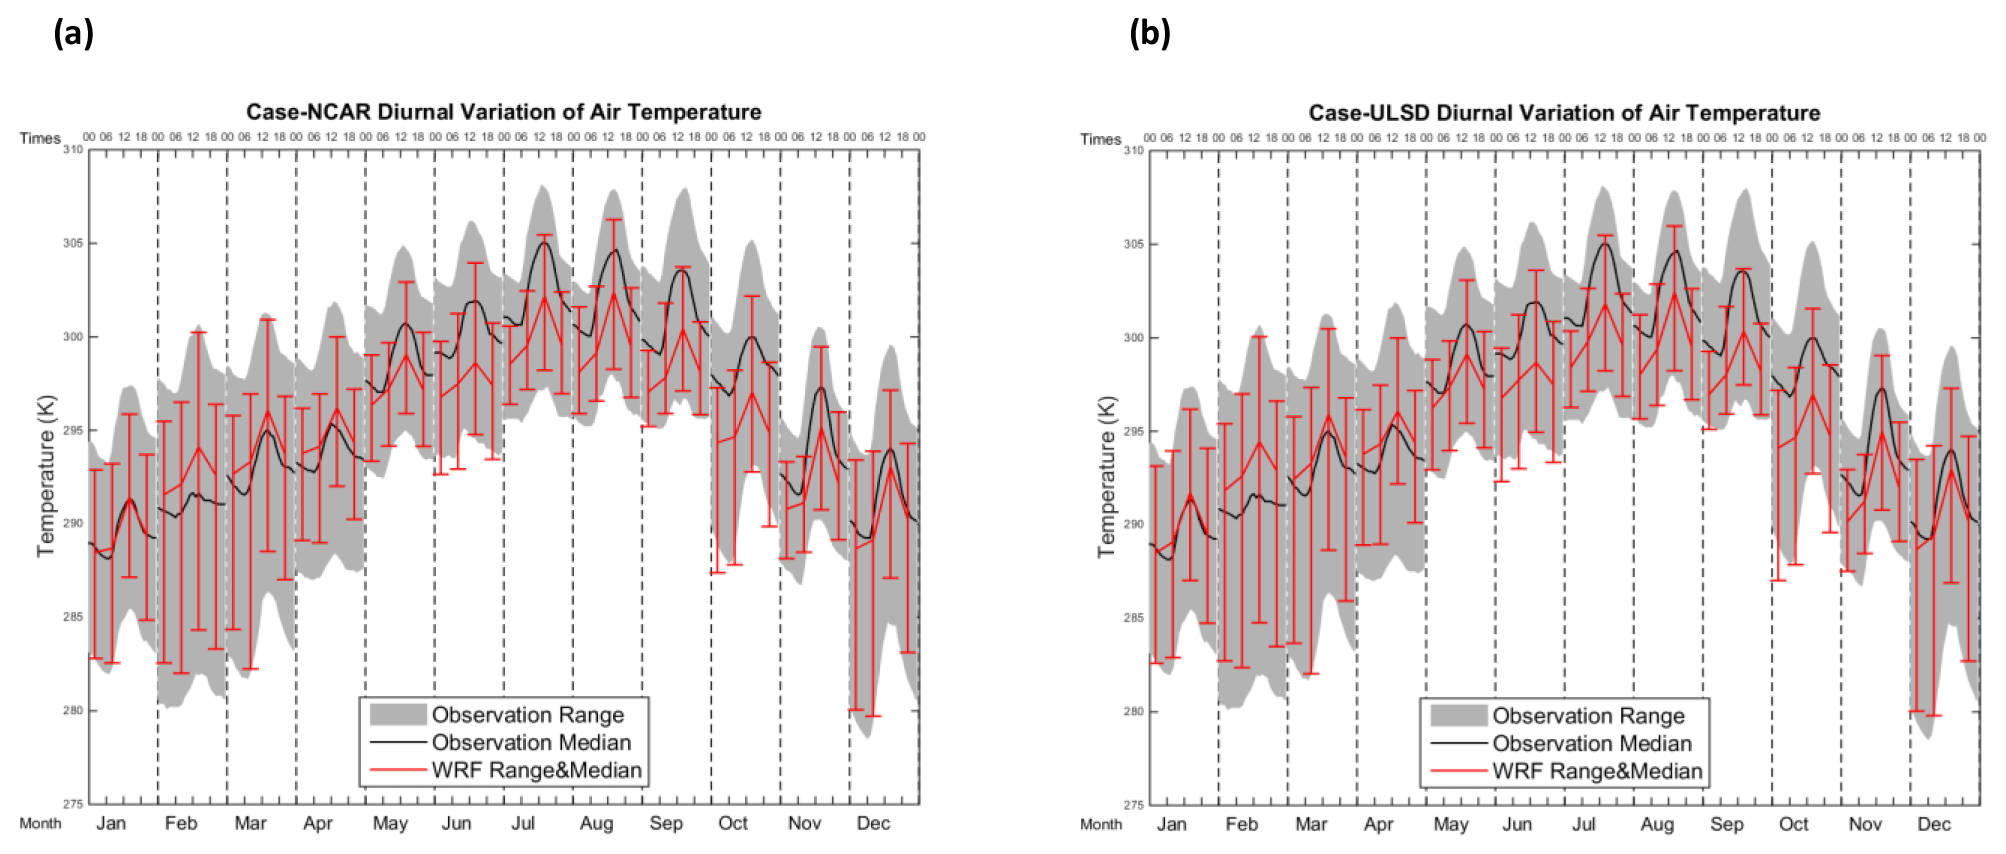
Figure 6The annual and diurnal variation of 2 m air temperature of Case-NCAR (a) and Case-ULSD (b). Data source: Li et al. (2019a, b).
Compared to Case-NCAR, the PSS annual mean values of Case-ULSD improved by 1.0 %, 3.2 %, and 5.5 % in the 2 m air temperature, surface temperature, and 10 m wind speed, respectively. On the contrary, the PSS annual mean values of Case-ULSD deteriorated by 5.6 % and 2.7 % in relative humidity and precipitation, respectively, compared to those of Case-NCAR. Figure 7 shows the PSS monthly variation of the 2 m air temperature. Meanwhile, the PSS monthly variations of other meteorological variables (surface temperature, relative humidity, precipitation, and wind speed) are shown in Sect. S2 of the Supplement.
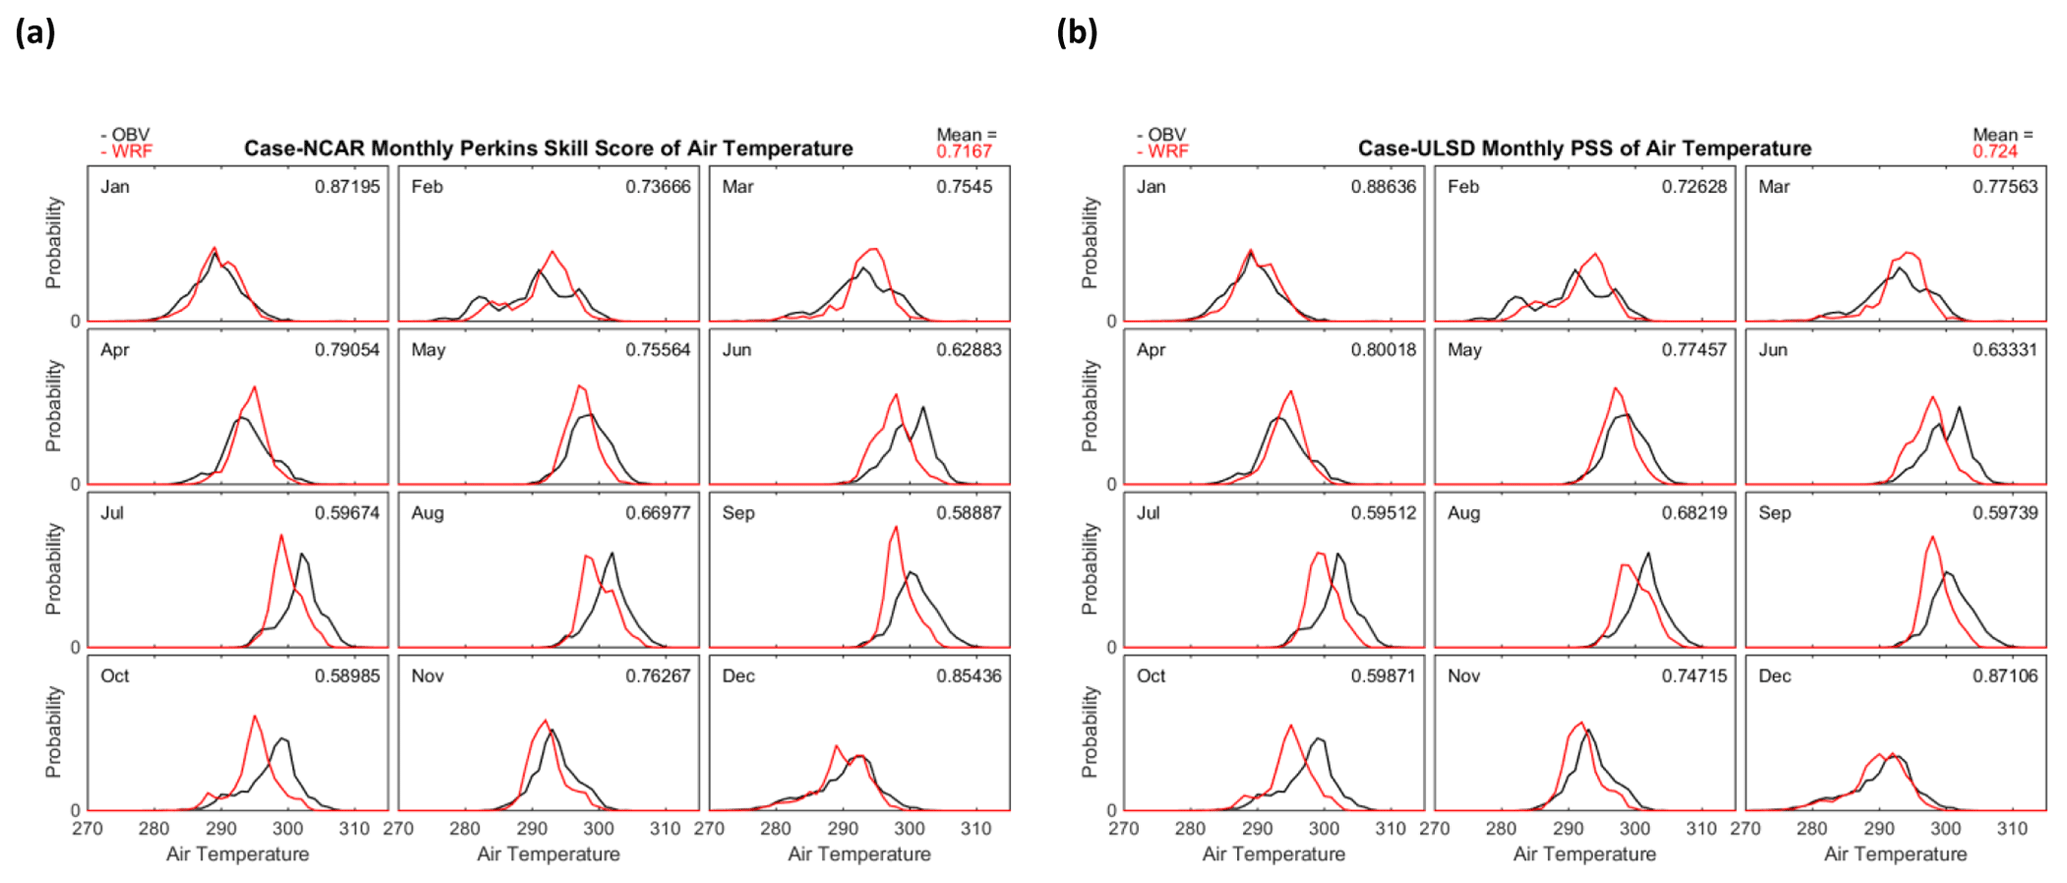
Figure 7PSS monthly variation of 2 m air temperature of Case-NCAR (a) and Case-ULSD (b). Data source: Li et al. (2019a, b).
Figure 8 shows the PDFD of 2 m air temperature of two experimental cases. For the PDFD of surface temperature, relative humidity, precipitation, and 10 m wind of two cases, please refer to Sect. S3 of the Supplement. Compared to Case-NCAR, the annual mean values of the specified interval of the PDFD of Case-ULSD improved 2 % in surface temperature and precipitation. However, the annual mean values of the specified interval of the PDFD of Case-ULSD are the same as their corresponding ones of Case-NCAR in 2 m air temperature and 10 m wind speed. Worse still, the annual mean values of the specified interval of the PDFD of Case-ULSD deceased 1 % in relative humidity than those of Case-NCAR.

Figure 8PDFD of 2 m air temperature of Case-NCAR (a) and Case-ULSD (b). Data source: Li et al. (2019a, b).
To demonstrate the advantage of using the refined high-resolution land surface data, Fig. 9 illustrates the spatial distributions of the annual mean values of the simulated 2 m air temperature and surface temperature using the original and refined land surface data. For other meteorological variables (relative humidity, precipitation, and 10 m wind) of two cases, please refer to Sect. S4 of the Supplement. For all meteorological variables, the data refinement enabled more spatial details in the simulation results, which could be increased or decreased in value. Such differences were especially significant for urban centers where massive and rapid urbanization has taken place. The urban–rural differences were strengthened, especially for temperatures and the wind speed. The air temperature and surface temperature in urban areas mostly increased with the refined datasets due to the increased urban area and newly included effects of urban morphology. On the contrary, wind speed and humidity mostly decreased in urban areas.

Figure 9Spatial distribution of 2 m air temperature and surface temperature of Case-NCAR (a, c) and Case-ULSD (b, d). Data source: Li et al. (2019a, b).
Undoubtedly, the high-quality land surface input data influence the modeling results by providing more distinct spatial details. Taking a further step, we conducted a cause analysis of the physical mechanism of how the detailed spatial features were transferred from urban land surface to urban atmosphere. The inhomogeneity of the urban land surface affects energy and mass redistribution in the atmosphere. Atmospheric models are composed of interacting components (Fig. 10), representing certain atmospheric physics principles (Dudhia, 2014). The WRF ARW model can be applied as a regional climate model, even though it was originally a numerical weather prediction (NWP) model (Dudhia, 2014). By coupling it with the Noah LSM/UCM model, the near-surface atmospheric physical processes of momentum, water vapor, and the heat exchange in an urban environment are represented in the WRF ARW model, thus enabling an improvement in the results of urban climate simulation (Tewari et al., 2007). The Noah LSM Model provides the different quantities to the WRF ARW model, such as the surface sensible heat flux, surface latent heat flux, upward longwave radiation, and upward shortwave radiation, based on the different textures of the surface. In an urban area, the anthropogenic heat release caused by human activities increases the surface sensible heat flux. The urban morphology also has an impact on the radiation exchange and the roughness. The UCM model captures the improvement in quality of these urban land surface characteristics to improve the accuracy of the near-surface atmospheric physical processes.
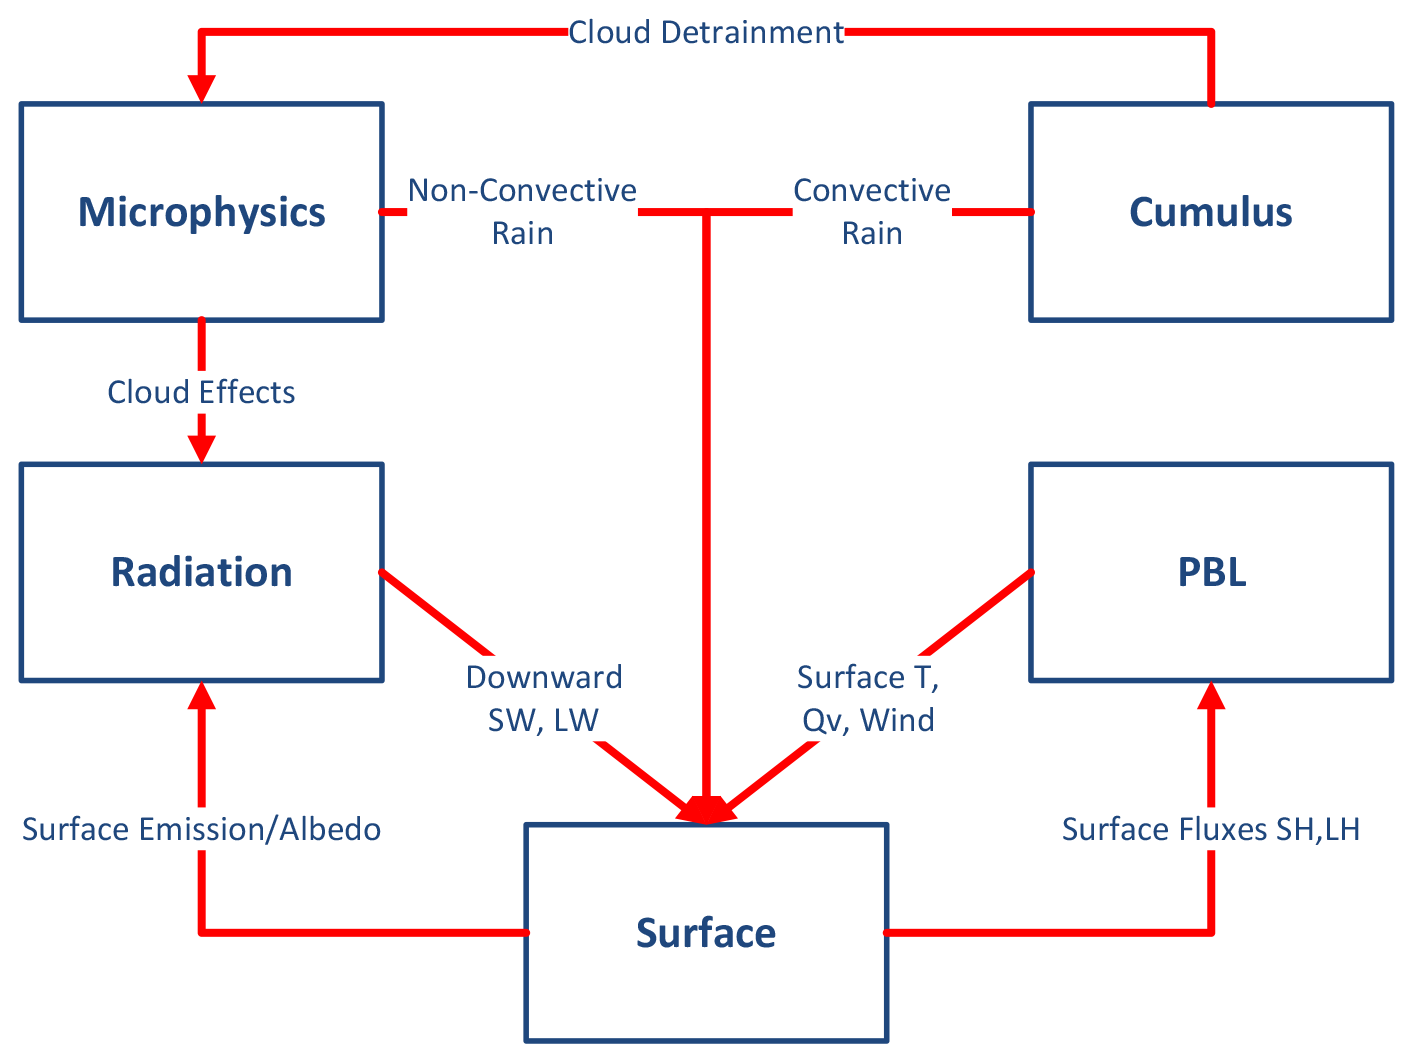
Figure 10Schematic of physics and their interactions within a typical NWP model (Dudhia, 2014).
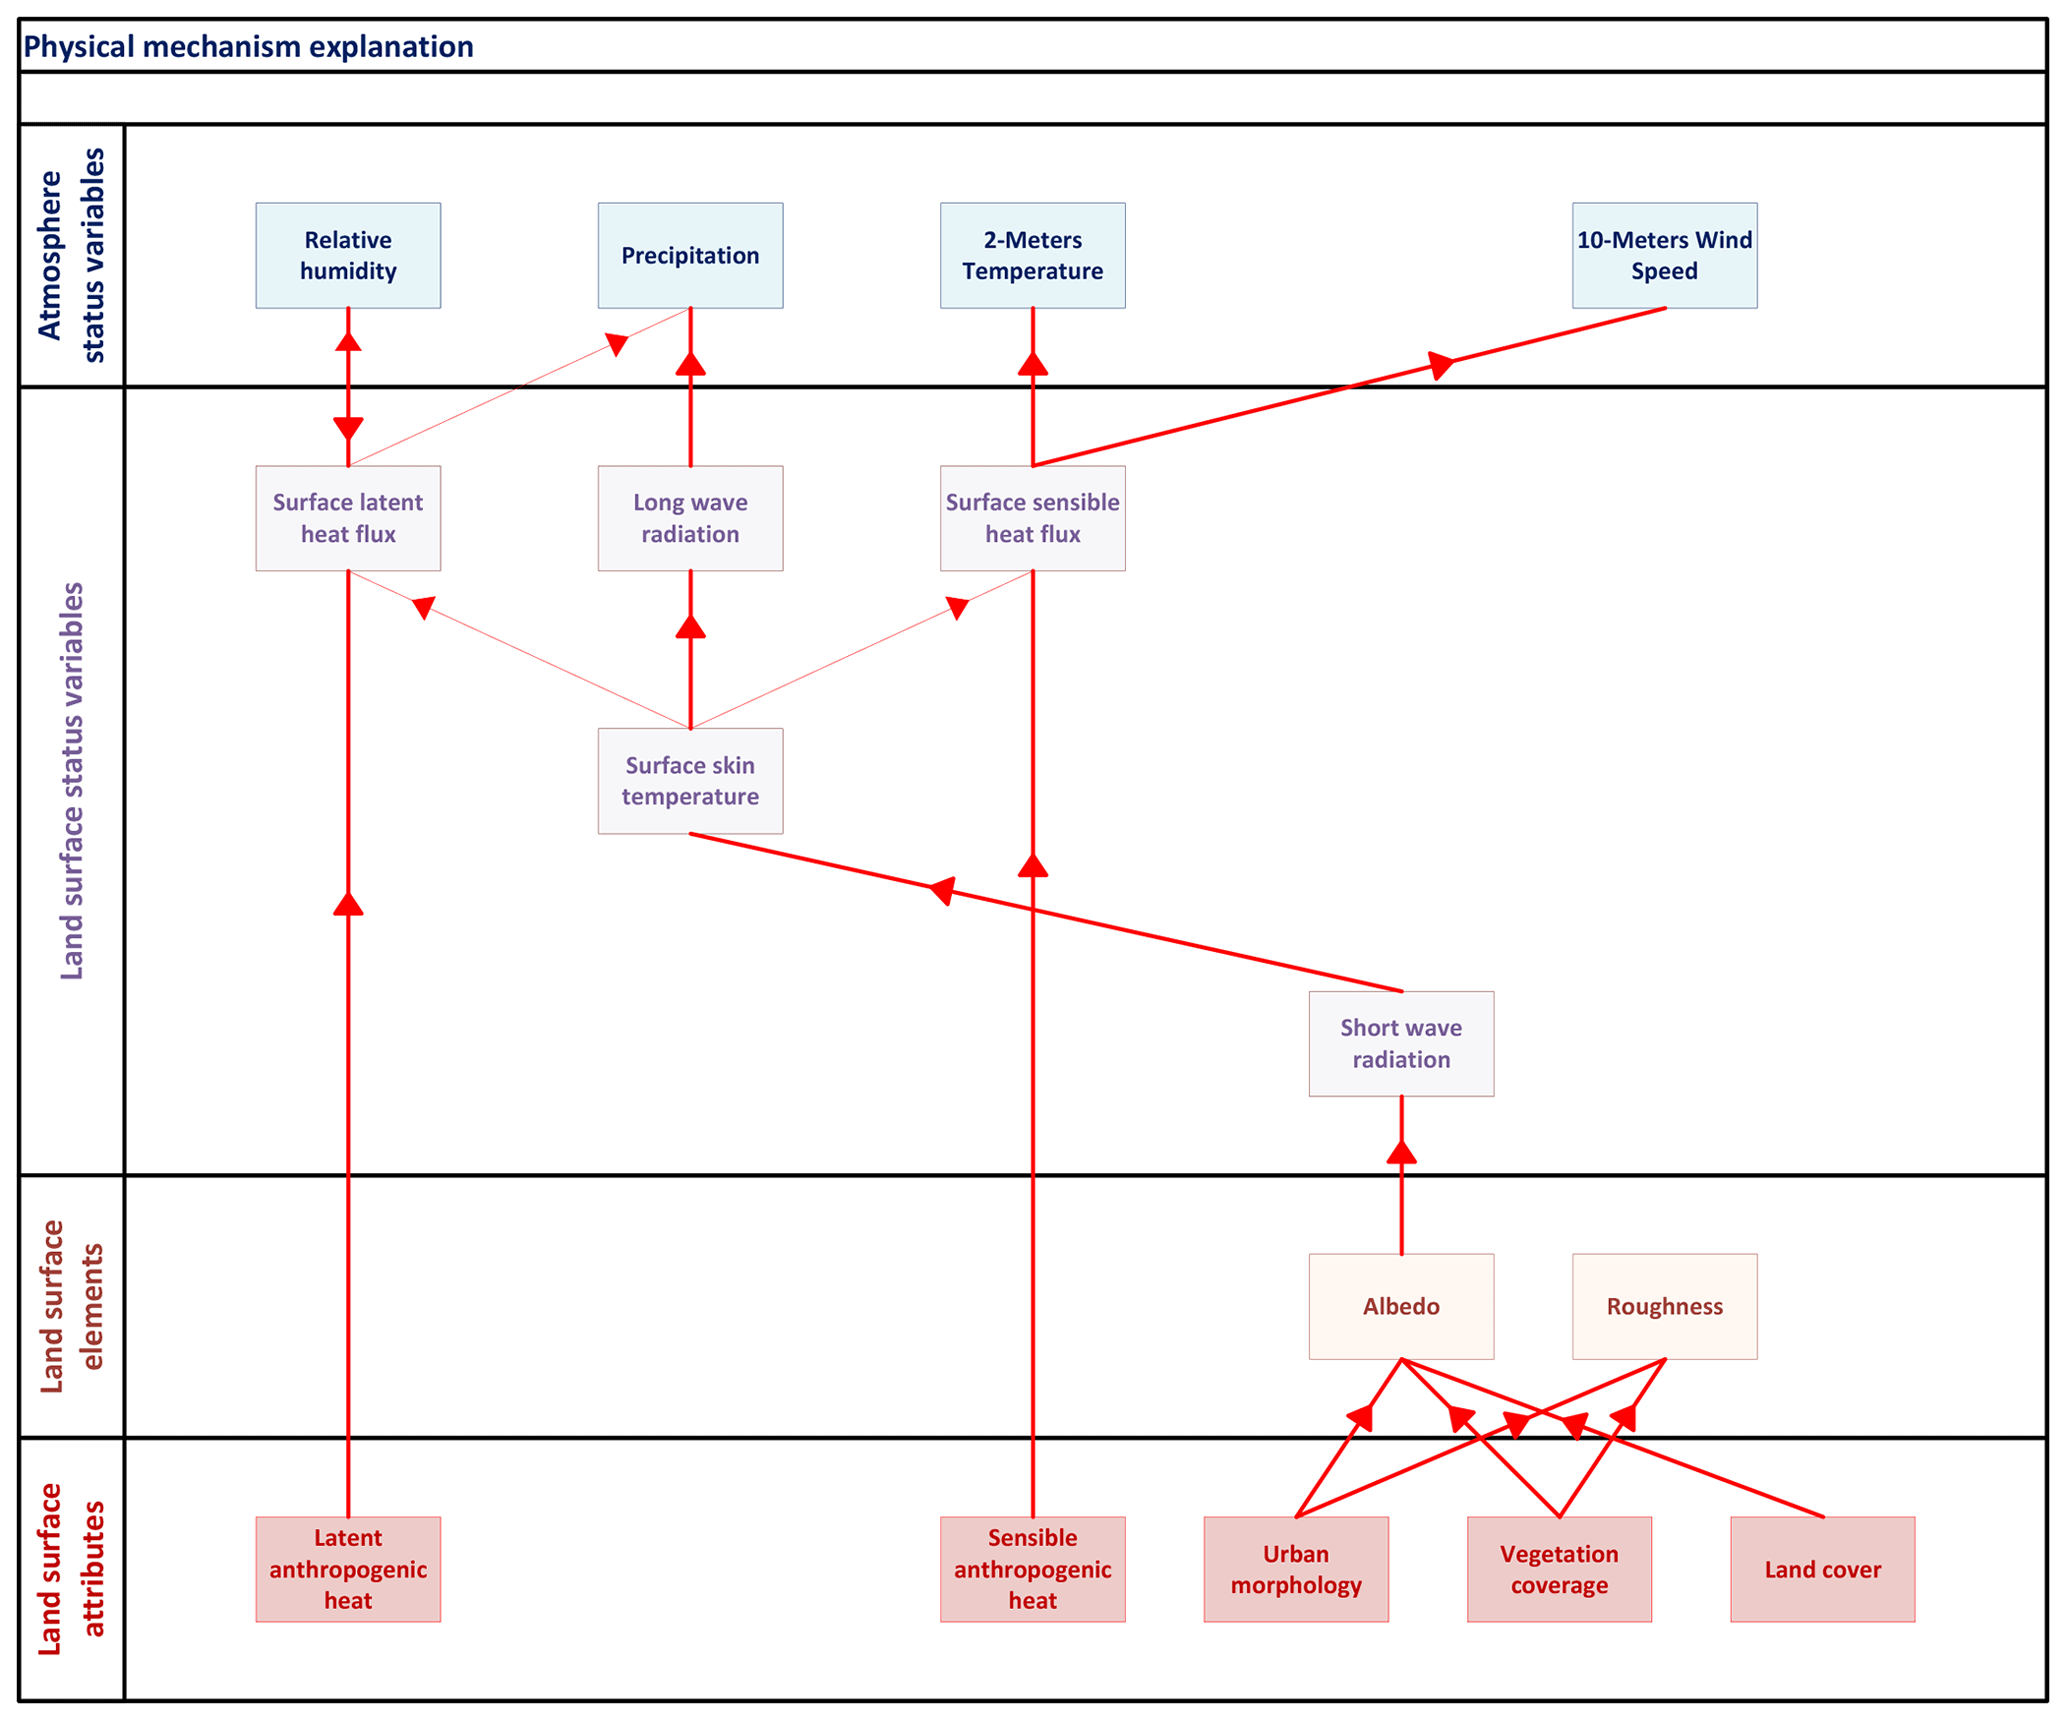
Figure 11The mechanism in propagating the detailed spatial features from the land surface attributes to the atmospheric variables.
Moreover, when we looked inside the WRF ARW/Noah LSM/SLUCM model, there are several physical modules. These modules interact with each other to update the state variables iteratively to propagate the land surface attributes' detailed spatial features to the atmospheric variables (Fig. 11). The detail spatial features in the land cover, vegetation coverage, urban morphology, and anthropogenic sensible and latent heat had effects on the 2 m air temperature, relative humidity, precipitation and 10 m wind speed through the intermediate variables (long- and shortwave radiations, surface temperature, surface sensible and latent heat).
For example, the 2 m air temperature has a similar spatial pattern to those of the albedo and sensible anthropogenic heat in Case-NCAR and Case-ULSD. Moreover, this propagating mechanism can be seen from the transmission of the difference between the two cases in the aforementioned intermediate variables. The spatial differences in the land cover and vegetation coverage between Case-NCAR and Case-ULSD caused the spatial difference in albedo (Fig. 12a). The differences in albedo and sensible anthropogenic heat (Fig. 11b) led to the spatial differences in the sensible heat flux (Fig. 12c). In turn, these spatial differences led to the spatial difference in 2 m temperature (Fig. 12d).
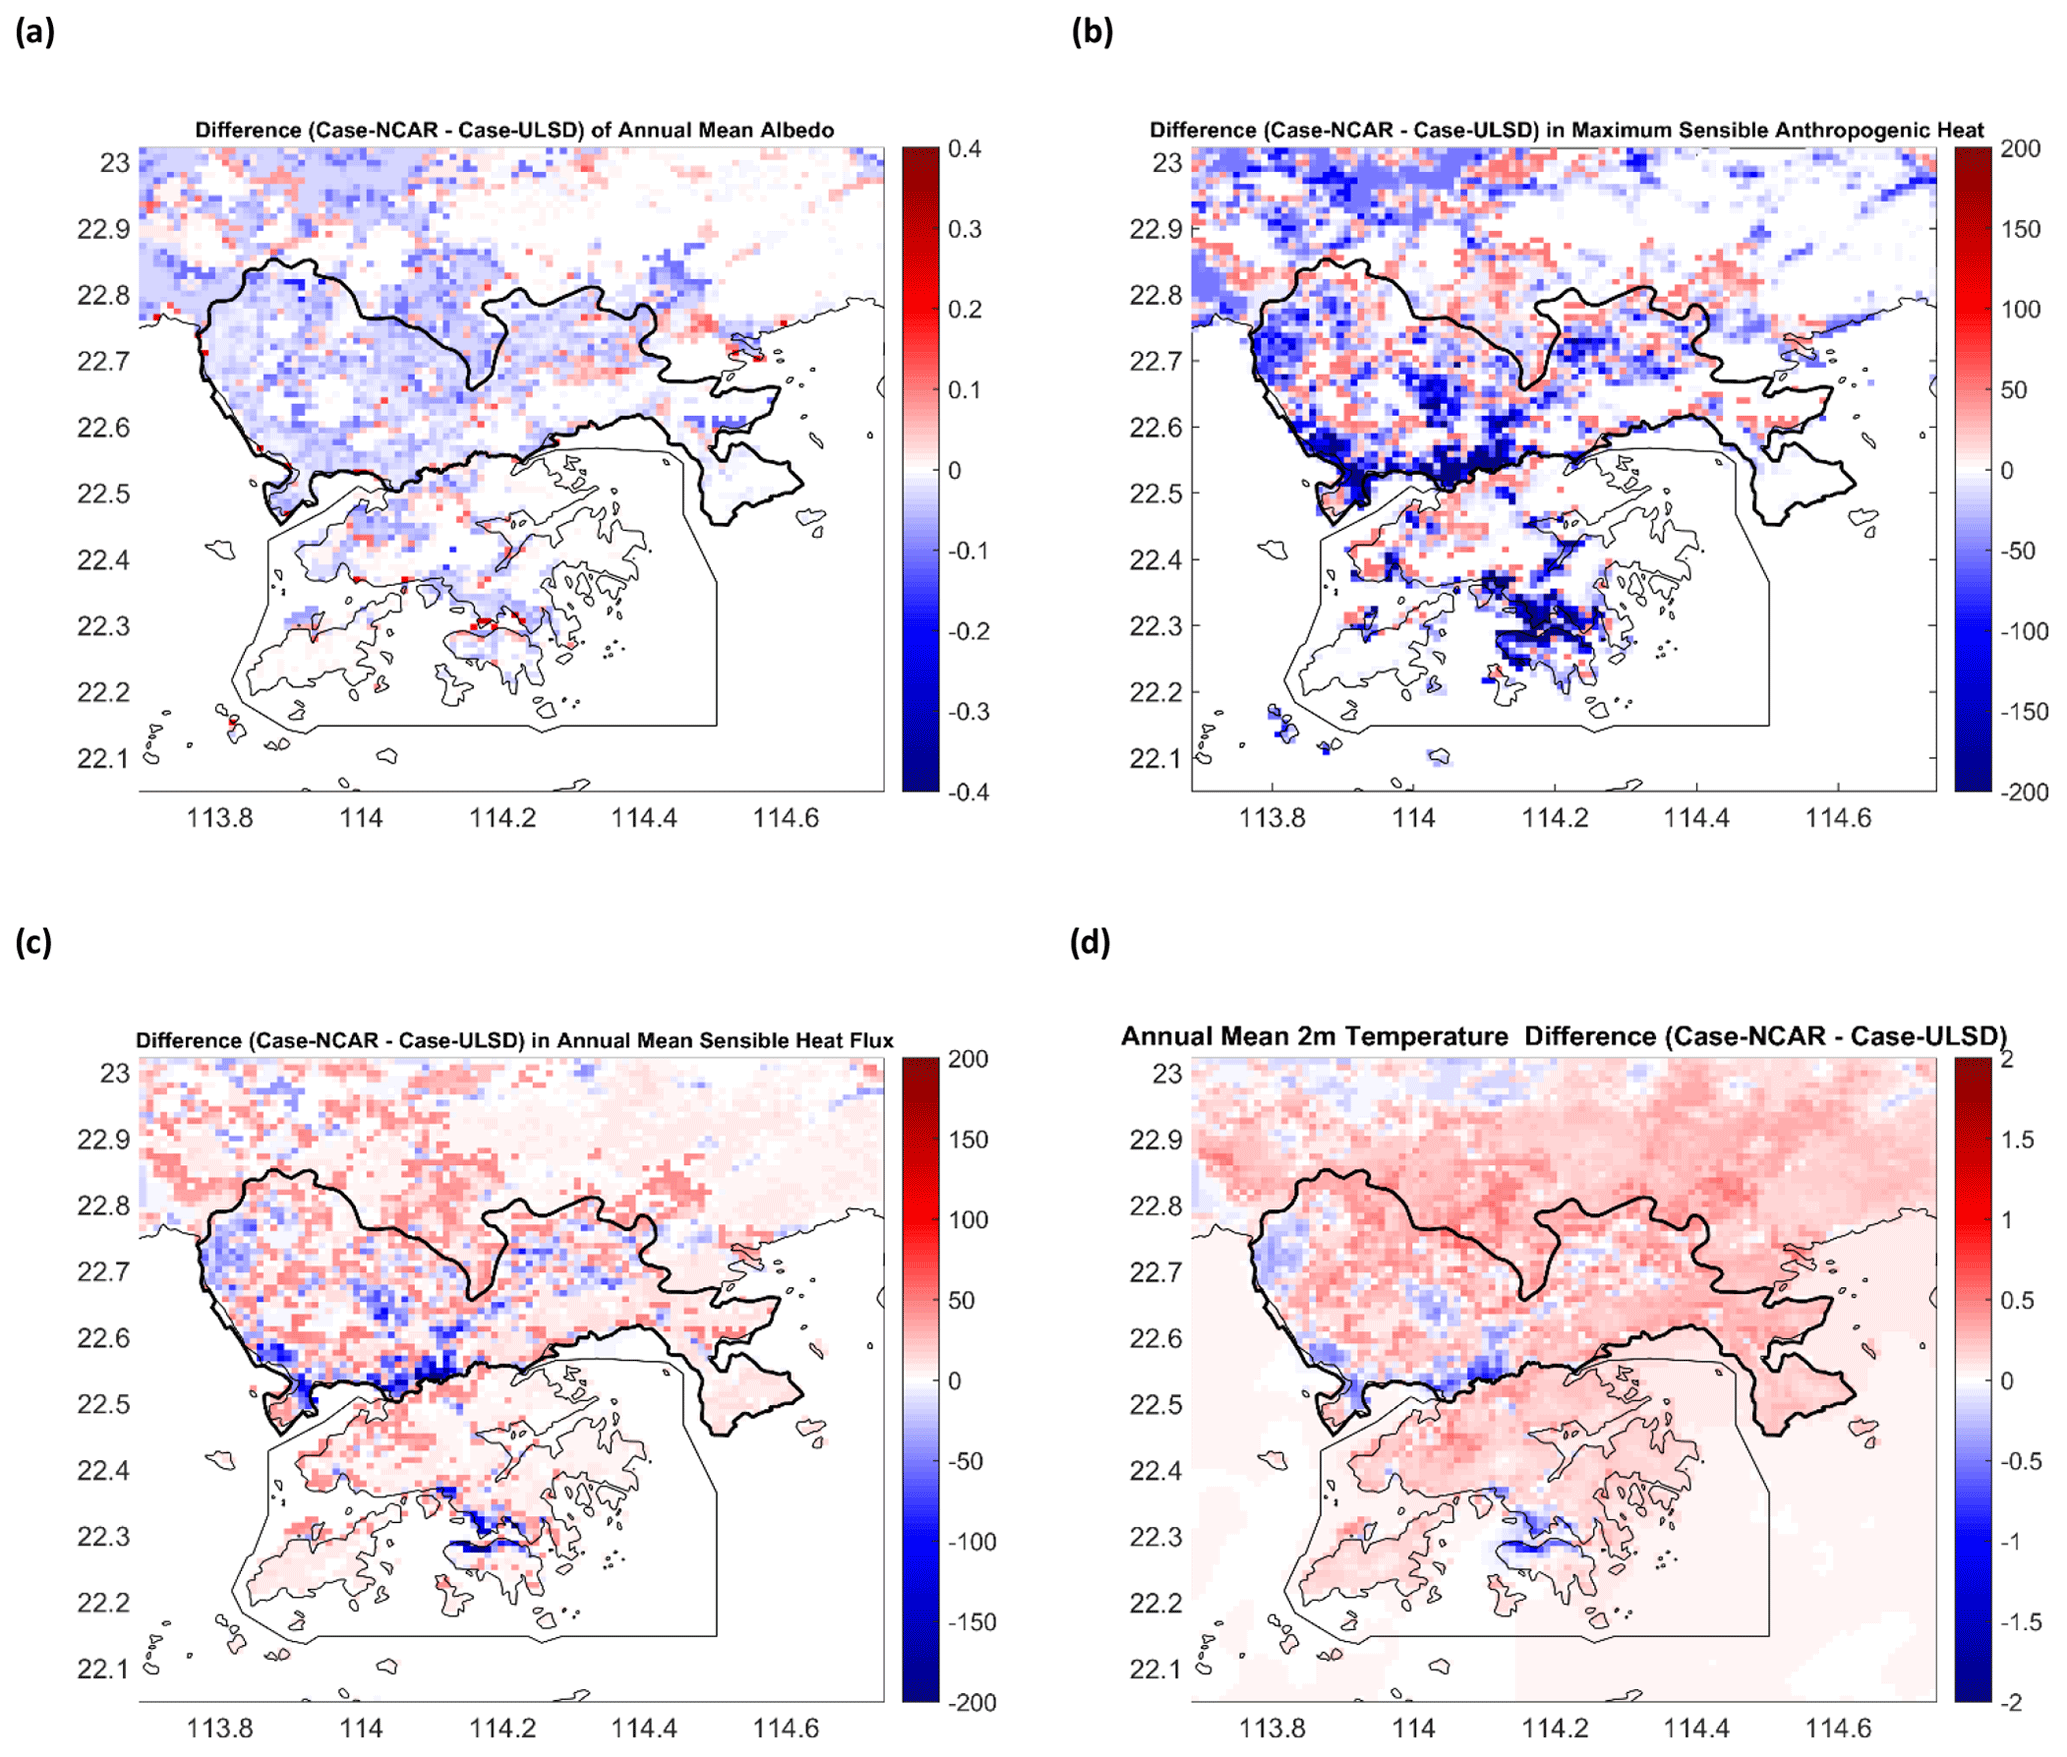
Figure 12Differences (Case-NCAR − Case-ULSD) in the albedo (a), the sensible anthropogenic heat (b), the annual mean sensible heat (c), and the annual mean 2 m air temperature (d).
Distortion of modeling is nothing short of the problem in the climate modeler community. The spatial or temporal distortion in climate modeling means that the simulation result is divergent with the observation data spatially or temporally. Many scientists have addressed the problem since the 1980s and gone on improving modeling practice in response to it (Warner, 2011). While improving the modeling practice, quality assurance should not be neglected in the climate modeling project (Warner, 2011), from an engineering project point of view. Quality assurance is “a part of quality management, but it is focused on providing confidence that quality requirements will be fulfilled” (ISO, 2015). However, quality assurance is overlooked because the modeler has less awareness of the sensitivity of the model (Warner, 2011). As a typical case of being careless, the IDQC, which makes sure the input data are accurate, is often ignored. Incoming quality control (IQC) is a familiar concept in production, which refers to the quality checking and evaluating incoming material. In the scenario of climate modeling, IQC is the quality control in the very first stage, which refers to the quality checking and evaluating incoming data before they will be delivered to the modeling system. From our findings, the IDQC indeed improved the modeling results at the spatial dimension, creating substantially more spatial details in simulation results.
On the other hand, the modeled variables of both cases have the same temporal variation behaviors as their corresponding observed ones, irrespective of the 2 m air temperature, surface temperature, relative humidity, precipitation, or 10 m wind speed. However, the values of PSS of 2 m air temperature, surface temperature, and 10 m wind speed in Case-ULSD are a little bit higher than those in Case-NCAR. The differences indicate that the modeling quality of Case-ULSD does not significantly improve when compared to that of Case-NCAR. Worse still, the values of PSS of relative humidity and precipitation in Case-ULSD are lower than those in Case-NCAR, which means the modeling quality of Case-ULSD in these variables is worse than those of Case-NCAR. Similarly, the annual mean values of the specified interval of the PDFD of Case-ULSD do not have a significant improvement in the modeled 2 m air temperature, surface temperature, precipitation, and 10 m wind speed than those of Case-NCAR. It is even worse than those of Case-NCAR in the modeled relative humidity, which means the high-quality input data did not positively affect the accuracy of the modeling results.
It is a valuable scientific question to probe why high-quality land surface data do not improve the accuracy of the modeling results. The modeled humidity and precipitation are impacted majorly by two soil variables (soil water permeability and initial relative soil moisture). We just used the default values of these two variables provided by NCAR in Case-ULSD. This could be a reason for why the modeled humidity and precipitation never improved. Moreover, many physical parameterization processes involved in the physics components (cumulus parameterization, microphysics, radiation planetary boundary layer, surface layer, land surface model, and urban canopy model) of the WRF ARW Noah LSM/SLUCM model. The default parameters of these processes were set to be suitable for the coarse-resolution land surface data to ensure overall robustness in global uses. Accordingly, they cannot guarantee the adaptability for the fine-resolution land surface data. This the main reason for why the quality of land surface data did not transmit positive effects on the quality of modeling results, which sheds light on the direction of urban climate model development. The land surface data will become more and more refined in the future, and the parameterization schemes of the numerical model need to adapt to these more refined data. Perhaps the parameterization schemes need to be further improved and consider more physical processes involved in the model.
Also, we only focused on the IDQC on the land surface data in this study. The IDQC on the soil attributes and initial condition data should be conducted in order to improve the quality of the modeling results. Moreover, the quality of FNL data is critical to the accuracy of the lateral boundary conditions. The resolution of the currently used FNL data is relatively coarse. Accordingly, further follow-up work can be considered to improve the FNL data by employing variational assimilation to improve the quality of urban climate modeling results.
The most significant improvement in modeling results through the incoming data quality control of the land surface data is that the model produced more distinct spatial details in the fine grids. Urban climate modeling is a meteorological downscaling application that is employed to produce the fine-scale spatial and temporal details from the coarse-resolution meteorological data (Hong and Kanamitsu, 2014). It is, therefore, a critical indicator for the urban climate to precisely construct the fine-scale details in the area of interest (Lo et al., 2008). In this study, we conducted two meteorological downscaling cases in the dynamical limited-area model with the same lateral boundary condition of coarse-resolution data and two different land surface data. Then we compare which case constructs more fine details in the area of interest. From the dynamical meteorological downscaling point of view, Case-ULSD has a significant improvement in the performance of modeling results compared to the Case-NCAR. Admittedly, the incoming data quality contributes to improving modeling performance. The sensitivity of land surface processes to input land surface data is also vital for enhancing modeling performance. We suggested improving the sensitivity of the urban land surface model to the input land surface data as a further step in the atmospheric model development.
The source codes of the WRF ARW modeling system package (WRF Model 3.7.1 and WRF Pre-Processing System (WPS) 3.7.1) are publicly available at https://www2.mmm.ucar.edu/wrf/users/download/get_source.html (National Center for Atmospheric Research, 2005a, b). The configuration profile of the WRF ARW modeling system (namelist.wps and namelist.input), changes in the WRF ARW modeling system (the source codes for inputting the 2D anthropogenic sensible and latent heat), geo_data_refinement processing package and wrf_input_refinement processing package are available at https://doi.org/10.5281/zenodo.3996876 (Li, 2020a).
The 2010 NCEP FNL (Final) Operational Global Analyses dataset is available at https://rda.ucar.edu/datasets/ds083.2/ (National Centers for Environmental Prediction/National Weather Service/NOAA/US Department of Commerce, 2016). The completed dataset of WRF Preprocessing System (WPS) geographical input data is publicly available at http://www2.mmm.ucar.edu/wrf/users/download/get_sources_wps_geog.html (National Center for Atmospheric Research, 2016). The 2010 PRD urban land surface dataset is available at https://doi.org/10.5281/zenodo.3687362 (Li and Zhou, 2020). The 2010 PRD observation locations, 2010 PRD 2 m air temperature, 2010 PRD 10 m wind speed, 2010 PRD precipitation, and 2010 PRD relative humidity are available at https://doi.org/10.5281/zenodo.4016909 (Li, 2020b). The 2010 MODIS/Aqua land surface temperature and emissivity (LST/E) product is publicly available at https://modis.gsfc.nasa.gov/data/dataprod/mod11.php (MODIS, 2012). The modeling variables for model evaluation (T2, TSK, U10, V10, RAINC, RAINNC, RH2, and SWDOWN) are available at https://doi.org/10.5281/zenodo.4016909 (Li, 2020b).
The supplement related to this article is available online at: https://doi.org/10.5194/gmd-13-6349-2020-supplement.
ZL, as the leading author, designed the model configuration, conducted the model run, conceived and designed the experiment and the analysis, performed the experiment and the analysis, contributed data, developed the related software packages, and wrote the paper. BW contributed the ideas in the explanations of the physical mechanisms, designed the model configuration, collected the data, designed the analysis methods, and programmed some related software packages. YZ collected the data, performed the analysis, and critically revised the paper. HW supported the computer systems and checked the paper for language errors.
The authors declare that they have no conflict of interest.
This paper was edited by David Topping and reviewed by two anonymous referees.
Anthes, R. A.: Regional models of the atmosphere in middle latitudes, Mon. Weather Rev., 111, 1306–1335, 1983.
Bruyère, C. L., Done, J. M., Holland, G. J., and Fredrick, S.: Bias corrections of global models for regional climate simulations of high-impact weather, Clim. Dynam., 43, 1847–1856, 2014.
Chen, F., Kusaka, H., Tewari, M., Bao, J. W., and Hirakuchi, H.: Utilizing the coupled WRF/LSM/Urban modeling system with detailed urban classification to simulate the urban heat island phenomena over the Greater Houston area, in: Fifth Symposium on the Urban Environment, 25 August 2004, American Meteorological Society, Vancouver, BC, Canada, 9–11, 2004.
Dudhia, J.: A history of mesoscale model development, Asia-Pac. J. Atmos. Sci., 50, 121–131, 2014.
Hong, S. Y. and Kanamitsu, M.: Dynamical downscaling: fundamental issues from an NWP point of view and recommendations, Asia-Pac. J. Atmos. Sci., 50, 83–104, 2014.
International Organization for Standardization (ISO): ISO 9000, Quality management systems–fundamentals and vocabulary, Geneva, Switzerland, 51 pp., 2015.
Kain, J. S., Weiss, S. J., Bright, D. R., Baldwin, M. E., Levit, J. J., Carbin, G. W., Schwartz, C. S., Weisman, M. L., Droegemeier, K. K., Weber, D. B., and Thomas, K. W.: Some practical considerations regarding horizontal resolution in the first generation of operational convection-allowing NWP, Weather Forecast., 23, 931–952, 2008.
Keyser, D. and Uccellini, L. W.: Regional models: Emerging research tools for synoptic meteorologists, B. Am. Meteorol. Soc., 68, 306–320, 1987.
Li, Z.: The technical note for the programming technical preparation package in high-resolution urban climate simulation: Hong Kong-Shenzhen area urban climate simulation using WRF/Noah LSM/SLUCM model, Zenodo, https://doi.org/10.5281/zenodo.3996876, 2020a.
Li, Z.: Evaluation dataset for urban climate simulation, Zenodo, https://doi.org/10.5281/zenodo.4016909, 2020b.
Li, Z. and Zhou, Y.: High-resolution (100 m) urban land surface dataset for the Hong Kong-Shenzhen area, Zenodo, https://doi.org/10.5281/zenodo.3687362, 2020.
Li, Z., Zhou, Y., Wan, B., Chen, Q., Huang, B., Cui, Y., and Chung, H.: The impact of urbanization on air stagnation: Shenzhen as case study, Sci. Total Environ., 664, 347–362, 2019a.
Li, Z., Zhou, Y., Wan, B., Chung, H., Huang, B., and Liu, B.: Model evaluation of high-resolution urban climate simulations: using the WRF/Noah LSM/SLUCM model (Version 3.7.1) as a case study, Geosci. Model Dev., 12, 4571–4584, https://doi.org/10.5194/gmd-12-4571-2019, 2019b.
Lo, J. C.-F., Yang, Z.-L., and Pielke Sr., R. A.: Assessment of three dynamical climate downscaling methods using the Weather Research and Forecasting (WRF) model, J. Geophys. Res., 113, D09112, https://doi.org/10.1029/2007JD009216, 2008.
MODIS: NASA EOSDIS Land Processes DAAC/USGS Earth Resources Observation and Science (EROS) Center: MODIS/Aqua Land Surface Temperature and Emissivity Daily L3 Global 1 km Grid SIN, Data file, available at: https://modis.gsfc.nasa.gov/data/dataprod/mod11.php (last access: 13 January 2017), 2012.
National Center for Atmospheric Research: WRF Model 3.7.1, Computer software, Boulder, Co., USA, available at: https://www2.mmm.ucar.edu/wrf/users/download/get_source.html (last access: 22 March 2016), 2005a.
National Center for Atmospheric Research: WRF Pre-Processing System (WPS) 3.7.1, Computer software, Boulder, Co., USA, available at: https://www2.mmm.ucar.edu/wrf/users/download/get_source.html (last access: 22 March 2016), 2005b.
National Center for Atmospheric Research: Completed Dataset and the New Static Data Released with v3.7 of WRF Preprocessing System (WPS) Geographical Input Data, available at: http://www2.mmm.ucar.edu/wrf/users/download/get_sources_wps_geog.html, last access: 22 March 2016.
National Centers for Environmental Prediction/National Weather Service/NOAA/U.S. Department of Commerce: NCEP FNL Operational Model Global Tropospheric Analyses, continuing from July 1999, available at: https://rda.ucar.edu/datasets/ds083.2/, last access: 22 March 2016.
Oreskes, N., Shrader-Frechette, K., and Belitz, K.: Verification, validation, and confirmation of numerical models in the earth sciences, Science, 263, 641–646, 1994.
Sertel, E., Robock, A., and Ormeci, C.: Impacts of land cover data quality on regional climate simulations, Int. J. Climatol., 30, 1942–1953, 2010.
Teutschbein, C. and Seibert, J.: Bias correction of regional climate model simulations for hydrological climate-change impact studies: Review and evaluation of different methods, J. Hydrol., 456, 12–29, 2012.
Tewari, M., Chen, F., Kusaka, H., and Miao, S.: Coupled WRF/Unified Noah/urban-canopy modeling system. NCAR WRF Documentation, NCAR, Boulder, USA, 1–20, 2007, available at: http://www.ral.ucar.edu/research/land/technology/urban/WRF-LSM-Urban.pdf (last access: 9 April 2015), 2007.
Warner, T. T.: Quality assurance in atmospheric modeling, B. Am. Meteorol. Soc., 92, 1601, https://doi.org/10.1175/BAMS-D-11-00054.1, 2011.
World Meteorological Organization: Guide to the Quality Management System for the Provision of Meteorological Service for International Air Navigation, World Meteorological Organization, Geneva, Switzerland, 2014.