the Creative Commons Attribution 4.0 License.
the Creative Commons Attribution 4.0 License.
 | 07 Dec 2020
Calibrating soybean parameters in JULES 5.0 from the US-Ne2/3 FLUXNET sites and the SoyFACE-O3 experiment
Karina Williams
Stephen Sitch
Amos P. K. Tai
Andy Wiltshire
Jemma Gornall
Elizabeth A. Ainsworth
Timothy Arkebauer
David Scoby
Tropospheric ozone (O3) is the third most important anthropogenic greenhouse gas. O3 is detrimental to plant productivity, and it has a significant impact on crop yield. Currently, the Joint UK Land Environment Simulator (JULES) land surface model includes a representation of global crops (JULES-crop) but does not have crop-specific O3 damage parameters and applies default C3 grass O3 parameters for soybean that underestimate O3 damage. Physiological parameters for O3 damage in soybean in JULES-crop were calibrated against leaf gas-exchange measurements from the Soybean Free Air Concentration Enrichment (SoyFACE) with O3 experiment in Illinois, USA. Other plant parameters were calibrated using an extensive array of soybean observations such as crop height and leaf carbon and meteorological data from FLUXNET sites near Mead, Nebraska, USA. The yield, aboveground carbon, and leaf area index (LAI) of soybean from the SoyFACE experiment were used to evaluate the newly calibrated parameters. The result shows good performance for yield, with the modelled yield being within the spread of the SoyFACE observations. Although JULES-crop is able to reproduce observed LAI seasonality, its magnitude is underestimated. The newly calibrated version of JULES will be applied regionally and globally in future JULES simulations. This study helps to build a state-of-the-art impact assessment model and contribute to a more complete understanding of the impacts of climate change on food production.
- Article
(990 KB) - Full-text XML
-
Supplement
(1667 KB) - BibTeX
- EndNote


Surface ozone (O3) pollution is one of the major threats to global food security due to the detrimental effects of ozone exposure on crops (Ainsworth et al., 2012; Avnery et al., 2011b; Leung et al., 2020; Long et al., 2005; Tai et al., 2014; Tai and Val Martin, 2017). In the United States alone, crop loss due to tropospheric O3 costs more than USD 5 billion annually (Ainsworth et al., 2012; Avnery et al., 2011a; Van Dingenen et al., 2009).
Soybean is one of the main staple crops for human consumption; it also serves as an important source of animal feed. It is a cheap source of proteins, and therefore soybean products are consumed around the world. The impact of O3 on soybean physiology and growth has been studied extensively (Ainsworth et al., 2012; Betzelberger et al., 2012; Dermody et al., 2008; Morgan et al., 2003). Crop yield losses to tropospheric O3 have been quantified using model projection and experiments. The National Crop Loss Assessment Network and European Open Top Chamber programmes have established the air quality guideline, which derived dose–response relationships from comparable experimental data. These campaigns provided critical information such as the O3 response relationship and estimated yield loss due to O3 damage that enabled regional projections of O3 effects on crop yields (Fuhrer, 2009). However, open top chambers modify plant response to O3 due to the “chamber effects” which create microclimates (Elagöz and Manning, 2005) and environmental differences between the chamber and open air micrometeorology in which yield loss is underestimated (Van Dingenen et al., 2009). Recently the introduction of free-air concentration enrichment (FACE) technology avoids the artefacts from enclosed chambers, and O3 fumigation was adapted to FACE facilities (Agathokleous et al., 2017; Paoletti et al., 2017). The application of FACE experiment on crops took place in China (Zhu et al., 2011) and the USA, including experiments with soybean at the SoyFACE facility in Champaign, Illinois (Morgan et al., 2004; Betzelberger et al., 2010, 2012).
Crops are a significant component of the land surface; e.g. croplands and pasturelands represent 12 % and 26 % of the global terrestrial land, respectively (Van den Hoof et al., 2011). Moreover, the phenology of crops is very different from that of natural vegetation and is characterised by high growth, turnover rate, and strong seasonality. It is thus necessary to include a crop-specific parameterisation scheme to improve simulations of land surface fluxes and regional climate in agroecosystems (Van den Hoof et al., 2011). The Joint UK Land Environment Simulator with crops (JULES-crop) is a crop parameterisation (Osborne et al., 2015) within the land surface model JULES (Best et al., 2011; Clark et al., 2011). Global simulations have been performed with JULES-crop for rice, wheat, maize, and soybean (Osborne et al., 2015). These four crop types contribute more than 70 % of human calorie intake (Ray et al., 2013). JULES-crop includes routines representing growth, development, and harvesting of crops driven by the overlying meteorological inputs. In JULES-crop, four new prognostic variables have been added: crop development index (DVI), root carbon (Croot), harvest carbon (Charv), and reserve carbon (Cresv). DVI controls the duration of the crop growing season in four distinct stages – sowing, emergence, flowering, and maturity – and it determines when changes in carbon partitioning occur (Osborne and Hooker, 2011). Croot, Charv, and Cresv are the carbon pools for roots, harvested organs (e.g. grains of cereal, fruits, and root), and stem reserves, respectively. Carbon pools for stem and leaves are determined from the existing prognostic variables, leaf area index (LAI) and canopy height. In Osborne et al. (2015), global runs of maize, wheat, soybean, and rice were carried out using JULES-crop. Site runs were performed at four FLUXNET sites with soybean–maize rotation: Bondville (US-Bo1), Fermi (US-IB1), and Mead (US-Ne2 and US-Ne3). Simulated yield was compared against country and global FAO crop yields. Osborne et al. (2015) used generic representations for each of the crops in their global study. For the plant parameters that are needed outside the crop model such as leaf nitrogen and leaf respiration parameters, these are set to those of the C3 or C4 grass functional types. Osborne et al. (2015) suggested that these parameters could be tuned to be more crop specific to improve fit to observations. These JULES parameters have been calibrated against observations for maize, using data from the Mead FLUXNET sites in Nebraska (Williams et al., 2017). However, to date, these parameters have not been calibrated to soybean data.
There are many crop models developed by institutions/organisations around the world. Most are designed for application to an individual field up to the regional scale and do not include O3 impacts on vegetation. Supplement Table S1 compares a selection of land surface models which include crop tiles and have the functions to model climate impact on crop productivity. JULES-crop is of particular interest because it is a development of the global land surface component JULES of the Met Office numerical weather prediction and climate models and contains a detailed representation of plant physiological processes at sub-diurnal timescales, including consideration of O3 effects on natural vegetation, thus making it suitable for this study. JULES-crop has been accepted into the JULES trunk with the intention to be coupled with the Hadley Centre Global Environment Model (HadGEM) in the near future. HadGEM is recognised as one of the best performing climate models with smaller errors than typical climate models (Gleckler et al., 2008; Knutti et al., 2013).
The calibration of O3 damage on soybean would allow land surface and crop models to more realistically and reliably simulate present-day and future O3 damage and subsequently to quantify its economic impacts. The objective of this study is to calibrate soybean representation for JULES-crop, with a particular focus on the response of soybean to O3 exposure.
This paper is organised as follows: Sect. 2 describes the model set-up and observations used for the JULES calibration. Section 3 compares the results from the calibrated JULES runs against independent observations. Section 4 assesses the suitability of the model for modelling soybean under O3 damage and discusses ways of future model improvement.
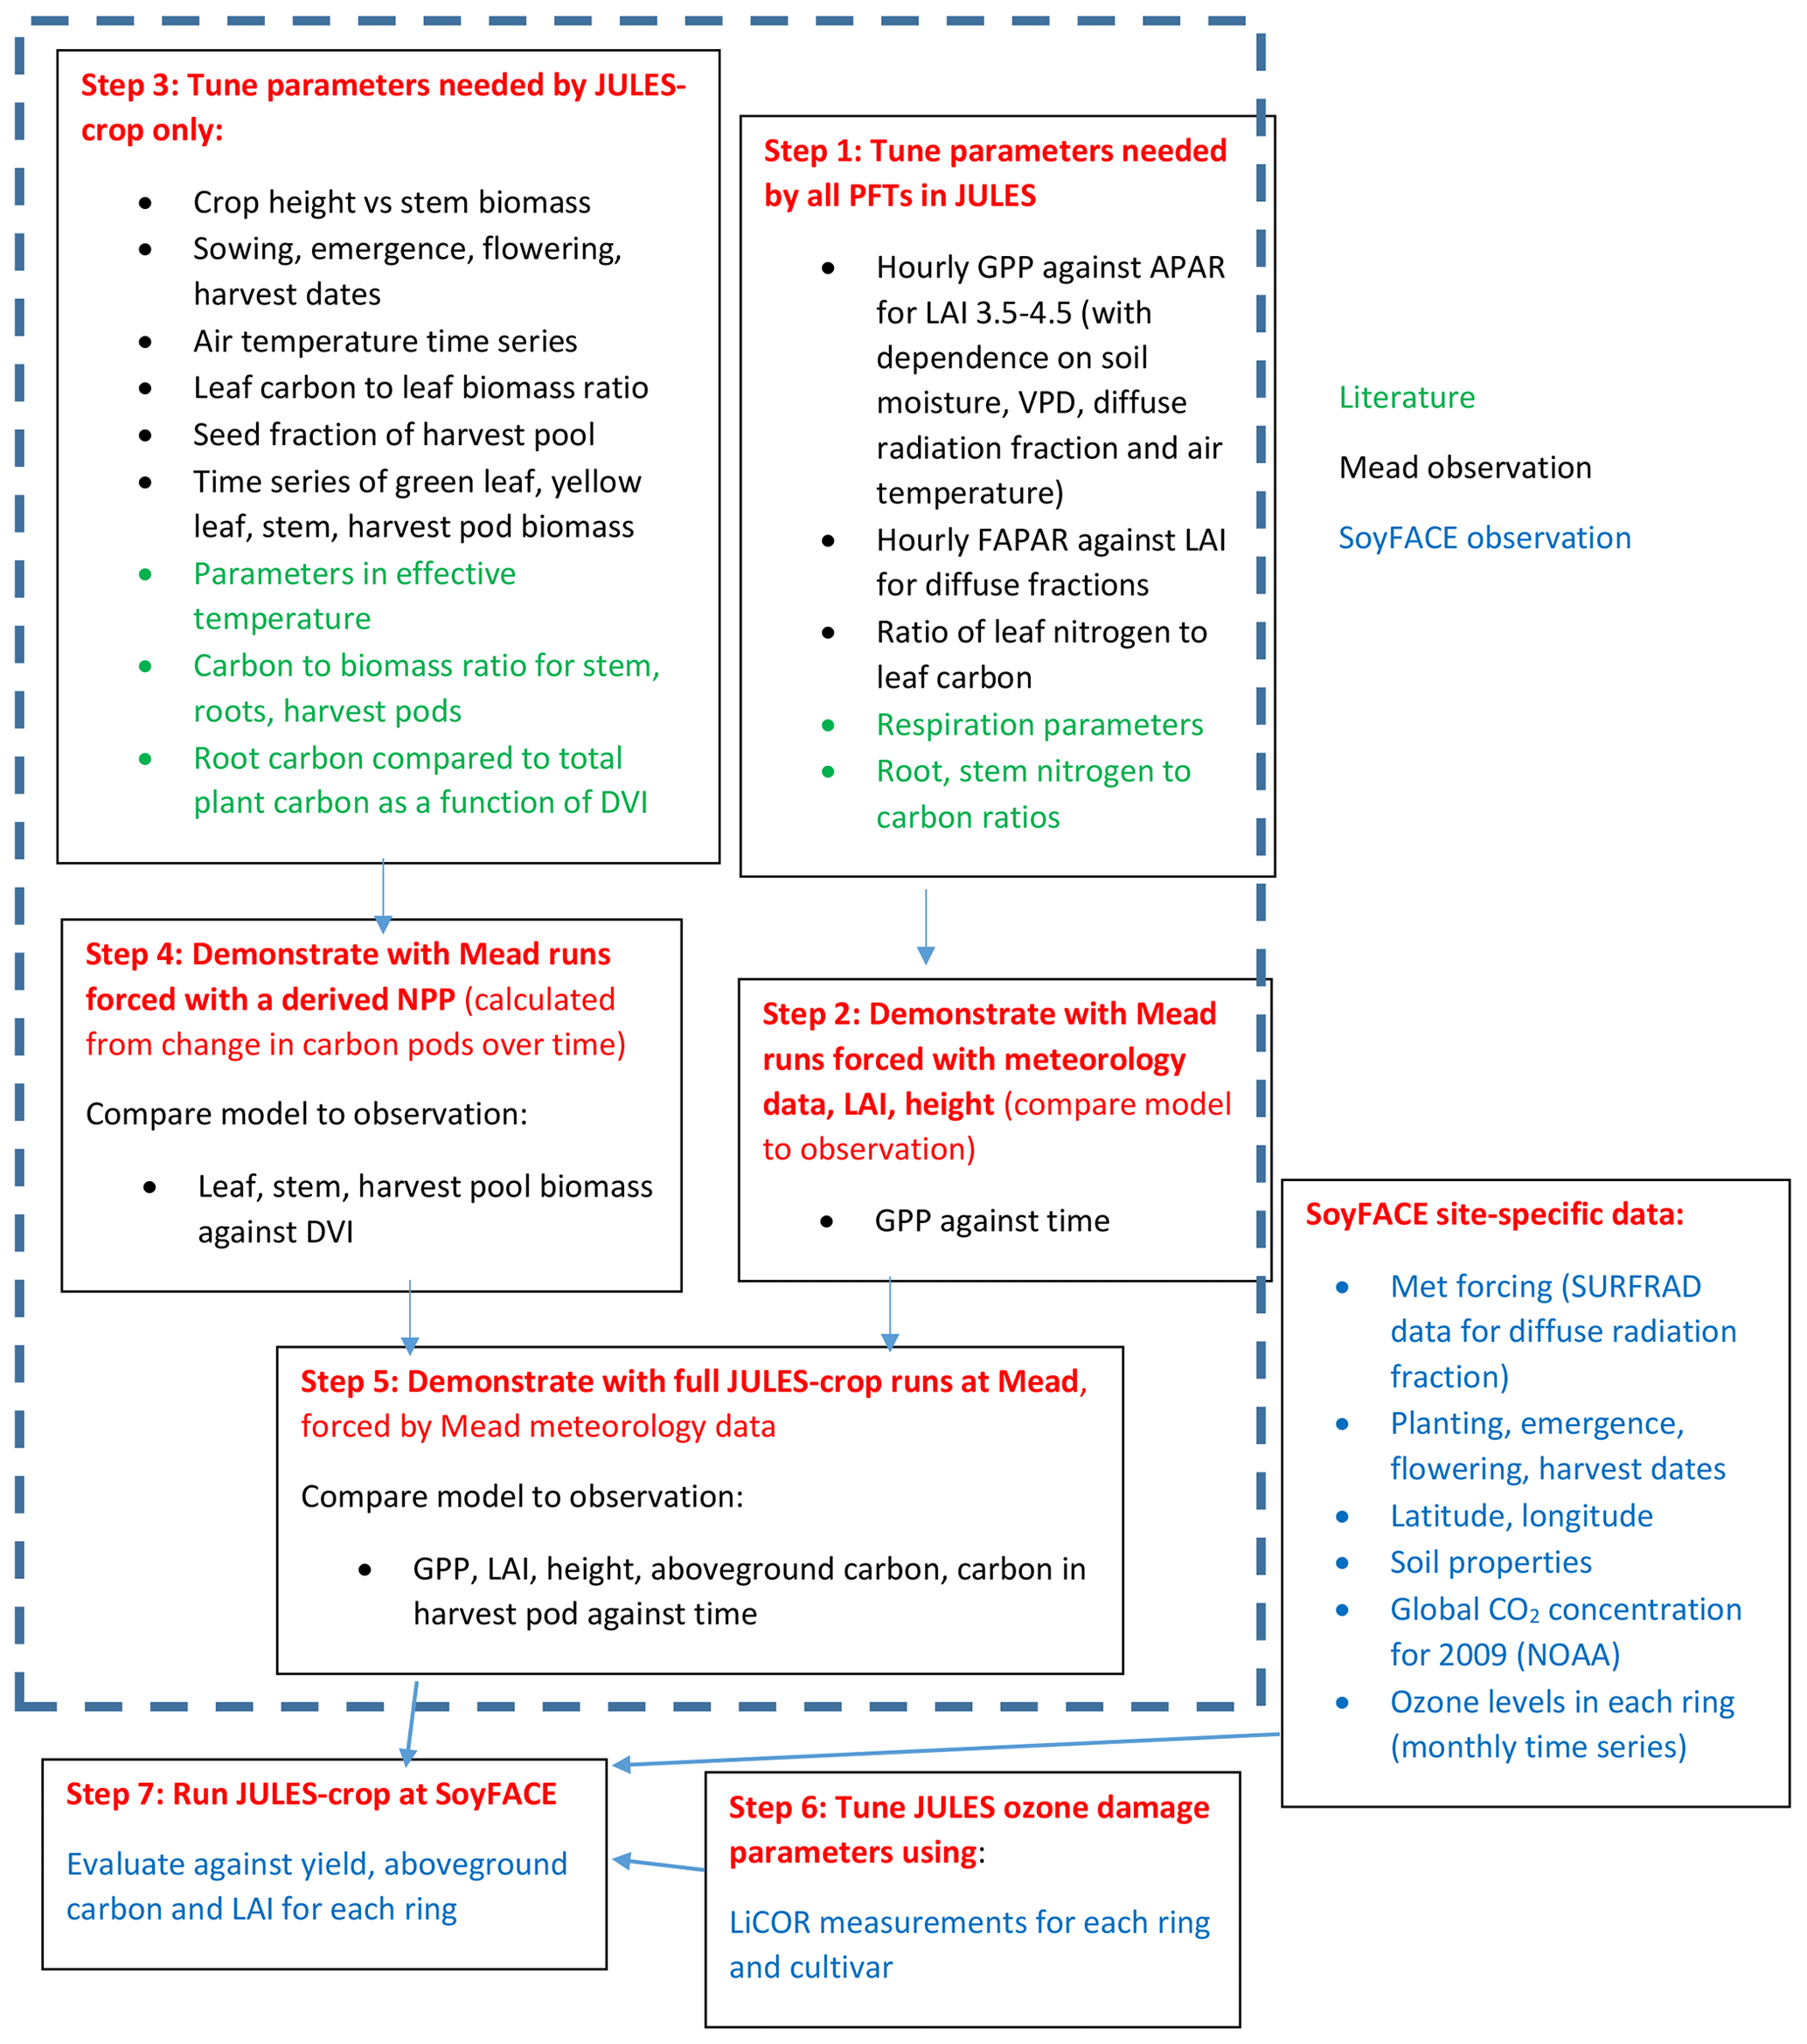
A flowchart demonstrating the calibration and evaluation procedure is given in Fig. 1. We first tuned the JULES-crop soybean parameterisation at the US-Ne2 and US-Ne3 Mead sites, where three years of soybean physiological and meteorological observations were available, at ambient ozone (Fig. 1, steps 1–5). The three years are 2004, 2006, and 2008 in which soybeans were grown in Mead; maize was grown in other years.
Secondly, to calibrate the JULES ozone damage parameters (Fig. 1, step 6) we made the assumption that there is a negligible damage to crop yield at ambient background levels of O3 at both the SoyFACE and Mead sites. This is consistent with Mills et al. (2007), who reviewed over 700 published papers and conference proceedings and found that O3 level of AOT40 over 3 months of 5 ppm h reduced soybean yield by less than 5 %. Then we calibrated specifically the soybean O3 response using leaf gas exchange measurements from soybean grown under elevated O3 concentrations at SoyFACE.
Finally, we applied JULES-crop newly calibrated for soybean and its O3 sensitivity at the leaf level and evaluated model performance against observed yield and leaf area index from SoyFACE, taken for the full range of rings and cultivars (Fig. 1, step 7).
2.1 Calibration of soybean in the absence of ozone damage, using observations from Mead
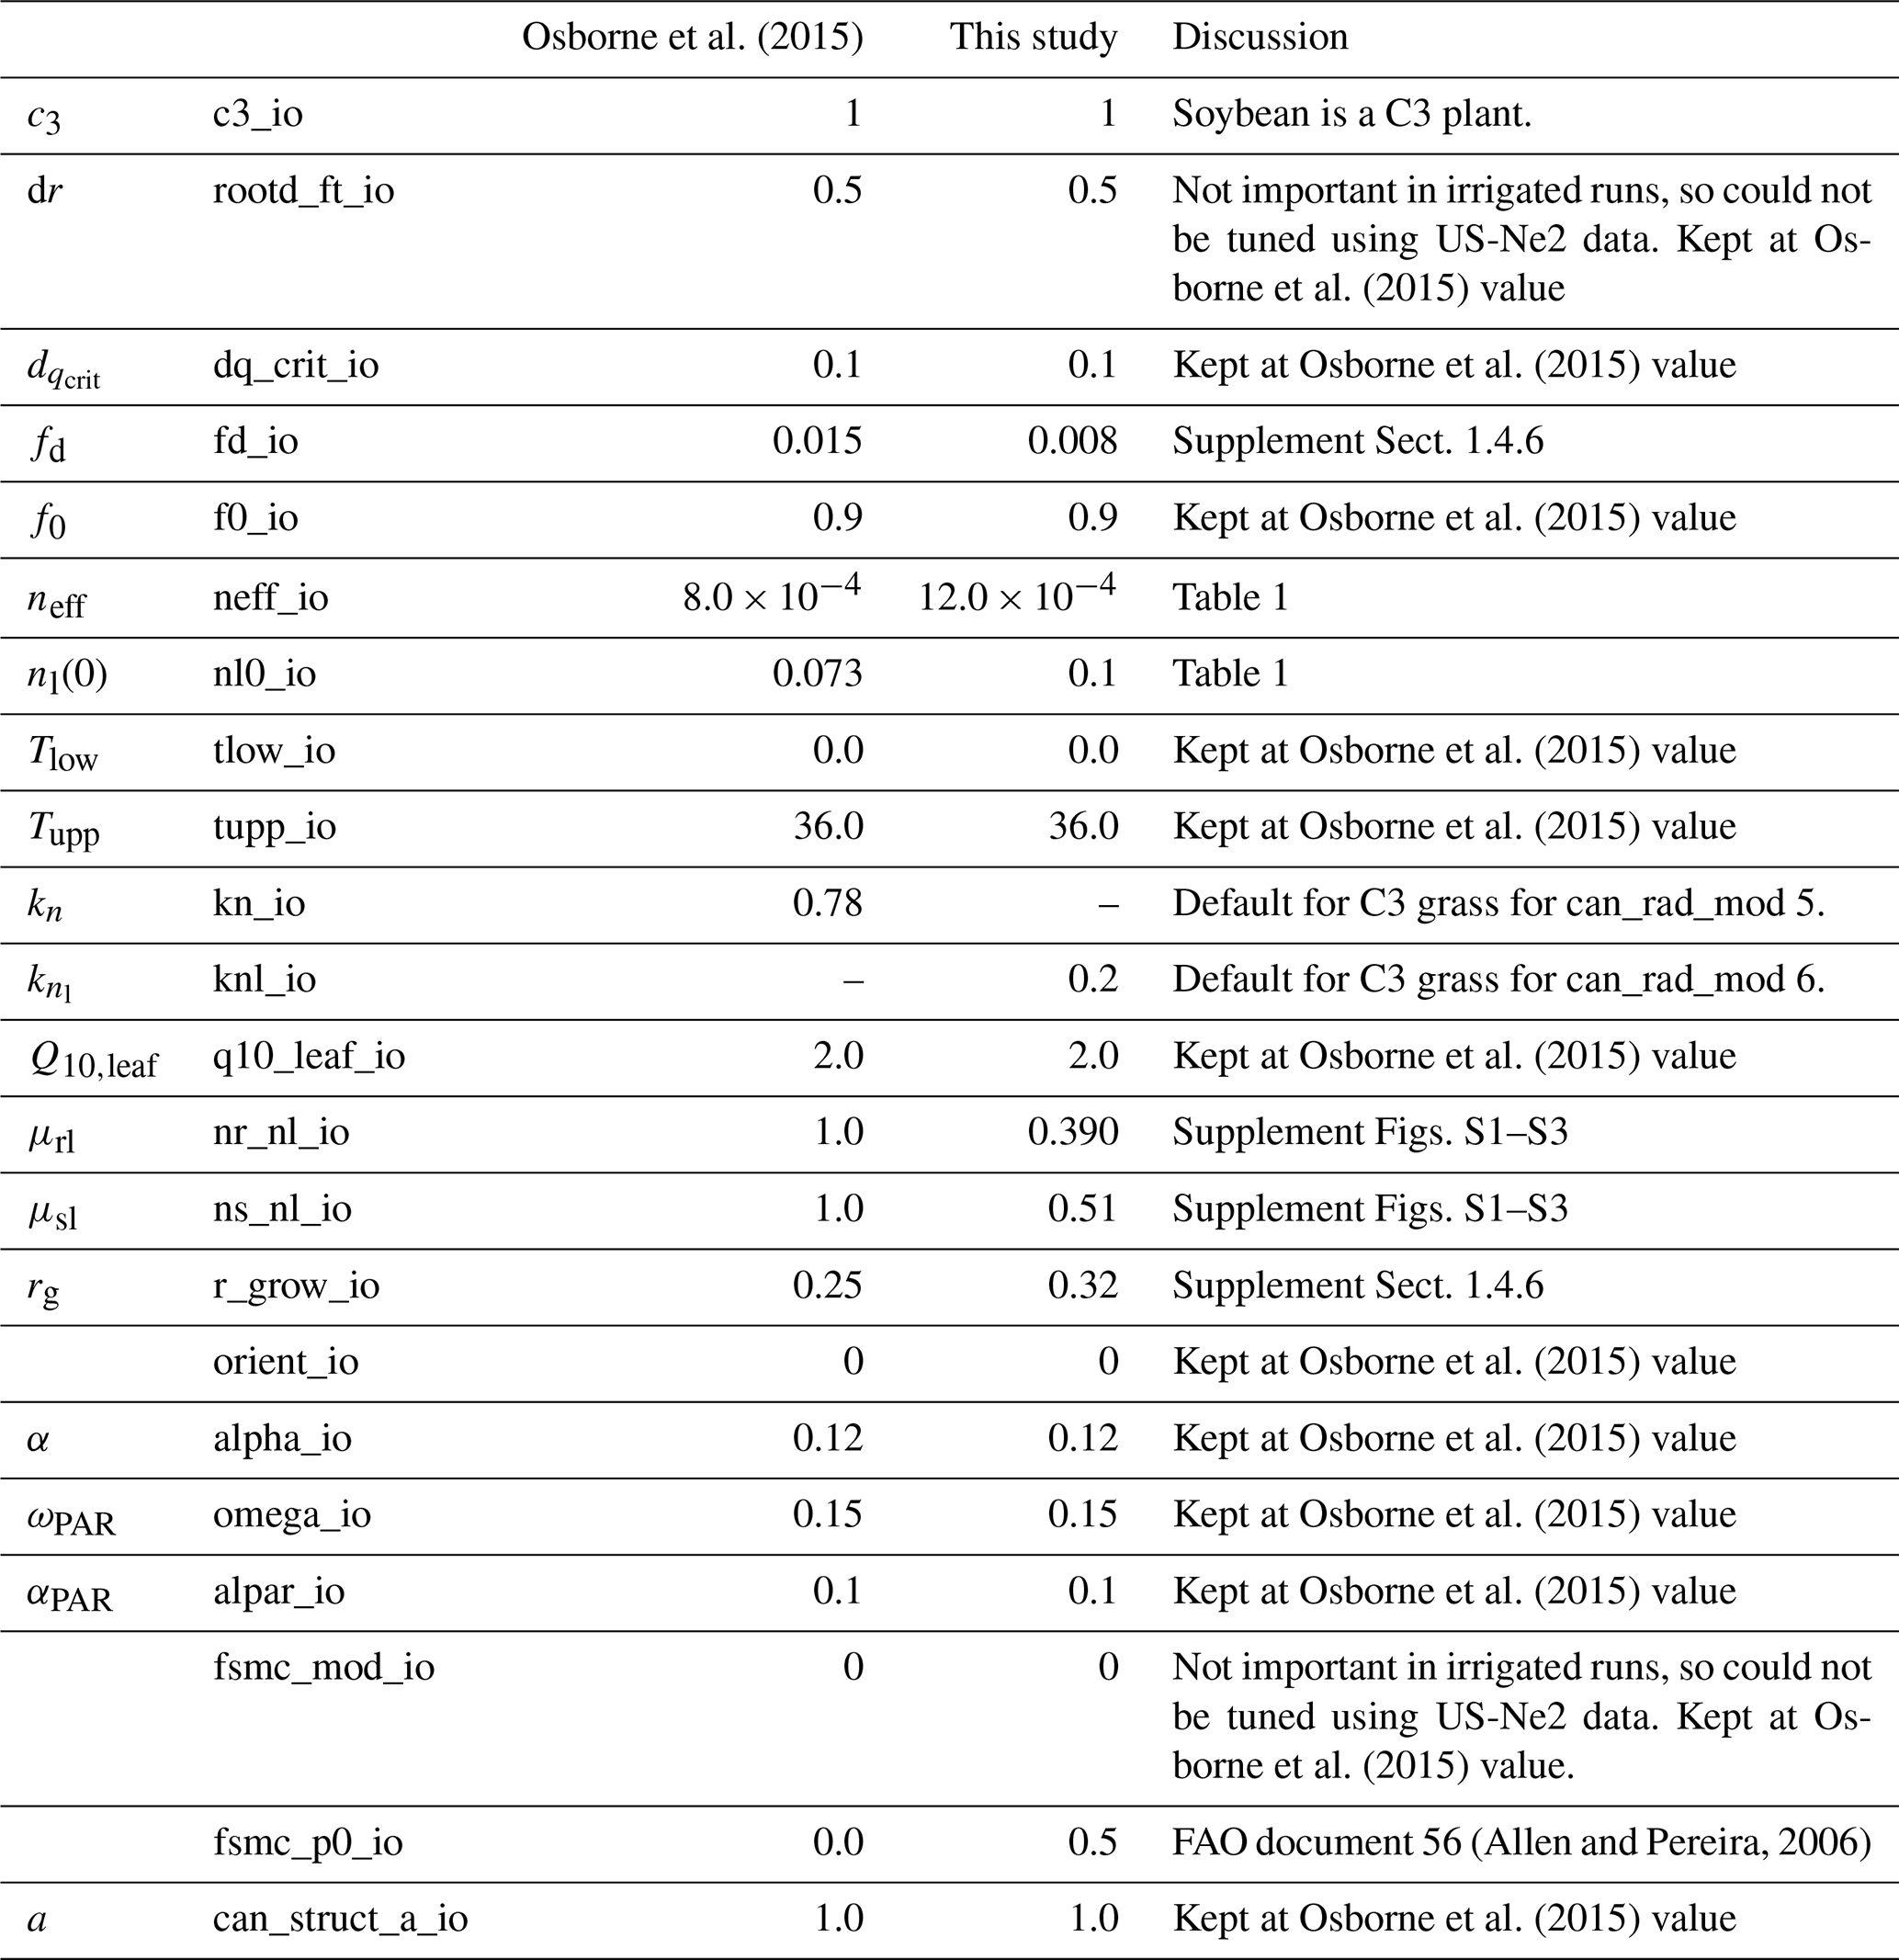
We followed the standard tuning procedure performed on maize by Williams et al. (2017) but applied to soybean (Fig. 1, steps 1–5). Step 1 involves using Mead observation to tune the parameters needed by all plant functional types (PFTs) in JULES with the crop model switched off. Step 2 is to evaluate the model performance of gross primary productivity (GPP) using Mead meteorology and LAI. Step 3 tunes the parameters needed by crop only. Step 4 evaluates the JULES-crop run performance with observed carbon pools in leaf, stem, harvest, etc. Step 5 demonstrates the full JULES-crop runs at Mead using Mead meteorology and compared the model with observed GPP, aboveground carbon, etc. Step 6 tunes ozone damage using SoyFACE LI-COR measurements. And finally step 7 evaluates JULES-crop performance using SoyFACE meteorology and compares with observed yield and LAI. This method is described in detail in the Supplement, and the resulting parameters are given in Tables 1–3. These are compared to the parameters used in Osborne et al. (2015), which we refer to as the “Osborne 2015 tuning”. Note that the parameters in Table 3 in the Osborne 2015 tuning are typical defaults for C3 grass, rather than soybean-specific.
Table 1JULES module switches, in which F (false) means turned off and T (true) means turned on.
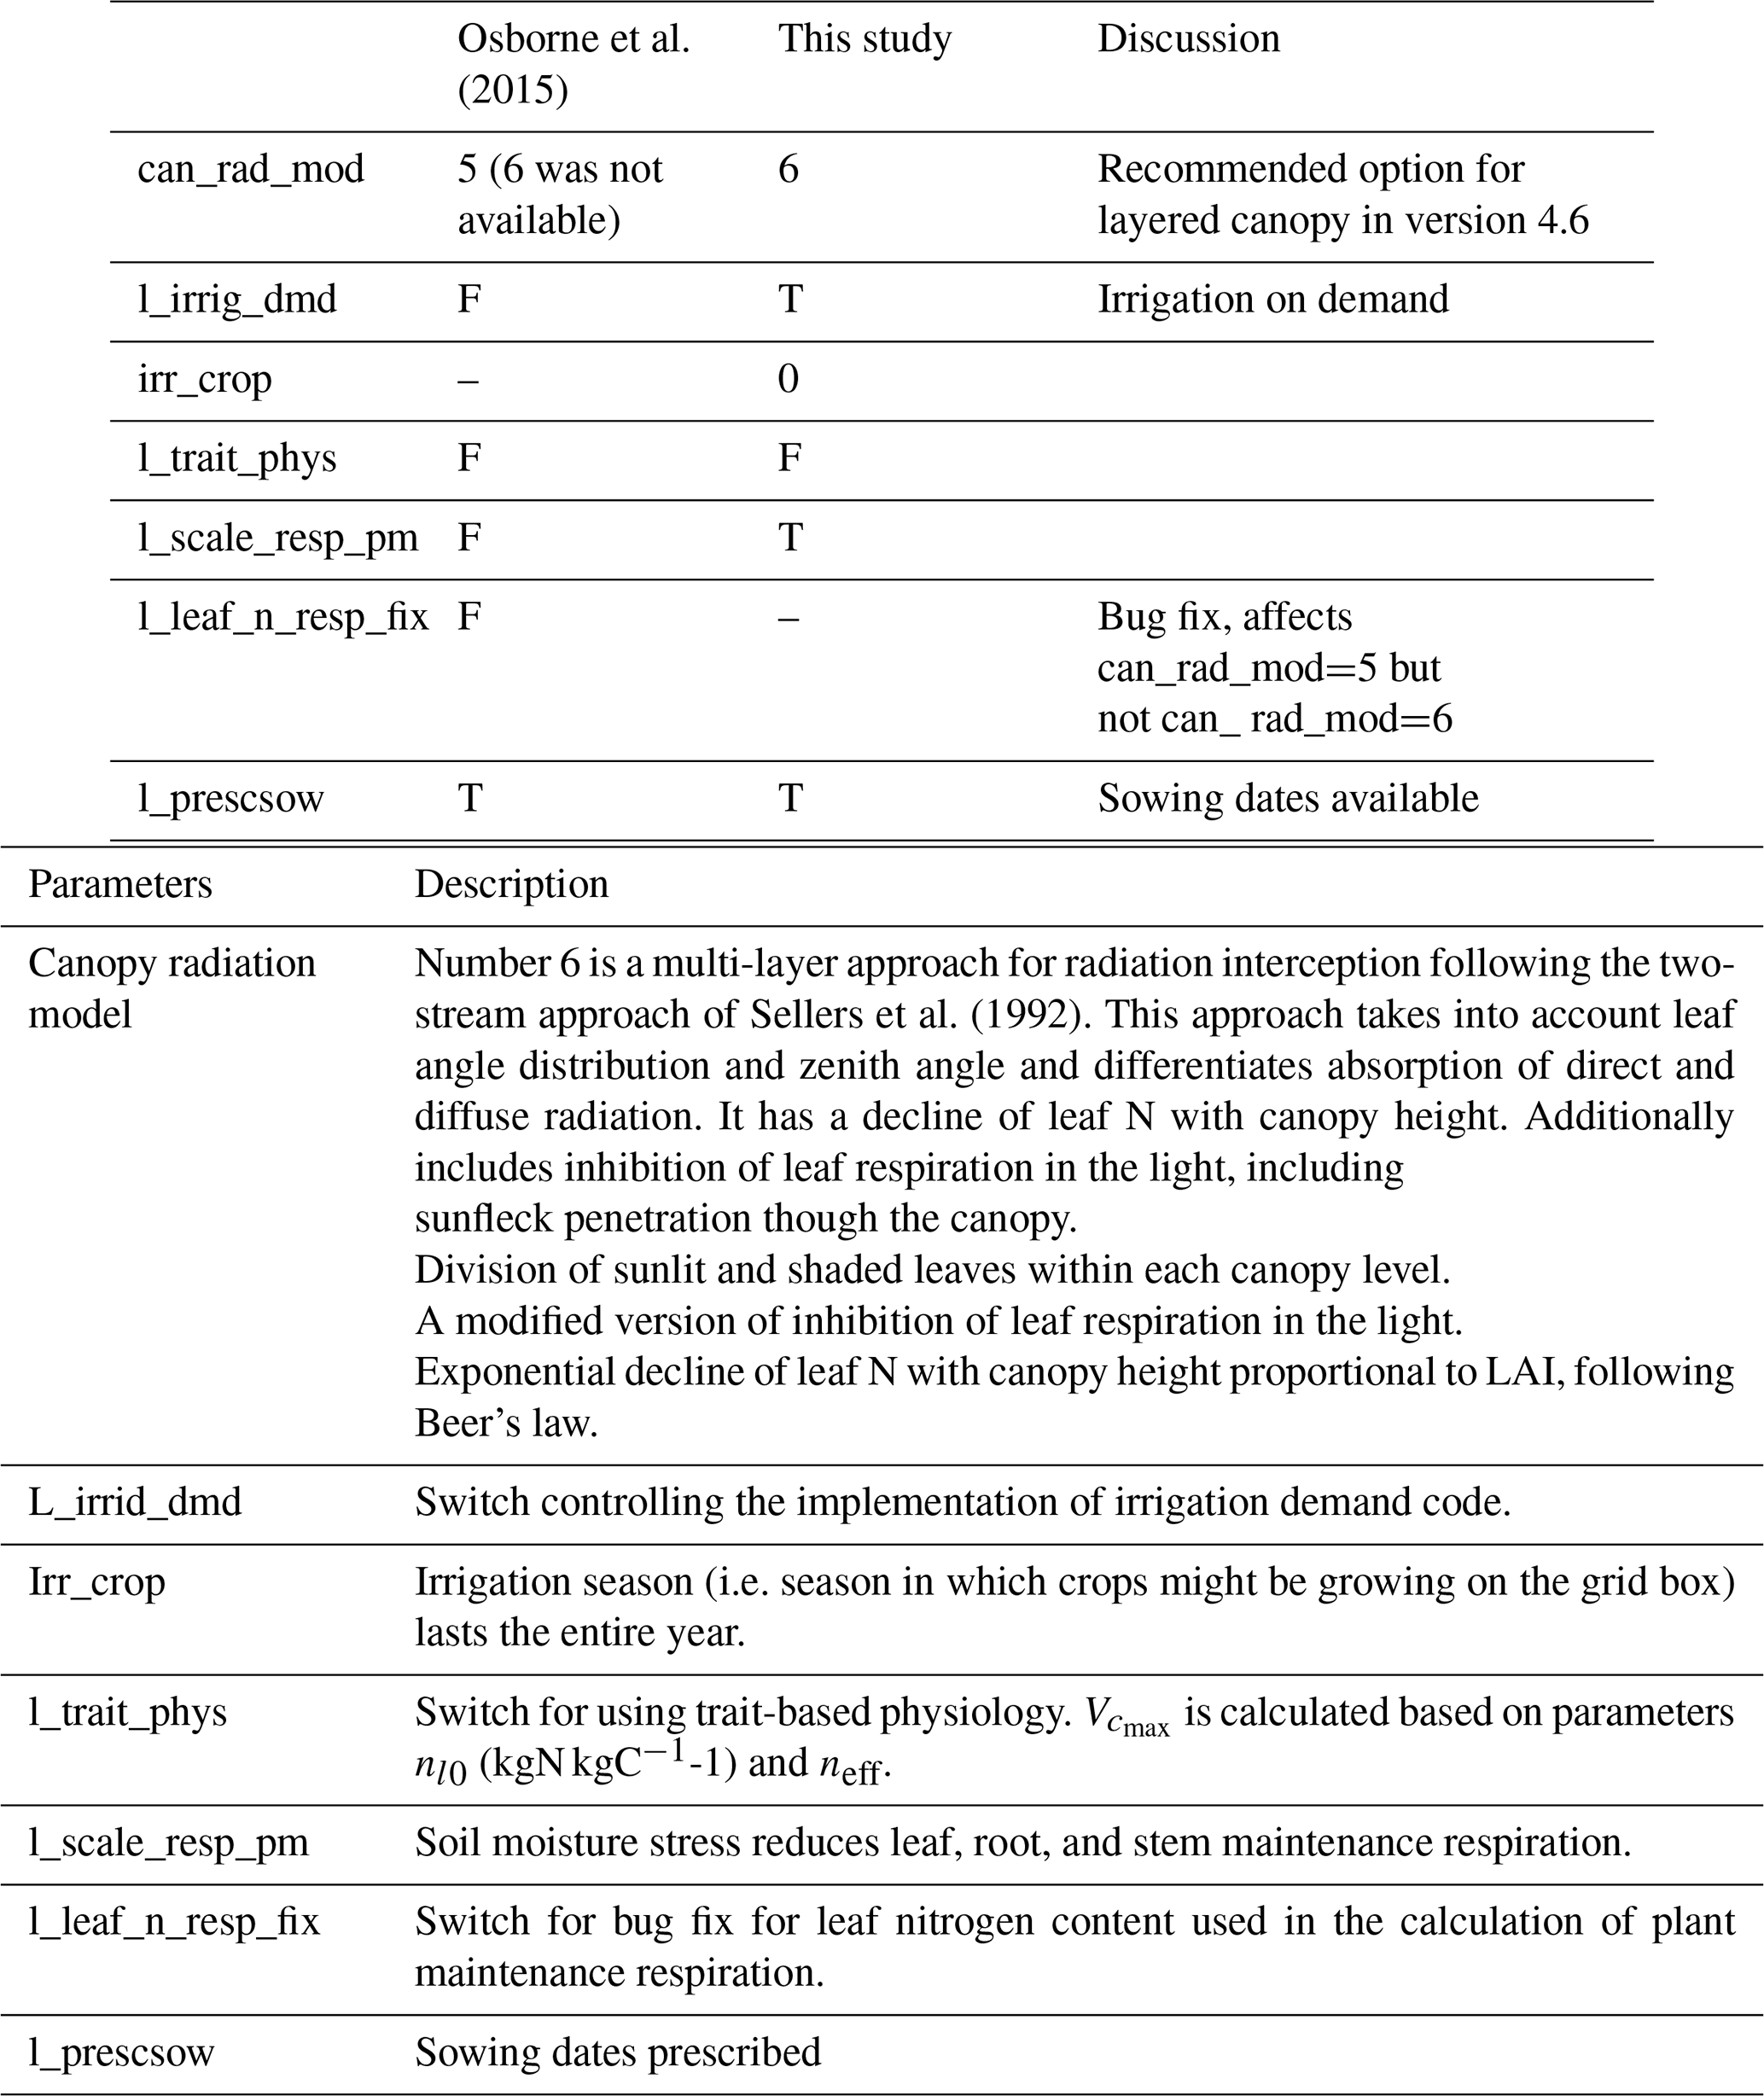
Table 2Parameter values in JULES-crop that are used to represent soybean. Asterisk indicates parameter was hardwired.
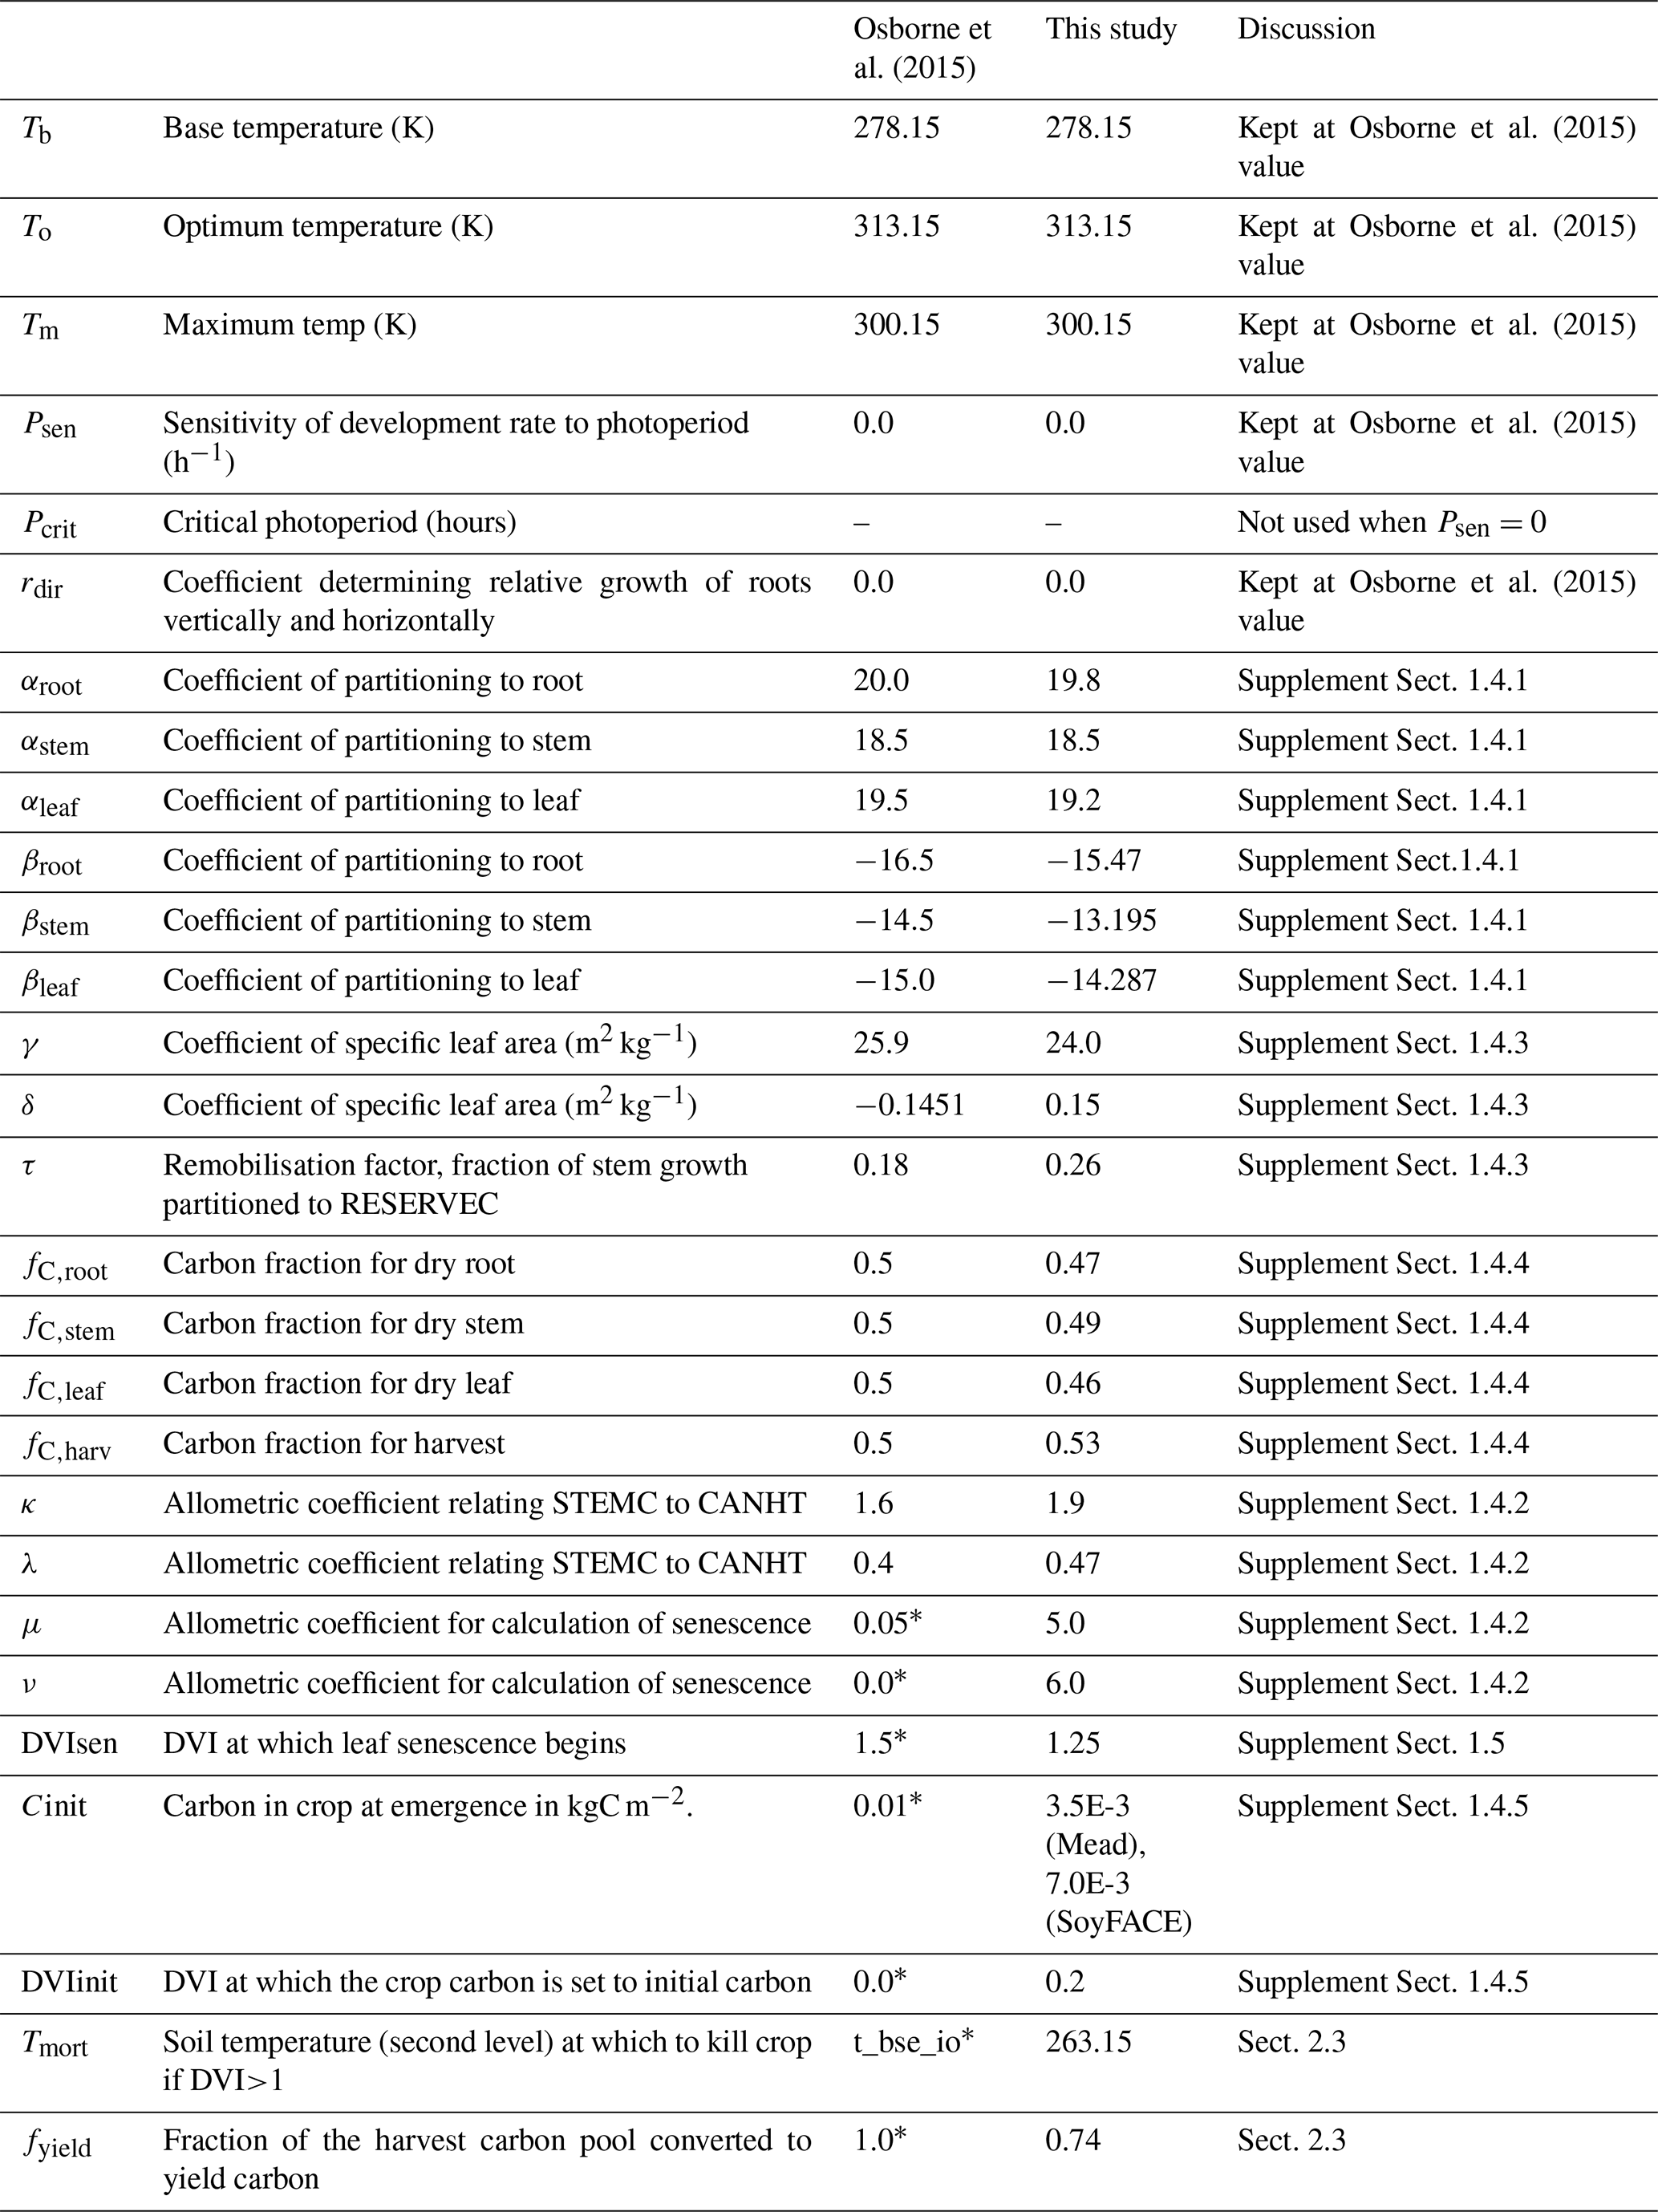
Table 3JULES plant functional type parameters extended to represent soybean.
2.2 Calibration of JULES ozone damage parameters
2.2.1 Ozone effects on vegetation (exposure response)
Many studies have shown that the impacts of O3 are closely related to accumulated exposure above a threshold concentration rather than the mean growing season concentration (Gerosa et al., 2012; Mills et al., 2007). An index of accumulated exposure above a threshold concentration of x ppb (AOTx) has thus been developed as a measure of assessing O3 pollution effects on vegetation. AOTx is calculated as the summed product of the concentration above the threshold concentration and time (T), with values expressed in ppb h or ppm h (Mills et al., 2007).
The O3 exposure index AOT40 (accumulated O3 exposure over a threshold of 40 parts per billion; Eq. 1) has been widely used by crop impact models in the forestry and agriculture industry and was used at SoyFACE.
The metric ensures only O3 concentrations above 40 ppb are included. The integral is taken over daytime hours between 07:00 to 19:00 LT (UTC-6). AOT40 does not account for the actual uptake of O3 by plants and how this varies with ontogenetic (life span of the plant) and climatic factors such as temperature, irradiance, vapour pressure deficit, and/or soil moisture (Ashmore, 2005; Fuhrer et al., 1997).
There is a drawback of the cumulative O3 exposure indices (Pleijel et al., 2000), which assume an instantaneously fixed threshold flux below which there is no effect of O3, which may not be realistic. Also in nature, the threshold value is unlikely to be constant (Ashmore, 2005) since the capacity of detoxification of O3 varies with climate and plant species. To improve these indices, the Stockholm Environment Institute developed the Deposition of Ozone for Stomatal Exchange model (DO3SE) (Emberson et al., 2007; ICP Vegetation, 2017). DO3SE was developed to estimate the risk of O3 damage to European vegetation and is capable of providing O3 flux estimation by evaluating the soil water deficits and their influence on stomatal conductance which affect plant O3 uptake. Phyto-toxic O3 dose (POD) above a stomatal threshold over a growing season (the accumulated stomatal flux above threshold Y) PODY can differentiate species sensitivity to rising background concentration, while AOT40 can only incorporate the effect of rising global background O3 above the threshold 40ppb. This difference means the AOT40 metric is less sensitive to O3 peaks, and stomatal flux-based metrics (e.g. PODY and DO3SE) perform better on O3 damage estimation in general (Büker et al., 2012; Dentener et al., 2010; Pleijel et al., 2007).
2.2.2 Description of ozone response scheme in JULES
The current O3 scheme in JULES uses a dose-response approach to model O3 damage (Sitch et al., 2007; Clark et al., 2011). It uses the O3 concentration in the atmosphere to modify net photosynthesis Ap by an O3 uptake factor F:
where F represents the fractional reduction of plant production:
It assumes that O3 suppresses the potential net leaf photosynthesis in proportion to the O3 flux through stomata above a specified critical threshold (Clark et al., 2011).
UO is the instantaneous leaf uptake of O3 over a plant functional type specific threshold () (nmol m−2 s−1), and the plant type specific parameter a is the fractional reduction of photosynthesis with O3 uptake by leaves (Clark et al., 2011; Sitch et al., 2007).
From Eqs. (3) and (4), F depends on the O3 uptake rate by stomata () over a critical (plant functional type specific) threshold for damage. It uses an analogy of Ohm's law, the O3 flux through stomata, (nmol O3 m−2 s−1), which is given by
where [O3] is the molar concentration of O3 at reference level (nmol m−3) and Ra is the combined aerodynamic and boundary layer resistance between leaf surface and reference level (s m−1). gl is the leaf conductance for H2O (m s−1), and is the ratio of leaf resistance for O3 to leaf resistance for water vapour (Sitch et al., 2007). The uptake flux is dependent on the stomatal conductance, which is reliant on the photosynthetic rate in JULES. Given that gl and photosynthetic rate are linearly related, gl is given by
where gp is the leaf conductance in the absence of O3 effects. The set of Eqs. (3, 5, 6) produces a quadratic relationship as a function of F that can be solved analytically (Sitch et al., 2007).
Fractional reduction of photosynthesis with the instantaneous uptake of O3 by leaves (mmol m−2) determines the sensitivity of soybean to O3, and the PFT-specific O3 critical level () determines the threshold O3 flux above which would cause damage to photosynthesis (Oliver et al., 2018; Sitch et al., 2007). The higher the sensitivity of plants to O3 the lower photosynthesis the plant has at a given constant critical threshold. Sitch et al. (2007) configured plant functional types with two different O3 sensitivities (fractional reduction of photosynthesis by O3, F, Eqs. 2, 3), where a=1.40 is high sensitivity, and a=0.25 is lower sensitivity for C3 grass (Sitch, 2007), using monthly average O3 data and calibration to yield observations.
2.2.3 Calibrating the ozone effects on crop leaf photosynthesis in JULES using SoyFACE
The SoyFACE experiment in Illinois allows controlled CO2 or O3 enrichment across large plots within a soybean field without an enclosure. SoyFACE O3 fumigation typically began after the emergence of soybean, and the plots were fumigated with O3 for 8–9 h daily except when leaves were wet. In 2009 and 2010, soybeans were exposed to nine different concentrations of O3 ranging from the ambient level to a target level of 200 ppb (Supplement Fig. S2). The fumigation ended when soybean was mature.
Plant damage from O3 is cumulative, and the target concentration for the experiment was not always met (e.g. when wind speeds are low, during rain, or when O3 generators or analysers are down). Therefore, the 8 h mean and the AOT40 index (accumulated ozone exposure above the threshold of 40 ppb) were used for the analysis in SoyFACE instead of using the target O3 concentration. The planting dates were 6 June 2009 (day 159) and 27 May 2010 (day 157). Fumigation began on 29 June 2009 (day 179–260) and 6 June 2010 (day 167–271), and harvest occurred on 20 October 2009 (day 293) and 20 September 2010 (day 273). O3 concentrations measured at SoyFACE fluctuated greatly, as they were strongly influenced by weather conditions, especially by wind speed. The magnitude of O3 concentration fluctuations in the high targeted concentration was greater than the low concentration (Supplement Fig. S2). On some days of the year when the fumigation was off, very low O3 concentrations were recorded for all target rings.
To calibrate the O3 parameters for soybean in JULES-crop, we used midday photosynthetic gas-exchange measurements from Betzelberger et al. (2012). These were taken at four stages during the growing season, from seven soybean cultivars growing at nine different O3 concentrations, using open gas exchange systems (LI-6400 and LI-6400-40). These observations were used in conjunction with the daytime 8 h mean O3 concentration measurements and the parameters calibrated at the Mead site to drive the Leaf Simulator computer package, which reproduces the calculation of leaf photosynthesis within JULES. We then tuned the O3 parameterisation of fractional reduction of photosynthesis by O3 (sensitivity) and threshold of O3 flux (nmol m−2 s−1) to match the modelled leaf photosynthesis rate to the observed rate (Fig. 2). The tuned parameters are shown in Table 4.
Table 4Summary of ozone parameter configurations employed in JULES-crop for the default Osborne et al. (2015) value and the tuned as calibrated to SoyFACE leaf gas-exchange measurements (note that these have been calibrated to daytime 8 h concentrations and therefore will be different to parameters calibrated to monthly 24 h means).

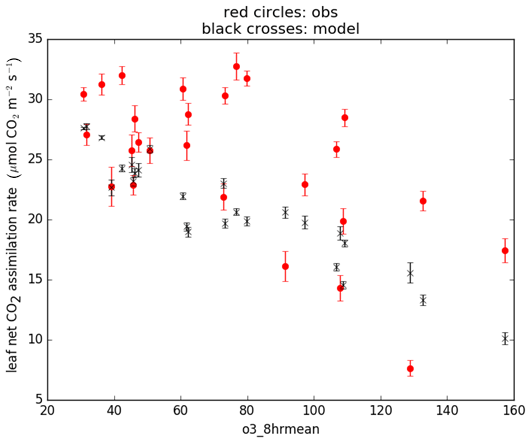
Figure 2Net leaf CO2 assimilation rate for calibrated JULES, simulated using the Leaf Simulator (black crosses) and observations from Betzelberger et al. (2012) (grey circles). X axis is the daytime 8 h mean O3 concentration (ppb).
2.3 Model configuration for the JULES-crop SoyFACE runs
The meteorological forcing data measured at Champaign, Illinois, in 2009 were used to drive the JULES-crop model. The downward longwave radiation and diffuse radiation data from NOAA at Bondville site (SURFRAD) were used as SoyFACE does not have these variables available. The driving data were repeatedly applied (recycled 25 times) to spin up the model from an arbitrary starting point with soil temperature initially set to 278 K and soil moisture to 75 % of saturation. A single crop type was modelled – soybean – using a single plant tile. Observed CO2 (NOAA) and 8 h mean observed O3 concentrations from the SoyFACE rings (averaged over a month) were used as the driving data of the model since natural O3 is produced around 8 h in daytime, and it is a typical temporal resolution for O3 fumigation. The soil ancillary parameters used in SoyFACE were extracted from the global dataset of soil ancillary from the HadGEM2-ES model (a coupled Earth system model that was used by the Met Office Hadley Centre for the CMIP5). Observed ambient O3 was used as the control. The new parameters for soybean were used, which we calibrated to observations from the Mead FLUXNET sites as described in the Supplement. The exception is the initial carbon: since the row spacing at the SoyFACE facility is half that used at the Mead sites, we doubled the initial carbon for SoyFACE compared to Mead. The resulting model yield, above ground carbon, and LAI were compared to the SoyFACE observations.
Results from JULES runs with crop model and ozone damage turned on are shown in Figs. 3 and 4. Figure 3 shows the evaluation of the soybean aboveground biomass carbon for different O3 exposure levels (AOT40) using the O3 damage parameters in Table 4. The model aboveground carbon (solid lines) is compared to the line fitted in Betzelberger et al. (2012) to their aboveground carbon observations. The run with the newly-calibrated parameters overestimated the carbon at ambient ozone levels. One contributing factor could be that water stress is underestimated in the new configuration, since it was not possible to evaluate the response to soil water availability using the Mead site data, so we instead derived a value for fsmc_p0 (parameterised in the calculation of the threshold for water stress; see Table 3) from the literature. We tested the sensitivity to this choice by re-running this configuration with fsmc_p0=0, which represents water-stressed conditions, and this caused a 12 % reduction in aboveground carbon (plots shown in Supplement). In addition, the representation of the soil properties in the JULES SoyFACE run could be improved by calibration to site measurements. In contrast, the Osborne 2015 tuning intersects the line fitted to observed aboveground carbon at zero ozone concentration (partially because of higher water stress) but then shows a sharp decrease from zero to ambient levels, which is not realistic. Note that no observations were taken for below-ambient ozone concentrations at SoyFACE, so this section of the fitted line is an extrapolation. The slope of the aboveground carbon response to increasing ozone concentrations is similar for all three runs and compares very well to the Betzelberger et al. (2012) fitted line.
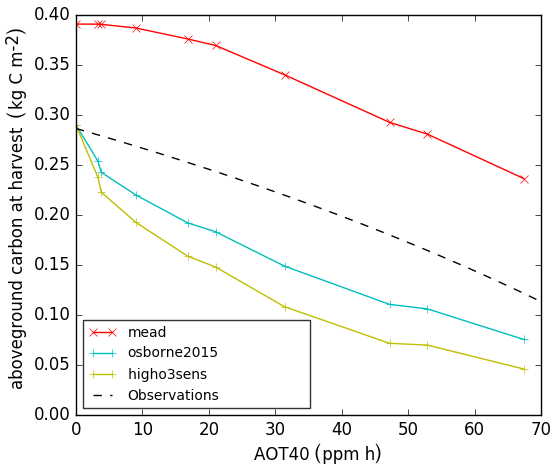
Figure 3Aboveground carbon biomass of soybean at harvest stage for calibrated Joint UK Land Environment Simulator with Crop module turned on (JULES-crop) using the Mead soybean tuning (red), Osborne et al. (2015) standard parameters with Sitch et al. (2007) low ozone sensitivity (blue), high ozone sensitivity (green), and observation from SoyFACE from Betzelberger et al. (2012).
The yield-O3 response curve in Fig. 4 shows that new parameterisation slightly overestimates yield in the ambient SoyFACE ring, compared to the spread of SoyFACE yield observations from Betzelberger et al. (2012). The Osborne 2015 tuning with high ozone sensitivity is within the spread of measured yield in ambient conditions, but note that the modelled yield has decreased sharply from zero ozone concentration to ambient levels, which is undesirable. The magnitude of the gradient of yield against AOT40 for all three model configurations is within the spread of the observations. However, the slope is underestimated for the new, calibrated run and overestimated for the Osborne 2015 tuning, especially for the range from ambient to 40 ppm h. Recall that ozone concentration modifies net leaf CO2 assimilation rate in JULES and that the model parameters governing this process (Fo3crit, a) are calibrated directly to net leaf CO2 assimilation rate observations from SoyFACE in our new configuration (Sect. 2). Reductions in the modelled net leaf CO2 assimilation rate lead to the reductions in model aboveground biomass, yield, and LAI, which we show in this section. However, Betzelberger et al. (2012) also reported additional impacts of ozone damage, such as changes in leaf absorptance and specific leaf mass, that are not represented in JULES, and therefore our tuning does not account for them. In contrast, the values of Fo3crit and a in the high and low sensitivity versions of the Osborne 2015 tuning simulations (Table 4) were calibrated in Sitch et al. (2007) to yield observations. Therefore, they can be seen as “effective” parameters in these configurations, since they incorporate the effect of the ozone damage processes that are not explicitly represented in JULES.
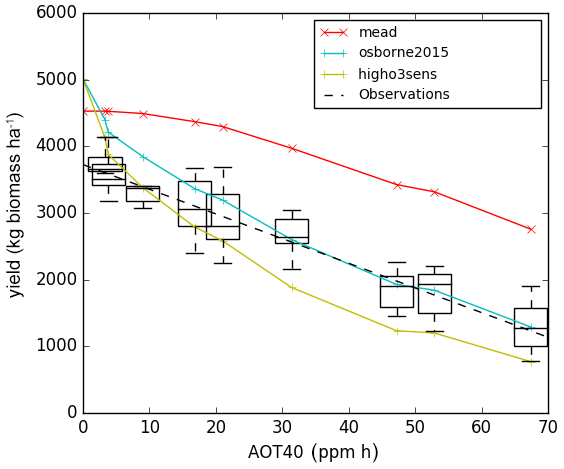
Figure 4Black dashed line is the line of best fit from SoyFACE observation, and the blue and green lines with crosses are the modelled output for each ozone concentration using the Osborne et al. (2015) tuning with Sitch et al. (2007) low and high sensitivity, respectively. The red line and crosses are the tuned parameters with Mead FLUXNET observation and SoyFACE ozone damage according to Table 4.
Note that we plot AOT40 on the x axis for illustrative purposes only, to be comparable with results presented in Betzelberger et al. (2012) – AOT40 was not used in the JULES run. An alternative would be to plot ring number or ring target concentration. Ideally, we would plot the x axis with the metric phytotoxic ozone dose (POD) for JULES and observed data, which account for the dosage of O3 that get into the stomata of soybean, but this is beyond the scope of the present study.

Figure 5Time series of leaf area index (LAI) responses on different target ozone concentration at SoyFACE. Black line is observed LAI from Betzelberger et al. (2012), and the other lines are JULES-crop LAI with different tunings. Blue: calibrated JULES-crop using Mead observations. Green: Osborne 2015 tuning with low sensitivity. Red: Osborne 2015 tuning with high sensitivity to ozone.
Figure 5 compares the model and observed LAI at SoyFACE for different O3 concentrations. JULES was able to reproduce LAI seasonality; however, it underestimated the amplitude. The maximum LAI for calibrated JULES peaked around day 240 in September, and observations peaked at DoY 220–230. The peak LAI in the model runs was less than half the observed LAI in all cases. While the Mead model runs also showed a slight underestimation of peak LAI compared to observation (Supplement), the majority of the underestimation of the modelled SoyFACE LAI is due to a difference between the observed relationships between peak LAI and yield at the Mead and SoyFACE sites. At both sites, observed maximum yield increases with observed peak LAI. However, for similar observed yields, the observed SoyFACE yield tends to be higher than the observed Mead LAI. Given that our calibration is based on Mead observations, it is therefore not surprising that our model runs at SoyFACE underestimate peak LAI compared to the SoyFACE observations.
A contributing factor to the different relationship between observed peak LAI and observed yield at SoyFACE compared to Mead could be the different methods used to measure LAI at the Mead sites (which this parameter set was tuned against) and at SoyFACE. At Mead, destructive measurements were taken, whereas at SoyFACE, LAI was measured indirectly, using radiation attenuation through the canopy.
Another plausible contributing factor for the different relationship between observed peak LAI and observed yield at SoyFACE compared to Mead is the row density of the soybean. The SoyFACE row spacing was half that of Mead, so as described above we set the initial carbon to twice that observed at Mead. The denser planting allowed soybean at SoyFACE to reach higher LAI earlier in the growing season. If this also resulted in thinner leaves at the beginning of the season than with the Mead row spacing, then this could explain the difference in the peak LAI to yield relationship between the two sites. Ricaurte et al. (2016) showed that higher sowing density would increase phyllochron in a linear relationship, which results in a higher LAI measured, which is consistent with our study. JULES also does not account for leaf age on leaf assimilation rate – in reality a lower leaf assimilation is observed in the late season associated with leaf ageing, and it is plausible that this could also be affected by row spacing.
Figure 5 also demonstrates that model LAI responds more to ozone concentrations than the observed LAI. One contributing factor is the observed decrease in specific leaf area at SoyFACE in increased ozone (Betzelberger et al., 2012). As mentioned above, this process is not captured by JULES. This issue is particularly pronounced in the Osborne 2015 tuning runs, where the modelled LAI in the ring with target 200 ppb is roughly a third of the peak LAI in the ambient ring.
Climate change and air pollution are a great threat to food production. JULES-crop has been developed to represent crops in the land surface model and allows us to estimate the future climate and air pollution impact on crops. The O3 impact on crops could be quantified with an improved parameterisation to the existing O3 damage scheme for C3 plants. The default soybean biochemical and respiratory parameters in JULES were based on C3 grass parameters. Characteristics of soybean are more similar to a shrub than grass; therefore, parameter calibration is needed to improve the performance of soybean in JULES-crop.
In this paper, the parameters needed to describe soybean in JULES-crop were first revised against observations from the Mead FLUXNET sites to ensure that the crop biochemical and respiratory parameters explicitly represented soybean. Comparison with observations from these sites showed that GPP and LAI were well represented for irrigated soybean at Mead. The O3 damage parameterisation was subsequently calibrated against leaf gas exchange observations from the Soybean Free Air Concentration Enrichment (SoyFACE) facility for the O3 damage, by tuning the sensitivity and critical threshold of O3 damage. On the whole, JULES-crop reproduces the observed negative correlation between yield and O3 exposure. It also reproduced the negative impacts of ozone on LAI and the seasonality of phenology, although the simulated LAI was underestimated at SoyFACE. This method of calibrating soybean could be replicated for other crops once data become available and would contribute to more accurate parameters for crop models. The calibration will be applied to a regional and transient run and eventually the newly calibrated JULES-crop for soybean and its sensitivity to O3 damage, coupled within an Earth system model.
This study uses JULES version 5.0 releases. The code and configuration for the SoyFACE runs can be downloaded via the Met Office Science Repository Service (MOSRS) at https://code.metoffice.gov.uk/trac/roses-u/browser/a/r/8/6/6/trunk (JULES Collaboration, 2018) (registration required) and are freely available subject to accepting the terms of the software licence. The Leaf Simulator can be downloaded from https://code.metoffice.gov.uk/trac/utils (Williams et al., 2018) (login required).
Unless otherwise noted, all site observations discussed in this paper were obtained from the site information pages of the AmeriFlux website hosted by the Oak Ridge National Laboratory (http://fluxnet.fluxdata.org/, AmeriFlux collaboration, 2018) or by personal communication with the Mead site research technologist. The longwave radiation, diffuse radiation, and air pressure from Bondville, Illinois, site can be obtained by the SURFRAD (surface radiation) network from ftp://aftp.cmdl.noaa.gov/data/radiation/surfrad/Bondville_IL/ (NOAA, 2018). The SoyFACE data used for the run are available on MOSRS at https://code.metoffice.gov.uk/trac/roses-u/browser/a/r/8/6/6/trunk/driving_data (Ainsoworth, 2017a), https://code.metoffice.gov.uk/trac/roses-u/browser/a/r/8/6/6/trunk/bin/SoyFACE_gas_exchange_data_2009.csv (Ainsoworth, 2017b), and https://code.metoffice.gov.uk/trac/roses-u/browser/a/r/8/6/6/trunk/ancil_data (Ainsoworth, 2017c).
Accessing the MOSRS requires registration, but once you access the system, there is no information about who is downloading or viewing which pages.
The supplement related to this article is available online at: https://doi.org/10.5194/gmd-13-6201-2020-supplement.
FL led the study design, data analysis and writing. KW contributed substantially to the Mead calibration, data analysis, study design and writing. SS contributed to the writing and study design. APKT contributed to the writing. AW and JG contributed to the study design. EAA contributed the SoyFACE data. TA and DS contributed the Mead data.
The authors declare that they have no conflict of interest.
Felix Leung gratefully acknowledges financial support from the NERC CASE Studentship with Met Office (NE/J017337/1), “Impact of tropospheric O3 on crop production under future climate and atmospheric CO2 concentrations, and their interactions within the Earth System”. Karina Williams gratefully acknowledges financial support from the European Commission under grant agreements 308291 (EUPORIAS) and 603864 (HELIX). We acknowledge the following AmeriFlux sites for their data records: US-Ne1, US-Ne1, and US-Ne3. In addition, funding for AmeriFlux data resources and core site data was provided by the US Department of Energy's Office of Science. I would also like to acknowledge Gerd Folberth and Eddy Robertson for helping me with the technical part of JULES.
This research has been supported by the NERC CASE Studentship with Met Office (grant no. NE/J017337/1) and the European Commission (EUPORIAS (grant no. 308291) and HELIX (grant no. 603864)).
This paper was edited by Jatin Kala and reviewed by two anonymous referees.
Agathokleous, E., Vanderstock, A., Kita, K., and Koike, T.: Stem and crown growth of Japanese larch and its hybrid F1 grown in two soils and exposed to two free-air O3 regimes, Environ. Sci. Pollut. Res., 24, 6634–6647, https://doi.org/10.1007/s11356-017-8401-2, 2017.
Ainsoworth, E. A.: Meteorology of SoyFACE site, the SoyFACE data used for the run are available on MOSRS at https://code.metoffice.gov.uk/trac/roses-u/browser/a/r/8/6/6/trunk/driving_data, last access: 5 September 2017a.
Ainsworth, E. A.: Gas exchange data of SoyFACE, available at: https://code.metoffice.gov.uk/trac/roses-u/browser/a/r/8/6/6/trunk/bin/SoyFACE_gas_exchange_data_2009.csv, last access: 5 September 2017b.
Ainsworth, E. A: Soil data of SoyFACE, available at: https://code.metoffice.gov.uk/trac/roses-u/browser/a/r/8/6/6/trunk/ancil_data, last access: 5 September 2017c.
Ainsworth, E. A., Yendrek, C. R., Sitch, S., Collins, W. J., and Emberson, L. D.: The effects of tropospheric ozone on net primary productivity and implications for climate change, Annu. Rev. Plant Biol., 63, 637–661, https://doi.org/10.1146/annurev-arplant-042110-103829, 2012.
Allen, R. G. and Pereira, L. S.: Crop Evapotranspiration, guidelines for computing crop water requirements, available at: https://www.kimberly.uidaho.edu/water/fao56/fao56.pdf (last access: 28 September 2018), 2006.
AmeriFlux collaboration: AmeriFlux Site Information, available at: http://fluxnet.fluxdata.org/ (last access: 11 November 2018), 2018.
Ashmore, M. R.: Assessing the future global impacts of ozone on vegetation, Plant Cell Environ., 28, 949–964, https://doi.org/10.1111/j.1365-3040.2005.01341.x, 2005.
Avnery, S., Mauzerall, D. L., Liu, J., and Horowitz, L. W.: Global crop yield reductions due to surface ozone exposure: 1. Year 2000 crop production losses and economic damage, Atmos. Environ., 45, 2284–2296, https://doi.org/10.1016/j.atmosenv.2010.11.045, 2011a.
Avnery, S., Mauzerall, D. L., Liu, J., and Horowitz, L. W.: Global crop yield reductions due to surface ozone exposure: 2. Year 2030 potential crop production losses and economic damage under two scenarios of O3 pollution, Atmos. Environ., 45, 2297–2309, https://doi.org/10.1016/j.atmosenv.2011.01.002, 2011b.
Best, M. J., Pryor, M., Clark, D. B., Rooney, G. G., Essery, R. L. H., Ménard, C. B., Edwards, J. M., Hendry, M. A., Porson, A., Gedney, N., Mercado, L. M., Sitch, S., Blyth, E., Boucher, O., Cox, P. M., Grimmond, C. S. B., and Harding, R. J.: The Joint UK Land Environment Simulator (JULES), model description – Part 1: Energy and water fluxes, Geosci. Model Dev., 4, 677–699, https://doi.org/10.5194/gmd-4-677-2011, 2011.
Betzelberger, A. M., Gillespie, K. M., Mcgrath, J. M., Koester, R. P., Nelson, R. L., and Ainsworth, E. A.: Effects of chronic elevated ozone concentration on antioxidant capacity, photosynthesis and seed yield of 10 soybean cultivars, Plant. Cell Environ., 33, 1569–1581, https://doi.org/10.1111/j.1365-3040.2010.02165.x, 2010.
Betzelberger, A. M., Yendrek, C. R., Sun, J., Leisner, C. P., Nelson, R. L., Ort, D. R., and Ainsworth, E. A.: Ozone exposure response for US soybean cultivars: linear reductions in photosynthetic potential, biomass, and yield, Plant Physiol., 160, 1827–39, https://doi.org/10.1104/pp.112.205591, 2012.
Büker, P., Morrissey, T., Briolat, A., Falk, R., Simpson, D., Tuovinen, J.-P., Alonso, R., Barth, S., Baumgarten, M., Grulke, N., Karlsson, P. E., King, J., Lagergren, F., Matyssek, R., Nunn, A., Ogaya, R., Peñuelas, J., Rhea, L., Schaub, M., Uddling, J., Werner, W., and Emberson, L. D.: DO3SE modelling of soil moisture to determine ozone flux to forest trees, Atmos. Chem. Phys., 12, 5537–5562, https://doi.org/10.5194/acp-12-5537-2012, 2012.
Clark, D. B., Mercado, L. M., Sitch, S., Jones, C. D., Gedney, N., Best, M. J., Pryor, M., Rooney, G. G., Essery, R. L. H., Blyth, E., Boucher, O., Harding, R. J., Huntingford, C., and Cox, P. M.: The Joint UK Land Environment Simulator (JULES), model description – Part 2: Carbon fluxes and vegetation dynamics, Geosci. Model Dev., 4, 701–722, https://doi.org/10.5194/gmd-4-701-2011, 2011.
Dentener, F., Keating, T., and Akimoto, H.: Hemispheric Transport of 2010 Part A: Ozone and Particulate Matter, Air Pollut. Stud., available at: https://www.unece.org/fileadmin/DAM/env/lrtap/Publications/11-22136-Part-D_01.pdf (last access: 18 March 2013), 2010.
Dermody, O., Long, S. P., McConnaughay, K., and DeLucia, E. H.: How do elevated CO2 and O3 affect the interception and utilization of radiation by a soybean canopy?, Glob. Change Biol., 14, 556–564, https://doi.org/10.1111/j.1365-2486.2007.01502.x, 2008.
Elagöz, V. and Manning, W. J.: Responses of sensitive and tolerant bush beans (Phaseolus vulgaris L.) to ozone in open-top chambers are influenced by phenotypic differences, morphological characteristics, and the chamber environment, Environ. Pollut., 136, 371–383, https://doi.org/10.1016/j.envpol.2005.01.021, 2005.
Emberson, L. D., Büker, P., and Ashmore, M. R.: Assessing the risk caused by ground level ozone to European forest trees: A case study in pine, beech and oak across different climate regions, Environ. Pollut., 147, 454–466, https://doi.org/10.1016/j.envpol.2006.10.026, 2007.
Fuhrer, J.: Ozone risk for crops and pastures in present and future climates., Naturwissenschaften, 96, 173–94, https://doi.org/10.1007/s00114-008-0468-7, 2009.
Fuhrer, J., Skärby, L., and Ashmore, M. R.: Critical levels for ozone effects on vegetation in Europe, Environ. Pollut., 97, 91–106, 1997.
Gerosa, G., Finco, A., Marzuoli, R., Ferretti, M., and Gottardini, E.: Errors in ozone risk assessment using standard conditions for converting ozone concentrations obtained by passive samplers in mountain regions, J. Environ. Monit., 14, 1703, https://doi.org/10.1039/c2em10965d, 2012.
Gleckler, P. J., Taylor, K. E., and Doutriaux, C.: Performance metrics for climate models, J. Geophys. Res.-Atmos., 113, D06104, https://doi.org/10.1029/2007JD008972, 2008.
ICP Vegetation: Mapping Critical Levels for Vegetation, Chapter III, Manual on Methodologies and Criteria for Modelling and Mapping Critical Loads and Levels and Air Pollution Effects, Risks and Trends, Conv. Long-range Transbound, Air Pollut., Umweltbundesamt, Suhl, Germany, 66 pp., available at: https://www.umweltbundesamt.de/sites/default/files/medien/4292/dokumente/ch3-mapman-2017-10.pdf (last access: 10 September 2017), 2017.
JULES Collaboration: ULES collaboration: JULES land-surface model, available at: https://code.metoffice.gov.uk/trac/roses-u/browser/a/r/8/6/6/trunk (last access: 11 November 2019), 2018.
Knutti, R., Masson, D., and Gettelman, A.: Climate model genealogy: Generation CMIP5 and how we got there, Geophys. Res. Lett., 40, 1194–1199, https://doi.org/10.1002/grl.50256, 2013.
Leung, F., Pang, J. Y. S., Tai, A. P. K., Lam, T., Tao, D. K. C., and Sharps, K.: Evidence of Ozone-Induced Visible Foliar Injury in Hong Kong Using Phaseolus Vulgaris as a Bioindicator, Atmosphere-Basel, 11, 266, https://doi.org/10.3390/atmos11030266, 2020.
Long, S. P., Ainsworth, E. A., Leakey, A. D. B., and Morgan, P. B.: Global food insecurity, treatment of major food crops with elevated carbon dioxide or ozone under large-scale fully open-air conditions suggests recent models may have overestimated future yields, Philos. T. Roy. Soc. B, 360, 2011–20, https://doi.org/10.1098/rstb.2005.1749, 2005.
Mills, G., Buse, A., Gimeno, B., Bermejo, V., Holland, M., Emberson, L., and Pleijel, H.: A synthesis of AOT40-based response functions and critical levels of ozone for agricultural and horticultural crops, Atmos. Environ., 41, 2630–2643, https://doi.org/10.1016/j.atmosenv.2006.11.016, 2007.
Morgan, P. B., Ainsworth, E. A., and Long, S. P.: How does elevated ozone impact soybean? A meta-analysis of photosynthesis, growth and yield, Plant Cell Environ., 26, 1317–1328, https://doi.org/10.1046/j.0016-8025.2003.01056.x, 2003.
Morgan, P. B., Bernacchi, C. J., Ort, D. R., and Long, S. P.: An in vivo analysis of the effect of season-long open-air elevation of ozone to anticipated 2050 levels on photosynthesis in soybean, Plant Physiol., 135, 2348–2357, https://doi.org/10.1104/pp.104.043968, 2004.
NOAA: Surface Radiation of Bondville (SURFRAD), available at: ftp://aftp.cmdl.noaa.gov/data/radiation/surfrad/Bondville_IL/, last access: 11 November 2018.
Oliver, R. J., Mercado, L. M., Sitch, S., Simpson, D., Medlyn, B. E., Lin, Y.-S., and Folberth, G. A.: Large but decreasing effect of ozone on the European carbon sink, Biogeosciences, 15, 4245–4269, https://doi.org/10.5194/bg-15-4245-2018, 2018.
Osborne, T. and Hooker, J.: JULES-crop technical documentation Crop parameterisation, University of Reading, Reading, Berkshire, UK, 1–49, 2011.
Osborne, T., Gornall, J., Hooker, J., Williams, K., Wiltshire, A., Betts, R., and Wheeler, T.: JULES-crop: a parametrisation of crops in the Joint UK Land Environment Simulator, Geosci. Model Dev., 8, 1139–1155, https://doi.org/10.5194/gmd-8-1139-2015, 2015.
Paoletti, E., Materassi, A., Fasano, G., Hoshika, Y., Carriero, G., Silaghi, D., and Badea, O.: A new-generation 3D ozone FACE (Free Air Controlled Exposure), Sci. Total Environ., 575, 1407–1414, https://doi.org/10.1016/j.scitotenv.2016.09.217, 2017.
Pleijel, H., Danielsson, H., Emberson, L., Ashmore, M. R., and Mills, G.: Ozone risk assessment for agricultural crops in Europe: Further development of stomatal flux and flux-response relationships for European wheat and potato, Atmos. Environ., 41, 3022–3040, https://doi.org/10.1016/j.atmosenv.2006.12.002, 2007.
Ray, D. K., Mueller, N. D., West, P. C., Foley, J. A.: Yield Trends Are Insufficient to Double Global Crop Production by 2050, PLoS One, 8, e66428, https://doi.org/10.1371/journal.pone.0066428, 2013.
Ricaurte, J., Clavijo Michelangeli, J. A., Sinclair, T. R., Rao, I. M. andBeebe, S. E.: Sowing Density Effect on Common Bean Leaf Area Development, Crop Sci., 56, 2713–2721, https://doi.org/10.2135/cropsci2016.01.0056, 2016.
Sitch, S.: Carbon sinks threatened by increasing ozone, Nat. Publ. Gr., 7, 2335–2340, 2007.
Sitch, S., Cox, P. M., Collins, W. J., and Huntingford, C.: Indirect radiative forcing of climate change through ozone effects on the land-carbon sink, Nature, 448, 791–794, https://doi.org/10.1038/nature06059, 2007.
Tai, A. P. K. and Martin, M. V.: Impacts of ozone air pollution and temperature extremes on crop yields: Spatial variability, adaptation and implications for future food security, Atmos. Environ., 169, 11–21, https://doi.org/10.1016/J.ATMOSENV.2017.09.002, 2017.
Tai, A. P. K., Martin, M. V., and Heald, C. L.: Threat to future global food security from climate change and ozone air pollution, Nat. Clim. Change, 4, 817–821, https://doi.org/10.1038/NCLIMATE2317, 2014.
Van den Hoof, C., Hanert, E., and Vidale, P. L.: Simulating dynamic crop growth with an adapted land surface model – JULES-SUCROS: Model development and validation, Agric. For. Meteorol., 151, 137–153, https://doi.org/10.1016/j.agrformet.2010.09.011, 2011.
Van Dingenen, R., Dentener, F. J., Raes, F., Krol, M. C., Emberson, L., and Cofala, J.: The global impact of ozone on agricultural crop yields under current and future air quality legislation, Atmos. Environ., 43, 604–618, https://doi.org/10.1016/j.atmosenv.2008.10.033, 2009.
Williams, K., Gornall, J., Harper, A., Wiltshire, A., Hemming, D., Quaife, T., Arkebauer, T., and Scoby, D.: Evaluation of JULES-crop performance against site observations of irrigated maize from Mead, Nebraska, Geosci. Model Dev., 10, 1291–1320, https://doi.org/10.5194/gmd-10-1291-2017, 2017.
Williams, K., Hemming, D., Harper, A. B., and Mercado, L. M.: Leaf simulator, available at: https://code.metoffice.gov.uk/trac/utils (last access: 5 November 2019), 2018.
Zhu, X., Feng, Z., Sun, T., Liu, X., Tang, H., Zhu, J., Guo, W., and Kobayashi, K.: Effects of elevated ozone concentration on yield of four Chinese cultivars of winter wheat under fully open-air field conditions, Glob. Chang. Biol., 17, 2697–2706, https://doi.org/10.1111/j.1365-2486.2011.02400.x, 2011.