the Creative Commons Attribution 4.0 License.
the Creative Commons Attribution 4.0 License.
 | 26 Aug 2020
Evaluation of CH4MODwetland and Terrestrial Ecosystem Model (TEM) used to estimate global CH4 emissions from natural wetlands
Tingting Li
Yanyu Lu
Lingfei Yu
Wenjuan Sun
Qing Zhang
Wen Zhang
Guocheng Wang
Zhangcai Qin
Lijun Yu
Hailing Li
Ran Zhang
Wetlands are the largest and most uncertain natural sources of atmospheric methane (CH4). Several process-based models have been developed to quantify the magnitude and estimate spatial and temporal variations in CH4 emissions from global wetlands. Reliable models are required to estimate global wetland CH4 emissions. This study aimed to test two process-based models, CH4MODwetland and Terrestrial Ecosystem Model (TEM), against the CH4 flux measurements of marsh, swamp, peatland and coastal wetland sites across the world; specifically, model accuracy and generality were evaluated for different wetland types and in different continents, and then the global CH4 emissions from 2000 to 2010 were estimated. Both models showed similar high correlations with the observed seasonal/annual total CH4 emissions, and the regression of the observed versus computed total seasonal/annual CH4 emissions resulted in R2 values of 0.81 and 0.68 for CH4MODwetland and TEM, respectively. The CH4MODwetland produced accurate predictions for marshes, peatlands, swamps and coastal wetlands, with model efficiency (EF) values of 0.22, 0.52, 0.13 and 0.72, respectively. TEM produced good predictions for peatlands and swamps, with EF values of 0.69 and 0.74, respectively, but it could not accurately simulate marshes and coastal wetlands (EF <0). There was a good correlation between the simulated CH4 fluxes and the observed values on most continents. However, CH4MODwetland showed no correlation with the observed values in South America and Africa. TEM showed no correlation with the observations in Europe. The global CH4 emissions for the period 2000–2010 were estimated to be 105.31 ± 2.72 Tg yr−1 by CH4MODwetland and 134.31 ± 0.84 Tg yr−1 by TEM. Both models simulated a similar spatial distribution of CH4 emissions globally and on different continents. Marshes contribute 36 %–39 % of global CH4 emissions. Lakes/rivers and swamps are the second and third greatest contributors, respectively. Other wetland types account for only approximately 20 % of global emissions. Based on the model applicability, if we use the more accurate model, i.e., the one that performs best as evidenced by a higher model efficiency and a lower model bias, to estimate each continent and wetland type, we obtain a new assessment of 116.99–124.74 Tg yr−1 for the global CH4 emissions for the period 2000–2010. Our results imply that performance at a global scale may conceal model uncertainty. Efforts should be made to improve model accuracy for different wetland types and regions, particularly hotspot regions, to reduce the uncertainty in global assessments.
- Article
(2235 KB) - Full-text XML
-
Supplement
(433 KB) - BibTeX
- EndNote


Atmospheric methane (CH4) is the second most prevalent human-induced greenhouse gas (GHG) after carbon dioxide (CO2). Its radiative forcing effect is 28 times greater than that of CO2 on a 100-year horizon (Myhre et al., 2013). The radiative forcing attributed to CH4 has been re-evaluated by the Intergovernmental Panel on Climate Change (IPCC) Fifth Assessment Report (AR5) and was reported to be almost twice as high as the value reported in the Fourth Assessment Report (AR4), with values of 0.97 W m−2 versus 0.48 W m−2, respectively (Myhre et al., 2013). This estimate considers that the emission of CH4 leads to an increase in ozone production, stratospheric water vapor and CO2, which can affect its own lifetime (Boucher et al., 2009; Myhre et al., 2013; Shindell et al., 2012).
The growth rate of the atmospheric CH4 concentration has varied in different historical periods. There was an exponential increase from preindustrial times to the 1980s. The growth rate decreased after the 1980s and was close to zero from 1999 to 2006; then, the growth rate resumed strong growth in the period of 2007–2017 (Dlugokencky et al., 2009, 2016; Nisbet et al., 2019). However, the causes that drive the variations in growth rate remain unclear due to the uncertainties in estimating CH4 emissions and sinks (Ghosh et al., 2015; Saunois et al., 2016; Nisbet et al., 2019; Dalsøren et al., 2016).
Integrated at the global scale, wetlands are the largest and most uncertain source of CH4 emitted to the atmosphere (Kirschke et al., 2013; Saunois et al., 2016). These emissions represent approximately 30 % of the total CH4 input (Saunois et al., 2016). Bottom-up and top-down approaches are popular methods for estimating global CH4 emissions from natural wetlands. Top-down approaches are based on inverse models (e.g., Bousquet et al., 2006; Fraser et al., 2013; Meirink et al., 2008; Tsuruta et al., 2017; Bruhwiler et al., 2014), which determine “optimal” surface fluxes that best fit atmospheric CH4 observations given an atmospheric transport model including chemistry, prior estimates of fluxes and their uncertainties (Kirschke et al., 2013). Bottom-up approaches use process-based models that describe the relationship between the environmental factors and the processes of CH4 production, oxidation and emission using mathematical equations (e.g., Li et al., 2010; Zhu et al., 2013, 2014; Zhang et al., 2002; Walter and Heimann, 2000; Tian et al., 2015; Riley et al., 2011; Meng et al., 2012; Zhuang et al., 2006).
Recent studies related to the bottom-up approach have used an ensemble of process-based models driven by the same climate forcing to estimate the global CH4 emissions from natural wetlands. For example, the Wetland and Wetland CH4 Intercomparison of Models Project (WETCHIMP) used 10 land surface models and estimated global CH4 emissions of 190 ± 76 Tg CH4 yr−1 for the 1993–2004 period (Melton et al., 2013). In the following year, Kirschke et al. (2013) assessed a large emission range of 142–287 Tg CH4 yr−1 from 1980 to 2010. Saunois et al. (2016) and Poulter et al. (2017) estimated global emissions of 153–227 Tg CH4 yr−1 for the decade 2003–2012 and 184 ± 22 Tg CH4 yr−1 for the decade 2000–2012 using ensemble process-based models (Poulter et al., 2017). Saunois et al. (2016) suggested that approximately 70 % of the uncertainty was due to model structures and parameters.
Natural wetland ecosystems are greatly heterogeneous on a global scale. Wetlands vary widely by continent with respect to area and type (Kingsford et al., 2016; Keddy, 2010). Some wetland types have higher emissions, while some emit less CH4; this difference is because the processes of controls on CH4 cycling differ among wetland types (Bridgham et al., 2013). For example, sedge-dominated marshes or fens often emit higher CH4 fluxes, because sedges can increase methanogenic substrates as part of their plant productivity and promote CH4 transportation through their soft aerenchyma and lacunae tissues (McEwing et al., 2015; Jitka et al., 2017; Bhullar et al., 2013; Joabsson and Christensen, 2001; Kwon et al., 2017; King et al., 2002; Chanton, 2005). Bog soils with anaerobic incubations emit little CH4 due to the particularly high CO2:CH4 ratios of the end products of anaerobic carbon (Bridgham et al., 1998; Galand et al., 2010; Keller and Bridgham, 2007). Coastal wetlands with high salinity usually emit less CH4 than other wetlands, because the sulfate in seawater inhibits CH4 production (Bartlett et al., 1985; Delaune et al., 1983; Li et al., 2016; Poffenbarger et al., 2011).
Model evaluation is a core part of model development and testing (Bennett et al., 2013). Based on the model evaluation, the modeler must be confident that the model will fulfill its purpose (Bennett et al., 2013; Rykiel, 1996). If applying process-based models for global-scale CH4 estimations, it is necessary to evaluate its performance in different wetland types and regions. This process is also helpful for confirming the source of uncertainties and improving the model. However, previous studies have always focused on global assessments and have overlooked model performance in different wetland types or regions, which may have induced high uncertainties (Poulter et al., 2017; Saunois et al., 2016; Kirschke et al., 2013; Melton et al., 2013). CH4MODwetland (Li et al., 2010) and the Terrestrial Ecosystem Model (TEM) (Zhuang et al., 2004, 2007, 2013; Melillo et al., 1993) are two established process-based models that can be used to simulate regional and global wetland CH4 emissions. Both models have been validated at specific sites (Zhu et al., 2013; Li et al., 2010, 2017). However, we do not have information on the accuracy and applicability of the models for different wetland types and on different continents. The objectives of this study were to comprehensively evaluate the model performances of CH4MODwetland and TEM for different wetland types and on different continents and then to use the models to estimate global CH4 emissions from natural wetlands.
The performance evaluation should clearly depend on the model objectives (Bennett et al., 2013). The models considered in this study aim to estimate the annual emissions from global wetlands. Therefore, the accuracy and applicability of the model in simulating annual CH4 emissions for different wetland types and continents are very important in a performance evaluation. Several process-based models have been developed in recent decades (Xu et al., 2016). Some models are simple semiempirical models that focus on the biochemical processes of CH4 production, oxidation and emission, e.g., Walter's model (Walter et al., 1996; Walter and Heimann, 2000), CASA (Potter, 1997) and CH4MODwetland (Li et al., 2010). This kind of model requires simple inputs and parameters and is easily extrapolated to a regional scale. Other models are based on more complex land ecosystem models coupled to the CH4 processes module, such as Community Land Model 4 Methane model (CLM4Me), Organising Carbon and Hydrology In Dynamic Ecosystems model (ORCHIDEE), Sheffield Dynamic Global Vegetation Model (SDGVM) and Terrestrial Ecosystem Model (TEM). These models describe complex ecosystem processes and require more inputs and parameters. In this study, we chose CH4MODwetland and TEM to compare the model performance of a simple easy-to-run model and a sophisticated land ecosystem model. Moreover, both models have been validated at the site scale, but no comprehensive accuracy analysis in different continents or for various wetland types has been done before. We collected CH4 flux measurements from 43 wetlands spanning the main wetland types in the world from peer-reviewed literature (Table 1). A set of statistical methods was used to comprehensively evaluate the performance of CH4MODwetland and TEM in different wetland types and on different continents. Finally, we extrapolated both models to estimate the global CH4 emissions from 2000 to 2010.
Table 1Description of observation wetland sites. Observation period (YYYY.MM).
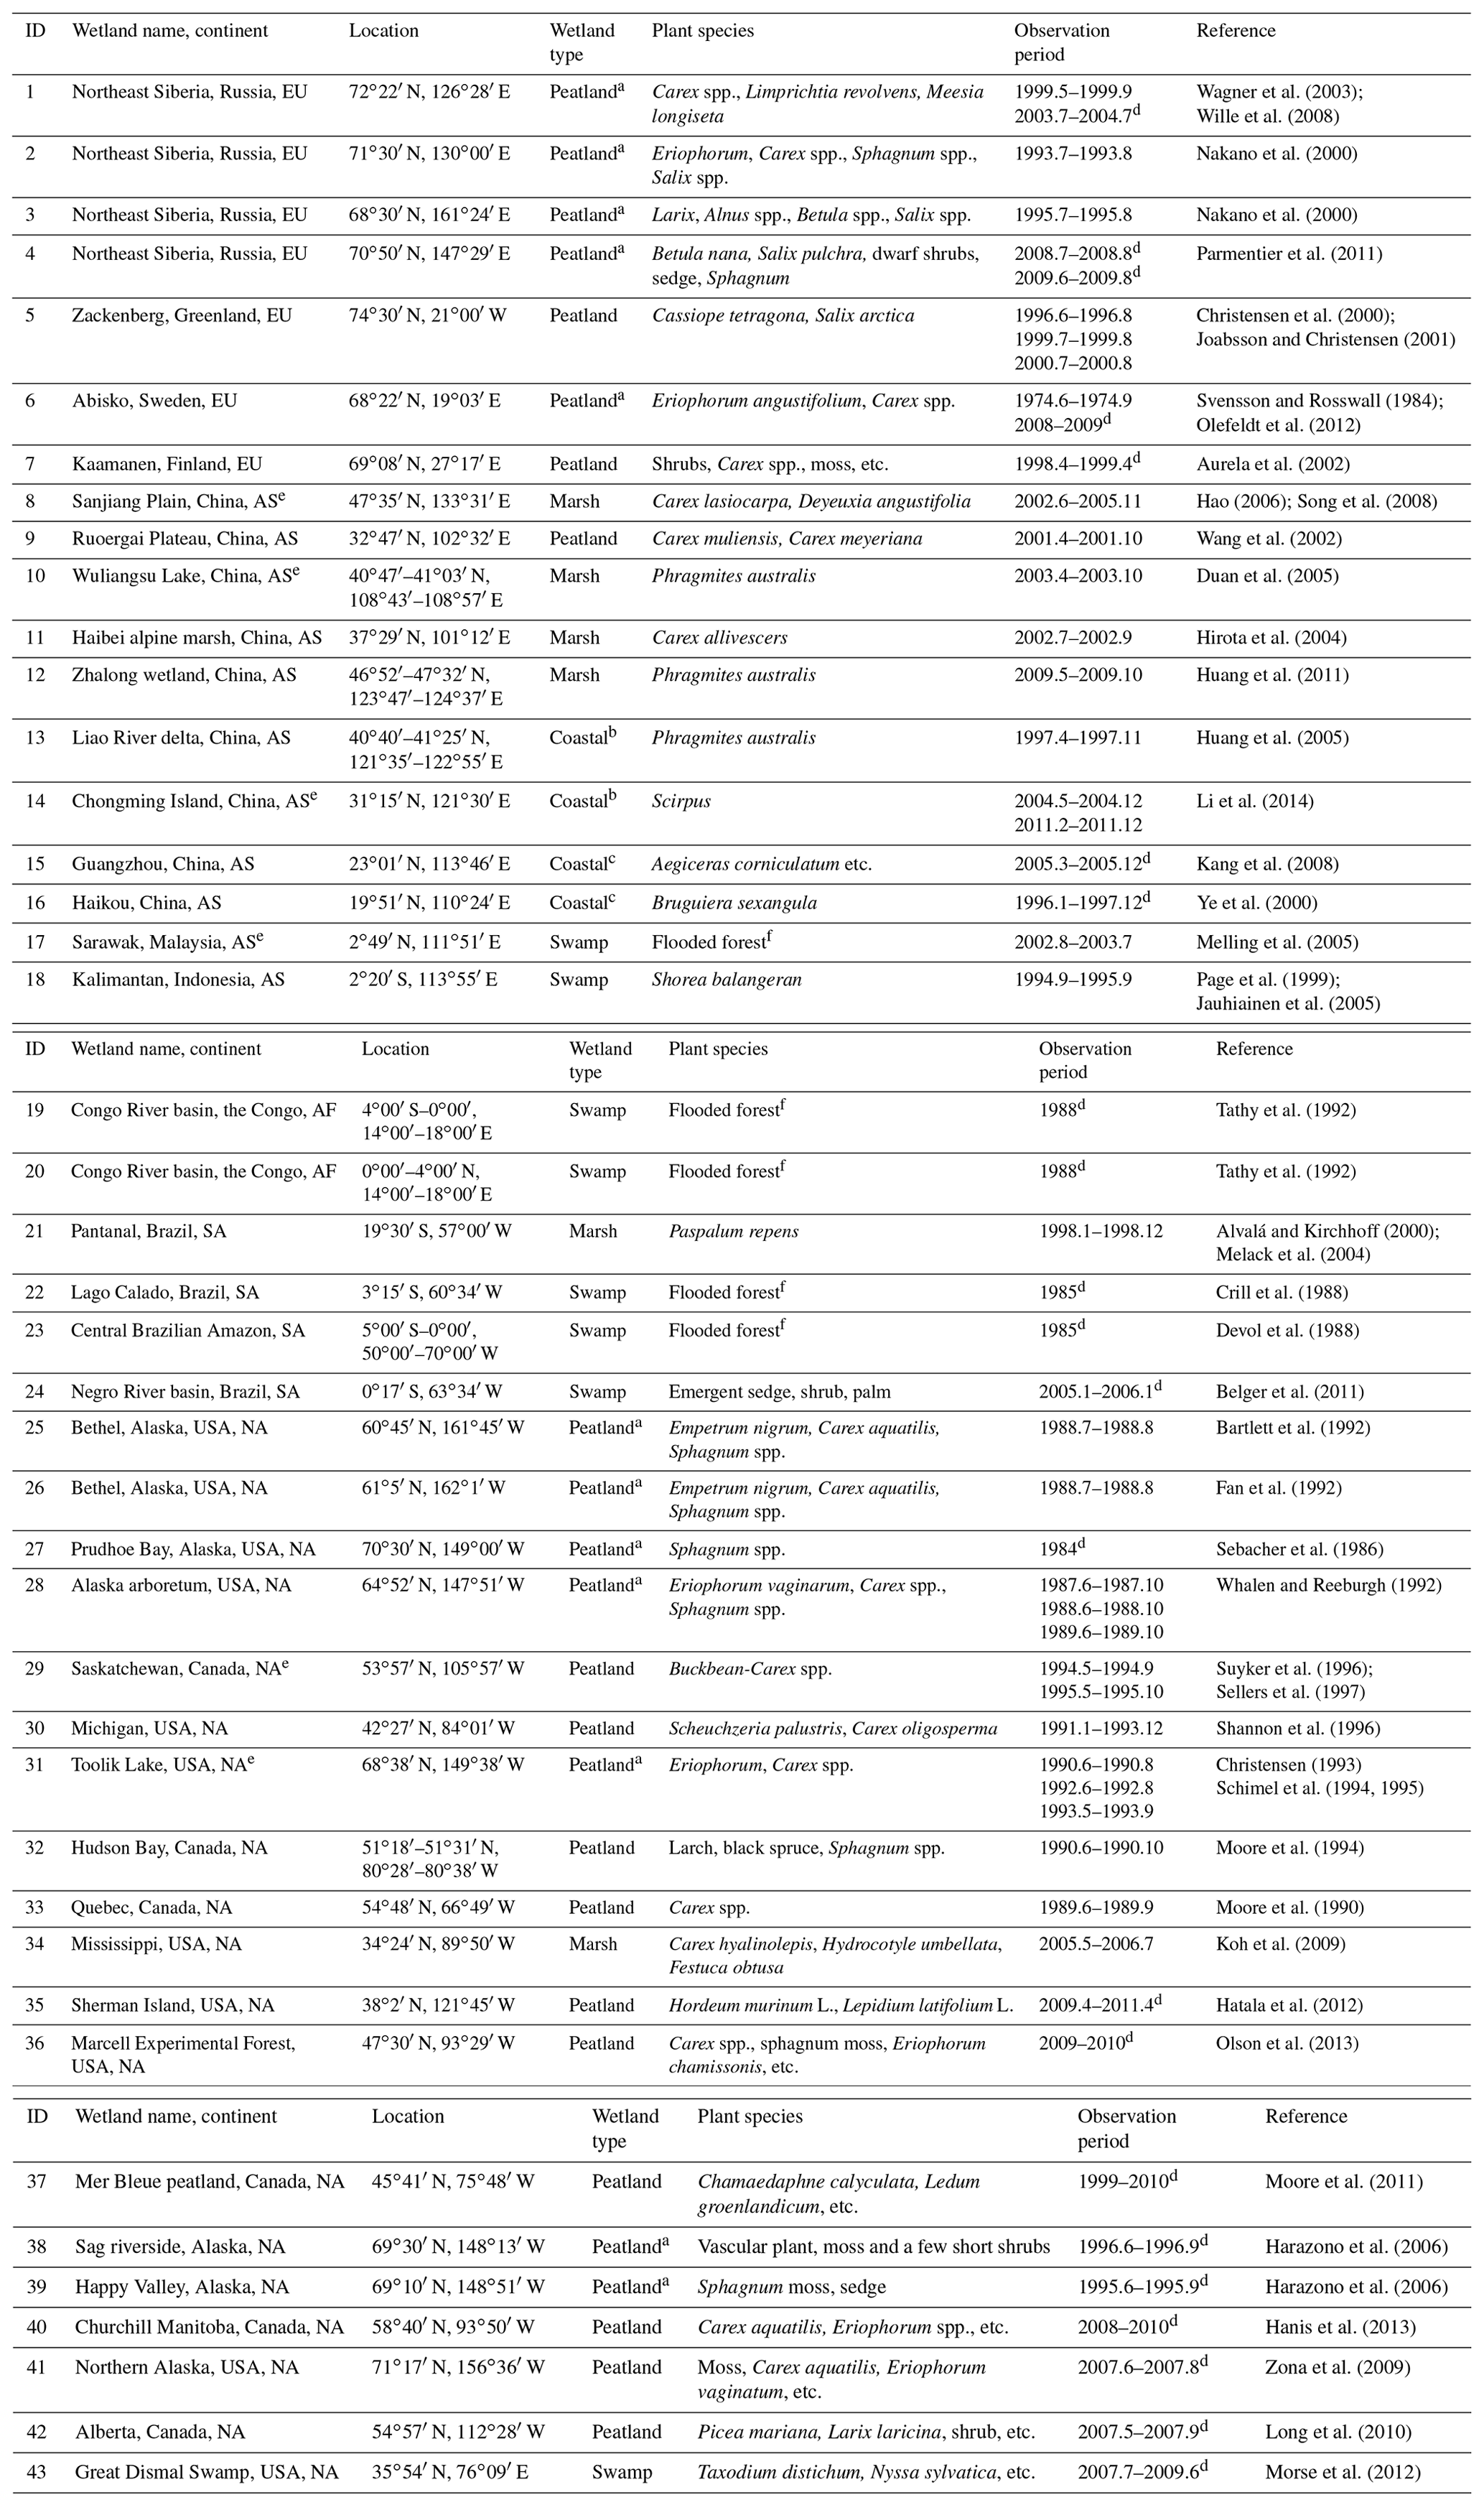
a Tundra.
b Tidal marsh.
c Mangrove.
d We used the reported average yearly CH4 flux of the
experimental year or period from the literature.
e Wetland sites used for calibration.
f These swamp sites do not have plant species
information in the
literature.
2.1 Model overview
2.1.1 CH4MODwetland
The CH4MODwetland model is a process-based biogeophysical model used to simulate the processes of CH4 production, oxidation and emission from natural wetlands (Li et al., 2010). The model was established based on CH4MOD, which is used to predict CH4 emissions from rice paddies (Huang et al., 1997). In CH4MODwetland, we focused on the differences in the supply of methanogenic substrates between natural wetlands and rice paddies. Methanogenic substrates are derived from root exudates, the decomposition of plant litter and soil organic matter. The methane production rates were determined based on the methanogenic substrates and the influence of environmental factors, including soil temperature, soil texture and soil redox potential. Additionally, we incorporated the influence of salinity on CH4 production to improve the model performance for coastal wetlands (Li et al., 2016). Inputs to the CH4MODwetland model include the daily air and soil temperature, water table depth, annual aboveground net primary productivity (ANPP), soil sand fraction, soil organic matter, bulk density, and soil salinity. The outputs are the daily and annual CH4 production and emissions. We used the TOPMODEL hydrological model to simulate the water table depth as the inputs of CH4MODwetland (Bohn et al., 2007; Li et al., 2015, 2019a; Zhu et al., 2013; Beven and Kirkby, 1979).
The main parameters that must be calibrated in CH4MODwetland include the vegetation index (VI), which was used to quantify the different capacities for producing root exudates of the various plant species; the fraction of plant-mediated transport available (Tveg); the fraction of CH4 oxidized during plant-mediated transport (Pox); the proportion of belowground net primary productivity (BNPP) to the total net primary productivity (NPP) (fr); the fraction of nonstructural component in plant litter (FN) (Table S1 in the Supplement); and the empirical constant of the influence of salinity. The model parametrization and main parameters are described in Sect. S1 in the Supplement.
2.1.2 TEM
TEM is another process-based biogeochemical model that couples carbon, nitrogen, water and heat processes in terrestrial ecosystems to simulate ecosystem carbon and nitrogen dynamics (Melillo et al., 1993; Zhuang et al., 2007, 2013). The methane dynamics module was first coupled within TEM by Zhuang et al. (2004) to explicitly simulate the process of methane production (methanogenesis), oxidation (methanotrophy) and transport between the soil and the atmosphere. Methane production is assumed to occur only in saturated zones and is regulated by organic substrate, soil thermal conditions, soil pH, and soil redox potentials; methane oxidation, which occurs in the unsaturated zone, depends on the soil methane and oxygen concentrations, temperature, moisture and redox potential. Methane transport is described by three pathways in TEM: (1) diffusion through the soil profile, (2) plant-aided transport and (3) ebullition. TEM has also been coupled with TOPMODEL (Zhu et al., 2013). The model calibration of the TEM is well documented in Sect. S2 and Table S2.
2.2 Site information and data sources
2.2.1 Site information
We collected data from 43 wetland sites across the world (Table 1). The wetland sites included 6 marsh sites, 25 peatland sites, 8 swamp sites and 4 coastal wetland sites. Among the wetland sites, 7 sites are distributed in Europe (EU), 11 sites are distributed in Asia (AS), 2 sites are distributed in Africa (AF), 4 sites are distributed in South America (SA) and 19 sites are distributed in North America (NA). The observations were from the late 1980s to the 2010s. The observation periods covered either a growing season or a whole year (Table 1). We calculated the total amount of CH4 emissions during the growing season or the whole year as the observed seasonal/annual CH4 emissions. For most of the wetland sites, the total amount of seasonal/annual CH4 emissions during the observation period was calculated by summing the daily observations. Gaps in the CH4 emission measurements were filled by linear interpolation between two adjacent days of observations. For a few wetland sites, the observed seasonal/annual CH4 emissions were directly obtained from the literature. More details about the location, vegetation and observation periods are described in Table 1.
2.2.2 Wetland map
The global wetland distributions of different wetland types were based on the Global Lakes and Wetlands Database (GLWD-3; https://www.worldwildlife.org/publications/global-lakes-and-wetlands-database-lakes-and-wetlands-grid-level-3, last access: 10 October 2019) (Lehner and Döll, 2004) (Fig. 1). According to GLWD-3, the wetland types include (1) lakes, (2) reservoirs, (3) rivers (we combined lakes, reservoirs and rivers as a single wetland type, hereafter referred to as lakes/rivers), (4) freshwater marsh and floodplain (hereafter referred to as marsh), (5) swamp forest and flooded forest (hereafter referred to as swamp), (6) coastal wetland, (7) saline wetland (we combined coastal wetland and saline wetland as a single wetland type, hereafter referred to as coastal wetland), (8) bog, fen and mire (hereafter referred to as peatland), (9) intermittent wetland and (10) no-specific wetland. All of the observed sites (Table 1) are distributed on the wetland map (Fig. 1).
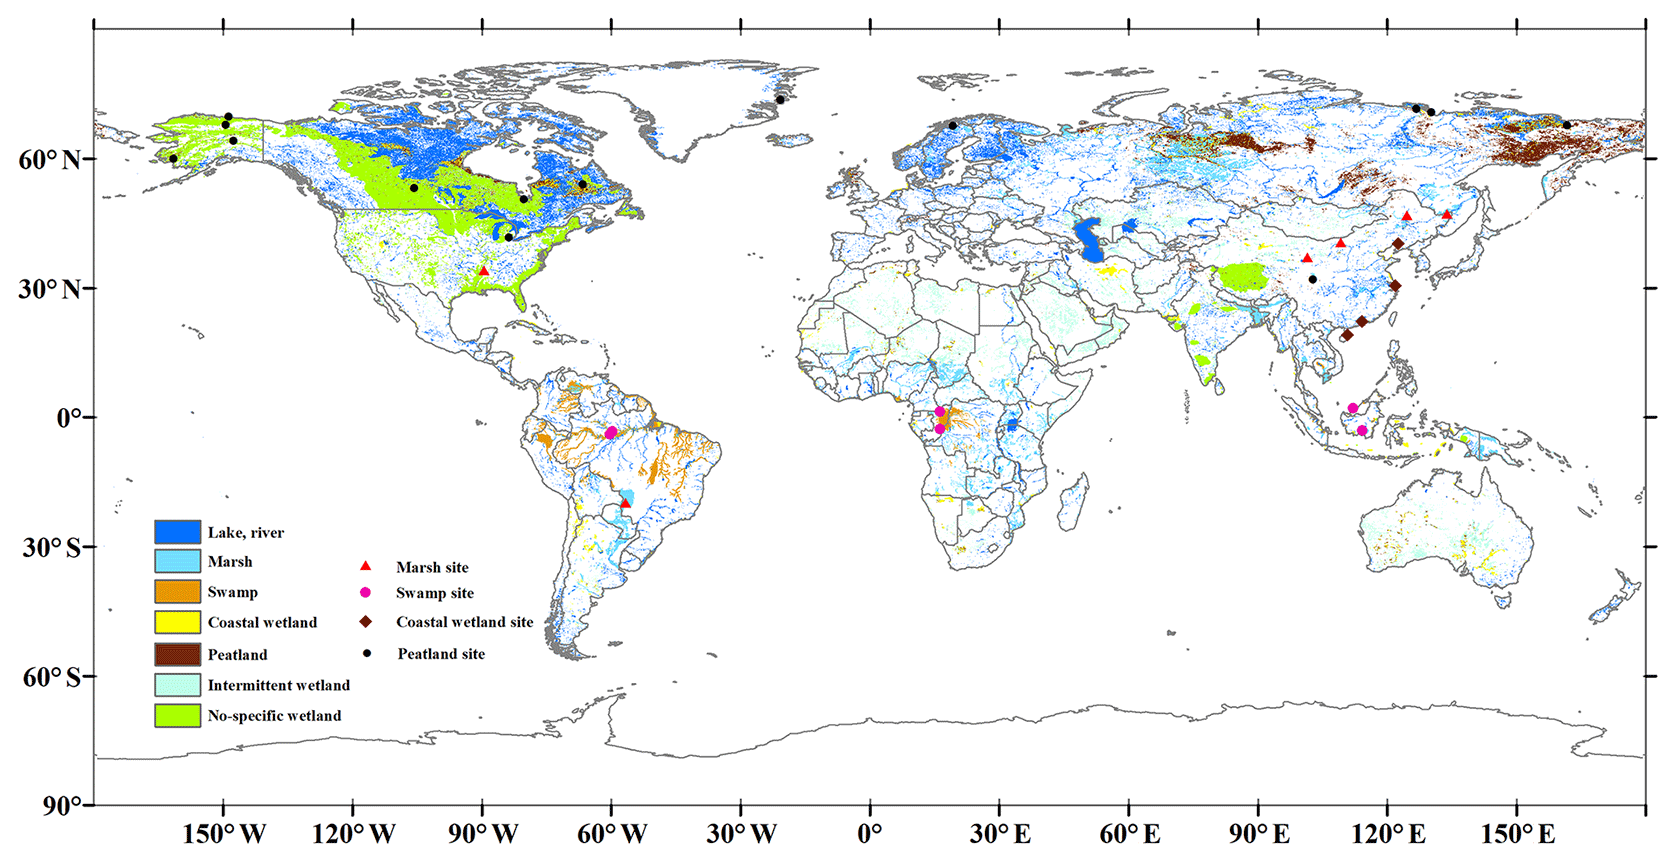
Figure 1Wetland site distribution (Table 1) and global wetland maps of GLWD-3 (Lehner and Döll, 2004).
The global wetland area (excluding rivers) was estimated by the “Global Review of Wetland Resources and Priorities for Wetland Inventory (GRoWI)” as 530–570 Mha (Spiers, 1999). We used an average value, as the wetland area excluded rivers in this study. The global wetland area of rivers was based on GLWD-3. Therefore, we assumed that the global wetland area was 584 Mha, which represented the wetland area for the period from 2000 to 2010. The cartography-based GLWD-3 data provide a global distribution of natural wetlands at a 30 s resolution. Then, we aggregated the merged map up to (latitude × longitude) grids. The wetland area (excluding rivers) in each pixel was adjusted by the ratio of the global wetland area estimated by GRoWI and by GLWD-3.
2.2.3 Driver data
The input climate data for the models include the daily air temperature, precipitation, cloudiness and vapor pressure. The historical daily climate data were developed from the latest monthly datasets of the Climatic Research Unit (CRU TS 3.10) of the University of East Anglia in the United Kingdom (Harris et al., 2014).
The soil properties needed by the CH4MODwetland model include soil texture (percentage of sand in the soil), bulk density, soil organic carbon content, soil temperature and soil moisture. The additional information needed by TEM includes the percentage of silt and clay in the soil, soil pH, and site elevation. The soil texture data were derived from the soil map of the Food and Agriculture Organization (FAO) (FAO, 2012). The soil organic carbon content and the reference bulk density of wetland soils were retrieved from the Harmonized World Soil Database (HWSD) (FAO, 2008) by masking the HWSD with the Global Lakes and Wetlands Database (GLWD) (Lehner and Döll, 2004). The daily soil temperature data were estimated by TEM from spatially interpolated climate data. The daily soil moisture driving CH4MODwetland coupled with TOPMODEL was developed from the monthly dataset (http://www.cpc.ncep.noaa.gov/soilmst/leaky_glb.htm. last access: 10 October 2019) by temporal linear interpolation (Fan and van den Dool, 2004). The soil pH was also derived from the global soil property dataset of the International Geosphere-Biosphere Programme (IGBP) (Carter and Scholes, 2000).
The vegetation map of the IGBP was referenced to specify the vegetation parameters for CH4MODwetland (Table S1) and TEM. The map was derived from the IGBP Data and Information System (DIS) DISCover Database (Belward et al., 1999; Loveland et al., 2000). The 1 km × 1 km DISCover dataset was reclassified into the TEM vegetation classification scheme and then aggregated into grids. The annual ANPP used to drive CH4MODwetland was from the output of TEM.
For CH4MODwetland, a high-resolution topographic wetness index dataset (Marthews et al., 2015) was used to calculate the changes in the water table. Global salinity data were obtained from the World Ocean Atlas 2009 (Antonov et al., 2010). We also used 1 km × 1 km global elevation data derived from the Shuttle Radar Topography Mission (SRTM) (Farr et al., 2007). The above data were resampled to grids to match the resolution of the other input data.
2.3 Model evaluation
We compared the observed seasonal/annual CH4 emissions from the wetland sites (Table 1) and the simulated CH4 emissions at the grid scale for the same period (described in Sect. 2.4). The statistics include the determination coefficient (R2), the root-mean-square error (RMSE), the mean deviation (RMD), the model efficiency (EF) and the coefficient of determination (CD) were used to evaluate model performance on a global scale, a continental scale and for each wetland type. Because of the limited number of sites in Africa and South America, we combined the two continents together.
Two simulations with the same RMSE values may not be considered equivalent, because the distribution of the error among the sources may not be the same (Allen and Raktoe, 1981). We further analyzed the source of the model errors by decomposing it into three components: the mean bias from the modeling procedure (UM), the errors due to regression (UR) and the errors due to random disturbances (UE) (Allen and Raktoe, 1981). The detailed description and the equations used to calculate these statistics are described in Sect. S3.
2.4 Model extrapolation
CH4MODwetland and TEM were used to simulate the CH4 emissions from global wetlands at a spatial resolution of . We established spatially explicit data for climate, soils, vegetation, land use and other environmental inputs at a spatial resolution to facilitate the models at the global scale. Both process-based models were conducted for the period of 1980–2010 in each pixel to simulate the temporal spatial variations in CH4 fluxes. In this study, we focused only on the total CH4 emissions for the period 2000–2010, because we assumed that the wetland map represented the distribution of natural wetlands during this period. The total CH4 emissions from the natural wetlands, excluding the lakes/rivers in each pixel, were calculated as the product of the CH4 fluxes and the gridded wetland area. To make an overall global or continental CH4 emissions assessment, we evaluated the CH4 emissions from lakes/rivers using the IPCC Tier 1 method based on the CH4 emissions factor (IPCC, 1996) and the area of lakes/rivers in each pixel.
We aggregated the gridded values and obtained the annual mean CH4 emissions from each wetland type and each continent by CH4MODwetland combined with the IPCC Tier1 method (hereafter referred to as Method A) and TEM combined with the IPCC Tier1 method (hereafter referred to as Method B). In addition to the two global assessments Method A and Method B, we made two other assessments of global CH4 emissions by choosing the more accurate model (Method C and Method D). Based on the model performance evaluation (Sect. 2.3), we found a more accurate model for each wetland type and each continent. In the Method C approach, we chose the CH4 emissions from each continent simulated by the more accurate model. In Oceania, we used the average simulated result by CH4MODwetland and the TEM, because there was no wetland site on this continent (Table 1). We summed the CH4 emissions from all continents and made an assessment of the global CH4 emissions. In the Method D approach, we chose the CH4 emissions from marsh, peatland, swamp and coastal wetlands simulated by the more accurate model. The CH4 emissions are from intermittent wetlands and nonspecific wetlands (no-specific wetlands), which were used as the average result by CH4MODwetland and TEM. The CH4 emissions from lakes/rivers were based on the IPCC Tier 1 method. We summed the CH4 emissions from all wetland types and assessed the global CH4 emissions.
3.1 Model evaluation
3.1.1 Model evaluation for global wetland sites
Figure 2 shows the correlation of the modeled versus observed total amount of seasonal/annual CH4 emissions by CH4MODwetland (Fig. 2a) and the TEM (Fig. 2b). The regression of the observed versus computed total seasonal/annual CH4 emissions by CH4MODwetland (Fig. 2a) resulted in an R2 of 0.81, with a slope of 1.17 and an intercept of −1.93 g m−2 (n=58, p<0.001). The regression of the observed versus computed total seasonal/annual CH4 emissions by TEM (Fig. 2b) resulted in an R2 of 0.68, with a slope of 0.74 and an intercept of 4.77 g m−2 (n=58, p<0.001). These results indicated that the variations in the CH4 emissions between sites and in different years could be delineated by both process-based models.
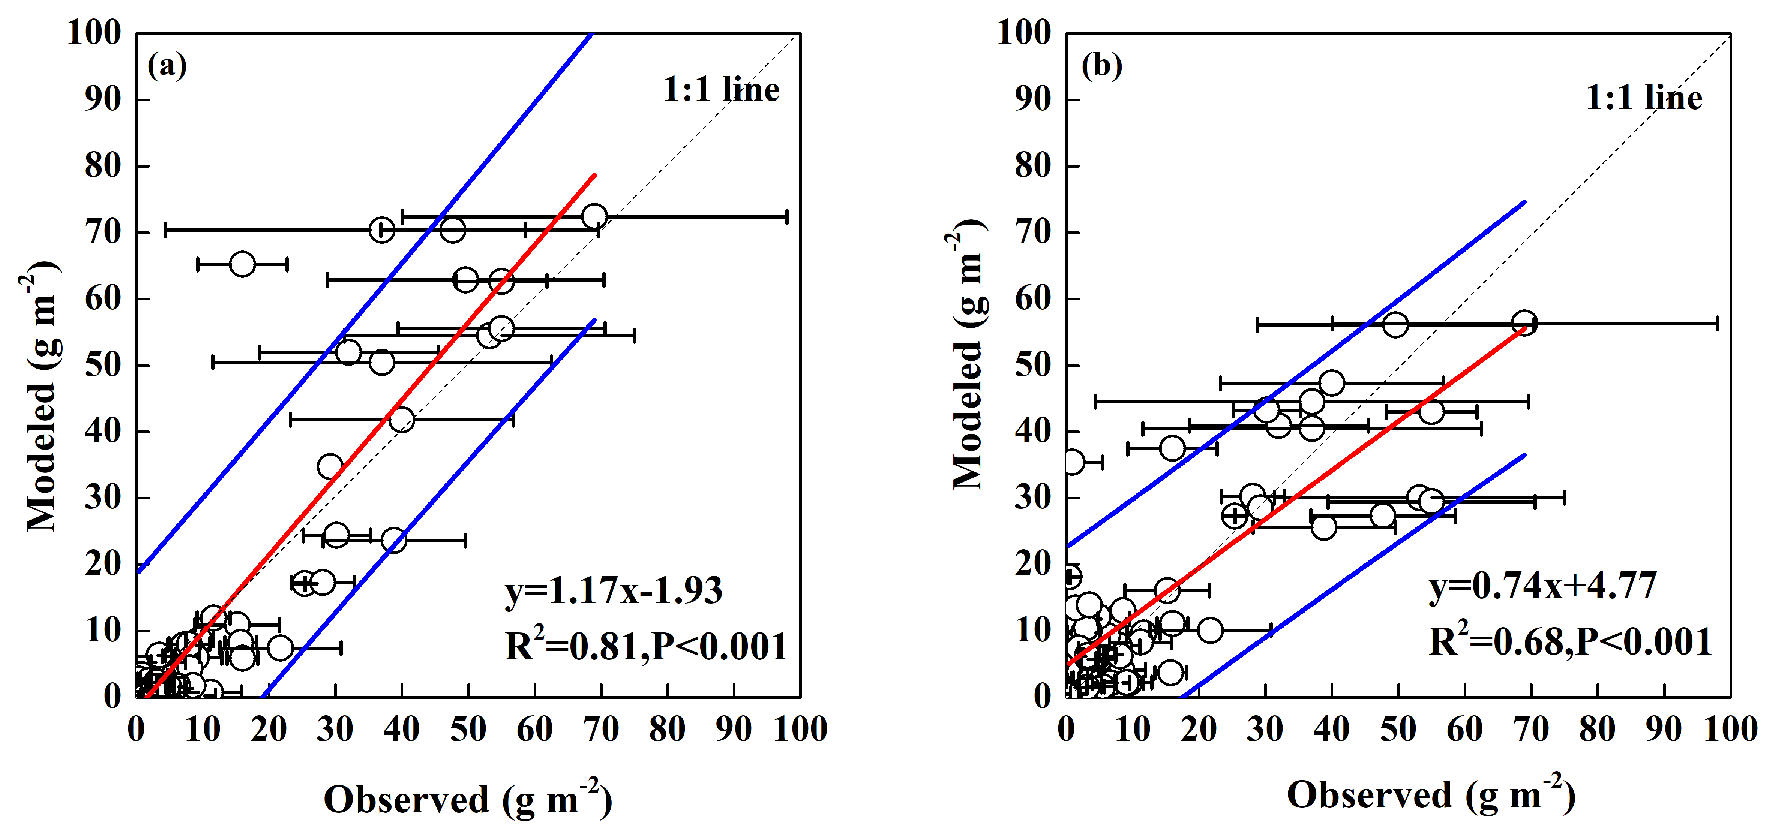
Figure 2Regression of simulated against observed total amount of seasonal/annual CH4 emissions from global wetland sites by CH4MODwetland (a) and TEM (b). The horizontal bars are the standard errors from the sampling replicates at the wetland site. The red line is the regression line of simulated vs. observed between modeled and observed values. The blue line is the prediction correspondence. The dashed line is the 1 : 1 line.
Table 2Model performance for CH4MODwetland and TEM for different continents and wetland types.
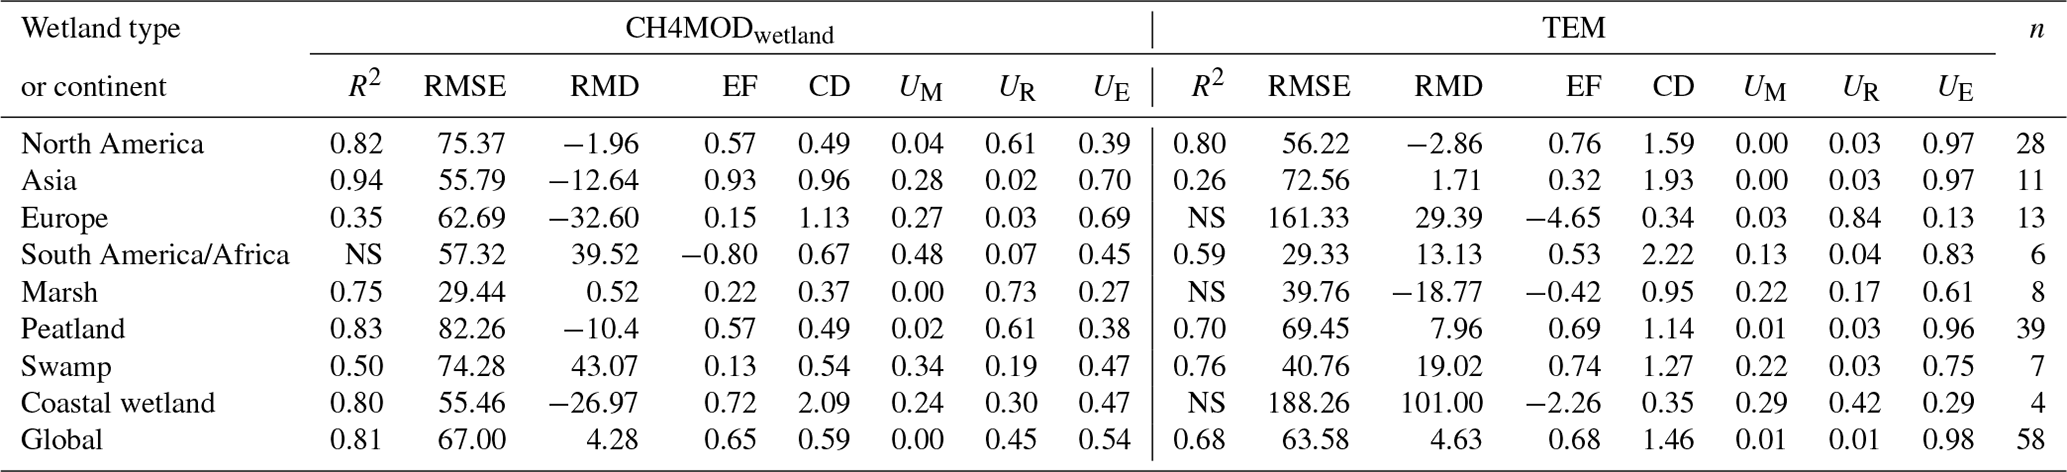
NS represents no significant correlation.
The statistics of the model performance of seasonal/annual CH4 emissions (Table 2) indicated that both process-based models had the capability to simulate seasonal/annual CH4 emissions from natural wetlands on a global scale (EF =0.65 for CH4MODwetland and EF =0.68 for TEM). However, a discrepancy still existed between the simulated and observed seasonal/annual CH4 emissions (RMSE =67.00 % for CH4MODwetland and RMSE =63.58 % for TEM). For CH4MODwetland, the source of the errors was mainly from the regression error and random error, while for TEM the errors were mainly due to random disturbances (Table 2). Both models slightly overestimated the seasonal/annual CH4 emissions on a global scale, with RMD values of ∼4 % (Table 2).
3.1.2 Model evaluation for different continents
We further analyzed the model predictions by CH4MODwetland and TEM among different continents (Fig. 3, Table 2). There was a good correlation between the simulated seasonal/annual CH4 emissions and the observed values on most of the continents by the two models. The R2 varied between 0.35 (Fig. 3e) and 0.94 (Fig. 3c) for CH4MODwetland and between 0.26 (Fig. 3d) and 0.80 (Fig. 3h) for TEM. The CH4MODwetland model yielded more accurate predictions in Asia and North America, with EFs of 0.93 and 0.57, respectively (Fig. 3b and a, Table 2), than in South America and Africa (EF <0 in Table 2) (Fig. 3g). TEM yielded more accurate predictions in North America and South America/Africa than CH4MODwetland, with EF values of 0.76 and 0.53, but performed poorly in Europe (EF <0 in Table 2). CH4MODwetland underestimated the observed emissions (RMD %) in Asia and Europe (RMD %) (Table 2). TEM overestimated the CH4 emissions in South America/Africa (RMD =15.31 %) and slightly underestimated the CH4 emissions in North America (RMD %) (Table 1). Random error was the main contributor to the model errors in Asia and Europe in CH4MODwetland and in Asia, North America and South America/Africa in TEM (Table 2). However, the regression error contributed most to the model errors in North America in CH4MODwetland (Table 2).
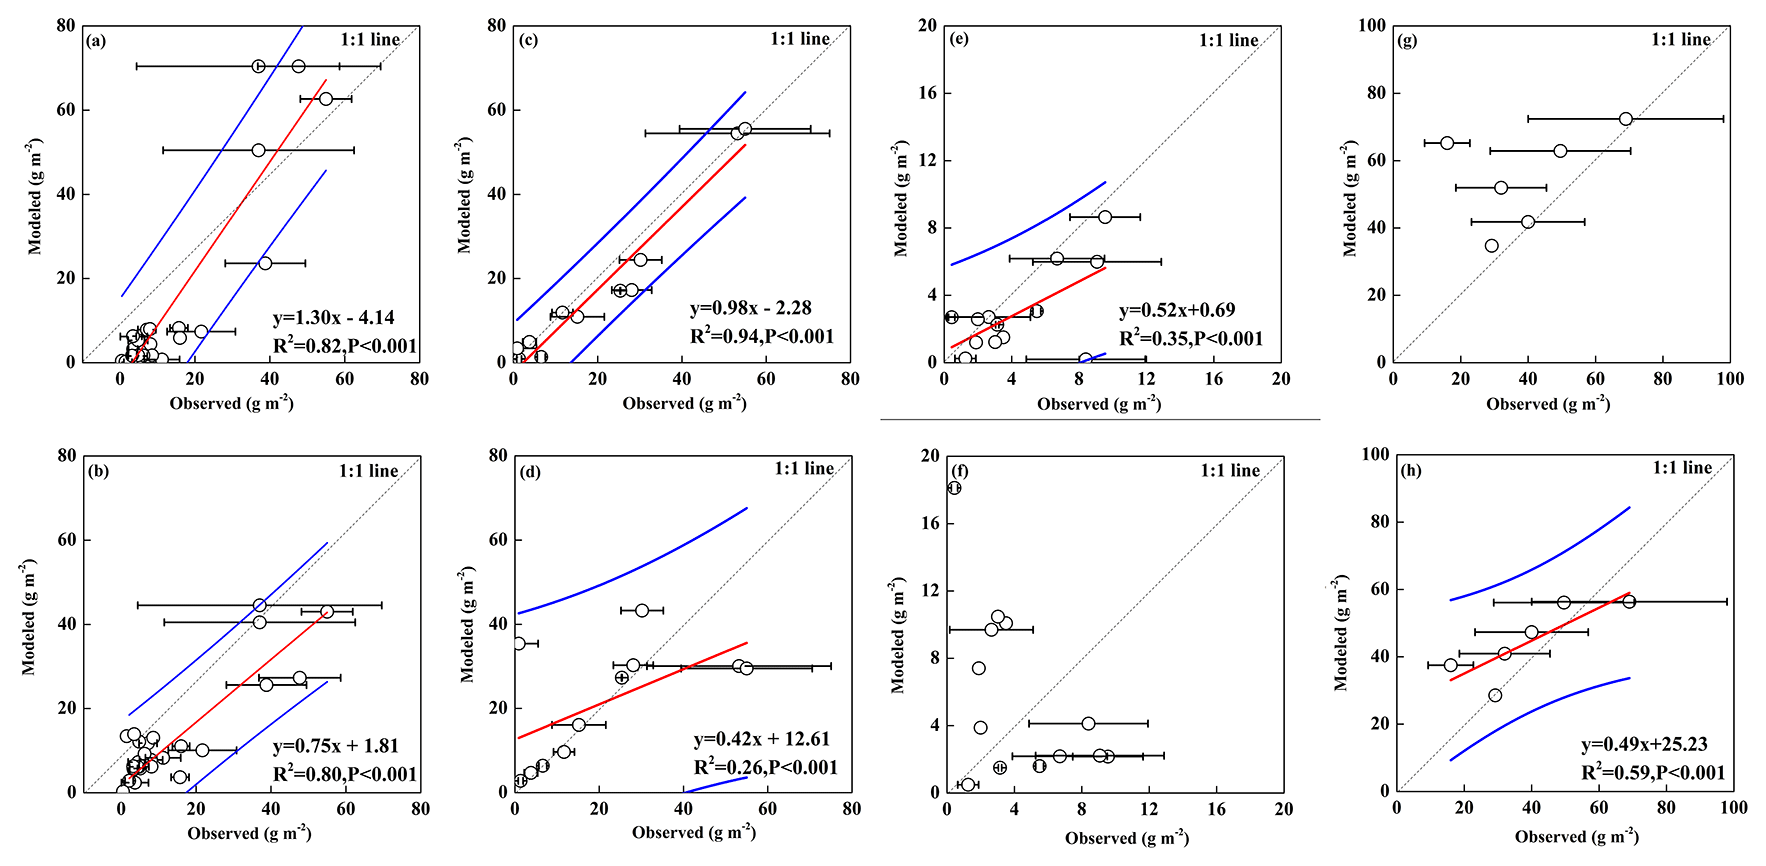
Figure 3Regression of simulated against observed total amount of seasonal/annual CH4 emissions from North American wetland sites by CH4MODwetland (a) and TEM (b), from Asian wetland sites by CH4MODwetland (c) and TEM (d), from European wetland sites by CH4MODwetland (e) and TEM (f), and from South American and African wetland sites by CH4MODwetland (g) and TEM (h). The horizontal bars are the standard errors from the sampling replicates at the wetland site. The blue line is the prediction correspondence. The dashed line is the 1 : 1 line.
3.1.3 Model evaluation for different wetland types
Figure 4 shows the regressions of the simulated values against the observed total amount of seasonal/annual CH4 emissions from the different wetland types. Regression analysis indicated that both models showed good performance in modeling seasonal/annual CH4 emissions from the peatland sites (Fig. 4c and d). TEM showed a better model efficiency and a lower RMSE and RMD than the CH4MODwetland (Table 2) for peatland. For the other wetland types, CH4MODwetland showed good performance in simulating the seasonal/annual CH4 emissions from coastal wetlands (EF =0.72), followed by marshes (EF =0.22) and swamps (EF =0.13) (Table 2). TEM showed poor performance for the marsh sites (EF ) and coastal wetlands (EF ) (Table 2); however, it showed good performance for the swamp sites (EF =0.74). There was no significant correlation (p>0.05) between the modeled and observed seasonal/annual CH4 emissions from the marsh sites (Fig. 4b) and coastal wetland sites (Fig. 4h).
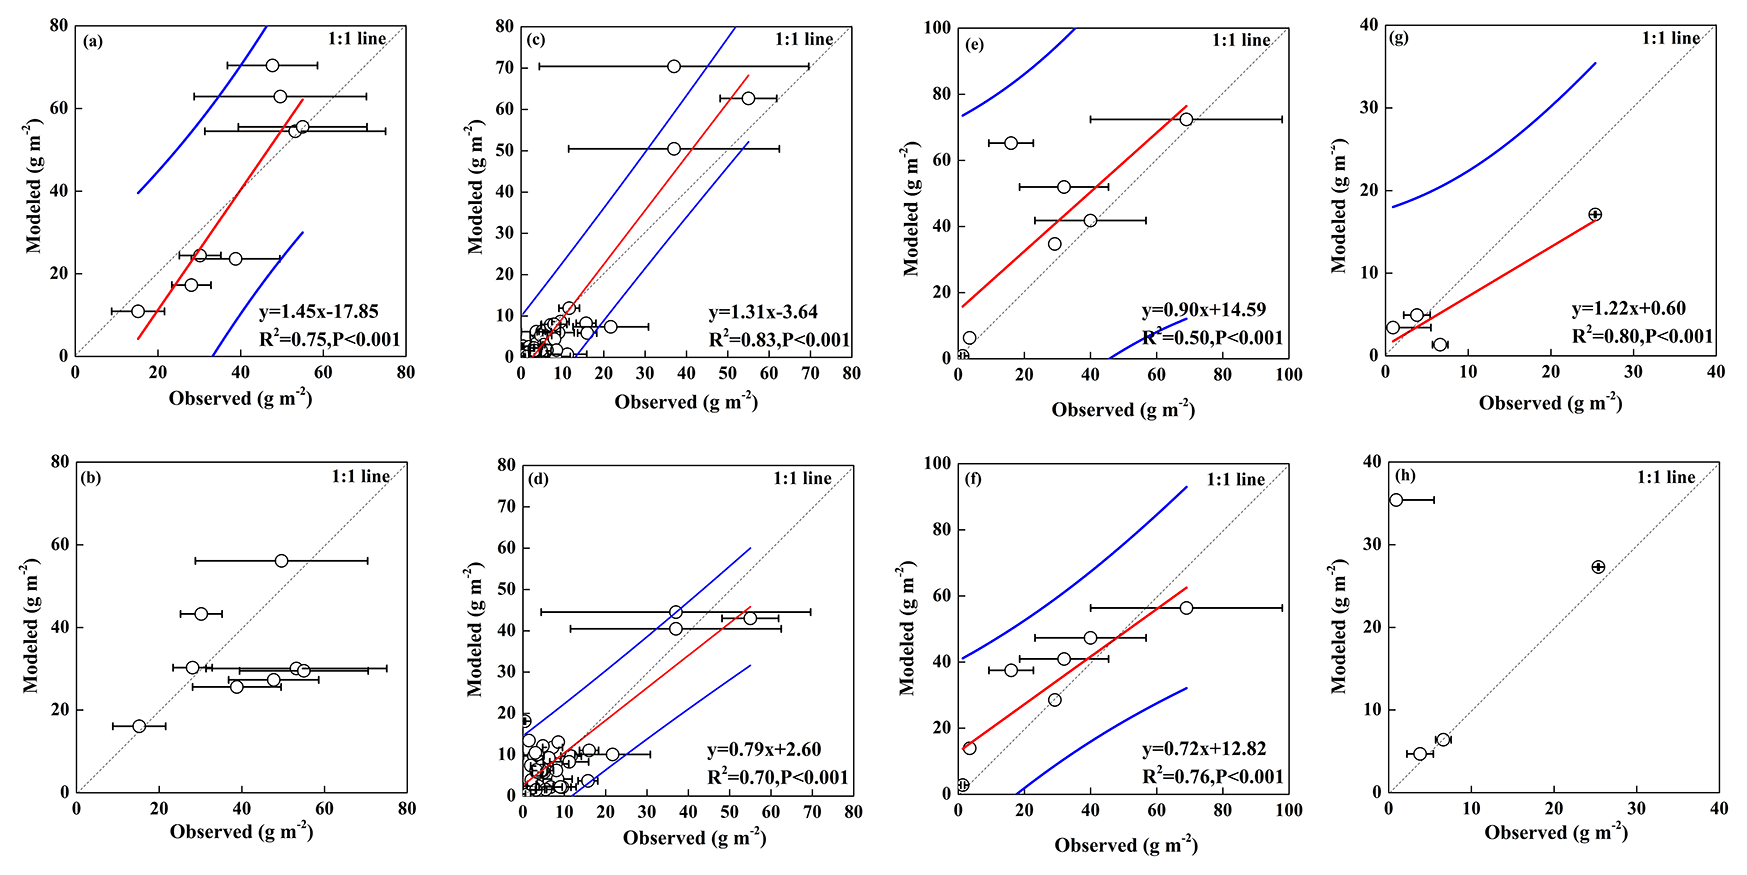
Figure 4Regressions of simulated against observed total amount of seasonal/annual CH4 emissions from marsh sites by CH4MODwetland (a) and TEM (b), from peatland sites by CH4MODwetland (c) and the TEM (d), from swamp sites by CH4MODwetland (e) and TEM (f), and from coastal wetland sites by CH4MODwetland (g) and TEM (h). The horizontal bars are the standard errors from the sampling replicates at the wetland site. The blue line is the prediction correspondence. The dashed line is the 1 : 1 line.
The errors by CH4MODwetland were mainly due to the regression error for marsh and peatland (Table 2). For coastal wetlands, the model bias contributed 24 %, the regression error contributed 30 %, and the random error contributed 47 % to the model errors (Table 2). The errors by the TEM were mainly due to the random error in peatland and swamps (Table 2).
3.2 Global CH4 emissions from natural wetlands
3.2.1 Spatial pattern of global CH4 emissions
The distribution of the simulated annual mean CH4 fluxes and total CH4 emissions for the period 2000–2010 showed similar patterns in CH4MODwetland and TEM (Fig. 5). The simulated latitudinal contributions of CH4 fluxes were consistent between the two models (Sect. S4, Fig. 5a and b). Large emissions were found in South America, southern Africa, and near the border of Canada and the United States (Fig. 5c and d). The latitudinal sums of CH4 emissions indicated that the strongest contribution came from the tropical zone (Fig. 5c and 5d). The latitudinal band of 10–0∘ S contributed 22.77 and 23.23 Tg yr−1 CH4 in CH4MODwetland and TEM, which accounted for 22 % and 18 % of the global emissions, respectively. A secondary large peak was simulated in the 40–50∘ N latitudinal band, with values of 14.64 and 16.66 Tg yr−1 CH4 according to CH4MODwetland and TEM, respectively. Generally, both models simulated a common decline in CH4 emissions from lower latitudes to higher latitudes (Fig. 5c and d). The largest peak in CH4 emissions was modeled in the 60–50∘ W meridional band, with values of 11.63 Tg yr−1 in CH4MODwetland (Fig. 5c) and 13.83 Tg yr−1 in TEM (Fig. 5d). This peak corresponded to the longitudes of the Amazon in South America. Both models simulated secondary peaks in the 30–40∘ E meridional band (Fig. 5c and d), which corresponded to the longitudes of the Congo in Africa.
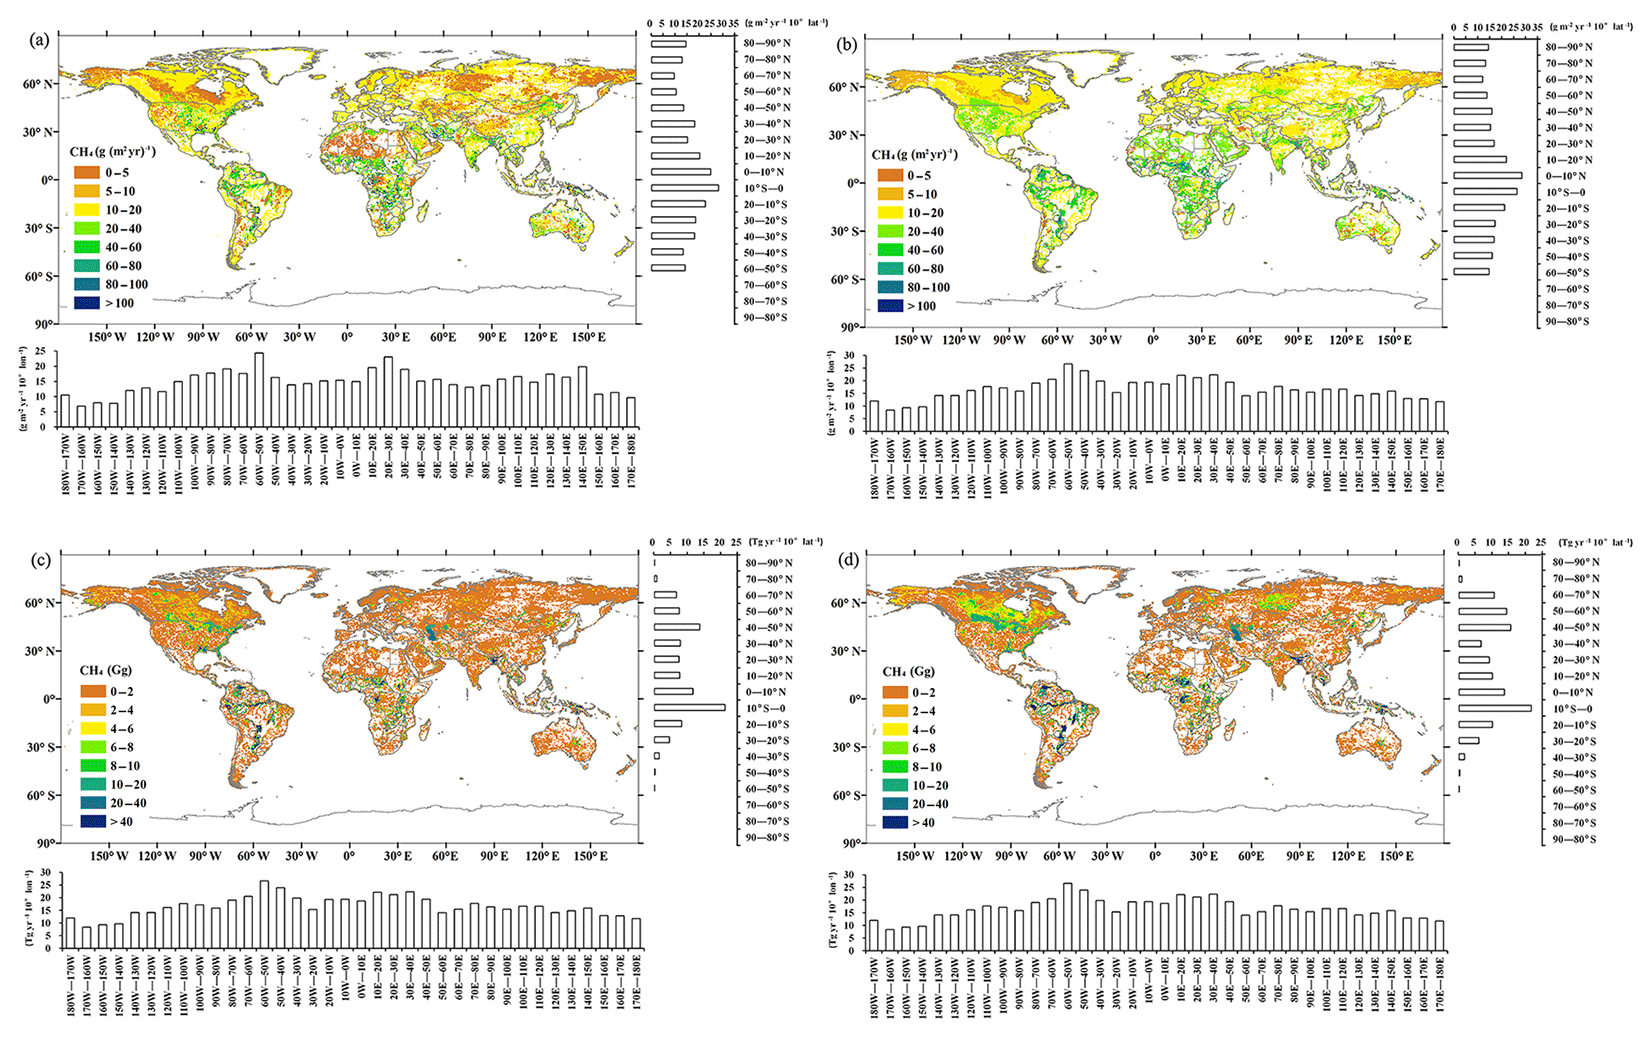
Figure 5Spatial pattern of annual mean CH4 fluxes for 2000–2010, with latitudinal and longitudinal distributions of annual mean CH4 fluxes by CH4MODwetland (a) and TEM (b). Spatial pattern of annual mean CH4 emissions for 2000–2010, with latitudinal and longitudinal distributions of annual mean CH4 emissions by CH4MODwetland (c) and TEM (d). The CH4 fluxes and emissions are aggregated in steps of 10∘.
3.2.2 CH4 emissions from different continents and wetland types
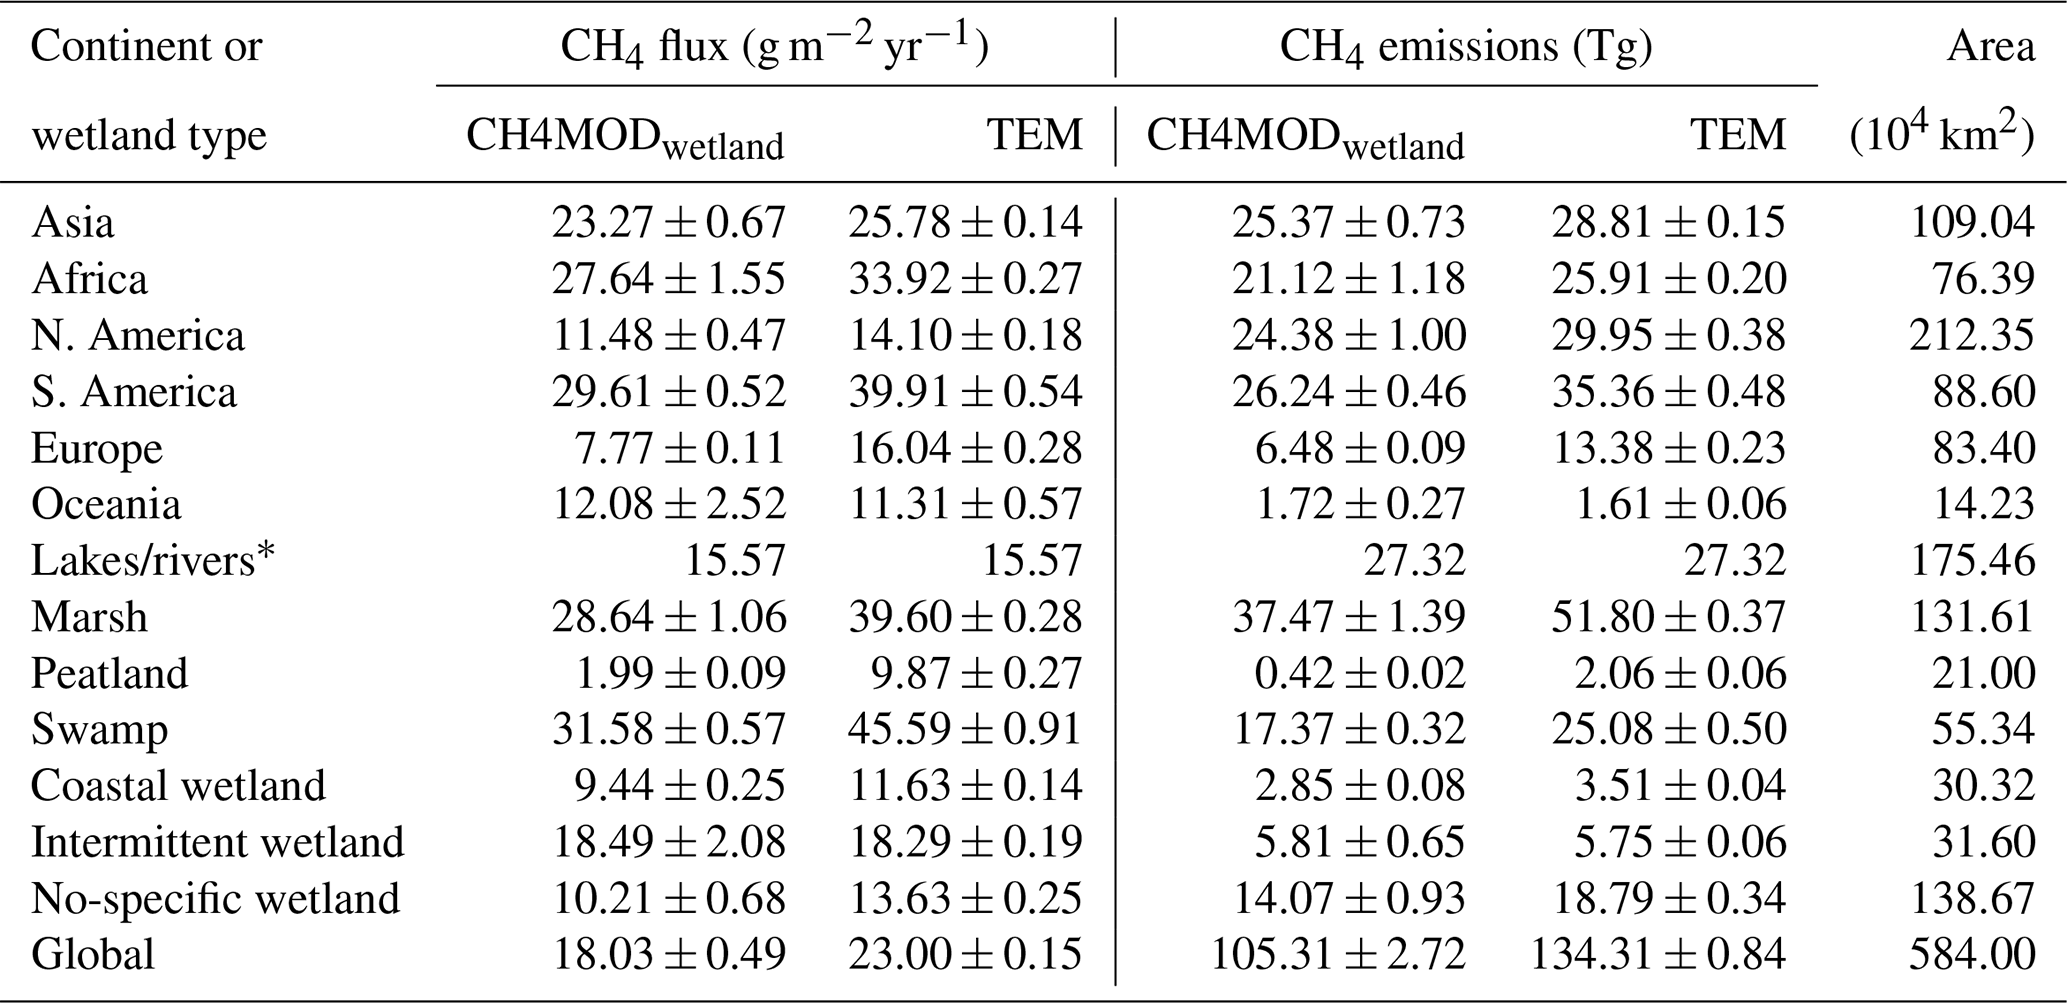
Table 3 provides an overview of the CH4 emissions from different continents and wetland types simulated by CH4MODwetland and TEM. A comparison of simulated CH4 fluxes from different continents by CH4MODwetland and TEM showed that the three highest fluxes were modeled in South America, Africa and Asia (Table 3). TEM simulated higher CH4 fluxes in Europe than in North America, but the CH4MODwetland simulations showed the opposite. For Oceania, the two models simulated similar fluxes.
Table 3CH4 simulations by CH4MODwetland and TEM for different continents and wetland types. All units are Tg CH4 yr−1 ±1σ, where the standard deviation represents the interannual variation in the model estimates.
∗ The IPCC Tier 1 method was used to estimate the CH4 emissions from lakes and rivers. The CH4 emission factor was from IPCC (1996).
Both models simulated the same sequence of CH4 fluxes: swamp, marsh, intermittent wetland, no-specific wetland, coastal wetland and peatland (Table 3). The simulated annual mean CH4 fluxes from intermittent wetlands were almost equivalent in both models. For other wetland types, TEM simulated higher CH4 fluxes than the CH4MODwetland model (Table 3). Both models simulated peak emissions in summer and lower emissions in winter for all wetland types except swamps (Fig. S1). Since large areas of swamps are distributed in the Southern Hemisphere (Fig. 1), higher and lower CH4 emissions were simulated during March to May and June to August, respectively (Fig. S1).
The global CH4 emissions simulated by TEM were 29 Tg yr−1 higher than those simulated by CH4MODwetland (Table 3). This difference depended on the differences in the CH4 fluxes and on the wetland area. The simulated results showed that half of this difference was attributed to marshes. South America contributed 30 % to this difference, because the simulated CH4 fluxes differed greatly between TEM and CH4MODwetland (Table 3).
The two models simulated similar spatial distributions of the CH4 emissions among different wetland types and continents (Table 3). Marshes emit higher CH4 fluxes and have the largest area. Thus, marshes were the greatest contributor to global CH4 emissions and contributed 36 %–39 % to global CH4 emissions (Table 3). Lakes/rivers and swamps were the second and third contributors, respectively (Table 3). The CH4 emissions from peatlands, coastal wetlands, intermittent wetlands and no-specific wetlands accounted for only approximately 20 % of the global emissions (Table 3).
Although North America accounted for 36 % of the global wetland area, it contributed only 22 %–23 % to global emissions (Table 3). In contrast, the wetland area in South America accounted for 15 % of the global area and contributed 25 %–26 % to global CH4 emissions. Asia and Africa also accounted for approximately 20 % of global emissions. The lowest area and emissions were found in Oceania (Table 3).
3.2.3 Global CH4 estimations
The global CH4 emissions for the period 2000–2010 were estimated to be 105.31 ± 2.72 Tg yr−1 by Method A and 134.31 ± 0.84 Tg yr−1 by Method B. Based on the evaluation of model performance (Table 2), CH4MODwetland yielded the most accurate predictions for Asia and Europe, and TEM yielded the most accurate predictions for North America and South America/Africa. Using this combination, the global CH4 emissions were estimated to be 124.74 ± 1.22 Tg by Method C. Similarly, in Method D, CH4MODwetland was used for simulations in marshes and coastal wetlands, and TEM was used for simulations in peatlands and swamps; as a result, the global wetland CH4 emissions were estimated to be 116.99 ± 2.23 Tg.
4.1 Generality of CH4MODwetland and TEM
A lack of correspondence between the model output and observations could be partly due to the observed flux data, e.g., the inevitable gap-filling of missing data points to determine the seasonal/annual total emissions (Kramer et al., 2002). The results showed differences between the observed and simulated CH4 emissions by both CH4MODwetland and TEM on a global scale (Fig. 2) and a continental scale (Fig. 3) and for different wetland types (Fig. 4). The reliability of the observed flux data is not under discussion in this study. We evaluated only the model accuracy and applicability across different wetland types and continents.
On a global scale, both models fulfilled the criteria of sufficient accuracy for the ability to predict CH4 fluxes (Table 2). However, this fuzzy analysis may miss some real model performance. For the model applicability on different continents, CH4MODwetland performed best in Asia, followed by North America and Europe. It performed poorly in South America/Africa, where swamps are more common (Table 2). TEM performed best in North America, followed by South America/Africa and Asia. It performed poorly in Europe (Table 2). Each continent has different main wetland types; thus, the model applicability for different continents depended on its applicability for different types. CH4MODwetland is suitable for marshes, peatlands and coastal wetlands, but it cannot be applied in swamps (Table 2). This limitation may be because in CH4MODwetland only a semiempirical logistic model is used to simulate plant growth (Li et al., 2010). This characteristic may induce large uncertainties in simulating the growth of forests in swamps (Table 1). However, TEM uses the carbon and nitrogen dynamics module (CNDM) to describe the effects of photosynthesis, respiration, decomposition and nutrient cycling on NPP (Melillo et al., 1993). Compared with CH4MODwetland, TEM performed well in simulating NPP in various vegetation types (Melillo et al., 1993). According to the model evaluation, TEM was suitable for swamps and peatlands but had large uncertainties in marshes and coastal wetlands (Table 2). This pattern may be because TEM focuses on two major wetland types: boreal tundra and forest wetland (Zhuang et al., 2004). The biochemical processes in TEM may be suitable for peatlands (tundra) and swamps (forest wetland) but not suitable for marshes. For coastal wetlands, TEM did not consider the inhibition of salinity on CH4 production (Poffenbarger et al., 2011; Bartlett et al., 1987) and greatly overestimated the CH4 fluxes (Table 2). CH4MODwetland introduced the influence of salinity on CH4 production and had good performance for coastal wetlands (Table 2).
4.2 Reducing uncertainties in global estimations
The estimates of global wetland CH4 emissions had large ranges in previous studies (Zhu et al., 2015). The estimates by process-based models ranged from 92 Tg yr−1 (Cao et al., 1996) to 297 Tg yr−1 (Gedney et al., 2004) during the period of 1980–2012. Recently, an ensemble of process-based models driven by the same climatic data has commonly been used to estimate global wetland CH4 emissions (Melton et al., 2013; Kirschke et al., 2013; Poulter et al., 2017; Saunois et al., 2016). However, the uncertainties in the model mean estimation range from 12 % (Poulter et al., 2017) to 40 % (Melton et al., 2013). The uncertainty mainly comes from the wetland distribution and model structure and parameters (Saunois et al., 2016). Estimating accurate wetland extent and its seasonal and annual variations is a major challenge in present studies. The global estimations of wetland area ranged from 4.3 to 12.9 Mha during the period of 1990 to 2005 (Melton et al., 2013). The wetland extent of 9.2 Mha from the GLWD excluded water bodies, and this value was ∼40 % higher than the wetland area used in this study. That is, this difference was the main reason for the lower global estimations determined in this study than those reported in previous works (Zhu et al., 2015; Melton et al., 2013; Poulter et al., 2017; Saunois et al., 2016). Improving the accuracy of wetland extent and temporal variations is important in reducing uncertainties in global wetland CH4 estimations.
In addition to wetland area, the model structure and parameters accounted for ∼70 % of the total uncertainties (Saunois et al., 2016). The results of the accuracy analysis showed that for CH4MODwetland regression bias accounted for 61 % of the model errors in peatland and mean bias accounted for 22 % of the RMSE in swamp; for TEM, mean bias and regression bias accounted for 29 % and 42 %, respectively, of the model errors in coastal wetland (Table 2). This result indicated that there were still uncertainties in the modeling procedure, e.g., in the model mechanism or in parameterization (Zhang et al., 2017; Allen and Raktoe, 1981). In the existing process-based models, which are not limited to CH4MODwetland and TEM, some important procedures should be focused on to reduce the bias due to the model mechanism. For example, the mechanism of the freeze–thaw cycle is important in process-based models (Wei and Wang, 2017) because of the large contribution of CH4 released during the nongrowing season in some frozen regions (Friborg et al., 1997; Huttunen et al., 2003; Mastepanov et al., 2008; Zona et al., 2016). In addition, quantifying CH4 ebullition is important but difficult due to the uncertainty in estimates of CH4 emissions from peatlands (Stanley et al., 2019). Moreover, although the importance of plants in CH4 biogeochemical processes has been reported in many studies, better modeling and characterization of plant community structure is needed (Bridgham et al., 2013). Finally, most of the present process-based models do not have the ability to simulate CH4 exchange from water bodies, such as lakes, rivers and reservoirs, although such water bodies contribute significantly to the global budget (Deemer et al., 2016). The use of the IPCC Tier method inevitably induces large uncertainties in the global estimates. The above mechanisms should be incorporated into existing process-based models to reduce the uncertainties in the current assessment.
The observational data that are related to processes of and controls on CH4 production, consumption and transport also limit the model calibration and validation. The flux data of 43 wetland sites used for model performance in this study are quite limited and do not represent all climatic, soil, hydrologic and vegetation conditions across global natural wetlands (Table 1). The observations in this study used both the chamber method and the eddy covariance method (Aubinet et al., 2012), which are widely used for CH4 observations (Table 1). There are differences in measuring CH4 fluxes between the two methods (Chaichana et al., 2018). The eddy covariance method may underestimate the fluxes (Twine et al., 2000; Sachs et al., 2010), while the chamber method may overestimate the fluxes (Werle and Kormann, 2001). These differences may introduce uncertainties to model calibration and validation. Furthermore, both process-based models were evaluated on an annual basis rather than on a daily scale. The validation of seasonal variation was not performed in this study, partly because we cannot obtain the daily step data for some of the sites. Fine temporal validation against more flux datasets, especially fluxes by eddy covariance experiments, and intermediate variables that control the CH4 process are necessary in future studies (Wei and Wang, 2017).
Two process-based models, CH4MODwetland and TEM, were used to simulate annual CH4 emissions from different wetland types and continents, and their performances were evaluated. Model validation showed that both models could simulate variations between different wetland sites and years. The statistical analysis of model performance showed that CH4MODwetland was capable of simulating CH4 emissions from marshes, peatlands, swamps and coastal wetlands, while TEM was capable of simulating CH4 emissions from peatlands and swamps (model efficiency >0). CH4MODwetland performed well in Asia, Europe and North America, while TEM performed well in North America, Asia, South America and Africa. The models were then used to estimate global wetland CH4 emissions. The CH4 simulations of both models had good agreement in terms of the latitudinal and meridional bands. The global CH4 emissions for the period 2000–2010 were estimated to be 105.31 ± 2.72 Tg yr−1 by CH4MODwetland and 134.31 ± 0.84 Tg yr−1 by the TEM. If we used a more accurate model to estimate each continent and wetland type based on the models' generality, the estimated global CH4 emissions would be 116.99–124.74 Tg yr−1 for the period 2000–2010. The uncertainty in global wetland CH4 assessments by the process-based model approach comes from the inaccuracy of the wetland mapping area, the modeling procedure and the observational limitations. Future research on accurately mapping wetlands, improving model mechanisms and parametrization, and using more observations to evaluate model performance would improve global estimations.
TEM and CH4MODwetland model code and model datasets (input data and model results) are available at https://doi.org/10.5281/zenodo.3537621 (Li et al., 2019b).
The supplement related to this article is available online at: https://doi.org/10.5194/gmd-13-3769-2020-supplement.
TL and LinY pondered the rationale of the method. TL and YL developed and performed the model simulations. WS, QZ, WZ, GW, ZQ, LijY, HL and RZ performed the data collection and processing. TL prepared the article with contributions from all coauthors.
The authors declare that they have no conflict of interest.
This work was jointly supported by the National Natural Science Foundation of China (grant nos. 41775159, 91937302, and 31000234) and the National Key Scientific and Technological Infrastructure project “Earth System Science Numerical Simulator Facility” (EarthLab). We acknowledge data support from the National Earth System Science Data Center, National Science & Technology Infrastructure of China (http://www.geodata.cn, last access: August 2019).
This research has been supported by the National Natural Science Foundation of China (grant nos. 41775159, 91937302, and 31000234) and the National Key Scientific and Technological Infrastructure project “Earth System Science Numerical Simulator Facility” (EarthLab).
This paper was edited by Jason Williams and reviewed by two anonymous referees.
Allen, O. B. and Raktoe, B. L.: Accuracy analysis with special reference to the prediction of grassland yield, Biom. J., 23, 371–388, 1981.
Alvalá, P. C. and Kirchhoff, V. W. J. H.: Methane fluxes from the Pantanal floodplain in Brazil: seasonal variation, in: Non-CO2 greenhouse gases: Scientific understanding, control and implementation: Proceedings of the Second International Symposium, 8–10 September 1999, Noordwijkerhout, the Netherlands, edited by: van Ham, J., Baede, A. P. M., Meyer, L. A., and Ybema, R., Springer Netherlands, Dordrecht, the Netherlands, 95–99, 2000
Antonov, J. I., Seidov, D., Boyer, T. P., Locarnini, R. A., Mishonov, A. V., Garcia, H. E., Baranova, O. K., Zweng, M. M., and Johnson, D. R., World Ocean Atlas 2009, Volume 2: Salinity, in: NOAA Atlas NESDIS 69, edited by: Levitus, S., U.S. Government Printing Office, USA, 2010.
Aubinet, M., Vesala, T., and Papale, D.: Eddy covariance: a practical guide to measurement and data analysis, Springer Science & Business Media, Dordrecht, the Netherlands, 2012.
Aurela, M., Laurila, T., and Tuovinen, J. P.: Annual CO2 balance of a subarctic fen in northern Europe: importance of the wintertime efflux, J. Geophys. Res.-Atmos., 107, 4607, https://doi.org/10.1029/2002JD002055, 2002.
Bartlett, K. B., Harriss, R., and Sebacher, D.: Methane flux from coastal salt marshes, J. Geophys. Res.-Atmos., 90, 5710–5720, 1985.
Bartlett, K. B., Bartlett, D. S., Harriss, R. C., and Sebacher, D. I.: Methane emissions along a salt marsh salinity gradient, Biogeochemistry, 4, 183–202, https://doi.org/10.1007/bf02187365, 1987.
Bartlett, K. B., Crill, P., Sass, R., Harriss, R., and Dise, N.: Methane emissions from tundra environments in the Yukon-Kuskokwim Delta, Alaska, J. Geophys. Res., 97, 16645–16660, https://doi.org/10.1029/91JD00610, 1992.
Belger, L., Forsberg, B. R., and Melack, J. M.: Carbon dioxide and methane emissions from interfluvial wetlands in the upper Negro River basin, Brazil, Biogeochemistry, 105, 171–183, https://doi.org/10.1007/s10533-010-9536-0, 2011.
Belward, A. S., Estes, J. E., and Kline, K. D.: The IGBP-DIS global 1-km land-cover data set DISCover: A project overview, Photogramm. Eng. Remote Sens., 65, 1013–1020, 1999.
Bennett, N. D., Croke, B. F. W., Guariso, G., Guillaume, J. H. A., Hamilton, S. H., Jakeman, A. J., Marsili-Libelli, S., Newham, L. T. H., Norton, J. P., Perrin, C., Pierce, S. A., Robson, B., Seppelt, R., Voinov, A. A., Fath, B. D., and Andreassian, V.: Characterising performance of environmental models, Environ. Model. Softw., 40, 1–20, https://doi.org/10.1016/j.envsoft.2012.09.011, 2013.
Beven, K., and Kirkby, M. J.: A physically based, variable contributing area model of basin hydrology, Hydrol. Sci. B., 24, 43–69, 1979.
Bhullar, G. S., Iravani, M., Edwards, P. J., and Venterink, H. O.: Methane transport and emissions from soil as affected by water table and vascular plants, BMC Ecol., 13, 32, https://doi.org/10.1186/1472-6785-13-32, 2013.
Bohn, T., Lettenmaier, D., Sathulur, K., Bowling, L., Podest, E., McDonald, K., and Friborg, T.: Methane emissions from western Siberian wetlands: heterogeneity and sensitivity to climate change, Environ. Res. Lett., 2, 045015, https://doi.org/10.1088/1748-9326/2/4/045015, 2007.
Boucher, O., Friedlingstein, P., Collins, B., and Shine, K. P.: The indirect global warming potential and global temperature change potential due to methane oxidation, Environ. Res. Lett., 4, 044007, https://doi.org/10.1088/1748-9326/4/4/044007, 2009.
Bousquet, P., Ciais, P., Miller, J., Dlugokencky, E., Hauglustaine, D., Prigent, C., Van der Werf, G., Peylin, P., Brunke, E.-G., and Carouge, C.: Contribution of anthropogenic and natural sources to atmospheric methane variability, Nature, 443, 439–443, 2006.
Bridgham, S., Updegraff, K., and Pastor, J.: Carbon, Nitrogen, and Phosphorus Mineralization in Northern Wetlands, Ecology, 79, 1545–1561, 1998.
Bridgham, S. D., Cadillo-Quiroz, H., Keller, J. K., and Zhuang, Q.: Methane emissions from wetlands: biogeochemical, microbial, and modeling perspectives from local to global scales, Glob. Change Biol., 19, 1325–1346, 2013.
Bruhwiler, L., Dlugokencky, E., Masarie, K., Ishizawa, M., Andrews, A., Miller, J., Sweeney, C., Tans, P., and Worthy, D.: CarbonTracker-CH4: an assimilation system for estimating emissions of atmospheric methane, Atmos. Chem. Phys., 14, 8269–8293, https://doi.org/10.5194/acp-14-8269-2014, 2014.
Cao, M., Marshall, S., and Gregson, K.: Global carbon exchange and methane emissions from natural wetlands: Application of a process-based model, J. Geophys. Res.-Atmos., 101, 14399–14414, 1996.
Carter, A. J. and Scholes, R. J.: Spatial global database of soil properties., IGBP Global Soil Data Task CD-ROM, International Geosphere-Biosphere Programme Data Information Systems, Toulouse, France, 2000.
Chaichana, N., Bellingrath-Kimura, S., Komiya, S., Fujii, Y., Noborio, K., Dietrich, O., and Pakoktom, T.: Comparison of closed chamber and eddy covariance methods to improve the understanding of methane fluxes from rice paddy fields in Japan, Atmosphere, 9, 356, https://doi.org/10.3390/atmos9090356, 2018.
Chanton, J. P.: The effect of gas transport on the isotope signature of methane in wetlands, Org. Geochem., 36, 753–768, 2005.
Christensen, T. R.: Methane emission from Arctic tundra, Biogeochemistry, 21, 117–139, https://doi.org/10.1007/BF00000874, 1993.
Christensen, T. R., Friborg, T., Sommerkorn, M., Kaplan, J., Illeris, L., Soegaard, H., Nordstroem, C., and Jonasson, S.: Trace gas exchange in a high-Arctic valley: 1. Variationsin CO2 and CH4 flux between tundra vegetation types, Global Biogeochem. Cy., 14, 701–713, 2000.
Crill, P. M., Bartlett, K. B., Wilson, J. O., Sebacher, D. I., Harriss, R. C., Melack, J. M., MacIntyre, S., Lesack, L., and Smith-Morrill, L.: Tropospheric methane from an Amazonian floodplain lake, J. Geophys. Res.-Atmos., 93, 1564–1570, https://doi.org/10.1029/JD093iD02p01564, 1988.
Dalsøren, S. B., Myhre, C. L., Myhre, G., Gomez-Pelaez, A. J., Søvde, O. A., Isaksen, I. S. A., Weiss, R. F., and Harth, C. M.: Atmospheric methane evolution the last 40 years, Atmos. Chem. Phys., 16, 3099–3126, https://doi.org/10.5194/acp-16-3099-2016, 2016.
Deemer, B. R., Harrison, J. A., Li, S., Beaulieu, J. J., DelSontro, T., Barros, N., Bezerra-Neto, J. F., Powers, S. M., dos Santos, M. A., and Vonk, J. A.: Greenhouse gas emissions from reservoir water surfaces: A new global synthesis, BioScience, 66, 949–964, https://doi.org/10.1093/biosci/biw117, 2016.
Delaune, R. D., Smith, C. J., and Patrick Jr., W. H.: Methane release from Gulf coast wetlands, Tellus B, 35B, 8–15, https://doi.org/10.1111/j.1600-0889.1983.tb00002.x, 1983.
Devol, A. H., Richey, J. E., Clark, W. A., King, S. L., and Martinelli, L. A.: Methane emissions to the troposphere from the Amazon floodplain, J. Geophys. Res.-Atmos., 93, 1583–1592, https://doi.org/10.1029/JD093iD02p01583, 1988.
Dlugokencky, E. J.: NOAA/ESRL, available at: http://www.esrl.noaa.gov/gmd/ccgg/trends_ch4/, last access: 18 July 2016.
Dlugokencky, E. J., Bruhwiler, L., White, J., Emmons, L., Novelli, P. C., Montzka, S. A., Masarie, K. A., Lang, P. M., Crotwell, A., and Miller, J. B.: Observational constraints on recent increases in the atmospheric CH4 burden, Geophys. Res. Lett., 36, L18803, https://doi.org/10.1029/2009GL039780, 2009.
Duan, X., Wang, X., Mu, Y., and Ouyang, Z.: Seasonal and diurnal variations in methane emissions from Wuliangsu Lake in arid regions of China, Atmos. Environ., 39, 4479–4487, 2005.
Fan, S. M., Wofsy, S. C., Bakwin, P. S., Jacob, D. J., Anderson, S. M., Kebabian, P. L., McManus, J. B., Kolb, C. E., and Fitzjarrald, D. R.: Micrometeorological measurements of CH4 and CO2 exchange between the atmosphere and subarctic tundra, J. Geophys. Res.-Atmos., 97, 16627–16643, https://doi.org/10.1029/91jd02531, 1992.
Fan, Y. and van den Dool, H.: Climate Prediction Center global monthly soil moisture data set at 0.5 resolution for 1948 to present, J. Geophys. Res.-Atmos., 109, D10102, https://doi.org/10.1029/2003JD004345, 2004.
FAO/IIASA/ISRIC/ISS-CAS/JRC: Harmonized World Soil Database, version 1.0, FAO, Rome, Italy and IIASA, Laxenburg, Austria, 42 pp., 2008.
FAO/IIASA/ISRIC/ISS-CAS/JRC: Harmonized World Soil Database, version 1.2, FAO and IIASA, Rome, Italy and Laxenburg, Austria, 43 pp., 2012.
Farr, T. G., Rosen, P. A., Caro, E., Crippen, R., Duren, R., Hensley, S., Kobrick, M., Paller, M., Rodriguez, E., Roth, L., Seal, D., Shaffer, S., Shimada, J., Umland, J., Werner, M., Oskin, M., Burbank, D., and Alsdorf, D.: The shuttle radar topography mission, Rev. Geophys., 45, RG2004, https://doi.org/10.1029/2005rg000183, 2007.
Fraser, A., Palmer, P. I., Feng, L., Boesch, H., Cogan, A., Parker, R., Dlugokencky, E. J., Fraser, P. J., Krummel, P. B., Langenfelds, R. L., O'Doherty, S., Prinn, R. G., Steele, L. P., van der Schoot, M., and Weiss, R. F.: Estimating regional methane surface fluxes: the relative importance of surface and GOSAT mole fraction measurements, Atmos. Chem. Phys., 13, 5697–5713, https://doi.org/10.5194/acp-13-5697-2013, 2013.
Friborg, T., Christensen, T., and Søgaard, H.: Rapid response of greenhouse gas emission to early spring thaw in a subarctic mire as shown by micrometeorological techniques, Geophys. Res. Lett., 24, 3061–3064, https://doi.org/10.1029/97GL03024, 1997.
Galand, P. E., Yrjälä, K., and Conrad, R.: Stable carbon isotope fractionation during methanogenesis in three boreal peatland ecosystems, Biogeosciences, 7, 3893–3900, https://doi.org/10.5194/bg-7-3893-2010, 2010.
Gedney, N., Cox, P., and Huntingford, C.: Climate feedback from wetland methane emissions, Geophys. Res. Lett., 31, L20503, https://doi.org/10.1029/2004GL020919, 2004.
Ghosh, A., Patra, P. K., Ishijima, K., Umezawa, T., Ito, A., Etheridge, D. M., Sugawara, S., Kawamura, K., Miller, J. B., Dlugokencky, E. J., Krummel, P. B., Fraser, P. J., Steele, L. P., Langenfelds, R. L., Trudinger, C. M., White, J. W. C., Vaughn, B., Saeki, T., Aoki, S., and Nakazawa, T.: Variations in global methane sources and sinks during 1910–2010, Atmos. Chem. Phys., 15, 2595–2612, https://doi.org/10.5194/acp-15-2595-2015, 2015.
Hanis, K. L., Tenuta, M., Amiro, B. D., and Papakyriakou, T. N.: Seasonal dynamics of methane emissions from a subarctic fen in the Hudson Bay Lowlands, Biogeosciences, 10, 4465–4479, https://doi.org/10.5194/bg-10-4465-2013, 2013.
Hao, Q. J.: Effect of land-use change on greenhouse gases emissions in freshwater marshes in the Sanjiang Plain, PhD Dissertation, Institute of Atmospheric Physics, Chinese Academy of Sciences, Beijing, China, 2006.
Harazono, Y., Mano, M., Miyata, A., Yoshimoto, M., Zulueta, R., Vourlitis, G., Kwon, H., and Oechel, W.: Temporal and spatial differences of methane flux at arctic tundra in Alaska, Mem. Natl. Inst. Polar Res., 59, 79–95, 2006.
Harris, I., Jones, P., Osborn, T., and Lister, D.: Updated high-resolution grids of monthly climatic observations – the CRU TS3. 10 Dataset, Int. J. Climatol., 34, 623–642, 2014.
Hatala, J. A., Detto, M., Sonnentag, O., Deverel, S. J., Verfaillie, J., and Baldocchi, D. D.: Greenhouse gas (CO2, CH4, H2O) fluxes from drained and flooded agricultural peatlands in the Sacramento-San Joaquin Delta, Agr., Ecosyst. Environ., 150, 1–18, 2012.
Hirota, M., Tang, Y., Hu, Q., Hirata, S., Kato, T., Mo, W., Cao, G., and Mariko, S.: Methane emissions from different vegetation zones in a Qinghai-Tibetan Plateau wetland, Soil Biol. Biochem., 36, 737–748, 2004.
Huang, G., Li, X., Hu, Y., Shi, Y., and Xiao, D.: Methane (CH4) emission from a natural wetland of northern China, J. Environ. Sci. Health, 40, 1227–1238, 2005.
Huang, P. Y., Yu, H. X., Chai, L. H., Chai, F. Y., and Zhang, W. F.: Methane emission flux of Zhalong Phragmites Australis wetlands in growth season, Chin. J. Appl. Ecol., 22, 1219–1224, 2011.
Huang, Y. A. O., Sass, R., and Fisher, F.: Methane emission from Texas rice paddy soils. 1. Quantitative multi-year dependence of CH4 emission on soil, cultivar and grain yield, Glob. Change Biol., 3, 479–489, 1997.
Huttunen, J. T., Alm, J., Saarijärvi, E., Lappalainen, K. M., Silvola, J., and Martikainen, P. J.: Contribution of winter to the annual CH4 emission from a eutrophied boreal lake, Chemosphere, 50, 247–250, 2003.
IPCC: Revised 1996 IPCC Guidelines for National Greenhouse Gas Inventories: Reference Manual, Paris, France, 1996.
Jauhiainen, J., Takahashi, H., Heikkinen, J. E., Martikainen, P. J., and Vasander, H.: Carbon fluxes from a tropical peat swamp forest floor, Glob. Change Biol., 11, 1788–1797, 2005.
Jitka, V., Jiří, D., Stanislav, S., Lenka, M., and Hana, Č.: Effect of hummock-forming vegetation on methane emissions from a temperate sedge-grass marsh, Wetlands, 37, 675–686, https://doi.org/10.1007/s13157-017-0898-0, 2017.
Joabsson, A. and Christensen, T. R.: Methane emissions from wetlands and their relationship with vascular plants: an Arctic example, Glob. Change Biol., 7, 919–932, https://doi.org/10.1046/j.1354-1013.2001.00044.x, 2001.
Kang, W. X., Zhao, Z. H., Tian, D. L., He, J. N., and Deng, X. W.: CO2 exchanges between mangrove- and shoal wetland ecosystems and atmosphere in Guangzhou, Chin. J. Appl. Ecol., 19, 2605–2610, 2008.
Keddy, P. A.: Wetland ecology: principles and conservation, Cambridge University Press, Cambridge, UK, 2010.
Keller, J. and Bridgham, S.: Pathways of Anaerobic Carbon Cycling Across an Ombrotrophic–Minerotrophic Peatland Gradient, Limnol. Oceanogr., 52, 96–107, https://doi.org/10.4319/lo.2007.52.1.0096, 2007.
King, J., Reeburgh, W., Thieler, K., Kling, G., Loya, W., Johnson, L., and Nadelhoffer, K.: Pulse-labeling studies of carbon cycling in Arctic tundra ecosystems: The contribution of photosynthates to methane emission, Global Biogeochem. Cy., 16, 1062, https://doi.org/10.1029/2001GB001456, 2002.
Kingsford, R. T., Basset, A., and Jackson, L.: Wetlands: conservation's poor cousins, Aquat. Conserv., 26, 892–916, https://doi.org/10.1002/aqc.2709, 2016.
Kirschke, S., Bousquet, P., Ciais, P., Saunois, M., Canadell, J. G., Dlugokencky, E. J., Bergamaschi, P., Bergmann, D., Blake, D. R., and Bruhwiler, L.: Three decades of global methane sources and sinks, Nat. Geosci., 6, 813–823, 2013.
Koh, H. S., Ochs, C., and Yu, K.: Hydrologic gradient and vegetation controls on CH4 and CO2 fluxes in a spring-fed forested wetland, Hydrobiologia, 630, 271–286, https://doi.org/10.1007/s10750-009-9821-x, 2009.
Kramer, K., Leinonen, I., Bartelink, H., Berbigier, P., Borghetti, M., Bernhofer, C., Cienciala, E., Dolman, A., Froer, O., and Gracia, C.: Evaluation of six process-based forest growth models using eddy-covariance measurements of CO2 and H2O fluxes at six forest sites in Europe, Glob. Change Biol., 8, 213–230, 2002.
Kwon, M. J., Beulig, F., Ilie, I., Wildner, M., Küsel, K., Merbold, L., Mahecha, M. D., Zimov, N., Zimov, S. A., Heimann, M., Schuur, E. A. G., Kostka, J. E., Kolle, O., Hilke, I., and Göckede, M.: Plants, microorganisms, and soil temperatures contribute to a decrease in methane fluxes on a drained Arctic floodplain, Glob. Change Biol., 23, 2396–2412, https://doi.org/10.1111/gcb.13558, 2017.
Lehner, B. and Döll, P.: Development and validation of a global database of lakes, reservoirs and wetlands, J. Hydrol., 296, 1–22, 2004.
Li, T., Huang, Y., Zhang, W., and Song, C.: CH4MODwetland: A biogeophysical model for simulating methane emissions from natural wetlands, Ecol. Model., 221, 666–680, 2010.
Li, T., Zhang, W., Zhang, Q., Lu, Y., Wang, G., Niu, Z., Raivonen, M., and Vesala, T.: Impacts of climate and reclamation on temporal variations in CH4 emissions from different wetlands in China: from 1950 to 2010, Biogeosciences, 12, 6853–6868, https://doi.org/10.5194/bg-12-6853-2015, 2015.
Li, T., Xie, B., Wang, G., Zhang, W., Zhang, Q., Vesala, T., and Raivonen, M.: Field-scale simulation of methane emissions from coastal wetlands in China using an improved version of CH4MODwetland, Sci. Total Environ., 559, 256–267, https://doi.org/10.1016/j.scitotenv.2016.03.186, 2016.
Li, T., Zhang, Q., Cheng, Z., Wang, G., Yu, L., and Zhang, W.: Performance of CH4MODwetland for the case study of different regions of natural Chinese wetland, J. Environ. Sci., 57, 356–369, 2017.
Li, T., Li, H., Zhang, Q., Ma, Z., Yu, L., Lu, Y., Niu, Z., Sun, W., and Liu, J.: Prediction of CH4 emissions from potential natural wetlands on the Tibetan Plateau during the 21st century, Sci. Total Environ., 657, 498–508, https://doi.org/10.1016/j.scitotenv.2018.11.275, 2019a.
Li, T., Lu, Y., Yu, L., Sun, W., Zhang, Q., Zhang, W., Wang, G., Qin, Z., Yu, L., Li, H., and Zhang, R.: valuation of two process-based models used to estimate global CH4 emissions from natural wetlands, Zenodo, https://doi.org/10.5281/zenodo.3537621, 2019b.
Li, Y. J., Cheng, Z. L., Wang, D. Q., Hu, H., and Wang, C.: Methane emission in the process of wetland and vegetation succession in salt marsh of Yangtze River estuary, Acta Sci. Circumst., 34, 2035–2402, 2014.
Long, K. D., Flanagan, L. B., and Cai, T.: Diurnal and seasonal variation in methane emissions in a northern Canadian peatland measured by eddy covariance, Glob. Change Biol., 16, 2420–2435, https://doi.org/10.1111/j.1365-2486.2009.02083.x, 2010.
Loveland, T., Reed, B., Brown, J., Ohlen, D., Zhu, Z., Yang, L., and Merchant, J.: Development of a global land cover characteristics database and IGBP DISCover from 1 km AVHRR data, Int. J. Remote Sens., 21, 1303–1330, 2000.
Marthews, T. R., Dadson, S. J., Lehner, B., Abele, S., and Gedney, N.: High-resolution global topographic index values for use in large-scale hydrological modelling, Hydrol. Earth Syst. Sci., 19, 91–104, https://doi.org/10.5194/hess-19-91-2015, 2015.
Mastepanov, M., Sigsgaard, C., Dlugokencky, E. J., Houweling, S., Ström, L., Tamstorf, M. P., and Christensen, T. R.: Large tundra methane burst during onset of freezing, Nature, 456, 628–630, 2008.
McEwing, K. R., Fisher, J. P., and Zona, D.: Environmental and vegetation controls on the spatial variability of CH4 emission from wet-sedge and tussock tundra ecosystems in the Arctic, Plant Soil, 388, 37–52, https://doi.org/10.1007/s11104-014-2377-1, 2015.
Meirink, J. F., Bergamaschi, P., and Krol, M. C.: Four-dimensional variational data assimilation for inverse modelling of atmospheric methane emissions: method and comparison with synthesis inversion, Atmos. Chem. Phys., 8, 6341–6353, https://doi.org/10.5194/acp-8-6341-2008, 2008.
Melack, J. M., Hess, L. L., Gastil, M., Forsberg, B. R., Hamilton, S. K., Lima, I. B. T., and Novo, E. M. L. M.: Regionalization of methane emissions in the Amazon Basin with microwave remote sensing, Glob. Change Biol., 10, 530–544, https://doi.org/10.1111/j.1365-2486.2004.00763.x, 2004.
Melillo, J. M., McGuire, A. D., Kicklighter, D. W., Moore, B., Vorosmarty, C. J., and Schloss, A. L.: Global climate change and terrestrial net primary production, Nature, 363, 234–240, 1993.
Melling, L., Hatanoa, R., and Gohc, K. J.: Methane fluxes from three ecosystems in tropical peatland of Sarawak, Malaysia, Soil Biol. Biochem., 37, 1445–1453, 2005.
Melton, J. R., Wania, R., Hodson, E. L., Poulter, B., Ringeval, B., Spahni, R., Bohn, T., Avis, C. A., Beerling, D. J., Chen, G., Eliseev, A. V., Denisov, S. N., Hopcroft, P. O., Lettenmaier, D. P., Riley, W. J., Singarayer, J. S., Subin, Z. M., Tian, H., Zürcher, S., Brovkin, V., van Bodegom, P. M., Kleinen, T., Yu, Z. C., and Kaplan, J. O.: Present state of global wetland extent and wetland methane modelling: conclusions from a model inter-comparison project (WETCHIMP), Biogeosciences, 10, 753–788, https://doi.org/10.5194/bg-10-753-2013, 2013.
Meng, L., Hess, P. G. M., Mahowald, N. M., Yavitt, J. B., Riley, W. J., Subin, Z. M., Lawrence, D. M., Swenson, S. C., Jauhiainen, J., and Fuka, D. R.: Sensitivity of wetland methane emissions to model assumptions: application and model testing against site observations, Biogeosciences, 9, 2793–2819, https://doi.org/10.5194/bg-9-2793-2012, 2012.
Moore, T., Roulet, N., and Knowles, R.: Spatial and temporal variations of methane flux from subarctic/northern Boreal fens, Global Biogeochem. Cy., 4, 29–46, https://doi.org/10.1029/GB004i001p00029, 1990.
Moore, T., Heyes, A., and Roulet, N.: Methane emissions from wetlands, southern Hudson Bay Lowland, J. Geophys. Res., 99, 1455–1467, https://doi.org/10.1029/93JD02457, 1994.
Moore, T., Young, A., Bubier, J., Humphreys, E., Lafleur, P., and Roulet, N.: A multi-year record of methane flux at the Mer Bleue Bog, Southern Canada, Ecosystems, 14, 646–657, https://doi.org/10.1007/s10021-011-9435-9, 2011.
Morse, J. L., Ardón, M., and Bernhardt, E. S.: Greenhouse gas fluxes in southeastern U.S. coastal plain wetlands under contrasting land uses, Ecol. Appl., 22, 264–280, https://doi.org/10.1890/11-0527.1, 2012.
Myhre, G., Shindell, D., Bréon, F. M., Collins, W., Fuglestvedt, J., Huang, J., Koch, D., Lamarque, J. F., Lee, D., Mendoza, B., Nakajima, T., Robock, A., Stephens, G., Takemura, T., and Zhang, H.: Anthropogenic and Natural Radiative Forcing, in: Climate Change 2013: The Physical Science Basis. Contribution of Working Group I to the Fifth Assessment Report of the Inter-governmental Panel on Climate Change, edited by: Stocker, T. F., Qin, D., Plattner, G. K., Tignor, M., Allen, S. K., Boschung, J., Nauels, A., Xia, Y., Bex, V., and Midgley, P. M., Cambridge University Press, Cambridge, UK and New York, NY, USA, 2013.
Nakano, T., Kuniyoshi, S., and Fukuda, M.: Temporal variation in methane emission from tundra wetlands in a permafrost area, northeastern Siberia, Atmos. Environ., 34, 1205–1213, https://doi.org/10.1016/S1352-2310(99)00373-8, 2000.
Nisbet, E., Manning, M., Dlugokencky, E., Fisher, R., Lowry, D., Michel, S., Lund Myhre, C., Platt, S., Allen, G., Bousquet, P., Brownlow, R., Cain, M., France, J., Hermansen, O., Hossaini, R., Jones, A., Levin, I., Manning, A., Myhre, G., and White, J.: Very strong atmospheric methane growth in the four years 2014–2017: Implications for the Paris Agreement, Global Biogeochem. Cy., 33, 318–342, https://doi.org/10.1029/2018GB006009, 2019.
Olefeldt, D., Roulet, N. T., Bergeron, O., Crill, P., Bäckstrand, K., and Christensen, T. R.: Net carbon accumulation of a high-latitude permafrost palsa mire similar to permafrost-free peatlands, Geophys. Res. Lett., 39, L03501, https://doi.org/10.1029/2011GL050355, 2012.
Olson, D., Griffis, T., Noormets, A., Kolka, R., and Chen, J.: Interannual, seasonal, and retrospective analysis of the methane and carbon dioxide budgets of a temperate peatland, J. Geophys. Res.-Biogeo., 118, 226–238, https://doi.org/10.1002/jgrg.20031, 2013.
Page, S., Rieley, J., Shotyk, W., and Weiss, D.: Interdependence of peat and vegetation in a tropical peat swamp forest, Philos. T. Roy. Soc. Lond. B, 354, 1885–1897, https://doi.org/10.1098/rstb.1999.0529, 1999.
Parmentier, F. J. W., van Huissteden, J., van der Molen, M. K., Schaepman-Strub, G., Karsanaev, S. A., Maximov, T. C., and Dolman, A. J.: Spatial and temporal dynamics in eddy covariance observations of methane fluxes at a tundra site in northeastern Siberia, J. Geophys. Res.-Biogeo., 116, G03016, https://doi.org/10.1029/2010jg001637, 2011.
Poffenbarger, H. J., Needelman, B. A., and Megonigal, J. P.: Salinity influence on methane emissions from tidal marshes, Wetlands, 31, 831–842, https://doi.org/10.1007/s13157-011-0197-0, 2011.
Potter, C. S.: An ecosystem simulation model for methane production and emission from wetlands, Global Biogeochem. Cy., 11, 495–506, 1997.
Poulter, B., Bousquet, P., Canadell, J. G., Ciais, P., Peregon, A., Saunois, M., Arora, V. K., Beerling, D. J., Brovkin, V., and Jones, C. D.: Global wetland contribution to 2000–2012 atmospheric methane growth rate dynamics, Environ. Res. Lett., 12, 094013, https://doi.org/10.1088/1748-9326/aa8391, 2017.
Riley, W. J., Subin, Z. M., Lawrence, D. M., Swenson, S. C., Torn, M. S., Meng, L., Mahowald, N. M., and Hess, P.: Barriers to predicting changes in global terrestrial methane fluxes: analyses using CLM4Me, a methane biogeochemistry model integrated in CESM, Biogeosciences, 8, 1925–1953, https://doi.org/10.5194/bg-8-1925-2011, 2011.
Rykiel, E. J.: Testing ecological models: the meaning of validation, Ecol. Model., 90, 229–244, https://doi.org/10.1016/0304-3800(95)00152-2, 1996.
Sachs, T., Giebels, M., Boike, J., and Kutzbach, L.: Environmental controls on CH4 emission from polygonal tundra on the microsite scale in the Lena river delta, Siberia, Glob. Change Biol., 16, 3096–3110, 2010.
Saunois, M., Bousquet, P., Poulter, B., Peregon, A., Ciais, P., Canadell, J. G., Dlugokencky, E. J., Etiope, G., Bastviken, D., Houweling, S., Janssens-Maenhout, G., Tubiello, F. N., Castaldi, S., Jackson, R. B., Alexe, M., Arora, V. K., Beerling, D. J., Bergamaschi, P., Blake, D. R., Brailsford, G., Brovkin, V., Bruhwiler, L., Crevoisier, C., Crill, P., Covey, K., Curry, C., Frankenberg, C., Gedney, N., Höglund-Isaksson, L., Ishizawa, M., Ito, A., Joos, F., Kim, H.-S., Kleinen, T., Krummel, P., Lamarque, J.-F., Langenfelds, R., Locatelli, R., Machida, T., Maksyutov, S., McDonald, K. C., Marshall, J., Melton, J. R., Morino, I., Naik, V., O'Doherty, S., Parmentier, F.-J. W., Patra, P. K., Peng, C., Peng, S., Peters, G. P., Pison, I., Prigent, C., Prinn, R., Ramonet, M., Riley, W. J., Saito, M., Santini, M., Schroeder, R., Simpson, I. J., Spahni, R., Steele, P., Takizawa, A., Thornton, B. F., Tian, H., Tohjima, Y., Viovy, N., Voulgarakis, A., van Weele, M., van der Werf, G. R., Weiss, R., Wiedinmyer, C., Wilton, D. J., Wiltshire, A., Worthy, D., Wunch, D., Xu, X., Yoshida, Y., Zhang, B., Zhang, Z., and Zhu, Q.: The global methane budget 2000–2012, Earth Syst. Sci. Data, 8, 697–751, https://doi.org/10.5194/essd-8-697-2016, 2016.
Schimel, J., Nadelhoffer, K., Shaver, G., Giblin, A., and Rastetter, E.: Methane and carbon dioxide emissions were monitored in control, greenhouse, and nitrogen and phosphorus fertilized plots of three different plant communities Arctic LTER experimental plots, Toolik Field Station, 1992, Environmental Data Initiative, https://doi.org/10.6073/pasta/3e2ae7928b00f7546338086d0dc3bd55, 1994.
Schimel, J., Nadelhoffer, K., Shaver, G., Giblin, A., Rastetter, E.: Methane and carbon dioxide emissions were monitored in control, greenhouse, and nitrogen and phosphorus fertilized plots of three different plant communities, Toolik Field Station, North Slope Alaska, Arctic LTER 1993, Environmental Data Initiative, https://doi.org/10.6073/pasta/64c4ad25b7efb6f98acc22301dd1802a, 1995.
Sebacher, D., Harriss, R., Bartlett, K., Sebacher, S., and Grice, S.: Atmospheric methane sources: Alaskan tundra bogs, an alpine fen, and a subarctic boreal marsh, Tellus B, 38B, 1–10, https://doi.org/10.1111/j.1600-0889.1986.tb00083.x, 1986.
Sellers, P. J., Hall, F. G., Kelly, R. D., Black, A., Baldocchi, D., Berry, J., Ryan, M., Ranson, K. J., Crill, P. M., and Lettenmaier, D. P.: BOREAS in 1997: Experiment overview, scientific results, and future directions, J. Geophys. Res.-Atmos., 102, 28731–28769, 1997.
Shannon, R. D., White, J. R., Lawson, J. E., and Gilmour, B. S.: Methane efflux from emergent vegetation in peatlands, J. Ecol., 84, 239–246, 1996.
Shindell, D., Kuylenstierna, J. C. I., Vignati, E., van Dingenen, R., Amann, M., Klimont, Z., Anenberg, S. C., Muller, N., Janssens-Maenhout, G., Raes, F., Schwartz, J., Faluvegi, G., Pozzoli, L., Kupiainen, K., Höglund-Isaksson, L., Emberson, L., Streets, D., Ramanathan, V., Hicks, K., Oanh, N. T. K., Milly, G., Williams, M., Demkine, V., and Fowler, D.: Simultaneously Mitigating Near-Term Climate Change and Improving Human Health and Food Security, Science, 335, 183–189, https://doi.org/10.1126/science.1210026, 2012.
Song, C., Zhang, J., Wang, Y., Wang, Y., and Zhao, Z.: Emission of CO2, CH4 and N2O from freshwater marsh in northeast of China, J. Environ. Manag., 88, 428–436, https://doi.org/10.1016/j.jenvman.2007.03.030, 2008.
Spiers, A. G.: Review of international/continental wetland resources, in: Global review of wetland resources and priorities for wetland inventory, edited by: Finlayson, C. M., and Spiers, A. G., Supervising Scientist Report 144, Supervising Scientist, Canberra, Australia, 63–104, 1999.
Stanley, K. M., Heppell, C. M., Belyea, L. R., Baird, A. J., and Field, R. H.: The Importance of CH4 Ebullition in Floodplain Fens, J. Geophys. Res.-Biogeo., 124, 1750–1763, https://doi.org/10.1029/2018jg004902, 2019.
Suyker, A. E., Verma, S. B., Clement, R. J., and Billesbach, D. P.: Methane flux in a boreal fen: Season-long measurement by eddy correlation, J. Geophys. Res.-Atmos., 101, 28637–28647, https://doi.org/10.1029/96JD02751, 1996.
Svensson, B., and Rosswall, T.: In situ methane production from acid peat in plant communities with different moisture regimes in a subarctic mire, Oikos, 43, 341–350, https://doi.org/10.2307/3544151, 1984.
Tathy, J., Cros, B., Delmas, R., Marenco, A., Servant, J., and Labat, M.: CH4 emission from flooded forest in Central Africa, J. Geophys. Res., 97, 6159–6168, https://doi.org/10.1029/90JD02555, 1992.
Tian, H., Chen, G., Lu, C., Xu, X., Ren, W., Zhang, B., Banger, K., Tao, B., Pan, S., and Liu, M.: Global methane and nitrous oxide emissions from terrestrial ecosystems due to multiple environmental changes, Ecosystem Health and Sustainability, 1, 1–20, https://doi.org/10.1890/EHS14-0015.1, 2015.
Tsuruta, A., Aalto, T., Backman, L., Hakkarainen, J., van der Laan-Luijkx, I. T., Krol, M. C., Spahni, R., Houweling, S., Laine, M., Dlugokencky, E., Gomez-Pelaez, A. J., van der Schoot, M., Langenfelds, R., Ellul, R., Arduini, J., Apadula, F., Gerbig, C., Feist, D. G., Kivi, R., Yoshida, Y., and Peters, W.: Global methane emission estimates for 2000–2012 from CarbonTracker Europe-CH4 v1.0, Geosci. Model Dev., 10, 1261–1289, https://doi.org/10.5194/gmd-10-1261-2017, 2017.
Twine, T. E., Kustas, W., Norman, J., Cook, D., Houser, P., Meyers, T., Prueger, J., Starks, P., and Wesely, M.: Correcting eddy-covariance flux underestimates over a grassland, Agr. Forest Meteorol., 103, 279–300, 2000.
Wagner, D., Kobabe, S., Pfeiffer, E. M., and Hubberten, H. W.: Microbial controls on methane fluxes from a polygonal tundra of the Lena Delta, Siberia, Permafrost Periglac., 14, 173–185, 2003.
Walter, B. P. and Heimann, M.: A process-based, climate-sensitive model to derive methane emissions from natural wetlands: Application to five wetland sites, sensitivity to model parameters, and climate, Global Biogeochem. Cy., 14, 745–765, 2000.
Walter, B. P., Heimann, M., Shannon, R. D., and White, J. R.: A process‐based model to derive methane emissions from natural wetlands, Geophys. Res. Lett., 23, 3731–3734, 1996.
Wang, D., Lv, X., Ding, W., Cai, Z., Gao, J., and Yang, F.: Methan emission from narshes in Zoige Plateau, Adv. Earth Sci., 17, 877–880, 2002.
Wei, D. and Wang, X.: Uncertainty and dynamics of natural wetland CH4 release in China: Research status and priorities, Atmos. Environ., 154, 95–105, https://doi.org/10.1016/j.atmosenv.2017.01.038, 2017.
Werle, P. and Kormann, R.: Fast chemical sensor for eddy-correlation measurements of methane emissions from rice paddy fields, Appl. Optics, 40, 846–858, 2001.
Whalen, S. C. and Reeburgh, W. S.: Interannual variations in tundra methane emission: A 4-year time series at fixed sites, Global Biogeochem. Cy., 6, 139–159, 1992.
Wille, C., Kutzbach, L., Sachs, T., Wagner, D., and Pfeiffer, E. M.: Methane emission from Siberian arctic polygonal tundra: eddy covariance measurements and modeling, Glob. Change Biol., 14, 1395–1408, 2008.
Xu, X., Yuan, F., Hanson, P. J., Wullschleger, S. D., Thornton, P. E., Riley, W. J., Song, X., Graham, D. E., Song, C., and Tian, H.: Reviews and syntheses: Four decades of modeling methane cycling in terrestrial ecosystems, Biogeosciences, 13, 3735–3755, https://doi.org/10.5194/bg-13-3735-2016, 2016.
Ye, Y., Lu, C., and Lin, P.: CH4 dynamics in sediments of Bruguiera sexangula mangrove at Hegang Estuary, Soil Environ. Sci., 9, 91–95, 2000 (in Chinese).
Zhang, Q., Zhang, W., Li, T., Sun, W., Yu, Y., and Wang, G.: Projective analysis of staple food crop productivity in adaptation to future climate change in China, Int. J. Biometeorol., 61, 1445–1460, https://doi.org/10.1007/s00484-017-1322-4, 2017.
Zhang, Y., Li, C., Trettin, C. C., and Li, H.: An integrated model of soil, hydrology, and vegetation for carbon dynamics in wetland ecosystems, Global Biogeochem. Cy., 16, 1061–1078, 2002.
Zhu, Q., Liu, J., Peng, C., Chen, H., Fang, X., Jiang, H., Yang, G., Zhu, D., Wang, W., and Zhou, X.: Modelling methane emissions from natural wetlands by development and application of the TRIPLEX-GHG model, Geosci. Model Dev., 7, 981–999, https://doi.org/10.5194/gmd-7-981-2014, 2014.
Zhu, Q., Peng, C. H., Chen, H., Fang, X. Q., Liu, J. X., Jiang, H., Yang, Y. Z., and Yang, G.: Estimating global natural wetland methane emissions using process modelling: spatio-temporal patterns and contributions to atmospheric methane fluctuations, Global Ecol. Biogeogr., 24, 959–972, https://doi.org/10.1111/geb.12307, 2015.
Zhu, X., Zhuang, Q., Gao, X., Sokolov, A., and Schlosser, C. A.: Pan-Arctic land–atmospheric fluxes of methane and carbon dioxide in response to climate change over the 21st century, Environ. Res. Lett., 8, 045003, https://doi.org/10.1088/1748-9326/8/4/045003, 2013.
Zhuang, Q., Melillo, J. M., Kicklighter, D. W., Prinn, R. G., McGuire, A. D., Steudler, P. A., Felzer, B. S., and Hu, S.: Methane fluxes between terrestrial ecosystems and the atmosphere at northern high latitudes during the past century: A retrospective analysis with a process-based biogeochemistry model, Global Biogeochem. Cy., 18, GB3010, https://doi.org/10.1029/2004gb002239, 2004.
Zhuang, Q., Melillo, J. M., Sarofim, M. C., Kicklighter, D. W., McGuire, A. D., Felzer, B. S., Sokolov, A., Prinn, R. G., Steudler, P. A., and Hu, S.: CO2 and CH4 exchanges between land ecosystems and the atmosphere in northern high latitudes over the 21st century, Geophys. Res. Lett., 33, L17403, https://doi.org/10.1029/2006GL026972, 2006.
Zhuang, Q., Melillo, J., McGuire, A., Kicklighter, D., Prinn, R., Steudler, P., Felzer, B., and Hu, S.: Net emissions of CH4 and CO2 in Alaska: Implications for the region's greenhouse gas budget, Ecol. Appl., 17, 203–212, 2007.
Zhuang, Q., Chen, M., Xu, K., Tang, J., Saikawa, E., Lu, Y., Melillo, J. M., Prinn, R. G., and McGuire, A. D.: Response of global soil consumption of atmospheric methane to changes in atmospheric climate and nitrogen deposition, Global Biogeochem. Cy., 27, 650–663, 2013.
Zona, D., Oechel, W., Kochendorfer, J., Paw U, K., Salyuk, A., Olivas, P., Oberbauer, S., and Lipson, D.: Methane fluxes during the initiation of a large-scale water table manipulation experiment in the Alaskan Arctic tundra, Global Biogeochem. Cy., 23, GB2013, https://doi.org/10.1029/2009GB003487, 2009.
Zona, D., Gioli, B., Commane, R., Lindaas, J., Wofsy, S. C., Miller, C. E., Dinardo, S. J., Dengel, S., Sweeney, C., Karion, A., Chang, R. Y.-W., Henderson, J. M., Murphy, P. C., Goodrich, J. P., Moreaux, V., Liljedahl, A., Watts, J. D., Kimball, J. S., Lipson, D. A., and Oechel, W. C.: Cold season emissions dominate the Arctic tundra methane budget, P. Natl. Acad. Sci. USA, 113, 40–45, https://doi.org/10.1073/pnas.1516017113, 2016.