the Creative Commons Attribution 4.0 License.
the Creative Commons Attribution 4.0 License.
 | 30 Jun 2020
Further improvement of wet process treatments in GEOS-Chem v12.6.0: impact on global distributions of aerosols and aerosol precursors
Fangqun Yu
Jonathan M. Moch
Wet processes, including aqueous-phase chemistry, wet scavenging, and wet surface uptake during dry deposition, are important for global modeling of aerosols and aerosol precursors. In this study, we improve the treatments of these wet processes in the Goddard Earth Observing System with chemistry (GEOS-Chem) v12.6.0, including pH calculations for cloud, rain, and wet surfaces, the fraction of cloud available for aqueous-phase chemistry, rainout efficiencies for various types of clouds, empirical washout by rain and snow, and wet surface uptake during dry deposition. We compare simulated surface mass concentrations of aerosols and aerosol precursors with surface monitoring networks over the United States, European, Asian, and Arctic regions, and show that model results with updated wet processes agree better with measurements for most species. With the implementation of these updates, normalized mean biases (NMBs) of surface nitric acid, nitrate, and ammonium are reduced from 78 %, 126 %, and 45 % to 0.9 %, 15 %, and 4.1 % over the US sites, from 107 %, 127 %, and 90 % to −0.7 %, 4.2 %, and 16 % over European sites, and from 121 %, 269 %, and 167 % to −21 %, 37 %, and 86 % over Asian remote region sites. Comparison with surface measured SO2, sulfate, and black carbon at four Arctic sites indicated that those species simulated with the updated wet processes match well with observations except for a large underestimate of black carbon at one of the sites. We also compare our model simulation with aircraft measurement of nitric acid and aerosols during the Atmospheric Tomography Mission (ATom)-1 and ATom-2 periods and found a significant improvement of modeling skill of nitric acid, sulfate, and ammonium in the Northern Hemisphere during wintertime. The NMBs of these species are reduced from 163 %, 78 %, and 217 % to −13 %, −1 %, and 10 %, respectively. The investigation of impacts of updated wet process treatments on surface mass concentrations indicated that the updated wet processes have strong impacts on the global means of nitric acid, sulfate, nitrate, and ammonium and relative small impacts on the global means of sulfur dioxide, dust, sea salt, black carbon, and organic carbon.
- Article
(2332 KB) - Full-text XML
-
Supplement
(754 KB) - BibTeX
- EndNote


Aqueous-phase chemistry, wet scavenging, and wet surface uptake during dry deposition are the three major atmospheric wet processes for aerosols and aerosol precursors. Aqueous-phase chemistry plays a role as reaction chamber which efficiently converts aerosol precursors to aerosols (Ervens et al., 2011; Walcek and Taylor, 1986). Wet scavenging, a process by which chemicals accumulate in droplets and then are removed by precipitation, is the predominant removal pathway of aerosols and aerosol precursors (Textor et al., 2006). Dry deposition, where chemicals settle out of the atmosphere in the absence of precipitation, is greatly enhanced due to the absorption of water-soluble gases at wet surfaces associated with dew, fog, and rain (Garland and Branson, 1977; Wesely, 1989). These wet processes significantly impact global mass load and redistribute aerosols and aerosol precursors. Aerosol mass load and its global distributions are important for studies of aerosol optical properties (Kinne et al., 2006), aerosol direct radiative forcing (Myhre et al., 2013; Penner et al., 1994), and the health effects of particulate matter (Shiraiwa et al., 2017; Hopke et al., 2006). A better representation of wet processes in global modeling of aerosols and aerosol precursors can therefore enhance our ability to accurately simulate these different aerosol impacts.
The Goddard Earth Observing System with chemistry (GEOS-Chem) is a widely used community model which is continuously being improved (Holmes et al., 2019; Keller et al., 2014; Martin et al., 2003; Bey et al., 2001). Luo et al. (2019), L2019 hereafter, updated the GEOS-Chem wet scavenging scheme by using the Modern-Era Retrospective analysis for Research and Applications version 2 (MERRA-2) spatially and temporally varying cloud and rainwater to replace the assumption of fixed in-cloud condensation water (ICCW) in the GEOS-Chem rainout parameterization and by using new empirical rates for nitric acid and water-soluble aerosols in washout. These changes together reduced the normalized mean biases (NMBs) of simulated nitric acid, nitrate, and ammonium mass concentrations at the United States' surface monitoring networks from 145 %, 168 %, and 81 % to 24 %, 25 %, and 13 %, respectively. However, the impacts of the updated wet scavenging scheme on simulations over other regions (Europe, Asia, and remote areas) and the free troposphere were not investigated. Moreover, L2019 only investigated the changes of nitric acid, nitrate, and ammonium. The impact of the updated wet scavenging scheme on other aerosols such as sulfate, sea salt, dust, and carbonaceous aerosols was not investigated in that work. Due to the large impact of updated wet scavenging on model simulations, a comprehensive validation of simulated aerosols and aerosol precursors with ground-based monitoring networks for surface mass concentrations and aircraft measurements for vertical profiles is needed.
In this study, we further update the treatments of wet processes (aqueous chemistry, wet scavenging, and wet surface uptake during dry deposition) in GEOS-Chem and evaluate comprehensively simulated major inorganic aerosol precursors (sulfur dioxide, nitric acid, and ammonia) and aerosols (sulfate, nitrate, ammonium, black carbon, and organic carbon) by comparison with a large set of in situ observations. The updates to the wet processes are detailed in Sect. 2. Comparisons of simulations with measurements from surface monitoring networks including the United States Environmental Protection Agency (US EPA), the Interagency Monitoring of Protected Visual Environments (IMPROVE), the Chemical Speciation Network (CSN), the Clean Air Status and Trends Network (CASTNET), the Ammonia Monitoring Network (AMoN), the National Trends Network (NTN), the European Monitoring and Evaluation Programme (EMEP), and the Acid Deposition Monitoring Network in East Asia (EANET) are given in Sect. 3.1. Validations of aerosols and aerosol precursors for the Arctic and the Atmospheric Tomography (ATom) mission are presented in Sect. 3.2 and 3.3. The impact of the updated wet processes on global surface concentrations or aerosols and aerosol precursors are discussed in Sect. 3.4. A summary of our results is given in Sect. 4.
In the publicly released GEOS-Chem version 12.6.0, GC12 thereafter, in-cloud aqueous-phase chemistry was developed by Chin et al. (2000) for SO2. The wet scavenging scheme, including rainout due to formation of precipitation from clouds and washout due to falling precipitation from upper layers, was developed by Jacob et al. (2000) and Liu et al. (2001) for aerosols and by Amos et al. (2012) for gases. Scavenging of aerosol by snow and cold–mixed precipitation was updated by Q. Wang et al. (2011, 2014). Wet surface uptake during dry deposition is represented with constant values of effective Henry's law coefficient for surface resistance calculations (http://wiki.seas.harvard.edu/geos-chem/index.php/Physical_properties_of_GEOS-Chem_species#Definition_of_Henry.27s_law_constants, last access: October 2019).
L2019 showed that the assumption of in-cloud condensation water with a fixed value (1 g m−3) in the rainout parameterization in GC12 is one of the major reasons causing an overestimate in nitrate and ammonium mass concentrations compared to surface monitoring networks over the US. After replacing the fixed value of in-cloud condensation water with MERRA-2 cloud and rainwater, we get an updated equation for rainout loss fraction (Luo et al., 2019):
where F is the fraction of a water-soluble tracer in the grid-box scavenged by rainout, and Δt (s) is the model integration time step. k is the first-order rainout loss rate which represents the conversion of cloud water to precipitation water. ICCW (g m−3) is in-cloud condensation water. Pr (g m−3 s−1) is the rate of new precipitation formation. fc, LCW (g m−3), and ICW (g m−3) are the grid-box mean cloud fraction, liquid-phase cloud water content, and ice-phase cloud water content, respectively.
L2019 also showed that the difference between observations and simulations can be further reduced through (1) the update of empirical washout coefficients by rain for water-soluble aerosol with the value which was calculated by the parameterization of Laakso et al. (2003) for a 500 nm particle diameter, and (2) the new estimated washout coefficients for nitric acid by referring to field measurements for particles with a 10 nm diameter (Laakso et al., 2003) and the theoretical dependence of scavenging coefficients on particle sizes for particles <10 nm (Henzing et al., 2006). L2019 only focused on warm cloud wet scavenging and did not systematically consider the impact of wet process treatments on the simulated aerosols and aerosol precursors. Here, we show that a number of treatments in GC12 and L2019 can be further updated (as detailed below) to improve the performance of GEOS-Chem in simulating spatial and temporal variations of major aerosols and aerosol precursors on a global scale.
2.1 pH for cloud, rain, and wet surface
Water pH is important for dissolution and subsequent aqueous-phase reactions of water-soluble gases (Turnock et al., 2019; Ervens, 2015; Pandis and Seinfeld, 1989). Based on Henry's law, dissolution of water-soluble gases can be calculated as
where fw is the dissolution fraction for water-soluble gases, H∗ (mol L−1 atm−1) is the effective Henry's law constant, R (0.08205 L atm K−1 mol−1) is the gas constant, T (K) is the temperature, and LW (m3 m−3) is the liquid water content.
H∗ represents the impact of temperature, water acidity, and aqueous-phase equilibrium on solubility of water-soluble species (Seinfeld and Pandis, 2016). For SO2, H2O2, and NH3, which are important for aerosol precursor and aerosol simulation, H∗ can be calculated as (Seinfeld and Pandis, 2016)
where , , and are Henry's law constants (M atm−1) for SO2, H2O2, and NH3, respectively. K1 (M), K2 (M), K3 (M), K4 (M2), and K5 (M) are rate coefficients for SO2 reaction, reaction, H2O2 reaction, H2O reaction, and NH3 reaction, respectively. The values of Henry's law constants and rate coefficients are the same as those used in GEOS-Chem aqueous-phase chemistry. [H+] (M) is the hydrogen ion concentration in cloud/rain droplets and at wet surfaces, which is related to pH as
GC12 calculates cloud water pH iteratively by using the concentrations of sulfate, total ammonium (ammonium plus ammonia), total nitrate (nitrate plus nitric acid), SO2, and CO2 based on their effective Henry's law coefficients and cloud liquid water content in corresponding grid box (Alexander et al., 2012). This iterative calculation is updated to use Newton's method in order to arrive at a consistent result (Moch et al., 2020). To implement Newton's method, the equilibrium expressions for the concentrations of each soluble semi-volatile ion (SSVI) in terms of H+ and the derivatives for these equilibrium expressions are each solved explicitly so that Newton's method equation is in the form of
where SNVI is the concentration of soluble nonvolatile ions. For Eq. (7), the concentrations of each ion are multiplied by the ion charge (e.g., the terms for concentrations are multiplied by −2).
In tests with this new calculation, the solution always converged to an answer in less than 20 iterations, but if a maximum of 50 iterations is reached, we set it so that the last two solutions are averaged together. We here considered the solution to converge if the difference between and was less than 0.01. By default, the initial guess for H+ is set to 4.5, but we tested initial guesses ranging from a pH of 2 to 13 and found no change in the values at which the answer converged.
To represent the removal of aerosols due to rainout, GC12 assumes 30 % of sulfate, nitrate, and ammonium are removed away from cloud water before cloud water pH calculation. To take into account the variations in the amount of these species rained out, we use the real-time rainout fractions for corresponding species which are calculated during the treatment of wet scavenging to replace this constant value (i.e., 30 %). Additionally, in GC12, sulfate is assumed to be the only SNVI in cloud water, while ammonium and nitrate are treated as volatile species similar to ammonia and nitric acid:
Previous studies found that observed ammonium–sulfate aerosol molar ratio is lower than 2 over the US (Silvern et al., 2017; Hidy et al., 2014). Guo et al. (2018) found ammonium–sulfate aerosol molar ratio during the Wintertime Investigation of Transport, Emissions, and Reactivity (WINTER) study to be 1.47±0.43 and pointed out that this phenomena indicates an important role of soluble nonvolatile cations in aerosol thermodynamics. To reflect the impact of soluble nonvolatile cations on cloud water pH, we assume that total amount of soluble nonvolatile cations associated with aerosol thermodynamics (SNVC) is 25 % of sulfate. We also consider the contribution of calcium and magnesium based on simulated dust mass in GC12, assuming that 3 % of dust mass is soluble calcium and 0.6 % is soluble magnesium (Farlie et al., 2010; Moch et al., 2020), to SNVIs:
Rainwater pH, which is used for the calculation of effective Henry's law constants of water-soluble gases in rain droplets (Eqs. 3–5), is assumed to be a constant value of 4.5 in GC12. Rainwater pH is determined by the cloud water pH where the rain is produced, uptake of water and ions during rainfall processes, and evaporation of rain droplets. In addition, rainwater pH also depends on temperature (Smith and Martell, 1976). Although it is difficult to fully trace rainwater pH in the model based on current available information in GC12, we use cloud pH where rainout occurs to represent rainwater pH for rainout process and rainwater-mass-weighted cloud pH above where washout occurs to represent rainfall water pH for washout processes in this work. The calculated rainwater pH in this study varied from 4.3 to 6.9.
pH values also affect dry deposition of water-soluble gases via its impact on the uptake due to dissolution at wet surfaces. The origin of surface water where this uptake occurs is therefore important to account for the effect if varying pH. GC12 calculated the effective Henry's constant for dry deposition by assuming a temperature of 298.15 K and leaf water pH of 7. Surface water on land is dominated by leaf water whose pH is ∼7. The pH of ocean surface water varies from 8 to 8.5 (Antonov et al., 2010; Jacobson, 2005). de Caritat et al. (2005) found the pH of the meltwater of the Arctic snow varies from 4.6 to 6.1 with a median value of 5.4. We assume the pH values at wet surface are 7 for land, 8.2 for ocean, and 5.4 for snow in this work.
2.2 Fraction of cloud available for aqueous-phase chemistry
In GC12, the fraction of cloud available for aqueous-phase chemistry is assumed to be 100 % of the grid-box cloud fraction when temperatures are above 258 K and 0 % of the grid-box cloud fraction when temperatures are below 258 K. This means aqueous-phase chemistry in mixed clouds where temperatures are often below 258 K is not considered in GC12. However, many studies have indicated that supercooled cloud water can exist when temperatures are above 237 K (Rosenfeld and Woodley, 2000; Sassen, 1985). Therefore, we calculate aqueous-phase cloud fraction based on MERRA-2 cloud liquid content and cloud ice content when temperatures are higher than 237 K:
where faq is aqueous-phase cloud fraction, LCW (g m−3) is grid-box mean liquid-phase cloud water content, and ICW (g m−3) is grid-box mean ice-phase cloud water content.
2.3 Rainout efficiencies
2.3.1 Warm cloud
GEOS-Chem uses rainout efficiencies to represent the absorptions of water-soluble gases and aerosols in the cloud condensate phase (Jacob et al., 2000; Mari et al., 2000; Liu et al., 2001). After applying these efficiencies with the updated parameterization for rainout loss fraction (Luo et al., 2019), we get the new equation as
where Er is the rainout efficiency for corresponding species. Equation (11) is the same as Eq. (1) except Eq. (11) contains Er in the rainout calculation.
In GC12, rainout efficiencies for water-soluble aerosols are assumed to be 100 %, while those for water-soluble gases, except nitric acid and SO2, are calculated via Henry's law constants (Jacob et al., 2000). Er of nitric acid is assumed to be the same as water-soluble aerosols due to its high solubility. Er of SO2 is assumed to be the same as water-soluble aerosols but limited by the availability of H2O2 in the precipitating grid box (Chin et al., 1996). It means rainout of SO2 in GC12 is attributed to the aqueous-phase oxidation of SO2 by H2O2 rather than the absorption by cloud water. However, GEOS-Chem already accounted for in-cloud oxidation of SO2 as part of the aqueous-phase chemical calculation which converts in-cloud SO2 to sulfate, so doing the same in the scavenging calculation would be double-counting the removal of SO2. Considering the low solubility of SO2 in water, it is more appropriate to calculate rainout efficiency for SO2 based on Henry's law. In the present work, we assume Er of SO2 equals its dissolution fraction:
with calculated with Eq. (2).
In the present work, we also modified rainout efficiencies for hydrophilic black carbon (BC) and primary organic carbon (POC) from 100 % in GC12 to 50 %. The rationale for the modification is that, although the aging of BC and POC in the atmosphere converts these aerosols from hydrophobic to hydrophilic, they are not as easily activated into cloud droplet as water-soluble aerosols (e.g., sulfate, nitrate, ammonium). The composition of the particles decides the hygroscopic parameter kappa which is important for cloud activation calculation (Abdul-Razzak and Ghan, 2000). If BC and POC are internally mixed with the sulfate, nitrate, and ammonium (SNA) aerosols, then they all have similar compositions. However, in the actual atmosphere, many particles are externally mixed: some particles are pure SNA, while others are primary particles (BC, POC, dust, etc.) coated with SNA (Fassi-Fihri et al., 1997). It takes time for primary particles to gain coating through condensation, coagulation, and aqueous chemistry. The amount of SNA coated on primary particles depends on the aging time and abundance of SNA in the air. Based on a detailed size- and mixing-state-resolved advanced particle microphysics (APM) simulation which explicitly resolves the amount of SNA coating (Yu et al., 2012), the hygroscopic parameter kappa of coated BC and POC is roughly about half of that of SNA. More robust calculation of rainout efficiencies for BC and POC should consider the amount of soluble species coated on these particles (Yu et al., 2012; Yu and Luo, 2009), but this will be the subject of future work.
2.3.2 Mixed and cold clouds
In GC12, aerosols in mixed clouds (237 K K) and cold clouds (T<237 K) were assumed to be removed through heterogeneous and homogeneous freezing nucleation (Q. Wang et al., 2014). GEOS-Chem assumed that heterogeneous nucleation dominates ice formation at 237 K K (mixed cloud) and results in 100 % rainout efficiencies only for dust and hydrophobic black carbon which are considered as ice nuclei (IN). Homogeneous nucleation takes place at T<237 K (cold cloud) and results in 100 % rainout efficiencies for both water-soluble aerosol and IN.
Ice nucleation processes and their impacts on aerosol wet scavenging by mixed and cold clouds are largely unclear. However, it is known that ice nucleation rates depend strongly on temperature (DeMott et al., 2015; Kanji and Abbatt, 2010). To take this into account, we parameterize rainout efficiencies at warmer temperatures based on the fraction of dust in mixed clouds contributing to IN, which can be calculated as a function of T according to DeMott et al. (2015) as
In addition to T, ice nucleation efficiency of particles also depends on their sizes, and smaller particles (diameter <500 nm) are less likely to act as IN (Niedermeier et al., 2015). While most of the mass of dust particles is dominated by those larger than 500 nm (Zender et al., 2003), a significant fraction of BC particles are smaller than 500 nm (Sahu et al., 2012). Based on the sectional aerosol microphysics calculation in GEOS-Chem APM (Yu and Luo, 2009), the mass fraction of BC particles with diameter >500 nm is ∼50 %. In this study, we assume Er for hydrophobic BC in both mixed clouds (237 K K) and cold clouds (T<237 K) is 50 % of those values for dust.
Water-soluble aerosols are 100 % removed via homogeneous freezing nucleation in cold clouds (Q. Wang et al., 2014; Liu et al., 2001). Strom et al. (1997) observed that ∼40 % of pre-existing aerosol mass is incorporated in ice crystals. In this work, we assume cold cloud rainout efficiencies are 40 % for water-soluble aerosol, 50 % for hydrophobic black carbon, and 100 % for dust, respectively. Additionally, rainout of cold clouds is limited to below the MERRA-2 troposphere since stratospheric water in MERRA-2 is known to have unphysical behavior.
In GC12, cold cloud wet scavenging of nitric acid is treated the same as water-soluble aerosol. However, in cold clouds (T<237 K), nitric acid is removed by the partitioning on ice crystals (Kärcher and Voigt, 2006; Voigt et al., 2006), while water-soluble aerosol is removed by homogeneous freezing nucleation. Kärcher et al. (2008) used a climatology of cirrus ice water content together with observed molar ratios of HNO3∕H2O in cirrus ice particles to estimate the range of nitric acid content in cirrus ice (185–240 K). Their study showed that less efficient nitric acid uptake limits the nitric acid content in cirrus ice at higher temperatures and small ice water content permits only little nitric acid in ice at low temperatures. The fraction of nitric acid in ice generally increases with decreasing temperature. Kärcher and Voigt (2006) attributed this behavior to less efficient nitric acid trapping at higher temperatures despite faster ice growth rates, which is caused by an increasingly rapid escape of adsorbed nitric acid into the gas phase. A parameterization of nitric acid partitioning in cold clouds developed by Kärcher et al. (2008) is employed here to calculate Er of nitric acid in cold clouds when temperature is below 240 K:
where is the volume mixing ratio of in-cloud water and in-cloud ice, and [HNO3]vmr is volume mixing ratio for nitric acid gas.
2.4 Empirical washout coefficients by rain and snow
Washout coefficients by rain and snow in GC12 were updated by Wang et al. (2011) by adopting the parameterization constructed by Feng (2007, 2009) for individual aerosol modes. Accumulation-mode washout coefficients were used for all aerosols except dust and sea salt, for which the coarse-mode coefficients were used. Previous studies noticed that washout rates by rain derived from field measurements are 1 to 2 orders of magnitude larger than the values from theoretical calculation (Wang et al., 2010; Luo et al., 2019). Therefore, L2019 recommended using empirical washout coefficients for the simulation of washout by rain.
X. Wang et al. (2014) found that the large differences in washout rate between field measurements and theoretical calculation not only appear in washout by rain but also appear in washout by snow. In this work, we use the semi-empirical parameterization developed by X. Wang et al. (2014) for the calculation of nitric acid and aerosol washout by both rain and snow. Washout rate is calculated by an exponential equation:
where kwash (s−1) is the washout rate, Pd (mm h−1) is rain or snow falling from upper layers, fr is rainfall area fraction, Λ is washout scavenging coefficient, and b is an exponential coefficient.
The values of Λ and b for nitric acid and aerosol washout by rain (T>268 K) and snow (248 K K) are shown in Table 1. We assume precipitation at temperatures lower than 248 K is dominated by ice. GC12 assumed washout of aerosol by ice is the same as that by snow. However, uptake of aerosol by ice and by snow is different. Schneider et al. (2019) found specific surface area (SSA) of ice crystals is approximately one-fifth of SSA of snow. Therefore, in this work, we roughly assume washout rate by ice (T<248 K) is one-fifth of that by snow. Washout of nitric acid uses the same values as in L2019 but we extend the temperature limitation from 268 to 248 K. Washout of nitric acid by ice is assumed to be one-fifth of that by snow. Empirical washout coefficients by rain and snow for coarse aerosol and hydrophobic fine aerosol in this work are based on the values in X. Wang et al. (2014). Because the rain washout rate for water-soluble aerosols measured by Laakso et al. (2003) is still ∼20 times larger than that calculated by the semi-empirical parameterization, we used the value of to replace for hydrophilic aerosol's washout by rain. The washout coefficient of hydrophilic aerosol by snow is replaced with the value of , which is 20 times higher than the value by rain. The assumption of different washout coefficients for hydrophobic and hydrophilic aerosols is because the rain washout rate for water-soluble aerosols measured by Laakso et al. (2003) is larger than that calculated by the semi-empirical parameterization. One of the possible reasons is that droplet–particle collection mechanisms for hydrophobic and hydrophilic aerosols are different. Washout by ice is assumed to be one-fifth of that by snow.
Table 1List of Λ and b values in Eq. (15) for rain and snow washout parameterizations.
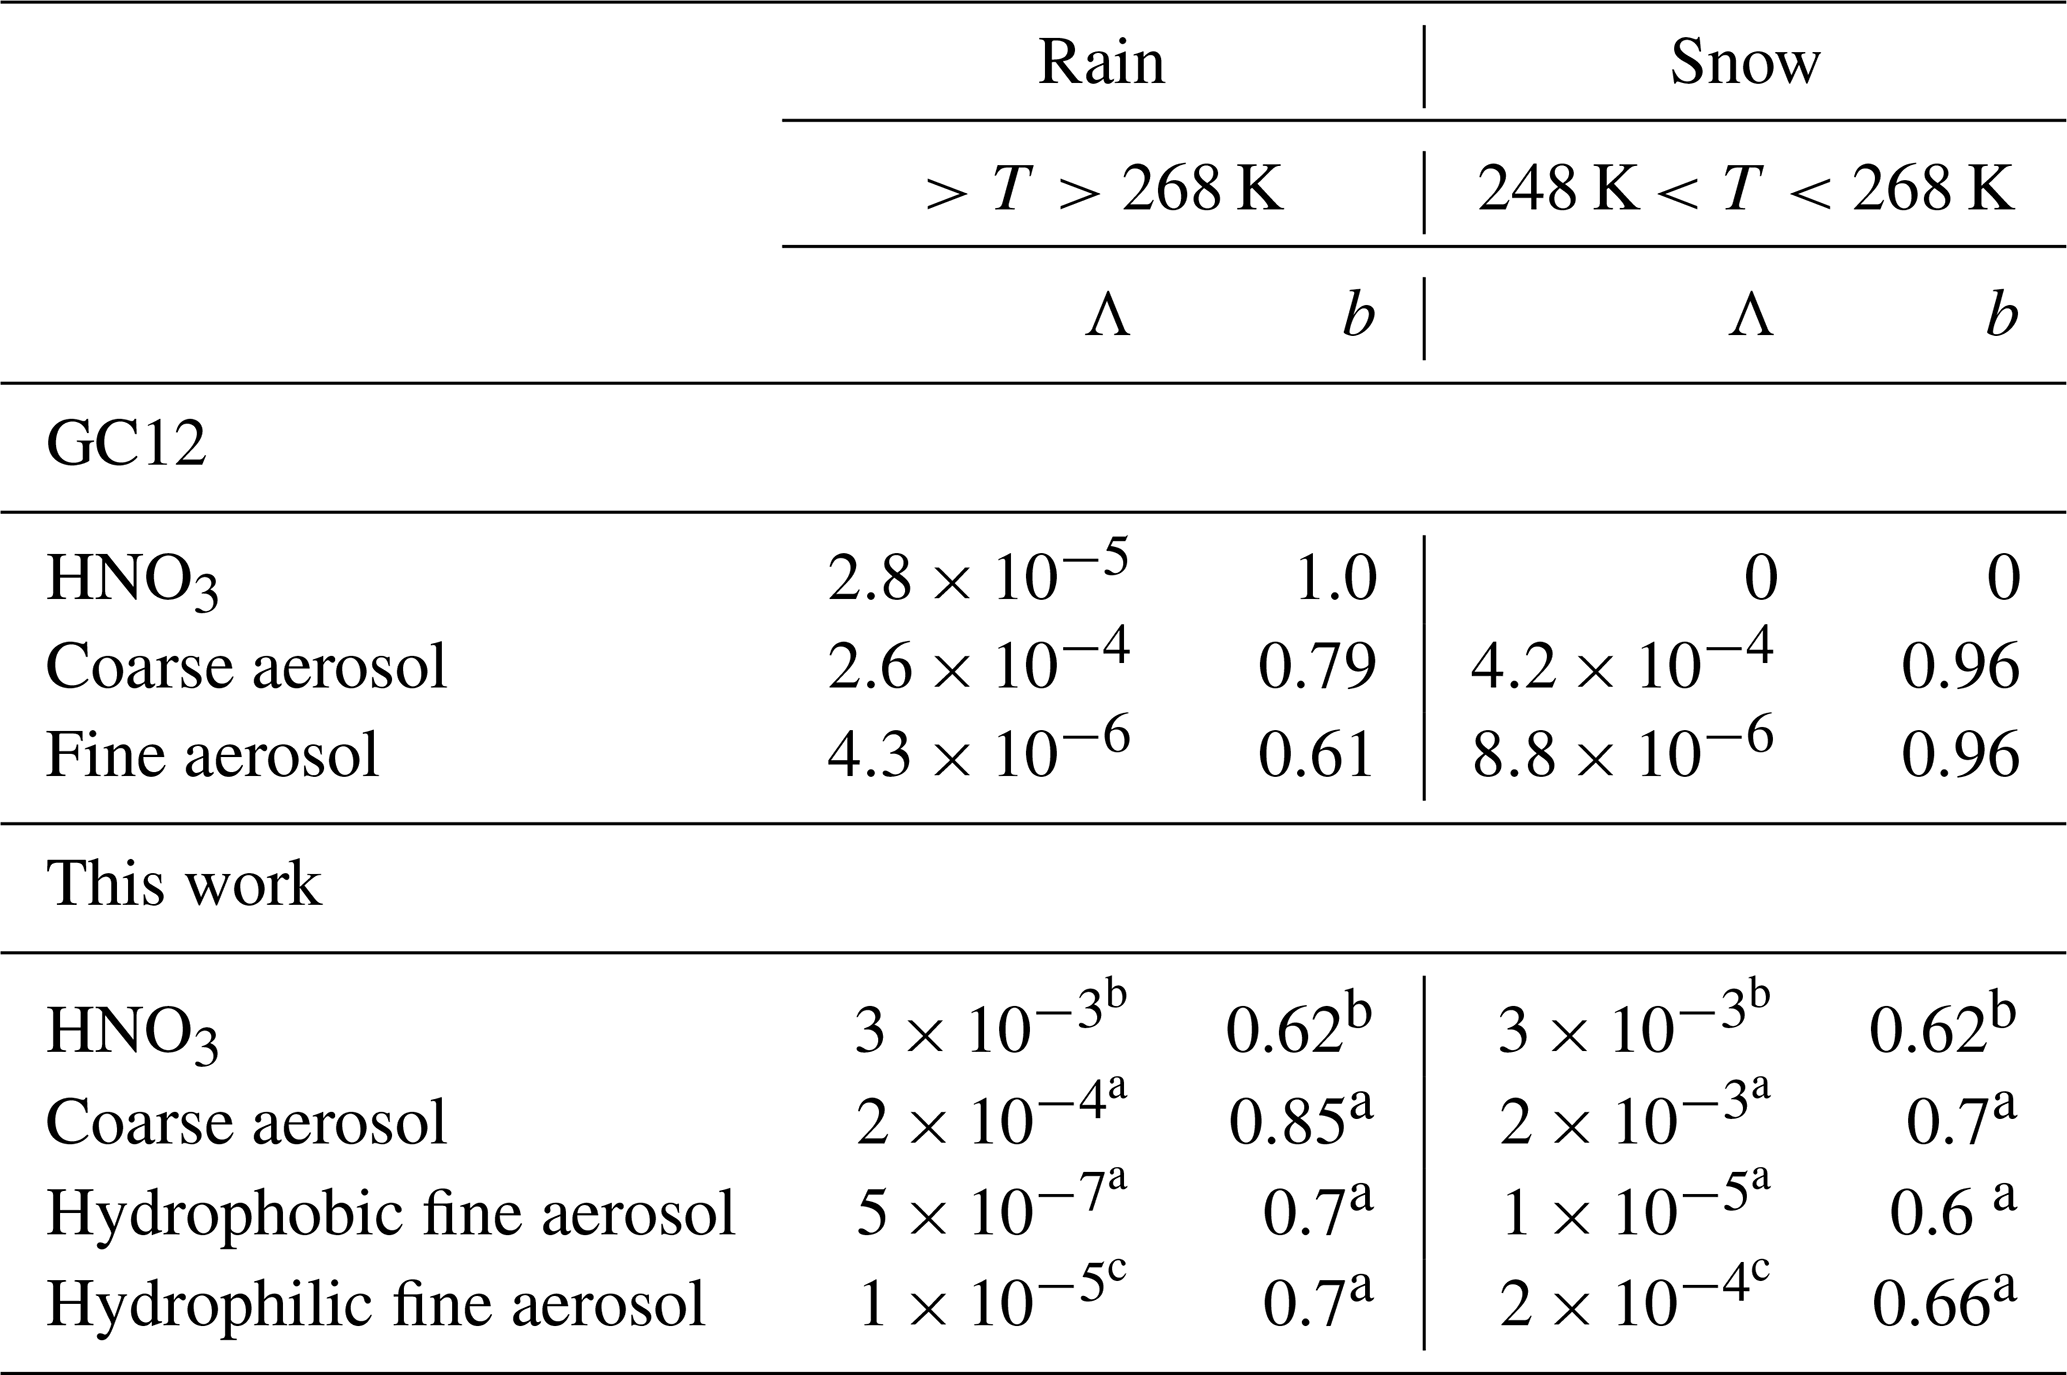
a From X. Wang et al. (2014) assuming fine aerosol with diameter of 100 nm and coarse aerosol with diameter of 6 µm. b From Luo et al. (2019). c This work.
2.5 Wet surface uptake during dry deposition
Uptake of water-soluble gases at wet surfaces is strongly influenced by dissolution processes. The solubility of SO2, H2O2, and NH3 at wet surfaces needs to be calculated via the effective Henry's law coefficient because it is associated with a series of aqueous-phase reactions (Seinfeld and Pandis, 2016). In GC12, H∗ of SO2, H2O2, and NH3 for dry deposition are assumed to be the constants with the values of 105, 5×10⁷, and 2×10⁴ M atm−1, respectively (http://wiki.seas.harvard.edu/geos-chem/index.php/Physical_properties_ of_GEOS-Chem_species#Definition_of_Henry.27s_ law_ constants, last access: October 2019). In this work, we consider the impacts of temperature and pH at wet surface on the values of H∗ (Erisman et al., 1994; Wesely et al., 1990), and the values of H∗ for SO2, H2O2, and NH3 are calculated with Eqs. (3)–(5). Wet surface pH values discussed in Sect. 2.1 are used to reflect the impact of wet surface acidity on dissolution during dry deposition. Wet surface pH values are only determined by land type and are not altered by precipitation. Ganzeveld et al. (1998) reported that observations and physical–chemical model simulations indicated SO2 dry deposition velocity increases from a minimum value of 0.01 cm s−1 for a temperature of 253 K to a value of 0.15–0.25 cm s−1 for 273 K. Therefore, in this work, we assume SO2 dry deposition velocity over snow and ice is 0.01 cm s−1 when temperatures are lower than 253 K.
To investigate the impacts of updated wet processes on global simulation of aerosols and aerosol precursors, we run GEOS-Chem for three cases: (1) standard Geos-Chem version 12.6.0, called GC12; (2) the same as case GC12 except using wet scavenging described in the work of Luo et al. (2019), and this case is named L2019; (3) the same as the case L2019 except considering the updated wet processes described in Sect. 2, and this case is called WETrev. All simulations are run with horizontal resolution and 47 layers from surface to 0.01 hPa. Emission over Europe is based on the EMEP inventory. Other emissions are produced by the default setting of HEMCO (Keller et al., 2014) for all simulations presented in this work.
3.1 Comparison with surface monitoring networks over the US, Europe, and Asia
To validate model results with surface monitoring networks, we use observational data taken at US EPA, CASTNET, AMoN, IMPROVE and CSN, EMEP and EANET sites. The criterion of observations used for model validation is that valid data are available for every month in 2011. For EANET observations, due to too much missing data, the criterion is loosened to monthly mean data available for each month during a 3-year period (2010–2012). Seto et al. (2007) pointed out that EANET observations at urban sites are much higher than those at remote sites. Since the number of the Asian sites is very limited, to make the validation more appropriate, only remote and rural sites are used for model validation. Table 2 shows the number of sites with observations and the number of sites satisfying these criteria. Figure 1 and Table 3 present the comparisons of observed secondary inorganic aerosol precursors and secondary inorganic aerosols at surface monitoring networks and the simulated mass concentrations by the GC12, L2019, and WETrev cases described above. As shown in Fig. 1a–c, simulated SO2 for the three cases is lower than observed values over the US but higher than the observations over Europe and Asia. Over the US, simulated SO2 is ∼20 % lower than observations. One possible reason is that a large amount of US EPA observations are located at urban regions where SO2 concentrations are much higher than rural and remote regions. There were 288 US EPA sites with valid data in each month of 2011. Only 69 of these sites were with the mark of “not in a city”. After considering the updates of wet scavenging by L2019, NMBs are increase from 20 % to 23 % over the US, reduced from 74 % to 59 % over Europe, and reduced from 63 % to 43 % over Asia, respectively. Consideration of updated wet processes in this work further reduces NMBs to 51 % in Europe and 23 % in Asia, respectively.
Table 2Number of sites with surface concentration observation (NVO) and number of sites satisfying criterion (NSC) at surface monitoring networks in the US, Europe, and Asia.
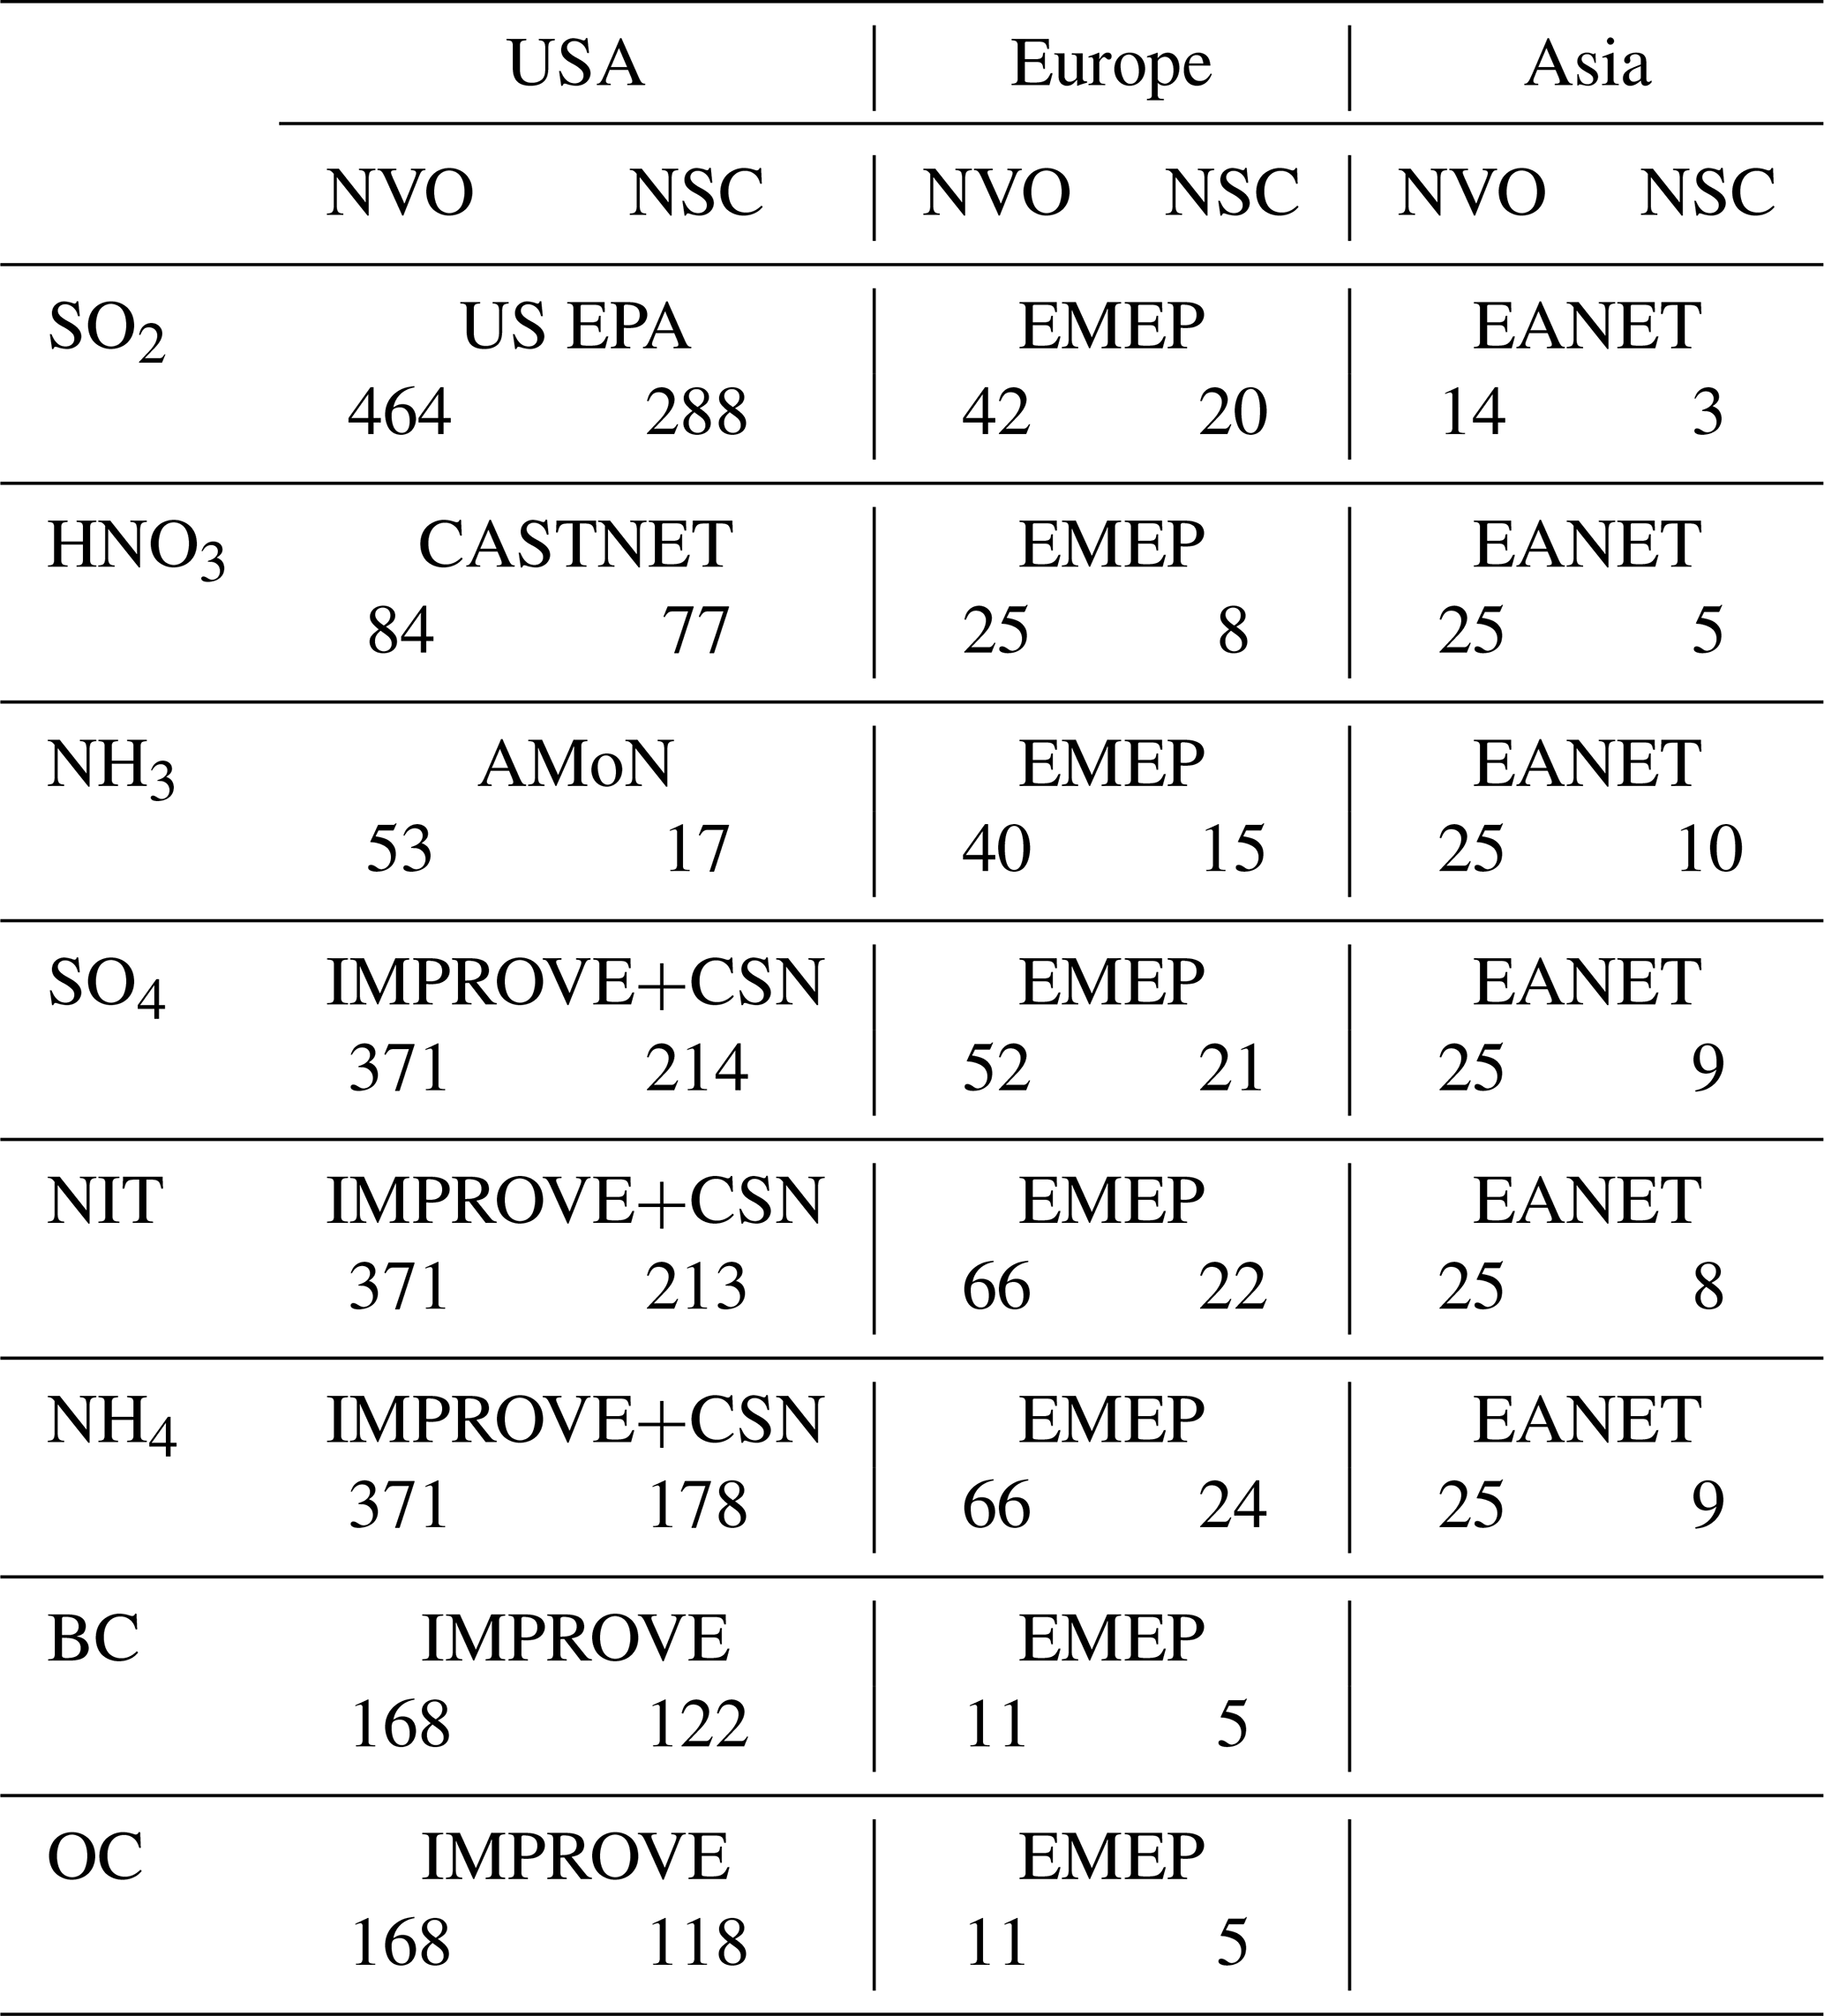
Table 3Observed and simulated annual mean surface concentrations of aerosols and aerosol precursors in the US, Europe, and Asia. Comparisons include annual mean surface concentrations (M, µg m−3), normalized mean bias (NMB, %), and correlation coefficient (r, when the number of samples >10) between observed and simulated annual mean values for the eight species by GC12, L2019, and WETrev cases.

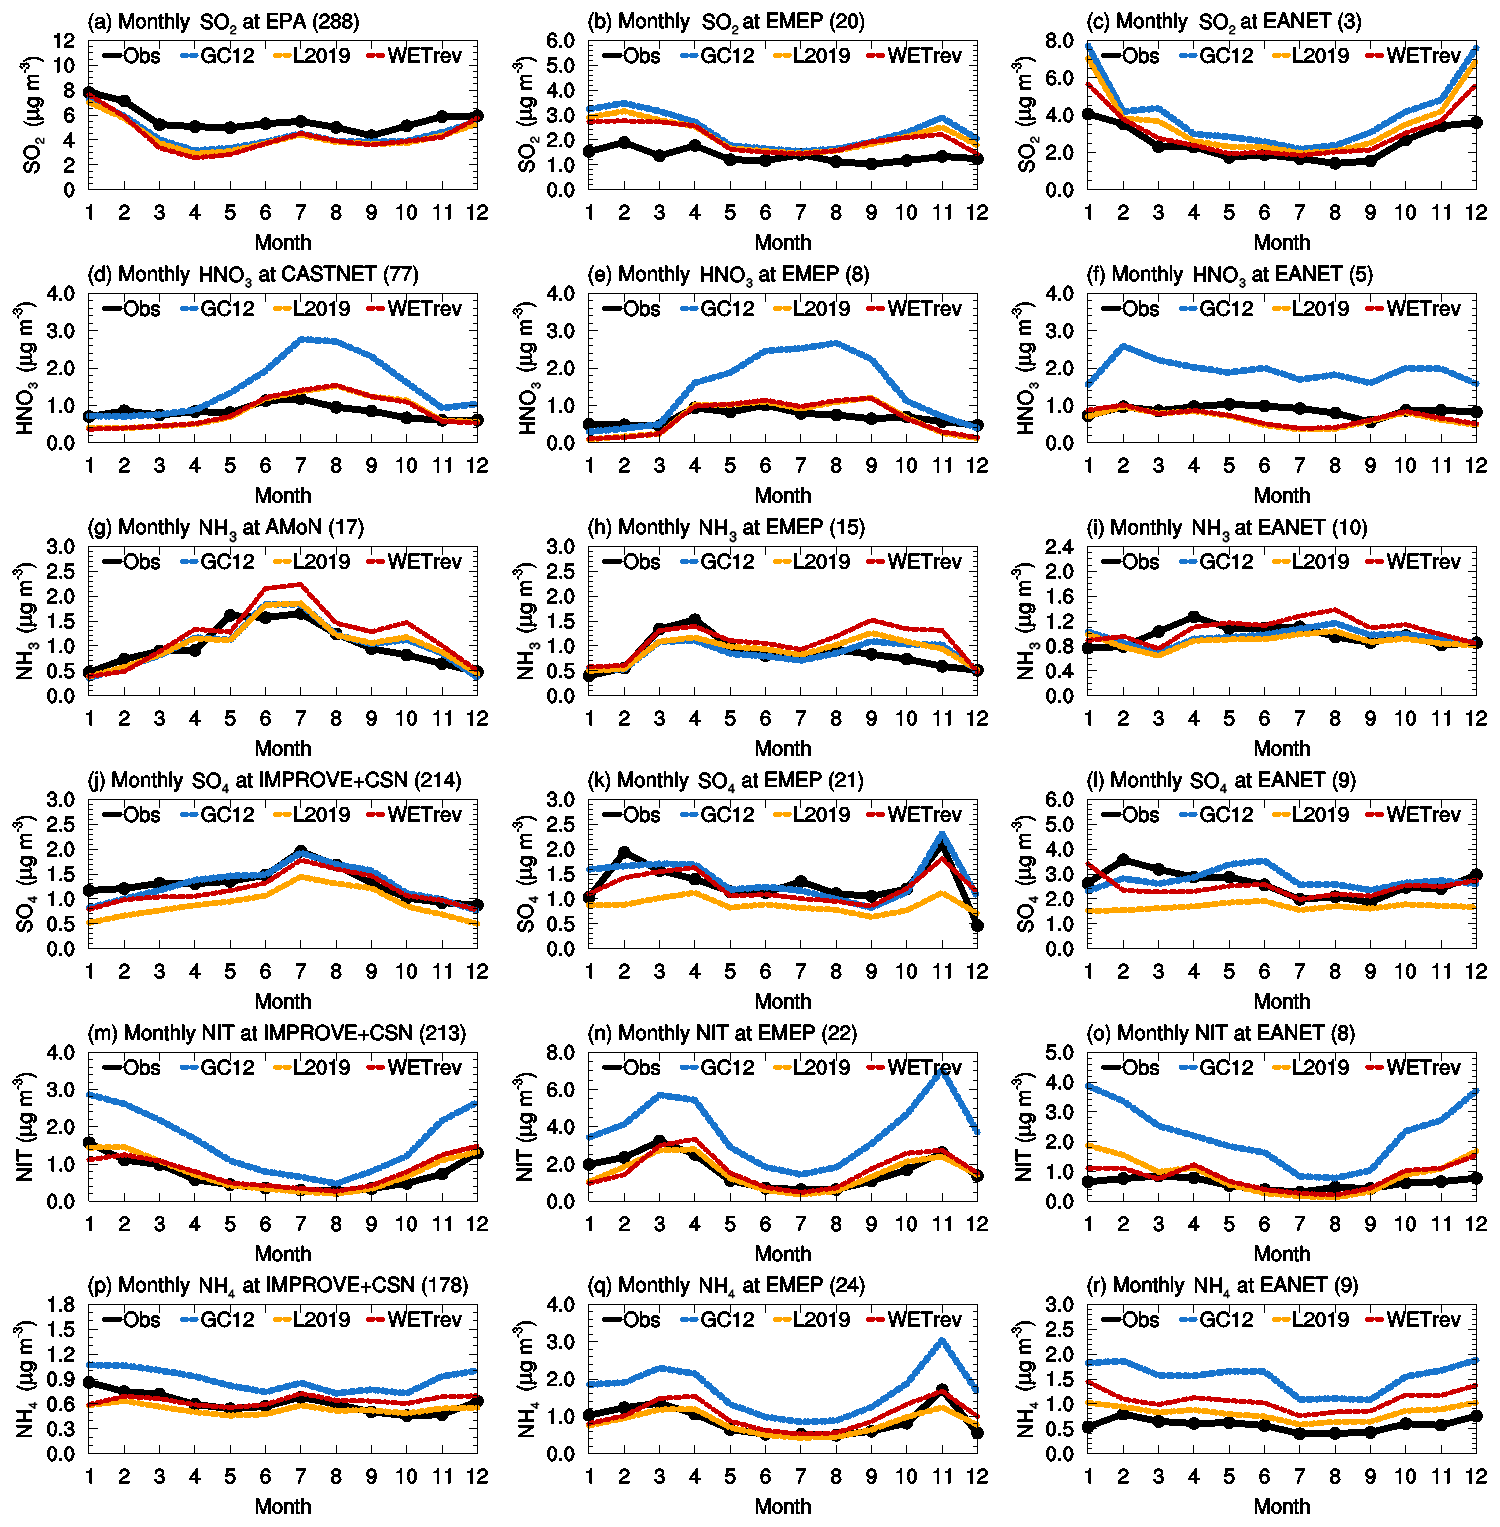
Figure 1Variations of monthly means for the year 2011 showing the comparisons of SO2, nitric acid, ammonia, sulfate, nitrate, and ammonium surface mass concentrations which are observed over (left column) the US, (center column) European, and (right column) Asian sites (black) and simulated by GC12 (blue), L2019 (yellow), and WETrev (red) cases.
Figure 1d–f are the results for nitric acid. NMBs of simulated nitric acid by GC12 for the US, Europe, and Asia are 78 %, 107 %, and 121 %, respectively. GC12 significantly overestimates the surface mass concentration of nitric acid in these regions. Simulations by L2019 and WETrev indicate that wet scavenging is the dominant process causing the overestimation of nitric acid in GEOS-Chem. NMBs of simulated nitric acid in WETrev for the US, Europe, and Asia are reduced to 0.9 %, −0.7 %, and −21 %, respectively. We also notice that WETrev underestimates nitric acid at low temperatures for US and European sites. These underestimates may be associated with the updated uptake coefficients by Holmes et al. (2019) for heterogeneous chemistry. If we switch back to the old heterogeneous chemistry in GEOS-Chem version 12.5, the underestimation of nitric acid at low temperatures is reduced (not shown). Figure 1g–i show that the biases of model-simulated ammonia by the three cases over the three regions are small. Since the increasing ammonia wet deposition is compensated by less equilibrium partitioning with decreased nitric acid in the air, wet processes show a relatively small impact on the simulation of ammonia.
Figure 1j–l are observed and simulated sulfate over the US, Europe, and Asia. NMBs of the GC12 case over the three regions are −1.1 %, 6.9 %, and 5.5 %, respectively. The application of updates to wet scavenging in L2019 leads to a significant underestimation of sulfate during wintertime, reaching up to 50 % over the three regions. Based on our investigation, we found that the absence of aqueous-phase chemistry in mixed clouds appears to be the main reason of underestimated sulfate at low temperatures. As we discussed in Sect. 2, aqueous-phase chemistry in GC12 is only simulated when temperatures are higher than 258 K. Conversely, in the WETrev case, the temperature limitation of aqueous-phase chemistry is extended from 258 to 237 K. This change allows aqueous-phase chemistry to be simulated when temperatures are low. After employing the new approaches of cloud water pH and aqueous-phase cloud fraction calculation, NMBs of the WETrev case in the three regions are −10 %, 4.3 %, and 6.3 %, respectively. It significantly reduces the bias shown in the L2019 case. The absence of aqueous-phase hydroxymethanesulfonate chemistry may also be a potential reason for the remaining model biases with sulfate, but this is not explored here (Moch et al., 2018). NMB of sulfate simulated by WETrev in the US is higher than that of GC12. However, the good agreement between GC12 sulfate and the observation can be attributed to the coincidental offsets of the higher sulfate mass due to the underestimation of sulfate wet scavenging and the lower sulfate mass due to the absence of aqueous-phase chemistry in mixed cloud and hydroxymethanesulfonate chemistry. As shown in Fig. 1m–r, simulated nitrate and ammonium in the GC12 case over the three regions are much higher than observations. As discussed in Luo et al. (2019), the overestimation is associated with the underestimation of rainout and washout of nitric acid and nitrate. Updated wet scavenging in L2019 successfully reduces NMBs of nitrate over the three regions from 126 % to 10 %, 127 % to 7.5 %, and 269 % to 47 %, respectively. NMBs of ammonium over the three regions are reduced from 45 % to −13 %, 90 % to −7.3 %, and 167 % to 42 %, respectively. Updated wet processes in this work show a relatively small impact on simulated nitrate and ammonium surface mass concentrations over the three regions.
For simplicity, the WETrev case includes all updates to wet processes as described in Sect. 2. To understand the contribution of various updates to the overall changes in the predicted concentrations of aerosols and aerosol precursors, we carry out five numerical sensitivity study cases (RO, WO, RP, DD, and AC). The RO case is the same as the WETrev case except using rainout rate in GC12; the WO case is the same as the WETrev case except using washout rate in GC12; the RP case is the same as the WETrev case except assuming pH of rainwater for wet scavenging is 4.5; the DD case is the same as the WETrev case except using dry deposition treatment in GC12; and the AC case is the same as the WETrev case except using aqueous-phase chemistry treatment in GC12. Relative contributions to the changes are calculated as
where RC is the relative contribution (%), C is simulated surface mass concentration (µg m−3), i is the numerical sensitive study case index (e.g., when i=1, Ci,j refers to CRO,j), and j is the site index.
Relative contributions of RO, WO, RP, DD, and AC to the changes of January and July surface concentrations over the US, European, and Asian sites are summarized in Table 4. In the US, the changes of SO2 are mainly caused by DD and AC, whose contributions are up to 54.2 % and 25.0 % in January and 50.5 % and 22.3 % in July. Rainout and washout both show a relatively small impact on the changes of SO2. In contrast, rainout and washout are important to the changes of nitric acid, sulfate, nitrate, and ammonium. The contribution of wet scavenging to the changes of these species exceeds 50 % in both January and July. For nitric acid, nitrate, and ammonium, the contribution of wet scavenging can be as high as 70 %–90 %. For sulfate, AC also plays an important role with relative contributions in January and July of 29.5 % and 17.5 %, which is comparable to the contributions of RO and WO. For ammonia, most of the changes are caused by DD and AC, with the sum of the two processes contributing >50 % of the changes. The contribution of RP to SO2, sulfate, ammonia, and ammonium is small in January and large in July. In July, the contribution of RP to SO2, sulfate, ammonia, and ammonium is 8.5 %, 4.4 %, 13.4 %, and 4.1 %, respectively. The relative contribution from RO, WO, RP, DD, and AC at the sites over Europe and Asia are similar to those over the US (Table 4).
Table 4Relative contribution (%) of modified rainout (RO), washout (WO), rain pH (RP), dry deposition (DD), and aqueous chemistry (AC) to the changes of January and July surface concentrations at the US, European, and Asian sites.
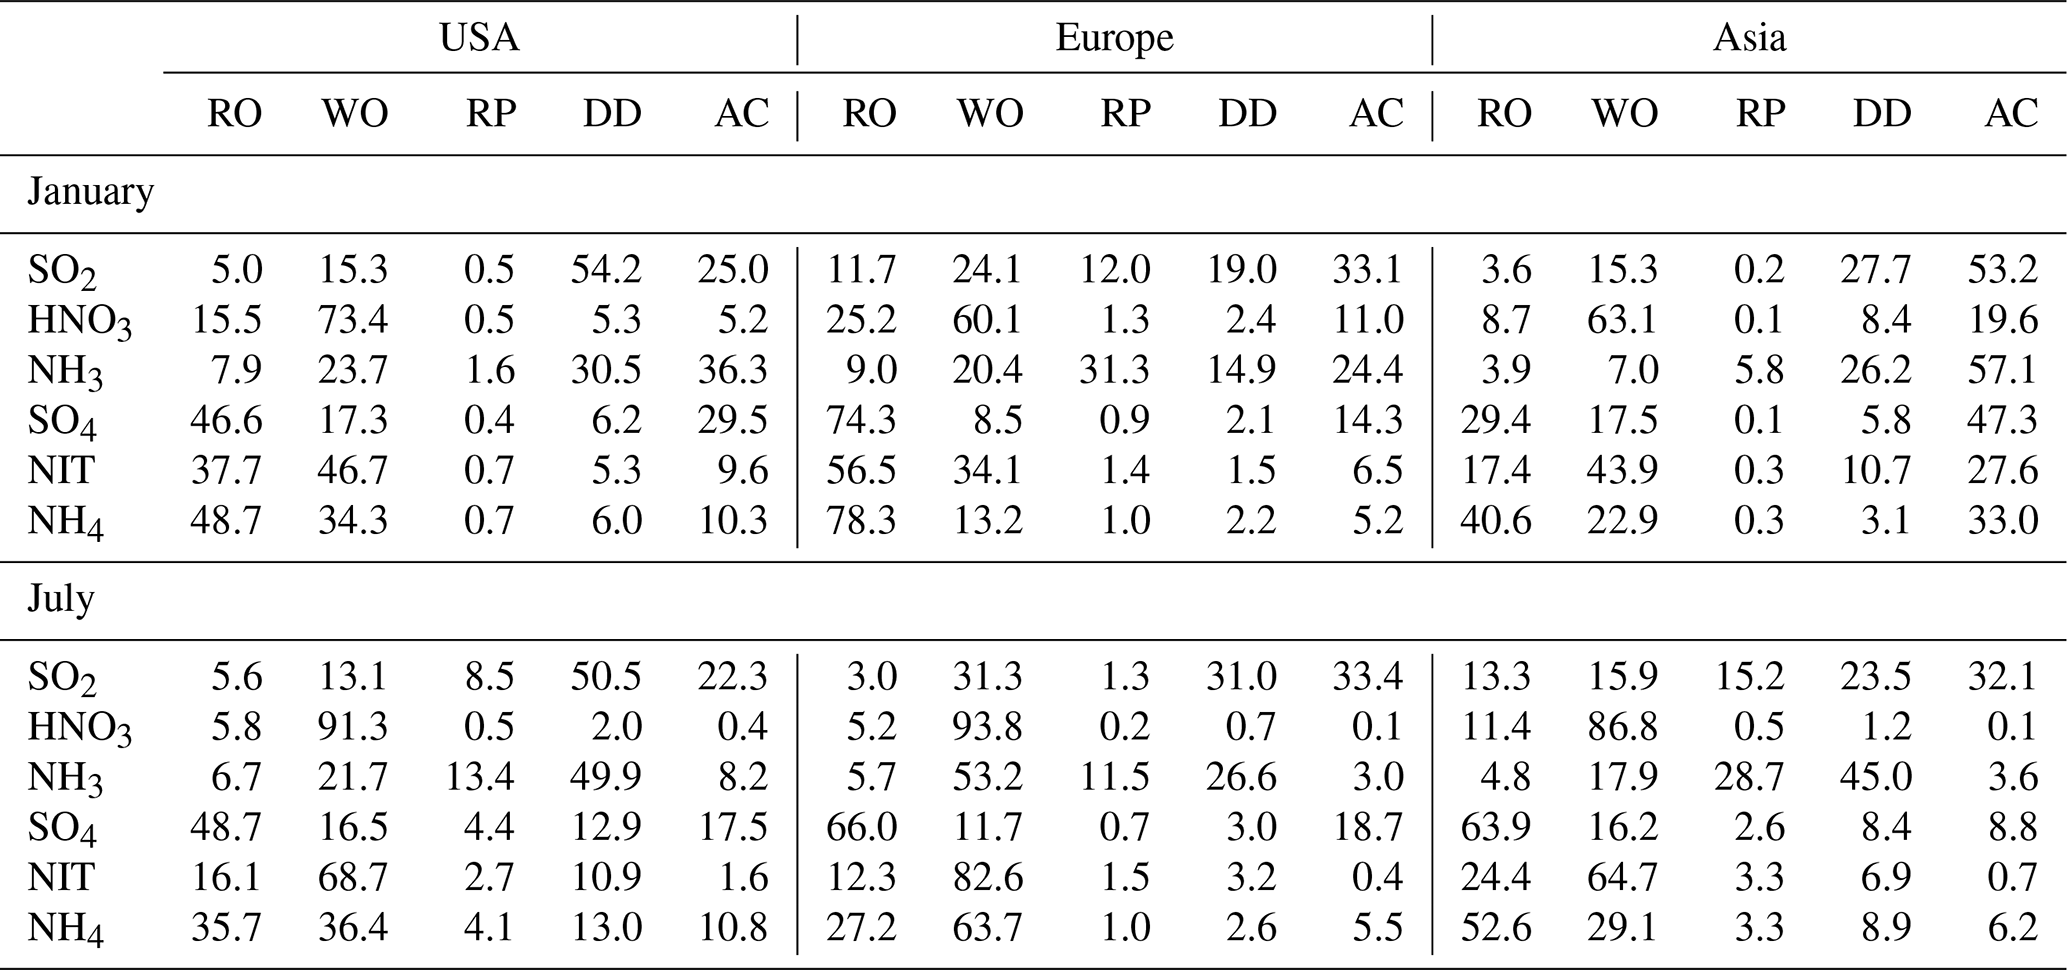
Figure 2 is a comparison of observed BC and OC over the US and Europe. Simulated BC over the US is close to observations except for a 10 %–20 % underestimate during summer and fall. The underestimate is likely associated with the underestimated wildfire emissions in the western US (Mao et al., 2015). Simulated OC over the US is close to observations during summer but 50 %–60 % lower than observations during spring and fall. GEOS-Chem (all three cases) significantly underestimates BC and OC over Europe and the possible reasons behind the bias remain to be investigated. NMBs of the BC and OC in Europe are up to −37 % and −61 %, respectively. The differences of simulated BC and OC in the three cases are small for the US and Europe which indicates wet processes have a small impact on the simulation of BC and OC in these regions. The small impact of wet processes on BC in the US and Europe is because 80 % of emitted BC is assumed to be hydrophobic aerosol which needs 1.15 d to be converted to hydrophilic BC. Updated wet processes have little impact on hydrophobic aerosol in the lower troposphere where wet scavenging is dominated by warm clouds. OC consists of primary organic aerosol (POA) and secondary organic aerosol (SOA) which is formed through the oxidation of organic gaseous precursors. Due to the low dissolution of POA and organic gaseous precursors in water, wet processes also have little impact on these species.

Figure 2Variations of monthly means for the year 2011 showing the comparisons of black carbon and organic carbon surface mass concentrations which are observed over (a, c) the US and (b, d) European sites (black) and simulated by GC12 (blue), L2019 (yellow), and WETrev (red) cases.
Wet deposition of simulated SO2+SO4, HNO3+NIT, and NH3+NH4 are compared with NTN observations over the US (Fig. 3), EMEP observations over Europe (Fig. 4), and EANET observations over remote regions in Asia (Fig. 5). The criteria of observations used for model validation are (1) valid data are available for each month in 2011 and (2) the difference between observed and simulated monthly precipitation is within a factor of 4 (Paulot et al., 2014). The number of sites with observations and the number of sites satisfying these criteria are shown in Table 5. For the comparison shown in Table 6, model-simulated wet deposition is corrected following Paulot et al. (2014) to remove bias due to precipitation. As shown in Fig. 3 and Table 6, GC12 underestimates SO2+SO4 wet deposition over the US and Europe. NMBs of SO2+SO4 wet deposition simulated by GC12 over the two region are −21 % and −46 %, respectively. After considering the updated wet processes in WETrev, NMBs of SO2+SO4 wet deposition are reduced to −9.0 % over the US and −6.2 % over Europe, respectively. However, all the three cases significantly underestimate SO2+SO4 wet deposition over Asia. One possible reason is that GEOS-Chem may underestimate eruptive volcanic emission near the four Japanese sites. For HNO3+NIT wet deposition over the US, the values simulated by GC12 are close to observations, while the values simulated by WETrev are ∼2 times higher than observations. However, wet deposition data are collected weekly at NTN sites. It is hard to estimate the uncertainty due to the evaporation of HNO3 from the collected precipitation water. Over Europe and Asia, wet deposition fluxes are observed daily at most of EMEP and EANET sites. The values of HNO3+NIT wet deposition simulated by GC12 are lower than observations, while the values simulated by WETrev are higher than observations. For NH3+NH4, GC12 underestimates wet deposition over the US, Europe, and Asia. NMBs over the three regions are −10 %, −33 %, and −10 %, respectively. NMBs of NH3+NH4 wet deposition simulated by WETrev are reduced to −7.7 % over Europe and −2.5 % over Asia, respectively.
Table 5Number of sites with wet deposition observation (NVO) and number of sites satisfying criterion (NSC) at surface monitoring networks in the US, Europe, and Asia.
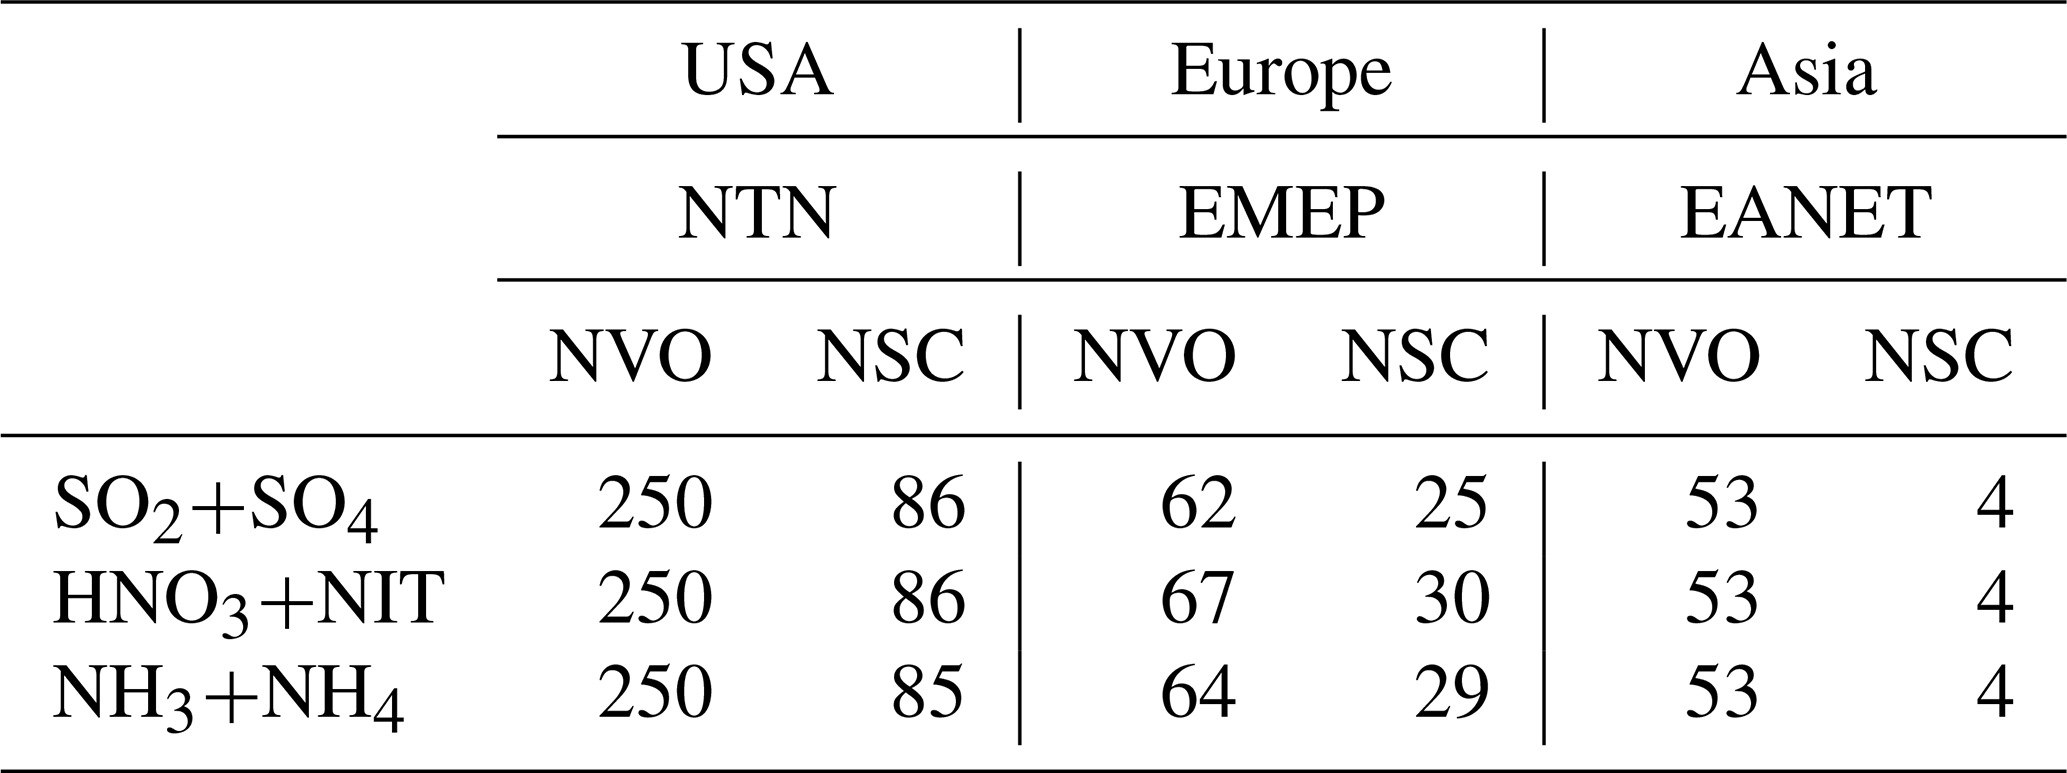

Figure 3Horizontal distributions of SO2+SO4 deposition over the US (a, d), Europe (b, e), and Asia (c, f). Filled circles are annual mean wet deposition at NTN, EMEP, and EANET corrected following Paulot et al. (2014) to remove bias due to precipitation.
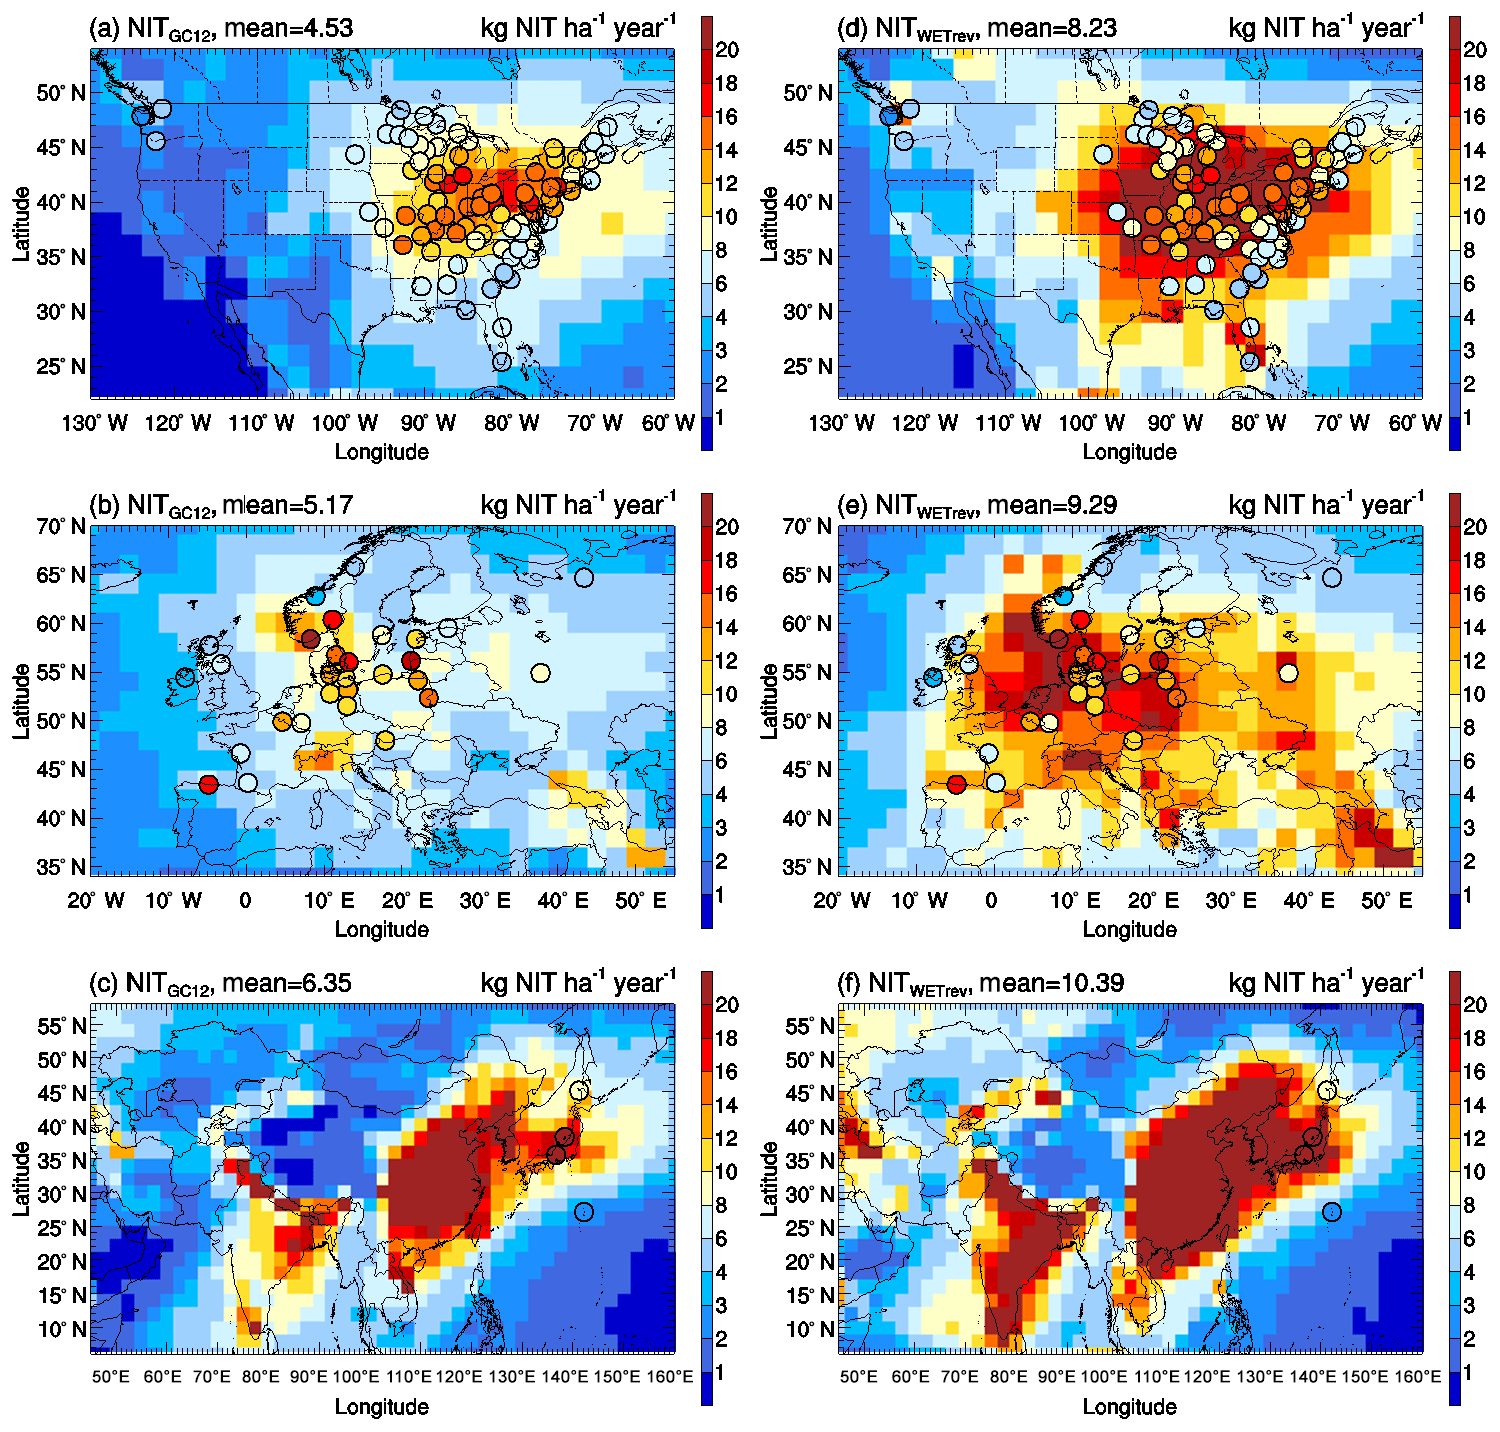
Figure 4The same as Fig. 3 but for HNO3+NIT.
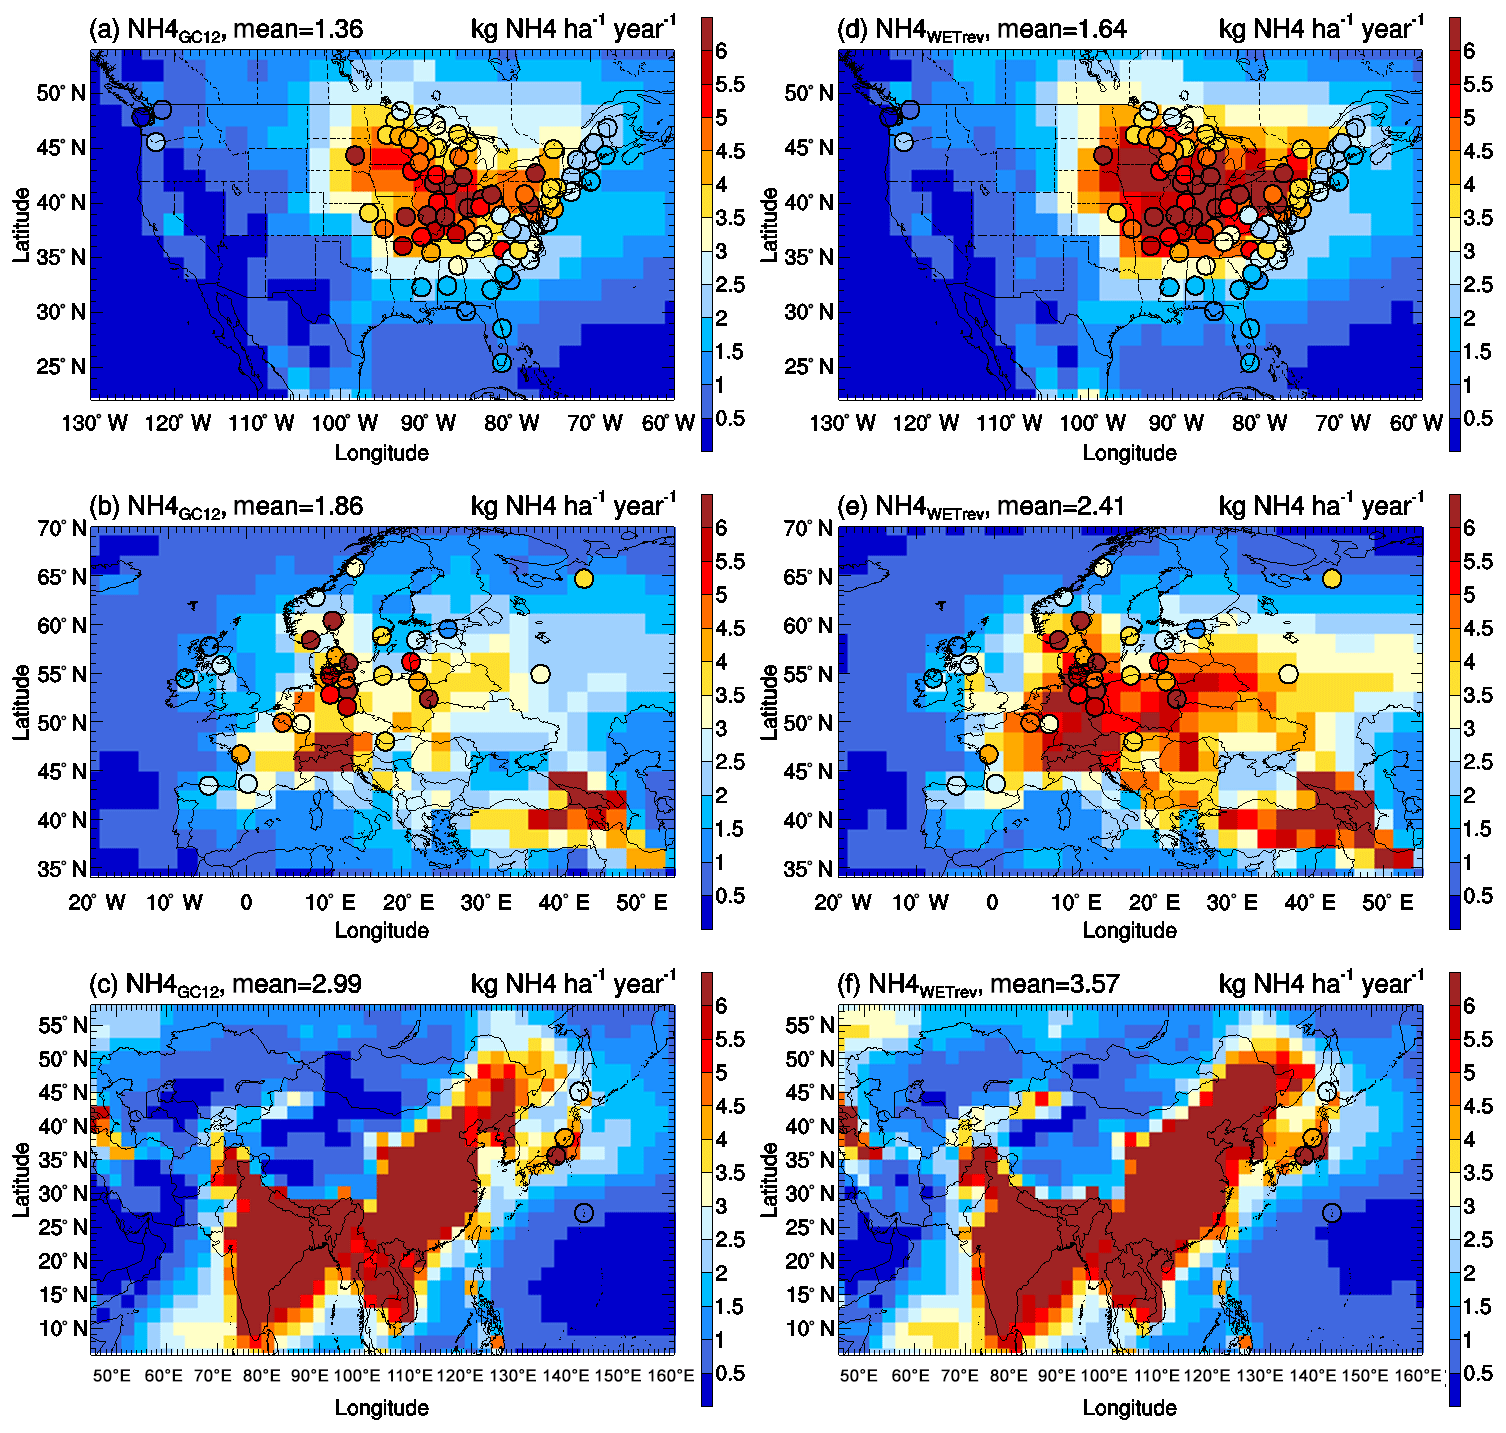
Figure 5The same as Fig. 3 but for NH3+NH4.
3.2 Comparison of SO2, sulfate, and BC mass concentrations at Arctic sites
We also study the impact of updated wet processes on SO2, sulfate, and BC surface mass concentrations at several Arctic sites where measurements are available. Figure 6 shows the comparison of SO2 at Nord (81.6∘ N, 16.7∘ W) and Zeppelin (78.9∘ N, 11.9∘ E). GC12 matches well with the observed SO2 at Nord but overestimates SO2 at Zeppelin in January and December by a factor of 3. The updated wet scavenging (yellow line) shows a small impact on simulated SO2 in the Arctic., with simulated SO2 reduced slightly during winter and spring. In WETrev, we assumed SO2 dry deposition velocity is 0.01 cm s−1 when temperatures are lower than 253 K. WETrev slightly enhances SO2 at the higher-latitude site (Nord) during winter. At Zeppelin, temperature in December is higher than that in January and February, and SO2 concentration is enhanced due to the modification of dry deposition in this work. However, there is more aqueous-phase chemistry in December which consumes the enhanced SO2. By switching from GC12 to WETrev, NMB of SO2 is increased from −23 % to 32 % at Nord and decreased from 27 % to 22 % at Zeppelin. Figure 7 compares the observed and simulated sulfate and BC at Alert (82.5∘ N, 62.5∘ W), Barrow (71.3∘ N, 156.6∘ W), and Zeppelin. Observations at the three sites show that both sulfate and BC are high in spring and low in summer. The model simulations generally capture seasonal variation at these Arctic sites. However, GC12 overestimates sulfate mass concentration at the three sites by a factor of 2–3. Simulated BC by GC12 is 50 % lower than observation at Alert during winter and spring and a factor of 2 higher than observations at Barrow and Zeppelin during winter. Updated wet scavenging significantly impacts simulated sulfate and BC in Arctic regions. Simulated sulfate by L2019 is much closer to observations except for a 50 % underestimation at Alert during winter and spring, while simulated BC at the three Arctic sites by L2019 is much lower than observations. The comparison with model results from WETrev shows the underestimation of sulfate at Alert during spring is compensated by considering aqueous-phase chemistry in mixed clouds. Most of BC in Arctic regions is transported from midlatitude to low-latitude source regions with open fire and anthropogenic emissions (Xu et al., 2017), and during the long-range transport hydrophobic BC is aged and converted to hydrophilic BC. The assumption of reduced hydrophilic BC rainout efficiency in the WETrev case increases simulated BC mass concentration and enhances agreement with observations at these Arctic sites. NMBs of BC are reduced from −67 % to −40 % at Barrow and from −75 % to −46 % at Zeppelin due to the switch from L2019 to WETrev.
Table 6Observed and simulated annual mean wet deposition of aerosols and aerosol precursors in the US, Europe, and Asia. Comparisons include annual mean wet deposition (M, kg ha−1 yr−1), normalized mean bias (NMB, %), and correlation coefficient (r, when the number of samples >10) between observed and simulated annual mean values by GC12, L2019, and WETrev cases. Simulated values at sites were corrected following Paulot et al. (2014) to remove bias due to precipitation.
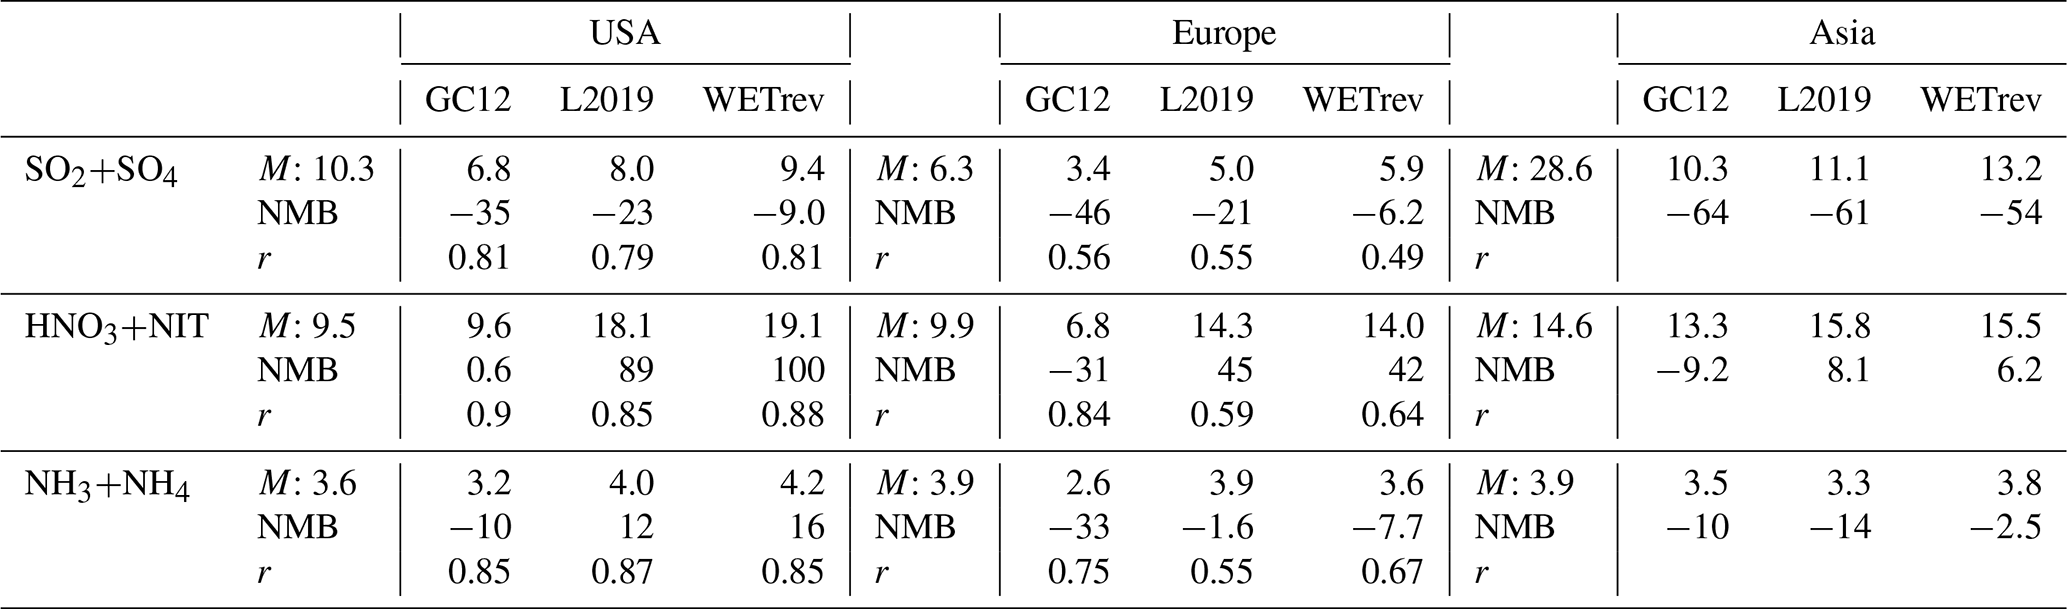
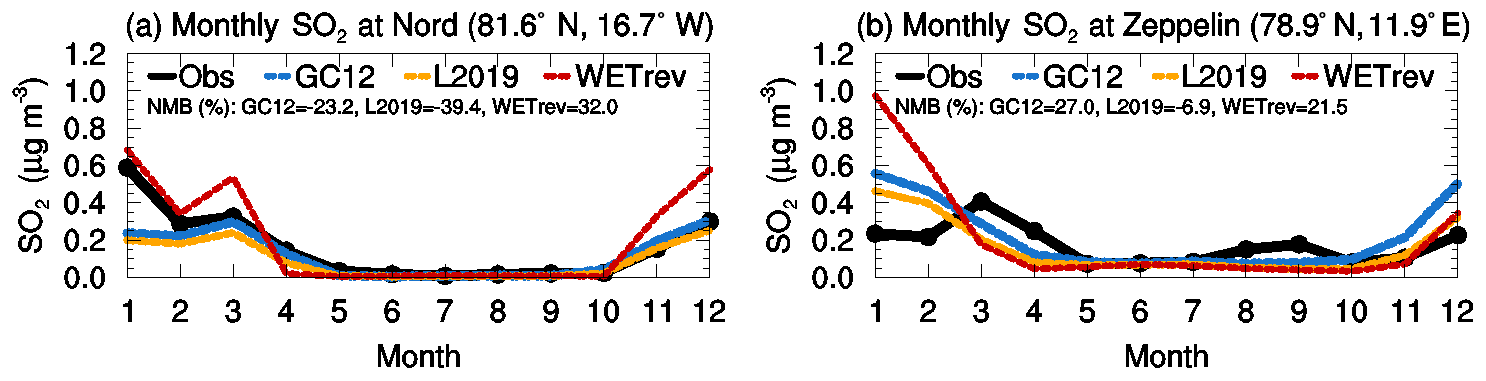
Figure 6Variations of multiyear monthly means showing the comparisons of SO2 surface mass concentrations which were observed at (a) Nord (2008–2013) and (b) Zeppelin (2008–2013) sites (black) and simulated (2011) by GC12 (blue), L2019 (yellow), and WETrev (red) cases.

Figure 7Variations of multiyear monthly means showing the comparisons of (a–c) sulfate and (d–f) black carbon surface mass concentrations which were observed at (a, d) Alert (2008-2012), (b, e) Barrow (2008–2013), and (c, f) Zeppelin (2008–2013) sites (black) and simulated (2011) by GC12 (blue), L2019 (yellow), and WETrev (red) cases.
3.3 Vertical profiles of nitric acid and aerosols: comparison with ATom-1 and ATom-2 aircraft measurements
To evaluate the impact of updated wet processes on simulated vertical profiles of aerosols and aerosol precursors, we compare simulated nitric acid and aerosols for the three cases with the aircraft measurements of ATom-1 in July–August 2016 and ATom-2 in January–February 2017 (Jimenez et al., 2019; Wofsy et al., 2018) over the Northern Hemisphere (Fig. 8) and the Southern Hemisphere (Fig. 9). Nitric acid was measured by chemical ionization mass spectrometer, while aerosols were measured by CU aircraft high-resolution time-of-flight aerosol mass spectrometer (HR-ToF-AMS) (Hodzic et al., 2020). The work of Brock et al. (2019) indicated that there is very good quantitative agreement between AMS and volume data. For ATom data, OC is calculated by OA_PM1_AMS/OAtoOC_PM1_AMS. For the model, we used 1.8 for SOAs. Flight tracks over land or in the stratosphere are filtered out for the comparison (see Fig. S1 in the Supplement for flight tracks of ATom-1 amd ATom-2). We filter out the flight tracks over land because ATom observations over land, whose values vary greatly, only account for 28 % of total measurements. The exclusion of these data makes the comparison more appropriate. Vertical profiles of nitric acid and aerosols over land, which are similar to those in Figs. 8 and 9, are shown in Fig. S2.
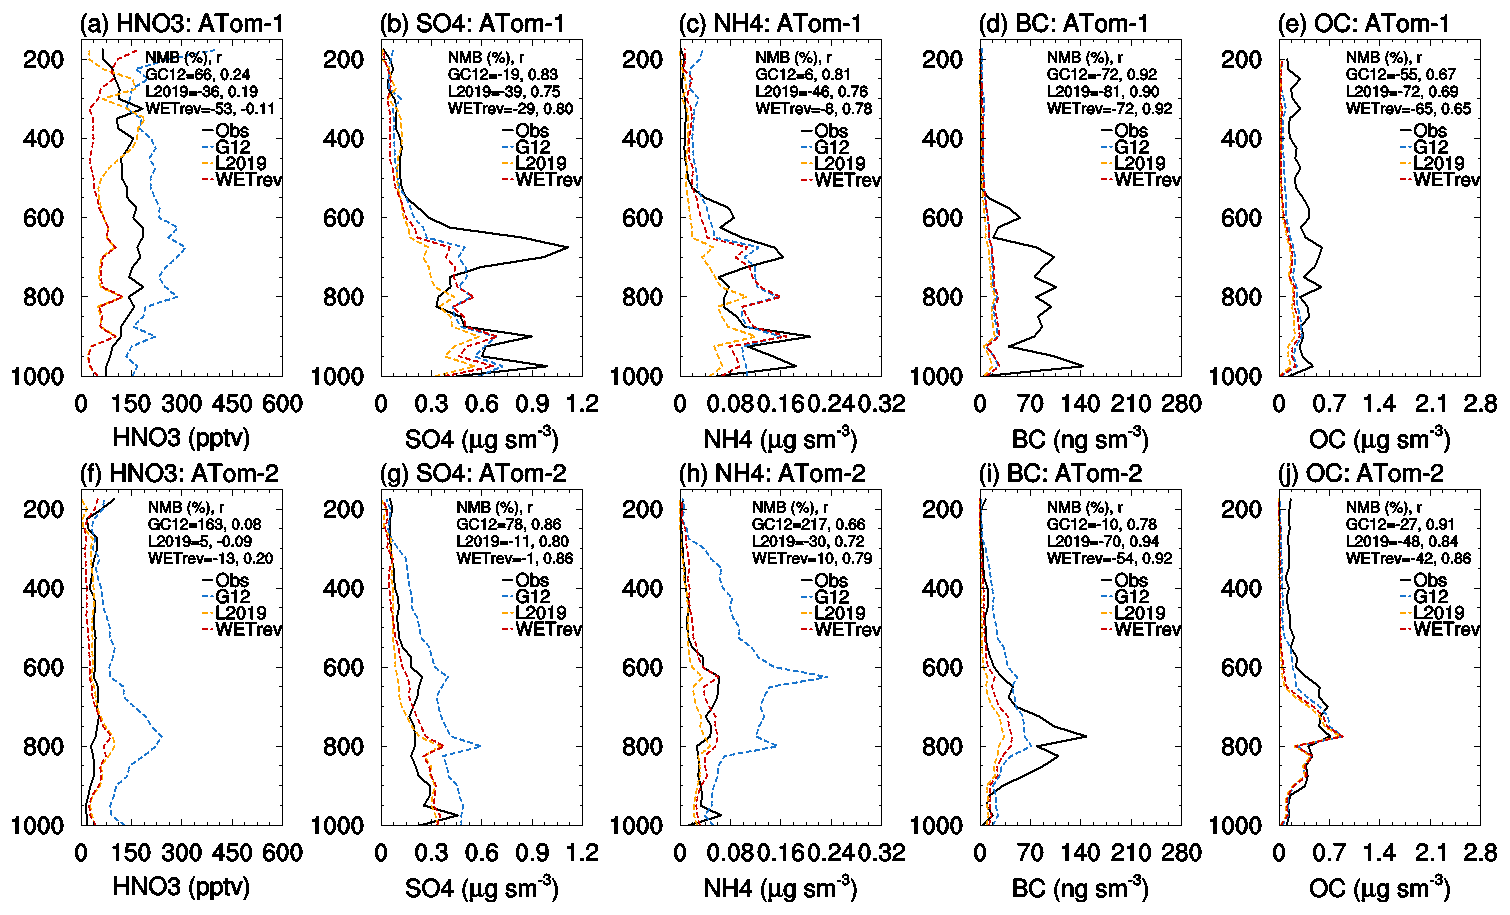
Figure 8Vertical profiles of nitric acid, sulfate, ammonium, black carbon, and organic carbon from ATom aircraft observations (black, ATom-1: a–e; ATom-2: f–j) and GEOS-Chem simulations by GC12 (blue), L2019 (yellow), and WETrev (red) cases over the Northern Hemisphere.
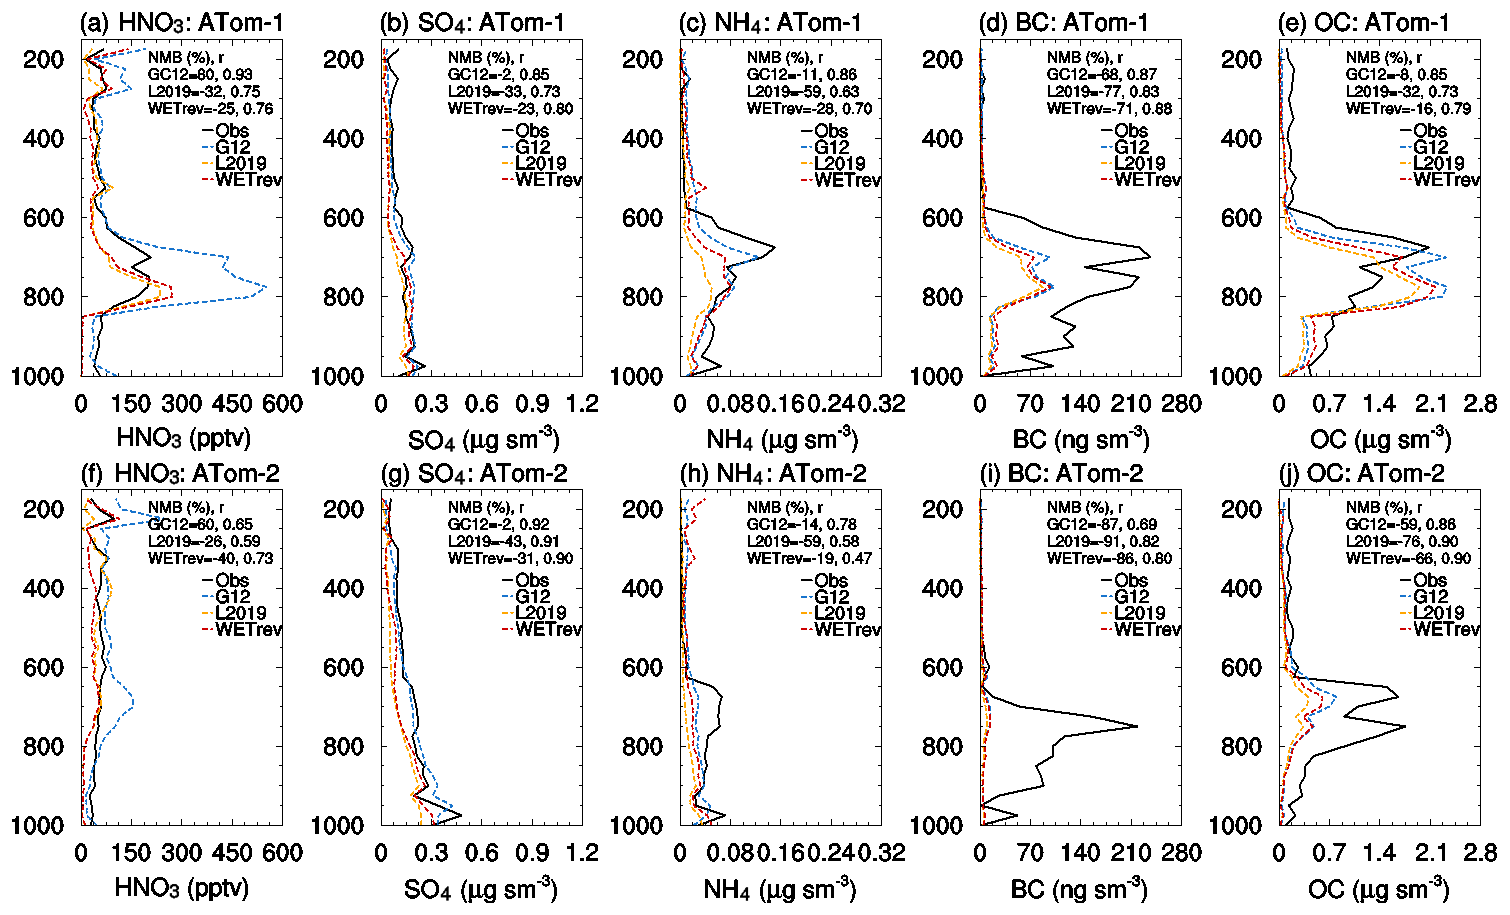
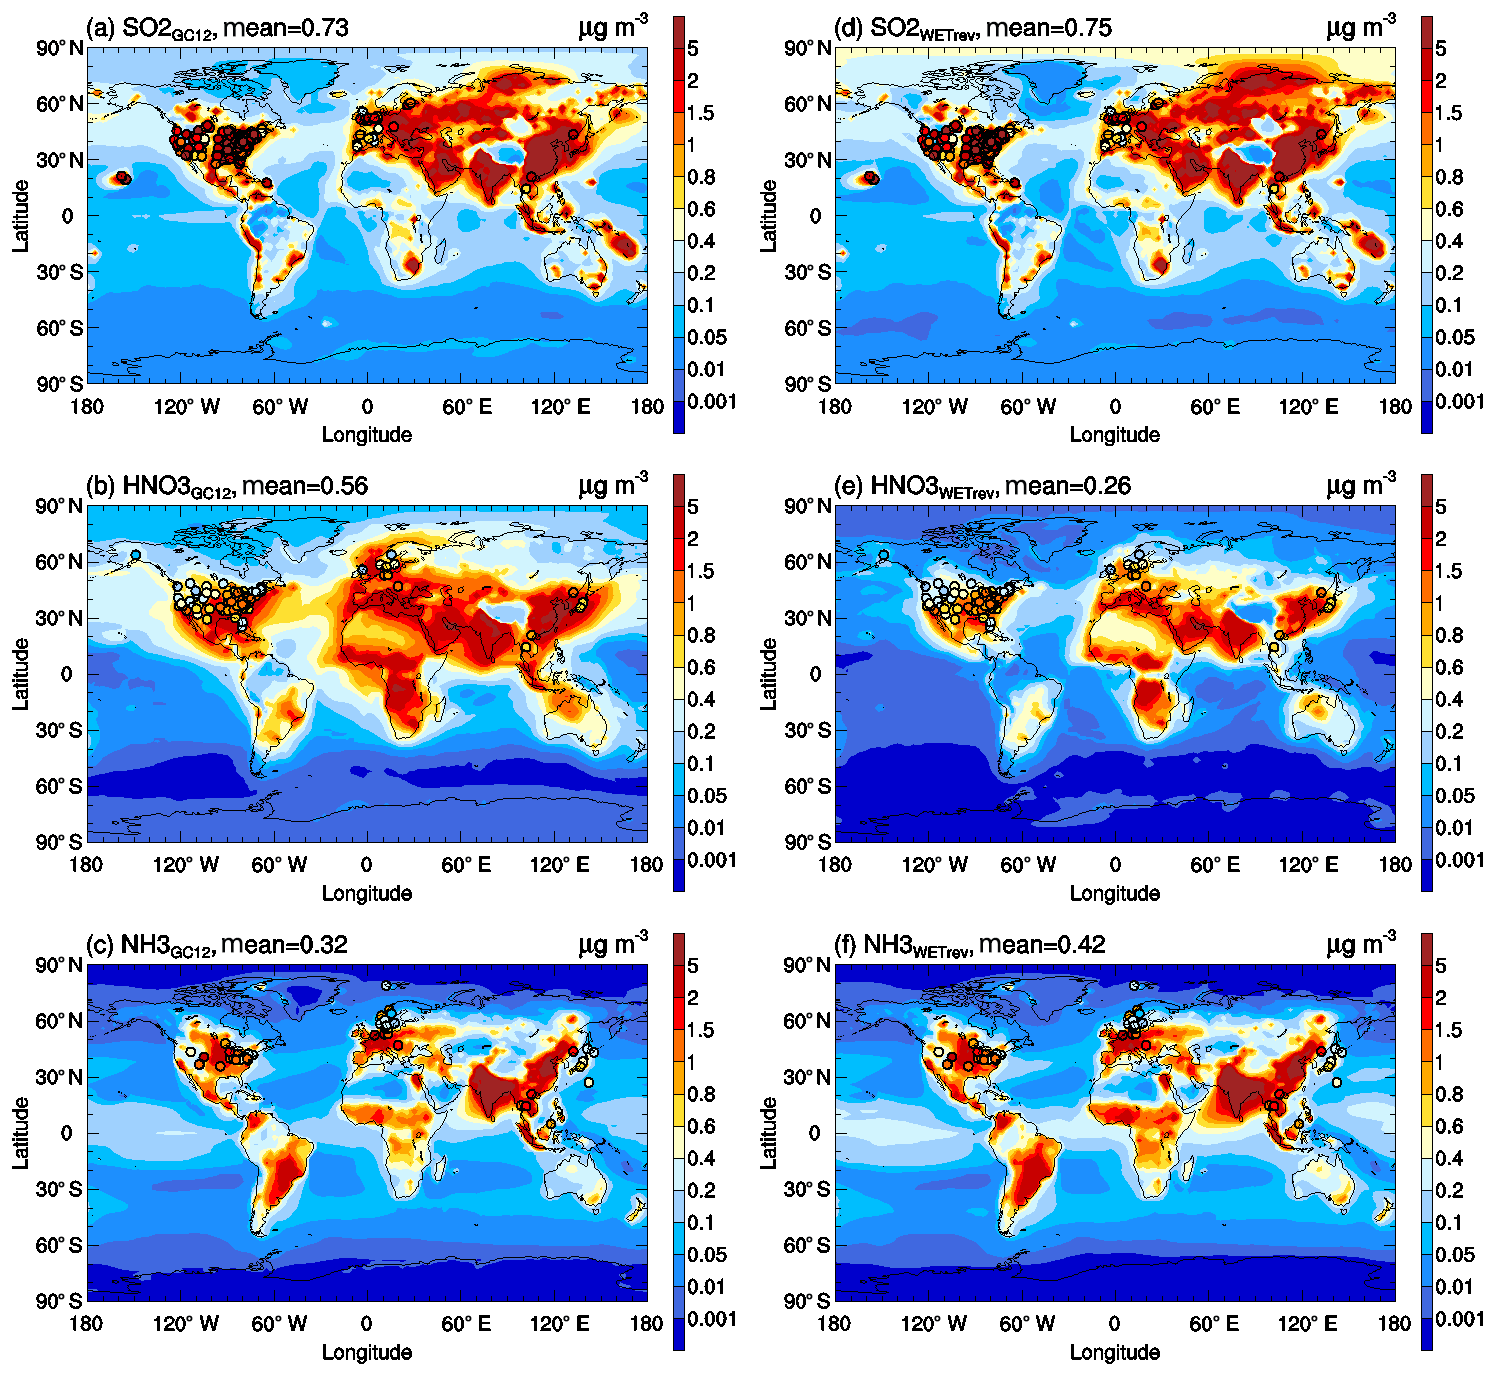
Figure 10Horizontal distributions of SO2, nitric acid, and ammonia surface mass concentrations simulated by the (a–c) GC12 case and (d–f) WETrev case. Filled circles are annual mean surface mass concentrations observed at IMPROVE, CSN, CASTNET, AMoN, EMEP, and EANET for corresponding species.
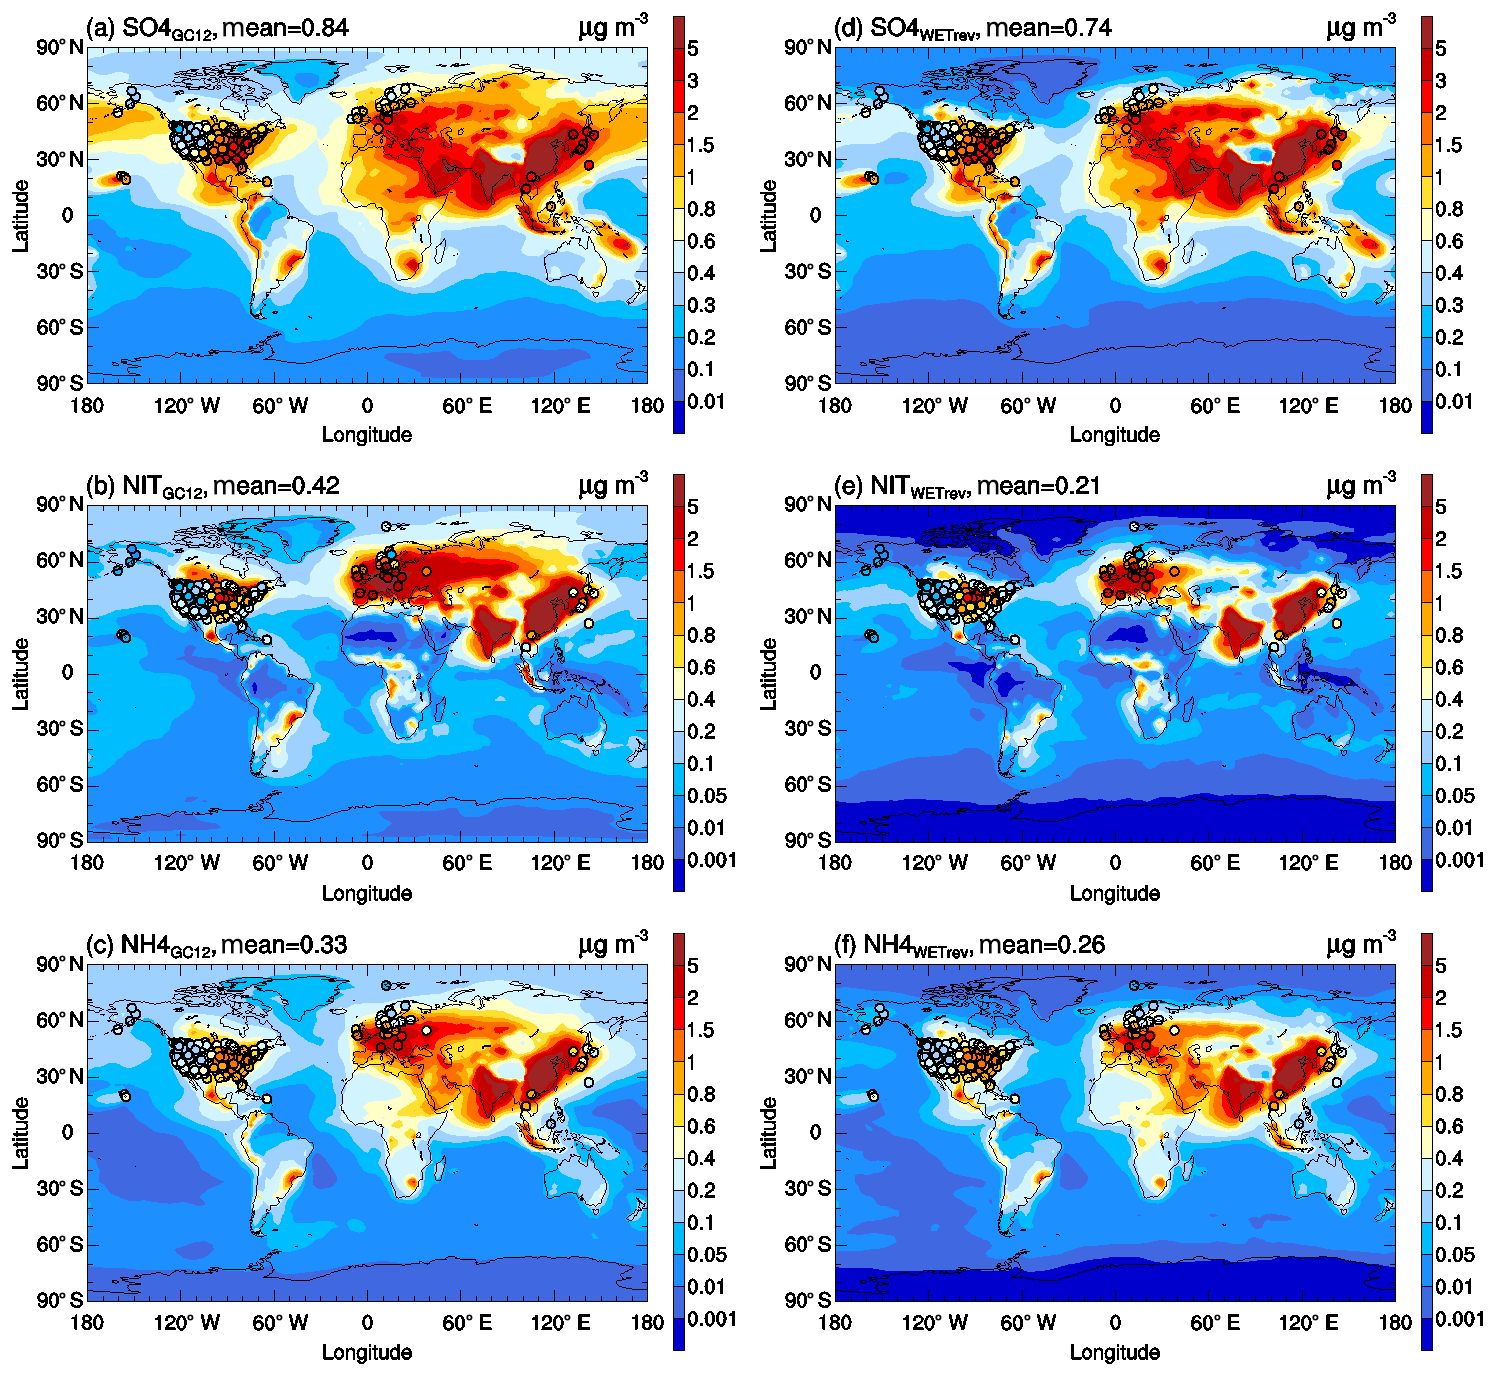
Figure 11The same as Fig. 10 but for sulfate, nitrate, and ammonium surface mass concentrations.
As shown in Fig. 8, GC12 overestimates nitric acid and underestimates black carbon and organic carbon over the Northern Hemisphere during both ATom-1 and ATom-2. NMBs of the three species are 66 %, −77 %, and −55 % during ATom-1 and 163 %, −10 %, and −27 % during ATom-2. GC12 simulated sulfate and ammonium match well with observations during ATom-1 but are much higher than observations during ATom-2 whose values are high: up to 78 % for sulfate and 217 % for ammonium. After considering the updated wet scavenging in L2019, the overestimates of nitric acid, sulfate, and ammonium during ATom-2 and nitric acid during ATom-1 are reduced to 5 %, −11 %, −30 %, and −36 %, respectively. However, L2019 significantly underestimates nitric acid at the upper troposphere where pressure is lower than 300 hPa. As we mentioned earlier, L2019 may overestimate cold cloud wet scavenging of nitric acid due to treatment of cold cloud rainout of nitric acid as same as water-soluble aerosol with 100 % rainout efficiency. With updated cold cloud scavenging in WETrev, the bias of nitric acid simulated by L2019 in the upper troposphere is reduced during ATom-2 and is enhanced during ATom-1. This indicates further understanding regarding ice uptake and removal of nitric acid is needed. Nitric acid concentrations simulated by WETrev between 500 and 300 hPa are much lower than those simulated by L2019 and GC12. This is because WETrev considers washouts of nitric acid by snow and ice which were absent in L2019 and GC12. Figure 8g shows the impact of updated aqueous-phase chemistry in mixed clouds on the sulfate vertical profile. Considering aqueous-phase chemistry in mixed clouds significantly enhances sulfate mass concentration within the range of 700–500 hPa during ATom-2 which makes the simulated sulfate much closer to observed values. Figure 8d and i indicate that the impact of updated wet scavenging on the black carbon vertical profile during ATom-2 is more obvious than that during ATom-1. This is because there is much less black carbon emitted from open fires in January than there is in July. Black carbon observed during ATom-2 is dominated by hydrophilic black carbon which is more affected by wet scavenging processes, while black carbon observed during ATom-1 is dominated by hydrophobic black carbon. Updated wet scavenging shows a small impact on organic carbon vertical profiles during both ATom-1 and ATom-2. Figure 9 shows comparisons over the Southern Hemisphere. Updated wet scavenging reduces overestimated nitric acid especially during ATom-1 period. NMB is reduced from 80 % to −25 %. For sulfate, ammonium, black carbon, and organic carbon, the differences among the three cases are relative small. NMBs of WETrev for these species are larger than those of GC12. All cases significantly underestimate black carbon from open fire and organic carbon in the upper troposphere. Based on the comparisons with ATom-1 and ATom-2 measurements, it is clear that the updated wet process treatments in this work and L2019 can improve the agreements of simulated and observed vertical profiles of nitric acid (Figs. 8a, f, 9a, and f). The simulated of wintertime sulfate and ammonium in the Northern Hemisphere are also improved by WETrev.
3.4 Impact on global distributions of surface mass concentrations
The impacts of updated wet process treatments on global simulation of surface mass concentrations are shown in Figs. 10–14. Figures 10–12 show simulated surface mass concentrations of secondary inorganic aerosol precursors (SO2, nitric acid, and ammonia), secondary inorganic aerosols (sulfate, nitrate, and ammonium), primary inorganic aerosols (sea-salt, dust, and black carbon), and organic carbon (primary organic aerosol and secondary organic aerosol) simulated by the GC12 case and WETrev case, while Figs. 13–14 are the percentage differences.
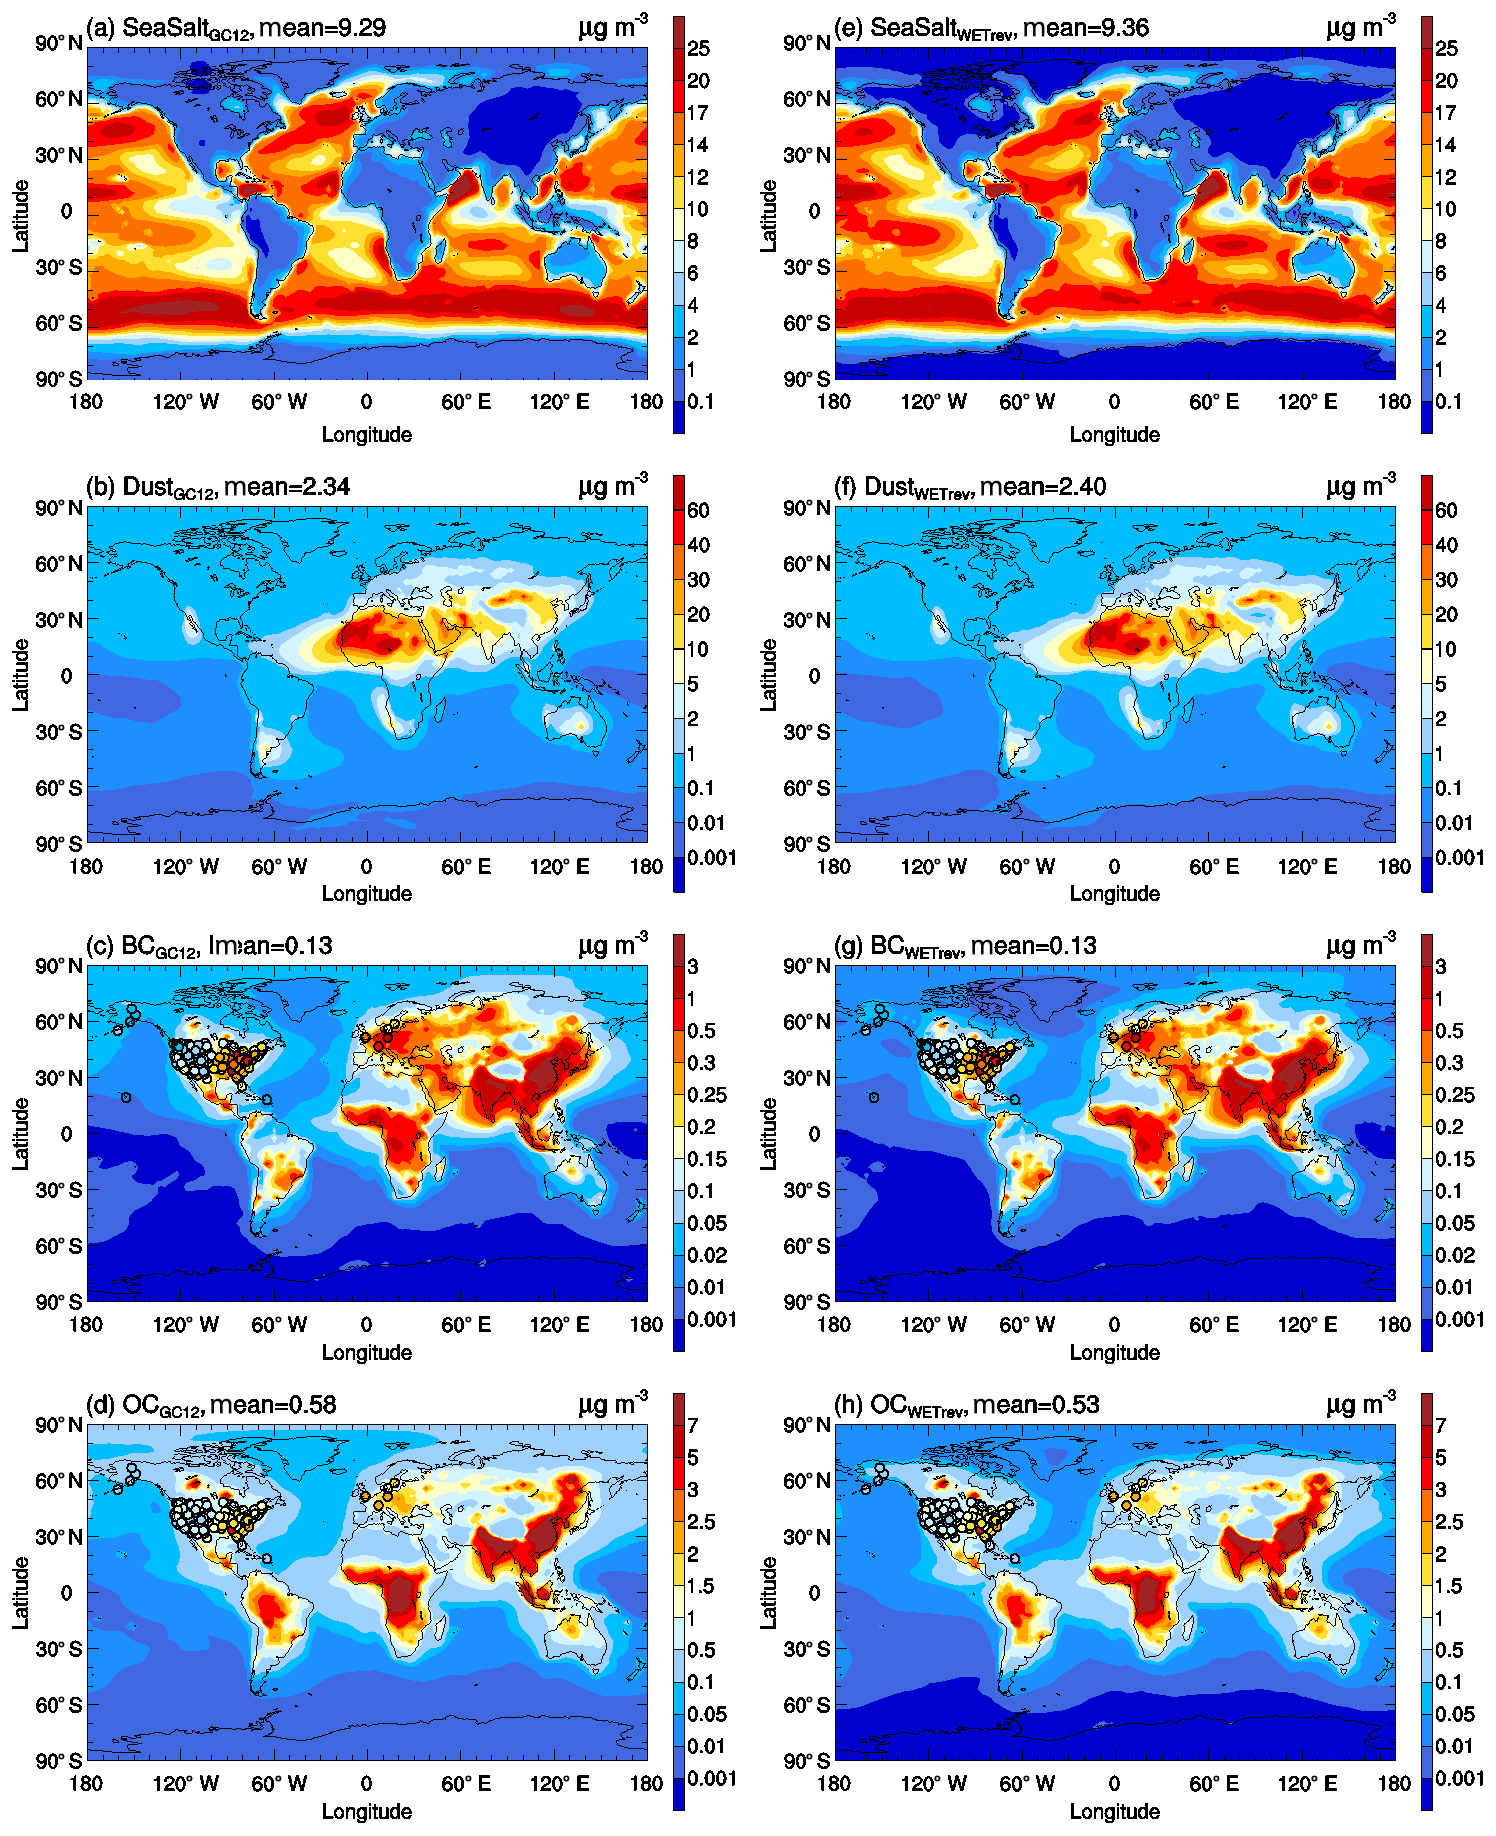
Figure 12The same as Fig. 10 but for black carbon, organic carbon, sea salt, and dust surface mass concentrations.
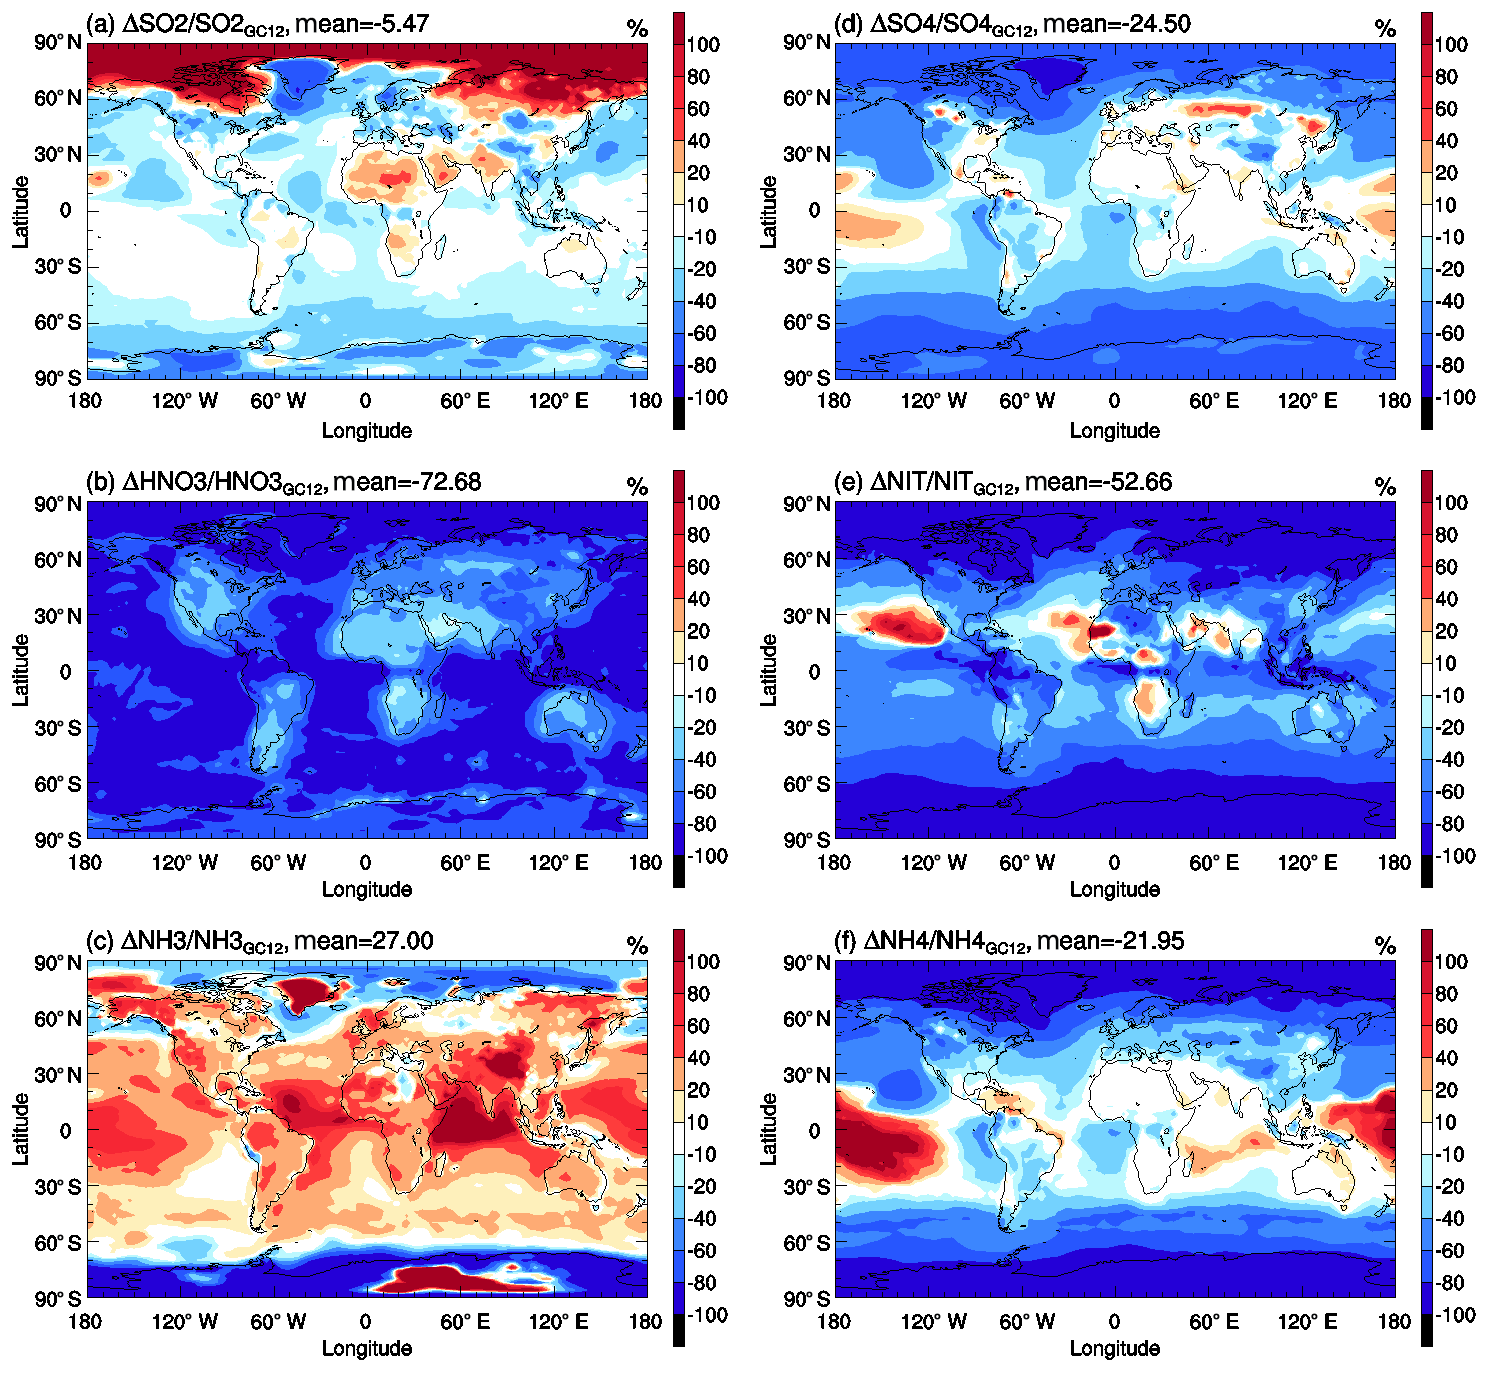
Figure 13Horizontal distributions of percentage changes in annual mean (a) SO2, (b) nitric acid, (c) ammonia, (d) sulfate, (e) nitrate, and (f) ammonium surface mass concentrations due to the switching of GC12 case to WETrev case.
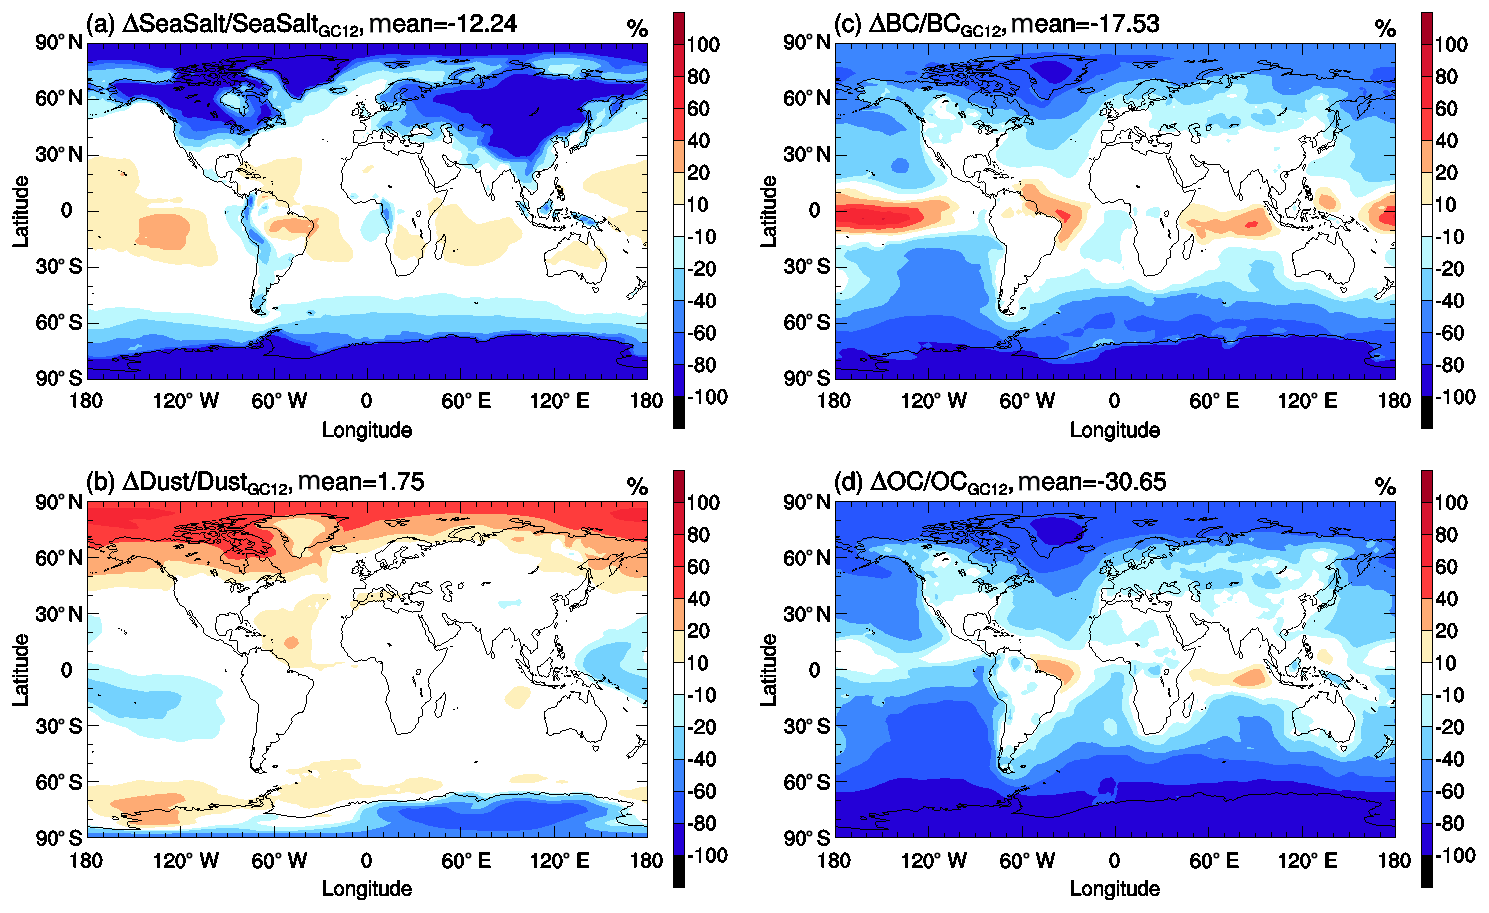
Figure 14The same as Fig. 13 but for (a) sea salt, (b) dust, (c) black carbon, and (d) organic carbon surface mass concentrations.
As shown in Fig. 10, high values of secondary inorganic aerosol precursors are mainly located over continental regions with high anthropogenic and natural emissions. After considering the updated wet process treatments in this study, global mean surface mass concentrations (GMSMCs) of SO2, nitric acid, and ammonia are changed from 0.73, 0.56, and 0.32 to 0.75, 0.26, and 0.42 µg m−3, respectively. The updated wet process treatments slightly impact GMSMC of SO2 but strongly impact GMSMC of nitric acid. The impact on ammonia is small over land but large over ocean. The weak impact of the updated wet process treatments on SO2 is because its wet removal is dominated by aqueous-phase chemistry. The strong impact of the updated wet process treatments on ammonia over the ocean is due to the changes of rainwater pH values over remote regions whose values are higher than the assumed 4.5 rainwater pH in GC12. Some large changes of surface mass concentration in Arctic and Antarctic regions, as shown in Fig. 13a–c, are associated with the updated treatments of wet surface uptake during dry deposition at snow and ice. However, due to low mass concentrations for Arctic and Antarctic regions, their impacts on GMSMC are small. The updated wet process treatments significantly impact GMSMC of secondary inorganic aerosols whose water solubility is high. After considering the updated wet process treatments, GMSMCs of sulfate, nitrate, and ammonium are changed from 0.84, 0.42, and 0.33 to 0.74, 0.21, and 0.26 µg m−3, respectively. Their global mean relative changes are high, up to −25 %, −53 %, and −22 %, respectively. Most of the reductions of these species happen in midlatitude to high-latitude regions with high mass concentrations.
Figures 12 and 14 show the impact of updated wet process treatments on primary inorganic aerosols and organic carbon. It is clear that the updated wet process treatments have little impact on GMSMCs of these species. For sea salt, its high concentrations are mainly located at midlatitude regions in both the Northern Hemisphere and Southern Hemisphere where cloud condensation water values are close to the assumed constant value in GC12. Therefore, the differences of wet scavenging in GC12 and WETrev cases in these regions are small. For dust, due to its low water solubility, the updated wet processes show a small impact in the lower troposphere where wet scavenging is dominated by warm clouds. Most of black carbon and organic carbon are emitted as hydrophobic aerosols and then converted to be hydrophilic aerosols due to aging. Therefore, the updated wet process treatments show only a small impact at source regions but show a strong impact for remote regions.
In this study, we updated aqueous-phase chemistry and wet scavenging for SO2 and sulfate, rainout efficiencies for warm, mixed, and cold clouds, empirical washout by rain and snow, and wet surface uptake during dry deposition in GEOS-Chem version 12.6.0. Systematic validations of simulated aerosols and aerosol precursors with ground-based monitoring networks over the US, Europe, and Asia, on-site observations at Arctic for surface mass concentrations and aircraft measurements during ATom-1 and ATom-2 for their vertical profiles were presented. Based on these validations, we found the following:
-
The model results with the updated treatment of wet processes agree better with measurements for most species in different regions, especially for nitric acid, nitrate, and ammonium whose NMBs were improved, respectively, from 78 %, 126 %, and 45 % to 0.9 %, 15 %, and 4.1 % over US sites, from 107 %, 127 %, and 90 % to −0.7 %, 4.2 %, and 16 % over European sites, and from 121 %, 269 %, and 167 % to −21 %, 37 %, and 86 % over Asian remote region sites.
-
Compared to Luo et al. (2019), the updated aqueous-phase chemistry and wet scavenging of SO2 and sulfate significantly improve the agreement of simulated SO2 and sulfate over the US, European, and Asian remote regions, especially during the wintertime. NMBs of sulfate in the three regions are reduced from −30 %, −33 %, and −36 % to −10 %, 4.3 %, and 6.3 %.
-
The updated wet process treatments significantly improve the performance of sulfate wet deposition simulation over the US and Europe. NMBs are reduced from −35 % to −9 % over the US and from −46 % to −6.2 % over Europe, respectively.
-
The updated rainout efficiencies enhance BC mass concentration for remote regions and successfully reduce the bias between simulation and observation at Arctic sites. NMBs of BC are reduced from −67 % to −40 % at Barrow and from −75 % to −46 % at Zeppelin due to the switch from L2019 to WETrev.
-
Cold cloud scavenging plays important roles in the simulation in the upper troposphere, especially for nitric acid.
-
The updated wet surface uptake during dry deposition changes the performance of simulated SO2 at Arctic sites. NMB of SO2 is increased from −23 % to 32 % at Nord and decreased from 27 % to 22 % at Zeppelin.
Wet processes are important for atmospheric chemistry modeling. Our study indicates that the updated wet process treatments introduced in this study have strong impacts on global means of water-soluble aerosols and aerosol precursors such as nitric acid, sulfate, nitrate, and ammonium. The updated wet process treatments exhibit relatively small impacts on the simulated global means of SO2, dust, sea salt, black carbon, and organic carbon. Although there are clear improvements derived from the updated treatment of wet processes, there still exist limitations of the work presented in this study. For example, washout efficiencies of water-soluble species such as SO2 and ammonia are sensitive to rainwater pH values. In this study, we simply assumed rainwater pH values for rainout and washout are cloud pH at where rainout occurs and rainwater-mass-weighted cloud pH above where washout occurs, respectively. However, rainwater pH needs to be calculated by tracing the cloud process and precipitation process of the rainwater life cycle. The impact of traced rainwater pH on wet scavenging needs to be further investigated.
The code of GEOS-Chem 12.6.0 is available through the GEOS-Chem distribution webpage (http://wiki.seas.harvard.edu/geos-chem/index.php/GEOS-Chem_12, https://doi.org/10.5281/zenodo.3507501, The International GEOS-Chem User Community, 2019). The updated wet process code can be obtained by contacting the author directly. All measurement data are publicly available. US EPA data are downloaded from https://www.epa.gov/outdoor-air-quality-data (US Environmental Protection Agency, 2019); CASTNET, AMoN, IMPROVE, and CSN data are downloaded from http://views.cira.colostate.edu/fed/ (Colorado State University, 2019); NTN data are downloaded from http://nadp.slh.wisc.edu/data/ntn/ntnAllsites.aspx (NADP Program Office, 2019); EMEP data are downloaded from http://ebas.nilu.no/default.aspx (Norwegian Institute for Air Research, 2019a) and https://projects.nilu.no//ccc/emepdata.html (Norwegian Institute for Air Research, 2019b); EANET data are downloaded from https://monitoring.eanet.asia/document/signin (Network Center for EANET, 2019); ATom data are downloaded from https://espoarchive.nasa.gov/archive/browse/atom (Wofsy et al., 2018).
The supplement related to this article is available online at: https://doi.org/10.5194/gmd-13-2879-2020-supplement.
GL and FY proposed and implemented the improved wet process schemes and validated model simulations with surface observations and ATom aircraft measurements. JM provided the new cloud pH approach in GEOS-Chem. All authors contributed to the writing and editing of the paper.
The authors declare that they have no conflict of interest.
The authors thank Daniel J. Jacob (Harvard University), whose comments and suggestions greatly helped improve and clarify this paper. We would like to acknowledge the United States Environmental Protection Agency (US EPA), the Interagency Monitoring of Protected Visual Environments (IMPROVE), the Chemical Speciation Network (CSN), the Clean Air Status and Trends Network (CASTNET), the Ammonia Monitoring Network (AMoN), National Trends Network (NTN), the European Monitoring and Evaluation Programme (EMEP), and the Acid Deposition Monitoring Network in East Asia (EANET) for the on-site measurement data. We would like to acknowledge the Atmospheric Tomography Mission (ATom) for the aircraft measurement data (https://daac.ornl.gov/ATOM/campaign/, last access: August 2019). GEOS-Chem is a community model maintained by the GEOS-Chem Support Team at Harvard University.
This research has been supported by NYSERDA (grant no. 137487), NASA (grant no. NNX17AG35G), and NSF (grant no. 1550816).
This paper was edited by Samuel Remy and reviewed by three anonymous referees.
Abdul-Razzak, H. and Ghan, S. J., A parameterization of aerosol activation: 2. Multiple aerosol types, J. Geophys. Res., 105, 6837–6844, https://doi.org/10.1029/1999JD901161, 2000.
Alexander, B., Allman, D. J., Amos, H. M., Fairlie, T. D., Dachs, J., Hegg, D. A., and Sletten, R. S.: Isotopic constraints on sulfate aerosol formation pathways in the marine boundary layer of the subtropical northeast Atlantic Ocean, J. Geophys. Res., 117, D06304, https://doi.org/10.1029/2011JD016773, 2012.
Amos, H. M., Jacob, D. J., Holmes, C. D., Fisher, J. A., Wang, Q., Yantosca, R. M., Corbitt, E. S., Galarneau, E., Rutter, A. P., Gustin, M. S., Steffen, A., Schauer, J. J., Graydon, J. A., Louis, V. L. St., Talbot, R. W., Edgerton, E. S., Zhang, Y., and Sunderland, E. M.: Gas-particle partitioning of atmospheric Hg(II) and its effect on global mercury deposition, Atmos. Chem. Phys., 12, 591–603, https://doi.org/10.5194/acp-12-591-2012, 2012.
Antonov, J. I., Seidov, D., Boyer, T. P., Locarnini, R. A., Mishonov, A. V., Garcia, H. E., Baranova, O. K., Zweng, M. M., and Johnson, D. R.: World Ocean Atlas 2009, Volume 2: Salinity, in: NOAA Atlas NESDIS 69, edited by: Levitus, S., US Government Printing Office, Washington, 2010.
Bey, I., Jacob, D. J., Yantosca, R. M., Logan, J. A., Field, B. D., Fiore, A. M., Li, Q., Liu, H. Y., Mickley, L. J., and Schultz, M. G.: Global modeling of tropospheric chemistry with assimilated meteorology: Model description and evaluation, J. Geophys. Res., 106, 23073–23095, https://doi.org/10.1029/2001JD000807, 2001.
Brock, C. A., Williamson, C., Kupc, A., Froyd, K. D., Erdesz, F., Wagner, N., Richardson, M., Schwarz, J. P., Gao, R.-S., Katich, J. M., Campuzano-Jost, P., Nault, B. A., Schroder, J. C., Jimenez, J. L., Weinzierl, B., Dollner, M., Bui, T., and Murphy, D. M.: Aerosol size distributions during the Atmospheric Tomography Mission (ATom): methods, uncertainties, and data products, Atmos. Meas. Tech., 12, 3081–3099, https://doi.org/10.5194/amt-12-3081-2019, 2019.
Chin, M., Jacob, D. J., Gardner, G. M., Foreman-Fowler, M. S., Spiro, P. A., and Savoie, D. L.: A global three-dimensional model of tropospheric sulfate, J. Geophys. Res., 101, 18667–18690, https://doi.org/10.1029/96JD01221, 1996.
Chin, M., Rood, R. B., Lin, S.-J., Muller, J.-F., and Thompson, A. M.: Atmospheric sulfur cycle simulated in the global modelGOCART: Model description and global properties, J. Geophys. Res., 105, 24671–24687, 2000.
Colorado State University: Federal Land Manager Environmental Database, available at: http://views.cira.colostate.edu/fed/, last access: August 2019.
de Caritat, P., Hall, G., Gislason, S., Belsey, W., Braun, M., Goloubeva, N. I., Olsen, H. K., Scheie, J. O., and Vaive, J. E.: Chemical composition of arctic snow: concentration level andregional distribution of major elements, Sci. Total Environ., 336, 183–199, 2005.
DeMott, P. J., Prenni, A. J., McMeeking, G. R., Sullivan, R. C., Petters, M. D., Tobo, Y., Niemand, M., Möhler, O., Snider, J. R., Wang, Z., and Kreidenweis, S. M.: Integrating laboratory and field data to quantify the immersion freezing ice nucleation activity of mineral dust particles, Atmos. Chem. Phys., 15, 393–409, https://doi.org/10.5194/acp-15-393-2015, 2015.
Erisman, J. W., Van Pul, A., and Wyers, G. P.: Parameterizationof surface resistance for the quantification of atmospheric deposition of acidifying pollutants and ozone, Atmos. Environ., 28, 2595–2607, 1994.
Ervens, B.: Modeling the processing of aerosol and trace gases in clouds and fogs, Chem. Rev., 115, 4157–4198, https://doi.org/10.1021/cr5005887, 2015.
Ervens, B., Turpin, B. J., and Weber, R. J.: Secondary organic aerosol formation in cloud droplets and aqueous particles (aqSOA): a review of laboratory, field and model studies, Atmos. Chem. Phys., 11, 11069–11102, https://doi.org/10.5194/acp-11-11069-2011, 2011.
Fairlie, T. D., Jacob, D. J., Dibb, J. E., Alexander, B., Avery, M. A., van Donkelaar, A., and Zhang, L.: Impact of mineral dust on nitrate, sulfate, and ozone in transpacific Asian pollution plumes, Atmos. Chem. Phys., 10, 3999–4012, https://doi.org/10.5194/acp-10-3999-2010, 2010.
Fassi-Fihri, A., Suhre, K., and Rosset, R.: Internal and external mixing in atmospheric aerosols by coagulation: impact on the optical and hygroscopic properties of the sulphate-soot system, Atmos. Environ., 10, 1393–1402, 1997.
Feng, J.: A 3-mode parameterization of below-cloud scavenging ofaerosols for use in atmospheric dispersion models, Atmos. Environ., 41, 6808–6822, 2007.
Feng, J.: A size-resolved model for below-cloud scavenging of aerosols by snowfall, J. Geophys. Res.-Atmos., 114, D08203, https://doi.org/10.1029/2008JD011012, 2009.
Ganzeveld, L., Lelieveld, J., and Roelofs, G.-J.: A dry deposition parameterization for sulfur oxides in a chemistry and general circulation model, J. Geophys. Res., 103, 5679–5694, https://doi.org/10.1029/97JD03077, 1998.
Garland, J. A. and Branson, J. R.: The deposition of sulphur dioxide to pine forest assessed by a radioactive tracer method, Tellus, 29, 445–454, https://doi.org/10.1111/j.2153-3490.1977.tb00755.x, 1977.
Guo, H., Nenes, A., and Weber, R. J.: The underappreciated role of nonvolatile cations in aerosol ammonium-sulfate molar ratios, Atmos. Chem. Phys., 18, 17307–17323, https://doi.org/10.5194/acp-18-17307-2018, 2018.
Hodzic, A., Campuzano-Jost, P., Bian, H., Chin, M., Colarco, P. R., Day, D. A., Froyd, K. D., Heinold, B., Jo, D. S., Katich, J. M., Kodros, J. K., Nault, B. A., Pierce, J. R., Ray, E., Schacht, J., Schill, G. P., Schroder, J. C., Schwarz, J. P., Sueper, D. T., Tegen, I., Tilmes, S., Tsigaridis, K., Yu, P., and Jimenez, J. L.: Characterization of organic aerosol across the global remote troposphere: a comparison of ATom measurements and global chemistry models, Atmos. Chem. Phys., 20, 4607–4635, https://doi.org/10.5194/acp-20-4607-2020, 2020.
Henzing, J. S., Olivié, D. J. L., and van Velthoven, P. F. J.: A parameterization of size resolved below cloud scavenging of aerosols by rain, Atmos. Chem. Phys., 6, 3363–3375, https://doi.org/10.5194/acp-6-3363-2006, 2006.
Hidy, G. M., Blanchard, C. L., Baumann, K., Edgerton, E., Tanenbaum, S., Shaw, S., Knipping, E., Tombach, I., Jansen, J., and Walters, J.: Chemical climatology of the southeastern United States, 1999–2013, Atmos. Chem. Phys., 14, 11893–11914, https://doi.org/10.5194/acp-14-11893-2014, 2014.
Holmes, C. D., Bertram, T. H., Confer, K. L., Graham, K. A., Ronan, A. C., Wirks, C. K., and Shah, V.: The role of clouds in the tropospheric NOx cycle: A new modeling approach for cloud chemistry and its global implications, Geophys. Res. Lett., 46, 4980–4990, https://doi.org/10.1029/2019GL081990, 2019.
Hopke, P. K., Ito, K., Mar, T., Christensen, W. F., Eatough, D. J., Henry, R. C., Kim, E., Laden, F., Lall, R., Larson, T. V., Liu, H., Neas, L., Pinto, J., Stölzel, M., Suh, H., Paatero, P., and Thurston, G. D.: PM source apportionment and health effects: 1. Intercomparison of source apportionment results, J. Expo. Sci. Env. Epid., 16, 275e286, https://doi.org/10.1038/sj.jea.7500458, 2006.
The International GEOS-Chem User Community: geoschem/geos-chem: GEOS-Chem 12.6.0 (Version 12.6.0), Zenodo, https://doi.org/10.5281/zenodo.3507501, October 2019.
Jacob, D. J., Liu, H., Mari, C., and Yantosca, B. M., Harvard wet de-position scheme for GMI, available at: http://acmg.seas.harvard.edu/geos/wiki_docs/deposition/wetdep.jacob_etal_2000.pdf (last access: December 2019), 2000.
Jacobson, M. Z.: Studying ocean acidification with conservative, stable numerical schemes for nonequilibrium air-ocean exchange and ocean equilibrium chemistry, J. Geophys. Res., 110, D07302, https://doi.org/10.1029/2004JD005220, 2005.
Jimenez, J. L., Campuzano-Jost, P., Day, D. A., Nault, B. A., Price, D. J., and Schroder, J. C.: ATom: L2 Measurements from CU High-Resolution Aerosol Mass Spectrometer (HR-AMS), ORNL DAAC, Oak Ridge, Tennessee, USA, https://doi.org/10.3334/ORNLDAAC/1716, 2019.
Kanji, Z. A. and Abbatt, J. P. D.: Ice nucleation onto Arizona test dust at cirrustemperatures: Effect of temperature and aerosol size on onsetrelative humidity, J. Phys. Chem., 114A, 935–941, 2010.
Kärcher, B. and Voigt, C.: Formation of nitric acid/water ice particles in cirrus clouds, Geophys. Res. Lett., 33, L08806, https://doi.org/10.1029/2006GL025927, 2006.
Kärcher, B. M., Schiller, C., Voigt, C., Schlager, H., and Popp, P.: A climatological view to HNO3 partitioning in cirrus clouds, Q. J. Roy. Meteor. Soc., 134, 905–912, https://doi.org/10.1002/qj.253, 2008.
Keller, C. A., Long, M. S., Yantosca, R. M., Da Silva, A. M., Pawson, S., and Jacob, D. J.: HEMCO v1.0: a versatile, ESMF-compliant component for calculating emissions in atmospheric models, Geosci. Model Dev., 7, 1409–1417, https://doi.org/10.5194/gmd-7-1409-2014, 2014.
Kinne, S., Schulz, M., Textor, C., Guibert, S., Balkanski, Y., Bauer, S. E., Berntsen, T., Berglen, T. F., Boucher, O., Chin, M., Collins, W., Dentener, F., Diehl, T., Easter, R., Feichter, J., Fillmore, D., Ghan, S., Ginoux, P., Gong, S., Grini, A., Hendricks, J., Herzog, M., Horowitz, L., Isaksen, I., Iversen, T., Kirkevåg, A., Kloster, S., Koch, D., Kristjansson, J. E., Krol, M., Lauer, A., Lamarque, J. F., Lesins, G., Liu, X., Lohmann, U., Montanaro, V., Myhre, G., Penner, J., Pitari, G., Reddy, S., Seland, O., Stier, P., Takemura, T., and Tie, X.: An AeroCom initial assessment – optical properties in aerosol component modules of global models, Atmos. Chem. Phys., 6, 1815–1834, https://doi.org/10.5194/acp-6-1815-2006, 2006.
Laakso, L., Grönholm, T., Rannik, U., Kosmale, M., Fiedler, V.,Vehkamäki, H., and Kulmala, M.: Ultrafine particle scavenging coefficients calculated from 6 years field measurements, Atmos. Environ., 37, 3605–3613, 2003.
Liu, H. Y., Jacob, D. J., Bey, I., and Yantosca, R. M.: Constraints from Pb-210 and Be-7 on wet deposition and transport in a global three-dimensional chemical tracer model driven by as-similated meteorological fields, J. Geophys. Res.-Atmos., 106, 12109–12128, 2001.
Luo, G., Yu, F., and Schwab, J.: Revised treatment of wet scavenging processes dramatically improves GEOS-Chem 12.0.0 simulations of surface nitric acid, nitrate, and ammonium over the United States, Geosci. Model Dev., 12, 3439–3447, https://doi.org/10.5194/gmd-12-3439-2019, 2019.
Mao, Y. H., Li, Q. B., Henze, D. K., Jiang, Z., Jones, D. B. A., Kopacz, M., He, C., Qi, L., Gao, M., Hao, W.-M., and Liou, K.-N.: Estimates of black carbon emissions in the western United States using the GEOS-Chem adjoint model, Atmos. Chem. Phys., 15, 7685–7702, https://doi.org/10.5194/acp-15-7685-2015, 2015.
Mari, C., Jacob, D. J., and Bechtold, P.: Transport and scavenging of soluble gases in a deep convective cloud, J. Geophys. Res., 105, 22255–22267, https://doi.org/10.1029/2000JD900211, 2000.
Martin, R. V., Jacob, D. J., Yantosca, R. M., Chin, M., and Ginoux, P.: Global and regional decreases in tropospheric oxidants from photochemical effects of aerosols, J. Geophys. Res., 108, 4097, https://doi.org/10.1029/2002JD002622, 2003.
Moch, J. M., Dovrou, E., Mickley, L. J., Keutsch, F. N., Cheng, Y., Jacob, D. J., Jiang, J., Li, M., Munger, J. W., Qiao, X., and Zhang, Q.: Contribution of Hydroxymethane Sulfonate to Ambient Particulate Matter: A Potential Explanation for High Particulate Sulfur During Severe Winter Haze in Beijing, Geophys. Res. Lett., 45, 11969–11979, https://doi.org/10.1029/2018GL079309, 2018.
Moch, J. M., Dovrou, E., Mickley, L. J., Keutsch, F. N., Liu, Z., Wang, Y., Dombek, T. L., Kuwata, M., Budisulistiorini, S. H., Yang, L., Decesari, S., Paglione, M., Alexander, B., Shao, J., Munger, J. W., and Jacob, D. J.: Global importance of hydroxymethanesulfonate in ambient particular matter: Implications for air quality, J. Geophys. Res., in review, 2020.
Myhre, G., Samset, B. H., Schulz, M., Balkanski, Y., Bauer, S., Berntsen, T. K., Bian, H., Bellouin, N., Chin, M., Diehl, T., Easter, R. C., Feichter, J., Ghan, S. J., Hauglustaine, D., Iversen, T., Kinne, S., Kirkevåg, A., Lamarque, J.-F., Lin, G., Liu, X., Lund, M. T., Luo, G., Ma, X., van Noije, T., Penner, J. E., Rasch, P. J., Ruiz, A., Seland, Ø., Skeie, R. B., Stier, P., Takemura, T., Tsigaridis, K., Wang, P., Wang, Z., Xu, L., Yu, H., Yu, F., Yoon, J.-H., Zhang, K., Zhang, H., and Zhou, C.: Radiative forcing of the direct aerosol effect from AeroCom Phase II simulations, Atmos. Chem. Phys., 13, 1853–1877, https://doi.org/10.5194/acp-13-1853-2013, 2013.
NADP Program Office: National Atmospheric Deposition Program (NRSP-3) data, available at: http://nadp.slh.wisc.edu/data/ntn/ntnAllsites.aspx, last access: August 2019.
Network Center for EANET: EANET Data on the Acid Deposition in the East Asian Region available at: https://monitoring.eanet.asia/document/signin, last access: August 2019.
Niedermeier, D., Augustin-Bauditz, S., Hartmann, S., Wex, H., Ignatius, K., and Stratmann, F.: Can we define an asymptotic value for theice active surface site density for heterogeneous ice nucleation?, J. Geophys. Res.-Atmos., 120, 5036–5046, https://doi.org/10.1002/2014JD022814, 2015.
Norwegian Institute for Air Research: EBAS database, available at: http://ebas.nilu.no/default.aspx, last access: August 2019a.
Norwegian Institute for Air Research: EMEP measurement data, available at: https://projects.nilu.no//ccc/emepdata.html, last access: August 2019b.
Pandis, S. N. and Seinfeld, J. H.: Sensitivity analysis of a chemical mechanism for aqueous-phase atmospheric chemistry, J. Geophys. Res., 94, 1105–1126, https://doi.org/10.1029/JD094iD01p01105, 1989.
Paulot, F., Jacob, D. J., Pinder, R. W., Bash, J. O., Travis, K., and Henze, D. K.: Ammonia emissions in the United States, European Union, and China derived by high-resolution inversion of ammonium wet deposition data: Interpretation with a new agricultural emissions inventory (MASAGE_NH3), J. Geophys. Res.-Atmos., 119, 4343–4364, https://doi.org/10.1002/2013JD021130, 2014.
Penner, J. E., Charlson, R. J., Hales, J. M., Laulainen, N. S., Leifer, R., Novakov, T., Ogren, J., Radke, L. F., Schwartz, S. E., and Travis, L.: Quantifying and Minimizing Uncertainty of Climate Forcing by Anthropogenic Aerosols, B. Am. Meteorol. Soc., 75, 375–400, https://doi.org/10.1175/1520-0477(1994)075<0375:QAMUOC>2.0.CO;2, 1994.
Rosenfeld, D. and Woodley, W. L.: Deep convective clouds with sustained highly supercooled liquid water until −37.5 ∘C, Nature, 405, 440–442, 2000.
Sahu, L. K., Kondo, Y., Moteki, N., Takegawa, N., Zhao, Y., Cubison, M. J., Jimenez, J. L., Vay, S., Diskin, G. S., Wisthaler, A., Mikoviny, T., Huey, L. G., Weinheimer, A. J., and Knapp, D. J.: Emission characteristics of black carbon in anthropogenic and biomass burning plumes over California during ARCTAS-CARB 2008, J. Geophys. Res., 117, D16302, https://doi.org/10.1029/2011JD017401, 2012.
Sassen, K.: Supercooled Liquid Water In Winter Storms: A Preliminary Climatology from Remote Sensing Observations, The Journal of Weather Modification, 17, 30–35, 1985.
Schneider, A., Flanner, M., De Roo, R., and Adolph, A.: Monitoring of snow surface near-infrared bidirectional reflectance factors with added light-absorbing particles, The Cryosphere, 13, 1753–1766, https://doi.org/10.5194/tc-13-1753-2019, 2019.
Seto, S., Sato, M., Tatano, T., Kusakari, T., and Hara, H., Spatial distribution and source identification of wet deposition at remote EANET sites in Japan, Atmos. Environ., 41, 9386–9396, 2007.
Seinfeld, J. H. and Pandis, S. N.: Atmospheric Chemistry and Physics: From Air Pollution to Climate Change, John Wiley & Sons, Hoboken, 2016.
Shiraiwa, M., Ueda, K., Pozzer, A., Lammel, G., Kampf, C. J., Fushimi, A., Enami, S., Arangio, A. M., Fröhlich-Nowoisky, J., Fujitani, Y., Furuyama, A., Lakey, P. S. J., Lelieveld, J., Lucas, K., Morino, Y., Pöschl, U., Takahama, S., Takami, A., Tong, H., Weber, B., Yoshino, A., and Sato, K.: Aerosol Health Effectsfrom Molecular to Global Scales, Environ. Sci. Technol., 51, 13545–13567, https://doi.org/10.1021/acs.est.7b04417, 2017.
Silvern, R. F., Jacob, D. J., Kim, P. S., Marais, E. A., Turner, J. R., Campuzano-Jost, P., and Jimenez, J. L.: Inconsistency of ammonium–sulfate aerosol ratios with thermodynamic models in the eastern US: a possible role of organic aerosol, Atmos. Chem. Phys., 17, 5107–5118, https://doi.org/10.5194/acp-17-5107-2017, 2017.
Smith, R. M. and Martell, A. E.: Critical Stability Constants, Vol. 2, Amine Complexes, Plenum Publ., Co., New York, 1976.
Strom, J., Strauss, B., Anderson, T., Schroder, F., Heintzenberg, J., and Wendhng, P.: In situ observations of the microphysical properties of young cirrus clouds, J. Atmos. Sci., 541, 2542–2553, 1997.
Textor, C., Schulz, M., Guibert, S., Kinne, S., Balkanski, Y., Bauer, S., Berntsen, T., Berglen, T., Boucher, O., Chin, M., Dentener, F., Diehl, T., Easter, R., Feichter, H., Fillmore, D., Ghan, S., Ginoux, P., Gong, S., Grini, A., Hendricks, J., Horowitz, L., Huang, P., Isaksen, I., Iversen, I., Kloster, S., Koch, D., Kirkevåg, A., Kristjansson, J. E., Krol, M., Lauer, A., Lamarque, J. F., Liu, X., Montanaro, V., Myhre, G., Penner, J., Pitari, G., Reddy, S., Seland, Ø., Stier, P., Takemura, T., and Tie, X.: Analysis and quantification of the diversities of aerosol life cycles within AeroCom, Atmos. Chem. Phys., 6, 1777–1813, https://doi.org/10.5194/acp-6-1777-2006, 2006.
Turnock, S. T., Mann, G. W., Woodhouse, M. T., Dalvi, M., O'Connor, F. M., Carslaw, K. S., and Spracklen, D. V.: The impact of changes in cloud water pH on aerosol radiative forcing, Geophys. Res. Lett., 46, 4039–4048, https://doi.org/10.1029/2019GL082067, 2019.
US Environmental Protection Agency: Air Quality System Data Mart Air Quality Data Collected at Outdoor Monitors Across the US, available at: https://www.epa.gov/outdoor-air-quality-data, last access: August 2019.
Voigt, C., Schlager, H., Ziereis, H., Kärcher, B., Luo, B. P., Schiller, C., Krämer, M., Popp, P. J., Irie, H., and Kondo, Y.: Nitric acidin cirrus clouds, Geophys. Res. Lett., 33, L05803, https://doi.org/10.1029/2005GL025159, 2006.
Walcek, C. J. and Taylor, G. R.: A Theoretical Method for Computing Vertical Distributions of Acidity and Sulfate Production within Cumulus Clouds, J. Atmos. Sci., 43, 339–355, https://doi.org/10.1175/1520-0469(1986)043<0339:ATMFCV>2.0.CO;2, 1986.
Wang, Q., Jacob, D. J., Fisher, J. A., Mao, J., Leibensperger, E. M.,Carouge, C. C., Le Sager, P., Kondo, Y., Jimenez, J. L., Cubi-son, M. J., and Doherty, S. J.: Sources of carbonaceous aerosolsand deposited black carbon in the Arctic in winter-spring: impli-cations for radiative forcing, Atmos. Chem. Phys., 11, 12453–12473, https://doi.org/10.5194/acp-11-12453-2011, 2011.
Wang, Q., Jacob, D. J., Spackman, J. R., Perring, A. E., Schwarz, J. P., Moteki, N., Marais, E. A., Ge, C., Wang, J., and Barrett, S. R. H.: Global budget and radiative forcing of black carbon aerosol: constraints from pole-to-pole (HIPPO) observations across the Pacific, J. Geophys. Res., 119, 195–206, 2014.
Wang, X., Zhang, L., and Moran, M. D.: Uncertainty assessment of current size-resolved parameterizations for below-cloud particle scavenging by rain, Atmos. Chem. Phys., 10, 5685–5705, https://doi.org/10.5194/acp-10-5685-2010, 2010.
Wang, X., Zhang, L., and Moran, M. D.: Development of a new semi-empirical parameterization for below-cloud scavenging of size-resolved aerosol particles by both rain and snow, Geosci. Model Dev., 7, 799–819, https://doi.org/10.5194/gmd-7-799-2014, 2014.
Wesely, M. L.: Parameterization of surface resistances to gaseous dry deposition in regional-scale numerical models, Atmos. Environ., 23, 1293–1304, 1989.
Wesely, M. L., Sisterson, D. L., and Jastrow, J. D.: Observations of the chemical properties of dew on vegetation that affect the dry deposition of SO2, J. Geophy. Res., 95, 7501–7514, 1990.
Wofsy, S. C., Afshar, S., Allen, H. M., Apel, E. C., Asher, E. C., Barletta, B., Bent, J., Bian, H., Biggs, B. C., Blake, D. R., Blake, N., Bourgeois, I., Brock, C. A., Brune, W. H., Budney, J. W., Bui, T. P., Butler, A., Campuzano-Jost, P., Chang, C. S., Chin, M., Commane, R., Correa, G., Crounse, J. D., Cullis, P. D., Daube, B. C., Day, D. A., Dean-Day, J. M., Dibb, J. E., DiGangi, J. P., Diskin, G. S., Dollner, M., Elkins, J. W., Erdesz, F., Fiore, A. M., Flynn, C. M., Froyd, K. D., Gesler, D. W., Hall, S. R., Hanisco, T. F., Hannun, R. A., Hills, A. J., Hintsa, E. J., Hoffman, A., Hornbrook, R. S., Huey, L. G., Hughes, S., Jimenez, J. L., Johnson, B. J., Katich, J. M., Keeling, R. F., Kim, M. J., Kupc, A., Lait, L. R., Lamarque, J.-F., Liu, J., McKain, K., Mclaughlin, R. J., Meinardi, S., Miller, D. O., Montzka, S. A., Moore, F. L., Morgan, E. J., Murphy, D. M., Murray, L. T., Nault, B. A., Neuman, J. A., Newman, P. A., Nicely, J. M., Pan, X., Paplawsky, W., Peischl, J., Prather, M. J., Price, D. J., Ray, E., Reeves, J. M., Richardson, M., Rollins, A. W., Rosenlof, K. H., Ryerson, T. B., Scheuer, E., Schill, G. P., Schroder, J. C., Schwarz, J. P., St.Clair, J. M., Steenrod, S. D., Stephens, B. B., Strode, S. A., Sweeney, C., Tanner, D., Teng, A. P., Thames, A. B., Thompson, C. R., Ullmann, K., Veres, P. R., Vieznor, N., Wagner, N. L., Watt, A., Weber, R., Weinzierl, B., Wennberg, B. P. O., Williamson, C.J., Wilson, J. C., Wolfe, G. M., Woods, C. T., and Zeng, L. H.: ATom: Merged Atmospheric Chemistry, Trace Gases, and Aerosols, ORNL DAAC, Oak Ridge, Tennessee, USA, https://doi.org/10.3334/ORNLDAAC/1581, 2018.
Xu, J.-W., Martin, R. V., Morrow, A., Sharma, S., Huang, L., Leaitch, W. R., Burkart, J., Schulz, H., Zanatta, M., Willis, M. D., Henze, D. K., Lee, C. J., Herber, A. B., and Abbatt, J. P. D.: Source attribution of Arctic black carbon constrained by aircraft and surface measurements, Atmos. Chem. Phys., 17, 11971–11989, https://doi.org/10.5194/acp-17-11971-2017, 2017.
Yu, F. and Luo, G.: Simulation of particle size distribution with a global aerosol model: contribution of nucleation to aerosol and CCN number concentrations, Atmos. Chem. Phys., 9, 7691–7710, https://doi.org/10.5194/acp-9-7691-2009, 2009.
Yu, F., Luo, G., and Ma, X.: Regional and global modeling of aerosol optical properties with a size, composition, and mixing state resolved particle microphysics model, Atmos. Chem. Phys., 12, 5719–5736, https://doi.org/10.5194/acp-12-5719-2012, 2012.
Zender, C. S., Bian, H., and Newman, D., Mineral Dust Entrainment and Deposition (DEAD) model: Description and 1990s dust climatology, J. Geophys. Res., 108, 4416, https://doi.org/10.1029/2002JD002775, 2003.