the Creative Commons Attribution 4.0 License.
the Creative Commons Attribution 4.0 License.
 | 19 Jul 2019
CLIMADA v1: a global weather and climate risk assessment platform
Gabriela Aznar-Siguan
David N. Bresch
The need for assessing the risk of extreme weather events is ever increasing. In addition to quantification of risk today, the role of aggravating factors such as high population growth and changing climate conditions matters, too. We present the open-source software CLIMADA (CLIMate ADAptation), which integrates hazard, exposure, and vulnerability to compute the necessary metrics to assess risk and to quantify socio-economic impact. The software design is modular and object oriented, offering a simple collaborative framework and a parallelization strategy which allows for scalable computations on clusters. CLIMADA supports multi-hazard calculations and provides an event-based probabilistic approach that is globally consistent for a wide range of resolutions, suitable for whole-country to detailed local studies. This paper uses the platform to estimate and contextualize the damage of hurricane Irma in the Caribbean in 2017. Most of the affected islands are non-sovereign countries and also rely on overseas support in case disaster strikes. The risk assessment performed for this region, based on remotely available data available shortly before or hours after landfall of Irma, proves to be close to reported damage and hence demonstrates a method to provide readily available impact estimates and associated uncertainties in real time.
- Article
(899 KB) - Full-text XML
- BibTeX
- EndNote


Improving the resilience of our societies in the face of volatile weather is an urgent priority today and will increase in importance in the years to come. This is due not only to changing climate conditions, but also to rising population and economic growth. Given that the increased exposure has been a significant driver to higher damages in the last century (Bouwer, 2011), the climate of the past is by no means a sufficient basis for decisions going forward. In 2017, the natural-catastrophe-related economic losses amounted to around USD 330 billion, 0.44 % of global gross domestic product (GDP) and almost double the previous 10-year average. A new annual record was set for the highest insured losses – more than two-fifths of the economic losses – mainly due to payouts related to three major hurricanes in the US (Harvey, Irma, and Maria); wildfire outbreaks in California; and many thunderstorms, windstorms, and other severe weather events around the world (Bevere et al., 2018). In order to foster the use of the continuously increasing weather and climate information to undertake preemptive (and precautionary) action we present here the global and multi-hazard decision support tool for CLIMate ADAptation, CLIMADA.
While measures exist to adapt to an ever changing environment, decision makers on all levels – from multinational organizations, sovereign and sub-sovereign states, cities, companies, and down to the local community – need the facts to identify the most cost-effective instruments; they need to know the potential weather and climate-related damages over the coming decades to identify measures to mitigate these risks – and to decide whether the benefits will outweigh the costs. For this purpose, CLIMADA was developed, which supports the appraisal of risk management options and adaptation measures by estimating the expected socioeconomic impact of weather and climate as a measure of risk today, the incremental increase from economic growth, and the further incremental increase due to climate change. Starting from a comprehensive mapping of hazards and exposures, using state-of-the-art probabilistic risk modelling techniques, it integrates different economic development and climate impact scenarios combined with a cost-benefit approach to assess a comprehensive portfolio of adaptation measures. Adaptation measures include, for example, building defences, improved spatial planning, ecosystem-based approaches, building regulations and risk transfer (insurance) against some of the more extreme weather events. In this context, CLIMADA implements the Economics of Climate Adaptation methodology, which establishes an economic framework to fully integrate risk and reward perspectives of different stakeholders (Bresch, 2016; Bresch and ECA working group, 2009; Bresch and Schraft, 2011; Souvignet et al., 2016).
The first step in the cost-benefit analysis is to determine the current risk. CLIMADA does this by modelling socioeconomic impacts of weather extremes following an event-based probabilistic approach. Whilst other multi-hazard impact modelling platforms exist, like HAZUS (Schneider et al., 2006), CAPRA (Cardona et al., 2012), and RISKSCAPE (King and Bell, 2006), CLIMADA has a global scope and is open source, hosted on GitHub (https://github.com/CLIMADA-project/climada_python, last access: 17 July 2019) under the GNU GPL license (GNU Operating System, 2007). We present here the new generation of the platform, with improved performance, scalability, maintainability, and a streamlined user interface. Written from scratch in Python and based on an object-oriented design, the architecture defines classes which enable risk assessment computations for independent research areas to be developed separately yet with high reusability of common functionalities. With this design we aim to foster usage of the platform in interdisciplinary studies and international collaboration.
In this study, we describe the impact modelling procedure of CLIMADA and demonstrate its capabilities through a risk analysis of tropical cyclones in several overseas territories of the Caribbean. The methodology for the cost-benefit estimation of adaptation measures is going to be presented in a further paper. Even if the previous version of CLIMADA has been used in several impact modelling analyses in the past (e.g. Geiger et al., 2018; Gettelman et al., 2017; Welker et al., 2016), this is the first formal description and detailed exemplary validation of the methodological approach. Following the introduction, Sect. 2 describes the concept and design of the tool. Section 3 specifies the impact modelling implementation for tropical cyclones through the reproduction of hurricane Irma in the affected overseas territories, compares it against the reported economic damage, and provides a risk analysis. The paper concludes with a discussion of the results obtained with CLIMADA.
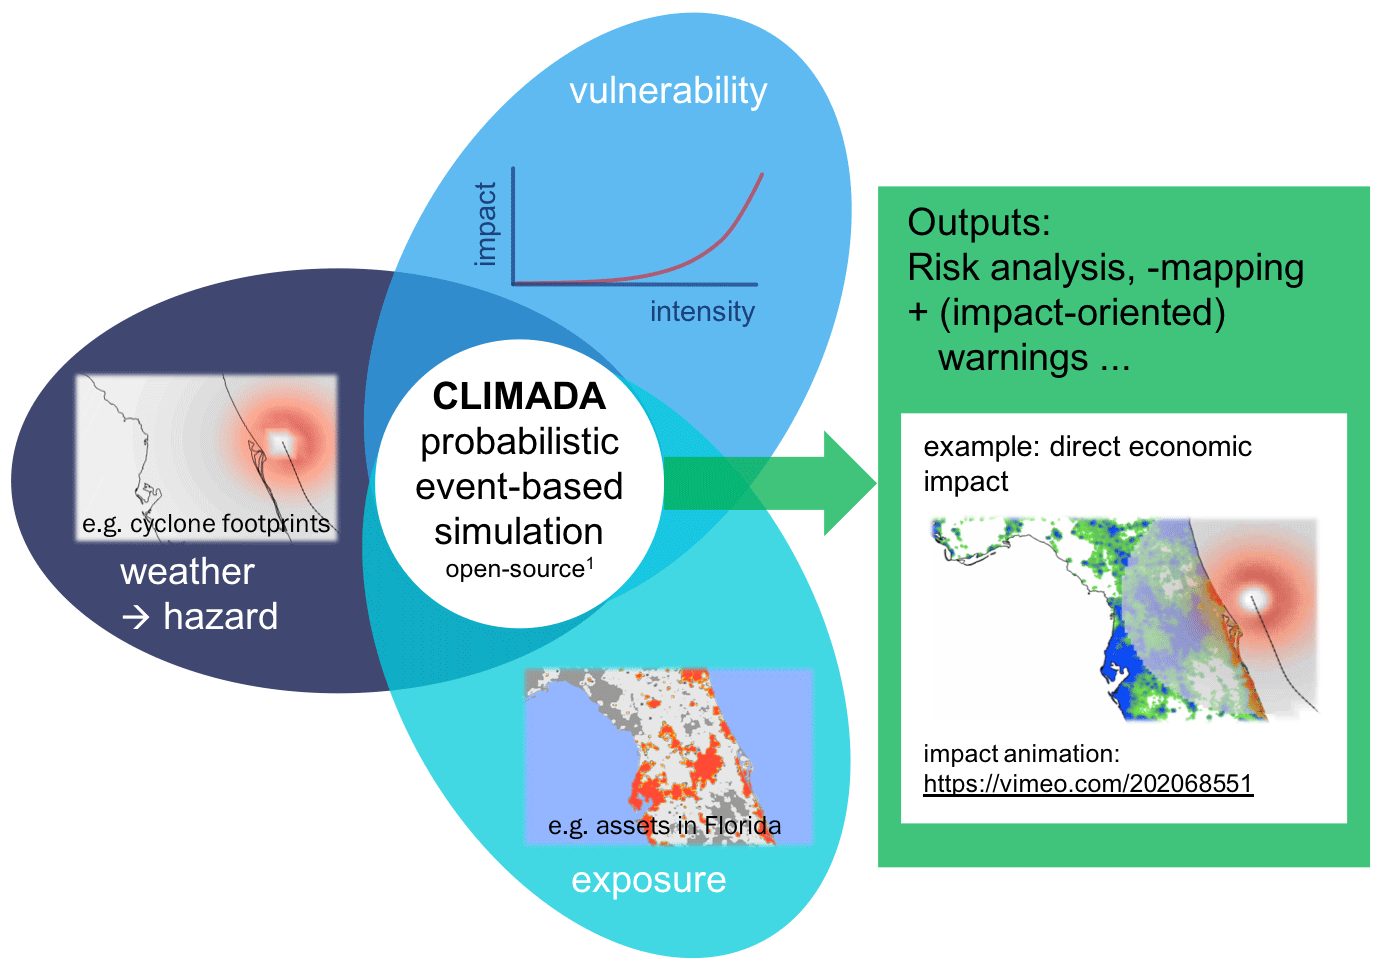
Figure 1In essence, CLIMADA implements the concept of risk as in IPCC (2014). CLIMADA combines hazard (e.g. a tropical cyclone wind footprint, leftmost inset), exposure (e.g. an asset distribution, centre bottom inset), and vulnerability (functional relationship between hazard intensity and impact, centre at the top) to calculate risk. Severity, measured, for example, as direct economic impact, is rendered by the red dots on the right panel. Please refer to the link provided for an animated version.
2.1 Concept
CLIMADA implements a fully probabilistic risk assessment model. According to the IPCC (IPCC, 2014), natural risks emerge through the interplay of climate and weather-related hazards; the exposure of goods or people to this hazard; and the specific vulnerability of exposed people, infrastructure, and environment. The unit chosen to measure risk has to be the most relevant one in a specific decision problem, not necessarily monetary units. Wildfire hazard might be measured by burned area, exposure by population, or replacement value of homes and hence risk might be expressed as number of affected people in the context of evacuation or repair cost of buildings in the context of property insurance. For example, see the definitions box of Zscheischler et al. (2018) for a complete description of the weather and climate risk elements used here.
Risk has been defined by the International Organization for Standardization as the “effect of uncertainty on objectives” (Lark, 2015) and similarly by the IPCC (2012) as the potential for consequences when something of value is at stake and the outcome is uncertain, recognizing the diversity of values. Risk can then be quantified as the combination of the probability of a consequence and its magnitude:
In the simplest case, × stands for a multiplication; more generally, it represents a convolution of the respective distributions of probability and severity. We approximate the severity as follows:
where fimp is the impact function which parameterizes to what extent an exposure will be affected by a specific hazard. While “vulnerability function” is broadly used in the modeller community, we refer to it as “impact function” to explicitly include the option of opportunities (i.e. negative damages). An opportunity can arise, for example, for specific bird species populations in a warmer environment (e.g. Gregory et al., 2009). Using this approach, CLIMADA constitutes a platform to analyse risks of different hazard types in a globally consistent fashion at different resolution levels, at scales from multiple kilometres down to metres, depending on the purpose. Figure 1 shows the main components of CLIMADA and demonstrates one possible output.
2.2 Implementation
The component diagram in Fig. 2 shows the architecture of CLIMADA which distinguishes three main packages, hazard, entity, and engine, as described in the following.
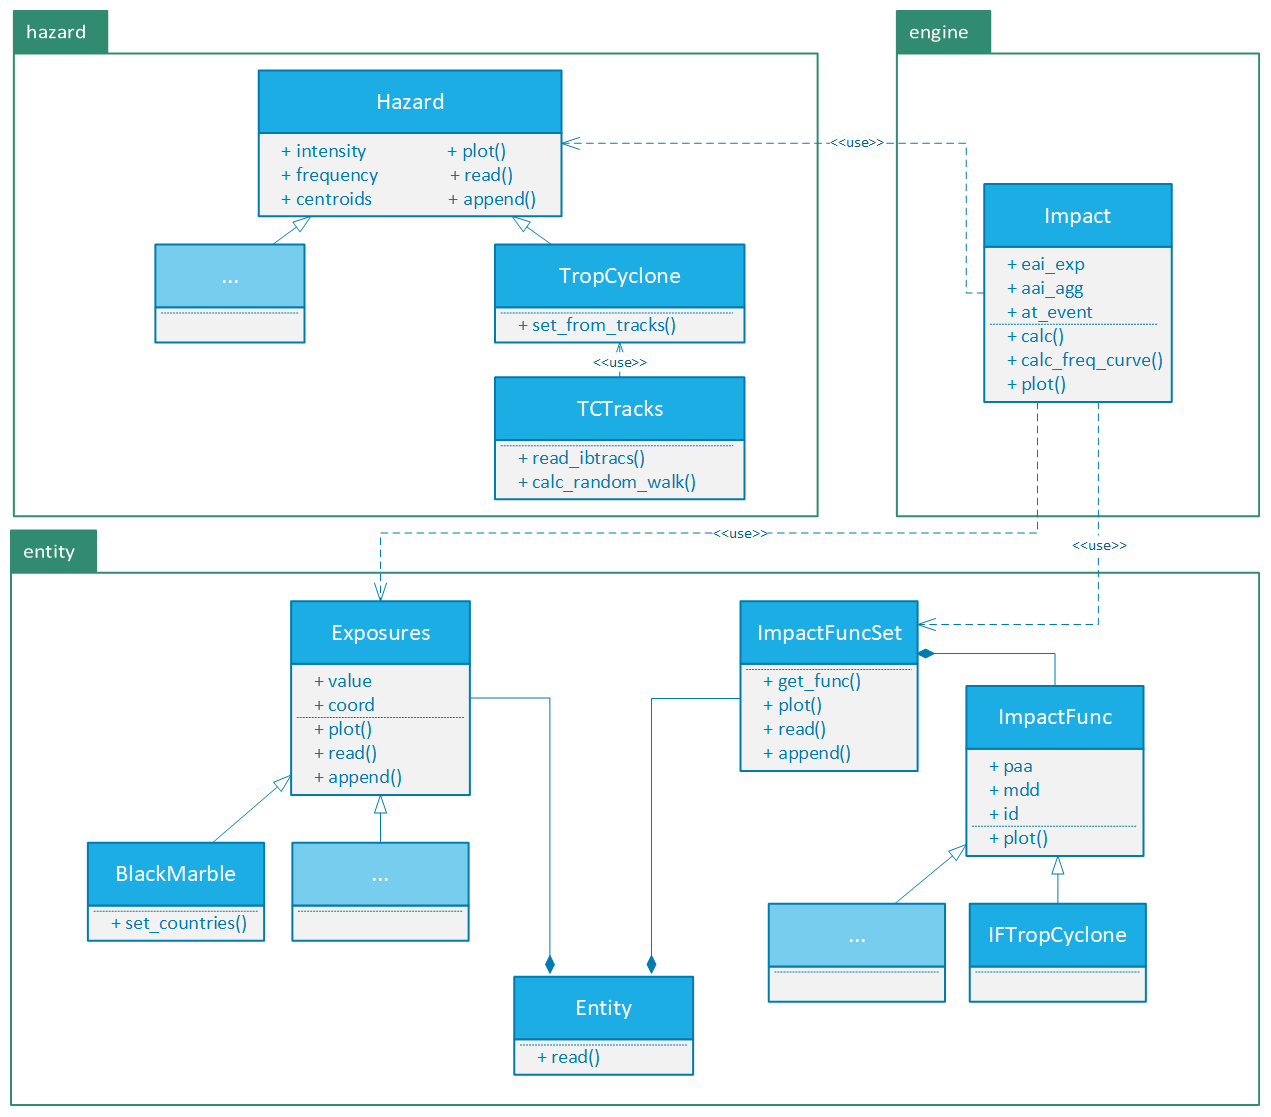
Figure 2Simplified risk assessment architecture of CLIMADA. See Sect. 3 for more details on BlackMarble and TropCyclone. For more information on CLIMADA's components see https://climada-python.readthedocs.io/en/stable/ (last access: 17 July 2019).
2.2.1 Hazard
A hazard describes weather events such as storms, floods, droughts, or heat waves both in terms of probability of occurrence as well as physical intensity. They are defined by the base class Hazard (see Fig. 2) which gathers the required attributes that enable the impact computation (such as centroids, frequency per event, and intensity per event and centroid) and common methods such as readers and visualization functions. Each hazard class collects historical data and transforms them, if necessary, in order to construct a coherent event database. Stochastic events are generated taking into account the frequency and main intensity characteristics (such as local water depth for floods or gust speed for storms) of historical events, producing an ensemble of probabilistic events for each historical event. CLIMADA provides therefore an event-based probabilistic approach which does not depend on a hypothesis of a priori general probability distribution choices. The source of the historical data (e.g. inventories or satellite images) and the methodologies used to compute the hazard attributes and its stochastic events depend on each hazard type and are defined in its corresponding Hazard-derived class (e.g. TropCyclone for tropical cyclones, explained later in Sect. 3.2.2). This procedure provides a solid and homogeneous methodology to compute impacts worldwide. In the case where the risk analysis comprises a specific region where good quality data or models describing the hazard intensity and frequency are available, these can be directly ingested by the platform through the reader functions, skipping the hazard modelling part (in total or partially), and allowing us to easily and seamlessly combine CLIMADA with external sources. Hence the impact model can be used for a wide variety of applications, e.g. deterministically to assess the impact of a single (past or future) event or to quantify risk based on a (large) set of probabilistic events. Note that since the Hazard class is not an abstract class, any hazard that is not defined in CLIMADA can still be used by providing the Hazard attributes.
2.2.2 Entity
The entity package of CLIMADA contains the socioeconomic aspects of a risk assessment: exposures and impact functions. Default values of those can be obtained using the container class Entity.
The exposure is quantified with a value, but this is not necessarily needed to be a monetary asset. It can describe the geographical distribution of people, livelihoods, and assets or infrastructure, generally speaking of all items potentially exposed to hazards, including ecosystems and their services. This information is provided by the Exposures class, where also optional attributes related to insurability, such as deductible and coverage, are defined. Similarly to the Hazard class, Exposures provides the values needed for the impact computation – coord for coordinates and value defined for each coordinate – and common functionalities of a container, reader, and visualization class (see Fig. 2). It can be also directly used to compute the impact, or the user might use the different exposure models and data collections of CLIMADA, which are defined in the Exposures-derived classes. The Black Marble model explained in Sect. 3.2.1 below consists of an approximation of the economic exposure downscaling macroeconomic parameters, which is suited for economic analyses on a worldwide scale or at country or regional levels. Smaller-scale studies (cities) use normally georeferenced archives. Extensive GIS (geographic information system) data can be ingested with the reader methods.
Impact functions (fimp in Eq. 2) are defined for different exposure and hazard types. They approximate the loss probability function by relating the hazard intensity to the exposure's mean damage ratio (MDR) in method calc_mdr of class ImpactFunc (see Fig. 2). Impact function models can be defined using derived classes of ImpactFunc. ImpactFuncSet is the container of the ImpactFunc instances that are used in an assessment, which represent the different exposures and hazards.
2.2.3 Engine
Finally, the engine package contains the end products of the interactions of the classes defined in hazard and entity. The Impact class (see Fig. 2) is used to compute the impact of a hazard on its corresponding exposures and impact functions using the calc method and storing all the resulting risk assessment metrics. The hazard defined at its centroids is first mapped to the exposure coordinates. Then, the damage ratio derived by the impact functions is translated into direct impact by multiplying it by the exposed value as follows (based on Eq. 2):
where xij and hij are, respectively, the impact and hazard intensity due to event i at location j, valj the value of exposure at location j, γj are the parameters of exposure j that characterize its vulnerability, and fimp the impact function. The impact is obtained for every exposure j and every event i affecting it (historical and stochastic). Based on this impact for event and the frequency of each event, almost any risk metric can be calculated. Following the formalism of Cardona et al. (2012) we approximate the following.
-
Expected annual impact (EAI) at exposure j contained in attribute eai_exp:
where X is the impact random variable, E its expectation, Ei is an event, and F its (annual) frequency. Nhist is the number of historical events, represents an historical event, represents all the ensemble members of event , and Nev represents the total number of events. Independence of events is assumed.
-
Average annual impact (AAI) is contained in attribute aai_agg and is the addition of EAI over all exposures:
where Nexp is the number of exposures.
-
Probable maximum impact (PMI): PMI represents the impact that is exceeded at a fixed low annual frequency (typically 1/1500 to 1/250). It is obtained from the impact exceedance curve computed with method calc_freq_curve. Taking the total probability theorem into account, this curve is approximated by discretization of relation
where v(x) is the exceedance frequency of impact x, T(x) its equivalent return period, and h the hazard intensity. is the probability density function of h given that the historical event took place and is computed using the event's ensemble members. The probability of exceeding an impact value given intensity h, , is computed using the exposure values and their impact functions (Eq. 3). We assume that the impacts of an event at different exposures are independent. Following these definitions, a stakeholder interested in impacts with 300 years return period can define the PMI as x such that yr−1.
If one aims to compare the risk of two sets of exposures, it is helpful to retain the per event information.
-
Impact at event (at_event attribute of Impact): contains the per event impact over all locations
Using this formalism, metrics EAI and AAI can be expressed as follows,
If we now consider two sets of exposures (e.g. in two Caribbean islands), risk aggregation, as often applied in an insurance context, becomes straightforward. Let us assume in country A that damages are only considered above a threshold TA and up to a cover limit CA, and likewise TB and CB for country B. We calculate and from ground up and can now apply the non-linear coverage conditions as follows:
Hence the combined covered impact is and now risk measures as defined above easily apply to the resulting . This formalism allows for an elegant way to handle non-linear risk transfer options on a portfolio of exposure sets.
3.1 Case study area
Nineteen countries in the Caribbean region are not independent sovereign states; they retain constitutional relationships with their original metropolitan powers through different systems (Clegg, 2015). Natural catastrophes like hurricane Irma in September 2017 allow for the comparison of the reactions of their respective mainland governments (see Aballain, 2018). Irma made seven landfalls, four of which occurred as category 5 in the Saffir–Simpson scale across the northern Caribbean islands. It held a 60 h period of sustained category 5 intensity, which is the second longest such period on record, behind the 1932 Cuba Hurricane (Cangialosi et al., 2018). Irma's track over our study area is depicted in Fig. 3.
The Caribbean island groups we analyse in this paper are specified in Table 1. Whilst Antigua and Barbuda and St. Kitts and Nevis are sovereign countries, the other islands are either overseas collectivities of France (St. Barthélemy and Saint Martin), constituent territories of the Netherlands (Sint Maarten), special municipalities of the Netherlands (St. Eustatius and Saba), British overseas territories (Anguilla, British Virgin Islands, and Turks and Caicos Islands), or unincorporated and organized territories of the United States (United States Virgin Islands). As such, the corresponding mainland is the one responsible for security and defence.
Table 1Group of islands studied. Source is, in order prioritized, the World Bank, the UN data, the Central Bureau voor de Statistiek, and Comptes Economiques Rapides de l'Outre-mer and L'Institut d'Émission des Départements d'Outre-mer. The areas are obtained from Wikipedia.
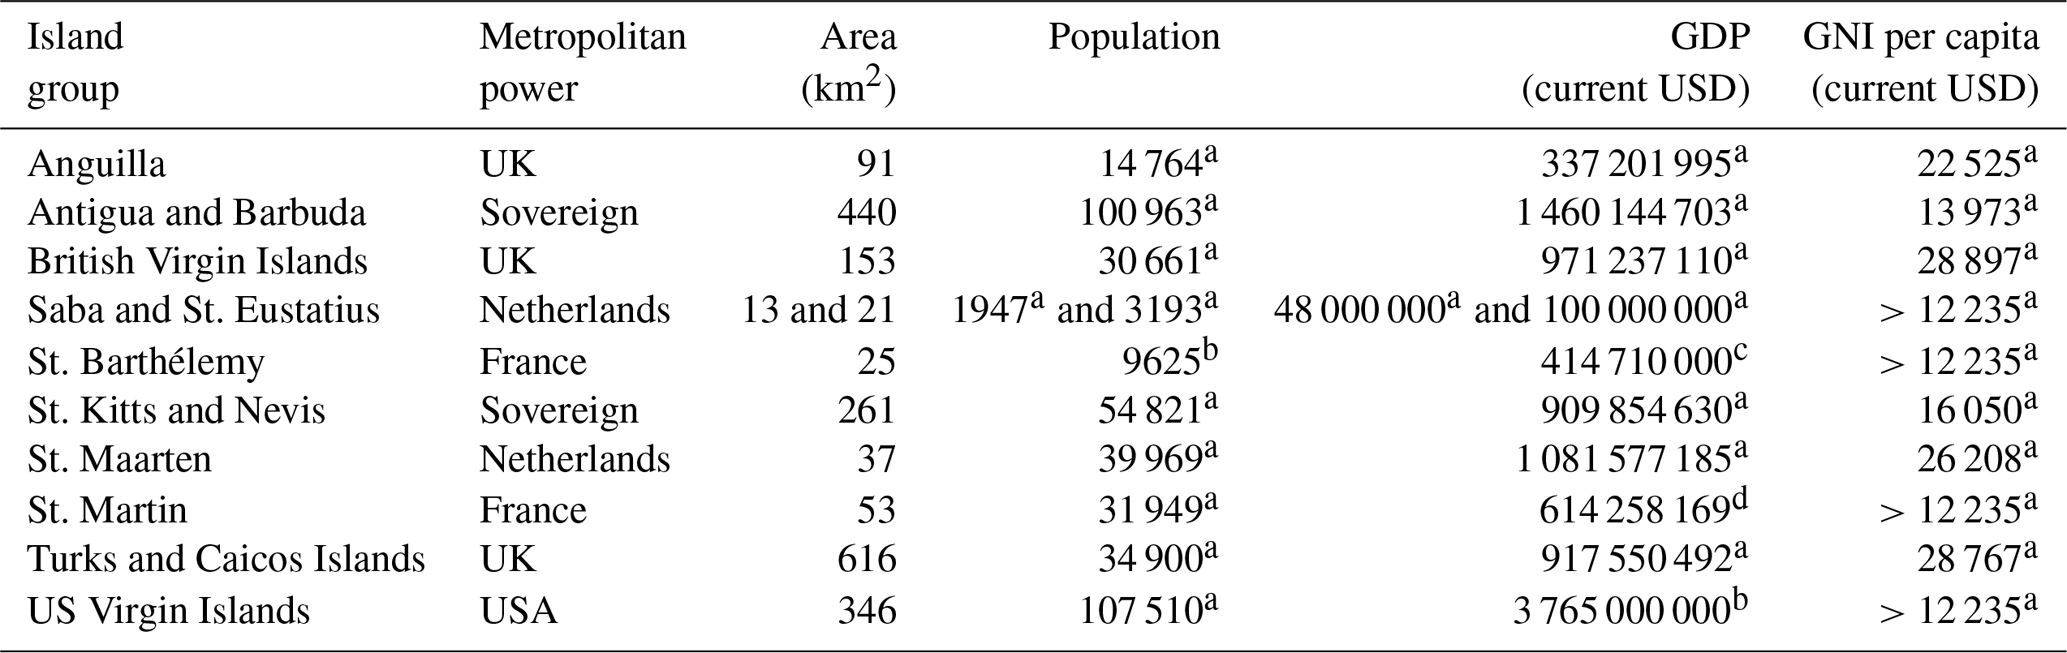
The superscripts indicate the year of the data: a 2016, b 2015, c 2014, and d 2010.
In the past the considered islands have developed their economy mainly through the primary sector but a discernible trend towards an expanding service sector started in the latter half of the 20th century, especially towards tourism (it accounts for 80 % of the economy of Sint Maarten). Some of the islands also developed their economies based on offshore finance, like the British Virgin Islands, Nevis, Anguilla, or the Turks and Caicos Islands.
3.2 Data and methods
3.2.1 Economic model using Black Marble
In order to approximate the spatial distribution and the amount of exposed economic value, we downscale the national gross domestic product (GDP) using the nighttime lights of NASA's Black Marble 2016 annual composite of the Visible Infrared Imaging Radiometer Suite (VIIRS) day–night band (DNB) at 500 m resolution (Román et al., 2018). This has been implemented in the BlackMarble class of Fig. 2. Data derived from nighttime satellite imagery have helped develop various globally consistent proxy measures of human well-being at the gridded, sub-national, and national level such as socioeconomic variables, energy use, urban built-in expansion, and carbon emissions (see review of Ghosh et al., 2013).
Henderson et al. (2012) relate growth of GDP to growth of night lights intensity, while later Bickenbach et al. (2016) argue that the result of Henderson et al. (2012) is stable at country level but unstable at lower levels. We consider the nominal GDP values at current US dollar at year 2016, before Irma's intervention, from the World Bank and the UN data. For the overseas collectivities of France, we infer the values from local reports, as specified in Table 1. As observed by Bickenbach et al. (2016), the GDP values for Saba and St. Eustatius result in an overestimation if retrieved from the downscaling of Netherlands' GDP through night light. In this case, we consider the GDP values reported by the Central Bureau voor de Statistiek.
According to Zhao et al. (2017), a linear relation between nighttime lights and GDP would result in over-distributions in suburban areas, under-distributions in urban areas, and very large under-distributions in urban core areas, where saturated pixels exist. To overcome this problem, we use a square transformation to correct urban and suburban GDP distribution. In addition, we multiply the total GDP by the income group level defined by the World Bank, which is based on the gross national income (GNI), as in Gettelman et al. (2017). The economic value exposed in each pixel vali is then
where inc_grp is the income group level (4 in all the islands) and the digital number of the light in pixel i.
In Table 2 we show the exposure values per island. The GAR 2015 models (de Bono and Chatenoux, 2014) are also presented since they are used in Cardona et al. (2017) to compute Irma's damage with CAPRA. In GAR 2015 statistical data such as socioeconomic information, building type, and capital stock are transposed onto a grid of 5 km size using GIS data such as gridded population dataset (LandScan) and VIIRS DNB data.
Table 2Exposed economic values and Irma damage (discussed further below in Sect. 3.3) per island group in current millions of USD.

The superscripts indicate the source of the data: a ECLAC (Economic Commission for Latin America and the Caribbean). b Estimate of damage in public sector (based on an interview of St. Kitts and Nevis prime minister Timothy Harris; http://www.thestkittsnevisobserver.com/local-news/hurricane-irma-leaves-st-kitts-and-nevis-with-initial-53-2-million-in-damages/, last access: 17 July 2019). c Amount claimed to be needed for recovery (based on an interview of Virgin Islands governor Kenneth Mapp; https://eu.usatoday.com/story/news/2017/11/09/no-electricity-homes-ruins-reporter-goes-home-and-finds-misery-hope-and-resilience-u-s-virgin-island/826573001/, last access: 17 July 2019).
3.2.2 Modelling tropical cyclone damage
The TropCyclone class handles the tropical cyclone model in CLIMADA. It computes the hazard properties from input tropical cyclone tracks, which are managed by the class TCTracks (see Fig. 2). TCTracks ingests the tracks of the International Best Track Archive for Climate Stewardship (IBTrACS) archive (Knapp et al., 2010). We use the latest version, 04, of the archive. Since not all the track records contain all the necessary information, especially before 1980, we use the selection and processing of tracks described by Geiger et al. (2018), which does not consider tracks before 1950. Synthetic tracks are obtained from historical ones by a direct random-walk process, starting at slightly perturbed initial locations of the tracks (Kleppek et al., 2008). Moreover, in order to take the decay of wind intensities after landfall into account, we statistically build an exponential decay coefficient of the wind speed (and corresponding increasing pressure) and apply it to the synthetic tracks after landfall. Thus, 693 tracks have crossed the surrounding area of study (a square of approximately 3000 km side length containing the islands) between 1950 and 2017, and we generate an ensemble of 50 samples for each historical event, obtaining a catalogue of 34 650 tropical cyclones. Assuming stationarity to estimate current risk, the annual frequency assigned to each event is the same as observed in the historic dataset. The event frequency is then yr−1 yr−1.
A tropical cyclone track contains the following information about the eye: time, location, radius of maximum winds, and central and environmental pressure. From these properties the 1 min sustained peak gusts are computed as the sum of a static circular wind field (following Holland, 2008) and the translational wind speed that arises from the storm movement. We incorporate the decline of the translational component from the cyclone centre by multiplying it by an attenuation factor. See Geiger et al. (2018) for more details about the implementation and its limitations.
Finally, the event intensities are translated into damage using the impact function of Emanuel (2011). In this function the property damage starts above a threshold vthresh equal to 25.7 m s−1 and increases as the cubic power of the wind speed as follows:
where vhalf is the wind gust where half of the property is damaged and vij is the maximum wind gust at centroid i due to event j. Following the findings of Sealy and Strobl (2017) for the Bahamas, we consider vhalf=74.7 m s−1.
3.3 Model evaluation: direct economic damage of hurricane Irma
Fig. 3a and c shows the exposed economic value of the islands computed with the Black Marble model (Sect. 3.2.1), Irma's track, and the contour curves of its maximum 1 min sustained wind in knots computed with the tropical cyclone model (Sect. 3.2.2). Fig. 3b and d shows the computed damage generated by the storm using Eq. (3). The aggregated values of damage are shown in Table 2. Economic damage estimations can vary significantly between data sources. In Table 2 we compare our results against the following sources: the Emergency Events Database (EM-DAT)1, the National Hurricane Center's (NHC) Tropical Cyclone Report (Cangialosi et al., 2018), and the Economic Commission for Latin America and the Caribbean (ECLAC) report (ECLAC, 2018). Moreover, we consider the results of CAPRA in Cardona et al. (2017).

Figure 3(a, c) Rendered exposed value, contour lines of Irma maximum 1 min sustained winds (in knots) and Irma track as modelled by CLIMADA. (b, d) Economic damage generated by Irma computed by CLIMADA.
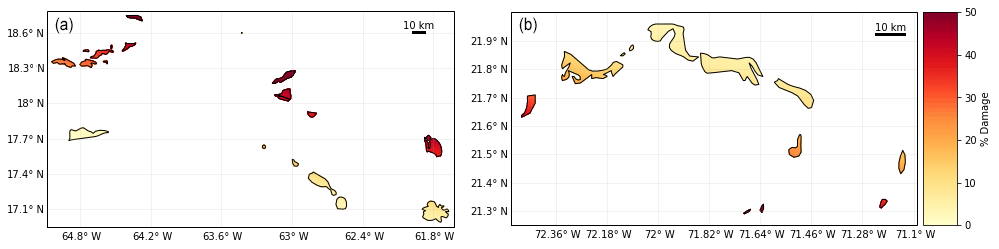
Figure 4Economic damage computed by CLIMADA as percentage of local exposure (per pixel). (a) Lesser Antilles; (b) Turks and Caicos Islands.
In all the cases the order of magnitude of the damages computed by CLIMADA lies within the ranges provided by various sources. Whilst one might argue that Anguilla reaches a higher damage because of its presumably inflated GDP from offshore finances, this is not the case for other tax havens, such as the Turks and Caicos Islands, the British Virgin Islands, or the US Virgin Islands. The amount claimed by the latter one represents the money needed for recovery, which can exceed the replacement cost to previous standards computed by the models. We note that in this case changing the polynomial transformation of the night lights does not change considerably the aggregated amount of damage per island. This is due to the small scale of the islands compared to the wind fields scope. Changing the islands' income group level does lead to less realistic damages.
3.4 Risk assessment
Risk emerges from the interaction between natural hazard and its exposure. From the tropical cyclone ensembles built according to Sect. 3.2.2, hazard return period maps can be calculated. Figure 5 represents the maximum 1 min sustained wind speeds in knots for return periods of 25, 50, 100, and 250 years. All the island groups studied are approximately equally exposed to the same level of intensity, which reaches the category 5 every 250 years.

Figure 5Wind fields in knots for return periods (RPs) of 25, 50, 100, and 250 years in the study region.
Combining the hazard with the exposure value and location as in Eq. (6), we obtain the damage levels of Fig. 6 for return periods of up to 3400 years. The curves grow initially fast, reaching the tens of millions of US dollar damages with a return period of 10 years in all the islands. The whole region being susceptible to frequent and intense tropical cyclones, every mainland and sovereign territory should count with damages exceeding USD 1 billion every 100 years. The dots in the figure represent the damage caused by Irma, which exemplifies an event with return period of 20–30 years for the US Virgin Islands, St. Kitts and Nevis, Antigua and Barbuda, and Saba and St. Eustatius. We notice that the assumption of independent events in Eq. (6) does not allow us to study compound events. Fig. 6 provides, therefore, the probability of exceedance of an impact caused by a single tropical cyclone; the occurrence of correlated events is not fully addressed.
The quality of the probability distribution obtained by the ensembles is assessed in the probability–probability plot of Fig. 7. There we compare the cumulative probability distribution of the damages of the historical events (693 events) – empirical distribution in Fig. 7 – with the cumulative probability distribution obtained from the full set of events (34 650 events) – model distribution in Fig. 7 – evaluated at every historical event. Whilst the zero damaging historical events are slightly underestimated by the model, the highly damaging events reach a better fitting. In general, the historical damages lie close to the identity line.
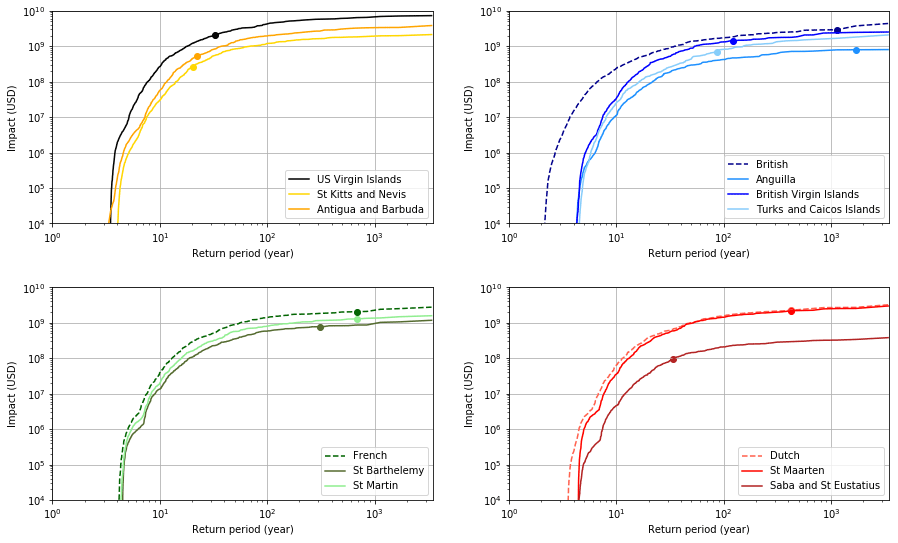
Figure 6Impact exceedance frequency curves for the different island groups and their accumulated value per mainland power. The dots represent the damage reached by hurricane Irma.
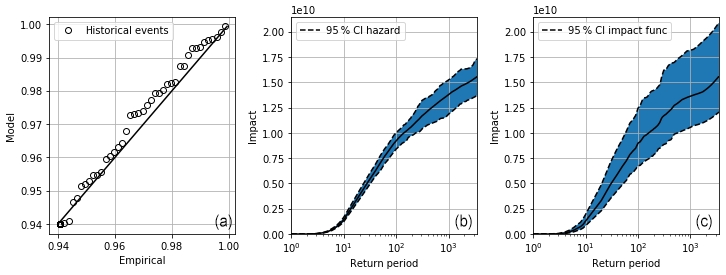
Figure 7Quality metrics of the impact distribution. (a) shows the probability-probability plot. (b) shows the mean value and the 95 % confidence interval (CI) when sampling on the hurricane tracks and (c) represents the 95 % CI when sampling on impact functions with a maximal 10 % shape modification, allowing to assess the uncertainty introduced by the models.
Furthermore, we analyse the amount of uncertainty intrinsic to the probabilistic hazard model and the vulnerability model. Performing a Monte Carlo-based simulation with 100 repetitions of the synthetic track generation, we compute their corresponding total damage and represent the 95 % confidence interval (CI) in Fig. 7b. We compute the same number of scenarios with a fixed hazard and modify 10 % of the shape of the impact function by uniformly sampling from its parameters of Eq. (12): vhalf+εhalf and vthresh+εthresh, where . The 95 % CI of the last distribution is shown in Fig. 7c. The highest uncertainty range is obtained for extremely rare events (once every 3400 years), which produce a total damage in the region between USD 12.5 and 21 billion. It is clear from the comparison of both figures that the uncertainty induced by the socioeconomic model is greater than the one produced by the tropical cyclone model, which is in line with Gettelman et al. (2017). Other sources of uncertainty can originate from modelling tropical cyclone damages based only on their wind gusts. Even if the model works fine for regular hurricanes like Irma (Sect. 3.3), rainfall and storm surges can account for high damages also in less windy storms (e.g. hurricane Sandy in 2012) that are not completely captured.
Table 3Average annual impact and exceedance impact level for several yearly return periods in millions of USD.
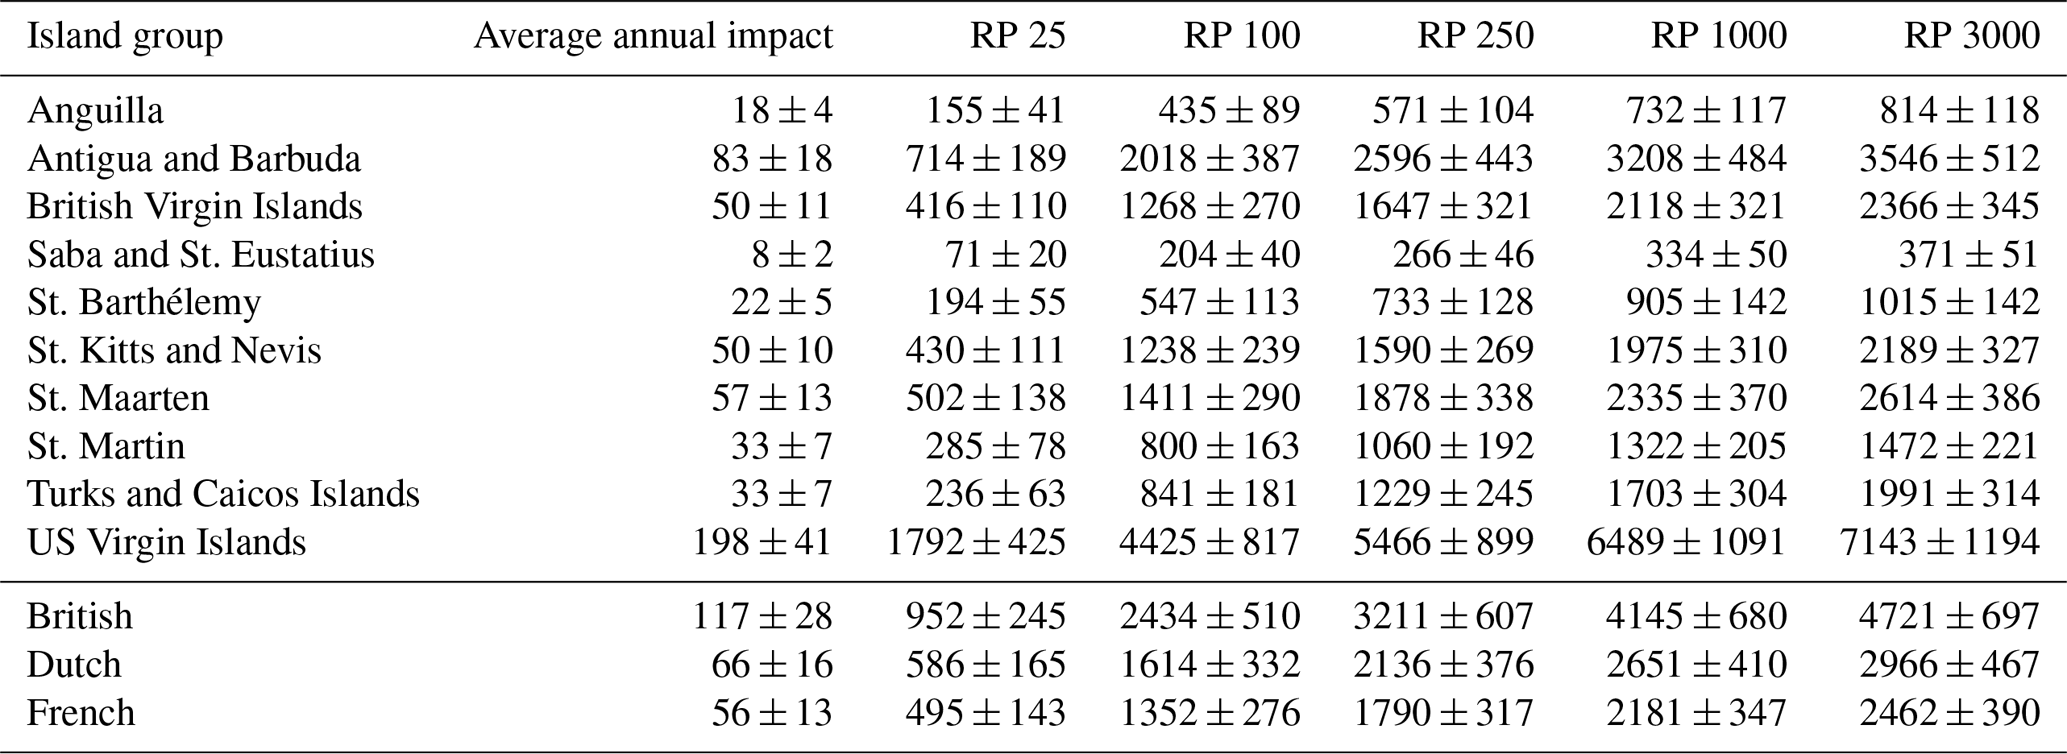
Performing a last Monte Carlo simulation which combines both hazard and impact function sampling, we obtain the results of Table 3. The average annual impact reported (see Eq. 5) indicates that the money every island should yearly put aside to cover for all the coming hurricane damages ranges from USD 8±2 million for Saba and St. Eustatius to USD 198±41 million for the US Virgin Islands. The metrics per mainland power are also shown. After Irma's crisis the Foreign Affairs Committee of the House of Commons recognized the vulnerability to natural disasters of their overseas territories and the need to address it (Foreign Affairs Committee, House of Commons, 2018). The results per mainland presented here account for the probability of several overseas territories being hit by the same event, and the accumulated damage that might arise. These metrics can therefore help mainlands to define natural disaster response strategies able to cope with all expected impacts, as well as long-term cost-effective resilience measures.
Other risk assessment studies have been performed on the Caribbean before. Bertinelli et al. (2016) study the hurricane damage over the whole Caribbean and obtain USD 30 billion damage for a 500-year event. They compute a local wind damage index using night light intensities and aggregate by country to compute the translated monetary value using the GDP – night light relation of Chen and Nordhaus (2011). Given that their study region includes bigger islands, such as the Cayman Islands, Jamaica, and Puerto Rico, which amounts to a total GDP 28 times bigger than in our study area, their result is in agreement with the USD 1.25 billion we obtain for a 500-year event in the whole region. Comparing at the island level, the Caribbean Catastrophe Risk Insurance Facility (2010) (CCRIF) estimates an expected annual damage of USD 15 million in Anguilla, which lies in our range estimate of USD 18±4 million. However, their study includes both damage from wind and flooding of tropical cyclones.
CLIMADA offers a risk assessment framework to perform multi-hazard analyses at global and local scales. We are building a catalogue of event-based probabilistic hazard models for weather and climate disasters such as drought, flood or windstorm, and their corresponding socioeconomic exposure on a global scale at medium (10 km) to high (500 m) resolution. These models allow one to perform risk analyses globally in a consistent way and with the minimum necessary information. The modularity of the object-oriented tool allows one to easily integrate third-party models through reading functions and complementary Python libraries which support a vast variety of file formats (e.g. for shape and grid files). Thanks to the description of the most computationally cost-intensive algorithms in matrix from, CLIMADA can compute impacts and risk metrics on a laptop efficiently even at high geographic resolution for hundreds of thousands of events. Moreover, its parallelized components allow one to scale the computations on a cluster, reducing significantly the execution time of the most time-consuming computations, such as the synthetic events generation (which does – nota bene – not need to be repeated for each risk assessment). The performance characteristics are indispensable for decision making, where different scenarios need to be tested and compared as fast as possible to obtain a better understanding of the inherent uncertainty.
In this paper we have presented the application of CLIMADA to assess the economic impact of hurricane Irma to small Caribbean islands, where most of them rely on overseas security support because of their non-sovereign status. The computed damages agree well with reported ones, within the uncertainties inherent to the losses reported. To put these impacts into context, we performed a probabilistic tropical cyclone risk analysis in the same region and estimated the intrinsic model uncertainties originating from the hazard and vulnerability used. The only data used were satellite nightlight intensities, two macroeconomic indicators (GDP and income group level) of the islands, and the historical hurricane tracks of the IBTrACS repository. This has allowed us to perform an analysis at 500 m spatial resolution. The corresponding amount of exposure coordinates is 9311 and we have generated a catalogue of 34 560 hurricane events. On a laptop with 4 virtual CPUs, it took less than 2 h to generate the full probabilistic hazard set and only a few seconds to calculate the resulting impact and risk metrics.
Future work includes the modelling of tropical cyclone damages not only based on their wind intensity, but also based on coupled rainfall amount and surge height, components that might become increasingly dominate because of climate change (Garner et al., 2017). Other hazard types, exposures, and impact functions are being developed in CLIMADA under a cooperative model using unit testing and a continuous integration platform. The presented work constitutes the base for the risk assessment functionality that will allow us to perform adaptation options appraisal under different future scenarios.
CLIMADA is openly available at GitHub (https://github.com/CLIMADA-project/climada_python, Bresch and Aznar-Siguna, 2019a) under the GNU GPL license (GNU Operating System, 2007). The documentation is hosted on Read the Docs (https://climada-python.readthedocs.io/en/stable/, Aznar-Siguna and Bresch, 2019) and includes a link to the interactive tutorial of CLIMADA. v1.0.0 was used for this publication, which is permanently available at the ETH Data Archive: https://doi.org/10.5905/ethz-1007-187 (Bresch and Aznar-Siguan, 2019b). The script reproducing the main results of the paper as well as all the figures is available under https://github.com/CLIMADA-project/climada_papers (Bresch and Aznar-Siguna, 2019c).
DNB conceptualized CLIMADA and oversaw its implementation in Python, based on the previous MATLAB implementation by himself. GAS designed and executed the Python implementation of the software, defined the case study, and performed the analysis. GAS prepared the article in discussion with contributions by DNB.
The authors declare that they have no conflict of interest.
David N. Bresch developed the first version of CLIMADA as a basis for teaching a master course on uncertainty and risk at ETH back in 2010. He is thankful for many students' feedback and improvement suggestions, without which the model would not be as comprehensive and stable a tool as it is by now.
This paper was edited by James Annan and reviewed by Mauricio Pohl and one anonymous referee.
Aballain, O.: Hurricane Irma and Hurricane Maria in the media: France vs America, a Contrastive Analysis, Utrecht University, 2018.
Aznar-Siguan, G. and Bresch, D. N.: CLIMADA_python documentation, available at: https://climada-python.readthedocs.io/en/stable/, last access: 17 July 2019.
Bertinelli, L., Mohan, P., and Strobl, E.: Hurricane damage risk assessment in the Caribbean: An analysis using synthetic hurricane events and nightlight imagery, Ecol. Econ., 108, 8589–8594, https://doi.org/10.1016/j.ecolecon.2016.02.004, 2016.
Bevere, L., Schwartz, M., Sharan, R., and Zimmerli, P.: Natural catastrophes and man-made disasters in 2017: a year of record-breaking losses, available at: http://media.swissre.com/documents/sigma1_2018_en.pdf (last access: 17 July 2019), 2018.
Bickenbach, F., Bode, E., Nunnenkamp, P., and Söder, M.: Night lights and regional GDP, Rev. World Econ., 152, 425–447, https://doi.org/10.1007/s10290-016-0246-0, 2016.
Bouwer, L. M.: Have disaster losses increased due to anthropogenic climate change?, B. Am. Meteorol. Soc., 92, 39–46, 2011.
Bresch, D. N.: Shaping Climate Resilient Development – Economics of Climate Adaptation, in: Climate Change Adaptation Strategies – An Upstream-downstream Perspective, edited by: Salzmann, G., Huggel, N., Nussbaumer, C., and Ziervogel, S. U., Springer, available at: https://link.springer.com/book/10.1007 %2F 978-3-319-40773-9 (last access: 17 July 2019), 2016.
Bresch, D. N. and Aznar-Siguan, G.: CLIMADA_python, available at: https://github.com/CLIMADA-project/climada_python, last access: 17 July 2019a.
Bresch, D. N. and Aznar-Siguan, G.: CLIMADA_python v1.0.0, https://doi.org/10.5905/ethz-1007-187, 2019b.
Bresch, D. N. and Aznar-Siguan, G.: CLIMADA_python publications, https://github.com/CLIMADA-project/climada_papers, 2019c.
Bresch, D. N. and ECA working group: Shaping climate-resilient development: A framework for decision-making, available at: https://www.ethz.ch/content/dam/ethz/special-interest/usys/ied/wcr-dam/documents/Economics_of_Climate_Adaptation_ECA.pdf (last access: 17 July 2019), 2009.
Bresch, D. N. and Schraft, A.: Neue, integrierte sichtweise zum Umgang mit Klimarisiken und deren Versicherung, Schweiz. Z. Forstwes., 162, 464–468, https://doi.org/10.3188/szf.2011.0464, 2011.
Cangialosi, J. P., Latto, A. S., and Berg, R.: National Hurricane Center Tropical Cyclone Report: Huricane Irma (AL12017), 30 August–12 September 2017, 2018.
Cardona, O., Ordaz, M., Reinoso, E., Yamín, L. E., and Barbat, A. H.: CAPRA – comprehensive approach to probabilistic risk assessment: international initiative for risk management effectiveness, Proc. 15th World Conf. Earthq. Eng. – WCEE, 1, September, 1–10, available at: http://www.iitk.ac.in/nicee/wcee/article/WCEE2012_0726.pdf (last access: 17 July 2019), 2012.
Cardona, O., Bernal, G. A., and Villegas, C. P.: Loss assessment for hurricane irma – Final Report, INGENIAR Risk Intelligence: CIMNE, available at: https://reliefweb.int/sites/reliefweb.int/files/resources/Hurricane Irma R4 odc.pdf (last access: 17 July 2019), 2017.
CCRIF: The Caribbean Catastrophe Risk Insurance: Enhancing the Climate Risk and Adaptation Fact Base for the Caribbean, CCRIF's Econ. Clim. Adapt. Initiat., available at: https://www.ccrif.org/sites/default/files/publications/ECABrochureFinalAugust182010.pdf (last access: 17 July 2019), 2010.
Chen, X. and Nordhaus, W. D.: Using luminosity data as a proxy for economic statistics, P. Natl. Acad. Sci. USA, 108, 8589–8594, https://doi.org/10.2139/ssrn.1666164, 2011.
Clegg, P.: The Non-Self Governing Territories of the Caribbean and Debates over Autonomy, in: South America, Central America and the Caribbean 2016, edited by: West, E. J., Routledge, Abingdon, 33–39, available at: https://www.routledge.com/products/9781857437850 (last access: 17 July 2019), 2015.
de Bono, A. and Chatenoux, B.: A global exposures model for GAR 2015, available at: https://www.preventionweb.net/english/hyogo/gar/2015/en/bgdocs/risk-section/De%20Bono,%20Andrea,%20Bruno%20Chatenoux.%202015.%20A%20Global%20Exposure%20Model%20for%20GAR%202015,%20%20UNEP-GRID.pdf (last access: 17 July 2019), 2014.
ECLAC: Irma and Maria By Numbers, Focus (Madison), 1–17, available at: https://repositorio.cepal.org/bitstream/handle/11362/43446/1/FOCUSIssue1Jan-Mar2018.pdf (last access: 17 July 2019), 2018.
Emanuel, K.: Global Warming Effects on U.S. Hurricane Damage, Weather. Clim. Soc., 3, 261–268, https://doi.org/10.1175/WCAS-D-11-00007.1, 2011.
Foreign Affairs Committee, House of Commons: The UK's response to hurricanes in its Overseas Territories, Fifth Report of Session 2017–19, London, available at: https://publications.parliament.uk/pa/cm201719/cmselect/cmfaff/722/722.pdf (last access: 17 July 2019), 2018.
Garner, A. J., Mann, M. E., Emanuel, K. A., Kopp, R. E., Lin, N., Alley, R. B., Horton, B. P., DeConto, R. M., Donnelly, J. P., and Pollard, D.: Impact of climate change on New York City's coastal flood hazard: Increasing flood heights from the preindustrial to 2300 CE, P. Natl. Acad. Sci. USA, 114, 201703568, https://doi.org/10.1073/pnas.1703568114, 2017.
Geiger, T., Frieler, K., and Bresch, D. N.: A global historical data set of tropical cyclone exposure (TCE-DAT), Earth Syst. Sci. Data, 10, 185–194, https://doi.org/10.5194/essd-10-185-2018, 2018.
Gettelman, A., Bresch, D. N., Chen, C. C., Truesdale, J. E., and Bacmeister, J. T.: Projections of future tropical cyclone damage with a high-resolution global climate model, Climatic Change, 146, 575–585, https://doi.org/10.1007/s10584-017-1902-7, 2017.
Ghosh, T., Anderson, S. J., Elvidge, C. D., and Sutton, P. C.: Using nighttime satellite imagery as a proxy measure of human well-being, Sustainability, 5, 4988–5019, https://doi.org/10.3390/su5124988, 2013.
GNU Operating System: GNU General Public License, version 3, available at: https://www.gnu.org/licenses/gpl.html (last access: 17 July 2019), 2007.
Gregory, R. D., Willis, S. G., Jiguet, F., Voříšek, P., Klvaňová, A., van Strien, A., Huntley, B., Collingham, Y. C., Couvet, D., and Green, R. E.: An indicator of the impact of climatic change on European bird populations, PLoS One, 4, e4678, https://doi.org/10.1371/journal.pone.0004678, 2009.
Henderson, J. V., Storeygard, A., and Weil, D. N.: Measuring Economic Growth from Outer Space, Am. Econ. Rev., 102, 994–1028, https://doi.org/10.1257/aer.102.2.994, 2012.
Holland, G.: A Revised Hurricane Pressure–Wind Model, Mon. Weather Rev., 136, 3432–3445, https://doi.org/10.1175/2008MWR2395.1, 2008.
IPCC: Managing the Risks of Extreme Events and Disasters to Advance Climate Change Adaptation. A Special Report of Working Groups I and II of the Intergovernmental Panel on Climate Change, edited by: Field, C. B., Barros, V., Stocker, T. F., Qin, D., Dokken, D. J., Ebi, K. L., Mastrandrea, M. D., Mach, K. J., Plattner, G.-K., Allen, S. K., Tignor, M., and Midgley, P. M.: Cambridge University Press, Cambridge, UK, and New York, NY, USA, 2012.
IPCC: Climate Change 2014: Impacts, Adaptation and Vulnerability. Part A: Global and Sectoral Aspects. Contribution of Working Group II to the Fifth Assessment Report of the Intergovernmental Panel on Climate Change, edited by: Field, C. B., Barros, V. R., Dokken, D. J., Mach, K. J., Mastrandrea, M. D., Bilir, T. E., Chatterjee, M., Ebi, K. L., Estrada, Y. O., Genova, R. C., Girma, B., Kissel, E. S., Levy, A. N., MacCracken, S., Mastrandrea, P. R., and White, L. L., Cambridge University Press, United Kingdom and New York, NY, USA, 2014.
King, A. B. and Bell, R.: Riskscape New Zealand – A Multihazard Loss Modelling Tool, in: 2006 NZSEE Conference, p. 9., 2006.
Kleppek, S., Muccione, V., Raible, C. C., Bresch, D. N., Koellner-Heck, P., and Stocker, T. F.: Tropical cyclones in ERA-40: A detection and tracking method, Geophys. Res. Lett., 35, 1–5, https://doi.org/10.1029/2008GL033880, 2008.
Knapp, K. R., Kruk, M. C., Levinson, D. H., Diamond, H. J., and Neumann, C. J.: The international best track archive for climate stewardship (IBTrACS), B. Am. Meteorol. Soc., 91, 363–376, https://doi.org/10.1175/2009BAMS2755.1, 2010.
Lark, J.: ISO31000: Risk Management: a Practical Guide for SMEs, International Organization for Standardization, available at: https://thaiindustrialoffice.files.wordpress.com/2016/02/iso_31000_for_smes.pdf (last access: 17 July 2019), 2015.
Román, M. O., Wang, Z., Sun, Q., Kalb, V., Miller, S. D., Molthan, A., Schultz, L., Bell, J., Stokes, E. C., Pandey, B., Seto, K. C., Hall, D., Oda, T., Wolfe, R. E., Lin, G., Golpayegani, N., Devadiga, S., Davidson, C., Sarkar, S., Praderas, C., Schmaltz, J., Boller, R., Stevens, J., Ramos González, O. M., Padilla, E., Alonso, J., Detrés, Y., Armstrong, R., Miranda, I., Conte, Y., Marrero, N., MacManus, K., Esch, T., and Masuoka, E. J.: NASA's Black Marble nighttime lights product suite, Remote Sens. Environ., 210, 113–143, https://doi.org/10.1016/j.rse.2018.03.017, 2018.
Schneider, P. J., Schauer, B. A., and Asce, M.: HAZUS – Its Development and Its Future, Nat. Hazards Rev., 7, 40–44, 2006.
Sealy, K. S. and Strobl, E.: A hurricane loss risk assessment of coastal properties in the caribbean: Evidence from the Bahamas, Ocean Coast. Manage., 149, 42–51, https://doi.org/10.1016/j.ocecoaman.2017.09.013, 2017.
Souvignet, M., Wieneke, F., Müller, L., and Bresch, D. N.: Economics of Climate Adaptation (ECA): Guidebook for Practitioners, KfW Group, KfW Development Bank, Frankfurt am Main, available at: https://www.kfw-entwicklungsbank.de/PDF/Download-Center/Materialien/2016_No6_Guidebook_Economics-of-Climate-Adaptation_EN.pdf (last access: 17 July 2019), 2016.
Welker, C., Martius, O., Stucki, P., Bresch, D., Dierer, S., and Brönnimann, S.: Modelling economic losses of historic and present-day high-impact winter windstorms in Switzerland, Tellus A, 68, 29546, https://doi.org/10.3402/tellusa.v68.29546, 2016.
Zhao, N., Liu, Y., Cao, G., Samson, E. L., and Zhang, J.: Forecasting China's GDP at the pixel level using nighttime lights time series and population images, GISci. Remote Sens., 54, 407–425, https://doi.org/10.1080/15481603.2016.1276705, 2017.
Zscheischler, J., Westra, S., Van Den Hurk, B. J. J. M., Seneviratne, S. I., Ward, P. J., Pitman, A., Aghakouchak, A., Bresch, D. N., Leonard, M., Wahl, T., and Zhang, X.: Future climate risk from compound events, Nat. Clim. Change, 8, 469–477, https://doi.org/10.1038/s41558-018-0156-3, 2018.
EM-DAT: the Emergency Events Database – Université catholique de Louvain (UCL) – CRED (Centre for Research on the Epidemiology of Disasters), Debarati Guha-Sapir – https://www.emdat.be/ (last access: 17 July 2019), Brussels, Belgium.