the Creative Commons Attribution 4.0 License.
the Creative Commons Attribution 4.0 License.
 | 29 Nov 2018
The use of radiocarbon 14C to constrain carbon dynamics in the soil module of the land surface model ORCHIDEE (SVN r5165)
Marwa Tifafi
Marta Camino-Serrano
Christine Hatté
Hector Morras
Lucas Moretti
Sebastián Barbaro
Sophie Cornu
Bertrand Guenet
Despite the importance of soil as a large component of the terrestrial ecosystem, the soil compartments are not well represented in land surface models (LSMs). Indeed, soils in current LSMs are generally represented based on a very simplified schema that can induce a misrepresentation of the deep dynamics of soil carbon. Here, we present a new version of the Institut Pierre Simon Laplace (IPSL) LSM called ORCHIDEE-SOM (ORganizing Carbon and Hydrology in Dynamic EcosystEms-Soil Organic Matter), incorporating the 14C dynamics into the soil. ORCHIDEE-SOM first simulates soil carbon dynamics for different layers, down to 2 m depth. Second, concentration of dissolved organic carbon and its transport are modelled. Finally, soil organic carbon decomposition is considered taking into account the priming effect.
After implementing 14C in the soil module of the model, we evaluated model outputs against observations of soil organic carbon and modern 14C fraction (F14C) for different sites with different characteristics. The model managed to reproduce the soil organic carbon stocks and the F14C along the vertical profiles for the sites examined. However, an overestimation of the total carbon stock was noted, primarily on the surface layer. Due to 14C, it is possible to probe carbon age in the soil, which was found to be underestimated. Thereafter, two different tests on this new version have been established. The first was to increase carbon residence time of the passive pool and decrease the flux from the slow pool to the passive pool. The second was to establish an equation of diffusion, initially constant throughout the profile, making it vary exponentially as a function of depth. The first modifications did not improve the capacity of the model to reproduce observations, whereas the second test improved both estimation of surface soil carbon stock as well as soil carbon age. This demonstrates that we should focus more on vertical variation in soil parameters as a function of depth, in order to upgrade the representation of the global carbon cycle in LSMs, thereby helping to improve predictions of the of soil organic carbon to environmental changes.
- Article
(1561 KB) - Full-text XML
- BibTeX
- EndNote


The complexity of the mechanisms involved in controlling soil activity (Jastrow et al., 2007) and therefore the carbon flux from the soil to the atmosphere makes predicting the response of these systems to climate change extremely complex. Thus our ability to predict future changes in carbon stocks in soils using global climate models is currently heavily criticized (Todd-Brown et al., 2013; Wieder et al., 2013). Indeed, Earth system models (ESMs) are increasingly used today in order to predict the future evolution of the climate. For instance, results of a set of ESMs are taken into account within the Intergovernmental Panel on Climate Change (IPCC; Taylor et al., 2012) for assessment of the impacts of climate change and design of mitigation strategies. Hence, their predictions need to be as accurate as possible. These models represent the physical, chemical and biological processes within and between the atmosphere, ocean and terrestrial biosphere. They allow us to follow and understand both the effect of the climate on carbon storage and vice versa. However, ESMs are continuously under development and some key processes in the global carbon cycle are still missing or not represented with the necessary details. One of the components of an ESM is the land surface model (LSM). This component primarily manages the carbon cycle, energy and water on land and simulates the carbon exchange between the land surface and the atmosphere, namely the gross primary production (GPP) and the autotrophic and heterotrophic respiration.
Despite the importance of soils as a large component of the global carbon storage, soil compartments are not well represented in LSMs (Todd-Brown et al., 2013). Indeed, carbon dynamics in soil described in LSMs are based on the “Century” (Parton et al., 1987) or RothC models (Coleman et al., 1997) where soil carbon is represented as several pools with different turnover rates for each pool. Carbon is decomposed in each pool, one part of which is then transferred from one pool to another and the other part is lost through heterotrophic respiration. In addition, soils are generally represented as a single-layer box in LSMs that do not take into account the evolution and variation in soil organic processes as a function of depth (Todd-Brown et al., 2013).
One way to reconcile this simplified representation of carbon dynamics of the models with the complexity of the data collected in the field is to integrate isotopic tracers into the models themselves and thus facilitate the comparison between model outputs and data (He et al., 2016). Moreover, thanks to an additive constraint on the model structure, this may improve the model performance. For instance, radiocarbon is an important tool for studying the dynamics of soil organic matter (Trumbore, 2000). Indeed, 14C data acquired from soil organic matter provide complementary information on the dynamics (temporal dimension) of soil organic matter. This tracer has the major advantage of being integrator of carbon dynamics on long timescales (a few decades to several centuries). It is therefore a very powerful tool to constrain conceptual schemes that may not be directly compared to variables measured in the field (Elliott et al., 1996). Different authors have already successfully implemented radiocarbon in soil models and were able to clearly show that the introduction of pools with turnover time of thousands of years were unnecessary to fit radiocarbon data (Ahrens et al., 2015), whereas Braakhekke et al. (2014) showed that after a re-parameterization of the models based on radiocarbon data the prediction of their model was quite different with more carbon in topsoil and less in deep soil compared to the model without radiocarbon.
Radiocarbon is produced naturally at a constant rate in the upper atmosphere through bombardment of cosmic rays. It thus provides information on the dynamics of organic matter that has been stabilized by interaction with mineral surfaces and stored long enough for significant radioactive decay (Trumbore, 2000), as the half-life of 14C is about 5730 years. We must also take into account radiocarbon produced during atmospheric tests of thermonuclear weapons in the early 1960s (Delibrias et al., 1964; Hua et al., 2013). Atmospheric bomb testing in the late 1950s and early 1960s led to an abrupt doubling of atmospheric 14C concentration in a span of 2–3 years. Through exchange with ocean and terrestrial reservoirs, it has decreased but still remains above the natural background. As with any other carbon isotope, this 14C was metabolized by the vegetation and transferred to soil. By measuring 14C activity of a soil sample, it is possible to evaluate the amount of carbon introduced into the soil since the 1960s (Balesdent and Guillet, 1982; Scharpenseel and Schiffmann, 1977).
In this study, we present a new version of the IPSL LSM called ORCHIDEE-SOM (ORganizing Carbon and Hydrology in Dynamic EcosystEms-Soil Organic Matter) incorporating 14C dynamics in the soil. Thanks to this tracer, we can evaluate the SOC dynamics, in particular by looking at the 14C peak produced by atmospheric weapons testing and observed in the soils at four different sites having different biomes.
2.1 ORCHIDEE-SOM overview
ORCHIDEE is the LSM of the IPSL Earth system model (Krinner et al., 2005). It is composed of three different modules. First, SECHIBA (Ducoudré et al., 1993; de Rosnay and Polcher, 1998), the surface–vegetation–atmosphere transfer scheme, describes the soil water budget and energy and water exchanges. The time step of this module is 30 min. Second, the module of the vegetation dynamics has been taken from the dynamic global vegetation model LPJ (Sitch et al., 2003). The time step of this module is 1 year. Finally, the STOMATE (Saclay Toulouse Orsay Model for the Analysis of Terrestrial Ecosystems) module simulates vegetation phenology and carbon dynamics with a time step of 1 day.
ORCHIDEE can be run coupled to a global circulation model where the boundary conditions of the model are provided by the atmospheric modules (temperature, precipitation, atmospheric CO2 concentration, etc.). In return, ORCHIDEE provides the land surface carbon, energy and water fluxes. However, since our study focuses on changes in the land surface rather than on the interaction with climate, we ran ORCHIDEE in the offline configuration. In this case, atmospheric conditions such as temperature, humidity and wind are read from a meteorological dataset. The climate data CRUNCEP used for our study (6-hourly climate data over several years) were obtained from the combination of two existing datasets: the Climate Research Unit (CRU; Mitchell et al., 2004) and the National Centers for Environmental Prediction (NCEP; Kalnay et al., 1996).

Figure 1Overview of the different fluxes and processes in soil as presented in the version of ORCHIDEE-SOM adapted from Camino-Serrano et al. (2018).
Our starting point is a ORCHIDEE-SOM version based on the SVN r3340 (Krinner et al., 2005), which is presented in detail in Camino-Serrano et al. (2017). Figure 1 represents how the soil is described in this new version. Indeed, the major particularity of ORCHIDEE-SOM is that it simulates the dynamics of soil carbon for 11 layers from the surface to 2 m depth. First, litter is divided into four pools: metabolic or structural litter pools which can be found below or above ground. Only the belowground litter is modelled on 11 levels, from surface to 2 m depth, as the aboveground litter layer has a fixed thickness of 10 mm. Second, SOC is divided into three pools (active, passive and slow), following Parton et al. (1988), which differ in their turnover rates and which are discretized into 11 layers up to a depth of 2 m. Then, dissolved organic carbon (DOC) is represented as two pools and also discretized over 11 layers up to a depth of 2 m: labile DOC has a high decomposition rate and recalcitrant DOC has a low decomposition rate (Camino-Serrano et al., 2018). Finally, another particularity of this version of ORCHIDEE-SOM is that the SOC decomposition is modified to account for the priming effect following Guenet et al. (2016). Briefly, priming is described following Eq. (1).
with DOCrecycled being the unrespired DOC that is redistributed into the pool i considered for each soil layer z in g C m−2 day−1, kSOC being a SOC decomposition rate constant (days−1), and LOC being the stock of labile organic C defined as the sum of the C pools with a higher decomposition rate than the pool considered within each soil layer z. We therefore considered that for the active carbon pool LOC is the litter and DOC, but for the slow carbon pool LOC is the sum of the litter, DOC and so on. Finally, c is a parameter controlling the impact of the LOC pool on the SOC mineralization rate, i.e. the priming effect. The equation was parameterized based on soil incubations data and evaluated over litter manipulation experiments (Guenet et al., 2016).
Since the soil profile is divided into 11 layers, SOC and DOC transport following the diffusion must also be described. SOC diffusion is actually a representation of bioturbation processes (animal and plant activity), whereas DOC relies more on non-biological diffusion. Both diffuse through concentration gradients.
This is represented using Fick's law (Braakhekke et al., 2011; Elzein and Balesdent, 1995; O'Brien and Stout, 1978; Wynn et al., 2005):
where FD is the flux of carbon transported by diffusion in g C m−3 day−1, D is the diffusion coefficient (m2 day−1) and C is the amount of carbon in the pool (DOC or SOC) subject to transport (g C m−3). The diffusion coefficient is assumed to be constant across the soil profile in ORCHIDEE-SOM but the diffusion parameters (D) used in the equations for SOC and DOC can differ. All the transport processes goes up to 2 m, corresponding to the soil depth fixed in the model. For DOC, at 2 m the DOC can be exported through drainage.
2.2 ORCHIDEE-SOM-14C
In ORCHIDEE-SOM, the different compartments (soil carbon input, litter, SOC, DOC and heterotrophic respiration) are presented as a matrix with a single dimension referring to the total carbon. In order to introduce the 14C, a new dimension has been added to all the variables cited above. Thus, all processes that apply to the total soil carbon are now also represented for 14C. We label this new version including 14C as ORCHIDEE-SOM-14C.
Several ways of reporting 14C activity levels are available. We chose to use the fraction modern, with the F14C symbol as advocated by Reimer et al. (2004) rather than absolute concentration of 14C (reported as Bq).
with C; S for sample and OX1 for “Oxalic Acid 1”, the 14C international standard. F14C is twice normalized: (i) it takes into account isotopic fractionation by being normalized to a δ13C = −25 ‰, and (ii) it corresponds to a deviation towards an international standard (i.e. 95 % of OX1 as measured in 1950; Stuiver and Polach, 1977). By propagating F14C from atmosphere at the origin of vegetal photosynthesis to soil respired CO2, there is no need to focus on 13C isotopic fractionation all along the organic matter mineralization with F14C.
To ease the readability of the paper, we will further express F14C as F14C with Asample being the A of the measured (or modelled) data and Aref an international reference. Normalizations are included in Aref and F14C will be written as F14 to simplify notation involving superscripts and subscripts.
Since we focus on SOC dynamics, we did not include the 14C in plants but did include 14C in the litter. The 14C-litter is obtained by multiplying the atmospheric value by the total carbon in the litter:
where F is the F14C of atmosphere at the time of leaf growth (Fig. 2).

Figure 2Evolution of the F14C of atmospheric CO2 in Argentina, Republic of the Congo and France (data from Hua et al., 2013).
Thus, from the litter, all processes defined in Sect. 2.1 that apply to total soil carbon are also represented for 14C.
We also take into account the radioactive decay of 14C. For that, we calculate the amount of 14C as follows:
where Kdecrease is the radioactive decay constant (= Ln2/5730; Godwin, 1962).
The F14C of the soil is then calculated back for carbon, per pool:
with Pool representing the active, slow or passive pool.
Finally, we calculate a mean F14C value per soil layer, according to depth:
2.3 Site descriptions
2.3.1 French sites
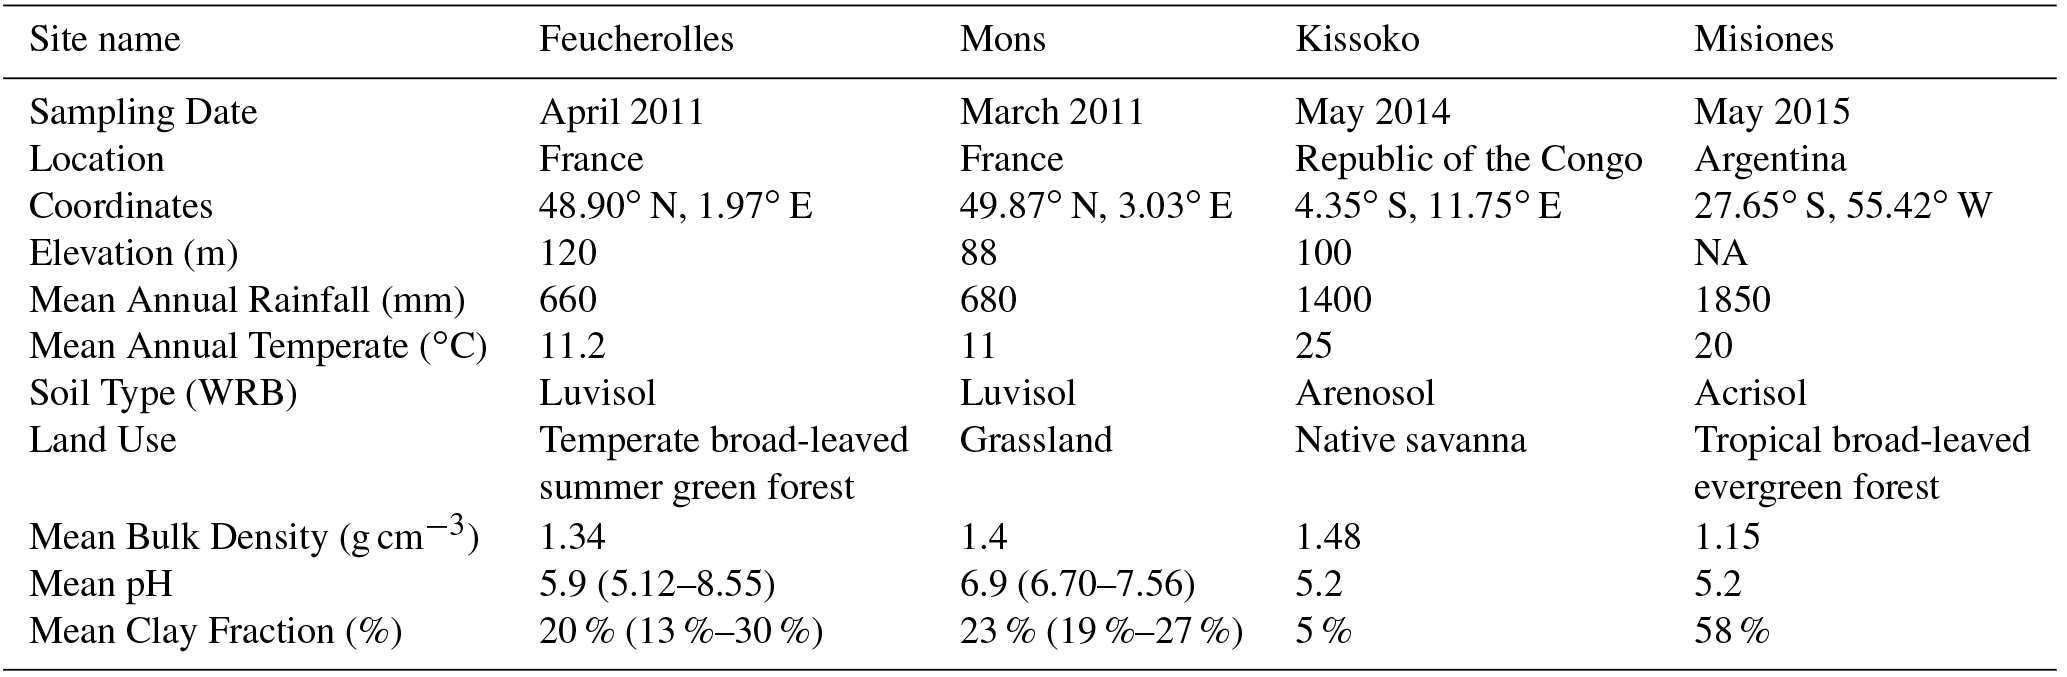
Two Luvisol (WRB, 2006) profiles located in northern France were selected: the Feucherolles and Mons sites. In Mons (49.87∘ N, 3.03∘ E; Luvisol) the soils sit under grassland, and are developed from several metres of loess and are therefore well drained. The mean annual air temperature is 11 ∘C and the annual precipitation is about 680 mm (Keyvanshokouhi et al., 2016). In Feucherolles (48.9∘ N, 1.97∘ E), the soil sits under oak forest, and clay and gritstone deposits are found at approximately 1.5 m depth. The mean annual air temperature is 11.2 ∘C and the annual precipitation is about 660 mm (Keyvanshokouhi et al., 2016). Both soils are neutral to slightly acidic and are characterized by the presence of a clay accumulation Bt horizon with clay content reaching 30 % for Feucherolles and 27 % for Mons, while the upper horizons are poorer in clay (17 % for Feucherolles and 20 % for Mons).
The 14C data from the soils of both sites were obtained after chemical treatment done at Laboratoire des Sciences du Climat et de l'Environnement (LSCE) using a protocol adapted to achieve carbonate leaching without any loss of organic carbon; 14C activity was measured by AMS (aerosol mass spectrometry) at the French Laboratoire de mesure du 14C (LMC14) facility (Cottereau et al., 2007). Details on measurements and sampling can be found in Jagercikova et al. (2017).
2.3.2 Republic of the Congo site
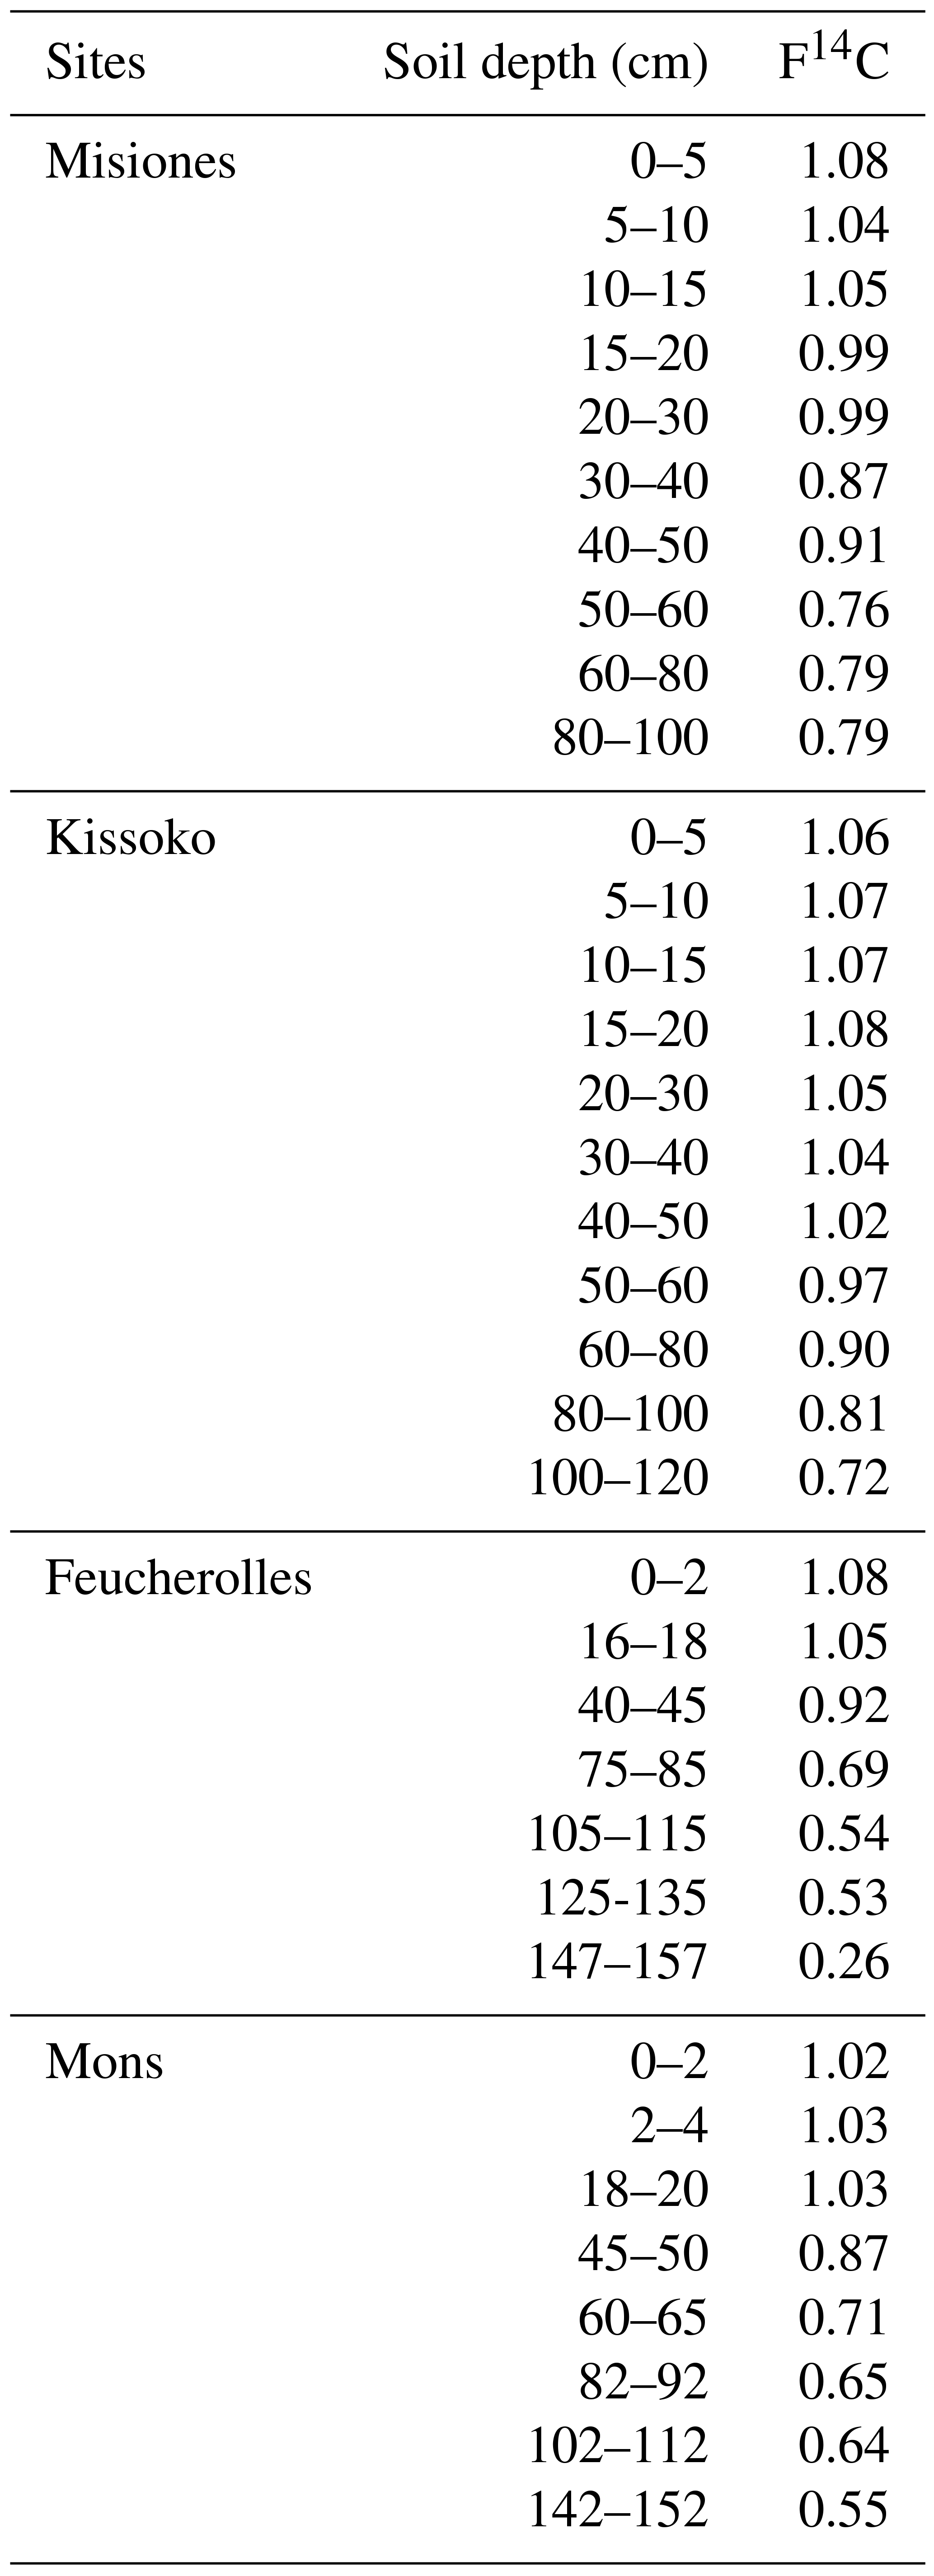
The studied site is located in Kissoko (4.35∘ S, 11.75∘ E). It belongs to the SOERE F-ORE-T (Site de l'ObservatoirE de Recherche en Environnement sur le Fonctionnement des écosystèmes fOREsTiers) field observation sites of Pointe Noire, Republic of the Congo. The mean annual air temperature is about 25 ∘C with low seasonal variation (±5 ∘C), and average annual precipitation of 1400 mm, and a dry season between June and September. The deep acidic sandy soil is a ferralic Arenosol (WRB, 2006). The soil is characterized by a sand content greater than 90 % (Laclau et al., 2000). A soil profile was taken under native savanna vegetation dominated by C4 plants (Epron et al., 2009). The soil was sampled in May 2014 at different depths: 0–5, 5–10, 10–15, 15–20, 20–30, 30–40, 40–50, 50–60, 60–80, 80–100 and 100–120 cm. All samples were crushed and air-dried. Once in the laboratory, they were homogenized, crushed, randomly subsampled and sieved at 200 µm. Then 14C measurements were made the same way as the two French sites, using the LSCE chemical treatment and the French LMC14 facility following recommendations by Cottereau et al. (2007).
2.3.3 Argentinian site
The Province of Misiones is located in northeastern Argentina. The climate is subtropical humid without a dry season, an annual mean temperature of 20 ∘C and 1850 mm of mean annual rainfall (Morrás et al., 2009). The profile used in this study is located in the southern part of Misiones (27∘ S, 55∘ W). Native vegetation is a forest dominated by C3 plants. The soil selected is an Acrisol (WRB, 2006). It is a red clay soil, strongly to very strongly acid with a clay content varying from 40 % at the surface to 60 % at 1 m depth. The 14C measurements were made using a new compact radiocarbon system called ECHoMICADAS (Environment, Climate, Human, Mini Carbon Dating System; Tisnérat-Laborde et al., 2015). Briefly, the soil was sampled in May 2015 at different depths: 0–5, 5–10, 10–15, 15–20, 20–30, 30–40, 40–50, 50–60, 60–80 and 80–100 cm. All samples were crushed and air-dried. Once in the laboratory, they were homogenized, crushed, randomly subsampled and sieved at 200 µm. Then 14C measurements were made using the ECHoMICADAS following the recommendations of Tisnérat-Laborde et al. (2015).
For the four sites, the SOC (kg m−3), for each depth z, was calculated using carbon content and bulk density data using the following equation:
where OCC (wt/wt) is the carbon content and BD (kg m−3) is the bulk density.
2.4 Different model tests
After the implementation of radiocarbon in the model, different tests were carried out (Table 2). Here we represent the outputs provided by three simulations:
First, simulation using the initial version ORCHIDEE-SOM-14C (labelled “Control” in figures and tables) in which no changes were made. The diffusion was kept constant throughout the profile ( m2 yr−1) and the other parameters are those of the detailed version in Camino-Serrano et al. (2018).
Second, simulation using the initial version ORCHIDEE-SOM-14C in which we modified some parameters following He et al. (2016) (labelled “He et al., 2016, parameterization” in figures and tables). In brief, the authors used 14C data from 157 globally distributed soil profiles sampled to 1 m depth to evaluate CMIP5 models. Their results show that ESMs underestimated the mean age of soil carbon by a factor of more than 6 and overestimated the carbon sequestration potential of soils by a factor of nearly 2. So, the suggestion (that we apply in this simulation) for the IPSL model was to multiply the turnover time of the passive pool by 14 and the flux from slow pool to passive pool by 0.07 (Table 2). The diffusion was kept constant throughout the profile ( m2 yr−1) but the turnover time of the passive pool increased from 462 to 6468 years and the flux from the slow pool to the passive pool decreased from 0.07 to 0.0049.
Third, simulation using the initial version ORCHIDEE-SOM-14C in which we assume that the diffusion varies as a function of depth (“Depth-varying diffusion constant” in figures and tables) according to the equation below:
where D is the diffusion (m2 yr−1) at a specific depth and z is the depth. This equation of diffusion varying as a function of depth is following Jagercikova et al. (2014) and assumes that bioturbation is higher in the topsoil than in deep soil.
Table 1General description of the studied sites. The mean bulk density, pH and clay fraction values calculated from the different soil layer depths available from the data were used as input for each site. For the Mons and Feucherolles sites, min and max values of pH and clay fraction are provided between brackets.

2.5 Model simulations
In order to reach a steady state of the soil module, we ran the model over 12 700 years (spin-up). The state at the last time step of this spin-up was used as the initial state for the simulations. For this, the CRUNCEP meteorological data for the period 1901–1910 were used. This has been applied for Misiones, Feucherolles and Mons. However, for Kissoko, a first spin-up similar to the other sites was carried out but a second one (over approximately 4200 years) was also done after the end of the first to take into account the change of the land cover from a tropical forest to a C4 savanna at this site (Schwartz et al., 1992). The atmospheric CO2 concentration has been set to 296 ppm (year 1901; Keeling and Whorf, 2006) for the spin-ups and the F14C has been set to one corresponding to pre-industrial values. For each site, specific pH, clay content and bulk density values were used (Table 1). It should be noted that for these last data, only one value (the mean value on the profile) is provided as input for the model.
The simulations were outputted at a yearly time step, from 1900 to 2011. A yearly atmospheric CO2 concentration value (Keeling and Whorf, 2006) is read for the sites. The same specific pH, clay content and bulk density values were used (Table 1).
Figure 2 shows the evolution of the F14C values in the atmosphere used in our model for Argentina, Republic of the Congo and France (Fig. 5 from Hua et al., 2013). The values provided are classified into five zones, three in the Northern Hemisphere (NH) and two in the Southern Hemisphere (SH), corresponding to different levels of 14C. For France, the values correspond to the NH zone 2, for the Republic of the Congo to the SH zone 3 and finally for Argentina to the SH zone 1–2. Thus, for our simulations, a yearly value is read for each site.
An F14C value of 1.8 represents a doubling of the amount of 14C in atmospheric CO2. In Fig. 2, it can be noted that the values recorded in France (NH) are higher than those in the Republic of the Congo and Argentina (SH). This is due to the preponderance of atmospheric tests in the NH and the time required to mix air across the Equator.
2.6 Statistical analysis
Simulating carbon processes in soil requires comparison between the model outputs and the measurements to test the model accuracy and possibly implement further improvement. Statistical analysis based on the statistics of deviation were done to evaluate the model–measurement discrepancy according to Kobayashi and Salam (2000) (where a detailed description of the method is provided). Here, we only reproduce the different equations used; x refers to the model outputs and y to the measurements, while i refers to soil depth. The intervals of soil depth of the model outputs and the measurements were homogenized by linearly interpolating the data to common depth intervals defined for each site. The simulations and data were then compared for each depth interval.
RMSD is the root mean squared deviation, which represents the mean distance between simulation and measurement.
MSD, the mean squared deviation, is the square of RMSD. The lower the value of MSD, the closer the simulation results are to the measurements.
where and are the means of xi (model outputs) and yi (measurements), respectively.
SB is a part of the MSD (Eq. 14) and represents the bias of the simulation from the measurement.
SDs is the standard deviation of the simulation.
SDm is the standard deviation of the measurements.
r is the correlation coefficient between the simulation and measurements.
SDSD is the difference in the magnitude of fluctuation between the simulation and measurements.
LSC represents the lack of positive correlation weighted by the standard deviations.
The MSD can therefore be rewritten as
For the different simulations, the MSD and its components were calculated according to the total soil carbon and to the F14C.
Table 3The correlation coefficient (r) between model outputs and measurements for carbon stock (kg C m−2) over the soil profile, for the four sites. The results of the initial version of the model ORCHIDEE-SOM-14C (Control), those from the version including the modification according to He et al. (2016) (He et al., 2016, parameterization) and diffusion varying according to depth (Depth-varying diffusion constant) are provided.
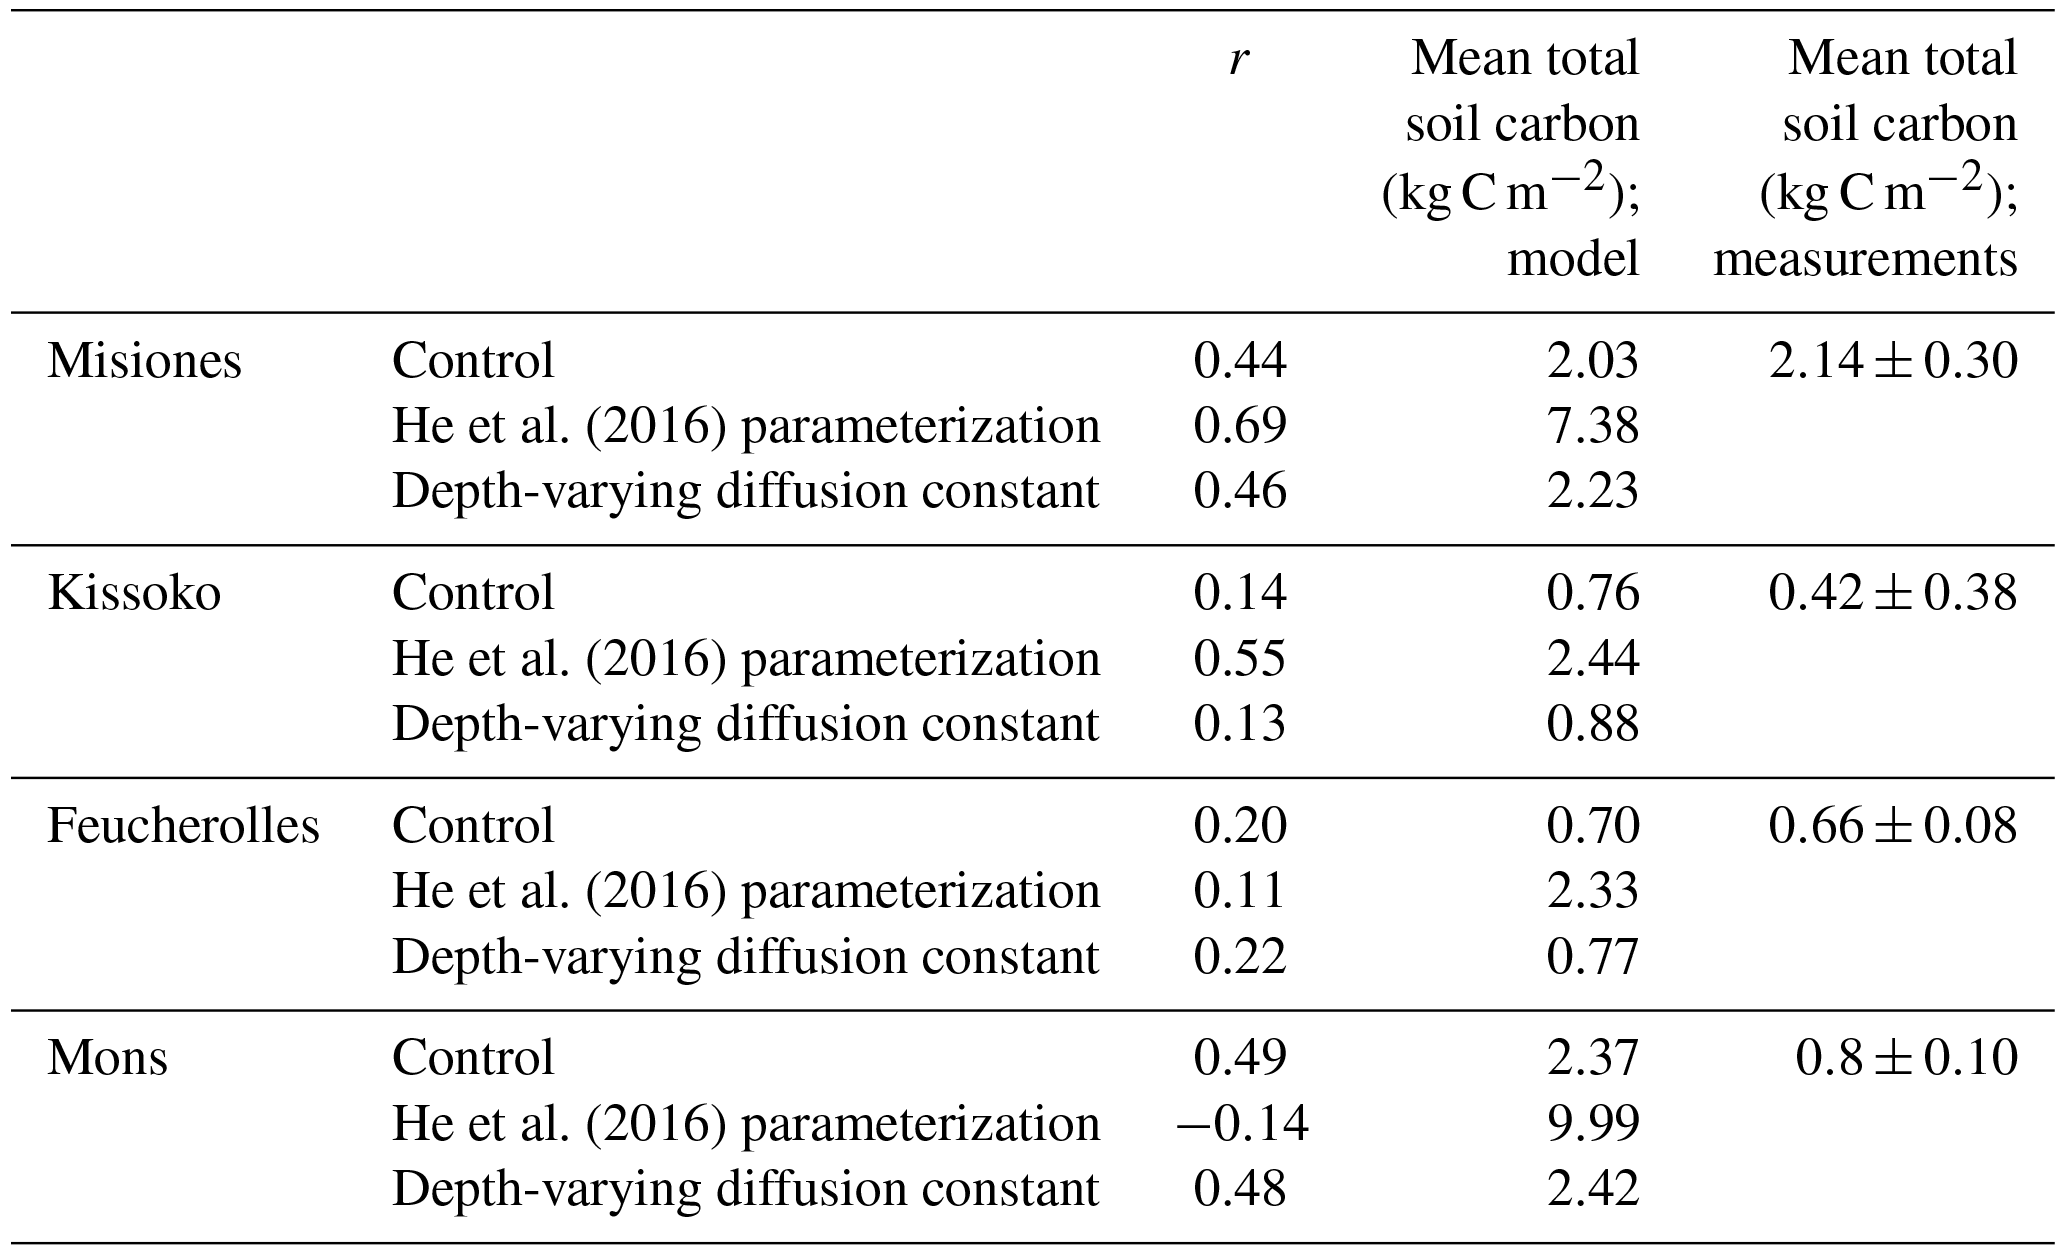

Figure 3Total soil carbon (kg C m−3) according to depth for the four sites. The results of the initial version of the model ORCHIDEE-SOM-14C (Control), those from the version including the modification according to He et al. (2016) (He et al., 2016, parameterization) and diffusion varying according to depth (Depth-varying diffusion constant) are shown.
3.1 Outputs from simulation using the initial version of the model ORCHIDEE-SOM-14C (Control)
3.1.1 Simulated total soil carbon
Results from the initial version of ORCHIDEE-SOM-14C show that in all the studied sites, the model succeeds in reproducing the trend of the total carbon profiles, with more carbon at the surface which then decreases according to depth (Fig. 3). Moreover, total soil carbon stock simulated down to 2 m depth is in accordance with data in the case of Misiones and Feucherolles where the major difference mainly lies on the surface. This results in correlation coefficients of 0.44 and 0.2, respectively (Table 3). For the sites of Kissoko and Mons, an overestimation of the total soil carbon is found to a depth of 50 cm for Kissoko and up to a depth of 120 cm for Mons. Correlation coefficients are 0.14 and 0.49 for Kissoko and Mons, respectively (Table 3).
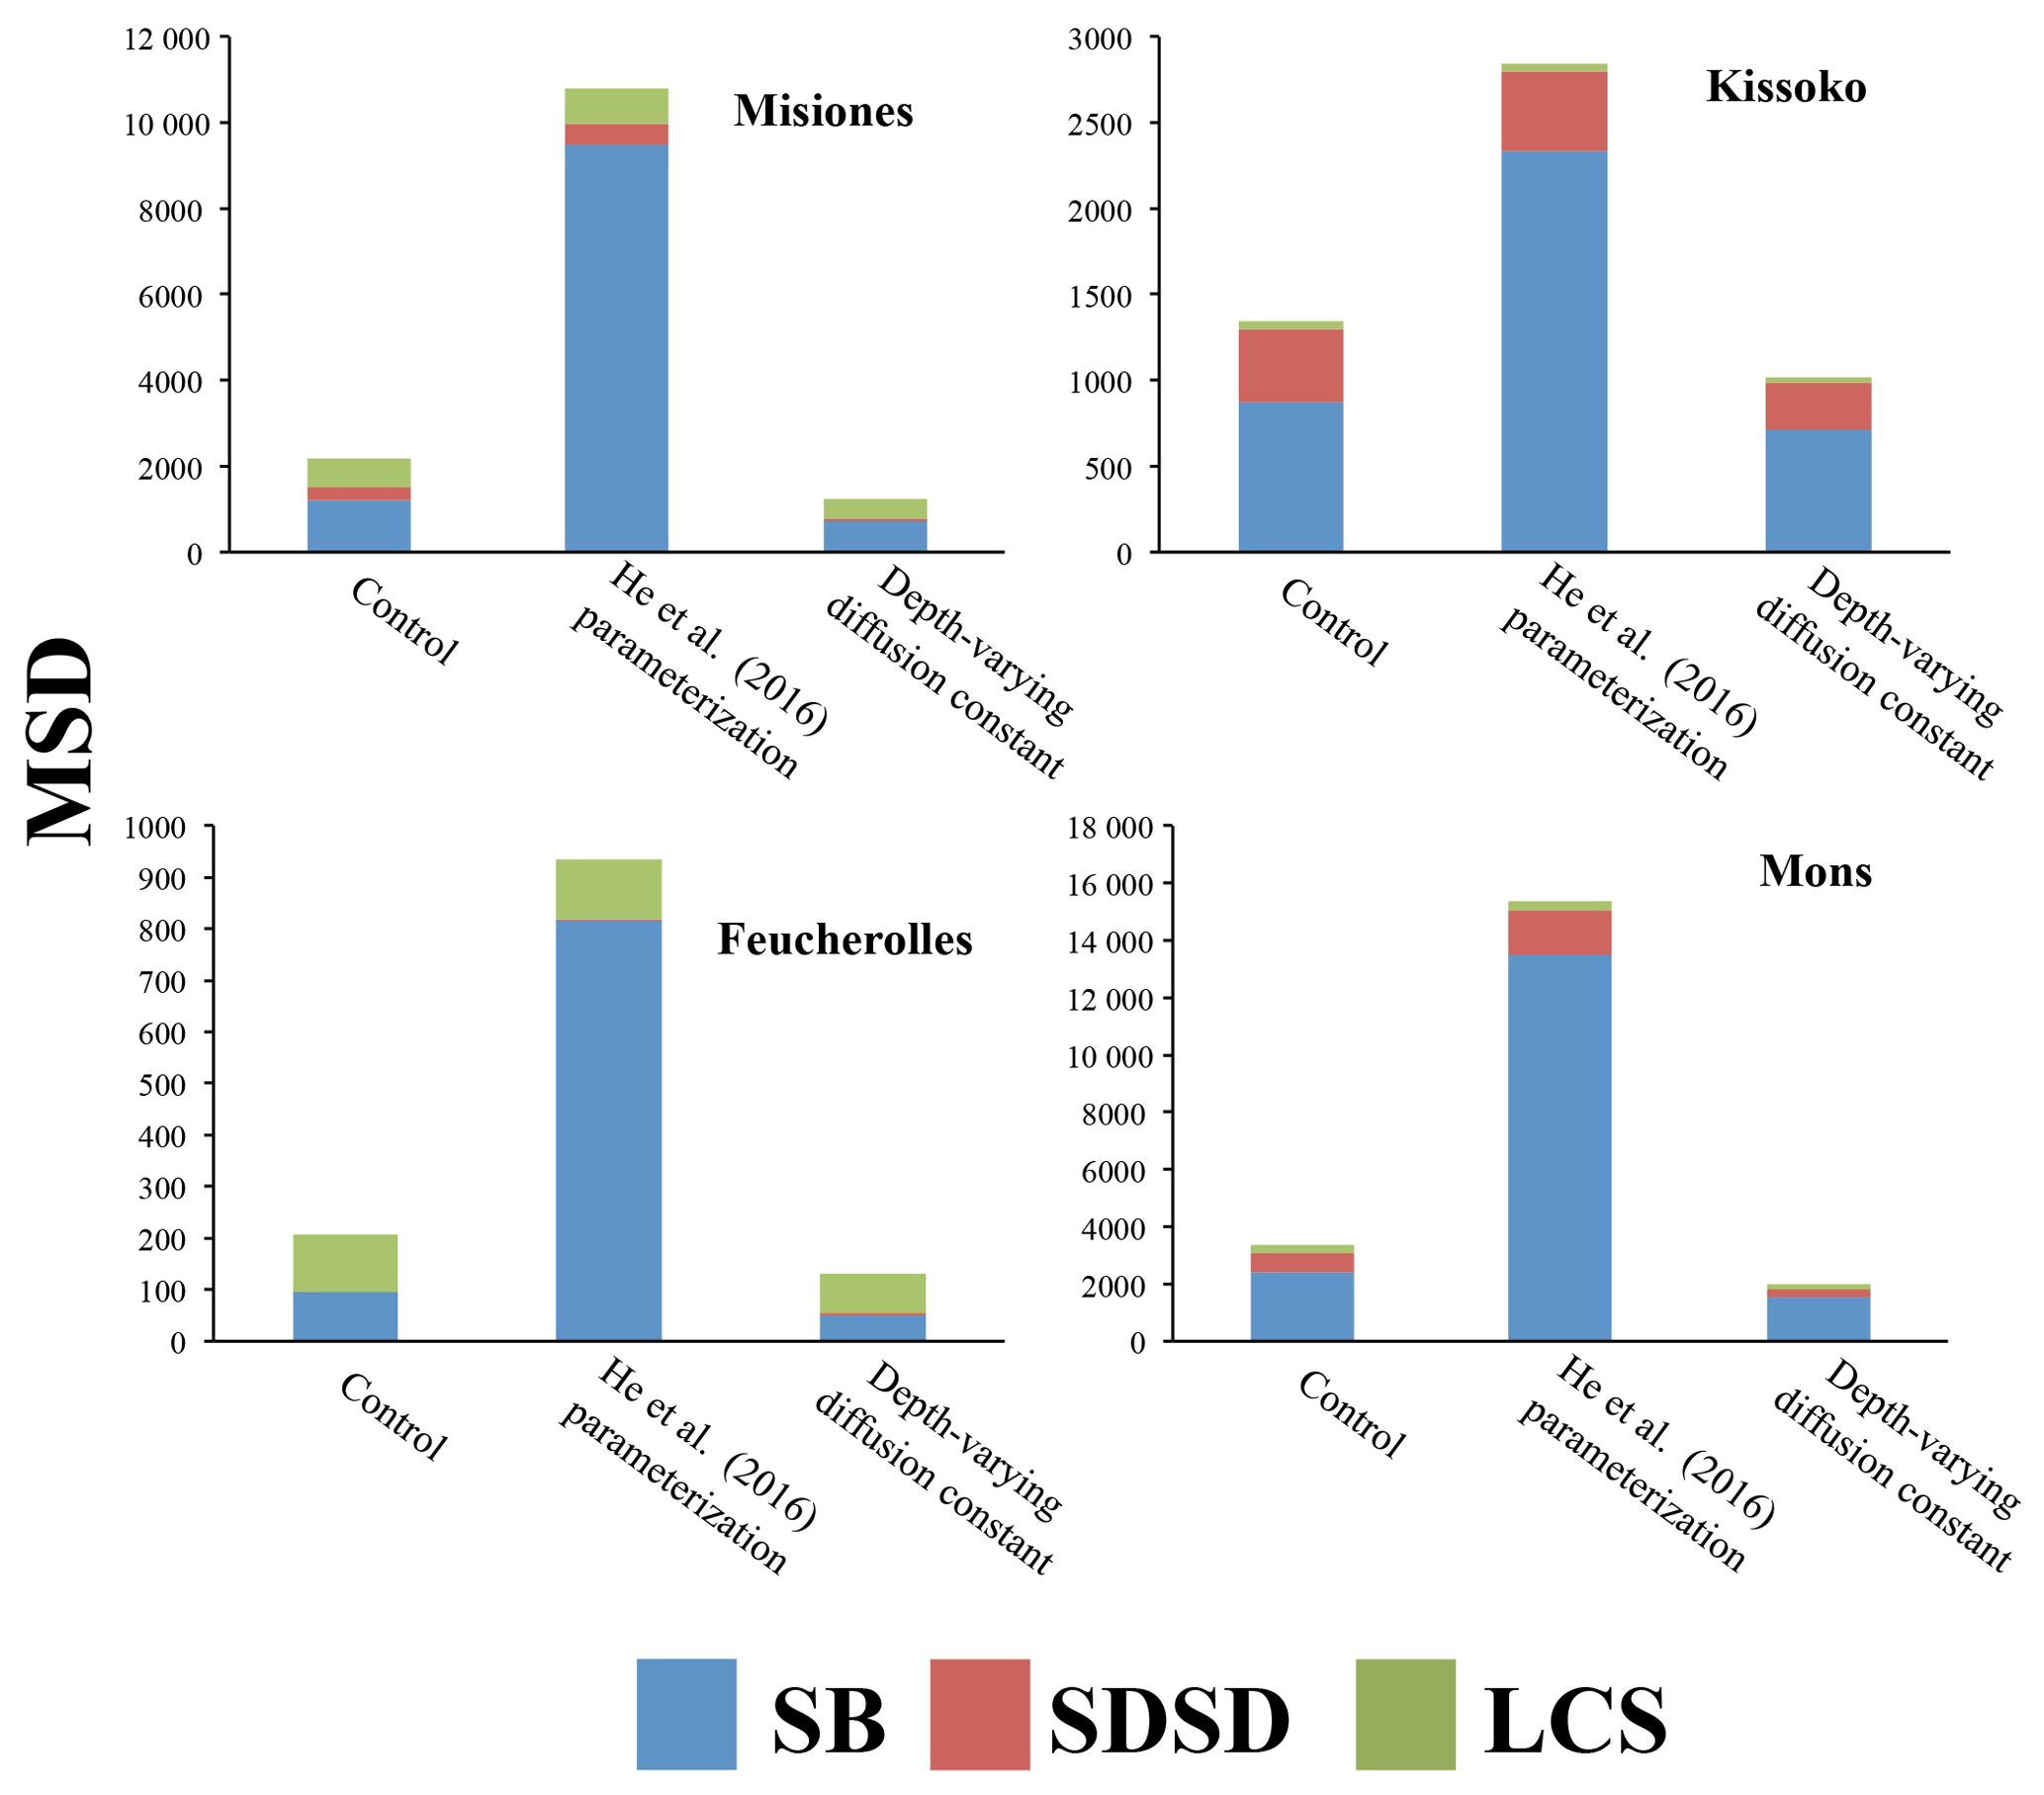
Figure 4Mean squared deviation (MSD) and its components for total soil carbon (kg C m−6): lack of correlation weighted by the standard deviation (LCS), squared difference between standard deviations (SDSD) and the squared bias (SB). For the four sites, the results of the initial version of the model ORCHIDEE-SOM-14C (Control), those from the version including the modification according to He et al. (2016) (He et al., 2016, parameterization) and diffusion varying according to depth (Depth-varying diffusion constant) are shown.
Metrics presented in Fig. 4 showed that this version (ORCHIDEE-SOM-14C) represents relatively well the observation from Feucherolles (MSD =206 kg C m−6), whereas the others are highly overestimated (Kissoko, MSD =1343 kg C m−6; Misiones MSD =2180 kg C m−6; Mons MSD =3355 kg C m−6). By detailing the different components of the MSD (Fig. 4), we note that for Mons and Kissoko, standard bias (SB) is the major component of the MSD, contributing 70 % and 60 %, respectively. This reflects that the average of total soil carbon over the soil profile simulated by the model is primarily the origin of the deviation of the model outputs from data. The mean total soil carbon estimated by the model (Table 3) is almost 3 times higher than the mean total carbon measured for Mons (2.37 kg C m−2 against 0.8 kg C m−2, respectively) and it is more than 5 times that measured for Kissoko (2.44 kg C m−2 against 0.42 kg C m−2, respectively). For Mons a net primary production (NPP) of 6.7 t ha−1 yr−1 was estimated by the technical institute for pasture in this region of France based on the annual yields, whereas the model predicts a NPP of 7.5 t ha−1 yr−1. The large overestimation of the SOC stocks may therefore be due to an overestimation of the NPP. This significant gap recorded in the case of the Kissoko site, where the measured SOC is very low, is probably due to an overestimation of decay rates by ORCHIDEE in sandy soils. The correlation coefficient for Mons is relatively high compared to other sites (Table 3), whereas Fig. 3 shows that the model performance was not very good for this site. This is mainly due to a large SB, whereas other MSD components were rather low.
However, the main components of MSD for Feucherolles and Misiones are both SB (46 % and 56 % for Feucherolles and Misiones, respectively) and also LCS (53 % and 31 % for Feucherolles and Misiones, respectively). This means that for these two sites, the deviation between model outputs and measurements is mainly due to a variation in carbon stock estimation throughout the profile. The mean total soil carbon estimated in both these cases (Table 3) is only slightly higher than those measured (2.03 kg C m−2 estimated against 2.14 kg C m−2 measured for Misiones and 0.7 kg C m−2 estimated against 0.68 kg C m−2 measured for Feucherolles).
The vertical profiles of the SOC stock were fairly represented by the model. The overestimation, especially at the top, suggests that the distribution of the litter following the root profile and/or the vertical transport of SOC by diffusion are not correctly described in the model.
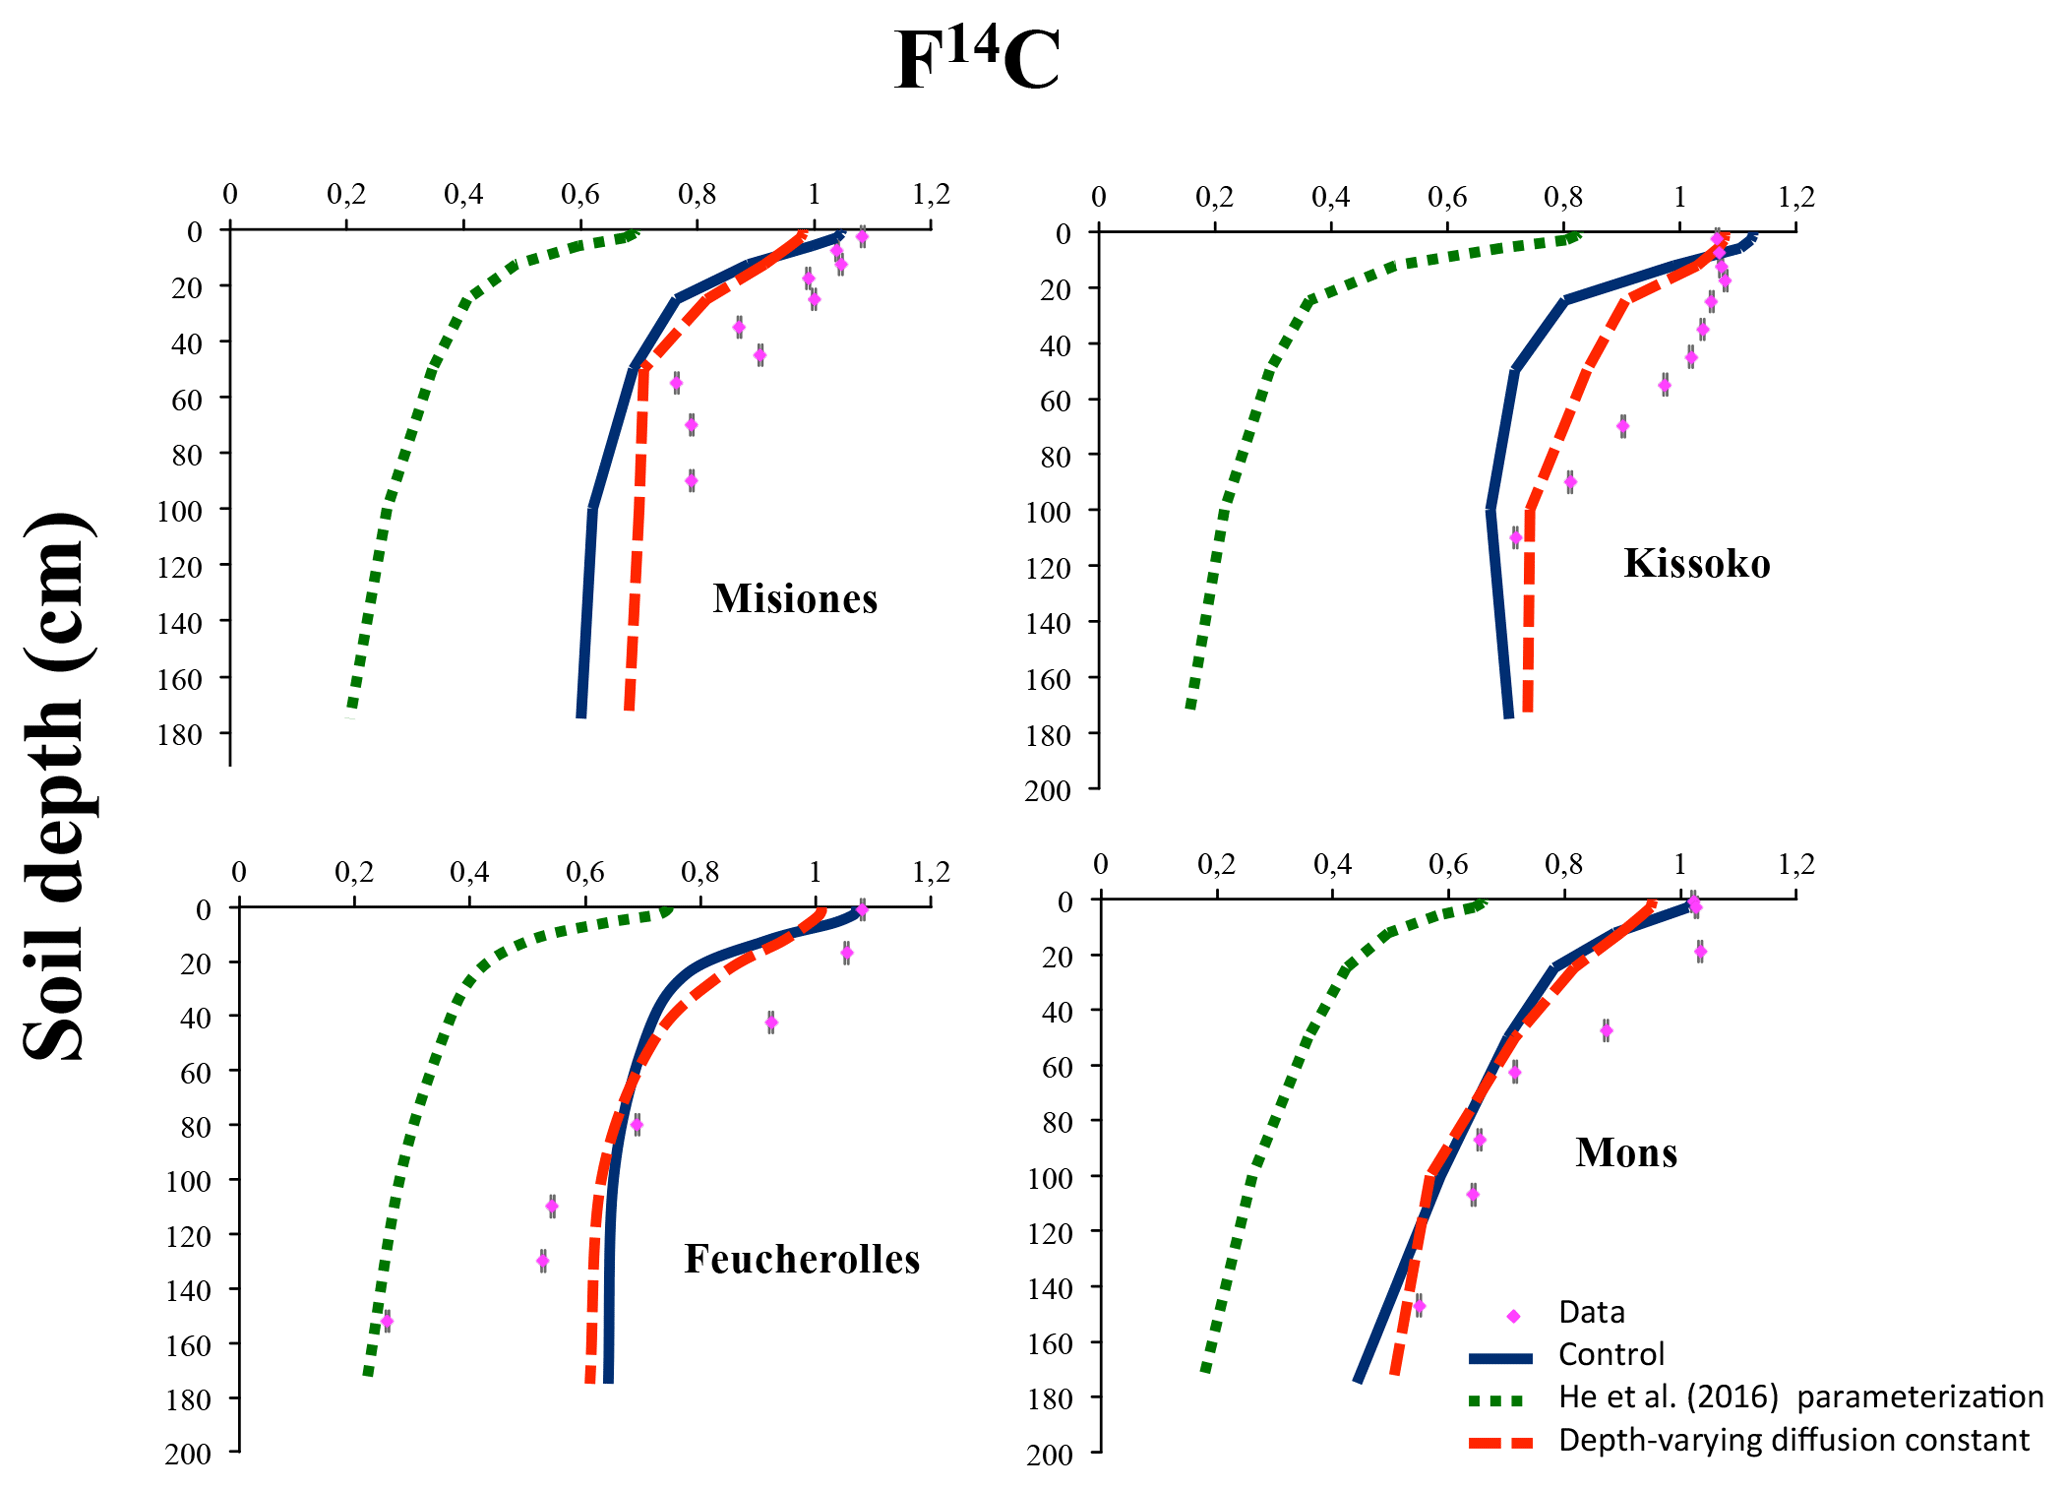
Figure 5Modern fraction F14C according to depth for the four sites. The results of the initial version of the model ORCHIDEE-SOM-14C (Control), those from the version including the modification according to He et al. (2016) (He et al., 2016, parameterization) and diffusion varying according to depth (Depth-varying diffusion constant) are shown.
3.1.2 Simulated F14C
Regarding the 14C activity, bulk F14C profiles show a classical pattern with higher 14C activity on the top, slightly influenced by the peak bomb-enriched years. Subsequently, profiles show decreasing 14C activity with depth (Fig. 5).
The estimated profiles (Control) follow the same trend with a decrease from the surface to depth. However, there is a significant difference between the estimated values and those measured throughout the profile. The statistical analyses (Fig. 6) provide MSD values: 0.02 for Mons and Misiones, 0.03 for Kissoko and 0.09 for Feucherolles. The major component of the MSD in the four sites is the LCS, with a proportion reaching 90% for Mons, 80% for Misiones and 70% for Republic of the Congo, but only 55% for Feucherolles. The high proportions of LCS suggest that the model fails to reproduce the shape of the profile. The lower values estimated by the models reflect a more modern carbon age than in reality. This can be explained, first, by the fact that the root profile puts too much fresh organic carbon in deep soil. Afterwards, in ORCHIDEE, root profile is assumed to follow an exponential function without modulation due to environmental conditions.
Table 4The correlation coefficient (r) between model outputs and measurements and the mean values (provided by the model and the measurements) over the profile according to F14C for the four sites. The results of the initial version of the model ORCHIDEE-SOM-14C (Control), those from the version including the modification according to (He et al., 2016) (He et al., 2016, parameterization) and diffusion varying according to depth (Depth-varying diffusion constant) are provided.
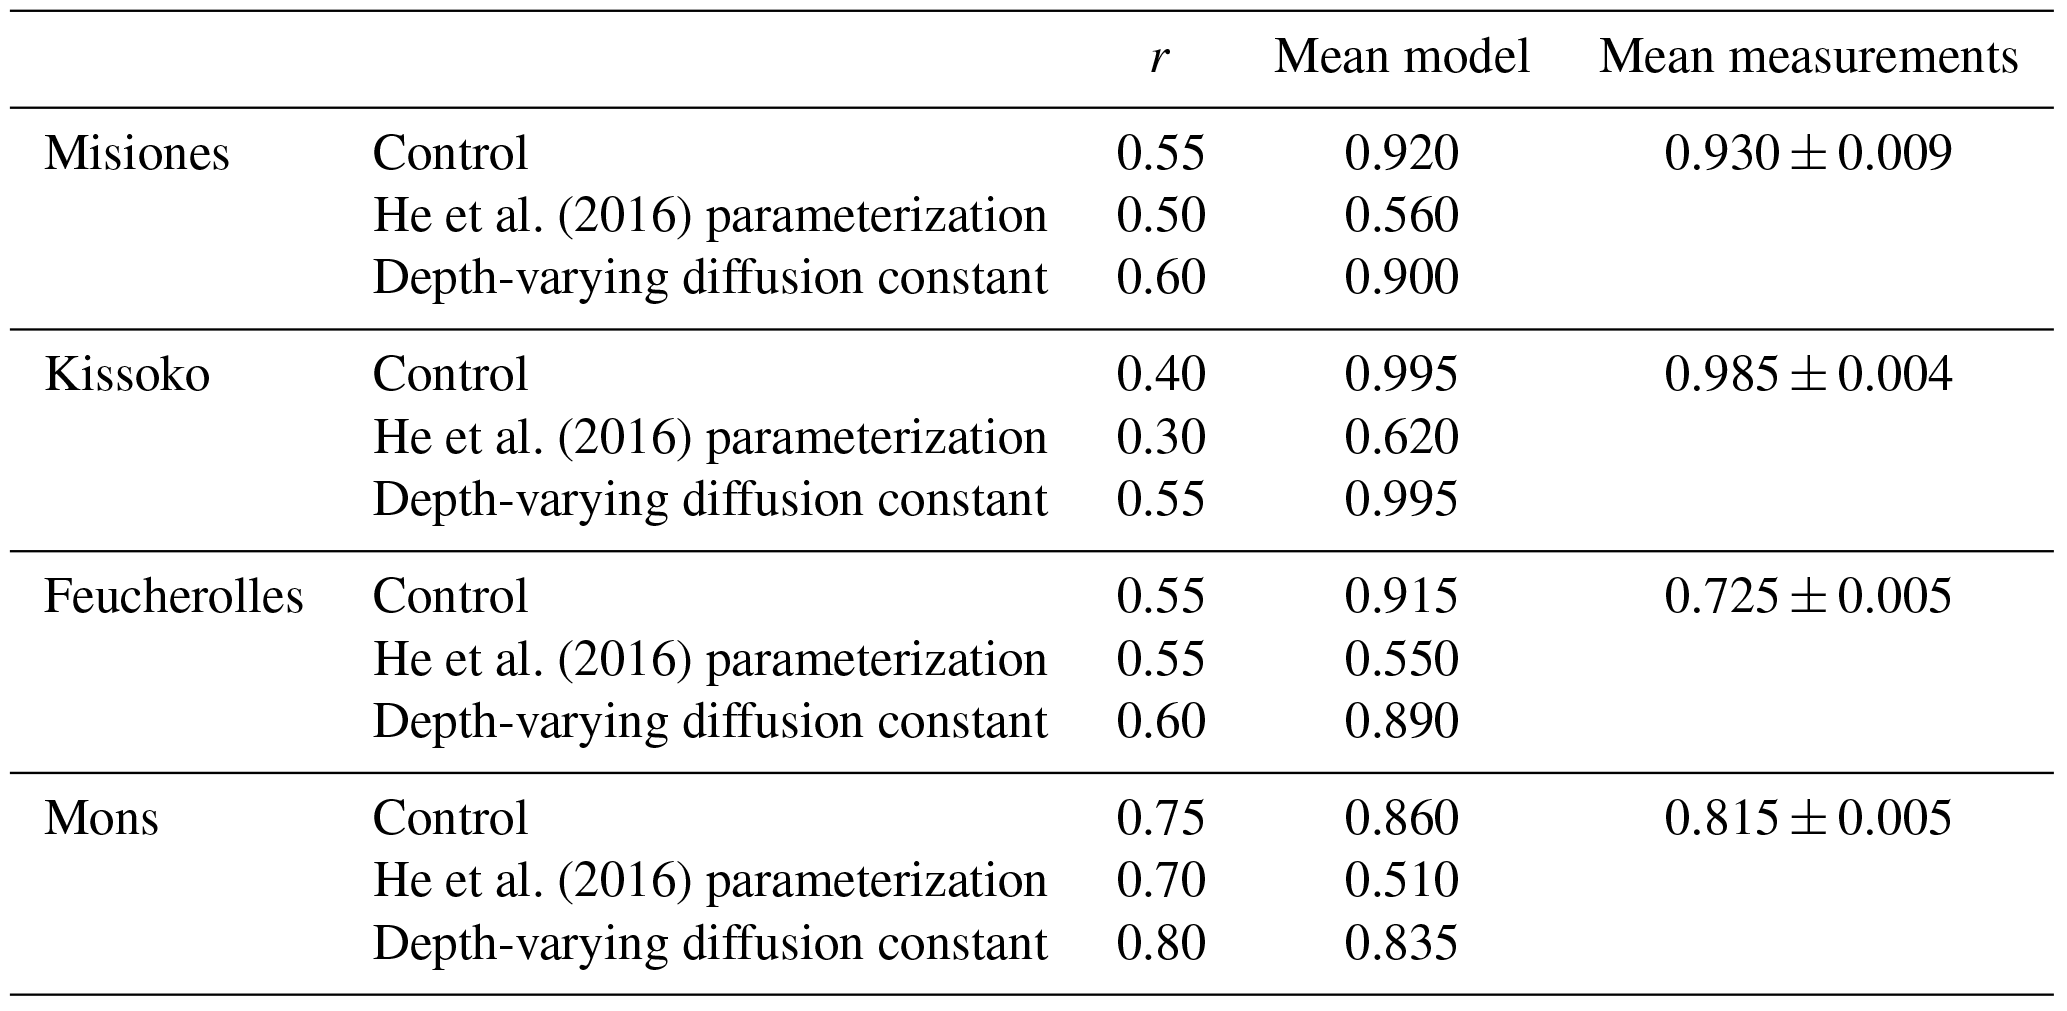

Figure 6Mean squared deviation (MSD) and its components: lack of correlation weighted by the standard deviation (LCS), squared difference between standard deviations (SDSD) and the squared bias (SB) calculated for modern fraction F14C. For the four sites, the results of the initial version of the model ORCHIDEE-SOM-14C (Control), those from the version including the modification according to He et al. (2016) (He et al., 2016, parameterization) and diffusion varying according to depth (Depth-varying diffusion constant) are shown.
SB's contribution to the MSD does not exceed 7% for Misiones, Kissoko or Mons but reaches about 40% for Feucherolles. This reflects that the mean value of the F14C estimated by the model and that obtained after the measurements are not very different, except for the Feucherolles site (Table 4). Indeed, the average value estimated for Misiones is 0.920, very close to that measured at 0.930, 0.995 for Kissoko against 0.985 measured and 0.860 for Mons against 0.815 measured. Yet, the difference is greater for the Feucherolles site, the estimated value being 0.915 while the measurement is 0.725. This difference might be caused by the low F14C value measured at 150 cm (0.257), which the model is not able to capture. This suggests that modelled deep soil carbon is much younger than the observed total soil carbon, probably because ORCHIDEE-SOM simulates a relatively small proportion of passive pool in the lower soil horizons (Fig. 7), while an increasing proportion of passive carbon with soil depth could be expected.
In brief, SOC stocks are generally overestimated and soil carbon age in deep soils (as shown by the F14C) is underestimated, suggesting that the turnover rate of the passive pool is subject to improvements in ORCHIDEE-SOM.
3.2 Outputs from simulation using the initial version of the model ORCHIDEE-SOM-14C including the suggestion of He et al. (He et al., 2016, parameterization)
3.2.1 Simulated total soil carbon
Figure 3 shows profile outputs after the suggestion of He et al. (2016) was implemented into ORCHIDEE-SOM-14C (green dotted curves). Resulting profiles follow the same trend as observations but in this case (labelled “He et al., 2016, parameterization”), the overestimation is very high across the whole profile. This is further confirmed by the metrics analysis (Fig. 4). MSD values markedly increased, resulting in an even higher variance. Obviously, the major component of MSD in all cases is the SB (varying from 80% to 87%) reflecting an even more marked overestimation of the mean total carbon estimates: 7.38 kg C m−2 against 2.14 kg C m−2 for Misiones, 2.44 kg C m−2 against 0.42 kg C m−2 for Kissoko, 2.33 kg C m−2 against 0.66 kg C m−2 for Feucherolles and 9.99 kg C m−2 against 0.8 kg C m−2 for Mons.
3.2.2 Simulated F14C
He et al. (2016) parameterization outputs (Fig. 5, green dotted curves) for F14C are once again even further away from observations, and MSDs (Fig. 6) are much higher, except for Feucherolles. The MSD components for the Feucherolles site show that the LCS increases from 0.05 to 0.06, whereas the SB decreases from 0.04 to 0.03, again reflecting a variation in the profile more than a difference from the means.
Improvement of the model–measurement fit for the F14C at 150 cm in Feucherolles confirms that the deep soil carbon simulated by the control version of ORCHIDEE-SOM-14C was excessively young, since the longer residence time of the passive pool reported by He et al. (2016) resulted in a higher proportion of passive pool across the soil profile (Fig. 7), thus improving deep soil carbon age. Nevertheless, this test only improves the simulation of deep soil carbon in Feucherolles. On the contrary, this increase in carbon residence time increases model deviation from observations for all other cases (Figs. 5 and 6).
Indeed, taking the priming effect into account in this new version of ORCHIDEE has contributed to a 50 % decrease in carbon storage over the historical period. The correction of He et al. (2016) was also aimed at reducing this storage and is of the same order of magnitude as the priming effect. Thus, applying the correction of He et al. (2016) to this version of the model, which takes into account the priming effect, contributes to a double correction for the same target, which then generates this important difference between model outputs and measurements. Moreover, the work of He et al. (2016) is done under the standard parameterization of ORCHIDEE based on “Century”, while ORCHIDEE-SOM was re-parameterized after adding several different processes, the priming effect among them (Camino-Serrano et al., 2018), which makes it difficult to compare results between the two studies.
3.3 Outputs from simulation using the initial version of the model ORCHIDEE-SOM-14C with diffusion varying according to depth (Depth-varying diffusion constant)
3.3.1 Simulated total soil carbon
Fick's law of diffusion is classically used in models to represent bioturbation assuming that soil fauna activity may be represented following the Fick's law of diffusion (Elzein and Balesdent, 1995; Guenet et al., 2013; Koven et al., 2013; O'Brien and Stout, 1978; Wynn et al., 2005). Using a fixed diffusion constant (D in Eq. 2) implicitly suggests that soil fauna activity is uniform over the entire soil profile. This is generally the case for several models of diffusion, in particular at the level of an ecosystem (Bruun et al., 2007; Guimberteau et al., 2018; O'Brien and Stout, 1978). However, soil faunal activity vary naturally with depth and the diffusion constant should therefore be depth dependent (Jagercikova et al., 2014).
With depth-varying diffusion constant, the carbon profile (orange dashed curves) was improved compared to the initial outputs (Control). The overestimation at the surface decreases at the four sites (Fig. 3). In particular, the Misiones outputs fit very well the observed profiles. This is confirmed with lower MSDs for the four sites for this version compared to the control (Fig. 4).
The total SOC stocks simulated according to this third simulation are closer to the measured values and describing the vertical transport of SOC by varying diffusion according to depth significantly improves the model outputs.
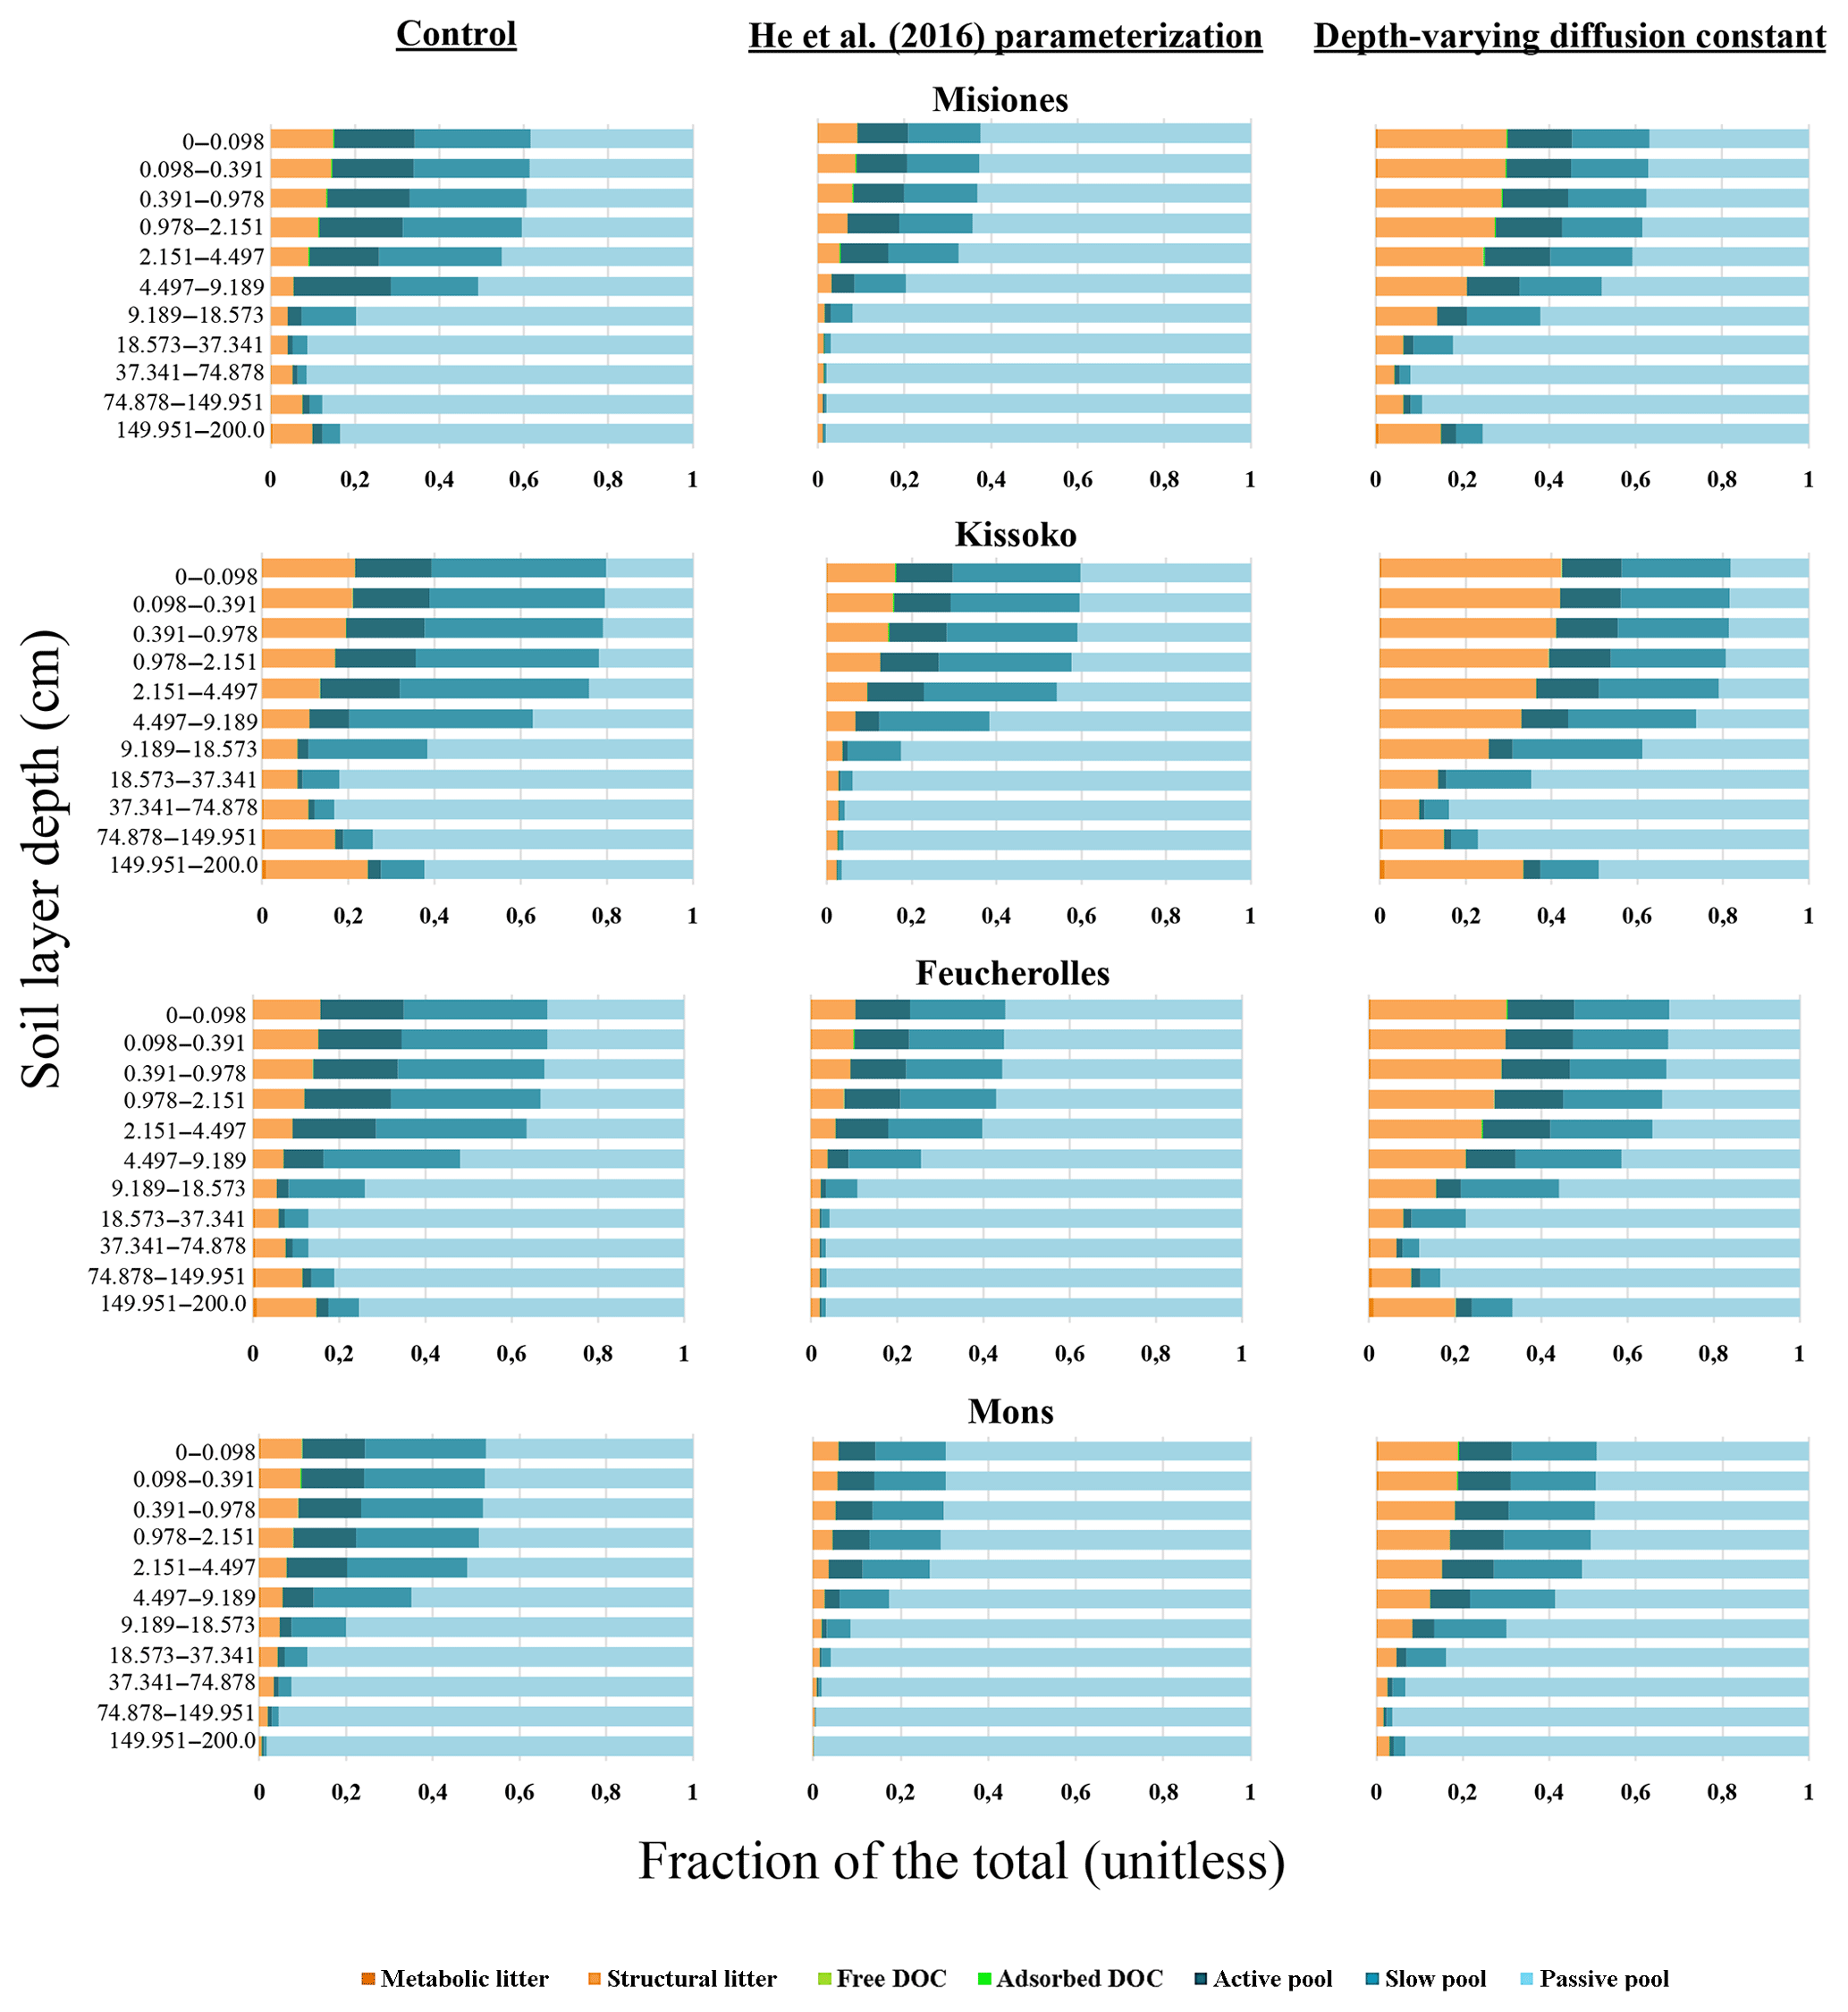
Figure 7Relative proportion of each of the soil carbon pools summing the total soil carbon at each soil layer. The results of the initial version of the model ORCHIDEE-SOM-14C (Control, left column), those from the version including the modification according to He et al. (2016) (He et al., 2016, parameterization; middle column) and diffusion varying according to depth (Depth-varying diffusion constant, right column) are shown.
3.3.2 Simulated F14C
Regarding the F14C outputs, the simulations using the initial version ORCHIDEE-SOM-14C in which we assume that the diffusion varies as a function of depth (Depth-varying diffusion constant) results in an improvement of the F14C profiles (orange dashed curves), in particular for the sites Misiones, Mons and Kissoko (Fig. 5). Statistical analyses prove it with significantly lower MSDs. In addition, the proportion of LCS is 98 %, 92 % and 88 % for Mons, Misiones and Kissoko, respectively, highlighting an estimated average very close to the measurements with a clear disparity, less marked than with the first two simulations, throughout the profile (Fig. 6). Overall, the simulated F14C to 2 m of depth according to this third simulation are in better agreement with the measured values, and thus incorporating diffusion that varies with depth significantly improves the model outputs.
Using a diffusion coefficient that varies as a function of depth seems to correct the overestimation of the surface total soil carbon by increasing the proportion of labile soil carbon pools in the first soil layers.
When we sum the total soil carbon at each soil layer and look at the relative proportion of each of the soil carbon pools (Fig. 7), we note that it is mainly the distribution of the litter according to depth which varies. In fact, the structural litter proportion is multiplied by about 2 in all four cases, and this proportion remains relatively constant across the profile. This increase in litter proportion has also resulted in a decrease in the passive pool, more pronounced at the surface but also important at depth (except for Feucherolles where the decrease is only marked at the bottom). It suggests that the vertical carbon distribution, which is largely modified by the diffusion coefficient, greatly impacts the SOC and 14C profiles, which is in line with Dwivedi et al. (2017) who found that the vertical carbon input profiles were important controls over the 14C depth distribution.
In this study, the vertical transport of SOC and litter through diffusion has been improved by varying diffusion according to depth. Further model development should explore the impact of the other processes defining the soil carbon pools vertical distribution and especially the distribution of the litter according to the root profile.
Overall, by using radiocarbon (14C) measurements we have been able to diagnose internal model biases (underestimation of deep soil carbon age) and to propose further model improvements (depth-dependent diffusion). Therefore, the use of radiocarbon (14C) tracers in global models emerges as a promising tool to constrain not only SOC turnover times in the long-term (He et al., 2016) but also internal SOC processes and fluxes that have no direct comparison with field measurements. Nevertheless, the model evaluation performed here on only four sites should be considered as proof of concept and more in-depth evaluations are needed, in particular using a large 14C database available at a global scale (Balesdent et al., 2018; Mathieu et al., 2015). Indeed, the F14C is largely controlled by pedo-climatic conditions such as clay content, climate and mineralogy (Mathieu et al., 2015) and the range of situations we covered here is relatively limited.
ORCHIDEE-SOM-14C, is one of the first land surface models (LSMs) that incorporates the 14C dynamics into the soil (Koven et al., 2013). Its starting point is ORCHIDEE-SOM, a recently developed soil model. We evaluated the new model ORCHIDEE-SOM-14C for four sites in different biomes. The model almost managed to reproduce the soil organic carbon stocks and the 14C content along the vertical profiles at all four sites. However, an overestimation of the total carbon stock throughout the profile was noted, with the greatest deviation at the surface. By using radiocarbon (14C) measurements, we have been able to diagnose internal model biases (underestimation of deep soil carbon age) and to propose further model improvements (depth-dependent diffusion). These results demonstrate the importance of depth-dependent diffusion for improving model outputs with regards to observations. This suggests that, from now on, model improvements should mainly focus on a depth-dependent parameterization. We limited our work here to depth-varying diffusion, but other parameters are also depth dependent and should be represented as such in the next version of the model. For instance, belowground litter production in the model is simply represented by an exponential law without any representation of the effect of resource distribution on root profile (e.g. water or nutrients). This is a complex task in a LSM running at large scale with a classical resolution of 0.5∘, but the soil modules of LSMs are quite sensitive to the NPP (Camino-Serrano et al., 2018; Todd-Brown et al., 2013), and a better constraint on the profile of the belowground litter production would likely improve the model performance. Furthermore, here we used only one averaged value over the soil profile for soil boundary conditions (texture, pH, bulk density) but those variables are known to impact the F14C (Mathieu et al., 2015) and change with depth (Barré et al., 2009) and depth-varying boundary conditions may also help to improve the model. Finally, the next step will deal with the comparison of model outputs to data at larger scales to be able to run the new version ORCHIDEE-SOM-14C at both regional and global scales.
The version of the code is freely available here: https://doi.org/10.14768/20181114001.1 (Tifafi et al., 2018).
MT, CH and BG designed the study. MT and MCS developed the model. HM, LM and SB provided soil samples and data on the Misiones site; SC provided data on the Feucherolles and Mons sites. HM, LM, SB and SC provided pedological information on sites. MT and CH measured 14C on the Argentinian soil samples. MT planned and carried out the simulations.
The authors declare that they have no conflict of interest.
This study, part of Marwa Tifafi's PhD and
financed by the University of Versailles Saint Quentin, is within the scope of the
ANR-14-CE01-0004 DeDyCAS project. Marta Camino-Serrano acknowledges funding from the
European Research Council Synergy grant ERC- 2013-SyG-610028 IMBALANCE-P. Part of the
data were acquired in the frame of the AGRIPED project (ANR 2010 BLAN 605). We thank
Matthew McGrath for his valuable comments on the manuscript.
Edited by: Carlos Sierra
Reviewed by: three anonymous
referees
Ahrens, B., Braakhekke, M. C., Guggenberger, G., Schrumpf, M., and Reichstein, M.: Contribution of sorption, DOC transport and microbial interactions to the 14C age of a soil organic carbon profile: Insights from a calibrated process model, Soil Biol. Biochem., 88, 390–402, https://doi.org/10.1016/j.soilbio.2015.06.008, 2015.
Balesdent, J. and Guillet, B.: Les datations par le 14C des matières organiques des sols. Contribution à l'étude de l'humification et du renouvellement des substances humiqueétriques, Sci. du sol, 2, 93–111, 1982.
Balesdent, J., Basile-Doelsch, I., Chadoeuf, J., Cornu, S., Derrien, D., Fekiacova, Z., and Hatté, C.: Atmosphere–soil carbon transfer as a function of soil depth, Nature, 23, 599–602, https://doi.org/10.1038/s41586-018-0328-3, 2018.
Barré, P., Berger, G., and Velde, B.: How element translocation by plants may stabilize illitic clays in the surface of temperate soils, Geoderma, 151, 22–30, https://doi.org/10.1016/j.geoderma.2009.03.004, 2009.
Braakhekke, M., Beer, C., Schrumpf, M., Ekici, A., Ahrens, B., Hoosbeek, M. R., Kruijt, B., Kabat, P., and Reichstein, M.: The use of radiocarbon to constrain current and future soil organic matter turnover and transport in a temperate forest, J. Geophys. Res.-Biogeo., 372–391, https://doi.org/10.1002/2013JG002420, 2014.
Braakhekke, M. C., Beer, C., Hoosbeek, M. R., Reichstein, M., Kruijt, B., Schrumpf, M., and Kabat, P.: SOMPROF: A vertically explicit soil organic matter model, Ecol. Modell., 222, 1712–1730, https://doi.org/10.1016/j.ecolmodel.2011.02.015, 2011.
Bruun, S., Christensen, B. T., Thomsen, I. K., Jensen, E. S., and Jensen, L. S.: Modeling vertical movement of organic matter in a soil incubated for 41 years with 14C labeled straw, Soil Biol. Biochem., 39, 368–371, https://doi.org/10.1016/j.soilbio.2006.07.003, 2007.
Camino-Serrano, M., Guenet, B., Luyssaert, S., Ciais, P., Bastrikov, V., De Vos, B., Gielen, B., Gleixner, G., Jornet-Puig, A., Kaiser, K., Kothawala, D., Lauerwald, R., Peñuelas, J., Schrumpf, M., Vicca, S., Vuichard, N., Walmsley, D., and Janssens, I. A.: ORCHIDEE-SOM: modeling soil organic carbon (SOC) and dissolved organic carbon (DOC) dynamics along vertical soil profiles in Europe, Geosci. Model Dev., 11, 937–957, https://doi.org/10.5194/gmd-11-937-2018, 2018.
Coleman, K., Jenkinson, D. S., Crocker, G. J., Grace, P. R., Klír, J., Körschens, M., Poulton, P. R., and Richter, D. D.: Simulating trends in soil organic carbon in long-term experiments using RothC-26.3, Geoderma, 81, 29–44, https://doi.org/10.1016/S0016-7061(97)00079-7, 1997.
Cottereau, E., Arnold, M., Moreau, C., Baqué, D., Bavay, D., Caffy, I., Comby, C., Dumoulin, J.-P., Hain, S., Perron, M., Salomon, J., and Setti, V.: Artemis, the New 14C AMS at LMC14 in Saclay, France, Radiocarbon, 49, 291–299, https://doi.org/10.2458/azu_js_rc.49.2928, 2007.
Delibrias, G., Guillier, M. T., and Labeyrie, J.: Saclay natural radiocarbon measurements i, Radiocarbon, 6, 233–250, 1964.
de Rosnay, P. and Polcher, J.: Modelling root water uptake in a complex land surface scheme coupled to a GCM, Hydrol. Earth Syst. Sci., 2, 239–255, https://doi.org/10.5194/hess-2-239-1998, 1998.
Ducoudré, N. I., Laval, K., and Perrier, A.: SECHIBA, a New Set of Parameterizations of the Hydrologic Exchanges at the Land-Atmosphere Interface within the LMD Atmospheric General Circulation Model, J. Climate, 6, 248–273, https://doi.org/10.1175/1520-0442(1993)006<0248:SANSOP>2.0.CO;2, 1993.
Dwivedi, D., Riley, W., Torn, M., Spycher, N., Maggi, F., and Tang, J.: Mineral properties, microbes, transport, and plant-input profiles control vertical distribution and age of soil carbon stocks, Soil Biol. Biochem., 107, 244–259, https://doi.org/10.1016/j.soilbio.2016.12.019, 2017.
Elliott, E. T., Paustian, K., and Frey, S. D.: Modeling the Measurable or Measuring the Modelable: A Hierarchical Approach to Isolating Meaningful Soil Organic Matter Fractionations, in Evaluation of Soil Organic Matter Models: Using Existing Long-Term Datasets, 1994, 161–179, 1996.
Elzein, A. and Balesdent, J.: Mechanistic Simulation of vertical distribution of carbon concentrations and residence times in soils, Soil Sci. Soc. Am. J., 59, 1328–1335, https://doi.org/10.1017/CBO9781107415324.004, 1995.
Epron, D., Marsden, C., M'Bou, A. T., Saint-André, L., d'Annunzio, R., and Nouvellon, Y.: Soil carbon dynamics following afforestation of a tropical savannah with Eucalyptus in Congo, Plant Soil, 323, 309–322, https://doi.org/10.1007/s11104-009-9939-7, 2009.
Godwin, H.: Half-life of radiocarbon, Nature, 195, 984–984, https://doi.org/10.1038/195984a0, 1962.
Guenet, B., Eglin, T., Vasilyeva, N., Peylin, P., Ciais, P., and Chenu, C.: The relative importance of decomposition and transport mechanisms in accounting for soil organic carbon profiles, Biogeosciences, 10, 2379–2392, https://doi.org/10.5194/bg-10-2379-2013, 2013.
Guenet, B., Moyano, F. E., Peylin, P., Ciais, P., and Janssens, I. A.: Towards a representation of priming on soil carbon decomposition in the global land biosphere model ORCHIDEE (version 1.9.5.2), Geosci. Model Dev., 9, 841–855, https://doi.org/10.5194/gmd-9-841-2016, 2016.
Guimberteau, M., Zhu, D., Maignan, F., Huang, Y., Yue, C., Dantec-Nédélec, S., Ottlé, C., Jornet-Puig, A., Bastos, A., Laurent, P., Goll, D., Bowring, S., Chang, J., Guenet, B., Tifafi, M., Peng, S., Krinner, G., Ducharne, A., Wang, F., Wang, T., Wang, X., Wang, Y., Yin, Z., Lauerwald, R., Joetzjer, E., Qiu, C., Kim, H., and Ciais, P.: ORCHIDEE-MICT (v8.4.1), a land surface model for the high latitudes: model description and validation, Geosci. Model Dev., 11, 121–163, https://doi.org/10.5194/gmd-11-121-2018, 2018.
He, Y., Trumbore, S. E., Torn, M. S., Harden, J. W., Vaughn, L. J. S., Allison, S. D., and Randerson, J. T.: Radiocarbon constraints imply reduced carbon uptake by soils during the 21st century, Science, 353, 1419–1424, 2016.
Hua, Q., Barbetti, M., and Rakowski, A. Z.: Atmospheric Radiocarbon for the Period 1950–2010, Radiocarbon, 55, 2059–2072, https://doi.org/10.2458/azu_js_rc.v55i2.16177, 2013.
Jagercikova, M., Evrard, O., Balesdent, J., Lefèvre, I., and Cornu, S.: Modeling the migration of fallout radionuclides to quantify the contemporary transfer of fine particles in Luvisol profiles under different land uses and farming practices, Soil Till. Res., 140, 82–97, https://doi.org/10.1016/j.still.2014.02.013, 2014.
Jagercikova, M., Cornu, S., Bourlès, D., Evrard, O., Hatté, C., and Balesdent, J.: Quantification of vertical solid matter transfers in soils during pedogenesis by a multi-tracer approach, J. Soil. Sediment., 17, 408–422, https://doi.org/10.1007/s11368-016-1560-9, 2017.
Jastrow, J. D., Amonette, J. E., and Bailey, V. L.: Mechanisms controlling soil carbon turnover and their potential application for enhancing carbon sequestration, Clim. Change, 80, 5–23, https://doi.org/10.1007/s10584-006-9178-3, 2007.
Kalnay, E., Kanamitsu, M., Kistler, R., Collins, W., Deaven, D., Gandin, L., Iredell, M., Saha, S., White, G., Woollen, J., Zhu, Y., Chelliah, M., Ebisuzaki, W., Higgins, W., Janowiak, J., Mo, K. C., Ropelewski, C., Wang, J., Leetmaa, a., Reynolds, R., Jenne, R., and Joseph, D.: The NCEP/NCAR 40-year reanalysis project, B. Am. Meteorol. Soc., 77, 437–471, https://doi.org/10.1175/1520-0477(1996)077<0437:TNYRP>2.0.CO;2, 1996.
Keeling, C. D. and Whorf, T. P.: Atmospheric CO2 records from sites in the SIO air sampling network, Oak Ridge Natl. Lab. U.S. Dept. or Energy, Oak Ridge, Tenn., 2006.
Keyvanshokouhi, S., Cornu, S., Samouëlian, A., and Finke, P.: Evaluating SoilGen2 as a tool for projecting soil evolution induced by global change, Sci. Total Environ., 571, 110–123, https://doi.org/10.1016/j.scitotenv.2016.07.119, 2016.
Kobayashi, K. and Salam, M. .: Comparing simulated and measured values using mean squared deviation and its components, Agron. J., 92, 345–352, 2000.
Koven, C. D., Riley, W. J., Subin, Z. M., Tang, J. Y., Torn, M. S., Collins, W. D., Bonan, G. B., Lawrence, D. M., and Swenson, S. C.: The effect of vertically resolved soil biogeochemistry and alternate soil C and N models on C dynamics of CLM4, Biogeosciences, 10, 7109–7131, https://doi.org/10.5194/bg-10-7109-2013, 2013.
Krinner, G., Viovy, N., de Noblet-Ducoudré, N., Ogée, J., Polcher, J., Friedlingstein, P., Ciais, P., Sitch, S., and Prentice, I. C.: A dynamic global vegetation model for studies of the coupled atmosphere-biosphere system, Global Biogeochem. Cy., 19, GB1015, https://doi.org/10.1029/2003GB002199, 2005.
Laclau, J. P., Bouillet, J. P., and Ranger, J.: Dynamics of biomass and nutrient accumulation in a clonal plantation of Eucalyptus in Congo, Forest Ecol. Manag., 128, 181–196, https://doi.org/10.1016/S0378-1127(99)00146-2, 2000.
Mathieu, J. A., Hatté, C., Balesdent, J., and Parent, É.: Deep soil carbon dynamics are driven more by soil type than by climate: a worldwide meta-analysis of radiocarbon profiles, Glob. Change Biol., 21, 4278–4292, https://doi.org/10.1111/gcb.13012, 2015.
Mitchell, T. D., Carter, T. R., Jones, P. D., Hulme, M., and New, M.: A comprehensive set of high-resolution grids of monthly climate for Europe and the globe: the observed record (1901–2000) and 16 scenarios (2001–2100), Cent. Clim., July, 1–30, available at: https://www.tyndall.ac.uk/sites/default/files/wp55.pdf (last access: 5 February 2018), 2004.
Morrás, H., Moretti, L., Píccolo, G., and Zech, W.: Genesis of subtropical soils with stony horizons in NE Argentina: Autochthony and polygenesis, Quatern. Int., 196, 137–159, https://doi.org/10.1016/j.quaint.2008.07.001, 2009.
O'Brien, B. J. and Stout, J. D.: Movement and turnover of soil organic matter as indicated by carbon isotope measurements, Soil Biol. Biochem., 10, 309–317, https://doi.org/10.1016/0038-0717(78)90028-7, 1978.
Parton, W., Schimel, D. S., Cole, C., and Ojima, D.: Analysis of factors controlling soil organic matter levels in Great Plains grasslands, Soil Sci. Soc. Am. J., 51, 1173–1179, 1987.
Parton, W. J., Stewart, J. W. B., and Cole, C. V.: Dynamics of C, N, P and S in grassland soils: a model, Biogeochemistry, 5, 109–131, https://doi.org/10.1007/BF02180320, 1988.
Reimer, P. J., Brown, T. A., and Reimer, R. W.: Discussion: reporting and calibration of post-bomb 14C data, Radiocarbon, 46, 1299–1304, https://doi.org/10.2458/azu_js_rc.46.4183, 2004.
Scharpenseel, H. W. and Schiffmann, H.: Radiocarbon dating of soils, a review, Zeitschrift für Pflanzenernährung und Bodenkd., 140, 159–174, https://doi.org/10.1002/jpln.19771400205, 1977.
Schwartz, D., Mariotti, A., Trouve, C., Van Den Borg, K., and Guillet, B.: Etude des profils isotopiques 13C et 14C d'un sol ferrallitique sableux du littoral congolais?: implications sur la dynamique de la matière organique et l'histoire de la végétation, Comptes Rendus l'Académie des Sci. 2 Mécanique, 1992, 315, 1411–1417, ISSN: 0249-6305, 1992.
Sitch, S., Smith, B., Prentice, I. C., Arneth, a., Bondeau, a., Cramer, W., Kaplan, J. O., Levis, S., Lucht, W., Sykes, M. T., Thonicke, K., and Venevsky, S.: Evaluation of ecosystem dynamics, plant geography and terrestrial carbon cycling in the LPJ dynamic global vegetation model, Glob. Chang. Biol., 9, 161–185, https://doi.org/10.1046/j.1365-2486.2003.00569.x, 2003.
Stuiver, M. and Polach, H. A.: Reporting of 14C data, Radiocarbon, 19, 355–363, https://doi.org/10.1016/j.forsciint.2010.11.013, 1977.
Taylor, K. E., Stouffer, R. J., and Meehl, G. a.: An overview of CMIP5 and the experiment design, B. Am. Meteorol. Soc., 93, 485–498, https://doi.org/10.1175/BAMS-D-11-00094.1, 2012.
Tifafi, M., Guenet, B., and Orchidee-core group: The use of radiocarbon 14C to constrain carbon dynamics in the soil module of the land surface model ORCHIDEE (SVN r5165), https://doi.org/10.14768/20181114001.1, 2018.
Tisnérat-Laborde, N., Thil, F., Synal, H.-A., Hatté, C., Cersoy, S., Gauthier, C., Kaltnecker, E., Massault, M., Michelot, J.-L., Noret, A., Noury, C., Siani, G., Tombret, O., Vigne, J.-D., Wacker, L., and Zazzo, A.: A new compact AMS facility measuring 14C dedicated to Environment, Climate and Human Sciences, in: 22nd International Radiocarbon Conference, Dakar, Senegal, November 2015, Oral presentation, 16–20, 2015.
Todd-Brown, K. E. O., Randerson, J. T., Post, W. M., Hoffman, F. M., Tarnocai, C., Schuur, E. A. G., and Allison, S. D.: Causes of variation in soil carbon simulations from CMIP5 Earth system models and comparison with observations, Biogeosciences, 10, 1717–1736, https://doi.org/10.5194/bg-10-1717-2013, 2013.
Trumbore, S.: Age of Soil Organic Matter and Soil Respiration?: Radiocarbon Constraints on Belowground C Dynamics, Ecol. Appl., 10, 399–411, https://doi.org/10.1890/1051-0761(2000)010[0399:AOSOMA]2.0.CO;2, 2000.
Wieder, W. R., Bonan, G. B., and Allison, S. D.: Global soil carbon projections are improved by modelling microbial processes, Nat. Clim. Change, 3, 1–4, https://doi.org/10.1038/nclimate1951, 2013.
WRB: World reference base for soil resources 2006: a framework for international classification, correlation and communication, 2006.
Wynn, J. G., Bird, M. I., and Wong, V. N. L.: Rayleigh distillation and the depth profile of 13C/12C ratios of soil organic carbon from soils of disparate texture in Iron Range National Park, Far North Queensland, Australia, Geochim. Cosmochim. Ac., 69, 1961–1973, 2005.