the Creative Commons Attribution 4.0 License.
the Creative Commons Attribution 4.0 License.
 | 02 Nov 2018
Carbon–nitrogen coupling under three schemes of model representation: a traceability analysis
Zhenggang Du
Ensheng Weng
Lifen Jiang
Jianyang Xia
The interaction between terrestrial carbon (C) and nitrogen (N) cycles has been incorporated into more and more land surface models. However, the scheme of C–N coupling differs greatly among models, and how these diverse representations of C–N interactions will affect C-cycle modeling remains unclear. In this study, we explored how the simulated ecosystem C storage capacity in the terrestrial ecosystem (TECO) model varied with three different commonly used schemes of C–N coupling. The three schemes (SM1, SM2, and SM3) have been used in three different coupled C–N models (i.e., TECO-CN, CLM 4.5, and O-CN, respectively). They differ mainly in the stoichiometry of C and N in vegetation and soils, plant N uptake strategies, downregulation of photosynthesis, and the pathways of N import. We incorporated the three C–N coupling schemes into the C-only version of the TECO model and evaluated their impacts on the C cycle with a traceability framework. Our results showed that all three of the C–N schemes caused significant reductions in steady-state C storage capacity compared with the C-only version with magnitudes of −23 %, −30 %, and −54 % for SM1, SM2, and SM3, respectively. This reduced C storage capacity was mainly derived from the combined effects of decreases in net primary productivity (NPP; −29 %, −15 %, and −45 %) and changes in mean C residence time (MRT; 9 %, −17 %, and −17 %) for SM1, SM2, and SM3, respectively. The differences in NPP are mainly attributed to the different assumptions on plant N uptake, plant tissue C : N ratio, downregulation of photosynthesis, and biological N fixation. In comparison, the alternative representations of the plant vs. microbe competition strategy and the plant N uptake, combined with the flexible C : N ratio in vegetation and soils, led to a notable spread in MRT. These results highlight the fact that the diverse assumptions on N processes represented by different C–N coupled models could cause additional uncertainty for land surface models. Understanding their difference can help us improve the capability of models to predict future biogeochemical cycles of terrestrial ecosystems.
- Article
(5312 KB) - Full-text XML
-
Supplement
(248 KB) - BibTeX
- EndNote


Terrestrial ecosystem carbon (C) storage is jointly determined by ecosystem C input (i.e., net primary productivity, NPP) and mean residence time (MRT), both of which are strongly affected by the terrestrial nitrogen (N) availability (Vitousek et al., 1991; Hungate et al., 2003; Luo et al., 2004). Nitrogen is an essential component of enzymes, proteins, and secondary metabolites (van Oijen and Levy, 2004). Plant and microbial production requires N to meet stoichiometric demands, thus affecting the C balance and nutrient turnover of ecosystems (Cleveland et al., 2013; Wieder et al., 2015b). Since N limitation is widespread for plant growth in terrestrial ecosystems (LeBauer and Treseder, 2008; Xia and Wan, 2008), N availability is often highly correlated with key ecological processes, such as C assimilation (Field and Mooney, 1986; Du et al., 2017), allocation (Kuzyakov and Xu, 2013), plant respiration (Sprugel et al., 1995), and litter and soil organic matter (SOM) decomposition (Terrer et al., 2016). Nitrogen dynamics thus play an important role in governing the terrestrial ecosystem C storage (García-Palacios et al., 2013; Shi et al., 2015).
Given the importance of N availability on C sink projections (Hungate et al., 2003; Wang and Houlton 2009, Zaehle et al., 2015, Wieder et al., 2015b), N processes are increasingly incorporated into biogeochemical models. The representation of N cycling and its feedback to C cycling in models reflects what has been established in the ecosystem research community. Early C–N coupled models demonstrated that the N availability limited C storage capacity with associated effects on plant photosynthesis and growth in many terrestrial ecosystems (Melillo et al., 1993; Luo et al., 2004). Recent studies have largely confirmed these results by improving C–N coupling models with multiple hypotheses (Zhou et al., 2014; Zaehle et al., 2014; Thomas et al., 2015). These hypotheses include plant downregulation productivity based on the N required for cell construction or N availability for plant absorption (Thornton et al., 2007; Gerber et al., 2010), constant or flexible stoichiometry for allocation and tissue (Wang et al., 2001; Shevliakova et al., 2009; Zaehle and Friend, 2010), competition between plants and microbes for soil nutrients (Zhu et al., 2017), evapotranspiration (ET) or NPP-driven empirical functions to generate spatial estimates of biological N fixation (BNF) (Cleveland et al., 1999; Wieder et al., 2015a; Meyerholt et al., 2016), and respiration of excess C to obtain N from the environment and/or to prevent the accumulation of C beyond the storage capacity (Zaehle et al., 2010). This knowledge has significantly helped improve our understanding of the terrestrial C–N coupling and is an important basis to develop comprehensive terrestrial process-based models (Thornton et al., 2007; Thomas et al., 2013). However, simulated results of the terrestrial C cycle illustrated considerable spread among models, and much uncertainty arose from predictions of N effects on C dynamics (Arora et al., 2013; Zaehle et al., 2015). The contradictory results were largely from different representations of fundamental N processes (e.g., the degree of flexibility of the C : N ratio in vegetation and soils, plant N uptake strategies, pathways of N import, decomposition, and the representations of the competition between plants and microbes for mineral N) (Sokolov et al., 2008; Wania et al., 2012; Walker et al., 2015). Furthermore, the methodology used to derive the C–N coupling schemes among models varied largely, which might be invalid for the model intercomparisons to provide insight into the underlying mechanism of N status for terrestrial C-cycle projection.
In the past decades, terrestrial models have integrated more and more processes to improve model performance (Koven et al., 2013; Todd-Brown et al., 2013; Wieder et al., 2014). The more processes are incorporated, the more difficult it becomes to understand or evaluate model behavior (Luo et al., 2015). Traceability analysis has been developed to diagnose the simulation results within (Xia et al., 2013; Ahlström et al., 2015) and among (Rafique et al., 2016; Zhou et al., 2018) models. Based on the traceability analysis framework, key traceable elements, including fundamental properties of the terrestrial C cycle and their representations in shared structures among existing models, can be identified and characterized under different sources of variation (e.g., external forcing and uncertainty in processes). Traceability analysis enables the diagnosis of where models are clearly lacking predictive ability and evaluation of the relative benefit when more or alternative components are added to the models (Luo et al., 2015).
This study is designed to examine the effects of C–N coupling under different schemes of model representation on ecosystem C storage in the terrestrial ecosystem (TECO) model with the traceability analysis framework. Three schemes of model representation were conducted mainly based on the carbon–nitrogen coupling version of TECO (TECO-CN, SM1; Weng and Luo, 2008), the Community Land Model version 4.5 (CLM 4.5, SM2; Koven et al., 2013; Oleson et al., 2013), and the carbon–nitrogen coupling version of the Organizing Carbon and Hydrology in Dynamic Ecosystems model (O-CN, SM3; Zaehle and Friend, 2010; Zaehle and Dalmonech, 2011) (Table 1). The three C–N schemes differ in degrees of flexibility of the C : N ratio in vegetation and soils, plant N uptake strategies, pathways of N import, and the representations of the competition between plants and microbes for soil-available N. Based on the forcing data of ambient CO2 concentration, N deposition, and meteorological data (i.e., air temperature, soil temperature, relative humidity, vapor pressure deficit, precipitation, wind speed, photosynthetically active radiation) obtained from Duke Forest during the period of 1996–2007, we conduct three alternative C–N coupling schemes (i.e., SM1, SM2, and SM3) as well as C-only in the TECO model framework to compare their effects on the ecosystem C storage capacity. The N-process sensitivity analysis was carried out to evaluate the variability in estimated ecosystem C storage caused by the process-related parameters at the steady state.
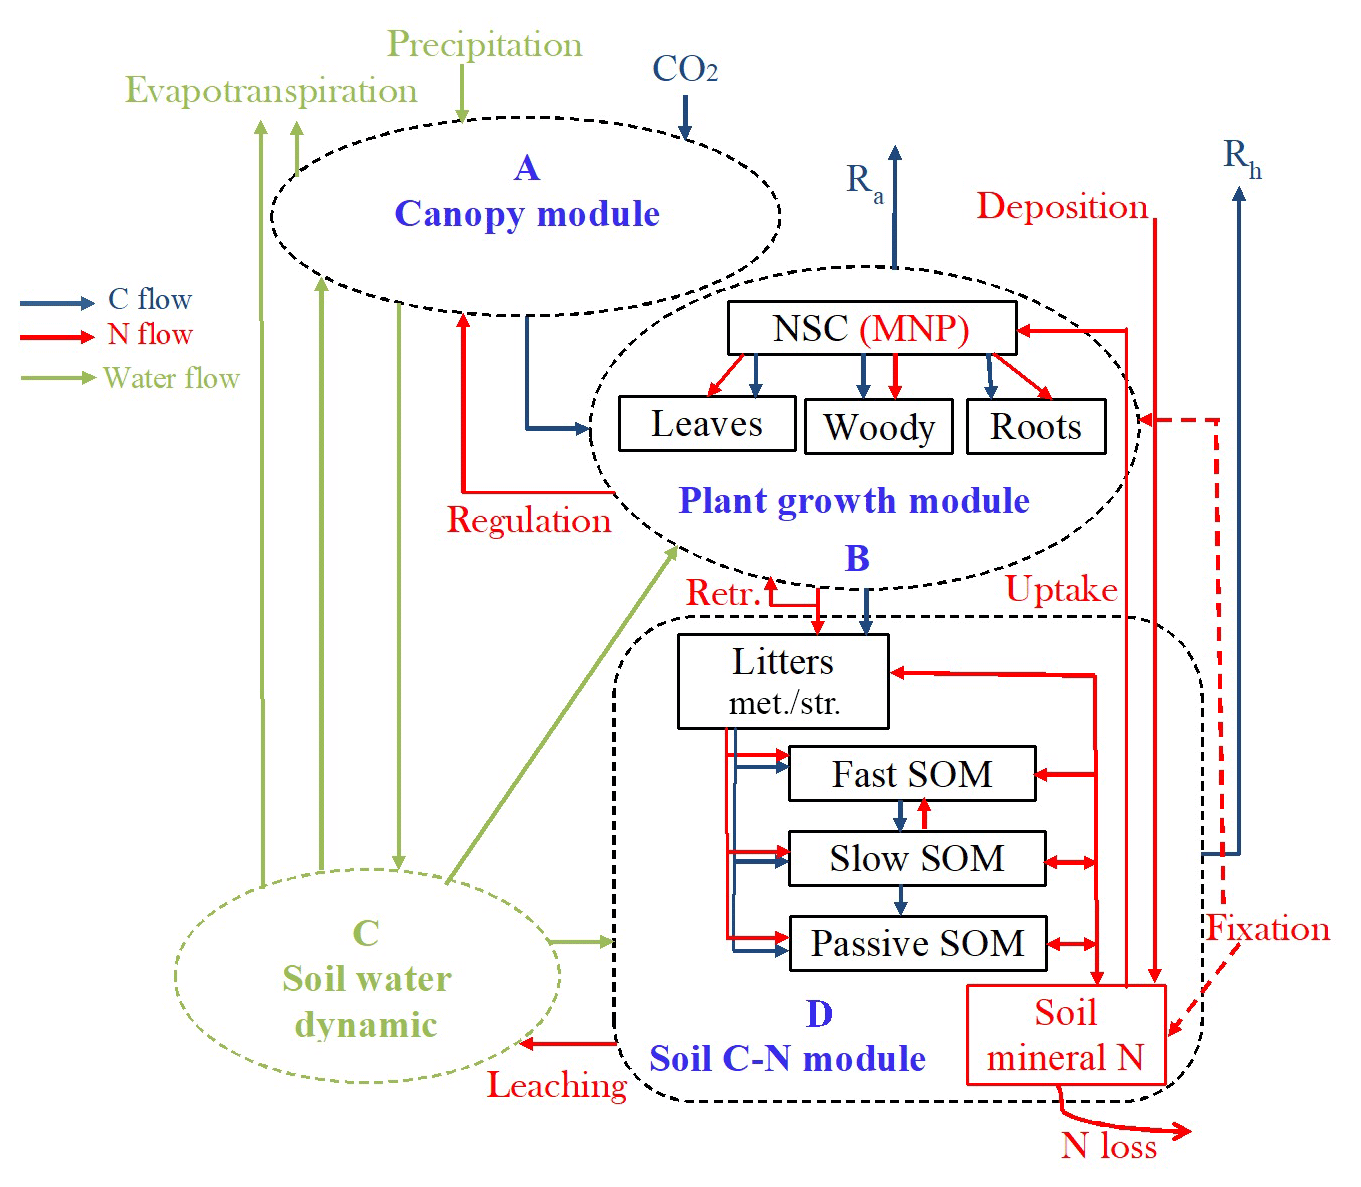
Figure 1Schematic diagram of the terrestrial ecosystem carbon (C) and nitrogen (N) coupling model (TECO-CN). (A) Canopy module, (B) plant growth module, (C) soil water dynamics module, and (D) soil carbon–nitrogen coupling module. Rectangles represent the carbon and nitrogen pools. Ra is autotrophic respiration. Rh is heterotrophic respiration. Retr.: retranslocation. NSC: nonstructural carbohydrate. MNP: mineral N in plant tissues. SOM: soil organic matter. * Set N fixation as an option when the plant N uptake is not enough for growth in terms of C investment.
2.1 Data sources
The datasets used in this study were taken from the Duke free-air CO2 enrichment (FACE) experiment located in Blackwood, North Carolina, USA (35.97∘ N, 79.08∘ W). The flux tower lies on a 15-year-old loblolly pine (Pinus taeda L.) plantation. The meteorological forcing data were downloaded from the AmeriFlux database at http://ameriflux.lbl.gov (last access: 26 December 2016), including ambient CO2 concentration ([CO2]), air temperature at the top canopy (Ta), soil temperature (Ts), photosynthetically active radiation (PAR), relative humidity (RH), vapor pressure deficit (VPD), precipitation, wind speed (Ws), and N deposition. All forcing datasets are available from 1996 to 2007. To set the initial condition for the models, we collected the related datasets from previous studies. Standing biomass and biomass production data at each plot for plant compartments (i.e., foliage, fine root, and woody biomass, including branches and coarse roots) were taken from McCarthy et al. (2010). The C and N concentration data for each plant compartment based on Finzi et al. (2007) were used to estimate C and N stocks and fluxes. Plant N demand and uptake were calculated from these data measured by Finzi et al. (2007). The C and N concentrations of litter and SOM were obtained from Lichter et al. (2008).
2.2 Model description and C–N schemes
2.2.1 TECO-CN
The terrestrial ecosystem C–N coupling model (TECO-CN) used in the present study is a variant of the TECO carbon-only version (TECO-C) incorporating additional key N processes (Fig. 1). The TECO-C model is a process-based ecosystem model designed to examine critical processes regulating interactive responses of plants and ecosystems to climate change. It has four major components: canopy photosynthesis module, plant growth module, soil water dynamic module, and soil C dynamic module. The canopy photosynthesis and soil water dynamic modules run at an hourly time step, while the plant growth and soil C dynamic modules run at the daily time step. A detailed description of the TECO-C model can be found in Weng and Luo (2008).
The N cycle added to the TECO model for this study is simplified following the structure of Luo and Reynolds (1999), Gerber et al. (2010), and Wang et al. (2010). It has a similar structure to the TECO-C model (Fig. 1). There are nine organic N pools, including plant, litter, and soil N pools, and one inorganic soil N pool. The plant N pools include leaves, wood, roots, and mineral N in plant tissues. The litter and soil N pools include metabolic and structural litter N, fast, slow, and passive soil organic N (SON), and soil mineral N pools. The total plant N demand on each time step is calculated following the NPP allocation to new tissue growth based on their C : N ratios. To meet the demand, the plant N supply is calculated from three parts, including the retranslocated N from senescing tissues, plant uptake from the soil mineral N pool, and external N sources from atmospheric deposition and biological N fixation. The N absorbed by roots enters into the mineral N pool in plant tissues and is then allocated to the remaining plant pools with plant growth. The N in leaves and fine roots is reabsorbed before senescence. Plant litters will enter metabolic or structural pools depending on their C : N ratios.
The allocation coefficients act as the key factor to determine the baseline C residence time in this study. Plant-assimilated C allocated to the leaves, stems, and roots depends on their growth rates, which vary with phenology (Luo et al., 1995; Denison and Loomis, 1989; Shevliakova et al., 2009; Weng and Luo, 2008):
where bl, bs, and br are the partitioning coefficient of newly assimilated C to leaves, stems, and roots, respectively. Parameters c1 and c2 are calculated as
where bml and bmr are the leaf and root biomass; CN and CN represent the C : N ratios of the leaf pool at 0 and the current time step, respectively; SLA is specific leaf area; and h is plant height, which is calculated as
where hmax is the maximum canopy height, h1 is an empirical parameter, and bmP is plant biomass.
Table 1Summary of the nitrogen–carbon coupling schemes used and the representation of key processes in the carbon–nitrogen cycle.
a See this study. b Koven et al. (2013). c Oleson et al. (2013). d Zaehle and Friend (2010). e Zaehle and Dalmonech (2011). f Use the same representation as in the TECO-CN model among three schemes.
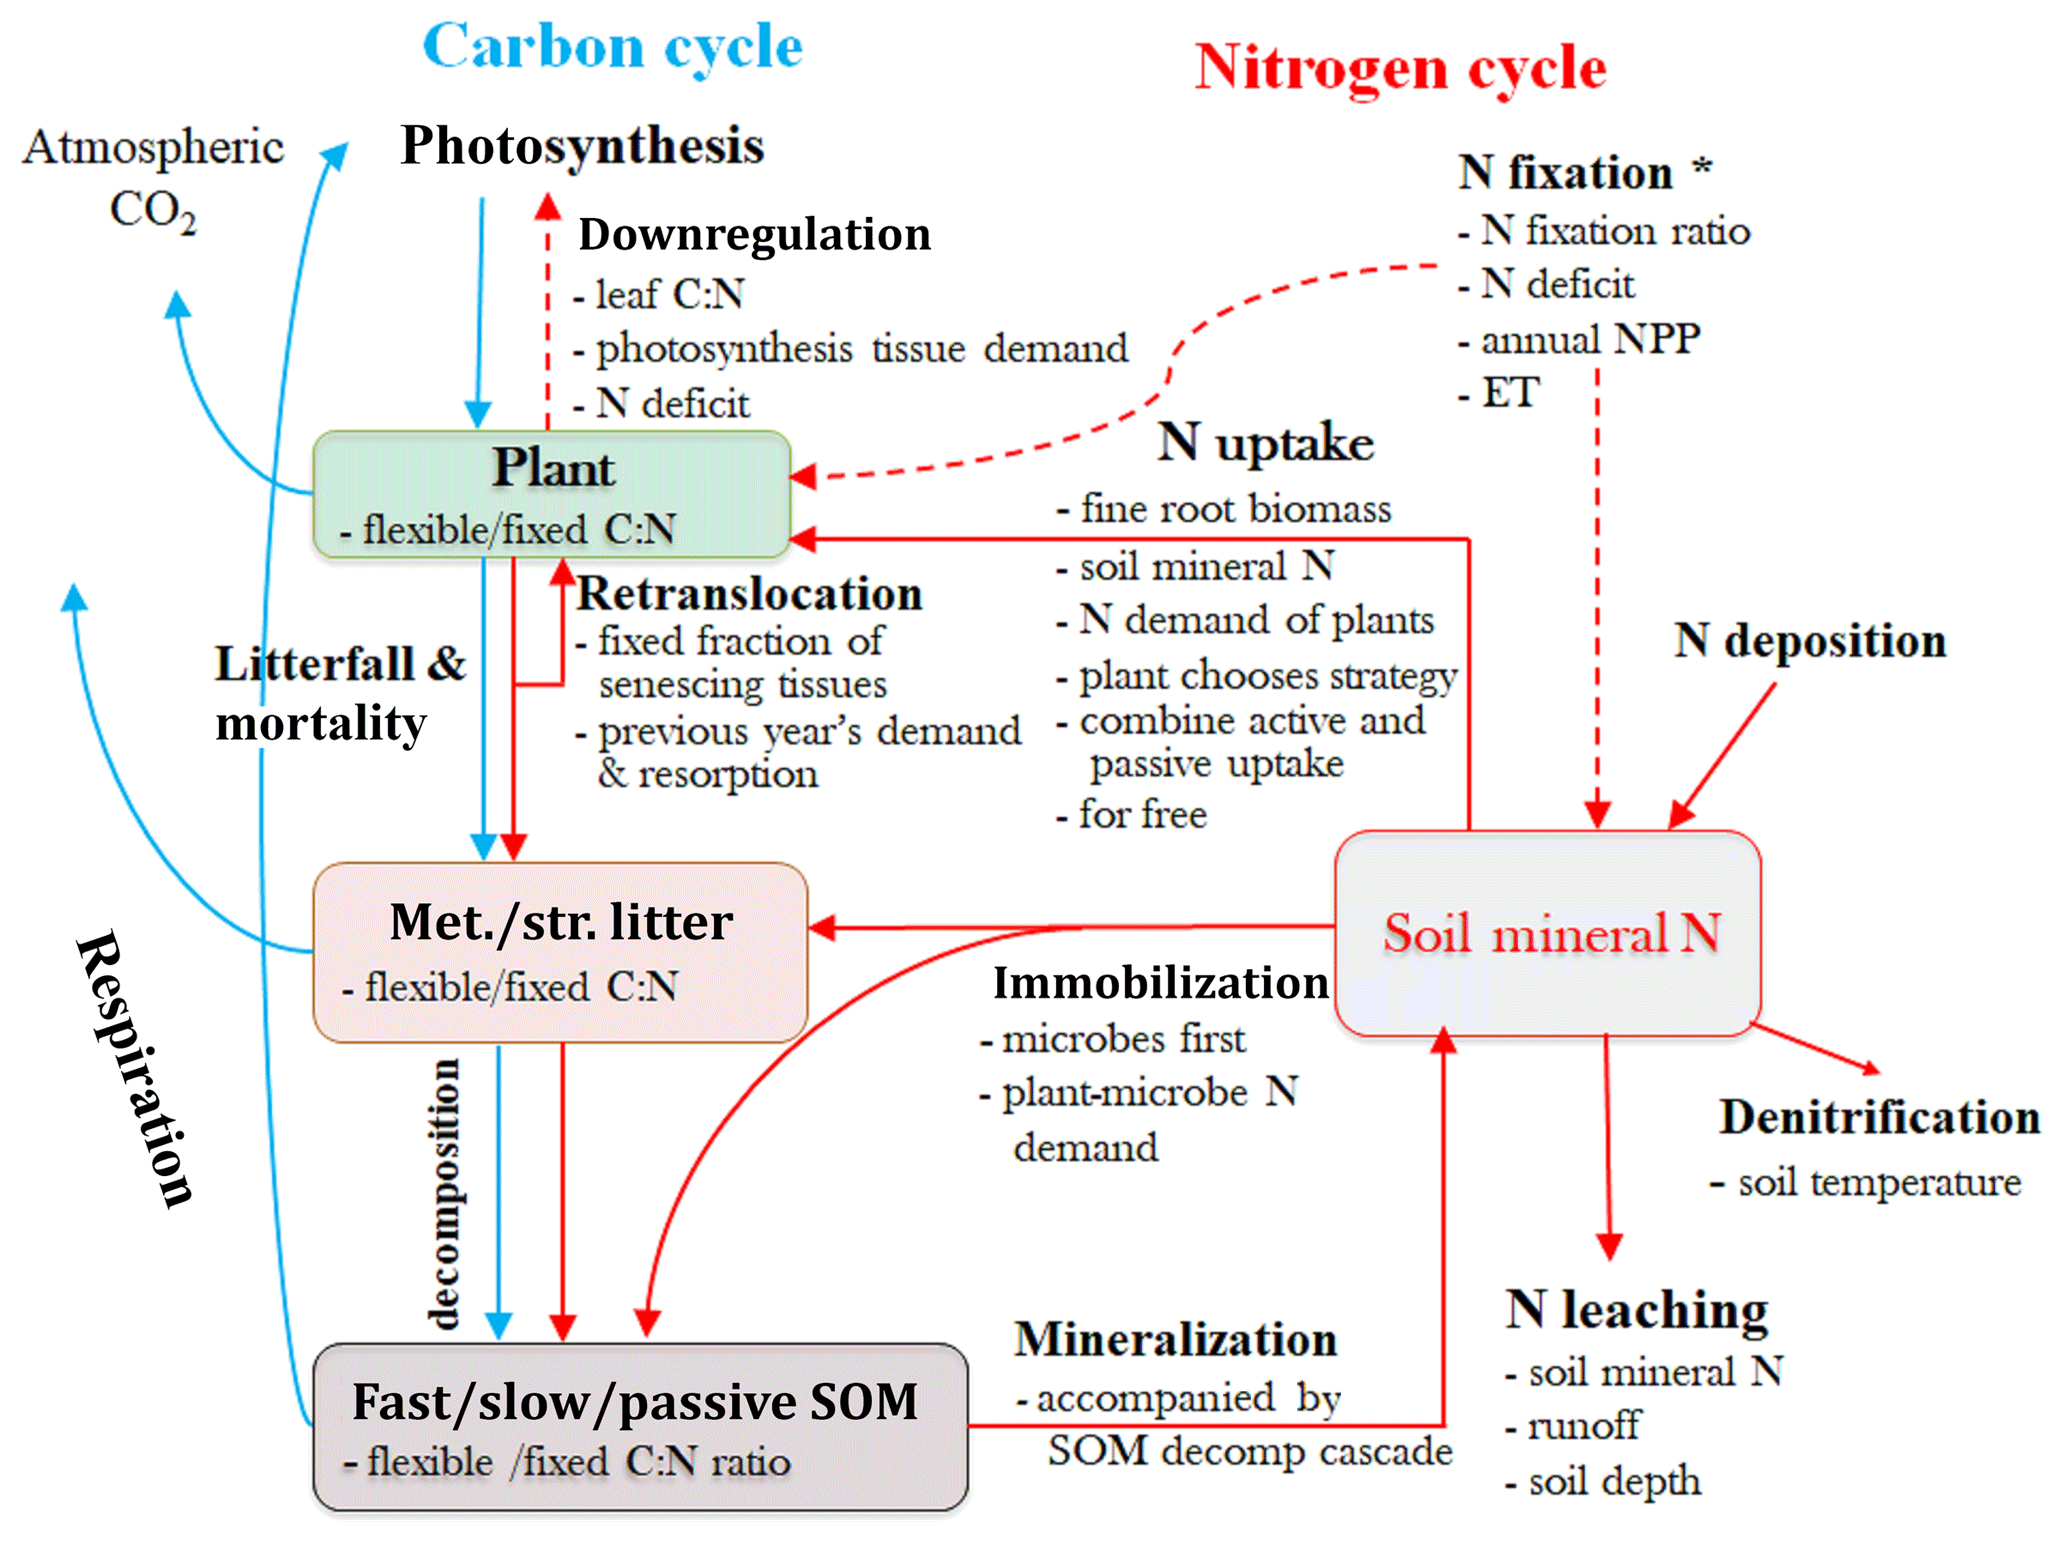
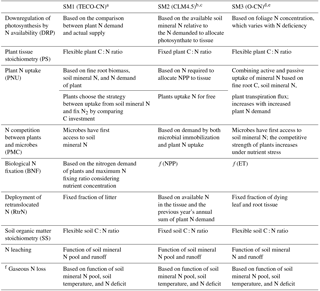
Figure 2Schematic diagram illustrating the major carbon (C) and nitrogen (N) flows and stores in a terrestrial ecosystem, with alternative assumptions of the N processes represent in SM1, SM2, and SM3. Light blue arrows indicate C-cycle processes and red arrows show N-cycle processes. Met./Str. litter: metabolic and/or structural litters; SOM: soil organic matter. * Set N fixation as an option when the plant N uptake is not enough for growth in terms of C investment in SM1, but go directly to soil mineral N pool in SM2 and SM3.
2.2.2 C–N coupling schemes
We conducted four experiments, including three simulations with their representations of C–N coupling schemes (SM1, SM2, and SM3), and an additional C-only simulation in the TECO model framework. The three C–N interaction simulations include one original scheme in the TECO-CN model and the other two schemes represent CLM4.5-BGC and O-CN. The three C–N coupling schemes differ in the representation of the downregulation of photosynthesis, the degree of flexibility of the C : N ratio in vegetation and soils (i.e., fixed C : N ratio in SM2, flexible C : N ratio in SM1 and SM3), plant N uptake strategies, pathways of N import to the plant reserves, and the competition between plants and microbes for soil mineral N (Table 1, Fig. 2).
SM1 (TECO-CN)
The N downregulation of photosynthesis in SM1 is determined by the comparison between plant N demand and the actual supply of N:
where Nsup (g N m−2 s−1) is the actual supply of N obtained from retranslocated N, plant N uptake, and biological N fixation. Ndemand (g N m−2 s−1) is plant N demand, which is calculated as
where Ci is the C pool size of plant tissue at the current time step, and CN is the C : N ratio of plant tissue at the first time step.
The retranslocated N is calculated as
where ri is the N resorption coefficient, CNi is the C : N ratio, and outCi (g C m−2 s−1) is the value of C leaving the plant pool i at each time step.
The plant N uptake (g N m−2 s−1) from the soil mineral N pool is a function of the root biomass density (Roottotal, g C m−2) and N demand of plants, following McMurtrie et al. (2012).
where Ndemand is the N demand of plants; SNmine (g N m−2) is the soil mineral N; fU, max is the maximum rate of N absorption per step when Roottotal approaches infinity; and Root0 (g C m−2) is a constant of root biomass at which the N uptake rate is half of the parameter fU, max.
The biological N fixation (g N m−2 s−1) is calculated as
where nfix=0.0167 is the maximum N fixation ratio and fnsc is the nutrient-limiting factor. fnsc is calculated as
where NSCmin (g C m−2) and NSCmax (g C m−2) are the minimal and maximal sizes of the nonstructural C pool, respectively.
The soil microbial immobilization (g N m−2 s−1) is calculated as
where CN0i and CNi () are the C : N ratios of metabolic litter, structural litter, and fast, slow, and passive soil organic C pools at the first and current time step, respectively.
Two pathways of N loss are modeled. One is gaseous loss (Ngas_loss, g N m−2 s−1) and another is leaching (Nleach, g N m−2 s−1). Both are proportional to the availability of soil mineral N (SNmin, g N m−2). The equations are
where fngas=0.001 and fnleach=0.5, Tsoil (∘C) is the soil temperature, Vrunoff (mm s−1) is the value of runoff, hdepth (mm) is the soil depth, and Ndepos=0.78 g N m−2 yr−1 is the N deposition used in this study.
SM2 (CLM4.5bgc)
The N downregulation of photosynthesis in SM2 is calculated as
where CFallo (g C m−2 s−1) is the total flux of allocated C, which is determined by available mineral N. CFavail_alloc (g C m−2 s−1) is the potential C flux from photosynthesis, which can be allocated to new growth. CF (g C m−2 s−1) is the potential gross primary productivity (GPP) when there is no N limitation.
The retranslocated N (g N m−2 s−1) is calculated as
where N (g N m−2 y−1) is the previous year's annual sum of retranslocated N obtained from senescing tissues, and N (g N m−2 y−1) is the previous year's annual sum of plant N demand. Nretrans_avail (g N m −2 s−1) is the available retranslocated N in senescing tissues, which is calculated by the proportional of senescing tissues.
The plant N uptake (g N m−2 s−1) is described as
where fplant_demand is the fraction (from 0 to 1) of the plant N demand, which can be met given the current soil mineral N supply and competition with heterotrophs. fplant_demand is set to be equal to the fraction of potential immobilization demand (fimmob_demand) that is calculated as
where Nimmob_demand (g N m−2 s−1) is the total potential N immobilization demand (i.e., total potential microbial N demand).
The biological N fixation (g N m−2 s−1) is calculated as
where NPPpy (g C m−2 y−1) is the previous year's NPP.
SM3 (O-CN)
The N downregulation of photosynthesis in SM3 is calculated as
where a and b are empirical constants, and Nleaf∕LAI (g N m−2) is foliage N per unit of leaf area.
The retranslocated N (g N m−2 s−1) is calculated as
where τ (g N m−2 s−1) is the foliage or roots shed in each step, and and are the fractions of N retranslocated when the tissue dies off.
The plant N uptake (g N m−2 s−1) is calculated as
where is maximum N uptake capacity per unit of fine root mass (Zaehle and Friend, 2010; Kronzucker et al., 1995, 1996), is the rate of N uptake not associated with Michaelis–Menten kinetics, and is the half-saturation concentration of fine root N uptake. f(Tsoil) is calculated as
where Tsoil (∘C) is soil temperature.
Croot (g C m−2) is fine root mass. f(NCplant) is the dependency of N uptake on plant N status and is calculated as
where ncleaf, min and ncleaf, max are the minimum and maximum foliage N concentration, respectively. NCplant (g N g−1 C) is taken as the mean N concentration of foliage, fine root, and labile N pools, representing the active and easily translocatable portion of plant N.
The biological N fixation (g N m−2 s−1) is calculated as
where AET (mm y−1) is the mean annual evapotranspiration.
2.3 Traceability analysis framework
The traceability analysis framework was used to evaluate the variation of the modeled ecosystem C storage capacity under different C–N schemes (Fig. S1 in the Supplement). According to the traceability analysis framework (Xia et al., 2013), the modeled C storage capacity can be traced to (i) a product of NPP and ecosystem residence time (τE). The latter τE can be further traced to (ii) baseline C residence time (, which is usually preset in a model according to vegetation characteristics and soil types, (iii) N scalar (ξN), (iv) environmental scalars (ξ) including temperature (ξT) and water (ξW) scalars, and (v) the external climate forcing. The framework for decomposing modeled C storage capacity into a few traceable components is built upon a pool and flux structure, which is adopted in all of the terrestrial C models. The structure can be represented well by a matrix equation (Luo et al., 2003; Luo and Weng, 2011; Huang et al., 2018):
where is an 8×1 vector describing eight C pool sizes in leaf, root, wood, metabolic litter, structural litter, and fast, slow, and passive soil organic C in the TECO model (Weng and Luo, 2008). represents the partitioning coefficients of the photosynthetically fixed C into different plant pools. U(t) is the input of fixed C via plant photosynthesis. A is an 8×8 matrix representing the C transfer between pools. ξ is an 8×8 diagonal matrix of control for plant N status and environmental scalars on a C decay rate at each time step. C is an 8×8 diagonal matrix representing the C exit rates from a pool at each time step.
The C storage capacity equals the sum of C in all pools at the steady state (Xss), which can be obtained by making Eq. (28) equal to zero as described in Xia et al. (2013):
The vector Uss is the ecosystem C influx at the steady state. The partitioning (B vector), transfer coefficients (A matrix), and exit rates (C matrix) in Eq. (28) together determine the baseline C residence time (.
The baseline C residence time ( in Eq. (30), N scalars (ξN), and environmental scalars (ξE) together determine the C residence time (τE).
Thus, the C storage capacity is jointly determined by the ecosystem residence time (τE) and steady-state C influx (Uss).
The environmental scalar is further separated into the temperature (ξT) and water (ξW) scalars, which can be represented as
As the respiration and decomposition rate modifier, the N scalar is given by vector . The component quantifies the changes in N content at each time step compared with the initial condition in the C pool i. It is calculated as
where CN and CN are the C : N ratio of the pool i at 0 and n time step, respectively.
2.4 Model simulations and sensitivity analysis
To obtain the modeled C storage capacity, we spun up the TECO model with the C-only and three C–N coupling schemes to the steady state using the semi-analytical solution method developed by Xia et al. (2012). In this study, the meteorological forcings of 1996–2007 with the time step of 30 min were used to run the models to the steady state. Once the simulations are spun up to the steady state, C and N fluxes and state variables as well as the matrix elements A, C, B, and ξ in Eq. (29) from all time steps in the last recycle of the climate forcing were saved for the traceability analysis.
The sensitivities of both NPP and mean C residence time (MRT) as well as ecosystem C storage capacity to each main N process in three schemes were calculated as
where , , and (i=1, 2, 3) represent the sensitivities of NPP, MRT, and ecosystem C storage capacity to the N process P in the scheme i, respectively. NPP and MRT are the annual mean values of NPP and MRT at the steady state in the scheme i. NPP and NPP are the annual mean values of NPP that were simulated to steady state again in scheme i based on the value of the N process P (i.e., list in Table 1) by increasing 50 % and decreasing 50 %, respectively. MRT and MRT are the annual mean values of MRTs that were simulated in the same way as NPP and calculated using Eqs. (30) and (31).
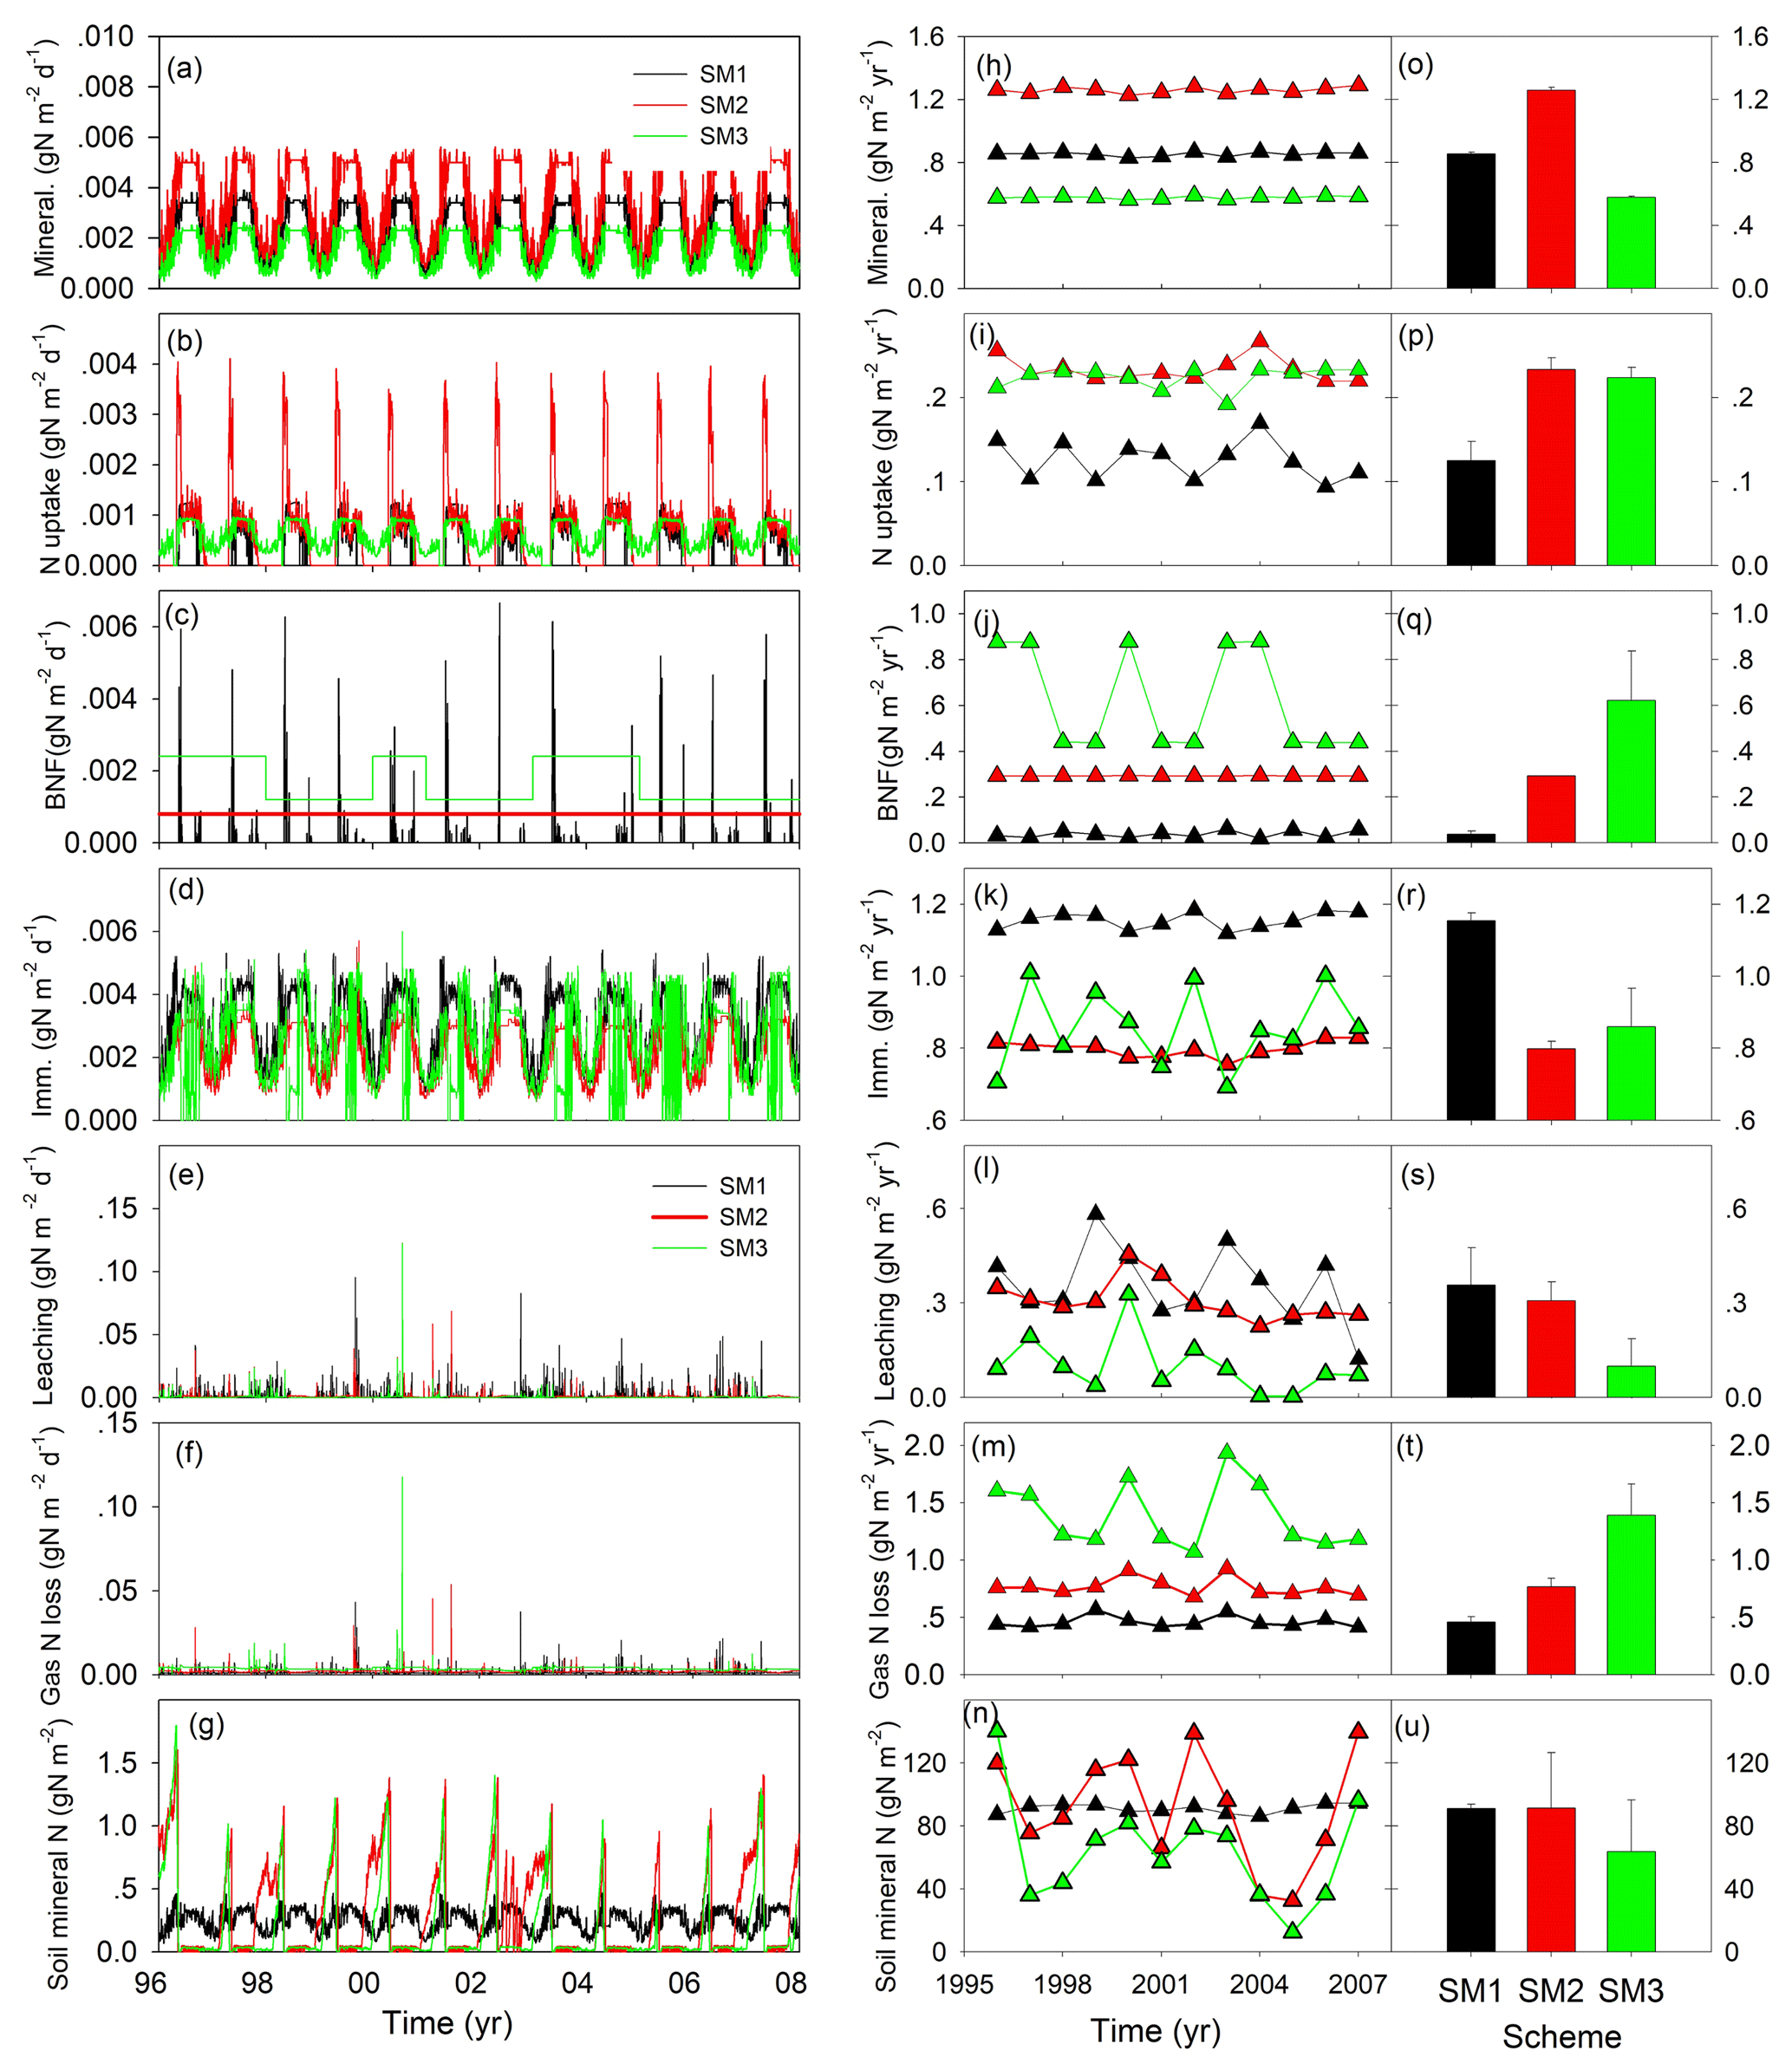
Figure 3Simulated nitrogen fluxes and soil mineral nitrogen from three carbon–nitrogen coupling schemes (SM1, SM2, and SM3) in the TECO-CN model for 1996 to 2007 at Duke Forest. Mineral.: mineralization; BNF: biological N fixation; Imm.: immobilization.
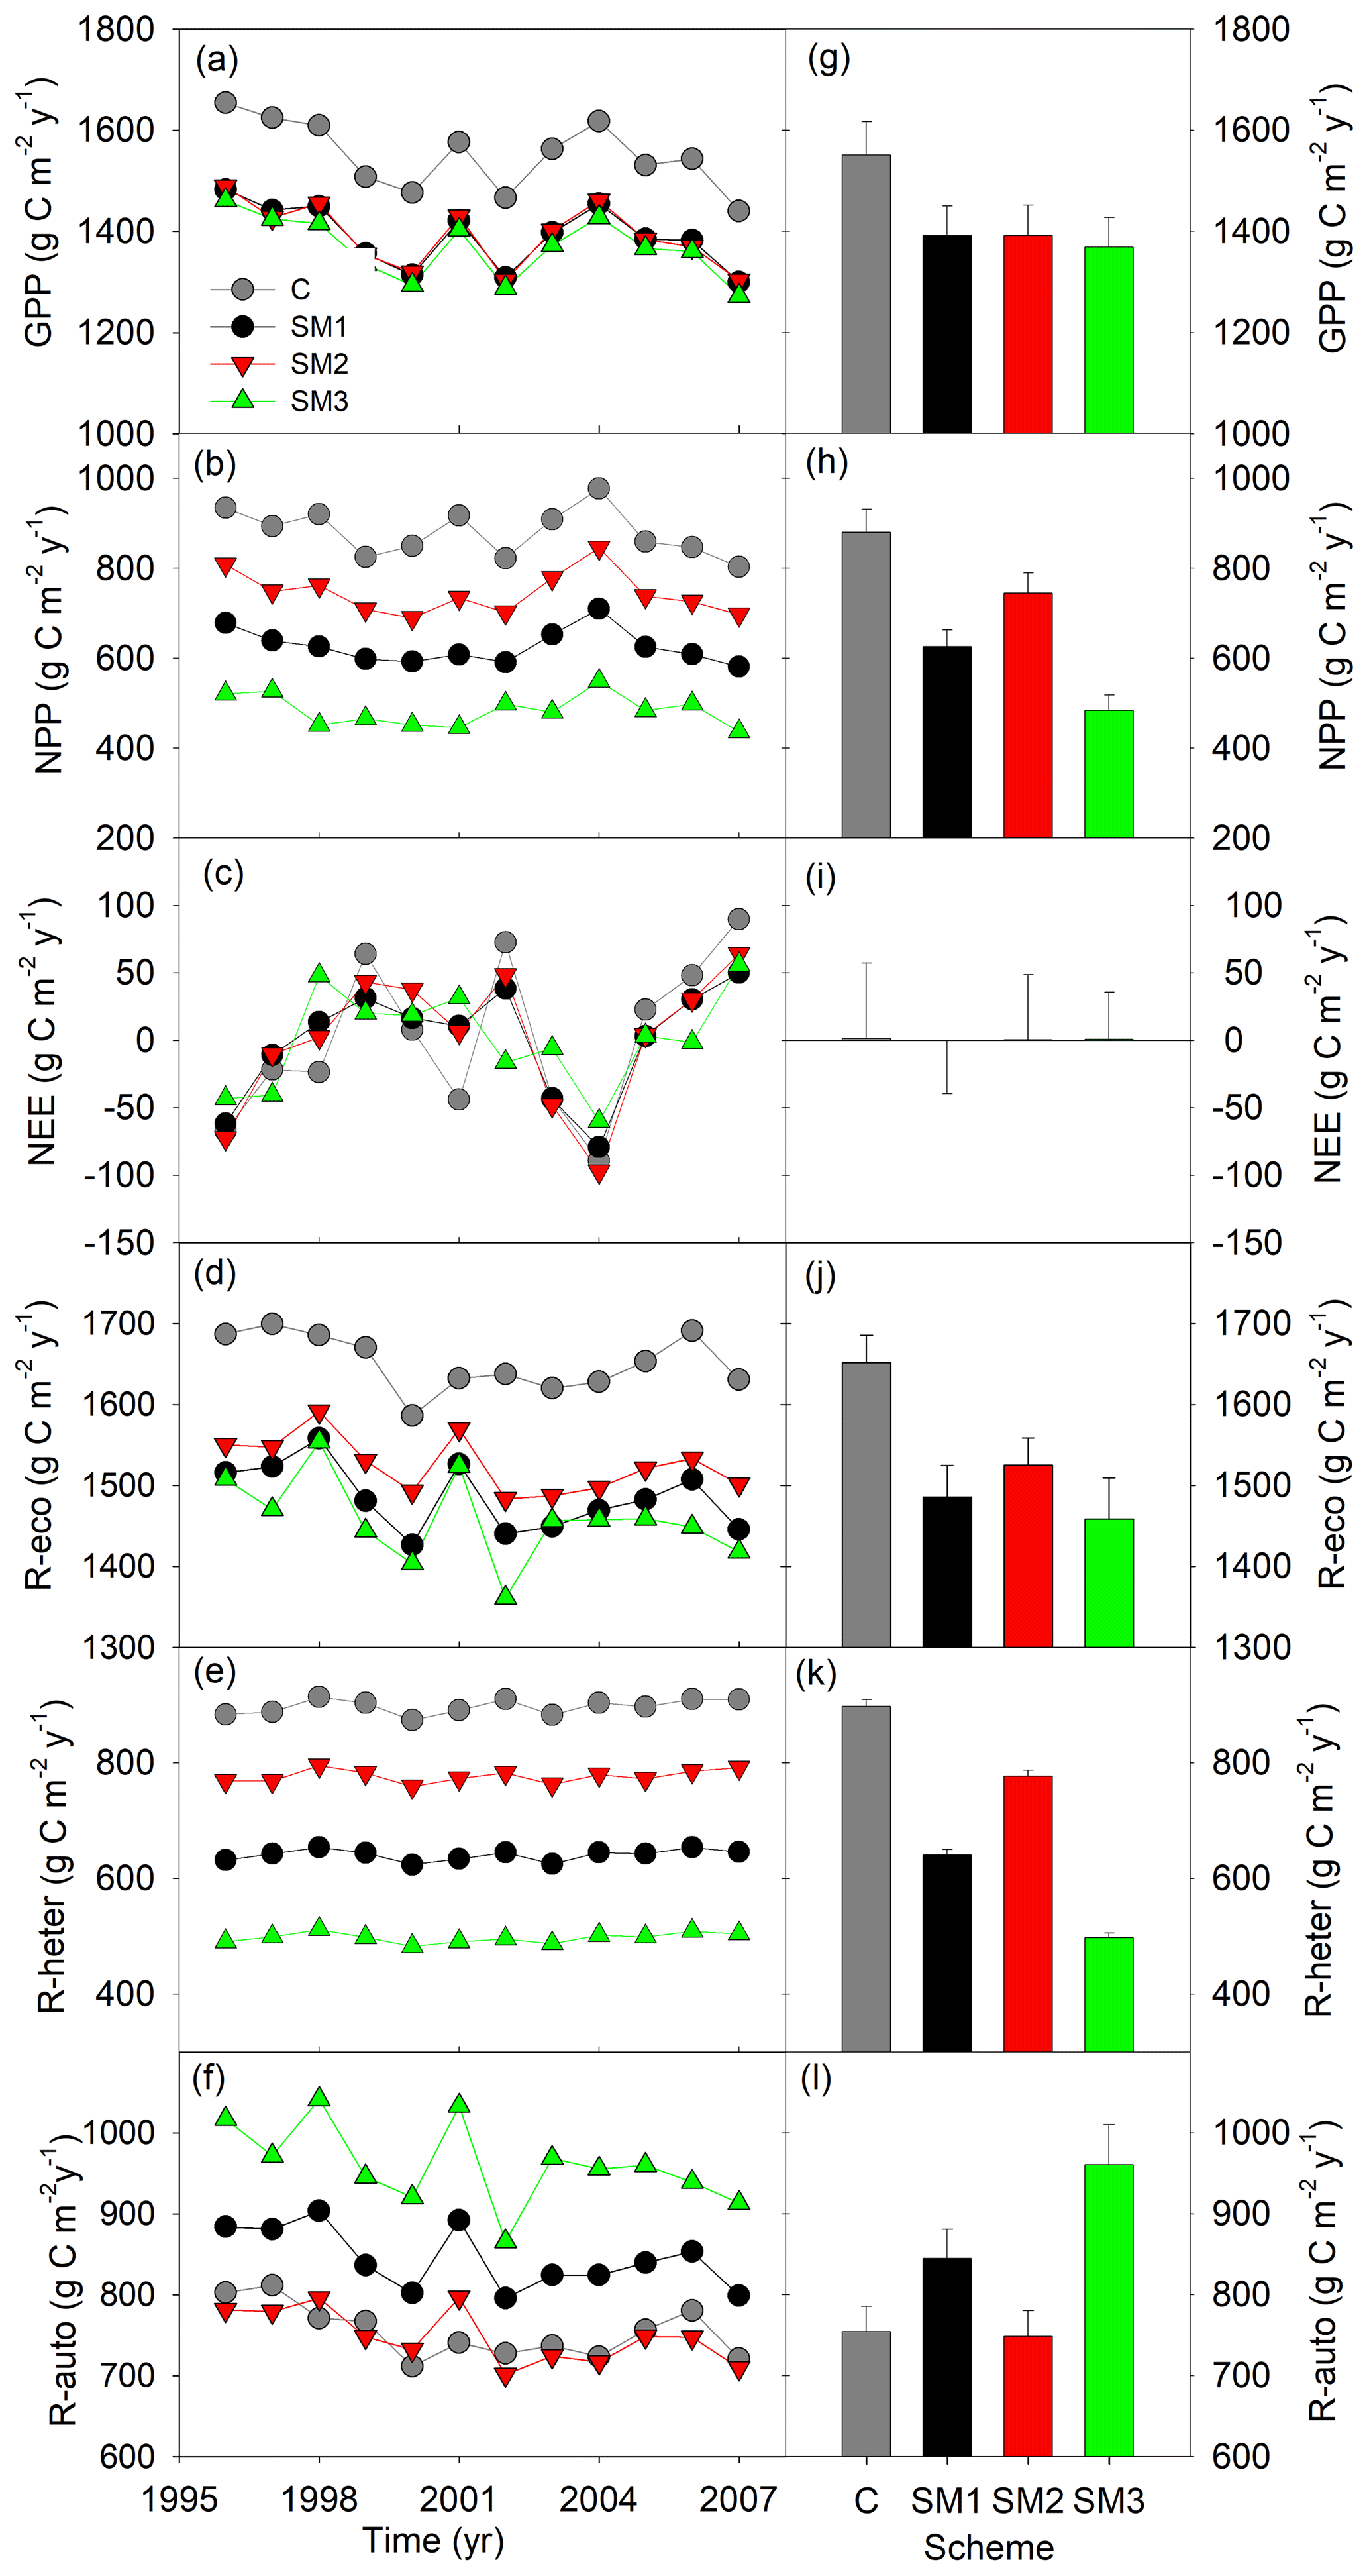
Figure 4Simulated annual (a–f) and mean (g–l) carbon fluxes from the carbon-only version and carbon–nitrogen coupled with three schemes (SM1, SM2, and SM3) of the TECO model for 1996 to 2007 at Duke Forest. GPP: gross primary productivity; NPP: net primary productivity; NEE: net ecosystem exchange of CO2; R-eco: ecosystem respiration; R-heter: heterotrophic respiration; R-auto: autotrophic respiration.
3.1 Simulations of C and N dynamics at steady state
At the steady state, the dynamics of N fluxes and soil mineral N showed different patterns among three C–N schemes in the TECO model (Fig. 3). The simulated soil N mineralization and plant N uptake fluxes in SM2 displayed the largest daily variation (1.5 and 0.86 mg N m−2 d−1, respectively) and annual mean values (1.26 and 0.23 g N m−2 yr−1, respectively) among the three C–N schemes. This variation mainly resulted from both the plant N demand and the available N in soil (Fig. 3g). The dynamic of soil mineral N also drove the variation of the N leaching flux, for which SM1 showed the largest daily variation (40 mg N m−2 d−1) and annual mean value (0.36 g N m−2 yr−1). However, the representation of biological N fixation (BNF) as an option when the plant uptake is not enough for growth led to the largest daily variation (28 mg N m−2 d−1) but with the smallest annual value (0.04 g N m−2 yr−1) in SM1 in comparison with the other two C–N schemes. Both the nitrogen balance requirement and the dynamic of soil mineral N resulted in the largest daily variation (1.97 mg N m−2 d−1) and annual value of gaseous N loss (1.39 g N m−2 yr−1) in SM3. The combined effect of the flexible C : N ratio and soil mineral N drove the largest daily variation of N immobilization fluxes (1.3 mg N m−2 d−1) in SM3 and the largest annual mean value (1.15 g N m−2 yr−1) in SM1. The dynamics of soil mineral N in SM2 and SM3 displayed similar patterns of daily and annual dynamics.
Compared with the TECO-C model, the three C–N coupling schemes introduced significant signs of N limitation on forest growth at the steady state but with varying magnitude (Fig. 4). Specifically, the three N schemes caused significant reductions in GPP (10 %, 10 %, and 12 % for SM1, SM2, and SM3, respectively) compared to the C-only TECO model. Similar response patterns were also found for NPP, ecosystem respiration, and heterotrophic respiration. Among the three schemes, SM3 had the strongest effect (45 %, 12 %, and 45 % reduction for NPP, ecosystem respiration, and heterotrophic respiration, respectively), while SM2 had the weakest effect (15 %, 8 %, and 13 %, respectively), and the effect of SM1 was relatively moderate (29 %, 10 %, and 29 %, respectively). However, by comparison with the TECO-C version, both the SM1 and SM3 schemes increased the autotrophic respiration by 12 % and 27 %, respectively. At or near the steady state, NEE in both TECO-C and the three C–N coupling schemes had similarly mean values (1.37, −0.13, 0.66, and 0.84 g C m−2 yr−1), which were approximately equal to zero but with large variations (56, 39.4, 48.1, and 34.9).
The three C–N coupling schemes induced different effects on C and N stoichiometric status for different pools (Figs. 5 and S2). All three schemes had significant limitation signs on woody and structural litter as well as fast and slow SOM pools but with different magnitudes (Fig. 5a). SM2 had the highest C sizes for the roots (731.8 g C m−2) and metabolic litter (1252.1 g C m−2), while SM1 had the highest C size for passive SOM pool (4249.5 g C m−2). SM2 had a constant C : N ratio for all the displaying pools (Fig. 5b), while the C : N ratios for the three displaying pools (leaf, root, and structural litter) had no significant change in SM1 and SM3. As for both woody and metabolic litter pools, SM1 and SM3 had higher C : N ratios (357.2 and 357.9, respectively) compared with SM2 (354). SM1 had the lowest C : N ratio (4.6) for the soil passive SOM pool among the three schemes.
The divergent effects of the three C–N schemes on plant N uptake (Fig. 3), autotrophic respiration, and NPP (Fig. 4) lead to different N use efficiency (NUE) and carbon use efficiency (CUE) (Fig. 6). SM1 had the highest NUE (159.1 g C g−1 N), mainly resulting from its low plant N uptake. In contrast, SM3 had the lowest NUE (67.3 g C g−1 N) as a result of its small NPP. Because of the hypothesis of N uptake for free (whereby nitrogen uptake does not require the expenditure of energy in the form of carbon), SM2 had the highest CUE (0.54) among the three C–N schemes, which was close to that in the C-only version (0.57). However, SM3 had the lowest CUE (0.35) due to both C cost for plant active N uptake and the assumption that increased respiration removes the excess C.
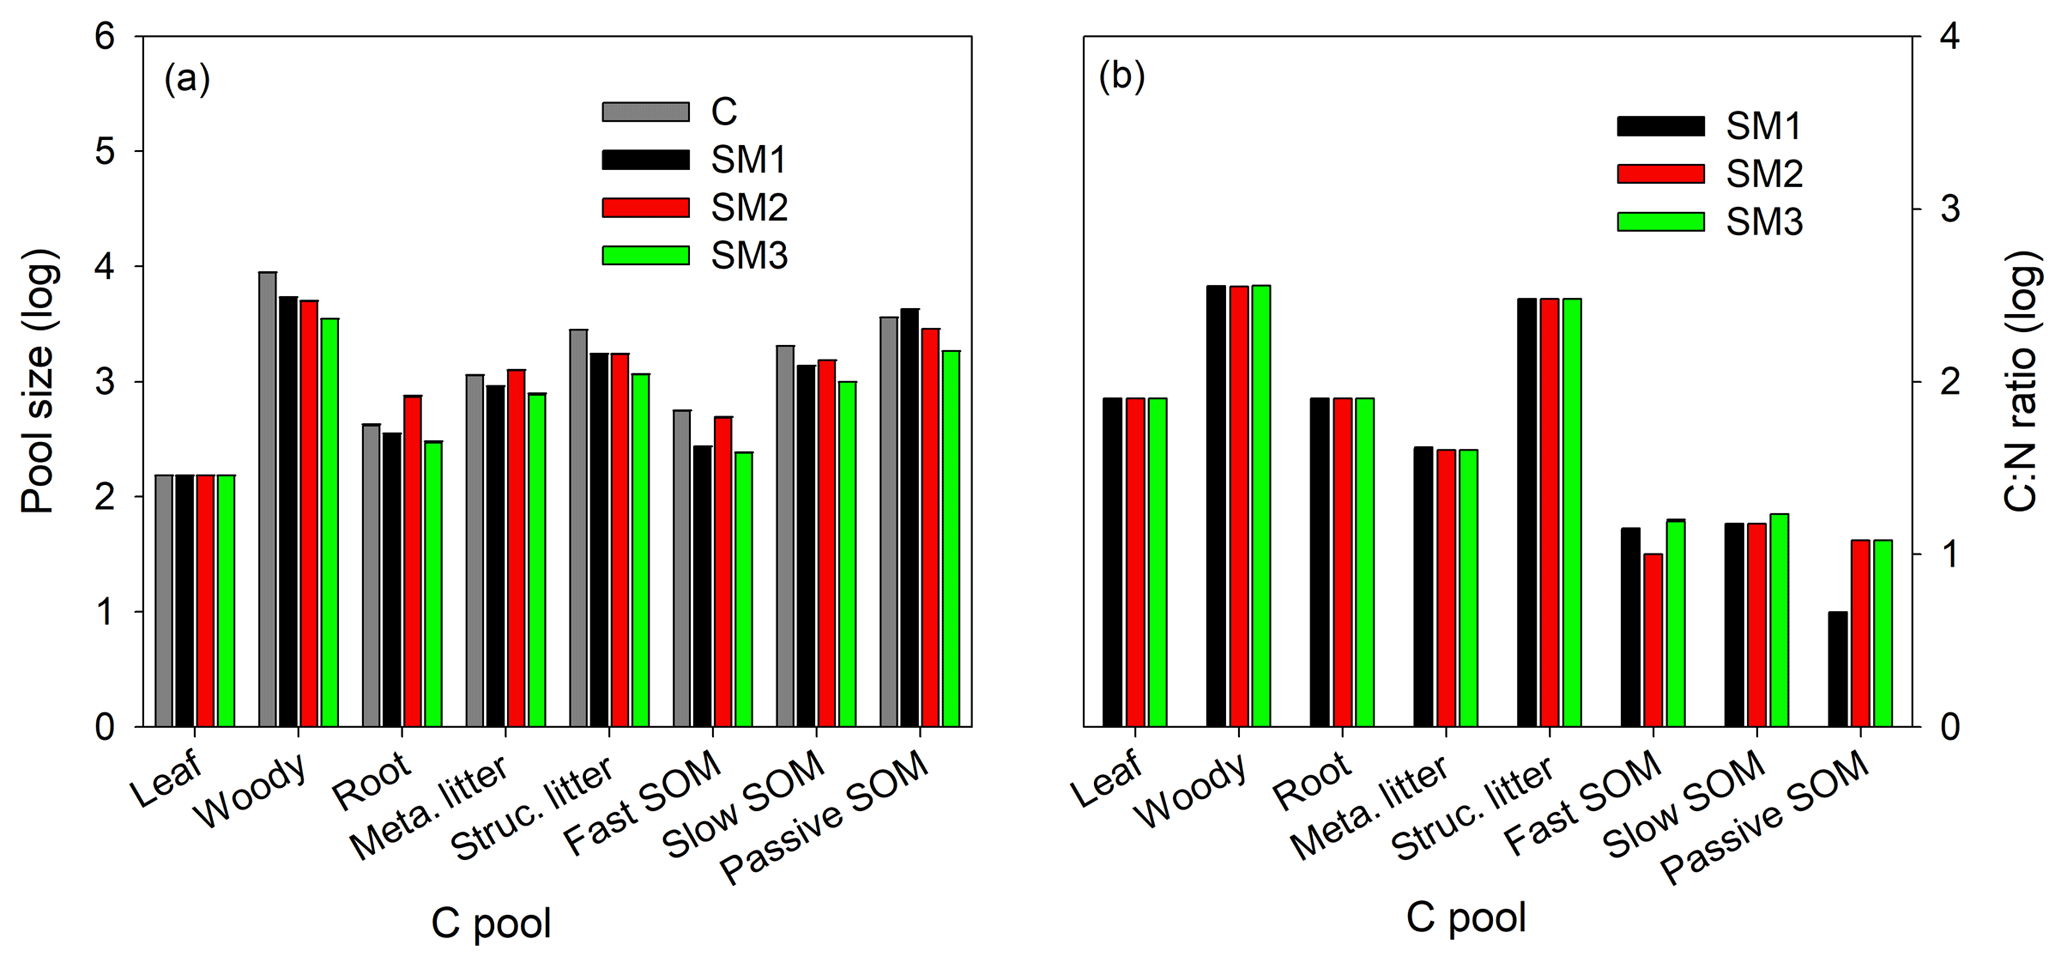
Figure 5The annual average sizes of carbon pools (a) at the steady state during 1996–2007 for the C-only version and the three C–N schemes (SM1, SM2, and SM3), and the C : N ratio (b) of each carbon pool for the three C–N schemes (SM1, SM2, and SM3) in the TECO-CN model.
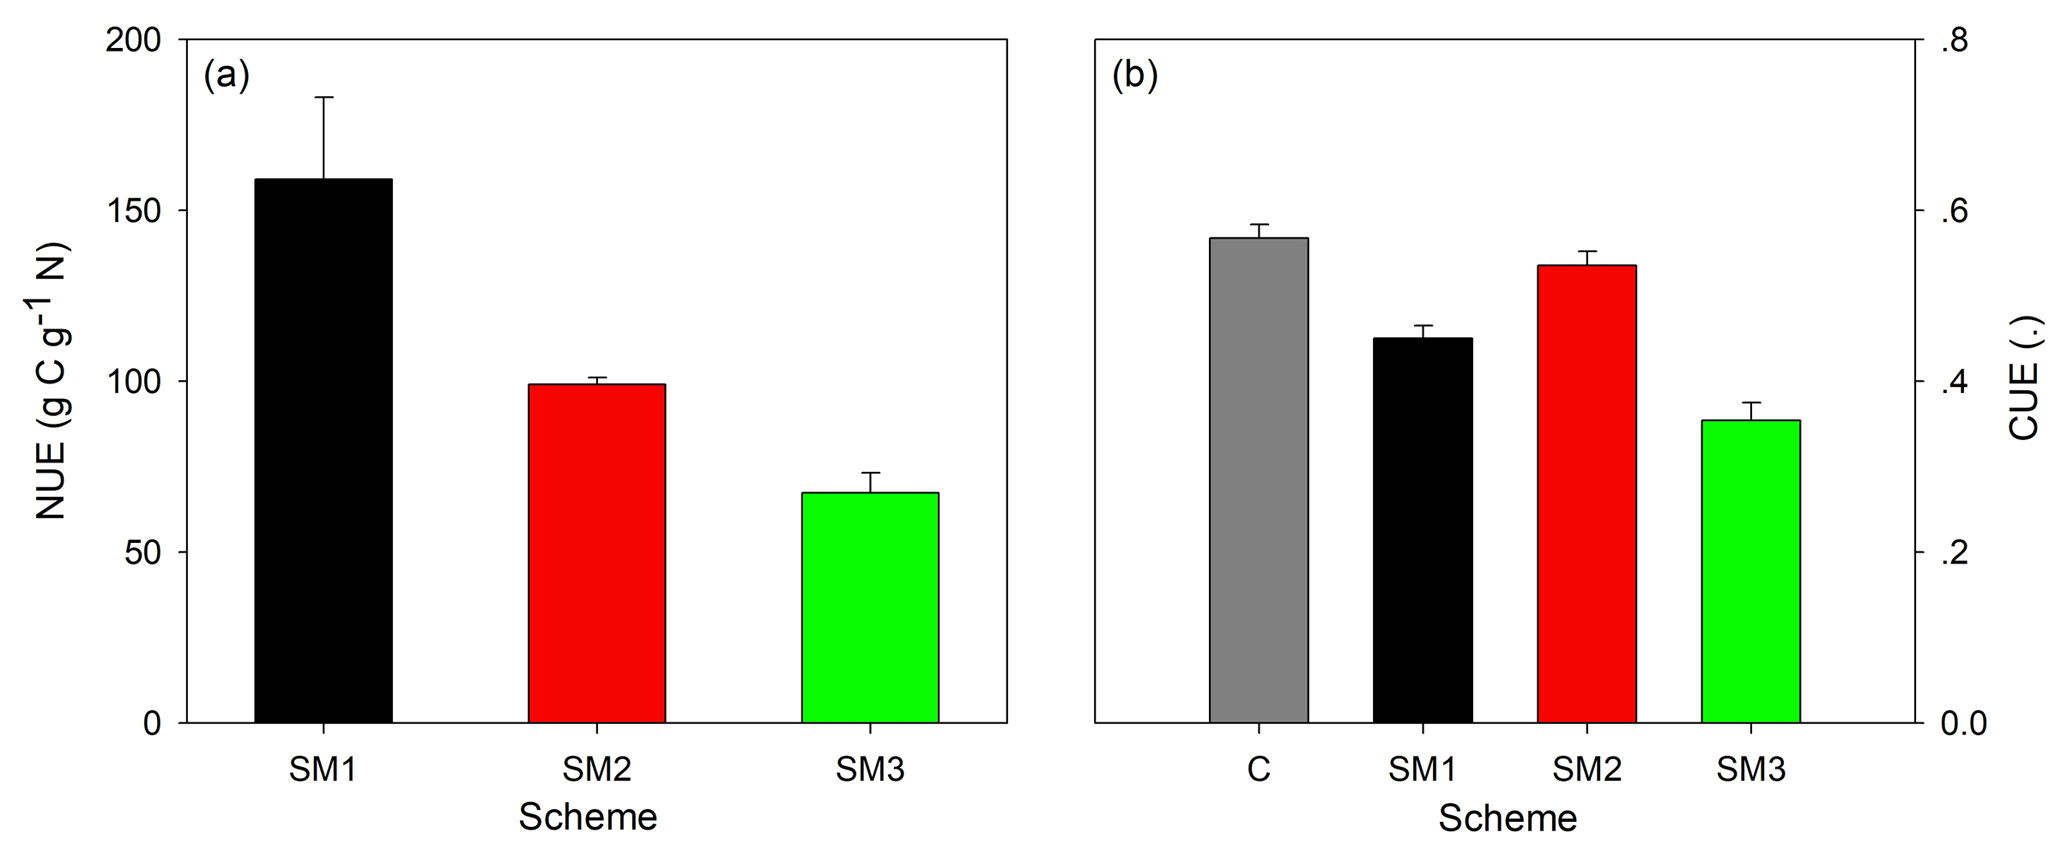
Figure 6The nitrogen use efficiency (NUE, a) in three C–N schemes of the TECO model (SM1, SM2, and SM3) and the carbon use efficiency (CUE, b) at the steady state among the C-only version and the three C–N schemes of the TECO model (SM1, SM2, and SM3).
3.2 Simulation of C storage capacity
The ecosystem C storage capacity also differed greatly among the three C–N coupling schemes and the C-only version of the TECO model (Fig. 7). The C-only version had the largest C storage capacity (19.5 kg C m−2) among the four simulations due to its high NPP (879.9 g C m−2 yr−1). The C storage capacity in SM1 (15.1 kg C m−2) was close to that in SM2 (13.7 kg C m−2). The SM3 had the lowest C storage capacity (8.9 kg C m−2) among the four simulations as a result of its small NPP (483.9 g C m−2 yr−1) and relatively short MRT (18.6 years). By comparison with the C-only version, the three C–N schemes all induced different reductions in NPP (−29 %, −15 %, and −45 % for SM1, SM2, and SM3, respectively) and further reduced their ecosystem C storage capacity. For the MRT, SM1 exhibited positive effects (+9 %) relative to the C-only version, while the other two schemes induced negative ones (i.e., −16.9 % in SM2 and −16.7 % in SM3).
3.3 Ecosystem C residence time
Ecosystem C residence time (τE) is collectively determined by baseline residence time, N scalar, and environmental scalars as shown in Eq. (31). Specifically, differences in τE among the three C–N coupling schemes and the C-only TECO model are determined by baseline residence time and the effects of the N scalar on eight plant C pools (Fig. 8). For example, SM1 had the longest τE because the N scalar had very strong control of passive SOM. The baseline residence time was further determined by C allocation (Fig. 9). Overall, compared with the C-only version, the additional N processes enhanced the partitioning coefficient of NPP to roots (33 %, 82 %, and 53 % for SM1, SM2, and SM3, respectively) but decreased the partitioning coefficient to wood (−25 %, −45 %, and −34 %, respectively). Furthermore, the decreased partitioning coefficient to wood regulated the variations of the baseline residence time of wood, structural litter, and slow and passive SOM. However, the increased partitioning coefficient to roots determined the variations of the baseline residence time of roots and metabolic litter.

Figure 7Simulation of annual ecosystem carbon storage capacity for 1996 to 2006 at Duke Forest by carbon in flux (NPP, x axis) and ecosystem residence time (τE, y axis) in the TECO model framework with three carbon–nitrogen coupling schemes (SM1, SM2, and SM3) and in the TECO C-only model (C). (a) Ecosystem carbon residence time (τE) in SM1, SM2, SM3, and the C-only model; (b) mean ecosystem carbon storage simulated among SM1, SM2, SM3, and the C-only model; (c) relative change in NPP and ecosystem residence time simulated among the three schemes compared with the C-only model.
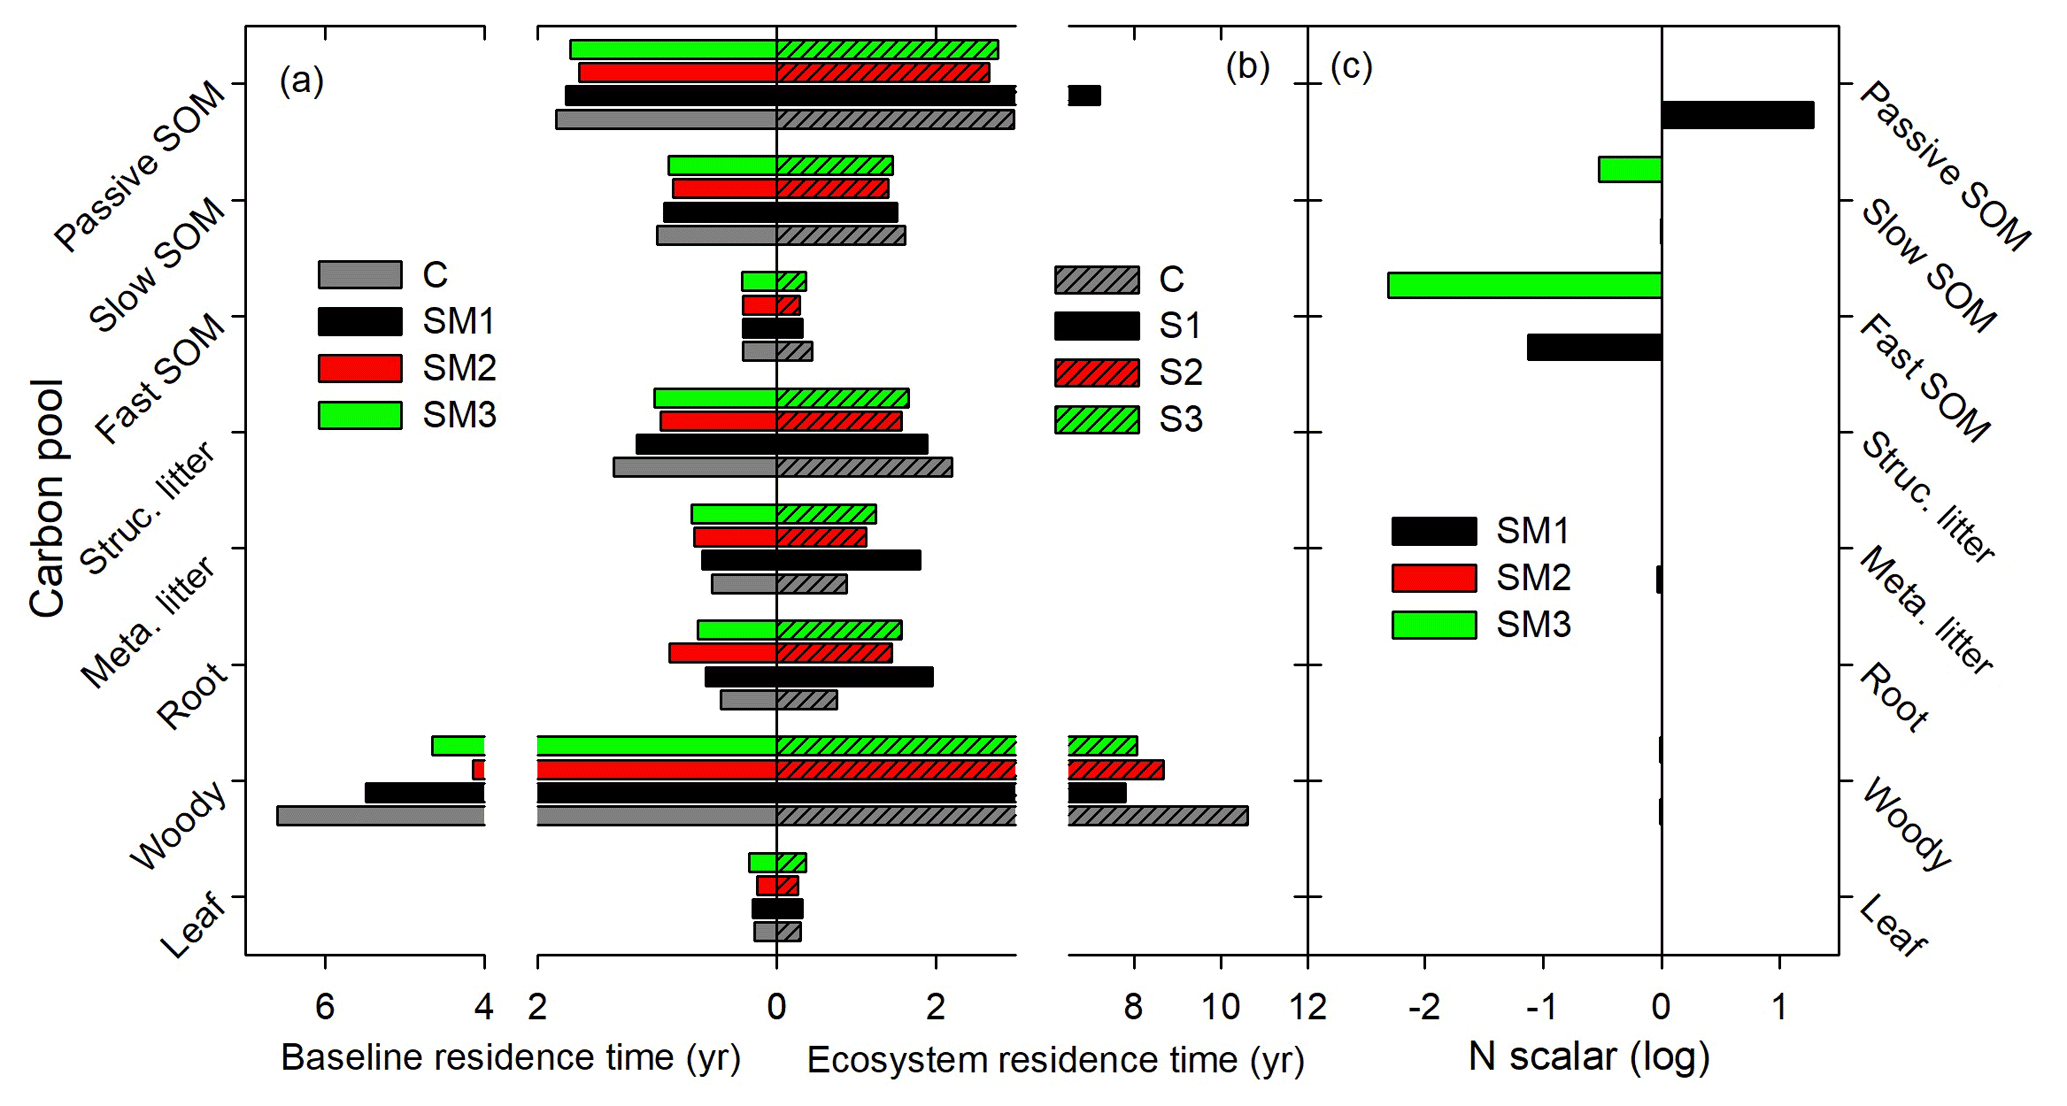
Figure 8Determination of carbon-pool residence times based on traceability framework in the TECO C–N model with three C–N coupling schemes (SM1, SM2, and SM3) and the TECO C-only model (C). (a) Baseline residence time, (b) mean residence time, and (c) nitrogen scalar.
3.4 Sensitivity of N processes to NPP and MRT
For either NPP or MRT, the N processes had different sensitivities among the three C–N schemes of the TECO model (Fig. 10). For NPP, plant C : N ratio had the highest sensitivities in both SM1 (0.32) and SM2 (0.53). However, the plant N uptake in SM3 had the highest sensitivity (0.87) for NPP. For MRT, competition between plants and microbes, downregulation of photosynthesis, and plant C : N had the highest sensitivities in SM1 (0.27), SM2 (0.19), and SM3 (0.56), respectively. As the NPP and MRT jointly determined the ecosystem C storage capacity, the plant tissue C : N ratio, downregulation of photosynthesis, and plant N uptake had the highest sensitivities for the ecosystem C storage capacity in SM1 (0.06), SM2 (0.09), and SM3 (0.26), respectively.
4.1 Underlying N processes and plant production
Gross or net primary production (i.e., GPP or NPP) is regulated by the amount of N availability for plant growth through the N demand, which is set by the relative proportion of biomass growth in the different plant components and their C : N stoichiometry (Zaehle et al., 2014; Thomas et al., 2015). The limitation of equilibrium N on plant production reflects the effects of multiple processes in the C–N interaction, mainly including downregulation of photosynthetic capacity by N availability, the ecosystem's balance of N inputs and losses (i.e., net ecosystem N exchange), plant N uptake, soil N mineralization, and the C : N stoichiometry of vegetation and soils. However, due to a lack of consensus on the nature of the mechanisms, the representation of these processes varies greatly among diverse models (Zaehle et al., 2014).
There are two common alternative assumptions for the downregulation of photosynthesis that have been implemented in models: (1) the change in photosynthetic capacity is directly associated with the magnitude of plant-available N (e.g., SM2), and (2) N limitation is associated with foliage N, which feeds back to limit photosynthetic capacity (e.g., SM1 and SM3). Our results showed that both assumptions had significant limitations with similar effects on GPP (Fig. 4a, g). The probable reason is that the TECO model calculates photosynthesis by light availability and the carboxylation rate based on the Farquhar model (Farquhar et al., 1980). The effects of N stress under the TECO framework, either associated with plant-available N or associated with foliage N concentration, are estimated according to limiting factors of photosynthetic biochemistry (the maximum rate of carboxylation, , and the maximum rate of electron transport at saturating irradiance, Jmax). The two assumptions of downregulation of photosynthesis may have different time-dependent effects on GPP in nonsteady-state systems (Xu et al., 2012; Walker et al., 2017).
At or near the steady state, net ecosystem N exchange is driven by the processes of N input via deposition and fixation and N loss via leaching and volatilization (Zaehle et al., 2014; Thomas et al., 2015). Previous studies have stated that analyzing the steady-state condition is useful to understand N effects because the balance between external N sources and N losses determines whether an ecosystem is N limited (Rastetter et al., 1997; Menge et al., 2009; Thomas et al., 2015). In this study, divergent NPP responses among the three schemes might partly result from their different representations of BNF (Figs. 3 and 10). Specifically, SM2 and SM3 simulated BNF explicitly, which used modified empirical relationships of BNF with NPP and evapotranspiration (ET), respectively (Cleveland et al., 1999). These phenomenological relationships generally captured biogeographical observations of higher rates of BNF in humid environments with high solar radiation (Wieder et al., 2015a). However, the highest response of NPP in only ET-driven BNF (i.e., SM3) may illustrate that not only energetic but also C costs of “fixing” atmospheric dinitrogen (N2) into a biologically usable form (NH3) broadly affect NPP (Gutschick, 1981; Rastetter et al., 2001). This was because SM3 considered C investments in BNF, while SM2 did not. By contrast, for the nonsteady state, the NPP-driven BNF creates a positive feedback between BNF and NPP, possibly causing a large impact on C dynamics and terrestrial C storage (Wieder et al., 2015a). On the other hand, SM1 applied a different strategy, which set BNF as an option when the plant N uptake is not enough for growth in terms of C investment, leading to the highest plant NUE (Fig. 6a) but a lower response of BNF to NPP (Fig. 10a). Another driving factor of the net ecosystem N exchange is N loss, which depends on the rate of leaching and volatilization. In this study, using the same formulation in proportion to the size of the soil mineral N pool among the three schemes, the different annual mean magnitude of N leaching was more correlated with soil mineral N. In the original CLM4.5 and O-CN (Oleson et al., 2013; Zaehle et al., 2010), the soil mineral N pool is divided into two pools (ammonium and nitrate). The N leaching is only valid on the nitrate pool, while the ammonium pool is assumed to be unaffected by leaching. This hypothesis may reduce the correlation between leaching and total soil mineral N.

Figure 9Coefficients for the partitioning of NPP to nonstructural C (NSC), root, woody, and leaf in the C-only model (C) and the C–N coupling model with three schemes (SM1, SM2, and SM3).
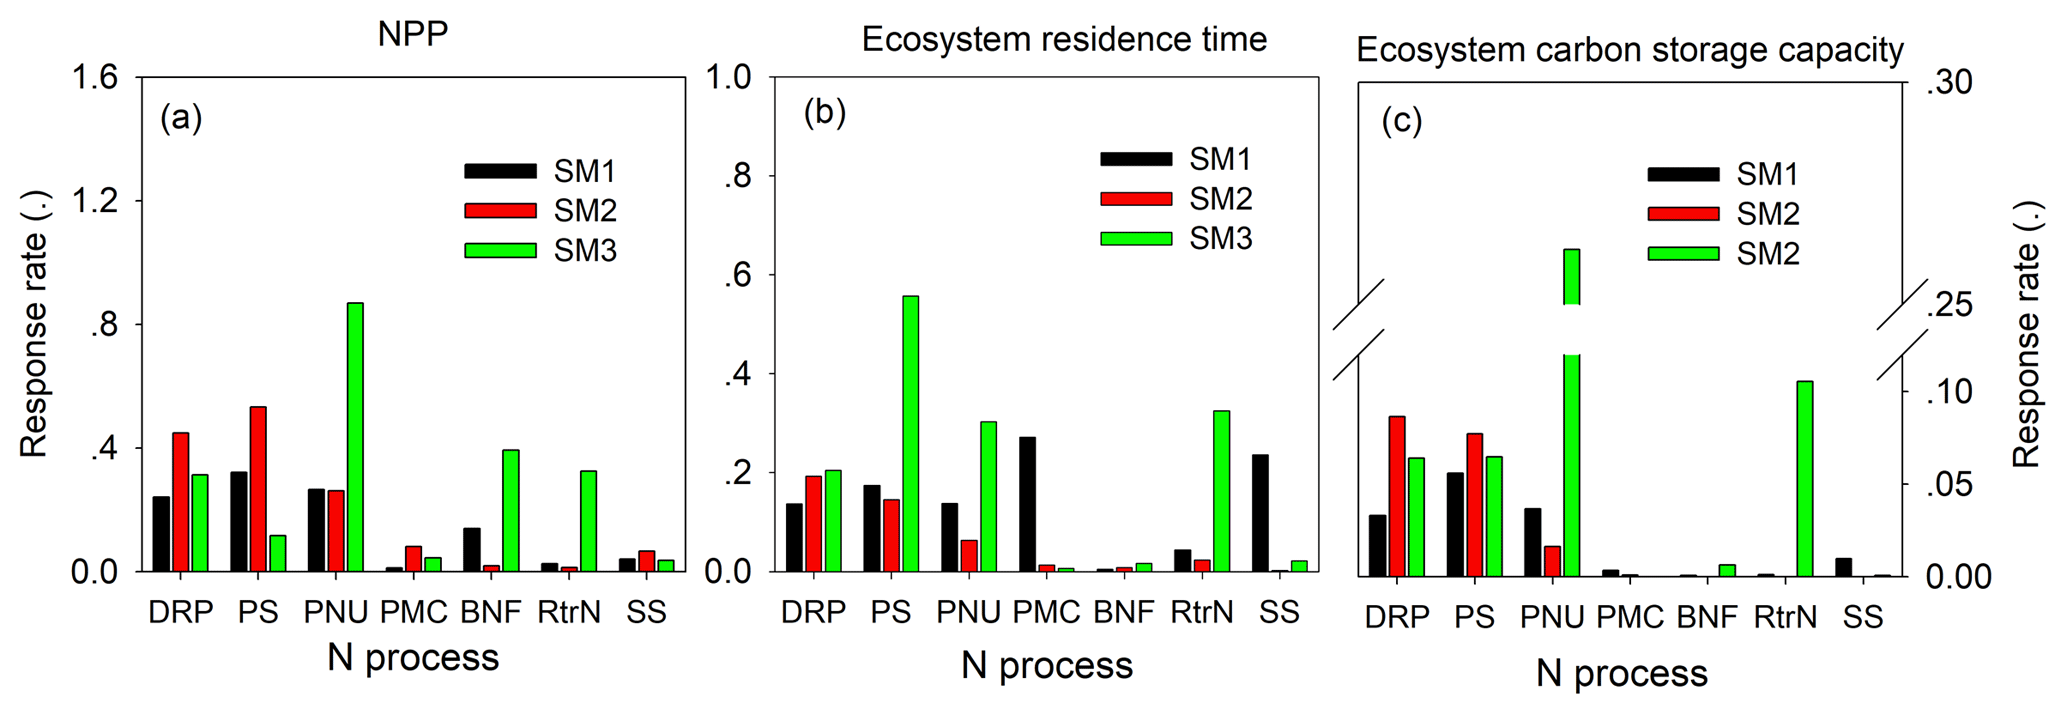
Figure 10The sensitivity of nitrogen processes to NPP (a), ecosystem residence time (τE, b), and ecosystem C storage capacity (c) among three carbon–nitrogen coupling schemes (SM1, SM2, and SM3). DRP: downregulation of photosynthesis; PS: plant tissue C : N ratio; PNU: plant N uptake; PMC: plant and microbe competition; BNF: biological N fixation; RtrN: retranslocation N; SS: soil pool C : N ratio.
The processes of plant N uptake and net N mineralization determine how N moves through the plant–soil system, thereby triggering N limitation on plant growth and C storage capacity (Fig. 10). However, to our knowledge, exploring those processes exactly in models is limited by inadequate representation of aboveground and belowground interactions that control the patterns of N allocation and whole-plant stoichiometry (Zaehle et al., 2014; Thomas et al., 2015). Plant tissue, litter, and SOM are the primary sinks of N in terrestrial ecosystems, while N in these forms is not directly available for plant uptake, leading to an increase in N demand for plant growth. This N must turn over to become available for plant uptake. Therefore, the time for N to stay in these unavailable pools controls the transactional delay between the incorporation of N into the plant unavailable pool and becomes available for plant uptake. In this way, the residence time of N in SOM appears to be an important factor for governing plant growth. This N limitation mainly occurs in nonsteady state because the accumulation of N in slow-turnover-rate SOM pools reduces the N available for plant uptake (Thomas et al., 2015). At or near steady state, however, the sequestration of N in SOM mainly affects the C residence time (Figs. 8 and 10b). In this study, the different NUE among the three C–N schemes is induced by different mechanisms. SM1 had the highest NUE due to the combined effects of plant N uptake based on C investment strategy (as described above) and flexible tissue C : N ratio. Nitrogen stress increased the tissue C : N ratio (Fig. 5b), leading to a high microbial N immobilization and then a lower net N mineralization (Fig. 3), which allowed for plant cell construction with a lower N requirement. However, this was not the case for SM3 since both hypotheses of increasing respiration to remove the excess C under N stress and the higher C investment for the BNF lead to the decrease in C input and then limits the microbial immobilization for the passive SOM pool. The inclusion of flexible C : N stoichiometry appeared to be an important feature allowing models to capture responses of the ecosystem C storage capacity to climate variability through adjusting the C : N ratio of nonphotosynthetic tissues or the whole-plant allocation among tissues (Figs. 9 and 10) with different C : N ratios (Zaehle and Friend, 2010).
4.2 Ecosystem N status and C residence time
Ecosystem N status in models, including plant-available and unavailable N forms, is set by N inputs from N fixation and N deposition, N losses from leaching and denitrification, and N gain from the turnover of litter and SOM through tissue senescence and decomposition. As noted above, the external N cycle (i.e., N inputs and N losses) couples the N processes within the plant–litter–SOM system, being mainly associated with the limitation of plant production (Vitousek, 2004; Vicca et al., 2012; Craine et al., 2015). The effects of ecosystem N status on C mean residence time (MRT), however, has been much less studied than N limitation on the productivity of plants and soil organisms because these effects involve various impacts on C transfer among pools and C release from each pool via decomposition and respiration (Thompson and Randerson, 1999; Xia et al., 2013). Therefore, the different impacts of ecosystem N status induce oscillating N limitation on MRT (Figs. 8 and 10) due to the inherently different assumptions of C–N interactions among the three C–N coupling schemes (Zhou et al., 2012; Shi et al., 2018).
At the steady state, the different effects of N status on changes in modeled MRT can be attributed to the different rate of soil N mineralization dependent on the total amount of N in SOM and its turnover time, immobilization based on the competition strategy between plants and microbes and their stoichiometry, and different deployment of reabsorbed N. The traceability framework in this study can trace those different effects into three components (i.e., climate forcing, N scalar ξN, and baseline MRT) based on three alternative C–N coupling schemes under the TECO model framework. Since the forcing data are identical, we assumed the same effects for this component in all four experiments.
In our study, the N scalar (ξN) was based on the dynamics of C : N ratios (Eq. 34). Therefore, the N scalar had no effect on MRT in SM2, resulting from the assumption of a fixed C : N ratio in all C pools (Figs. 5b and 8c). In both SM1 and SM3, however, the N scalar had large effects on the SOM pool, which is probably related to different mechanisms. Specifically, the N scalar in SM1 had contrasting effects on MRT of fast and passive SOM pools (i.e., negative vs. positive, respectively), which may largely be attributed to the plant and microbe competition strategy combining with a much larger passive SOM pool in the TECO-CN model (Du et al., 2017; Zhu et al., 2017). Under N stress, the competition between plants and microbes is expected to be intensified, resulting in an increasing C : N ratio of nonphotosynthetic tissues (e.g., wood and root) and the vegetation C : N ratio. This effectively prevents N limitation of cell construction and corresponds to an increase in whole-plant NUE (Thomas et al., 2015). In this case, the higher C : N ratio in those tissues lowers structural litter quality, leading soil microbes to immobilize more N to maintain their stoichiometric balance (Hu et al., 2001; Manzoni et al., 2010). However, in SM3, increased respiration acted as a mechanism to remove the excess C, which is a stoichiometry-based implementation to prevent the accumulation of labile C to prevent the accumulation of C beyond the storage capacity under N stress (Zaehle and Friend, 2010; Thomas et al., 2015). This mechanism promotes the respiration of faster-turnover pools (fast and slow SOM pools; Fig. 5a), leading to an increased C : N ratio and decreased MRT in these two pools (Fig. 8).
In the traceability framework, the baseline MRT is determined by the potential decomposition rates of C pools (C matrix), coefficients for the C partitioning of NPP (B vector), and transfer coefficients between C pools (A matrix, Eq. 30; Xia et al., 2013). The matrices A and C are preset in the TECO model according to vegetation characteristics and soil texture (Weng and Luo, 2008). Therefore, the notable spread in baseline MRT across the C–N schemes was induced by the B vector, which was modified by different N limitation assumptions (Eqs. 1–6). Conceptually, in order to meet the N demand, plants adjust NPP allocation to N absorption tissues (e.g., roots). In this study, the three schemes all had similar trends of adjusting C allocation from wood to roots (Fig. 9), but with different mechanisms. For both SM1 and SM3, increased root C allocation was mainly driven by N uptake capacity, which is associated with plant competitiveness in SM1 (Fig. 10b) and the respiration of excess labile C in SM3 (Figs. 4f, l, and 10b). However, for SM2, increasing root C allocation may occur in the spin-up stage from plant adjustment to whole-plant allocation among tissues to fit a fixed C : N ratio.
C–N coupling has been represented in ecosystem and land surface models with different schemes, generating great uncertainties in model predictions. The most difference among terrestrial C–N coupling models occurs with the degree of flexibility of the C : N ratio in vegetation and soils, plant N uptake strategies, downregulation of photosynthesis, and the representations of the pathways of N import. In this study, we evaluated alternative representations of C–N interactions and their impacts on the C cycle using the TECO model framework. Our traceability analysis showed that the different representations of C–N coupling processes lead to divergent simulations of plant production, C residence time, and thus the ecosystem C storage capacity. Plant production is mainly affected by the different assumptions on net ecosystem N exchange, plant N uptake, net N mineralization, and the C : N ratio of vegetation and soil. In comparison, alternative representations of plant and microbe competition strategy and plant N uptake, combined with the flexible C : N ratio in vegetation and soils, led to notable spread effects on C residence time. Overall, the downregulation of photosynthesis, plant tissue C : N ratio, plant N uptake, and N retranslocation are the dominant processes of ecosystem C storage capacity. Identifying representations of the main C–N processes under different schemes can help us improve the N limitation assumptions employed in terrestrial ecosystem models and forecast future C sinks in response to climate change.
The code for TECO-CN and the three C–N coupling schemes is available at https://github.com/zgdu/TECO-CN-2.0-new (last access: 20 April 2018) (Du et al., 2018).
The data for this paper are available upon request to the corresponding authors.
The supplement related to this article is available online at: https://doi.org/10.5194/gmd-11-4399-2018-supplement.
ZD, JX, and XZ designed the study. ZD and EW wrote the code. ZD performed the experiments. ZD wrote the paper with contributions from all coauthors.
The authors declare that they have no conflict of interest.
This work was financially supported by the National Key R&D Program of
China (2017YFA0604600), the National Natural Science Foundation of China
(31770559, 31722009, 41630528), National 1000 Young Talents Program of China,
and the Fundamental Research Funds for Central Universities. Zhenggang Du
also thanks the China Scholarship Council (201606140130) for scholarship
support.
Edited by: Tomomichi Kato
Reviewed by: Will Wieder and one anonymous referee
Ahlström, A., Xia, J., Arneth, A., Luo, Y., and Smith, B.: Importance of vegetation dynamics for future terrestrial carbon cycling, Environ. Res. Lett., 10, 089501, https://doi.org/10.1088/1748-9326/10/8/089501, 2015.
Arora, V., Boer, G., Friedlingstein, P., Eby, M., Jones, C., Christian, J., Bonan, G., Bopp, L., Brovkin, V., Cadule, P., and Hajima, T.: Carbon–concentration and carbon–climate feedbacks in CMIP5 Earth system models, J. Climate, 26, 5289–5314, 2013.
Cleveland, C., Townsend, A., Schimel, D., Fisher, H., Howarth, R., Hedin, L., Perakis, S., Latty, E., Von Fischer, J., Elseroad, A., and Wasson, M.: Global patterns of terrestrial biological nitrogen (N2) fixation in natural ecosystems, Global Biogeochem. Cy., 13, 623–645, 1999.
Cleveland, C., Houlton, B., Smith, W., Marklein, A., Reed, S., Parton, W., Del Grosso, S., and Running, S.: Patterns of new versus recycled primary production in the terrestrial biosphere, P. Natl. Acad. Sci. USA, 110, 12733–12737, 2013.
Craine, J., Brookshire, E., Cramer, M., Hasselquist, N., Koba, K., Marin-Spiotta, E., and Wang, L.: Ecological interpretations of nitrogen isotope ratios of terrestrial plants and soils, Plant Soil, 396, 1–26, 2015.
Denison, R. and Loomis, R.: An integrative physiological model of alfalfa growth and development, Publication/University of California, Division of Agriculture and Natural Resources, USA, 1989.
Du, Z., Zhou, X., Shao, J., Yu, G., Wang, H., Zhai, D., Xia, J., and Luo, Y.: Quantifying uncertainties from additional nitrogen data and processes in a terrestrial ecosystem model with Bayesian probabilistic inversion, J. Adv. Model. Earth Sy., 9, 548–565, 2017.
Du, Z., Weng, E., Jiang, L., Luo, Y., Xia, J., and Zhou X.: zgdu/TECO-CN-2.0, https://github.com/zgdu/TECO-CN-2.0-new, last access: 20 April 2018.
Farquhar, G., Caemmerer, S., and Berry, J.: A biochemical model of photosynthetic CO2 assimilation in leaves of C3 species, Planta, 149, 78–90, 1980.
Field, C. H. and Mooney, H. A.: Photosynthesis–nitrogen relationship in wild plants, in: On the Economy of Plant Form and Function, edited by: Givnish, T. J., Cambridge University Press, Cambridge, UK, 25–55, 1986.
Finzi, A., Norby, R., Calfapietra, C., Gallet-Budynek, A., Gielen, B., Holmes, W., Hoosbeek, M., Iversen, C., Jackson, R., Kubiske, M., and Ledford, J.: Increases in nitrogen uptake rather than nitrogen-use efficiency support higher rates of temperate forest productivity under elevated CO2, P. Natl. Acad. Sci. USA, 104, 14014–14019, 2007.
García-Palacios, P., Maestre, F., Kattge, J., and Wall, D.: Climate and litter quality differently modulate the effects of soil fauna on litter decomposition across biomes, Ecol. Lett., 16, 1045–1053, 2013.
Gerber, S., Hedin, L., Oppenheimer, M., Pacala, S., and Shevliakova, E.: Nitrogen cycling and feedbacks in a global dynamic land model, Global Biogeochem. Cy., 24, GB1001, https://doi.org/10.1029/2008GB003336, 2010.
Gutschick, V.: Evolved strategies of nitrogen acquisition by plants, Am. Nat., 118, 607–637, 1981.
Hu, S., Chapin, F. S., Firestone, M. K., Field, C. B., and Chiariello, N. R.: Nitrogen limitation of microbial decomposition in a grassland under elevated CO2, Nature, 409, 188–191, 2001.
Huang, Y., Lu, X., Shi, Z., Lawrence, D., Koven, C., Xia, J., Du, Z., Kluzek, E., and Luo, Y.: Matrix approach to land carbon cycle modeling: A case study with the Community Land Model, Glob. Change Biol., 24, 1394–1404, 2018.
Hungate, B. A., Dukes, J. S., Shaw, M. R., Luo, Y., and Field, C. B.: Nitrogen and climate change, Science, 302, 1512–1513, 2003.
Koven, C. D., Riley, W. J., Subin, Z. M., Tang, J. Y., Torn, M. S., Collins, W. D., Bonan, G. B., Lawrence, D. M., and Swenson, S. C.: The effect of vertically resolved soil biogeochemistry and alternate soil C and N models on C dynamics of CLM4, Biogeosciences, 10, 7109–7131, https://doi.org/10.5194/bg-10-7109-2013, 2013.
Kronzucker H., Siddiqi, M., and Glass, A.: Kinetics Of NO3- Influx In Spruce, Plant Physiol., 109, 319–326, 1995.
Kronzucker H., Siddiqi, M., and Glass, A.: Kinetics of influx in spruce, Plant Physiol., 110, 773–779, 1996.
Kuzyakov, Y. and Xu, X.: Competition between roots and microorganisms for nitrogen: mechanisms and ecological relevance, New Phytol., 198, 656–669, 2013.
LeBauer, D. and Treseder, K.: Nitrogen limitation of net primary productivity in terrestrial ecosystems is globally distributed, Ecology, 89, 371–379, 2008.
Lichter, J., Billings, S., Ziegler, S., Gaindh, D., Ryals, R., Finzi, A., Jackson, R., Stemmler, E., and Schlesinger, W.: Soil carbon sequestration in a pine forest after 9 years of atmospheric CO2 enrichment, Glob. Change Biol., 14, 2910–2922, 2008.
Luo Y. and Reynolds J.: Validity of extrapolating field CO2 experiments to predict carbon sequestration in natural ecosystems, Ecology, 80, 1568–1583, 1999.
Luo, Y. and Weng, E.: Dynamic disequilibrium of the terrestrial carbon cycle under global change, Trends Ecol. Evol., 26, 96–104, 2011.
Luo, Y., Meyerhoff, P., and Loomis, R.: Seasonal patterns and vertical distributions of fine roots of alfalfa (Medicago sativa L.), Field Crop. Res., 40, 119–127, 1995.
Luo, Y., White, L., Canadell, J., DeLucia, E., Ellsworth, D., Finzi, A., Lichter J., and Schlesinger, W.: Sustainability of terrestrial carbon sequestration: a case study in Duke Forest with inversion approach, Global Biogeochem. Cy., 17, 1021, https://doi.org/10.1029/2002GB001923, 2003.
Luo, Y., Su, B., Currie, W., Dukes, J., Finzi, A., Hartwig, U., Hungate, B., McMurtrie, R., Oren, R., Parton, W., and Pataki, D.: Progressive nitrogen limitation of ecosystem responses to rising atmospheric carbon dioxide, BioScience, 54, 731–739, 2004.
Luo, Y., Keenan, T., and Smith, M.: Predictability of the terrestrial carbon cycle, Glob. Change Biol., 21, 1737–1751, 2015.
Manzoni, S., Trofymow, J. A., Jackson, R. B., and Porporato, A.: Stoichiometric controls on carbon, nitrogen, and phosphorus dynamics in decomposing litter, Ecol. Monogr., 80, 89–106, 2010.
McCarthy, H., Oren, R., Johnsen, K., Gallet-Budynek, A., Pritchard, S., Cook, C., LaDeau, S., Jackson, R., and Finzi, A.: Re-assessment of plant carbon dynamics at the Duke free-air CO2 enrichment site: interactions of atmospheric [CO2] with nitrogen and water vailability over stand development, New Phytol., 185, 514–528, 2010.
McMurtrie, R., Iversen, C., Dewar, R., Medlyn, B., Nasholm, T., Pepper, D., and Norby R.: Plant root distributions and nitrogen uptake predicted by a hypothesis of optimal root foraging, Ecol. Evol., 2, 1235–1250, 2012.
Melillo J., McGuire A., Kicklighter D., Moore B., Vorosmarty C., and Schloss, A.: Global climate change and terrestrial net primary production, Nature, 363, 234–240, 1993.
Menge, D., Pacala, S., and Hedin, L.: Emergence and maintenance of nutrient limitation over multiple timescales in terrestrial ecosystems, Am. Nat., 173, 164–175, 2009.
Meyerholt, J., Zaehle, S., and Smith, M. J.: Variability of projected terrestrial biosphere responses to elevated levels of atmospheric CO2 due to uncertainty in biological nitrogen fixation, Biogeosciences, 13, 1491–1518, https://doi.org/10.5194/bg-13-1491-2016, 2016.
Oleson, K., Lawrence, M., Bonan, B., Drewniak, B., Huang, M., Koven, D., Levis, S., Li, F., Riley, J., Subin, M., and Swenson, S.: Technical description of version 4.5 of the Community Land Model (CLM), NCAR, Technical Note NCAR/TN-503+STR, Boulder, CO., 244–305, 2013.
Rafique, R., Xia, J., Hararuk, O., Asrar, G. R., Leng, G., Wang, Y., and Luo, Y.: Divergent predictions of carbon storage between two global land models: attribution of the causes through traceability analysis, Earth Syst. Dynam., 7, 649–658, https://doi.org/10.5194/esd-7-649-2016, 2016.
Rastetter, E., Agren, G., and Shaver, G.: Responses of N-limited ecosystems to increased CO2: a balanced-nutrition, coupled-element-cycles model, Ecol. Appl., 7, 444–460, 1997.
Rastetter, E., Vitousek, P., Field, C., Shaver, G., Herbert, D., and Agren, G.: Resource optimization and symbiotic nitrogen fixation, Ecosystems, 4, 369–388, 2001.
Shevliakova, E., Pacala, S. W., Malyshev, S., Hurtt, G. C., Milly, P. C. D., Caspersen, J. P., Sentman, L. T., Fisk, J. P., Wirth, C., and Crevoisier, C.: Carbon cycling under 300 years of land use change: Importance of the secondary vegetation sink, Global Biogeochem. Cy., 23, GB2022, https://doi.org/10.1029/2007GB003176, 2009.
Shi, Z., Yang, Y., Zhou, X., Weng, E., Finzi, A. C., and Luo, Y.: Inverse analysis of coupled carbon–nitrogen cycles against multiple datasets at ambient and elevated CO2, J. Plant. Ecol., 9, 285–295, 2015.
Shi, Z., Crowell, S., Luo, Y., and Moore, B.: Model structures amplify uncertainty in predicted soil carbon responses to climate change, Nat. Commun., 9, 2171, https://doi.org/10.1038/s41467-018-04526-9, 2018.
Sokolov, A. P., Kicklighter, D. W., Melillo, J. M., Felzer, B. S., Schlosser, C. A., and Cronin, T. W.: Consequences of considering carbon–nitrogen interactions on the feedbacks between climate and the terrestrial carbon cycle, J. Climate, 21, 3776–3796, 2008.
Sprugel, D., Ryan, M., Brooks, J., Vogt, K., and Martin, T.: Respiration from the organ level to the stand, in: Resource Physiology of Conifers, edited by: Smith, W. K. and Hinckley, T. M., Academic Press, San Diego, CA, 255–299, 1995.
Terrer, C., Vicca, S., Hungate, B., Phillips, R., and Prentice, I.: Mycorrhizal association as a primary control of the CO2 fertilization effect, Science, 353, 72–74, 2016.
Thomas, R., Zaehle, S., Templer, P., and Goodale, C.: Global patterns of nitrogen limitation: confronting two global biogeochemical models with observations. Glob. Change Biol., 19, 2986–2998, 2013.
Thomas, R., Brookshire, E., and Gerber, S.: Nitrogen limitation on land: how can it occur in Earth system models?, Glob. Change Biol., 21, 1777–1793, 2015.
Thompson, M. and Randerson, J.: Impulse response functions of terrestrial carbon cycle models: method and application, Glob. Change Biol., 5, 371–394, 1999.
Thornton, P., Lamarque, J., Rosenbloom, N., and Mahowald, N.: Influence of carbon-nitrogen cycle coupling on land model response to CO2 fertilization and climate variability, Global biogeochem. Cy., 21, GB4018, https://doi.org/10.1029/2006GB002868, 2007.
Todd-Brown, K. E. O., Randerson, J. T., Post, W. M., Hoffman, F. M., Tarnocai, C., Schuur, E. A. G., and Allison, S. D.: Causes of variation in soil carbon simulations from CMIP5 Earth system models and comparison with observations, Biogeosciences, 10, 1717–1736, https://doi.org/10.5194/bg-10-1717-2013, 2013.
van Oijen, M. and Levy, P.: Nitrogen metabolism and plant adaptation to the environment: The scope for process-based modeling, in: Nitrogen Acquisition and Assimilation in Higher Plants, edited by: Amâncio, S. and Stulen, I., Springer, Dordrecht, 133–147, 2004.
Vicca, S., Luyssaert, S., Penuelas, J., Campioli, M., Chapin III, F., Ciais, P., Heinemeyer, A., Högberg, P., Kutsch, W., Law, B., and Malhi, Y.: Fertile forests produce biomass more efficiently, Ecol. Lett., 15, 520–526, 2012.
Vitousek, P.: Nutrient cycling and limitation: Hawai'i as a model system. Princeton University Press, Princeton,, 2004.
Vitousek, P. and Howarth R.: Nitrogen limitation on land and in the sea: how can it occur?, Biogeochemistry, 13, 87–115, 1991.
Walker, A., Zaehle, S., Medlyn, B., De Kauwe, M., Asao, S., Hickler, T., Parton, W., Ricciuto, D., Wang, Y., Wårlind, D., and Norby, R.: Predicting long-term carbon sequestration in response to CO2 enrichment: How and why do current ecosystem models differ?, Global Biogeochem. Cy., 29, 476–495, 2015.
Walker, A., Quaife, T., Bodegom, P., De Kauwe, M., Keenan, T., Joiner, J., Lomas, M., MacBean, N., Xu, C., Yang, X., and Woodward, F.: The impact of alternative trait-scaling hypotheses for the maximum photosynthetic carboxylation rate (Vcmax) on global gross primary production, New Phytol., 215, 1370–1386, 2017.
Wang, S., Grant, R., Verseghy, D., and Black, T.: Modelling plant carbon and nitrogen dynamics of a boreal aspen forest in CLASS – the Canadian Land Surface Scheme, Ecol. Model., 142, 135–154, 2001.
Wang, Y. P. and Houlton, B. Z.: Nitrogen constrain on terrestrial carbon uptake: implications for the global carbon-climate feedback, Geophys. Res. Lett., 36, L24403, https://doi.org/10.1029/2009GL041009, 2009.
Wang, Y. P., Law, R. M., and Pak, B.: A global model of carbon, nitrogen and phosphorus cycles for the terrestrial biosphere, Biogeosciences, 7, 2261–2282, https://doi.org/10.5194/bg-7-2261-2010, 2010.
Wania, R., Meissner, K. J., Eby, M., Arora, V. K., Ross, I., and Weaver, A. J.: Carbon-nitrogen feedbacks in the UVic ESCM, Geosci. Model Dev., 5, 1137–1160, https://doi.org/10.5194/gmd-5-1137-2012, 2012.
Weng, E. and Luo, Y.: Soil hydrological properties regulate grassland ecosystem responses to multifactor global change: A modeling analysis, J. Geophys. Res., 113, G03003, https://doi.org/10.1029/2007JG000539, 2008.
Wieder, W., Boehnert, J., and Bonan, G.: Evaluating soil biogeochemistry parameterizations in Earth system models with observations, Global Biogeochem. Cy., 28, 211–222, 2014.
Wieder, W., Cleveland, C., Lawrence, D., and Bonan, G.: Effects of model structural uncertainty on carbon cycle projections: biological nitrogen fixation as a case study, Environ. Res. Lett., 10, 044016, https://doi.org/10.1088/1748-9326/10/4/044016, 2015a.
Wieder, W., Cleveland, C., Smith, W., and Todd-Brown, K.: Future productivity and carbon storage limited by terrestrial nutrient availability, Nat. Geosci., 8, 441–444, 2015b.
Xia, J. and Wan, S.: Global response patterns of terrestrial plant species to nitrogen addition, New Phytol., 179, 428–439, 2008.
Xia, J. Y., Luo, Y. Q., Wang, Y.-P., Weng, E. S., and Hararuk, O.: A semi-analytical solution to accelerate spin-up of a coupled carbon and nitrogen land model to steady state, Geosci. Model Dev., 5, 1259–1271, https://doi.org/10.5194/gmd-5-1259-2012, 2012.
Xia, J., Luo, Y., Wang, Y., and Hararuk, O.: Traceable components of terrestrial carbon storage capacity in biogeochemical models, Glob. Change Biol., 19, 2104–2116, 2013.
Xu, C., Fisher, R., Wullschleger, S., Wilson, C., Cai, M., and McDowell, N.: Toward a mechanistic modeling of nitrogen limitation on vegetation dynamics, PloS ONE, 7, e37914, https://doi.org/10.1371/journal.pone.0037914, 2012.
Zaehle, S. and Dalmonech, D.: Carbon–nitrogen interactions on land at global scales: current understanding in modelling climate biosphere feedbacks, Curr. Opin. Env. Sust., 3, 311–320, 2011.
Zaehle, S. and Friend, A.: Carbon and nitrogen cycle dynamics in the O-CN land surface model: 1. Model description, site-scale evaluation, and sensitivity to parameter estimates, Global Biogeochem. Cy., 24, GB1005, https://doi.org/10.1029/2009GB003521, 2010.
Zaehle, S., Medlyn, B., De Kauwe, M., Walker, A., Dietze, M., Hickler, T., Luo, Y., Wang, Y., El-Masri, B., Thornton, P., and Jain, A.: Evaluation of 11 terrestrial carbon-nitrogen cycle models against observations from two temperate Free-Air CO2 Enrichment studies, New Phytol., 202, 803–822, 2014.
Zaehle, S., Jones, C., Houlton, B., Lamarque, J. and Robertson, E.: Nitrogen availability reduces CMIP5 projections of twenty-first-century land carbon uptake, J. Climate, 28, 2494–2511, 2015.
Zhou, L., Zhou, X., Zhang, B., Lu, M., Luo, Y., Liu, L., and Li, B.: Different responses of soil respiration and its components to nitrogen addition among biomes: a meta-analysis, Glob. Change Biol., 20, 2332–2343, 2014.
Zhou, S., Liang, J., Lu, X., Li, Q., Jiang, L., Zhang, Y., Schwalm, C., Fisher, J., Tjiputra, J., Sitch, S., and Ahlström, A.: Sources of uncertainty in modeled land carbon storage within and across three MIPs: Diagnosis with three new techniques, J. Climate, 31, 2833–2851, 2018.
Zhou, X., Zhou, T., and Luo, Y.: Uncertainties in carbon residence time and NPP-driven carbon uptake in terrestrial ecosystems of the conterminous USA: a Bayesian approach, Tellus B, 64, 17223, https://doi.org/10.3402/tellusb.v64i0.17223, 2012.
Zhu, Q., Riley, W., and Tang, J.: A new theory of plant–microbe nutrient competition resolves inconsistencies between observations and model predictions, Ecol. Appl., 27, 875–886, 2017.