the Creative Commons Attribution 4.0 License.
the Creative Commons Attribution 4.0 License.
 | 31 Aug 2018
A global scavenging and circulation ocean model of thorium-230 and protactinium-231 with improved particle dynamics (NEMO–ProThorP 0.1)
Jean-Claude Dutay
Matthieu Roy-Barman
In this paper we set forth a 3-D ocean model of the radioactive trace isotopes 230Th and 231Pa. The interest arises from the fact that these isotopes are extensively used for investigating particle transport in the ocean and reconstructing past ocean circulation. The tracers are reversibly scavenged by biogenic and lithogenic particles.
Our simulations of 230Th and 231Pa are based on the NEMO–PISCES ocean biogeochemistry general circulation model, which includes biogenic particles, namely small and big particulate organic carbon, calcium carbonate and biogenic silica. Small and big lithogenic particles from dust deposition are included in our model as well. Their distributions generally compare well with the small and big lithogenic particle concentrations from recent observations from the GEOTRACES programme, except for boundary nepheloid layers for which, as of today, there are no non-trivial prognostic models available on a global scale. Our simulations reproduce 230Th and 231Pa dissolved concentrations: they compare well with recent GEOTRACES observations in many parts of the ocean. Particulate 230Th and 231Pa concentrations are significantly improved compared to previous studies, but they are still too low because of missing particles from nepheloid layers. Our simulation reproduces the main characteristics of the 231Pa∕230Th ratio observed in the sediments and supports a moderate affinity of 231Pa to biogenic silica as suggested by recent observations relative to 230Th.
Future model development may further improve understanding, especially when this will include a more complete representation of all particles, including different size classes, manganese hydroxides and nepheloid layers. This can be done based on our model as its source code is readily available.
- Article
(5638 KB) - Full-text XML
-
Supplement
(671 KB) - BibTeX
- EndNote


Oceanic circulation and the carbon cycle play a major role in the regulation of the past and present climate. Heat and carbon dioxide in the atmosphere tend to equilibrate with the ocean surface and are transported down into the deep ocean through the Meridional Overturning Circulation (MOC). Biogeochemical cycling also generates organic carbon that transfers into the deep ocean through particle sinking. Because of this, the strength of the MOC and particle removal participate actively in the regulation of the climate on the Earth.
Trace elements are also affected by these mechanisms and represent useful tools to provide constraints on these processes. The GEOTRACES programme has generated a large unique dataset that can now be used to better understand biogeochemical oceanic processes. Modelling quantifies and provides more information on the processes that control the oceanic distribution of these new observations. In present day climate, it is difficult to measure the MOC strength, and for past climate there are no measurements available at all. Isotopes and trace elements from sediment cores are used as proxies to infer past ocean circulation. Several examples include carbon isotopes (Broecker et al., 1988), the cadmium∕calcium ratio (Rosenthal et al., 1997), the ratio between protactinium-231 and thorium-230 (231Pa∕230Th) (Böhm et al., 2015), and the neodymium isotope ratio 143Nd∕144Nd (Piotrowski et al., 2005). These proxies are affected by dynamical and biogeochemical processes. Including these proxies in a climate model is a way to better understand the climatic signal they register.
We will focus on 230Th and 231Pa because these isotopes are well documented by the international GEOTRACES programme, and they are particularly suitable to study the transfer of particulate matter since the isotopes' source in the ocean is perfectly known: radioactive decay of uranium isotopes. Others have modelled 143Nd and 144Nd (Arsouze et al., 2008, 2009; Ayache et al., 2016), 13C (Tagliabue et al., 2009), and 14C (Mouchet, 2013). The ratio between 230Th and 231Pa is used as a proxy for past ocean conditions, but this signal is potentially affected by both circulation and biogeochemical changes. Therefore, a correct understanding of the scavenging and underlying particle dynamics is essential in order to better simulate these tracers (Dutay et al., 2015).
Protactinium-231 and thorium-230 are produced in the ocean by the α decay of uranium-235 and uranium-234, respectively. Because the activity of uranium is approximately uniform in the ocean, 231Pa and 230Th are produced at a relatively constant rate ( and ; dpm: disintegrations per minute) (Henderson and Anderson, 2003). They are both scavenged rapidly by the many particles that reside in the ocean and settle towards the sea floor. 231Pa is less sensitive to particle scavenging than 230Th, which is reflected in the longer residence time of 231Pa (80–200 yr) compared to that of 230Th (20–40 yr) (Yu et al., 1996). 231Pa and 230Th are radioactive, decaying to radium isotopes and having a half-life of 32.76 and 75.40 kyr, respectively. Each combination of particle–radionuclide adsorption has a different reactivity. Other factors may affect the adsorption of radionuclides onto particles. For example, smaller particles have larger surface area to volume ratios, which results in an increase in the number of these radionuclides adsorbed per particle. Additionally, while the adsorption rate is expected to increase with particle concentration, the adsorption rate may be partly limited by the coagulation of non-filtered particles (or colloids) to filtered particles (Honeyman and Santschi, 1988; Honeyman et al., 1988). The vertical distributions of natural radionuclides, such as 230Th and 231Pa, are hence sensitive to the distribution and mixture of particles. As a consequence of the different particle reactivities of 230Th and 231Pa, the dissolved concentration ratio 231Pa∕230Th deviates from the production activity ratio of 0.093 (Anderson, 2003; Anderson et al., 1983; Rutgers van der Loeff et al., 2016).
As both particle dynamics and circulation of the ocean affect 230Th and 231Pa, numerical biogeochemical general circulation models are used to study the relative contribution of these mechanisms. The isotopes have been simulated in models of intermediate complexity, for instance by Henderson et al. (1999) (LSG-OGCM), Marchal et al. (2000) (EMIC 2.5D), Heinze et al. (2006, 2018) (HAMOCC) and Luo et al. (2010). More complex ocean general circulation models have also been used to simulate these tracers, namely by Dutay et al. (2009) (NEMO–PISCES), Siddall et al. (2007), Rempfer et al. (2017) (Bern3D), and Gu and Liu (2017) (CESM). Dutay et al. (2009) demonstrated that the particle concentration simulated by the PISCES model in the deep ocean was too low by a factor of 2 in the mesopelagic zone to 50 in the deepest ocean. This led to overestimated radionuclide concentrations in the deep ocean. Therefore, it is crucial to improve the representation of the particles (Dutay et al., 2009). Rempfer et al. (2017) showed that taking into account additional sinks at the sea floor and at the ocean margins yields an improved agreement with observations, especially for the dissolved phases of 230Th and 231Pa. Particulate ratios improved to a lesser extent; the authors have not presented an evaluation of their simulated particulate concentrations. Gu and Liu (2017) had similar goals as this study.
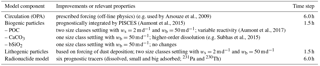
In this study, we try to improve on previous studies that simulate the distribution of 230Th and 231Pa. Our approach is to improve the mechanistic description of the particle and radionuclide cycling, as well as on the side of system design and reusability of the model. We evaluate how well the model fits with observations, but tuning is not one of our main goals. Just like Dutay et al. (2009), we use the NEMO–OPA (Nucleus for European Modelling of the Ocean – Océan PAralelisé) ocean general circulation model (Madec and the NEMO team, 2016) and the PISCES biogeochemical model (Aumont et al., 2015). Aumont et al. (2017) showed that dissolution rates of particulate organic carbon (POC) in PISCES were overestimated, and they improved on this by introducing a spectrum of different labilities. This improved the simulation of both small and big POC significantly, so we use this same model for our simulations. There are several improvements since Dutay et al. (2009); namely, the new model
-
includes lithogenic particles from dust deposition;
-
has improved the biogeochemistry, affecting the biogenic particle distributions (Aumont et al., 2015, 2017);
-
includes three different phases per nuclide (dissolved, and adsorbed onto big (and small) particles), whereas Dutay et al. (2009) include only a single compartment (total concentration) for each nuclide from which they calculated the respective phases based on chemical equilibrium;
-
is more precise and explicit on the mathematical formalism;
-
is written in Fortran 95 instead of Fortran 77, making the extension of its use to other modern Fortran models easier; and
-
is part of a modern model framework, NEMO–TOP, facilitating its use with other models in this framework.
The main objective of this paper is to improve on the simulation of 230Th and 231Pa (the dissolved phase and two particulate size classes of particles for both nuclides) based on an improved modelling of small and big particles.
New observations are available from the GEOTRACES programme. Especially the North Atlantic GA03 transects will be used for model validation because on this transect not only dissolved 230Th and 231Pa have been measured (Hayes et al., 2015a), but also their adsorbed forms (Hayes et al., 2015b) and biogenic and lithogenic particle concentrations in two size classes (Lam et al., 2015).
In order to simulate the biogenic particle dynamics and their interaction with the 230Th and 231Pa trace isotopes, we use the biogeochemical circulation model NEMO–PISCES (Aumont et al., 2015; Madec, 2008). This model has been employed for many other studies concerning trace metals, as well as large-scale ocean biogeochemistry (Arsouze et al., 2009; Dutay et al., 2009; Gehlen et al., 2007; Tagliabue et al., 2010; van Hulten et al., 2013, 2014, 2017b). We force PISCES by a climatological year of circulation fields (including turbulent diffusion) that was obtained from the dynamical component of NEMO. Table 1 gives an overview of this and other components of the model and their relevant properties.
(Aumont et al., 2015)(Aumont et al., 2017)Table 1Model components and properties essential for the radionuclide model. OPA stands for Océan PAralalisé.
All model fields are defined on the ORCA2 discrete coordinate system, an irregular grid covering the whole world ocean with a nominal resolution of , with an increased resolution in the meridional direction near the Equator and Antarctica and in both horizontal directions in the Mediterranean, Red, Black and Caspian seas. On the Northern Hemisphere, it has two coordinate singularities, one in Canada and the other in Russia, such that both singularities fall outside the computational domain. The vertical resolution of the ORCA2 grid is 10 m in the upper 100 m, increasing downwards to 500 m such that there are 30 layers in total and the ocean has a maximum depth of 5000 m (Madec and Imbard, 1996; Murray, 1996). The time step of the model is 6 h for the dynamics and the radionuclides and 1.5 h for the biogeochemistry (PISCES) and the lithogenic particles. When necessary, sub-time stepping is done for all sinking components in the model.
2.1 Circulation
The circulation was obtained by forcing NEMO in the ORCA2 configuration with climatological air–sea boundary conditions consisting of heat, freshwater and momentum fluxes that were derived from bulk formulae. They are functions of wind, sea surface temperature, air temperature, air humidity and evaporation minus precipitation. For the tropics, daily wind stress was used, which was based on European Remote Sensing (ERS) satellite data, and for the polar regions NCEP/NCAR reanalysis data were used (Kalnay et al., 1996; Kistler et al., 2001). Surface salinity was restored with a timescale of 60 days towards the seasonal Polar Science Center Hydrographic Climatology (PHC) dataset to avoid model drift (Timmermann et al., 2005). The last year of this 200-year simulation is used as our 1-year climatology with a resolution of 5 days of the dynamics.
2.2 Particle dynamics
This version of PISCES includes two size classes of POC, both with differential remineralisation rates (Aumont et al., 2017), one size class of biogenic silica (bSiO2) and one class of calcium carbonate (CaCO3) (Fig. 1). In the model, particles sink down with two velocities: ws=2 m d−1 and wb=50 m d−1. Aumont et al. (2015) mark the diameter boundary at 100 µm, but as we need to compare with observations, the size classes will be taken to correspond with “small” particles (∅≤51 µm) and “big” particles (∅>51 µm).
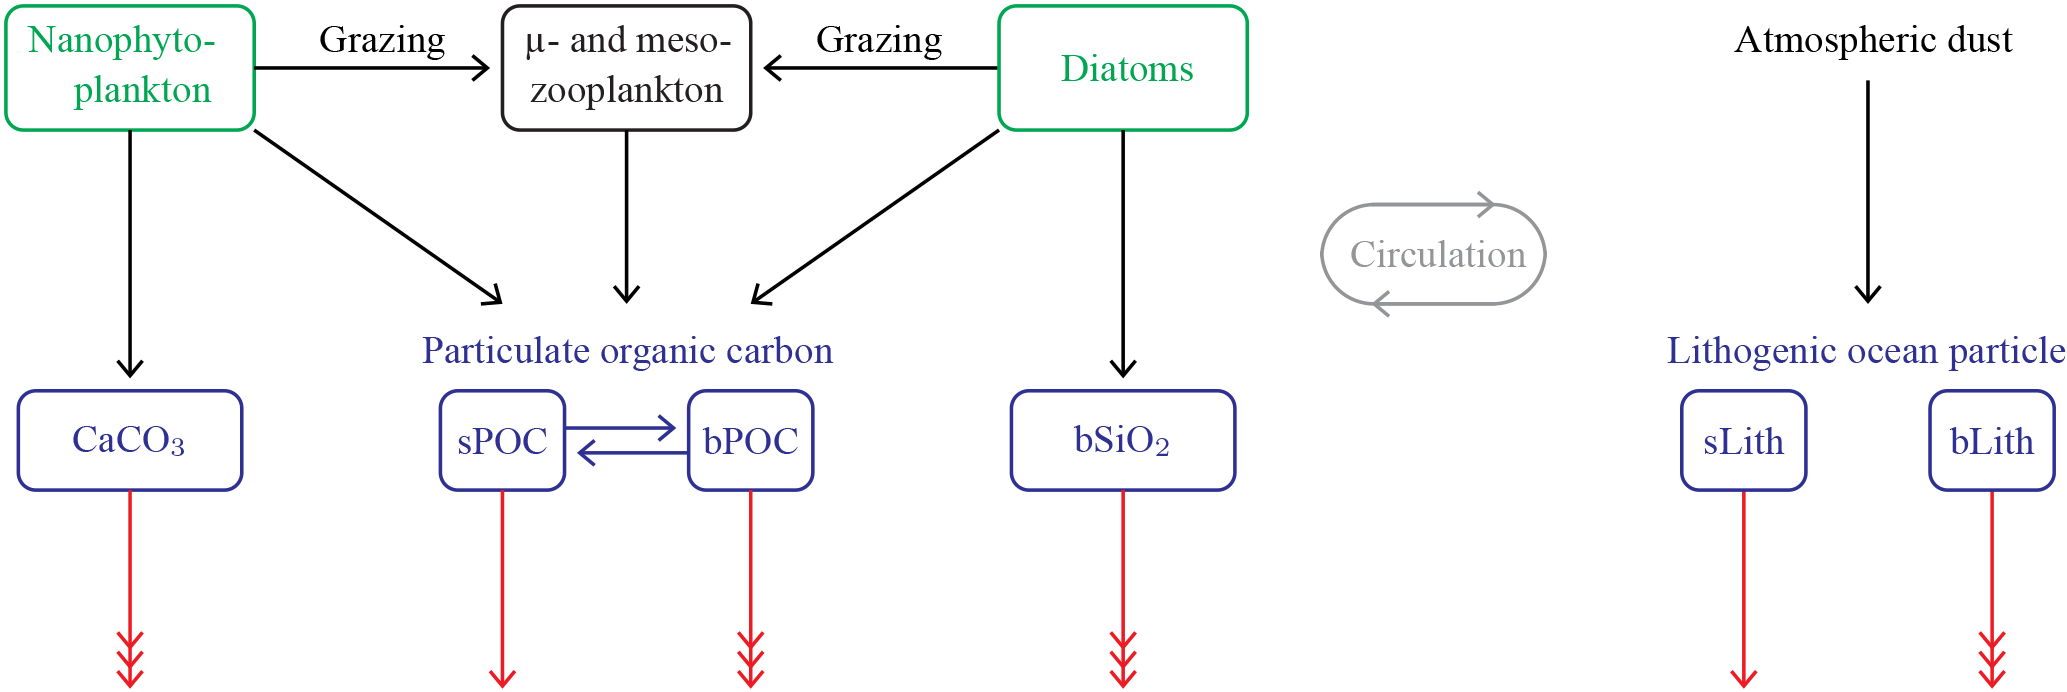
Figure 1Conceptual model of the particle dynamics on which the numerical model is based. Nanophytoplankton and diatoms (in green) take up nutrients and CO2, which are released again from respiration and remineralisation of bSiO2, POC, dissolved organic matter and lithogenic particles. The nutrients, CO2 and dissolved organic matter are not represented in the figure because only particles impact 231Pa and 230Th. Zooplankton are denoted by the black box. All sinking particles are denoted by blue boxes. Effectively, this figure comprises the internal cycling of PISCES, minus details that are not of interest here, plus the lithogenic dust model. Small and big particulate organic matter is denoted by sPOM and bPOM, both subject to the differential lability scheme (Aumont et al., 2017), and bSiO2 stands for biogenic silica. Similarly, sLith and bLith stand for small and big lithogenic particles. Sinking is denoted by the red arrows; triple arrows mean fast, and normal arrows slow.
The dissolution equation for calcium carbonate is given by
where the rate variable for calcite dissolution is
where k and n are two somewhat restricted, though tunable, parameters that signify a dissolution rate constant and a reaction rate order, respectively. The calcite saturation state is given by
where is the product of the saturation concentrations of calcium and carbonate. This can be approximated by
because relative variations in [Ca2+] are small. For CaCO3 we changed the standard first-order dissolution kinetics parameterisation to a fourth-order dissolution based on evidence of Keir (1980) and subsequent studies. For our simulation we used a calcite dissolution rate constant of k=2.5 mo−1 and a dissolution order of n=3.9 (Subhas et al., 2015).
In addition to biogenic particles, we introduced lithogenic dust particles in the model. The yearly average dust flux is derived from Hauglustaine et al. (2004) and is presented in Fig. 2. It is used by the model as the input of lithogenic ocean particles and for nutrient supply in PISCES. This dust deposition field has been tested in biogeochemical studies with this configuration of NEMO (van Hulten et al., 2013).

Figure 2Dust deposition on a logarithmic scale (). It is the integrated flux over the 12-month climatology based on Hauglustaine et al. (2004).
Small and big lithogenic particles are added to the upper layer of the ocean according to
where PLitho is the small (big) lithogenic particle concentration, f is the fraction of the dust that gets partitioned into the small (big) lithogenic particles in the ocean, Δz1=10 m is the thickness of the upper model layer and Φdust is the dust flux.
Our model has two size classes for lithogenic particles, so this equation is applied for two different concentrations PLitho and respective fractions f. We set the small lithogenic dust flux fraction to 20 % and the big one to 80 %. Once partitioned in the ocean, the lithogenic particles sink down, changing their concentrations throughout the ocean according to
where w is the settling velocity set to the constant 2 m d−1 for the small lithogenic particles and to 50 m d−1 for the big particles. The depth, z, is positive upwards, ∇h is the horizontal divergence, and 𝒜 and ℬ are respectively the horizontal and vertical eddy diffusivity coefficients. The material derivative includes a term for eddy-induced velocity (Gent and McWilliams, 1990; Gent et al., 1995). Equation (6) is identical to the settling of small and big POC (Aumont et al., 2015). Of course, there are also biological and chemical sources and sinks for POC. However, for lithogenic particles there are no such sources or sinks because the only source in our model is dust deposition and we assume the lithogenic particles are refractory. The lithogenic particles are removed from the model domain when arriving at the sea floor, which means that they are buried in the sediment.
2.3 Radionuclides
Thorium-230 and protactinium-231 are produced throughout the ocean from the decay of 234U and 235U, respectively. Because of long residence times of over 200 kyr, these uranium isotopes are approximately homogeneously distributed throughout the ocean and do not change much over time (Ku et al., 1977). The residence time of 234U is 3.2–5.6×10⁵ a, which is much longer than the full mixing time of the world ocean of about 103 a (Dunk et al., 2002). The 234U concentration can vary about 10 %, depending mostly on the salinity (Owens et al., 2011), but that is smaller than uncertainties arising from other assumptions in our model. Therefore, we assume that the production rates of 230Th and 231Pa are constant both in space and time.

Figure 3The conceptual reversible scavenging model for the radionuclides. The radioisotopes, 230Th and 231Pa, are depicted in orange when in the dissolved phase. Just like with the other PISCES tracers, the dissolved and particulate radionuclides are transported by circulation and eddy diffusion.
The 230Th and 231Pa radionuclides are reversibly scavenged by biogenic and lithogenic particles (Fig. 3). We will assume, as in previous studies (Dutay et al., 2009; Siddall et al., 2005), that the adsorption and desorption reaction rates are sufficiently fast compared to radionuclide production, decay, advection, mixing, change in particle distribution and settling of the adsorbed phases (see discussion in Sect. 6). Because of that, we equilibrate between the dissolved and adsorbed phases instantly at each time step. This means, only considering adsorption and desorption processes at this point, that we must solve this set of equations for every nuclide i:
where Ai stands for the activity of nuclide 1 and where Pj stands for the concentration of particle (in gram per gram of seawater, so strictly this is a mass fraction). D is the set of non-sinking phases (here only dissolved), S of small particles that sink with 2 m d−1 and B of big particles that sink with 50 m d−1 (in the same way as Eq. 6 for lithogenic particles). For any particle size class and any radionuclide i, we define . Finally, Kij is the equilibrium partition coefficient of nuclide i for particle j. As with small and big POC, adsorbed 230Th and 231Pa should aggregate and disaggregate. However, any transference of radionuclides between two particle types or size classes, in addition to the instant equilibration, would not have any effect as there would quickly be a new equilibrium of the radionuclides between the particles and the dissolved phase at the next instant re-equilibration (which happens each time step). Therefore, there is no equation for the radionuclides addressing aggregation.
Since we cannot solve this analytically, this will be done numerically by first assigning a new value to the dissolved nuclide activity:2
Then, we calculate the activity of i that is adsorbed onto small and big particles by applying Eqs. (7b) and (7c). With this approach, the small and big adsorbed concentrations equilibrate instantly. Assuming that the change in adsorption strength is much smaller than the relative change in tracer activity, , the total activity of every i is conserved, i.e. Eq. (7a) holds.
Proof. Let the total adsorption strength for any isotope i be and the total amount of the same isotope , and let primes denote the updated concentrations. Assume that the adsorption strength for every isotope i is constant ().
The 230Th and 231Pa that are adsorbed onto the particles follow the same law as the small and big (lithogenic) particles (Eq. 6). Of course, by definition, the adsorbed radioisotope and the particle settle with the same speed, and thus we have implemented it.
The decay terms of 230Th and 231Pa are much smaller than the other sources and sinks, but they are included in the model:
where βi and λi are respectively the production rate and radioactive decay of isotope i.
For the numerical simulations, we forced the just described model, an adjusted version of PISCES with lithogenic particles and radiotracers, with the off-line circulation fields. The model was spun up for 500 years, after which it was in an approximate steady state (decadal drift of −0.002 % for total 230Th and +0.058 % for total 231Pa). Protactinium-231 has a larger drift than thorium-230 because 230Th is more quickly removed everywhere in the ocean because of its high particle reactivity. The lithogenic particles are in a steady state, and the PISCES variables are in an approximate steady state (e.g. phosphate shows a drift of −0.005 % per decade).
The partition coefficients Kij, with , depend on the type of particle j and are given in Table 2.
Table 2Partition coefficients for the different modelled particles in 106 g of seawater per gram of particles. In parentheses is the value for the sensitivity simulation discussed in Sect. 6.1.
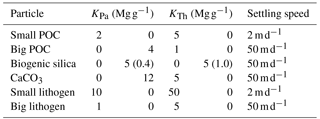
These coefficients still have large uncertainties, but their values can be constrained by reported values from different experimental studies (Chase et al., 2002; Geibert and Usbeck, 2004; Hayes et al., 2015b). Therefore, we had quite some freedom in prescribing values. The adsorption onto calcium carbonate is a factor of 2 decreased from Chase et al. (2002). This brings the K value of Pa closer to that in Hayes et al. (2015b) based on field measurements, namely 0.9±0.4 Mg g−1 (106 g of seawater per gram of particles), but since we maintained the ratio of K values, the partition coefficient of Th is much smaller than found by Hayes et al. (2015b). It is consistent with the laboratory results of Geibert and Usbeck (2004), but they cleaned the biogenic silica aggressively, bought carbonate that should be organic-free and clay (smectite) was purchased as a commercial standard and not cleaned (Geibert and Usbeck, 2004; and Walter Geibert, personal communication, January 2018). In the real ocean, solid minerals are not clean but have organic matter around them, giving rise to increased scavenging (Chuang et al., 2014). Therefore, our K values for at least biogenic silica and calcium carbonate may be lower than what is typically considered realistic. The actual reason for the relatively low K values is that we only have fast-sinking biogenic silica and calcium carbonate particles in the model that also represent smaller particles that sink slower. Thus using higher K values would result in too much export of Pa and Th. For small lithogenic particles, K is set about a factor of 5 larger than in the literature (Geibert and Usbeck, 2004; Hayes et al., 2015b), whereas big lithogenic particles have a smaller value than reported in the literature. The Supplement contains a more exhaustive table of information, including an estimated literature range (Table S3). The consequences of the chosen values for the partition coefficients are discussed further in Sect. 6.
In this study, we will focus on the GEOTRACES GA03 transect in the North Atlantic Ocean. Recently, a large number of measurements on both radionuclides and their carrier particles have been collected on this transect. This unique combination makes it especially useful to evaluate a radionuclide scavenging model. We will also compare our global ocean model with several observational datasets throughout the ocean (Table 3). Observations obtained from the GEOTRACES programme are denoted with the respective GEOTRACES transect number (Mawji et al., 2015; Schlitzer et al., 2018).
Brun-Cottan et al. (1991)Druffel et al. (1992)Lam et al. (2011)Lam et al. (2015)Bacon and Anderson (1982)Roy-Barman et al. (1996)Henderson et al. (1999)Marchal et al. (2007)Venchiarutti et al. (2011)Venchiarutti et al. (2011)Hayes et al. (2013)Deng et al. (2014)Hayes et al. (2015a, b)Burckel et al. (2015, 2016)Table 3Observations used for comparison with the model simulations.
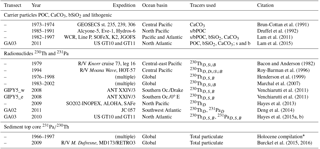
* http://climotope.earth.ox.ac.uk/data_compilations (last access: 27 August 2018).
For the carrier particles most of our data come from Lam et al. (2015), which is a recent GEOTRACES dataset at the GA03 transect in the North Atlantic Ocean. An older compilation of particles is taken from Lam et al. (2011). We use some older data as well (Table 3). Particle concentrations were determined by filtering seawater in situ.
Concentrations of both dissolved and particulate phases of 230Th and 231Pa were taken from Hayes et al. (2015a) (GA03) and Hayes et al. (2014) (Pacific Ocean). Other data are listed in Table 3.
To evaluate the sediment 231Pa∕230Th flux of the model, we will compare with compilations of the Holocene (i.e. top core particulate concentrations) (Table 3).
5.1 Circulation
As mentioned before, our model is part of a global general circulation model, but instead of solving the Navier–Stokes equations, our tracers are advected by the circulation fields of a previous simulation of the dynamical ocean model. Since the overturning circulation is of importance for the redistribution of the tracers, we present basic results here.
Figure S1 of the Supplement presents the overturning stream function (OSF) of the Atlantic Ocean. The OSF is defined as the zonally (through the basin) and vertically (from the surface downwards) integrated meridional component of the current velocity. We use this as a measure for the Atlantic Meridional Overturning Circulation (AMOC). The upper overturning cell transports 14 Sv (1 Sv =106 m3 s−1) on average. Observations suggest higher values of about 19±5 Sv (Cunningham et al., 2007; Rayner et al., 2011; Sinha et al., 2018). The lower cell has an overturning strength of about 6 Sv, which is stronger than the about 2 Sv from estimates (Talley et al., 2003). This overestimation is mostly due to the fact that the AMOC is shallow. The AMOC reaches about 2500 m of depth, whereas observational studies show the deep water sinks down to about 4000 m. At around 30∘ N the AMOC has weakened notably, which is consistent with some studies (Johnson, 2008), but the Antarctic Bottom Water (AABW) does not go as far north as other studies suggest (Middag et al., 2015).
The Antarctic Circumpolar Current is also an important feature for large-scale ocean circulation. The throughflow at the Drake Passage is a good measure for that. In our model the flux through the Drake Passage is 200 Sv, which slightly overestimates recently reported values (Donohue et al., 2016).
5.2 Particles
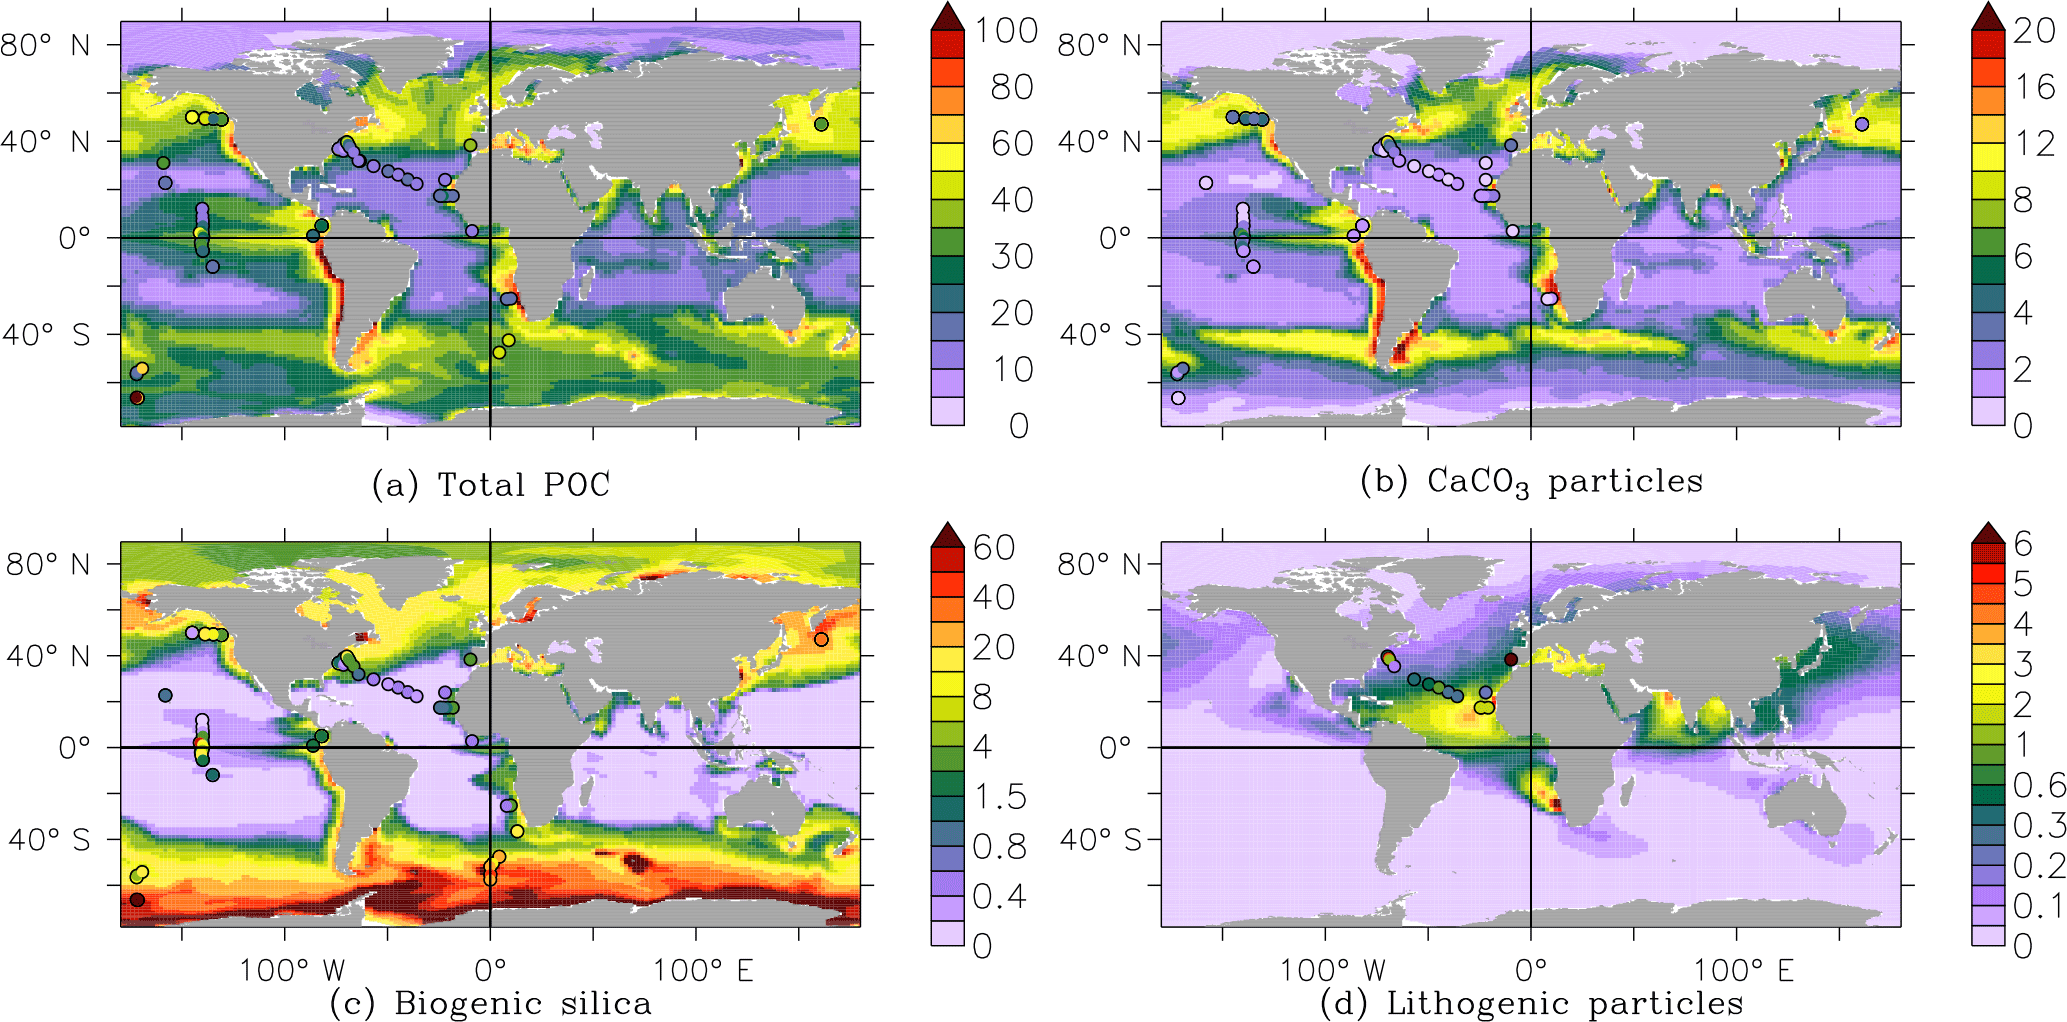
Figure 4Particle concentrations from the PISCES model at the surface ocean. Observations are represented as coloured discs (Brun-Cottan et al., 1991; Druffel et al., 1992; Lam et al., 2011, 2015). The unit of every modelled and measured particle concentration is mg m−3.
Figure 4 shows the surface concentrations of total POC, big calcium carbonate, big biogenic silica and total lithogenic particles. Observations are plotted as coloured discs on top of the modelled concentrations. The modelled biogenic particles include living matter. For the model, we assume POC includes all phytoplankton and microzooplankton (not mesozooplankton since it may swim away), calcium carbonate contains the assumed fraction of CaCO3 in the phytoplankton, and biogenic silica includes living diatoms. The modelled concentrations and patterns of total POC compare well with the observations (Fig. 4a). For instance, coastal and equatorial Pacific POC concentrations are elevated in both the model and the observations compared to other regions, although the spatial extent of the oligotrophic regions appears to be too small in the model. We compare our modelled CaCO3 (big, fast-sinking calcium carbonate particles), with the big calcium carbonate particles from observations. As the model tries to represent CaCO3 with only one size class, neither comparing with only big particles nor comparing with total CaCO3 is completely fair. Incidentally, we have data of big CaCO3 for both the Atlantic and Pacific Ocean, whereas only for the Atlantic Ocean do we have small particle data. Even though the meridional patterns of big CaCO3 particles are reproduced, the concentrations are generally overestimated, especially in the Gulf of Alaska (Fig. 4b). Contrarily, total observed [CaCO3], which is only provided along section GA03 where small particulate CaCO3 measurements are available, is higher than the prediction of our modelled (only big) CaCO3 particle concentration. The model produces a reasonable spatial distribution of biogenic silica: there are more elevated values in the high latitudes, but concentrations are underestimated at the surface at low latitudes (Fig. 4c).
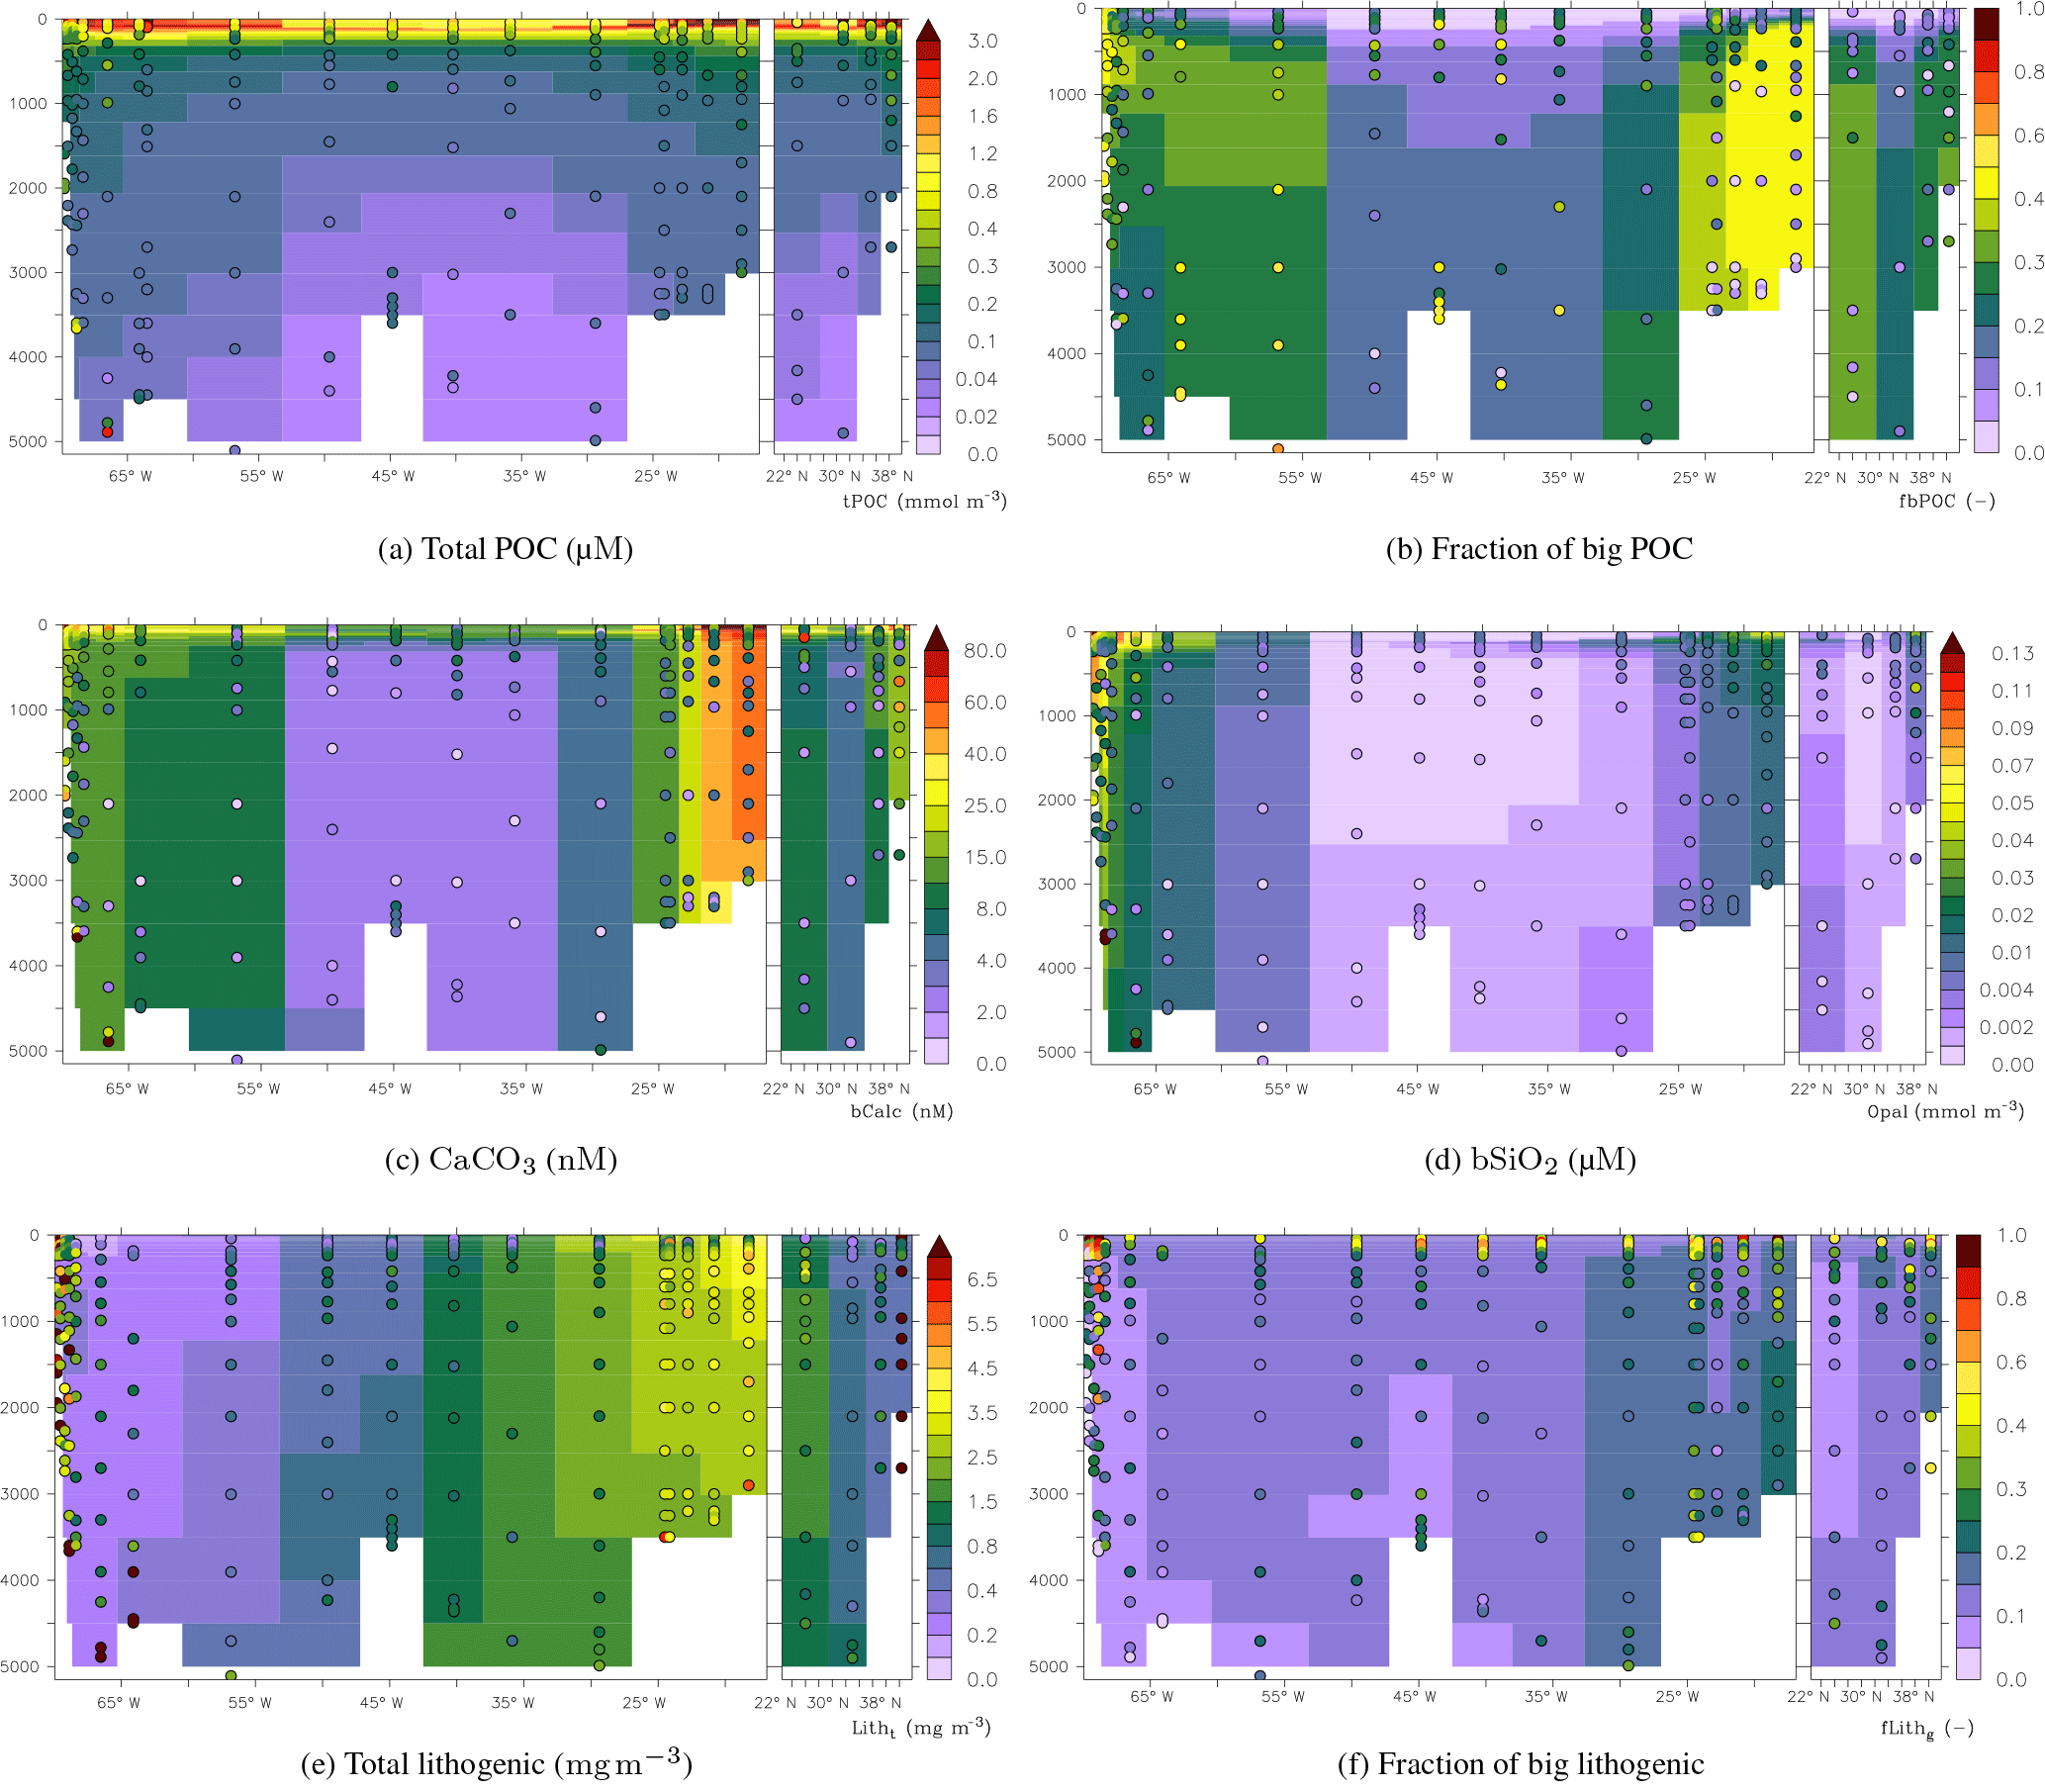
Figure 5Particle fields at the GA03 North Atlantic GEOTRACES transect; observations (Lam et al., 2015) as coloured discs.
The recent large dataset obtained from the full-ocean depth GEOTRACES GA03 transect (Lam et al., 2015) provides an opportunity to analyse the performance of PISCES in more detail. PISCES generally produces the right order of magnitude for all four biogenic particles (small and big POC, calcium carbonate, and biogenic silica), but there still remain some shortcomings in their distributions (Fig. 5a–d).
-
The total POC concentration in Fig. 5a is up to a factor of 4 underestimated in the deep oligotrophic ocean. In the upper 200 m of the ocean the model overestimates the observations, though at some points at the surface the POC concentration is underestimated (also Fig. 4a). In both the observations and the model the fraction of big POC varies from zero to 0.6 (Fig. 5), but the spatial distributions are very different. More detailed results and discussion on the simulation of POC are to be found in Aumont et al. (2017).
-
The model underestimates the CaCO3 concentrations from 70 to 25∘ W by a factor of 2 to 10, but east of that up to Africa the prediction lies close to or overestimates the observations. In the Canary Basin and up to Portugal (meridional transect at the right), the model reproduces the right order of magnitude, but it does not reproduce the correct profiles everywhere (Fig. 5c).
-
Biogenic silica concentrations are generally reproduced but the model overestimates the higher concentrations observed along the western margin (Fig. 5d).
Finally, the modelled total lithogenic particle concentration at the surface shows, as expected, a close resemblance with dust deposition patterns (Fig. 2) and mostly compares well with observations (Fig. 4d). Only near the coasts of the USA and Portugal does the model strongly underestimate lithogenic particle concentrations. Concerning the deep ocean, our model captures quite nicely the general distribution at the GA03 transect (Fig. 5e and f). However, the concentrations near the western boundary are strongly underestimated, especially those of big lithogenic particles. Our model reproduces the observed fraction of big lithogenic particles of ∼0.1 to ∼0.3 in most of the deep ocean, but it underestimates the much larger fraction of big particles observed in the upper 200 m of the ocean (0.1–0.2 in the model versus 0.3–0.9 in the observations).
5.3 Thorium-230 and protactinium-231
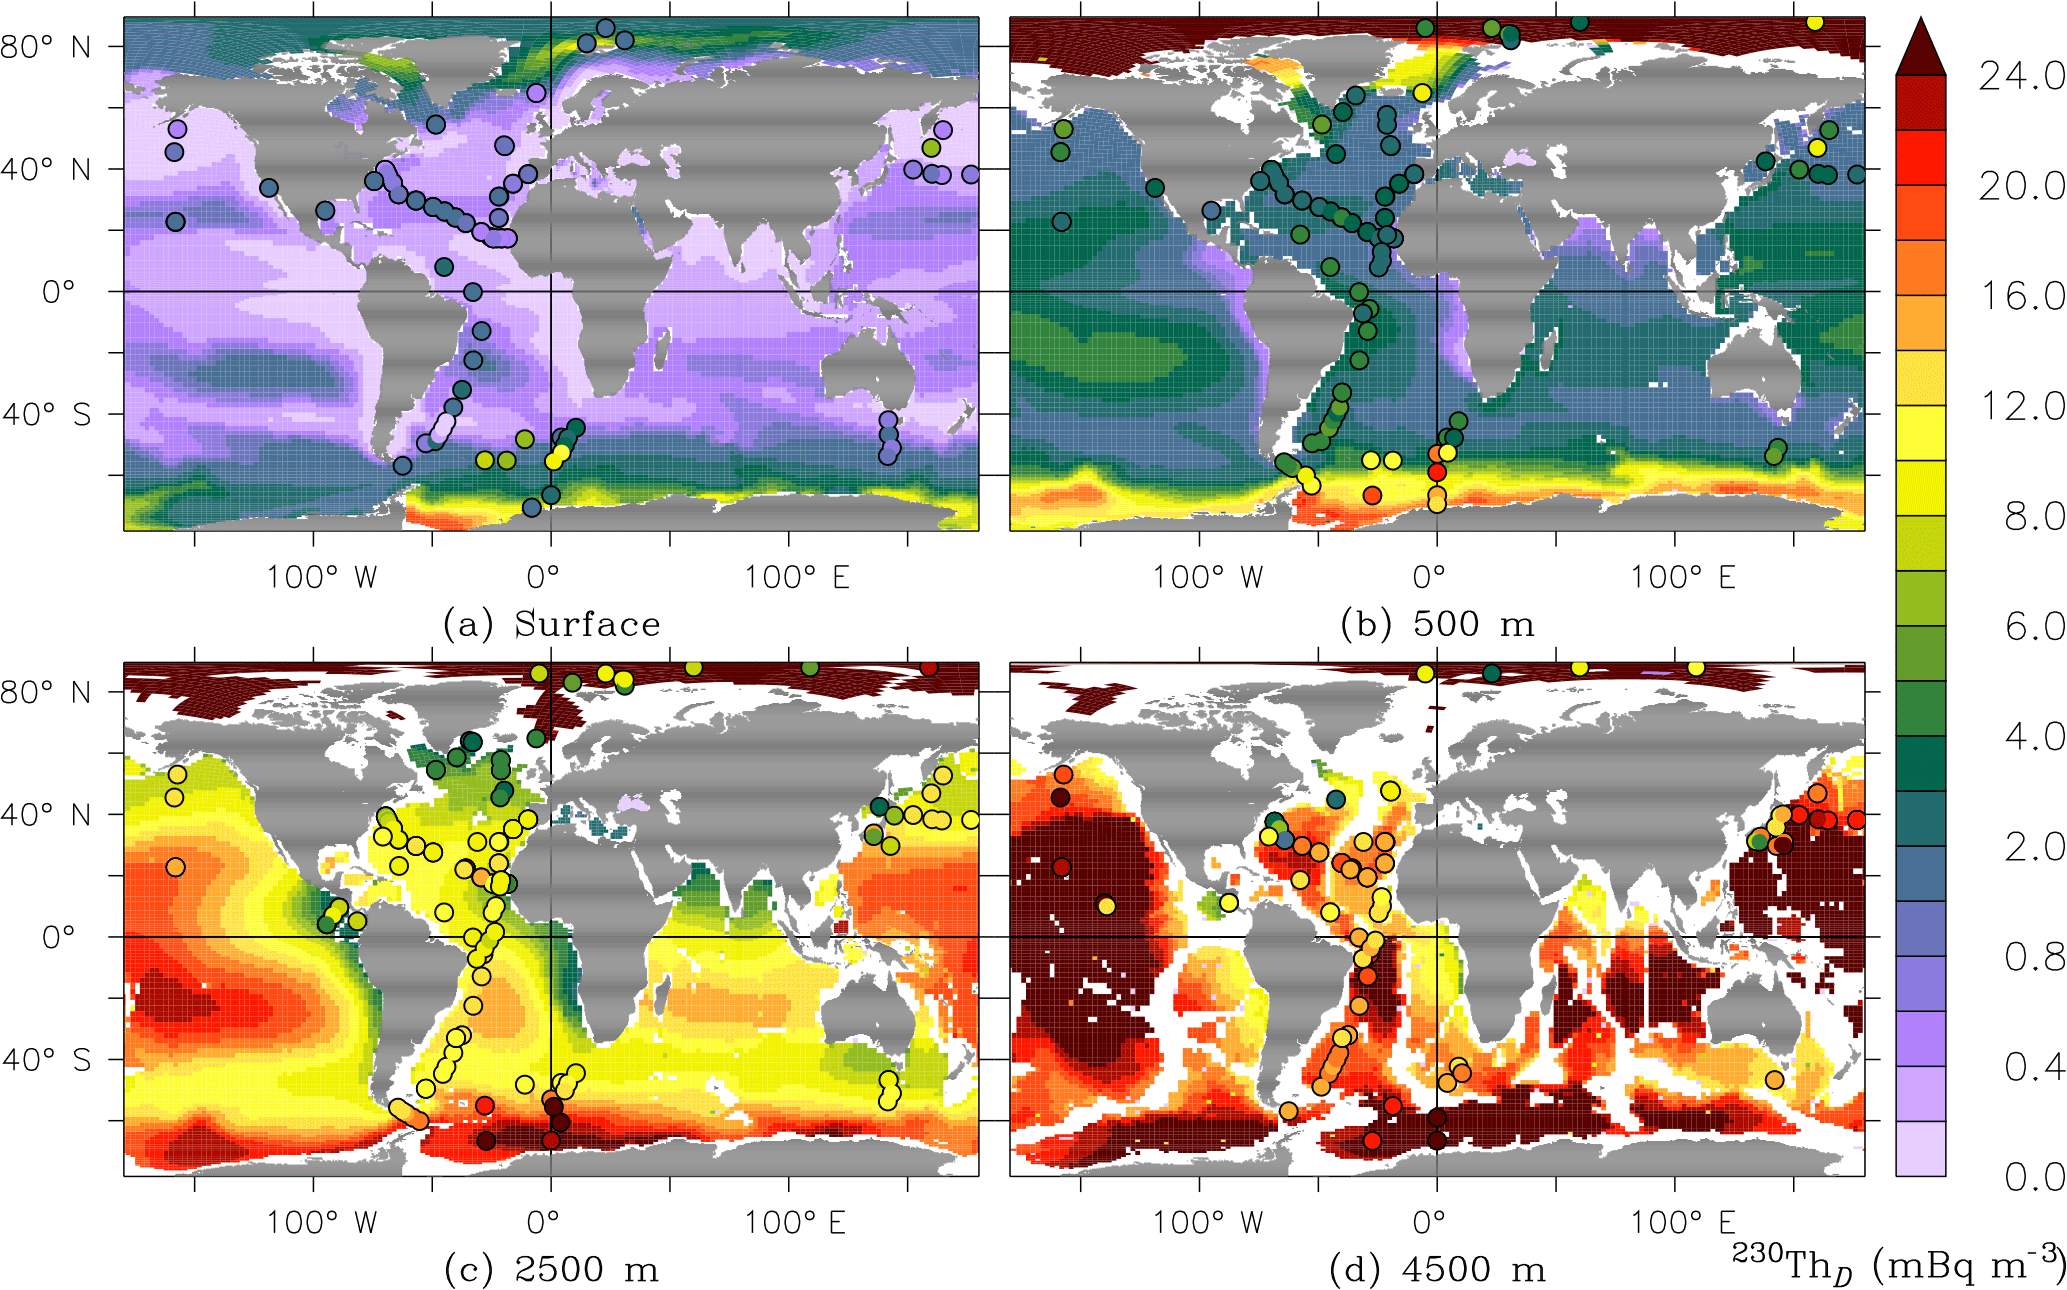
Figure 6The dissolved thorium-230 activity at four depth levels (mBq m−3); observations as discs on the same colour scale.
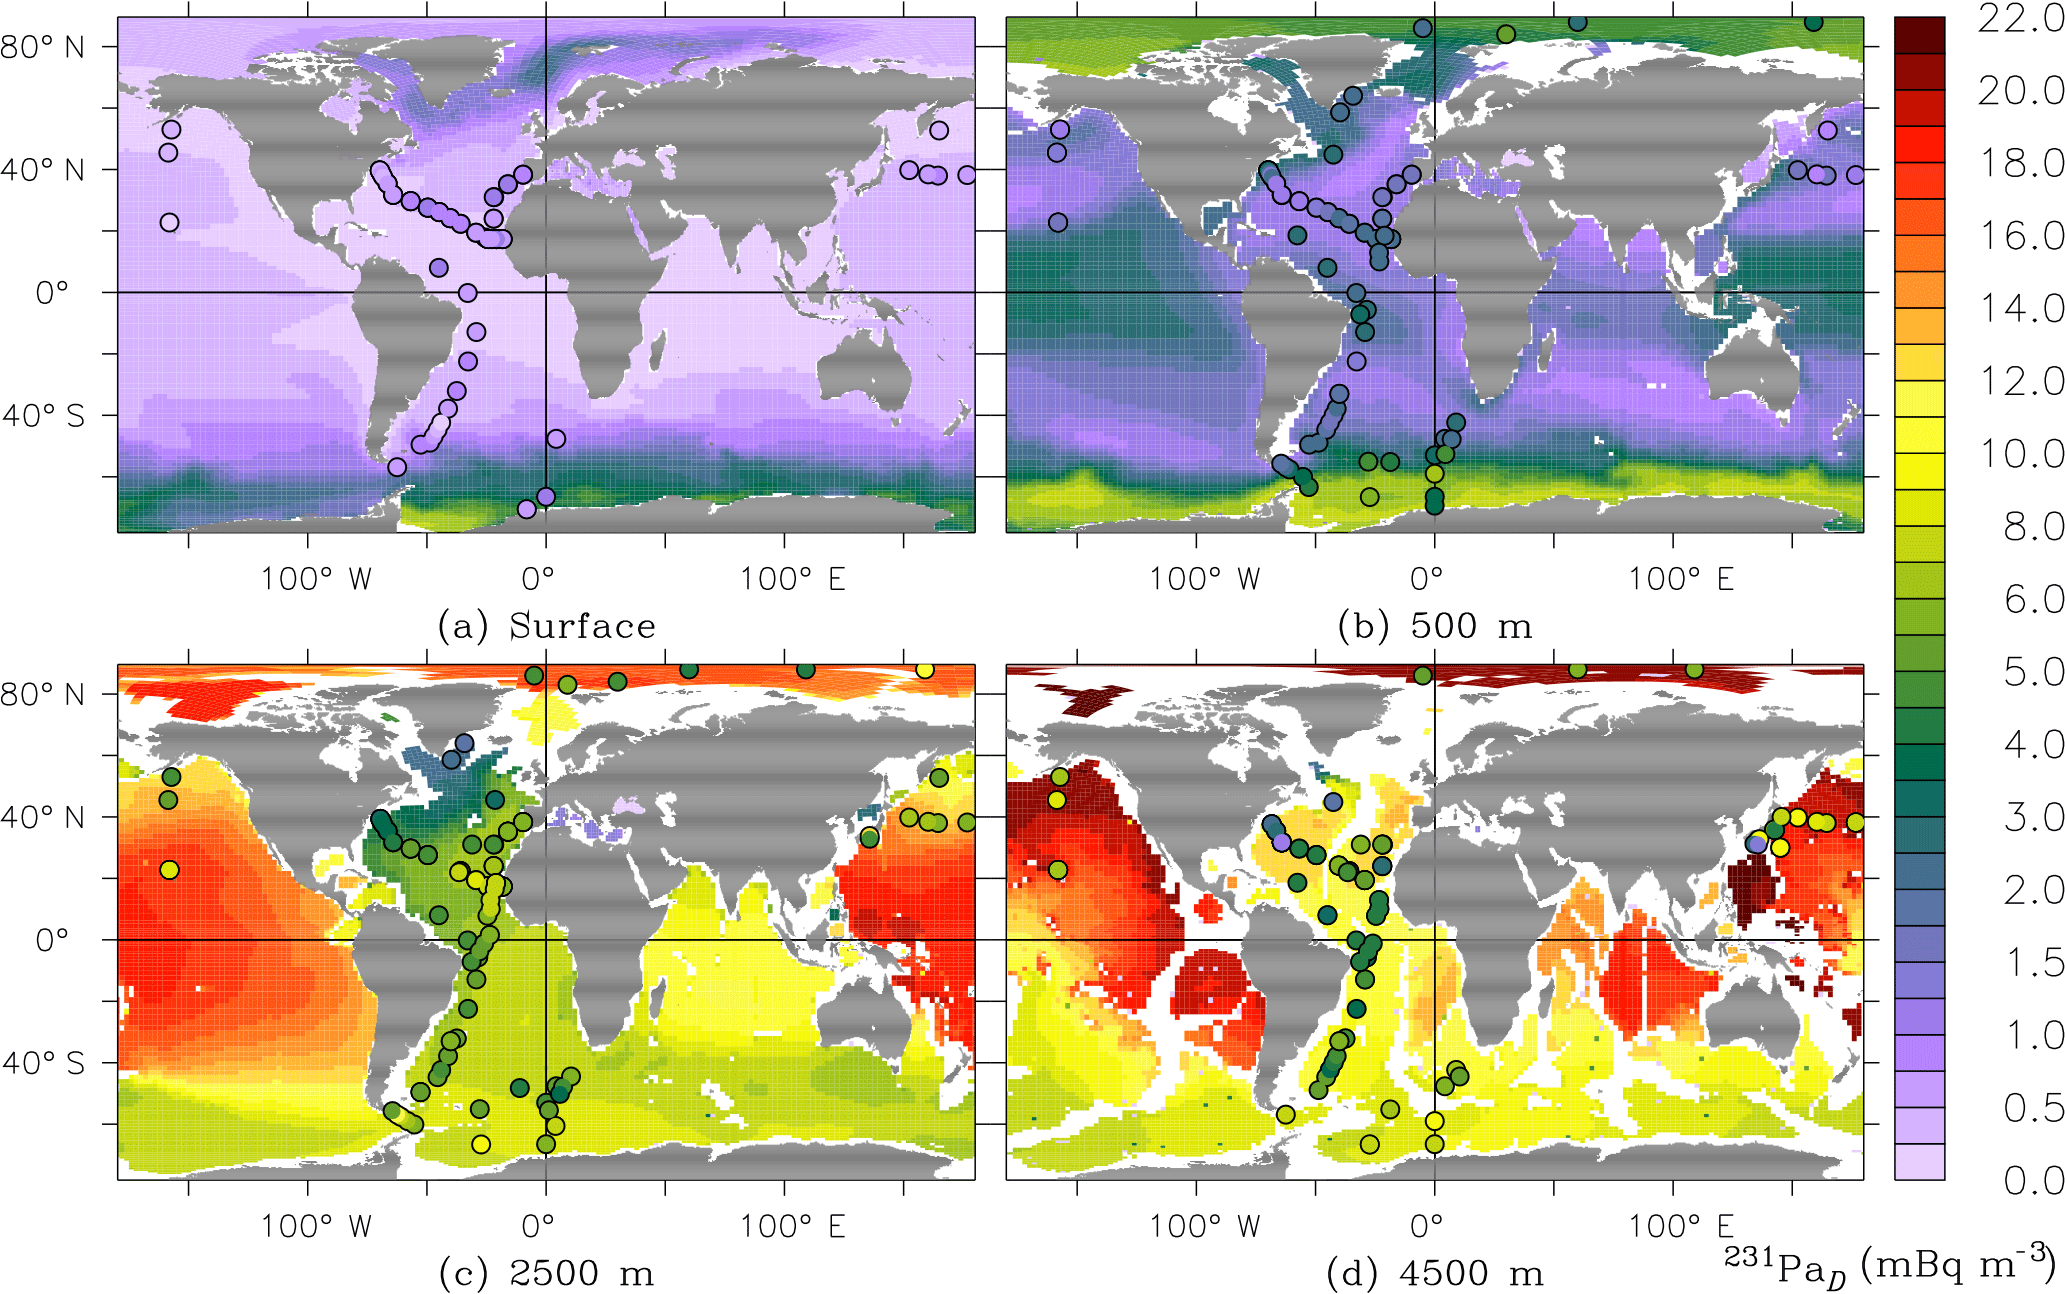
Figure 7The dissolved protactinium-231 activity at four depth levels (mBq m−3); observations as coloured discs.
[230Th]D stands for the concentration of 230Th that is in the dissolved phases. Similarly, [230Th]S is the concentration of 230Th that is adsorbed onto small particles S, [230Th]B the concentration adsorbed onto big particles B and similarly for 231Pa. The modelled dissolved distributions of 230Th and 231Pa are underestimated at the surface (Figs. 6 and 7). Below the surface, [230Th]D is much better captured by the model (also Fig. 8a for the GA03 transect). However, observations show lower values near the bottom in the western part of the GA03 section and at 45∘ W associated with more intense scavenging related to respective nepheloid layers and manganese oxides from hydrothermal vents, which are not produced in the simulation (Fig. 8a and b).
In the intermediate and deep waters of all the oceans, modelled [231Pa]D is generally of the correct order of magnitude but is strongly overestimated below 2500 m of depth (Fig. 8b), especially in the Pacific Ocean (Fig. 7c, d).
The concentrations of the adsorbed phases of 230Th at GA03 are presented in Fig. 8c and e. In the deep ocean, modelled [230Th]S and [230Th]B have lower values than [230Th]D, which is consistent with observations. Furthermore, compared with Dutay et al. (2009), we have notably improved [230Th]S and [230Th]B. Other global modelling studies have not reported adsorbed concentrations of 230Th and 231Pa. However, the model still underestimates the observed [230Th]S and [230Th]B.
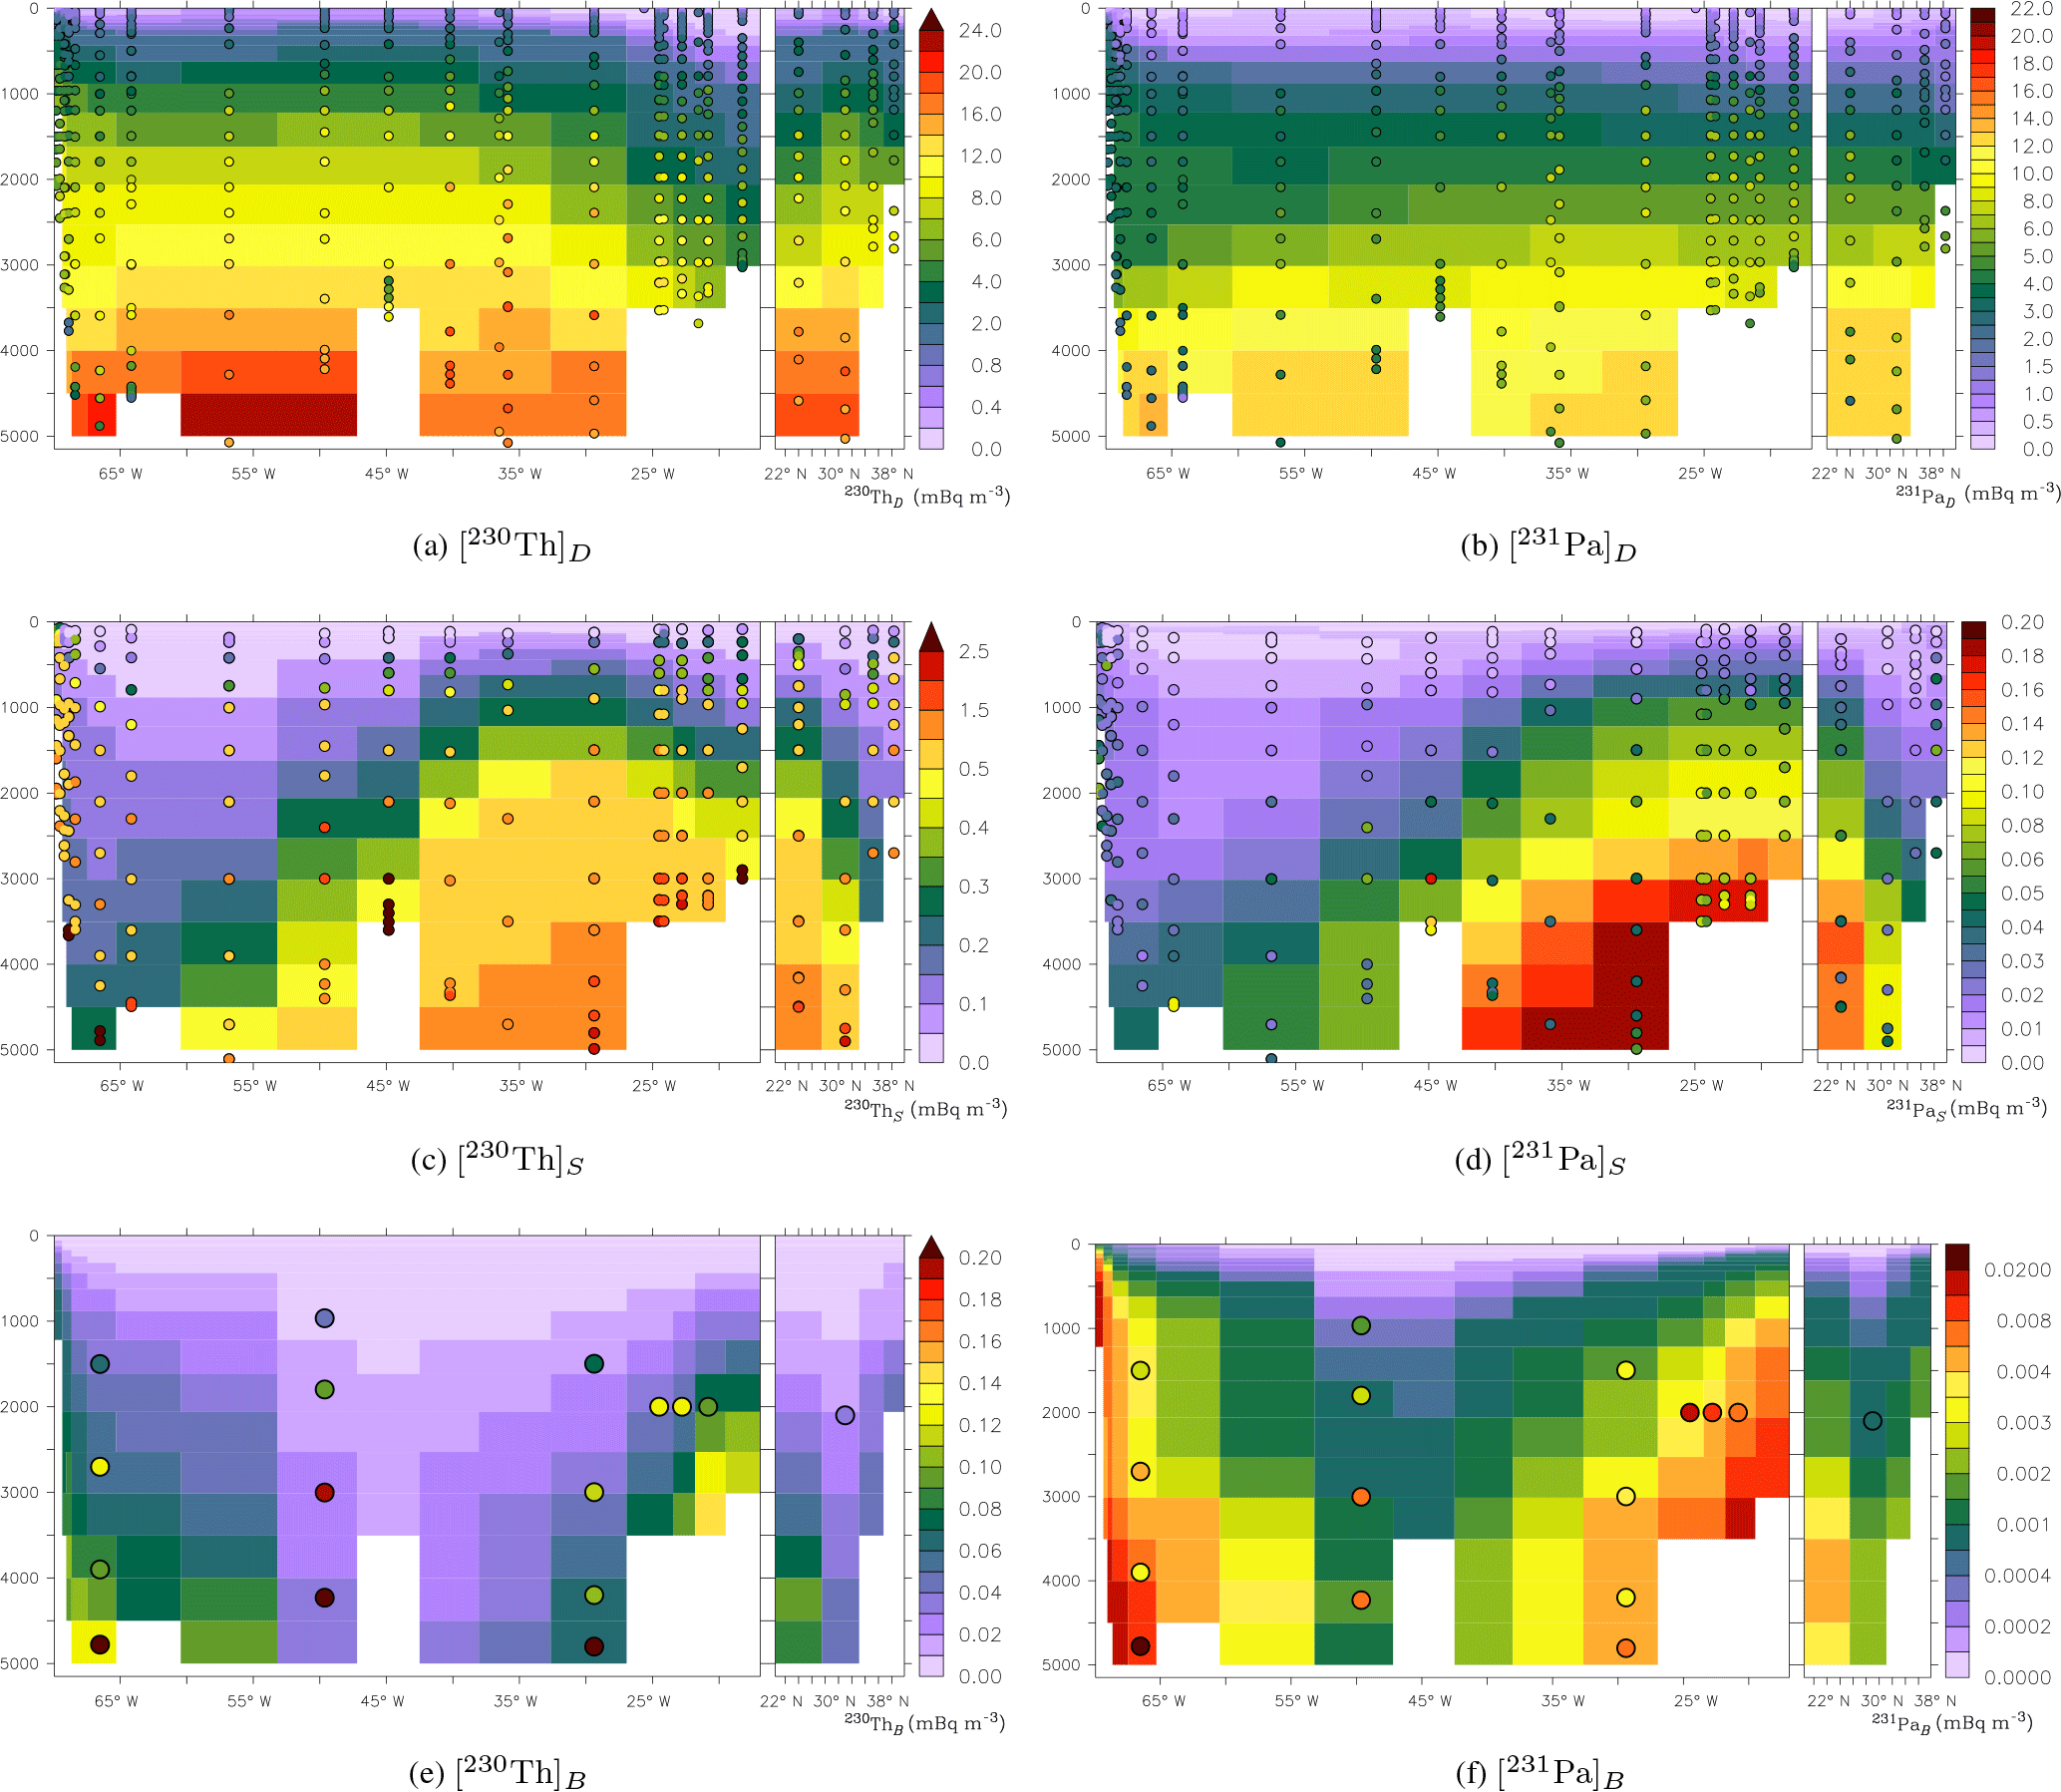
Figure 8Radionuclide concentrations at the GA03 North Atlantic GEOTRACES transect. Panels (a) and (b) display dissolved concentrations, panels (c) and (d) show the amounts on small particles, and panels (e) and (f) those on big particles. Everything is in mBq m−3. Observations (Hayes et al., 2015a) are shown as coloured discs.
Contrarily, small 231Pa particles are overestimated in our model below 1500 m at the GA03 transect (Fig. 8d). Big 231Pa particles are simulated more realistically (Fig. 8f).
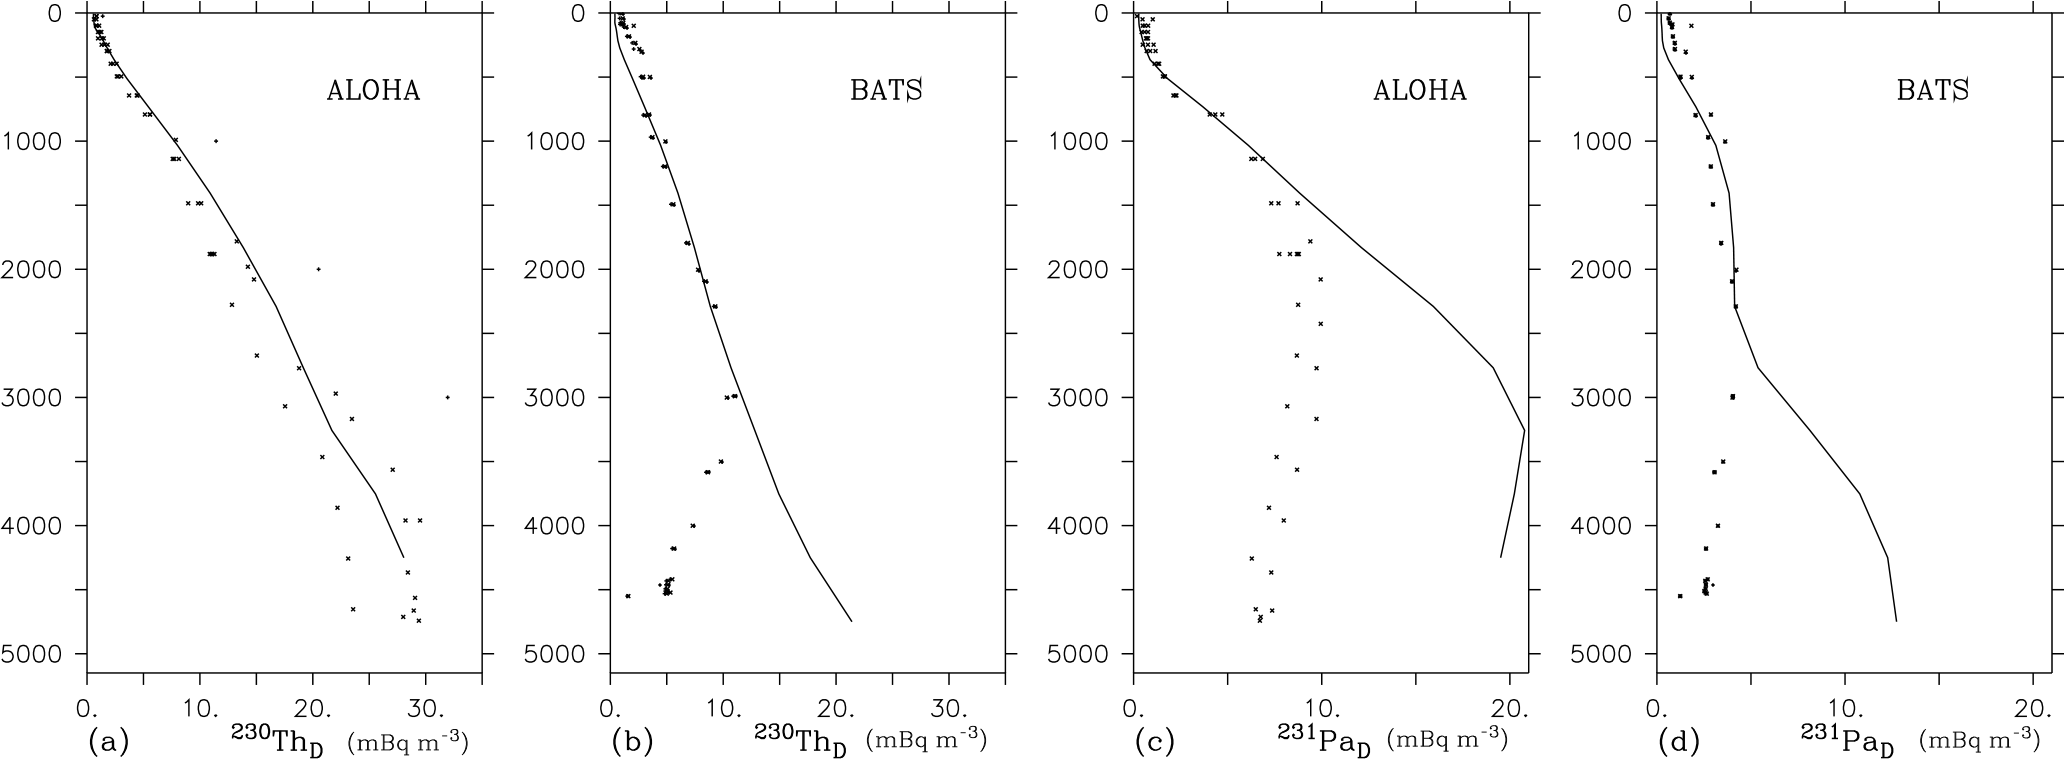
Figure 9Radionuclide concentrations in mBq m−3 at stations in the North Pacific (around the ALOHA station, 158∘ W, 23∘ N) and North Atlantic Ocean (around the BATS station, 64∘ W, 29∘ N). The left two panels (a, b) display [230Th]D, and the right two (c, d) [231Pa]D. The line is the model, and the speckles are the observations.
To clearly show the change in 230Th and 231Pa with respect to depth, profiles are plotted in Fig. 9. [230Th]D is linearly increasing downwards, which matches the observations, but below 3000 m near Bermuda, [230Th]D increases where it should decrease according to the observations. The shape of [231Pa]D matches that of the observations for the upper 2 km, below which our model overestimates the observations by up to a factor of 4 at the bottom of the ocean.
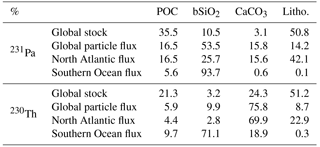
Table 4Relative global budget of 231Pa and 230Th in the different particulate phases (“global stock”) in percentages. Globally averaged fluxes in the different phases (“global particle flx”), and the same but for the North Atlantic Ocean (44–24∘ W, 25–56∘ N) and the Weddell Sea (44–24∘ W, 76–63∘ S), all in percentages associated with each particle type.
Globally in the model, only 0.3 % of the 231Pa sits in the particulate pool, and for 230Th this is 1.3 %. The rest is in the dissolved phase. Observational data show that more than 10 % of 230Th sits in the particulate pool, typically adsorbed onto small calcium carbonate particles. The underestimation by our model can be explained by the fact that we only have big, fast-sinking CaCO3 particles in the model. Since the big particles are removed quickly, these cannot act as a realistic CaCO3-associated 230Th pool without depleting 230Th, and thus we underestimate the particulate radionuclide concentrations.
Table 4 gives two types of information on the adsorbed phases. One is the amount fraction of radionuclide adsorbed onto each particle (“global stock”). The other is the fraction of the flux carried by each type of particle (the other rows) for the global ocean and two regions of the ocean. No distinction is made between big and small particles (they are summed). The stock and the flux are not necessarily the same because the big particles have a different settling velocity from the small particles. For example, only for POC and lithogenic particles do we have slowly sinking particles on which much of the radionuclides are adsorbed, whereas the big affinity of Pa to bSiO2 mostly results in a strong export (and similarly for Th on CaCO3).
Only a small amount of 230Th is adsorbed onto biogenic silica (3 %), though the amount is larger for 231Pa (11 %). However, the global settling flux of 231Pa is primarily (54 %) determined by bSiO2, particularly due to the high bSiO2 fluxes in the Southern Ocean. Most of the modelled particulate 231Pa and 230Th is on the lithogenic particles, but lithogenic particles account for only 14 % of the 231Pa flux and 9 % of the 230Th flux. If lithogenic particles from nepheloid layers were included, this fraction would be higher. The flux contribution is also different from what is in the pools when we look at CaCO3: only 24 % of the 230Th is on calcium carbonate, but CaCO3 is responsible for 76 % of the 230Th export. These discrepancies between the contribution of each particle type to the flux and to the stock of radionuclides arise from the different settling velocities for each type of particle.
The relative contributions of the different particulate phases also vary for different regions of the ocean. Most notably, biogenic silica is responsible for 94 % of 231Pa export in the Southern Ocean.
Compared to Dutay et al. (2009), the 230Th profile shape is improved, but only to a small extent due to the large improvement in the POC representation (Aumont et al., 2017) because the POC accounts for only 6 % of the vertical transport of 230Th (Table 4). The improvement is mostly due to the addition of lithogenic dust particles and the adjusted CaCO3 dissolution. Lithogenic particles and CaCO3 hardly dissolve compared to POC and hence the downward particle flux remains constant, which is in agreement with 1-D models which show linear profiles of 230ThD (Roy-Barman, 2009).
5.4 Sedimentation flux ratio of 231Pa∕230Th
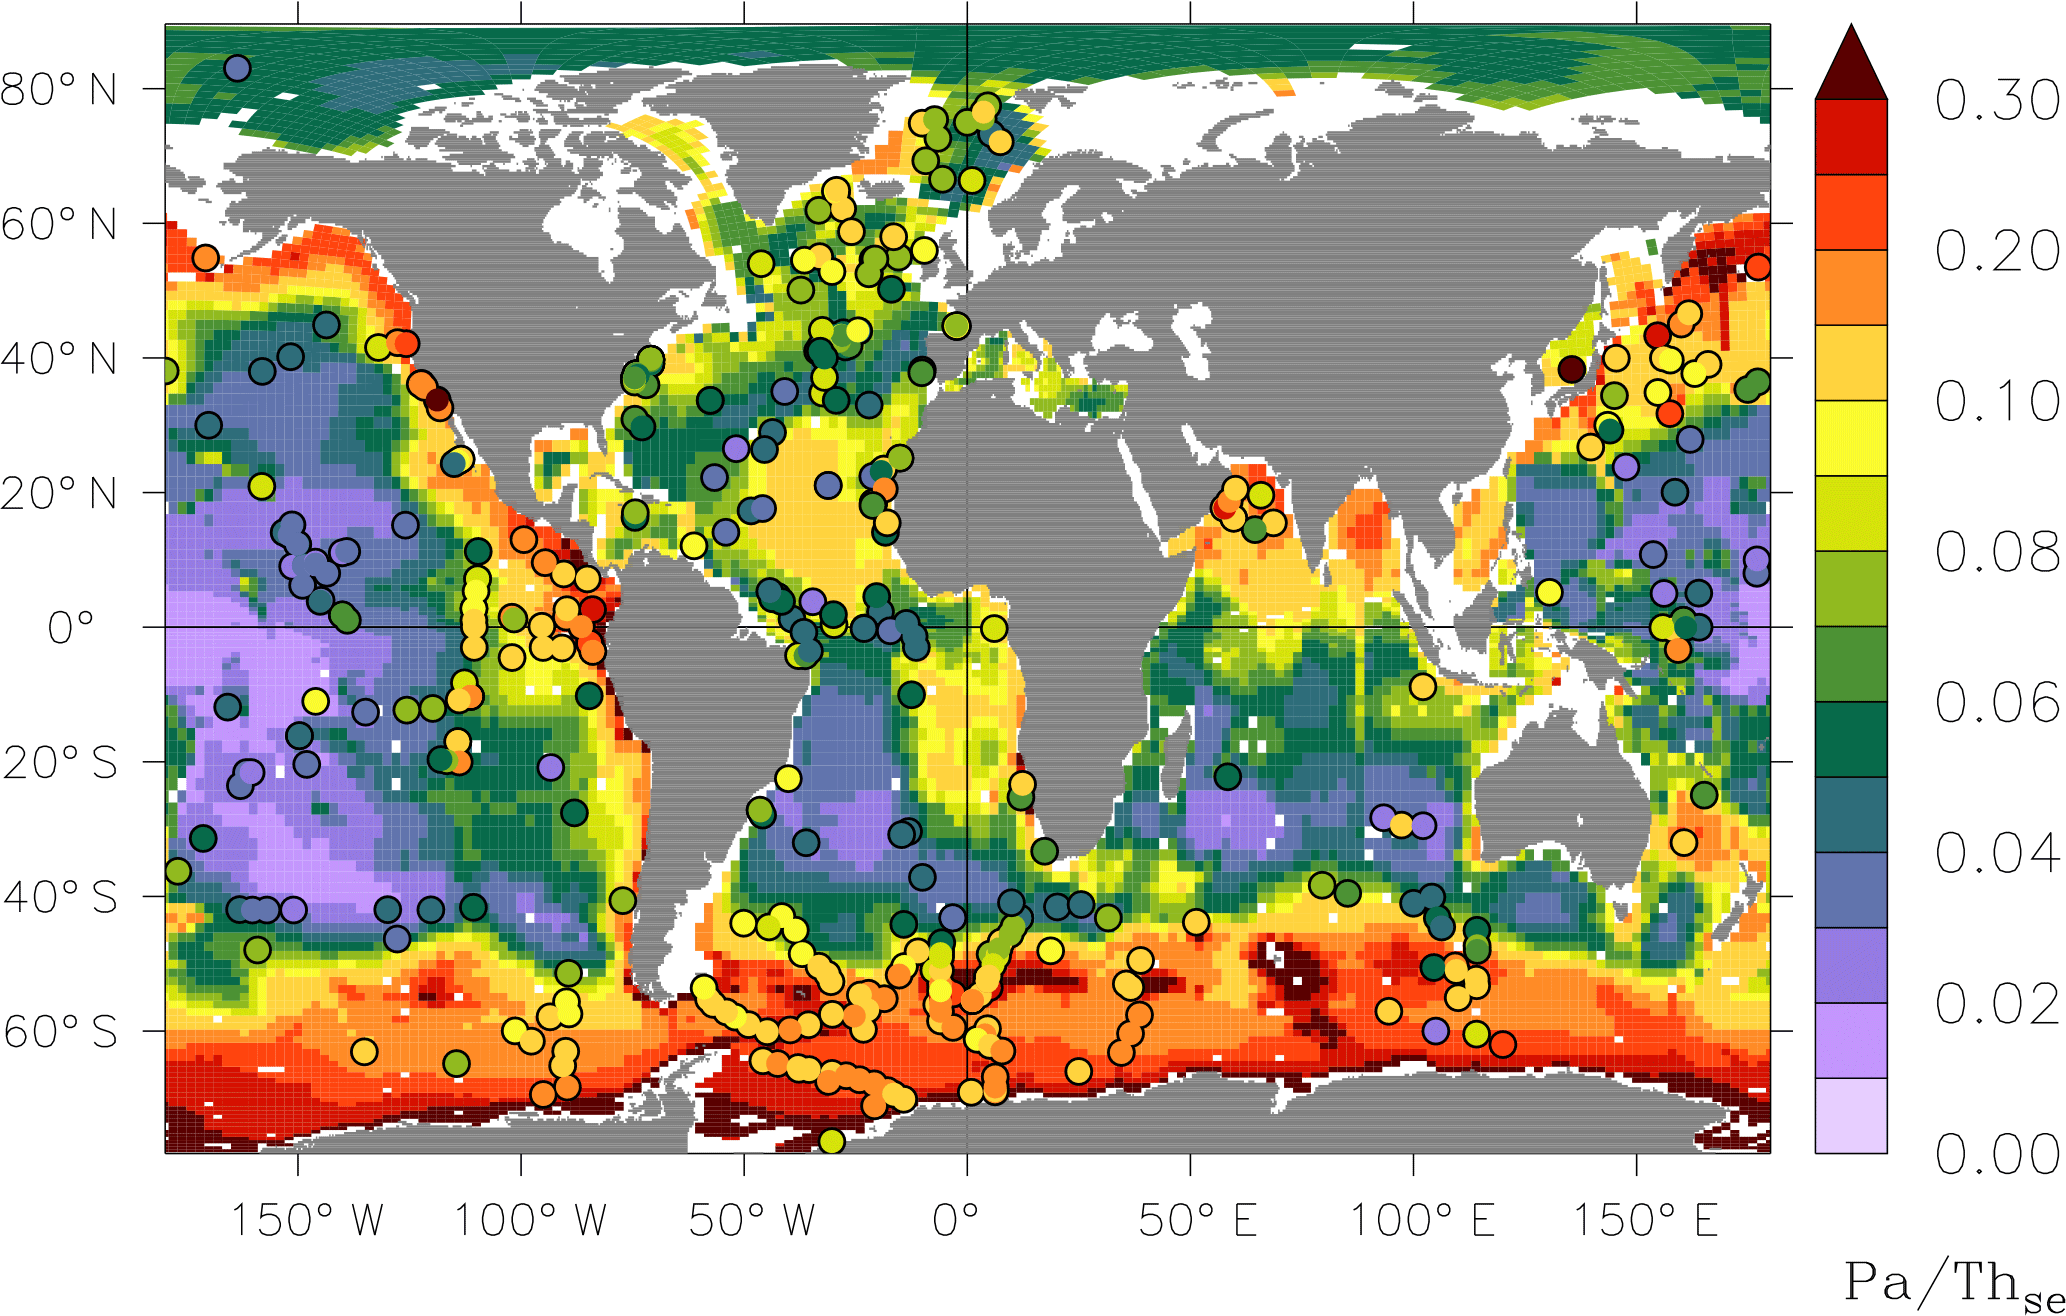
Figure 10Sedimented 231Pa∕230Th ratio. Top core measurements are presented as coloured discs. This is the standard simulation with .
The sedimentation flux of the total adsorbed 231Pa∕230Th ratio captures the general patterns of the upper sediment core 231Pa∕230Th concentration ratio (Fig. 10). Consistent with observations, the model produces more elevated 231Pa∕230Th ratio values in the Southern Ocean, the northern part of the Indian Ocean, the Pacific Ocean and along the coastal upwelling regions. However, at some places, like much of the Southern Ocean, our model tends to overestimate the ratio derived from the sediment core observations.
We succeed in generating the global patterns of the dissolved nuclide concentrations. However, we underestimate radioactivities in the surface waters (Figs. 6a and 7a). This shortcoming may be due to the instant equilibration between the dissolved and the adsorbed phases (Henderson et al., 1999). After the decay of U into 231Pa and 230Th, the tracers instantly adsorb onto the particles in the surface ocean and are exported from the mixed layer. The equilibrium scavenging approach is commonly used in Pa∕Th modelling (Dutay et al., 2009; Gu and Liu, 2017; Siddall et al., 2005). It allows the model to use partition coefficients that can be directly constrained by observations (although consensus values for these coefficients are still not available). A non-equilibrium approach to scavenging could be considered, but it would necessitate the use of adsorption and desorption coefficients (k+, k−) that are currently very poorly constrained by observations. Observations shows equilibrium partition coefficient K values varying (decreasing) with particle flux (Chase et al., 2002; Roy-Barman et al., 1996), and we apply these in our simulation (i.e. lower K values for large, fast-sinking particles). This parameterisation produces effects that are similar to those of a non-equilibrium system for fast-sinking particles.
The reversible scavenging model uses partition coefficients Kij for the different isotopes i and particles j. Many studies provide constraints on these coefficients but estimates vary strongly between different studies. Small particles are the most important scavengers and largely control the shape of the vertical profile of the tracers (Dutay et al., 2009). This also shows from sedimentary isotope records (Kretschmer et al., 2011). This is explained by the specific surface of small particles, which is larger than that of big particles. Therefore, higher adsorption values are set for small particles compared to the bigger particles of the same type (namely, 5 times higher for POC and 10 times higher for lithogenic particles). Compared to Dutay et al. (2009), we succeed in simulating the tracer concentrations using reasonable K values. This is due to improvement in (especially small) particle concentrations, which were generated with the lability parameterisation of POC (Aumont et al., 2017), the change in the CaCO3 dissolution parameterisation and the addition of lithogenic dust in our ocean model. This shows that at least two particle size classes are needed to simulate dissolved and particulate thorium and protactinium. Our model does not include small particles for all types (there are neither small CaCO3 nor small bSiO2 particles), even though we expect that better results can be reached upon adding those particles akin to small POC and small lithogenic particles.
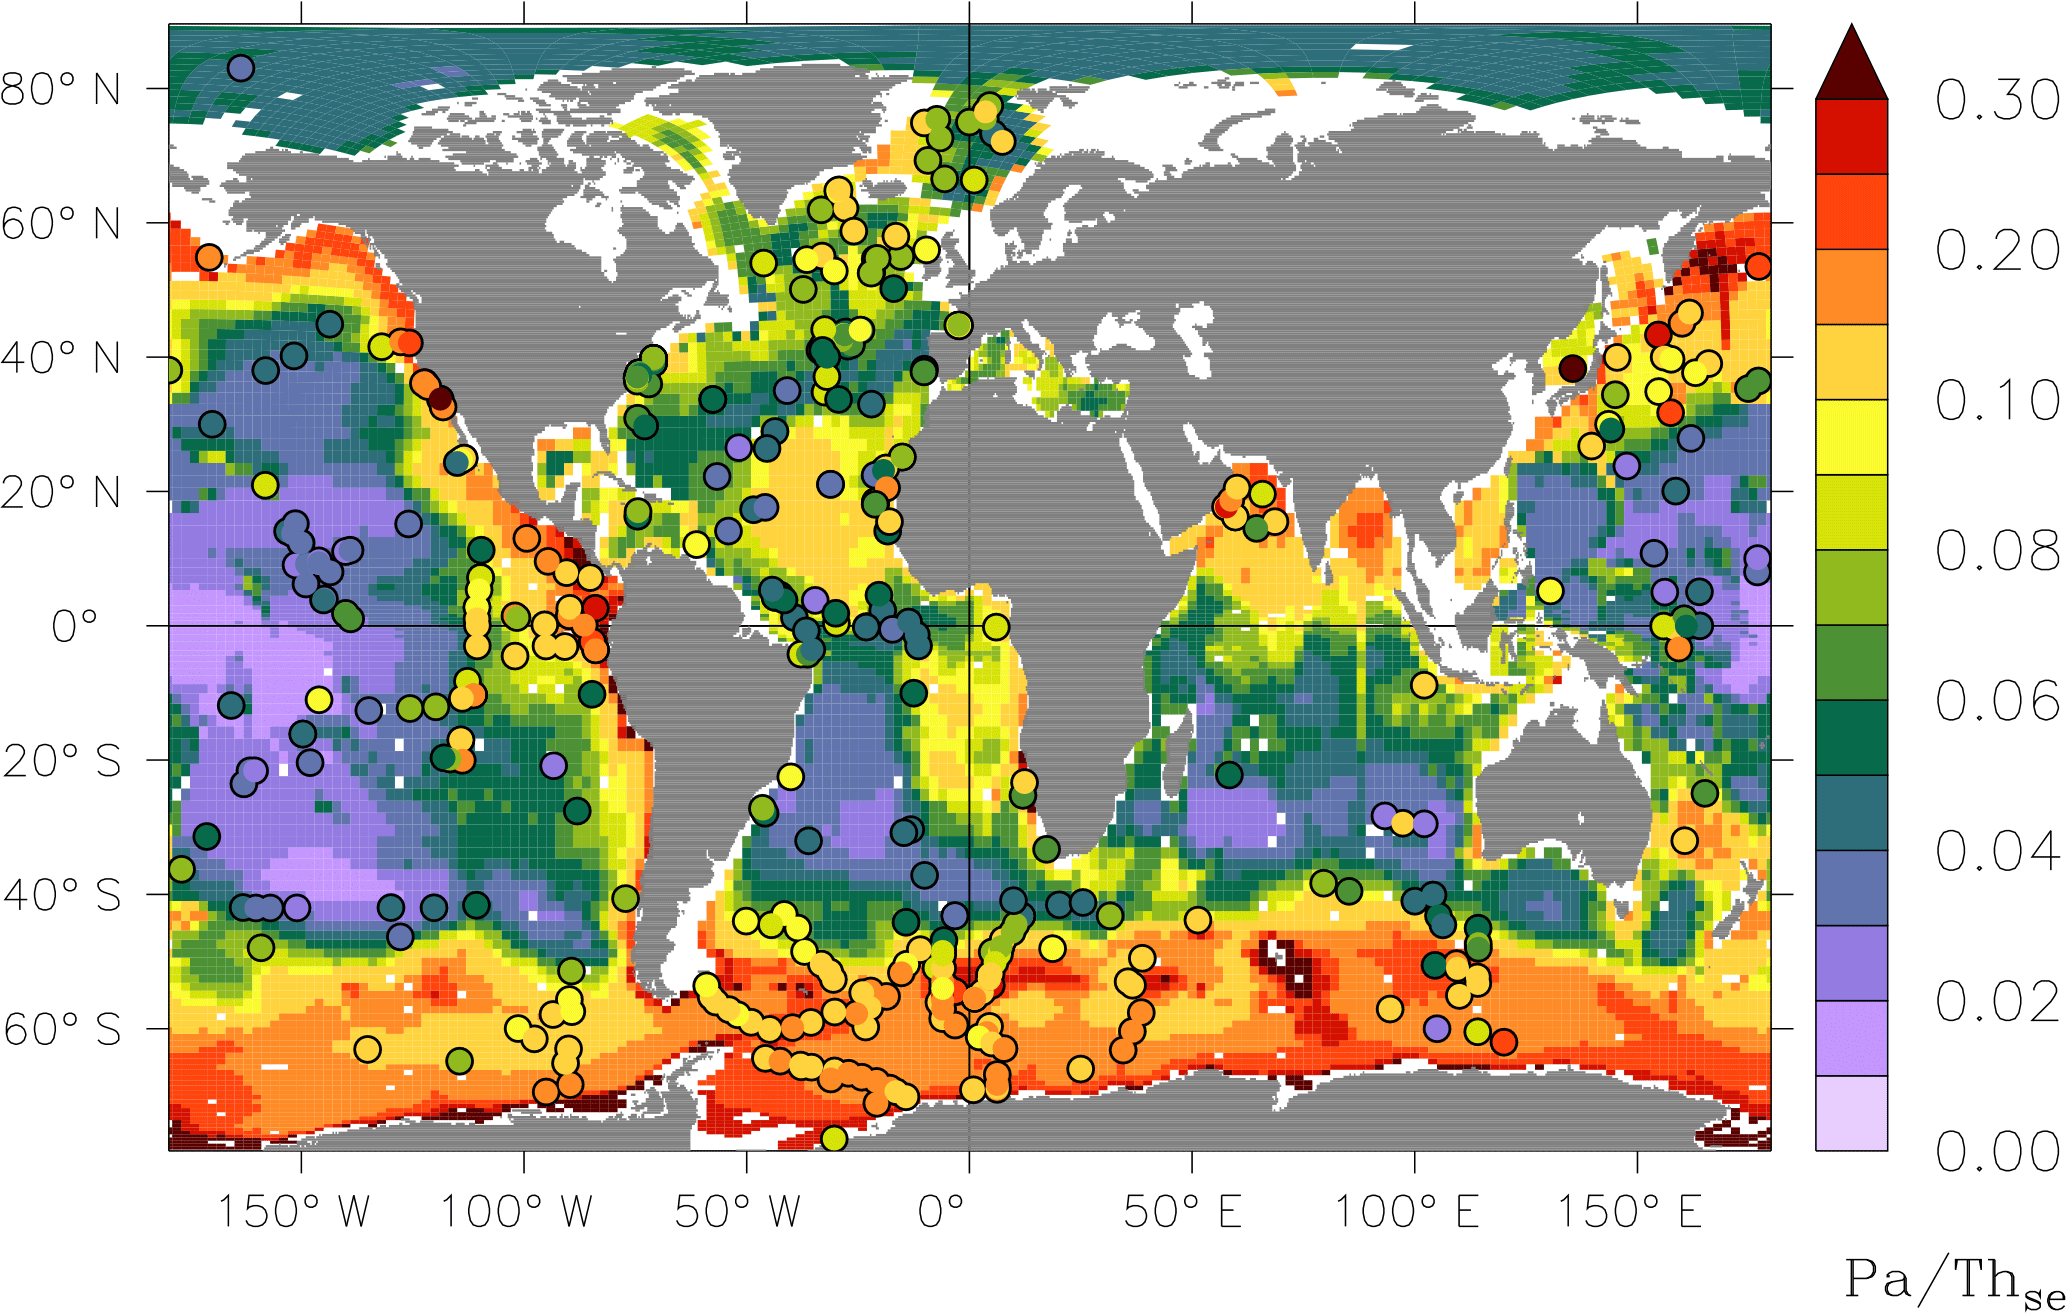
Figure 11Sedimented 231Pa∕230Th ratio when we set . Top core measurements are presented as discs.
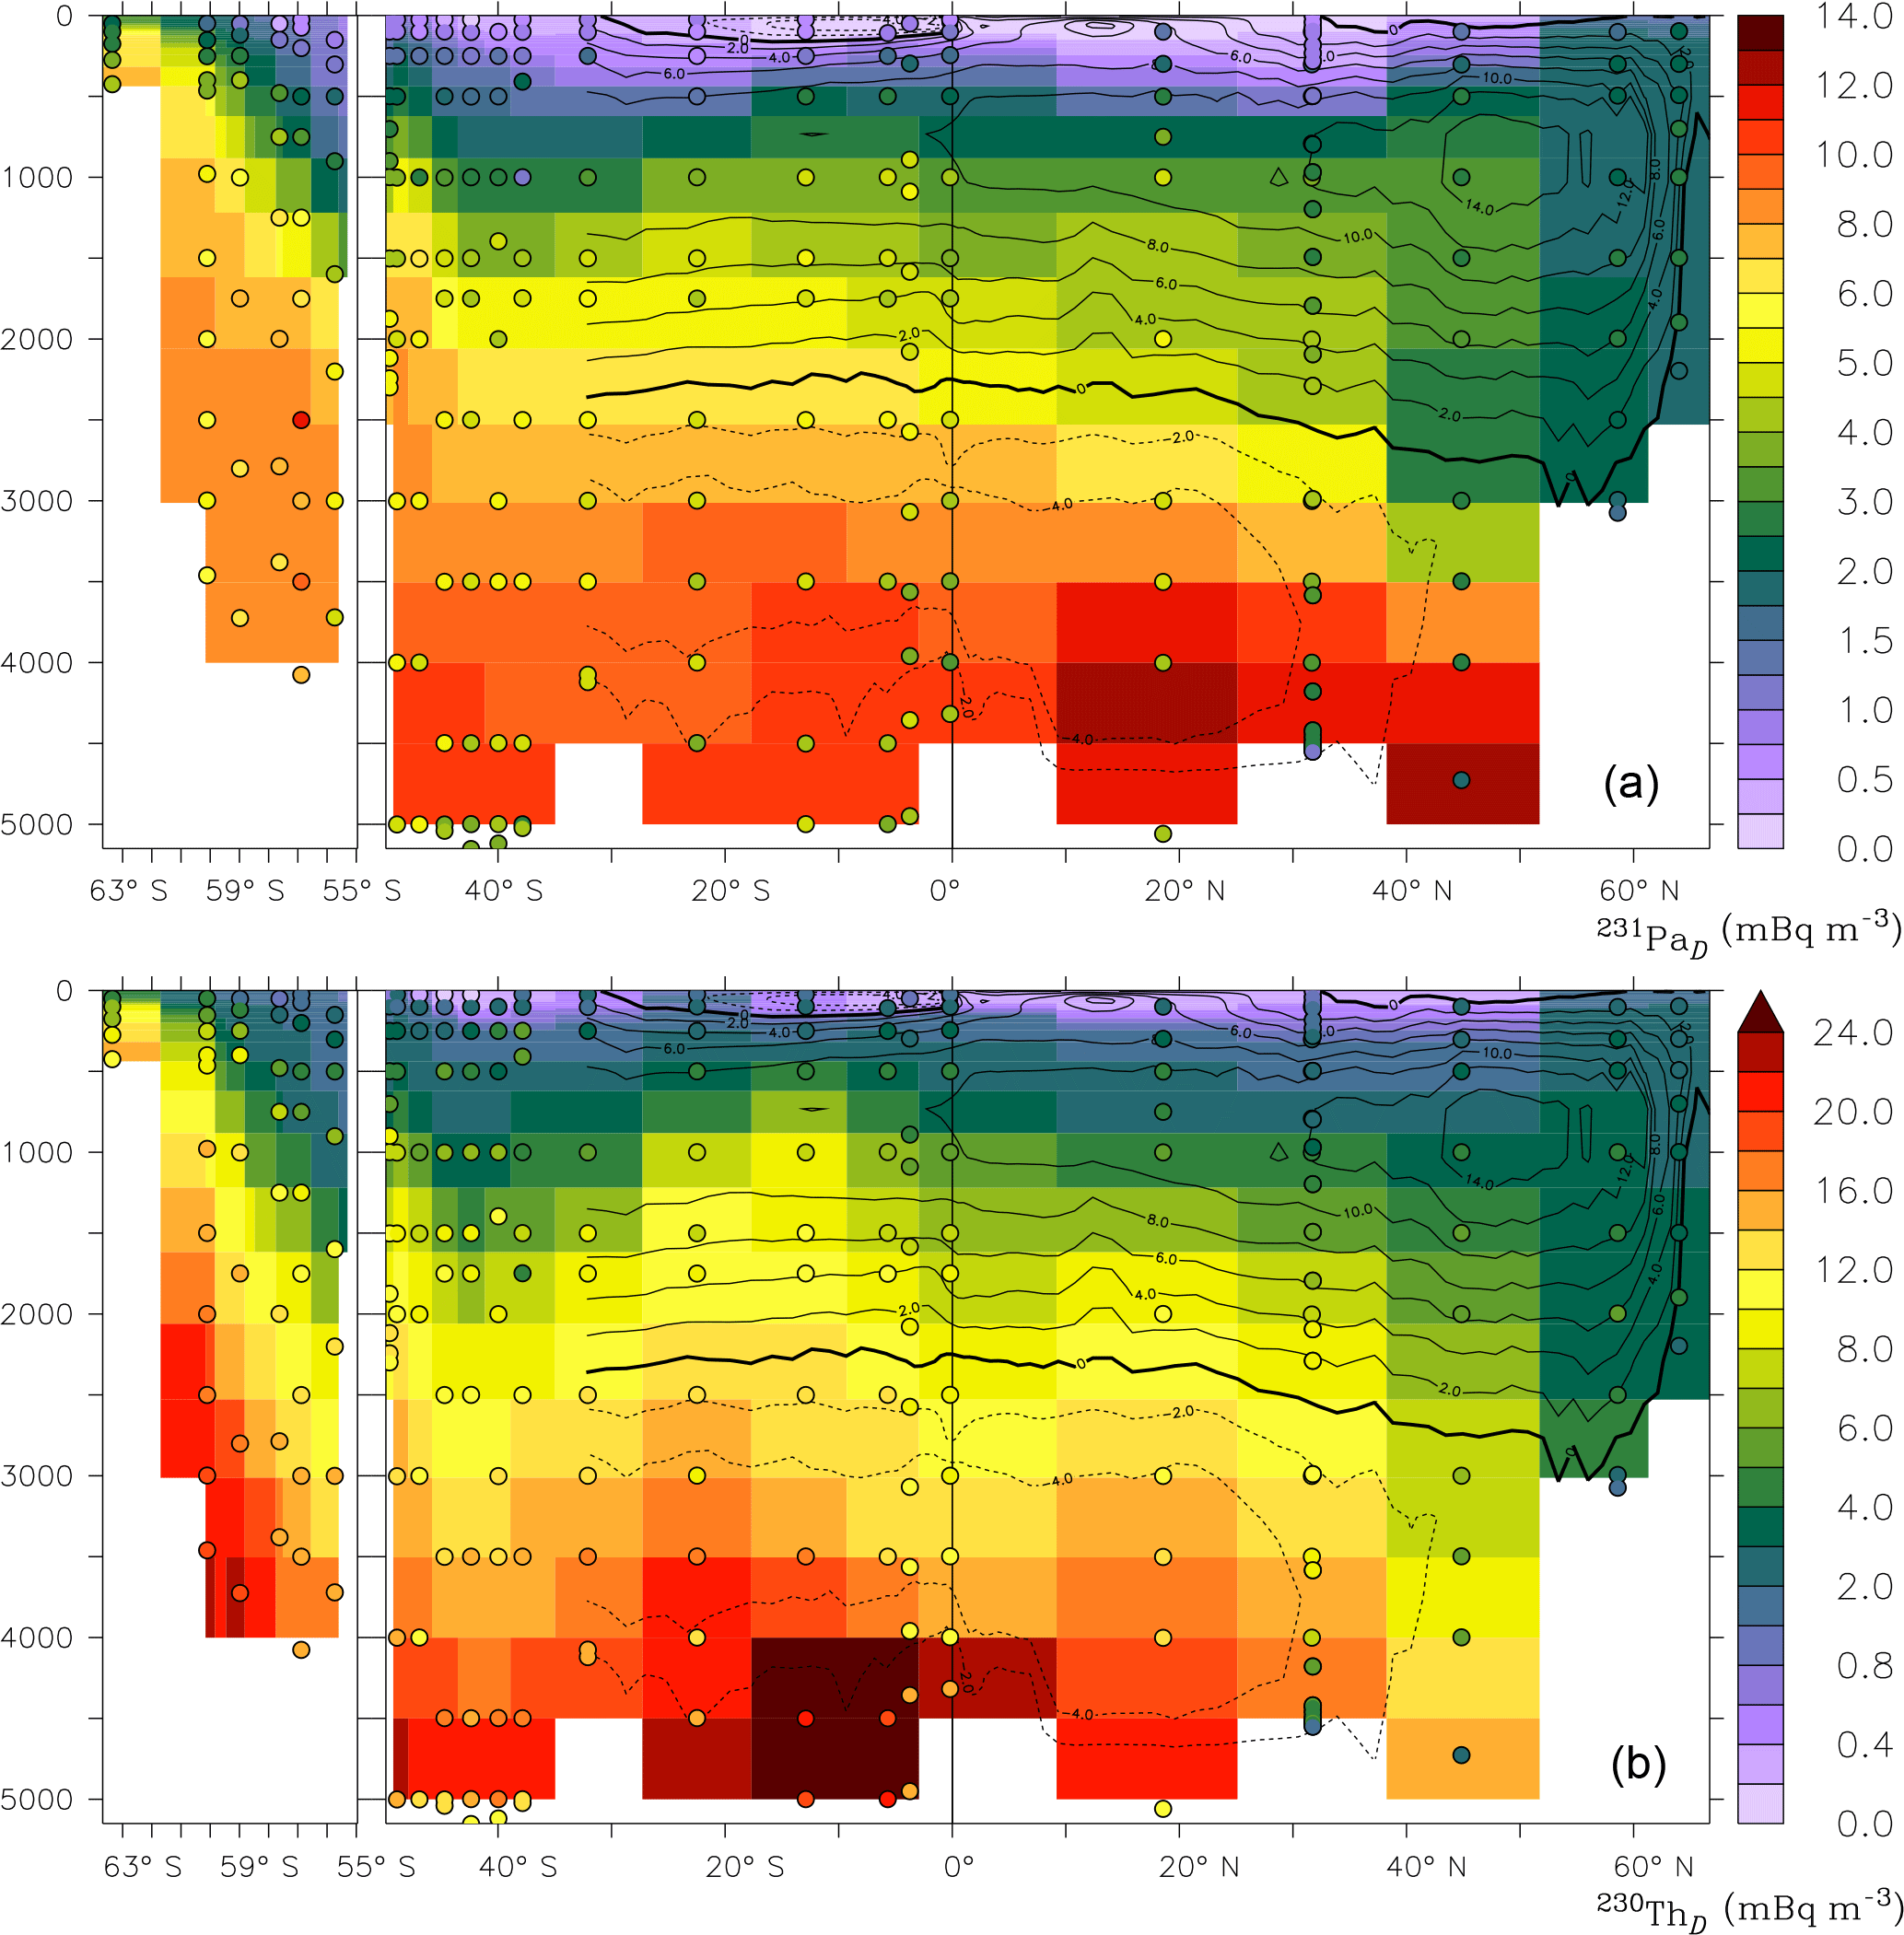
Figure 12Dissolved protactinium-231 (a) and thorium-230 (b) at the Drake Passage (GIPY5) and western Atlantic (GA02) transects (mBq m−3); observations as discs. The Atlantic OSF, in Sv, is superimposed as a contour.
On the GA02 transect, the correlation coefficient r of the data–model comparison of [230Th]D is 0.80, which is close to what was reported by Rempfer et al. (2017) in their simulations without bottom-boundary scavenging. On the GA03 section, r=0.78. The correlations between the model and observations are presented as scatter plots (Supplement Fig. S2).
There are a couple of interesting features to note on the comparisons. Firstly, the hydrothermal plume over the ridge results in 230Th-poor seawater that is not reproduced by the model (red triangle in Fig. S2, GA03). Secondly, in the western boundary currents, very low dissolved 230Th concentrations are observed due to strong nepheloids and/or possibly strong deep ventilation from the north. Neither of these processes is represented in the model. The lack of nepheloids has an especially large impact on the GA02 transect, which has a relatively large number of measured profiles near the western boundary. Finally, between 32 and 20∘ W, the model tends to underestimate 230Th. The value of the correlation index is not that important because the goal of this study is not to give a perfect model–data comparison.
The provided dust flux does not distinguish between different dust particle sizes or types. Furthermore, dust deposition is uncertain; therefore, we chose a dust flux that was available to the ORCA2 configuration of NEMO, and its biogeochemistry has been tested with that dust flux. However, given the significant impact of dust particles on thorium and protactinium concentrations, it would be useful to look into the effect of different dust deposition fields and using different dust particle size classes. A good model of 230Th (and other isotopes of thorium) could even constrain the sporadic and uncertain dust deposition, but all this falls outside the scope of the present study.
Our model adds 80 % of the dust deposition into the fast-sinking lithogenic particle compartment (corresponding to ∅>51 µm), and only 20 % goes into the slowly sinking compartment (corresponding to ∅≤51 µm). This is necessary to reproduce the distributions of lithogenic particles. However, airborne dust particles typically have a diameter smaller than 20 µm (Knippertz and Stuut, 2014) and thus fall clearly within the small size class of less than 50 µm. Recently, there have been observations of aerosols larger than 20 µm (van der Does et al., 2016), but they do not reach far enough into the atmosphere above the open ocean to explain the high concentration of big lithogenic ocean particles. The explanation for the apparently required high fraction of big lithogenic particles is that smaller aerosols aggregate in the upper layers of the ocean. Moreover, though more hypothetically, there may be strong aggregation with biogenic particles just below the surface, below which the aggregates partly disaggregate again to result in the ∼0.2 big lithogenic fraction in the deep ocean (Fig. 5f).
The underestimation of lithogenic particle concentrations at the western boundary is expected. The reason is that we only have dust deposition as a source of lithogenic particles, whereas nepheloid layers are not included. Nepheloid layers are at least locally an important source of lithogenic (and biogenic) particles (Lam et al., 2015). With the transport of 230Th and 231Pa through the western boundary current, a significant portion may be scavenged. Moreover, the periodic transport through the North Atlantic Gyre would result in lower [230Th]D and [231Pa]D throughout a large part of the North Atlantic Ocean, possibly improving the concentrations in the deep ocean. Therefore, it will be useful to include nepheloid layers in the future. We have not done this so far because we do not know how to model nepheloid layers. Except for trivial models, like the one of Rempfer et al. (2017), who forced an additional constant scavenging rate in the bottom box of the ocean model, no large-scale prognostic nepheloid models have been developed.
We overestimate the radionuclide activity in the deep ocean, which is partly because we underestimate particle concentrations. Thorium adsorbs especially well onto lithogenic particles, which are underestimated in the western Atlantic Ocean (in the subsurface, west of about 43∘ W, Fig. 5e). Below 2 km of depth, POC is also underestimated (Fig. 5a), even though the lability parameterisation improved the distribution by over an order of magnitude compared to previous versions of PISCES (Aumont et al., 2017). Small POC and the small lithogenic particles are the only small particles. The overall underestimation of small particles in the deep ocean results in an overestimation of the radionuclides in the deep ocean. In our simulation, [230Th]D is not that much overestimated (outside the Arctic Ocean). However, [231Pa]D is strongly overestimated in the deep Pacific and Atlantic Ocean.
Clearly the model does not remove 231Pa efficiently enough from the deep ocean (Figs. 7c, d, 8b and 12a). Two likely reasons may be that the waters are not well ventilated in the model (older than in reality) or that there is not enough scavenging. The Atlantic OSF (Fig. S1) shows that the upper overturning cell is too shallow compared to observational studies, so there is too little ventilation. This means that 231Pa can build up in the deep water due to sluggish ventilation of the physical model (Biastoch et al., 2008; Dutay et al., 2002). Moreover, the AABW has weakened in the deep North Atlantic Ocean near the high [231Pa]D region (Fig. 12a), which may also contribute to the high dissolved 231Pa concentrations. The volume transport of the lower cell is about 6 Sv near 20∘ N and still 2 Sv near 40∘ N, which is in the order of magnitude of what is reported by the literature. Moreover, the relationship between sediment 231Pa∕230Th at any given site and the overturning circulation is very complex. In general, any increased opportunity for protactinium to scavenge would increase the sedimentary 231Pa∕230Th ratio. Specifically, a slower overturning would mean more Pa scavenging and a higher ratio “just downstream of the sites of deep water formation” (Luo et al., 2010). Similarly, relatively stronger scavenging of Pa means a higher sedimentary 231Pa∕230Th, which we can see in the Southern Ocean and some coastal areas where the concentration of bSiO2 is high. For these reasons, it is not obvious whether the weak overturning is large enough to explain the discrepancy between the modelled and the observed [231Pa]D.
In reality, there are many regions in the North Atlantic Ocean where there is sediment resuspension and where there are nepheloid layers (Gardner and Sullivan, 1981; Gardner et al., 2017; Lam et al., 2015). This is consistent with the fact that our model underestimates lithogenic particle concentrations in the western Atlantic Ocean (Fig. 5e). The additional lithogenic particles would scavenge more 231Pa, resulting in lower [231Pa]D. Even though the enforced scavenging occurs near the floor and the western boundary of the ocean, a strong flux of water passes through the latter region and is transported through the North Atlantic Gyre and through the rest of the Atlantic, diluting high tracer concentrations. The small POC and lithogenic particles are now underestimated in much of the deep ocean. They would contribute to lower radio tracer concentrations as well. Rempfer et al. (2017) confirmed that an additional bottom sink affects 231Pa and 230Th significantly. They used a homogeneous extra scavenger in their model grid's bottom grid cell. Therefore, it would be worth testing if a realistic distribution of nepheloids would result in the right amount of scavenging.
Other particles may include resuspended (nepheloidal) biogenic particles, but also manganese and iron hydroxides that are not included in our model, and a smaller class of calcium carbonate and biogenic silica particles in addition to the big particle classes that are already in the model. Manganese oxides are especially available near hydrothermal vents, but also throughout the Pacific Ocean in low concentrations but much higher than in the Atlantic Ocean. Indeed, it has been argued that hydrothermal inputs may provide additional removal of 231Pa and 230Th (German et al., 2016; Lopez et al., 2015; Rutgers van der Loeff et al., 2016), and recently this has been confirmed based on an analysis of the ∼10∘ S zonal GP16 transect in the Pacific Ocean (Pavia et al., 2017).
Finally, the particle concentration effect (Honeyman et al., 1988) should be taken into account in future models, particularly when regions of high particle concentration (e.g. ocean margins and nepheloid layers) are included.
6.1 Effect of scavenging by bSiO2 on the 231Pa∕230Th sedimentation flux ratio
Previously, it was suggested that Pa has a stronger affinity for bSiO2 than Th, i.e. (Chase et al., 2002; Dutay et al., 2009; Henderson et al., 1999). This “standard view” has weakened over time, so it is often accepted that (Rempfer et al., 2017; Rutgers van der Loeff et al., 2016; Venchiarutti et al., 2011). We argue here that it is Th which has the stronger affinity to bSiO2 (), similarly (though not quite) to other particles.
Our standard simulation (with ) yields a too-high sedimentation 231Pa∕230Th ratio compared to top core sediment observations below diatom-rich areas such as the Southern Ocean. In that region, bSiO2 largely controls the particle scavenging of the two tracers, especially that of 231Pa (Table 4). In order to estimate how strongly the model depends on the value of the bSiO2 partition coefficient we performed a sensitivity experiment in which we set and such that now (Table 2).
As a result of this reduction, the 231Pa∕230Th flux ratio is no longer that much overestimated in diatom-rich regions (Fig. 11). This result suggests that protactinium has a weaker affinity to biogenic silica than thorium, though the fractionation is closer to 1 than that of other particle types (Table 2). This result is consistent with Geibert and Usbeck (2004) whose laboratory study shows no definitive affinity of either Th or Pa to biogenic silica. Their average K values actually suggest that thorium has a higher affinity to biogenic silica.
We included lithogenic particles in the model from deposited dust. Since lithogenic particles have a strong relative affinity with 230Th () and since they are mostly prevalent in the (northern) Atlantic Ocean, much of the 230Th is scavenged in the Atlantic Ocean. Calcium carbonate KPa∕KTh is even smaller (0.024) and is present throughout much of the Atlantic but not in the Southern Ocean. This leaves protactinium to be scavenged by biogenic silica in the Southern Ocean when it arrives there through the AMOC. Therefore, even with the smaller-than-conventional K ratio of 0.4 for biogenic silica, the familiar pattern of higher values of 231Pa∕230Th in the Southern Ocean compared to most of the rest of the ocean is still reproduced.
The purpose of this study is two-fold. Firstly, we set out a model of 231Pa and 230Th, complete with all the necessary particle improvements and additions. This includes improved underlying particle dynamics from NEMO–PISCES and the addition of lithogenic particles. We have succeeded in this, and the model has been presented and implemented such that it can be used for future studies, including for the modelling and validation of ocean circulations in the past, present and future.
Secondly, this model helps us to study the interplay between the particle and water transport that controls the 231Pa and 230Th profiles. We have shown that, by improving on the particles, we improved the radionuclide distributions and fluxes. We have also shown to what extent the different particle phases drive the scavenging of 231Pa and 230Th.
Dissolved 230Th and 231Pa concentrations are realistic in the intermediate-depth ocean (big improvement compared to Dutay et al., 2009) but not in the upper part of the ocean. A finite equilibration time between the different radionuclide phases may help. The model can be extended to include this in future versions. It would double the number of adsorption and desorption parameters whose values should be determined through a careful literature and model sensitivity study.
In the deep ocean, the overestimation of 230Th and 231Pa in several regions is likely to be caused, at least partly, by missing nepheloid particles, but manganese oxides (from hydrothermal vents) may also improve the distributions. Of course, reported adsorption and desorption parameters vary a lot between different studies, meaning that a different, yet still plausible, combination of partition coefficients could better describe the available data. Additionally, the circulation may be too weak, not freshening AABW fast enough, and hence 230Th and 231Pa concentrations become too high near the ocean floor.
The mathematical variable names correspond to the Fortran variables as described in Table S1 of the Supplement. We encourage the reader to use our model, NEMO–ProThorP, to build extended and improved models. We have implemented two particle size classes of adsorbed nuclides, which is the minimum that is needed to produce good results. Instead of introducing a new tracer for every particle type, we only distinguish between “adsorbed onto small particles” and “adsorbed onto big particles”, meaning that one is restricted in this set-up to include only particles that sink with the two respective settling speeds for scavenging. Whereas this is somewhat restricting, it is computationally efficient, and it restricts the number of degrees of freedom (which is usually a good thing in complex models). NEMO–ProThorP can also be used to set up a non-instant equilibration model (with a k+ and k−) that may yield better concentrations in the upper ocean.
The underlying model, NEMO 3.6 (svn revision 5283), can be downloaded from http://www.nemo-ocean.eu/ (Madec and the NEMO team, 2016) after creating a login. NEMO includes the biogeochemical PISCES model (Aumont et al., 2015). For reproducibility purposes, version 0.1.0 of the radionuclide and lithogenic particles model code can be obtained at https://dx.doi.org/10.5281/zenodo.1009065 (van Hulten et al., 2017a). However, we plan to make this code available as part of the NEMO model.
The NEMO model is available under the CeCILL (http://www.cecill.info/, last access: 27 August 2018) free software licence, modelled after the GNU GPL. The lithogenic particles and 230Th∕231Pa-specific code is licenced under the same terms or under the GNU General Public License (https://www.gnu.org/copyleft/gpl.html, last access: 27 August 2018) version 3 or higher. The authors would appreciate it if, in addition to the legal adherence to copyleft and attribution, they are informed about the use of the code.
Finally, the most important raw model output files are available at PANGAEA (https://doi.org/10.1594/PANGAEA.887261) (van Hulten et al., 2018). The Julia scripts used for the statistics are included in the Supplement. This may be useful to reproduce the results or further inspect the model output.
The supplement related to this article is available online at: https://doi.org/10.5194/gmd-11-3537-2018-supplement.
The model and the simulations were designed by MvH, JCD and MRB. MvH implemented the code and performed the simulations. The paper was prepared by MvH with close collaboration and major contributions from MRB and JCD.
The authors declare that they have no conflict of interest.
We would like to thank Marion Gehlen and Olivier Aumont for the discussions on the calcite parameterisation in PISCES, among other things. The first author is grateful to Jörg Lippold for both the discussion and encouragement that also helped this work.
This study was supported by a Swedish Research Council grant (349-2012-6287) in the framework of the French–Swedish cooperation in the common research training programme in the climate, environment and energy agreement between VR and LSCE for the project “Particle transport derived from isotope tracers and its impact on ocean biogeochemistry: a GEOTRACES project in the Arctic Ocean”. This study was partly supported by the project “Overturning circulation and its implications for the global carbon cycle in coupled models” (ORGANIC; the Research Council of Norway, grant no. 239965).
The authors wish to acknowledge the use of Ferret
(https://ferret.pmel.noaa.gov/Ferret/, last access: 27 August 2018), a
product of NOAA's Pacific Marine Environmental Laboratory
(http://www.noaa.gov/, last access: 27 August 2018). Most of the plots
in this paper were created by the Ferret visualisation library ComPlot
(http://www.nongnu.org/complot/,
last access: 27 August 2018) (van Hulten, 2017). Finally, the
language Julia (https://julialang.org/, last access: 27 August 2018)
was used for some of the statistics.
Edited by:
Andrew Yool
Reviewed by: Peter Santschi and three anonymous
referees
Anderson, R.: Chemical tracers of particle transport, Treatise on Geochemistry, 6, 247–273, https://doi.org/10.1016/B0-08-043751-6/06111-9, 2003. a
Anderson, R., Bacon, M., and Brewer, P.: Removal of 230Th and 231Pa from the open ocean, Earth Planet. Sc. Lett., 62, 7–23, https://doi.org/10.1016/0012-821X(83)90067-5, 1983. a
Arsouze, T., Dutay, J.-C., Kageyama, M., Lacan, F., Alkama, R., Marti, O., and Jeandel, C.: A modeling sensitivity study of the influence of the Atlantic meridional overturning circulation on neodymium isotopic composition at the Last Glacial Maximum, Clim. Past, 4, 191–203, https://doi.org/10.5194/cp-4-191-2008, 2008. a
Arsouze, T., Dutay, J.-C., Lacan, F., and Jeandel, C.: Reconstructing the Nd oceanic cycle using a coupled dynamical – biogeochemical model, Biogeosciences, 6, 2829–2846, https://doi.org/10.5194/bg-6-2829-2009, 2009. a, b, c
Aumont, O., Ethé, C., Tagliabue, A., Bopp, L., and Gehlen, M.: PISCES-v2: an ocean biogeochemical model for carbon and ecosystem studies, Geosci. Model Dev., 8, 2465–2513, https://doi.org/10.5194/gmd-8-2465-2015, 2015. a, b, c, d, e, f, g
Aumont, O., van Hulten, M., Roy-Barman, M., Dutay, J.-C., Éthé, C., and Gehlen, M.: Variable reactivity of particulate organic matter in a global ocean biogeochemical model, Biogeosciences, 14, 2321–2341, https://doi.org/10.5194/bg-14-2321-2017, 2017. a, b, c, d, e, f, g, h, i
Ayache, M., Dutay, J.-C., Arsouze, T., Révillon, S., Beuvier, J., and Jeandel, C.: High-resolution neodymium characterization along the Mediterranean margins and modelling of eNd distribution in the Mediterranean basins, Biogeosciences, 13, 5259–5276, https://doi.org/10.5194/bg-13-5259-2016, 2016. a
Bacon, M. and Anderson, R.: Distribution of Thorium Isotopes Between Dissolved and Particulate Forms in The Deep Sea, J. Geophys. Res., 87, 2045–2056, https://doi.org/10.1029/JC087iC03p02045, 1982. a
Biastoch, A., Böning, C. W., Getzlaff, J., Molines, J.-M., and Madec, G.: Causes of Interannual–Decadal Variability in the Meridional Overturning Circulation of the Midlatitude North Atlantic Ocean, J. Climate, 21, 6599–6615, https://doi.org/10.1175/2008JCLI2404.1, 2008. a
Böhm, E., Lippold, J., Gutjahr, M., Frank, M., Blaser, P., Antz, B., Fohlmeister, J., Frank, N., Andersen, M. B., and Deininger, M.: Strong and deep Atlantic meridional overturning circulation during the last glacial cycle, Nature, 517, 73–76, https://doi.org/10.1038/nature14059, 2015. a
Broecker, W. S., Andree, M., Bonani, G., Wolfli, W., Oeschger, H., Klas, M., Mix, A., and Curry, W.: Preliminary estimates for the radiocarbon age of deep water in the glacial ocean, Paleoceanography, 3, 659–669, https://doi.org/10.1029/PA003i006p00659, 1988. a
Brun-Cottan, J. C., Auger, R., Lambere, C. E., and Chesselet, R.: Sources and transport of suspended calcites in Pacific Deep Water, J. Mar. Res., 49, 543–564, https://doi.org/10.1357/002224091784995837, 1991. a, b
Burckel, P., Waelbroeck, C., Gherardi, J. M., Pichat, S., Arz, H., Lippold, J., Dokken, T., and Thil, F.: Atlantic Ocean circulation changes preceded millennial tropical South America rainfall events during the last glacial, Geophys. Res. Lett., 42, 411–418, https://doi.org/10.1002/2014GL062512, 2014GL062512, 2015. a
Burckel, P., Waelbroeck, C., Luo, Y., Roche, D. M., Pichat, S., Jaccard, S. L., Gherardi, J., Govin, A., Lippold, J., and Thil, F.: Changes in the geometry and strength of the Atlantic meridional overturning circulation during the last glacial (20–50 ka), Clim. Past, 12, 2061–2075, https://doi.org/10.5194/cp-12-2061-2016, 2016. a
Chase, Z., Anderson, R., Fleisher, M., and Kubik, P.: The influence of particle composition and particle flux on scavenging of Th, Pa and Be in the ocean, Earth Planet. Sc. Lett., 204, 215–229, 2002. a, b, c, d
Chuang, C.-Y., Santschi, P. H., Jiang, Y., Ho, Y.-F., Quigg, A., Guo, L., Ayranov, M., and Schumann, D.: Important role of biomolecules from diatoms in the scavenging of particle-reactive radionuclides of thorium, protactinium, lead, polonium, and beryllium in the ocean: A case study with Phaeodactylum tricornutum, Limnol. Oceanogr., 59, 1256–1266, https://doi.org/10.4319/lo.2014.59.4.1256, 2014. a
Cunningham, S., Kanzow, T., Rayner, D., Baringer, M., Johns, W., Marotzke, J., Longworth, H., Grant, E., Hirschi, J.-M., Beal, L., Meinen, C. S., and Bryden, H. L.: Temporal variability of the Atlantic meridional overturning circulation at 26.5∘ N, Science, 317, 935–938, https://doi.org/10.1126/science.1141304, 2007. a
Deng, F., Thomas, A. L., Rijkenberg, M. J., and Henderson, G. M.: Controls on seawater 231Pa, 230Th and 232Th concentrations along the flow paths of deep waters in the Southwest Atlantic, Earth Planet. Sc. Lett., 390, 93–102, https://doi.org/10.1016/j.epsl.2013.12.038, 2014. a
Donohue, K. A., Tracey, K. L., Watts, D. R., Chidichimo, M. P., and Chereskin, T. K.: Mean Antarctic Circumpolar Current transport measured in Drake Passage, Geophys. Res. Lett., 43, 11760–11767, https://doi.org/10.1002/2016GL070319, 2016. a
Druffel, E., Williams, P., Bauer, J., and Ertel, J.: Cycling of dissolved and particulate organic matter in the open ocean, J. Geophys. Res., 97, 15639–15659, https://doi.org/10.1029/92JC01511, 1992. a, b
Dunk, R., Mills, R., and Jenkins, W.: A reevaluation of the oceanic uranium budget for the Holocene, Chem. Geol., 190, 45–67, https://doi.org/10.1016/S0009-2541(02)00110-9, a
Dutay, J., Bullister, J., Doney, S., Orr, J., Najjar, R., Caldeira, K., Campin, J., Drange, H., Follows, M., Gao, Y., Gruber, N., Hecht, M. W., Ishida, A., Joos, F., Lindsay, K., Madec, G., Maier-Reimer, E., Marshall, J. C., Matear, R. J., Monfray, P., Mouchet, A., Plattner, G.-K., Sarmiento, J., Schlitzer, R., Slater, R., Totterdell, I. J., Weirig, M.-F., Yamanaka, Y., and Yool, A.: Evaluation of ocean model ventilation with CFC-11, Ocean Model., 4, 89–120, https://doi.org/10.1016/S1463-5003(01)00013-0, 2002. a
Dutay, J., Lacan, F., Roy-Barman, M., and Bopp, L.: Influence of particle size and type on 231Pa and 230Th simulation with a global coupled biogeochemical-ocean general circulation model: A first approach, Geochem. Geophy. Geosy., 10, Q01011, https://doi.org/10.1029/2008GC002291, 2009. a, b, c, d, e, f, g, h, i, j, k, l, m, n, o
Dutay, J., Tagliabue, A., Kriest, I., and van Hulten, M. M. P.: Modelling the role of marine particle on large scale 231Pa, 230Th, Iron and Aluminium distributions, Prog. Oceanogr., 133, 66–72, https://doi.org/10.1016/j.pocean.2015.01.010, 2015. a
Gardner, W. D. and Sullivan, L. G.: Benthic storms, Science, 213, 329–331, 1981. a
Gardner, W. D., Tucholke, B. E., Richardson, M. J., and Biscaye, P. E.: Benthic storms, nepheloid layers, and linkage with upper ocean dynamics in the western North Atlantic, Mar. Geol., 385, 304–327, https://doi.org/10.1016/j.margeo.2016.12.012, 2017. a
Gehlen, M., Gangstø, R., Schneider, B., Bopp, L., Aumont, O., and Ethe, C.: The fate of pelagic CaCO3 production in a high CO2 ocean: a model study, Biogeosciences, 4, 505–519, https://doi.org/10.5194/bg-4-505-2007, 2007. a
Geibert, W. and Usbeck, R.: Adsorption of thorium and protactinium onto different particle types: experimental findings, Geochim. Cosmochim. Ac., 68, 1489–1501, https://doi.org/10.1016/j.gca.2003.10.011, 2004. a, b, c, d, e
Gent, P. and McWilliams, J.: Isopycnal mixing in ocean circulation models, J. Phys. Oceanogr., 20, 150–155, https://doi.org/10.1175/1520-0485(1990)020<0150:IMIOCM>2.0.CO;2, 1990. a
Gent, P., Willebrand, J., McDougall, T., and McWilliams, J.: Parameterizing eddy-induced tracer transports in ocean circulation models, J. Phys. Oceanogr., 25, 463–474, https://doi.org/10.1175/1520-0485(1995)025<0463:PEITTI>2.0.CO;2, 1995. a
German, C. R., Casciotti, K. A., Dutay, J.-C., Heimbürger, L. E., Jenkins, W. J., Measures, C. I., Mills, R. A., Obata, H., Schlitzer, R., Tagliabue, A., Turner, D. R., and Whitby, H.: Hydrothermal impacts on trace element and isotope ocean biogeochemistry, Philos. T. R. Soc. A, 374, 2081, https://doi.org/10.1098/rsta.2016.0035, 2016. a
Gu, S. and Liu, Z.: 231Pa and 230Th in the ocean model of the Community Earth System Model (CESM1.3), Geosci. Model Dev., 10, 4723–4742, https://doi.org/10.5194/gmd-10-4723-2017, 2017. a, b, c
Hauglustaine, D., Hourdin, F., Jourdain, L., Filiberti, M.-A., Walters, S., Lamarque, J.-F., and Holland, E.: Interactive chemistry in the Laboratoire de Météorologie Dynamique general circulation model, J. Geophys. Res.-Atmos., 109, D04314, https://doi.org/10.1029/2003JD003957, 2004. a, b
Hayes, C. T., Anderson, R. F., Fleisher, M. Q., Serno, S., Winckler, G., and Gersonde, R.: Quantifying lithogenic inputs to the North Pacific Ocean using the long-lived thorium isotopes, Earth Planet. Sc. Lett., 383, 16–25, https://doi.org/10.1016/j.epsl.2013.09.025, 2013. a
Hayes, C. T., Anderson, R. F., Fleisher, M. Q., Serno, S., Winckler, G., and Gersonde, R.: Biogeography in 231Pa∕230Th ratios and a balanced 231Pa budget for the Pacific Ocean, Earth Planet. Sc. Lett., 391, 307–318, https://doi.org/10.1016/j.epsl.2014.02.001, 2014. a
Hayes, C. T., Anderson, R. F., Fleisher, M. Q., Huang, K.-F., Robinson, L. F., Lu, Y., Cheng, H., Edwards, R. L., and Moran, S. B.: 230Th and 231Pa on GEOTRACES GA03, the US GEOTRACES North Atlantic transect, and implications for modern and paleoceanographic chemical fluxes, Deep-Sea Res. Pt. II, 116, 29–41, https://doi.org/10.1016/j.dsr2.2014.07.007, 2015a. a, b, c, d
Hayes, C. T., Anderson, R. F., Fleisher, M. Q., Lam, P. J., Ohnemus, D. C., Huang, K.-F., Robinson, L. F., Lu, Y., Cheng, H., Edwards, R. L., and Moran, S. B.: Intensity of Th and Pa scavenging partitioned by particle chemistry in the North Atlantic Ocean, Mar. Chem., 170, 49–60, https://doi.org/10.1016/j.marchem.2015.01.006, 2015b. a, b, c, d, e, f
Heinze, C., Gehlen, M., and Land, C.: On the potential of 230Th, 231Pa, and 10Be for marine rain ratio determinations: A modeling study, Global Biogeochem. Cy., 20, gB2018, https://doi.org/10.1029/2005GB002595, 2006. a
Heinze, C., Ilyina, T., and Gehlen, M.: The potential of 230Th for detection of ocean acidification impacts on pelagic carbonate production, Biogeosciences, 15, 3521–3539, https://doi.org/10.5194/bg-15-3521-2018, 2018. a
Henderson, G. M. and Anderson, R. F.: The U-series Toolbox for Paleoceanography, Reviews in Mineralogy and Geochemistry, 52, 493–531, https://doi.org/10.2113/0520493, 2003. a
Henderson, G. M., Heinze, C., Anderson, R. F., and Winguth, A. M.: Global distribution of the 230Th flux to ocean sediments constrained by GCM modelling, Deep-Sea Res. Pt. I, 46, 1861–1893, https://doi.org/10.1016/S0967-0637(99)00030-8, 1999 (observational data available at: http://climotope.earth.ox.ac.uk/data_compilations/holocene_231pa230th_dataset_notes_and_references, last access: 27 August 2018). a, b, c, d
Honeyman, B. D. and Santschi, P. H.: Metals in aquatic systems, Environ. Sci. Technol., 22, 862–871, https://doi.org/10.1021/es00173a002, 1988. a
Honeyman, B. D., Balistrieri, L. S., and Murray, J. W.: Oceanic trace metal scavenging, Deep-Sea Res. Pt. A, 35, 227–246, https://doi.org/10.1016/0198-0149(88)90038-6, 1988. a, b
Johnson, G. C.: Quantifying Antarctic Bottom Water and North Atlantic Deep Water volumes, J. Geophys. Res.-Oceans, 113, c05027, https://doi.org/10.1029/2007JC004477, 2008. a
Kalnay, E., Kanamitsu, M., Kistler, R., Collins, W., Deaven, D., Gandin, L., Iredell, M., Saha, S., White, G., Woollen, J., Zhu, Y., Leetmaa, A., Reynolds, R., Chelliah, M., Ebisuzaki, W., Higgins, W., Janowiak, J., Mo, K. C., Ropelewski, C., Wang, J., Jenne, R., and Joseph, D.: The NCEP/NCAR 40-Year Reanalysis Project, B. Am. Meteorol. Soc., 77, 437–471, https://doi.org/10.1175/1520-0477(1996)077<0437:TNYRP>2.0.CO;2, 1996. a
Keir, R. S.: The dissolution kinetics of biogenic calcium carbonates in seawater, Geochim. Cosmochim. Ac., 44, 241–252, https://doi.org/10.1016/0016-7037(80)90135-0, 1980. a
Kistler, R., Collins, W., Saha, S., White, G., Woollen, J., Kalnay, E., Chelliah, M., Ebisuzaki, W., Kanamitsu, M., Kousky, V., van den Dool, H., Jenne, R., and Fiorino, M.: The NCEP-NCAR 50-year reanalysis, B. Am. Meteorol. Soc., 82, 247–267, https://doi.org/10.1175/1520-0477(2001)082<0247:TNNYRM>2.3.CO;2, 2001. a
Knippertz, P. and Stuut, J.-B. W.: Mineral Dust, Springer Dordrecht Heidelberg New York London, https://doi.org/10.1007/978-94-017-8978-3, 2014. a
Kretschmer, S., Geibert, W., van der Loeff, M. M. R., Schnabel, C., Xu, S., and Mollenhauer, G.: Fractionation of 230Th, 231Pa, and 10Be induced by particle size and composition within an opal-rich sediment of the Atlantic Southern Ocean, Geochim. Cosmochim. Ac., 75, 6971–6987, https://doi.org/10.1016/j.gca.2011.09.012, 2011. a
Ku, T.-L., Knauss, K. G., and Mathieu, G. G.: Uranium in open ocean: concentration and isotopic composition, Deep-Sea Res., 24, 1005–1017, https://doi.org/10.1016/0146-6291(77)90571-9, 1977. a
Lam, P. J., Doney, S. C., and Bishop, J. K. B.: The dynamic ocean biological pump, Global Biogeochem. Cy., 25, GB3009, https://doi.org/10.1029/2010GB003868, 2011. a, b, c
Lam, P. J., Ohnemus, D. C., and Auro, M. E.: Size-fractionated major particle composition and concentrations from the US GEOTRACES North Atlantic zonal transect, Deep-Sea Res. Pt. II, 116, 303–320, https://doi.org/10.1016/j.dsr2.2014.11.020, 2015. a, b, c, d, e, f, g, h
Lopez, G. I., Marcantonio, F., Lyle, M., and Lynch-Stieglitz, J.: Dissolved and particulate 230Th–232Th in the Central Equatorial Pacific Ocean: Evidence for far-field transport of the East Pacific Rise hydrothermal plume, Earth Planet. Sc. Lett., 431, 87–95, https://doi.org/10.1016/j.epsl.2015.09.019, 2015. a
Luo, Y., Francois, R., and Allen, S. E.: Sediment 231Pa∕230Th as a recorder of the rate of the Atlantic meridional overturning circulation: insights from a 2-D model, Ocean Sci., 6, 381–400, https://doi.org/10.5194/os-6-381-2010, 2010. a, b
Madec, G.: NEMO ocean engine, Note du Pole de Modélisation, Institut Pierre-Simon Laplace, 2008. a
Madec, G. and Imbard, M.: A global ocean mesh to overcome the North Pole singularity, Clim. Dynam., 12, 381–388, https://doi.org/10.1007/BF00211684, 1996. a
Madec, G. and the NEMO team: NEMO ocean engine, Note du Pole de Modélisation, Institut Pierre-Simon Laplace, 2016. a, b
Marchal, O., François, R., Stocker, T., and Joos, F.: Ocean thermohaline circulation and sedimentary 231Pa∕230Th ratio, Paleoceanography, 15, 625–641, https://doi.org/10.1029/2000PA000496, 2000. a
Marchal, O., François, R., and Scholten, J.: Contribution of 230Th measurements to the estimation of the abyssal circulation, Deep-Sea Res. Pt. I, 54, 557–585, https://doi.org/10.1016/j.dsr.2007.01.002, 2007. a
Mawji, E., Schlitzer, R., Dodas, E. M., Abadie, C., Abouchami, W., Anderson, R. F., Baars, O., Bakker, K., Baskaran, M., Bates, N. R., Bluhm, K., Bowie, A., Bown, J., Boye, M., Boyle, E. A., Branellec, P., Bruland, K. W., Brzezinski, M. A., Bucciarelli, E., Buesseler, K., Butler, E., Cai, P., Cardinal, D., Casciotti, K., Chaves, J., Cheng, H., Chever, F., Church, T. M., Colman, A. S., Conway, T. M., Croot, P. L., Cutter, G. A., de Baar, H. J., de Souza, G. F., Dehairs, F., Deng, F., Dieu, H. T., Dulaquais, G., Echegoyen-Sanz, Y., Edwards, R. L., Fahrbach, E., Fitzsimmons, J., Fleisher, M., Frank, M., Friedrich, J., Fripiat, F., Galer, S. J., Gamo, T., Solsona, E. G., Gerringa, L. J., Godoy, J. M., Gonzalez, S., Grossteffan, E., Hatta, M., Hayes, C. T., Heller, M. I., Henderson, G., Huang, K.-F., Jeandel, C., Jenkins, W. J., John, S., Kenna, T. C., Klunder, M., Kretschmer, S., Kumamoto, Y., Laan, P., Labatut, M., Lacan, F., Lam, P. J., Lannuzel, D., le Moigne, F., Lechtenfeld, O. J., Lohan, M. C., Lu, Y., Masqué, P., McClain, C. R., Measures, C., Middag, R., Moffett, J., Navidad, A., Nishioka, J., Noble, A., Obata, H., Ohnemus, D. C., Owens, S., Planchon, F., Pradoux, C., Puigcorbé, V., Quay, P., Radic, A., Rehkämper, M., Remenyi, T., Rijkenberg, M. J., Rintoul, S., Robinson, L. F., Roeske, T., Rosenberg, M., Rutgers van der Loeff, M., Ryabenko, E., Saito, M. A., Roshan, S., Salt, L., Sarthou, G., Schauer, U., Scott, P., Sedwick, P. N., Sha, L., Shiller, A. M., Sigman, D. M., Smethie, W., Smith, G. J., Sohrin, Y., Speich, S., Stichel, T., Stutsman, J., Swift, J. H., Tagliabue, A., Thomas, A., Tsunogai, U., Twining, B. S., van Aken, H. M., van Heuven, S., van Ooijen, J., van Weerlee, E., Venchiarutti, C., Voelker, A. H., Wake, B., Warner, M. J., Woodward, E. M. S., Wu, J., Wyatt, N., Yoshikawa, H., Zheng, X.-Y., Xue, Z., Zieringer, M., and Zimmer, L. A.: The GEOTRACES Intermediate Data Product 2014, Mar. Chem., 177, 1–8, https://doi.org/10.1016/j.marchem.2015.04.005, 2015 (observational data available at: http://www.geotraces.org/dp/, last access: 27 August 2018). a
Mouchet, A.: The Ocean Bomb Radiocarbon Inventory Revisited, Radiocarbon, 55, 1580–1594, https://doi.org/10.1017/S0033822200048505, 2013. a
Murray, R.: Explicit generation of orthogonal grids for ocean models, J. Comput. Phys., 126, 251–273, https://doi.org/10.1006/jcph.1996.0136, 1996. a
Owens, S., Buesseler, K., and Sims, K.: Re-evaluating the 238U-salinity relationship in seawater: Implications for the 238U–234Th disequilibrium method, Mar. Chem., 127, 31–39, https://doi.org/10.1016/j.marchem.2011.07.005, 2011. a
Pavia, F., Anderson, R., Vivancos, S., Fleisher, M., Lam, P., Lu, Y., Cheng, H., Zhang, P., and Edwards, R. L.: Intense hydrothermal scavenging of 230Th and 231Pa in the deep Southeast Pacific, Mar. Chem., 201, 212–228, https://doi.org/10.1016/j.marchem.2017.08.003, 2017. a
Piotrowski, A. M., Goldstein, S. L., Hemming, S. R., and Fairbanks, R. G.: Temporal Relationships of Carbon Cycling and Ocean Circulation at Glacial Boundaries, Science, 307, 1933–1938, https://doi.org/10.1126/science.1104883, 2005. a
Rayner, D., Hirschi, J.-M., Kanzow, T., Johns, W., Wright, P., Frajka-Williams, E., Bryden, H., Meinen, C., Baringer, M., Marotzke, J., Beal, L. M., and Cunningham, S. A.: Monitoring the Atlantic meridional overturning circulation, Deep-Sea Res. Pt. II, 58, 1744–1753, https://doi.org/10.1016/j.dsr2.2010.10.056, 2011. a
Rempfer, J., Stocker, T. F., Joos, F., Lippold, J., and Jaccard, S. L.: New insights into cycling of 231Pa and 230Th in the Atlantic Ocean, Earth Planet. Sc. Lett., 468, 27–37, https://doi.org/10.1016/j.epsl.2017.03.027, 2017. a, b, c, d, e, f
Rosenthal, Y., Boyle, E. A., and Labeyrie, L.: Last Glacial Maximum paleochemistry and deepwater circulation in the Southern Ocean: Evidence from foraminiferal cadmium, Paleoceanography, 12, 787–796, https://doi.org/10.1029/97PA02508, 1997. a
Roy-Barman, M.: Modelling the effect of boundary scavenging on Thorium and Protactinium profiles in the ocean, Biogeosciences, 6, 3091–3107, https://doi.org/10.5194/bg-6-3091-2009, 2009. a
Roy-Barman, M., Chen, J., and Wasserburg, G.: 230Th–232Th systematics in the central Pacific Ocean: The sources and the fates of thorium, Earth Planet. Sc. Lett., 139, 351–363, https://doi.org/10.1016/0012-821X(96)00017-9, 1996. a, b
Rutgers van der Loeff, M., Venchiarutti, C., Stimac, I., van Ooijen, J., Huhn, O., Rohardt, G., and Strass, V.: Meridional circulation across the Antarctic Circumpolar Current serves as a double 231Pa and 230Th trap, Earth Planet. Sc. Lett., 455, 73–84, https://doi.org/10.1016/j.epsl.2016.07.027, 2016. a, b, c
Schlitzer, R., Anderson, R. F., Masferrer Dodas, E., et al.: The GEOTRACES Intermediate Data Product 2017, Chem. Geol., 493, 210–223, https://doi.org/10.1016/j.chemgeo.2018.05.040, 2018. a
Siddall, M., Henderson, G., Edwards, N., Frank, M., Müller, S., Stocker, T., and Joos, F.: 231Pa∕230Th fractionation by ocean transport, biogenic particle flux and particle type, Earth Planet. Sc. Lett., 237, 135–155, https://doi.org/10.1016/j.epsl.2005.05.031, 2005. a, b
Siddall, M., Stocker, T. F., Henderson, G. M., Joos, F., Frank, M., Edwards, N. R., Ritz, S. P., and Müller, S. A.: Modeling the relationship between 231Pa∕230Th distribution in North Atlantic sediment and Atlantic meridional overturning circulation, Paleoceanography, 22, PA2214, https://doi.org/10.1029/2006PA001358, 2007. a
Sinha, B., Smeed, D., McCarthy, G., Moat, B., Josey, S., Hirschi, J.-M., Frajka-Williams, E., Blaker, A., Rayner, D., and Madec, G.: The accuracy of estimates of the overturning circulation from basin-wide mooring arrays, Prog. Oceanogr., 160, 101–123, https://doi.org/10.1016/j.pocean.2017.12.001, 2018. a
Subhas, A. V., Rollins, N. E., Berelson, W. M., Dong, S., Erez, J., and Adkins, J. F.: A novel determination of calcite dissolution kinetics in seawater, Geochim. Cosmochim. Ac., 170, 51–68, https://doi.org/10.1016/j.gca.2015.08.011, 2015. a, b
Tagliabue, A., Bopp, L., Roche, D. M., Bouttes, N., Dutay, J.-C., Alkama, R., Kageyama, M., Michel, E., and Paillard, D.: Quantifying the roles of ocean circulation and biogeochemistry in governing ocean carbon-13 and atmospheric carbon dioxide at the last glacial maximum, Clim. Past, 5, 695–706, https://doi.org/10.5194/cp-5-695-2009, 2009. a
Tagliabue, A., Bopp, L., Dutay, J.-C., Bowie, A., Chever, F., Jean-Baptiste, P., Bucciarelli, E., Lannuzel, D., Remenyi, T., Sarthou, G., Aumont, O., Gehlen, M., and Jeandel, C.: Hydrothermal contribution to the oceanic dissolved iron inventory, Nat. Geosci., 3, 252–256, https://doi.org/10.1038/NGEO818, 2010. a
Talley, L., Reid, J., and Robbins, P.: Data-based meridional overturning streamfunctions for the global ocean, J. Climate, 16, 3213–3226, https://doi.org/10.1175/1520-0442(2003)016<3213:DMOSFT>2.0.CO;2, 2003. a
Timmermann, R., Goosse, H., Madec, G., Fichefet, T., Ethé, C., and Dulière, V.: On the representation of high latitude processes in the ORCA-LIM global coupled sea ice–ocean model, Ocean Model., 8, 175–201, https://doi.org/10.1016/j.ocemod.2003.12.009, 2005. a
Middag, R., van Hulten, M. M. P., van Aken, H. M., Rijkenberg, M. J. A., Gerringa, L. J. A., Laan, P., and de Baar, H. J. W.: Dissolved aluminium in the ocean conveyor of the West Atlantic Ocean: Effects of the biological cycle, scavenging, sediment resuspension and hydrography, Mar. Chem., 177, 69–86, https://doi.org/10.1016/j.marchem.2015.02.015, 2015. a
van der Does, M., Korte, L. F., Munday, C. I., Brummer, G.-J. A., and Stuut, J.-B. W.: Particle size traces modern Saharan dust transport and deposition across the equatorial North Atlantic, Atmos. Chem. Phys., 16, 13697–13710, https://doi.org/10.5194/acp-16-13697-2016, 2016. a
van Hulten, M. M. P.: ComPlot: Comparison Plotter to visually evaluate ocean model simulations, The Journal of Open Source Software, 2, 368, https://doi.org/10.21105/joss.00368, 2017. a
van Hulten, M. M. P., Sterl, A., Dutay, J.-C., Tagliabue, A., Gehlen, M., de Baar, H. J. W., and Middag, R.: Aluminium in an ocean general circulation model compared with the West Atlantic GEOTRACES cruises, J. Marine Syst., 126, 3–23, https://doi.org/10.1016/j.jmarsys.2012.05.005, 2013. a, b
van Hulten, M. M. P., Sterl, A., Middag, R., de Baar, H. J. W., Gehlen, M., Dutay, J.-C., and Tagliabue, A.: On the effects of circulation, sediment resuspension and biological incorporation by diatoms in an ocean model of aluminium*, Biogeosciences, 11, 3757–3779, https://doi.org/10.5194/bg-11-3757-2014, 2014. a
van Hulten, M. M. P., Dutay, J., and Roy-Barman, M.: Ocean model of Protactinium, Thorium and Particles (ProThorP), https://doi.org/10.5281/zenodo.1009064, software package, 2017a. a
van Hulten, M., Middag, R., Dutay, J.-C., de Baar, H., Roy-Barman, M., Gehlen, M., Tagliabue, A., and Sterl, A.: Manganese in the west Atlantic Ocean in the context of the first global ocean circulation model of manganese, Biogeosciences, 14, 1123–1152, https://doi.org/10.5194/bg-14-1123-2017, 2017b. a
van Hulten, M. M. P., Dutay, J., and Roy-Barman, M.: Output from a global scavenging and circulation ocean model of thorium-230 and protactinium-231 (ProThorP 0.1), https://doi.org/10.1594/PANGAEA.887261, 2018. a
Venchiarutti, C., Rutgers van der Loeff, M., and Stimac, I.: Scavenging of 231Pa and thorium isotopes based on dissolved and size-fractionated particulate distributions at Drake Passage (ANTXXIV-3), Deep-Sea Res. Pt. II, 58, 2767–2784, https://doi.org/10.1016/j.dsr2.2010.10.040, 2011. a, b, c
Yu, E.-F., Francois, R., and Bacon, M. P.: Similar rates of modern and last-glacial ocean thermohaline circulation inferred, Nature, 379, 689–694, https://doi.org/10.1038/379689a0, 1996. a
The concentration of radionuclides (amount per unit of volume) is proportional to its (radio)activity (disintegrations per unit of time). These terms are used interchangeably throughout this paper. Moreover, they are considered identical: the activity or concentration is expressed in mBq m−3, and thus we report activity ratios of 231Pa∕230Th.
When summation bounds are not specified, the union of all particulate phases, S∪B, is assumed.