the Creative Commons Attribution 4.0 License.
the Creative Commons Attribution 4.0 License.
 | 06 Jul 2018
Stratospheric aerosol evolution after Pinatubo simulated with a coupled size-resolved aerosol–chemistry–climate model, SOCOL-AERv1.0
Timofei Sukhodolov
Jian-Xiong Sheng
Aryeh Feinberg
Bei-Ping Luo
Thomas Peter
Laura Revell
Andrea Stenke
Debra K. Weisenstein
Eugene Rozanov
We evaluate how the coupled aerosol–chemistry–climate model SOCOL-AERv1.0 represents the influence of the 1991 eruption of Mt. Pinatubo on stratospheric aerosol properties and atmospheric state. The aerosol module is coupled to the radiative and chemical modules and includes comprehensive sulfur chemistry and microphysics, in which the particle size distribution is represented by 40 size bins with radii spanning from 0.39 nm to 3.2 µm. SOCOL-AER simulations are compared with satellite and in situ measurements of aerosol parameters, temperature reanalyses, and ozone observations. In addition to the reference model configuration, we performed series of sensitivity experiments looking at different processes affecting the aerosol layer. An accurate sedimentation scheme is found to be essential to prevent particles from diffusing too rapidly to high and low altitudes. The aerosol radiative feedback and the use of a nudged quasi-biennial oscillation help to keep aerosol in the tropics and significantly affect the evolution of the stratospheric aerosol burden, which improves the agreement with observed aerosol mass distributions. The inclusion of van der Waals forces in the particle coagulation scheme suggests improvements in particle effective radius, although other parameters (such as aerosol longevity) deteriorate. Modification of the Pinatubo sulfur emission rate also improves some aerosol parameters, while it worsens others compared to observations. Observations themselves are highly uncertain and render it difficult to conclusively judge the necessity of further model reconfiguration. The model revealed problems in reproducing aerosol sizes above 25 km and also in capturing certain features of the ozone response. Besides this, our results show that SOCOL-AER is capable of predicting the most important global-scale atmospheric effects following volcanic eruptions, which is also a prerequisite for an improved understanding of solar geoengineering effects from sulfur injections to the stratosphere.
- Article
(844 KB) - Full-text XML
- BibTeX
- EndNote


During the eruption of Mt. Pinatubo in June 1991, a large amount of sulfur dioxide was emitted into the stratosphere, leading to an enhancement of the stratospheric aerosol burden. The aerosol layer perturbed the Earth's radiative balance, resulting in a top-of-the-atmosphere global mean radiative forcing up to −3 W m−2 (Minnis et al., 1993), a global surface cooling of ∼ 0.4–0.5 K (Dutton and Christy, 1992; Thompson et al., 2009), and a temperature increase of ∼ 2.5–3.5 K in the tropical lower stratosphere (Labitzke and McCormick, 1992; Randel et al., 2009). During the past decades it was shown that these observed temperature perturbations are connected to many feedbacks in the Earth system such as alteration of the stratospheric circulation with consequences for the troposphere (e.g., Kodera, 1994; Graf et al., 2007), dynamical and chemical effects on stratospheric ozone (Solomon, 1999; Rozanov et al., 2002; Telford et al., 2009), drying of the troposphere causing significant changes in the regional hydrological cycle (Soden et al., 2002), modulation of the global monsoon (Liu et al., 2016), and even modulation of the ocean circulation (e.g., Predybaylo et al., 2017). The distribution and evolution of stratospheric sulfate can therefore be considered as the main forcing constraint for these and many other processes following large volcanic eruptions (Kremser et al., 2016; Timmreck et al., 2016; Swingedouw et al., 2017), and proper information about the aerosol layer is crucial for the characterization and understanding of numerous inherent feedbacks.
Modeling studies help to synthesize our knowledge of how the Mt. Pinatubo and other big eruptions impact the climate system. Global three-dimensional general circulation models (GCMs) or chemistry–climate models (CCMs) used for studying volcanic effects on climate can be mainly separated into two groups: those using prescribed aerosol distributions and those using online aerosol microphysical modules (e.g., Zanchettin et al., 2016). Models of the first type can use aerosol composites derived from satellite and ground-based observations (e.g., Stenchikov et al., 1998), but for studies of the pre-satellite era and the future such models have to rely on estimates provided by models of the second type or derived by simple reconstruction methods (e.g., Toohey and Sigl, 2017). They have only limited ability to reproduce the climate response to volcanic eruptions, as the aerosols are prescribed and therefore the feedbacks between aerosols and the stratosphere are completely missed, resulting in biased aerosol radiative forcing depending on concrete circumstances. Such models also inherit either all instrumental uncertainties (see Sect. 3) or uncertainties from the second type of models and reconstruction models. Models with aerosol microphysics can also be grouped depending on how they treat the aerosol size distribution: a first class of so-called “modal” and “bulk” (unimodal) schemes and a second class of size-resolving (also called “sectional”) aerosol modules. Currently, there are more than a dozen active global models with aerosol microphysics (see review by Kremser et al., 2016), a smaller part of which employ sectional aerosol schemes.
Both modal and size-resolving schemes have their benefits and problems. Modal aerosol schemes prescribe some basic parameters characterizing size distribution (e.g., size distribution function) and therefore have high computational efficiency. Size-resolving schemes simulate an evolution of size distribution and can better describe gravitational sedimentation, which crucially affects the stratospheric aerosol lifetime. Arfeuille et al. (2013) argued that bulk schemes are less satisfactory in reproducing volcanic aerosol distributions, which cast doubts on the success of such approaches. For 2-D models, Weisenstein et al. (2007) have shown that size-resolving aerosol models are superior to modal approaches in accurately representing the time-dependent aerosol size distribution after large volcanic eruptions. Further progress using a CCM coupled with a size-resolving microphysical aerosol module to simulate Pinatubo-like eruptions has been achieved by English et al. (2013); however, the decline of the simulated aerosol burden was too fast compared with observations, which they attributed to the lack of heating as the aerosol radiative feedback remained decoupled in their model. This highlighted the fact that the fine resolution of aerosol sizes is not a universal solution and the performance of any model, even with highly resolved aerosol sizes, depends on representation of relevant chemical, microphysical, and radiative processes, large-scale transport, and gravitational sedimentation, as well as their interactions.
The Pinatubo eruption is the strongest volcanic event since the beginning of the satellite era and is therefore often used as a model performance test. Modeling studies of the Pinatubo eruption using models with an assumed lognormal size distribution (e.g., Timmreck et al., 1999a, b; Aquila et al., 2012; Dhomse et al., 2014; Sekiya et al., 2016; Mills et al., 2016) and sectional distribution (English et al., 2013; Kleinschmitt et al., 2017) generally agree reasonably well with observations of atmospheric longwave and shortwave extinctions, aerosol burden, and other integral parameters. However, an intercomparison of different Pinatubo studies is hampered by the fact that models make different assumptions of how much sulfur was initially emitted and how the plume was distributed as a function of altitude. Models that reported good agreement with observations used a variety of emission estimates ranging from 10 to 17 teragrams (Tg) of SO2 and SO2 plume altitudes in the lower stratosphere differing by a few kilometers. This hints at large differences in how models treat important microphysical and transport processes and significantly increases the uncertainty of the overall aerosol layer understanding.
An ongoing model intercomparison project on the climatic response to volcanic forcing (VOLMIP; Zanchettin et al., 2016) aims to address the existing intermodel uncertainties. So far only the Tambora eruption in 1815 has been considered for global models with interactive aerosol microphysics. Marshall et al. (2018) evaluated the performance of four state-of-the-art models (WACCM, UM-UKCA, SOCOL-AER, and ECHAM5-HAM) using mostly the same settings of the initial emission and compared the results to the available observations of ice core sulfate. The focus of that study was on sulfate deposition in polar areas, as ice cores are the best available source of information about historical eruptions (Sigl et al., 2015; Toohey and Sigl, 2017). The comparison revealed that modeled volcanic sulfate deposition varies substantially in timing, spatial pattern, and magnitude between the models. The ratio of the hemispheric atmospheric sulfate aerosol burden after the eruption to the average amount of sulfate deposited on ice sheets varied among models by up to a factor of 15. The burden-to-deposition ratio is to a large extent determined by the treatment of deposition processes, which are simplified in models. Furthermore, it also depends on sulfur species that never entered the stratosphere but were transported through the (upper) troposphere, oxidized, and removed by wet or dry deposition. Moreover, it depends on how fast aerosols grow and sediment from the stratosphere back to the troposphere. The analysis of the stratospheric burdens of SO2 and liquid H2SO4 as well as the polar winds also revealed large intermodel differences. Therefore there is still no clear understanding of which model is closer to reality in describing the stratospheric aerosol distribution, since direct stratospheric observations are missing and the ice core estimates could be strongly modulated by the tropospheric deposition schemes.
The representation of aerosol evolution in the stratosphere requires treatment of many processes, which can substantially differ among models. Previous studies (e.g., Timmreck et al., 1999a, b; Aquila et al., 2012) illustrated the importance of the quasi-biennial oscillation (QBO) and radiative heating of volcanic aerosols in the models, as these processes affect the transport and thus the lifetime and climate impact of aerosols. Benduhn and Lawrence (2013) found that numerical diffusion induced by an inaccurate sedimentation scheme may lead to excessive transport of the aerosol to the middle and upper stratosphere. So, even with a fine aerosol size resolution, resulting sedimentation can be biased due to the model's numerical scheme. English et al. (2011, 2013) suggested that attractive van der Waals forces may lead to an enhanced coagulation efficiency and should be taken into account (in the transition and free molecular regimes). However, such interactions led to an even faster decay in their simulated global aerosol burden after the Pinatubo eruption. Sekiya et al. (2016) and Kleinschmitt et al. (2017) also investigated the role of this process and reported significant effects on aerosol parameters. Interactive chemistry was also shown to be important for aerosol formation, as hydroxyl radical (OH) can become depleted after big eruptions, which prolongs the time needed for the conversion of volcanic SO2 to H2SO4 (Bekki, 1995; Mills et al., 2017).
The coupled size-resolving stratospheric aerosol–chemistry–climate SOCOL-AER model has been evaluated in detail for volcanically quiescent conditions (Sheng et al., 2015b). In this study, we employ it for the Pinatubo eruption of 1991 and aim to characterize its performance by comparing our results against satellite observations and in situ measurements. By means of this model we also attempt to illustrate the roles of the aerosol radiative heating, sedimentation scheme, coagulation efficiency, and the QBO in the evolution of the aerosol burdens, aerosol optical properties, and particle size distributions, which may also help to better understand differences between various models.
The coupled aerosol–chemistry–climate model SOCOL-AERv1.0 (SOCOL-AER hereafter) has been introduced by Sheng et al. (2015b), who applied the model to analyze the global atmospheric sulfur budget under volcanically quiescent conditions and its sensitivity to anthropogenic emissions. SOCOL-AER is a CCM SOCOLv3 (GCM ECHAM5 plus chemical module MEZON; Stenke et al., 2013) combined with an aerosol module AER (Weisenstein et al., 1997). AER includes a comprehensive description of sulfur chemistry and microphysics, in which the particles are size-resolved by 40 size bins spanning radii from 0.39 nm to 3.2 µm, which allows us to consider all relevant microphysical processes (e.g., nucleation and coagulation). The influence of the aerosol on radiation fluxes at all wavelengths is also taken into account. SOCOL-AER uses 6-band shortwave (Cagnazzo et al., 2007) and 16-band longwave (Mlawer et al., 1997) radiation schemes. Extinction coefficients, single-scattering albedos, and asymmetry factors required by the radiation codes are calculated online from aerosol physical properties using Mie theory for actual H2SO4 weight percent and temperature using refraction indices from Biermann et al. (2000). The aerosol surface area density and composition is used to calculate heterogeneous reaction rates in a chemical module. In this study, the spatial resolution of SOCOL-AER is set to T42 horizontal truncation (2.8∘ × 2.8∘ latitude–longitude resolution) and 39 vertical hybrid sigma-pressure levels from the surface to 80 km (about 1–1.5 km per level in the upper troposphere and lower stratosphere, 2–3 km above). The QBO in the model is nudged to observed wind profiles. Monthly mean transient sea surface temperatures (SSTs) and sea ice coverage (SIC) are prescribed from the Hadley Centre Sea Ice and SST data set (Rayner et al., 2003). Comprehensive sulfur surface emissions are also fully taken into account. A more detailed description of the SOCOL-AER modules can be found in Sheng et al. (2015b).
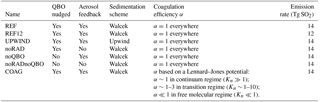
Observational estimates of the total SO2 mass emitted by Pinatubo and its vertical distribution are still very uncertain (Guo et al., 2004). We use an estimate of Sheng et al. (2015a), who used a 2-D sulfate aerosol model with the same microphysical module as in SOCOL-AER to identify the optimized emission parameters by running ∼ 300 sensitivity experiments spanning the observational uncertainty and comparing the results to observations of different aerosol parameters. Based on Sheng et al. (2015a), the Pinatubo eruption is introduced here by an injection of 14 Tg SO2 in the region 97–112∘ E and 1.8∘ S–12∘ N. SO2 is continuously released from 14 to 15 June 1991 and spread between 16 and 30 km with a vertical mass distribution skewed to low altitudes with the mass peak between 18 and 21 km. All experiments are summarized in Table 1. The reference run subsequently termed REF represents the standard setup of SOCOL-AER, including nudged QBO, interactive aerosol radiative and chemical effects, and coagulation efficiency uniformly set to one. In terms of module versions it replicates the model configuration used for the Tambora study (Marshall et al., 2018).
By means of the experiment REF12 we estimate the model sensitivity to uncertainty in the emission amount by lowering it to 12 Tg SO2. In the experiment termed noRAD, the radiative fluxes are calculated using the SAGE-4λ data set (Arfeuille et al., 2013) averaged over the period 1995–2002 instead of the interactively simulated aerosol distribution, which eliminates the radiative effects of volcanic aerosols. The experiment termed noQBO is carried out without QBO, which leads to a weak easterly zonal wind in the tropical stratosphere. Both QBO nudging and interactive radiation are switched off in the experiment termed noRADnoQBO. These three experiments allow us to identify the impact of QBO and the radiative heating of volcanic aerosols on the evolution of the stratospheric aerosol burden after the Pinatubo eruption. We also carry out an exploratory experiment concerning the coagulation efficiency; the experiment termed COAG represents the coagulation efficiency as Lennard–Jones potential, i.e., a smooth function of the Knudsen number retrieved from the results in Fig. 3 of Narsimhan and Ruckenstein (1985) with a Hamaker constant of J. As an approximation of attractive van der Waals forces it enhances the coagulation efficiency in the transition regime (maximum enhancement larger than 2), but decreases it rapidly (less than 1) as the Knudsen number increases in the free molecular regime. The experiment termed UPWIND employs the upwind sedimentation scheme (Benduhn and Lawrence, 2013), while all other simulations use the more elaborate Walcek method with minimal numerical diffusion (Walcek, 2000). This is sufficient to clarify the impact of different sedimentation schemes, though work by Benduhn and Lawrence (2013) presented a further improved modified Walcek method.
Each of these experiments consists of five ensemble members. In the figures we show the ensemble spread for the REF experiment and only ensemble means for other experiments to keep figures as uncomplicated as possible. In addition to Pinatubo, for all runs we considered the smaller eruption of Cerro Hudson in Chile in August 1991. We used the latest estimate of 2.3 Tg total SO2 emitted (Miles et al., 2017) with 75 % of mass injected between 16 and 18 km. Sensitivity studies with and without this event showed that its contribution is minor, since it is located at higher latitudes (45.5∘ S), but we keep it for completeness.
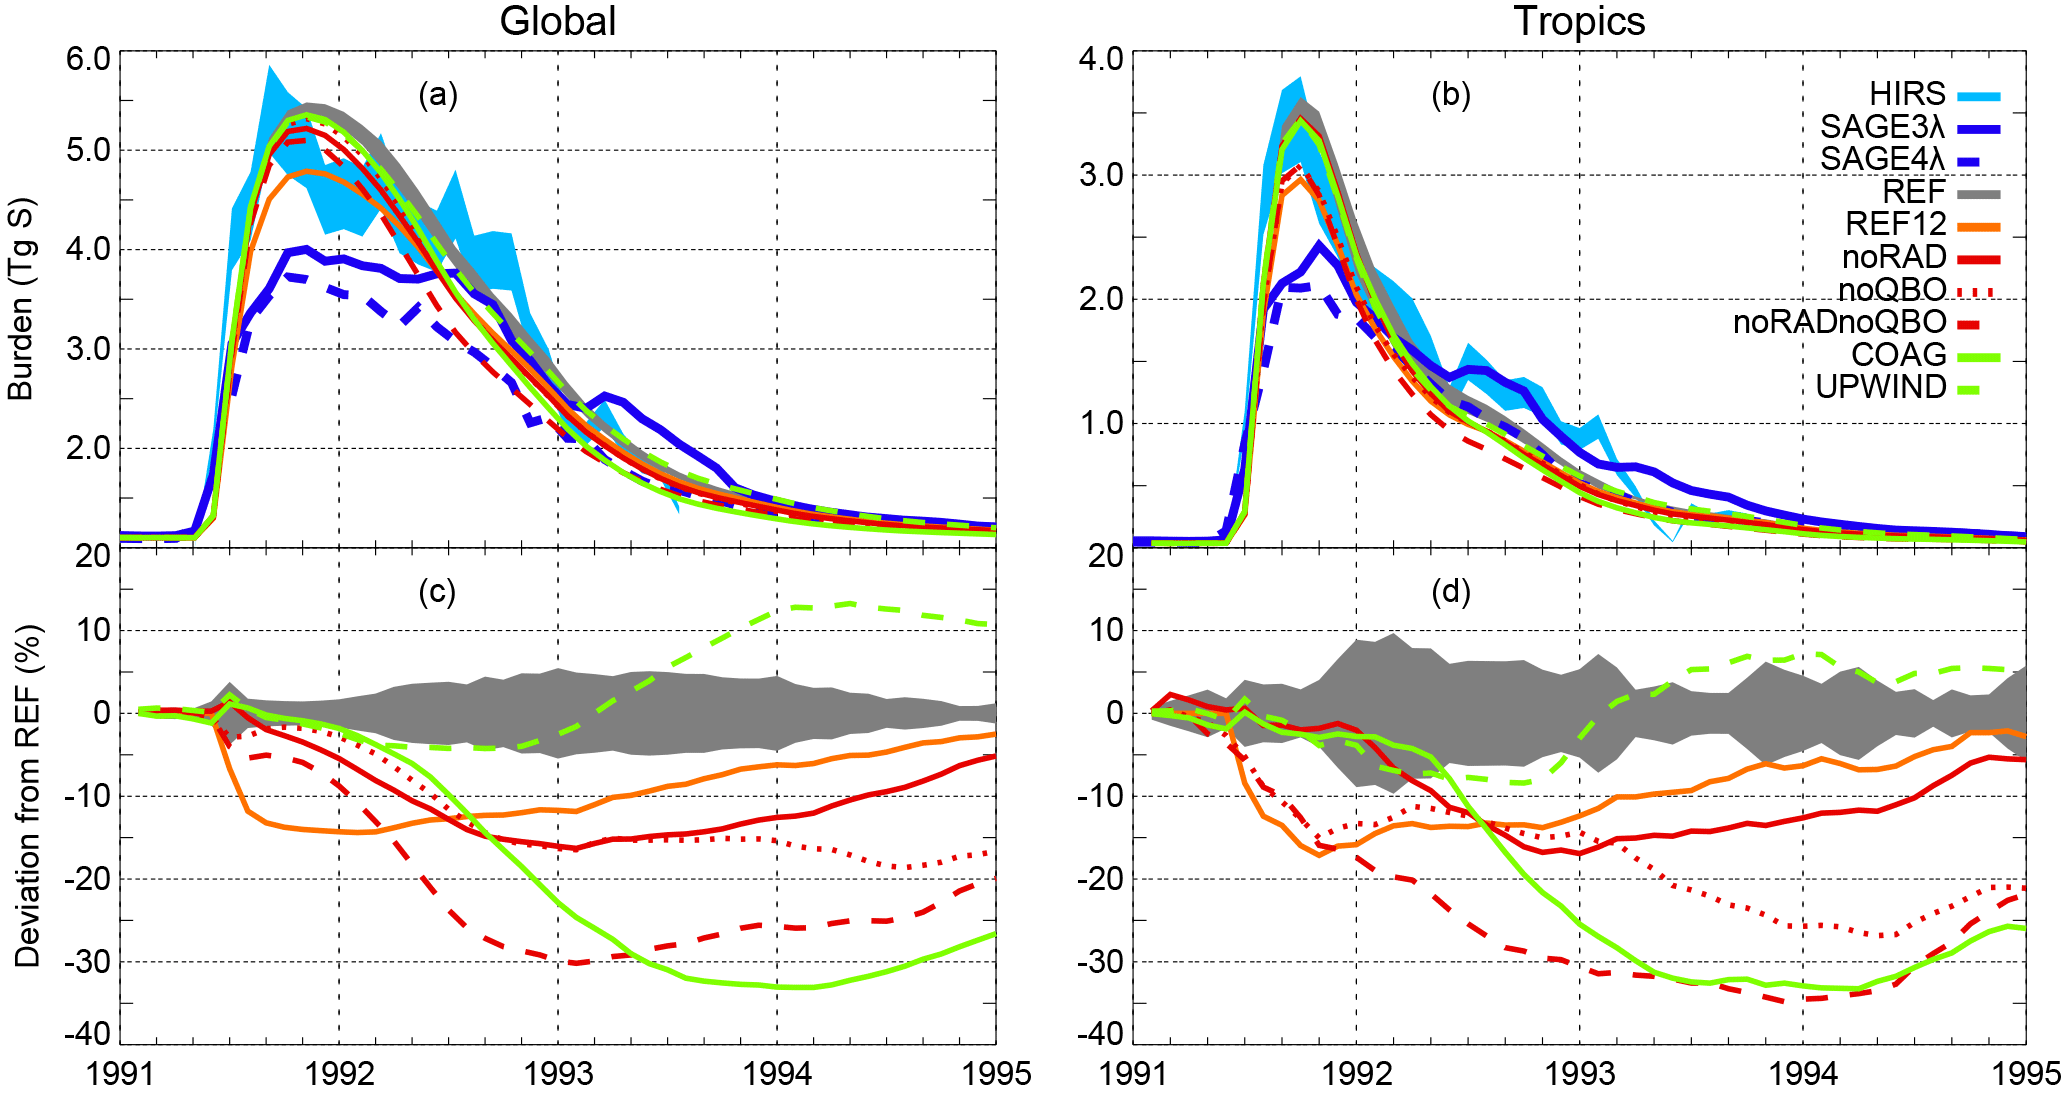
Figure 1(a, b) Evolution of model-calculated global (pole to pole, left) and tropical (20∘ S–20∘ N, right) stratospheric aerosol burden (Tg of S) compared with the HIRS- and SAGE-II-derived data (SAGE-3,4λ). HIRS-derived aerosol sulfur burden assumes 75 % sulfuric acid by weight. Light blue shaded area: uncertainties of HIRS. Grey shaded area: 2σ ensemble spread of the REF experiment. All other experiments are shown as ensemble means. (c, d) Same as (a) and (b), but deviations of all the numerical experiments from the REF in %.
3.1 Aerosol burden
Figure 1 shows the evolution of observation-derived and model-calculated stratospheric aerosol burdens in units of Tg of sulfur globally integrated (panel a) and in the tropics (panel b). The High-Resolution Infrared Radiation Sounder (HIRS) measured the aerosol vertical column and derived total aerosol mass with about 10 % uncertainties. HIRS includes tropospheric and stratospheric aerosols together (Baran and Foot, 1994). In contrast, the limb-occultation measurements of SAGE II allow aerosols in the troposphere and stratosphere to be distinguished from one another. In this work the SAGE-II-derived total aerosol mass is represented by two data sets. The first one, the SAGE-4λ method (Arfeuille et al., 2013) used within the Chemistry–Climate Model Initiative (CCMI), employs all four SAGE wavelengths with overall about 30 % uncertainties for non-gap-filled data and higher uncertainties in data gaps filled by lidar station data. The second data set was recently compiled for phase 6 of the Coupled Model Intercomparison Project (CMIP6; Eyring et al., 2016) using the SAGE-3λ method, which is similar to SAGE-4λ but refrains from employing the less reliable channel at 385 nm, thus considering only three SAGE wavelengths. Directly after Pinatubo the SAGE-3λ data set uses additional satellite and ground-based data for gap filling. More information about the SAGE-3,4λ composites can be found in a recent paper by Thomason et al. (2018).
During the first year after the Pinatubo eruption, the aerosol mass in both SAGE-II-based data sets is noticeably lower than in HIRS data. This is likely related to the saturation effects of SAGE II as a limb-occultation instrument during this period (Russell et al., 1996). The SAGE-3λ composite provides significantly larger burdens than its predecessor due to additional data used in a gap-filling procedure (Revell et al., 2017), but still much lower than HIRS. After this period, when the atmosphere becomes sufficiently transparent, SAGE II measurements are expected to provide more accurate aerosol extinctions. In contrast, the HIRS-derived mass becomes less reliable with time, when the aerosol cloud spreads to higher latitudes with lower values that are close to the noise level of the technique (Baran and Foot, 1994). This suggests trusting the HIRS data up to mid-1992 and the SAGE data afterwards (Sheng et al., 2015a). Note, however, that the updated SAGE-II-based data set now also provides values closer to HIRS from mid-1992 to early 1993 and considerably larger values later in 1993.
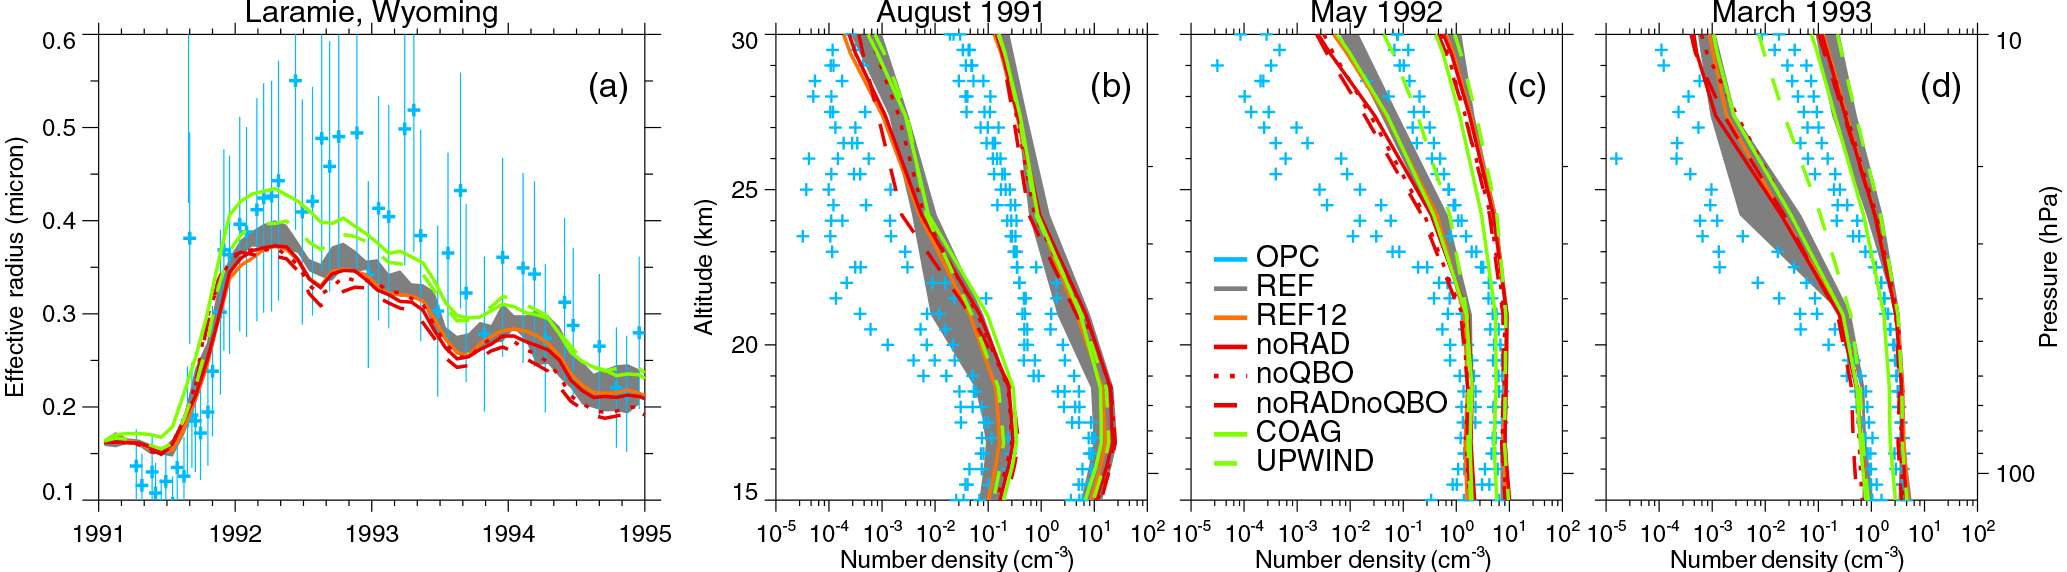
Figure 2Comparison of in situ measurements of particle size (at Laramie, Wyoming; Deshler, 2008) with SOCOL-AER simulations. (a) Stratospheric effective particle radius averaged for 14–30 km of altitude. Thin blue whiskers reflect measurement uncertainty (taken from Kleinschmitt et al., 2017). (b–d) Profiles of cumulative number densities for two size channels with radii R>0.15 µm (right group of curves) and R>0.5 µm (left group of curves) in August 1991, May 1992, and March 1993, respectively. SOCOL-AER results are monthly means, while OPC data are discrete measurements within chosen months.
The global stratospheric aerosol burden calculated by REF (grey shaded area representing 2σ ensemble spread) agrees well with the HIRS data peaking around 5.4 Tg at the end of 1991. Later, REF agrees well with the SAGE-4λ composite, while the updated SAGE-3λ has a generally larger burden. Qualitatively similar results are found for the tropics. Recent modeling studies by Mills et al. (2016) and Kleinschmitt et al. (2017) showed very similar time series of the global aerosol burden with initial emissions of 10 and 14 Tg of SO2, respectively. These studies, another work by Sekiya et al. (2016), and the present study fail to reproduce the pronounced step-like evolution of the burden seen in HIRS and SAGE-3λ, showing a smoother decrease instead. Dhomse et al. (2014) overestimated the HIRS peak burden even with 10 Tg of SO2 emitted, but obtained this step-like behavior. Dhomse et al. (2014) explained it by variability in the background aerosols related to the summer increase in photolysis, but they also noted that their background values are significantly larger than in the other models and observations. Besides instrumental uncertainty, another reason for the complicated shape of the observational curves seen in Fig. 1 could be the seasonal variability of the stratospheric circulation that is known to be underestimated in ECHAM5 (Stenke et al., 2013) and LMDZ (Kleinschmitt et al., 2017), which are core GCMs of the sectional models SOCOL-AER and LMDZ-S3A, respectively.
Panels (c) and (d) of Fig. 1 show deviations (%) from REF in all experiments. Our experiment with lower emission (REF12, 12 Tg of SO2 instead of 14 in REF, but otherwise unchanged plume characteristics) shows lower burdens of up to 14 % globally and 17 % in the tropics, which is therefore even farther than REF from the latest SAGE-II-derived estimates after mid-1992. The results of the sensitivity runs noQBO, noRAD, and noRADnoQBO are presented by the red curves. During the first few months after the Pinatubo eruption, the aerosol mass loading in the tropical reservoir is maintained by the competition between sedimentation and enhanced tropical upwelling due to the radiative heating of volcanic aerosols with the QBO in a strongly descending easterly phase (Trepte and Hitchman, 1992; Trepte et al., 1993). Therefore, deactivation of each of these processes leads to a stratospheric burden decrease mostly located in the tropics. About 1 year after the eruption the global aerosol burden in noQBO and noRAD is approximately 15 % lower than in REF. The experiment noRADnoQBO shows a cumulative effect up to −30 % around 1993. Gravitational sedimentation becomes a dominant removal process when particles grow sufficiently large after the Pinatubo eruption. With effective radii of 0.5 µm or more (Russell et al., 1996) these particles sediment efficiently. The burden calculated by UPWIND mostly lies within ±10 % with respect to REF. This upwind scheme was shown to have a large numerical diffusion smearing the aerosol layer out in both the up and down directions (Benduhn and Lawrence, 2013). This results in a slightly lower mass during 1–1.5 years after the eruption (effect of the downward diffusion) and a slightly larger mass later on (upward transported aerosols stay longer in the stratosphere). Although this diffusion effect is of numerical origin, for our model it increases the stratospheric lifetime of aerosols and leads to a better agreement with SAGE-3λ after 1993. The aerosol burden calculated by COAG, which differs from REF by a higher coagulation efficiency, shows a more rapid decay rate of the global volcanic aerosol burden compared to REF and the measurements. The difference to REF maximizes in late 1993 at approximately −33 %, which is in agreement with other studies also looking at the van der Waals forces effects (English et al., 2013; Sekiya et al., 2016).
3.2 Aerosol size distribution
Figure 2 shows comparisons of the optical particle counter (OPC) measurements operated above Laramie, Wyoming (41∘ N, 105∘ W; Deshler et al., 2003; Deshler, 2008) against our model experiments. The model was sampled as monthly mean values averaged over a region of ±5∘ latitude and longitude around Laramie. Panel (a) shows the effective aerosol radius averaged over 14–30 km. The effective radius calculated by REF generally lies within the observational uncertainty. However, compared to the observational mean, it is biased high under quiescent conditions and biased low during the volcanically perturbed period. COAG shifts the effective radius up compared to REF, which improves the agreement with observations after 1992, but worsens it earlier. Differences of other experiments reflect the burden of the aerosol behavior shown in Fig. 1, illustrating that less mass present in the stratosphere generally also leads to smaller sizes.
Panels (b)–(c) of Fig. 2 show cumulative number distributions for two OPC size channels (R>0.15 µm and R>0.5 µm) in August 1991, May 1992, and March 1993 representing different stages of the volcanic aerosol cloud. We use months with at least two soundings to obtain a useful approximation of day-to-day variability. Aerosol number densities at the altitudes of the maximum concentrations are well reproduced by REF for both large and small particles. Higher altitudes, however, are not so well reproduced, with modeled number densities being up to 3 orders of magnitude too high for bigger particles at certain levels. However, at these high altitudes OPC measurements are themselves uncertain, often having to rely on only one or two channels (plus the concomitant condensation counter measurement). Even larger deviations from the OPC measurements are found for the UPWIND experiment, which clearly has too many particles, especially large ones, in the middle stratosphere all the way to the upper edge of the stratospheric aerosol layer, highlighting the importance of a sedimentation scheme with low numerical diffusivity. Experiments with radiatively decoupled aerosols, noRAD and noRADnoQBO, illustrate the importance of the enhanced upwelling, even in midlatitudes, by showing more large particles staying at the lower levels.
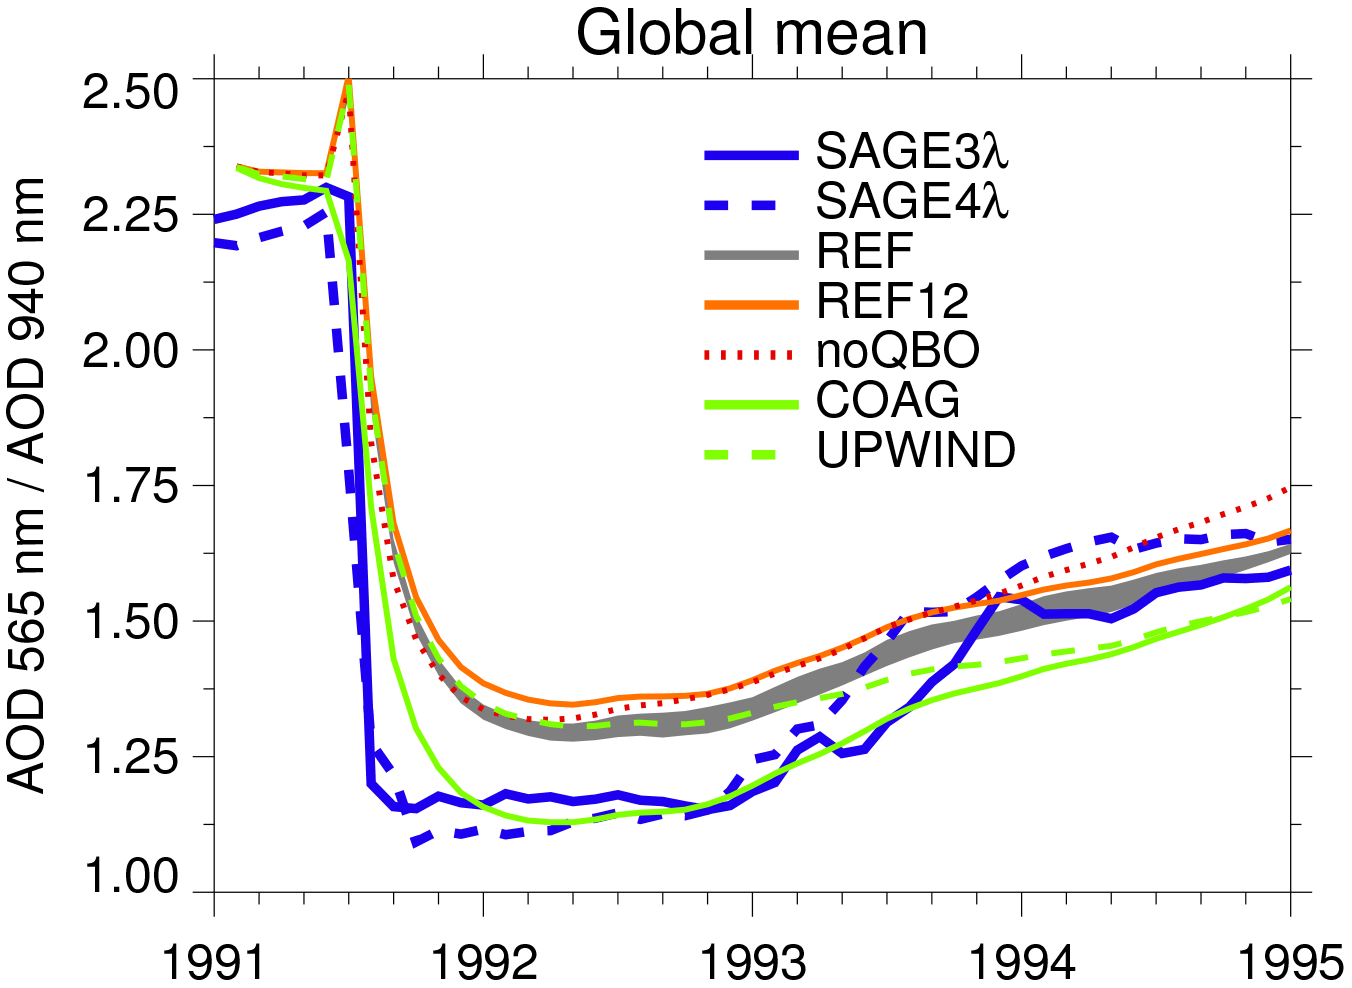
Figure 3Comparison of remote measurements of aerosol optical depth (AOD) ratios at two wavelengths, a proxy of particle size, with SOCOL-AER simulations. Lines: SAGE-II-derived (SAGE-3,4λ) and modeled global AOD (>18 km) ratios 565 nm ∕ 940 nm. Grey shaded area: 2σ ensemble spread of the REF experiment. All other experiments are shown as ensemble means.
To analyze the global mean size distributions, in Fig. 3 we show the ratio of aerosol optical depth (AOD) at 565 and 940 nm for the column above 18 km calculated from SAGE-II-derived composites (blue curves) and from model results. These ratios are inversely related to the particle size: a smaller ratio corresponds to larger particles. In the early phase of the Pinatubo eruption, a large number of small particles are formed, which coalesce very quickly as shown by the very sharp drop in the AOD ratio, falling below 1.25 in observations. Afterwards, the small AOD ratio stays almost constant for approximately 1 year. Around late 1993 the ratio starts to return to higher values because the large particles continuously sediment out of the stratosphere and smaller particles nucleate in the air entering the stratosphere in the tropics. REF predicts smaller particles than derived from SAGE II during the early phase after the eruption, and only in 1993 does it start to agree well with the satellite observations. In contrast, due to the enhanced coagulation, COAG produces larger particles (smaller AOD ratios) than REF and shows better agreement with SAGE II during the 4 years following the eruption. The model run UPWIND with a simplified upwind scheme for sedimentation is initially close to REF but reveals overestimation of the particle sizes compared to REF after 1993. This is related to a larger aerosol burden (Fig. 1), which enables further coagulation. Our experiment with the reduced emission (REF12) further illustrates this effect by showing that weaker emission leads to slightly smaller sizes over the whole lifetime of the volcanic aerosol cloud.
In general, the model in its reference configuration slightly underestimates the mean particle radius. The agreement with observations is much better if a more detailed coagulation is used. However, as seen in panels (b)–(c) of Fig. 2, the model in all configurations also has problems in reproducing altitudes higher than 25 km. Comparison of the model to both in situ OPC measurements and the satellite-based global composites SAGE-3λ and SAGE-4λ reveals the same effects of individual experiments. The main difference between the two comparisons is seen during the pre-eruption time, as the model shows larger particles than OPC and smaller particles than SAGE, which can be attributed to the local bias of model parameters.
3.3 Aerosol optical depth
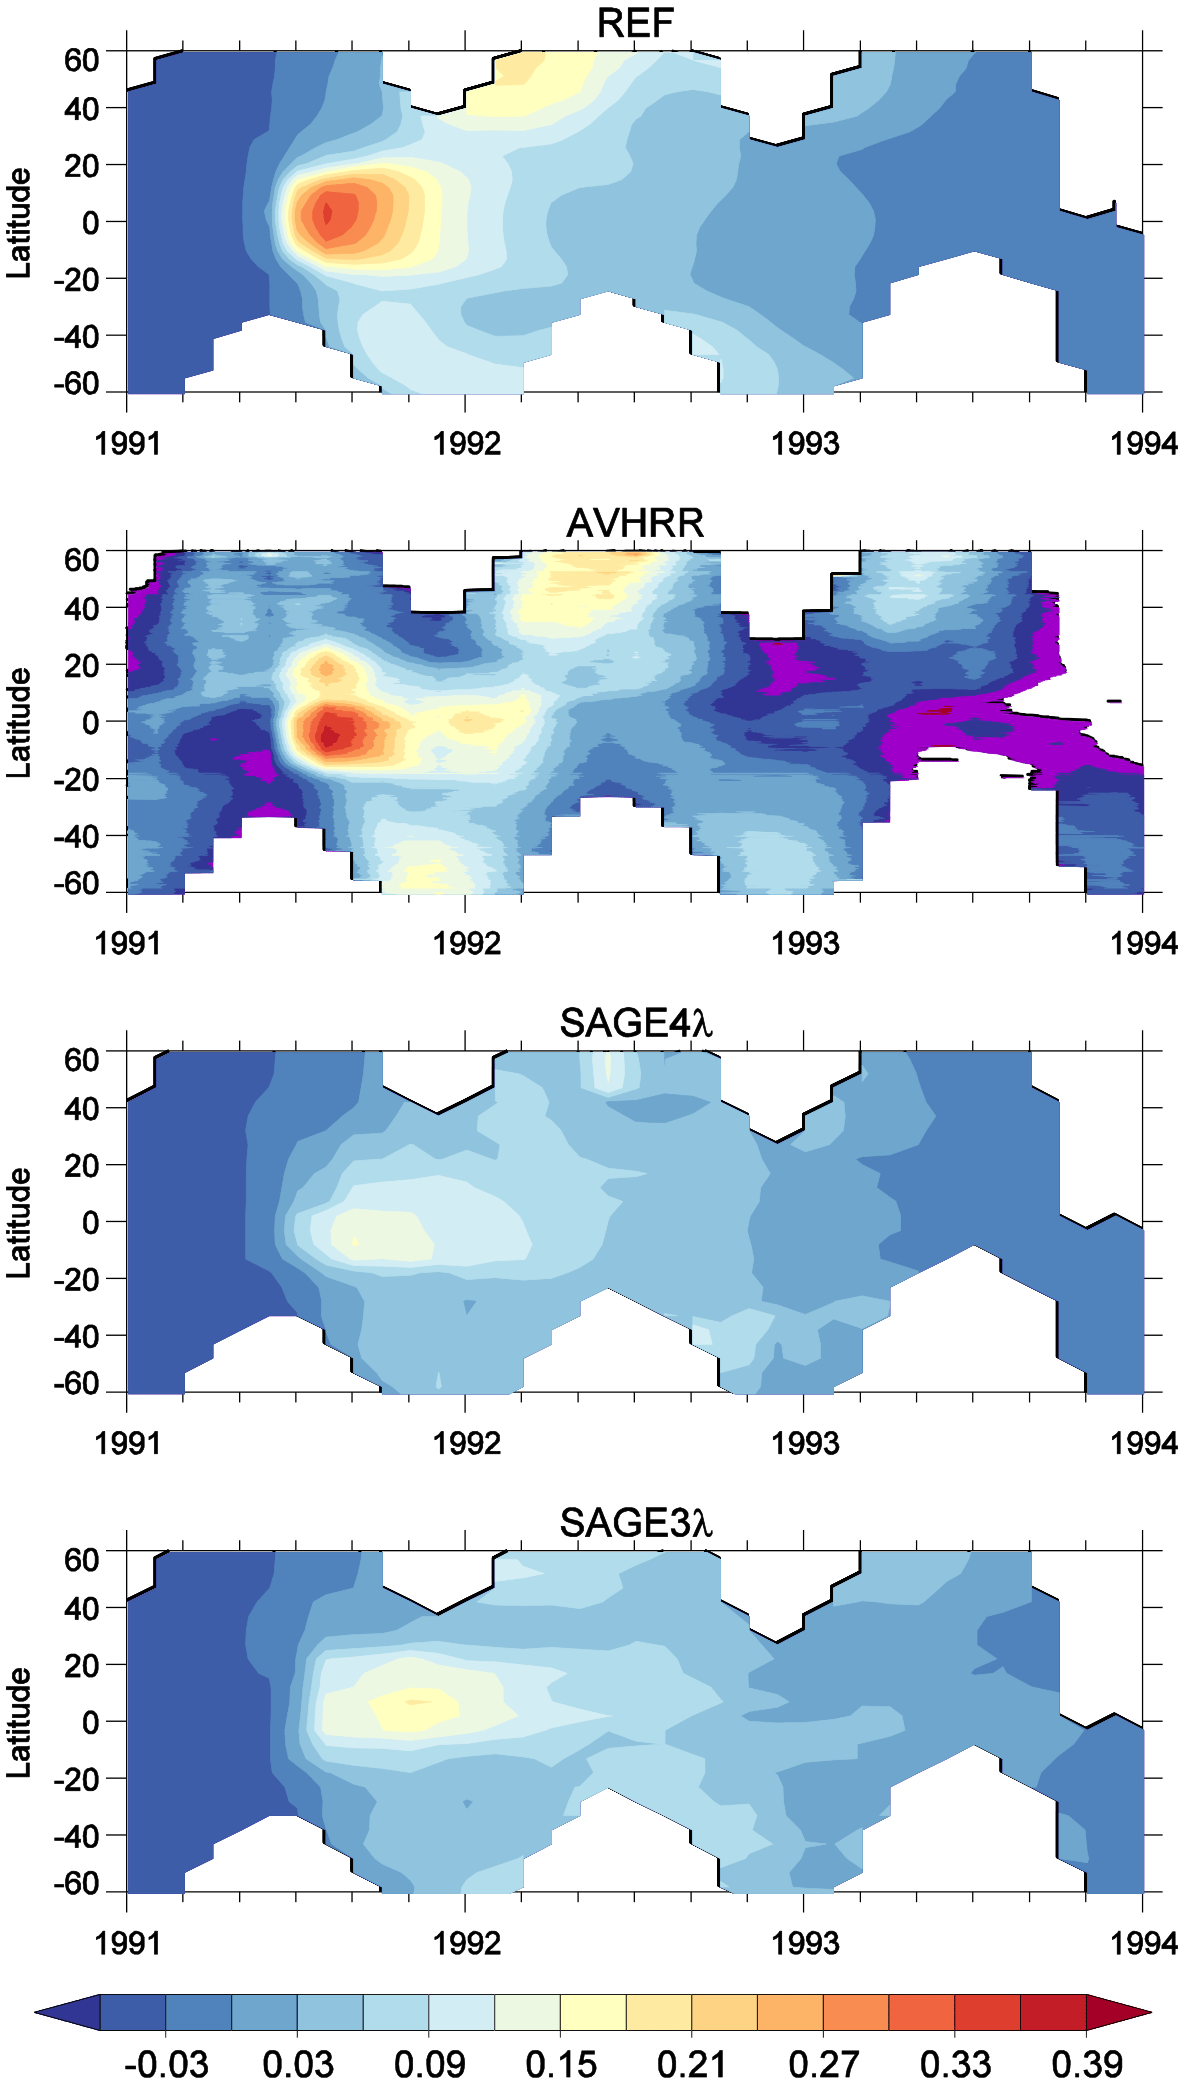
Figure 4Monthly zonal average total AOD measured at 0.63 µm by AVHRR and calculated at 0.56 µm above the tropopause by SOCOL-AER and provided by SAGE-3,4λ composites. Since AVHRR measurements were performed over oceans, we applied the same selection for the model here. SAGE-3,4λ data were, however, initially provided as zonal means. Background values are subtracted from all data sets (which may result in slightly negative values). All panels are masked at winter high latitudes where AVHRR data are missing.
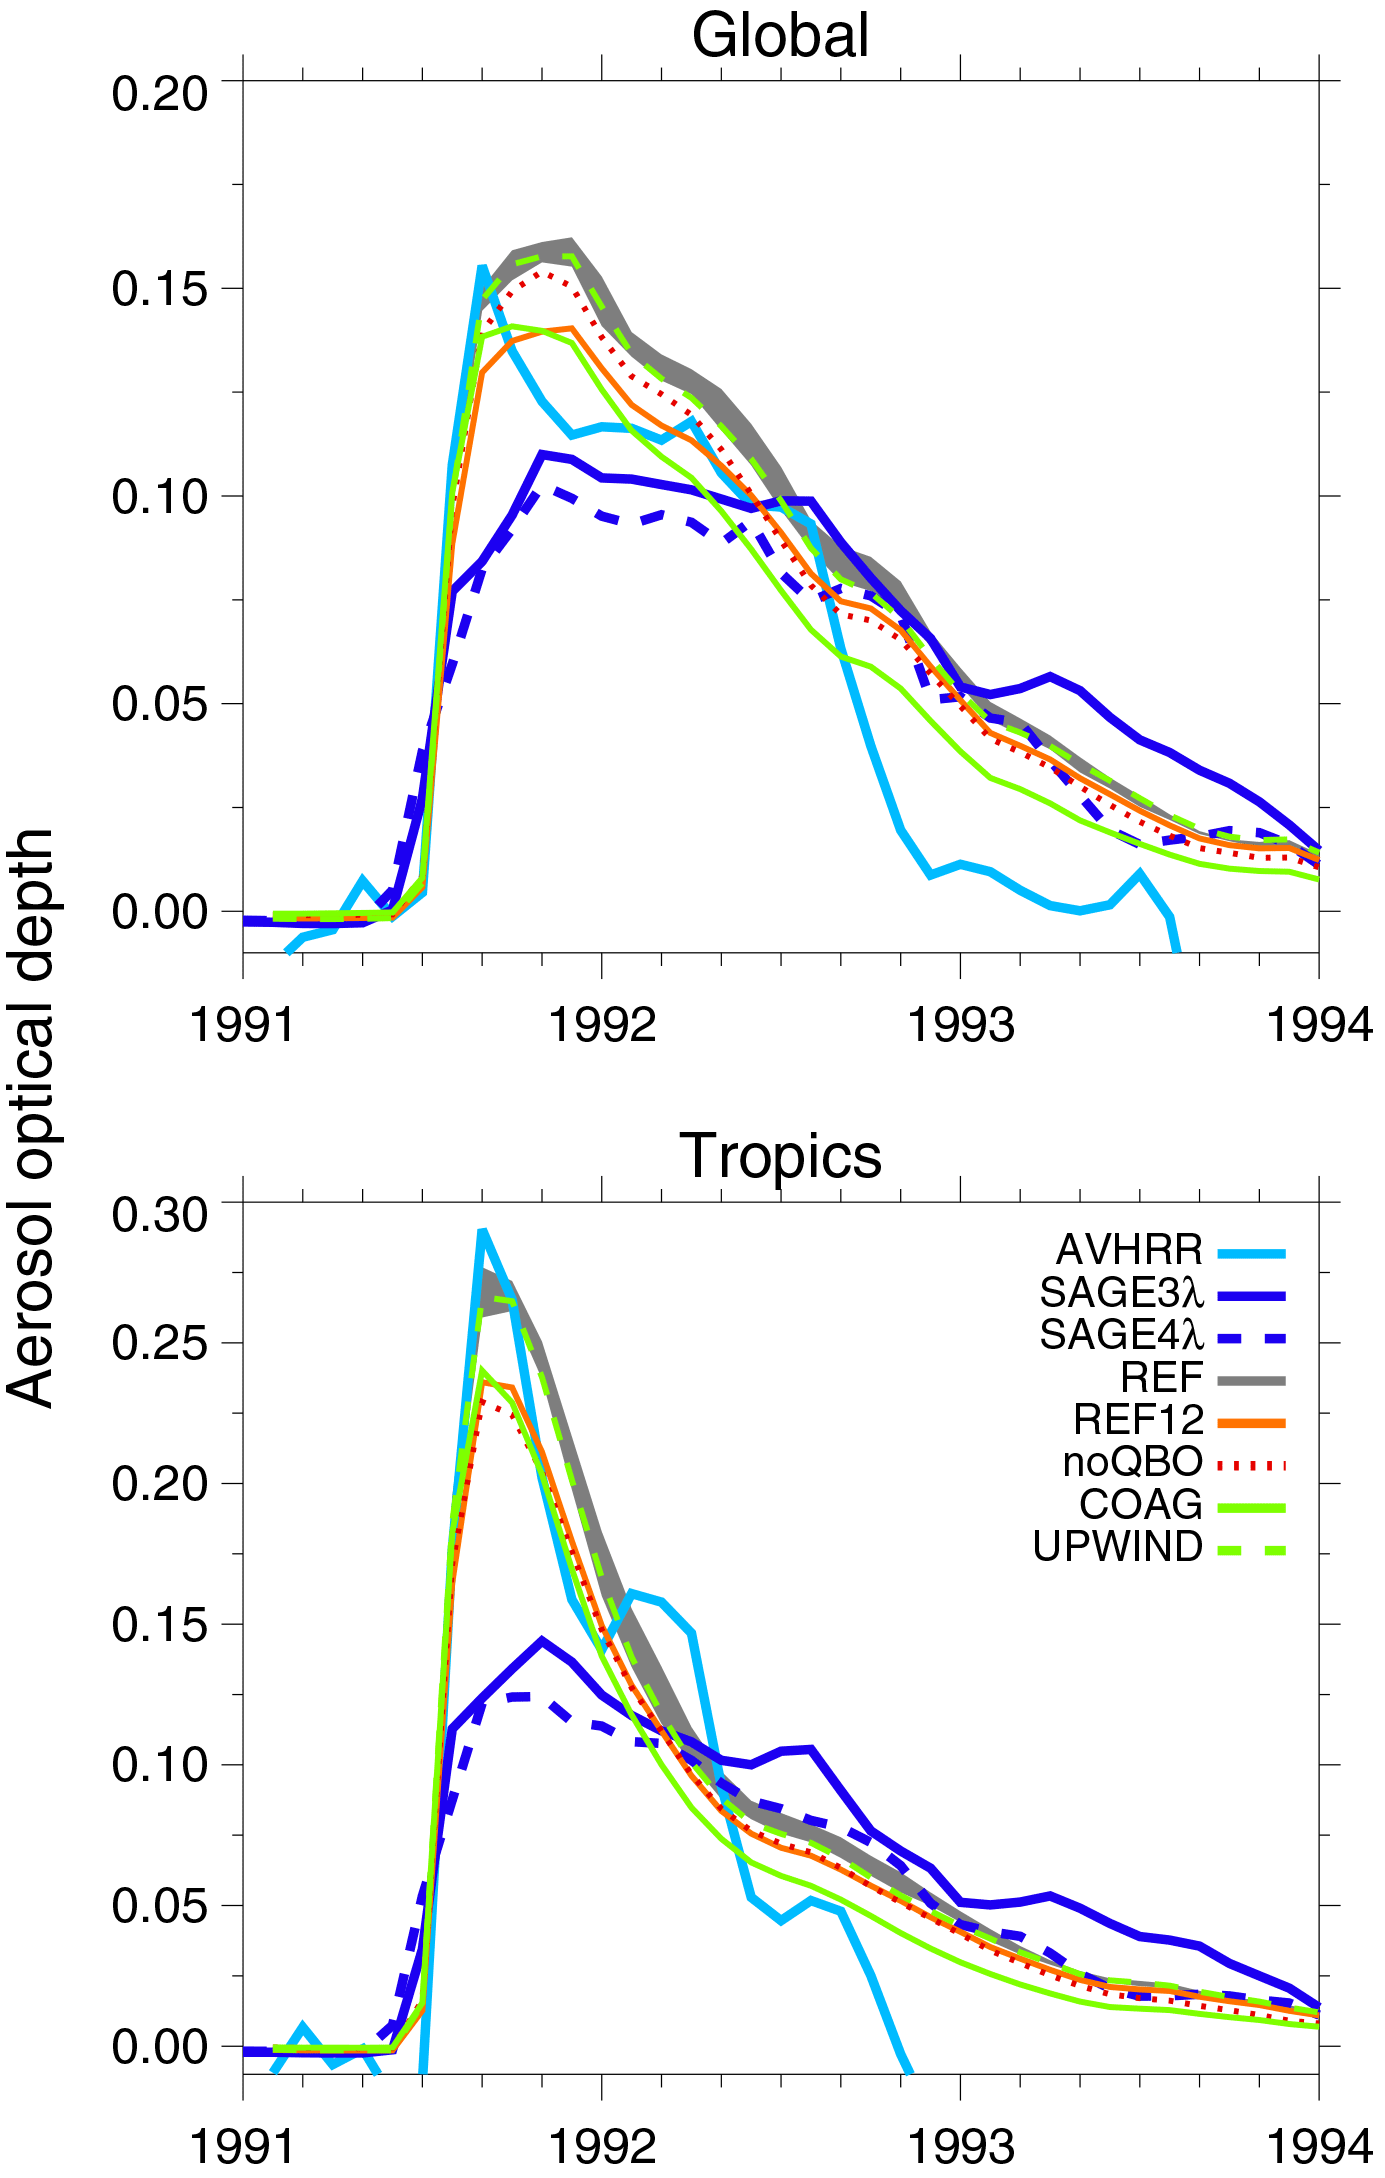
Figure 5Same as in Fig. 4 but averaged over non-masked regions globally (80∘ S–80∘ N) and in the tropics (20∘ S–20∘ N). Grey shaded area: 2σ ensemble spread of the REF experiment. All other experiments are shown as ensemble means.
Figure 4 shows the latitudinal evolution of volcanic material as modeled and measured AOD in the visible part of the solar spectrum, which also represents the main direct climate forcing, since it defines the amount scattered back to space solar irradiance responsible for global cooling. In addition to SAGE II, we used data from the Advanced Very High Resolution Radiometer (AVHRR) satellite instrument, which makes observations over global oceans (Zhao et al., 2013). Modeled and SAGE-3,4λ AODs are obtained by vertically integrating the extinctions above the tropopause. We removed latitudes not observed by AVHRR for each month from the other data sets and subtracted background values from observations and calculations. Aerosol optical depths derived from SAGE II and AVHRR significantly disagree both in magnitude and spatial distribution. SAGE-3,4λ shows much smaller AOD in the tropics in 1991 and not so strong a southward plume as seen in AVHRR at the end of 1991, part of which is influenced by the high-latitude Cerro Hudson eruption in August 1991. The northern hemispheric plume in 1992 is also more pronounced in the AVHRR data. Figure 5 shows the same AOD values, but averaged over the non-masked regions in Fig. 4 over the globe and the tropics. The main difference between AVHRR and SAGE is that AVHRR shows a higher AOD peak in 1991 (2 times higher in tropics) similar to the faster increase in early aerosol burden of HIRS (Fig. 1). However, AVHRR reveals a much faster decay, so starting from late 1992 SAGE-II-derived AOD is much larger than measured by AVHRR.
Modeling results are closer to AVHRR before mid-1992 and to SAGE-II-derived data later. REF shows weaker south- and northward plumes in Fig. 4, but nicely captures the initial increase in the tropics seen by AVHRR. The lifetime of the initial tropical cloud is also well captured compared to AVHRR, except for a small increase in early 1992. Similarly to the burden shown in Fig. 1, starting from mid-1992 the model results are closer to SAGE-4λ than to SAGE-3λ. The experiment REF12 shows lower AODs that are closer to AVHRR globally but at the same time it also provides a weaker initial increase in 1991. The experiment without QBO shows that less mass is maintained in the tropics compared to REF, and therefore more mass is transported southward in 1991 following the Brewer–Dobson circulation. The experiment with increased coagulation efficiency (COAG) shows a faster decay of initial AOD increase. UPWIND has slight changes but mostly lies within the uncertainties of REF. Similarly to the size evolution discussed in the previous section, in general the details of all modeling experiments are also qualitatively consistent with those shown for the burden in Fig. 1.
3.4 Stratospheric temperature response
Lower tropical stratospheric warming after major eruptions is one of the key features of volcanic influence on climate (e.g., Swingedouw et al., 2017). It is a forcing for the thermal wind balance, a mechanism through which volcanoes can affect high-latitude tropospheric circulation. This warming is also an important indicator for the aerosol mass distribution in the stratosphere because it is mostly caused by the infrared absorption of volcanic aerosols, which does not critically depend on aerosol particle size (Lacis et al., 1992). The difficulty of a correct representation of post-volcanic stratospheric warmings is a known issue of global models. Key factors are, besides uncertainties in aerosol distributions, model dynamics and radiative transfer, which in turn also depend on many factors such as spatial and spectral resolution, the presence and quality of interactive chemistry, and others (Eyring et al., 2006; Lanzante and Free, 2008; SPARC, 2010).
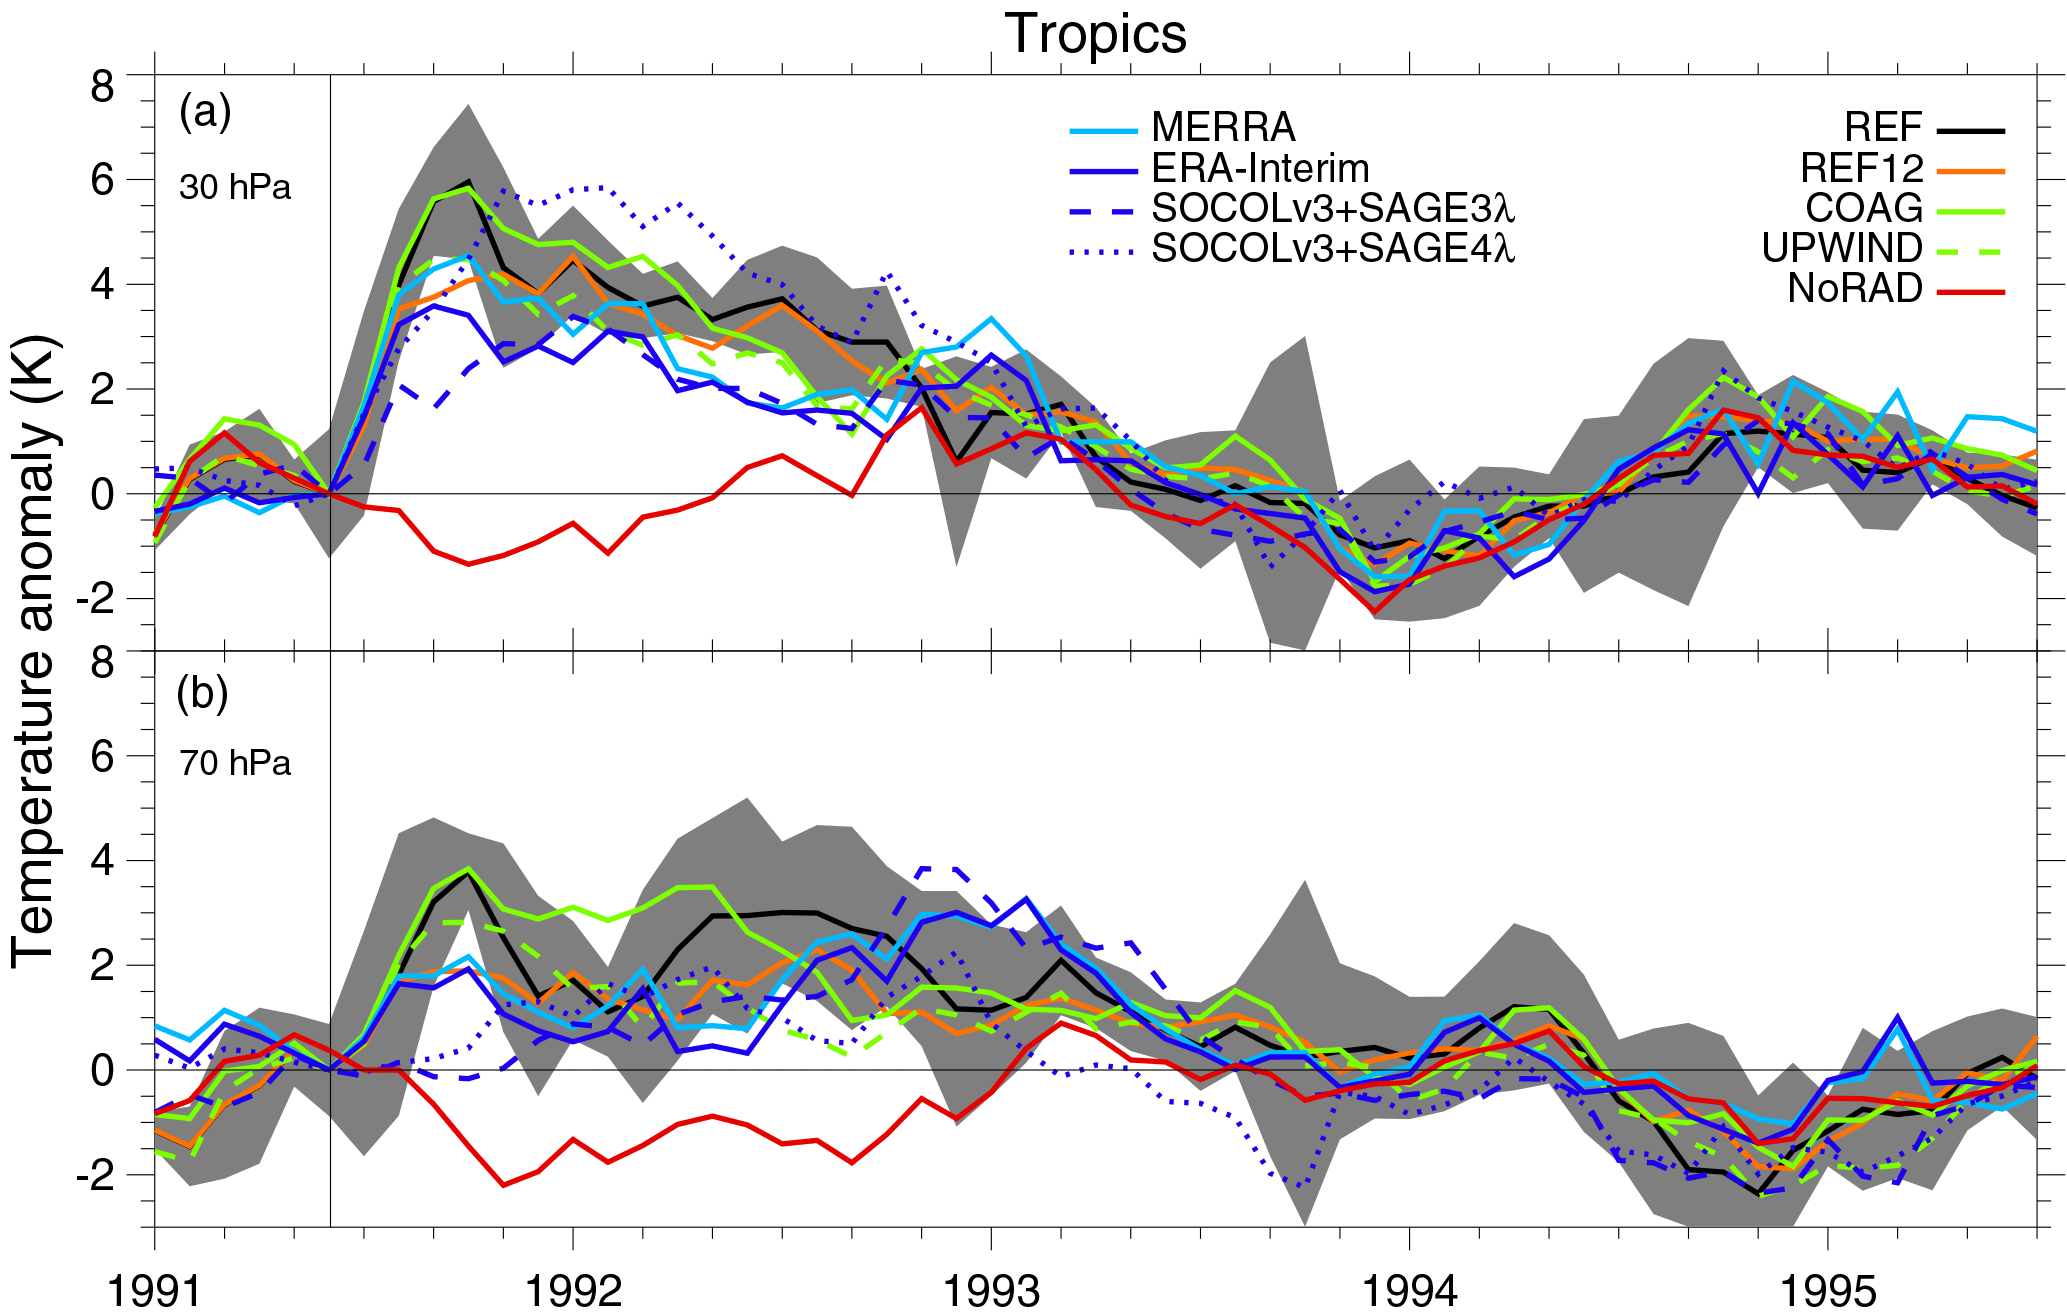
Figure 6Zonal mean temperature anomalies from SOCOL-AER for the tropics (20∘ S–20∘ N) at 30 hPa (a) and 70 hPa (b). Light and dark blue lines: MERRA and ERA-Interim temperature reanalysis data. Anomalies are computed by subtracting the annual cycle. Grey shaded area: 2σ ensemble spread of the REF experiment. All other scenario curves are ensemble means.
Figure 6 compares zonal mean tropical temperature anomalies computed by SOCOL-AER in the lower stratosphere after the Pinatubo eruption with the ERA-Interim and MERRA reanalyses. Anomalies are calculated by subtracting the climatological annual cycle averaged over 1986–2013 for reanalyses and over 1991–1995 of the noRADnoQBO experiment for all other model experiments. Although the noRAD experiment has no aerosol radiative effect, we have also added it to Fig. 6 so that everything between the noRAD line and other lines can be attributed to the radiative effect of volcanic aerosols. By mid-1993 this effect is mostly gone and then all model experiments are in line with reanalyses. Since the lower tropical stratosphere is a dynamically very active region, the model also shows a large ensemble spread in the stratospheric temperature signal so that all numerical experiments and observations generally fall into this variability. While the temperature anomalies in the reanalyses differ by up to 1 K, the ensemble mean of REF (black curve) overestimates the warming both at 30 and 70 hPa by 1–2 K in late 1991 and mid-1992. The SOCOL-AER scenarios show some differences with respect to each other. While the experiment with reduced emissions (REF12) shows better agreement with reanalyses at both levels, this apparent improvement comes with clear deteriorations in other quantities, such as too-small particle sizes (Fig. 3). The scenario with enhanced coagulation efficiency COAG is warmer at 70 hPa early in 1992, which is related to the increased sedimentation of larger particles to lower altitudes. The results of the UPWIND scenario show a smaller warming than REF, which reflects the larger vertical spread of the aerosol mass due to enhanced diffusion, leading to faster aerosol removal from the lowermost stratosphere.
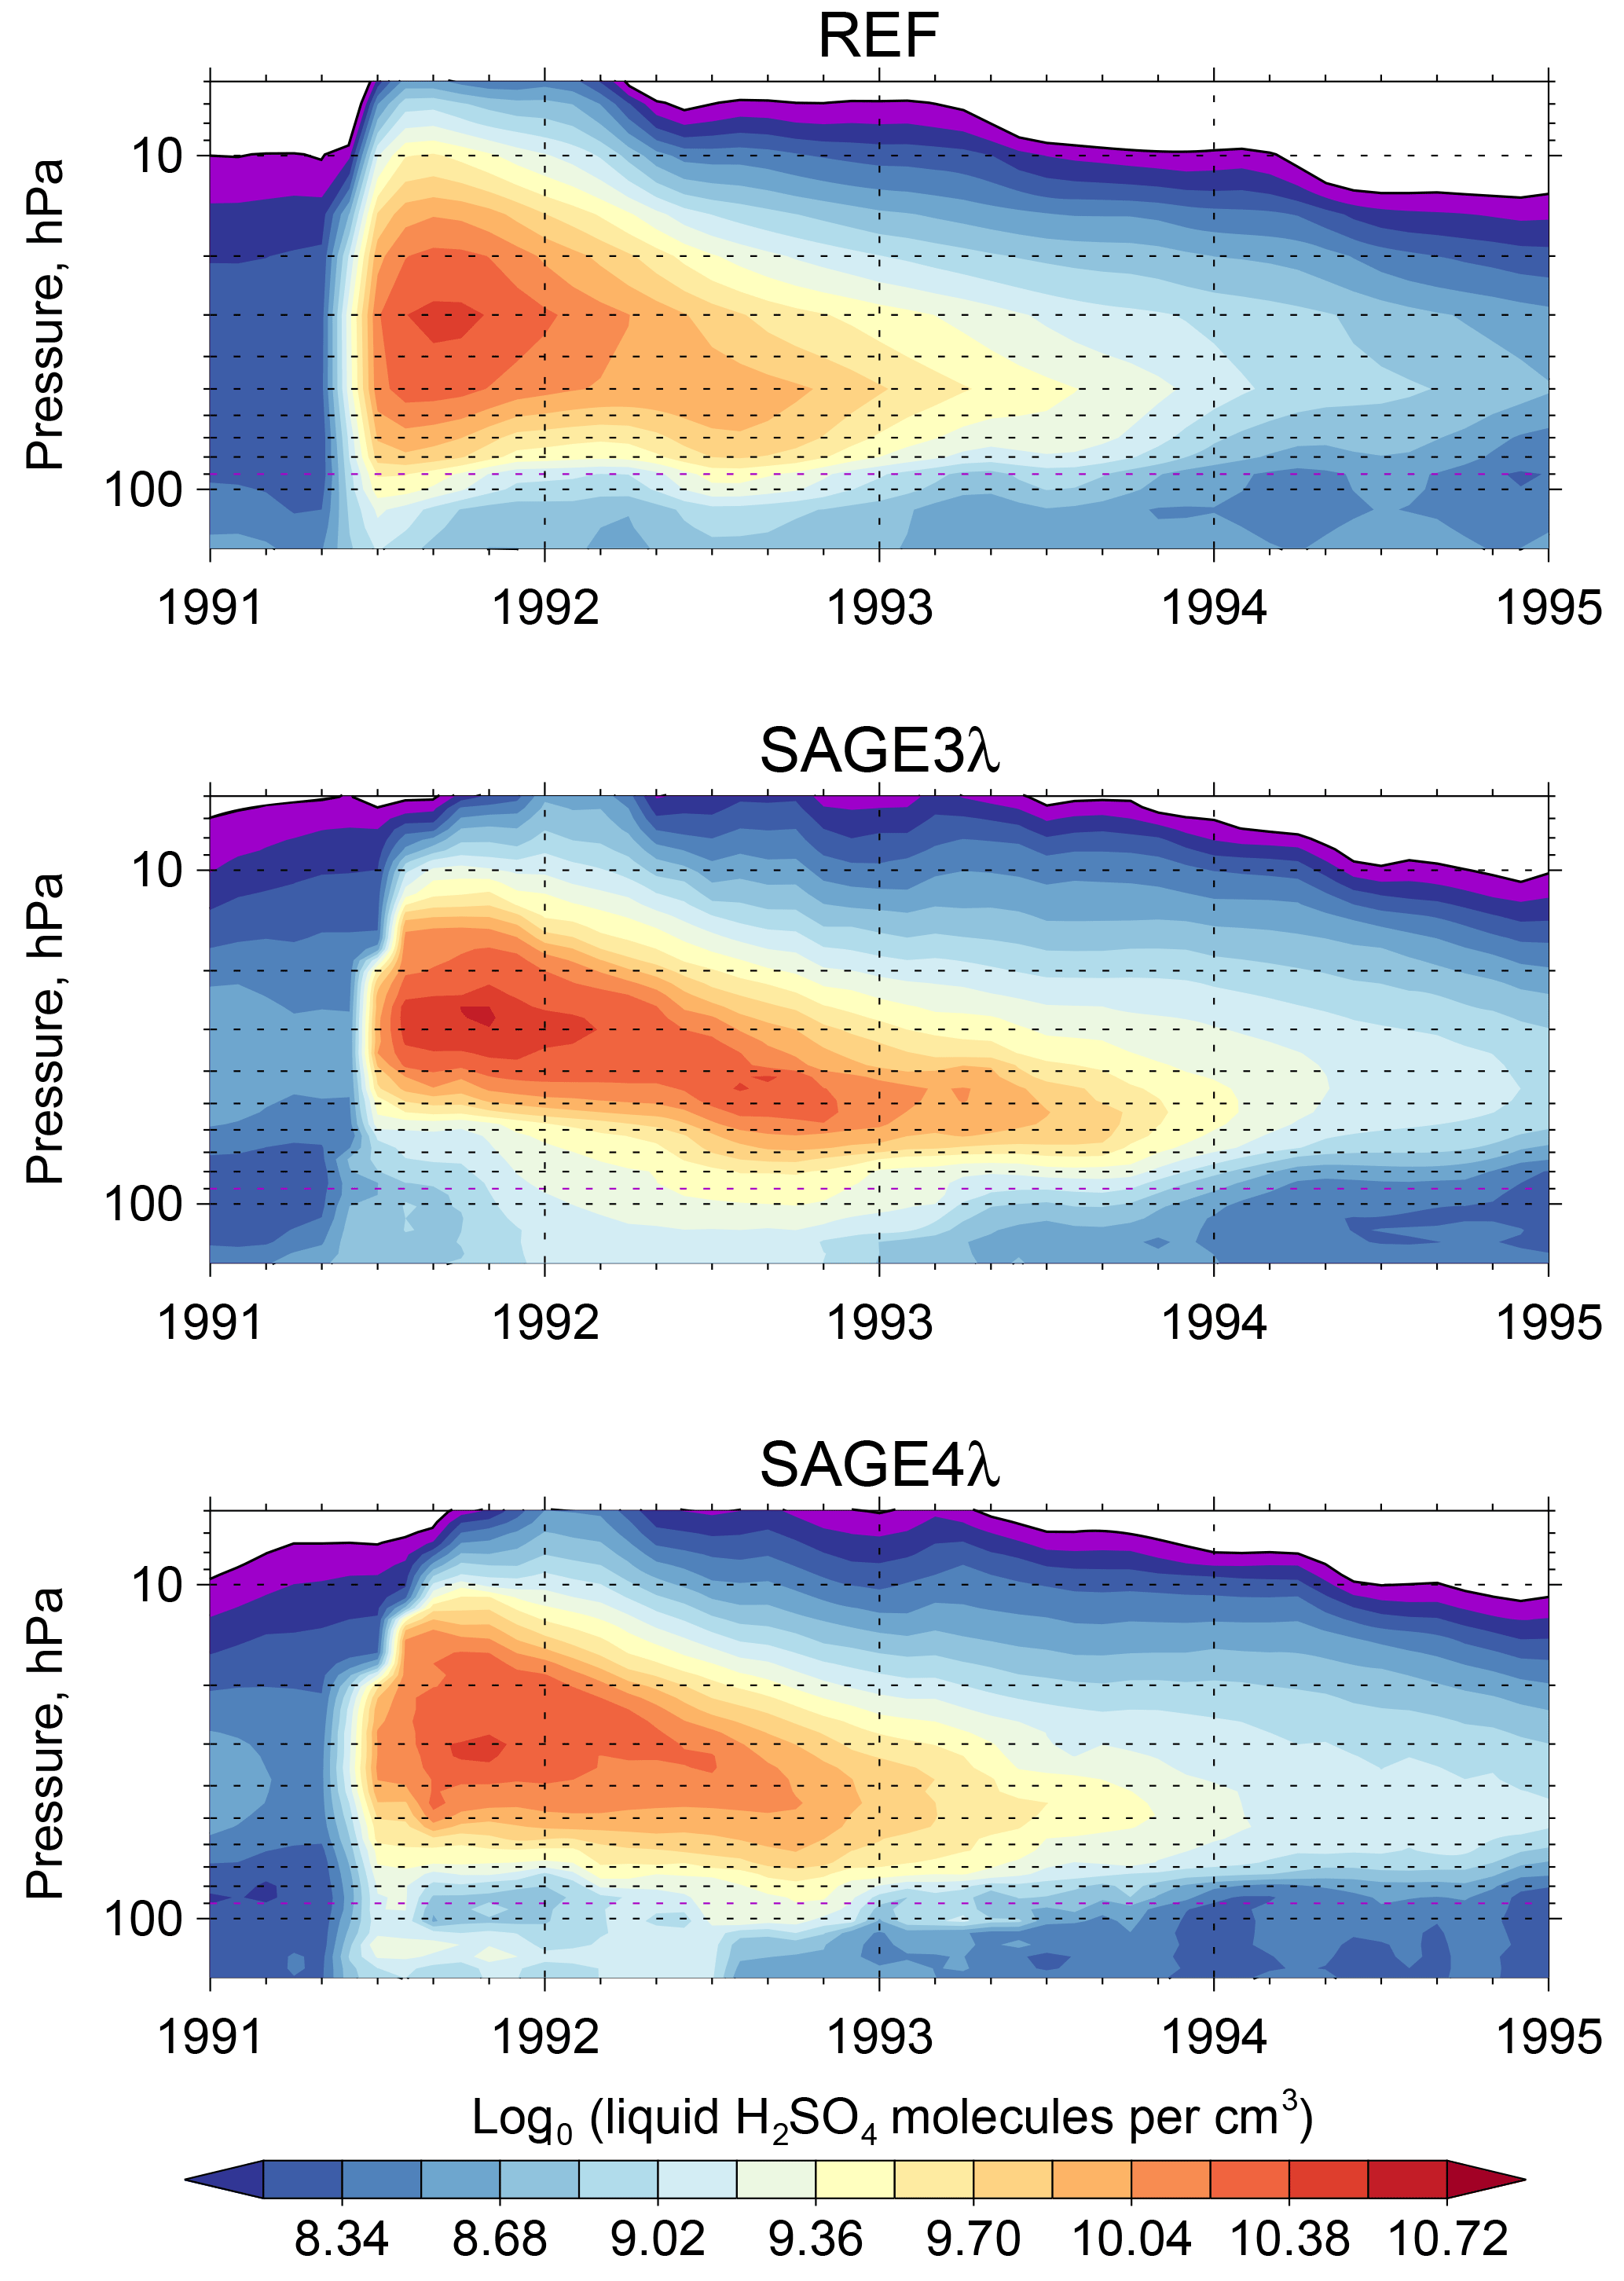
Figure 7Vertical distribution of liquid H2SO4 concentration averaged over the tropics (20∘ S–20∘ N).
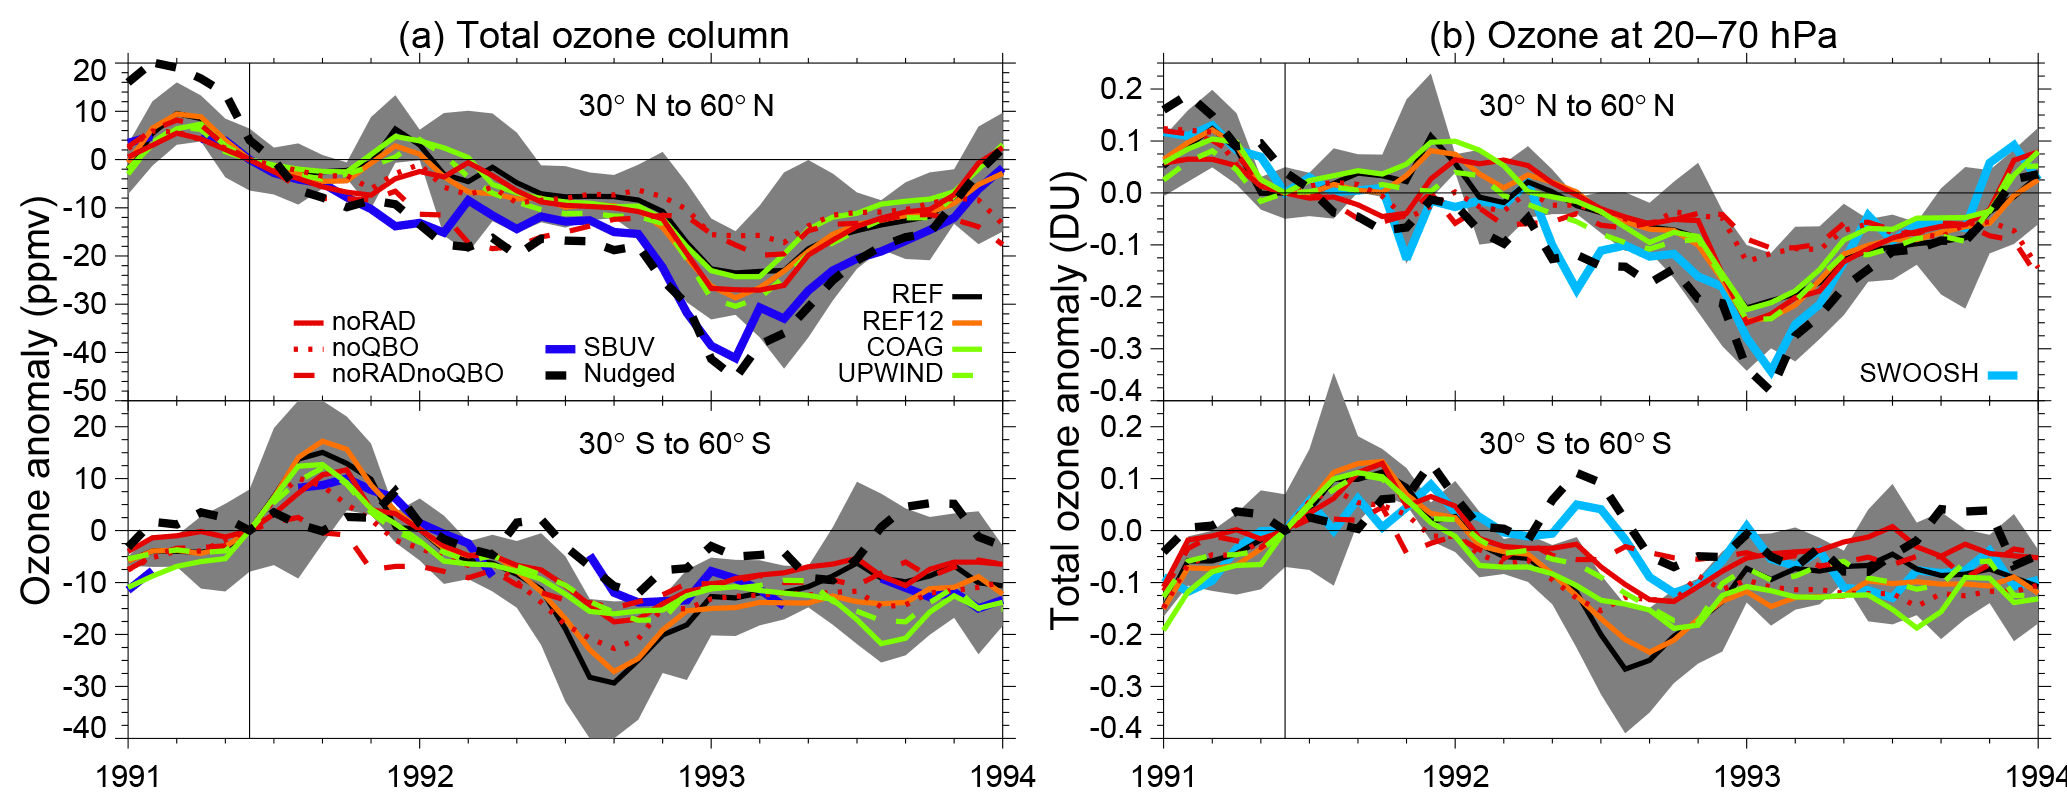
Figure 8Monthly mean midlatitude (30–60∘ north and south) ozone anomalies from SOCOL-AER compared with observations. (a) Total ozone column. (b) Ozone mixing ratio at 20–70 hPa. Observational data sets SWOOSH and SBUVv8.6 are denoted by light and dark blue lines, respectively. Anomalies are computed by subtracting the annual cycle. Grey shaded area: 2σ ensemble spread of the REF experiment. All other experiments are shown as ensemble means.
To further understand the model results, we plotted the vertical aerosol mass distribution in the tropics for REF and the SAGE-3,4λ composites in Fig. 7. We did not plot the vertical mass distributions from other experiments because they are all very similar to REF relative to SAGE data. There are small differences between experiments that are consistent with the previous analysis; i.e., the UPWIND mass is more vertically diffused, while COAG results show a faster decay of the whole aerosol cloud and therefore slightly more mass present at lower levels. The main difference of all SOCOL-AER experiments to the SAGE-II-derived data is the presence of a large amount of aerosol mass in 1991 in the lowermost stratosphere, i.e., below approximately 60 hPa, which is not consistent with the SAGE-II-based composites, in particular SAGE-3λ. Potentially the SAGE-II-derived data can be still influenced by the known problems in observing the lower stratosphere, which became opaque for limb-occultation instruments in 1991 (Russell et al., 1996). This is partly confirmed by comparison of SAGE-II-derived data with HIRS and AVHRR in previous sections. Recently, Revell et al. (2017) analyzed the stratospheric warming after Pinatubo using SOCOLv3, which has the same dynamical and chemical cores as SOCOL-AER, but with prescribed aerosols from the SAGE-4λ and SAGE-3λ composites (dashed and dotted blue curves in Fig. 6). While our SOCOL-AER-based REF simulation overestimates the temperature response at 70 hPa in 1991, both SOCOLv3 simulations driven by the SAGE-II-based data sets are biased low compared to the reanalysis temperatures (Fig. 6b). From a purely radiative point of view neglecting dynamical feedbacks, this suggests that the correct aerosol mass loading below 60 hPa lies between our REF simulation and SAGE-II-derived data.
At higher altitudes, i.e., around the level of maximum aerosol loading, all SOCOL-AER simulations and the SOCOLv3–SAGE-4λ results show a linear relation between aerosol mass and the resulting warming, while the SOCOLv3–SAGE-3λ results show a different behavior: despite having the largest aerosol mass among all considered cases, the simulated temperature response is smallest (Fig. 6a). Even considering potential dynamical effects (e.g., Toohey et al., 2014), the SAGE-3λ-based results are surprising. This encouraged Revell et al. (2017) to reassess their results, and they noticed an issue with the spectral integration of the SAGE-3λ extinctions. The effect of this spectral integration issue on the comparison between SAGE-3λ, SAGE-4λ, and SOCOL-AER will be investigated and discussed further in an upcoming study.
3.5 Ozone response
The response of ozone to major volcanic eruptions is subject to a plethora of dynamical and radiative stratospheric feedbacks, including changes in heterogeneous chemistry. Previously, it was shown that even the sign of the total ozone response after a volcanic eruption depends on the stratospheric halogen loading (e.g., Tie and Brasseur, 1995; Muthers et al., 2015). Volcanic eruptions can in principle also contribute to stratospheric chlorine, which further affects ozone (e.g., Klobas et al., 2017), but there was no significant increase in stratospheric chlorine observed after Pinatubo (Webster et al., 1998). Aquila et al. (2013) and Dhomse et al. (2015) pointed to the hemispheric asymmetry of the midlatitude ozone response to Pinatubo due to modified ozone transport from the tropics. Figure 8 compares monthly mean midlatitude ozone (30–60∘ for both hemispheres) from SOCOL-AER simulations with the total ozone column from the combined record SBUV (Merged Ozone Data Set version 8.6; McPeters et al., 2013) and with the lower stratospheric (20–70 hPa) ozone mixing ratio from the merged satellite composite SWOOSH (Stratospheric Water and Ozone Satellite Homogenized data set; Davis et al., 2016). Anomalies are obtained by subtracting monthly means for 1991–1995.
Compared to SBUV, SOCOL-AER does show a decline in ozone column; however, it underestimates it in the Northern Hemisphere (NH) and overestimates it in the Southern Hemisphere (SH). REF12, COAG, and UPWIND generally fit into the ensemble spread of REF. REF also shows an ozone increase in 1991 in the SH discussed by Aquila et al. (2013) and Dhomse et al. (2015), but in late 1991 a similar increase is shown by the model in the NH, which is not seen in SBUV data. The noRAD and noQBO results show that parts of these ozone increases in the SH and NH are due to heating by aerosols in the tropics and due to QBO, respectively, and both of these peaks disappear in the noRADnoQBO experiment. This hints that SOCOL-AER dynamics do not adequately respond to perturbations in the tropics given that QBO is prescribed and post-eruption warming is well captured, at least by the REF12 experiment (Fig. 6). In order to check this, we performed another experiment with the dynamics nudged to ERA-Interim reanalysis data with the rest of the settings kept as in REF. We used the same nudging procedure as described in Ball et al. (2016). The nudged experiment also shows some differences compared to SBUV, but in general reproduces its behavior much better, thus suggesting some problems in the model's dynamics and good performance of the model's chemistry and aerosol microphysics. Comparison of SOCOL-AER ozone with the SWOOSH composite of stratospheric satellite measurements leads to the same conclusions for the lower stratosphere.
We have simulated the temporal and spatial development of stratospheric aerosols following the 1991 Pinatubo eruption, as well as temperature and ozone responses, using SOCOL-AER, a free-running 3-D global chemistry–climate model coupled with a size-resolving aerosol module. The simulations explore the roles of the QBO, aerosol radiative heating, sedimentation scheme, and coagulation efficiency in the evolution of the stratospheric aerosol after Pinatubo.
The results show that QBO and interactive aerosol radiative heating play important roles in maintaining the tropical stratospheric aerosol reservoir over the whole course of volcanic aerosol cloud evolution, significantly affecting volcanic aerosol lifetime. Furthermore, the results suggest that an accurate sedimentation scheme helps to improve the model's ability to reproduce stratospheric aerosol. Numerically diffusive methods, such as a simple upwind method, must be avoided in modeling studies of large volcanic eruptions to prevent artificially fast spreading of particles to high and low altitudes. A more sophisticated coagulation scheme is capable of improving the comparisons with in situ particle size measurements and satellite-borne extinction ratios, which are a proxy for particle sizes. On the other hand, the improved coagulation scheme leads to too-rapid sedimentation and loss of stratospheric aerosol mass, which become noticeable in the model about 1 year after the eruption.
There is significant uncertainty among the observational data of different aerosol parameters. Observations differ by up to ±15 % in the global aerosol burden, ±30 % in aerosol optical depth and spatiotemporal aerosol distribution in the 2 years following the eruption, ±40 % in the effective particle radii, and ±0.5 K in the lower stratospheric temperature anomalies. This renders the exact determination of the required emitted sulfur amount difficult. Thus, the vertically integrated tropical mass simulated by the reference experiment in 1991 (Fig. 1b) is in good agreement with HIRS, but later experiences faster decay that is not consistent with HIRS and SAGE-3λ but closer to SAGE-4λ. Considering this fact and relying on SAGE-3λ after 1991, we can assume that our 14 Tg estimate of initial emissions was still sufficient for our model, but the vertical distribution of the resulting aerosols could be incorrectly shifted to the lowermost levels. This fact could be responsible for one of the modeling deficiencies found, namely the 1–2 K larger warming that is inconsistent with temperature reanalyses. It could also explain the integrated modeled burden difference to SAGE-3λ since 1992 (Fig. 1), as the mass located at lower levels also sediments faster to the troposphere despite the increased buoyancy produced by additional warming. The experiment with the reduced emissions revealed much better representation of the post-eruption stratospheric warming, but at the same time less optimal agreement with observations of other parameters. In terms of AOD in the visible part of the spectrum, our model is also closer first to AVHRR and later to SAGE-4λ than to SAGE-3λ. It is important to note that the period when all aerosol burden and AOD observational data overlap in 1992 is perfectly captured by the model. Observed features of the ozone response appear to be problematic in being reproduced by the model in a free-running mode, which can be overcome by using a nudged mode. Potentially, both aerosol lifetime and ozone response can be improved with increased horizontal and vertical resolution.
There is rising interest among the climate community in global models with interactive aerosol microphysics. It is caused partly by widely discussed climate geoengineering, namely a compensation for global warming by artificial emissions of SO2 (e.g., MacMartin et al., 2016), and by the unclear role of major and smaller volcanoes in the future climate (e.g., Bethke et al., 2017; Klobas et al., 2017). Considering other modeling studies of Pinatubo effects, our simulations corroborate the results of Kleinschmitt et al. (2017) who also used a sectional model (LDMZ-S3A) and the same emission rate of 14 Tg of SO2. Their results also revealed problems in reproducing aerosol sizes above 25 km and overestimation of stratospheric warming; however, they attributed the latter to the fact that aerosol composition is prescribed during the calculation of aerosol optical properties in LDMZ-S3A (Christoph Kleinschmitt, personal communication, 2017), which is not the case for SOCOL-AERv1.0. The reasons for these and other revealed problems are to be investigated, as SOCOL-AER is still undergoing further development.
The recent Tambora model intercomparison study by Marshall et al. (2018) demonstrated that SOCOL-AER has substantial problems in representing the absolute values of sulfate deposition in the polar regions due to a simplified tropospheric deposition scheme, but also that SOCOL-AER has the closest agreement with ice core observations in terms of the timing of the start and end of volcanic increases in deposition, which is defined by stratospheric aerosol lifetime. A model intercomparison study for Pinatubo is planned within the framework of the Stratospheric Sulfur and Its Role in Climate activity (SSiRC; Timmreck et al., 2018), but, as was also shown here, aerosol observational uncertainty concerning the eruption of Mt. Pinatubo is high and will complicate the derivation of exact conclusions for certain processes and models. Another strong eruption similar to Pinatubo could significantly improve our understanding of the underlying microphysical and transport processes given recent advances in measuring techniques (Kremser et al., 2016).
The SOCOL-AER model code and simulation results presented in this study can be downloaded from https://doi.org/10.5281/zenodo.1245196 (Sukhodolov et al., 2018a) and https://doi.org/10.5281/zenodo.1245202 (Sukhodolov et al., 2018b), respectively. In case of problems, please contact the corresponding author.
JXS and TS performed the simulations, visualized the data, and wrote most of the paper. All authors are responsible for code development and the discussion of results.
The authors declare that they have no conflict of interest.
This work was supported by the Swiss National Science Foundation under
grant 200021_130478 (IASSA). Eugene Rozanov and Timofei Sukhodolov acknowledge
support from the Swiss National Science Foundation under grant 200021_169241
(VEC). Aryeh Feinberg acknowledges support from the ETH grant ETH-39 15-2. We
thank Michael Mills for the discussion of AVHRR data and Christoph Kleinshmitt
for the discussion about LDMZ-S3A results and for providing the effective radius
observational time series. We also thank Matthew Toohey and an anonymous
reviewer for their thorough evaluation of the paper, which helped us to
improve it.
Edited by: Slimane
Bekki
Reviewed by: Matthew Toohey and one anonymous referee
Aquila, V., Oman, L. D., Stolarski, R. S., Colarco, P. R., and Newman, P. A.: Dispersion of the volcanic sulfate cloud from a Mount Pinatubo-like eruption, J. Geophys. Res.-Atmos., 117, D06216, https://doi.org/10.1029/2011JD016968, 2012. a, b
Aquila, V., Oman, L. D., Stolarski, R., Douglass, A. R., and Newman, P. A.: The Response of Ozone and Nitrogen Dioxide to the Eruption of Mt. Pinatubo at Southern and Northern Midlatitudes, J. Atmos. Sci., 70, 894–900, https://doi.org/10.1175/JAS-D-12-0143.1, 2013. a, b
Arfeuille, F., Luo, B. P., Heckendorn, P., Weisenstein, D., Sheng, J. X., Rozanov, E., Schraner, M., Brönnimann, S., Thomason, L. W., and Peter, T.: Modeling the stratospheric warming following the Mt. Pinatubo eruption: uncertainties in aerosol extinctions, Atmos. Chem. Phys., 13, 11221–11234, https://doi.org/10.5194/acp-13-11221-2013, 2013. a, b, c
Ball, W. T., Haigh, J. D., Rozanov, E. V., Kuchar, A., Sukhodolov, T., Tummon, F., Shapiro, A. V., and Schmutz, W.: High solar cycle spectral variations inconsistent with stratospheric ozone observations, Nat. Geosci., 9, 206–209, https://doi.org/10.1038/ngeo2640, 2016. a
Baran, A. J. and Foot, J. S.: New application of the operational sounder HIRS in determining a climatology of sulphuric acid aerosol from the Pinatubo eruption, J. Geophys. Res.-Atmos., 99, 25673–25679, https://doi.org/10.1029/94JD02044, 1994. a, b
Bekki, S.: Oxidation of volcanic SO2: A sink for stratospheric OH and H2O, Geophys. Res. Lett., 22, 913–916, https://doi.org/10.1029/95GL00534, 1995. a
Benduhn, F. and Lawrence, M. G.: An investigation of the role of sedimentation for stratospheric solar radiation management, J. Geophys. Res.-Atmos., 118, 7905–7921, https://doi.org/10.1002/jgrd.50622, 2013. a, b, c, d
Bethke, I., Outten, S., Otterå, O. H., Hawkins, E., Wagner, S., Sigl, M., and Thorne, P.: Potential volcanic impacts on future climate variability, Nat. Clim. Change, 7, 799–805, https://doi.org/10.1038/nclimate3394, 2017. a
Biermann, U. M., Luo, B. P., and Peter, T.: Absorption Spectra and Optical Constants of Binary and Ternary Solutions of H2SO4, HNO3, and H2O in the Mid Infrared at Atmospheric Temperatures, J. Phys. Chem. A, 104, 783–793, https://doi.org/10.1021/jp992349i, 2000. a
Cagnazzo, C., Manzini, E., Giorgetta, M. A., Forster, P. M. D. F., and Morcrette, J. J.: Impact of an improved shortwave radiation scheme in the MAECHAM5 General Circulation Model, Atmos. Chem. Phys., 7, 2503–2515, https://doi.org/10.5194/acp-7-2503-2007, 2007. a
Davis, S. M., Rosenlof, K. H., Hassler, B., Hurst, D. F., Read, W. G., Vömel, H., Selkirk, H., Fujiwara, M., and Damadeo, R.: The Stratospheric Water and Ozone Satellite Homogenized (SWOOSH) database: a long-term database for climate studies, Earth Syst. Sci. Data, 8, 461–490, https://doi.org/10.5194/essd-8-461-2016, 2016. a
Deshler, T.: A review of global stratospheric aerosol: Measurements, importance, life cycle, and local stratospheric aerosol, Atmos. Res., 90, 223–232, https://doi.org/10.1016/j.atmosres.2008.03.016, 2008. a, b
Deshler, T., Hervig, M. E., Hofmann, D. J., Rosen, J. M., and Liley, J. B.: Thirty years of in situ stratospheric aerosol size distribution measurements from Laramie, Wyoming (41∘ N), using balloon-borne instruments, J. Geophys. Res.-Atmos., 108, 4167, https://doi.org/10.1029/2002JD002514, 2003. a
Dhomse, S. S., Emmerson, K. M., Mann, G. W., Bellouin, N., Carslaw, K. S., Chipperfield, M. P., Hommel, R., Abraham, N. L., Telford, P., Braesicke, P., Dalvi, M., Johnson, C. E., O'Connor, F., Morgenstern, O., Pyle, J. A., Deshler, T., Zawodny, J. M., and Thomason, L. W.: Aerosol microphysics simulations of the Mt. Pinatubo eruption with the UM-UKCA composition-climate model, Atmos. Chem. Phys., 14, 11221–11246, https://doi.org/10.5194/acp-14-11221-2014, 2014. a, b, c
Dhomse, S. S., Chipperfield, M. P., Feng, W., Hossaini, R., Mann, G. W., and Santee, M. L.: Revisiting the hemispheric asymmetry in midlatitude ozone changes following the Mount Pinatubo eruption: A 3-D model study, Geophys. Res. Lett., 42, 3038–3047, https://doi.org/10.1002/2015GL063052, 2015. a, b
Dutton, E. G. and Christy, J. R.: Solar radiative forcing at selected locations and evidence for global lower tropospheric cooling following the eruptions of El Chichón and Pinatubo, Geophys. Res. Lett., 19, 2313–2316, https://doi.org/10.1029/92GL02495, 1992. a
English, J. M., Toon, O. B., Mills, M. J., and Yu, F.: Microphysical simulations of new particle formation in the upper troposphere and lower stratosphere, Atmos. Chem. Phys., 11, 9303–9322, https://doi.org/10.5194/acp-11-9303-2011, 2011. a
English, J. M., Toon, O. B., and Mills, M. J.: Microphysical simulations of large volcanic eruptions: Pinatubo and Toba, J. Geophys. Res.-Atmos., 118, 1880–1895, https://doi.org/10.1002/jgrd.50196, 2013. a, b, c, d
Eyring, V., Butchart, N., Waugh, D. W., Akiyoshi, H., Austin, J., Bekki, S., Bodeker, G. E., Boville, B. A., Brühl, C., Chipperfield, M. P., Cordero, E., Dameris, M., Deushi, M., Fioletov, V. E., Frith, S. M., Garcia, R. R., Gettelman, A., Giorgetta, M. A., Grewe, V., Jourdain, L., Kinnison, D. E., Mancini, E., Manzini, E., Marchand, M., Marsh, D. R., Nagashima, T., Newman, P. A., Nielsen, J. E., Pawson, S., Pitari, G., Plummer, D. A., Rozanov, E., Schraner, M., Shepherd, T. G., Shibata, K., Stolarski, R. S., Struthers, H., Tian, W., and Yoshiki, M.: Assessment of temperature, trace species, and ozone in chemistry-climate model simulations of the recent past, J. Geophys. Res.-Atmos., 111, D22308, https://doi.org/10.1029/2006JD007327, 2006. a
Eyring, V., Bony, S., Meehl, G. A., Senior, C. A., Stevens, B., Stouffer, R. J., and Taylor, K. E.: Overview of the Coupled Model Intercomparison Project Phase 6 (CMIP6) experimental design and organization, Geosci. Model Dev., 9, 1937–1958, https://doi.org/10.5194/gmd-9-1937-2016, 2016. a
Graf, H.-F., Li, Q., and Giorgetta, M. A.: Volcanic effects on climate: revisiting the mechanisms, Atmos. Chem. Phys., 7, 4503–4511, https://doi.org/10.5194/acp-7-4503-2007, 2007. a
Guo, S., Bluth, G. J. S., Rose, W. I., Watson, I. M., and Prata, A. J.: Re-evaluation of SO2 release of the 15 June 1991 Pinatubo eruption using ultraviolet and infrared satellite sensors, Geochem. Geophy. Geosy., 5, Q04001, https://doi.org/10.1029/2003GC000654, 2004. a
Kleinschmitt, C., Boucher, O., Bekki, S., Lott, F., and Platt, U.: The Sectional Stratospheric Sulfate Aerosol module (S3A-v1) within the LMDZ general circulation model: description and evaluation against stratospheric aerosol observations, Geosci. Model Dev., 10, 3359–3378, https://doi.org/10.5194/gmd-10-3359-2017, 2017. a, b, c, d, e, f
Klobas, E. J., Wilmouth, D. M., Weisenstein, D. K., Anderson, J. G., and Salawitch, R. J.: Ozone depletion following future volcanic eruptions, Geophys. Res. Lett., 44, 7490–7499, https://doi.org/10.1002/2017GL073972, 2017. a, b
Kodera, K.: Influence of volcanic eruptions on the troposphere through stratospheric dynamical processes in the northern hemisphere winter, J. Geophys. Res.-Atmos., 99, 1273–1282, https://doi.org/10.1029/93JD02731, 1994. a
Kremser, S., Thomason, L. W., von Hobe, M., Hermann, M., Deshler, T., Timmreck, C., Toohey, M., Stenke, A., Schwarz, J. P., Weigel, R., Fueglistaler, S., Prata, F. J., Vernier, J.-P., Schlager, H., Barnes, J. E., Antuña-Marrero, J.-C., Fairlie, D., Palm, M., Mahieu, E., Notholt, J., Rex, M., Bingen, C., Vanhellemont, F., Bourassa, A., Plane, J. M. C., Klocke, D., Carn, S. A., Clarisse, L., Trickl, T., Neely, R., James, A. D., Rieger, L., Wilson, J. C., and Meland, B.: Stratospheric aerosol: Observations, processes, and impact on climate, Rev. Geophys., 54, 278–335, https://doi.org/10.1002/2015RG000511, 2016. a, b, c
Labitzke, K. and McCormick, M. P.: Stratospheric temperature increases due to Pinatubo aerosols, Geophys. Res. Lett., 19, 207–210, https://doi.org/10.1029/91GL02940, 1992. a
Lacis, A., Hansen, J., and Sato, M.: Climate forcing by stratospheric aerosols, Geophys. Res. Lett., 19, 1607–1610, https://doi.org/10.1029/92GL01620, 1992. a
Lanzante, J. R. and Free, M.: Comparison of Radiosonde and GCM Vertical Temperature Trend Profiles: Effects of Dataset Choice and Data Homogenization*, J. Climate, 21, 5417–5435, https://doi.org/10.1175/2008JCLI2287.1, 2008. a
Liu, F., Chai, J., Wang, B., Liu, J., Zhang, X., and Wang, Z.: Global monsoon precipitation responses to large volcanic eruptions, Sci. Rep.-UK, 6, 24331, https://doi.org/10.1038/srep24331, 2016. a
MacMartin, D. G., Kravitz, B., Long, J. C. S., and Rasch, P. J.: Geoengineering with stratospheric aerosols: What do we not know after a decade of research?, Earths Future, 4, 543–548, https://doi.org/10.1002/2016EF000418, 2016. a
Marshall, L., Schmidt, A., Toohey, M., Carslaw, K. S., Mann, G. W., Sigl, M., Khodri, M., Timmreck, C., Zanchettin, D., Ball, W. T., Bekki, S., Brooke, J. S. A., Dhomse, S., Johnson, C., Lamarque, J.-F., LeGrande, A. N., Mills, M. J., Niemeier, U., Pope, J. O., Poulain, V., Robock, A., Rozanov, E., Stenke, A., Sukhodolov, T., Tilmes, S., Tsigaridis, K., and Tummon, F.: Multi-model comparison of the volcanic sulfate deposition from the 1815 eruption of Mt. Tambora, Atmos. Chem. Phys., 18, 2307–2328, https://doi.org/10.5194/acp-18-2307-2018, 2018. a, b, c
McPeters, R. D., Bhartia, P. K., Haffner, D., Labow, G. J., and Flynn, L.: The version 8.6 SBUV ozone data record: An overview, J. Geophys. Res.-Atmos., 118, 8032–8039, https://doi.org/10.1002/jgrd.50597, 2013. a
Miles, G. M., Siddans, R., Grainger, R. G., Prata, A. J., Fisher, B., and Krotkov, N.: Retrieval of volcanic SO2 from HIRS/2 using optimal estimation, Atmos. Meas. Tech., 10, 2687–2702, https://doi.org/10.5194/amt-10-2687-2017, 2017. a
Mills, M. J., Schmidt, A., Easter, R., Solomon, S., Kinnison, D. E., Ghan, S. J., Neely, R. R., Marsh, D. R., Conley, A., Bardeen, C. G., and Gettelman, A.: Global volcanic aerosol properties derived from emissions, 1990–2014, using CESM1(WACCM), J. Geophys. Res.-Atmos., 121, 2332–2348, https://doi.org/10.1002/2015JD024290, 2016. a, b
Mills, M. J., Richter, J. H., Tilmes, S., Kravitz, B., MacMartin, D. G., Glanville, A. A., Tribbia, J. J., Lamarque, J.-F., Vitt, F., Schmidt, A., Gettelman, A., Hannay, C., Bacmeister, J. T., and Kinnison, D. E.: Radiative and Chemical Response to Interactive Stratospheric Sulfate Aerosols in Fully Coupled CESM1(WACCM), J. Geophys. Res.-Atmos., 122, 13061–13078, https://doi.org/10.1002/2017JD027006, 2017. a
Minnis, P., Harrison, E. F., Stowe, L. L., Gibson, G. G., Denn, F. M., Doelling, D. R., and Smith, W. L.: Radiative Climate Forcing by the Mount Pinatubo Eruption, Science, 259, 1411–1415, https://doi.org/10.1126/science.259.5100.1411, 1993. a
Mlawer, E. J., Taubman, S. J., Brown, P. D., Iacono, M. J., and Clough, S. A.: Radiative transfer for inhomogeneous atmospheres: RRTM, a validated correlated-k model for the longwave, J. Geophys. Res., 102, 16663–16682, https://doi.org/10.1029/97JD00237, 1997. a
Muthers, S., Arfeuille, F., Raible, C. C., and Rozanov, E.: The impacts of volcanic aerosol on stratospheric ozone and the Northern Hemisphere polar vortex: separating radiative-dynamical changes from direct effects due to enhanced aerosol heterogeneous chemistry, Atmos. Chem. Phys., 15, 11461–11476, https://doi.org/10.5194/acp-15-11461-2015, 2015. a
Narsimhan, G. and Ruckenstein, E.: The Brownian coagulation of aerosols over the entire range of Knudsen numbers: Connection between the sticking probability and the interaction forces, J. Colloid Interf. Sci., 104, 344–369, https://doi.org/10.1016/0021-9797(85)90044-X, 1985. a
Predybaylo, E., Stenchikov, G. L., Wittenberg, A. T., and Zeng, F.: Impacts of a Pinatubo-size volcanic eruption on ENSO, J. Geophys. Res.-Atmos., 122, 925–947, https://doi.org/10.1002/2016JD025796, 2017. a
Randel, W. J., Shine, K. P., Austin, J., Barnett, J., Claud, C., Gillett, N. P., Keckhut, P., Langematz, U., Lin, R., Long, C., Mears, C., Miller, A., Nash, J., Seidel, D. J., Thompson, D. W. J., Wu, F., and Yoden, S.: An update of observed stratospheric temperature trends, J. Geophys. Res.-Atmos., 114, D02107, https://doi.org/10.1029/2008JD010421, 2009. a
Rayner, N. A., Parker, D. E., Horton, E. B., Folland, C. K., Alexander, L. V., Rowell, D. P., Kent, E. C., and Kaplan, A.: Global analyses of sea surface temperature, sea ice, and night marine air temperature since the late nineteenth century, J. Geophys. Res.-Atmos., 108, 4407, https://doi.org/10.1029/2002JD002670, 2003. a
Revell, L. E., Stenke, A., Luo, B., Kremser, S., Rozanov, E., Sukhodolov, T., and Peter, T.: Impacts of Mt Pinatubo volcanic aerosol on the tropical stratosphere in chemistry–climate model simulations using CCMI and CMIP6 stratospheric aerosol data, Atmos. Chem. Phys., 17, 13139–13150, https://doi.org/10.5194/acp-17-13139-2017, 2017. a, b, c
Rozanov, E. V., Schlesinger, M. E., Andronova, N. G., Yang, F., Malyshev, S. L., Zubov, V. A., Egorova, T. A., and Li, B.: Climate/chemistry effects of the Pinatubo volcanic eruption simulated by the UIUC stratosphere/troposphere GCM with interactive photochemistry, J. Geophys. Res.-Atmos., 107, ACL 12-1–ACL 12-14, https://doi.org/10.1029/2001JD000974, 2002. a
Russell, P. B., Livingston, J. M., Pueschel, R. F., Bauman, J. J., Pollack, J. B., Brooks, S. L., Hamill, P., Thomason, L. W., Stowe, L. L., Deshler, T., Dutton, E. G., and Bergstrom, R. W.: Global to microscale evolution of the Pinatubo volcanic aerosol derived from diverse measurements and analyses, J. Geophys. Res.-Atmos., 101, 18745–18763, https://doi.org/10.1029/96JD01162, 1996. a, b, c
Sekiya, T., Sudo, K., and Nagai, T.: Evolution of stratospheric sulfate aerosol from the 1991 Pinatubo eruption: Roles of aerosol microphysical processes, J. Geophys. Res.-Atmos., 121, 2911–2938, https://doi.org/10.1002/2015JD024313, 2016. a, b, c, d
Sheng, J.-X., Weisenstein, D. K., Luo, B.-P., Rozanov, E., Arfeuille, F., and Peter, T.: A perturbed parameter model ensemble to investigate Mt. Pinatubo's 1991 initial sulfur mass emission, Atmos. Chem. Phys., 15, 11501–11512, https://doi.org/10.5194/acp-15-11501-2015, 2015a. a, b, c
Sheng, J.-X., Weisenstein, D. K., Luo, B.-P., Rozanov, E., Stenke, A., Anet, J., Bingemer, H., and Peter, T.: Global atmospheric sulfur budget under volcanically quiescent conditions: Aerosol-chemistry-climate model predictions and validation, J. Geophys. Res.-Atmos., 120, 256–276, https://doi.org/10.1002/2014JD021985, 2015b. a, b, c
Sigl, M., Winstrup, M., McConnell, J. R., Welten, K. C., Plunkett, G., Ludlow, F., Büntgen, U., Caffee, M., Chellman, N., Dahl-Jensen, D., Fischer, H., Kipfstuhl, S., Kostick, C., Maselli, O. J., Mekhaldi, F., Mulvaney, R., Muscheler, R., Pasteris, D. R., Pilcher, J. R., Salzer, M., Schüpbach, S., Steffensen, J. P., Vinther, B. M., and Woodruff, T. E.: Timing and climate forcing of volcanic eruptions for the past 2,500 years, Nature, 523, 543–549, https://doi.org/10.1038/nature14565, 2015. a
Soden, B. J., Wetherald, R. T., Stenchikov, G. L., and Robock, A.: Global Cooling After the Eruption of Mount Pinatubo: A Test of Climate Feedback by Water Vapor, Science, 296, 727–730, https://doi.org/10.1126/science.296.5568.727, 2002. a
Solomon, S.: Stratospheric ozone depletion: A review of concepts and history, Rev. Geophys., 37, 275–316, https://doi.org/10.1029/1999RG900008, 1999. a
SPARC: SPARC CCMVal Report on the Evaluation of Chemistry-Climate Models, edited by: Eyring, V., Shepherd, T., and Waugh, D., SPARC Report No. 5, WCRP-30/2010, WMO/TD – No. 40, available at: https://www.sparc-climate.org/publications/sparc-reports/sparc-report-no-5/ (last access: 4 July 2018), 2010. a
Stenchikov, G. L., Kirchner, I., Robock, A., Graf, H.-F., Antuña, J. C., Grainger, R. G., Lambert, A., and Thomason, L.: Radiative forcing from the 1991 Mount Pinatubo volcanic eruption, J. Geophys. Res., 103, 13837–13857, https://doi.org/10.1029/98JD00693, 1998. a
Stenke, A., Schraner, M., Rozanov, E., Egorova, T., Luo, B., and Peter, T.: The SOCOL version 3.0 chemistry–climate model: description, evaluation, and implications from an advanced transport algorithm, Geosci. Model Dev., 6, 1407–1427, https://doi.org/10.5194/gmd-6-1407-2013, 2013. a, b
Sukhodolov, T., Sheng, J.-X., Feinberg, A., Luo, B.-P., Peter, T., Revell, L., Stenke, A., Weisenstein, D. K., and Rozanov, E.: SOCOL-AERv1.0 model code, https://doi.org/10.5281/zenodo.1245196, 2018a. a
Sukhodolov, T., Sheng, J.-X., Feinberg, A., Luo, B.-P., Peter, T., Revell, L., Stenke, A., Weisenstein, D. K., and Rozanov, E.: Simulation results, https://doi.org/10.5281/zenodo.1245202, 2018b. a
Swingedouw, D., Mignot, J., Ortega, P., Khodri, M., Menegoz, M., Cassou, C., and Hanquiez, V.: Impact of explosive volcanic eruptions on the main climate variability modes, Global Planet. Change, 150, 24–45, https://doi.org/10.1016/j.gloplacha.2017.01.006, 2017. a, b
Telford, P., Braesicke, P., Morgenstern, O., and Pyle, J.: Reassessment of causes of ozone column variability following the eruption of Mount Pinatubo using a nudged CCM, Atmos. Chem. Phys., 9, 4251–4260, https://doi.org/10.5194/acp-9-4251-2009, 2009. a
Thomason, L. W., Ernest, N., Millán, L., Rieger, L., Bourassa, A., Vernier, J.-P., Manney, G., Luo, B., Arfeuille, F., and Peter, T.: A global space-based stratospheric aerosol climatology: 1979–2016, Earth Syst. Sci. Data, 10, 469–492, https://doi.org/10.5194/essd-10-469-2018, 2018. a
Thompson, D. W. J., Wallace, J. M., Jones, P. D., and Kennedy, J. J.: Identifying Signatures of Natural Climate Variability in Time Series of Global-Mean Surface Temperature: Methodology and Insights, J. Climate, 22, 6120, https://doi.org/10.1175/2009JCLI3089.1, 2009. a
Tie, X. and Brasseur, G.: The response of stratospheric ozone to volcanic eruptions: Sensitivity to atmospheric chlorine loading, Geophys. Res. Lett., 22, 3035–3038, https://doi.org/10.1029/95GL03057, 1995. a
Timmreck, C., Graf, H.-F., and Feichter, J.: Simulation of Mt. Pinatubo Volcanic Aerosol with the Hamburg Climate Model ECHAM4, Theor. Appl. Climatol., 62, 85–108, https://doi.org/10.1007/s007040050076, 1999a. a, b
Timmreck, C., Graf, H.-F., and Kirchner, I.: A one and half year interactive MA/ECHAM4 simulation of Mount Pinatubo Aerosol, J. Geophys. Res.-Atmos., 104, 9337–9359, https://doi.org/10.1029/1999JD900088, 1999b. a, b
Timmreck, C., Pohlmann, H., Illing, S., and Kadow, C.: The impact of stratospheric volcanic aerosol on decadal-scale climate predictions, Geophys. Res. Lett., 43, 834–842, https://doi.org/10.1002/2015GL067431, 2016. a
Timmreck, C., Mann, G. W., Aquila, V., Hommel, R., Lee, L. A., Schmidt, A., Brühl, C., Carn, S., Chin, M., Dhomse, S. S., Diehl, T., English, J. M., Mills, M. J., Neely, R., Sheng, J., Toohey, M., and Weisenstein, D.: The Interactive Stratospheric Aerosol Model Intercomparison Project (ISA-MIP): Motivation and experimental design, Geosci. Model Dev. Discuss., https://doi.org/10.5194/gmd-2017-308, in review, 2018. a
Toohey, M. and Sigl, M.: Volcanic stratospheric sulfur injections and aerosol optical depth from 500 BCE to 1900 CE, Earth Syst. Sci. Data, 9, 809–831, https://doi.org/10.5194/essd-9-809-2017, 2017. a, b
Toohey, M., Krüger, K., Bittner, M., Timmreck, C., and Schmidt, H.: The impact of volcanic aerosol on the Northern Hemisphere stratospheric polar vortex: mechanisms and sensitivity to forcing structure, Atmos. Chem. Phys., 14, 13063–13079, https://doi.org/10.5194/acp-14-13063-2014, 2014. a
Trepte, C. R. and Hitchman, M. H.: Tropical stratospheric circulation deduced from satellite aerosol data, Nature, 355, 626–628, https://doi.org/10.1038/355626a0, 1992. a
Trepte, C. R., Veiga, R. E., and McCormick, M. P.: The poleward dispersal of Mount Pinatubo volcanic aerosol, J. Geophys. Res.-Atmos., 98, 18563–18573, https://doi.org/10.1029/93JD01362, 1993. a
Walcek, C. J.: Minor flux adjustment near mixing ratio extremes for simplified yet highly accurate monotonic calculation of tracer advection, J. Geophys. Res.-Atmos., 105, 9335–9348, https://doi.org/10.1029/1999JD901142, 2000. a
Webster, C. R., May, R. D., Michelsen, H. A., Scott, D. C., Wilson, J. C., Jonsson, H. H., Brock, C. A., Dye, J. E., Baumgardner, D., Stimpfle, R. M., Koplow, J. P., Margitan, J. J., Proffitt, M. H., Jaeglé, L., Herman, R. L., Hu, H., Flesch, G. J., and Loewenstein, M.: Evolution of HCL concentrations in the lower stratosphere from 1991 to 1996 following the eruption of Mt. Pinatubo, Geophys. Res. Lett., 25, 995–998, https://doi.org/10.1029/98GL00548, 1998. a
Weisenstein, D. K., Yue, G. K., Ko, M. K. W., Sze, N.-D., Rodriguez, J. M., and Scott, C. J.: A two-dimensional model of sulfur species and aerosols, J. Geophys. Res., 102, 13019–13035, https://doi.org/10.1029/97JD00901, 1997. a
Weisenstein, D. K., Penner, J. E., Herzog, M., and Liu, X.: Global 2-D intercomparison of sectional and modal aerosol modules, Atmos. Chem. Phys., 7, 2339–2355, https://doi.org/10.5194/acp-7-2339-2007, 2007. a
Zanchettin, D., Khodri, M., Timmreck, C., Toohey, M., Schmidt, A., Gerber, E. P., Hegerl, G., Robock, A., Pausata, F. S. R., Ball, W. T., Bauer, S. E., Bekki, S., Dhomse, S. S., LeGrande, A. N., Mann, G. W., Marshall, L., Mills, M., Marchand, M., Niemeier, U., Poulain, V., Rozanov, E., Rubino, A., Stenke, A., Tsigaridis, K., and Tummon, F.: The Model Intercomparison Project on the climatic response to Volcanic forcing (VolMIP): experimental design and forcing input data for CMIP6, Geosci. Model Dev., 9, 2701–2719, https://doi.org/10.5194/gmd-9-2701-2016, 2016. a, b
Zhao, T. X.-P., Chan, P. K., and Heidinger, A. K.: A global survey of the effect of cloud contamination on the aerosol optical thickness and its long-term trend derived from operational AVHRR satellite observations, J. Geophys. Res.-Atmos., 118, 2849–2857, https://doi.org/10.1002/jgrd.50278, 2013. a