the Creative Commons Attribution 4.0 License.
the Creative Commons Attribution 4.0 License.
The implementation of NEMS GFS Aerosol Component (NGAC) Version 2.0 for global multispecies forecasting at NOAA/NCEP – Part 2: Evaluation of aerosol optical thickness
Partha Sarathi Bhattacharjee
Jun Wang
Cheng-Hsuan Lu
Vijay Tallapragada
An accurate representation of aerosols in global numerical weather prediction (NWP) models is important to predict major air pollution events and to also understand aerosol effects on short-term weather forecasts. Recently the global aerosol forecast model at NOAA, the NOAA Environmental Modeling System (NEMS) GFS Aerosol Component (NGAC), was upgraded from its dust-only version 1 to include five species of aerosols (black carbon, organic carbon, sulfate, sea salt and dust). This latest upgrade, now called NGACv2, is an in-line aerosol forecast system providing three-dimensional aerosol mixing ratios along with aerosol optical properties, including aerosol optical thickness (AOT), every 3 h up to 5 days at global resolution. In this paper, we evaluated nearly 1.5 years of model AOT at 550 nm with available satellite retrievals, multi-model ensembles and surface observations over different aerosol regimes. Evaluation results show that NGACv2 has high correlations and low root mean square errors associated with African dust and also accurately represented the seasonal shift in aerosol plumes from Africa. Also, the model represented southern African and Canadian forest fires, dust from Asia, and AOT within the US with some degree of success. We have identified model underestimation for some of the aerosol regimes (particularly over Asia) and will investigate this further to improve the model forecast. The addition of a data assimilation capability to NGAC in the near future is expected to provide a positive impact in aerosol forecast by the model.
- Article
(6776 KB) - Full-text XML
- Companion paper
- BibTeX
- EndNote
In the past 2 decades, aerosol distributions, their properties and their impact have been studied using a combination of complex numerical models and space- and ground-based monitoring programs. Aerosols play a crucial role in climate and the hydrologic cycle by altering the radiation balance and clouds. Also, large concentrations of aerosol particles near the surface influence ambient air quality and human health (Menon et al., 2002). Natural and anthropogenic aerosols are thought to play an important role in global climate model projections of future climate; however, their roles are so complex that uncertainty in radiative forcing of climate change is mainly dominated by the uncertainty associated with aerosol forcing (Forster et al., 2007). This complexity is due to aerosols' role in altering the planetary energy balance through a number of mechanisms: direct effects (Haywood and Boucher, 2000), semi-direct effects (Hansen et al., 1997) and indirect effects (Lohmann and Feichter, 2005). The lack of detailed knowledge of the emissions and optical and chemical properties of aerosols results in a knowledge gap that prevents a full understanding of aerosol impact on climate simulations (Ghan et al., 2012).
In contrast to climate models, global numerical weather prediction (NWP) centers have used monthly climatologies of aerosol distributions to account for aerosol effects in the past. This is largely due to the additional complexity and computational resources required to include fully prognostic aerosol schemes in high-resolution operational global forecasting systems but is also due to a limited understanding of aerosol feedbacks in short-range (1–5-day) forecasts. However, the advancement in computing power, improved aerosol models and enhanced aerosol observations now allow a more systematic documentation of the impact of aerosols (and uncertainties therein) on weather forecasts (Tanaka et al., 2003; Morcrette et al., 2009; Westphal et al., 2009). Some of the NWP centers have embarked on aerosol data assimilation efforts using both passive and active sensors (Sekiyama et al., 2010; Zhang el al., 2008; Benedetti et al., 2009). Several studies have shown improvement in NWP forecasts by the inclusion of aerosols (Haywood et al., 2005; Mulcahy et al., 2014). Short-range forecasts of aerosols by NWP centers are particularly beneficial for air quality forecasts and other societal needs in the event of large dust events (like transatlantic dust plumes from Sahara) or biomass burning episodes (e.g., southern Africa, North and South America, and Southeast Asia).
Verification of aerosol forecasts against available observations is important to correct systematic model biases and to understand the model's variability characteristics. Previous studies have been done evaluating the performance of the European Centre for Medium Range Forecast (ECMWF) aerosol model by comparing model data to satellite and ground observations (Morcrette et al., 2009; Mangold et al., 2011; Cesnulyte et al., 2014). These studies focused on the comparison of monthly mean and daily aerosol quantities in both visible and UV wavelengths as well as looking into different case studies (e.g., Saharan dust event, high sea-salt aerosol load). Eskes et al. (2015) provided a general overview of the validation approach for the European operational CAMS (Copernicus Atmospheric Monitoring Service) global forecast system which uses data assimilation to combine in situ and remote-sensing observations for atmospheric aerosols. Campbell et al. (2012) evaluated NASA Cloud Aerosol Lidar with Orthogonal Polarization (CALIOP) aerosol optical thickness (AOT) against the Navy Aerosol Analysis and Prediction System (NAAPS) to qualitatively assess day/night retrieval skill of the satellite and its accuracy. NAAPS also developed an AOT reanalysis product using the assimilation of quality-controlled retrievals from the satellite and found that the reanalysis follows the seasonal and interannual variability for the total AOT quite well (Lynch et al., 2016).
At NOAA, a prognostic aerosol capability was developed at the Environmental Modeling Centre (EMC) of the National Centers of Environmental Prediction (NCEP) in 2012. NASA's bulk aerosol scheme (an in-line version of the Goddard Chemistry, Aerosol, Radiation and Transport model (GOCART); Chin et al., 2002; Colarco et al., 2010) was incorporated into the NOAA Environmental Modeling System (NEMS) to establish an interactive global aerosol forecasting system: NEMS GFS Aerosol Component version 1.0 (hereafter NGACv1) (Lu et al., 2016). The model became operational in 2012, providing 120 h global dust forecasts, once per day. It was incorporated as one of the seven global models in the world's first global multi-model aerosol ensemble product – the International Cooperative for Aerosol Prediction Multi-Model ensemble (ICAP-MME; Sessions et al., 2015) – to forecast dust on a real-time basis. NGACv1 was also incorporated into the World Meteorological Organization (WMO) Sand and Dust Storm Warning Advisory and Assessment System (SDS-WAS) northern Africa–Middle-East–Europe (NA-ME-E) node to provide timely and quality sand and dust storm forecasts.
NGACv1 was recently upgraded to include four more aerosol species (sea salt, sulfate, black carbon and organic carbon) from its previous version of dust-only forecasts. This upgrade of the model (hereafter NGACv2) also uses near-real-time satellite-based smoke emissions and was declared operational in March 2017. The focus of this paper is the evaluation of the NGACv2 AOT product at 550 nm. The paper is organized as follows: Sect. 2 presents general information about the NGAC model and a summary of the products. Satellite and ground data sets used in this evaluation are described in Sect. 3. Section 4 shows comparisons of NGACv2 with ICAP-MME and satellite retrievals. The evaluation of NGACv2 aerosol products with in situ measurements is presented in Sect. 5. Section 6 describes two events (one is Central African smoke and the other is transatlantic dust) where NGAC forecasts are compared to observations. Section 7 finishes with a discussion and concluding remarks. Detailed descriptions of NGACv2 and its outputs and its operational implementation are described in Part 1 of this paper (Wang et al., 2018).
NGACv2 is a global in-line aerosol forecast system. The forecast model component of NGAC is NOAA's operational Global Forecast System (GFS) based on NEMS, which, in turn, is based on the common modeling framework using the Earth System Modeling Framework (ESMF). GFS is a spectral model, comprised of model dynamics and physics in a hydrostatic system with a reduced Gaussian grid and hybrid (sigma and pressure) vertical levels. The aerosol component of NGACv2 is GOCART, which was developed at NASA Earth Science Programs to simulate atmospheric aerosols (including sulfate, black carbon (BC), organic carbon (OC), dust and sea salt) and sulfur gases (SO2) (Chin et al., 2002, 2007; Ginoux et al., 2001; Colarco et al., 2010). Dust and sea-salt emissions are dependent on wind speed, whereas BC and OC are produced from biomass burning and biofuel consumption. Sulfate is produced from the oxidation of SO2 and dimethylsulfide (DMS). Daily biomass burning emissions are provided by the Global Biomass Burning Emission Product extended (GBBEPx), which was developed at NOAA's National Environmental Satellite, Data and Information Services (NESDIS) Center for Satellite Application and Research (STAR). GBBEPx contains daily global biomass burning emissions (BC, OC, SO2, etc.), blended fire observations from NESDIS/STAR's Global Burning Emission Product from a constellation of Geosationary satellites (GBBEP; Zhang et al., 2012) and NGAC/GMAO's Quick Fire Emissions Data version 2 from a polar orbiting sensor (QFED2; Darmenov and Dal Silva, 2015). NGACv2 is a joint collaboration between NOAA and NASA and represents an efficient way of transitioning research into NCEP operations. More details about model configuration, emission data sets, budget, post-processing and NEMS GFS coupling with GOCART are discussed in Wang et al. (2018).
NGACv2 currently runs at T126L64 (∼ 110 km) which is a lower horizontal resolution than the current operational GFS (T1534L64, ∼ 13 km as of March 2017). Aerosol initial conditions are taken from the 24 h NGAC forecasts from the previous day while meteorological initial conditions are downscaled from the high-resolution Global Data Assimilation System (GDAS) analysis. NGACv2 runs twice a day at 00:00 Z and 12:00 Z and produces output on a longitude/latitude grid at 3-hourly forecast intervals from 00 to 120 hours. Output files contain both two-dimensional and three-dimensional fields of various aerosol and meteorological variables. Total AOT is calculated based on all five species of aerosol at 340, 440, 550, 660, 860, 1110 and 1630 nm wavelengths. AOT from each species at 550 nm is also available, as well as mixing ratios (in three dimensions), sedimentation flux, dry and wet deposition flux, and scavenging flux. A full list of NGACv2 output is available in Wang et al. (2018).
Here we describe both NGACv2 and other observational AOT datasets used in this study. As AOT (column-integrated extinction coefficient) at 550 nm is a common reference for much of the previous work that involves satellite aerosol retrievals, we have considered this one quantity for all the evaluations. Daily NGACv2 forecast data from June 2015 to October 2016 (17 months in total) are used to evaluate spatial and temporal variation for global and regional scales. NGACv2 550 nm AOT (total and individual species) data are two-dimensional ( grid) and in GRIB2 format.
MODIS provides near-global coverage of aerosol measurements in space and time. We used a MODIS Level-3 (daily and monthly at ) AOT dataset in this study (https://ladsweb.nascom.nasa.gov/, last access: March 2018). The dataset belongs to the Collection 6 combined land and ocean from the Aqua satellite (Levy et al., 2013). This latest collection of MODIS data includes AOT data based on refined retrieval algorithms, in particular the expanded Deep Blue algorithm (Hsu et al., 2013; Sayer et al., 2013). It introduces a merged AOD product, combining retrievals from the Dark Target (DT) and Deep Blue (DB) algorithms to produce a consistent data set covering a multitude of surface types ranging from oceans to bright deserts (Sayer et al., 2014). We have used 550 nm MODIS AOT variables “dark target” and “deep blue” (for brighter surfaces) for all the statistical comparisons in this paper. We also used the new aerosol product Dark_Target_Deep_Blue_Combined_Mean to qualitatively compare model results.
The Visible Infrared Imaging Radiometer Suite (VIIRS) sensor onboard the Suomi National Polar Orbiting (S-NPP) satellite provides sets of aerosol environmental data records (EDRs) based on daily global observations from space (Jackson et al., 2013; Liu et al., 2013). Beginning in 2012, VIIRS provides AOT at 550 nm at a global horizontal resolution. Daily gridded VIIRS data used in this paper are from the NOAA STAR ftp site at ftp://ftp.star.nesdis.noaa.gov/pub/smcd/jhuang/npp.viirs.aerosol.data/edraot550 (last access: March 2018). We have also used Enterprise Processing System (EPS) VIIRS data ( resolution), which use a newer aerosol algorithm to retrieve AOT for dust in Africa (Ciren et al., 2012; Laszlo and Liu, 2016) and became operational in July 2017.
ICAP-MME provides 6-hourly forecasts of total and dust AOD globally out to 120 h at resolution (Reid et al., 2011; Sessions et al., 2015). Total AOD in ICAP-MME is provided by the four core multispecies models: the European Centre Medium Range Weather Forecasts Copernicus Atmosphere Monitoring Service (ECMWF-CAMS), the Japan Meteorological Agency Model of Aerosol species in the Global Atmosphere (JMA-MASINGAR), the NASA Goddard Earth Observing System Version5 (NASA-GEOS5) and the Naval Research Lab Navy Aerosol Analysis and Prediction System (NRL-NAAPS) modeling systems. Dust-only AOD are provided by the aforementioned four models, plus the Barcelona Supercomputer Center Chemical Transport Model (NMMB/BSC-CTM), the United Kingdom Met Office Unified Model (UKMO-UM) and NGACv1. All four of the multispecies models invoke aerosol data assimilation (DA) and satellite-based smoke emissions. In this study, we have used coincident 6-hourly ICAP-MME forecasts of each day to compare them to NGACv2 results. Multi-model ensembles, which use independent and skilled forecasts, are an ever increasing tool for forecasters as they are more accurate than the individual member deterministic models (Meehl et al., 2007; Fordham et al., 2012). As NGACv2, ICAP-MME and MODIS products all have a 1∘ horizontal resolution.
We have used the second Modern-Era Retrospective analysis for Research and Application (MERRA-2) (Gelaro et al., 2017) AOT forecast and analysis for a case study of an Asian fire event. MERR2 provides various AOT forecasts at horizontal resolution and at 72 vertical levels.
The Aerosol Robotic Network (AERONET) is a global ground-based network of automated sun-photometer measurements that provide AOT, surface solar flux and other radiometric products (Holben et al., 1998). It is a well-established network of over 700 global stations and its data are widely used for aerosol-related studies (Zhao et al., 2002). AERONET employs the CIMEL sun–sky spectral radiometer which measures direct sun radiances at eight spectral channels centered at 340, 380, 440, 500, 675, 870, 940 and 1020 nm. AOT uncertainties in the direct sun measurements are within ±0.01 for longer wavelengths (longer than 440 nm) and ±0.02 for shorter wavelengths (Eck et al., 1999). NGACv2 outputs AOT at 550 nm and several AERONET sites do not report at 500 or 550 nm wavelengths. To compare with NGACv2 550 nm AOT data, AERONET AOT at 440 and 675 nm were linearly interpolated on a log–log scale to provide 550 nm AOT. All AERONET data are sampled temporally at ±1 h of daily 3-hourly NGACv2 forecasts (for example, at any particular location AERONET measurements between 11:00 Z and 13:00 Z are averaged to compare them to the 12:00 Z model forecast). A 2 h time window is created to allow for more sampling of AERONET measurements over any location. Also, we discarded very high AERONET AOT values (over 2.5) from all stations when statistical analysis was performed. Some of the station data report AOT of 5 and above in extreme high-aerosol events (smoke and pollution transport) which may not be simulated by the model due to coarse resolution. We estimated that approximately 3 % of the data are discarded due to this threshold. We have given more weight to the number of sample points and AERONET location (Table 2) for qualitatively describing correlation coefficients at each location as “low”, “moderate” and “high” in this study. Model AOT at a site was extracted and compared only when AERONET had measurements in that time window. In this study we have used all available level 1.5 (cloud-screened) daily AOT data sets for the same time period (Smirnov et al., 2000).
Quantitative analysis in this study is performed by calculating the following parameters: the average, standard deviation, correlation coefficient (R) and root mean square error (RMSE) of unitless 550 nm AOT.
We compared seasonal variations (all four seasons: JJA, SON, DJF and MAM) of model forecast AOT with MODIS data for 2015–2016. We analyzed model results for both 2015 and 2016, and Fig. 1 shows results from 2015. Figure 1 shows global maps of AOT (total and dust from NGACv2) against ICAP-MME and MODIS (total AOT) for 2015 JJA (average of June–July–August). Higher burdens of AOT are found during the Northern Hemisphere summer, as wind-blown dust over northern Africa and the Persian Gulf and smoke over southern Africa and North America contributes the majority of high AOT shown in Fig. 1. NGACv2 seasonal variation is in qualitative agreement with both MODIS and ICAP-MME for many of the locations that represent major aerosol regimes, although there are a few noticeable differences. Major dust events over Africa, the Middle East and northwestern China are very similar in dust-only AODs between NGACv2 and ICAP-MME (Fig. 1b, d). Dust-transported plumes from northern Africa to the Atlantic Ocean are the most visible feature for both the models and satellite products (Fig. 1a, c and e). Smoke events located on the western coast of southern Africa and Canada are from NGACv2 OC AOT (not shown). Persistent sea-salt aerosol bands at 60∘ S are evident from model total AOT (Fig. 1a, c). Some of the differences in total AOT (for example, lower AOT over India and China) are the results of known issues associated with NGACv2 which will be discussed later on. Since daily gridded MODIS data are used, which are not sampled at model forecast hours, some of the differences between NGACv2 and MODIS can be attributed to data sampling.
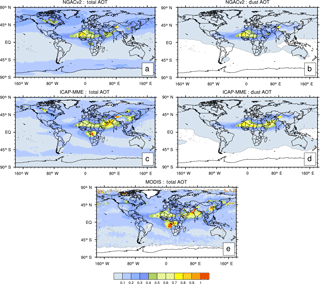
Figure 1Global maps of averaged AOT 550 nm for JJA (June–July–August) 2015. Total AOT from NGACv2, ICAP and MODIS are in (a, c, e); NGACv2 dust-only is in (b), and ICAP dust-only is in (d). NGAC, ICAP and MODIS AOT 550 nm are at 1∘ resolution. Values beyond the range of the color bar are represented by the end colors.
Figure 1 showed that Saharan dust dominates most of the observed high AOT in the atmosphere over the Atlantic Ocean in the summer months. We also analyzed monthly variations of meridional distributions of AOT over the Atlantic Ocean. Figure 2 shows NGACv2 total, dust and OC AOT between 40∘ S to 60∘ N in three different months: December 2015 and April and July 2016. In the Hovmöller diagrams (Fig. 2), 6-hourly model forecasts are averaged between 60∘ W and 30∘ E (including land regions over Africa and Europe) to get daily AOT values from the model for each month. We also plotted latitudinal variation in AOT from our model at a 23∘ W longitude transect (located over the Atlantic Ocean where the majority of the aerosol plumes pass) for the same months and aerosol species (line plots in Fig. 2). We added MODIS total AOT at 23∘ W to validate our model results. Latitudinal changes in the aerosol plume off the coast of western African coast are shown by NGACv2 for the selected months. In the winter (Fig. 2a–c) maximum values of AOT are located around 10∘ N, but in July the max moves further north to around 18–20∘ N (Fig. 2g–i). Biomass burning in northern Africa is most active in the winter season, as OC AOT shows high values between 0 and 5∘ N (Fig. 2c). So, high values of total AOT in Fig. 2a are contributed to by dust and OC aerosols and also by sea-salt aerosols in higher latitudes between 50 and 60∘ N (not shown). In contrast, in July the total AOT peak shifts to 20∘ N (Fig. 2g) and dust is the dominant aerosol contributing to total AOT (Fig. 2h). In the summer season dust originates from the western Sahara, under the conditions of a thermal low that prevails over that region (due to intense solar heating). In July 2016 biomass burning contributed much of OC aerosols across the Atlantic south of the equator (Fig. 2i). Also, OC and sulfate (not shown) from Europe contributes to total AOT in July (Fig. 1g). Compared to strong latitudinal variations in December and July, all the AOT peaks are less intense in April (Fig. 2d–f), with the majority contribution from dust aerosols. Model results agree with latitudinal variation at the 23∘ W location, where total AOT peaks match between NGACv2 and MODIS across all 3 months (Fig. 2a, d and g). Seasonal shifts in transatlantic aerosol plumes are of the kind that have been observed through satellites and reported in numerous studies (Takemura et al., 2000; Kaufman et al., 2005; Ben-Ami et al., 2009).
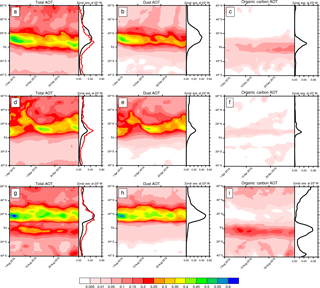
Figure 2Latitude–time Hovmöller plot of NGACv2 total, dust and OC AOT (all at 550 nm) over the Atlantic Ocean, zonally averaged (between 60∘ W and 30∘ E). Top row (a, b, c) is for December 2015, middle row (d, e, f) for April 2016 and bottom row (g, h, i) for July 2016. Line plots show zonal average of total, dust and OC AOT at 23∘ W (over Atlantic Ocean). NGACv2 and MODIS total AOT are represented by black and red lines, respectively, in the line plots.
For quantitative comparisons we selected key aerosol regions over the land and ocean and extracted the model results and satellite data over those regions (Fig. 3). We have used 6-hourly model forecasts and averaged them to calculate the daily mean AOT values over these regions. The three ocean regions include the North and South Atlantic oceans and North Indian Ocean, which are major long-range aerosol transport pathways for dust, smoke and sulfate. Figure 3 shows nine land regions including two dust source regions (North Africa and the Middle East), two biomass burning regions (South America and southern Africa), three regions over North America (eastern and western US and Canada) and two major pollution source regions (India and East Asia). Previous studies have shown that aerosols over India and East Asia are composed of different aerosol types and the relative contribution of individual species varies with season (Kedia et al., 2014; Bhawar et al., 2016). Table 1 summarizes the latitude–longitude bounds of all the 12 regions, along with correlation coefficients and RMSEs for NGACv2 and MODIS for different seasons between 2015 and 2016. Figure 4 shows one such daily time series for 2015-JJA in the selected six regions where we have included ICAP-MME results as well. The time series of individual regions provides a general characterization of the overall difference between model and satellite products. Figure 4a and c show that NGACv2 agrees very well with both ICAP-MME and MODIS over one strong biomass burning event in North America during late June–early July 2015. However, the NGACv2-simulated peak is broad compared to another two, indicating that the model is less sensitive to capturing some of the AOT variations over Canada (Fig. 4c). For African dust, NGACv2 correlates well when the dust plume is present over land (Fig. 4e) but underestimates it over the ocean (Fig. 4d).
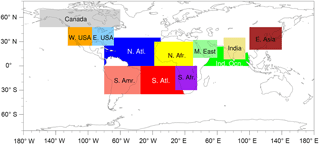
Figure 3Map of 12 global zones selected for aerosol analysis between NGACv2, MODIS and ICAP. Details about each zone are described in Table 1.
Table 1Correlation coefficients and RMSE (in italics) of total AOT at 550 nm in different seasons between NGACv2 and MODIS over selected regions of the globe. Daily AOT from model and satellite data are considered for these calculations.
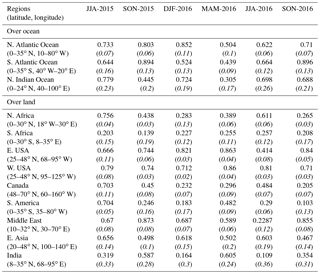
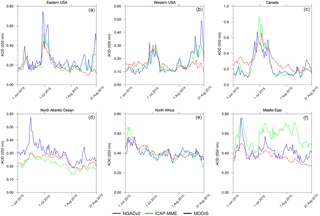
Figure 4Regional time series comparison of daily modeled and satellite-retrieved AOT between 1 June and 31 August 2015 over selected regions (a–f). See Table 1 for description of the regions. Points over the ocean are masked for calculating AOT over land-only regions and vice versa.
Over the oceans, the model shows consistently high correlations with MODIS across different seasons (Table 1). Both the North and South Atlantic oceans are dominated by transatlantic passages of dust, smoke (both BC and OC) and aerosol plumes as well as the presence of sea salts. On the other hand, dust from the Arabian Peninsula travels across the northern Indian Ocean between May to August to reach the Indian subcontinent (Shalaby et al., 2015). In the winter, pollution outflow from the Indian subcontinent creates a haze plume over the ocean (Ramanathan et al., 2001). NGACv2 shows a low RMSE error (and high correlations) in both the North and South Atlantic Ocean. However, higher RMSE is given over the Indian Ocean during both summer seasons, and this is related to an underestimation of dust transport from the Middle East.
Table 2Locations of AERONET stations, correlations, RMSE and number of paired observations with NGACv2.
Over land, the performance of NGACv2 is mixed across different regions, as shown in Table 1. Over the continental US (both eastern and western US), the model shows both high correlations (more than 0.5 in all seasons, except the summer of 2016) and low RMSE (less than 0.12) compared to satellite products in all six seasons of the current analysis. We noticed a drop in the correlation coefficient in summer 2016 (0.41) from the previous summer (0.66) in the eastern US (RMSE remains low in both summers), and this may be partly due to the absence of a very high-aerosol event (Canadian smoke event) like the one that occurred in 2015 (Fig. 4a, b). In summer 2016, the highest total AOT averaged over the eastern US from MODIS is 0.35, compared to 0.78 in 2015. The modeled and MODIS AOTs in the Saharan dust source region (N. Africa) show a correlation over 0.6 (with low RMSE) during the major dust outbreak seasons in summer. Over the biomass burning regions (in South America), the model shows low correlation (and high RMSE) during September–November, when most of the Amazon forest fires take place. But in the non-burning season both the correlations and RMSE improve. The magnitude of the maximum AOT over South America is largely underestimated by the model by a factor of 3, indicating that the biomass burning emission in the model is probably too low during the burning season.
We used Taylor diagrams to summarize model performance in different seasons over the same regions described in Table 1 (Fig. 5). Taylor diagrams (Taylor, 2001) provide a statistical summary of comparisons between NGACv2 and MODIS observations in terms of their spatial correlation coefficients and the ratio of spatial standard deviations of the model and observations over all 12 regions. The spatial correlation coefficient is the quantity that measures the degree of agreement of two fields, and standard deviations are normalized by the corresponding observations. In general, a model's performance is better in summer months (JJA; Fig. 5a) than other seasons in terms of low variance and high correlations over most of the regions. However, in future we need a more detailed study to understand some of the interannual variations shown by the model, particularly over land regions (Fig. 5).
One major difference between the model and the satellite data is over India, where the model has a much lower AOT in all seasons (low R and high RMSEs). The largest contribution from aerosol loading over India comes from the anthropogenic component (with the majority as sulfate, followed by OC and BC) and by dust blown from the Middle East and western India during May–July. This bias in AOT by NGACv2 may be due to high aerosol scavenging by clouds and precipitation and their subsequent removal of them from the atmosphere. Also, dust blown from Middle East is underestimated by NGACv2 (Fig. 4f), contributing to lower AOT in the pre-monsoon season over India. Yoo et al. (2013) evaluated GFS forecasts against satellite observations and identified large discrepancies in low cloud fractions over land and oceans. There could be several factors responsible for such discrepancies, such as (a) the removal of cloud condensate water by strong vertical diffusion in the shallow convective scheme; (b) microphysical processes interacting with stratocumulus clouds removing cloud condensate water; (c) the precipitation scheme used in the model leading to large aerosol removal through wet deposition. All this could cause the low bias in AOT over India (and East Asia) as sulfate aerosols (and also 20 % BC and 50 % OC in GOCART are hydrophilic) are formed in the clouds and hygroscopic growth is most effective in high-humidity regions near clouds.
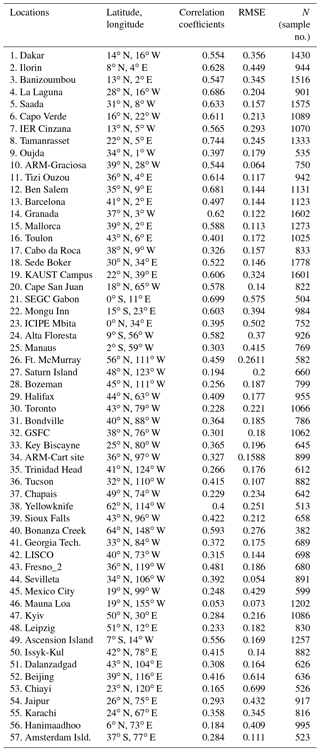
Figure 6 shows correlation coefficients (R) of the NGACv2 AOT compared to AERONET-derived AOT during the entire 17 months of the study period. Table 2 summarizes the latitude and longitude of the AERONET sites along with R, RMSE and the number of paired observation points of the 57 stations used in this study. Figure 7 shows a scatterplot of 550 nm total AOT between NGACv2 and AERONET at 12 stations. Figure 8 shows an entire 17-month time series of AOT at the same 12 stations as shown in Fig. 7 between NGACv2 and AERONET. The first seven sites in Fig. 6 are located on the west coast of northern Africa and are dominated by dust aerosols. The model closely reproduces the observed variation (with R between 0.5 and 0.6 and low RMSE). Site 8 (Tamanrasset), located at the center of the Sahara, shows very high R (0.74) because of its location in the active dust source area (maxima of the dust source function in the model) (Figs. 7a and 8a). However, the model overestimates AOT during the low-dust AOT period (November to March) over this site, which leads to higher RMSE.
Sites 9–12 (Fig. 6 and Table 2) are located at the northern boundary of Africa and are influenced by dust from the Sahara: Oujda in Morocco, Graciosa Island in the Azores (in the Atlantic Ocean), Tizi Ouzou in Algeria and Ben Salem in Tunisia (Figs. 7e and 8e). These sites are located further from the Sahara (compared to the first six sites), but the transport of dust simulated by the model matches closely with observations (with R ∼ 0.5). Aerosols at sites 13–17 in Fig. 6 contain dust aerosols from Africa and other aerosol types from the European landmass. All these sites are located in southern Europe (near the western part of Mediterranean Sea) and are influenced by desert dust transported from arid areas in North Africa and the advection of anthropogenic particles from the central European industrial area (Mallet et al., 2013). Table 2 and Figs. 7 and 8f suggest model AOT correlations vary between 0.32 and 0.62 at these sites, with associated low RMSE.
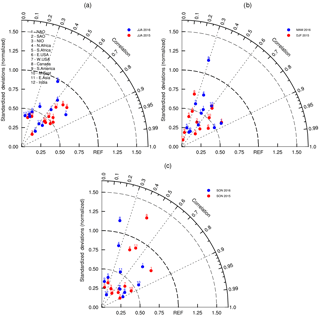
Figure 5Taylor diagrams for (a) JJA, (b) MAM and DJF, and (c) SON between NGACv2 and MODIS over 12 regions described in Table 1. On the Taylor diagrams, angular axes show spatial correlations between modeled and observed fields; radial axes show spatial standard deviation normalized against that of the observations. Each dot represents a region in Table 1 identified by its number on top. NAO: North Atlantic Ocean; SAO: South Atlantic Ocean; NIO: North Indian Ocean in the figure.
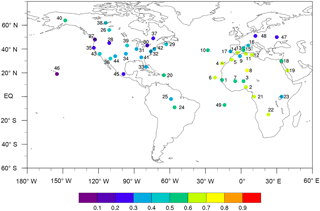
Figure 6Correlation map of total AOT at 550 nm between NGACv2 and AERONET sites. Approximate location of AERONET centers in the map represented as filled circles. Name and location of these sites are listed in Table 2.
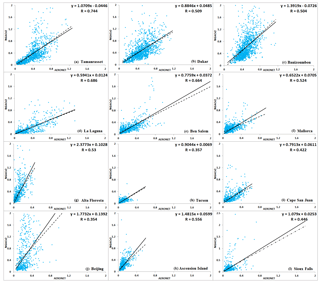
Figure 7Correlation plots of 550 nm AOT between NGACv2 and 12 AERONET locations. Black continuous lines in the panels represent the 1 : 1 line, while dotted black lines represent linear regression fits to data points. Actual locations of AERONET centers are listed in Table 2.
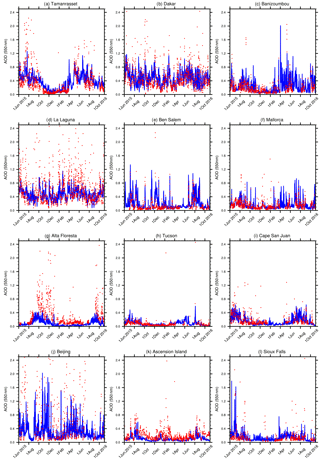
Figure 8Time series plots of 550 nm AOT between NGACv2 and 12 AERONET locations described in Fig. 7. The blue continuous line in the panels represents NGACv2, while red points represent AERONET observations. Actual locations of AERONET centers are listed in Table 2.
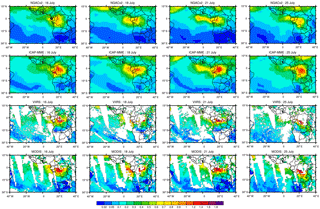
Figure 9Comparison of total AOD between forecasts of NGACv2 and ICAP-MME to observations of VIIRS and MODIS for selected days in July 2016. For both models, daily 6-hourly forecasts are averaged to compare them to daily satellite observations for each day. Apart from VIIRS, which is at 0.25∘ resolution, all others are at 1∘. Satellite observations have data gaps, which are in white (third and fourth rows). The black dot in the first panel represents the approximate location of AERONET station Gabon.
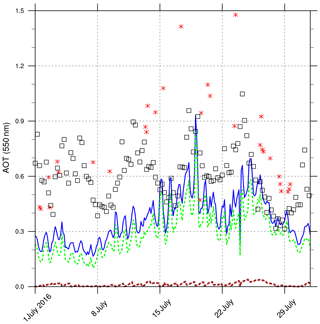
Figure 10Comparison of 550 nm AOD between NGACv2, ICAP-MME and AERONET location at Gabon for the month of July 2016. Blue line represents total AOD, green line is OC, and brown line represents BC AOD, all from NGACv2. Red asterisk symbol is for AERONET observations at that location, and black squares are ICAP-MME 6-hourly forecast. AERONET station location is marked in Fig. 9.
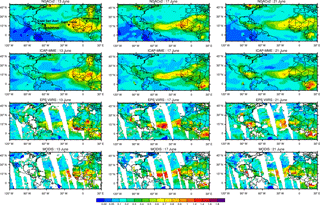
Figure 11Comparison of total AOD between forecasts of NGACv2 and ICAP-MME to observations of EPS-VIIRS and MODIS for selected days in June 2015. Satellite observations have data gaps, which are in white (third and fourth rows). All data in this figure are at 1∘ resolution. Black dots in the first panel represent approximate locations of AERONET stations.
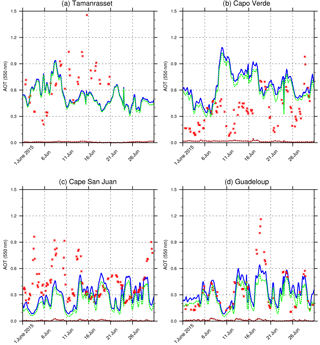
Figure 12Comparison of 550 nm AOT between NGACv2 and four AERONET locations for the month of June 2015. The blue line represents total AOT, the green line is for dust and the brown line is for OC AOT, all from NGACv2. The red asterisk is for AERONET observations at that location. AERONET station locations are marked in Fig. 11a.
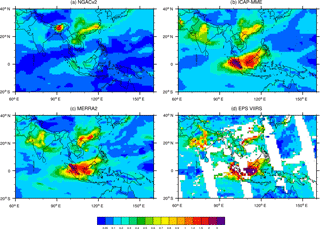
Figure 13Total AOT at 550 nm on 13 September 2015 from NGACv2, ICAP-MME, MERRA-2 and EPS-VIIRS. Satellite observation has data gaps, which are white in panel (d). MERRA-2 data resolution is at . The rest of them are at a 1∘ resolution.
Sites 18 and 19 are located in the Middle East and consist mainly of mineral dust. NGACv2 correlates better with the King Abdullah University of Science and Technology (KAUST) campus site (located in Saudi Arabia) with a correlation above 0.6, but the correlation decreases to 0.52 at Sede Boker, which is located further north on the Arabian Peninsula. Despite a high correlation at the KAUST campus site, the model often underestimates some of the higher AOT events at this location which gave rise to a higher RMSE (∼ 0.32). Sites 21–23, located in equatorial and southern Africa, are influenced mainly by biomass burning. Biomass burning activity peaks during August–September at these sites and the magnitude of the maximum AOT at the three southern African sites is underestimated by the model by a factor of almost 2 to 3 (high RMSE in Table 2), suggesting that the biomass burning emission in the model is probably low during the burning season. A similar underestimation of AOT is also observed over two of the South American sites (24 and 25 in Fig. 6). Model-simulated AOT correlates well (0.58) at site 24, which is largely due to the model estimating low AOT at these sites during the non-biomass burning seasons (Figs. 7 and 8g). But the model underestimates AOT (∼ 3 times) between September and November when the biomass burning season prevails in Brazil.
Site 20 and sites 26 to 44 in Fig. 6 are located in and around North America (US and Canada) and are generally considered to be dominated by pollution aerosols: smoke, sulfate and dust in the southeastern and southwestern US. Three sites (26, 38 and 40 in Table 2), which are in Canada and located above 55∘ N, are influenced by biomass burning aerosols and trans-Pacific transport of pollutants (mainly dust). All three sites show a higher correlation with the model (R above 0.4), and the model closely reproduces the higher AOT over Fort McMurray and Yellowknife during major fire events that included May 2016 around Fort McMurray. The rest of the locations over the continental US (hereafter CONUS) show mixed results in terms of R and RMSE (Table 2). Southwestern sites (sites 36, 43 and 44) influenced by dust in the spring and sulfate in summer show R of around 0.4 (Figs. 7 and 8h). Sites in the northern and northeastern parts of CONUS are dominated by anthropogenic pollution (sulfate) and occasional smoke from Canada in winter and spring. NGACv2 correlates reasonably well with (R∼ 0.35) model underestimation of sulfate aerosols in summer. Also, the model does not have nitrate aerosols from anthropogenic sources, which leads to an underestimation of AOT. Kroll and Seinfeld (2008) have shown that anthropogenically emitted nitrogen oxides (NOx) can directly affect the formation of secondary organic aerosols (SOAs).
The remaining 13 sites (sites 45–57 in Fig. 6 and Table 2) are located all over the globe, reflecting a variety of aerosol regimes. For example, at the oceanic site in Hawaii (site 46 in Fig. 6), modeled AOT values are higher than AERONET between May to October. This bias could be due to overestimation of trans-Pacific dust transport from Asia and sea-salt aerosols. A similar overestimation of Asian dust is also observed at Dalanzadgad (site 51) which is located in the arid Gobi desert region in Mongolia. Over urban areas (sites 45, 47, 48) model correlations with AERONET are moderate (R∼ 0.3) with an underestimation of AOT in summer over Mexico City (site 45) and Kyiv (site 47). Ascension Island (site 49) is located in the remote southern Atlantic Ocean and is affected by biomass burning outflow from southern Africa (Figs. 7 and 8k). The model is able to reproduce high biomass burning events over this location as shown by a high correlation (R=0.55) and low RMSE (Table 2). Sea-salt aerosol is dominant over remote Amsterdam Island in the southern Indian Ocean and model correlation is low (R=0.28) at a 95 % confidence intervals but associated with low RMSE. NGACv2 shows R∼ 0.32 with AERONET measurements in three larger metropolitan cities (sites 52, 54 and 55 in Table 2), with an underestimation of sulfate and anthropogenic aerosols during the summer months at all three Asian locations (Figs. 7 and 8i).
6.1 July 2016 smoke event
Forest fires are a significant source of carbonaceous aerosols at northern latitudes in spring and summer (Generoso et al., 2003) and are associated with increased mortality and morbidity (Rappold et al., 2011). A major fire breakout was reported in central Africa during July and August 2016. The majority of the fires burned cropland or grass, which is a common agricultural practice in this region. We compared model forecasts and observations on selected days in July over this region to assess model performance during this event. Figure 9 shows a comparison of the total AOT between NGACv2, ICAP-MME, VIIRS and MODIS for days when smoke emission is prominent. We have averaged coincident 6-hourly model forecasts (for both NGACv2 and ICAP-MME) to compute daily averages to compare them to daily satellite observations. Ten-meter zonal wind from NGACv2 (not shown) indicates that an easterly wind gradually pushed smoke from Central Africa towards the west and northwest in the month of July. Figure 9 shows that NGACv2 captured this smoke event quite well and qualitatively matches (in terms of location and advection) both ICAP-MME and satellite observations. The magnitude of AOT, however, is underestimated by the model compared to ground station and satellite observations (Figs. 9, 10). Smoke AOT has been added as a new capability in NGACv2 and uses different emissions than the models that are under the ICAP assembly, which independently verifies model performance.
We also looked into model AOT against one AERONET station in Central Africa (Fig. 10) during this fire event. The location of that AERONET station (station SEGC_Lope_Gabon in the AERONET database) is marked in Fig. 9. We compared total, OC and BC (only) AOT from NGACv2 to observed AOT at that station. We also added 6-hourly daily forecast of ICAP-MME for the month of July 2016 in the Fig. 10. Both model and station observations show an increase in AOT after 10 July, which continues to grow higher after 15 July until the end of the month. The majority of total AOT in Fig. 10 is contributed by biomass-burning-generated OC, with some increase in BC also observed. Figure 10 shows that the model AOT pattern for the month matches closely with surface observations. In terms of intensity, the majority of the reported AOT from AERONET are higher than the model forecast, which is also due to a difference in spatial resolution between the model and surface observations.
6.2 June 2015 dust event
During boreal summer, dust from the deserts of the Sahara, the largest sources of dust in the world, is transported across the Atlantic Ocean by prevailing tropical easterly winds (Karyampudi et al., 1999). According to recent satellite estimation, each year 182 million tons of dust on average leave the western edge of Sahara, and of that 27.7 million tons falls on the surface of the Amazon basin (Yu et al., 2015). Huge plumes of Saharan dust were swept off the coast of western Sahara in the middle of June 2015 and traveled across the Atlantic Ocean to reach the southeast corner of the US (UMBC smog blog reported days of dust in the Caribbean and Gulf of Mexico at http://alg.umbc.edu/usaq/archives/2015_06.html, last access: March 2018). The actual dust storm began on 13 June when a storm system off the west coast of Africa stirred up a heavy stream of dust from Senegal, western Sahara and Mauritania. On 22 June, the Saharan dust had traveled more than 5000 miles to reach southern Texas, where it contributed to moderately poor air quality. Figure 11 shows NGACv2 total AOT forecasts for the selected days of 13, 17 and 21 June. These days show the progression of dust westward from the African coast with high AOT above 1 over land which gradually decreases as the dust storm crosses over the ocean. ICAP, MODIS and EPS-VIIRS (all in horizontal resolution) are compared to NGACv2 in Fig. 11.
Four AERONET stations (marked in Fig. 12a) were used in this case to further look into the westward dust progression. One of these four stations – Tamanrasset (22∘ N, 5∘ E) in southern Algeria – is located near the source of dust storm, while the other three stations – Cape Verde (AERONET station name Capo Verde in Table 2), Cape San Juan and Guadeloupe – are located on the downwind side. Total AOT from AERONET is compared to total, dust and OC AOT from NGACv2 in Fig. 12 for each of these four stations. It is evident that dust AOT is the main contributor to total NGACv2 AOT at all the stations during this event. Between 8 and 21 June, the AERONET location in Tamanrasset observed ground AOT above ∼ 0.7 on some days with highs reaching nearly 1.5 (Fig. 12a). Apart from on 8 June, NGACv2 dust AOT intensity (reaching ∼ 0.6) was underestimated compared to ground observations at this location. At Cape Verde, which is located just off the coast of Africa, NGACv2 correlation is low (R=0.375) at a 95 % confidence interval with AERONET observations and also overestimates the intensity (nearly 2 times) during the event (Fig. 12b). San Juan and Guadeloupe stations, located in Puerto Rico and the Caribbean, respectively, show a gradual increase in AOT from 13 June onward as Saharan dust began to reach those locations (Fig. 12c, d). NGACv2 dust AOT peaks coincide with high AERONET values at these locations, but the model-simulated intensity is lower compared to the observation.
This paper presents an evaluation of NOAA's new updated aerosol forecast model NGACv2, which became operational in March 2017. The model couples NEMS GFS with NASA's GOCART aerosol and is an in-line global aerosol forecast system. The model forecasts five species of aerosol (dust, sea salt, BC, OC and sulfate) every 3 h, twice per day (00:00 Z and 12:00 Z) and out to 5 days on a global horizontal grid. We extensively evaluated 17 months of model-simulated total AOT both temporally and spatially against satellites (MODIS, VIIRS) and multi-model ensemble (ICAP-MME) data. Satellite AOT retrievals inherently have greater uncertainty, which is further exacerbated by using measurements from multiple satellites. The long-term MODIS AOT, on the other hand, provides a consistent measurement platform, and hence it is used for the validation of model results in this study. We also compared model results with more than 50 AERONET station observations, which are spread globally and represent different aerosol regimes.
The model reproduces the prominent temporal and geographical features of AOTs as observed by MODIS and ICAP-MME, like dust plumes over northern Africa and the Arabian Peninsula, biomass burning plumes in southern Africa, northern Canada and high-altitude sea-salt bands. The AOT in North Africa is among the highest in the world throughout the year, a combined effect of dust outbreaks from the Sahara and biomass burning near the equator. NGACv2 captures the seasonal shift in the aerosol plume off the west coast of Africa and agrees well with MODIS observations. The model also correlates highly with MODIS observations over both the eastern and western US regions during the study period. We found an underestimation of model AOT over Asia and during the South American biomass season and Middle East dust season. We regularly monitor dust and smoke events around the globe and use them to evaluate our model performance. In this paper, we showed two such cases, where the NGACv2 forecast fared reasonably well compared to other models and observations with some biases in terms of intensity.
The comparisons of model forecasts with surface point locations show results similar to our comparisons with MODIS in larger gridded domains. The model reproduces the seasonal variations at most of the sites, especially those sites on the African continent where dust and biomass plumes dominate. The model also captures dust and smoke outflow from Africa at AERONET locations that are present in the Atlantic Ocean (Cape Verde, Ascension Island) even though the magnitudes do not match with these point observations. Model AOT captures two other dust regions (the Arabian Peninsula and Asian dust near the source region) but underestimates them quantitatively as these dust plumes undergo long-range transport over Asia. The model forecasts large biomass burnings over Canada in both 2015 and 2016, and it agrees well with AERONET station data. However, like other aerosol forecast models, NGACv2 also produces weaker AOT signals for some aerosol events and regimes. The model underestimates AOT over the Amazon region in both years and also for the Indonesian fire event in 2015. It also underestimates sulfate AOT over Asia, which results a large underestimation of total AOT compared to AERONET over these locations.
The 2015 fire season in Indonesia started in July and lasted through October, with haze extending through Malaysia, Singapore and Thailand, and it exposed millions of people to hazardously poor air quality (Field et al., 2016). Figure 13 shows total AOT from NGACv2, ICAP-MME and MERRA-2 forecasts compared to EPS-VIIRS observation on a single day in September 2015 over southeast Asia. Six-hourly model forecasts are averaged to get daily AOT for the models. NGACv2 underestimates total AOT which is caused by low smoke emission (both OC and BC) data used by the model for this fire event. Wei et al. (2017) studied both forecast and analysis of MERRA-2 aerosol fields and compared this with NGACv2. That study also compared aerosol analysis increments (defined as difference between analysis and model first guess) of all four cycles of MERRA-2 and found large AOT analysis increment (0.6–0.8) in the 06:00 Z DA cycle which contributed to higher AOT in MERRA-2. Thus, the underestimation of Indonesian fire by NGACv2 can be attributed to both near-real-time emissions and the absence of DA. Lynch et al. (2016) showed that AOT DA is as important as tuning processes of the sources and sinks of aerosols.
At present, model comparisons with satellite results can be meaningfully interpreted in regions where AOT is very high and dominated by a single aerosol (dust or smoke). In mixed aerosol regimes, particularly over land (where pollution, long-range transport of biomass burning or dust all contribute), the model seems to simulate an AOT lower than the observations by a factor of 2–3. We discussed some of these problems associated with the model that include the quick removal of aerosols (scavenging), the type of microphysics scheme (creation of too few or excessive boundary layer clouds that reduce sulfate AOT generation) and lower emission factors (over South America and Asia). Our next steps will be addressing these issues with the model and further improving overall model forecasts, with a particular focus on Asia. Ongoing DA work with NGAC shows some improvements in terms of total AOT over Asia through DA (Lu et al., 2017).
Expanding the aerosol species from dust only in NGACv1 to multispecies in NGACv2 provides a more complete global aerosol forecast using near-real-time global biomass burning emission data GBBEPx. It also provides direct guidance on long-range aerosol transport and the impact on particulate matter over CONUS and will be used as the dynamical boundary conditions for a regional air quality model like the Community Model for Air Quality (CMAQ) which runs as part of NOAA's National Air Quality Forecast Capability (Lee et al., 2017). This work provides general validation results to characterize the present NGACv2 performance and identify deficiencies for future improvements. Daily NGACv2 web graphics can be viewed at http://www.emc.ncep.noaa.gov/gmb/NGAC/html/realtime.ngac.html (last access: March 2018), and near-real-time comparisons with other models, satellites and AERONET stations are posted at http://www.emc.ncep.noaa.gov/gmb/NGAC/NGACv2 (last access: March 2018).
NCEP operational products are accessible to general users, free of charge in real time at NOAA Operational Model Archive and Distribution System (NOMADS). The NCEP Central Operations (NCO) ftp site provides the source code, relevant run scripts and fixed fields files at http://www.nco.ncep.noaa.gov/pmb/codes/nwprod/ngac.v2.3.0 (last access: March 2018). The NGACv2 output is in GRIdded Binary Version 2 (GRIB2) format on a grid, with 3-hourly output up to 120 h. NGACv2 products from NOMADS are available at http://nomads.ncep.noaa.gov/pub/data/nccf/com/ngac/prod (last access: March 2018). The NCAR Command Language (NCL) program is used to generate all the figures in this paper (https://www.ncl.ucar.edu/, last access: March 2018).
The authors declare that they have no conflict of interest.
Partial funding of this research was provided by the NOAA National Weather
Service Program Office (NWSPO) Next Generation Global Prediction System
(NGGPS) award number NA15NWS4680008. We thank Atmosphere Archive &
Distribution System (LAADS) Distributed Active Archive Center (DAAC), located
in the Goddard Space Flight Center in Greenbelt, Maryland, for providing
MODIS Level-3 data. We acknowledge the S-NPP/VIIRS science team for the
high-quality products. We thank Jeff McQueen, who is lead in air quality
forecast at NCEP/EMC, for his support. We are grateful to Shobha Kondragunta,
who is co-lead of the VIIRS aerosol algorithm team, for providing EPS-VIIRS
data. We wish to thank the ICAP team for providing their MME AOT data. We
acknowledge that AERONET team for the production of the data used in this
work. The authors would like to thank the two anonymous reviewers for their
valuable suggestions and comments.
Edited by: Rolf Sander
Reviewed by: two anonymous referees
Ben-Ami, Y., Koren, I., and Altaratz, O.: Patterns of North African dust transport over the Atlantic: winter vs. summer, based on CALIPSO first year data, Atmos. Chem. Phys., 9, 7867–7875, https://doi.org/10.5194/acp-9-7867-2009, 2009.
Benedetti, A., Morcrette, J.-J., Boucher, O., Dethof, A., Engelen, R. J., Fisher, M., Flentje, H., Huneeus, N., Jones, L., Kaiser, J. W., Kinne, S., Mangold, A., Razinger, M., Simmons, A. J., and Suttieet, M.: Aerosol analysis and forecast in the European Centre for Medium Range Forecasts Integrated Forecast System: 2. Data assimilation, J. Geophys. Res., 114, D13205, https://doi.org/10.1029/2008JD011115, 2009.
Bhawar, R. L., Lee, W.-S., and Rahul, P. R. C.: Aerosol types and radiative forcing estimates over East Asia, Atmos. Environ., 141, 532–541, 2016.
Campbell, J. R., Tackett, J. L., Reid, J. S., Zhang, J., Curtis, C. A., Hyer, E. J., Sessions, W. R., Westphal, D. L., Prospero, J. M., Welton, E. J., Omar, A. H., Vaughan, M. A., and Winker, D. M.: Evaluating nighttime CALIOP 0.532 µm aerosol optical depth and extinction coefficient retrievals, Atmos. Meas. Tech., 5, 2143–2160, https://doi.org/10.5194/amt-5-2143-2012, 2012.
Cesnulyte, V., Lindfors, A. V., Pitkänen, M. R. A., Lehtinen, K. E. J., Morcrette, J.-J., and Arola, A.: Comparing ECMWF AOD with AERONET observations at visible and UV wavelengths, Atmos. Chem. Phys., 14, 593–608, https://doi.org/10.5194/acp-14-593-2014, 2014.
Chin, M., Ginoux, P., Kinne, S., Torres, O., Holben, B. N., Duncan, B. N., Martin, R. V., Logan, J. A., Higurashi, A., and Nakajima, T.: Tropospheric aerosol optical thickness from the GOCART model and comparisons with satellite and sunphotometer measurements, J. Atmos. Sci., 59, 461–483, 2002.
Chin, M., Diehl, T., Ginoux, P., and Malm, W.: Intercontinental transport of pollution and dust aerosols: implications for regional air quality, Atmos. Chem. Phys., 7, 5501–5517, https://doi.org/10.5194/acp-7-5501-2007, 2007.
Ciren, P., Liu, H., Kondragunta, S., and Laszlo, I.: Adapting MODIS Dust Mask Algorithm toSuomi NPP VIIRS for Air Quality Applications, AGU Fall Meeting Abstracts, San Francisco, 11–16 December 2012.
Colarco, P., da Silva, A., Chin, M., and Diehl, T.: Online simulations of global aerosol distributions in the NASA GEOS-4 model and comparisons to satellite and ground-based aerosol optical depth, J. Geophys. Res., 115, D14207, https://doi.org/10.1029/2009JD012820, 2010.
Darmenov, A. and Da Sila, A. M.: The Quick Fire Emissions Dataset (QFED) – Documentation of versions 2.1, 2.2 and 2.4, NASA Technical Report Series on Global Modeling and Data Assimilation, NASA/TM-2015-104606, Vol. 18, 211 pp., available at: http://gmao.gsfc.nasa.gov/pubs/tm/ (last access: November 2017), 2015.
Eck, T. F., Holben, B. N., Reid, J. S., Dubovik, O., Smirnov, A., O'Neill, N. T., Slutsker, I., and Kinne, S.: The wavelength dependence of the optical depth of biomass burning, urban and desert dust aerosols, J. Geophys. Res., 104, 31333–31350, 1999.
Eskes, H., Huijnen, V., Arola, A., Benedictow, A., Blechschmidt, A.-M., Botek, E., Boucher, O., Bouarar, I., Chabrillat, S., Cuevas, E., Engelen, R., Flentje, H., Gaudel, A., Griesfeller, J., Jones, L., Kapsomenakis, J., Katragkou, E., Kinne, S., Langerock, B., Razinger, M., Richter, A., Schultz, M., Schulz, M., Sudarchikova, N., Thouret, V., Vrekoussis, M., Wagner, A., and Zerefos, C.: Validation of reactive gases and aerosols in the MACC global analysis and forecast system, Geosci. Model Dev., 8, 3523–3543, https://doi.org/10.5194/gmd-8-3523-2015, 2015.
Field, R. D., van der Werf, G. R., Fanin, T., Fetzer, E. J., Fuller, R., Jethva, H., Levy, R., Livesey, N. J., Luo, M., Torres, O., and Worden, H. M.: Indonesian fire activity and smoke pollution in 2015 show persistent nonlinear sensitivity to El-Nino induced drought, P. Natl. Acad. Sci. USA, 113, 9204–9209, 2016.
Fordham, D. A., Wigley, T. M., Watts, M. J., and Brook, B. W.: Strengthening forecasts of climate change impacts with multi-model ensemble averaged projections using MAGICC/SCENGEN 5.3, Ecography, 35, 4–8, 2012.
Forster, P., Ramaswamy, V., Artaxo, P., Berntsen, T., Betts, R., Fahey, D. W., Haywood, J., Lean, J., Lowe, D. C., Myhre, G., Nganga, J., Prinn, R., Raga, G., Schultz, M., and Van Dorland, R.: Changes in Atmospheric Constituents and in Radiative Forcing, in: Climate Change 2007: The Physical Science Basis. Contribution of Working Group I to the Fourth Assessment Report of the Intergovernmental Panel on Climate Change, edited by: Solomon, S., Qin, D., Manning, M., Chen, Z., Marquis, M., Averyt, K. B., Tignor, M., and Miller, H. L., Cambridge University Press, Cambridge, United Kingdom and New York, NY, USA, 2007.
Gelaro, R., McCarty, W., Suárez, M. J., Todling, R., Molod, A., Takacs, L., Randles, C. A., Darmenov, A., Bosilovich, M. G., Reichle, R., Wargan, K., Coy, L., Cullather, R., Draper, C., Akella, S., Buchard, V., Conaty, A., da Silva, A. M., Gu, W., Kim, G., Koster, R., Lucchesi, D. Merkova, J. E., Nielsen, G. Partyka, G., Pawson, S., Putman, W., Rienecker, M., Schubert, S. D., Sienkiewicz, M., and Zhao, B.: The Modern-Era Retrospective Analysis for Research and Applications, Version 2 (MERRA-2), J. Climate, 30, 5419–5454, https://doi.org/10.1175/JCLI-D-16-0758.1, 2017.
Generoso, S., Bréon, F.-M., Balkanski, Y., Boucher, O., and Schulz, M.: Improving the seasonal cycle and interannual variations of biomass burning aerosol sources, Atmos. Chem. Phys., 3, 1211–1222, https://doi.org/10.5194/acp-3-1211-2003, 2003.
Ghan, S. J., Liu, X., Easter, R. C., Zaveri, R., Rasch, P. J., Yoon, J., and Eaton, B.: Toward a minimal representation of aerosols in climate models: Comparative decomposition of aerosol direct, semidirect and indirect radiative forcing, J. Climate, 25, 6461–6476, 2012.
Ginoux, P., Chin, M., Tegen, I., Prospero, J. M., Holben, B., Dubovik, O., and Lin, S.-J.: Sources and global distributions of dust aerosols simulated with the GOCART model, J. Geophys. Res., 106, 20255–20273, 2001.
Hansen, J., Sato, M., and Ruedy, R.: Radiative forcing and climate response, J. Geophys. Res., 102, 6831–6864, https://doi.org/10.1029/96JD03436, 1997.
Haywood, J. and Boucher, O.: Estimates of the direct and indirect radiative forcing due to tropospheric aerosols: A review, Rev. Geophys., 38, 513–543, https://doi.org/10.1029/1999RG000078, 2000.
Haywood, J. M., Allan, R. P., Culverwell, I., Slingo, T., Milton, S., Edwards, J., and Clerbaux, N.: Can desert dust explain the outgoing longwave radiation anomaly over the Sahara during July 2003?, J. Geophys. Res., 110, D05105, https://doi.org/10.1029/2004JD005232, 2005.
Holben, B. N., Eck, T. F., Slutsker, I., Tanré, D., Buis, J. P., Setzer, A., Vermote, E., Reagan, J. A., Kaufman, Y. J., Nakajima, T., Lavenu, F., Jankowiak, I., and Smirnov, A.: AERONET – A Federated instrument network and data archive for aerosol characterization, Remote Sens. Environ., 66, 1–16, 1998.
Hsu, N. C., Jeong, M.-J., Bettenhausen, C., Sayer, A. M., Hansell, R., Seftor, C. S., Huang, J., and Tsay, S.-C.: Enhanced Deep Blue aerosol retrieval algorithm: The second generation, J. Geophys. Res.-Atmos., 118, 9296–9315, https://doi.org/10.1002/jgrd.50712, 2013.
Jackson, J., Liu, H., Laszlo, I., Kondragunta, S., Remer, L. A., Huang, J., and Huang, H.-C.: Suomi-NPP VIIRS Aerosol Algorithms and Data Products, J. Geophys. Res., 118, 12673–12689, https://doi.org/10.1002/2013jd020449, 2013.
Karyampudi, V.: Validation of the Saharan dust plume conceptual model using Lidar, Meteosat, and ECMWF Data, B. Am. Meteorol. Soc., 80, 1045–1075, 1999.
Kaufman, Y. J., Koren, I., Remer, L. A., Tanré, D., Ginoux, P., and Fan, S.: Dust transport and deposition observed from the Terra-Moderate Resolution Imaging Spectroradiometer (MODIS) spacecraft ovet the Atlantic Ocean, J. Geophs. Res., 110, D10S12, https://doi.org/10.1029/2003JD004436, 2005.
Kedia, S., Ramachandran, S., Holben, B. N., and Tripathi, S. N.: Quantification of aerosol type, and sources of aerosols over the Indo-Gangetic Plain, Atmos. Environ., 98, 607–619, 2014.
Kroll, J. H. and Seinfeld, J. H.: Chemistry of secondary organic aerosol: formation and evolution of low-volatility organics in the atmosphere, Atmos. Environ., 42, 3293–3624, 2008.
Laszlo, I. and Liu, H.: EPS Aerosol Optical Depth (AOD) Algorithm Theoretical Basis Document, VIIRS ATBD, JPSS internal note, available at: https://www.star.nesdis.noaa.gov/jpss/documents/ATBD/ATBD_EPS_Aerosol_AOD_v3.0.1.pdf (last access: March 2018), 2016.
Levy, R. C., Mattoo, S., Munchak, L. A., Remer, L. A., Sayer, A. M., Patadia, F., and Hsu, N. C.: The Collection 6 MODIS aerosol products over land and ocean, Atmos. Meas. Tech., 6, 2989–3034, https://doi.org/10.5194/amt-6-2989-2013, 2013.
Lee, P., McQueen, J., Stajner, I., Huang, J., Pan, L., Tong, D., Kim, H., Tang, Y., Kondragunta, S., Ruminski, M., Lu, S., Rogers, E., Saylor, R., Shafran, P., Huang, H., Gorline, J., Upadhayay, S., and Artz, R.: NAQFC developmental forecast guidance for Fine particulate matter (PM2.5), Weather Forecast., 32, 407–421, 2017.
Liu, H., Remer, L. A., Huang, J., Huang, H.-C., Kondragunta, S., Laszlo, I., Oo, M., and Jackson, J. M.: Preliminary Evaluation of Suomi-NPP VIIRS Aerosol Optical Thickness, J. Geophys. Res., 119, 3942–3962, https://doi.org/10.1002/2013jd020360, 2013.
Lohmann, U. and Feichter, J.: Global indirect aerosol effects: a review, Atmos. Chem. Phys., 5, 715–737, https://doi.org/10.5194/acp-5-715-2005, 2005.
Lu, C.-H., da Silva, A., Wang, J., Moorthi, S., Chin, M., Colarco, P., Tang, Y., Bhattacharjee, P. S., Chen, S.-P., Chuang, H.-Y., Juang, H.-M. H., McQueen, J., and Iredell, M.: The implementation of NEMS GFS Aerosol Component (NGAC) Version 1.0 for global dust forecasting at NOAA/NCEP, Geosci. Model Dev., 9, 1905–1919, https://doi.org/10.5194/gmd-9-1905-2016, 2016.
Lu, C.-H., Wei, S.-W., Zhang, X., Kondragunta, S., Chen, S.-P., Zhao, Q., Wang, J., Bhattacharjee, P., and McQueen, J. T.: The utilization of satellite observations for improving Global aerosol forecasting, Asia Oceania Geosc. Soc. Conference, Singapore, 11 August 2017.
Lynch, P., Reid, J. S., Westphal, D. L., Zhang, J., Hogan, T. F., Hyer, E. J., Curtis, C. A., Hegg, D. A., Shi, Y., Campbell, J. R., Rubin, J. I., Sessions, W. R., Turk, F. J., and Walker, A. L.: An 11-year global gridded aerosol optical thickness reanalysis (v1.0) for atmospheric and climate sciences, Geosci. Model Dev., 9, 1489–1522, https://doi.org/10.5194/gmd-9-1489-2016, 2016.
Mallet, M., Dubovik, O., Nabat, P., Dulac, F., Kahn, R., Sciare, J., Paronis, D., and Léon, J. F.: Absorption properties of Mediterranean aerosols obtained from multi-year ground-based remote sensing observations, Atmos. Chem. Phys., 13, 9195–9210, https://doi.org/10.5194/acp-13-9195-2013, 2013.
Mangold, A., De Backer, H., De Paepe, B., Dewitte, S., Chiapello, I., Derimian, Y., Kacenelenbogen, M., Léon, J.-F., Huneeus, N., Schulz, M., Ceburnis, D., O'Dowd, C., Flentje, H., Kinne, S., Benedetti, A., Morcrette, J.-J., and Boucher, O.: Aerosol analysis and forecast in the European Centre for Medium Range Weather Forecasts Integrated Forecast System: 3. Evaluation by means of case studies, J. Geophys. Res., 116, D03302, https://doi.org/10.1029/2010JD014864, 2011.
Menon, S., Hansen, J., Nazarenko, L., and Luo, Y.: Climate effects of black carbon aerosols in China and India, Science, 297, 2250–2253, https://doi.org/10.1126/science.1075159, 2002.
Meehl, G. A., Covey, C., Delworth, T., Latif, M., McAvaney, B., Mitchell, J. F., Stouffer, R. J., and Taylor, K. E.: The WCRP CMIP3 multimodel dataset – A new era in climate change research, B. Am. Meteorol. Soc, 88, 1383–1394, 2007.
Morcrette, J.-J., Boucher, O., Jones, L., Salmond, D., Bechtold, P., Beljaars, A., Benedetti, A., Bonet, A., Kaiser, J. W., Razinger, M., Schulz, M., Serrar, S., Simmons, A. J., Sofiev, M., Suttie, M., Tompkins, A. M., and Untch, A.: Aerosol analysis and forecast in the European centre for medium-range weather forecasts integrated forecast system: forward modeling, J. Geophys. Res., 114, D06206, https://doi.org/10.1029/2008JD011235, 2009.
Mulcahy, J. P., Walters, D. N., Bellouin, N., and Milton, S. F.: Impacts of increasing the aerosol complexity in the Met Office global numerical weather prediction model, Atmos. Chem. Phys., 14, 4749–4778, https://doi.org/10.5194/acp-14-4749-2014, 2014.
Ramanathan, V., Crutzen, P. J., Lelieveld, J., Mitra, A. P., Althausen, D., Andersons, J., Andreae, M. O., Cantrell, W., Cass, G. R., Chung, C. E., Clarke, A. D., Coakley, J. A., Collins, W. D., Conant, W. C., Dulac, F., Heintzenberg, J., Heymsfield, A. J., Holben, B., Howell, S., Hudson, J., Jayaraman, A., Kiehl, J. T., Krishnamurti, T. N., Lubin, D., McFarquhar, G., Novakov, T., Ogren, J. A., Podgorny, I. A., Prather, K., Priestley, K., Prospero, J. M., Quinn, P. K., Rajeev, K., Rasch, P., Rupert, S., Sadourny, R., Satheesh, S. K., Shaw, G. E., Sheridan, P., and Valero, F. P. J.: Indian Ocean Experiment: An integrated analysis of the climate forcing and effects of the great Indo-Asian haze, J. Geophys. Res., 106, 28371–28398, https://doi.org/10.1029/2001JD900133, 2001.
Rappold, A. G., Stone, S. L., Cascio, W. E., Neas, L. M., Kilaru, V. J., Carraway, M. S., Szykman, J. J., Ising, A., Cleve, W. E., Meredith, J. T., Vaughan-Batten, H., Deyneka, L., and Devlin, R. B.: Peat bog wildfire smoke exposure in rural North Carolina is associated with cardiopulmonary emergency department visits assessed through syndromic surveillance, Environ. Health Persp., 119, 1415–1420, 2011.
Reid, J., Benedetti, A., Colarco, P. R., and Hansen, J. A.: International operational aerosol observability work-shop, B. Am. Meteorol. Soc., 92, ES21–ES24, https://doi.org/10.1175/2010BAMS3183.1, 2011.
Sayer, A. M., Hsu, N. C., Bettenhausen, C., and Jeong, M.-J.: Validation and uncertainty estimates for MODIS Collection 6 “Deep Blue” aerosol data, J. Geophys. Res.-Atmos., 118, 7864–7872, https://doi.org/10.1002/jgrd.50600, 2013.
Sayer, A. M., L. A. Munchak, N. C. Hsu, R. C. Levy, C. Bettenhausen, and M.-J. Jeong: MODIS Collection 6 aerosol products: Comparison between Aqua's e-Deep blue, dark target and “merged” data sets and usage recommendations, J. Geophys. Res.-Atmos., 119, 13965–989, 2014.
Sekiyama, T. T., Tanaka, T. Y., Shimizu, A., and Miyoshi, T.: Data assimilation of CALIPSO aerosol observations, Atmos. Chem. Phys., 10, 39–49, https://doi.org/10.5194/acp-10-39-2010, 2010.
Sessions, W. R., Reid, J. S., Benedetti, A., Colarco, P. R., da Silva, A., Lu, S., Sekiyama, T., Tanaka, T. Y., Baldasano, J. M., Basart, S., Brooks, M. E., Eck, T. F., Iredell, M., Hansen, J. A., Jorba, O. C., Juang, H.-M. H., Lynch, P., Morcrette, J.-J., Moorthi, S., Mulcahy, J., Pradhan, Y., Razinger, M., Sampson, C. B., Wang, J., and Westphal, D. L.: Development towards a global operational aerosol consensus: basic climatological characteristics of the International Cooperative for Aerosol Prediction Multi-Model Ensemble (ICAP-MME), Atmos. Chem. Phys., 15, 335–362, https://doi.org/10.5194/acp-15-335-2015, 2015.
Shalaby, A., Rappenglueck, B., and Eltahir, E. A. B.: The climatology of dust aerosol over the arabian peninsula, Atmos. Chem. Phys. Discuss., 15, 1523–1571, https://doi.org/10.5194/acpd-15-1523-2015, 2015.
Smirnov, A., Holben, B. N., Eck, T. F., Dubovik, O., and Slutsker, I.: Cloud Screening and quality control algorithms for the AERONET database, Remote Sens. Environ., 73, 337–349, 2000.
Takemura, T., Okamoto, H., Maruyama, Y., Numaguti, A., Higurashi, A., and Nakajima, T.: Global three-dimensional simulation of aerosol optical thickness distribution of various origins, J. Geophys. Res., 105, 17853–17873, 2000.
Tanaka, T. Y., Orito, K., Sekiyama, T. T., Shibata, K., Chiba, M., and Tanaka, H.: MASINGAR, a global tropospheric aerosol chemical transport model coupled with MRI/JMA98 GCM: model description, Pap. Meteorol. Geophys., 53, 119–138, 2003.
Taylor, K. E.: Summarizing multiple aspects of model performance in a single diagram, J. Geophys. Res., 106, 7183–7192, https://doi.org/10.1029/2000JD900719, 2001.
Wang, J., Bhattacharjee, P. S., Tallapragada, V., Lu, C.-H., Kondragunta, S., da Silva, A., Zhang, X., Chen, S.-P., Wei, S.-W., Darmenov, A. S., McQueen, J., Lee, P., Koner, P., and Harris, A.: The implementation of NEMS GFS Aerosol Component (NGAC) Version 2.0 for global multispecies forecasting at NOAA/NCEP – Part 1: Model descriptions, Geosci. Model Dev., 11, 2315–2332, https://doi.org/10.5194/gmd-11-2315-2018, 2018.
Wei, S.-W., Zhao, Q., Chen, S. P., Wang, J., Bhattacharjee, P. S., Kondragunta, S., McQueen, J.., and Lu, S.: Improving NCEP global aerosol forecasts by data assimilation of VIIRS aerosol products, Fifth AMS Symposium on the Joint Center for Satellite Data Assimilation, Seattle, WA, USA, 23–26 January 2017, American Meteorological Society, 2017.
Westphal, D. L., Curtis, C. A., Liu, M., and Walker, A. L.: Operational aerosol and dust storm forecasting, in: WMO/GEO expert meeting on an international sand and dust storm warning system, IOP conference series: Earth and Environmental Science, 7, 012007, https://doi.org/10.1088/1755-1307/7/1/012007, 2009.
Yoo, H., Li, Z., Hou, Y.-T., Lord, S., Weng, F., and Barker, H. W.: Diagnosis and testing of low-level cloud parameterizations for the NCEP/GFS model using satellite and ground-based measurements, Clim. Dynam., 41, 1595–1613, 2013.
Yu, H., Chin, M., Yuan, T., Bian, H., Remer, L. A., Prospero, J. M., Omar, A., Winker, D., Yang, Y., Zhang, Y., Zhang, Z., and Zhao, C.: The fertilizing role of African dust in the Amazon rainforest: A first multiyear assessment based on data from Cloud-Aerosol Lidar and Infrared Pathfinder Satellite Observations, Geophys. Res. Lett., 42, 1984–1991, https://doi.org/10.1002/2015GL063040, 2015.
Zhang, J., Reid, J. S., Westphal, D. L., Baker, N. L., and Hyer, E. J.: A system for operational aerosol optical depth data assimilation over global oceans, J. Geophys. Res., 113, D10208, https://doi.org/10.1029/2007JD009065, 2008.
Zhang, X., Kondragunta, S., Ram, J., Schmidt, C., and Huang, H.-C.: Near-real-time global biomass burning emissions product from geostationary satellite constellation, J. Geophys. Res., 117, D14201, https://doi.org/10.1029/2012JD017459, 2012.
Zhao, T. X., Stowe, L. L., Smirnov, A., Crosby, D., Sapper, J., and McClain, C. R.: Development of a global validation package for satellite oceanic aerosol optical thickness retrieval based on AERONET observations and its application to NOAA/NESDIS operational aerosol retrievals, J. Atmos. Sci., 59, 294–312, 2002.


