
the Creative Commons Attribution 4.0 License.
the Creative Commons Attribution 4.0 License.
 | 12 Oct 2026
Evaluating the EPICC-Model for regional air quality simulation: a comparative study with CAMx and CMAQ
Mengjie Lou

Wending Wang
Huansheng Chen
Kai Cao
Xiaohan Fan
Dingyue Liang
Fenfen Yu
Jiating Zhang
Wei Wang
Zifa Wang
This study presents a systematic evaluation of the EPICC-Model developed in China for regional PM2.5 and MDA8 O3 simulations against established international models, using WRF meteorological fields and a multi-source integrated emission inventory. Results highlight the strengths of the EPICC-Model in several aspects: it achieves relatively high spatial consistency with measurements for PM2.5, with an annual index of agreement (IOA) of 0.80, and accurately captures pollution patterns in heavily polluted North China. It also demonstrates improved performance in simulating summer O3 peaks, reducing maximum bias by more than 20 µg m−3; this performance may be partly associated with its inclusion of heterogeneous HONO formation and particulate nitrate photolysis. The model exhibits the highest hit rate (45.6 %) for MDA8 O3 pollution events exceeding 160 µg m−3 and successfully reproduces persistent pollution episodes. However, all models share common limitations, including insufficient capability in reproducing heavy pollution episodes, systematic underestimation of , and uncertainties in SOA-related OC simulations. Future improvements should focus on refining secondary aerosol chemistry and emission inventories and further evaluating the representation of vertical turbulent mixing under stable boundary-layer conditions. This study benchmarks the performance of the EPICC-Model against established chemical transport models (CTMs) and identifies priorities for its further development and regional application.
- Article
(12107 KB) - Full-text XML
-
Supplement
(5211 KB) - BibTeX
- EndNote


With rapid urbanization and industrialization, China faces increasingly severe multi-pollutant air quality challenges. Among them, fine particulate matter (PM2.5) and ozone (O3) are key threats to public health and ecosystems, and their coordinated control has become a priority. Specifically, PM2.5 comprises both directly emitted particles and secondary components formed from SO2, NOx, NH3, and volatile organic compounds (VOCs), with its levels also affected by regional transport and meteorology (Zhang et al., 2012; Jing et al., 2020; Zhai et al., 2021; Bao et al., 2023). Emission control policies have reduced population-weighted PM2.5 exposure by ∼48 % from 2013 to 2020 (Xiao et al., 2022), yet severe winter haze episodes persist in regions like Beijing-Tianjin-Hebei. In contrast, O3 is formed through photochemical reactions involving NOx and VOCs, and its production exhibits nonlinear responses to precursor levels, characterized by NOx-sensitive and VOC-sensitive regimes (Haagen-Smit and Fox, 1956; Sillman, 1999). Ambient O3 levels are also strongly influenced by meteorological factors, including solar radiation, temperature, humidity, and boundary-layer dynamics (Li et al., 2019b; Gao et al., 2022). In many Chinese urban clusters, PM2.5 concentrations have decreased, whereas warm-season maximum daily 8 h average (MDA8) O3 concentrations increased at a rate of 1.2±1.3 ppb yr−1 during 2013–2022 (Wang et al., 2024). The combined pollution of PM2.5 and O3 exhibits complex spatiotemporal evolution patterns and formation mechanisms (Lyu et al., 2025; Zhu et al., 2022), posing significant challenges for sustained air quality improvement in China.
To better understand the formation of complex air pollution and assess control strategies, Chemical Transport Models (CTMs) are widely used for regional air quality analysis and policy evaluation (Li et al., 2021; Gao and Zhou, 2024). Representative CTMs include the Community Multiscale Air Quality Modeling System (CMAQ) developed by the U.S. Environmental Protection Agency (EPA) (Byun and Schere, 2006; Foley et al., 2010; Appel et al., 2017, 2021), the Comprehensive Air Quality Model with Extensions (CAMx) developed by Ramboll (Ramboll, 2020; Emery et al., 2024), WRF-Chem for regional-scale simulations (Grell et al., 2005), and GEOS-Chem, which is widely applied for global-scale studies (Eastham et al., 2018; The International GEOS-Chem User Community, 2025). However, current CTMs still exhibit significant uncertainties in simulating PM2.5 and O3 under specific pollution scenarios in China, primarily manifested as systematic biases in peak concentrations, spatiotemporal distribution errors, and inaccuracies in capturing seasonal variability (Bessagnet et al., 2016; Chen et al., 2019). Against this backdrop, China has developed the Emission and atmospheric Processes Integrated and Coupled Community Model (EPICC-Model) to enhance capabilities in simulating complex pollution processes. Supported by the National Natural Science Foundation of China (Major Program) and the Earth System Numerical Simulation Facility (EarthLab), the model was officially released on 8 November 2024 (EPICC-Model Working Group, 2026a) (for detailed description, see Sect. 2.1).
As a newly released CTM, the EPICC-Model has undergone preliminary single-model performance evaluations (EPICC-Model Working Group, 2026a; Wang et al., 2025), but systematic multi-model comparisons under nationwide, multi-season conditions remain lacking. Multi-model intercomparison not only helps reveal differences among models in pollutant transport, chemical reactions, and meteorological feedbacks, but also serves as a key approach to quantifying simulation uncertainties and improving model robustness and reliability (Carmichael et al., 2008). Although substantial efforts have been made in evaluating CTMs over China and East Asia, such as the MICS-Asia phase studies on PM2.5 and O3 (Chen et al., 2019; Gong and Liao, 2019; Itahashi et al., 2020; Li et al., 2019a), regional comparisons in the Pearl River Delta (Wu et al., 2012), and recent multi-model analyses over eastern China (Gao et al., 2024), most focus on earlier-generation or established models. Likewise, large-scale assessments within CMIP5/6 have consistently revealed systematic biases in simulating PM2.5 and components across China (Li et al., 2020; Ren et al., 2024). Given the structural innovations and representations in the EPICC-Model, it is both timely and necessary to conduct a systematic comparison with established CTMs over China, in order to comprehensively assess its strengths and weaknesses and provide a scientific basis for subsequent model improvement and application.
Therefore, this study implements a consistent model intercomparison framework to systematically compare the simulation performance of three models (EPICC-Model, CMAQ, and CAMx) for PM2.5 and O3 concentrations over China in 2021, based on a unified meteorological driving field and a multi-source integrated emission inventory. The objectives are to comprehensively assess the capabilities of the EPICC-Model, identify common issues and their potential causes across multiple models, and propose targeted improvements. The paper is structured as follows: Sect. 2 introduces the configuration schemes of the three models, emission data sources, the WRF-based meteorological forcing, and the evaluation of meteorological simulations. Section 3 presents the research results, including comparative analyses of the spatiotemporal distribution simulations of PM2.5 and O3, PM2.5 chemical composition analysis, assessments of the Air Quality Index (AQI) and pollution forecast accuracy, as well as comparisons of model performance in simulating persistent pollution events. Section 4 summarizes the key findings and discusses future directions for model improvements and prospects.
2.1 Overview of simulation domain, period, and CTM configurations
This study employed a two-level nested grid configuration with the model domain centered at (35° N, 105° E). The outer domain covers East Asia with a 45 km horizontal resolution (228×165 grid cells), while the inner domain focuses on China at a 15 km resolution (465×300 grid cells), starting from grid point (36, 39) within the outer domain. All analyses and results are derived from the inner domain simulations. The simulation period extends from 12:00 UTC on 14 December 2020–18:00 UTC on 31 December 2021, with the initial 17.25 d (until 18:00 UTC on 31 December 2020) dedicated to model spin-up.
To systematically evaluate the operational model configurations, this study employed consistent meteorological driving fields generated by the Weather Research and Forecasting (WRF) model and a harmonized multi-source emission inventory to drive year-long simulations using the EPICC-Model, CAMx, and CMAQ. The EPICC-Model is a three-dimensional tropospheric CTM developed in China with an independent modular framework (EPICC-Model Working Group, 2026a). Several major process-level routines and numerical algorithms were inherited or adapted from CAMx and CMAQ, whose foundational contributions are explicitly acknowledged. Building on these foundations, the EPICC development team designed a modular and plug-in architecture and independently integrated several specialized chemistry treatments, including sulfate formation, heterogeneous HONO production, and N2O5 hydrolysis. Although the EPICC-Model supports multiple interchangeable scientific options within its plug-in architecture, the present study evaluates a single operational configuration (Table 1) rather than performing intra-model comparisons of alternate process representations or numerical schemes. Such option-to-option assessments have been reported elsewhere (Wang et al., 2025; EPICC-Model Working Group, 2026a). Featuring highly modular architecture and parallel computing capabilities, it simulates key physical and chemical processes including emissions, transport, gas-phase and heterogeneous reactions, aerosol thermodynamics, and dry/wet deposition. CAMx (Ramboll, 2020) is a versatile photochemical grid model widely used for air quality scientific assessments and policy support. It follows the “one atmosphere” approach, accommodating pollution simulations from urban to regional scales (Emery et al., 2024). CMAQ (EPA, 2021) is a continuously evolving open-source modeling platform featuring an open architecture and multi-processor parallel computing capabilities. It efficiently simulates air pollution processes including O3, particulate matter, toxic pollutants, and acid deposition (EPA, 2021).
Table 1Key configuration schemes of the EPICC-Model, CMAQ, and CAMx.
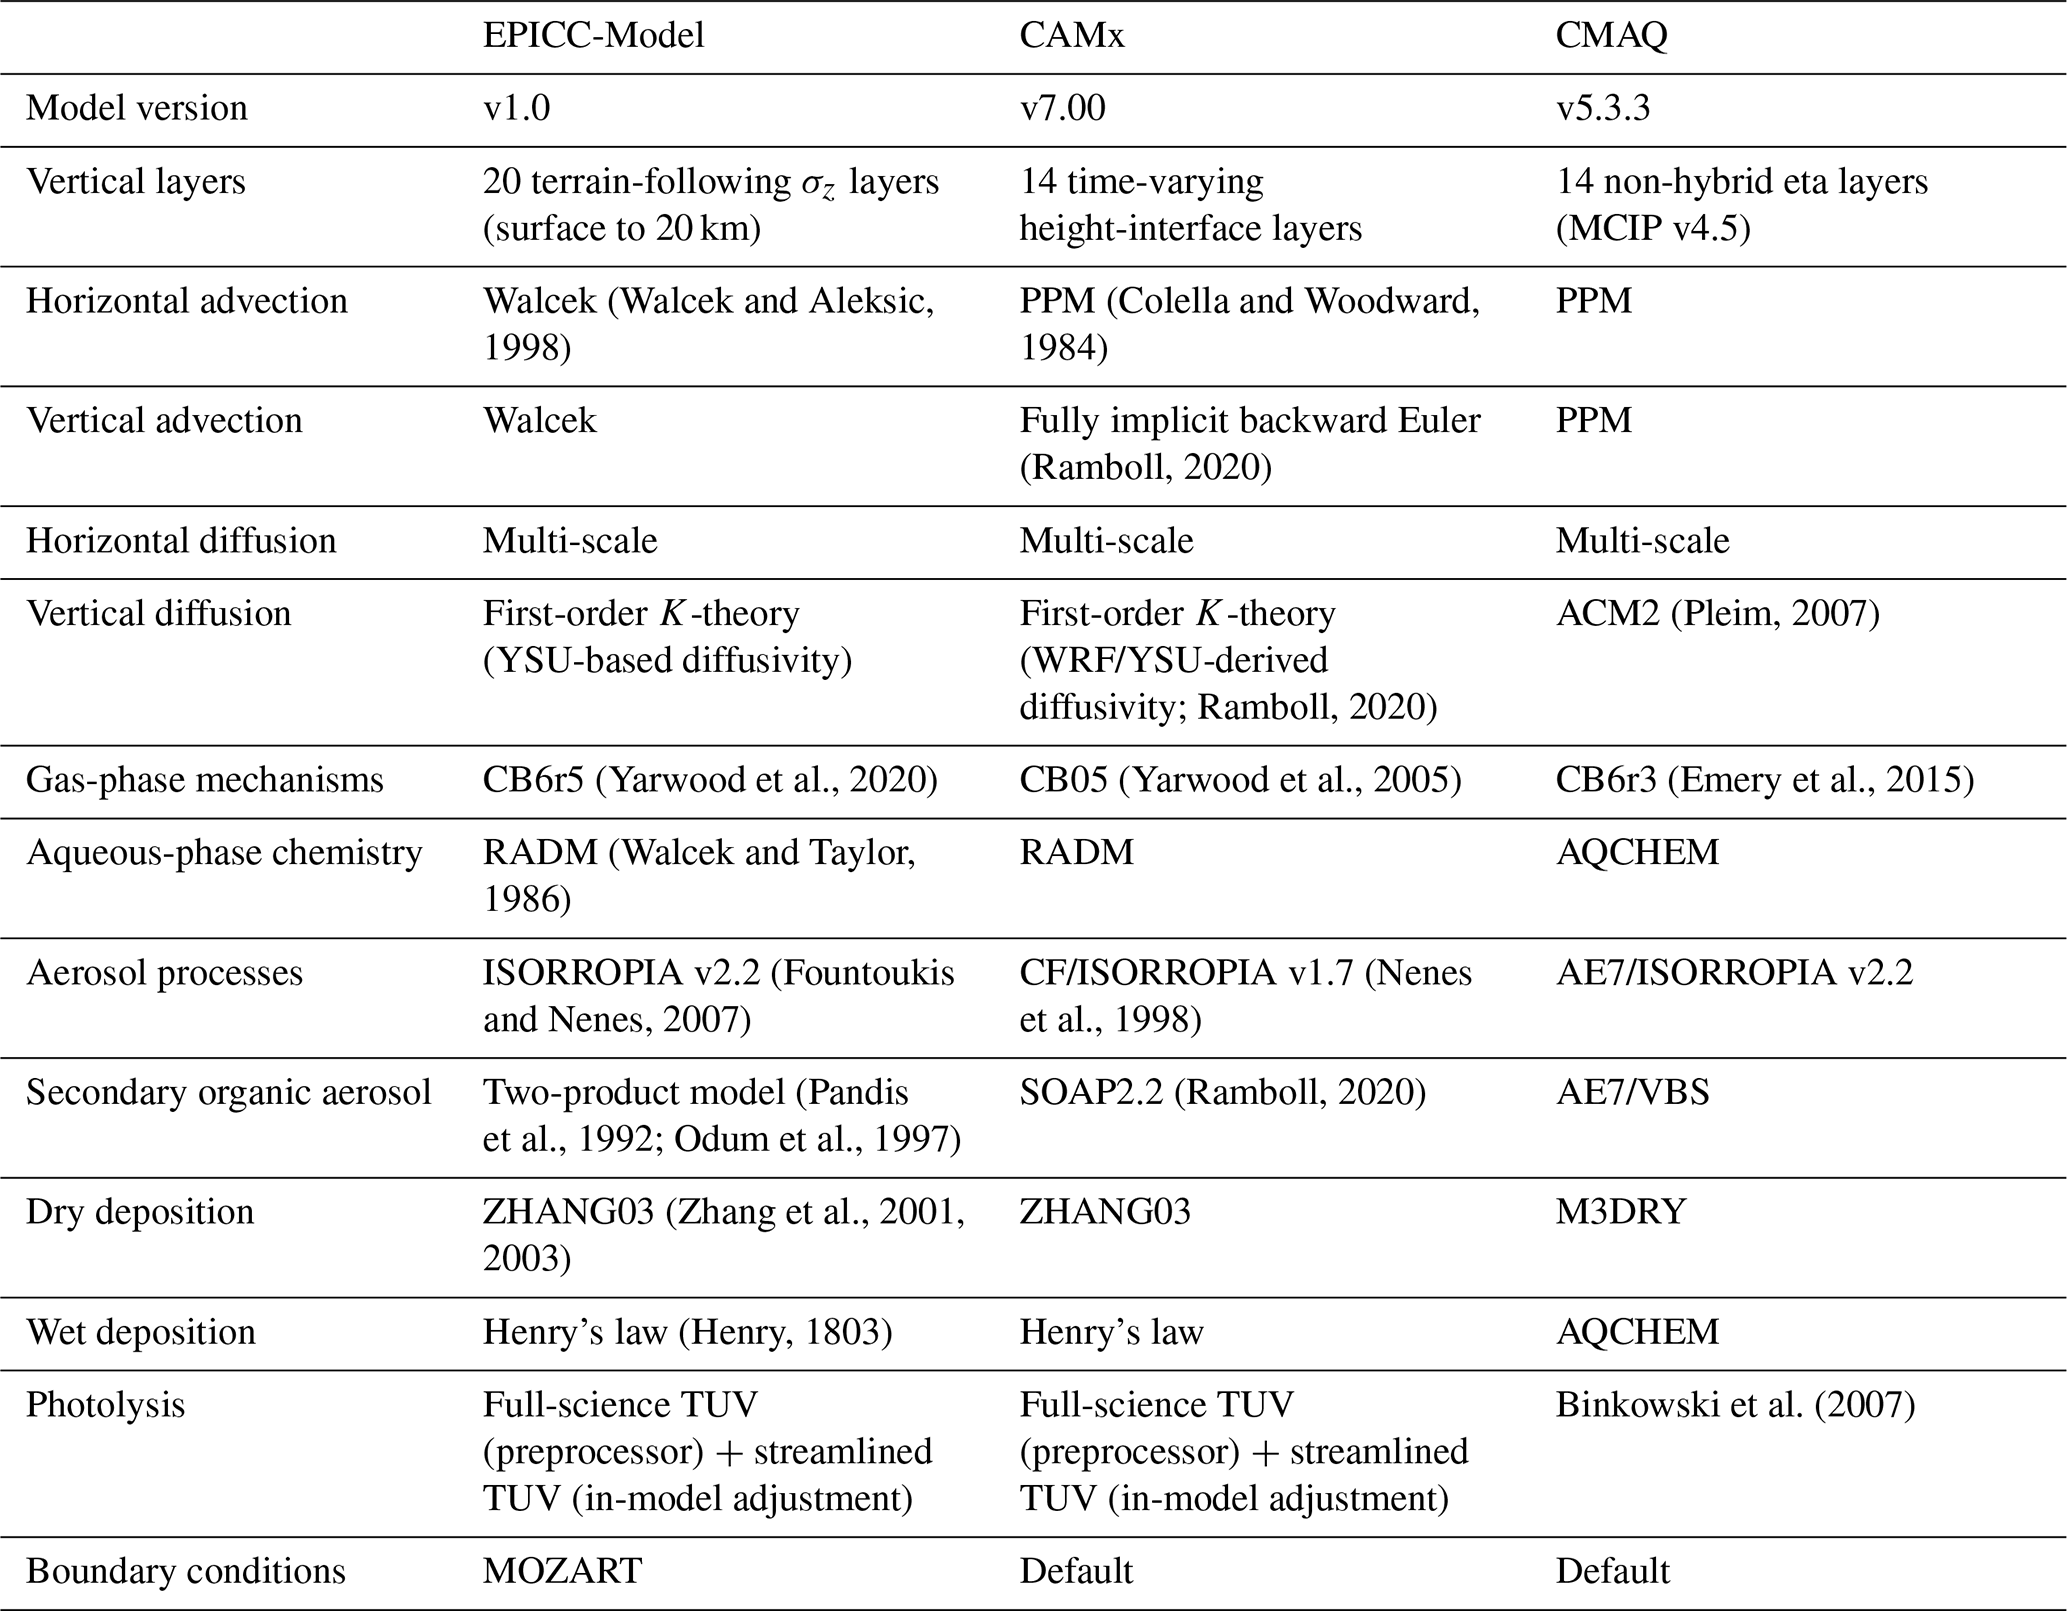
The key configuration parameters of the EPICC-Model, CAMx, and CMAQ are summarized in Table 1. In the operational configurations adopted in this study, the EPICC-Model employed 20 terrain-following normalized-height (σz) layers extending from the terrain surface to a fixed model top of 20 km, whereas CAMx and CMAQ were configured with 14 vertical layers. For CMAQ, MCIP v4.5 selected and collapsed layers from the original non-hybrid WRF-ARW terrain-following eta coordinate. For CAMx, WRFCAMx aggregated selected WRF layers and converted their full-level geopotential heights into time-varying physical layer-interface heights. The 14-layer configurations of CAMx and CMAQ used here reflect operational forecasting setups adopted for the study period, rather than a model-required or intrinsically coarser vertical capability; both models can be configured with finer vertical structures. For future controlled intercomparisons aimed at isolating process-level differences, harmonizing vertical and horizontal grid resolutions across models would be desirable. For three-dimensional transport, the EPICC-Model employed the Walcek scheme for both horizontal and vertical advection, and a first-order K-theory approach for vertical diffusion with diffusivities based on the YSU boundary-layer parameterization. CMAQ used the Piecewise Parabolic Method (PPM) for both horizontal and vertical advection and the Asymmetric Convective Model version 2 (ACM2) for vertical diffusion. WRF meteorological fields generated with the ACM2 scheme are commonly used in CMAQ applications to maintain consistency in boundary-layer treatment. CAMx used PPM for horizontal advection and a fully implicit backward Euler solver for vertical advection. Its vertical diffusion followed a first-order K-theory approach, with vertical diffusivities diagnosed from WRF meteorological fields based on the YSU parameterization. Thus, CAMx does not directly employ the complete online YSU scheme. In terms of chemical mechanisms, the EPICC-Model employed the CB6r5 gas-phase mechanism coupled with RADM aqueous-phase chemistry, allowing the representation of gas-aqueous reactions contributing to secondary organic aerosol (SOA) formation, particularly under high-humidity conditions where aqueous-phase reactions can influence SOA production (Yarwood et al., 2020). The CMAQ v5.3.3 configuration used in this study employed the CB6r3 mechanism in combination with the AE7/VBS module to represent SOA formation, and from version 5.2 onward, incorporated additional parameterizations such as Potential Combustion SOA (PCSOA) to compensate for combustion-related semivolatile organic compound (SVOC) and intermediate-volatility organic compound (IVOC) emissions not captured in current inventories (Murphy et al., 2017). Newer CMAQ versions include CB6r5 and its variants. CAMx used the CB05 gas-phase chemical mechanism coupled with the Secondary Organic Aerosol Partitioning (SOAP) module to parameterize SOA formation, simulating the oxidation of both anthropogenic and biogenic VOCs and their partitioning into the aerosol phase. The CB05 chemical mechanism adopted in CAMx has been widely applied in regional air quality simulations, providing a reasonable balance between chemical representation and computational efficiency. Although CAMx v7.00 also supports the more recent CB6r4 mechanism, CB05 was retained because this study aims to objectively evaluate the models using their actual operational forecasting configurations during the study period, rather than to compare or optimize chemical mechanisms. The operational use of CB05 also reflects the computational-efficiency and forecast-timeliness requirements of routine forecasting, and its applicability to regional CAMx simulations over China has been demonstrated in previous studies (Wen et al., 2021). For photolysis calculations, both the EPICC-Model and CAMx used the full Tropospheric Ultraviolet and Visible (TUV) radiative-transfer model as a preprocessor to generate photolysis-rate input files. A streamlined TUV module was then applied internally to adjust these rates for cloud and aerosol effects. Regarding boundary conditions, the EPICC-Model incorporated MOZART outputs as the initial and lateral background fields. Although CMAQ and CAMx also support the use of global model outputs, such as MOZART, to provide initial and lateral boundary conditions, simpler profile-based approaches were adopted for these two models to retain their operational configurations during the study period. Specifically, CMAQ boundary conditions were generated based on the CB6r3 profile file, and CAMx initial and boundary conditions were prepared using the icbcprep procedure with the corresponding profile configuration, which can be found in the Zenodo repository (https://doi.org/10.5281/zenodo.20843312, Lou and Wu, 2026). These initial and lateral boundary conditions were not harmonized across the three models, and their individual influence was not isolated through sensitivity simulations. Consequently, differences among the model results may reflect the combined effects of internal model formulations and initial and lateral boundary conditions, particularly for regional background concentrations and areas influenced by boundary inflow. Free-tropospheric LBCs may also influence surface O3 and PM2.5 away from the domain edges through rapid transport aloft and subsequent downward mixing (Mathur et al., 2017; Hogrefe et al., 2018; Zhang and Arunachalam, 2018). A comparison of O3 and PM2.5 near ∼2 km along the dominant inflow boundary was not performed, which limits diagnosis of LBC contributions in this surface-oriented evaluation. These differences in physical parameterizations, chemical mechanisms, and initial and lateral boundary conditions provide important context for interpreting the differences in PM2.5 and MDA8 O3 simulations among the three models.
2.2 WRF model configuration and meteorological simulation evaluation
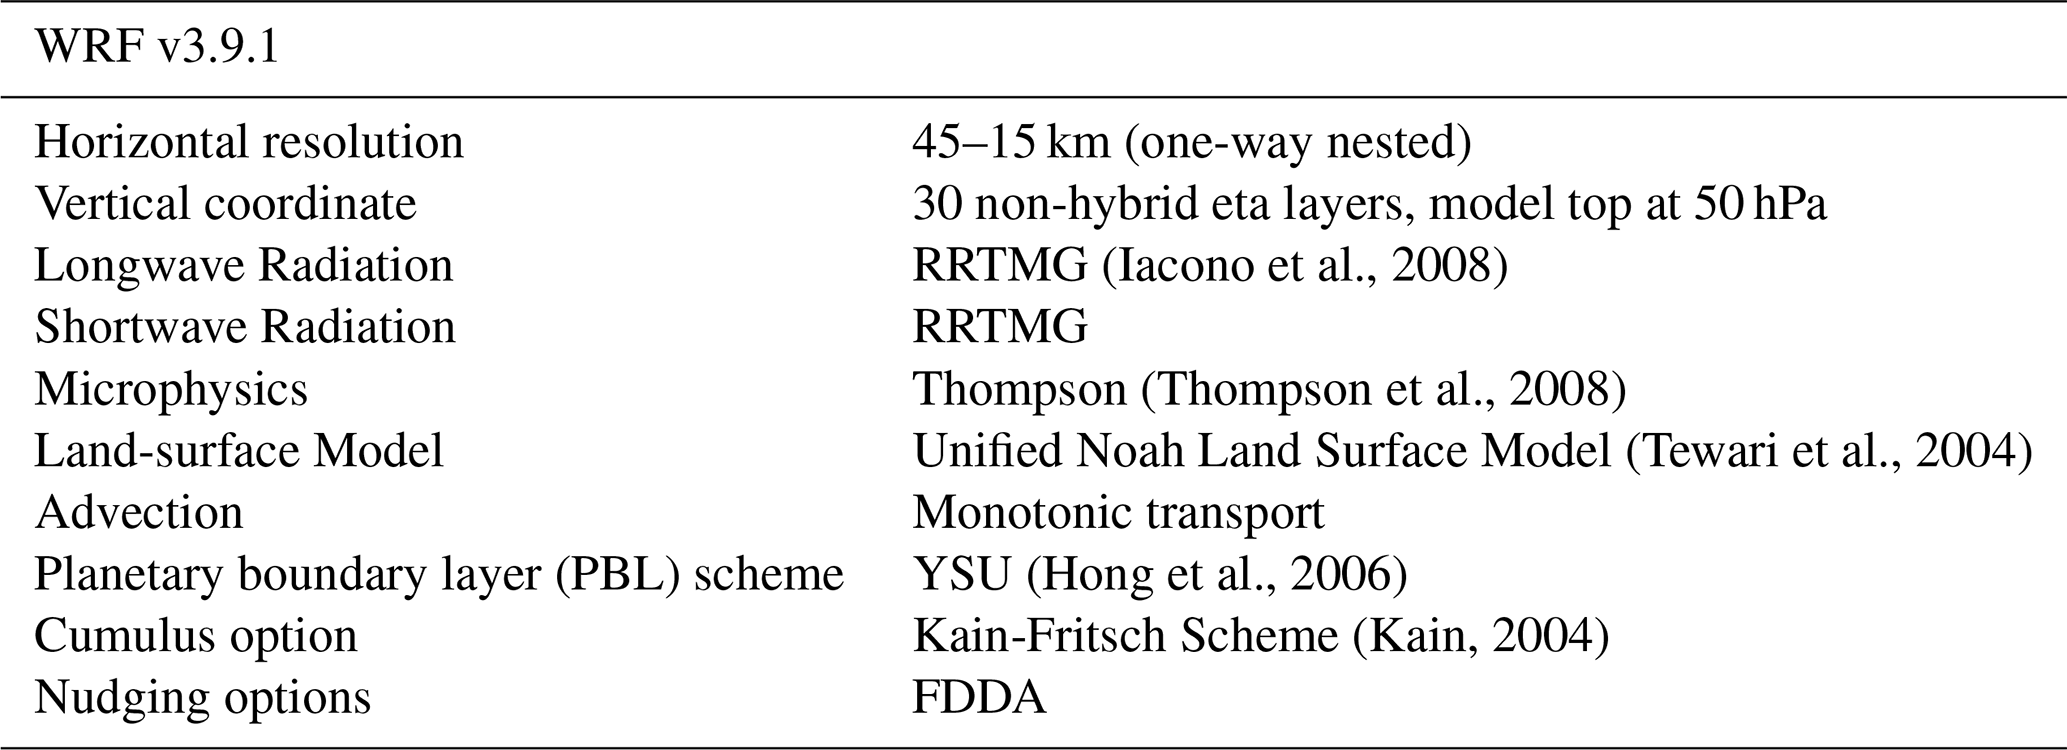
Key configuration parameters of the WRF model used in this study are summarized in Table 2. The simulations were conducted using WRF v3.9.1, with initial and boundary conditions derived from the National Centers for Environmental Prediction (NCEP) Final 1°×1° reanalysis data (FNL, ds083.2), featuring a temporal resolution of 6 h. To enhance the accuracy of the WRF simulations, four-dimensional data assimilation (FDDA) grid nudging was applied during the simulation. The WRF v3.9.1 simulation used the original non-hybrid terrain-following dry-hydrostatic-pressure eta coordinate, without the hybrid vertical coordinate option.
This study systematically evaluated the performance of the WRF model in simulating surface meteorological fields over mainland China for the year 2021, based on comprehensive observational data. The evaluation utilized daily observations from representative stations in 335 cities nationwide (excluding Jiayuguan and Wujiaqu due to data unavailability), covering key meteorological variables such as 2 m air temperature, 2 m relative humidity, 10 m wind speed, 10 m wind direction, precipitation, and surface pressure. To ensure seasonal representativeness, January, April, July, and October were selected to represent winter, spring, summer, and autumn, respectively, for comparative analysis (see Figs. S1–S24 in the Supplement for details, including the evaluation metrics).
The evaluation results indicated that the WRF model accurately captured the diurnal variations of key meteorological variables across most regions. For 2 m temperature simulations, the Pearson correlation coefficient (R) exceeded 0.7 in January and October, with the Root Mean Square Error (RMSE) below 5 °C and the Mean Bias (MB) constrained within ±2 °C in North, East, and South China. Simulations of 2 m relative humidity also performed well, with R values generally above 0.7 and RMSE below 15 % in April and July; MB values in East and South China were less than ±9 %. However, relatively large humidity biases were observed in parts of Southwest and Northwest China, where MB in the southwest exceeded 15 % and RMSE surpassed 17 %. Previous studies suggest that simulations can be considered reliable when R≥0.6–0.7, RMSE for temperature ≤5 °C, and RMSE for humidity <15 % (Lou et al., 2025; Oyegbile et al., 2024). Therefore, the WRF model used in this study demonstrated adequacy in simulating temperature and humidity. Simulations of 10 m wind speed showed consistent performance, with R exceeding 0.7 and RMSE below 8 m s−1 in most regions. Nevertheless, systematic overestimations were observed in the Sichuan Basin, Xinjiang, and parts of Tibet. Although the wind speed RMSE exceeds typical values reported in some studies (4–6 m s−1), it remains within an acceptable range given the seasonal variability at the national scale (Xu et al., 2020; Yu et al., 2022b). In contrast, the performance for 10 m wind direction was relatively poor, with R values below 0.4 in most areas, except for moderate improvement in the Beijing-Tianjin-Hebei region, East China, Central China, and South China. This finding aligns with previous research noting WRF's general limitations in reproducing wind direction (Jiménez and Dudhia, 2013). For precipitation, correlation coefficients were generally above 0.4 nationwide. However, substantial errors were observed in parts of Southwest, Northwest, and South China, especially in regions with complex terrain, consistent with previous findings (Yu et al., 2022a). Surface pressure simulations exhibited high consistency, with R values exceeding 0.7 across the country. While parts of Southwest and Central China exhibited slight underestimation (MB<20 hPa), likely associated with unresolved terrain altitude differences at the model resolution, surface pressure was slightly overestimated in Guizhou and Chongqing. Overall, the WRF model provided adequate meteorological forcing fields for CTMs.
2.3 Emission inventory and observational data sources
The anthropogenic emissions data used in this study for China were derived from the Multi-resolution Emission Inventory for China (MEIC) developed by Tsinghua University, with a base year of 2019 (Geng et al., 2024). This inventory includes major source sectors such as transportation, industry, power generation, and residential combustion, and covers multiple pollutants including CO, SO2, NOx, VOCs, PM10, PM2.5, black carbon (BC), and organic carbon (OC). Emissions of ammonia over China were obtained from the PKU-NH3 inventory (Huang et al., 2012a; Kang et al., 2016), while emissions from biomass burning are taken from the “China Open Biomass Burning Emissions Inventory” with a base year of 2017 (Huang et al., 2012b; Song et al., 2009). The Emissions Database for Global Atmospheric Research (EDGAR) v5.0 dataset (Crippa et al., 2020), with a base year of 2015 and a spatial resolution of 0.1°×0.1°, was used to represent anthropogenic emissions outside China. Biogenic emissions were simulated online using the Model of Emissions of Gases and Aerosols from Nature (MEGAN) v3.2 model (Guenther et al., 2012). It should be noted that although the base years of the emission inventories do not match the simulation year of this study, the use of inventories from adjacent years remains a common practice in regional air quality modeling, especially in the absence of globally consistent, high-resolution, multi-sector emission datasets for the target year. Under the assumption of no substantial changes in regional climate and socioeconomic activities, such inventories can reasonably represent the emission patterns of the study period (Amnuaylojaroen et al., 2014; Huang et al., 2023; Wang et al., 2023). It is important to clarify that no projection or temporal adjustment of the individual emission inventory data to the 2021 simulation year was performed.
All surface observational data used in this study were obtained from the China National Environmental Monitoring Centre (CNEMC), including hourly PM2.5 and O3 concentrations from 1644 national monitoring stations across China in 2021 (station distribution shown in Fig. S25 in the Supplement). Based on these data, daily average PM2.5 concentrations and MDA8 O3 values were calculated for 337 cities. Additionally, aerosol chemical composition data were obtained from the same source for ten representative cities: Beijing (116.41° E, 40.04° N), Tianjin (117.21° E, 39.17° N), Zhengzhou (113.73° E, 34.77° N), Jinan (117.06° E, 36.66° N), Shanghai (121.53° E, 31.23° N), Nanjing (118.76° E, 32.07° N), Wuhan (114.37° E, 30.54° N), Fuzhou (119.31° E, 26.10° N), Chengdu (104.09° E, 30.64° N), and Chongqing (106.47° E, 29.62° N).
3.1 Spatiotemporal distribution and statistical analysis of daily averages
Figure 1 presents the performance of the EPICC-Model, CAMx, and CMAQ in simulating annual PM2.5 concentrations, evaluated against observations from 1644 national monitoring stations across China. Based on the time series analysis (Fig. 1a), the year can be divided into three distinct phases. Phase I (January–mid-May): During this period, both the EPICC-Model and CAMx significantly underestimated PM2.5 concentrations and failed to capture the three major pollution episodes at the beginning of the year, as indicated by the circles in the figure (with biases ranging from 25 to 52 µg m−3). In contrast, CMAQ showed improved performance in capturing both the timing and intensity of pollution peaks. This was primarily attributed to its substantially higher simulated OC levels relative to the other models and observations, which produced a compensatory effect on total PM2.5 (Fig. 6). In addition, CMAQ exhibited intermittent overestimations during several periods, which may partly reflect the sensitivity of near-surface PM2.5 concentrations to the treatment of minimum vertical eddy diffusivity (Kz_min) in ACM2, as indicated by previous CMAQ sensitivity experiments over China (Kim et al., 2024). The contrasting pattern within the rectangular box was attributed to a dust event. Phase II (mid-May–mid-October): During this period, PM2.5 concentrations were generally low and exhibited limited variability. This was primarily attributed to elevated planetary boundary layer heights, enhanced turbulent mixing, and frequent precipitation events during the summer, which collectively facilitated the dilution and wet deposition of near-surface particulate matter. CAMx performed best in this phase. In contrast, both the EPICC-Model and CMAQ tended to overpredict pollutant levels, with CMAQ exhibiting a notably stronger positive bias. Phase III (mid-October–December): During the heating season, observed PM2.5 levels increased significantly, accompanied by greater spatiotemporal variability. CAMx maintained relatively good agreement with the observations, whereas the positive bias of CMAQ became more pronounced. The component evaluation in Fig. 6 indicates that the substantially elevated OC concentration simulated by CMAQ was the most likely dominant contributor to this PM2.5 overestimation, while differences in vertical mixing may have additionally influenced near-surface pollutant accumulation. The performance of the EPICC-Model was intermediate between the two.
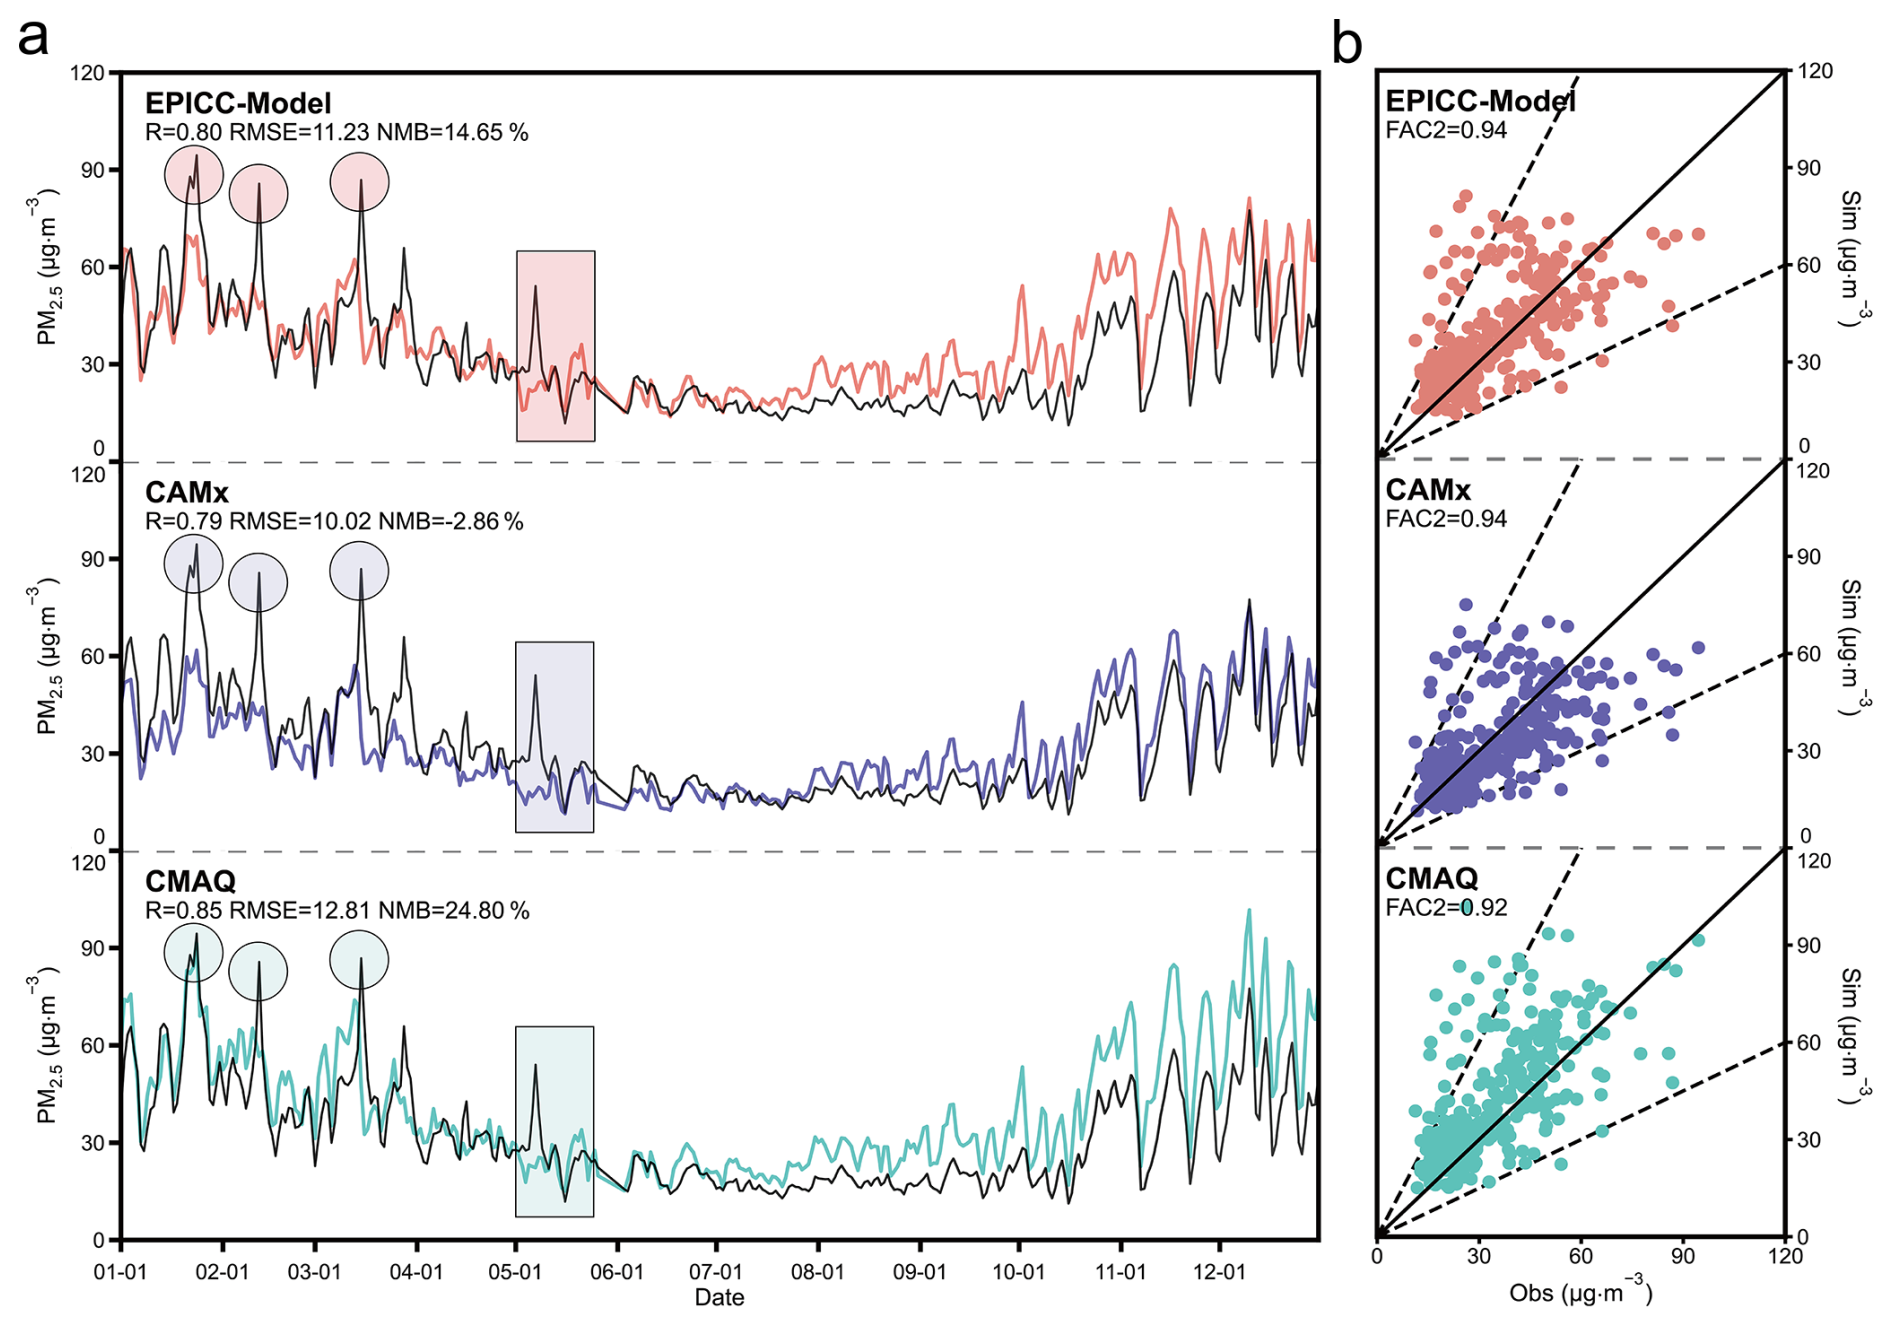
Figure 1Comparison of simulated and observed daily PM2.5 concentrations (i.e. daily mean PM2.5concentrations) across China in 2021. (a) shows the time series of daily PM2.5, with the black line representing observations from 1644 national air quality monitoring stations and colored lines indicating different CTMs. (b) presents scatter plots of modeled vs. observed PM2.5. All model outputs exclude dust aerosol contributions to isolate secondary particulate formation processes.
Statistical validation analysis (Fig. 1b) further corroborated the above findings. Although CMAQ exhibited the highest correlation coefficient (R=0.85), most of its data points lay above the 1:1 reference line, indicating a systematic overestimation. CAMx demonstrated the best overall statistical performance, with a Fraction of Predictions Within a Factor of Two (FAC2) value of 0.94 and a Normalized Mean Bias (NMB) of merely −2.86 %. It is important to note that CAMx struggled to capture severe pollution episodes, markedly underestimating periods of high concentrations, which constrains its usefulness for evaluating pollution processes. In contrast, the EPICC-Model exhibited a more pronounced seasonal response. Its simulations during spring and summer are more consistent with CAMx, indicating similar performance under the generally lower ambient PM2.5 concentrations during these seasons, particularly in summer when enhanced boundary-layer ventilation and more frequent precipitation favor pollutant dilution and wet removal. During the autumn and winter pollution seasons, its simulation trends aligned more closely with CMAQ, capturing pollution accumulation processes more effectively. At the national aggregate scale represented in Fig. 1, the EPICC-Model reproduced the seasonal transition of PM2.5 concentrations and responded to high-concentration pollution episodes while maintaining reasonably strong annual statistical performance.
Figure 2 presents the performance of the EPICC-Model, CAMx, and CMAQ in simulating MDA8 O3 concentrations, evaluated against observations from 1644 national monitoring stations across China. Observational data reveal a typical photochemically-driven seasonal pattern in O3 concentrations: summer months exhibit peak levels due to enhanced VOC-NOx chain reactions under intense solar radiation and elevated temperatures (Seinfeld and Pandis, 2016; Sillman, 1999), while O3 concentrations remain relatively low during the colder months because weaker solar radiation suppresses photolysis and lower temperatures reduce thermochemical reaction rates, collectively weakening photochemical activity (Wang et al., 2019). The time series analysis (Fig. 2a) showed that all three models reasonably reproduced the seasonal variation of O3 concentrations, yet notable differences emerged across concentration levels. The EPICC-Model performed particularly well during high-concentration episodes, effectively capturing the peak levels of O3 pollution. In contrast, both CAMx and CMAQ, while capable of reproducing high-concentration trends, systematically underestimated peak magnitudes with maximum negative biases reaching −20 µg m−3. The improved representation of high-O3 episodes by the EPICC-Model may be partly related to its inclusion of heterogeneous HONO formation and particulate nitrate photolysis, which can enhance radical production and O3 formation in inland China (Bao et al., 2018; Zhang et al., 2022; Li et al., 2024). Recent EPICC-specific sensitivity and source-diagnosis studies further demonstrate that these HONO pathways, including particulate nitrate photolysis, contribute to simulated HONO and O3 formation and improve the representation of O3 over China (Zhang et al., 2025; EPICC-Model Working Group, 2026a). At lower O3 concentration levels, CMAQ reproduced the general temporal variation but exhibited a systematic positive bias, which may reflect the combined influence of vertical redistribution and photochemical production.
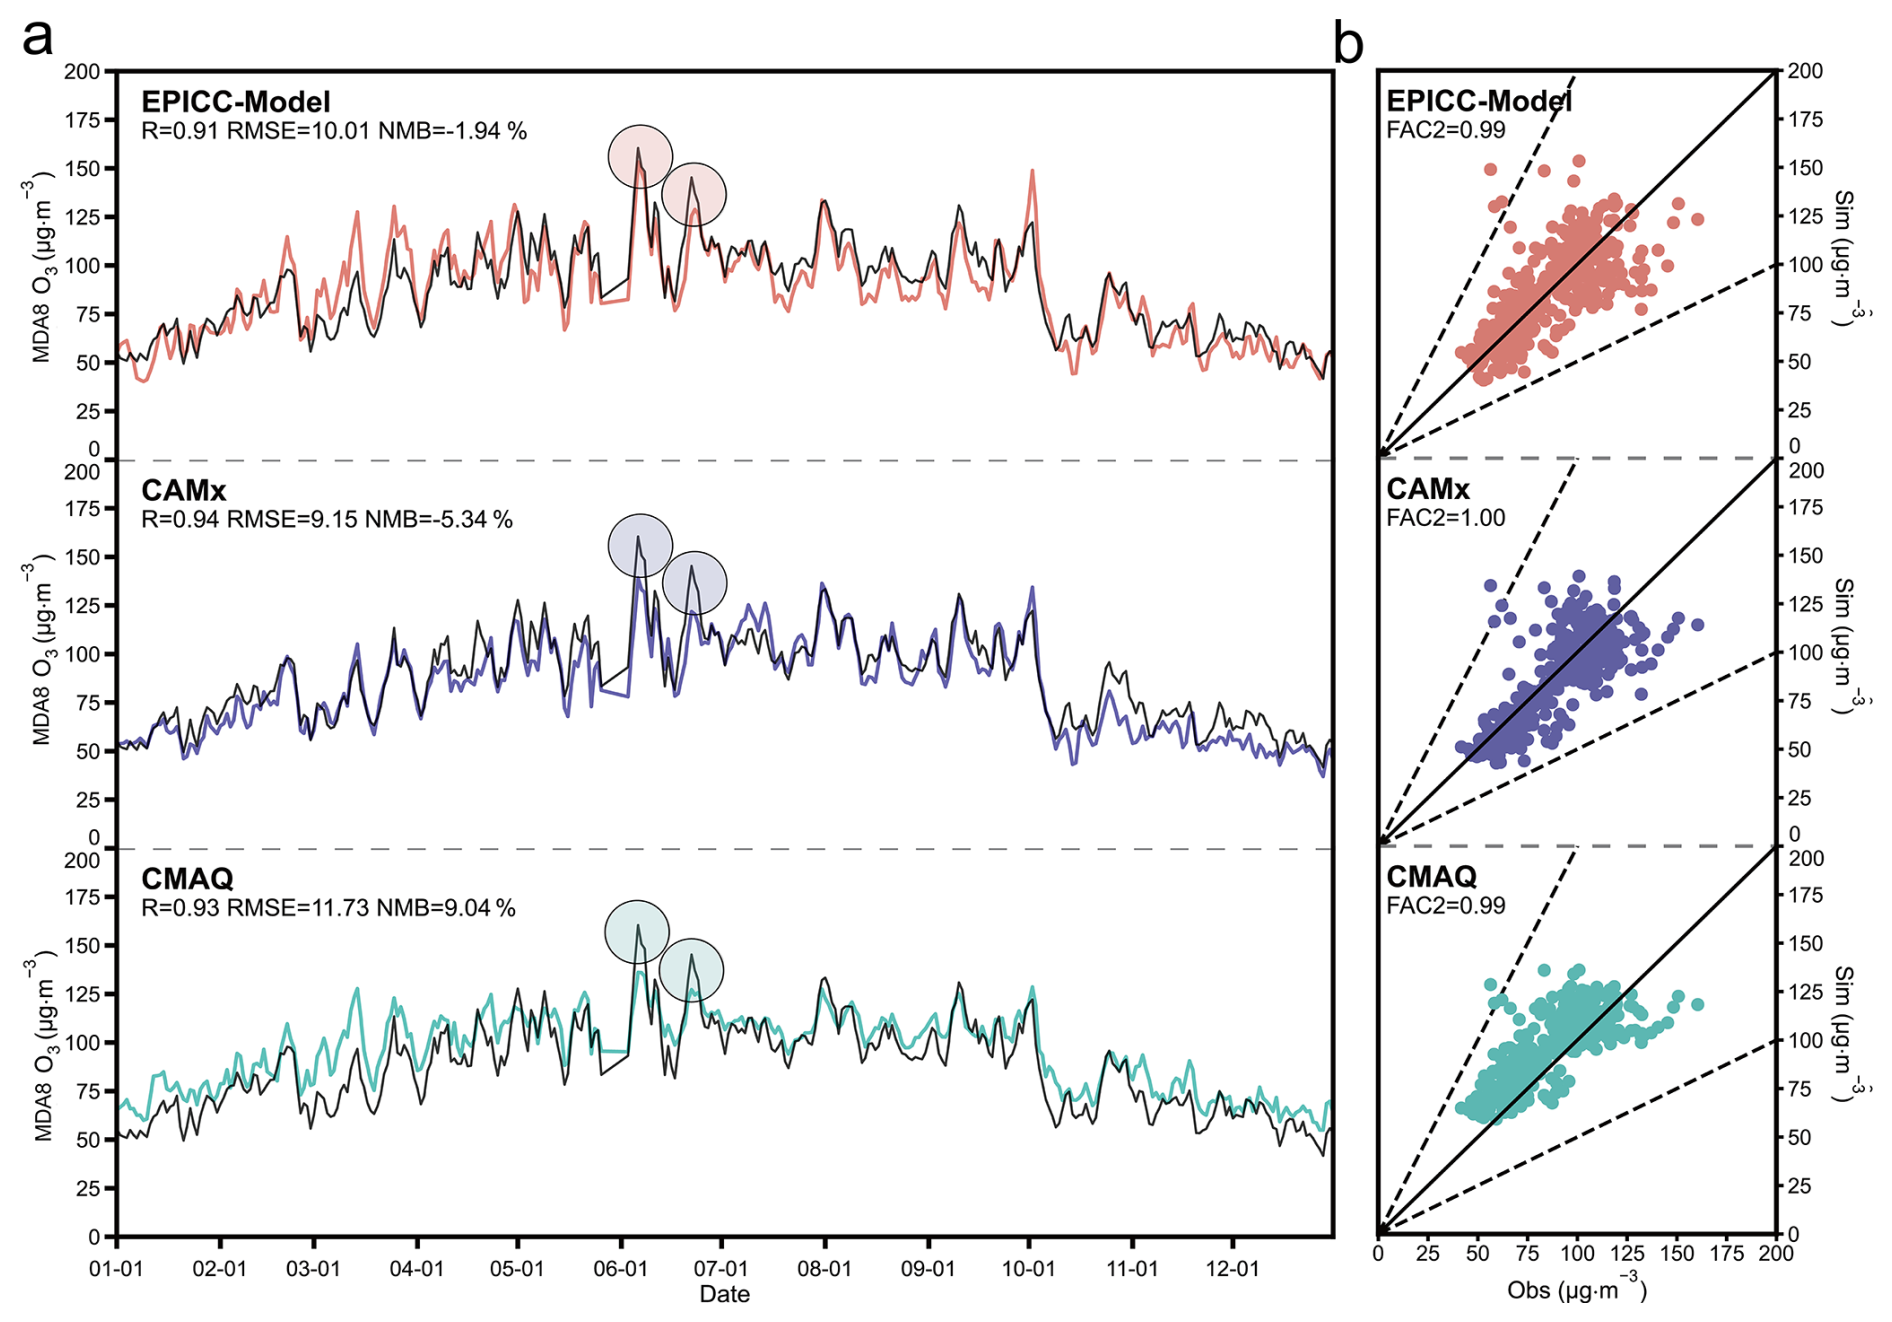
Figure 2Comparison of simulated and observed daily MDA8 O3 concentrations across China in 2021.
Statistical analysis indicated that CAMx achieved the highest temporal correlation (R=0.94) and the lowest RMSE (9.15 µg m−3), while exhibiting a modest negative mean bias ( %). CMAQ showed a slight overestimation throughout the year but maintained a strong temporal correlation (R=0.93), demonstrating good capability in capturing temporal variations. Notably, the EPICC-Model not only accurately captured peak concentrations but also achieved the lowest annual NMB, reflecting a more robust performance overall. The scatterplots in Fig. 2b showed that all three models had FAC2 values close to 1, indicating comparable overall performance. The models nevertheless exhibited different statistical characteristics: CMAQ tended to overestimate MDA8 O3, CAMx achieved the highest correlation and lowest RMSE despite a modest negative bias, and the EPICC-Model had the smallest absolute NMB.
Figure 3 compares the simulated spatial distributions of PM2.5 for the four seasons of 2021 produced by the EPICC-Model, CAMx, and CMAQ, revealing notable differences in regional simulation consistency and bias characteristics among the three models. As shown in Table 3, the IOA values vary across models and seasons, exhibiting clear seasonal patterns that quantitatively support the spatial distribution differences.
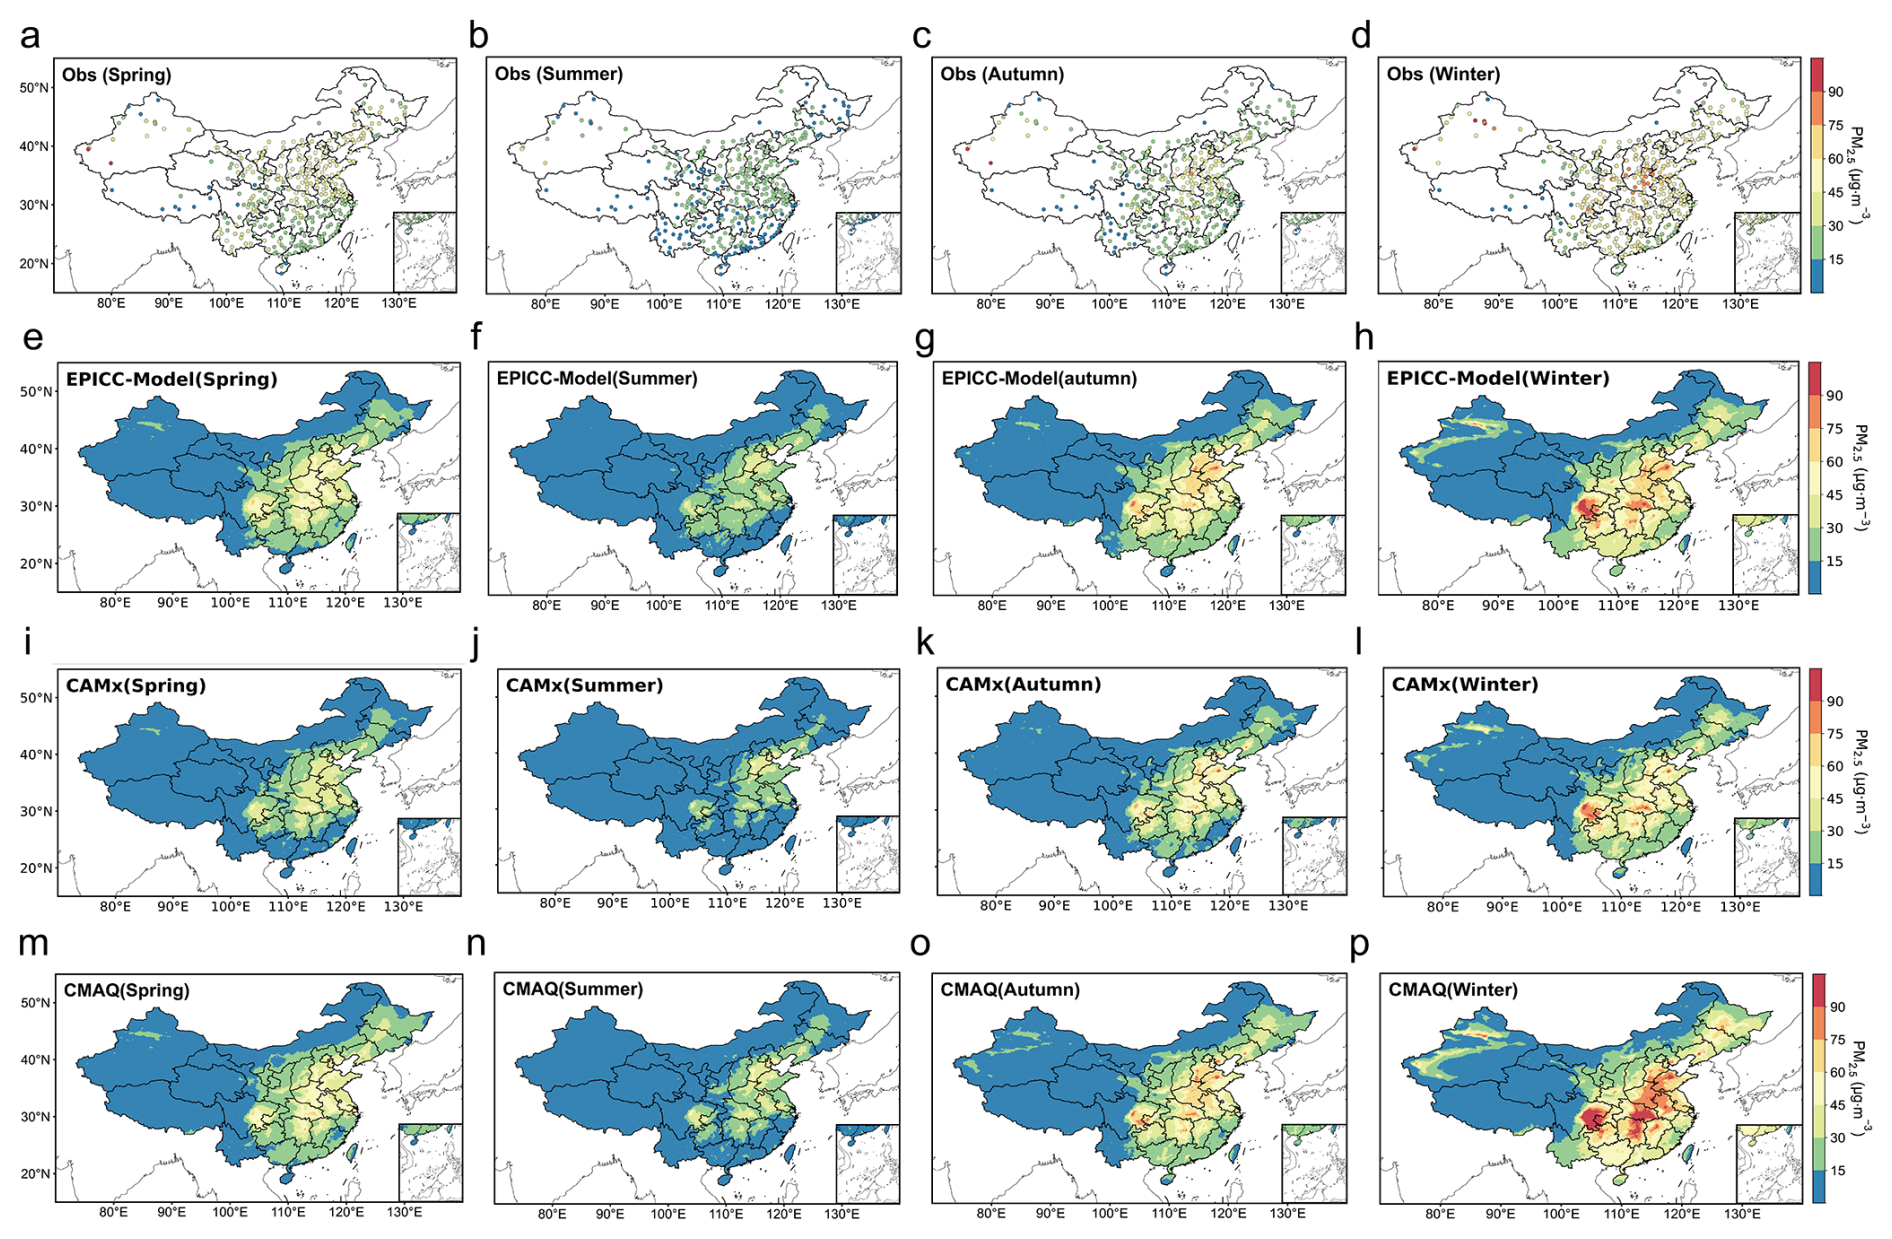
Figure 3Seasonal spatial distributions of simulated PM2.5 concentrations, with spring (March–May), summer (June–August), autumn (September–November), and winter (December–February).
Table 3IOA for the spatial distribution of PM2.5 simulated by different models.
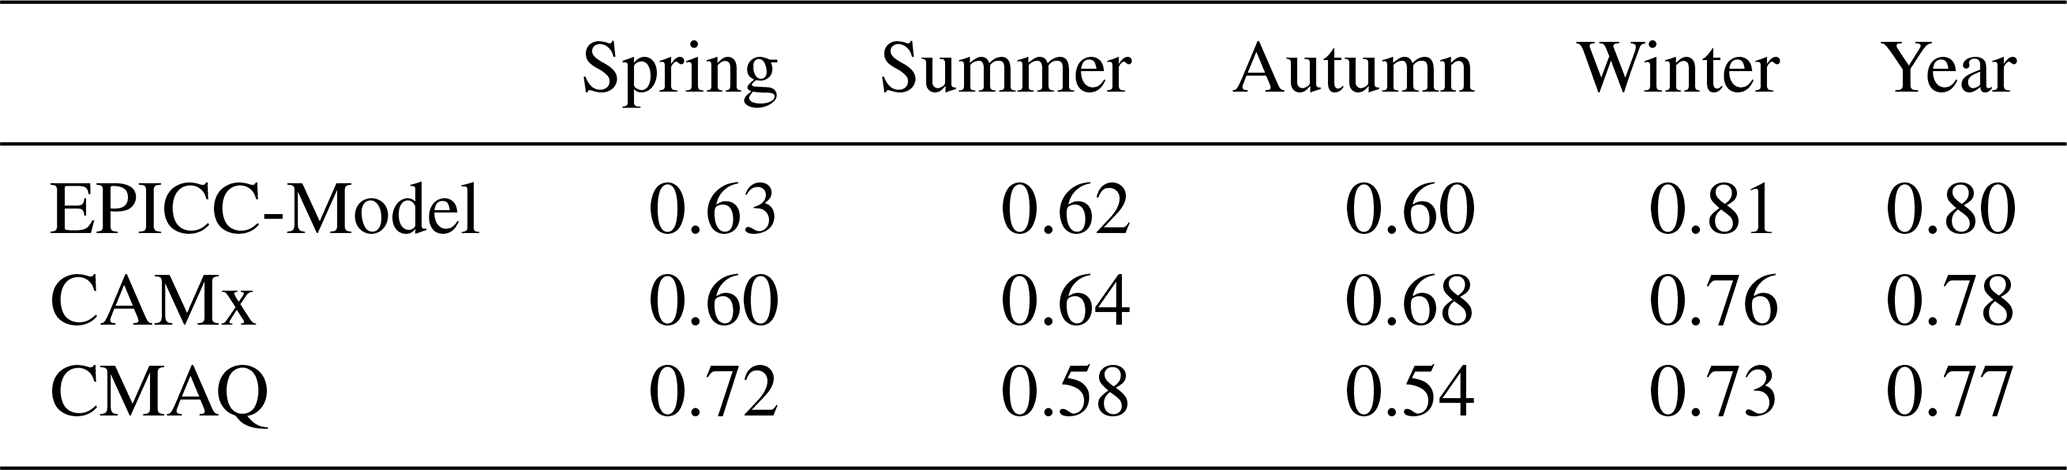
In spring, elevated PM2.5 concentrations were observed in several geographically separated regions, including North China, the arid basins of Northwest China, and the Sichuan Basin. This spatial pattern reflects the combined influences of northwesterly dust transport, local anthropogenic emissions, and pollutant accumulation under relatively limited ventilation in basin regions. All three models effectively reproduced the pollution pattern, with IOA values exceeding 0.60, and CMAQ achieved the highest IOA of 0.72. Since dust concentrations were excluded from the particulate matter assessment in this study, all three models consistently underestimated PM2.5 levels in the arid Northwest and southwestern plateau regions. In summer, influenced by the southeastern monsoon and intensive precipitation, PM2.5 remained generally low across China with reduced regional variability. The three models exhibited similar spatial consistency nationwide, with IOA values ranging between 0.58–0.64. However, in the high-humidity coastal regions of South China, the EPICC-Model and CMAQ demonstrated slight advantages over CAMx in simulation accuracy. In autumn, the nationwide PM2.5 concentrations rebounded due to an increase in stagnant weather conditions and a reduced boundary layer height. All three models showed varying degrees of overestimation in North China and the Sichuan Basin, likely related to ACM2/YSU schemes underestimating mixing layer height and weakening vertical diffusion at night (Jia et al., 2023). During this period, CAMx achieved the highest IOA value of 0.68, the EPICC-Model scored 0.60, while CMAQ dropped to its annual minimum of 0.54. In winter, PM2.5 concentrations reached their annual peak driven by low temperatures, temperature inversions, subsidence, and heating emissions. All three models successfully reproduced the pollution patterns in polluted regions like North and Central China. The EPICC-Model demonstrated exceptional performance with an IOA of 0.81, while CMAQ and CAMx maintained strong consistency at 0.73 and 0.76, respectively. However, all models unrealistically simulated higher PM2.5 concentrations in the Sichuan Basin compared to Henan Province. This discrepancy may have resulted from differences in emission estimates between the two regions: anthropogenic emissions in the Sichuan Basin are likely overestimated in the models, whereas frequent agricultural activities in Henan may lead to underestimation of NH3 emissions, thereby suppressing nitrate aerosol formation. Previous studies have demonstrated that spatial errors in NH3 emissions significantly impact nitrate-driven heavy pollution events (Kang et al., 2016; Kong et al., 2019; Liu et al., 2021).
Overall, all three models reliably simulated PM2.5 spatial distributions, with annual mean IOA values above 0.77. The EPICC-Model performed best (IOA=0.80), showing highest consistency in winter and heavily polluted North China. CAMx showed consistent performance (IOA=0.78) and was suitable for multi-seasonal averages but underestimated high-humidity regions and responded weakly to severe pollution. CMAQ showed slightly lower consistency (IOA=0.77), performed better in spring and winter, declined in summer and autumn, and exhibited a general positive bias, particularly in winter.
Figure 4 shows the seasonal spatial distribution of MDA8 O3 in 2021 from the three models. Given the strong seasonal variability of O3, model performance was quantitatively evaluated using the IOA metric, with detailed results provided in Table 4.
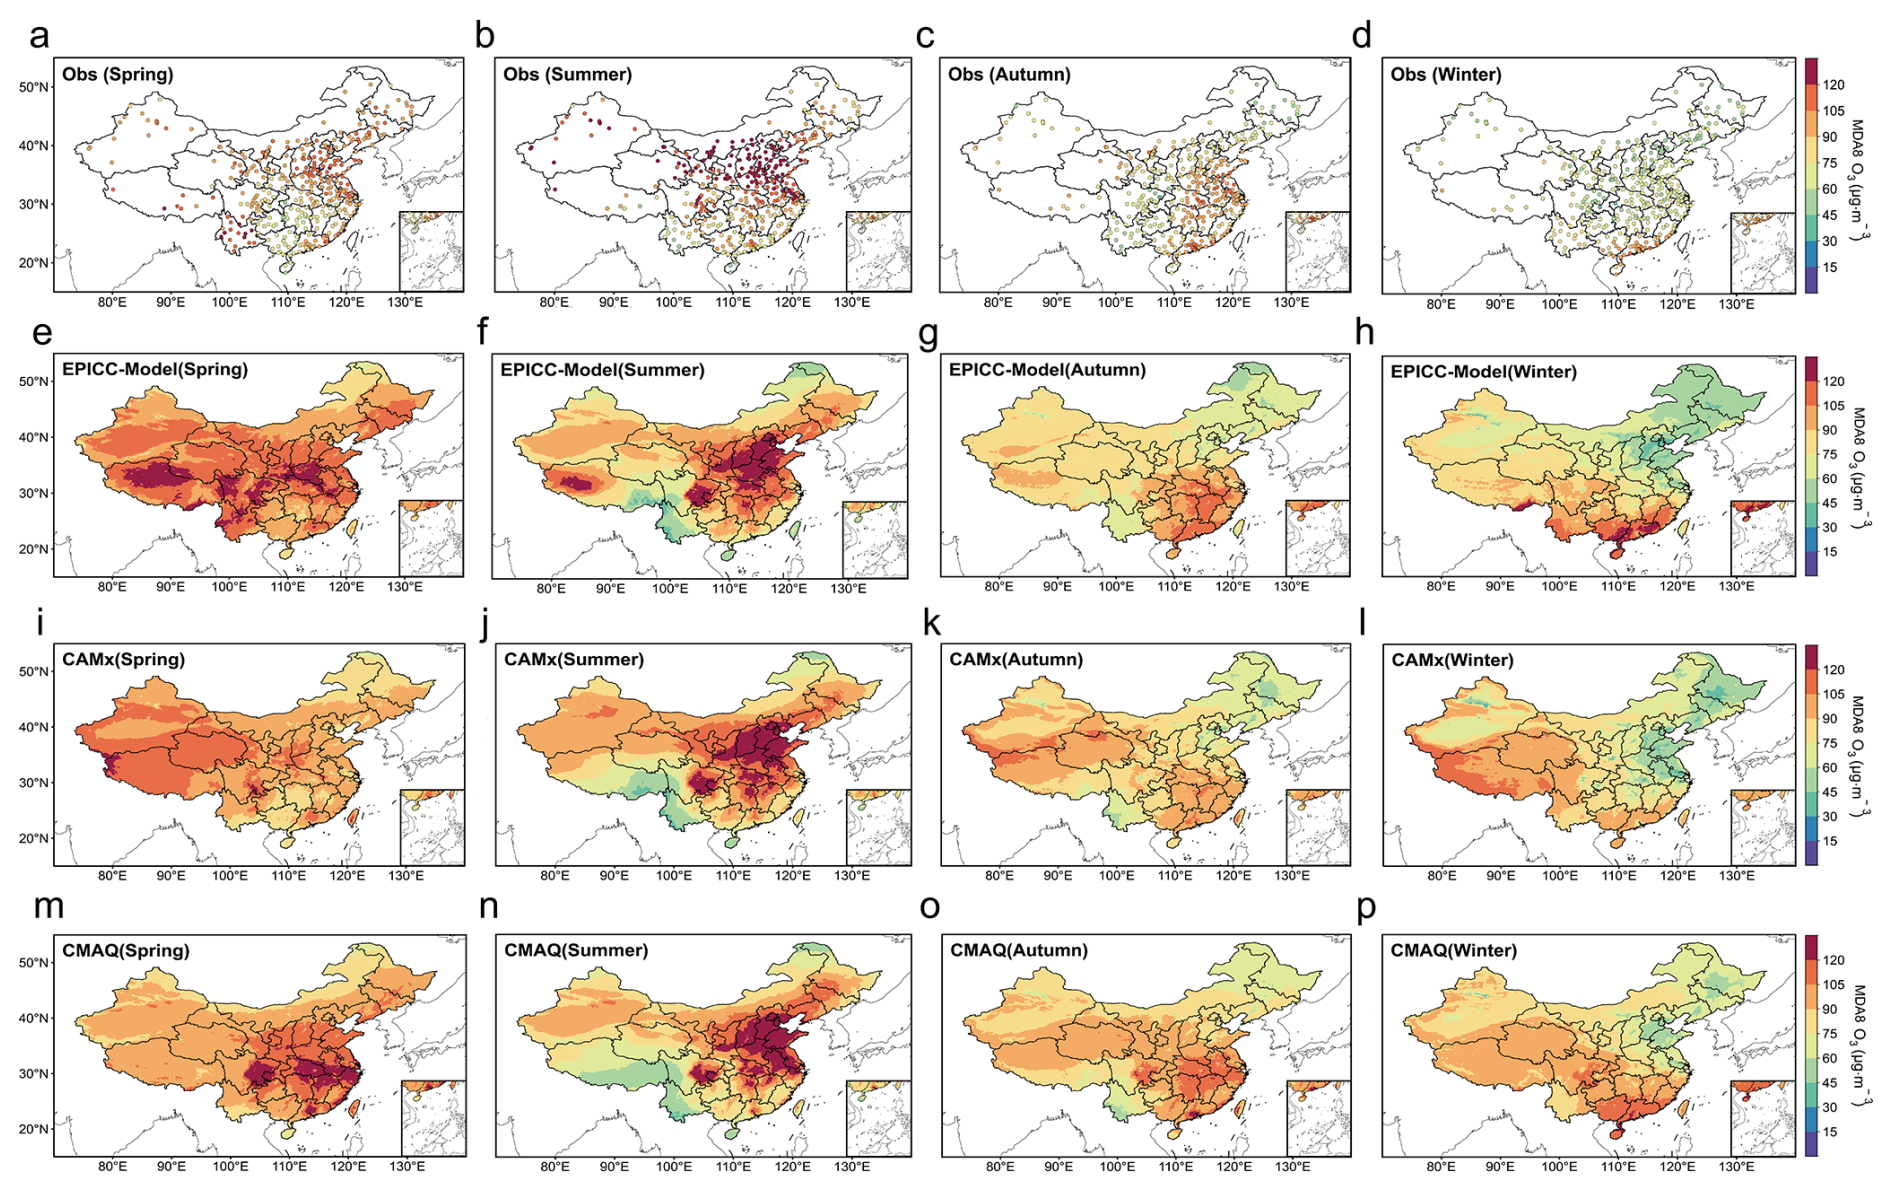
Figure 4Seasonal spatial distributions of simulated MDA8 O3 concentrations, with spring (March–May), summer (June–August), autumn (September–November), and winter (December–February).
Table 4IOA for the spatial distribution of MDA8 O3 simulated by different models.
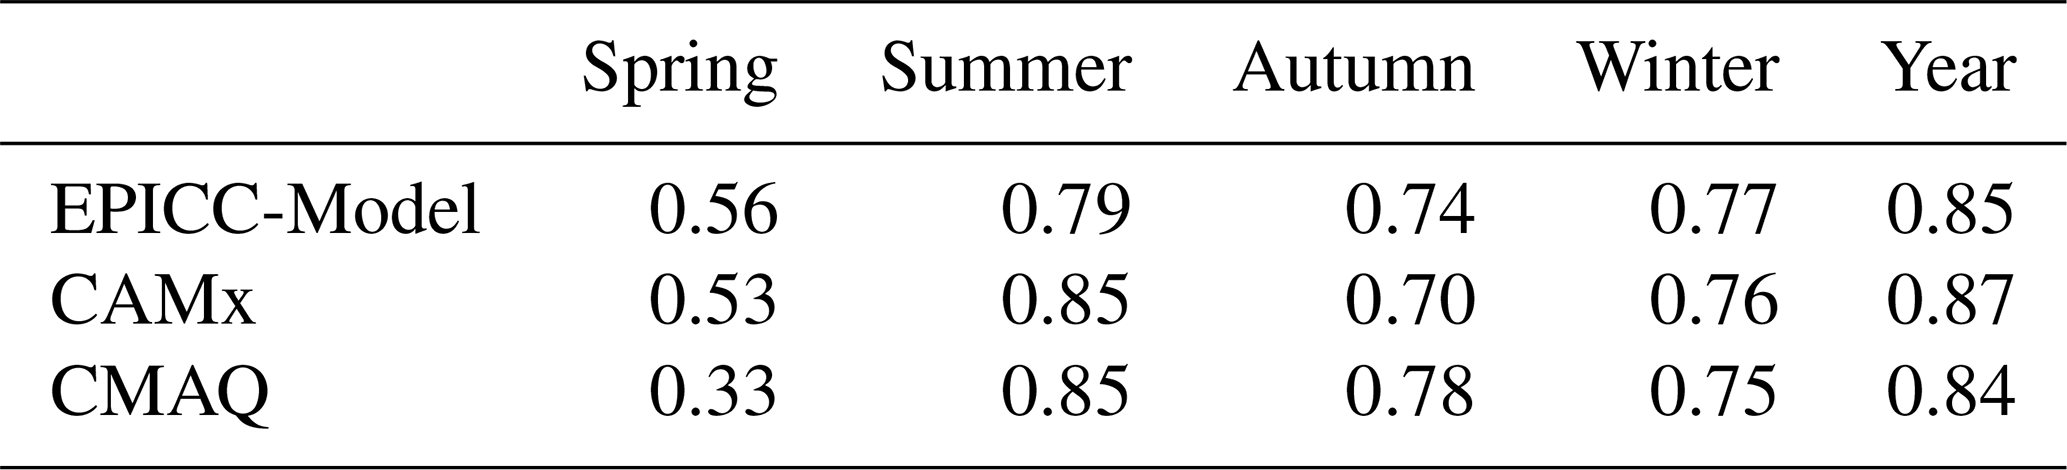
In spring, O3 pollution exhibited a multi-centered and scattered distribution pattern. The EPICC-Model reproduced this pattern well (IOA=0.56) and outperformed CAMx and CMAQ, particularly in the high-concentration areas like Yunnan. CAMx generally underestimated O3 across China, which may reflect the combined effects of its gas-phase chemistry and representation of vertical transport (Ren et al., 2022; Tang et al., 2011). CMAQ, in contrast, produced an unrealistic high-O3 belt over the Yangtze River plain with a much lower IOA of 0.33. In summer, a high O3 concentration belt formed over the mid-latitudes (30–40° N), and all three models successfully reproduced the enhanced O3 levels with the highest spatial consistency observed throughout the year. The summer IOA values for the EPICC-Model, CAMx, and CMAQ reached 0.79, 0.85, and 0.85, respectively. All three models were driven by meteorological inputs derived from the same WRF simulation but processed for their respective vertical structures. The simulated summer O3 distributions therefore reflected the combined influences of regional photochemistry, meteorological transport, and lateral boundary conditions (Li et al., 2019a). In autumn, nation-wide O3 declined as solar radiation weakened, with pollution centers shifted to eastern and southeastern coasts. All three models performed similarly (IOA 0.70–0.78). CMAQ performed best in the Pearl River Delta, accurately reproducing localized high concentrations, as supported by previous studies (Jiang et al., 2010; Wang et al., 2010). The EPICC-Model ranked second with slight overestimation in northern Jiangxi, and CAMx continued to underestimate O3. In winter, nationwide O3 concentrations decreased to their annual minimum, and the relative seasonal concentration maximum shifted toward southern coastal China. This redistribution reflects weaker photochemical production and stronger NO titration over northern China, whereas comparatively stronger solar radiation sustains greater photochemical activity in the south. All models performed steadily (IOA 0.75–0.77). The EPICC-Model reproduced the relative O3 maximum over the southern coastal region, whereas CAMx displaced it farther southwest. CMAQ reproduced O3 reasonably well over North China but overestimated concentrations mainly over the middle and lower reaches of the Yangtze River and the Sichuan Basin. These differences reflect the models' combined representations of photochemistry, NO titration, and atmospheric transport.
The evaluation indicated that the EPICC-Model showed consistent seasonal MDA8 O3 performance with an annual IOA of 0.85, capturing O3 distribution across China. CAMx had slightly higher consistency (IOA 0.87) but systematically underestimated in spring, autumn, and winter and missed localized peaks. CMAQ performed well in summer and autumn, especially over the Pearl River Delta, but IOA dropped to 0.33 in spring and overestimated in winter, indicating a need to improve boundary layer and dry deposition schemes.
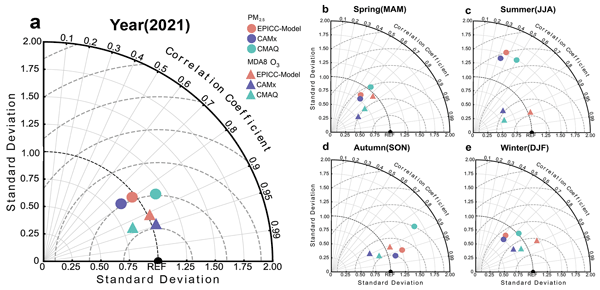
To comprehensively evaluate model performance, this study used Taylor diagrams to compare the EPICC-Model, CAMx, and CMAQ simulations with observations on both annual and seasonal scales. The Taylor diagram simultaneously displays the correlation coefficient (R), normalized standard deviation (SD), and centered root mean square error (RMSE). In the diagram, the radial distance represents SD, the angular coordinate indicates R, and dashed contours denote RMSE relative to observations. The “REF” point (R=1, SD=1) represents perfect agreement with observations. The annual results (Fig. 5a) showed that all three models performed satisfactorily in simulating PM2.5 and MDA8 O3, with particularly strong performance for MDA8 O3. Correlation coefficients exceeded 0.75 for all models, while RMSE and SD remained relatively low, indicating lower variability and higher accuracy in MDA8 O3 simulations compared to PM2.5.
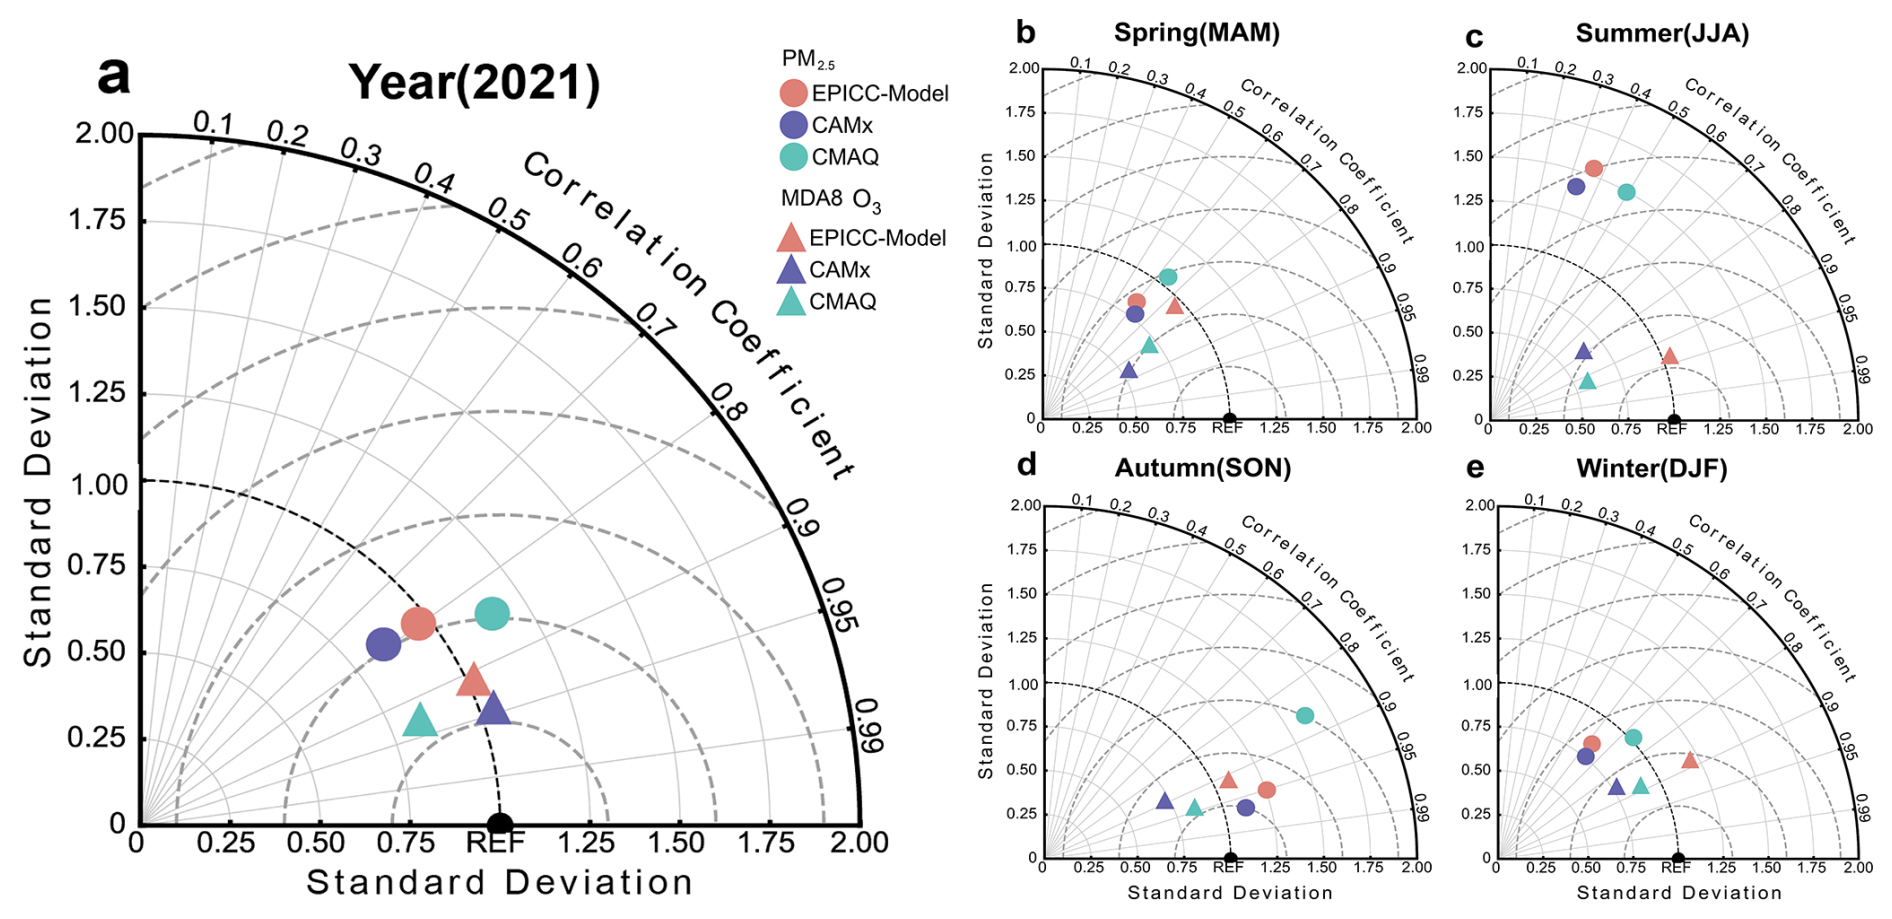
Figure 5Taylor diagrams of PM2.5 and MDA8 O3 for the three models on annual and seasonal scales.
Seasonally, PM2.5simulation accuracy exhibited marked variations: during winter and spring high-concentration periods, all three models showed comparable performance, with CMAQ demonstrating greater ability to replicate pollution peaks (SD ≈1, closest to observations). Model performance declined significantly under summer's low-background conditions (R<0.55, elevated RMSE/SD), indicating enhanced error during low-concentration periods. Autumn saw a recovery in performance, and CAMx achieved R=0.97. In contrast, MDA8 O3 simulations showed more robust seasonal consistency: while spring remained the weakest season (R>0.7), the EPICC-Model and CMAQ maintained low errors. The EPICC-Model excelled during summer O3 peaks (R≈0.95, lowest RMSE/SD), CMAQ led in autumn, and all models converged in winter (R=0.8–0.9), effectively capturing O3 spatiotemporal patterns.
Overall, the EPICC-Model demonstrated strong robustness in seasonal O3 simulations, maintaining consistently low standard deviations and showing clear advantages during the summer pollution peak. In contrast, CAMx and CMAQ exhibited relative strengths in PM2.5 simulations: CAMx performed particularly well under the complex meteorological conditions of autumn, while CMAQ better captured pollutant accumulation processes during the stable boundary layer conditions in winter, reflecting their respective adaptability.
3.2 Evaluation of PM2.5 chemical composition simulations
Based on the spatiotemporal variations of PM2.5 total concentrations simulated by each model, the performance of the EPICC-Model, CAMx, and CMAQ in simulating major chemical components was further evaluated. Figure 6 presents the average relative contributions and absolute concentrations of key PM2.5 components in ten representative cities across urban clusters, including the Beijing-Tianjin-Hebei, Yangtze River Delta, Chengdu-Chongqing, and the Middle Reaches of the Yangtze River regions. Overall, all three models reasonably reproduced the observed chemical composition structure characterized by a predominance of nitrate (), which is consistent with previous findings (Huang et al., 2021). Observations indicated that accounted for approximately 31.2 %–42.4 % of PM2.5 mass in most cities. This dominant feature was reproduced by all models, although the simulated concentrations tended to be overestimated to varying degrees.
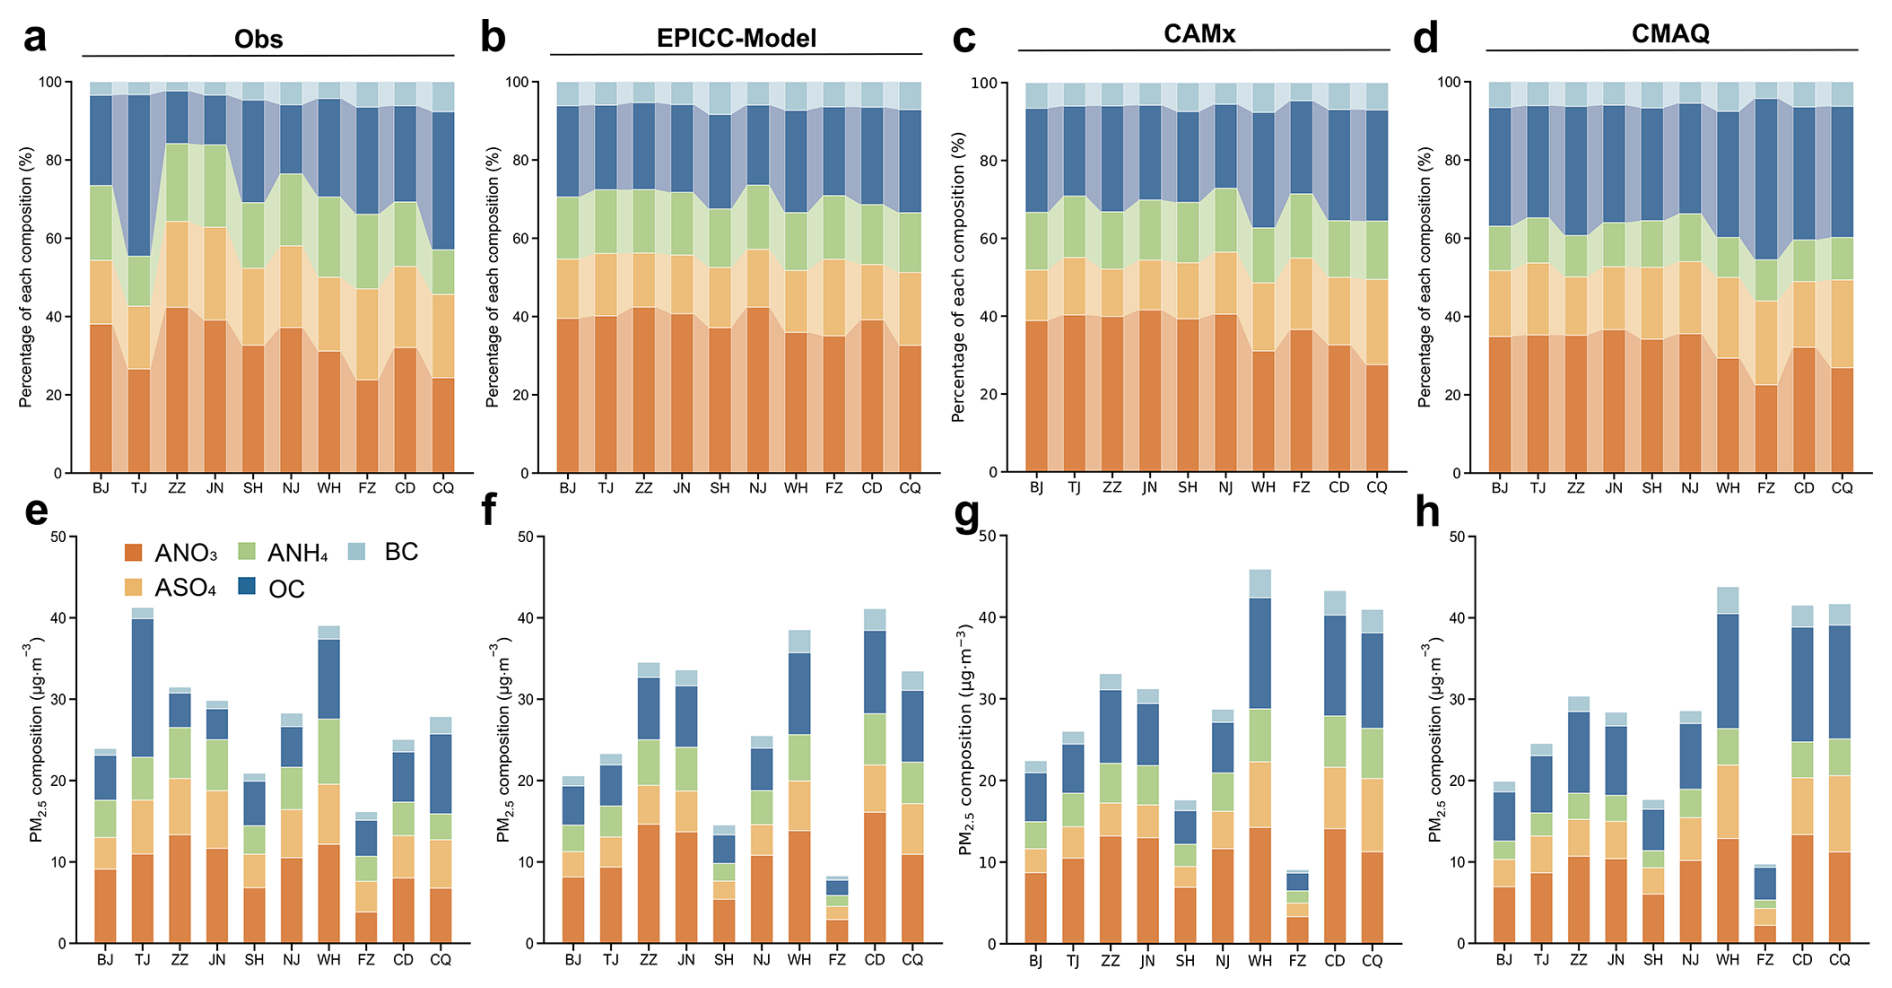
Figure 6Comparison of simulated and observed aerosol components in representative Chinese cities. ASO4, ANO3, ANH4, OC, and BC denote sulfate, nitrate, ammonium, organic carbon, and black carbon in PM2.5, respectively. The locations of monitoring sites are as follows: BJ (Beijing; 116.41° E, 40.04° N), TJ (Tianjin; 117.21° E, 39.17° N), ZZ (Zhengzhou; 113.73° E, 34.77° N), JN (Jinan; 117.06° E, 36.66° N), SH (Shanghai; 121.53° E, 31.23° N), NJ (Nanjing; 118.76° E, 32.07° N), WH (Wuhan; 114.37° E, 30.54° N), FZ (Fuzhou; 119.31° E, 26.10° N), CD (Chengdu; 104.09° E, 30.64° N), and CQ (Chongqing; 106.47° E, 29.62° N).
Meanwhile, all three models consistently underestimated sulfate (), a bias consistent with existing research findings (Shao et al., 2019), which may stem from underestimating SO2 oxidation rates or uncertainties in intra-cloud aqueous-phase chemical mechanisms. The insufficient formation of not only limited the production of ammonium sulphate [(NH4)2SO4] but also reduced the consumption potential of NH3(Gao et al., 2018), thereby suppressing the simulated concentration of ammonium (). The reduced formation of ammonium sulfate may also leave more NH3 available to partition with HNO3, potentially enhancing NH4NO3 formation and contributing to the overestimation of particulate in some regions.
For OC, although certain deviations are observed in individual cities, the overall simulation performance of the three models remained within an acceptable range (Miao et al., 2020). Among them, the EPICC-Model and CAMx produced results that were closer to observations, while CMAQ tended to systematically overestimate OC concentrations. This systematic bias may stem from the introduction of Potential Combustion SOA (PCSOA) species starting from CMAQv5.2. PCSOA serves as a surrogate secondary organic aerosol species to compensate for the lack of combustion-related SVOC and IVOC emissions in current inventories. However, the model estimates PCSOA concentrations through parameterized precursor emissions and simplified processes including OH oxidation and gas-particle partitioning. The associated uncertainties may result in regional and temporal discrepancies, failing to reflect the real-world variations in PCSOA and consequently leading to simulation biases (Murphy et al., 2017; Pennington et al., 2021). Overall, all three models share substantial uncertainties in SOA-related mechanisms, representing a common limitation.
BC is the least abundant component of PM2.5, with observed concentrations ranging from 0.7 to 2.1 µg m−3. All models exhibited generally consistent performance in simulating its relative contribution, and slight overestimations were observed in Beijing, Tianjin, and Zhengzhou. In Beijing and Zhengzhou, the elevated fractions were accompanied by overestimated absolute BC concentrations, suggesting possible uncertainties in BC emission magnitude or spatial allocation, as well as in mixing, transport, and removal processes. In Tianjin, however, the absolute BC bias was small. The elevated BC mass fraction is mainly attributable to the underestimation of other measured PM2.5 components in absolute terms (particularly OC), which reduces the simulated total of these components and thereby increases the relative contribution of BC. Differences in spatial representativeness between individual urban sites and grid-cell-averaged concentrations may introduce additional uncertainty, although their influence on the direction of the bias cannot be determined from the available data (Hong et al., 2017).
As shown in the stacked bar charts of PM2.5 absolute concentrations in Fig. 6e–h, Tianjin exhibits the highest levels among the selected cities, followed by Wuhan, while Fuzhou shows the lowest. This spatial pattern is closely related to regional emission intensity and meteorological conditions. The three models reasonably reproduce these concentrations in most cities, particularly in Nanjing. However, systematic biases exist in certain locations. Simulated concentrations in Tianjin are substantially lower than observations, primarily due to underestimation of OC associated with uncertainties in SOA formation mechanisms. In contrast, concentrations in Chengdu and Chongqing are consistently overestimated across all models, indicating an amplified model response to pollution episodes in central China. Overall, while the models capture the major chemical composition features, their ability to accurately reproduce absolute concentrations and regional variability remains limited, highlighting the need for refined emission inventories and improved representation of meteorological processes.
Table 5Comparison of AQI level forecast accuracy for 337 Chinese cities.

Table 6Comparison of PM2.5 IAQI level forecast accuracy at 1644 monitoring sites in China with observations.

Table 7Comparison of MDA8 O3 IAQI level forecast accuracy at 1644 monitoring sites in China with observations.

Figure 7 presents boxplots of statistical evaluation metrics (R, RMSE, and NMB) based on ten representative cities to quantify the simulation accuracy and systematic biases of each model. Regarding the overall distribution of R values, a clear “stepwise” difference is observed among the three models. CMAQ generally exhibits higher R values across PM2.5 components than the EPICC-Model and CAMx, indicating stronger capability in reproducing spatiotemporal variability. Among individual components, shows the highest correlation (median R>0.6) with no outliers, suggesting robust representation. and OC display slightly lower R values, reflecting moderate uncertainty but acceptable overall performance. shows dispersed correlations and some low R values, indicating substantial simulation errors, likely due to insufficient representation of regional secondary aerosol formation. BC exhibits the most compact R distribution, with low inter-city variability, reflecting robust and consistent simulation by all models. The RMSE analysis shows larger errors for and OC, with some cities reaching 12 µg m−3 and median values above 6 µg m−3, reflecting sensitivity to meteorology, secondary processes, and SOA-related uncertainties. The EPICC-Model performs well in this aspect. and NH4+ exhibit moderate RMSE, indicating relatively low variability simulations, while BC shows the lowest RMSE and most compact distribution, suggesting high accuracy. The NMB results show that the deviations of , , and are relatively constrained, although overestimations or underestimations still occur in some cities. In contrast, the NMB boxplots for OC and BC exhibit significant elongation, with deviations ranging from −50 % to +150 % in certain locations. The high bias of OC is mainly attributed to inaccuracies in the representation of SOA formation and precursor emissions, while the large relative deviations of BC are likely due to its low ambient concentrations, where even minor absolute errors can lead to amplified relative discrepancies.
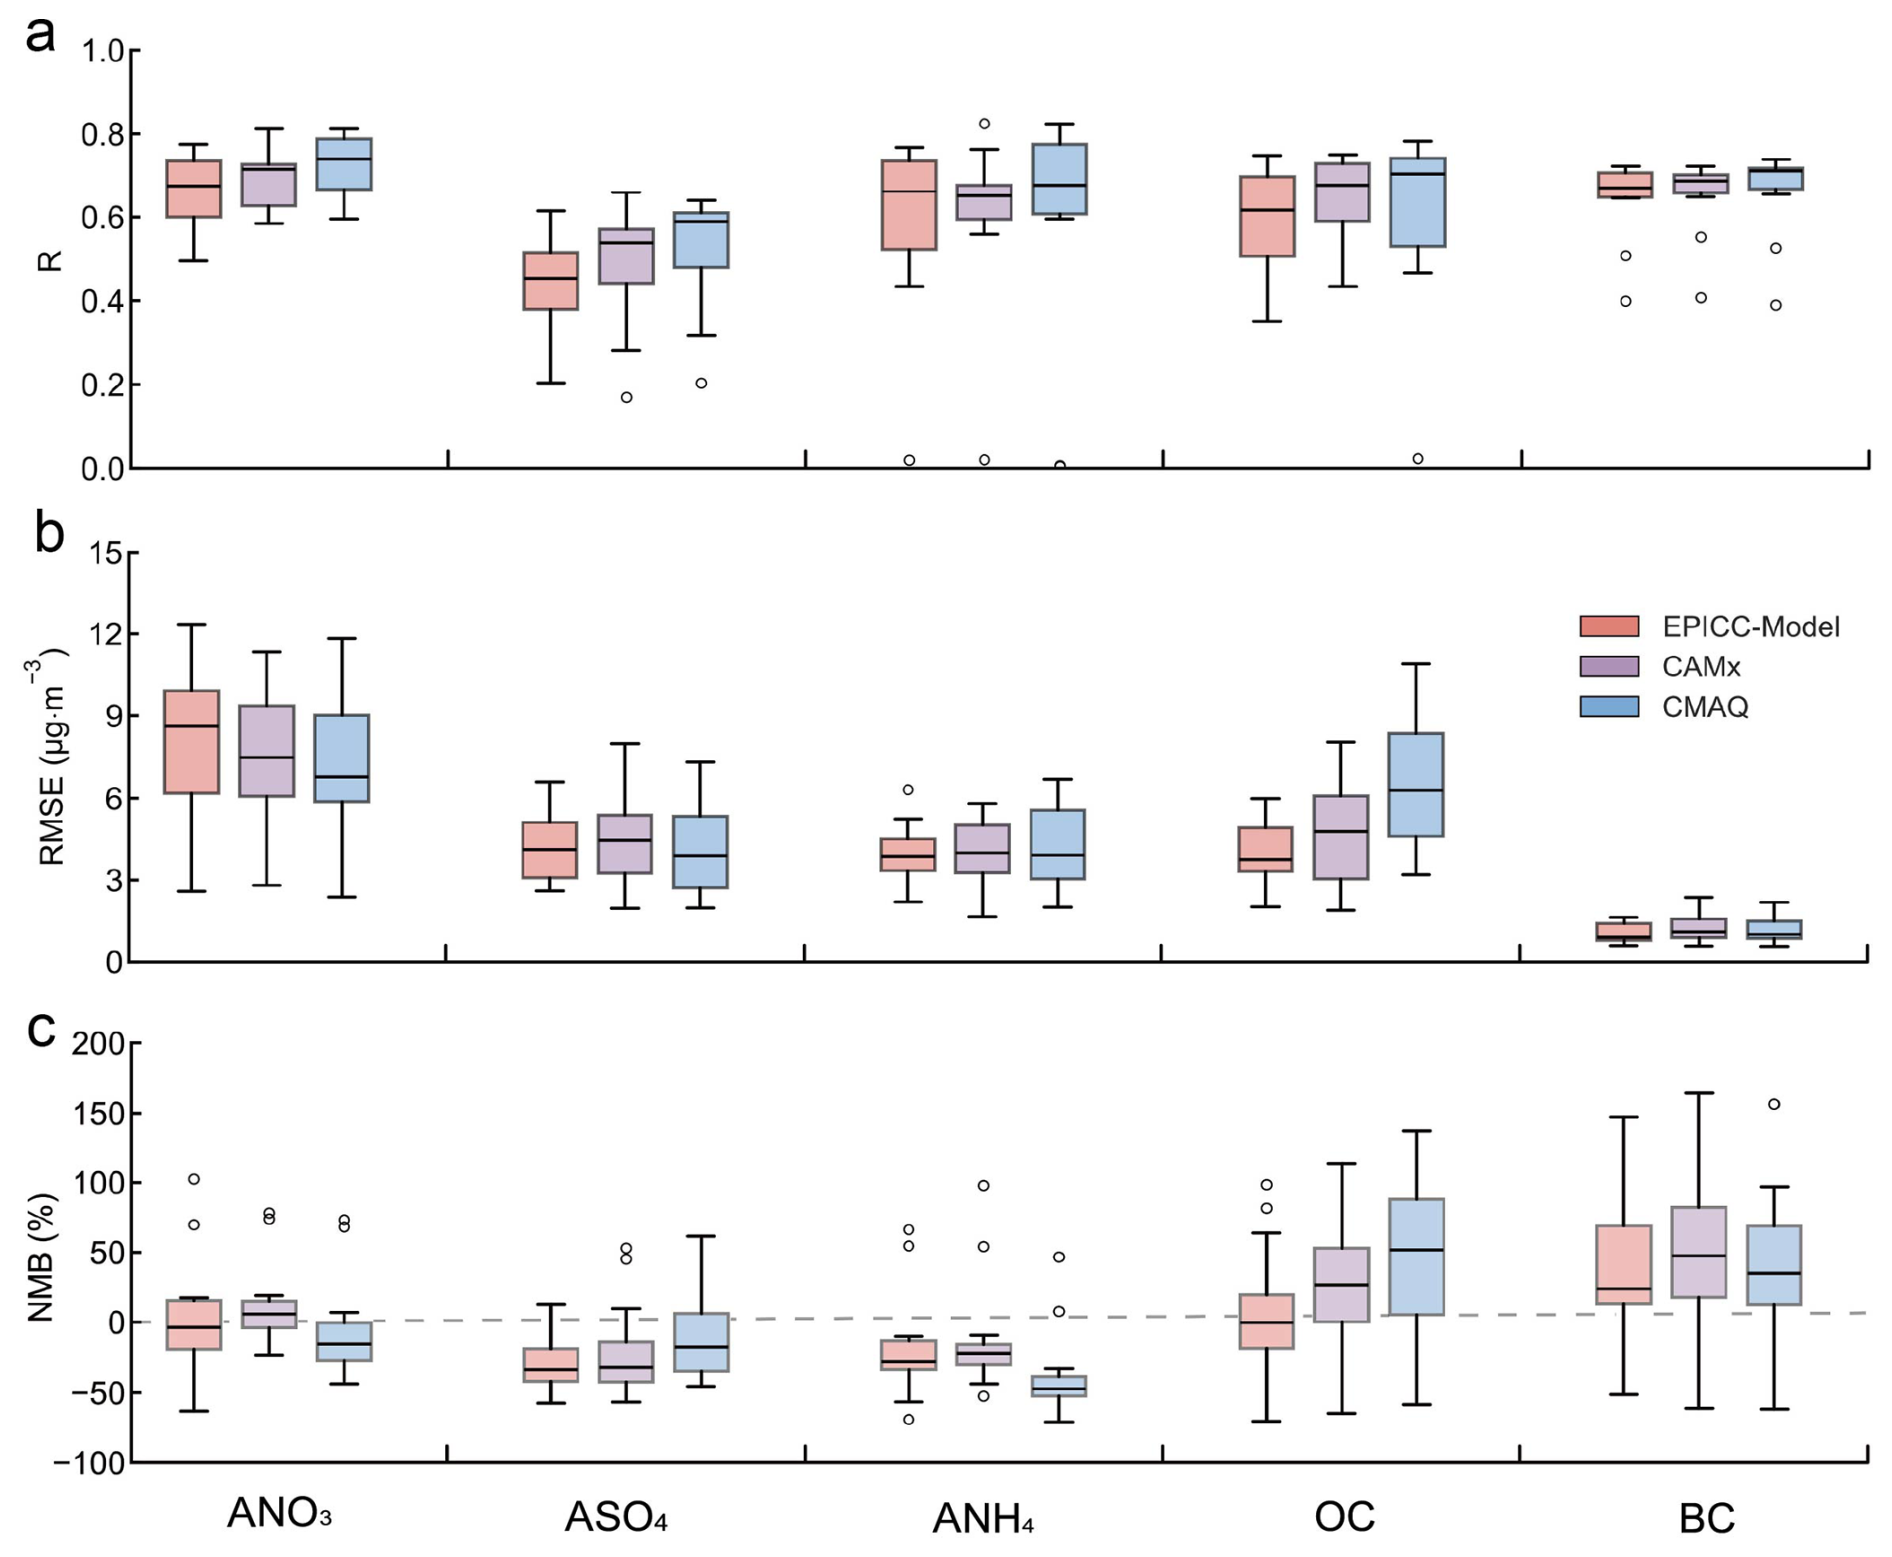
Figure 7Performance metrics of aerosol component simulations across models in representative Chinese cities.
A cross-model comparison reveals that CMAQ exhibits the highest correlation coefficients, particularly excelling in reproducing the spatial and temporal patterns of and . However, it shows a tendency to overestimate OC concentrations. CAMx shows intermediate performance across most components. The performance of the EPICC-Model varies among chemical components and cities, with its RMSE and NMB generally falling within the ranges of the other two models.
3.3 AQI and pollution forecast accuracy
To benchmark the performance of the three CTMs across air-quality categories, we evaluated the categorical forecasts of the EPICC-Model, CAMx, and CMAQ following the Technical guideline for numerical forecasting of ambient air quality (MEE, 2020) and the Technical Regulation for the Assessment of Urban Ambient Air Quality Index (AQI) Forecasts (Trial) (CNEMC, 2021), and presented in Sect. S7 of the Supplement. For the Air Quality Index (AQI) level evaluation, an AQI interval from 0.75F to 1.25F was first constructed, where F denotes the forecast AQI. This interval was converted to the corresponding air-quality-level range, and a forecast was considered correct when the observed level fell within that range. Missing observations or simulations were excluded before classification and evaluation. PM2.5 and MDA8 O3 were also evaluated separately using their respective individual air quality index (IAQI) categories. Because the present model configurations did not include wind-blown dust emissions, the combined heavy/severe PM2.5 category was retained as a diagnostic evaluation of model performance under the configurations used in this study, rather than as an evaluation of dust-forecasting capability. To determine whether the statistics for this category were dominated by typical dust events, the spatial and seasonal distribution of the observed heavy/severe PM2.5 events was additionally examined. The detailed analysis is presented in Sect. S4 and Table S1 in the Supplement. Overall, the categorical forecast accuracy generally decreased as the observed pollution level increased. The algorithms and definitions of AQI and IAQI are provided in the Supplement for reference.
In terms of overall forecasting accuracy, CAMx performed best for AQI, PM2.5 IAQI, and MDA8 O3 IAQI, with accuracies of 84 %, 83 %, and 90 %, respectively. The EPICC-Model showed competitive performance in several light and moderate pollution categories. This performance was physically consistent with the heterogeneous pathways represented in the model, including manganese-catalyzed SO2 oxidation at the air-liquid interface of deliquesced aerosol particles, N2O5 heterogeneous hydrolysis, and heterogeneous HONO formation (Wang et al., 2021; Zhang et al., 2022; Yang et al., 2024; EPICC-Model Working Group, 2026a). For PM2.5, CMAQ showed the highest accuracy in the moderate and combined heavy/severe categories, reaching 61 % and 40 %, respectively. Nevertheless, all three models showed substantially lower accuracy in the combined heavy/severe PM2.5 category than in the lower pollution categories.
Given the high sensitivity and risk posed by polluted weather and severe pollution events to public health and environmental management, this study further focused on the forecasting performance of PM2.5 and MDA8 O3 pollution events. Based on metrics such as hit rate, false alarm rate, and the distance from the random operating characteristic (DROC) (definitions and calculation methods are provided in the Supplement), the forecast effectiveness for general pollution conditions (PM2.5>75 and MDA8 ) and severe pollution conditions () was thoroughly analyzed to elucidate the applicability and potential limitations of each model under extreme pollution scenarios.
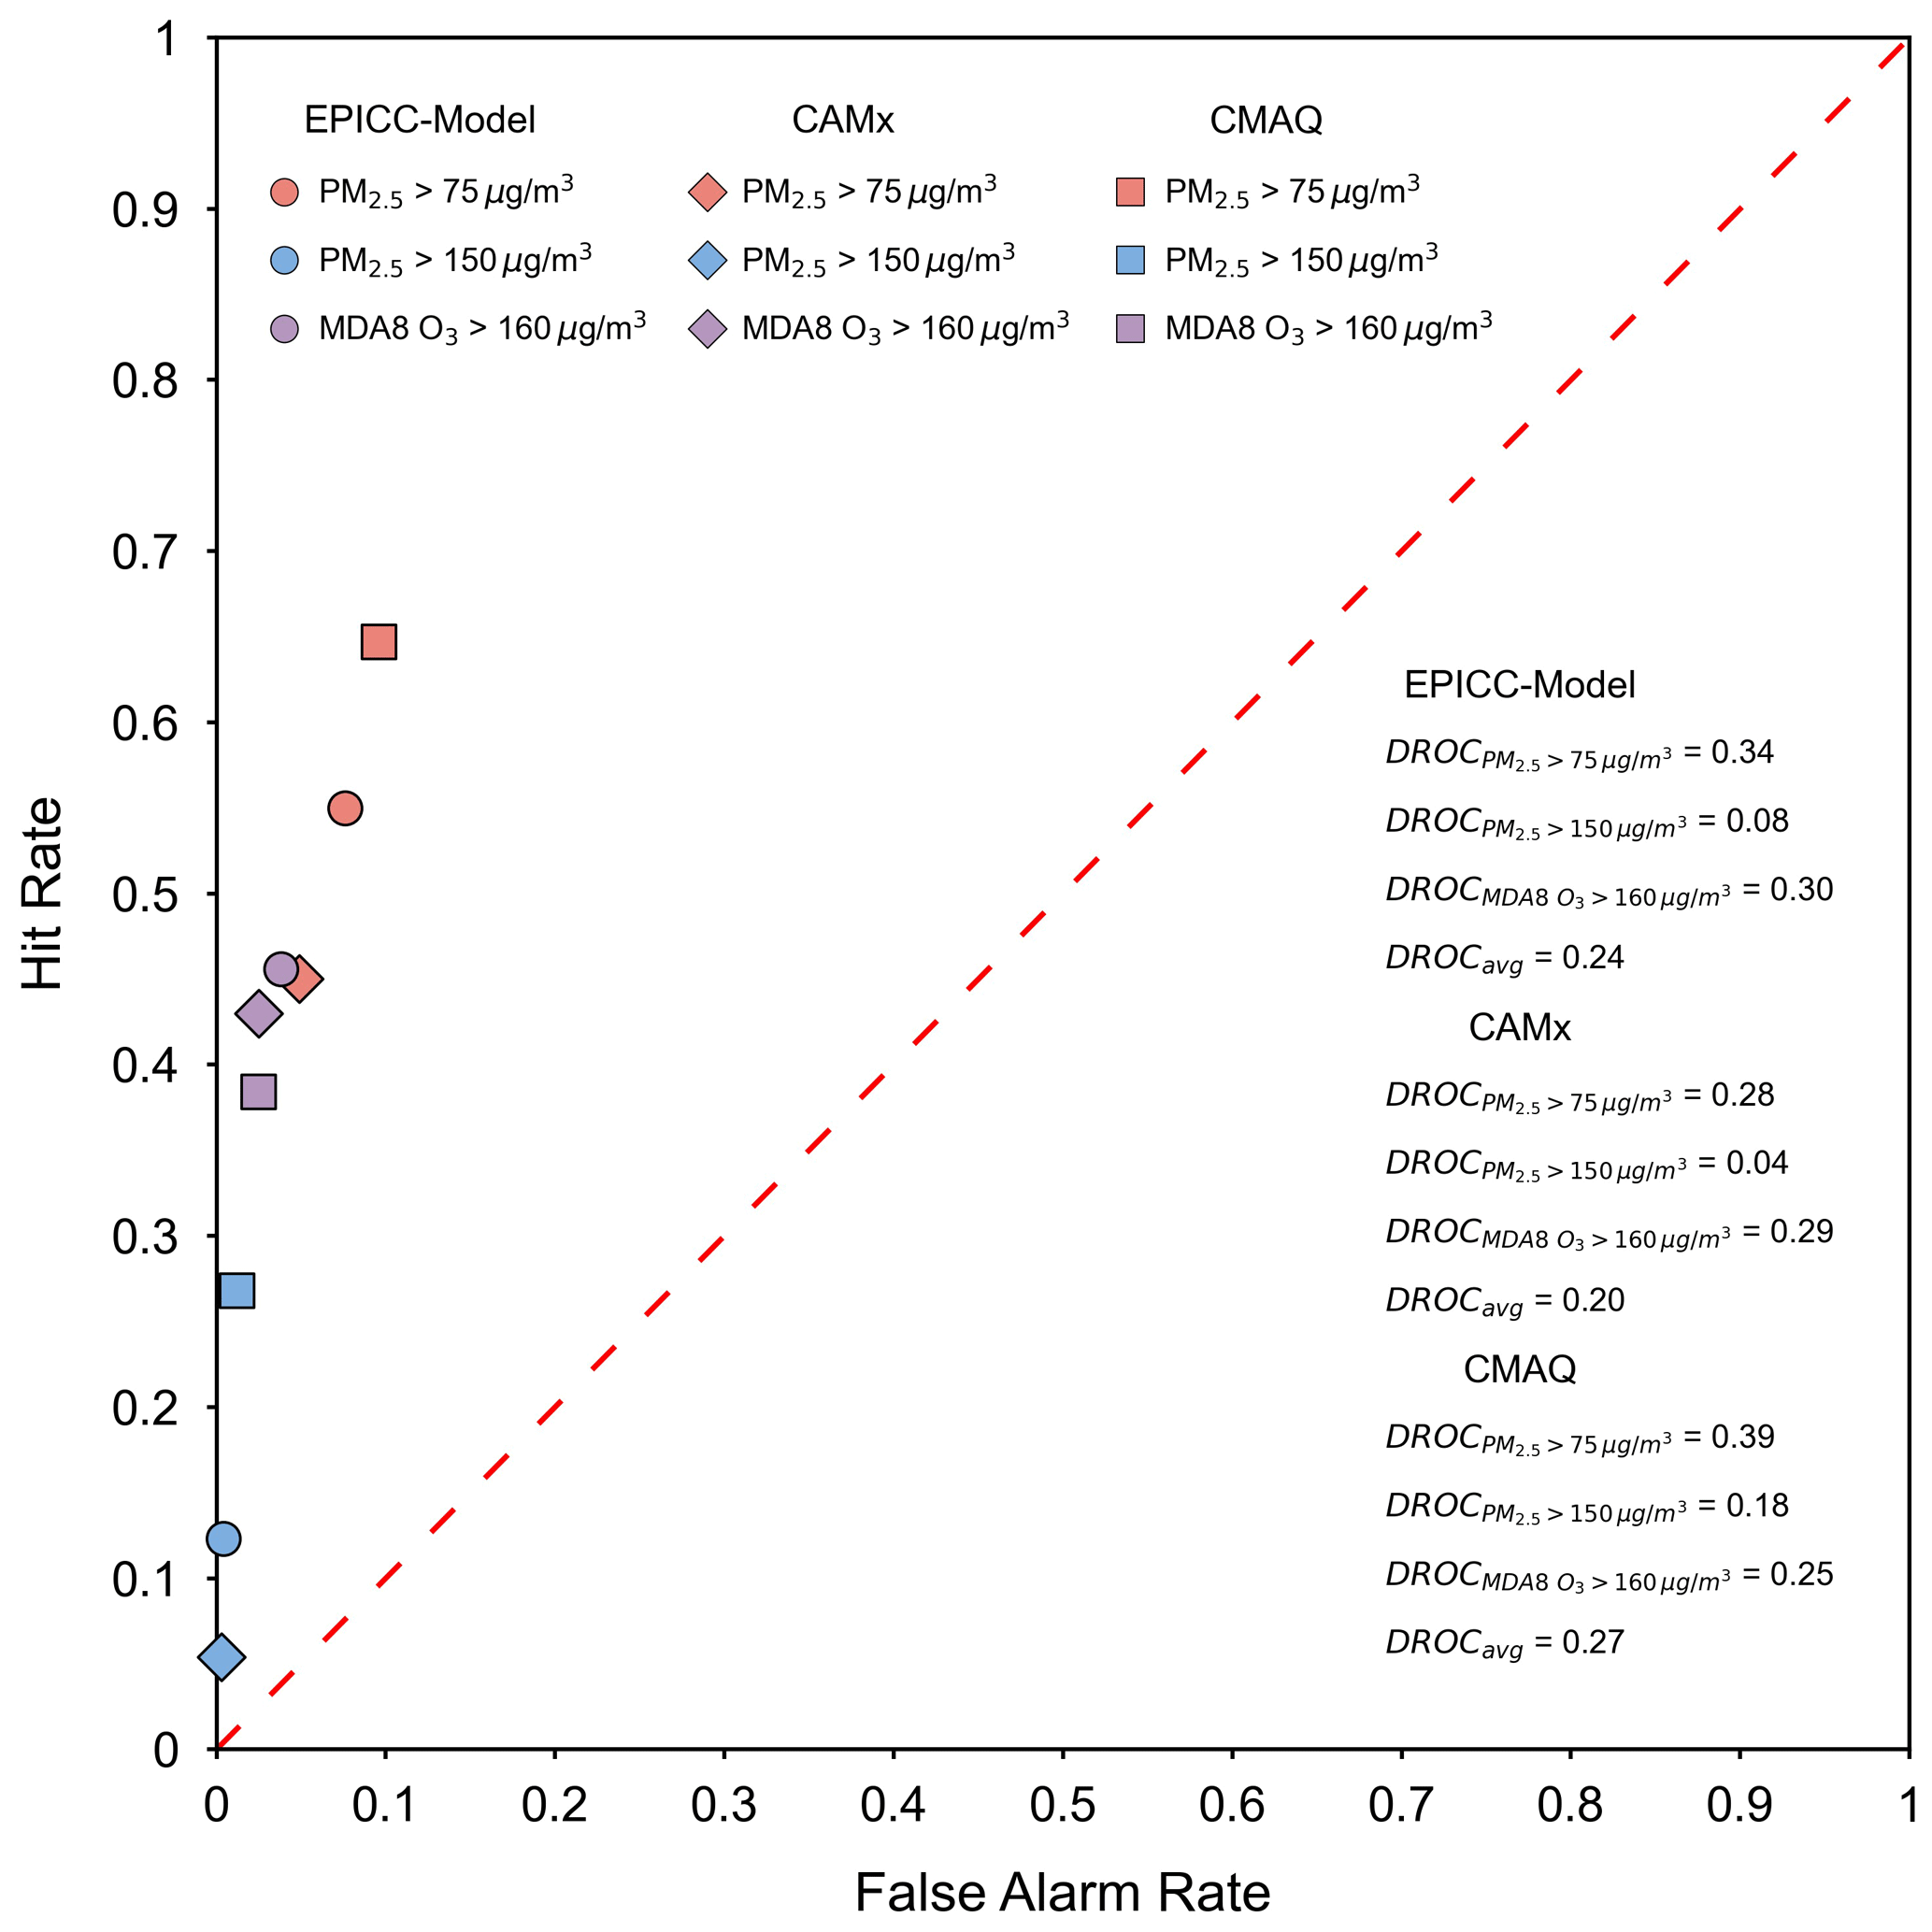
Figure 8Comparison of CTMs performance based on hit rate and false alarm rate. Scatter points represent the performance of three models (EPICC-Model: circles, CAMx: diamonds, CMAQ: squares) under different pollution event thresholds: PM2.5>75 µg m−3, PM2.5>150 µg m−3, and MDA8O3>160 µg m−3. The red dashed line indicates the random forecast reference line. The DROC metric, which quantifies model skill, is provided in the lower-right corner, with higher values indicating better model performance.
Figure 8 visually compared the forecast performance of three models under different pollution thresholds using scatter points in ROC space. For general pollution scenarios (PM2.5>75 µg m−3), CMAQ showed the highest hit rate (64.7 %) but was accompanied by a relatively high false alarm rate (9.6 %), indicating a tendency toward systematic overestimation. CAMx achieved the lowest false alarm rate (4.9 %), likely because it tended to underpredict PM2.5 levels and forecast fewer high pollution events. However, its hit rate was also relatively low (45.0 %), reflecting a more conservative forecasting tendency. The EPICC-Model struck a balance between hit rate (55.0 %) and false alarm rate (7.6 %), suggesting a trade-off between detection capability and false alarm occurrence. Under the more severe pollution condition (PM2.5>150 µg m−3), the hit rates of all models decreased significantly. While CMAQ still maintained the highest hit rate (26.8 %), its miss rate reached 73.2 %. The EPICC-Model and CAMx showed hit rates of only 12.3 % and 5.4 %, respectively, indicating limited responsiveness of current models to extreme pollution events. Nevertheless, all models maintained false alarm rates below 2 %. This reflects limitations of the models in simulating extreme pollution conditions. For O3 pollution events (MDA8O3>160 µg m−3), the EPICC-Model achieved the highest hit rate (45.6 %), slightly higher than CAMx (43.0 %) and CMAQ (38.4 %), while also maintained a low false alarm rate (3.8 %). The DROC values provided in the lower-right table quantitatively reflect the above observations: CMAQ had the highest DROC (0.39) for general PM2.5 pollution events, while the EPICC-Model performed best for O3 events (DROC=0.30). CAMx exhibited relatively low DROC across all thresholds.
3.4 Capability in capturing regional persistent pollution events
To further evaluate the capability of the EPICC-Model, CAMx, and CMAQ in simulating trans-regional and long-duration pollution episodes, this study selected typical persistent PM2.5 and O3 events in 2021, and conducted a dedicated analysis incorporating pollutant transport pathways and the spatiotemporal consistency of meteorological fields.
As shown in Fig. 9, a persistent PM2.5 pollution event occurred in eastern and central China from 20 to 28 January 2021. Initially, pollution was concentrated between 30–40° N, forming a “dual-core” pattern over the North China Plain and the Sichuan Basin. By 24 January, PM2.5 concentrations peaked, with the pollution belt extending southeastward to the middle and lower Yangtze River regions and northeastward to the Songnen Plain. On 28 January, under cold air influence, concentrations dropped below 75 µg m−3 in most areas, leaving only isolated hotspots. All three models captured the temporal evolution from initiation to dissipation. The EPICC-Model showed better performance in reproducing spatial gradients and temporal patterns, particularly in the center of the North China Plain and Yangtze River Middle-Reach corridor. CAMx reproduced the northeastward transport path but underestimated pollution intensity, failing to capture the strong core in Henan during the peak. CMAQ systematically overestimated concentrations.
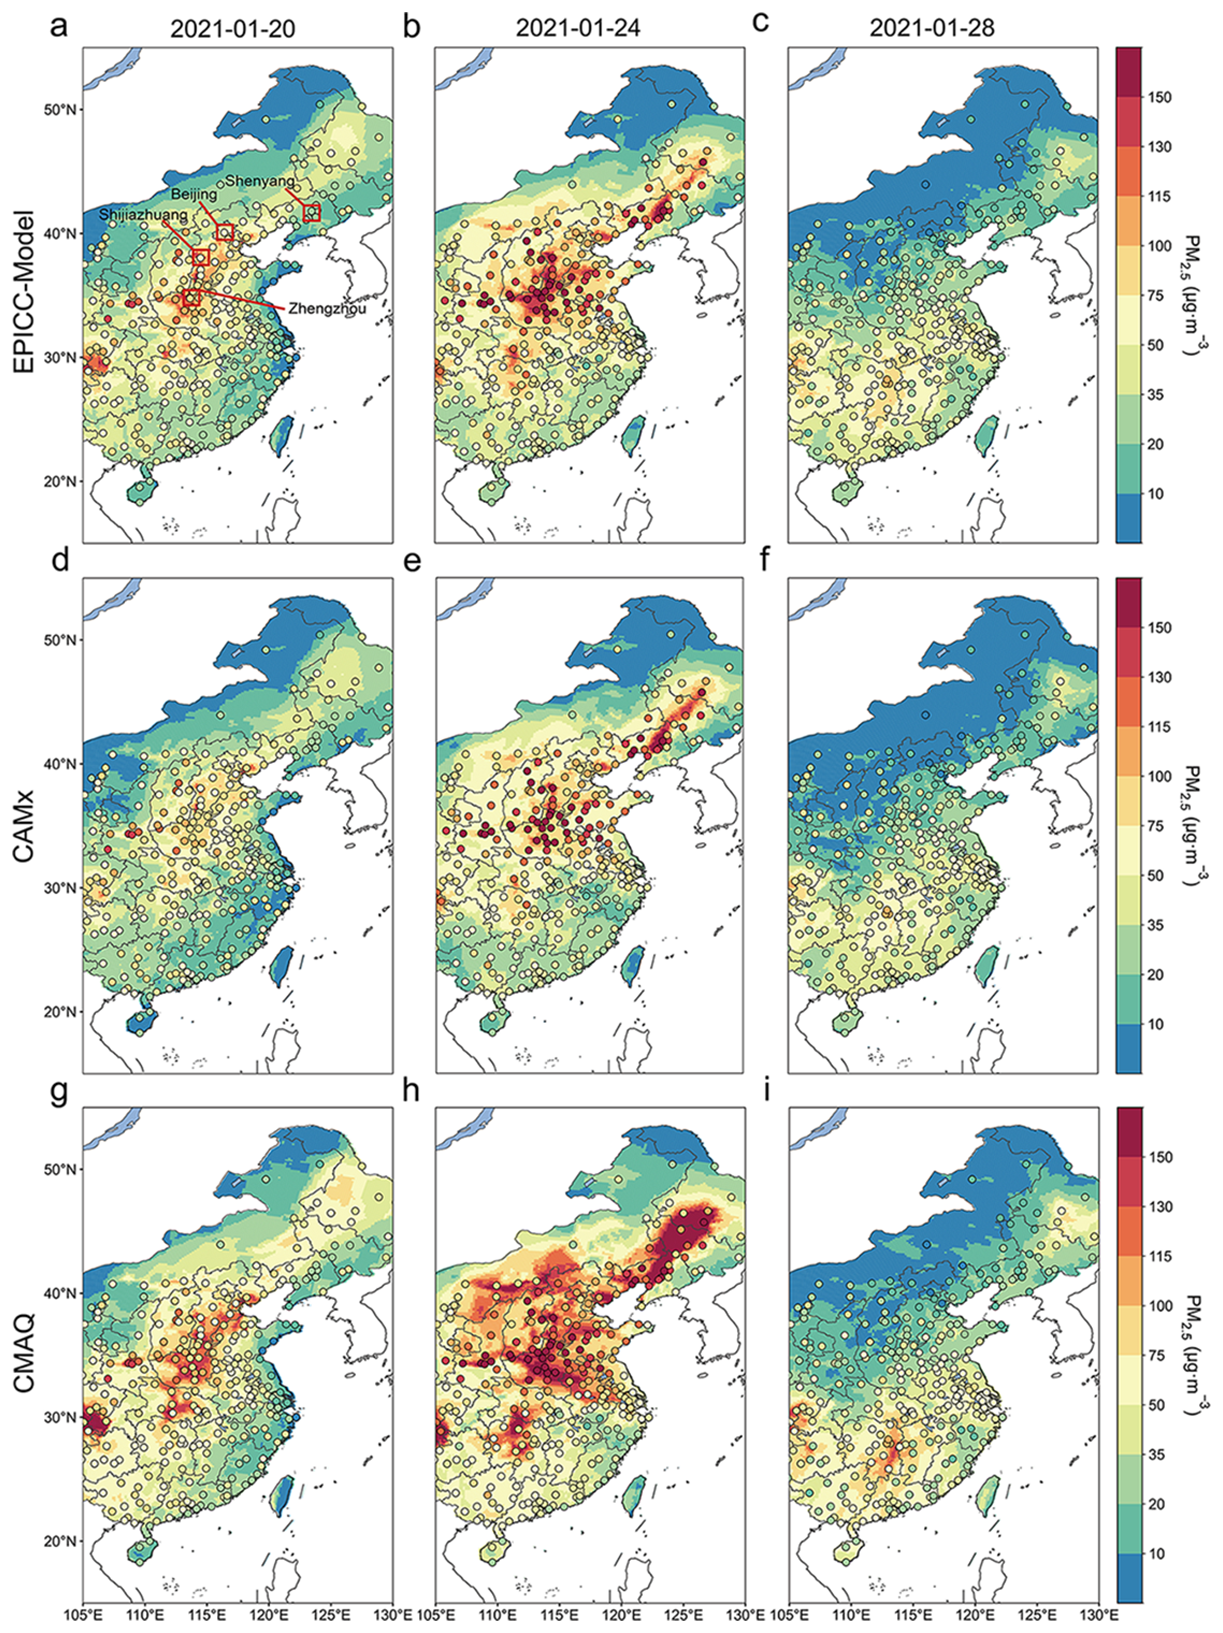
Figure 9Spatiotemporal distribution of the persistent PM2.5 pollution event. Dots represent observed concentrations in 337 cities.
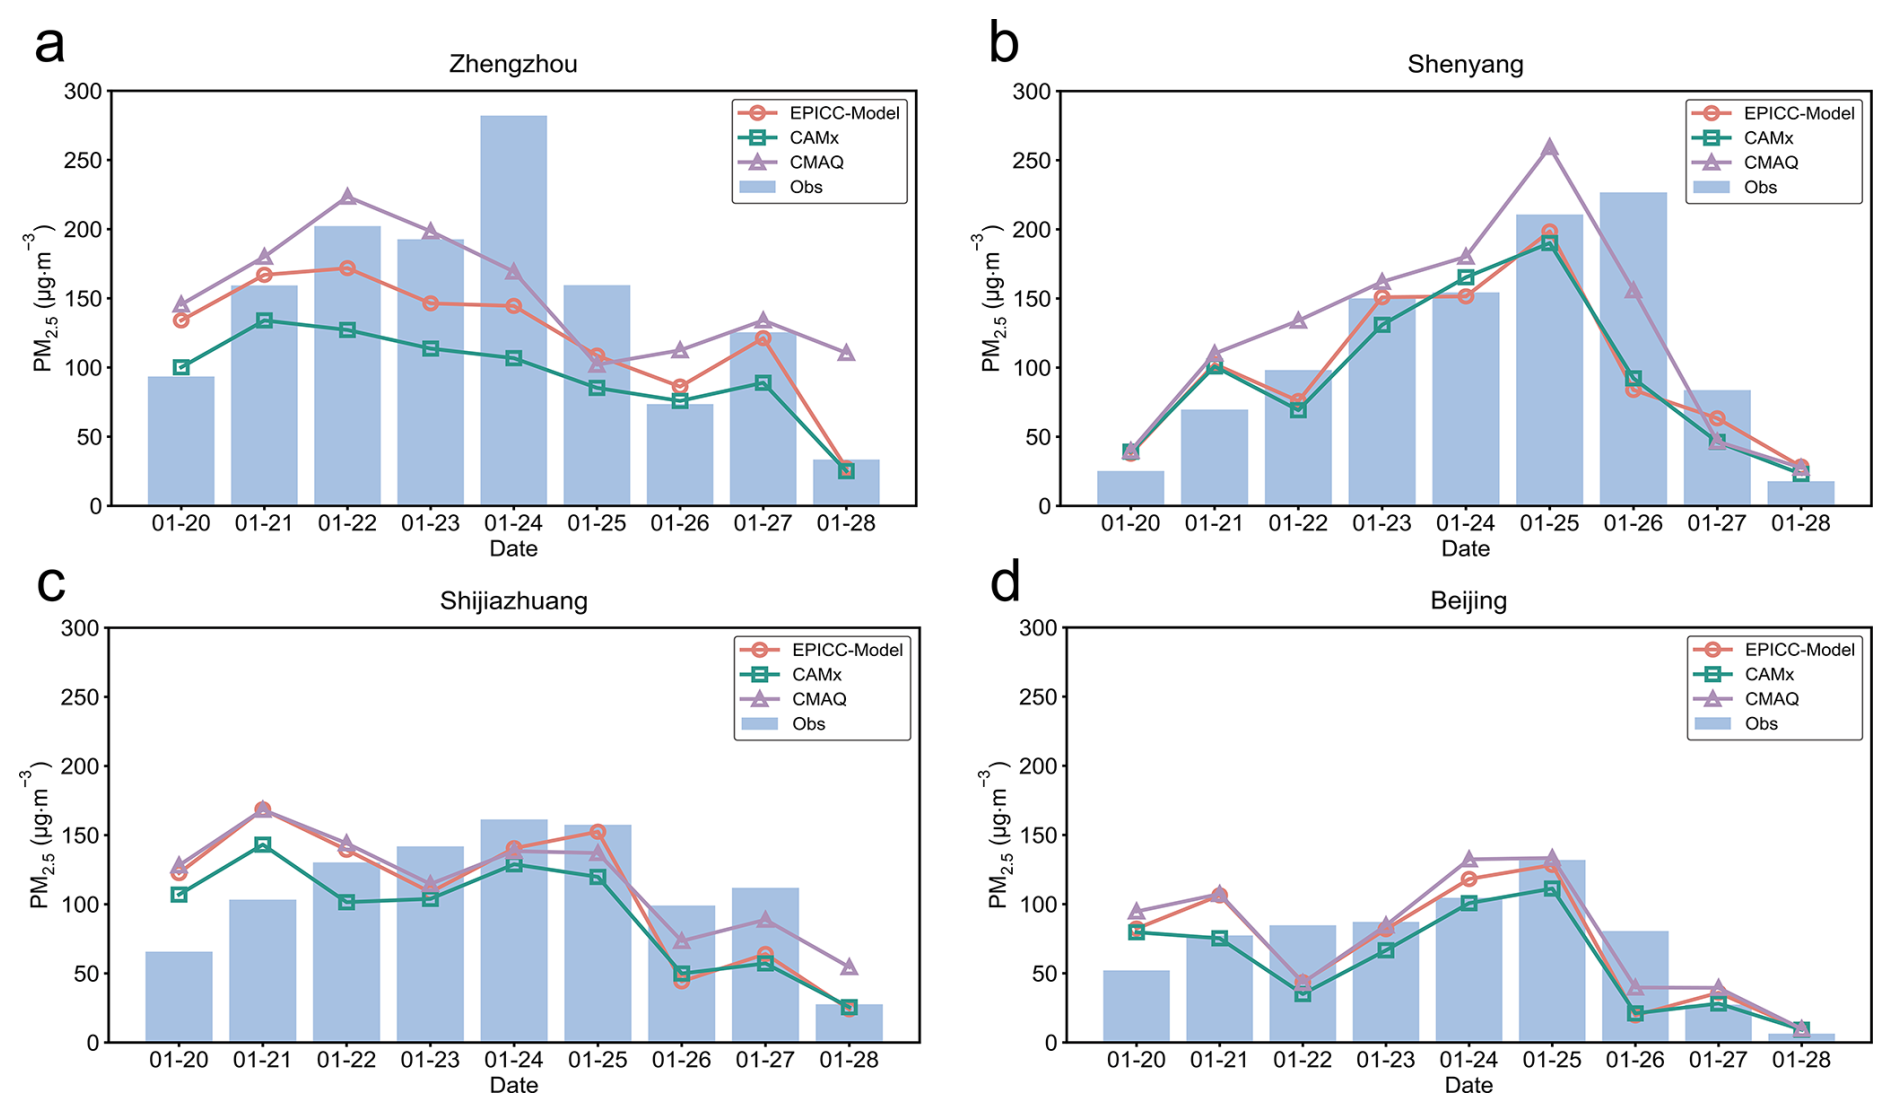
As shown in Fig. 10, Zhengzhou recorded the first PM2.5 peak (>150 µg m−3) on 21 January, with the pollution plume spreading northeastward and causing a delayed concentration rise in Shenyang. All four cities (Zhengzhou, Shenyang, Shijiazhuang, and Beijing) reached their maxima, though peak timings varied. During the clearing phase, driven by southward cold air intrusion, concentrations declined across all cities, with faster removal in Zhengzhou and Shijiazhuang than in Shenyang and Beijing. All three models reproduced the overall process but showed systematic timing biases, with peaks in Shenyang and Zhengzhou simulated 24–48 h earlier than observed. Such deviations may result from inaccuracies in the simulated wind field evolution within the meteorological models. In terms of magnitude, CAMx underestimated and CMAQ overestimated concentrations in Zhengzhou, while the EPICC-Model produced comparatively robust results. In the other three cities, all models tracked concentrations similarly.
As shown in Fig. 11, a persistent O3 pollution episode occurred in China from 3 to 14 June 2021. The event began on 3 June with scattered pollution over the North China Plain and parts of Guangdong Province. By the peak stage on 6 June, pollution intensity increased significantly, spreading to central, southeastern, and southern regions. By 10 June, the pollution weakened and became more localized in North China and its western areas, while southern regions began clearing. By 14 June, MDA8 O3 concentrations dropped below 100 µg m−3 across most areas, leaving only a few localized hotspots in Northeast China and Inner Mongolia. Elevated temperatures, strong solar radiation, and stagnant atmospheric conditions favored O3 formation, whereas cold air intrusions promoted dispersion and removal.
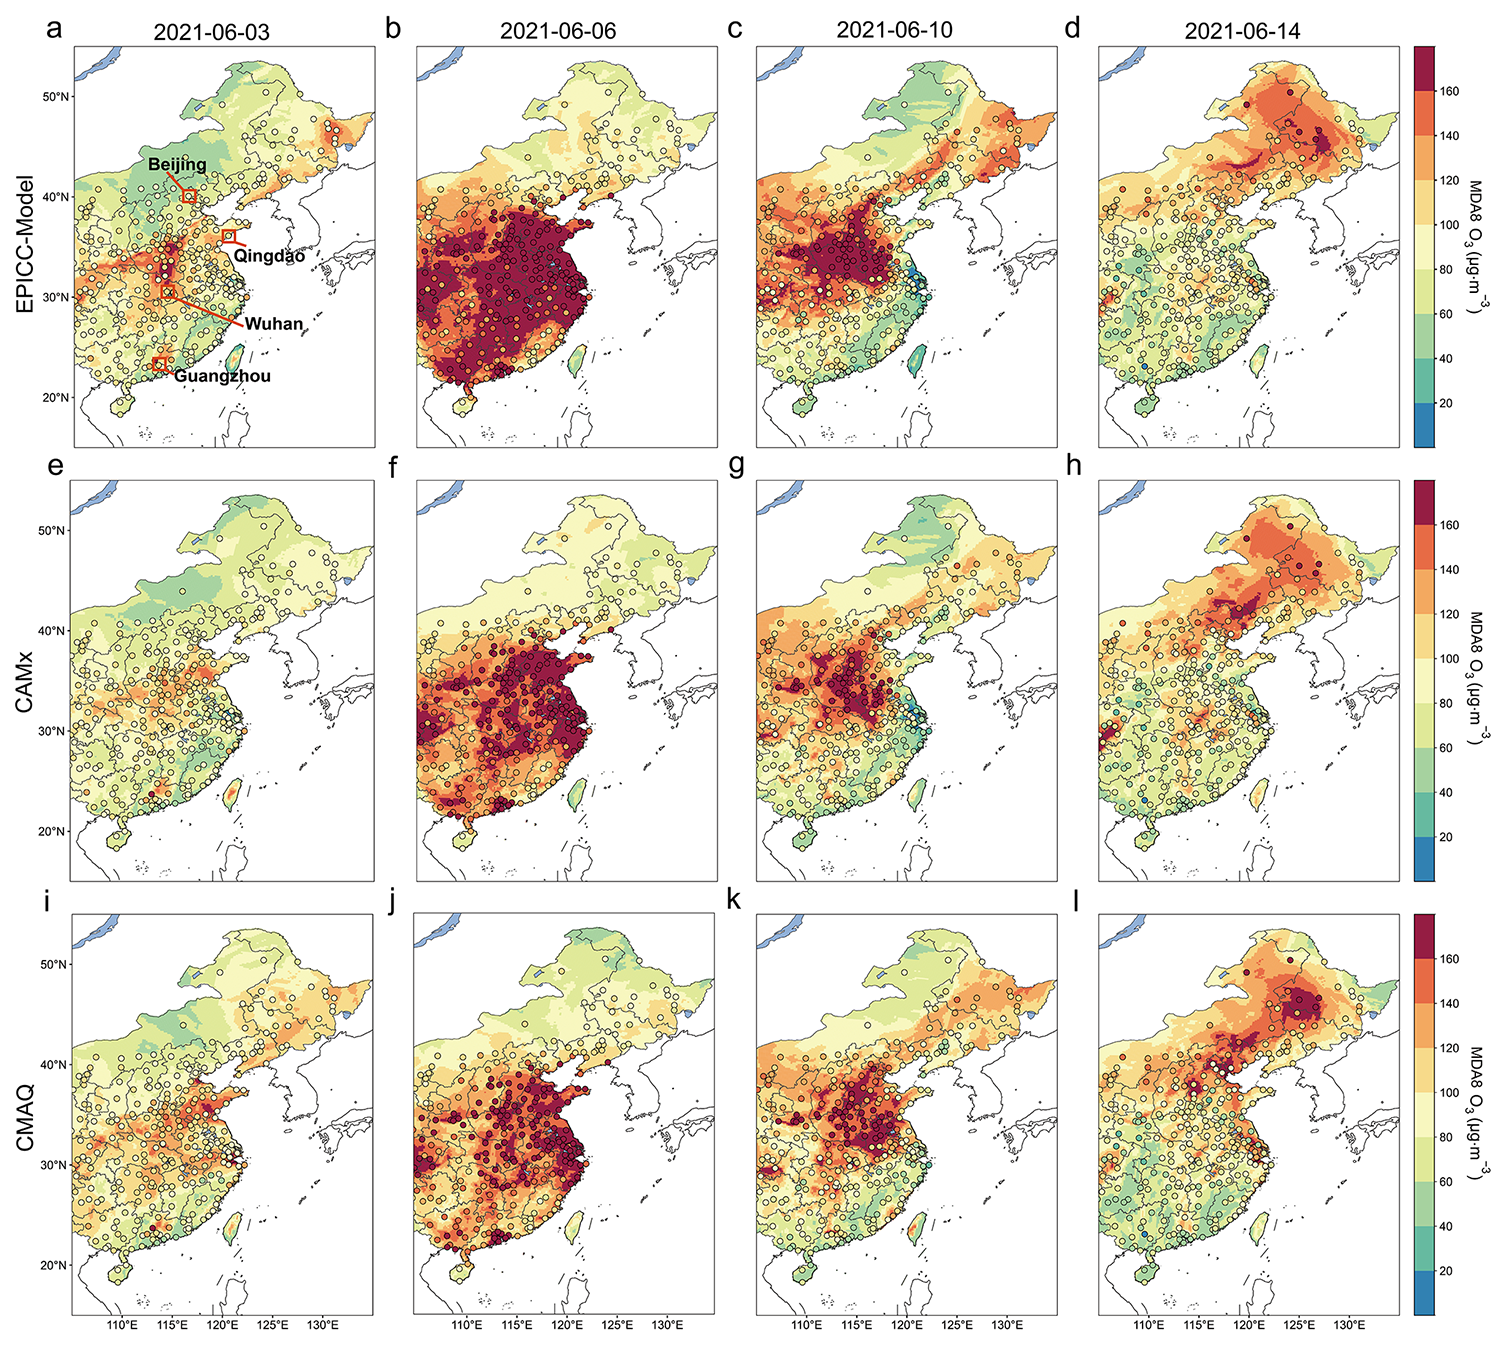
Figure 11Spatiotemporal distribution of the persistent O3 pollution event.
During this persistent pollution event, all three models captured the full process of occurrence, development, and removal. The EPICC-Model reproduced the expansion of the elevated-O3 area from central China toward southeastern and southern China and the subsequent clearing, although it locally overestimated O3 over southeastern China during the peak stage on 6 June, potentially reflecting uncertainties in simulated photochemistry and regional transport. CAMx and CMAQ generally underestimated O3 in the observed high-concentration regions, particularly on 6 and 10 June, but reproduced the local contrasts between neighboring high-O3 and low-O3 monitoring sites more clearly. In comparison, the EPICC-Model reproduced a broader region of elevated O3 but produced a smoother and more spatially extensive enhancement, resulting in local overestimation in parts of central and southeastern China. Overall, the EPICC-Model showed an advantage in representing the regional extent of the elevated-O3 area during this episode.
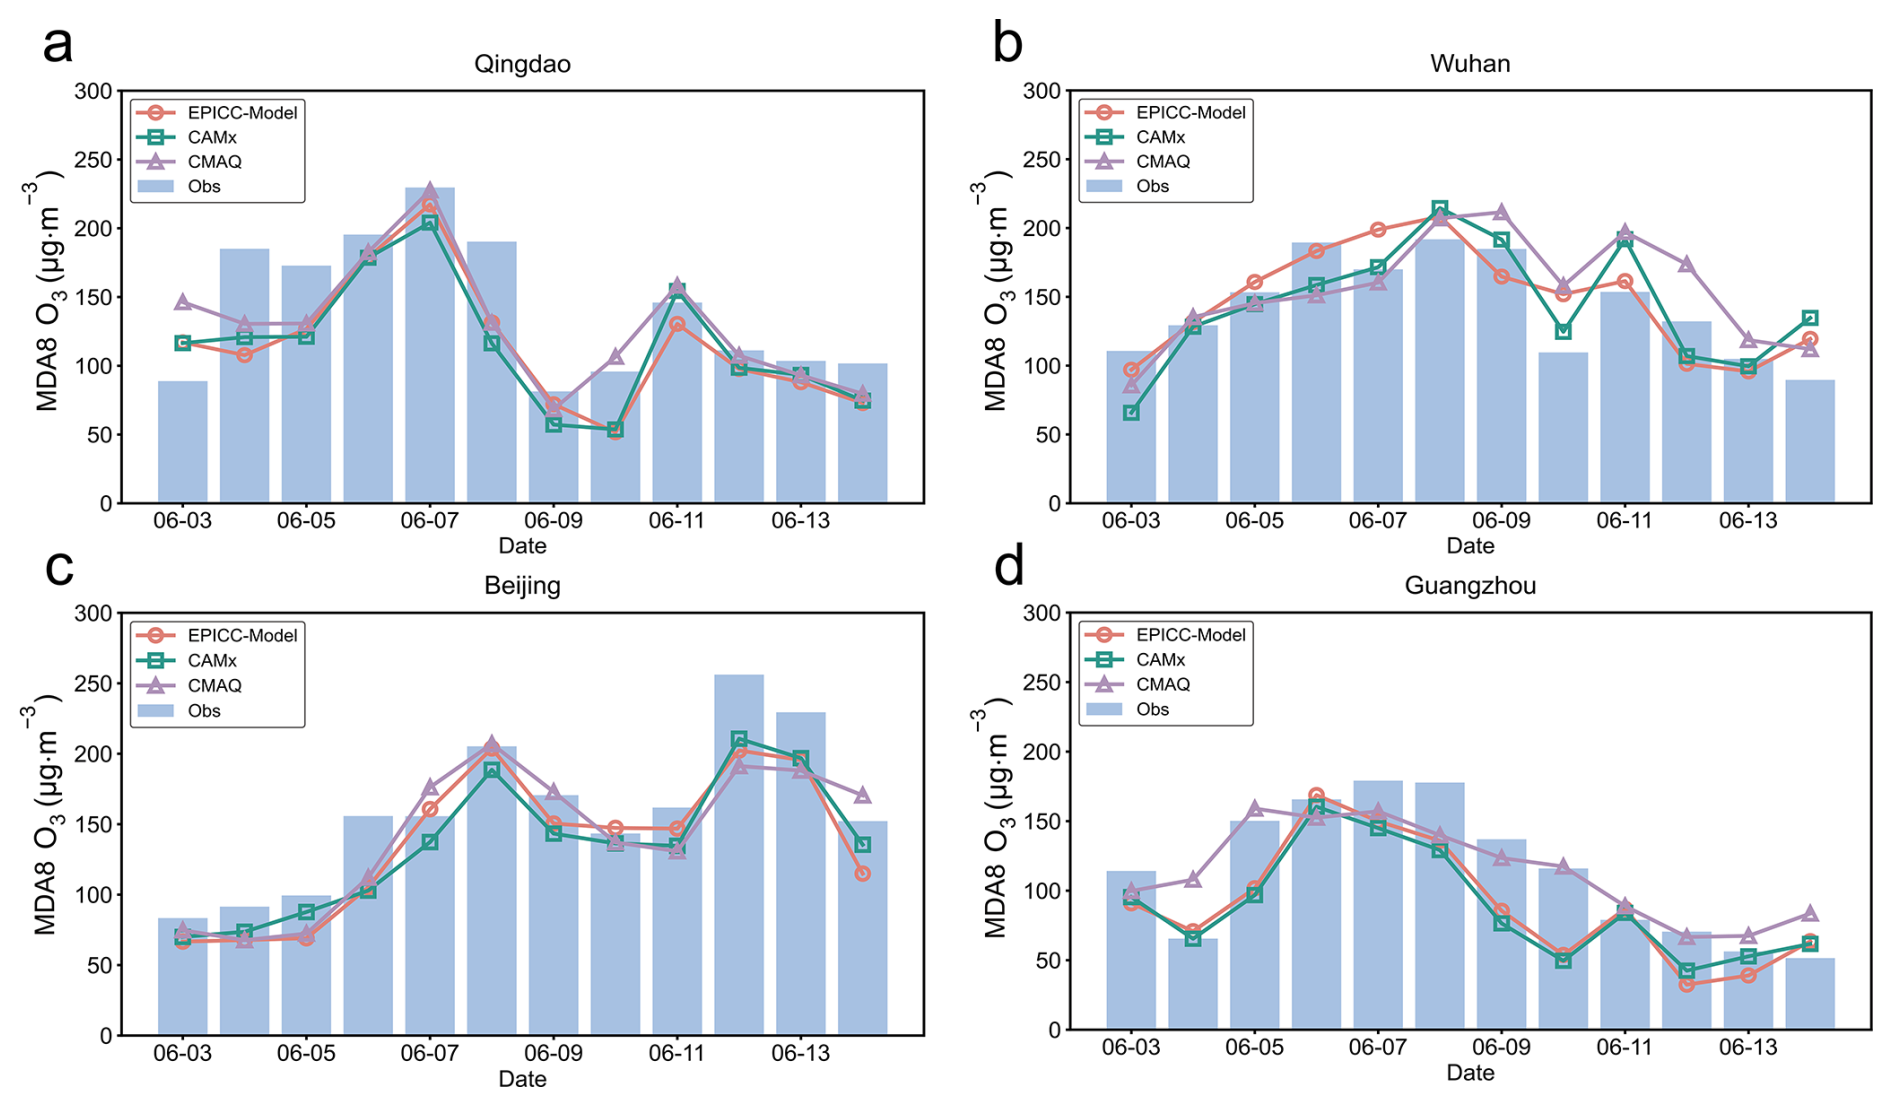
The pollution event occurred over central and eastern China between 30–40° N. Qingdao first entered O3 pollution on 4 June, with MDA8 O3 exceeding 160 µg m−3. The pollution then maintained high concentrations and expanded northward and southward, reaching Qingdao, Wuhan, Beijing, and Guangzhou by 6 June. After 9 June, the first clearing phase began from south to north, with Guangzhou improving first, followed by Wuhan and Qingdao, while the pollution center shifted to the North China Plain and northeastern regions, causing a sharp rise in Beijing around 12 June. By 14 June, most regions had cleared, with Beijing showing the fastest decline, likely due to enhanced cold air activity and higher boundary layer. All three models captured the full progression in Beijing and Qingdao accurately. For Wuhan and Guangzhou, model predictions showed approximately one-day deviations from observations, likely due to limited responses to abrupt meteorological changes.
This study presents a systematic evaluation of three CTMs (EPICC-Model, CAMx, and CMAQ) for PM2.5 and MDA8 O3 simulations over China in 2021, using meteorological fields derived from the same WRF simulation and multi-source emission inventories. The work fills a critical research gap by providing the first comprehensive comparison of the EPICC-Model against established CTMs. The results indicated that all three models could effectively reproduce the spatiotemporal evolution characteristics of PM2.5 and MDA8 O3 (PM2.5: R=0.79–0.85, MDA8 O3: R=0.91–0.94). The PM2.5 bias of the EPICC-Model varied seasonally, with a tendency toward underestimation in spring and summer and overestimation in autumn and winter. Spatially, it exhibited higher consistency (annual IOA=0.80), particularly in winter and over heavily polluted North China, effectively capturing pollution patterns and peaks. For O3, the EPICC-Model performed well during high-concentration summer episodes, and this performance may be partly associated with its inclusion of heterogeneous HONO formation and particulate nitrate photolysis. Furthermore, the EPICC-Model produced particularly accurate O3 simulations over the eastern, central, and Chengdu-Chongqing regions. Notably, all three models shared common deficiencies in PM2.5 simulations. Systematic underestimations occurred in arid northwestern China due to unaccounted dust processes, highlighting the critical influence of natural emissions on model accuracy. Conversely, autumn-winter PM2.5 overestimations occurred in North China and the Sichuan Basin. Insufficient nocturnal mixing may contribute to these biases, consistent with previously reported tendencies of the ACM2/YSU boundary-layer schemes under stable conditions (Jia et al., 2023). Uncertainties in emission inventories further exacerbate regional biases, such as potential overestimation of anthropogenic emissions in the Sichuan Basin and underestimation of agricultural NH3 emissions in Henan, which affects nitrate aerosol formation. Future improvements should incorporate dust processes, refine boundary layer parameterizations to better simulate pollutant accumulation under stable meteorological conditions, and employ higher-resolution emission inventories with improved temporal variability characterization.
In terms of PM2.5 component simulations, the EPICC-Model, CAMx, and CMAQ all reasonably reproduced the chemical composition characterized by dominance and associated regional variations. Compared with CAMx and CMAQ, the EPICC-Model exhibited smaller biases in and , with more robust control of absolute concentrations as reflected in RMSE and NMB, indicating a relatively consistent overall performance, although its correlation metrics are slightly lower than the other two models. Nevertheless, all three models share common limitations: is generally underestimated, leading to insufficient formation of (NH4)2SO4 and lower concentrations; SOA formation remains highly uncertain, influenced by precursor VOC emissions, oxidation pathways, and gas-particle partitioning parameterizations, resulting in spatial deviations in OC; BC simulations are highly sensitive to emission inventories, occasionally leading to slight overestimations in certain cities. Addressing these issues in future work should focus on optimizing secondary inorganic aerosol chemistry, improving SOA formation mechanisms and precursor emissions, and enhancing the resolution and accuracy of emission inventories to improve the models' capability in reproducing PM2.5 chemical composition.
Regarding AQI level classification ability, CAMx achieved the highest overall accuracy (84 %), demonstrating particular strengths in distinguishing “excellent” and “good” air quality levels. CMAQ was relatively accurate in pollution level identification, with the highest hit rate (64.7 %) in forecasting general pollution where PM2.5>75 µg m−3, but it had a high false alarm rate (9.6 %), indicating a tendency toward over-forecasting. The EPICC-Model showed higher hit rates in forecasting PM2.5 light to moderate pollution levels and MDA8 O3 general pollution, achieving 45.6 % for MDA8O3>160 µg m−3, compared with 43.0 % for CAMx and 38.4 % for CMAQ. For severe PM2.5 pollution events exceeding 150 µg m−3, all three models showed low hit rates, ranging from 5.4 % to 26.8 %, although their false alarm rates remained below 2 %. In addition, the EPICC-Model demonstrated relatively balanced false alarm rates across all pollution types, suggesting a simulation capability comparable to other mainstream models and particular effectiveness in capturing light to moderate pollution and O3 pollution.
In the simulation analysis of typical persistent PM2.5 and O3 pollution events in 2021, the EPICC-Model demonstrated strong capabilities, particularly outperforming CAMx and CMAQ in reproducing spatial distributions and pollution evolution. The EPICC-Model successfully captured the entire process of pollution occurrence, development, and clearance, particularly in the core area of the North China Plain and the diffusion zone of the middle Yangtze River, where the simulation results were in close agreement with observational data. CAMx and CMAQ, however, performed less effectively in capturing persistent pollution events, both exhibiting significant deviations during the simulation of severe pollution phases. CAMx tended to underestimate pollution intensity during some high-concentration stages, while the models exhibited timing deviations during the development or dissipation of individual episodes.
This study establishes a multi-model evaluation framework for systematically comparing the performance of the EPICC-Model with established CTMs over China. By identifying model-specific limitations and challenges shared across the three models, the comparison highlights priorities for future model enhancements, including improved representations of natural dust, boundary-layer mixing, secondary aerosol formation, and emission inputs. The results provide benchmark information for evaluating, selecting, and further developing regional air-quality modeling systems in China. The multi-model evaluation framework and identified performance characteristics may also serve as a reference for model applications in other regions facing similar air-quality modeling challenges.
All models used in this study are open source and publicly available. The EPICC-Model v1.0 source code is archived at https://doi.org/10.5281/zenodo.20303367 (EPICC-Model Working Group, 2026b). CAMx v7.00 can be downloaded from https://www.camx.com/download/source/ (last access: 8 October 2026) (Ramboll, 2020), while CMAQ v5.3.3 is available through https://doi.org/10.5281/zenodo.5213949 (US EPA Office of Research and Development, 2021). Meteorological fields were generated using the WRF v3.9.1 (Skamarock et al., 2008), which is available from https://www2.mmm.ucar.edu/wrf/users/download/get_source.html (last access: 8 October 2026). Initial and boundary conditions were derived from the NCEP FNL reanalysis dataset (NCEP, 2000), archived at https://doi.org/10.5065/D6M043C6. Anthropogenic emissions over China were obtained from the MEIC inventory developed by Tsinghua University (Geng et al., 2024), available at http://meicmodel.org.cn/?page_id=541&lang=en (last access: 8 October 2026). Chinese NH3 emissions were taken from the PKU-NH3 inventory, while biomass-burning emissions were obtained from the China Open Biomass Burning Emissions Inventory (Huang et al., 2012a, b; Song et al., 2009; Kang et al., 2016). Both datasets are available through the MEIC data platform at http://meicmodel.org.cn/?page_id=1772&lang=en (last access: 8 October 2026). Emissions outside China were represented using the EDGAR v5.0 inventory (Crippa et al., 2020), available at https://edgar.jrc.ec.europa.eu/dataset_ap50 (last access: 8 October 2026). Biogenic emissions were calculated online using MEGAN v3.2, whose source code is archived at https://doi.org/10.5281/zenodo.10526206 (Guenther, 2024; Guenther et al., 2012). Air quality observations were obtained from the China National Environmental Monitoring Centre (CNEMC; https://www.cnemc.cn/, last access: 8 October 2026). The primary datasets generated and analyzed in this study, as well as the emission data employed (using the 15th of each month as an example), are available in Zenodo at https://doi.org/10.5281/zenodo.20843312 (Lou and Wu, 2026). Additional supporting materials are available from the corresponding author upon reasonable request.
The supplement related to this article is available online at https://doi.org/10.5194/gmd-19-9651-2026-supplement.
ML, QW, WendW, and HC conceptualized and organized the study. ML performed the data analysis and drafted the manuscript. ML and XF conducted the numerical simulations, and FY optimized the simulation code. XF and WeiW provided data support. DL contributed to the meteorological model evaluation. ML, QW, WendW, and HC validated and analyzed the simulation results. KC, JZ, and ZW reviewed the research findings and provided key feedback. All authors read and approved the final manuscript.
The contact author has declared that none of the authors has any competing interests.
Publisher's note: Copernicus Publications remains neutral with regard to jurisdictional claims made in the text, published maps, institutional affiliations, or any other geographical representation in this paper. The authors bear the ultimate responsibility for providing appropriate place names. Views expressed in the text are those of the authors and do not necessarily reflect the views of the publisher.
We appreciate the technical support provided by the National Large Scientific and Technological Infrastructure, the “Earth System Numerical Simulation Facility” (https://cstr.cn/31134.02.EL, last access: 8 October 2026).
This study was supported by the National Key Research and Development Program of China (Grant no. 2023YFC3705705 and 2024YFC3713603) and the Strategic Priority Research Program of the Chinese Academy of Sciences (Grant no. XDB0760400).
This paper was edited by Ulas Im and reviewed by two anonymous referees.
Amnuaylojaroen, T., Barth, M. C., Emmons, L. K., Carmichael, G. R., Kreasuwun, J., Prasitwattanaseree, S., and Chantara, S.: Effect of different emission inventories on modeled ozone and carbon monoxide in Southeast Asia, Atmos. Chem. Phys., 14, 12983–13012, https://doi.org/10.5194/acp-14-12983-2014, 2014.
Appel, K. W., Napelenok, S. L., Foley, K. M., Pye, H. O. T., Hogrefe, C., Luecken, D. J., Bash, J. O., Roselle, S. J., Pleim, J. E., Foroutan, H., Hutzell, W. T., Pouliot, G. A., Sarwar, G., Fahey, K. M., Gantt, B., Gilliam, R. C., Heath, N. K., Kang, D., Mathur, R., Schwede, D. B., Spero, T. L., Wong, D. C., and Young, J. O.: Description and evaluation of the Community Multiscale Air Quality (CMAQ) modeling system version 5.1, Geosci. Model Dev., 10, 1703–1732, https://doi.org/10.5194/gmd-10-1703-2017, 2017.
Appel, K. W., Bash, J. O., Fahey, K. M., Foley, K. M., Gilliam, R. C., Hogrefe, C., Hutzell, W. T., Kang, D., Mathur, R., Murphy, B. N., Napelenok, S. L., Nolte, C. G., Pleim, J. E., Pouliot, G. A., Pye, H. O. T., Ran, L., Roselle, S. J., Sarwar, G., Schwede, D. B., Sidi, F. I., Spero, T. L., and Wong, D. C.: The Community Multiscale Air Quality (CMAQ) model versions 5.3 and 5.3.1: system updates and evaluation, Geosci. Model Dev., 14, 2867–2897, https://doi.org/10.5194/gmd-14-2867-2021, 2021.
Bao, F., Li, M., Zhang, Y., Chen, C., and Zhao, J.: Photochemical aging of Beijing urban PM2.5: HONO production, Environ. Sci. Technol., 52, 6309–6316, https://doi.org/10.1021/acs.est.8b00538, 2018.
Bao, Z., Zhang, X., Li, Q., Zhou, J., Shi, G., Zhou, L., Yang, F., Xie, S., Zhang, D., Zhai, C., Li, Z., Peng, C., and Chen, Y.: Measurement report: Intensive biomass burning emissions and rapid nitrate formation drive severe haze formation in the Sichuan Basin, China – insights from aerosol mass spectrometry, Atmos. Chem. Phys., 23, 1147–1167, https://doi.org/10.5194/acp-23-1147-2023, 2023.
Bessagnet, B., Pirovano, G., Mircea, M., Cuvelier, C., Aulinger, A., Calori, G., Ciarelli, G., Manders, A., Stern, R., Tsyro, S., García Vivanco, M., Thunis, P., Pay, M.-T., Colette, A., Couvidat, F., Meleux, F., Rouíl, L., Ung, A., Aksoyoglu, S., Baldasano, J. M., Bieser, J., Briganti, G., Cappelletti, A., D'Isidoro, M., Finardi, S., Kranenburg, R., Silibello, C., Carnevale, C., Aas, W., Dupont, J.-C., Fagerli, H., Gonzalez, L., Menut, L., Prévôt, A. S. H., Roberts, P., and White, L.: Presentation of the EURODELTA III intercomparison exercise – evaluation of the chemistry transport models' performance on criteria pollutants and joint analysis with meteorology, Atmos. Chem. Phys., 16, 12667–12701, https://doi.org/10.5194/acp-16-12667-2016, 2016.
Binkowski, F. S., Arunachalam, S., Adelman, Z., and Pinto, J.: Examining photolysis rates with a prototype on-line photolysis module in CMAQ, J. Appl. Meteorol., 46, 1252–1256, https://doi.org/10.1175/JAM2531.1, 2007.
Byun, D. and Schere, K. L.: Review of the governing equations, computational algorithms, and other components of the Models-3 Community Multiscale Air Quality (CMAQ) modeling system, Appl. Mech. Rev., 59, 51–77, https://doi.org/10.1115/1.2128636, 2006.
Carmichael, G. R., Sakurai, T., Streets, D., Hozumi, Y., Ueda, H., Park, S. U., Fung, C., Han, Z., Kajino, M., Engardt, M., Bennet, C., Hayami, H., Sartelet, K., Holloway, T., Wang, Z., Kannari, A., Fu, J., Matsuda, K., Thongboonchoo, N., and Amann, M.: MICS-Asia II: The model intercomparison study for Asia Phase II methodology and overview of findings, Atmos. Environ., 42, 3468–3490, https://doi.org/10.1016/j.atmosenv.2007.04.007, 2008.
Chen, L., Gao, Y., Zhang, M., Fu, J. S., Zhu, J., Liao, H., Li, J., Huang, K., Ge, B., Wang, X., Lam, Y. F., Lin, C.-Y., Itahashi, S., Nagashima, T., Kajino, M., Yamaji, K., Wang, Z., and Kurokawa, J.: MICS-Asia III: multi-model comparison and evaluation of aerosol over East Asia, Atmos. Chem. Phys., 19, 11911–11937, https://doi.org/10.5194/acp-19-11911-2019, 2019.
CNEMC (China National Environmental Monitoring Centre): Technical Regulation for the Assessment of Urban Ambient Air Quality Index (AQI) Forecasts (Trial), Beijing, China, 2021.
Colella, P. and Woodward, P. R.: The Piecewise Parabolic Method (PPM) for gas-dynamical simulations, J. Comput. Phys., 54, 174–201, https://doi.org/10.1016/0021-9991(84)90143-8, 1984.
Crippa, M., Solazzo, E., Huang, G., Guizzardi, D., Koffi, E., Muntean, M., Schieberle, C., Friedrich, R., and Janssens-Maenhout, G.: High resolution temporal profiles in the Emissions Database for Global Atmospheric Research, Sci. Data, 7, 121, https://doi.org/10.1038/s41597-020-0462-2, 2020.
Eastham, S. D., Long, M. S., Keller, C. A., Lundgren, E., Yantosca, R. M., Zhuang, J., Li, C., Lee, C. J., Yannetti, M., Auer, B. M., Clune, T. L., Kouatchou, J., Putman, W. M., Thompson, M. A., Trayanov, A. L., Molod, A. M., Martin, R. V., and Jacob, D. J.: GEOS-Chem High Performance (GCHP v11-02c): a next-generation implementation of the GEOS-Chem chemical transport model for massively parallel applications, Geosci. Model Dev., 11, 2941–2953, https://doi.org/10.5194/gmd-11-2941-2018, 2018.
Emery, C., Jung, J., Koo, B., and Yarwood, G.: Improvements to CAMx Snow Cover Treatments and Carbon Bond Chemical Mechanism for Winter Ozone, Final Report, Ramboll Environ, Novato, CA, USA, https://www.camx.com/files/udaq_snowchem_final_6aug15.pdf (last access: 29 September 2026), 2015.
Emery, C., Baker, K., Wilson, G., and Yarwood, G.: Comprehensive air quality model with extensions: formulation and evaluation for ozone and particulate matter over the US, Atmosphere-Basel, 15, 1158, https://doi.org/10.3390/atmos15101158, 2024.
EPA: CMAQv5.3.3 User's Guide, U. S. Environmental Protection Agency, Research Triangle Park, NC, USA, Zenodo [code], https://doi.org/10.5281/zenodo.5213949, 2021.
EPICC-Model Working Group: Description and evaluation of the Emission and atmospheric Processes Integrated and Coupled Community (EPICC) Model version 1.0, Adv. Atmospheric Sci., https://doi.org/10.1007/s00376-025-4384-y, 2026a.
EPICC-Model Working Group: Emission and atmospheric Processes Integrated and Coupled Community Model (EPICC-Model) (Version 1.6.0), Zenodo [code], https://doi.org/10.5281/zenodo.20303367, 2026b.
Foley, K. M., Roselle, S. J., Appel, K. W., Bhave, P. V., Pleim, J. E., Otte, T. L., Mathur, R., Sarwar, G., Young, J. O., Gilliam, R. C., Nolte, C. G., Kelly, J. T., Gilliland, A. B., and Bash, J. O.: Incremental testing of the Community Multiscale Air Quality (CMAQ) modeling system version 4.7, Geosci. Model Dev., 3, 205–226, https://doi.org/10.5194/gmd-3-205-2010, 2010.
Fountoukis, C. and Nenes, A.: ISORROPIA II: a computationally efficient thermodynamic equilibrium model for aerosols, Atmos. Chem. Phys., 7, 4639–4659, https://doi.org/10.5194/acp-7-4639-2007, 2007.
Gao, C., Zhang, X., Xiu, A., Tong, Q., Zhao, H., Zhang, S., Yang, G., Zhang, M., and Xie, S.: Intercomparison of multiple two-way coupled meteorology and air quality models (WRF v4.1.1–CMAQ v5.3.1, WRF–Chem v4.1.1, and WRF v3.7.1–CHIMERE v2020r1) in eastern China, Geosci. Model Dev., 17, 2471–2492, https://doi.org/10.5194/gmd-17-2471-2024, 2024.
Gao, M., Han, Z., Liu, Z., Li, M., Xin, J., Tao, Z., Li, J., Kang, J.-E., Huang, K., Dong, X., Zhuang, B., Li, S., Ge, B., Wu, Q., Cheng, Y., Wang, Y., Lee, H.-J., Kim, C.-H., Fu, J. S., Wang, T., Chin, M., Woo, J.-H., Zhang, Q., Wang, Z., and Carmichael, G. R.: Air quality and climate change, Topic 3 of the Model Inter-Comparison Study for Asia Phase III (MICS-Asia III) – Part 1: Overview and model evaluation, Atmos. Chem. Phys., 18, 4859–4884, https://doi.org/10.5194/acp-18-4859-2018, 2018.
Gao, Y., Yan, F., Ma, M., Ding, A., Liao, H., Wang, S., Wang, X., Zhao, B., Cai, W., Su, H., Yao, X., and Gao, H.: Unveiling the dipole synergic effect of biogenic and anthropogenic emissions on ozone concentrations, Sci. Total Environ., 818, 151722, https://doi.org/10.1016/j.scitotenv.2021.151722, 2022.
Gao, Z. and Zhou, X.: A review of the CAMx, CMAQ, WRF-Chem and NAQPMS models: application, evaluation and uncertainty factors, Environ. Pollut., 343, 123183, https://doi.org/10.1016/j.envpol.2023.123183, 2024.
Geng, G., Liu, Y., Liu, Y., Liu, S., Cheng, J., Yan, L., Wu, N., Hu, H., Tong, D., Zheng, B., Yin, Z., He, K., and Zhang, Q.: Efficacy of China's clean air actions to tackle PM2.5 pollution between 2013 and 2020, Nat. Geosci., 17, 987–994, https://doi.org/10.1038/s41561-024-01540-z, 2024.
Gong, C. and Liao, H.: A typical weather pattern for ozone pollution events in North China, Atmos. Chem. Phys., 19, 13725–13740, https://doi.org/10.5194/acp-19-13725-2019, 2019.
Grell, G. A., Peckham, S. E., Schmitz, R., McKeen, S. A., Frost, G., Skamarock, W. C., and Eder, B.: Fully coupled “online” chemistry within the WRF model, Atmos. Environ., 39, 6957–6975, https://doi.org/10.1016/j.atmosenv.2005.04.027, 2005.
Guenther, A.: MEGANv3.21.tar.gz emission calculator code (Version 3.21), Zenodo [code], https://doi.org/10.5281/zenodo.10526206, 2024.
Guenther, A. B., Jiang, X., Heald, C. L., Sakulyanontvittaya, T., Duhl, T., Emmons, L. K., and Wang, X.: The Model of Emissions of Gases and Aerosols from Nature version 2.1 (MEGAN2.1): an extended and updated framework for modeling biogenic emissions, Geosci. Model Dev., 5, 1471–1492, https://doi.org/10.5194/gmd-5-1471-2012, 2012.
Haagen-Smit, A. J. and Fox, M. M.: Ozone formation in photochemical oxidation of organic substances, Ind. Eng. Chem., 48, 1484–1487, https://doi.org/10.1021/ie51400a033, 1956.
Henry, W.: III. Experiments on the quantity of gases absorbed by water, at different temperatures, and under different pressures, Philos. Trans. R. Soc. Lond., 93, 29–274, https://doi.org/10.1098/rstl.1803.0004, 1803.
Hogrefe, C., Liu, P., Pouliot, G., Mathur, R., Roselle, S., Flemming, J., Lin, M., and Park, R. J.: Impacts of different characterizations of large-scale background on simulated regional-scale ozone over the continental United States, Atmos. Chem. Phys., 18, 3839–3864, https://doi.org/10.5194/acp-18-3839-2018, 2018.
Hong, C., Zhang, Q., He, K., Guan, D., Li, M., Liu, F., and Zheng, B.: Variations of China's emission estimates: response to uncertainties in energy statistics, Atmos. Chem. Phys., 17, 1227–1239, https://doi.org/10.5194/acp-17-1227-2017, 2017.
Hong, S.-Y., Noh, Y., and Dudhia, J.: A new vertical diffusion package with an explicit treatment of entrainment processes, Mon. Weather Rev., 134, 2318–2341, https://doi.org/10.1175/MWR3199.1, 2006.
Huang, L., Zhu, Y., Zhai, H., Xue, S., Zhu, T., Shao, Y., Liu, Z., Emery, C., Yarwood, G., Wang, Y., Fu, J., Zhang, K., and Li, L.: Recommendations on benchmarks for numerical air quality model applications in China – Part 1: PM2.5 and chemical species, Atmos. Chem. Phys., 21, 2725–2743, https://doi.org/10.5194/acp-21-2725-2021, 2021.
Huang, L., Liu, H., Yarwood, G., Wilson, G., Tao, J., Han, Z., Ji, D., Wang, Y., and Li, L.: Modeling of secondary organic aerosols (SOA) based on two commonly used air quality models in China: consistent S/IVOCs contribution but large differences in SOA aging, Sci. Total Environ., 903, 166162, https://doi.org/10.1016/j.scitotenv.2023.166162, 2023.
Huang, X., Song, Y., Li, M., Li, J., Huo, Q., Cai, X., Zhu, T., Hu, M., and Zhang, H.: A high-resolution ammonia emission inventory in China, Global Biogeochem. Cy., 26, GB1030, https://doi.org/10.1029/2011GB004161, 2012a.
Huang, X., Li, M., Li, J., and Song, Y.: A high-resolution emission inventory of crop burning in fields in China based on MODIS Thermal Anomalies/Fire products, Atmos. Environ., 50, 9–15, https://doi.org/10.1016/j.atmosenv.2012.01.017, 2012b.
Iacono, M. J., Delamere, J. S., Mlawer, E. J., Shephard, M. W., Clough, S. A., and Collins, W. D.: Radiative forcing by long-lived greenhouse gases: calculations with the AER radiative transfer models, J. Geophys. Res., 113, D13103, https://doi.org/10.1029/2008JD009944, 2008.
Itahashi, S., Ge, B., Sato, K., Fu, J. S., Wang, X., Yamaji, K., Nagashima, T., Li, J., Kajino, M., Liao, H., Zhang, M., Wang, Z., Li, M., Kurokawa, J., Carmichael, G. R., and Wang, Z.: MICS-Asia III: overview of model intercomparison and evaluation of acid deposition over Asia, Atmos. Chem. Phys., 20, 2667–2693, https://doi.org/10.5194/acp-20-2667-2020, 2020.
Jia, W., Zhang, X., Wang, H., Wang, Y., Wang, D., Zhong, J., Zhang, W., Zhang, L., Guo, L., Lei, Y., Wang, J., Yang, Y., and Lin, Y.: Comprehensive evaluation of typical planetary boundary layer (PBL) parameterization schemes in China – Part 1: Understanding expressiveness of schemes for different regions from the mechanism perspective, Geosci. Model Dev., 16, 6635–6670, https://doi.org/10.5194/gmd-16-6635-2023, 2023.
Jiang, F., Guo, H., Wang, T. J., Cheng, H. R., Wang, X. M., Simpson, I. J., Ding, A. J., Saunders, S. M., Lam, S. H. M., and Blake, D. R.: An ozone episode in the Pearl River Delta: field observation and model simulation, J. Geophys. Res.-Atmos., 115, 2009JD013583, https://doi.org/10.1029/2009JD013583, 2010.
Jiménez, P. A. and Dudhia, J.: On the ability of the WRF model to reproduce the surface wind direction over complex terrain, J. Appl. Meteorol., 52, 1610–1617, https://doi.org/10.1175/JAMC-D-12-0266.1, 2013.
Jing, Z., Liu, P., Wang, T., Song, H., Lee, J., Xu, T., and Xing, Y.: Effects of meteorological factors and anthropogenic precursors on PM2.5 concentrations in cities in China, Sustainability, 12, 3550, https://doi.org/10.3390/su12093550, 2020.
Kain, J. S.: The Kain–Fritsch convective parameterization: an update, J. Appl. Meteorol., 43, 170–181, https://doi.org/10.1175/1520-0450(2004)043<0170:TKCPAU>2.0.CO;2, 2004.
Kang, Y., Liu, M., Song, Y., Huang, X., Yao, H., Cai, X., Zhang, H., Kang, L., Liu, X., Yan, X., He, H., Zhang, Q., Shao, M., and Zhu, T.: High-resolution ammonia emissions inventories in China from 1980 to 2012, Atmos. Chem. Phys., 16, 2043–2058, https://doi.org/10.5194/acp-16-2043-2016, 2016.
Kim, D.-J., Kim, T.-H., Choi, J.-Y., Lee, J., Kim, R.-H., Son, J.-S., and Lee, D.: The impact of vertical eddy diffusivity changes in the CMAQ Model on PM2.5 concentration variations in northeast Asia: focusing on the Seoul Metropolitan Area, Atmosphere-Basel, 15, 376, https://doi.org/10.3390/atmos15030376, 2024.
Kong, L., Tang, X., Zhu, J., Wang, Z., Pan, Y., Wu, H., Wu, L., Wu, Q., He, Y., Tian, S., Xie, Y., Liu, Z., Sui, W., Han, L., and Carmichael, G.: Improved inversion of monthly ammonia emissions in China based on the Chinese ammonia monitoring network and ensemble Kalman filter, Environ. Sci. Technol., 53, 12529–12538, https://doi.org/10.1021/acs.est.9b02701, 2019.
Li, B., Gao, J., Chen, C., Wen, L., Zhang, Y., Li, J., Zhang, Y., Du, X., Zhang, K., and Wang, J.: Exploring HONO production from particulate nitrate photolysis in representative regions of China: characteristics, influencing factors, and environmental implications, Atmos. Chem. Phys., 24, 13183–13198, https://doi.org/10.5194/acp-24-13183-2024, 2024.
Li, J., Nagashima, T., Kong, L., Ge, B., Yamaji, K., Fu, J. S., Wang, X., Fan, Q., Itahashi, S., Lee, H.-J., Kim, C.-H., Lin, C.-Y., Zhang, M., Tao, Z., Kajino, M., Liao, H., Li, M., Woo, J.-H., Kurokawa, J., Wang, Z., Wu, Q., Akimoto, H., Carmichael, G. R., and Wang, Z.: Model evaluation and intercomparison of surface-level ozone and relevant species in East Asia in the context of MICS-Asia Phase III – Part 1: Overview, Atmos. Chem. Phys., 19, 12993–13015, https://doi.org/10.5194/acp-19-12993-2019, 2019a.
Li, K., Jacob, D. J., Liao, H., Zhu, J., Shah, V., Shen, L., Bates, K. H., Zhang, Q., and Zhai, S.: A two-pollutant strategy for improving ozone and particulate air quality in China, Nat. Geosci., 12, 906–910, https://doi.org/10.1038/s41561-019-0464-x, 2019b.
Li, R., Ma, X., Xiong, F., Jia, H., Sha, T., and Tian, R.: Comparisons and evaluation of aerosol burden and optical depth in CMIP5 simulations over East Asia, J. Atmospheric Sol.-Terr. Phys., 206, 105315, https://doi.org/10.1016/j.jastp.2020.105315, 2020.
Li, X., Hussain, S. A., Sobri, S., and Md Said, M. S.: Overviewing the air quality models on air pollution in Sichuan Basin, China, Chemosphere, 271, 129502, https://doi.org/10.1016/j.chemosphere.2020.129502, 2021.
Liu, Z., Zhou, M., Chen, Y., Chen, D., Pan, Y., Song, T., Ji, D., Chen, Q., and Zhang, L.: The nonlinear response of fine particulate matter pollution to ammonia emission reductions in North China, Environ. Res. Lett., 16, 034014, https://doi.org/10.1088/1748-9326/abdf86, 2021.
Lou, M. and Wu, Q.: The dataset of the manuscript “Evaluating the EPICC-Model for Regional Air Quality Simulation: A Comparative Study with CAMx and CMAQ”, Zenodo [data set], https://doi.org/10.5281/zenodo.21017233, 2026.
Lou, M., Wu, Q., Li, J., Cheng, H., Zhu, J., Wang, L., and Wang, Z.: The amplification effect of El Niño on winter heavy pollution frequency in Beijing, Environ. Res. Lett., 20, 074043, https://doi.org/10.1088/1748-9326/ade1ee, 2025.
Lyu, Y., Wu, D., Han, F., Zhang, H., Lv, F., Kang, A., Hu, Y., and Pang, X.: Co-occurring extremes of PM2.5 and ozone in warm seasons of the Yangtze River Delta of China: insights from explainable machine learning, ACS EST Air, 2, 578–588, https://doi.org/10.1021/acsestair.4c00314, 2025.
Mathur, R., Xing, J., Gilliam, R., Sarwar, G., Hogrefe, C., Pleim, J., Pouliot, G., Roselle, S., Spero, T. L., Wong, D. C., and Young, J.: Extending the Community Multiscale Air Quality (CMAQ) modeling system to hemispheric scales: overview of process considerations and initial applications, Atmos. Chem. Phys., 17, 12449–12474, https://doi.org/10.5194/acp-17-12449-2017, 2017.
MEE (Ministry of Ecology and Environment of the People's Republic of China): Technical Guideline for Numerical Forecasting of Ambient Air Quality (HJ 1130–2020), Beijing, China, 2020, https://www.mee.gov.cn/ywgz/fgbz/bz/bzwb/jcffbz/202005/t20200518_779714.shtml, last access: 8 August 2026.
Miao, R., Chen, Q., Zheng, Y., Cheng, X., Sun, Y., Palmer, P. I., Shrivastava, M., Guo, J., Zhang, Q., Liu, Y., Tan, Z., Ma, X., Chen, S., Zeng, L., Lu, K., and Zhang, Y.: Model bias in simulating major chemical components of PM2.5 in China, Atmos. Chem. Phys., 20, 12265–12284, https://doi.org/10.5194/acp-20-12265-2020, 2020.
Murphy, B. N., Woody, M. C., Jimenez, J. L., Carlton, A. M. G., Hayes, P. L., Liu, S., Ng, N. L., Russell, L. M., Setyan, A., Xu, L., Young, J., Zaveri, R. A., Zhang, Q., and Pye, H. O. T.: Semivolatile POA and parameterized total combustion SOA in CMAQv5.2: impacts on source strength and partitioning, Atmos. Chem. Phys., 17, 11107–11133, https://doi.org/10.5194/acp-17-11107-2017, 2017.
NCEP: NCEP FNL Operational Model Global Tropospheric Analyses, continuing from July 1999, National Centers for Environmental Prediction [data set], https://doi.org/10.5065/D6M043C6, 2000.
Nenes, A., Pandis, S. N., and Pilinis, C.: ISORROPIA: a new thermodynamic equilibrium model for multiphase multicomponent inorganic aerosols, Aquat. Geochem., 4, 123–152, https://doi.org/10.1023/A:1009604003981, 1998.
Odum, J. R., Jungkamp, T. P. W., Griffin, R. J., Forstner, H. J. L., Flagan, R. C., and Seinfeld, J. H.: The atmospheric aerosol-forming potential of whole gasoline vapor, Science, 276, 96–99, https://doi.org/10.1126/science.276.5309.96, 1997.
Oyegbile, O., Chan, A., Ooi, M., Anwar, P., Mohamed, A. A., and Li, L.: Evaluation of WRF model performance with different microphysics schemes for extreme rainfall prediction in Lagos, Nigeria: implications for urban flood risk management, Bull. Atmospheric Sci. Technol., 5, 19, https://doi.org/10.1007/s42865-024-00081-y, 2024.
Pandis, S. N., Harley, R. A., Cass, G. R., and Seinfeld, J. H.: Secondary organic aerosol formation and transport, Atmos. Environ., 26, 2269–2282, https://doi.org/10.1016/0960-1686(92)90358-r, 1992.
Pennington, E. A., Seltzer, K. M., Murphy, B. N., Qin, M., Seinfeld, J. H., and Pye, H. O. T.: Modeling secondary organic aerosol formation from volatile chemical products, Atmos. Chem. Phys., 21, 18247–18261, https://doi.org/10.5194/acp-21-18247-2021, 2021.
Pleim, J. E.: A combined local and nonlocal closure model for the atmospheric boundary layer. Part I: Model description and testing, J. Appl. Meteorol., 46, 1383–1395, https://doi.org/10.1175/JAM2539.1, 2007.
Ramboll: CAMx User's Guide, version 7.00, Ramboll, Novato, CA, USA, https://www.camx.com/Files/CAMxUsersGuide_v7.00.pdf (last access: 29 September 2026), 2020.
Ren, F., Lin, J., Xu, C., Adeniran, J. A., Wang, J., Martin, R. V., van Donkelaar, A., Hammer, M. S., Horowitz, L. W., Turnock, S. T., Oshima, N., Zhang, J., Bauer, S., Tsigaridis, K., Seland, Ø., Nabat, P., Neubauer, D., Strand, G., van Noije, T., Le Sager, P., and Takemura, T.: Evaluation of CMIP6 model simulations of PM2.5 and its components over China, Geosci. Model Dev., 17, 4821–4836, https://doi.org/10.5194/gmd-17-4821-2024, 2024.
Ren, J., Guo, F., and Xie, S.: Diagnosing ozone–NOx–VOC sensitivity and revealing causes of ozone increases in China based on 2013–2021 satellite retrievals, Atmos. Chem. Phys., 22, 15035–15047, https://doi.org/10.5194/acp-22-15035-2022, 2022.
Seinfeld, J. H. and Pandis, S. N.: Atmospheric Chemistry and Physics: From Air Pollution to Climate Change, 3rd edn., John Wiley and Sons, Hoboken, NJ, USA, ISBN 9781118947401, 2016.
Shao, J., Chen, Q., Wang, Y., Lu, X., He, P., Sun, Y., Shah, V., Martin, R. V., Philip, S., Song, S., Zhao, Y., Xie, Z., Zhang, L., and Alexander, B.: Heterogeneous sulfate aerosol formation mechanisms during wintertime Chinese haze events: air quality model assessment using observations of sulfate oxygen isotopes in Beijing, Atmos. Chem. Phys., 19, 6107–6123, https://doi.org/10.5194/acp-19-6107-2019, 2019.
Sillman, S.: The relation between ozone, NOx and hydrocarbons in urban and polluted rural environments, Atmos. Environ., 33, 1821–1845, https://doi.org/10.1016/S1352-2310(98)00345-8, 1999.
Skamarock, W. C., Klemp, J. B., Dudhia, J., Gill, D. O., Barker, D., Duda, M. G., Huang, X. Y., Wang, W., and Powers, J. G.: A description of the Advanced Research WRF version 3, NCAR Technical note-475+STR, https://doi.org/10.5065/D68S4MVH, 2008.
Song, Y., Liu, B., Miao, W., Chang, D., and Zhang, Y.: Spatiotemporal variation in nonagricultural open fire emissions in China from 2000 to 2007, Global Biogeochem. Cy., 23, 2008GB003344, https://doi.org/10.1029/2008GB003344, 2009.
Tang, W., Cohan, D. S., Morris, G. A., Byun, D. W., and Luke, W. T.: Influence of vertical mixing uncertainties on ozone simulation in CMAQ, Atmos. Environ., 45, 2898–2909, https://doi.org/10.1016/j.atmosenv.2011.01.057, 2011.
Tewari, M., Chen, F., Wang, W., Dudhia, J., LeMone, M. A., Mitchell, K., Ek, M., Gayno, G., Wegiel, J., and Cuenca, R. H.: Implementation and verification of the unified Noah land-surface model in the WRF model, 20th Conference on Weather Analysis and Forecasting/16th Conference on Numerical Weather Prediction, Seattle, WA, USA, 11–15 January 2004, https://ams.confex.com/ams/pdfpapers/69061.pdf (last access: 29 September 2026), 2004.
The International GEOS-Chem User Community: geoschem/geos-chem: GEOS-Chem 14.5.1, Zenodo [code], https://doi.org/10.5281/zenodo.14629792, 2025.
Thompson, G., Field, P. R., Rasmussen, R. M., and Hall, W. D.: Explicit forecasts of winter precipitation using an improved bulk microphysics scheme. Part II: Implementation of a new snow parameterization, Mon. Weather Rev., 136, 5095–5115, https://doi.org/10.1175/2008MWR2387.1, 2008.
US EPA Office of Research and Development: CMAQ (Version 5.3.3), Zenodo [code], https://doi.org/10.5281/zenodo.5213949, 2021.
Walcek, C. J. and Aleksic, N. M.: A simple but accurate mass conservative, peak-preserving, mixing ratio bounded advection algorithm with FORTRAN code, Atmos. Environ., 32, 3863–3880, https://doi.org/10.1016/S1352-2310(98)00099-5, 1998.
Walcek, C. J. and Taylor, G. R.: A theoretical method for computing vertical distributions of acidity and sulfate production within cumulus clouds, J. Atmos. Sci., 43, 339–355, https://doi.org/10.1175/1520-0469(1986)043<0339:ATMFCV>2.0.CO;2, 1986.
Wang, H., Lu, X., Palmer, P. I., Zhang, L., Lu, K., Li, K., Nagashima, T., Koo, J.-H., Tanimoto, H., Wang, H., Gao, M., He, C., Wu, K., Fan, S., and Zhang, Y.: Deciphering decadal urban ozone trends from historical records since 1980, Natl. Sci. Rev., 11, nwae369, https://doi.org/10.1093/nsr/nwae369, 2024.
Wang, W., Li, X., Shao, M., Hu, M., Zeng, L., Wu, Y., and Tan, T.: The impact of aerosols on photolysis frequencies and ozone production in Beijing during the 4-year period 2012–2015, Atmos. Chem. Phys., 19, 9413–9429, https://doi.org/10.5194/acp-19-9413-2019, 2019.
Wang, W., Liu, M., Wang, T., Song, Y., Zhou, L., Cao, J., Hu, J., Tang, G., Chen, Z., Li, Z., Xu, Z., Peng, C., Lian, C., Chen, Y., Pan, Y., Zhang, Y., Sun, Y., Li, W., Zhu, T., Tian, H., and Ge, M.: Sulfate formation is dominated by manganese-catalyzed oxidation of SO2 on aerosol surfaces during haze events, Nat. Commun., 12, 1993, https://doi.org/10.1038/s41467-021-22091-6, 2021.
Wang, W., Chen, H., Wang, Z., Li, J., Chen, X., Yu, F., Fan, X., Zhao, S., Hu, B., Wang, W., Tang, X., Wang, Z., Ge, B., and Wu, J.: Development and evaluation of photolysis and gas-phase reaction scheme in EPICC-model: impacts on tropospheric ozone simulation, Atmos. Environ., 359, 121373, https://doi.org/10.1016/j.atmosenv.2025.121373, 2025.
Wang, X., Zhang, Y., Hu, Y., Zhou, W., Lu, K., Zhong, L., Zeng, L., Shao, M., Hu, M., and Russell, A. G.: Process analysis and sensitivity study of regional ozone formation over the Pearl River Delta, China, during the PRIDE-PRD2004 campaign using the Community Multiscale Air Quality modeling system, Atmos. Chem. Phys., 10, 4423–4437, https://doi.org/10.5194/acp-10-4423-2010, 2010.
Wang, Y., Jiang, S., Huang, L., Lu, G., Kasemsan, M., Yaluk, E. A., Liu, H., Liao, J., Bian, J., Zhang, K., Chen, H., and Li, L.: Differences between VOCs and NOx transport contributions, their impacts on O3, and implications for O3 pollution mitigation based on CMAQ simulation over the Yangtze River Delta, China, Sci. Total Environ., 872, 162118, https://doi.org/10.1016/j.scitotenv.2023.162118, 2023.
Wen, W., Shen, S., Liu, L., Ma, X., Wei, Y., Wang, J., Xing, Y., and Su, W.: Comparative analysis of PM2.5 and O3 source in Beijing using a chemical transport model, Remote Sens.-Basel, 13, 3457, https://doi.org/10.3390/rs13173457, 2021.
Wu, Q., Wang, Z., Chen, H., Zhou, W., and Wenig, M.: An evaluation of air quality modeling over the Pearl River Delta during November 2006, Meteorol. Atmospheric Phys., 116, 113–132, https://doi.org/10.1007/s00703-011-0179-z, 2012.
Xiao, Q., Geng, G., Xue, T., Liu, S., Cai, C., He, K., and Zhang, Q.: Tracking PM2.5 and O3 pollution and the related health burden in China 2013–2020, Environ. Sci. Technol., 56, 6922–6932, https://doi.org/10.1021/acs.est.1c04548, 2022.
Xu, W., Ning, L., and Luo, Y.: Applying satellite data assimilation to wind simulation of coastal wind farms in Guangdong, China, Remote Sens.-Basel, 12, 973, https://doi.org/10.3390/rs12060973, 2020.
Yang, J., Qu, Y., Chen, Y., Zhang, J., Liu, X., Niu, H., and An, J.: Dominant physical and chemical processes impacting nitrate in Shandong of the North China Plain during winter haze events, Sci. Total Environ., 912, 169065, https://doi.org/10.1016/j.scitotenv.2023.169065, 2024.
Yarwood, G., Rao, S., Yocke, M., and Whitten, G. Z.: Updates to the Carbon Bond Chemical Mechanism: CB05, Final Report RT-04-00675, U. S. Environmental Protection Agency, Research Triangle Park, NC, USA, https://www.camx.com/Files/CB05_Final_Report_120805.pdf (last access: 29 September 2026), 2005.
Yarwood, G., Shi, Y., and Beardsley, R.: Impact of CB6r5 mechanism changes on air pollutant modeling in Texas, Final Report, Work Order No. 582-20-11221-014, Texas Commission on Environmental Quality, Austin, TX, USA, https://wayback.archive-it.org/414/20210529064250/https://www.tceq.texas.gov/assets/public/implementation/air/am/contracts/reports/pm/5822011221014-20200730-Ramboll-CB6r5MechanismChanges.pdf (last access: 8 October 2026), 2020.
Yu, E., Ma, J., and Sun, J.: Developing a climate prediction system over Southwest China using the 8-km Weather Research and Forecasting (WRF) model: system design, model calibration, and performance evaluation, Weather Forecast., 37, 1703–1719, https://doi.org/10.1175/WAF-D-21-0188.1, 2022a.
Yu, E., Bai, R., Chen, X., and Shao, L.: Impact of physical parameterizations on wind simulation with WRF V3.9.1.1 under stable conditions at planetary boundary layer gray-zone resolution: a case study over the coastal regions of North China, Geosci. Model Dev., 15, 8111–8134, https://doi.org/10.5194/gmd-15-8111-2022, 2022b.
Zhai, S., Jacob, D. J., Wang, X., Liu, Z., Wen, T., Shah, V., Li, K., Moch, J. M., Bates, K. H., Song, S., Shen, L., Zhang, Y., Luo, G., Yu, F., Sun, Y., Wang, L., Qi, M., Tao, J., Gui, K., Xu, H., Zhang, Q., Zhao, T., Wang, Y., Lee, H. C., Choi, H., and Liao, H.: Control of particulate nitrate air pollution in China, Nat. Geosci., 14, 389–395, https://doi.org/10.1038/s41561-021-00726-z, 2021.
Zhang, J., Lian, C., Wang, W., Ge, M., Guo, Y., Ran, H., Zhang, Y., Zheng, F., Fan, X., Yan, C., Daellenbach, K. R., Liu, Y., Kulmala, M., and An, J.: Amplified role of potential HONO sources in O3 formation in North China Plain during autumn haze aggravating processes, Atmos. Chem. Phys., 22, 3275–3302, https://doi.org/10.5194/acp-22-3275-2022, 2022.
Zhang, J. L., Wang, W. D., Zhu, K. Y., Huang, Z. J., Sheng, L., Liao, S. D., Yuan, X., Hu, Y. N., Liu, J. P., Tang, M. X., Huang, X. F., Li, J., Wang, Z. F., and Zheng, J. Y.: The potentials of uncertainty analysis and Bayesian optimization in HONO source modeling diagnosis and improvement, Environ. Res., 276, 121494, https://doi.org/10.1016/j.envres.2025.121494, 2025.
Zhang, L., Gong, S., Padro, J., and Barrie, L.: A size-segregated particle dry deposition scheme for an atmospheric aerosol module, Atmos. Environ., 35, 549–560, https://doi.org/10.1016/S1352-2310(00)00326-5, 2001.
Zhang, L., Brook, J. R., and Vet, R.: A revised parameterization for gaseous dry deposition in air-quality models, Atmos. Chem. Phys., 3, 2067–2082, https://doi.org/10.5194/acp-3-2067-2003, 2003.
Zhang, X. Y., Wang, Y. Q., Niu, T., Zhang, X. C., Gong, S. L., Zhang, Y. M., and Sun, J. Y.: Atmospheric aerosol compositions in China: spatial/temporal variability, chemical signature, regional haze distribution and comparisons with global aerosols, Atmos. Chem. Phys., 12, 779–799, https://doi.org/10.5194/acp-12-779-2012, 2012.
Zhang, Y. and Arunachalam, S.: A call for an aloft air quality monitoring network: need, feasibility, and potential value, Environ. Sci. Technol., 52, 10903–10908, https://doi.org/10.1021/acs.est.8b02496, 2018.
Zhu, Q., Yu, Y., Gong, H., Wang, Y., Wang, H., Wang, W., Xu, B., and Cheng, T.: Spatio-temporal characteristics of PM2.5 and O3 synergic pollutions and influence factors in the Yangtze River Delta, Front. Environ. Sci., 10, 1104013, https://doi.org/10.3389/fenvs.2022.1104013, 2022.