
the Creative Commons Attribution 4.0 License.
the Creative Commons Attribution 4.0 License.
 | 14 Sep 2026
Simulating the impacts of utility-scale photovoltaic installations with a physically based coupled WRF-PV model
Yiran Chen
Jiming Jin

Yimin Liu
Jannik Heusinger
Jesús Carrera
Zeyu Zhou
Utility-scale photovoltaic (PV) installations are expanding so significantly that they may alter the surface energy balance and affect the local climate. Yet, simplified or non-coupled PV schemes in regional climate models limit the representation of the PV climatic impacts. In this study, we developed a physically based, fully coupled WRF-PV model based on the Weather Research and Forecasting (WRF) model. WRF-PV maintains surface energy balance closure between the PV panels and the ground and enables the PV-induced radiative and thermal effects to feed back to the atmosphere dynamically. We used this model to perform two regional simulations, WRF_PV (with PV panels) and WRF_CTL (without PV panels), in northwestern China, a major PV deployment region. Our results indicated that WRF_PV captured observed spatial and diurnal climate features. Evaluation against MODIS showed that WRF-PV improved the simulation of skin temperature over PV installations, reducing the RMSE from 3.071 °C in WRF_CTL to 2.560 °C in WRF_PV. PV installations reduced daytime skin temperature by 1.6 °C but warmed near-surface air by 1.2 °C in summer. Additionally, we identified PV-induced atmospheric feedback including an increase in cloud fraction, resulting in a reduction in downward SW radiation of about 1.2 %, as well as a pronounced spatial redistribution of precipitation. This study shows that modeling PV-land surface processes is needed for regional climate models to adequately simulate the impacts of utility-scale PV installations.
- Article
(12689 KB) - Full-text XML
-
Supplement
(429 KB) - BibTeX
- EndNote


Solar energy has grown rapidly worldwide, motivated by the urgent need to abate greenhouse gas emissions and promote the sustainable energy transition (Haegel et al., 2019). Photovoltaic (PV) power, in particular, has expanded rapidly, and utility-scale PV farms have become a major contributor to new renewable energy capacity (IRENA, 2019). By 2022, the global cumulative PV capacity had reached 1064 GW, with China alone accounting for 393 GW, corresponding to more than 3000 km2 of installed PV area (IRENA, 2023; Lyu et al., 2024a), 4.5 times the area within the Fifth Ring Road of Beijing. A considerable portion of these installations is located in semi-arid and arid regions where abundant solar resources and land availability support utility-scale PV facilities (Lyu et al., 2024b). The rapid expansion of utility-scale PV deployment therefore calls for a systematic assessment of its environmental consequences and representation in regional climate models.
Utility-scale PV installations may induce a range of environmental impacts, including changes in surface properties and local climate conditions (Turney and Fthenakis, 2011; Barron-Gafford et al., 2019). PV installations replace natural land cover with panel arrays and modify surface physical characteristics. Over barren land, utility-scale PV installations reduce surface albedo and enhance shortwave absorption by the panels, while panel shading decreases the downward shortwave radiation reaching the underlying ground (Armstrong et al., 2016; Fan and Huang, 2020; Yue et al., 2021; Li et al., 2022; Ying et al., 2023; Wei et al., 2024; Zhang et al., 2024). Furthermore, PV panels have a lower heat capacity than natural surfaces, causing rapid thermal responses and limited heat storage (Hasan et al., 2016). Key PV system design parameters, such as panel tilt angle, row spacing, orientation, tracking systems, and mounting height, strongly influence surface albedo, shading patterns, and heat exchange processes (Smith et al., 2022; Stanislawski et al., 2022). These factors can modulate the magnitude and spatiotemporal characteristics of PV-induced radiative and thermal effects (Glick et al., 2020; Zainali et al., 2023). These changes in surface properties indicate that utility-scale PV farms represent a new engineered land-surface type with distinct radiative and thermal properties, which need to be explicitly represented in regional climate models.
Observational studies, including in situ field measurements and satellite-based remote sensing analyses, provide valuable insights into key microclimatic responses to utility-scale PV deployment. Field measurements across multiple PV farms in semi-arid regions revealed qualitatively consistent microclimatic responses, although their magnitudes varied among sites. During daytime, observed skin temperature changes ranged from almost 0 to cooling of 4 °C, while nighttime responses spanned from a slight warming of 0.1 °C to cooling of 2.3 °C (Yang et al., 2017; Chang et al., 2018; Jiang et al., 2021). These skin temperatures were retrieved from emitted longwave radiation, and uncertainties in surface emissivity contributed to the variability in the estimated temperatures. For near-surface air temperature, daytime warming ranged from 0.2 to 2.6 °C, whereas nighttime effects ranged from weak warming of 0.1 to 0.7 °C to cooling of 0.2 to 1.8 °C (Barron-Gafford et al., 2016; Yang et al., 2017; Broadbent et al., 2019; Wu et al., 2020; Jiang et al., 2021; Li et al., 2023; Zhang et al., 2024). For surface energy fluxes, sensible heat flux increased, with reported daytime enhancements of 25 to 50 W m−2 and a daily mean rise of about 18 W m−2, while both latent heat flux and ground heat flux decreased within PV installations (Broadbent et al., 2019; Jiang et al., 2021). Remote sensing analyses similarly reported daytime surface cooling of approximately 0.5 to 2 °C across utility-scale PV farms over broad regions, with nighttime effects generally weaker and ranging from slight cooling to modest warming (Zhang and Xu, 2020; Fan and Huang, 2021; Li et al., 2021; Wang et al., 2024; Xu et al., 2024). Overall, these observations showed that utility-scale PV installations can systematically alter multiple components of the land–atmosphere system. These observed microclimatic responses, together with the physical-property changes discussed above, highlight the need for a PV representation that integrates the relevant radiative and thermal processes within a consistent surface-energy framework.
Existing climate model studies generally represented PV installations using simplified or highly parameterized approaches. Previous studies often simulated PV impacts by prescribing an effective albedo, which was defined as the sum of panel albedo and the fraction of solar radiation converted to electricity. Based on this method, simulations with PV deployed across the Sahara showed global impacts on temperature, precipitation, and cloudiness (Hu et al., 2016; Li et al., 2018; Lu et al., 2021; Long et al., 2024). However, the conclusions depended strongly on the assumed efficiency value, and the energy-balance processes of the panels were not included in their simulations. Several studies incorporated PV effects into the Weather Research and Forecasting (WRF) model through highly parameterized schemes. These schemes modified radiative and heat flux fields to represent the influence of PV installations on the atmosphere (Chang et al., 2020, 2022). Yet, these schemes lacked energy balance closure and physical generality, limiting their ability to represent PV-related processes. Therefore, a scheme that ensures energy balance closure and explicitly resolves the energy exchanges among PV panels, the land surface, and the atmosphere is required in climate models.
Heusinger et al. (2020) developed a PV energy balance model, UCRC-Solar, which resolves PV panel surface temperature and the radiative and thermal exchanges of PV panels. UCRC-Solar was run offline and driven by external meteorological data. The rooftop evaluation further showed that UCRC-Solar captured PV surface temperature and power production in real conditions (Heusinger et al., 2021). Recent studies advanced UCRC-Solar by representing PV arrays as a canopy layer and parameterizing sensible heat exchange using canopy aerodynamic resistances (Li et al., 2024). Another study then integrated this scheme into WRF in a one-way coupling framework to simulate the local microclimate effects of PV deployment (Li et al., 2025b). However, the one-way coupling prevents PV-induced radiative and thermal changes from feeding back into the boundary layer. Yin et al. (2025) coupled the UCRC-Solar rooftop PV energy-balance model within the BEP-BEM scheme in WRF and used this system to investigate the impacts of rooftop PV installations on urban microclimate. However, fully coupled implementations of UCRC-Solar have not been extended to represent utility-scale PV farms in regional climate models. Hence, the lack of a fully coupled PV scheme with energy balance closure for utility-scale farms remains a limitation, as PV installations substantially alter radiative forcing, energy partitioning, and local meteorological conditions.
To address these gaps, this study presents WRF-PV, a physically based and fully coupled PV–ground–atmosphere scheme implemented in the WRF model. WRF-PV maintains surface energy closure between PV panels and the ground and allows the PV-induced thermal and radiative effects to interact dynamically with the atmosphere. The coupled model was applied to northwestern China, a major utility-scale PV deployment region characterized by semi-arid and arid environments, for the summers of 2018–2024. Paired simulations with and without PV panels were evaluated against reanalysis data, satellite products, and station observations, and were further used to demonstrate the effects of PV-induced surface energy changes on near-surface meteorology and regional climate. This study provides a physically consistent modeling framework for representing utility-scale PV installations in regional climate models.
2.1 Energy balance of PV panel
The energy balance of PV panels used in this study follows the formulation of Heusinger et al. (2020), and the surface temperature of PV panels (TPV) is governed by the energy balance equation:
where Cmodule is the effective heat capacity of the PV panel (J K−1 m−2); SWtot is the total absorbed shortwave radiation by the panel (W m−2); is the net longwave radiation flux into the panel (W m−2); QH,PV represents the sensible heat flux from the panel to the ambient air (W m−2); Pout denotes the electrical power output (W m−2).
SWtot is calculated as in Heusinger et al. (2021), with the rear-side contribution additionally included (Coimbra, 2025):
Equation (2) separates SWtot into contributions from the front and rear surfaces. SWdir, SWdif, and SWdown are the direct, diffuse, and total incoming shortwave radiation fluxes (W m−2), respectively. The three terms within the first parentheses represent the shortwave radiation incident on the front surface. The first term represents direct radiation, where projects the direct radiation from the horizontal plane to the tilted panel surface. θzh represents the solar zenith angle (°); θh is the incidence angle on the tilted panel (°). The second term represents diffuse radiation and is weighted by the unobstructed front-surface sky-view factor, , where β denotes the panel tilt angle (°). The third term represents ground-reflected shortwave radiation received by the front surface and is weighted by the unobstructed front-surface ground-view factor , where αG is the surface albedo of the underlying ground. αPV,top denotes the albedo of the front PV surface, calculated from the Fresnel law as an angle-dependent reflectance. The fourth term represents ground-reflected shortwave radiation received by the rear surface of the PV panel. This component is weighted by the unobstructed view factor from the rear surface to the ground . αPV,btm denotes the albedo of the rear PV surface and is prescribed as a constant value. fPV is the horizontally projected fractional surface coverage of PV panels and is used as an approximation of the shaded area fraction (Masson et al., 2014).
is determined by the difference between the incoming and outgoing radiation at the PV panel, following Wallace and Hobbs (2006). The incoming longwave radiation is calculated by considering the contributions from the sky, ground, and neighboring PV panels, while the outgoing term consists of radiation emitted from the front and rear surfaces of the PV panel. is given by:
where σ is the Stefan–Boltzmann constant (5.67×10⁻⁸ W m−2 K−4); LWdown denotes the total downward longwave radiation from the atmosphere (W m−2). ϵG, ϵtop, and ϵbtm denote the emissivities of the ground and the front and rear surfaces of the PV panel, respectively. TG is the ground surface temperature (K). SVFPV, PVFPV, and GVFPV denote the view factor of sky, adjacent PV panels, and ground from PV panels, respectively, which can be calculated following the geometric method described in Heusinger et al. (2020). The view-factor calculation is based on a PV-row configuration in which panels are arranged in parallel, equally spaced rows with the same mounting height, tilt angle, and azimuth orientation. In Eq. (3), the first term on the right-hand side represents atmospheric longwave radiation received by the front surface of the panel. The second term represents longwave radiation emitted by the ground and received by the rear surface of the panel. The third and fourth terms represent longwave radiation emitted by adjacent PV panels and received by the front and rear surfaces of the target panel, respectively. The last two terms represent longwave radiation emitted outward by the front and rear surfaces of the target panel.
The sensible heat flux is calculated as:
where TA denotes the ambient air temperature (K). hc denotes the combined convective heat-transfer coefficient (W m−2 K−1) for the two exposed panel surfaces. This treatment is consistent with simplified PV thermal models that represent the two-sided panel–air convective exchange using an overall coefficient (Heusinger et al., 2020; Almukhtar et al., 2023).
The electrical power generation is estimated following Heusinger et al. (2020):
where EffPV represents the maximum conversion efficiency under the reference condition (1000 W m−2, 25 °C) and η represents the solar conversion derating coefficient. SWcell represents the shortwave radiation absorbed by the solar cell after transmission through the front glazing layer:
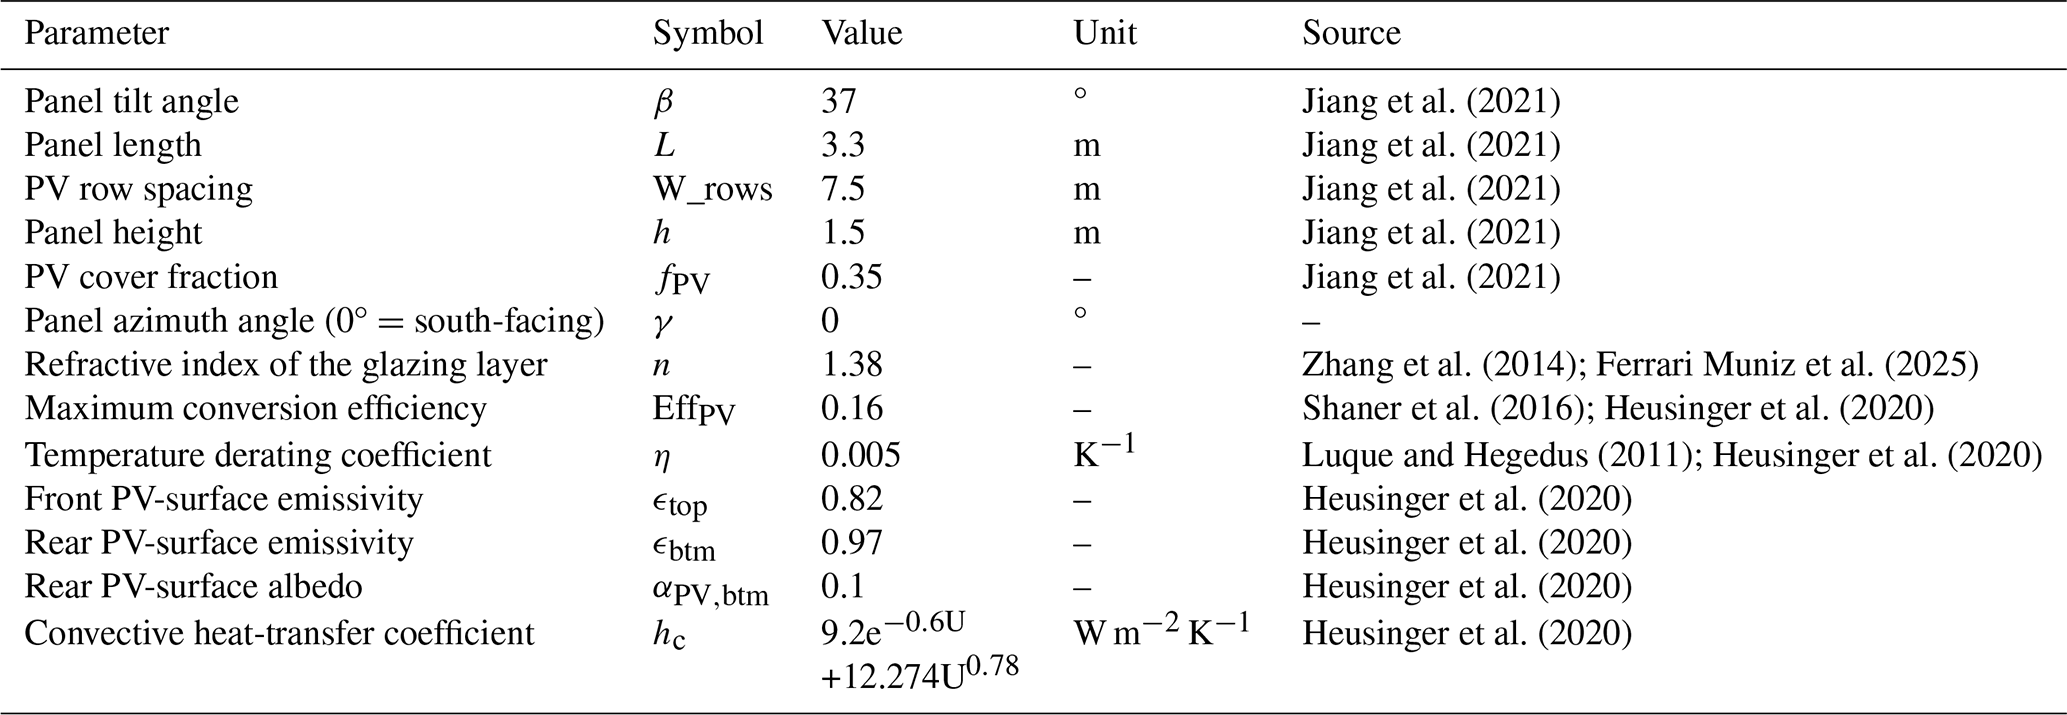
where the parameters (πα)dir, (πα)dif, (πα)G represent the transmissivity-absorptance products of the glazing for direct, diffuse, and ground-reflected shortwave radiation, respectively (Duffie and Beckman, 2013). M accounts for the spectral attenuation of solar radiation with increasing optical air mass (King et al., 2004). The configurable parameters used in this study are summarized in Table 1.
2.2 Energy-closed coupling scheme
We proposed a coupling scheme with energy balance closure and integrated the modified PV panel energy balance model into the WRF land surface module. In this scheme, the combined energy balance of the PV-ground system is expressed as the sum of the energy budgets of the PV panels and the ground, weighted by their respective coverage fractions. The energy balance of PV panels is described above (Eqs. 1–6) and the ground energy balance can be written as
where QH,G and LH denote the sensible and latent heat fluxes from the ground surface (W m−2), respectively, and GRDFLX is the ground heat flux (W m−2). PVFG represents the view factor of PV panels from the ground, which can be calculated as (Yin et al., 2025).
The total energy balance of the coupled PV-ground system is obtained from the combined PV panel and ground surface energy equation. The thermal capacity of the PV panel is neglected, as Yin et al. (2025) showed that this simplification increases the root-mean-square error (RMSE) of simulated PV surface temperature by only 0.2 °C. The resulting PV-ground system energy balance can be written as:
where cosβ converts the inclined PV surface area to its horizontal projection, ensuring that energy fluxes are consistently expressed per unit ground area. After algebraic simplification, the total longwave radiation absorbed by the PV-ground system (LWin) is given by:
and the total upward longwave radiation of the PV-ground system (LWup) is expressed as
In this study, an effective emissivity (ϵe) is defined for the PV-ground system as
and the skin temperature (TSK) is then diagnosed from the emitted longwave flux and the effective emissivity:
The total sensible heat flux emitted by the PV-ground system (SH) is represented by
The scheme ensures energy balance closure among the panels, the ground, and the atmosphere.
2.3 Numerical implementation in the land surface model
The PV scheme is implemented within the WRF surface-driver sequence and is called before the land surface model calculation at each land-surface time step. The shortwave and longwave radiative inputs used by the PV scheme, including SWdir, SWdif, and LWdown, are obtained from the radiation scheme of the host WRF atmospheric column. Because the module heat capacity is neglected, the PV panel temperature is solved diagnostically from the steady PV energy-balance equation at each time step. The subsequent land surface model calculation uses the adjusted surface energy balance (Eq. 7) to account for the presence of PV panels. In this treatment, PV coverage reduces the shortwave radiation reaching the ground, and the longwave input to the ground includes both atmospheric longwave radiation and longwave emission from the PV panels. GRDFLX is then calculated within the land surface model as part of the ground energy balance and used to update soil temperature, while the soil-temperature equation itself is retained. After the land surface model calculation, the PV grid cell TSK and SH are diagnosed from the PV panel and ground contributions.
3.1 Data for evaluation
China Meteorological Administration Land Data Assimilation System version 2.0 (CLDAS-V2.0) was used to evaluate the simulated 2 m air temperature and precipitation. CLDAS-V2.0 provides hourly gridded meteorological fields at a horizontal resolution of 0.0625° over China and surrounding regions (Sun et al., 2020). Daily precipitation observations from 42 surface meteorological stations were obtained from the National Meteorological Science Data Center of the China Meteorological Administration (CMA) and were used to evaluate the simulated precipitation-frequency distribution. The daytime land surface temperature fields from the MOD21A2 and MYD21A2 Collection 6.1 land surface temperature products were used to evaluate the simulated skin temperature (Hulley et al., 2018). These products have spatial and temporal resolutions of 1 km and 8 d, respectively. Further information on the production methods, previous evaluations, and uncertainties of these datasets is provided in Sect. S1 of the Supplement.
3.2 PV panels datasets
Three datasets were used to characterize the spatial distribution of PV installations. The first was the Photovoltaic Dataset of China, which covers 2013–2023 at five-year intervals and is provided as PV polygon vector data (Lin, 2024). We used its 2018 and 2023 layers. The second was the Global Photovoltaic Solar Panel Dataset, which provides annual 20 m raster PV maps for 2019–2022 (Li et al., 2025a). The third was the China Photovoltaic Power Plant Vector Dataset, which provides the 2024 PV map as PV polygon vector data (Yang et al., 2025). All three datasets were based on high-resolution satellite imagery, generated using machine learning classification approaches, and validated against manually interpreted samples. For each simulation year, only one PV dataset was used to prescribe the PV distribution. To assess the spatial consistency across dataset transitions, the PV distributions in adjacent years were compared using a 100 m spatial tolerance. The lost area accounted for only 0 %–2.56 % of the total mapped PV area, indicating generally good spatial continuity across adjacent years. To align with the spatial resolution of the MODIS land surface temperature dataset, only PV facilities with areas greater than 1 km2 were retained. Across the 2018–2024 PV maps, PV installations smaller than 1 km2 accounted for no more than 7.5 % of the total PV area in any year, indicating that the filtering retained the dominant share of PV-covered area throughout the study period. The total mapped PV installation area increased from 205.68 km2 in 2018 to 720.19 km2 in 2024.
3.3 Model setting
The WRF model version 4.4.2 (Skamarock et al., 2019) was employed to investigate the effects of utility-scale PV installations on regional climate. WRF is an advanced non-hydrostatic mesoscale model and is widely used in regional climate simulations and land-atmosphere interaction studies. In this study, the PV-ground coupling scheme in Sect. 2.2 was integrated into WRF. WRF was configured for high-resolution simulations using a two-way nested setup comprising three domains, with horizontal resolutions of 27, 9, and 3 km, respectively (Fig. 1). All three domains were centered at 38° N, 103° E and consisted of 211 × 196 grids with the Lambert conformal conic projection. The outermost domain (D01) covered East and Central Asia to capture large-scale circulation features, such as the East Asian summer monsoon, that influence China's regional climate. The intermediate domain (D02) covered several provinces in western China. The innermost domain (D03) covered the major PV concentration region in China to simulate the climatic effects induced by utility-scale PV installations. In the vertical direction, the WRF model was configured with 38 layers, and the top layer was set to 50 hPa.
The physical parameterization schemes applied in the WRF simulations included the Dudhia shortwave radiation scheme (Dudhia, 1989), rapid radiative transfer model (RRTM) longwave radiation scheme (Mlawer et al., 1997), revised MM5 Monin–Obukhov surface layer scheme (Jiménez et al., 2012), Lin microphysics scheme (Chen and Sun, 2002), University of Washington (UW) planetary boundary layer (Bretherton and Park, 2009), and Noah land surface model (Chen and Dudhia, 2001). The Grell 3D ensemble cumulus scheme (Grell and Dévényi, 2002) was activated in all domains. The vegetation-dependent scheme for surface thermal roughness length over land was adopted.
The ERA5 reanalysis data (Hersbach et al., 2020) were used to provide initial and lateral boundary conditions for the WRF simulations. ERA5 provides surface and pressure-level variables at a 0.25° horizontal resolution and a 3-hourly interval. Additionally, sea surface temperature was obtained from ERA5 and updated daily in the WRF simulations.
3.4 Numerical simulation design
Two sets of WRF simulations were conducted to assess the climatic response to utility-scale PV installations during summer, when solar radiation is strong and land–atmosphere coupling has been shown to play an important role in East Asian climate (Zhang et al., 2011). The first experiment (WRF_PV) incorporated a year-specific PV distribution, while the second experiment (WRF_CTL) used the original land-use data without PV installations. WRF_PV and WRF_CTL used identical initial and lateral boundary conditions and the same physical parameterization configuration described in Sect. 3.3. For each simulation year, the corresponding annual PV map was kept fixed throughout the simulation period in WRF_PV, consistent with the annual temporal resolution of the available PV datasets. The utility-scale PV areas were converted into a binary PV grid mask on the WRF D03 grid. A WRF grid cell was identified as a PV grid cell if it intersected with the PV area. In WRF_PV, the PV-ground coupling scheme updated surface temperature and energy fluxes at PV grid cells and enabled an explicit representation of PV-atmosphere feedback. Each simulation ran separately for the period of 2018–2024, with simulations initialized on 1 May and terminated on 31 August. The first month (May) was discarded as the model spin-up period, while the remaining three months (June–August) were used for analysis.
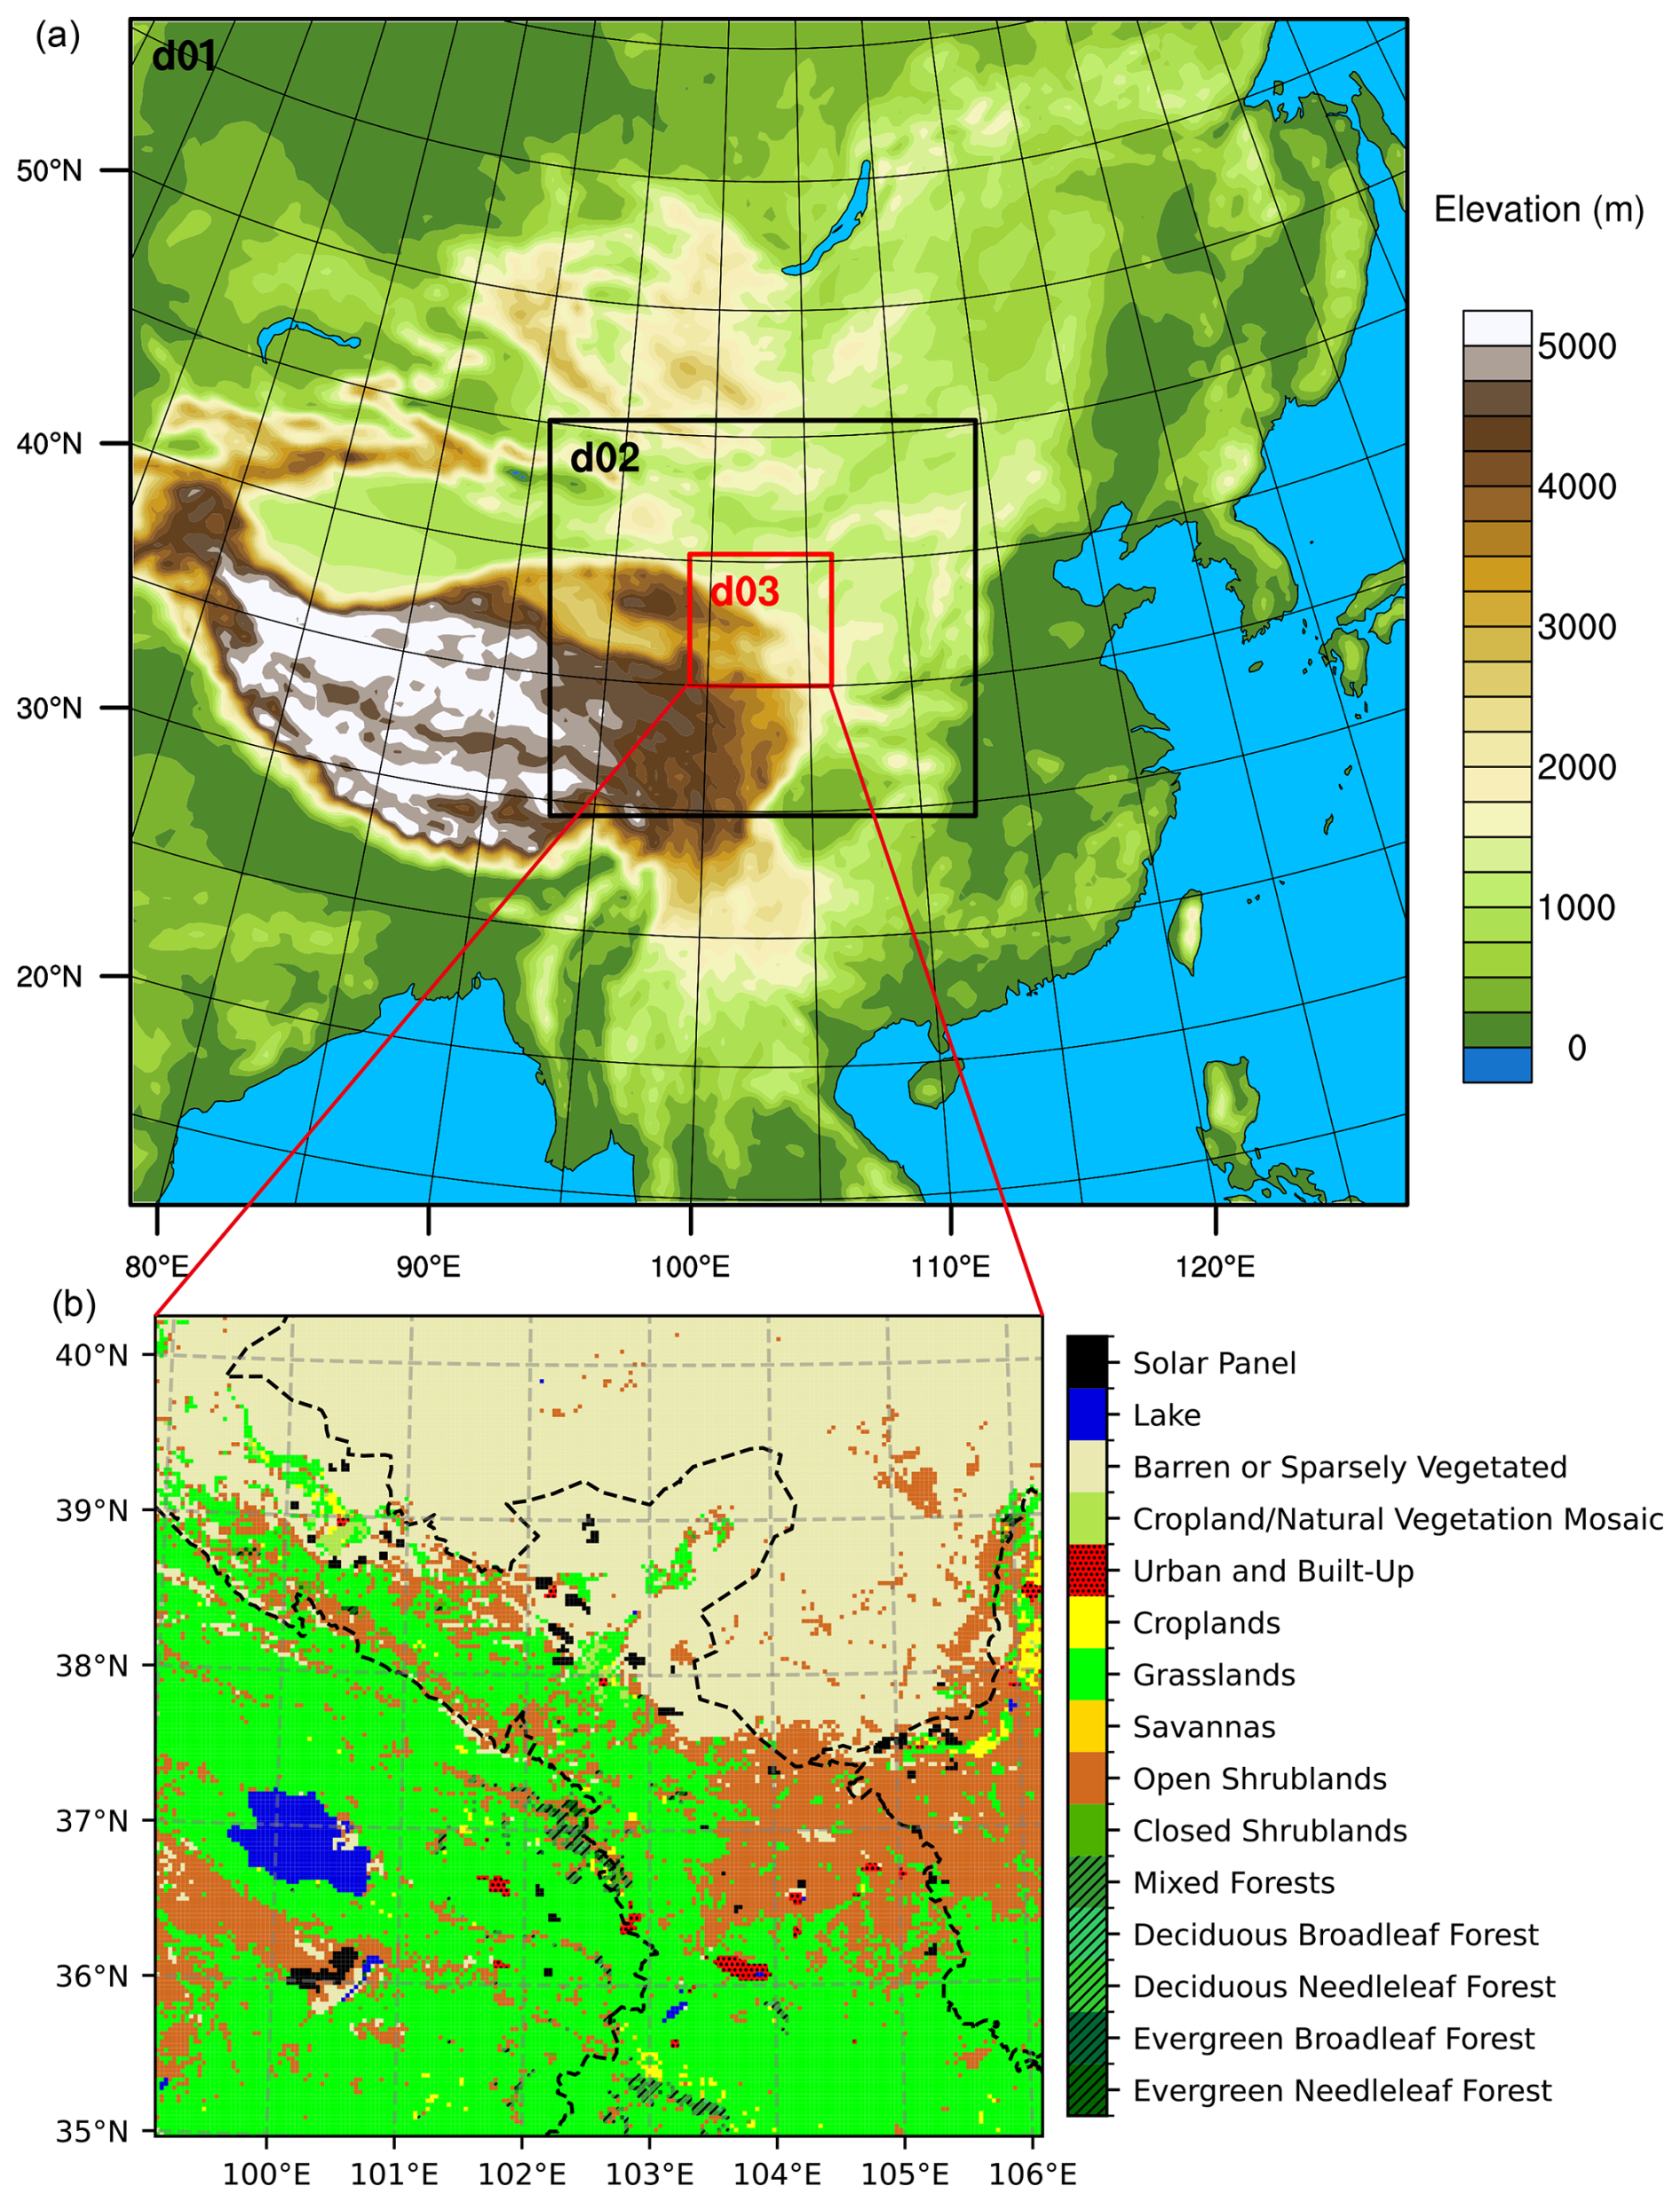
Figure 1(a) Three nested WRF domains with terrain elevation. (b) Land-use type of D03 in WRF_PV for the year 2024.
4.1 Model evaluation
4.1.1 2 m air temperature
The simulated 2 m air temperature (T2) from WRF_PV and WRF_CTL was evaluated against CLDAS. CLDAS showed horizontal heterogeneity across the study area, with high temperatures over the northern desert regions and low temperatures over the southwestern plateau and mountainous areas (Fig. 2a). Both WRF_PV and WRF_CTL successfully reproduced the spatial variations of T2 across the study region and captured the influence of elevation and underlying surface conditions on the temperature pattern (Fig. 2c and e). The corresponding bias maps show that the two simulations exhibit broadly similar spatial error patterns relative to CLDAS (Fig. 2d and f). Over the entire D03 domain, WRF_PV produced a mean bias of +0.38 °C and an RMSE of 1.78 °C, compared with +0.49 °C and 1.81 °C, respectively, for WRF_CTL. On the CLDAS grid cells over PV installations, WRF_PV produced a mean bias of +1.72 °C and an RMSE of 2.40 °C, whereas WRF_CTL produced corresponding values of +1.64 and 2.47 °C. Overall, WRF_PV showed slightly improved T2 performance in terms of RMSE, although the mean warm bias over the PV-containing grid cells increased marginally. Figure 2b further compares the diurnal cycles of spatially averaged T2 from CLDAS, WRF_PV, and WRF_CTL, showing that both simulations captured the overall temporal evolution well. These results indicate that both experiments reasonably reproduced the regional spatial and temporal characteristics of T2.
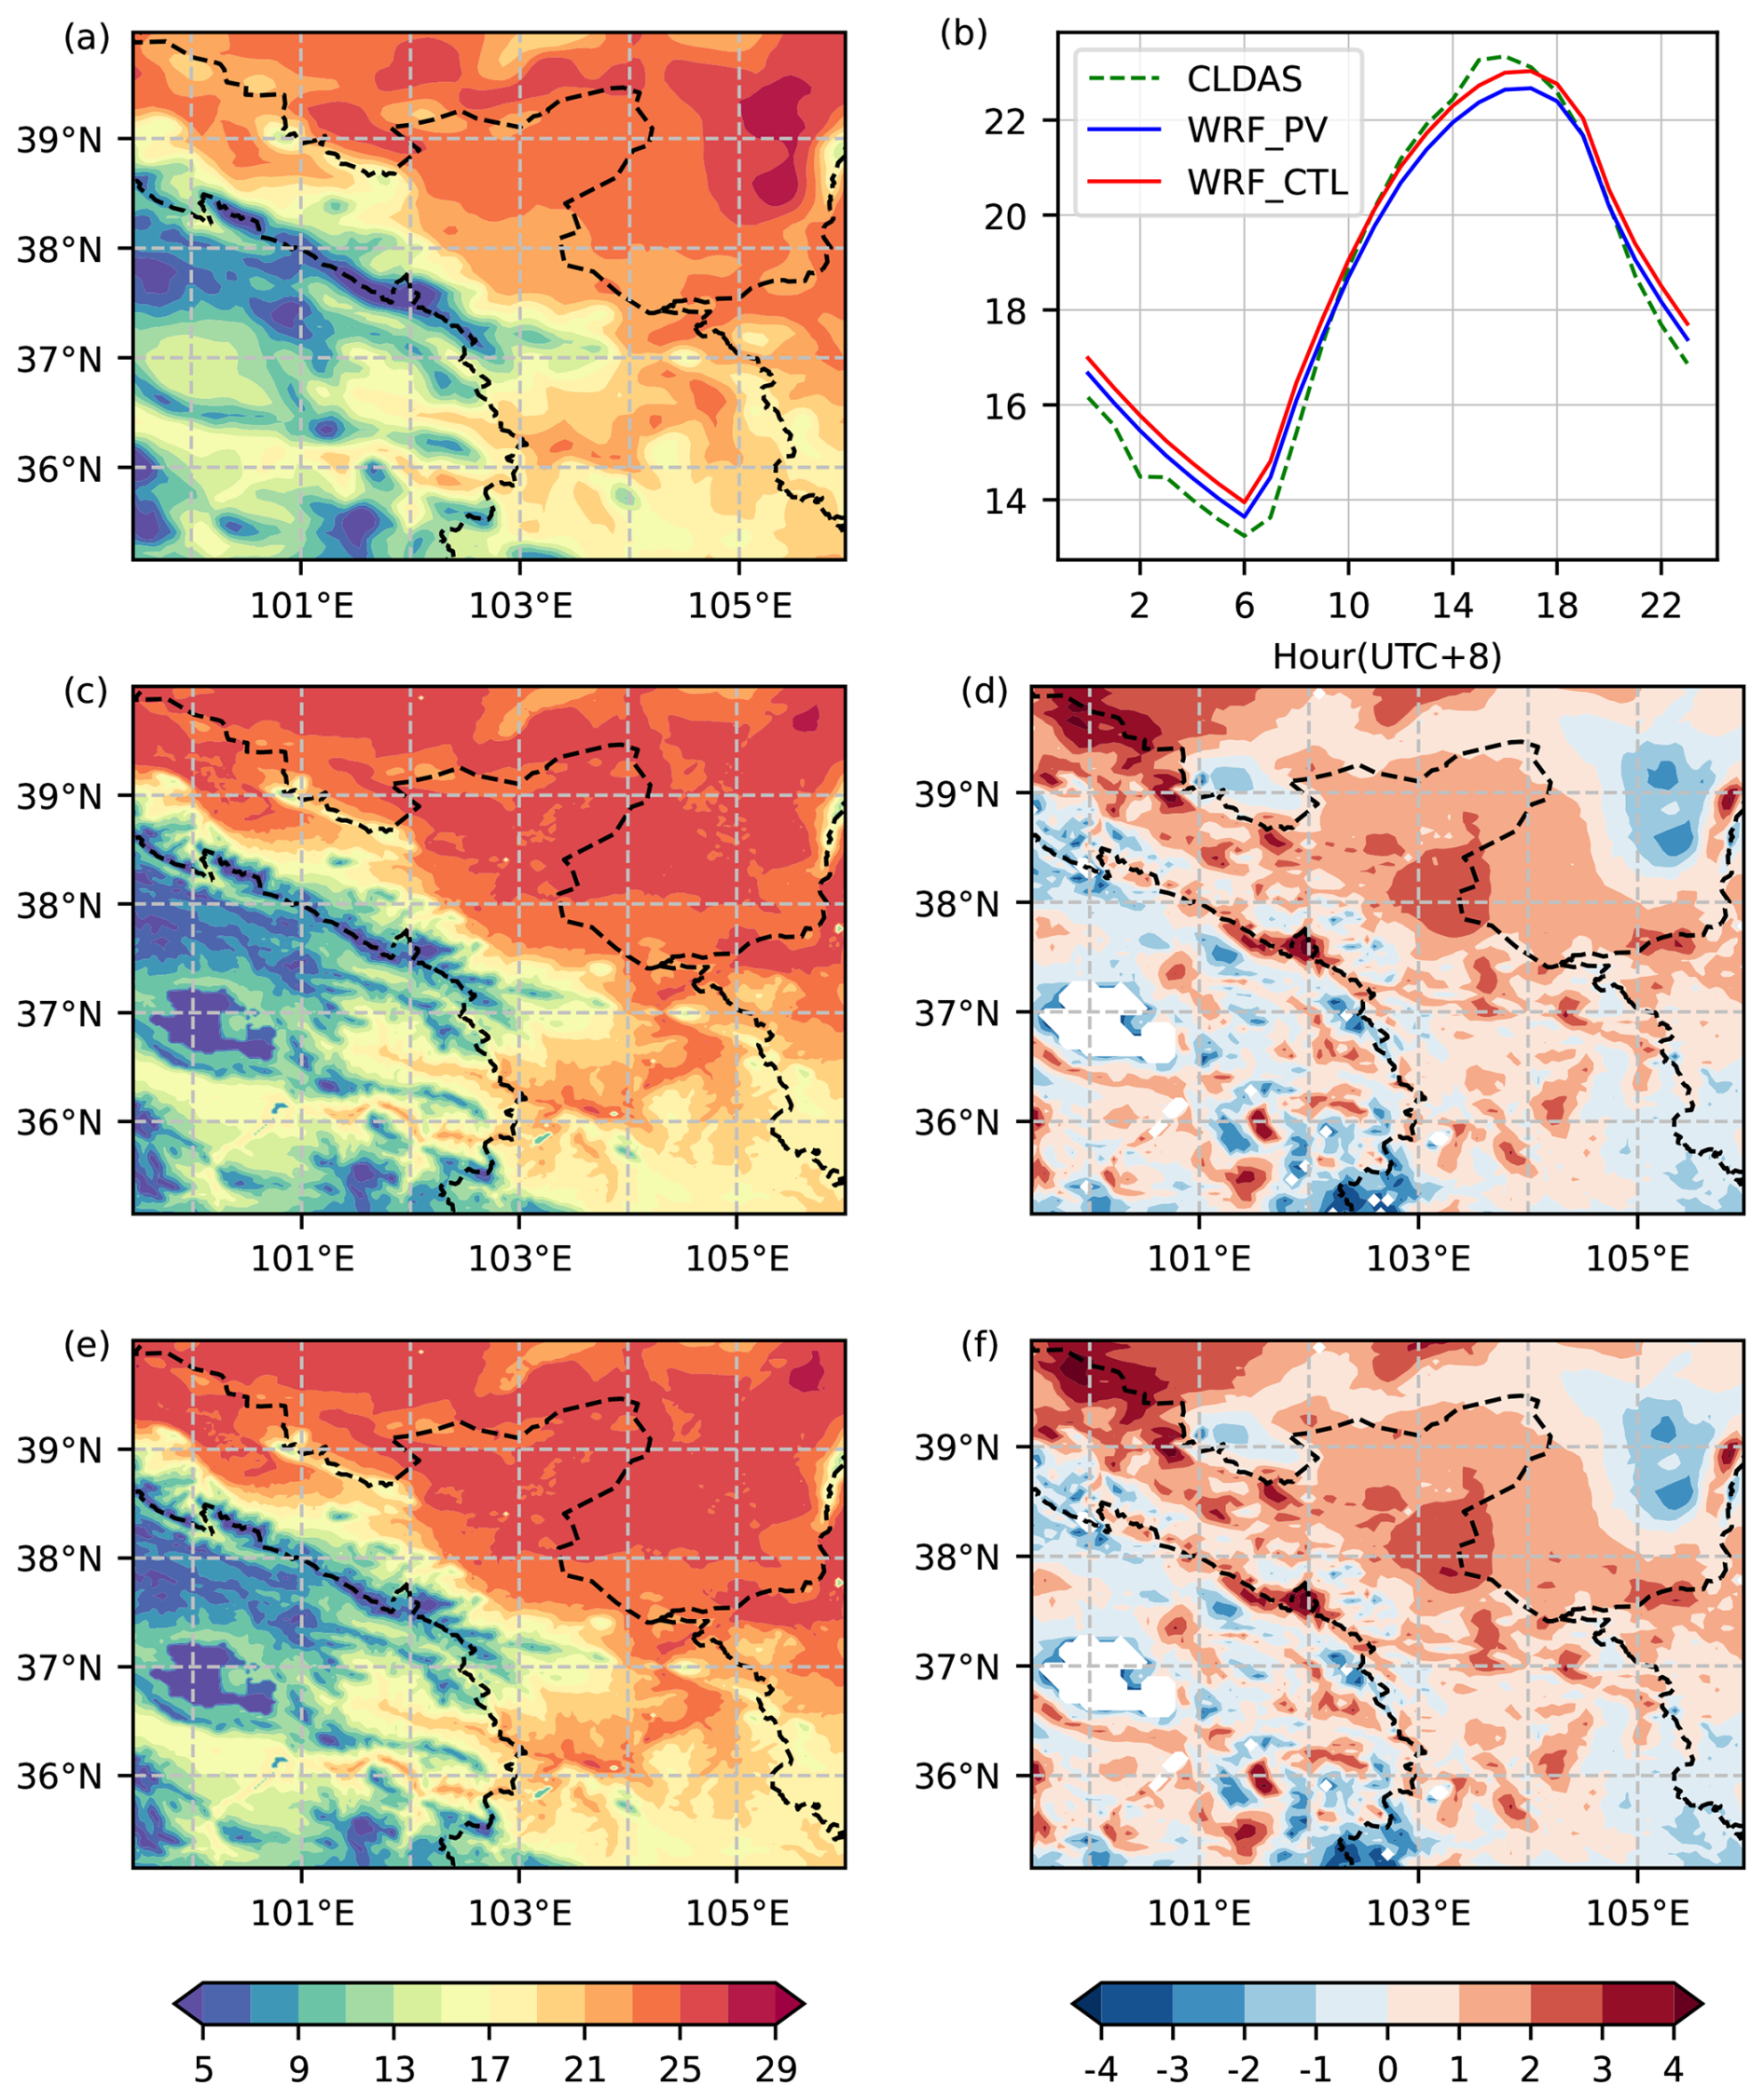
Figure 2Spatial distribution of mean air temperature at 2 m height (T2, °C) during summer (June, July and August) in D03: (a) CLDAS, (c) WRF_PV, and (e) WRF_CTL; differences of (d) WRF_PV−CLDAS and (f) WRF_CTL-CLDAS. (b) Diurnal cycle of T2 averaged over the study area.
4.1.2 Precipitation
Precipitation simulated by WRF_PV and WRF_CTL was also evaluated against CLDAS. As shown in Fig. 3a, the study region exhibited pronounced spatial heterogeneity in precipitation. Daily mean precipitation was lower in the north and higher in the southern and southwestern parts of the domain. Both WRF_PV and WRF_CTL realistically reproduced the regional precipitation pattern and captured the effects of monsoonal circulation and topography (Fig. 3c and 3e). Both WRF_PV and WRF_CTL reproduced this broad spatial pattern, but underestimated precipitation in the northern part of the domain and slightly overestimated it over parts of the southern regions (Fig. 3c–f). Over the entire D03 domain, WRF_PV produced a mean bias of +0.08 mm and an RMSE of 0.548 mm, compared with +0.05 and 0.549 mm, respectively, for WRF_CTL. On the CLDAS grid cells over PV installations, WRF_PV produced a mean bias of −0.01 mm and an RMSE of 0.661 mm, whereas WRF_CTL produced corresponding values of +0.05 and 0.735 mm. Overall, both experiments reasonably captured the spatial pattern of precipitation, with WRF_PV showing improved agreement with CLDAS over the PV-containing grid cells. Additionally, Fig. 3b presents the probability distributions of daily precipitation derived from CMA station observations, WRF_PV, and WRF_CTL. The observed and simulated precipitation distributions were generally consistent across different intensity ranges. Overall, both experiments reasonably captured the spatial pattern and frequency distribution of precipitation, demonstrating their reliability for regional climate simulation.
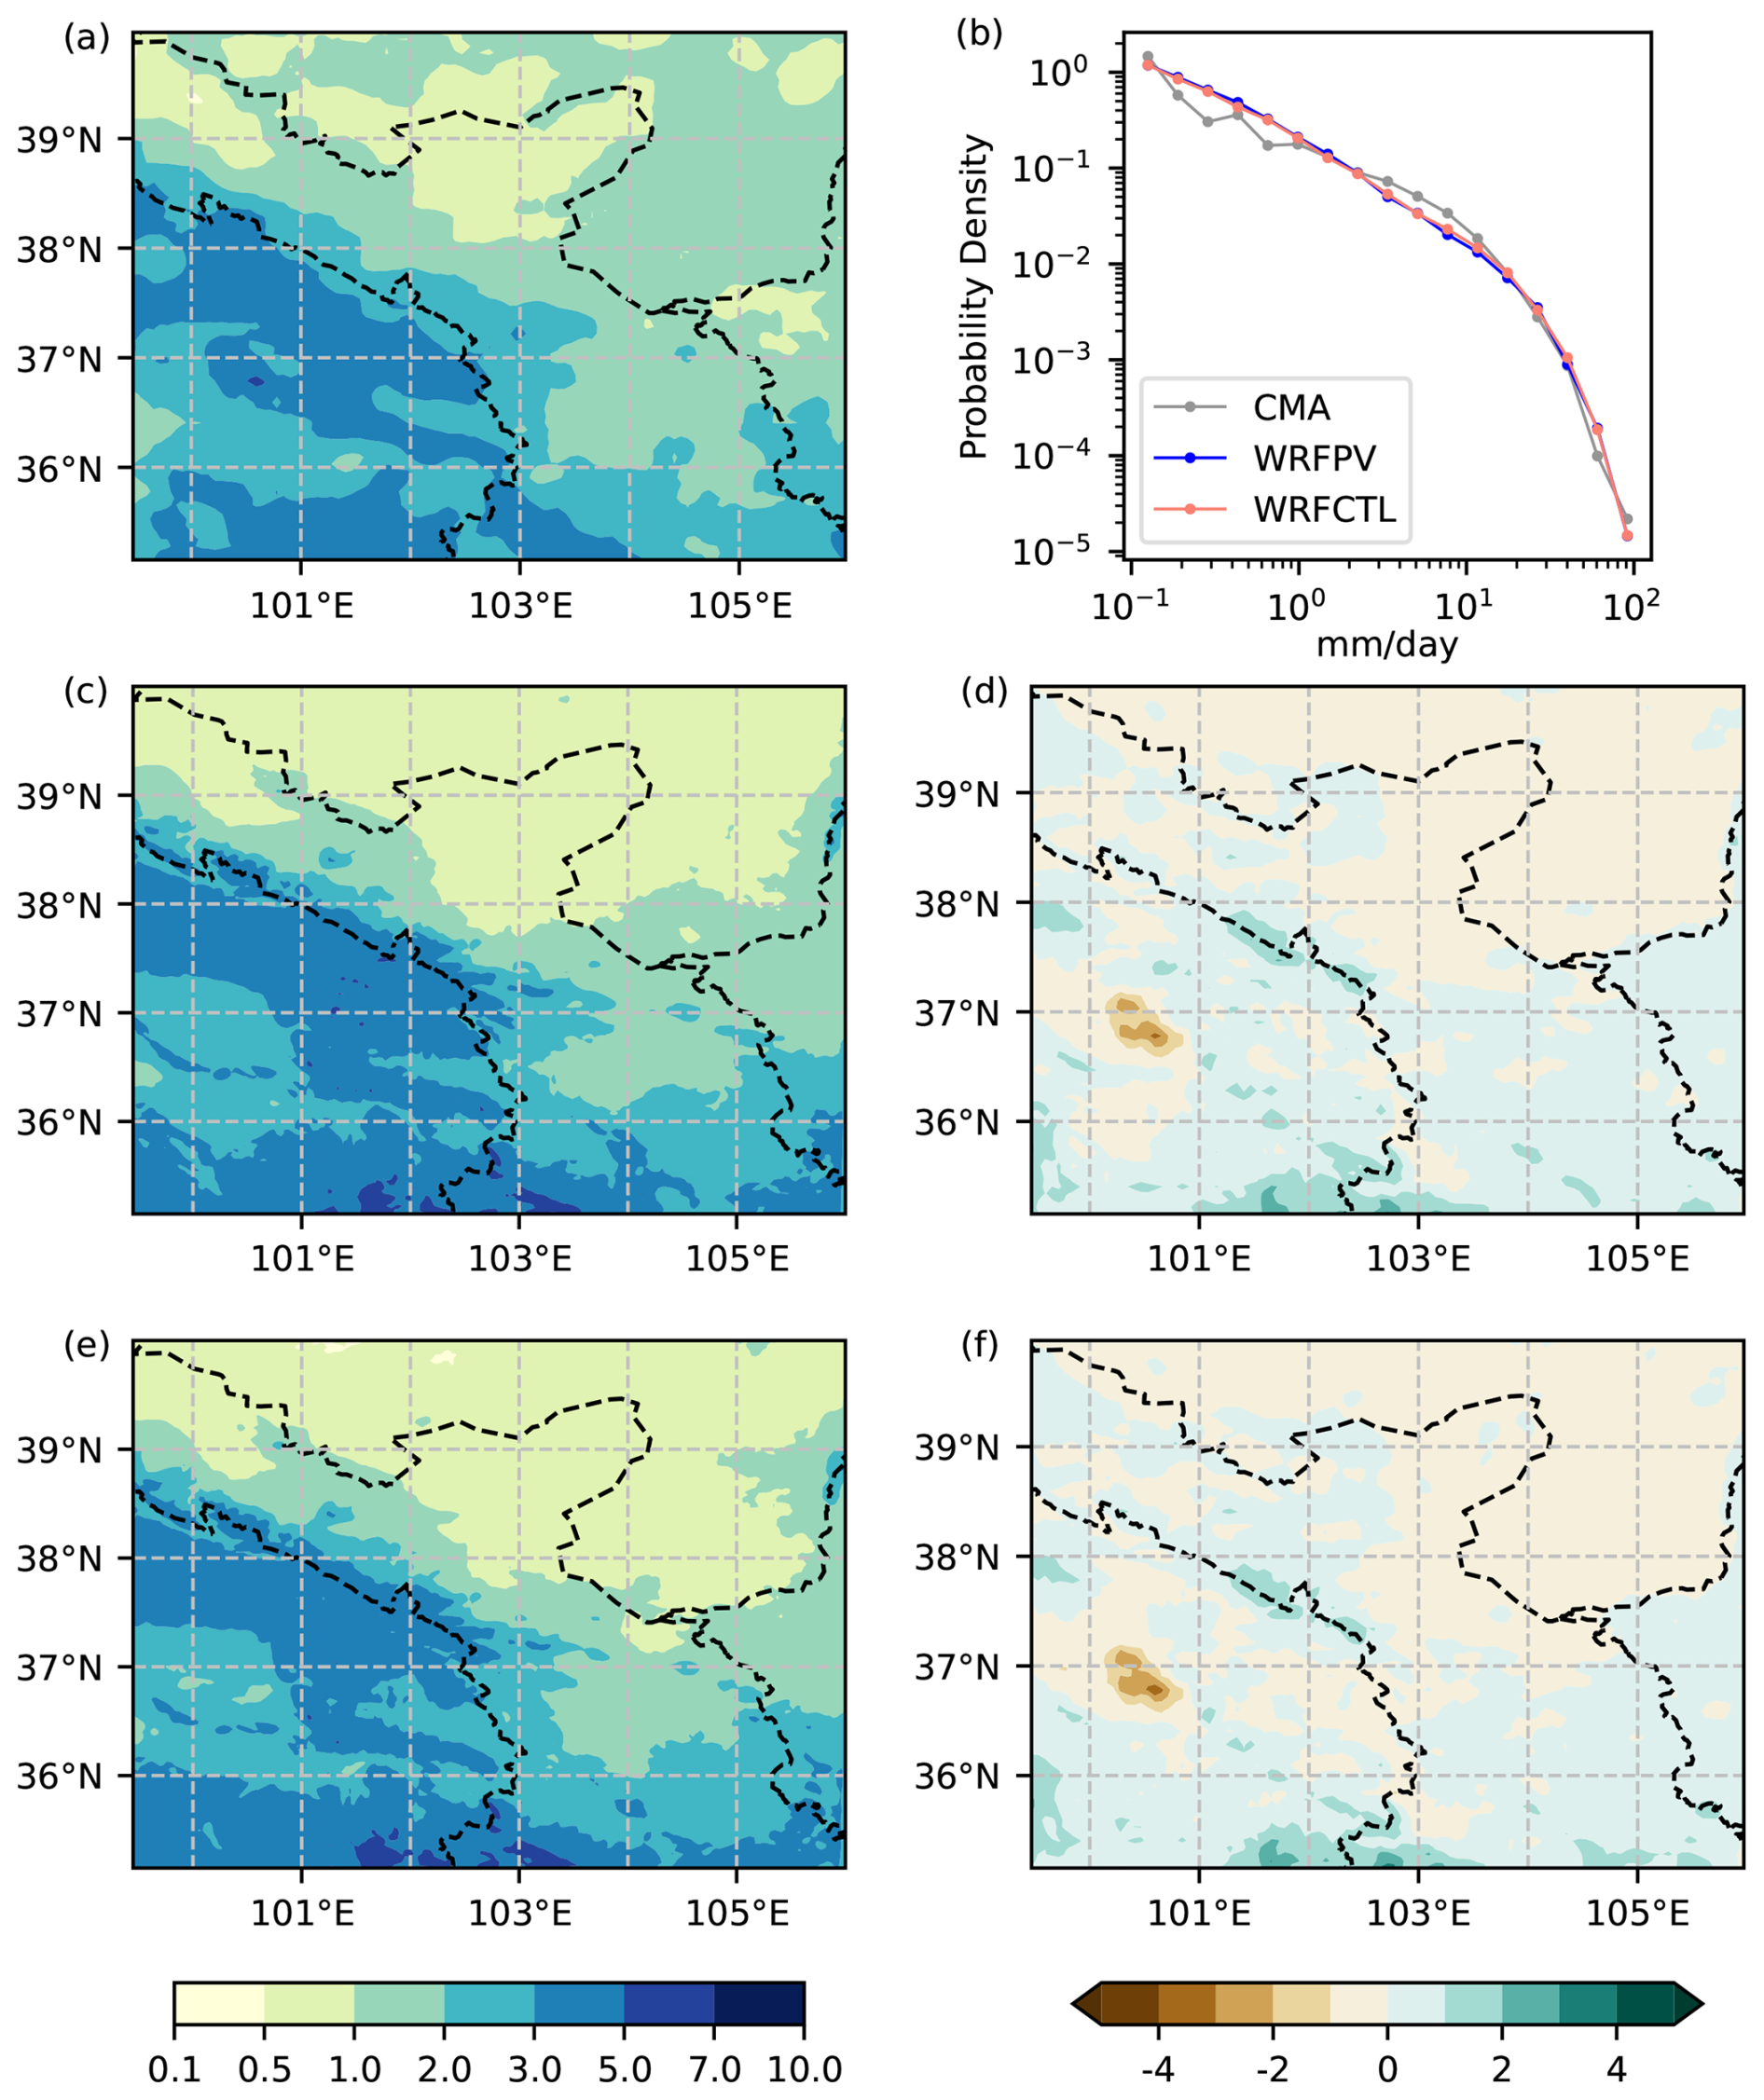
Figure 3Spatial distribution of mean precipitation (mm d−1) during summer in D03: (a) CLDAS, (c) WRF_PV, and (e) WRF_CTL; differences of (d) WRF_PV−CLDAS and (f) WRF_CTL−CLDAS. (b) Probability distribution of daily precipitation intensity derived from CMA station observations (grey line) and from WRF_PV (blue line) and WRF_CTL (red line). Simulation results were interpolated to station points.
4.1.3 Simulated skin temperature (TSK)
The performance of TSK simulation was evaluated against MODIS data over the PV grid cells. Valid MxD21A2 pixels whose centers fell within the identified PV facility boundaries were retained and assigned to the nearest WRF PV grid cell. Within each 8 d period, the MODIS pixels assigned to the same WRF grid cell were averaged to obtain a grid-cell-scale MODIS land surface temperature value. The corresponding MOD21A1D and MYD21A1D daily products were used to identify the valid observation dates and satellite overpass times within each 8 d period. WRF TSK was linearly interpolated to these overpass times and then averaged over the same 8 d period for comparison with the MODIS observations. A total of 10 310 valid 8 d MODIS–WRF collocations were retained and used to construct the error distributions shown in Fig. 4. The WRF_PV errors were more concentrated near zero, whereas the WRF_CTL distribution was shifted toward positive errors. At each observation time, MODIS land surface temperature and WRF TSK were first averaged over all valid PV grid cells. Bias and RMSE were then calculated from the 77 paired time-mean samples. WRF_CTL produced a mean bias of +0.697 °C and an RMSE of 3.071 °C, whereas WRF_PV produced a mean bias of −0.340 °C and an RMSE of 2.560 °C. Thus, WRF_PV reduced the RMSE by 0.511 °C and reduced the magnitude of the mean bias relative to WRF_CTL. These results indicate that WRF_PV achieved better agreement with MODIS than WRF_CTL over the PV installations. We also evaluated TSK over the surrounding non-PV grid cells. In the first grid-cell ring surrounding the PV grid cells, the RMSE decreased from 2.851 °C in WRF_CTL to 2.526 °C in WRF_PV. In the second and third grid-cell rings, it decreased from 2.791 to 2.622 °C. Therefore, the RMSE reduction weakened with distance from the PV grid cells. Together, these results indicate that the improvement in WRF_PV was concentrated mainly over the PV installations.
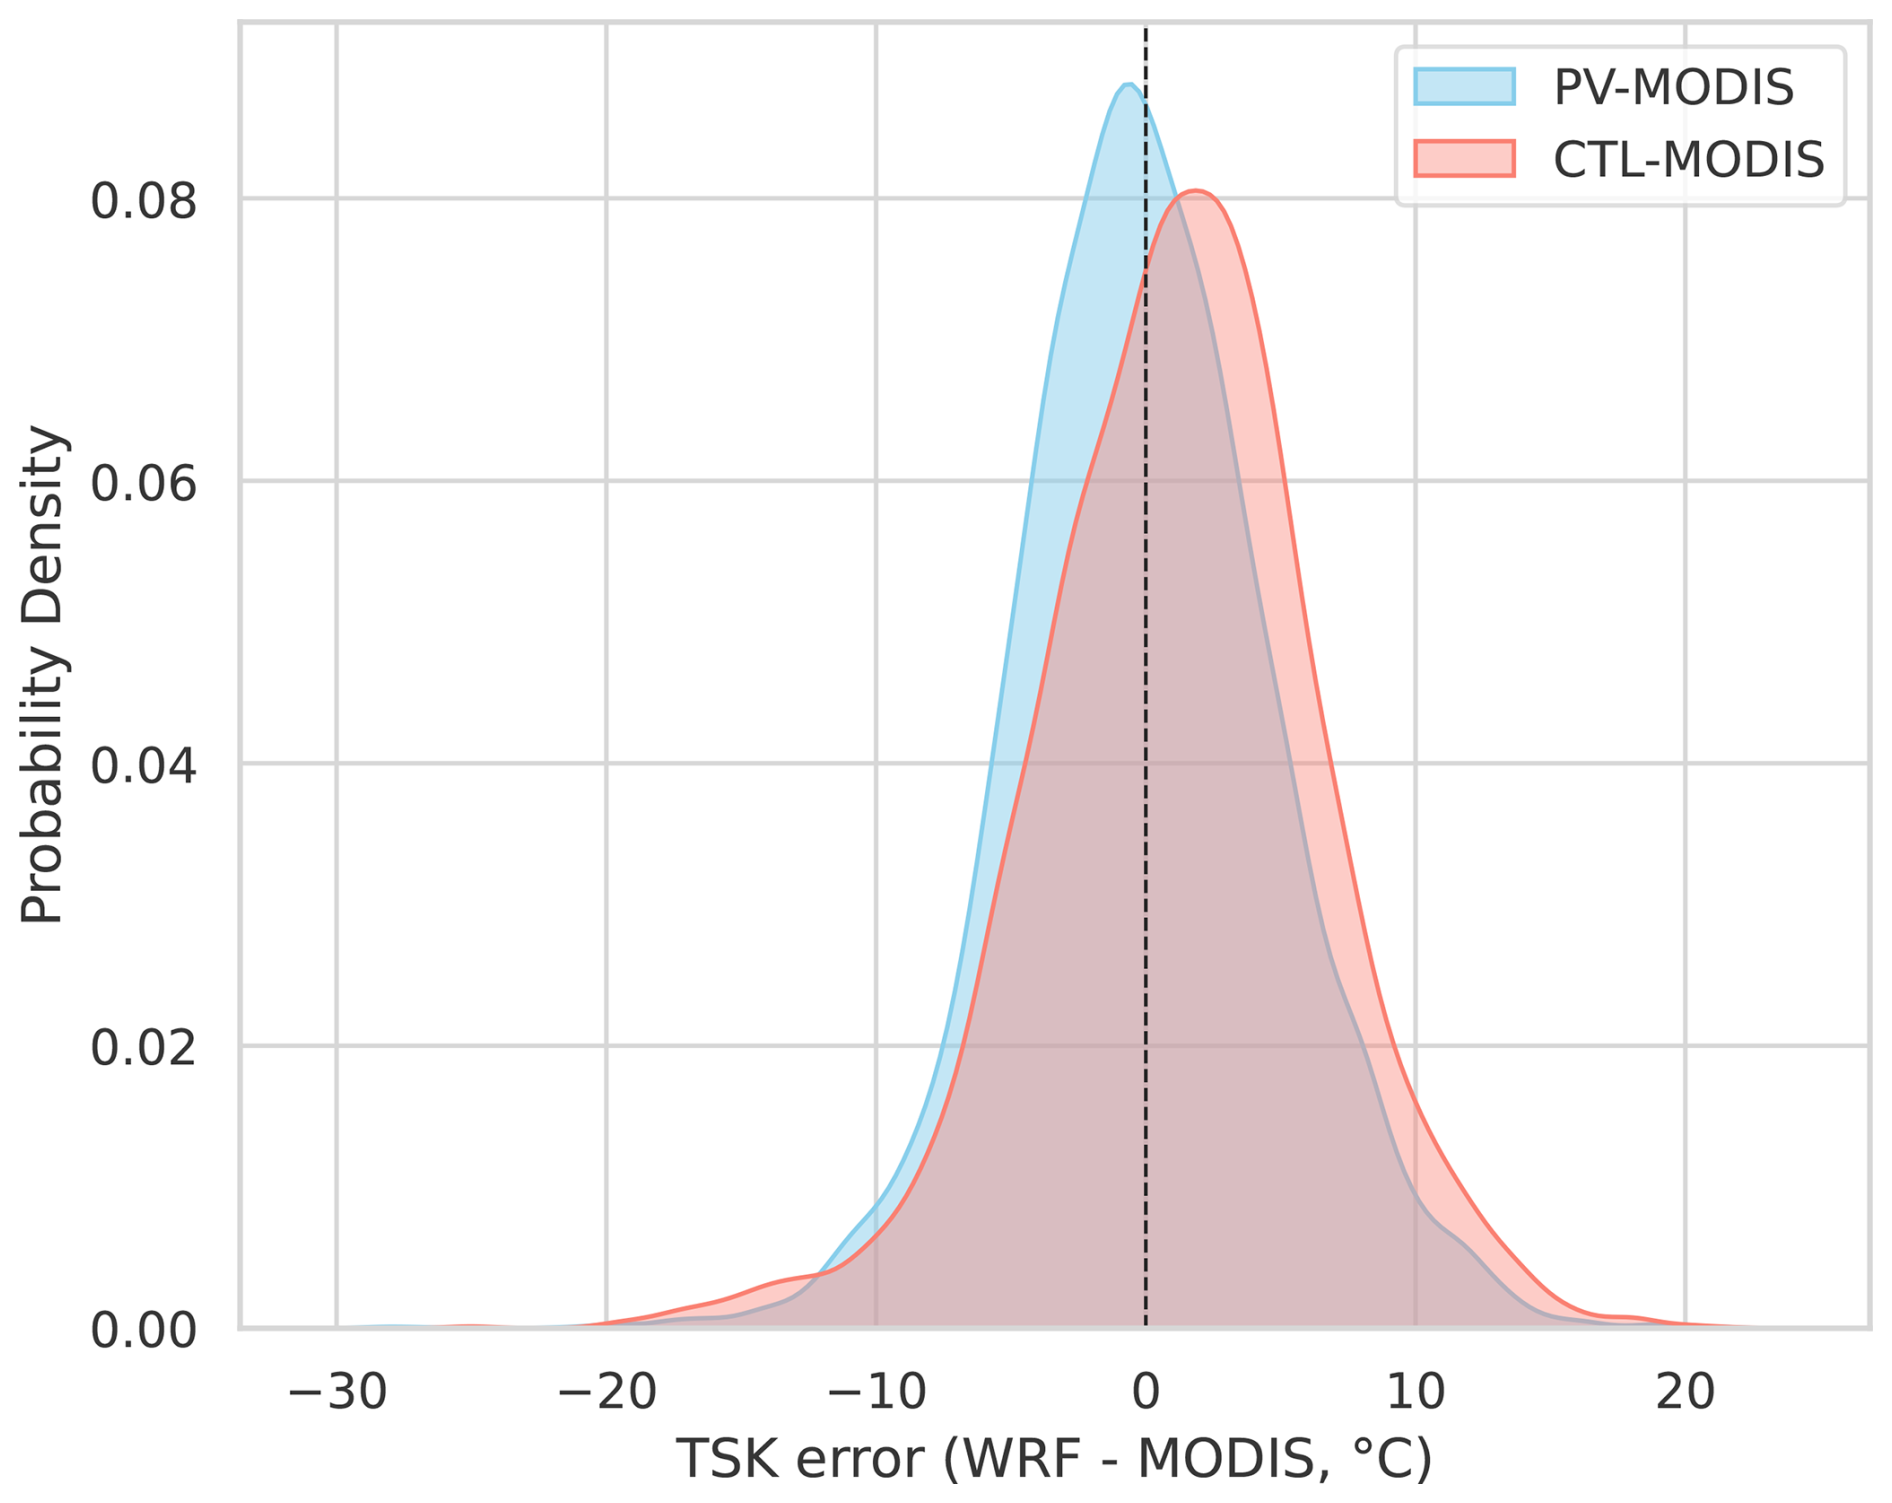
Figure 4Probability density distributions of skin temperature (TSK, °C) errors for the WRF_PV (blue shade) and WRF_CTL (red shade) simulations with respect to MODIS observations. The vertical dashed line denotes zero error.
4.2 Impacts on local temperature
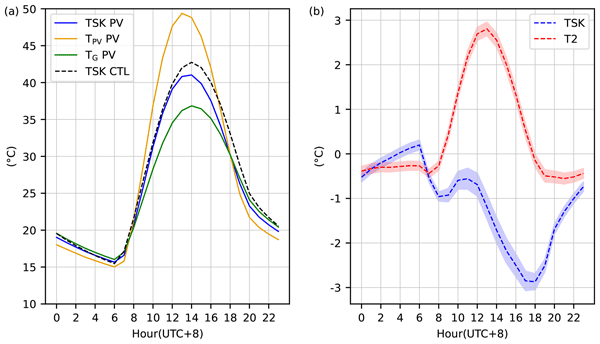
We compared the diurnal variation of surface temperatures from WRF_PV and WRF_CTL over all PV grid cells. In WRF_PV, surface temperatures included TPV, TG, and their integrated skin temperature (TSK_PV) following Eq. (12). In contrast, WRF_CTL included only the land surface skin temperature (TSK_CTL). As shown in Fig. 5a, TPV rose rapidly after sunrise and reached its maximum of 49.4 °C at 13:00 (times hereafter are all in local standard time, LST), about one hour earlier than TSK_CTL, which peaked at 14:00. TPV was higher than TSK_CTL during the day and lower after sunset. The earlier peak and larger amplitude resulted from the lower heat capacity of the PV material, which allowed it to warm quickly under solar radiation and cool rapidly after sunset. In contrast, TG exhibited an opposite response (Fig. 5a). TG remained lower than TSK_CTL after sunrise due to the shading effect of the PV panels, while it became higher at night as downward longwave radiation from the panels warmed the shaded ground. TG reached a peak of 36.8 °C at 14:00, about 6 °C lower than the peak of TSK_CTL.
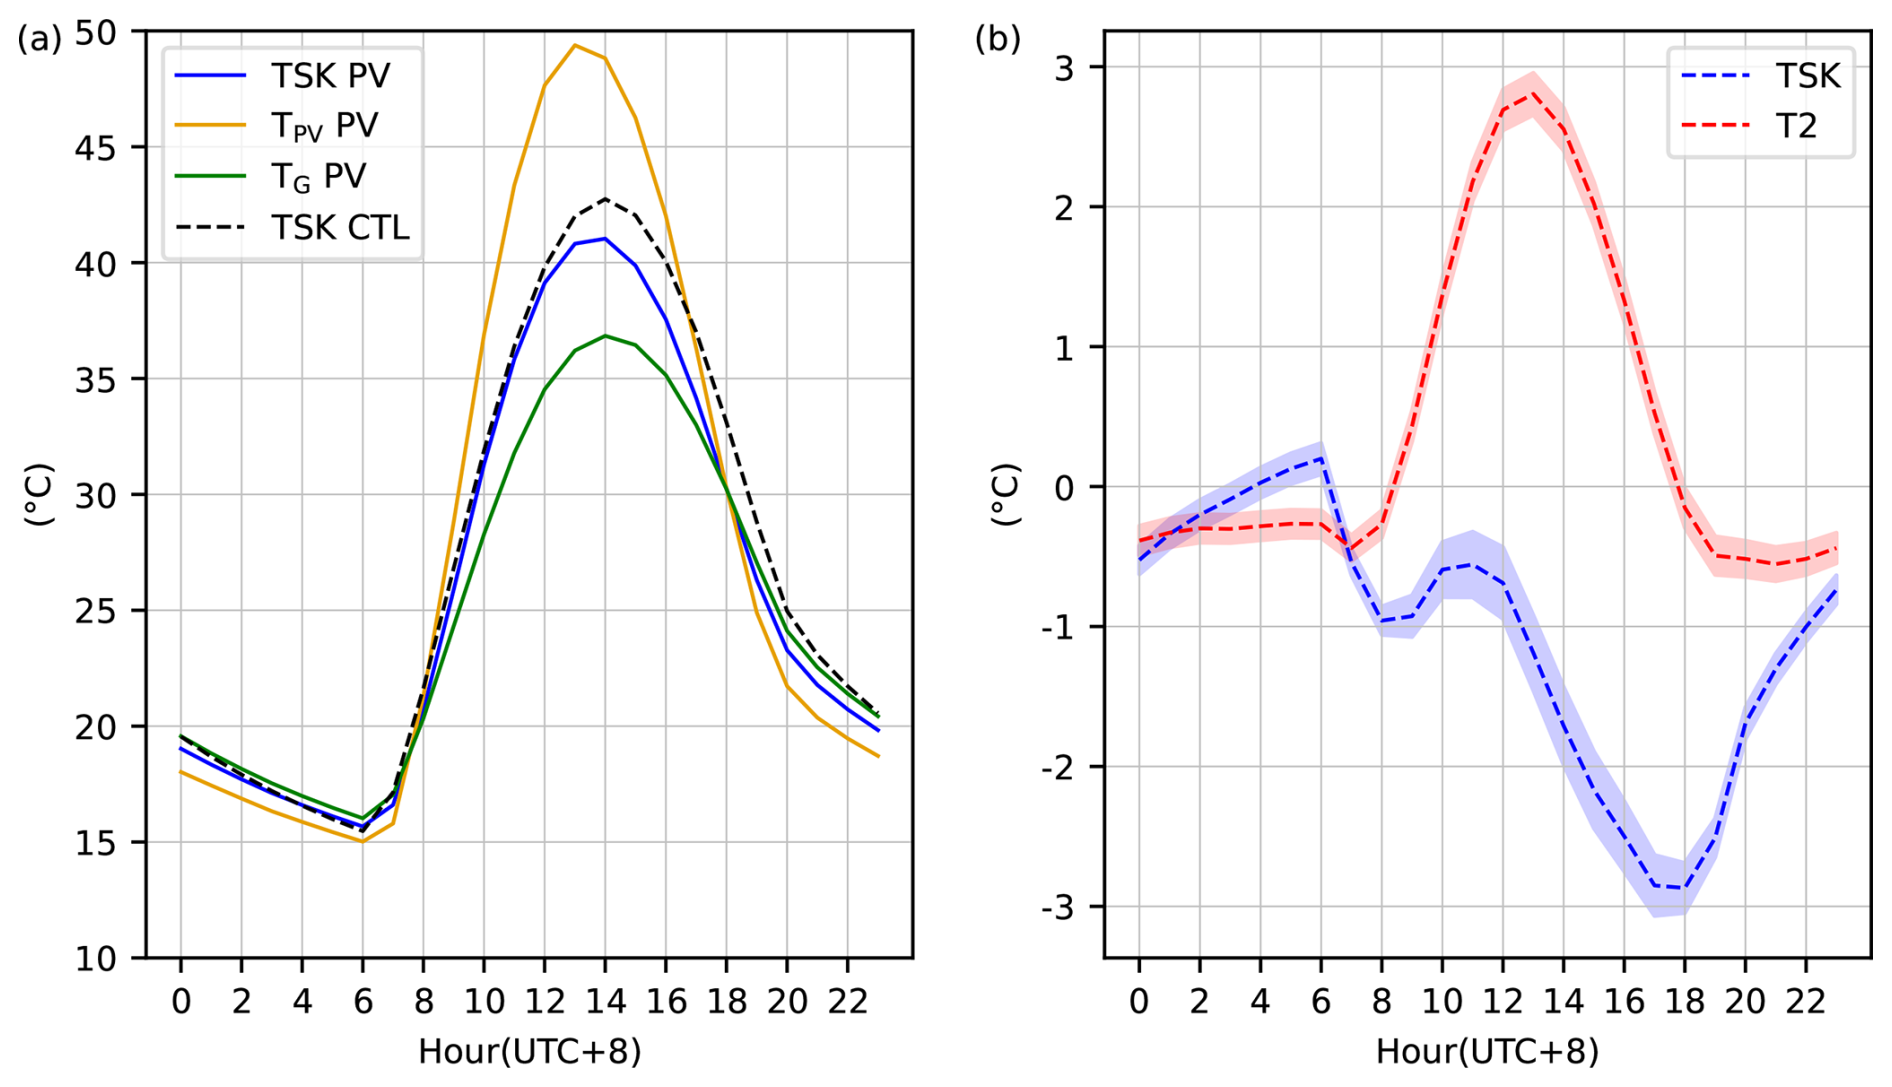
Figure 5(a) Mean diurnal cycle of skin temperature (TSK_PV), ground surface temperature (TG PV), surface temperature of PV panels (TPV PV) in WRF_PV, and skin temperature in WRF_CTL (TSK_CTL), averaged over all PV grid cells. (b) Diurnal cycle of differences of TSK and T2 between WRF_PV and WRF_CTL. The shaded areas represent the 95 % confidence interval.
The combined skin temperature TSK_PV exhibited an intermediate thermal behavior. Its peak temperature appeared at 14:00, consistent with both TG and TSK_CTL, with a maximum of 41 °C, which was 1.7 °C lower than the control peak (Fig. 5a). As shown in Fig. 5b, from morning to midnight, TSK_PV was significantly lower than TSK_CTL, with the difference reaching up to −2.9 °C at 18:00. The cooling was dominated by TG, with minor influence from TPV. Generally, TSK_PV was lower than TSK_CTL during daytime (08:00–19:00), with an average temperature difference of −1.6 °C. During nighttime (20:00–07:00), the temperature difference was smaller, averaging −0.51 °C. At each hour of the diurnal cycle, the WRF_PV minus WRF_CTL difference from each day was treated as one sample, and a t-test was used to determine whether the mean difference was significantly different from zero.
The T2 difference between WRF_PV and WRF_CTL showed a significant daytime warming, averaging +1.2 °C and peaking at +2.8 °C at 13:00 (Fig. 5b). This indicated that the PV panels warmed the near-surface air temperature. At night, the differences were smaller, with an average of −0.38 °C. Moreover, the diurnal temperature range of the ambient air increased under the PV scenario. The daytime T2 response was pronounced over the PV grid cells but largely diluted when averaged over D03 (not shown). Notably, compared with WRF_CTL, WRF_PV exhibited a decrease in TSK but an increase in T2, implying a redistribution of heat between the surface and the lower atmosphere. This differential response motivates a more detailed examination of the radiative processes involved and of how surface energy is partitioned at the land surface.
4.3 Impacts on local energy budget
Figure 6a illustrates that the PV deployment notably altered the daytime radiative balance. The most pronounced feature was a strong reduction in upward shortwave radiation (SWup), reaching up to −99 W m−2, with a daytime average difference of −49 W m−2. An exception occurred shortly after sunrise and before sunset, when SWup showed brief positive anomalies due to specular reflection from the PV panels at large solar zenith angles. Consistent with the differences in SWup, the net radiation (NetRad) showed a pronounced positive anomaly that peaked at 101 W m−2, with a daytime mean increase of 58 W m−2. These changes confirmed that more radiative energy was available at the surface during the day under the PV scenario. The increase in NetRad was also partly attributed to a reduction in upward longwave radiation (LWup), which decreased through most of the day, consistent with the cooler skin temperature and the lower emissivity of the PV panel surface. Overall, the increase in NetRad provided additional available energy at the surface under the PV scenario, driven by the reduced upward shortwave reflection and the diminished upward longwave emission.
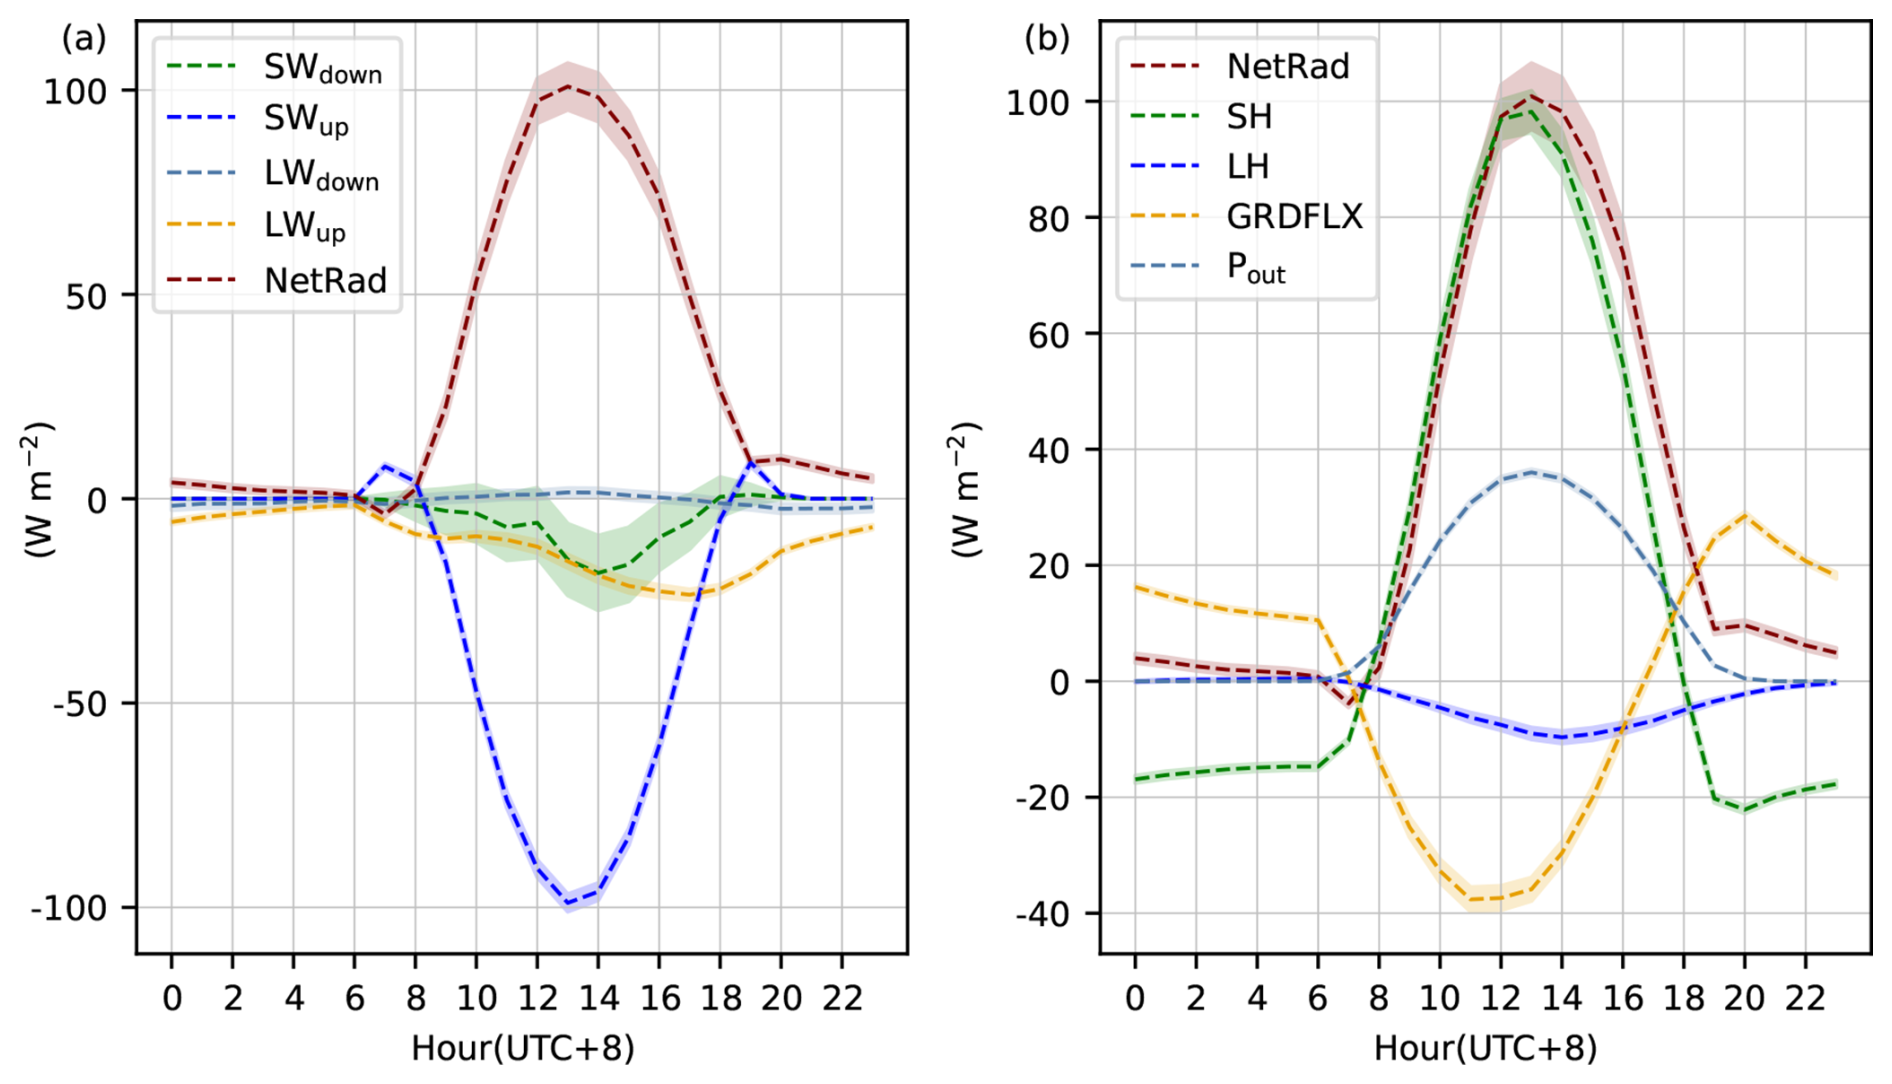
Figure 6(a) Diurnal cycle of differences of downward shortwave radiation (SWdown), upward shortwave radiation (SWup), downward longwave radiation (LWdown), upward longwave radiation (LWup), and net radiation (NetRad) between WRF_PV and WRF_CTL, averaged over all PV grid cells. (b) Diurnal cycle of differences of net radiation, sensible heat flux (SH), latent heat flux (LH), ground heat flux (GRDFLX) and electrical power output (Pout) between WRF_PV and WRF_CTL, averaged over all PV grid cells. The shaded areas represent the 95 % confidence interval.
Figure 6b shows the differences in non-radiative fluxes, averaged over all PV grid cells. Electrical power output peaked at 36 W m−2, with a daytime mean of 23 W m−2. This energy conversion represented an anthropogenic sink of surface energy and reduced the fraction of absorbed radiation that can be released as heat. The sensible heat flux (SH) in WRF_PV increased significantly during daytime, with a maximum difference of 98 W m−2 and a daytime mean of 50 W m−2. This increase was attributable to higher TPV and the larger surface area provided by the double-sided panels. This enhancement indicated intensified upward heat transport from the surface into the atmosphere, which contributed to the daytime warming of the ambient air (Fig. 5b). At night, however, SH difference became negative, with an average difference of −16 W m−2, indicating an enhancement of downward sensible heat transfer from the atmosphere to the PV-ground system. When averaged over the entire diurnal cycle, SH showed a positive mean difference of 17 W m−2. The latent heat flux (LH) exhibited an overall decrease under the PV scenario, with a daily mean decrease of about 3 W m−2, corresponding to roughly 13 % of total evaporation. This reduction reflected the suppression of surface evaporation caused by panel shading. The ground heat flux (GRDFLX), defined as positive downward, also showed distinct diurnal changes. It decreased during daytime by 16 W m−2, indicating that less energy penetrated into the soil due to panel shading. During nighttime, by contrast, GRDFLX became positive by 15 W m−2, meaning that the upward release of soil heat toward the surface was weakened. When averaged over the full diurnal cycle, the net change in GRDFLX was nearly zero, reflecting that the reduced daytime storage was canceled out by the reduced nighttime release. This indicated a decrease in soil heat content and a weaker diurnal heat exchange (Fig. 7). Overall, the PV installation not only increased the total available surface energy but also redistributed it. After PV deployment, energy was shifted from the subsurface to the atmosphere, as sensible heat exchange increased during the day while ground heat storage weakened. This shift reconciled the cooler surface with a warmer near-surface atmosphere.
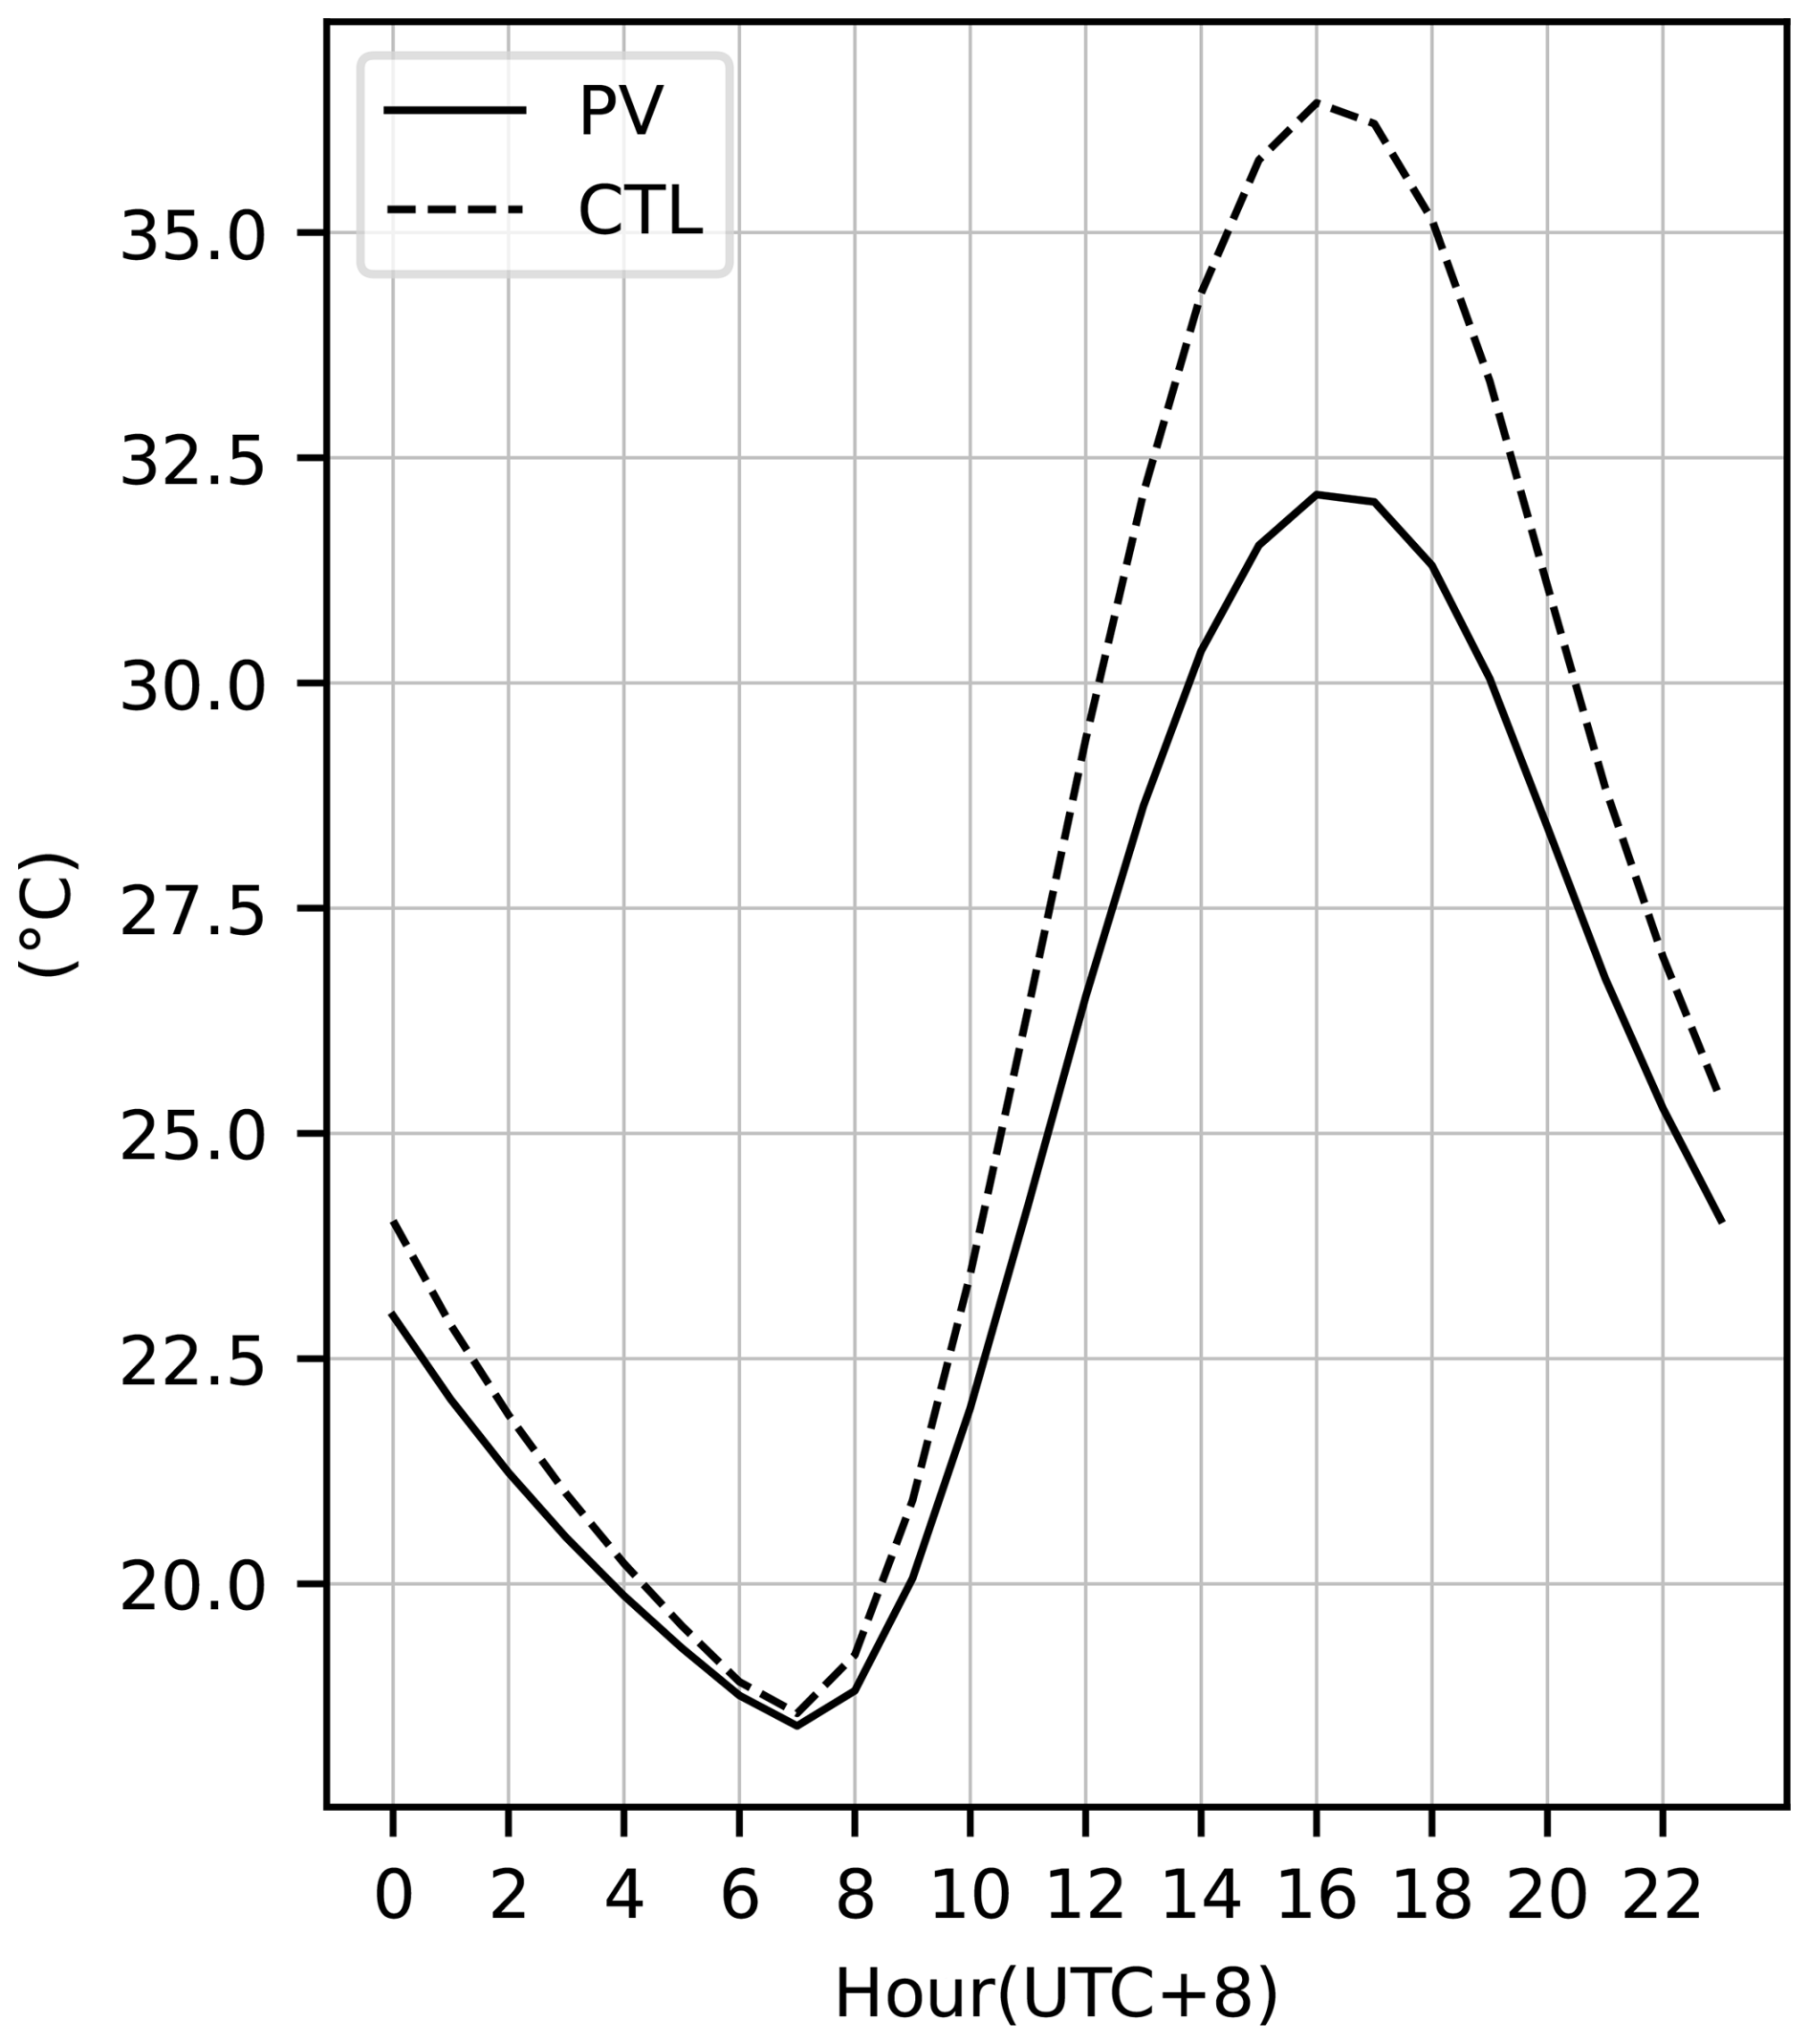
Figure 7Mean diurnal cycle of the 0–7 cm soil temperature in WRF_PV and WRF_CTL, averaged over all PV grid cells.
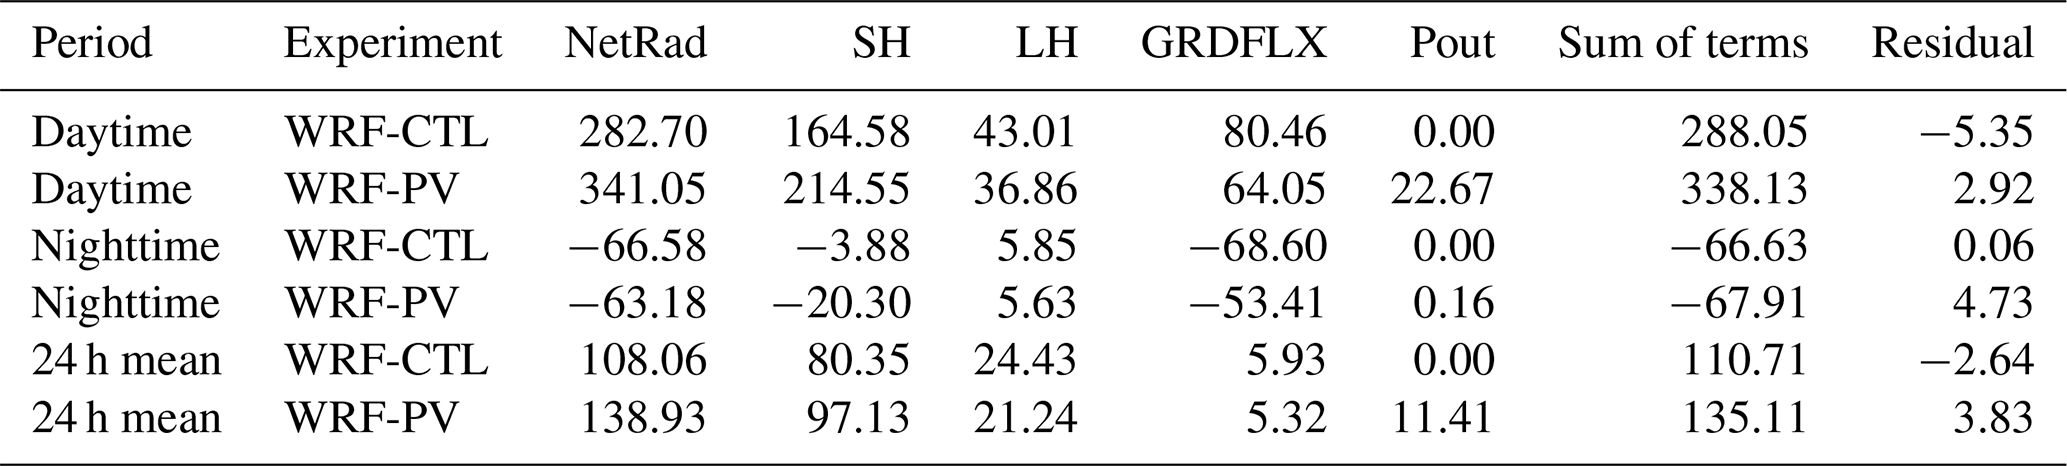
Table 2 summarizes the daytime, nighttime, and 24 h mean surface energy budgets over the WRF PV grid cells. The energy balance residual was calculated as the difference between net radiation and the sum of sensible heat flux, latent heat flux, ground heat flux, and electrical power output. In WRF_CTL, the residuals were −5.35, 0.06, and −2.64 W m−2 during daytime, nighttime, and over the full diurnal cycle, respectively. The corresponding residuals in WRF_PV were 2.92, 4.73, and 3.83 W m−2. This result indicates that the implemented PV–ground energy-balance scheme maintained approximate numerical energy closure.
Table 2Daytime, nighttime, and 24 h mean surface energy budget components over the WRF PV grid cells. All values are in W m−2.
To estimate the regional-scale magnitude of the PV-induced surface-energy perturbation, the local flux differences over the PV grid cells were weighted by the mean fractional area of PV grid cells within D03 during 2018–2024. The PV grid cells accounted for approximately 0.464 % of the D03 grid-cell area on average. This scaling yielded estimated daytime mean D03-averaged perturbations of approximately +0.27 W m−2 in net radiation and +0.23 W m−2 in sensible heat flux. These regional-mean perturbations were substantially smaller than the corresponding local changes over the PV grid cells because PV installations occupied only a small fraction of D03.
Having discussed the surface responses above, we now focus on the atmospheric feedbacks induced by PV installation, as reflected in the downward longwave and shortwave fluxes (LWdown and SWdown, Fig. 6a). LWdown increased slightly, while SWdown decreased significantly in the afternoon, with the largest difference of −18 W m−2 occurring at 14:00, and a daytime mean difference of −7 W m−2. The daytime mean difference accounted for approximately 1.2 % of the daytime mean SWdown in WRF_CTL. The reduction in SWdown was due to an increase in cloud fraction (Fig. 8a). The cloud fraction anomaly remained slightly positive throughout the day with a significant increase of approximately 1–3 percentage points in the afternoon, when the decrease in SWdown was most pronounced. In contrast, column-integrated water vapor decreased by approximately 0.2 kg m−2 (about 1 %) in WRF_PV relative to WRF_CTL, indicating that water vapor absorption was unlikely to be the primary cause of the SWdown reduction. This rise in clouds was consistent with the changes in vertical velocity and atmospheric stability (Fig. 8b and c). The vertical velocity showed positive anomalies (upward motion) between 600 and 850 hPa during 10:00–16:00, indicating locally intensified lifting driven by PV-induced enhanced sensible heat flux over the PV-covered area. Consistently, the static stability difference showed negative anomalies below about 600 hPa during daytime, reflecting reduced stability associated with the intensified thermal convection. Therefore, PV deployment not only shifted the surface energy partitioning but also changed the radiative energy input through land–atmosphere feedbacks.
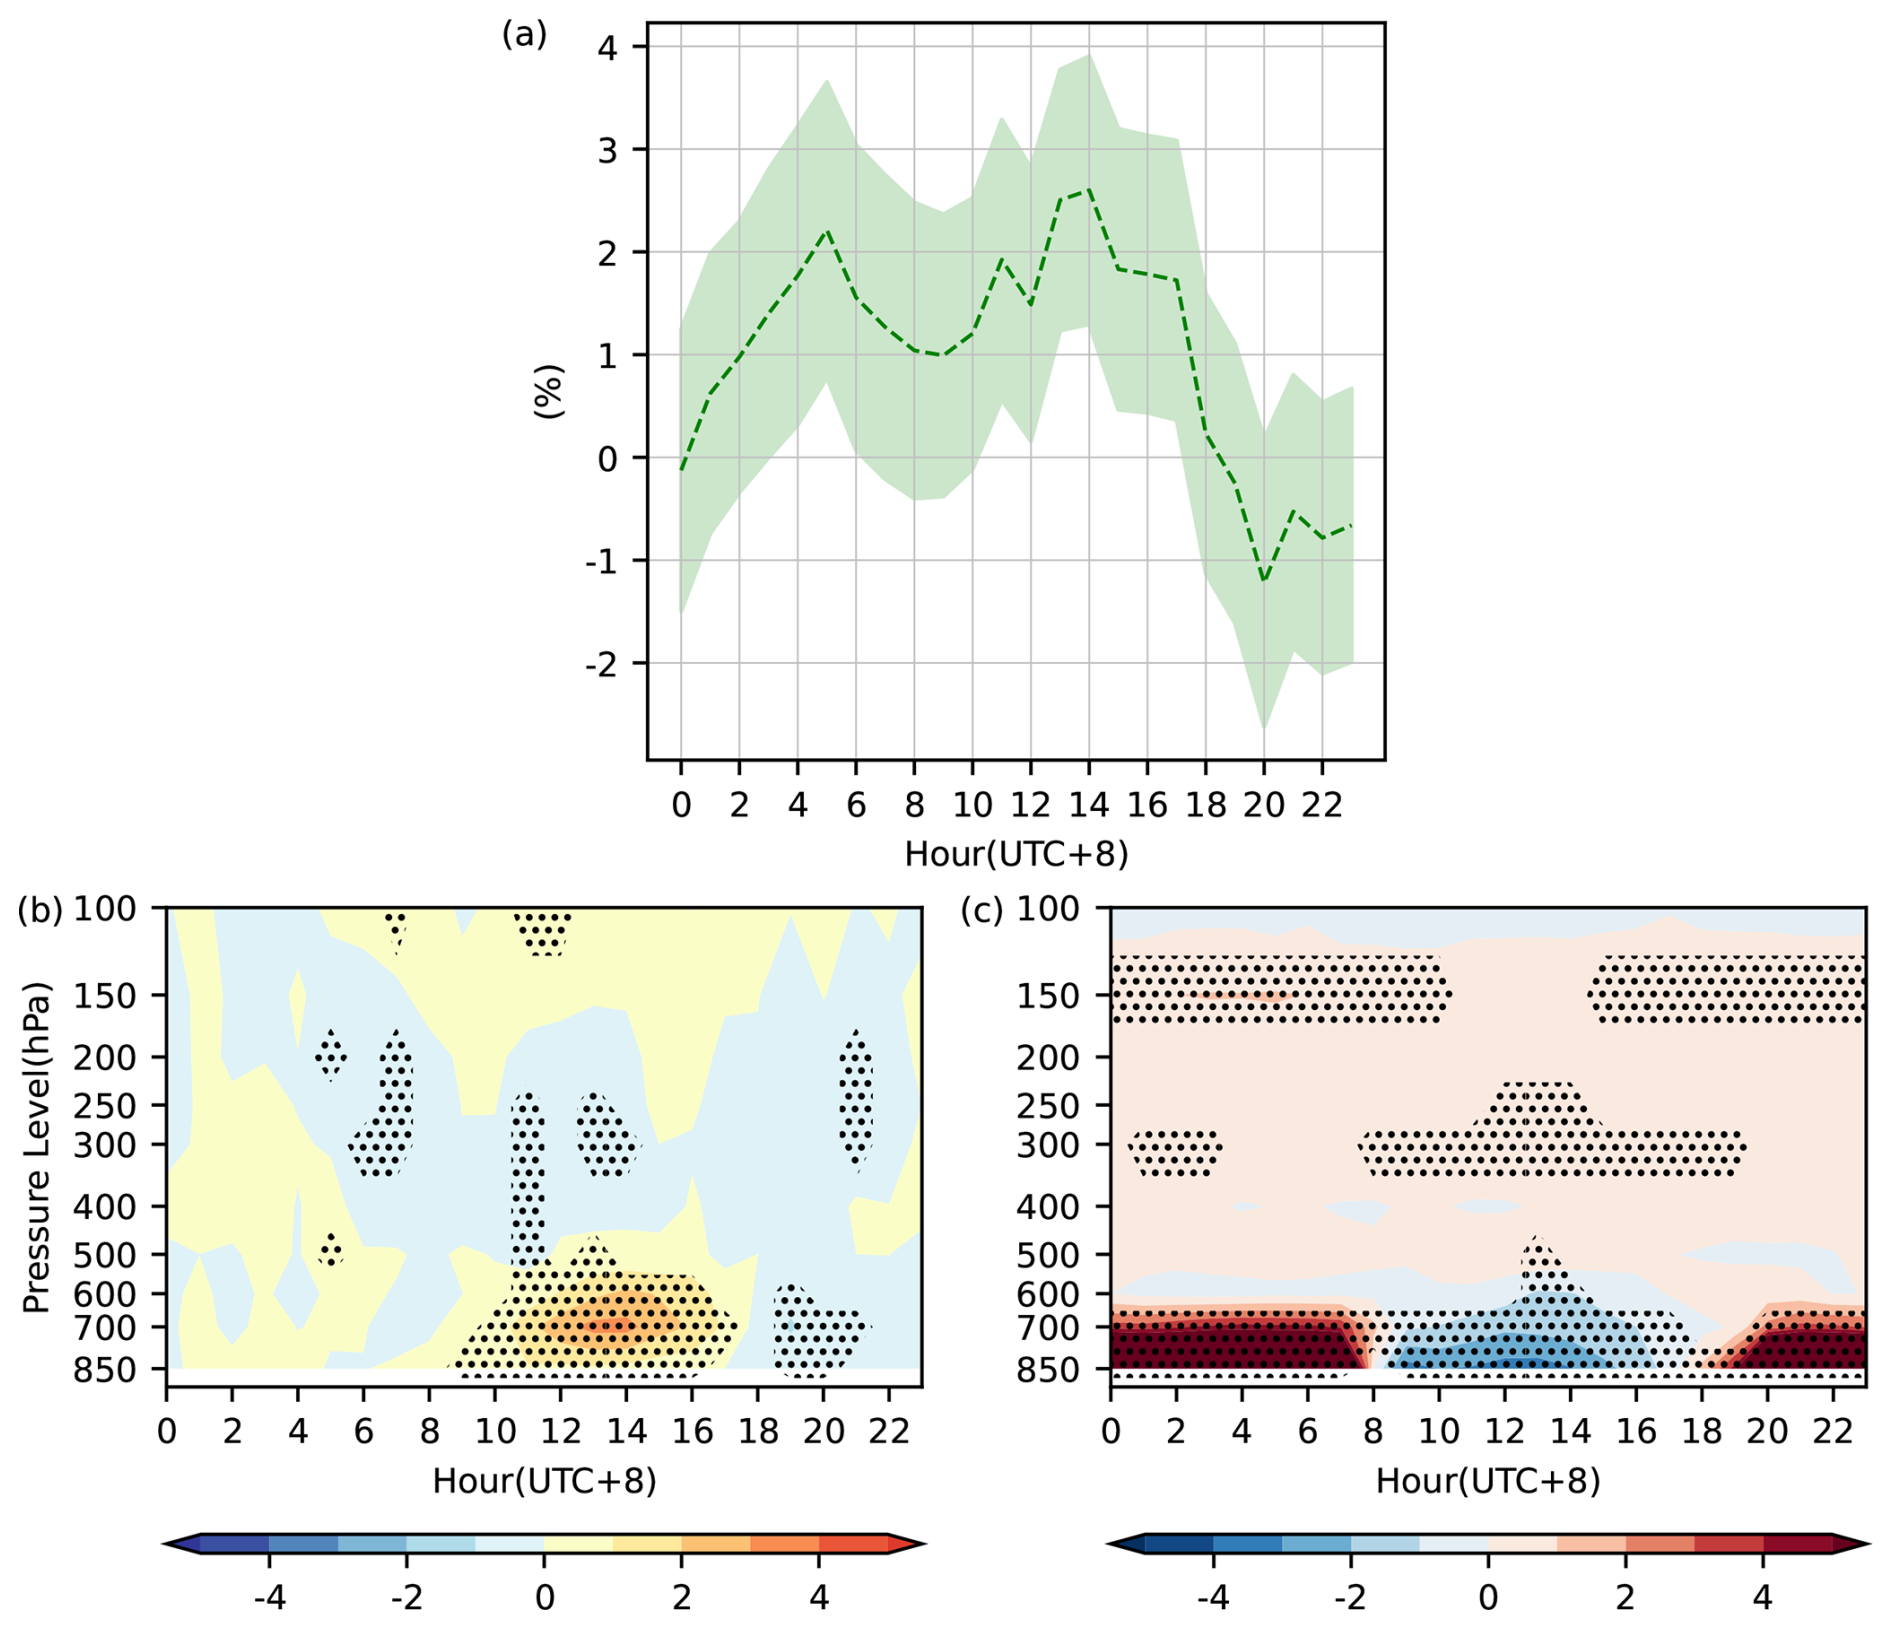
Figure 8Mean diurnal cycle of the difference of (a) low- and mid-level cloud fraction (below 400 hPa), (b) vertical velocity (cm s−1) and (c) static stability (10−4 K m−1) between WRF_PV and WRF_CTL, averaged over all PV grid cells. The shaded area in (a) represents the 95 % confidence interval, and dotted portions in (b) and (c) indicate differences that passed the significance test at the 95 % confidence level.
4.4 Impacts on precipitation
Figure 9 shows the spatial distributions of the changes in daily mean and cumulative extreme precipitation between WRF_PV and WRF_CTL together with the probability density distributions of daily precipitation. The domain-mean precipitation difference between WRF_PV and WRF_CTL was small, indicating little change in the overall summer precipitation amount (Fig. 9a). However, the spatial response was pronounced, with precipitation increasing mainly over the central and southern parts of the domain and decreasing over several northern and western areas. Despite only small changes in mean precipitation (Fig. 9a), the related changes in water vapor convergence, vertical motion, and precipitation were dynamically coherent (Fig. 10c and d). Accumulated extreme precipitation showed a more distinct and localized spatial response than mean precipitation (Fig. 9b). The probability distributions of WRF_PV and WRF_CTL were generally similar for light and moderate rainfall. However, WRF_PV showed a slightly higher probability density for heavy rainfall of 60–100 mm d−1, suggesting a modest shift toward more intense rainfall events (Fig. 9c).
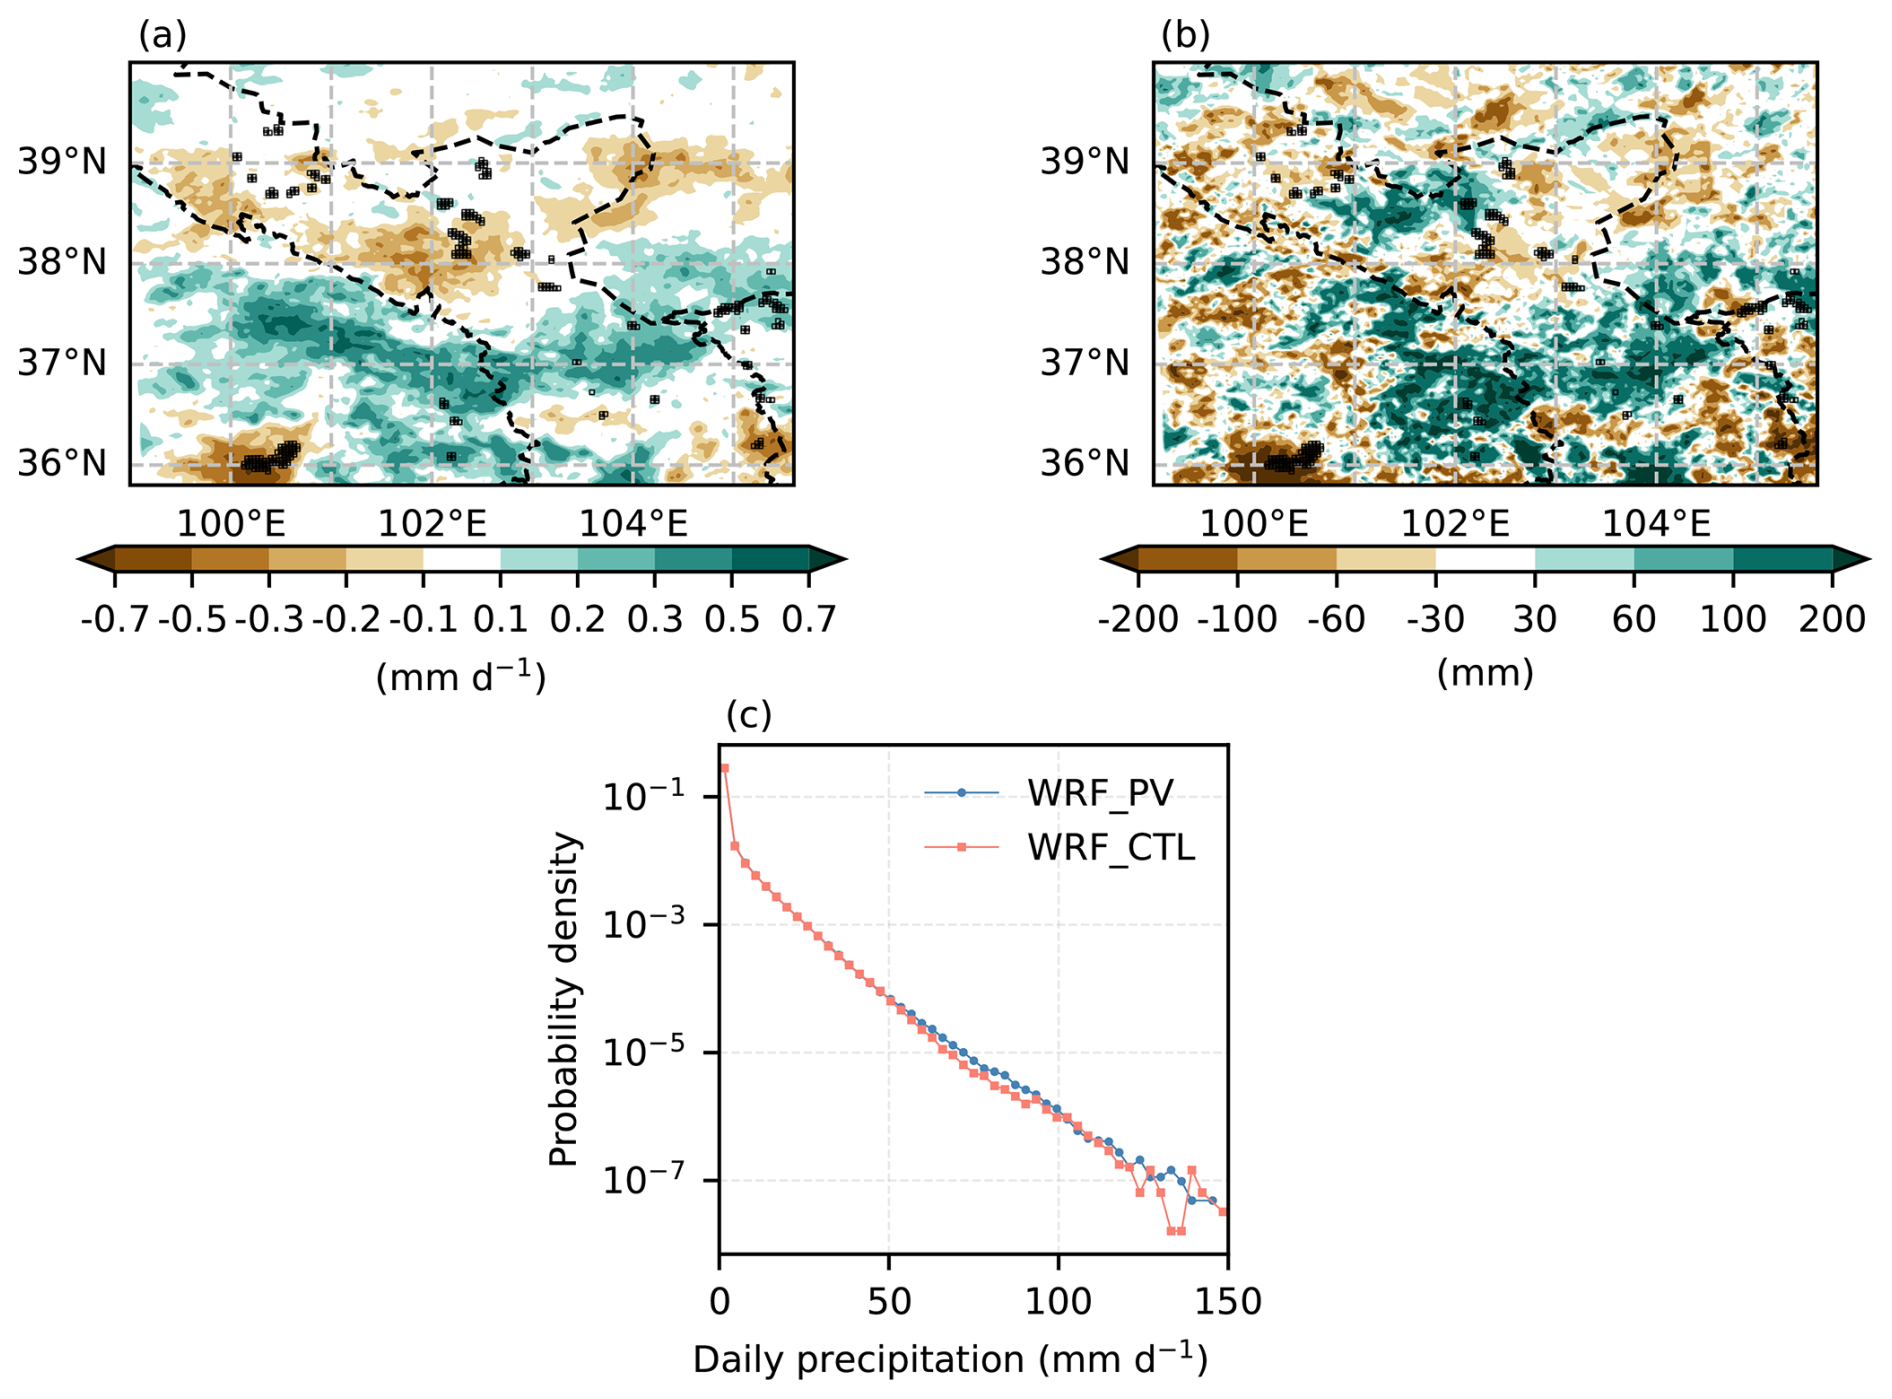
Figure 9Spatial changes and probability density distributions of summer precipitation during 2018–2024. (a) Difference in mean daily precipitation between WRF_PV and WRF_CTL. (b) Difference in cumulative extreme precipitation (> 30 mm d−1) amount between WRF_PV and WRF_CTL. (c) Probability density distributions of daily precipitation intensity in WRF_PV and WRF_CTL over D03. In (a) and (b), grey grid symbols denote PV grid cells.
In order to understand the association of the changes in circulation and precipitation with the PV distribution, Fig. 10a and b show the summer-mean low-level circulation and the change in sensible heat caused by PV deployment. The climatological low-level flow was predominantly southeasterly and closely influenced by the regional topography (Fig. 10a). The climatological precipitation field exhibited pronounced spatial heterogeneity, with higher precipitation over the plateau, where the low-level flow encountered rising terrain (Figs. 3a and 10a). Between 36 and 37° N, PV-induced sensible heating strengthened low-level convergence, accompanied by an enhanced easterly flow and water vapor transport toward the plateau (Fig. 10b). This circulation anomaly reinforced the existing terrain-related convergence and ascent (Fig. 10c and d), contributing to increased precipitation over northern Qinghai. Moreover, we take the area of extreme precipitation near 38.6° N, which is located well within the model domain and is largely free from lateral boundary effects, as an example (Fig. 9b). Increases in sensible heat flux were concentrated over the PV clusters and were accompanied by convergence in the low-level wind field (Fig. 10b). The easterly, southeasterly, and northeasterly wind anomalies flowed toward the PV clusters and ascended along the mountain range that marks the northern boundary of Gansu Province (Fig. 10a), inducing weak upward motion (Fig. 10c). Although this weak anomalous ascent led to only a slight modification of mean precipitation (Fig. 9a), it could produce enhanced extreme precipitation under appropriate conditions (Fig. 9b). These spatial correspondences suggested that PV-induced increases in sensible heat flux perturbed the local circulation, while the background flow and complex terrain modulated the locations of the resulting ascent, moisture convergence, and precipitation enhancement.
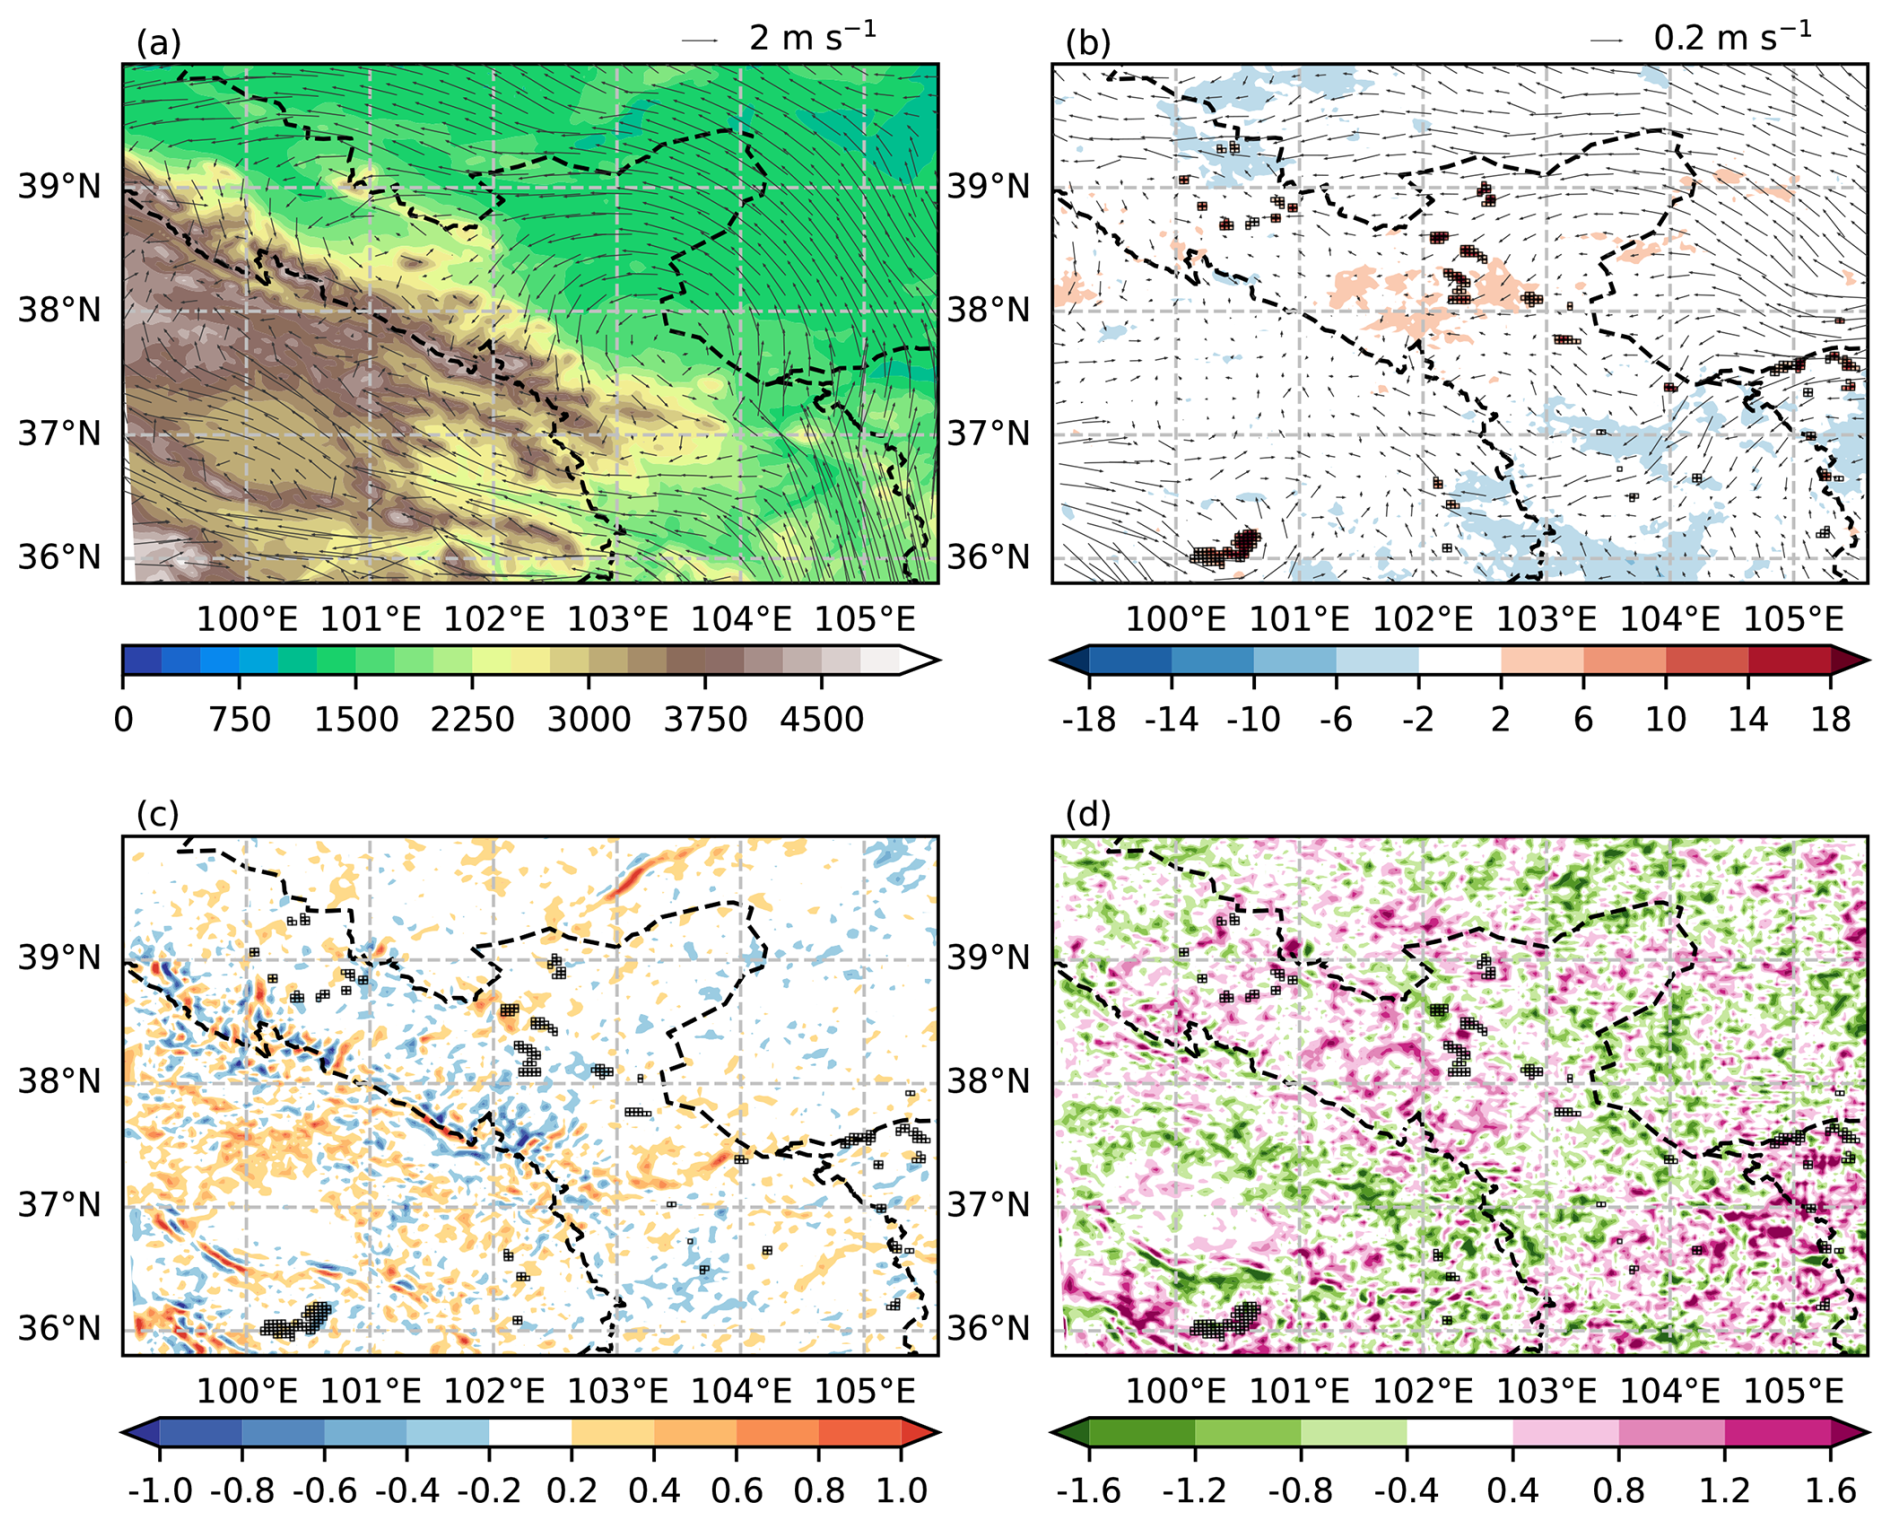
Figure 10Terrain and atmospheric processes during the summers of 2018–2024. (a) Terrain height (m, shading) and near-surface wind field in WRF_CTL (vectors). (b) Differences in sensible heat flux (W m−2, shading) and near-surface wind field (vectors). (c) Difference in vertical velocity (cm s−1), with positive values indicating enhanced upward motion. (d) Difference in vertically integrated water vapor flux divergence (10−5 kg m−2 s−1), with negative values indicating enhanced moisture convergence. All differences are calculated as WRF_PV minus WRF_CTL. In (b)–(d), grey grid symbols denote PV grid cells.
In this study, we developed a coupled WRF-PV model and applied it to summer conditions in northwestern China. The coupling maintains surface energy balance closure among the panels, the ground, and the atmosphere. This model provides a unified, physically consistent land–atmosphere framework for resolving PV-induced changes in surface energy balance and atmospheric response.
Evaluations showed that our model captured the spatial patterns of temperature and precipitation, the diurnal temperature cycle, and the precipitation frequency distribution. Moreover, the inclusion of the PV model improved the simulation of skin temperature over PV farms, reducing the RMSE from 3.071 °C in WRF_CTL to 2.560 °C in WRF_PV. During daytime, PV installations reduced the skin temperature (mean 1.6 °C, maximum 2.9 °C). This cooling is consistent with multiple remote sensing analyses of PV farms, which reported surface cooling of about 0.5 to 2 °C (Zhang and Xu, 2020; Fan and Huang, 2021; Li et al., 2021; Wang et al., 2024; Xu et al., 2024). Furthermore, PV deployment increased sensible heat flux while reducing latent heat and ground heat fluxes in the daytime, in good agreement with site measurements (Broadbent et al., 2019; Jiang et al., 2021). The enhanced sensible heating was driven by convective heat transfer from the warm PV panels to the surrounding air. Consequently, daytime 2 m air temperature increased (mean 1.2 °C, maximum 2.8 °C). This result is comparable to the near-surface warming of about 0.2 to 2.6 °C reported in previous site measurements (Barron-Gafford et al., 2016; Yang et al., 2017; Broadbent et al., 2019; Wu et al., 2020; Jiang et al., 2021; Li et al., 2023; Zhang et al., 2024).
Additionally, the PV-induced increase in sensible heating weakened lower-atmospheric stability and promoted upward motion, which increased cloud fraction and thereby reduced SWdown by approximately 1.2 %, with implications for local solar resources and PV yield estimation. Domain-mean summer precipitation changed little, but its spatial redistribution was pronounced, with a slight increase in the probability of rainfall in the 60–100 mm d−1 range.
An additional comparison with the effective albedo (EA) method of Li et al. (2018) is presented in the Supplement Sect. S2 and Table S1. The EA method does not account for shading and the associated changes in ground heat storage, nor does it explicitly represent convective heat exchange between PV panels and the atmosphere. By contrast, WRF-PV explicitly represents panel coverage, panel thermal properties, panel–atmosphere convective heat exchange, and shading effects, and showed closer agreement with MODIS.
WRF-PV can, in principle, be coupled with other land-surface schemes because the PV module is implemented outside the land-surface model subroutine. Such applications would mainly require adapting the input–output interface and the treatment of ground temperature beneath the panels. A one-day wall-clock benchmark showed that WRF-PV increased the model runtime by only 0.7 % relative to WRF_CTL.
Collocated in situ measurements of PV module temperature and surface energy fluxes were unavailable for the multiple PV farms and simulation periods considered in this regional study. However, the UCRC-Solar model underlying WRF-PV has previously been evaluated against measured module temperature and power production (Heusinger et al., 2020). In addition, the simulated peak PV module temperature of approximately 49 °C was close to the observed July daytime maximum of approximately 48 °C reported for a desert PV plant in western China (Li et al., 2023), while the simulated changes in sensible, latent, and ground heat fluxes were qualitatively consistent with previous field observations (Broadbent et al., 2019; Jiang et al., 2021). Future evaluation would benefit from broader field observations of module and near-surface air temperatures, surface energy fluxes, and power output to better constrain the energy partitioning represented by WRF-PV.
Because farm-specific installation information was unavailable, all PV farms were represented as fixed-tilt arrays with the same representative panel parameters. This simplification was supported by their location within a relatively narrow mid-latitude range with broadly similar solar geometry. The current WRF-PV implementation focuses on radiative and thermal processes and does not explicitly account for the aerodynamic effects of PV arrays on surface friction, near-surface wind, and turbulent exchange. In addition, the simulations were limited to boreal summer. Winter applications would require explicit treatment of PV-specific snow accumulation, shedding, and removal, which can affect panel energy balance and power output.
The present analysis focused on surface energy balance and land–atmosphere responses. Although soil moisture evolved interactively in the Noah land-surface model, its response to PV-induced shading was not systematically diagnosed. Vegetation conditions were prescribed rather than dynamically simulated. Over longer time scales, PV-induced changes in radiation, soil moisture, and near-surface microclimate may affect vegetation activity, which could modify transpiration, sensible–latent heat partitioning, and carbon exchange (Barron-Gafford et al., 2025; Jia et al., 2026). Consequently, the present results mainly represent the short-term physical responses to PV deployment and do not fully capture these longer-term feedbacks. Therefore, future work should extend WRF-PV toward a fully coupled PV–land–atmosphere–ecosystem model that can represent indirect feedbacks through vegetation-mediated land–atmosphere exchange, thereby improving the robustness of PV–climate impact assessments. Such a framework would be useful for future agrivoltaic applications in dryland regions, where the climatic effects of panel shading are closely tied to soil moisture conservation and vegetation-mediated land–atmosphere exchange (Ruth et al., 2026).
The WRF-PV model code, configuration files, and processed datasets used in this study are archived at Zenodo and are publicly available at: https://doi.org/10.5281/zenodo.21885978 (Chen, 2026). The PV module was implemented based on version 4.4.2 of the WRF (Skamarock et al., 2019), which is publicly available from the WRF official repository: https://github.com/wrf-model/WRF/tree/release-v4.4.2 (last access: 8 September 2026). The MODIS land surface temperature data used for model evaluation are available from the NASA Earthdata archive (https://earthdata.nasa.gov, last access: 8 September 2026). The CLDAS-V2.0 Dataset (Sun et al., 2020) is publicly available from the China Meteorological Data Service Centre (https://data.cma.cn/, last access: 8 September 2026).
The supplement related to this article is available online at https://doi.org/10.5194/gmd-19-8515-2026-supplement.
JJ conceived the study. YC developed the methodology and software, carried out the investigation, performed the formal analysis, prepared the visualizations, and wrote the original draft. JJ and YL supervised the research. JH contributed to the software development. JJ, YL, JH, JC, and ZZ reviewed and edited the manuscript. YL acquired the funding.
The contact author has declared that none of the authors has any competing interests.
Publisher's note: Copernicus Publications remains neutral with regard to jurisdictional claims made in the text, published maps, institutional affiliations, or any other geographical representation in this paper. The authors bear the ultimate responsibility for providing appropriate place names. Views expressed in the text are those of the authors and do not necessarily reflect the views of the publisher.
We thank the National Large Scientific and Technological Infrastructure “Earth System Numerical Simulation Facility” (https://cstr.cn/31134.02.el, last access: 8 September 2026) for technical support.
This study was supported by the National Natural Science Foundation of China (grant no. 42288101).
This paper was edited by Dalei Hao and reviewed by two anonymous referees.
Almukhtar, H., Lie, T. T., and Al-Shohani, W. A. M.: Comprehensive analysis of dust impact on photovoltaic module temperature: Experimental insights and mathematical modeling, Sol. Energy, 265, 112125, https://doi.org/10.1016/j.solener.2023.112125, 2023.
Armstrong, A., Ostle, N. J., and Whitaker, J.: Solar park microclimate and vegetation management effects on grassland carbon cycling, Environ. Res. Lett., 11, 074016, https://doi.org/10.1088/1748-9326/11/7/074016, 2016.
Barron-Gafford, G. A., Minor, R. L., Allen, N. A., Cronin, A. D., Brooks, A. E., and Pavao-Zuckerman, M. A.: The Photovoltaic Heat Island Effect: Larger solar power plants increase local temperatures, Sci. Rep., 6, 35070, https://doi.org/10.1038/srep35070, 2016.
Barron-Gafford, G. A., Pavao-Zuckerman, M. A., Minor, R. L., Sutter, L. F., Barnett-Moreno, I., Blackett, D. T., Thompson, M., Dimond, K., Gerlak, A. K., Nabhan, G. P., and Macknick, J. E.: Agrivoltaics provide mutual benefits across the food–energy–water nexus in drylands, Nat. Sustain., 2, 848–855, https://doi.org/10.1038/s41893-019-0364-5, 2019.
Barron-Gafford, G. A., Murphy, P., Salazar, A., Lepley, K., Rouini, N., Barnett-Moreno, I., and Macknick, J. E.: Agrivoltaics as a climate-smart and resilient solution for midday depression in photosynthesis in dryland regions, Npj Sustain. Agric., 3, 32, https://doi.org/10.1038/s44264-025-00073-1, 2025.
Bretherton, C. S. and Park, S.: A New Moist Turbulence Parameterization in the Community Atmosphere Model, J. Climate, 22, 3422–3448, https://doi.org/10.1175/2008JCLI2556.1, 2009.
Broadbent, A. M., Krayenhoff, E. S., Georgescu, M., and Sailor, D. J.: The Observed Effects of Utility-Scale Photovoltaics on Near-Surface Air Temperature and Energy Balance, J. Appl. Meteorol. Clim., 58, 989–1006, https://doi.org/10.1175/JAMC-D-18-0271.1, 2019.
Chang, R., Shen, Y., Luo, Y., Wang, B., Yang, Z., and Guo, P.: Observed surface radiation and temperature impacts from the large-scale deployment of photovoltaics in the barren area of Gonghe, China, Renew. Energy, 118, 131–137, https://doi.org/10.1016/j.renene.2017.11.007, 2018.
Chang, R., Luo, Y., and Zhu, R.: Simulated local climatic impacts of large-scale photovoltaics over the barren area of Qinghai, China, Renew. Energy, 145, 478–489, https://doi.org/10.1016/j.renene.2019.06.059, 2020.
Chang, R., Yan, Y., Luo, Y., Xiao, C., Wu, C., Jiang, J., and Shi, W.: A coupled WRF-PV mesoscale model simulating the near-surface climate of utility-scale photovoltaic plants, Sol. Energy, 245, 278–289, https://doi.org/10.1016/j.solener.2022.09.023, 2022.
Chen, F. and Dudhia, J.: Coupling an advanced land surface-hydrology model with the Penn State–NCAR MM5 modeling system. Part I: Model implementation and sensitivity, Mon. Weather Rev., 129, 587–604, https://doi.org/10.1175/1520-0493(2001)129<0569:CAALSH>2.0.CO;2, 2001.
Chen, S.-H. and Sun, W.-Y.: A One-dimensional Time Dependent Cloud Model, J. Meteorol. Soc. Jpn. Ser. II, 80, 99–118, https://doi.org/10.2151/jmsj.80.99, 2002.
Chen, Y.: Data and code for the article “Simulating the impacts of utility-scale photovoltaic installations with a physically based coupled WRF–PV model” (Version 1.1), Zenodo [code and data set], https://doi.org/10.5281/zenodo.21885978, 2026.
Coimbra, C. F. M.: Energy Meteorology for the Evaluation of Solar Farm Thermal Impacts on Desert Habitats, Adv. Atmos. Sci., 42, 313–326, https://doi.org/10.1007/s00376-024-4242-3, 2025.
Dudhia, J.: Numerical study of convection observed during the winter monsoon experiment using a mesoscale two-dimensional model, J. Atmos. Sci., 46, 3077–3107, https://doi.org/10.1175/1520-0469(1989)046<3077:NSOCOD>2.0.CO;2, 1989.
Duffie, J. A. and Beckman, W. A.: Solar Engineering of Thermal Processes, 4th Edn., John Wiley & Sons, Inc., https://doi.org/10.1002/9781118671603, 2013.
Fan, C. and Huang, X.: Satellite-observed changes of surface spectral reflectances due to solar farming and the implication for radiation budget, Environ. Res. Lett., 15, 114047, https://doi.org/10.1088/1748-9326/abbdea, 2020.
Fan, C. and Huang, X.: Direct impact of solar farm deployment on surface longwave radiation, Environ. Res. Commun., 3, 125006, https://doi.org/10.1088/2515-7620/ac40f1, 2021.
Ferrari Muniz, R., Silva Greatti, B., Sandrini, M., Paulo Belançon, M., Valcarenghi, R., Dosciatti Bini, R., and Santaella Zanuto, V.: Glass Application in Solar Energy Technology, in: Materials Science, vol. 13, edited by: Cristina Vasconcelos, H., IntechOpen, https://doi.org/10.5772/intechopen.1010177, 2025.
Glick, A., Smith, S. E., Ali, N., Bossuyt, J., Recktenwald, G., Calaf, M., and Cal, R. B.: Influence of flow direction and turbulence intensity on heat transfer of utility-scale photovoltaic solar farms, Sol. Energy, 207, 173–182, https://doi.org/10.1016/j.solener.2020.05.061, 2020.
Grell, G. A. and Dévényi, D.: A generalized approach to parameterizing convection combining ensemble and data assimilation techniques, Geophys. Res. Lett., 29, https://doi.org/10.1029/2002GL015311, 2002.
Haegel, N. M., Atwater, H., Barnes, T., Breyer, C., Burrell, A., Chiang, Y.-M., De Wolf, S., Dimmler, B., Feldman, D., Glunz, S., Goldschmidt, J. C., Hochschild, D., Inzunza, R., Kaizuka, I., Kroposki, B., Kurtz, S., Leu, S., Margolis, R., Matsubara, K., Metz, A., Metzger, W. K., Morjaria, M., Niki, S., Nowak, S., Peters, I. M., Philipps, S., Reindl, T., Richter, A., Rose, D., Sakurai, K., Schlatmann, R., Shikano, M., Sinke, W., Sinton, R., Stanbery, B. J., Topic, M., Tumas, W., Ueda, Y., Van De Lagemaat, J., Verlinden, P., Vetter, M., Warren, E., Werner, M., Yamaguchi, M., and Bett, A. W.: Terawatt-scale photovoltaics: Transform global energy, Science, 364, 836–838, https://doi.org/10.1126/science.aaw1845, 2019.
Hasan, A., Alnoman, H., and Rashid, Y.: Impact of integrated photovoltaic-phase change material system on building energy efficiency in hot climate, Energy Build., 130, 495–505, https://doi.org/10.1016/j.enbuild.2016.08.059, 2016.
Hersbach, H., Bell, B., Berrisford, P., Hirahara, S., Horányi, A., Muñoz‐Sabater, J., Nicolas, J., Peubey, C., Radu, R., Schepers, D., Simmons, A., Soci, C., Abdalla, S., Abellan, X., Balsamo, G., Bechtold, P., Biavati, G., Bidlot, J., Bonavita, M., De Chiara, G., Dahlgren, P., Dee, D., Diamantakis, M., Dragani, R., Flemming, J., Forbes, R., Fuentes, M., Geer, A., Haimberger, L., Healy, S., Hogan, R. J., Hólm, E., Janisková, M., Keeley, S., Laloyaux, P., Lopez, P., Lupu, C., Radnoti, G., De Rosnay, P., Rozum, I., Vamborg, F., Villaume, S., and Thépaut, J.: The ERA5 global reanalysis, Q. J. Roy. Meteor. Soc., 146, 1999–2049, https://doi.org/10.1002/qj.3803, 2020.
Heusinger, J., Broadbent, A. M., Sailor, D. J., and Georgescu, M.: Introduction, evaluation and application of an energy balance model for photovoltaic modules, Sol. Energy, 195, 382–395, https://doi.org/10.1016/j.solener.2019.11.041, 2020.
Heusinger, J., Broadbent, A. M., Krayenhoff, E. S., and Weber, S.: Adaptation of a photovoltaic energy balance model for rooftop applications, Build. Environ., 192, 107628, https://doi.org/10.1016/j.buildenv.2021.107628, 2021.
Hu, A., Levis, S., Meehl, G. A., Han, W., Washington, W. M., Oleson, K. W., Van Ruijven, B. J., He, M., and Strand, W. G.: Impact of solar panels on global climate, Nat. Clim. Change, 6, 290–294, https://doi.org/10.1038/nclimate2843, 2016.
Hulley, G. C., Malakar, N. K., Islam, T., and Freepartner, R. J.: NASA's MODIS and VIIRS Land Surface Temperature and Emissivity Products: A Long-Term and Consistent Earth System Data Record, IEEE J. Sel. Top. Appl. Earth Obs., 11, 522–535, https://doi.org/10.1109/JSTARS.2017.2779330, 2018.
IRENA: Future of solar photovoltaic: deployment, investment, technology, grid integration and socio-economic aspects, International Renewable Energy Agency, Abu Dhabi, ISBN 978-92-9260-156-0, 2019.
IRENA: Renewable capacity statistics 2023, International Renewable Energy Agency, Abu Dhabi, ISBN 978-92-9260-525-4, 2023.
Jia, M., Peng, B., Guan, K., Lawrence, D. M., DeLucia, E. H., Knapp, A. K., Barron-Gafford, G. A., Khanna, M., Lombardozzi, D. L., Sturchio, M. A., Kannenberg, S. A., Zhao, L., McCall, J., Tang, J., Bernacchi, C. J., Mwebaze, P., Majeed, F., Lee, D., and Time, A.: Climate-driven divergence in biophysical and economic impacts of agrivoltaics, P. Natl. Acad. Sci. USA, 123, e2514380123, https://doi.org/10.1073/pnas.2514380123, 2026.
Jiang, J., Gao, X., Lv, Q., Li, Z., and Li, P.: Observed impacts of utility-scale photovoltaic plant on local air temperature and energy partitioning in the barren areas, Renew. Energy, 174, 157–169, https://doi.org/10.1016/j.renene.2021.03.148, 2021.
Jiménez, P. A., Dudhia, J., González-Rouco, J. F., Navarro, J., Montávez, J. P., and García-Bustamante, E.: A Revised Scheme for the WRF Surface Layer Formulation, Mon. Weather Rev., 140, 898–918, https://doi.org/10.1175/MWR-D-11-00056.1, 2012.
King, D. L., Boyson, W. E., and Kratochvil, J. A.: Photovoltaic array performance model, Sandia National Laboratories, Albuquerque, NM, SAND2004-3535, https://doi.org/10.2172/919131, 2004.
Li, A., Liu, L., Li, S., Cui, X., Chen, X., and Cao, X.: Global photovoltaic solar panel dataset from 2019 to 2022, Sci. Data, 12, 637, https://doi.org/10.1038/s41597-025-04985-y, 2025a.
Li, B., Lei, C., Zhang, W., Olawoore, V. S., and Shuai, Y.: Numerical model study on influences of photovoltaic plants on local microclimate, Renew. Energy, 221, 119551, https://doi.org/10.1016/j.renene.2023.119551, 2024.
Li, B., Lei, C., Zhang, W., Xu, J., and Shuai, Y.: A numerical simulation study of microclimate in PV power plant using coupled WRF-PVCM, Energy, 317, 134529, https://doi.org/10.1016/j.energy.2025.134529, 2025b.
Li, G., Hernandez, R. R., Blackburn, G. A., Davies, G., Hunt, M., Whyatt, J. D., and Armstrong, A.: Ground-mounted photovoltaic solar parks promote land surface cool islands in arid ecosystems, Renew. Sustain. Energy Transit., 1, 100008, https://doi.org/10.1016/j.rset.2021.100008, 2021.
Li, P., Luo, Y., He, Z., Zheng, J., Xia, X., Liao, Z., and Gao, X.: A comparative study of the effects of photovoltaic power plants in desert and lake on the microclimate, Energy Rep., 10, 2128–2137, https://doi.org/10.1016/j.egyr.2023.08.064, 2023.
Li, Y., Kalnay, E., Motesharrei, S., Rivas, J., Kucharski, F., Kirk-Davidoff, D., Bach, E., and Zeng, N.: Climate model shows large-scale wind and solar farms in the Sahara increase rain and vegetation, Science, 361, 1019–1022, https://doi.org/10.1126/science.aar5629, 2018.
Li, Z., Zhao, Y., Luo, Y., Yang, L., Li, P., Jin, X., Jiang, J., Liu, R., and Gao, X.: A comparative study on the surface radiation characteristics of photovoltaic power plant in the Gobi desert, Renew. Energy, 182, 764–771, https://doi.org/10.1016/j.renene.2021.10.054, 2022.
Lin, G.: Photovoltaic dataset of China from 2013 to 2023 for ten years, Science Data Bank [data set], https://doi.org/10.57760/sciencedb.15684, 2024.
Long, J., Lu, Z., Miller, P. A., Pongratz, J., Guan, D., Smith, B., Zhu, Z., Xu, J., and Zhang, Q.: Large-scale photovoltaic solar farms in the Sahara affect solar power generation potential globally, Commun. Earth Environ., 5, 11, https://doi.org/10.1038/s43247-023-01117-5, 2024.
Lu, Z., Zhang, Q., Miller, P. A., Zhang, Q., Berntell, E., and Smith, B.: Impacts of Large‐Scale Sahara Solar Farms on Global Climate and Vegetation Cover, Geophys. Res. Lett., 48, e2020GL090789, https://doi.org/10.1029/2020GL090789, 2021.
Luque, A. and Hegedus, S.: Handbook of Photovoltaic Science and Engineering, 2nd Edn., John Wiley & Sons, Chichester, UK, https://doi.org/10.1002/9780470974704, 2011.
Lyu, X., Li, X., Wei, H., Wu, J., Dang, D., Zhang, C., Wang, K., and Lou, A.: Mapping of Utility-Scale Solar Panel Areas From 2000 to 2022 in China Using Google Earth Engine, IEEE J. Sel. Top. Appl. Earth Obs., 17, 18083–18095, https://doi.org/10.1109/JSTARS.2024.3468627, 2024a.
Lyu, X., Li, X., Zhang, C., Dang, D., Wang, K., and Lou, A.: Mapping the carbon mitigation potential of photovoltaic development in the Gobi and desert regions of China, Energy, 308, 132936, https://doi.org/10.1016/j.energy.2024.132936, 2024b.
Masson, V., Bonhomme, M., Salagnac, J.-L., Briottet, X., and Lemonsu, A.: Solar panels reduce both global warming and urban heat island, Front. Environ. Sci., 2, https://doi.org/10.3389/fenvs.2014.00014, 2014.
Mlawer, E. J., Taubman, S. J., Brown, P. D., Iacono, M. J., and Clough, S. A.: Radiative transfer for inhomogeneous atmospheres: RRTM, a validated correlated‐k model for the longwave, J. Geophys. Res.-Atmos., 102, 16663–16682, https://doi.org/10.1029/97JD00237, 1997.
Ruth, M., Kushwaha, P., Barron-Gafford, G. A., and Babst-Kostecka, A.: Enhancing climate-smart crop performance in arid agrivoltaics systems: effects of photovoltaic shading and soil amendments on tepary bean growth, yield, and associated soil microbiome, Plant Soil, 519, 1795–1819, https://doi.org/10.1007/s11104-025-08247-z, 2026.
Shaner, M. R., Atwater, H. A., Lewis, N. S., and McFarland, E. W.: A comparative technoeconomic analysis of renewable hydrogen production using solar energy, Energy Environ. Sci., 9, 2354–2371, https://doi.org/10.1039/C5EE02573G, 2016.
Skamarock, W. C., Klemp, J. B., Dudhia, J., Gill, D. O., Liu, Z., Berner, J., Wang, W., Powers, J. G., Duda, M. G., Barker, D. M., and Huang, X.-Y.: A Description of the Advanced Research WRF Model Version 4, https://doi.org/10.5065/1DFH-6P97, 2019.
Smith, S. E., Viggiano, B., Ali, N., Silverman, T. J., Obligado, M., Calaf, M., and Cal, R. B.: Increased panel height enhances cooling for photovoltaic solar farms, Appl. Energy, 325, 119819, https://doi.org/10.1016/j.apenergy.2022.119819, 2022.
Stanislawski, B. J., Harman, T., Silverman, T. J., Cal, R. B., and Calaf, M.: Row spacing as a controller of solar module temperature and power output in solar farms, J. Renew. Sust. Energ. Rev., 14, 063702, https://doi.org/10.1063/5.0123641, 2022.
Sun, S., Shi, C., Pan, Y., Bai, L., Xu, B., Zhang, T., Han, S., and Jiang, L.: Applicability Assessment of the 1998–2018 CLDAS Multi-Source Precipitation Fusion Dataset over China, J. Meteorol. Res., 34, 879–892, https://doi.org/10.1007/s13351-020-9101-2, 2020.
Turney, D. and Fthenakis, V.: Environmental impacts from the installation and operation of large-scale solar power plants, Renew. Sust. Energ. Rev., 15, 3261–3270, https://doi.org/10.1016/j.rser.2011.04.023, 2011.
Wallace, J. M. and Hobbs, P. V.: Atmospheric science: an introductory survey, 2nd Edn., Academic press, Amsterdam Paris, 395 pp., https://doi.org/10.1016/C2009-0-00034-8, 2006.
Wang, X., Zhou, Q., Zhang, Y., Liu, X., Liu, J., Chen, S., Wang, X., and Wu, J.: Diurnal Asymmetry Effects of Photovoltaic Power Plants on Land Surface Temperature in Gobi Deserts, Remote Sens., 16, 1711, https://doi.org/10.3390/rs16101711, 2024.
Wei, S., Ziegler, A. D., Qin, Y., Wang, D., Chen, Y., Yan, J., and Zeng, Z.: Small reduction in land surface albedo due to solar panel expansion worldwide, Commun. Earth Environ., 5, 474, https://doi.org/10.1038/s43247-024-01619-w, 2024.
Wu, W., Yue, S., Zhou, X., Guo, M., Wang, J., Ren, L., and Yuan, B.: Observational Study on the Impact of Large-Scale Photovoltaic Development in Deserts on Local Air Temperature and Humidity, Sustainability, 12, 3403, https://doi.org/10.3390/su12083403, 2020.
Xu, Z., Li, Y., Qin, Y., and Bach, E.: A global assessment of the effects of solar farms on albedo, vegetation, and land surface temperature using remote sensing, Sol. Energy, 268, 112198, https://doi.org/10.1016/j.solener.2023.112198, 2024.
Yang, L., Gao, X., Lv, F., Hui, X., Ma, L., and Hou, X.: Study on the local climatic effects of large photovoltaic solar farms in desert areas, Sol. Energy, 144, 244–253, https://doi.org/10.1016/j.solener.2017.01.015, 2017.
Yang, Y., Lin, S., Lu, R., and Liu, X.: CPVPD-2024: A Chinese photovoltaic plant dataset derived via a topography-enhanced deep learning framework, Sci. Data, 12, 1601, https://doi.org/10.1038/s41597-025-05891-z, 2025.
Yin, H., Krayenhoff, E. S., Voogt, J., Heusinger, J., and Aliabadi, A. A.: Simulation of Tilted Rooftop Photovoltaic Panels at City Scale: Novel Measurements, Model Development, and Application in WRF, J. Geophys. Res.-Atmos., 130, e2024JD043133, https://doi.org/10.1029/2024JD043133, 2025.
Ying, J., Li, Z., Yang, L., Jiang, Y., Luo, Y., and Gao, X.: The characteristics and parameterizations of the surface albedo of a utility-scale photovoltaic plant in the Gobi Desert, Theor. Appl. Climatol., 151, 1469–1481, https://doi.org/10.1007/s00704-022-04337-5, 2023.
Yue, S., Guo, M., Zou, P., Wu, W., and Zhou, X.: Effects of photovoltaic panels on soil temperature and moisture in desert areas, Environ. Sci. Pollut. Res., 28, 17506–17518, https://doi.org/10.1007/s11356-020-11742-8, 2021.
Zainali, S., Ma Lu, S., Stridh, B., Avelin, A., Amaducci, S., Colauzzi, M., and Campana, P. E.: Direct and diffuse shading factors modelling for the most representative agrivoltaic system layouts, Appl. Energy, 339, 120981, https://doi.org/10.1016/j.apenergy.2023.120981, 2023.
Zhang, J., Wu, L., and Dong, W.: Land-atmosphere coupling and summer climate variability over East Asia, J. Geophys. Res., 116, D05117, https://doi.org/10.1029/2010JD014714, 2011.
Zhang, J., Li, Z., Tao, J., Ge, Y., Zhong, Y., Wang, Y., and Yan, B.: Observed Impacts of Ground-Mounted Photovoltaic Systems on the Microclimate and Soil in an Arid Area of Gansu, China, Atmosphere, 15, 936, https://doi.org/10.3390/atmos15080936, 2024.
Zhang, X. and Xu, M.: Assessing the Effects of Photovoltaic Powerplants on Surface Temperature Using Remote Sensing Techniques, Remote Sens., 12, 1825, https://doi.org/10.3390/rs12111825, 2020.
Zhang, X., Lan, P., Lu, Y., Li, J., Xu, H., Zhang, J., Lee, Y., Rhee, J. Y., Choy, K.-L., and Song, W.: Multifunctional Antireflection Coatings Based on Novel Hollow Silica–Silica Nanocomposites, ACS Appl. Mater. Interf., 6, 1415–1423, https://doi.org/10.1021/am405258d, 2014.