
the Creative Commons Attribution 4.0 License.
the Creative Commons Attribution 4.0 License.
 | 04 Sep 2026
Sensitivity of cloud structure and precipitation to cloud microphysics schemes in ICON and implications for global km-scale simulations

Philipp Weiss
Philip Stier
Cloud microphysics remains a major source of uncertainty in km-scale atmospheric models. While cloud-resolving models have advanced our understanding of cloud-climate interactions, their predictability remains limited. Most studies have examined either microphysics schemes or domain-size sensitivities, but their interactions are poorly understood. This study examines cloud structure and precipitation sensitivity to microphysics schemes and how they vary between regional and global configurations within a single, consistent modelling framework. We analyse three convection-permitting simulations over the Amazon: two regional runs employing single- and double-moment microphysics schemes and a global single-moment run, with all other configurations consistent. We find that cloud hydrometeor characteristics are sensitive to the microphysics scheme. Specifically, the double-moment scheme produces up to five times more graupel and twice as much rain, but half as much cloud water and one-fifth as much fog as the single-moment scheme. Despite these differences, precipitation, water vapour, and outgoing longwave radiation remain consistent across schemes, suggesting large-scale constraints primarily govern integrated quantities. Furthermore, domain configuration further amplifies sensitivities. The global simulation exhibits up to 150 % more fog and nearly double the cloud ice compared to the regional single-moment run, highlighting the role of large-scale circulation and lateral boundary conditions. These findings demonstrate that microphysics schemes primarily influence cloud processes, while the domain setup determines how these sensitivities manifest. Improved observational constraints and perturbed-parameter ensembles are therefore needed to evaluate model performance, assess the broader generalisability of these findings and separate tuning effects and structural uncertainty.
- Article
(9947 KB) - Full-text XML
- BibTeX
- EndNote


Clouds are a key component of the atmospheric system, regulating the transport of heat, water, and momentum, while strongly influencing Earth’s energy balance (Stephens, 2005). Their radiative and hydrological effects are controlled by micron-scale physical processes, known as cloud microphysics, which govern the formation, growth, and sedimentation of hydrometeors. Due to their size, these interactions cannot be resolved and must be parameterised in atmospheric models. Uncertainties associated with this parameterisation are among the leading contributors to biases in the representation of clouds (Morrison et al., 2020).
Cloud-resolving models (CRMs) have become central tools for improving process-level understanding of clouds and for refining parameterisations in coarser-scale models. Since CRMs operate at kilometre or sub-kilometre grid spacings, they can explicitly simulate convection and its dynamics. Hence, CRMs are widely used to study cloud–aerosol–radiation interactions and cloud–climate feedbacks, and are often referred to as numerical laboratories (e.g., Wyngaard, 2004; Guichard and Couvreux, 2017; Randall et al., 1996; Herbert et al., 2015; Khain et al., 2015; Hourdin et al., 2017; Dagan et al., 2018; Herbert et al., 2021). Despite their strengths, studies have shown that simulated clouds are sensitive to many factors, including cloud droplet number concentration, aerosol optical depth, seasonality, and specific model employed (Karydis et al., 2012; Costa-Surós et al., 2020; Christensen et al., 2023; Labbouz et al., 2018). Furthermore, the magnitude of these responses strongly depends on model setup, including spatial resolution, domain size, and boundary conditions (Trenberth et al., 2009; Emanuel, 1994; Rao et al., 1988; Tao et al., 2012; Varble, 2018; Sherwood et al., 2020; Weigum et al., 2016; Li et al., 2024; Kipling et al., 2017; Marinescu et al., 2021; White et al., 2017; Zhang et al., 2017).
At the centre of these uncertainties lies the cloud microphysics parameterisation, which is implemented through microphysics schemes that approximate the statistical properties of hydrometeors (Adams-Selin et al., 2013; Morrison and Milbrandt, 2011; Tao et al., 2011). Different schemes, such as bin and bulk microphysics, employ different methods to evaluate hydrometeor statistics. Bulk microphysics schemes, the most common (Seiki et al., 2022), assume analytic functional forms for hydrometeor size distributions (e.g., gamma or lognormal) and predict a small set of statistical moments, such as mass mixing ratio or mean diameter (Lebo et al., 2012; Morrison and Milbrandt, 2011; Seifert and Beheng, 2006). This allows essential processes, including condensation, evaporation, deposition, and collision-coalescence, to be represented at reduced computational cost, while their complexity depends on the number of predicted moments.
Single-moment schemes predict only the mass mixing ratio of hydrometeor classes, typically cloud water, rain, ice, and snow. They are considered computationally efficient and reliable in km-scale models to reproduce the hydrological cycle and surface precipitation (Lebo et al., 2012). However, the prescribed number concentrations and fall speeds limit the representation of cloud variability, microphysical–radiative interactions, and phase partitioning (Khain et al., 2015). Double-moment schemes predict both mass and number concentration, allowing a more flexible treatment of processes such as growth, accretion, and riming (Seifert, 2011). This has been reported to improve the representation of hydrometeor spectra and precipitation development (e.g., Igel et al., 2015; Gettelman and Morrison, 2015). Beyond the added computational cost, double-moment schemes can introduce new biases from additional parameters and assumptions. For example, they can overestimate rainfall or condensate amounts in some environments (e.g., Wu and Petty, 2010; Van Weverberg et al., 2014).
As a result, differences between single- and double-moment schemes can significantly influence CRM outcomes, with several studies showing that microphysics affects simulated cloud fields as much as (or even more than) changes in resolution or external forcing (e.g., Igel et al., 2015; Guo et al., 2015; Khain et al., 2015; Seifert, 2011; Song and Zhang, 2011; Sullivan et al., 2016; Tao et al., 2016; White et al., 2017). Yet, with the current limitations of observational datasets, it remains difficult to determine which formulation performs more realistically.
Alongside the choice of microphysics, the choice of the domain also shapes CRM outcomes. Traditionally, CRMs are applied in limited-area domains, allowing for simulations with finer resolutions and longer integrations of specific weather events or localised phenomena, such as deep convection or regional precipitation patterns. Regional CRMs are particularly well-suited for process studies and case-specific experiments (Hohenegger et al., 2023), and have been widely used to investigate diurnal cycles, precipitation extremes, and mesoscale convective organisation. However, to constrain the atmospheric state and maintain consistency with observed large-scale conditions, regional simulations rely on lateral boundary conditions, typically derived from global reanalysis data or coarser-resolution models. This can propagate biases or errors from driving data into the simulated domain, limiting its ability to represent the full evolution of large-scale circulations (Uchida et al., 2017; Radović et al., 2024). This dependency is especially consequential in operational short-range forecasting, where regional CRMs serve as the primary tool for convective-scale prediction (e.g., Clark et al., 2016), and errors introduced at the lateral boundaries can rapidly propagate into the forecast. In addition, because regional simulations do not feed back to larger-scale flow, they decouple local processes from global circulation, thus preventing mutual interactions between local convection and large-scale dynamics (Guichard and Couvreux, 2017; Grabowski et al., 2000; Ibebuchi, 2022; Song et al., 2022).
Recent advances in high-performance computing have enabled CRMs to be employed globally, allowing km-scale simulations to explicitly resolve convective processes across the entire atmosphere. Global CRMs are increasingly used to explore large-scale circulation, climate sensitivity, and cloud–climate feedbacks (see, e.g., Herbert et al., 2025; Roh et al., 2021). In addition, global CRMs eliminate the need for lateral boundary conditions, resulting in a more consistent representation of large-scale phenomena, such as planetary waves and global circulation (Tomita et al., 2005; Hohenegger et al., 2023). However, the absence of external constraints can lead to divergence from observations, particularly for local weather systems (Hourdin et al., 2017); these setups may also struggle to capture small-scale processes due to resolution limitations. Global simulations also require a spin-up period, often around two weeks, to reach a statistically steady state, during which transient imbalances can affect results (Tomita et al., 2005; Kodama et al., 2012; Stevens et al., 2019). As a consequence, these methodological differences between regional and global simulations can result in substantial divergence in their representation of clouds and precipitation (Rocheta et al., 2017; Ferrari et al., 2020; Satoh et al., 2022).
In summary, the sensitivity of simulated clouds and precipitation to microphysics is well-documented, with differences between double-moment schemes exceeding those from aerosol perturbations (White et al., 2017), and higher resolutions have been shown to lead to improved mid-level cloud representation (Omanovic et al., 2024). By contrast, the role of domain configuration remains less explored, even though its limitations are increasingly recognised (Guichard and Couvreux, 2017; Grabowski et al., 2000; Song et al., 2022). Together, the uncertainties arising from microphysics schemes and from the choice between regional and global domains highlight the need to examine their interactions.
Motivated by these challenges, we investigate the sensitivity of cloud structure and precipitation to microphysics scheme in a km-scale CRM, and examine how these sensitivities manifest across regional and global configurations within a consistent modelling framework. Specifically, we ask how simulated cloud vertical profiles and precipitation differ between single- and double-moment schemes, and what the implications are for representing these processes in global km-scale simulations.
The remainder of this paper is organised as follows. Section 2 describes the model setup and experimental design. Section 3 presents the results, beginning with a bulk comparison before focusing on specific sections of the vertical cloud structure. Section 4 discusses the interpretation of results, observational biases, and model limitations. Section 5 summarises the findings and highlights their implications for future modelling efforts.
2.1 Model description
We use the ICOsahedral Non-hydrostatic modelling framework of the Max Planck Institute for Meteorology (ICON-MPIM), which simulates all Earth system components on an icosahedral-triangular C grid (Hohenegger et al., 2023). ICON comprises three main components: ocean, land, and atmosphere. For the land surface, it employs the Jena Scheme for Biosphere-Atmosphere Coupling in Hamburg (JSBACH) version 4, providing boundary conditions such as albedo, roughness length, and flux parameters, while solving the surface energy balance coupled with atmospheric diffusion equations (Richtmyer and Morton, 1967). It features a multi-layer soil hydrology scheme for water storage (Hagemann and Stacke, 2015) and a hydrological discharge model for routing runoff into the oceans (Hagemann and Dümenil, 1997). In the atmospheric component, ICON-MPIM utilises a hybrid sigma-z vertical coordinate system (the SLEVE scheme), incorporating a Rayleigh damping layer in the upper atmosphere (Leuenberger et al., 2010; Klemp et al., 2008). Within its regional configuration, a sponge layer is implemented along the lateral boundaries to prevent outward-propagating waves from reflecting, with the interior flow relaxed towards externally specified boundary data. In supersaturated regions, positive water vapour increments are cut to zero in the nudging zone to avoid an artificial increase in cloud water (DWD, 2020). ICON-MPIM employs radiation, cloud microphysics, and turbulence schemes, while avoiding parameterisation for shallow convection or subgrid-scale clouds to better resolve km-scale dynamics (Hohenegger et al., 2020). Its radiation scheme employs the Rapid Radiative Transfer Model for General circulation model applications-Parallel (RRTMGP) (Pincus et al., 2019), whereas turbulence is parameterised using a modified Smagorinsky scheme suited for cloud-resolving simulations (Dipankar et al., 2015). This configuration prioritises computational efficiency to explore Earth system dynamics and sensitivities to unresolved processes (Palmer and Stevens, 2019; Schär et al., 2020). Cloud microphysical processes are represented using the single- and double-moment schemes of Baldauf et al. (2011) and Seifert and Beheng (2006), respectively.
The single-moment scheme predicts mass mixing ratios of cloud water, rain, cloud ice, snow, and graupel. Warm-phase processes are represented by the parameterisation of Seifert and Beheng (2001), reduced to one-moment form by assuming a fixed cloud droplet number concentration of Nc=200 cm−3, consistent with the ICON one-moment microphysics default for continental conditions, and within the range reported for moderately polluted conditions in the Amazon during the wet season (see, e.g., Artaxo et al., 2002; Pöhlker et al., 2016). Raindrop growth and sedimentation are modelled using exponential size distributions with empirically derived terminal fall speeds. Cold-phase processes include graupel formation via raindrop freezing, cloud ice riming, and snow-to-graupel conversion when cloud water exceeds 0.2 g kg−1. Snow microphysics utilise temperature-dependent intercept parameters in exponential size distributions, enhancing the treatment of slower-falling aggregates at higher altitudes (Field et al., 2005). Graupel particles are assumed to have low density and moderate fall speeds based on the relationships of Heymsfield and Kajikawa (1987).
The double-moment scheme predicts both mass and number concentrations of the same hydrometeors, including hail. Raindrop formation employs a stochastic bulk parameterisation, with autoconversion and accretion rates depending on both mass and number concentrations, making them sensitive to droplet size and concentration. Hydrometeor size spectra are represented with a modified gamma distribution, whose parameters are diagnosed from the prognosed mass and number concentrations. Cold-phase processes include size-dependent collection and freezing efficiencies. Graupel forms through riming of snow and cloud ice, as well as melting and refreezing. Ice-phase interactions use collision efficiencies derived from Wisner et al. (1972), which account for the dependence of collection probability on particle size and relative fall speeds, providing a more realistic representation than the constant efficiencies assumed in simpler schemes. By prognosing number concentrations, the scheme explicitly represents processes such as ice multiplication, sedimentation velocities, and phase transitions under varying humidity and temperature conditions.
2.2 Simulation setup
To explore the sensitivity of cloud microphysics schemes, we compare two regional simulations using different microphysics schemes. To examine how these sensitivities interact with domain configuration, we also analyse a global simulation. All simulations are conducted using a horizontal grid spacing of approximately 5 km. The atmosphere and land components use time steps of 10 and 40 s in the regional and global setups, respectively, with radiation calculated every 3 and 12 min, consistent with stable configurations commonly used within the respective ICON configurations and compatible with available computational resources. Additional sensitivity tests using a regional configuration with the same atmospheric time step as the global simulation showed negligible differences in the analysed fields, indicating that the selected time steps do not materially affect the results presented here.
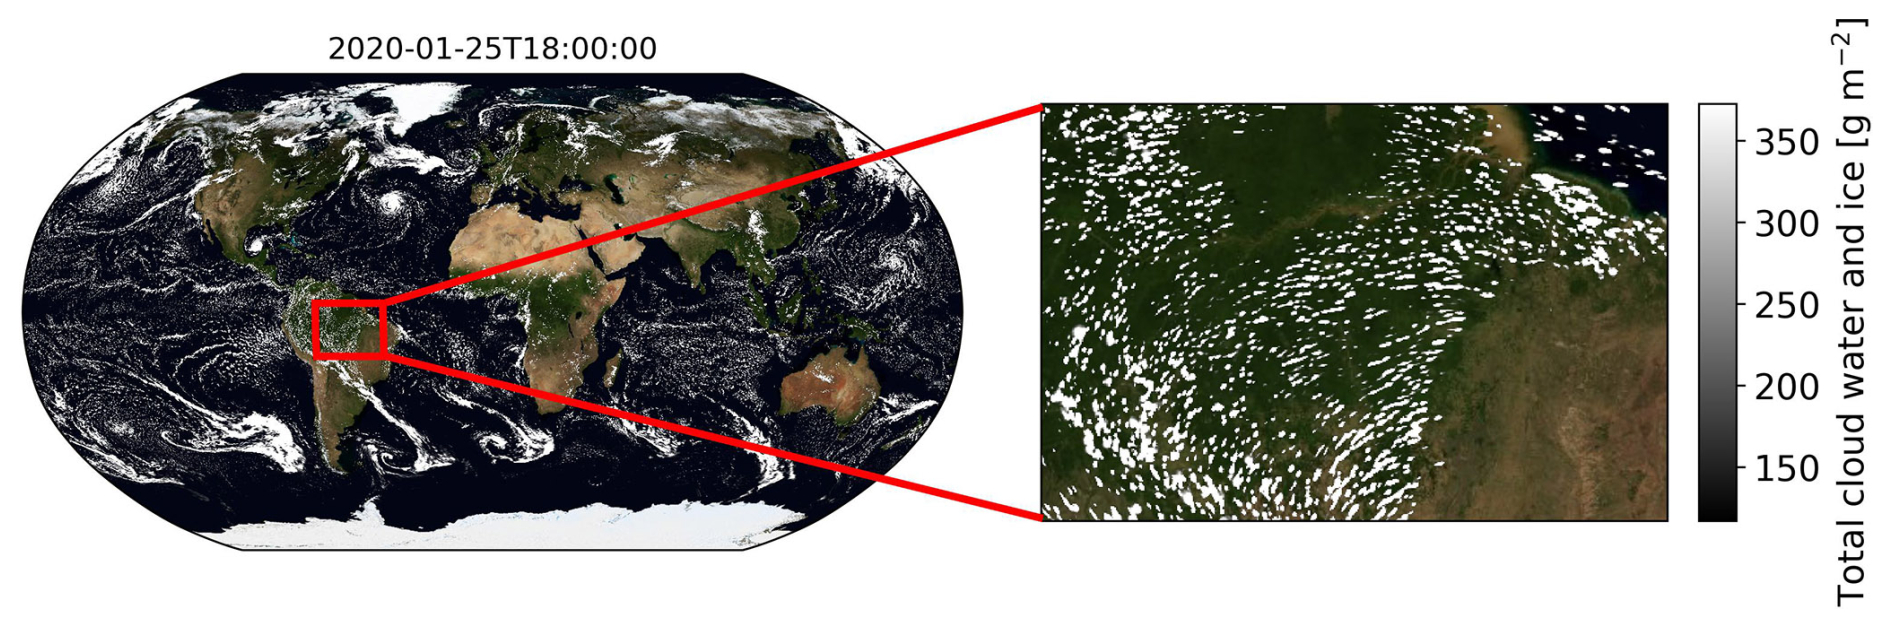
Figure 1Liquid and ice water path simulated by ICON-MPIM. The left panel shows the global distribution, with a red box highlighting the Amazon domain analysed in this study. The background image is taken from NASA Earth Observatory (NASA Earth Observatory, 2024).
The regional simulations use single- and double-moment microphysics schemes and are centred over the Amazon basin, spanning approximately 26° longitudinally (68–42° W) and 18° latitudinally (15° S–3° N). The global simulation employs the single-moment scheme and uses identical physical and numerical settings. From this simulation, the same Amazon region is selected (see Fig. 1) to enable direct comparison with the regional runs and to isolate the effects of domain configuration from those of microphysics representation. A 12 d spin-up (20–31 January 2020) is included to ensure the global simulation reaches a statistically stable state (Leduc and Laprise, 2009; Matte et al., 2017), with data collected and analysed across all simulations from 1 to 7 February 2020.
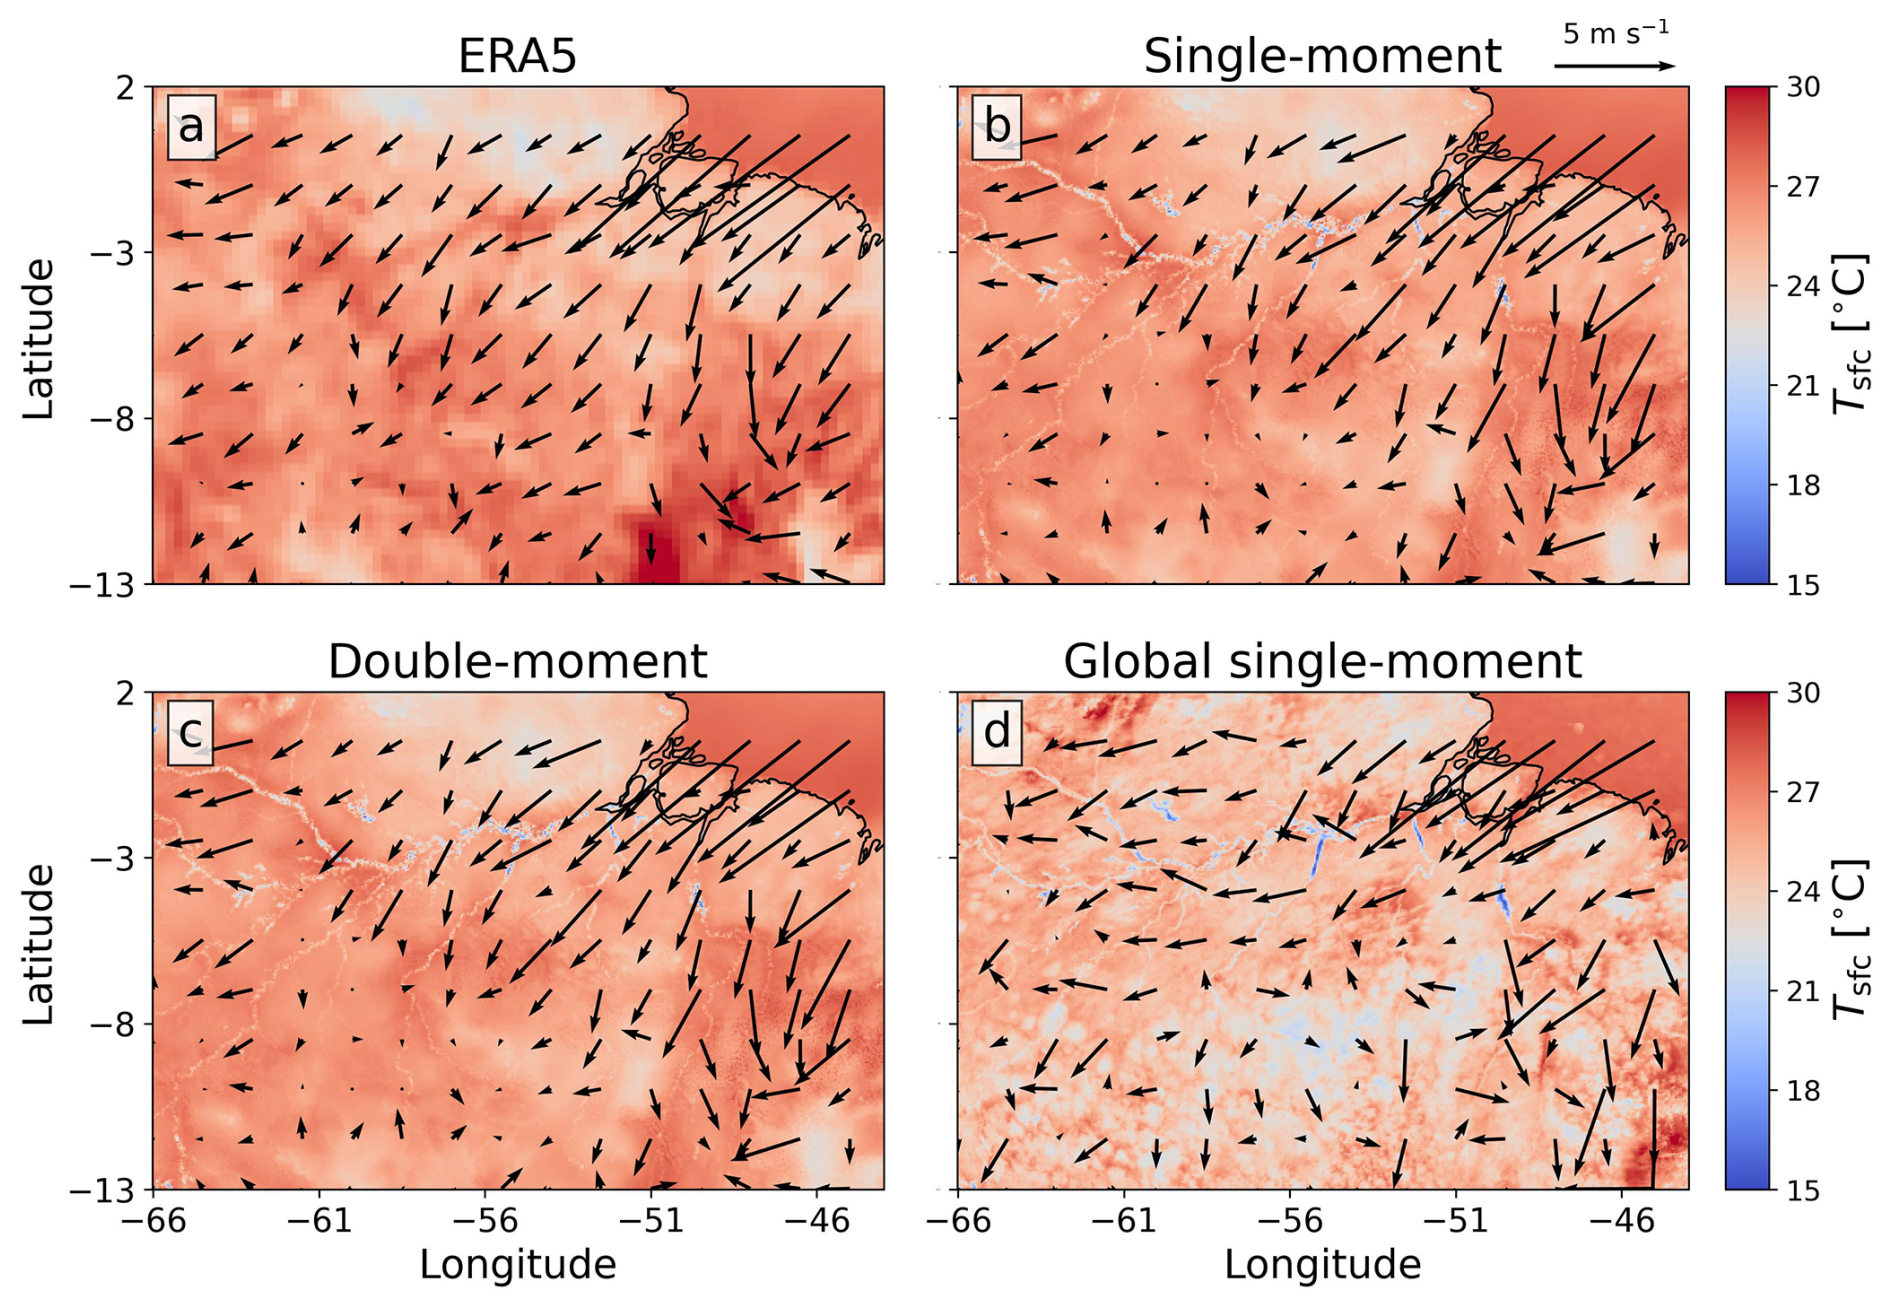
Figure 2Surface temperature (shading) and wind field (arrows) on 1 February 2020, 01:00 UTC, from (a) the ERA5 reanalysis, (b) the regional single-moment, (c) the regional double-moment, (d) and the global single-moment simulations. The figure illustrates the large-scale differences between the forcing fields used in the regional framework and the freely evolving global simulation.
ERA5 reanalysis data from the Copernicus Climate Change Service (Hersbach et al., 2017) is used to initialise all three simulations and provide lateral boundary conditions for the regional runs. Although all simulations undergo a spin-up period, the global configuration requires a substantially longer spin-up than the regional runs. Consequently, the atmospheric states of the simulations can diverge at the start of the analysis period, as shown in Fig. 2. The two regional simulations (Fig. 2b, c) remain nearly identical and closely resemble the ERA5 initial state (Fig. 2a). In contrast, the global simulation (Fig. 2d), despite reproducing the main large-scale features of ERA5, exhibits noticeable deviations characterised by cooler surface temperatures and a less organised near-surface wind pattern.
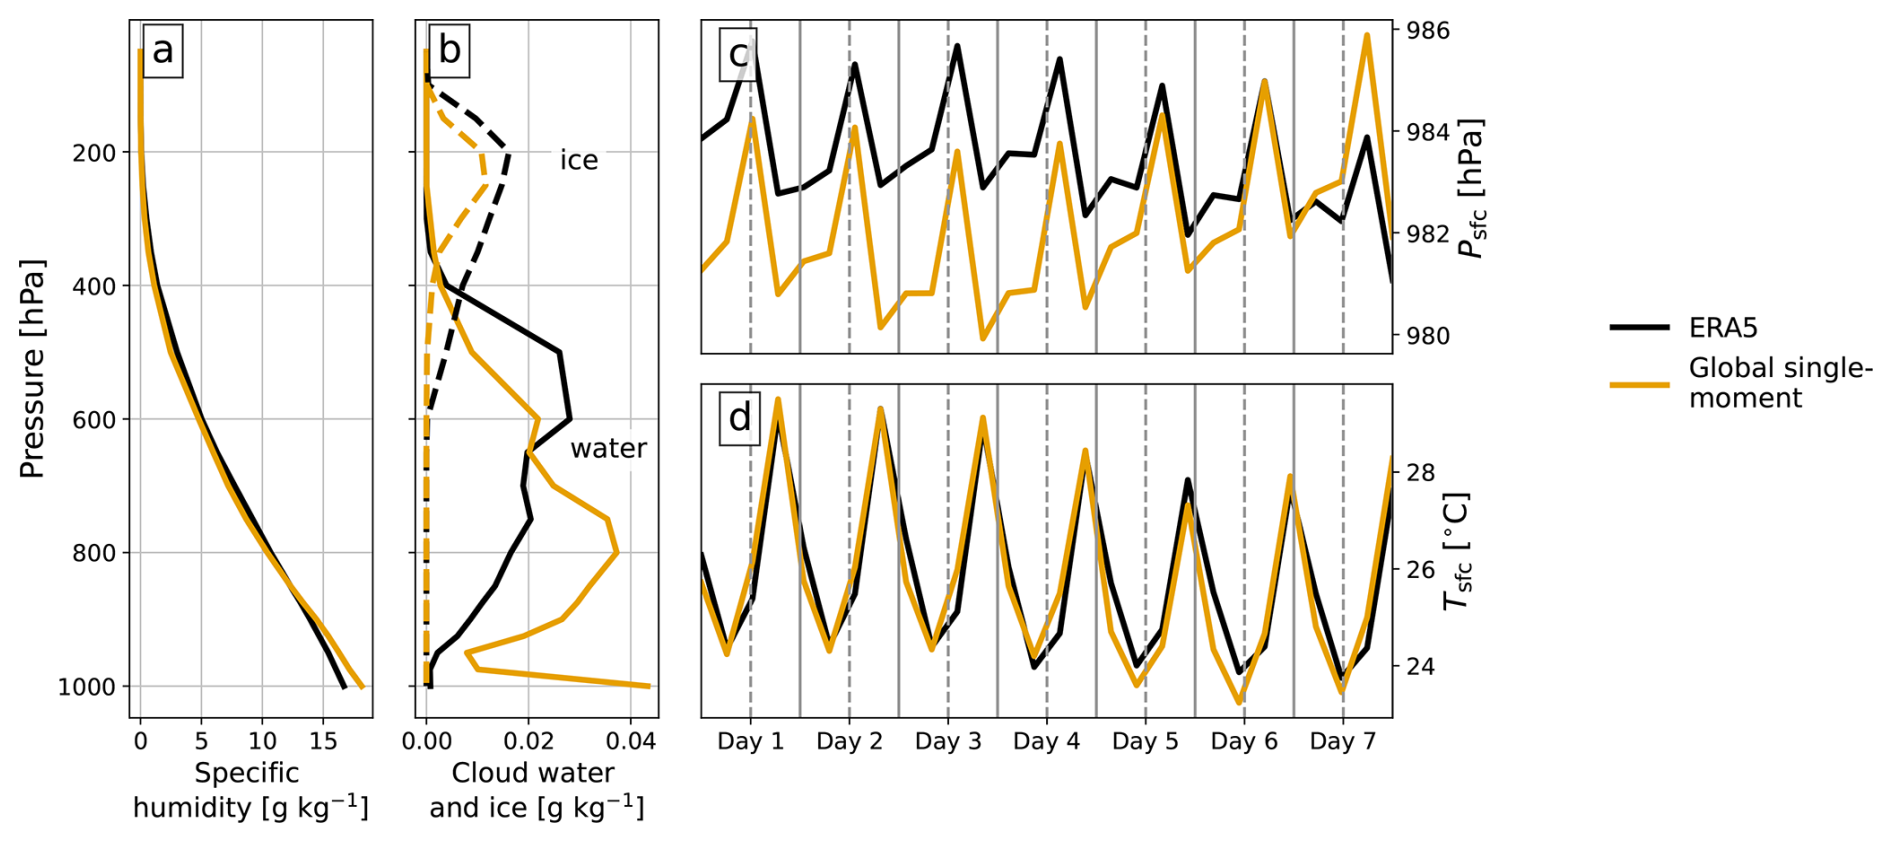
Figure 3Comparison of the ERA5 lateral boundary forcing applied to both regional simulations (black curves), with corresponding data from the global single-moment simulation (yellow curves) sampled within the boundary zone. Panels (a) and (b) show the mean vertical profiles of (a) specific humidity and (b) cloud water (solid) and ice (dashed), and panels (c) and (d) show the time series of (c) surface pressure and (d) surface temperature. The figure is intended to characterise differences in the large-scale forcing framework between the regional and global simulations.
Boundary conditions are updated every 6 h and linearly interpolated between time intervals. As with the initial conditions, the atmospheric state within the boundary zone remains closely constrained to ERA5 in both regional simulations, while the freely evolving global simulation can diverge substantially over time. To quantify these differences, Fig. 3 compares ERA5 boundary conditions with the corresponding boundary-region fields from the global simulation, sampled at the same frequency as ERA5 input. The comparison includes mean vertical profiles of specific humidity (Fig. 3a) and cloud water and ice (Fig. 3b), where solid lines indicate cloud water and dashed lines indicate cloud ice, as well as time series of surface pressure (Fig. 3c) and surface temperature (Fig. 3d). Figure 3 shows notable differences between ERA5 and the global single-moment simulation, including a near-surface specific humidity offset of about 2 g kg−1, divergence in vertical cloud profiles, and differences in the temporal evolution of surface pressure. Additional filtering tests (not shown) indicate that these differences persist beyond the dominant diurnal variability, suggesting that the global simulation evolves toward a distinct large-scale state during the analysis period. This behaviour is absent in the regional simulations, which remain continuously relaxed toward ERA5 at their lateral boundaries. In addition, the global simulation produces substantially more low-level cloud, whereas ERA5 shows greater amounts of mid-level and anvil cloud.
2.3 Observational data
To assess simulated surface precipitation rates and distributions, we use the Integrated Multi-satellitE Retrievals for Global Precipitation Measurement Mission (IMERG; NASA, 2020). IMERG estimates are derived from a combination of satellite observations and ground-based gauge measurements. Its high temporal (30 min) and spatial (0.1°) resolutions make it ideal for verification and comparison with CRM simulations. However, its evaluation for regional analysis is uncertain due to the lack of consistent ground-truth data (Li et al., 2023; Chen et al., 2020).
Despite this, IMERG effectively captures spatial precipitation patterns in regions with sparse rain gauges and complex topography (Hartke and Wright, 2022; Gilewski and Nawalany, 2018; Zhou et al., 2021), although its performance varies seasonally and geographically. Biases have been reported in the accuracy of winter precipitation over South America (Gadelha et al., 2019; da Silva et al., 2023), including misrepresentation of heavy rainfall and overestimation of moderate events (Talchabhadel et al., 2022; Muñoz de la Torre et al., 2024; Gadelha et al., 2019), and underdetection of low-intensity precipitation due to limitations of passive microwave retrieval (Bogerd et al., 2021). These issues are especially relevant in regions with strong seasonal variability, where the reliability of IMERG diminishes (Bulovic et al., 2020; Jiang and Bauer-Gottwein, 2019). However, IMERG remains valuable for evaluating simulated precipitation due to its high spatial and temporal resolution.
For deep-convection spatial distribution and occurrence, we use brightness temperature (BT) observations from the Advanced Baseline Imager (ABI) of the first satellite of the Geostationary Operational Environmental Satellites (GOES-16) series (Schmit and Gunshor, 2020) as a proxy for outgoing longwave radiation (OLR). We estimate OLR from ABI level 2 in the cloud and moisture imagery product (MCMIP) channel 11.2 µm using the relationship from Ohring et al. (1984) between the observed longwave window BT and the flux equivalent BT. This provides an OLR estimate that is most representative of high cloud tops, although it does not capture the full longwave spectrum.
To evaluate the simulations against in-situ observations, we use measurements from the Amazon Tall Tower Observatory (ATTO; Andreae et al., 2015), located in the central Amazon rainforest of Brazil. To constrain near-surface fog occurrence, we use ATTO's CHM15k ceilometer (Lufft, Fellbach, Germany), a vertically pointing backscatter lidar that provides continuous attenuated backscatter profiles and cloud base height retrievals, from which fog occurrence is inferred when the reported cloud base height falls at or near the surface (below 200 m). In addition, station visibility reports from the global Surface Synoptic Observations (SYNOP) network (WMO, 2019; https://library.wmo.int/idurl/4/35713, last access: 24 March 2026) are used to evaluate near-surface fog occurrence across the wider region. SYNOP (code form FM-12) is the World Meteorological Organization standard alphanumeric format for reporting surface meteorological observations from fixed land stations, both staffed and automatic, at standard synoptic times (00:00, 06:00, 12:00, and 18:00 UTC).
In this Section, we evaluate the vertical structure of the simulated cloud systems, examining how each component responds to the choice of microphysics scheme and the transition from a regional to a global configuration. First, we examine the time-averaged distributions of cloud water and ice. Figure 4 shows maps of liquid water path (LWP) and ice water path (IWP) across all three simulations. The distributions and magnitudes of LWP and IWP are sensitive to the microphysics scheme. The single-moment simulation generally predicts higher LWP values, especially along the northeastern coast, while the double-moment simulation yields lower values. All simulations predict increased LWP and IWP values over and near the coastline; however, the global simulation shows clouds in the northern parts of the domain, whereas the regional simulations remain relatively cloud-free in those areas. The double-moment simulation predicts a higher average IWP, with the global simulation showing more IWP in the northern “dry” regions as well (see Fig. 4d–f).
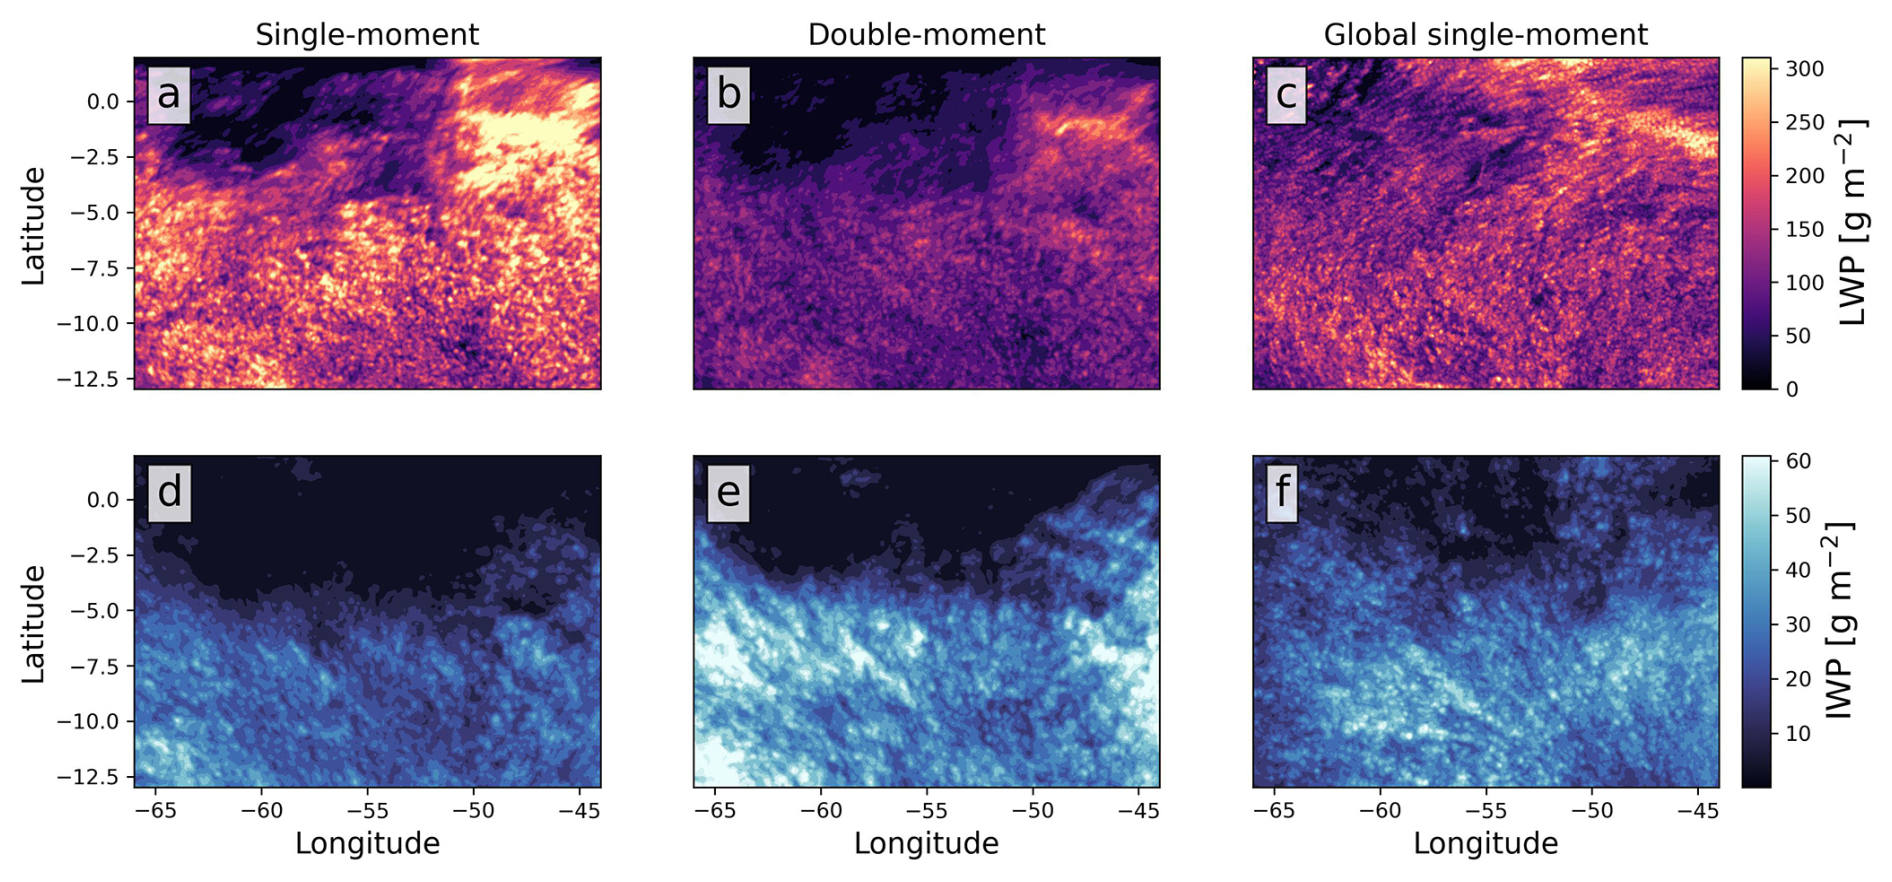
Figure 4Time-averaged maps of the liquid and ice water paths (a, d) for the single-moment regional simulation, (b, e) for the double-moment regional simulation, and (c, f) for the global simulation.
A closer examination of cloud structure reveals further differences. Figure 5 presents the time- and domain-averaged mass mixing ratio profiles for cloud water, ice, rain, graupel, snow, and water vapour. For rain, graupel, and snow, the single-moment simulations (regional and global) predict similar profiles (Fig. 5c–e). In contrast, the double-moment simulation predicts up to twice the rain and six times the graupel compared to single-moment runs, while snow amounts are lower (Fig. 5c–e). Regarding cloud ice (Fig. 5b), the simulations show less divergence: the double-moment simulates a slightly wider vertical spread with peak values marginally higher than the regional single-moment but lower than the global one.
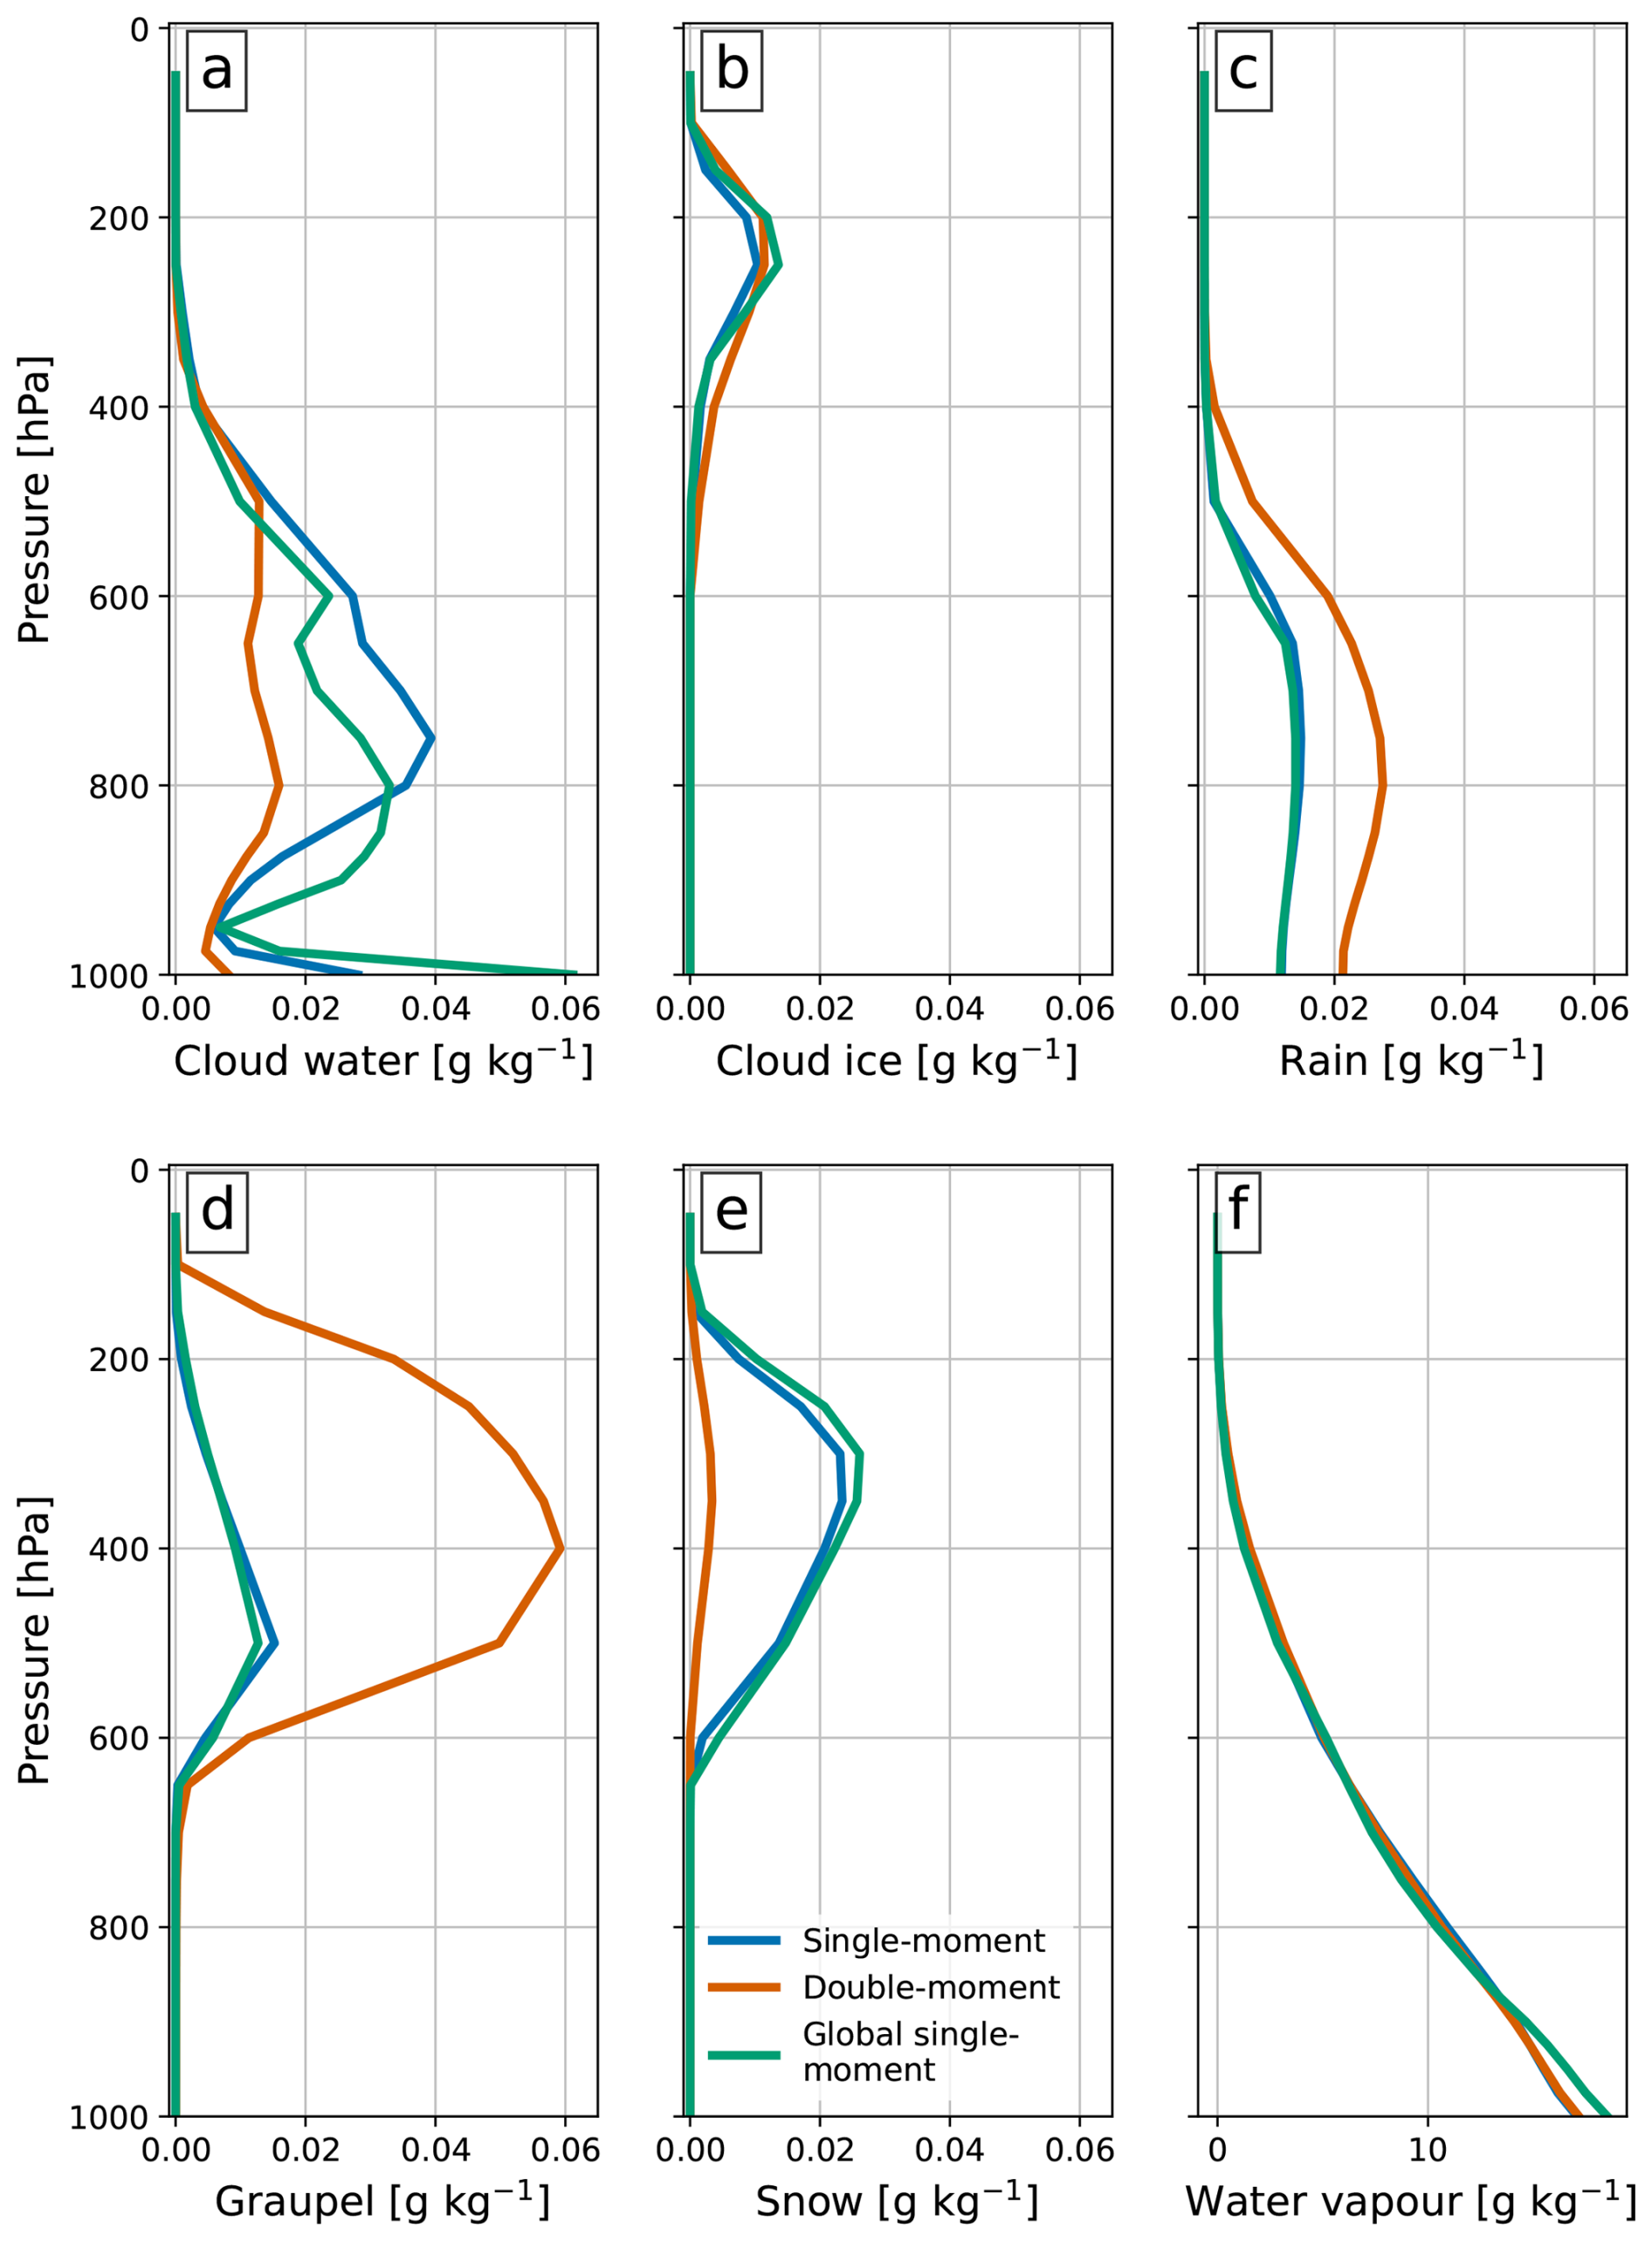
Figure 5Vertical profiles mass mixing ratio of (a) cloud liquid water, (b) ice, (c) rain water, (d) graupel, (e) snow, and (f) water vapour for the regional single-moment (blue) and double-moment (red) simulations, shown alongside the global single-moment run (green). The profiles are averaged over the entire Amazon region and experiment duration.
As for cloud ice, rain water, graupel, and snow, the cloud water profiles (Fig. 5a) indicate sensitivity to the microphysics scheme, particularly in low and mid-level clouds, with differences between the two single-moment simulations. For example, the global simulation predicts a lower cloud base, with higher vapour concentrations at lower levels. At around 750 hPa, a distinction between low and mid-level clouds is evident in the global simulation. Moreover, the simulations disagree on the magnitude of cloud liquid water at the lowest model level above the surface (Fig. 5a). To further analyse this, we focus on this lowest layer, and, hereafter, define fog as the cloud water present within this layer.
3.1 Fog
Fog formation is fundamentally governed by thermodynamic and dynamic conditions, including surface temperature, near-surface humidity, and boundary-layer structure. In this study, we do not aim to evaluate the absolute realism of simulated fog, but rather to characterise how fog responds to the two controlled differences between runs: the choice of microphysics scheme and the domain configuration. Although the regional simulations evolve freely within the domain interior, their large-scale thermodynamic evolution remains similar throughout the analysis period (not shown). Differences in fog characteristics between the regional runs can therefore be largely interpreted in terms of the differing microphysical representation, while differences between the regional and global runs additionally reflect the influence of large-scale dynamics. Figure 6 compares the spatial distribution of simulated fog occurrence frequency with SYNOP surface observations. Observed fog events are defined by horizontal visibility below 1.5 km, while model fog occurrence is defined as the normalised frequency of near-surface cloud liquid water mixing ratio exceeding 0.01 g kg−1. To ensure consistency, the model evaluation is restricted to the observation times. The two regional simulations exhibit broadly similar spatial fog distributions and occurrence frequencies, with enhanced fog occurrence near the northeastern coastal region and over parts of the southwestern domain. In contrast, the global single-moment simulation produces substantially broader and more persistent fog occurrence, particularly across the western half of the domain, with fog extending farther northward than in the regional configurations. The SYNOP observations indicate the highest fog occurrence frequencies at several stations within the western part of the domain. This behaviour is more consistent with the broader fog distribution produced by the global simulation, whereas the regional simulations remain comparatively fog-free in parts of this region. However, the global configuration also produces extensive fog occurrence in areas where the observational frequency remains relatively low, suggesting a positive bias in fog spatial coverage. Overall, the regional simulations produce more spatially confined fog occurrence patterns, while the global configuration favours more widespread and persistent fog formation.
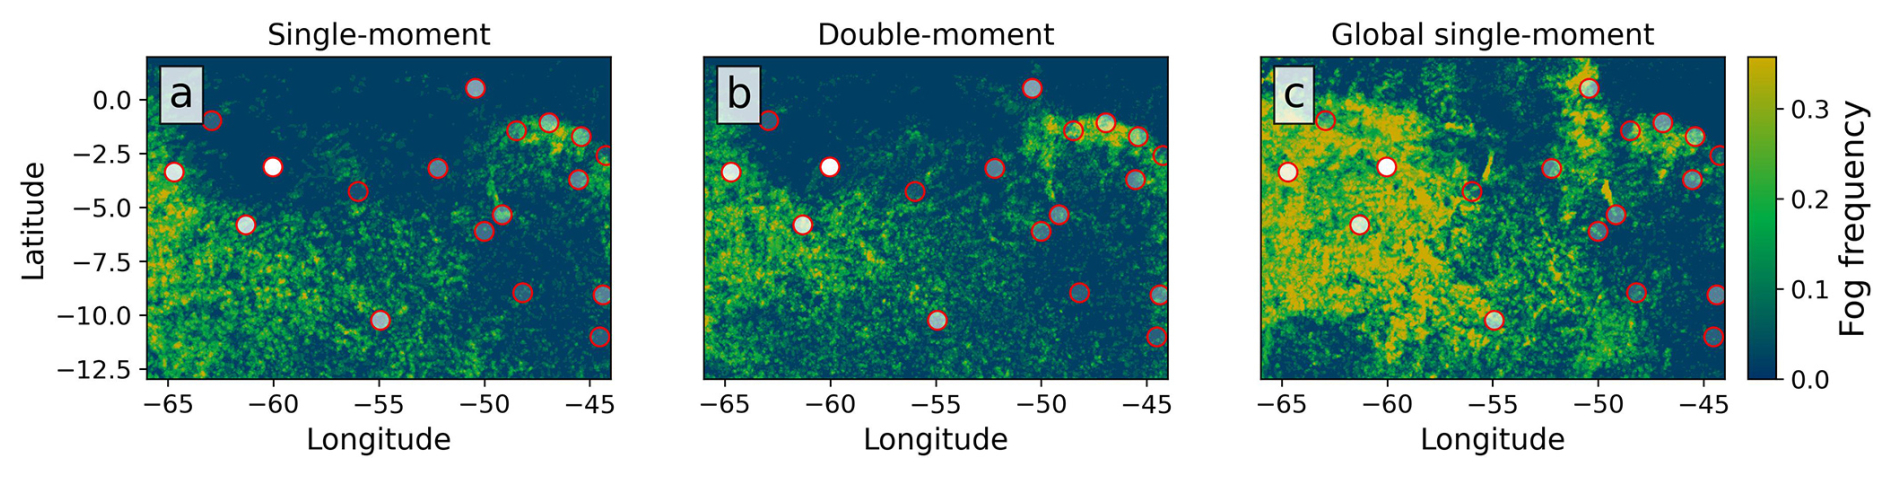
Figure 6Fog occurrence frequency for the (a) single-moment and (b) double-moment simulations, shown alongside (c) the global single-moment run. Fog occurrence is defined as the fraction of analysed time steps with fog mass mixing ratio exceeding 0.01 g kg−1. Overlaid circles (red) represent SYNOP stations, with their filling opacity indicating the normalised observed frequency of fog events (visibility <1.5 km) during the study period. Higher opacity corresponds to a greater frequency of fog reports.
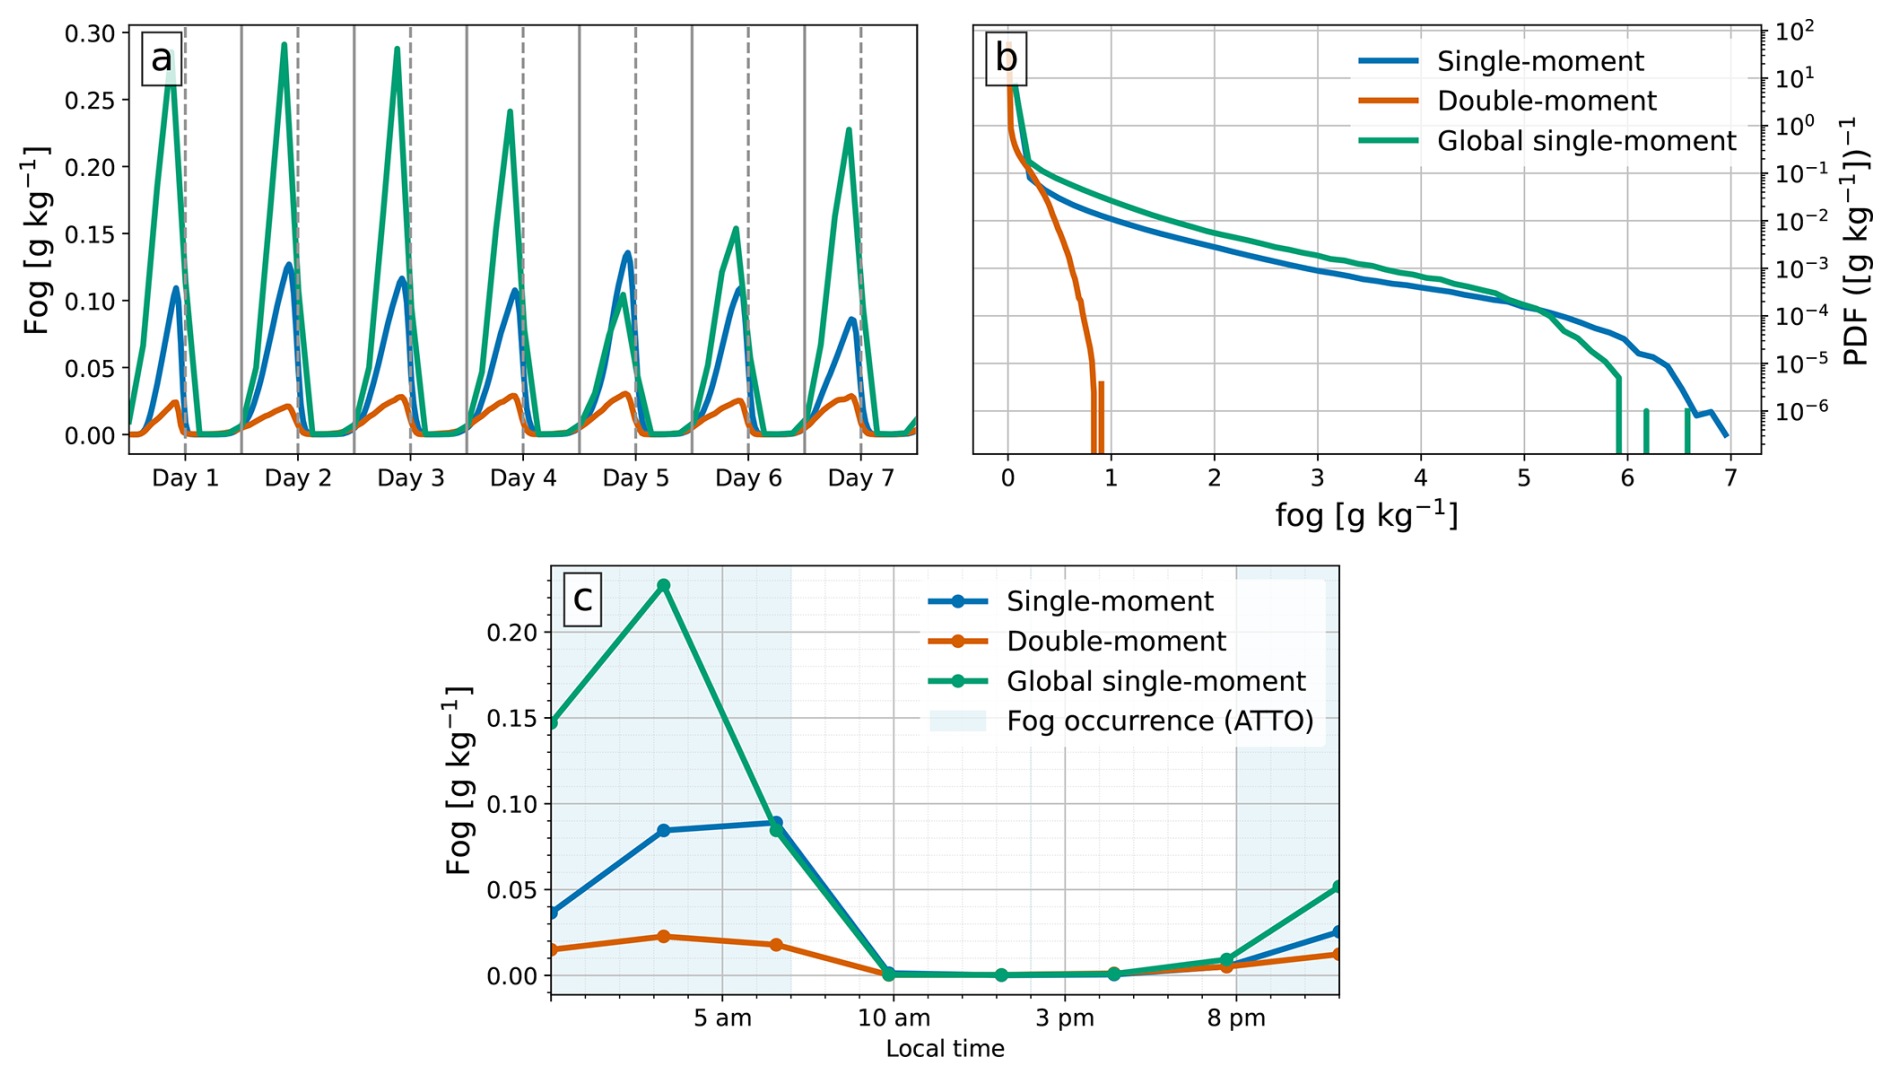
Figure 7(a) Domain mean time series, (b) probability density functions, and (c) the mean diurnal cycle of cloud liquid water mixing ratio at the lowest model level (fog) for the regional single-moment (blue) and double-moment (red) simulations, shown alongside the global single-moment run (green). In (c), the blue shading indicates periods when fog was observed by the ATTO ceilometer at least twice during the first week of February between 2022 and 2025.
As shown in Fig. 6, the domain-mean fog time series in Fig. 7a highlights significant differences in the fog diurnal cycle among the simulations. All three simulations exhibit similar diurnal cycles, starting around 20:00 LT and lasting approximately 12 h. As shown in Fig. 7c, this timing aligns well with the ATTO ceilometer observations, suggesting that ICON predicts the onset and peak of fog occurrence with relatively high reliability. However, amplitude differences are notable, with the double-moment simulation peaking at 0.025 g kg−1, the regional single-moment at 0.130 g kg−1, and the global single-moment at 0.295 g kg−1. Despite these large differences in magnitude, the consistent diurnal phase across all runs suggests that the underlying dynamical and thermodynamic triggers are similarly represented across configurations. Furthermore, while the onset is well-captured, all simulations exhibit a clear bias during the dissipation phase compared to observations, with fog persisting longer in the models than indicated by ATTO reports. Interestingly, the global simulation shows a decrease in fog on day five, the only instance where its mean value falls below that of the regional simulation. The subsequent recovery by day seven coincides with changes in circulation patterns. Because the regional simulations are constrained by reanalysis data at their lateral boundaries, whereas the global run evolves freely, external influences outside the Amazon basin modify local conditions through internally generated dynamics. These changes enhance vertical mixing and horizontal transport, which remove moisture from the boundary layer and reduce fog formation. While the time series in Fig. 7a shows some similarities, the probability density function (PDF) in Fig. 7b (shown on log-log axes) highlights clearer differences. The single-moment simulations display comparable distributions, with more frequent fog occurrences across most of the range. However, the distribution predicted by the double-moment simulation is shifted to lower values compared to the regional simulations, with a maximum value reaching approximately 1 g kg−1. This highlights that, under near-identical thermodynamic boundary forcing, the microphysics scheme is the primary source of inter-simulation variability in fog intensity, consistent with Pope and Igel (2023), who identify droplet size distribution tuning as a key driver for fog variability.
3.2 Liquid clouds
Analysis of the warm-phase processes reveals time series differences in water vapour path, LWP, and rain water path across all three simulations (Fig. 8). While all simulations agree on the general cycle, differences in amplitude are evident. The regional simulations show nearly identical water vapour distributions (Fig. 8a), with differences less than 0.5 %, whereas the global simulation exhibits levels up to 5 % higher. For LWP and rain (Fig. 8b and c), the single-moment simulations remain closely aligned throughout most of the experiment, while the double-moment simulation shows significantly lower LWP (up to half as much) and higher rain values (up to twice more). The global simulation also demonstrates greater diurnal variability in LWP, with a larger peak-to-peak range compared to the regional runs. Maximum LWP values differ notably; the average difference is 102.7 g m−2 between the regional simulations and 16.6 g m−2 between the single-moment simulations.
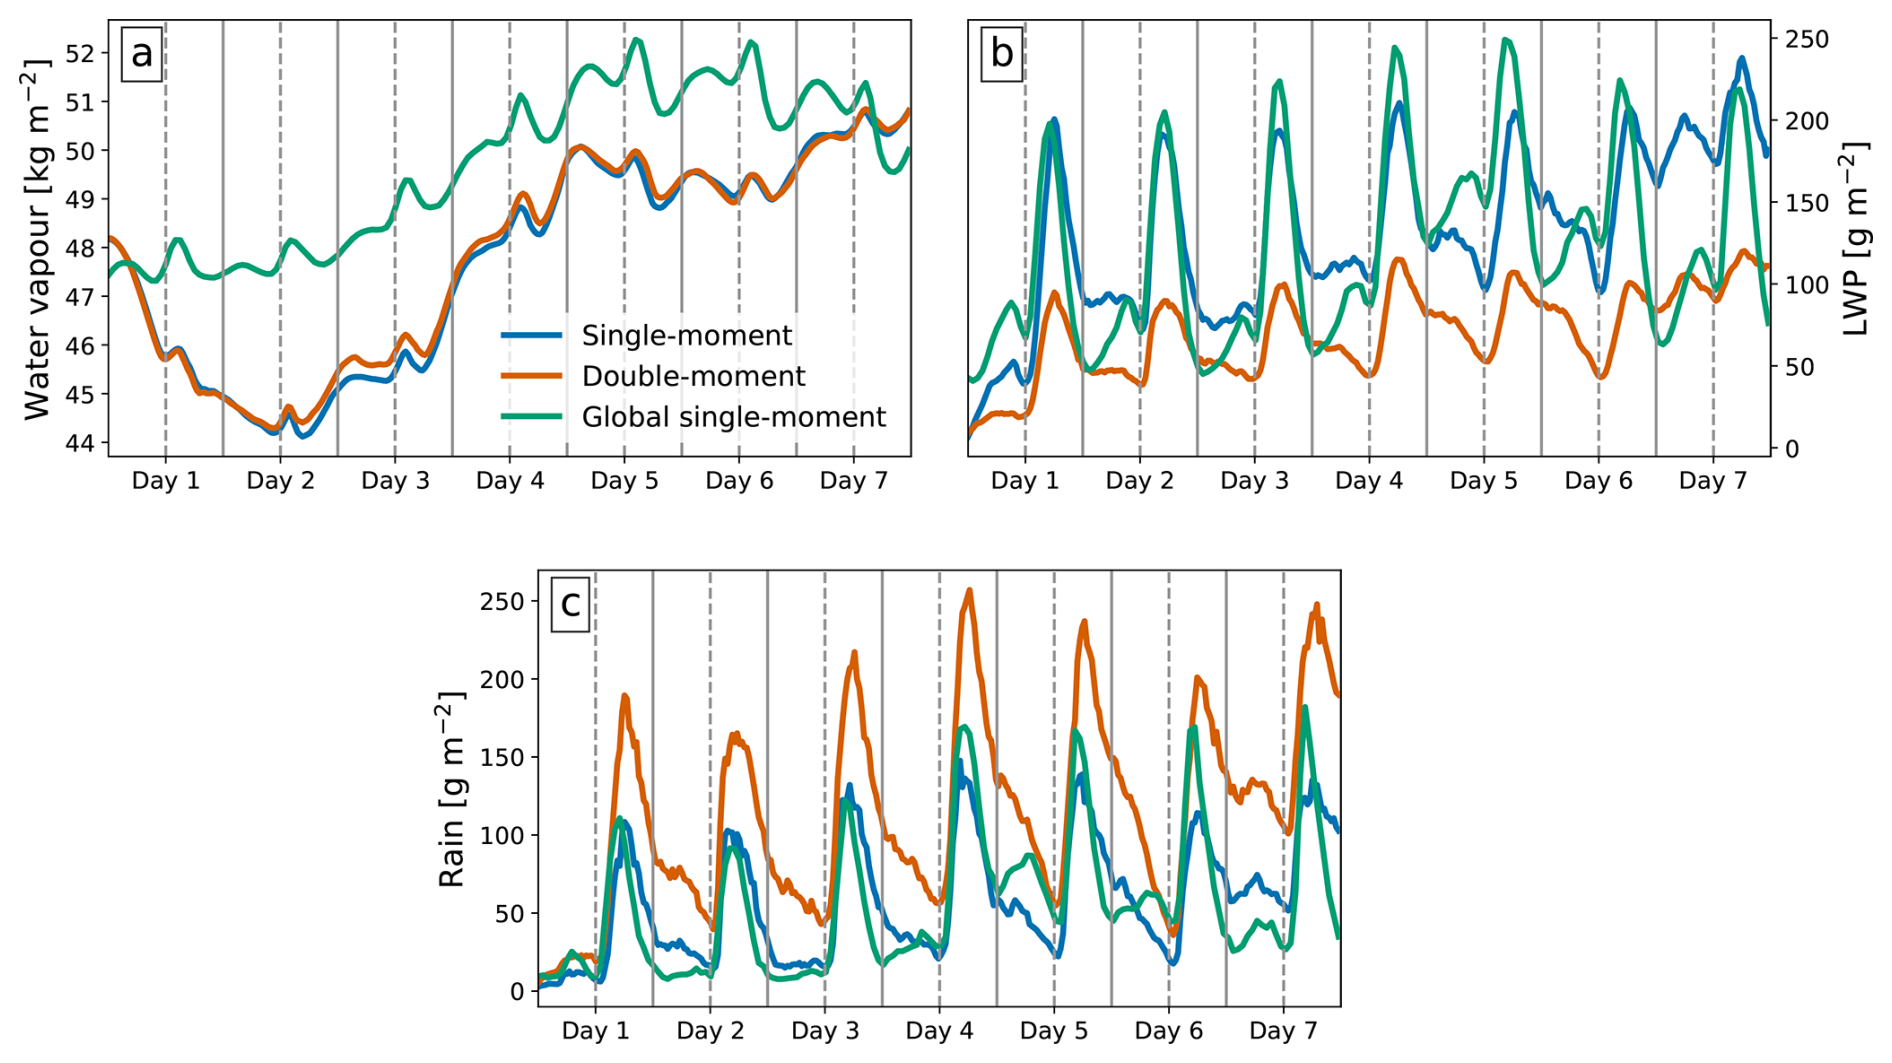
Figure 8Time series of (a) water vapour path, (b) LWP, and (c) rain water path for the regional single-moment (blue) and double-moment (red) simulations, shown alongside the global single-moment run (green). The time series are averaged over the entire Amazon region and experiment duration. Note that the data presented is measured in mass per unit area, where water vapour is shown in kg m−2 and liquid/rain water in g m−2 for convenience.
To complement warm-phase processes, we examine surface precipitation. Unlike rain water path, which represents the vertically integrated rainwater content, precipitation refers to the flux of falling hydrometeors reaching the surface. The time-averaged surface precipitation rate maps for the three simulations are presented alongside IMERG estimates (Fig. 9) to directly compare spatial distribution. The simulations closely match IMERG in spatial distribution, with the northern region remaining relatively dry. Both simulations accurately predict heavier coastal precipitation in the northeast and several organised convection centres, mainly in the south. However, both the single- and double-moment simulations overestimate precipitation intensity compared to IMERG. To enable consistent spatial comparison, the simulated data is regridded to the IMERG grid (approx. 10 km). However, it is important to interpret these discrepancies with caution. Although IMERG provides precipitation data on a fine spatial grid, its effective resolution, i.e., the smallest reliably resolved feature, is coarser than the nominal 0.1° grid due to limitations in satellite retrieval capabilities (Huffman et al., 2019). Its accuracy varies by geographic setting and precipitation type; it tends to underestimate heavy rainfall and overestimate moderate events, especially in tropical and mountainous regions, and performs less reliably during winter or in complex terrain (Bulovic et al., 2020; Tan et al., 2017). These biases may partly explain the differences in precipitation intensity.
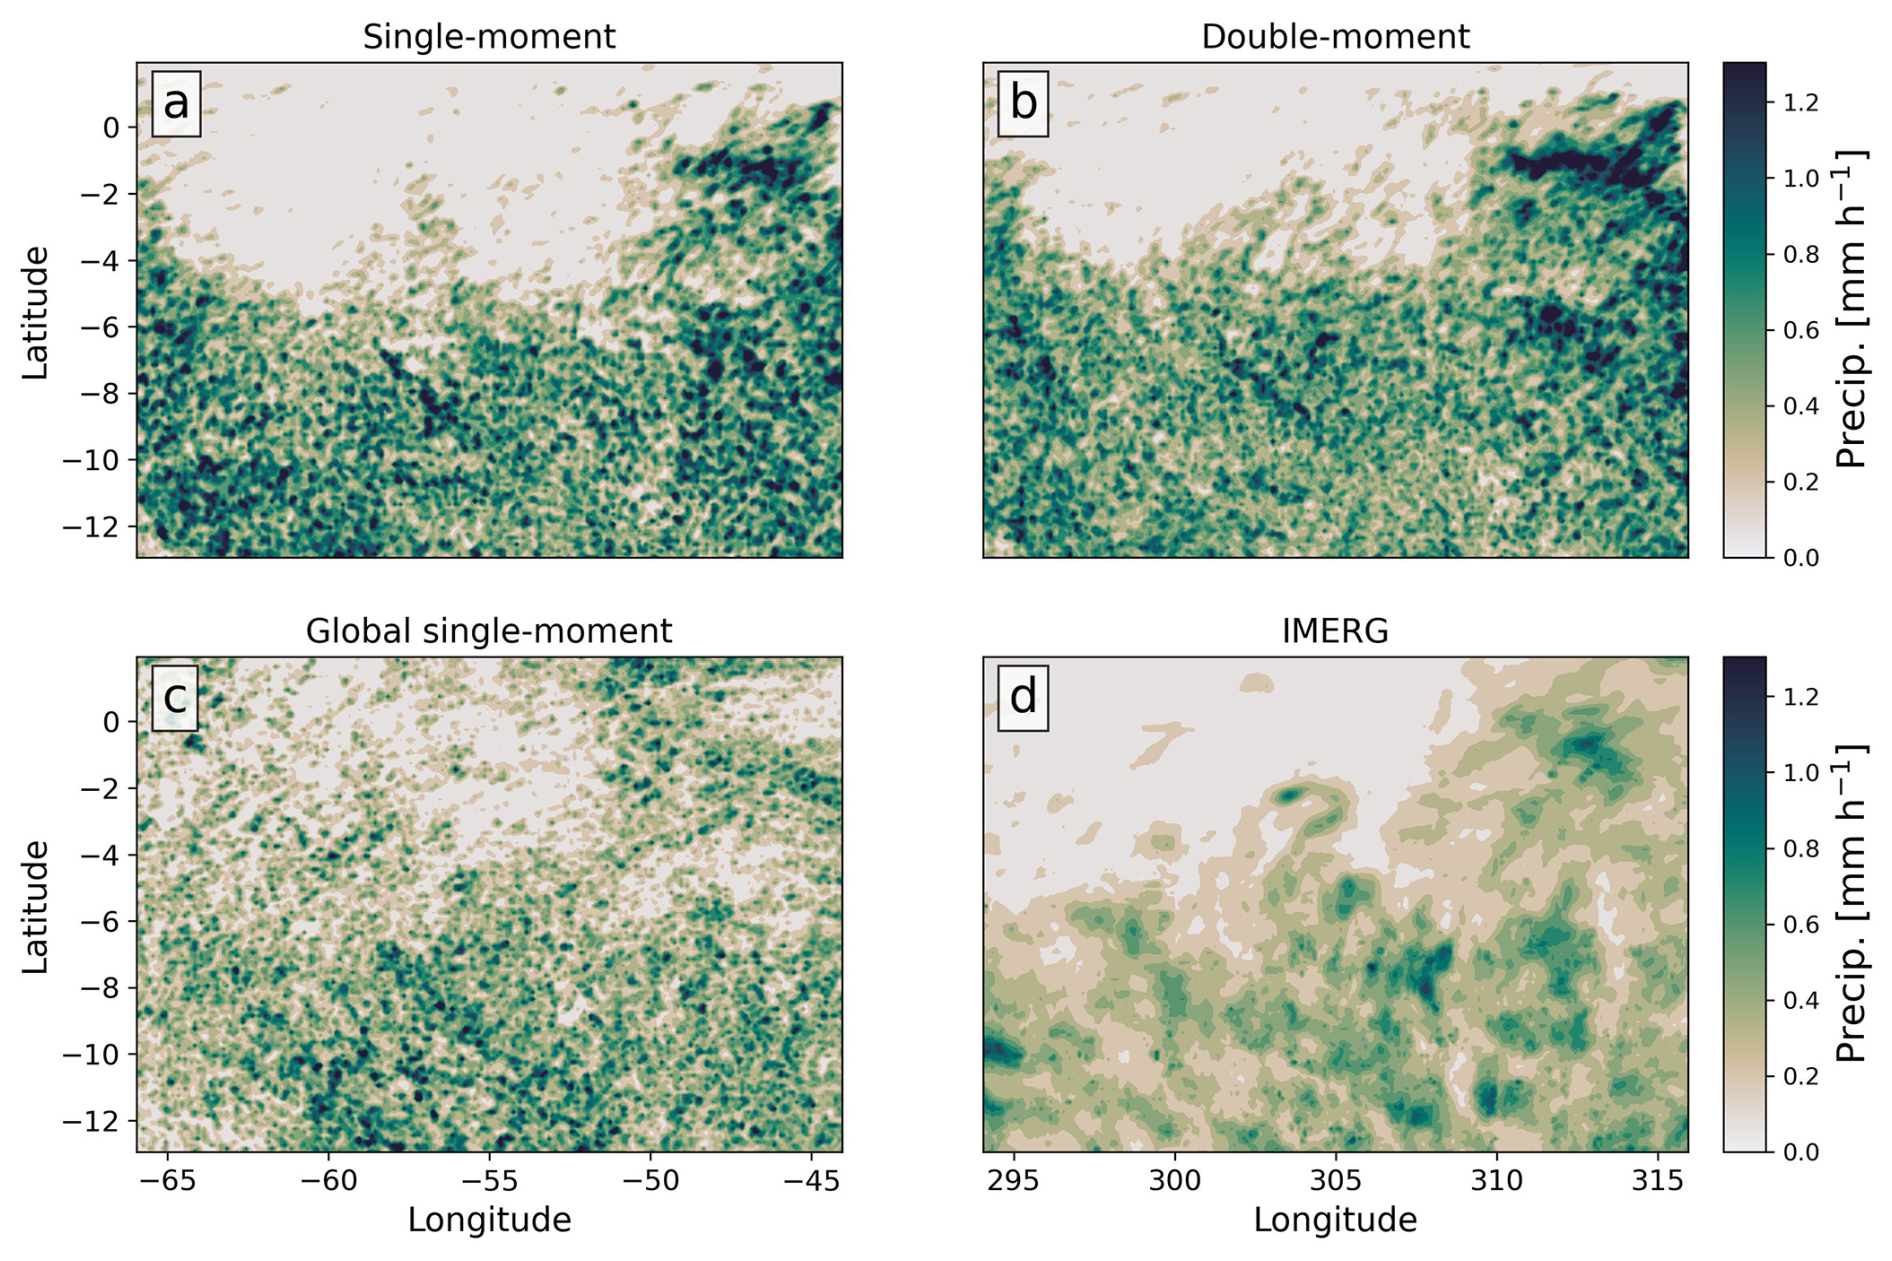
Figure 9Time-averaged maps of surface precipitation rate for the regional (a) single-moment and (b) double-moment simulations, shown alongside (c) the global single-moment run, and (d) IMERG estimates.
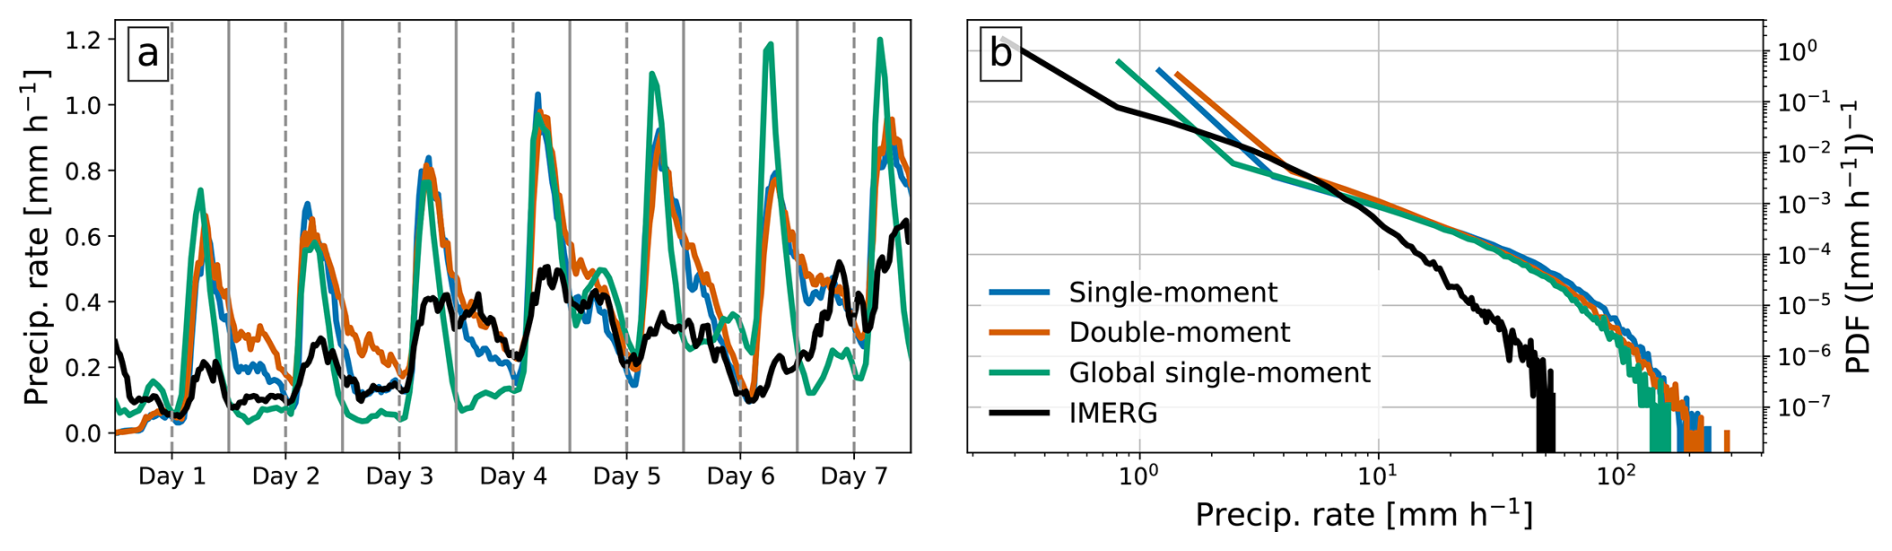
Figure 10(a) Time series and (b) probability density functions of surface precipitation rate for the regional single-moment (blue) and double-moment (red) simulations, shown alongside the global single-moment run (green) and IMERG estimates (black). The time series are averaged over the entire Amazon region and experiment duration.
To further examine these differences, Fig. 10 presents the time series of domain-mean surface precipitation rate (Fig. 10a) alongside its logarithmic scale PDF (Fig. 10b). While the simulated results broadly capture the diurnal cycle observed by IMERG, they tend to overestimate precipitation, often by nearly a factor of two, as on day four. Although precipitation values are generally similar across simulations, subtle differences arise; the global simulation consistently diverges from regional counterparts, particularly at minima and increasingly at maxima from day five onward. Notably, the relative ordering of simulations differs between rain water path (Fig. 8c) and surface precipitation rate (Fig. 10a). This discrepancy is particularly pronounced in the double-moment scheme, which sustains the highest rain water path despite similar domain-averaged precipitation rates. This apparent decoupling indicates that a larger in-column rainwater burden does not translate directly into enhanced surface precipitation, which likely reflects differences in the partitioning of rainwater within the column and in processes affecting its conversion to surface precipitation, such as evaporation or recycling into mixed-phase cloud processes.
Figure 10b reveals that all simulations overpredict the frequency of precipitation across most intensities compared to IMERG, especially at higher precipitation rates. The regional simulations exhibit similar distributions, with the double-moment predicting marginally lower probabilities for rates exceeding 150 mm h−1. The global simulation diverges from the regional simulations, particularly at the tail of the distribution, underestimating the probabilities of extreme precipitation. At low rates, IMERG data decrease more gradually than the simulations, which could reflect genuine model overestimation of light rainfall, but may equally arise from IMERG's known underdetection of weak precipitation due to limitations of passive microwave retrieval (e.g., Derin et al., 2021).
3.3 Ice clouds
Differences in the ice-phase hydrometeors are illustrated by the time series of domain-mean IWP, and graupel and snow water paths from the three simulations (Fig. 11). For IWP (Fig. 11a), the single-moment runs remain closely aligned during the first half of the experiment (days one through four), whereas the double-moment simulation produces nearly twice the peak values. In the second half of the experiment (days four through seven), IWP in the global single-moment run increases sharply, by about 10 g m−2, and exceeds that of the double-moment run, which decreases and approaches the regional single-moment values. The regional single-moment simulation shows a slight decline in IWP after day four, but the change is less pronounced. Graupel behaviour (Fig. 11b) differs substantially across schemes. The single-moment simulations exhibit similar diurnal cycles, although the regional run maintains elevated graupel concentrations slightly later into the night. The double-moment simulation produces markedly larger graupel amounts, reaching peaks over 400 g m−2, about five times higher than the single-moment runs, and maintains high values with little nocturnal relaxation. Snow evolution (Fig. 11c) shows the opposite tendency. The double-moment simulation maintains snow levels nearly constant at low values, around 10 g m−2, whereas both single-moment runs produce considerably higher and more variable amounts. During the first half of the experiment, snow in the single-moment simulations ranges between 50 and 100 g m−2; after day four, peak values increase to about 120 g m−2 in the regional run and up to 200 g m−2 in the global run. The contrasting behaviour of graupel and snow across schemes highlights the differing representations of mixed-phase processes and tuning.
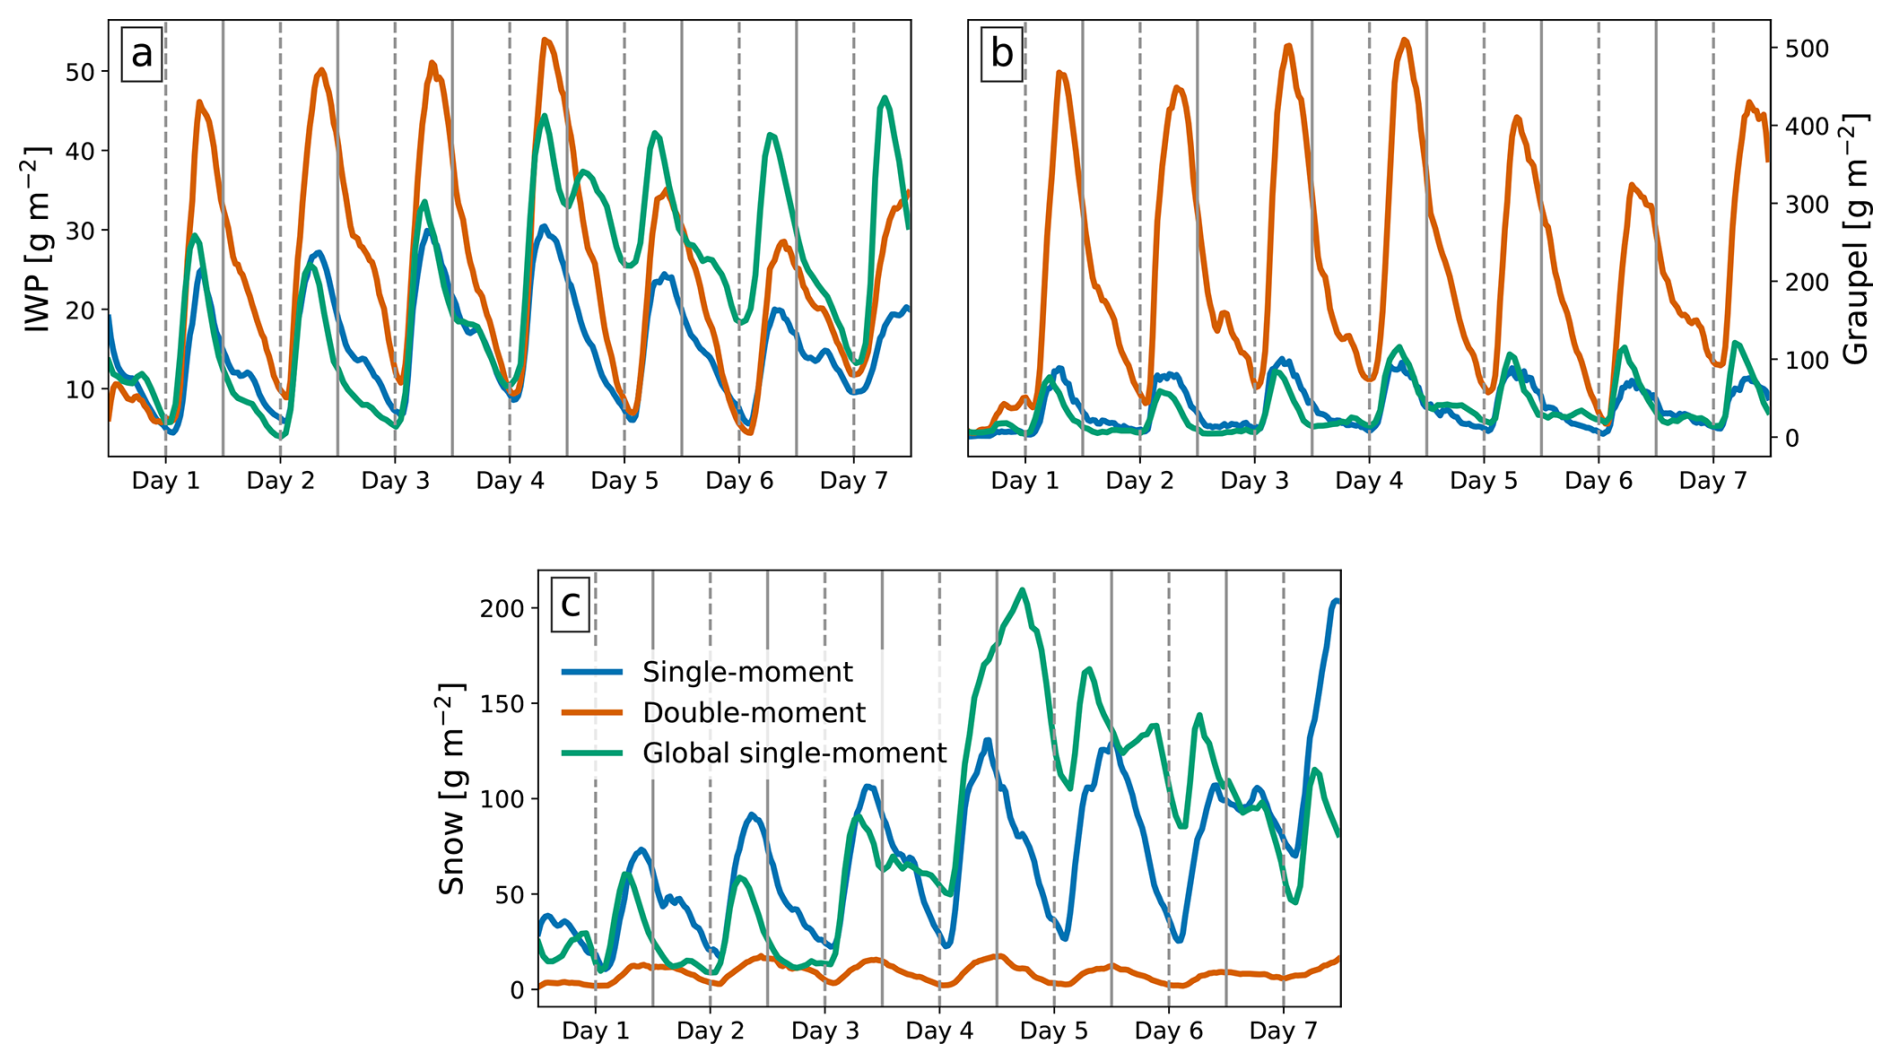
Figure 11Time series of (a) IWP, (b) graupel and (c) snow water paths for the regional single-moment (blue) and double-moment (red) simulations, shown alongside the global single-moment run (green). All variables are expressed in g m−2. The time series are averaged over the entire Amazon region and experiment duration.
The time-averaged OLR maps from the three simulations are compared with GOES-16 observations (Fig. 12) to assess the simulated cloud coverage. As noted in Sect. 2.3, the window-channel OLR proxy should be interpreted with caution for low- and mid-level clouds. GOES-16 shows suppressed OLR in the southern part of the domain (200–220 W m−2), with a compact low-OLR core extending southeastward and a smooth gradient toward higher OLR over the north. Both regional simulations reproduce the north–south gradient, though with sharper transitions than observed. The double-moment run (Fig. 12b) captures the location and magnitude of the low OLR core more closely, while the global run (Fig. 12c) extends the suppressed region too broadly. In contrast, the regional single-moment simulation (Fig. 12a) maintains generally higher OLR values and weaker suppression, underestimating deep convection compared to GOES-16. While neither simulation fully reproduces the observations, the double-moment run exhibits better agreement in matching the structure of the suppressed region. In contrast, the global simulation effectively captures the magnitude of this feature, albeit with an exaggerated spatial extent.
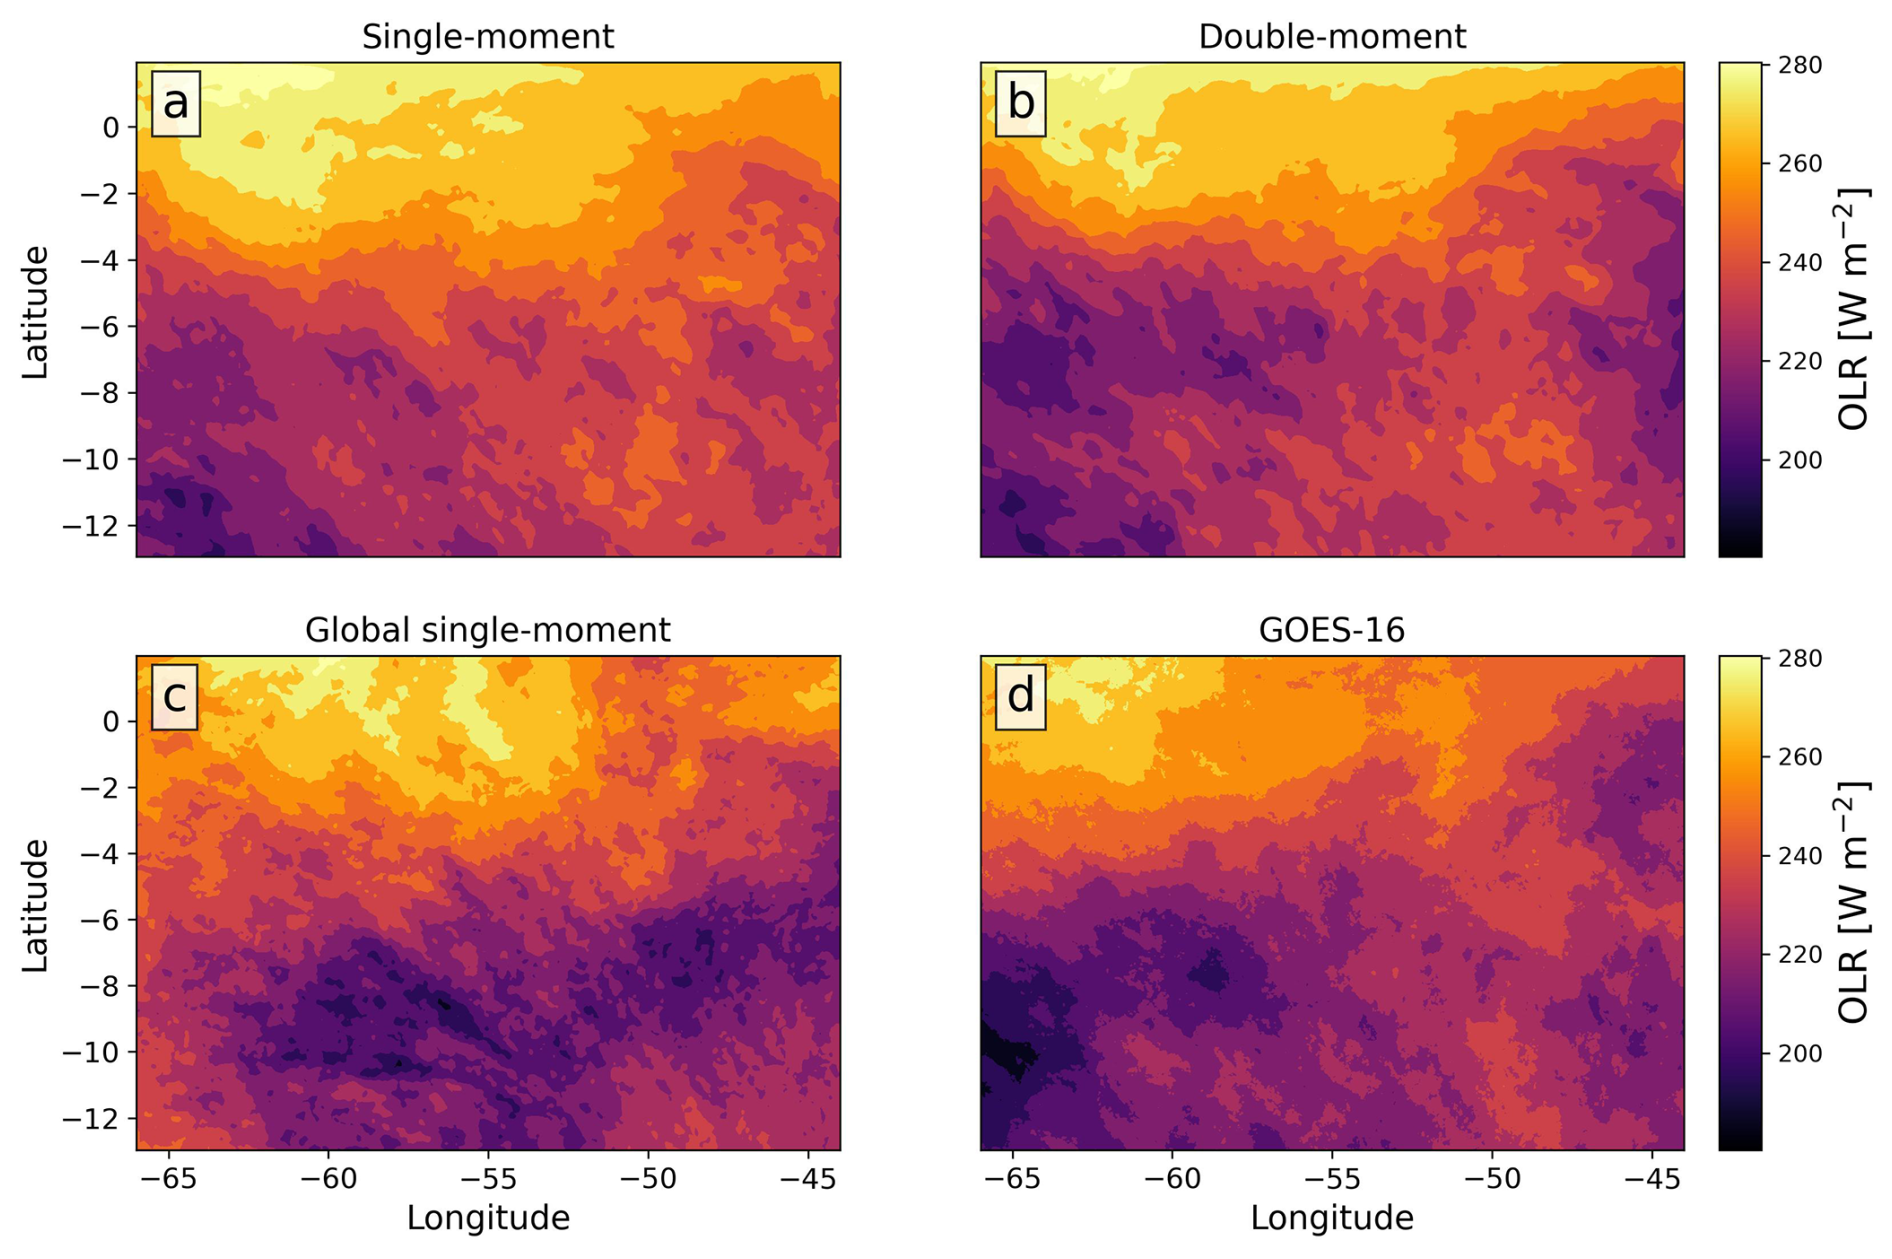
Figure 12Time-averaged maps of OLR for the regional (a) single-moment and (b) double-moment simulations, shown alongside (c) the global single-moment run and (d) GOES-16 observations.
The time series of domain-mean OLR in Fig. 13a shows that all simulations capture the diurnal cycle, with peaks and troughs generally aligning with GOES-16. In the first half of the experiment (days one through four), the global simulation maintains higher OLR daily mean values than both regional simulations and GOES-16, then drops from day five onwards. This difference, as expected from the free-running global setup, aligns with the transition seen in IWP (Fig. 11a), suggesting evolving cloud characteristics. Taken together, the decrease in fog, increase in IWP, and drop in OLR in the global simulation during the second half of the experiment suggest a coherent shift in cloud regime, discussed further in Sect. 4. Among the simulations, the double-moment model most closely follows GOES-16 retrievals at minima, typically associated with deep convection. All simulations, however, show higher daytime OLR maxima than GOES-16 (except during days five to seven in the global simulation), indicating shorter-lived or less extensive upper-level clouds, including cirrus and anvil clouds, which can maintain low OLR after convection collapses. From the PDFs shown in Fig. 13b, all simulations predict enhanced probabilities at the high-OLR tail, possibly indicating warm surface biases or reduced high cloud cover. They also show a broader peak around 275 W m−2, compared to the narrower GOES-16 peak. A secondary peak near 220 W m−2, potentially representing mid-level convective cloud tops, is captured in both regional simulations, although its width is underestimated relative to GOES-16. As mentioned above, these regions of the distribution should therefore be interpreted with caution when compared to GOES-16, particularly where the window-channel proxy is less reliable. At lower OLR values (below 150 W m−2), indicative of deep convection cloud tops, the single-moment regional simulation underpredicts occurrence; the global simulation aligns closer with the double-moment model, implying similar anvil coverage, consistent with Figs. 4, 11a and 13a.
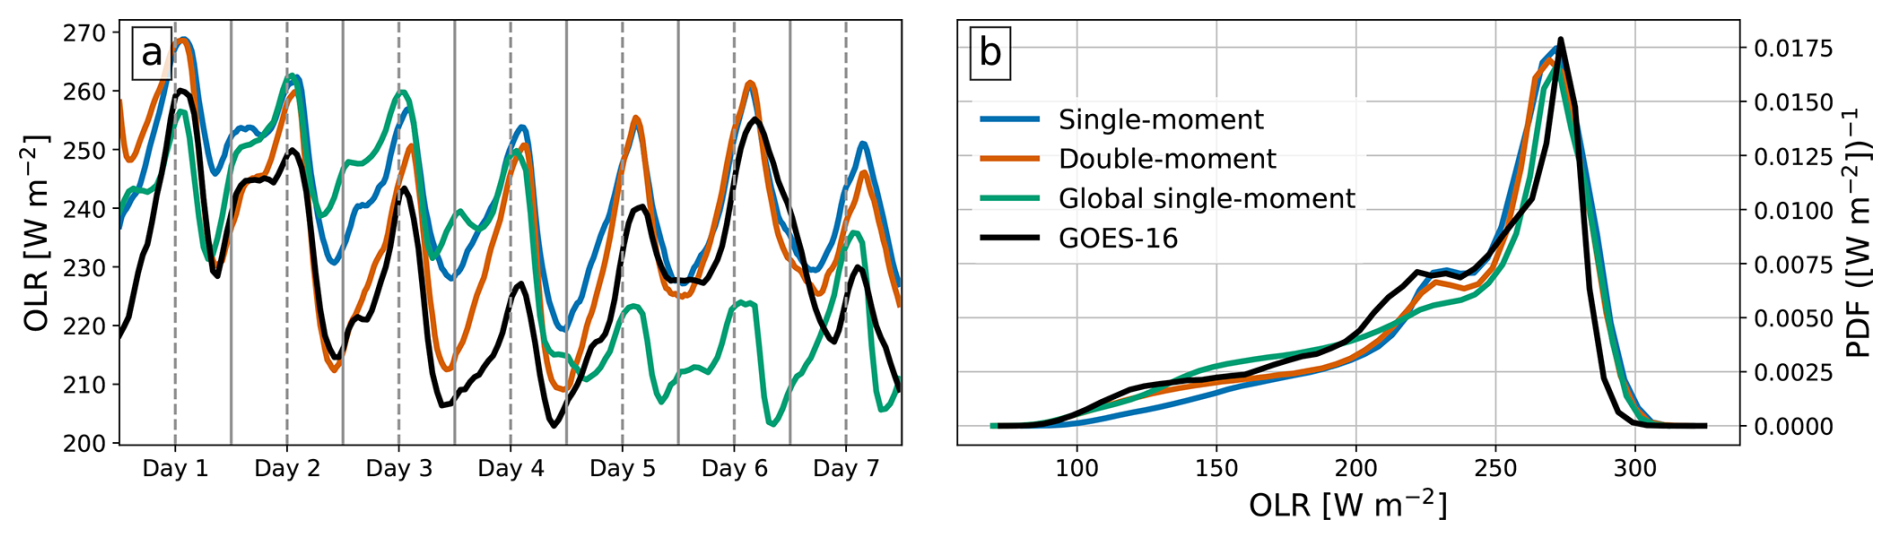
Figure 13(a) Time series and (b) probability density functions of OLR for the regional single-moment (blue) and double-moment (red) simulations, shown alongside the global single-moment run (green) and GOES-16 (black). The time series are averaged over the entire Amazon region and experiment duration.
The simulations clearly demonstrate that the choice of microphysics scheme affects cloud structure, hydrometeor distributions, and precipitation processes, similar to previous studies (see e.g., Khain et al., 2015; White et al., 2017; Igel et al., 2015). However, all simulations produced precipitation patterns that diverge from IMERG estimates (Fig. 9d). While IMERG show convective organisation, all three simulations fail to reproduce this pattern, and predict higher intensities. These discrepancies are consistent with previous findings that km-scale models tend to overestimate rainfall intensity and struggle to reproduce the degree of convective organisation observed in the Amazon (see e.g., Martins et al., 2015; Pascale et al., 2015; Rehbein and Ambrizzi, 2023). This issue is common in km-scale models but may be improved with smaller grid spacing (see e.g., Moseley et al., 2020; Hohenegger et al., 2020), which is potentially linked to thermodynamic effects of cold pools (see e.g., Tompkins, 2001); however, such resolutions remain computationally challenging for global simulations.
All three simulations also exhibited a more pronounced diurnal cycle than IMERG (Fig. 10a), with clear afternoon and nighttime peaks. Previous studies report regional variations in Amazon rainfall, including differences in peak timing (see e.g., Angelis et al., 2004). IMERG has been shown to underestimate peak rainfall intensities associated with deep convection (see e.g., Tang et al., 2020; Muñoz de la Torre et al., 2024), which explains its lower maximum values compared to the simulations. These considerations emphasise that comparisons with IMERG should be interpreted cautiously, particularly with respect to the magnitude and timing of extremes. Given these observational uncertainties, especially the reduced sensitivity of IMERG to weak precipitation, inferred model biases at the low-intensity end of the distribution should be treated with caution. Similarly, discrepancies at the high-intensity tail reflect a combination of model biases and IMERG's reduced reliability at sub-daily timescales and fine spatial scales (Huffman et al., 2019; Bulovic et al., 2020; Tan et al., 2017), such that the observed differences represent an upper bound on true model error.
Section 3 also highlights that, beyond the differences arising from the choice of microphysics scheme, domain configuration also influences simulation sensitivities. Hence, the following discussion considers microphysics sensitivity before addressing domain implications.
4.1 Sensitivity to microphysics schemes (single vs. double)
The choice of microphysics scheme influences the simulated cloud processes and hydrometeor distributions. The single-moment scheme consistently produces higher LWP, fog, and snow values compared to the double-moment scheme, with differences reaching up to 100 %, 400 %, and 1400 %, respectively (Figs. 5, 7, 8, 11). These differences arise from the way hydrometeor evolution responds to the underlying microphysical assumptions within each scheme. Overall, these results are consistent with previous studies, showing that single-moment schemes tend to overestimate low-level cloud condensate and precipitation rates, particularly in convective environments (e.g., Igel et al., 2015; Naumann et al., 2025; Köcher et al., 2023).
On average, the single-moment simulations produce more warm-phased clouds and thinner, less vertically extended anvil clouds compared to the double-moment scheme (Fig. 5a and b). The reduced anvil cloud cover in the single-moment scheme may be due to its reliance on fixed-size distributions and riming thresholds, which can suppress effective sedimentation or ice mass flux aloft. In contrast, the increased flexibility of the double-moment scheme in representing evolving size spectra can support sustained anvil development. This aligns with previous studies suggesting that changes in size distribution parameters and number concentrations can influence both precipitation efficiency and the vertical extent of ice clouds (Heymsfield et al., 2005).
On the other hand, the single-moment scheme consistently predicts less rain, graupel, and IWP compared to the double-moment scheme, with observed differences reaching up to 100 %, 400 %, and 100 %, respectively (Figs. 8, 11). The formation of graupel, a key contributor to precipitation efficiency, relies on the accretion of cloud water, which is treated with greater process-level flexibility in the double-moment scheme. Additionally, differences in warm-rain processes, such as autoconversion and collection efficiencies, likely contribute to the observed discrepancies in precipitation (Fig. 9), with studies showing that double-moment schemes more accurately represent the sensitivity of rain formation to variations in droplet size and concentration, which can modulate rainfall efficiency across different convective regimes (Zhang et al., 2018). Despite this, the two schemes yield similar levels of domain-averaged precipitation, OLR, and water vapour (Figs. 10, 13, and 8). This behaviour is consistent with the differing evolution of rain water path and surface precipitation (Sect. 3.2), highlighting that microphysical changes can redistribute rainwater within the column without proportionally altering surface fluxes. This suggests that while microphysical processes strongly influence the distribution and characteristics of hydrometeors, the domain-integrated outputs appear less sensitive to the specific microphysical parameterisation over these scales. This finding aligns with the conceptual framework of Dagan et al. (2019), which posits that at large spatial scales, atmospheric moisture and energy constraints can limit the impact of microphysical perturbations. While our simulation period is too short to assume a balance between precipitation and evaporation, the results support the idea that at broader scales, the divergence of water vapour (i.e., atmospheric dynamics) acts as a primary driver of precipitation variability, potentially dampening the signature of individual microphysical pathways on larger scales.
Interestingly, there are cases where the single-moment scheme simulation has demonstrated closer approximations to observed storm characteristics, such as in simulations of Super Typhoon Sarika (2016), where single-moment schemes produced a stronger storm than double-moment schemes (Li et al., 2020). These findings highlight that the relative performance of microphysics schemes may depend on the specific meteorological context and the processes dominating the cloud system under consideration.
However, it is important to address additional limitations associated with the choice of microphysics schemes. Double-moment schemes require greater computational load due to the larger set of prognostic variables they introduce (typically twice as many). Although this enables a more detailed microphysical representation, it does not necessarily improve the accuracy of predicted integrated quantities, such as precipitation or radiative fluxes (Köcher et al., 2023). Beyond computational cost, both schemes rely on tuning parameters that influence their simulated behaviour and may contribute to the observed divergence. Although tuning can improve agreement with observations, it reduces generalisability across regimes and complicates direct comparisons between schemes. While these aspects are beyond the scope of this study, they should be considered when interpreting the results.
4.2 Implications of domain configuration (global vs. regional)
While microphysics schemes primarily drive differences in cloud structure and hydrometeor distributions, the domain configuration modulates these sensitivity manifestations. The global single-moment run produces higher values of cloud ice, fog, precipitation, and water vapour than the regional single-moment run, with differences reaching up to 20 %, 150 %, 30 %, and 10 % respectively (Figs. 5, 7, 8, 10). These contrasts reflect the influence of large-scale circulation and energy transport, which are shaped by the domain size and the treatment of boundary conditions (Dagan et al., 2022b, a). Whereas the regional setup constrains circulation and thermodynamic profiles through sponge layers and prescribed boundary conditions, the global configuration allows the development of internally consistent synoptic-scale convection, enhancing moisture transport and convective organisation.
Temporal evolution highlights how the differences accumulate over time, with similar initial IWP values between the single-moment simulations and nearly doubled peak values in the global run during the second half of the experiment (Fig. 11a). This deviation, independent of the initial state (Fig. 2), points to the growing impact of boundary effects on cloud properties and moisture structure as simulations progress, consistent with studies showing that convective triggering and intensity, boundary-zone divergence and large-scale advection are sensitive to boundary conditions (Rybka et al., 2021). This behaviour is consistent with the large-scale boundary discrepancies identified in Fig. 3, which indicate that the global simulation progressively evolves toward a distinct large-scale state relative to the ERA5-constrained regional simulations. Such divergence likely contributes to the increasing differences in cloud structure between the global and regional configurations over time. A targeted way to disentangle these effects would be to repeat the global simulations with a substantially shorter spin-up, so that the configurations are compared under nearly identical synoptic conditions, thereby separating differences in model physics from those caused by divergence in the evolving large-scale state.
Fog formation provides a clear example of this interaction between microphysics and domain-scale dynamics. Although fog is mainly influenced by the microphysics scheme, the higher near-surface water vapour in the global simulation (Fig. 5f) promotes a more persistent fog (Fig. 7), likely due to weaker boundary-layer ventilation and reduced horizontal advection. This persistence is reinforced by a feedback mechanism in which fog reduces surface heating, slows vapour removal, and sustains itself under inversion capping until dissipated by solar forcing. Such processes illustrate how domain-scale dynamics can amplify or prolong microphysics-induced variability (Anber et al., 2015; Tardif, 2017). The simultaneous increase in IWP and decrease in OLR during the latter part of the global simulation is consistent with a transition toward deeper, more organised convection, which may contribute to enhanced vapour removal and the subsequent reduction in fog.
To assess whether thermodynamic biases underpin the fog differences, we compared domain-mean diurnal cycles of surface temperature, pressure, relative humidity, and wind between the runs (not shown). The two regional simulations exhibit nearly identical thermodynamic profiles, consistent with their shared lateral boundary conditions, whereas the global run diverges. Crucially, fog characteristics differ strongly between the two regional runs despite their thermodynamic similarity, which supports the interpretation that the microphysics scheme, rather than thermodynamic state, is the primary driver of inter-simulation fog variability. The global run enhanced fog is therefore influenced by both its distinct thermodynamic environment and unconstrained dynamics, acting on top of the microphysical differences. Although microphysical and thermodynamic processes are inherently coupled, the similarity of thermodynamic conditions between the regional runs provides a useful natural control that helps isolate the microphysical contribution in this case.
The longer time step used in the global simulation (40 s vs. 10 s regionally) may also influence process rates and biases such as fog and warm-cloud formation (Schmidt et al., 2024). However, sensitivity tests (not shown) with the global time step applied within the regional configuration show only modest quantitative reductions in domain-mean fog, without altering the qualitative differences between the configurations. This suggests that the time-step choice contributes to the magnitude of the divergence, and does not affect the primary sensitivities to domain configuration and microphysics identified here.
Taken together, these results demonstrate that, while the microphysics primarily controls cloud structure and hydrometeor characteristics, domain size shapes the dynamical environment in which these sensitivities are expressed. Global simulations enable the growth of large-scale circulations and moisture transport, which can amplify or reshape microphysics-driven differences, thus reinforcing the broader conclusion that integrated outputs, such as precipitation and OLR, are ultimately governed by this large-scale dynamical framework.
In this study, we investigate how simulated cloud and precipitation properties respond to different microphysics schemes and how these responses manifest in regional and global configurations in ICON. Three convection-permitting runs over the Amazon basin are analysed: a global simulation with a single-moment cloud microphysics scheme and two regional simulations with single- and double-moment schemes, under otherwise identical model configurations.
Results show that microphysics schemes exert the strongest influence on cloud hydrometeor characteristics. Compared to the regional single-moment run, the double-moment scheme produces up to five times more graupel and about twice as much rain and IWP, but up to half as much LWP, five times less fog and an order of magnitude less snow (Figs. 7, 8, 11). These contrasts reflect both the explicit treatment of number concentrations and size distributions in the double-moment scheme and the influence of scheme-specific tuning parameters, such that part of the discrepancy arises from parameter choices rather than structural differences alone. Despite these large microphysical differences, domain-averaged precipitation, water vapour, and OLR are similar across schemes (Figs. 8, 10, 13), indicating that large-scale dynamics and budget constraints dominate integrated atmospheric metrics.
Domain configuration further controls how these sensitivities manifest. The global single-moment run produces up to 150 % more fog, nearly twice the IWP, and roughly 10 % more water vapour than its regional counterpart (Figs. 7, 8, 11). These variations reflect the influence of domain size and boundary treatments on circulation, moisture transport, and convective organisation. After day four, the global run shows a sharp decline in fog, a doubling of IWP, and a reduction in OLR (Figs. 11, 13), changes absent in the regional runs. This behaviour highlights the ability of global simulations to develop internally consistent circulation patterns, whereas regional setups remain constrained by their boundaries. Although fog and warm-cloud formation may be further influenced by the longer time step used in the global run, we find that these differences are smaller than the impact of the microphysics scheme and domain size. Overall, the spread in fog across configurations and its sensitivity to both microphysics and domain size highlight the value of explicitly evaluating simulated fog against surface observations in the Amazon basin.
However, several limitations should be noted. Only one global simulation is performed, preventing direct comparisons between single- and double-moment schemes, as global km-scale double-moment runs remain computationally demanding and limiting the generalisability of conclusions regarding the role of domain configuration independently of the microphysics scheme. The observational data also carry uncertainty, as IMERG tends to underestimate extreme rainfall and independent datasets are scarce. This highlights the ongoing need for detailed and consistent observations to better constrain cloud and precipitation processes. Both schemes involve tunable parameters, and perturbed-parameter ensembles (PPEs) would help disentangle structural and parametric uncertainty. Global double-moment simulations, combined with PPEs, would help clarify how domain size, circulation, and microphysics interact to influence hydrometeor development.
In summary, km-scale regional simulations capture many aspects of cloud microphysics but may miss interactions such as moisture recycling, remote convection, and large-scale advection. Global simulations couple local and large-scale processes, but require higher computational resources and longer spin-up times. With global convection-permitting modelling now operational, progress depends on combining improved observational constraints with ensemble experimentation to refine the representation of clouds and reduce remaining uncertainties. The degree to which the specific sensitivities identified here extend to other convective regimes, model frameworks, and seasons remains an open question, motivating future multi-case and ensemble-based investigations.
The simulations were done using the open-source ICON model described by Hohenegger et al. (2023). Access to the ICON source code for scientific use is available from https://code.mpimet.mpg.de/projects/iconpublic (last access: 6 October 2025). The code, including the model configurations, is provided in Sela et al. (2025). ERA5 reanalysis data were obtained from the Copernicus Climate Data Store (https://doi.org/10.24381/cds.adbb2d47, Hersbach et al., 2023). The Integrated Multi-satellitE Retrievals for GPM (IMERG) v06 precipitation data (NASA, 2020) were obtained from the NASA Goddard Earth Sciences Data and Information Services Center (GES DISC) at https://gpm1.gesdisc.eosdis.nasa.gov/data/GPM_L3/GPM_3IMERGHH.06 (last access: 6 October 2025). Outgoing longwave radiation (OLR) was derived from Level 2 data of the Advanced Baseline Imager (ABI) aboard GOES-16 (Schmit and Gunshor, 2020), obtained through NOAA’s Comprehensive Large Array-data Stewardship System (CLASS; https://www.class.noaa.gov, last access: 6 October 2025). Product documentation for the ABI OLR algorithm is available at https://www.star.nesdis.noaa.gov/GOES (last access: 6 October 2025) and in Lee et al. (2010). Model, observation and reanalysis data used in this paper are available from Sela (2025) (https://doi.org/10.5281/zenodo.17592760).
MS and PW performed the regional and global simulations, respectively. All authors contributed to the design and interpretation. MS carried out the analysis and prepared the manuscript with contributions from all co-authors.
The contact author has declared that none of the authors has any competing interests.
Publisher's note: Copernicus Publications remains neutral with regard to jurisdictional claims made in the text, published maps, institutional affiliations, or any other geographical representation in this paper. The authors bear the ultimate responsibility for providing appropriate place names. Views expressed in the text are those of the authors and do not necessarily reflect the views of the publisher.
The simulations were performed and analysed on the Levante cluster of the DKRZ with resources granted under project 1368 (https://www.dkrz.de/en/systems/hpc/hlre-4-levante, last access: 6 October 2025). Maor Sela acknowledges funding from the NERC Doctoral Training Partnership in Environmental Research. Philipp Weiss and Philip Stier cknowledge funding from the European Union's Horizon 2020 project nextGEMS, and Philip Stier from the European Union's Horizon Europe project CleanCloud and its UKRI underwrite.
This research has been supported by the Natural Environment Research Council (grant no. NE/S007474/1), the Horizon 2020 (grant no. 101003470), and the HORIZON EUROPE Climate, Energy and Mobility (grant no. 101137639).
This paper was edited by Yang Tian and reviewed by Masaki Satoh and Tianning Su.
Adams-Selin, R. D., van den Heever, S. C., and Johnson, R. H.: Impact of graupel parameterization schemes on idealized bow echo simulations, Mon. Weather Rev., 141, 1241–1262, 2013. a
Anber, U., Gentine, P., Wang, S., and Sobel, A. H.: Fog and rain in the Amazon, P. Natl. Acad. Sci. USA, 112, 11473–11477, https://doi.org/10.1073/pnas.1505077112, 2015. a
Andreae, M. O., Acevedo, O. C., Araùjo, A., Artaxo, P., Barbosa, C. G. G., Barbosa, H. M. J., Brito, J., Carbone, S., Chi, X., Cintra, B. B. L., da Silva, N. F., Dias, N. L., Dias-Júnior, C. Q., Ditas, F., Ditz, R., Godoi, A. F. L., Godoi, R. H. M., Heimann, M., Hoffmann, T., Kesselmeier, J., Könemann, T., Krüger, M. L., Lavric, J. V., Manzi, A. O., Lopes, A. P., Martins, D. L., Mikhailov, E. F., Moran-Zuloaga, D., Nelson, B. W., Nölscher, A. C., Santos Nogueira, D., Piedade, M. T. F., Pöhlker, C., Pöschl, U., Quesada, C. A., Rizzo, L. V., Ro, C.-U., Ruckteschler, N., Sá, L. D. A., de Oliveira Sá, M., Sales, C. B., dos Santos, R. M. N., Saturno, J., Schöngart, J., Sörgel, M., de Souza, C. M., de Souza, R. A. F., Su, H., Targhetta, N., Tóta, J., Trebs, I., Trumbore, S., van Eijck, A., Walter, D., Wang, Z., Weber, B., Williams, J., Winderlich, J., Wittmann, F., Wolff, S., and Yáñez-Serrano, A. M.: The Amazon Tall Tower Observatory (ATTO): overview of pilot measurements on ecosystem ecology, meteorology, trace gases, and aerosols, Atmos. Chem. Phys., 15, 10723–10776, https://doi.org/10.5194/acp-15-10723-2015, 2015. a
Angelis, C. F., McGregor, G. R., and Kidd, C.: Diurnal cycle of rainfall over the Brazilian Amazon, Clim. Res., 26, 139–149, http://www.jstor.org/stable/24868716 (last access: 2 September 2026), 2004. a
Artaxo, P., Martins, J. V., Yamasoe, M. A., Procópio, A. S., Pauliquevis, T. M., Andreae, M. O., Guyon, P., Gatti, L. V., and Leal, A. M. C.: Physical and chemical properties of aerosols in the wet and dry seasons in Rondônia, Amazonia, J. Geophys. Res.-Atmos., 107, LBA 49-1–LBA 49-14, https://doi.org/10.1029/2001JD000666, 2002. a
Baldauf, M., Seifert, A., Förstner, J., Majewski, D., Raschendorfer, M., and Reinhardt, T.: Operational Convective-Scale Numerical Weather Prediction with the COSMO Model: Description and Sensitivities, Mon. Weather Rev., 139, 3887–3905, https://doi.org/10.1175/MWR-D-10-05013.1, 2011. a
Bogerd, L., Overeem, A., Leijnse, H., and Uijlenhoet, R.: A Comprehensive Five-Year Evaluation of IMERG Late Run Precipitation Estimates over the Netherlands, J. Hydrometeorol., 22, 1855–1868, https://doi.org/10.1175/JHM-D-21-0002.1, 2021. a
Bulovic, N., McIntyre, N., and Johnson, F.: Evaluation of IMERG V05B 30-Min Rainfall Estimates over the High-Elevation Tropical Andes Mountains, J. Hydrometeorol., 21, 2875–2892, https://doi.org/10.1175/JHM-D-20-0114.1, 2020. a, b, c
Chen, H., Yong, B., Qi, W., Wu, H., Ren, L., and Hong, Y.: Investigating the Evaluation Uncertainty for Satellite Precipitation Estimates Based on Two Different Ground Precipitation Observation Products, J. Hydrometeorol., 21, 2595–2606, https://doi.org/10.1175/JHM-D-20-0103.1, 2020. a
Christensen, M. W., Ma, P.-L., Wu, P., Varble, A. C., Mülmenstädt, J., and Fast, J. D.: Evaluation of aerosol–cloud interactions in E3SM using a Lagrangian framework, Atmos. Chem. Phys., 23, 2789–2812, https://doi.org/10.5194/acp-23-2789-2023, 2023. a
Clark, P., Roberts, N., Lean, H., Ballard, S. P., and Charlton-Perez, C.: Convection-permitting models: a step-change in rainfall forecasting, Meteorol. Appl., 23, 165–181, https://doi.org/10.1002/met.1538, 2016. a
Costa-Surós, M., Sourdeval, O., Acquistapace, C., Baars, H., Carbajal Henken, C., Genz, C., Hesemann, J., Jimenez, C., König, M., Kretzschmar, J., Madenach, N., Meyer, C. I., Schrödner, R., Seifert, P., Senf, F., Brueck, M., Cioni, G., Engels, J. F., Fieg, K., Gorges, K., Heinze, R., Siligam, P. K., Burkhardt, U., Crewell, S., Hoose, C., Seifert, A., Tegen, I., and Quaas, J.: Detection and attribution of aerosol–cloud interactions in large-domain large-eddy simulations with the ICOsahedral Non-hydrostatic model, Atmos. Chem. Phys., 20, 5657–5678, https://doi.org/10.5194/acp-20-5657-2020, 2020. a
Dagan, G., Koren, I., Altaratz, O., and Lehahn, Y.: Shallow convective cloud field lifetime as a key factor for evaluating aerosol effects, iScience, 10, 192–202, 2018. a
Dagan, G., Stier, P., and Watson-Parris, D.: Analysis of the atmospheric water budget for elucidating the spatial scale of precipitation changes under climate change, Geophys. Res. Lett., 46, 11252–11261, https://doi.org/10.1029/2019GL084173, 2019. a
Dagan, G., Stier, P., Dingley, B., and Williams, A. I. L.: Examining the Regional Co-Variability of the Atmospheric Water and Energy Imbalances in Different Model Configurations – Linking Clouds and Circulation, J. Adv. Model. Earth Sy., 14, e2021MS002951, https://doi.org/10.1029/2021MS002951, 2022a. a
Dagan, G., Stier, P., Spill, G., Harbert, R., Heikenfeld, M., and Van den Heever, S.: Boundary conditions representation can determine simulated aerosol effects on convective cloud fields, Commun. Earth Environ., 3, 71, https://doi.org/10.1038/s43247-022-00399-5, 2022b. a
da Silva, L. d. D. d. J., Mahmoud, M., González-Rodríguez, L., Mohammed, S., Rodríguez-López, L., and Arias, M. I. A.: Assessment of the IMERG Early-Run Precipitation Estimates over South American Country of Chile, Remote Sensing, 15, https://doi.org/10.3390/rs15030573, 2023. a
Derin, Y., Kirstetter, P.-E., and Gourley, J. J.: Evaluation of IMERG Satellite Precipitation over the Land–Coast–Ocean Continuum. Part I: Detection, J. Hydrometeorol., 22, 2843–2859, https://doi.org/10.1175/JHM-D-21-0058.1, 2021. a
Dipankar, A., Stevens, B., Heinze, R., Moseley, C., Zängl, G., Giorgetta, M., and Brdar, S.: Large eddy simulation using the general circulation model ICON, J. Adv. Model. Earth Sy., 7, 963–986, https://doi.org/10.1002/2015MS000431, 2015. a
DWD: ICON tutorial – Working with the ICON Model, DWD pub/nwv/icon tutorial2020, https://doi.org/10.5676/DWD_pub/nwv/icon_tutorial2020, 2020. a
Emanuel, K. A.: Atmospheric Convection, Oxford University Press, New York, Oxford, ISBN 9780195066302, 1994. a
Ferrari, F., Cassola, F., Tuju, P. E., Stocchino, A., Brotto, P., and Mazzino, A.: Impact of Model Resolution and Initial/Boundary Conditions in Forecasting Flood-Causing Precipitations, Atmosphere, 11, https://doi.org/10.3390/atmos11060592, 2020. a
Field, P., Hogan, R., Brown, P., Illingworth, A., Choulartona, T., and Cotton, R.: Parametrization of ice-particle size distributions for mid-latitude stratiform cloud, Q. J. Roy. Meteor. Soc., 131, 1997–2017, 2005. a
Gadelha, A. N., Coelho, V. H. R., Xavier, A. C., Barbosa, L. R., Melo, D. C., Xuan, Y., Huffman, G. J., Petersen, W. A., and das Almeida, C. N.: Grid box-level evaluation of IMERG over Brazil at various space and time scales, Atmos. Res., 218, 231–244, https://doi.org/10.1016/j.atmosres.2018.12.001, 2019. a, b
Gettelman, A. and Morrison, H.: Advanced Two-Moment Bulk Microphysics for Global Models. Part I: Off-Line Tests and Comparison with Other Schemes, J. Climate, 28, 1268–1287, https://doi.org/10.1175/JCLI-D-14-00102.1, 2015. a
Gilewski, P. and Nawalany, M.: Inter-Comparison of Rain-Gauge, Radar, and Satellite (IMERG GPM) Precipitation Estimates Performance for Rainfall-Runoff Modeling in a Mountainous Catchment in Poland, Water, 10, https://doi.org/10.3390/w10111665, 2018. a
Grabowski, W. W., Yano, J.-I., and Moncrieff, M. W.: Cloud Resolving Modeling of Tropical Circulations Driven by Large-Scale SST Gradients, J. Atmos. Sci., 57, 2022–2040, https://doi.org/10.1175/1520-0469(2000)057<2022:CRMOTC>2.0.CO;2, 2000. a, b
Guichard, F. and Couvreux, F.: A short review of numerical cloud-resolving models, Tellus A, 69, 1373578, https://doi.org/10.1080/16000870.2017.1373578, 2017. a, b, c
Guo, H., Golaz, J.-C., Donner, L. J., Wyman, B., Zhao, M., and Ginoux, P.: CLUBB as a unified cloud parameterization: Opportunities and challenges, Geophys. Res. Lett., 42, 4540–4547, 2015. a
Hagemann, S. and Dümenil, L.: A parametrization of the lateral waterflow for the global scale, Clim. Dynam., 14, 17–31, https://doi.org/10.1007/s003820050205, 1997. a
Hagemann, S. and Stacke, T.: Impact of the soil hydrology scheme on simulated soil moisture memory, Clim. Dynam., 44, 1731–1750, https://doi.org/10.1007/s00382-014-2221-6, 2015. a
Hartke, S. H. and Wright, D. B.: Where Can IMERG Provide a Better Precipitation Estimate than Interpolated Gauge Data?, Remote Sensing, 14, https://doi.org/10.3390/rs14215563, 2022. a
Herbert, R., Murray, B. J., Dobbie, S. J., and Koop, T.: Sensitivity of liquid clouds to homogenous freezing parameterizations, Geophys. Res. Lett., 42, 1599–1605, 2015. a
Herbert, R., Stier, P., and Dagan, G.: Isolating large‐scale smoke impacts on cloud and precipitation processes over the Amazon with convection permitting resolution, J. Geophys. Res., 126, https://doi.org/10.1029/2021JD034615, 2021. a
Herbert, R. J., Williams, A. I. L., Weiss, P., Watson-Parris, D., Dingley, E., Klocke, D., and Stier, P.: Regional variability of aerosol impacts on clouds and radiation in global kilometer-scale simulations, Atmos. Chem. Phys., 25, 7789–7814, https://doi.org/10.5194/acp-25-7789-2025, 2025. a
Hersbach, H., Bell, B., Berrisford, P., Hirahara, S., Horányi, A., Muñoz‐Sabater, J., Nicolas, J., Peubey, C., Radu, R., Schepers, D., Simmons, A., Soci, C., Abdalla, S., Abellan, X., Balsamo, G., Bechtold, P., Biavati, G., Bidlot, J., Bonavita, M., De Chiara, G., Dahlgren, P., Dee, D., Diamantakis, M., Dragani, R., Flemming, J., Forbes, R., Fuentes, M., Geer, A., Haimberger, L., Healy, S., Hogan, R., Hólm, E., Janisková, M., Keeley, S., Laloyaux, P., Lopez, P., Lupu, C., Radnoti, G., de Rosnay, P., Rozum, I., Vamborg, F., Villaume, S., and Thépaut, J.-N.: Complete ERA5 from 1940: Fifth generation of ECMWF atmospheric reanalyses of the global climate, Copernicus Climate Change Service (C3S) Data Store (CDS) [data set], https://doi.org/10.24381/cds.143582cf, 2017. a
Hersbach, H., Bell, B., Berrisford, P., Biavati, G., Horányi, A., Muñoz Sabater, J., Nicolas, J., Peubey, C., Radu, R., Rozum, I., Schepers, D., Simmons, A., Soci, C., Dee, D., and Thépaut, J.-N.: ERA5 hourly data on single levels from 1940 to present, Copernicus Climate Change Service (C3S) Data Store (CDS) [data set], https://doi.org/10.24381/cds.adbb2d47, 2023. a
Heymsfield, A. J. and Kajikawa, M.: An improved approach to calculating terminal velocities of plate-like crystals and graupel, J. Atmos. Sci., 44, 1088–1099, 1987. a
Heymsfield, A. J., Miloshevich, L. M., Schmitt, C., Bansemer, A., Twohy, C., Peollot, M. R., Fridlind, A., and Gerber, H.: Homogeneous ice nucleation in subtropical and tropical convection and its influence on cirrus anvil microphysics, J. Atmos. Sci., 62, 41–64, https://doi.org/10.1175/JAS-3360.1, 2005. a
Hohenegger, C., Kornblueh, L., Klocke, D., Becker, T., Cioni, G., Engels, J. F., Schulzweida, U., and Stevens, B.: Climate Statistics in Global Simulations of the Atmosphere, from 80 to 2.5 km Grid Spacing, J. Meteorol. Soc. Jpn. Ser. II, 98, 73–91, https://doi.org/10.2151/jmsj.2020-005, 2020. a, b
Hohenegger, C., Korn, P., Linardakis, L., Redler, R., Schnur, R., Adamidis, P., Bao, J., Bastin, S., Behravesh, M., Bergemann, M., Biercamp, J., Bockelmann, H., Brokopf, R., Brüggemann, N., Casaroli, L., Chegini, F., Datseris, G., Esch, M., George, G., Giorgetta, M., Gutjahr, O., Haak, H., Hanke, M., Ilyina, T., Jahns, T., Jungclaus, J., Kern, M., Klocke, D., Kluft, L., Kölling, T., Kornblueh, L., Kosukhin, S., Kroll, C., Lee, J., Mauritsen, T., Mehlmann, C., Mieslinger, T., Naumann, A. K., Paccini, L., Peinado, A., Praturi, D. S., Putrasahan, D., Rast, S., Riddick, T., Roeber, N., Schmidt, H., Schulzweida, U., Schütte, F., Segura, H., Shevchenko, R., Singh, V., Specht, M., Stephan, C. C., von Storch, J.-S., Vogel, R., Wengel, C., Winkler, M., Ziemen, F., Marotzke, J., and Stevens, B.: ICON-Sapphire: simulating the components of the Earth system and their interactions at kilometer and subkilometer scales, Geosci. Model Dev., 16, 779–811, https://doi.org/10.5194/gmd-16-779-2023, 2023. a, b, c, d
Hourdin, F., Mauritsen, T., Gettelman, A., Golaz, J.-C., Balaji, V., Duan, Q., Folini, D., Ji, D., Klocke, D., Qian, Y., Rauser, F., Rio, C., Tomassini, L., Watanabe, M., and Williamson, D.: The Art and Science of Climate Model Tuning, B. Am. Meteorol. Soc., 98, 589–602, https://doi.org/10.1175/BAMS-D-15-00135.1, 2017. a, b
Huffman, G. J., Bolvin, D. T., Nelkin, E. J., and Tan, J.: Integrated Multi-satellitE Retrievals for GPM (IMERG) Technical Documentation, NASA Goddard Space Flight Center, NASA Technical Document https://gpm.nasa.gov/sites/default/files/document_files/IMERG_doc_190313.pdf (last access: 7 May 2025), 2019. a, b
Ibebuchi, C.: On the representation of atmospheric circulation modes in regional climate models over Western Europe, Int. J. Climatol., 43, 668–682, https://doi.org/10.1002/joc.7807, 2022. a
Igel, A. L., Igel, M. R., and van den Heever, S. C.: Make It a Double? Sobering Results from Simulations Using Single-Moment Microphysics Schemes, J. Atmos. Sci., 72, 910–925, https://doi.org/10.1175/JAS-D-14-0107.1, 2015. a, b, c, d
Jiang, L. and Bauer-Gottwein, P.: How do GPM IMERG precipitation estimates perform as hydrological model forcing? Evaluation for 300 catchments across Mainland China, J. Hydrol., 572, 486–500, https://doi.org/10.1016/j.jhydrol.2019.03.042, 2019. a
Karydis, V. A., Capps, S. L., Russell, A. G., and Nenes, A.: Adjoint sensitivity of global cloud droplet number to aerosol and dynamical parameters, Atmos. Chem. Phys., 12, 9041–9055, https://doi.org/10.5194/acp-12-9041-2012, 2012. a
Khain, A. P., Beheng, K. D., Heymsfield, A., Korolev, A., Krichak, S. O., Levin, Z., Pinsky, M., Phillips, V., Prabhakaran, T., Teller, A., van den Heever, S. C., and Yano, J.-I.: Representation of microphysical processes in cloud-resolving models: Spectral (bin) microphysics versus bulk parameterization, Rev. Geophys., 53, 247–322, 2015. a, b, c, d
Kipling, Z., Stier, P., Labbouz, L., and Wagner, T.: Dynamic subgrid heterogeneity of convective cloud in a global model: description and evaluation of the Convective Cloud Field Model (CCFM) in ECHAM6–HAM2, Atmos. Chem. Phys., 17, 327–342, https://doi.org/10.5194/acp-17-327-2017, 2017. a
Klemp, J. B., Dudhia, J., and Hassiotis, A. D.: An Upper Gravity-Wave Absorbing Layer for NWP Applications, Mon. Weather Rev., 136, 3987–4004, https://doi.org/10.1175/2008MWR2596.1, 2008. a
Köcher, G., Zinner, T., and Knote, C.: Influence of cloud microphysics schemes on weather model predictions of heavy precipitation, Atmos. Chem. Phys., 23, 6255–6269, https://doi.org/10.5194/acp-23-6255-2023, 2023. a, b
Kodama, C., Noda, A. T., and Satoh, M.: An assessment of the cloud signals simulated by NICAM using ISCCP, CALIPSO, and CloudSat satellite simulators, J. Geophys. Res.-Atmos., 117, https://doi.org/10.1029/2011JD017317, 2012. a
Labbouz, L., Kipling, Z., Stier, P., and Protat, A.: How Well Can We Represent the Spectrum of Convective Clouds in a Climate Model? Comparisons between Internal Parameterization Variables and Radar Observations, J. Atmos. Sci., 75, 1509–1524, https://doi.org/10.1175/JAS-D-17-0191.1, 2018. a
Lebo, Z. J., Morrison, H., and Seinfeld, J. H.: Are simulated aerosol-induced effects on deep convective clouds strongly dependent on saturation adjustment?, Atmos. Chem. Phys., 12, 9941–9964, https://doi.org/10.5194/acp-12-9941-2012, 2012. a, b
Leduc, M. and Laprise, R.: Regional climate model sensitivity to domain size, Clim. Dynam., 32, 833–854, https://doi.org/10.1007/s00382-008-0400-z, 2009. a
Lee, H.-T., Laszlo, I., and Gruber, A.: ABI Earth Radiation Budget Upward Longwave Radiation: TOA (Outgoing Longwave Radiation), https://www.goes-r.gov/products/ATBDs/option2/RadBud_OLR_v2.0_no_color.pdf (last access: 6 October 2025), 2010. a
Leuenberger, D., Koller, M., Fuhrer, O., and Schär, C.: A Generalization of the SLEVE Vertical Coordinate, Mon. Weather Rev., 138, 3683–3689, https://doi.org/10.1175/2010MWR3307.1, 2010. a
Li, J., Ding, C., Li, F., and Chen, Y.: Effects of single- and double-moment microphysics schemes on the intensity of super typhoon Sarika (2016), Atmos. Res., 238, 104894, https://doi.org/10.1016/j.atmosres.2020.104894, 2020. a
Li, J., Zhang, K., Hassan, T., Zhang, S., Ma, P.-L., Singh, B., Yan, Q., and Huang, H.: Assessing the sensitivity of aerosol mass budget and effective radiative forcing to horizontal grid spacing in E3SMv1 using a regional refinement approach, Geosci. Model Dev., 17, 1327–1347, https://doi.org/10.5194/gmd-17-1327-2024, 2024. a
Li, Z., Wright, D. B., Hartke, S. H., Kirschbaum, D. B., Khan, S., Maggioni, V., and Kirstetter, P.-E.: Toward a Globally-Applicable Uncertainty Quantification Framework for Satellite Multisensor Precipitation Products Based on GPM DPR, IEEE T. Geosci. Remote, 61, 1–15, https://doi.org/10.1109/TGRS.2023.3235270, 2023. a
Marinescu, P. J., van den Heever, S. C., Heikenfeld, M., Barrett, A. I., Barthlott, C., Hoose, C., Fan, J., Fridlind, A. M., Matsui, T., Miltenberger, A. K., Stier, P., Vie, B., White, B. A., and Zhang, Y.: Impacts of Varying Concentrations of Cloud Condensation Nuclei on Deep Convective Cloud Updrafts – A Multimodel Assessment, J. Atmos. Sci., 78, 1147–1172, https://doi.org/10.1175/JAS-D-20-0200.1, 2021. a
Martins, G., von Randow, C., Sampaio, G., and Dolman, A. J.: Precipitation in the Amazon and its relationship with moisture transport and tropical Pacific and Atlantic SST from the CMIP5 simulation, Hydrol. Earth Syst. Sci. Discuss., 12, 671–704, https://doi.org/10.5194/hessd-12-671-2015, 2015. a
Matte, D., Laprise, R., Thériault, J., and Lucas-Picher, P.: Spatial spin-up of fine scales in a regional climate model simulation driven by low-resolution boundary conditions, Clim. Dynam., 49, 563–574, https://doi.org/10.1007/s00382-016-3358-2, 2017. a
Morrison, H. and Milbrandt, J.: Comparison of Two-Moment Bulk Microphysics Schemes in Idealized Supercell Thunderstorm Simulations, Mon. Weather Rev., 139, 1103–1130, https://doi.org/10.1175/2010MWR3433.1, 2011. a, b
Morrison, H., van Lier-Walqui, M., Fridlind, A. M., Grabowski, W. W., Harrington, J. Y., Hoose, C., Korolev, A., Kumjian, M. R., Milbrandt, J. A., Pawlowska, H., Posselt, D. J., Prat, O. P., Reimel, K. J., Shima, S.-I., van Diedenhoven, B., and Xue, L.: Confronting the Challenge of Modeling Cloud and Precipitation Microphysics, J. Adv. Model. Earth Sy., 12, e2019MS001689, https://doi.org/10.1029/2019MS001689, 2020. a
Moseley, C., Pscheidt, I., Cioni, G., and Heinze, R.: Impact of resolution on large-eddy simulation of midlatitude summertime convection, Atmos. Chem. Phys., 20, 2891–2910, https://doi.org/10.5194/acp-20-2891-2020, 2020. a
Muñoz de la Torre, E., González Trinidad, J., González Ramírez, E., Bautista Capetillo, C. F., Júnez Ferreira, H. E., Badillo Almaraz, H., and Rivas Recendez, M. I.: Estimation of Rainfall via IMERG-FR and Its Relationship with the Records of a Rain Gauge Network with Spatio-Temporal Variation, Case of Study: Mexican Semi-Arid Region, Remote Sensing, 16, https://doi.org/10.3390/rs16020273, 2024. a, b
NASA: Global Precipitation Measurements (GPM) Integrated Multi-satellitE Retrievals (IMERG) L3 Half Hourly 0.1 degree x 0.1 degree v6, https://catalogue.ceda.ac.uk/uuid/47c32530265d4d6e8fdb6c08b2330371 (last access: 28 February 2025), 2020. a, b
NASA Earth Observatory: Blue Marble Next Generation, https://visibleearth.nasa.gov/collection/1484/blue-marble (last access: 6 October 2025), 2024. a
Naumann, A. K., Esch, M., and Stevens, B.: How the representation of microphysical processes affects tropical condensate in the global storm-resolving model ICON, Atmos. Chem. Phys., 25, 6429–6444, https://doi.org/10.5194/acp-25-6429-2025, 2025. a
Ohring, G., Gruber, A., and Ellingson, R.: Satellite Determinations of the Relationship between Total Longwave Radiation Flux and Infrared Window Radiance, J. Appl. Meteorol. Clim., 23, 416–425, https://doi.org/10.1175/1520-0450(1984)023<0416:SDOTRB>2.0.CO;2, 1984. a
Omanovic, N., Goger, B., and Lohmann, U.: The impact of the mesh size and microphysics scheme on the representation of mid-level clouds in the ICON model in hilly and complex terrain, Atmos. Chem. Phys., 24, 14145–14175, https://doi.org/10.5194/acp-24-14145-2024, 2024. a
Palmer, T. and Stevens, B.: The scientific challenge of understanding and estimating climate change, P. Natl. Acad. Sci. USA, 116, 24390–24395, https://doi.org/10.1073/pnas.1906691116, 2019. a
Pascale, S., Lucarini, V., and Feng, X.: Analysis of rainfall seasonality from observations and climate models, Clim. Dynam., 44, 3281–3301, https://doi.org/10.1007/s00382-014-2278-2, 2015. a
Pincus, R., Mlawer, E. J., and Delamere, J. S.: Balancing Accuracy, Efficiency, and Flexibility in Radiation Calculations for Dynamical Models, J. Adv. Model. Earth Sy., 11, 3074–3089, https://doi.org/10.1029/2019MS001621, 2019. a
Pöhlker, M. L., Pöhlker, C., Ditas, F., Klimach, T., Hrabe de Angelis, I., Araújo, A., Brito, J., Carbone, S., Cheng, Y., Chi, X., Ditz, R., Gunthe, S. S., Kesselmeier, J., Könemann, T., Lavrič, J. V., Martin, S. T., Mikhailov, E., Moran-Zuloaga, D., Rose, D., Saturno, J., Su, H., Thalman, R., Walter, D., Wang, J., Wolff, S., Barbosa, H. M. J., Artaxo, P., Andreae, M. O., and Pöschl, U.: Long-term observations of cloud condensation nuclei in the Amazon rain forest – Part 1: Aerosol size distribution, hygroscopicity, and new model parametrizations for CCN prediction, Atmos. Chem. Phys., 16, 15709–15740, https://doi.org/10.5194/acp-16-15709-2016, 2016. a
Pope, N. H. and Igel, A. L.: Identifying Important Microphysical Properties and Processes for Marine Fog Forecasts, Mon. Weather Rev., 151, 2427–2441, https://doi.org/10.1175/MWR-D-22-0294.1, 2023. a
Radović, J., Belda, M., Resler, J., Eben, K., Bureš, M., Geletič, J., Krč, P., Řezníček, H., and Fuka, V.: Challenges of constructing and selecting the “perfect” boundary conditions for the large-eddy simulation model PALM, Geosci. Model Dev., 17, 2901–2927, https://doi.org/10.5194/gmd-17-2901-2024, 2024. a
Randall, D. A., man Xu, K., Somerville, R. J. C., and Iacobellis, S.: Single-Column Models and Cloud Ensemble Models as Links between Observations and Climate Models, J. Climate, 9, 1683–1697, https://doi.org/10.1175/1520-0442(1996)009<1683:SCMACE>2.0.CO;2, 1996. a
Rao, C. N., Stowe, L., McClain, E., Sapper, J., and McCormick, M.: Development and application of aerosol remote sensing with AVHRR data from the NOAA satellites, edited by: Hobbs, P. V., Aerosols and Climate, A. Deepak Publishing, Hampton, VA, USA, 69–80, 1988. a
Rehbein, A. and Ambrizzi, T.: Mesoscale convective systems over the Amazon basin in a changing climate under global warming, Clim. Dynam., 61, 1815–1827, https://doi.org/10.1007/s00382-022-06657-8, 2023. a
Richtmyer, R. D. and Morton, K. W.: Difference methods for initial-value problems, Interscience Publishers, John Wiley and Sons, New York, 2nd Edn., ISBN 0894647636, 1967. a
Rocheta, E., Evans, J. P., and Sharma, A.: Can Bias Correction of Regional Climate Model Lateral Boundary Conditions Improve Low-Frequency Rainfall Variability?, J. Climate, 30, 9785–9806, https://doi.org/10.1175/JCLI-D-16-0654.1, 2017. a
Roh, W., Satoh, M., and Hohenegger, C.: Intercomparison of Cloud Properties in DYAMOND Simulations over the Atlantic Ocean, J. Meteorol. Soc. Jpn. Ser. II, 99, 1439–1451, https://doi.org/10.2151/jmsj.2021-070, 2021. a
Rybka, H., Burkhardt, U., Köhler, M., Arka, I., Bugliaro, L., Görsdorf, U., Horváth, Á., Meyer, C. I., Reichardt, J., Seifert, A., and Strandgren, J.: The behavior of high-CAPE (convective available potential energy) summer convection in large-domain large-eddy simulations with ICON, Atmos. Chem. Phys., 21, 4285–4318, https://doi.org/10.5194/acp-21-4285-2021, 2021. a
Satoh, M., Matsugishi, S., Roh, W., Yasutaka, I., Naomi, K., Tatsuya, S., Tempei, H., and Hajime, O.: Evaluation of cloud and precipitation processes in regional and global models with ULTIMATE (ULTra-sIte for Measuring Atmosphere of Tokyo metropolitan Environment): a case study using the dual-polarization Doppler weather radars, Prog. Earth Planet. Sci., 9, 51, https://doi.org/10.1186/s40645-022-00511-5, 2022. a
Schmidt, H., Rast, S., Bao, J., Cassim, A., Fang, S.-W., Jimenez-de la Cuesta, D., Keil, P., Kluft, L., Kroll, C., Lang, T., Niemeier, U., Schneidereit, A., Williams, A. I. L., and Stevens, B.: Effects of vertical grid spacing on the climate simulated in the ICON-Sapphire global storm-resolving model, Geosci. Model Dev., 17, 1563–1584, https://doi.org/10.5194/gmd-17-1563-2024, 2024. a
Schmit, T. J. and Gunshor, M. M.: Chapter 4 – ABI Imagery from the GOES-R Series, in: The GOES-R Series, edited by: Goodman, S. J., Schmit, T. J., Daniels, J., and Redmon, R. J., Elsevier, 23–34, ISBN 978-0-12-814327-8, https://doi.org/10.1016/B978-0-12-814327-8.00004-4, 2020. a, b
Schär, C., Fuhrer, O., Arteaga, A., Ban, N., Charpilloz, C., Girolamo, S. D., Hentgen, L., Hoefler, T., Lapillonne, X., Leutwyler, D., Osterried, K., Panosetti, D., Rüdisühli, S., Schlemmer, L., Schulthess, T. C., Sprenger, M., Ubbiali, S., and Wernli, H.: Kilometer-Scale Climate Models: Prospects and Challenges, B. Ame. Meteorol. Soc., 101, E567– E587, https://doi.org/10.1175/BAMS-D-18-0167.1, 2020. a
Seifert, A.: Uncertainty and complexity in cloud microphysics, Workshop on Representing Model Uncertainty and Error in Numerical Weather and Climate Prediction Models, 20–24 June 2011, ECMWF, Shinfield Park, Reading, UK, 77–86, 2011. a, b
Seifert, A. and Beheng, K. D.: A double-moment parameterization for simulating autoconversion, accretion and self-collection, Atmos. Res., 59–60, 265–281, 2001. a
Seifert, A. and Beheng, K. D.: A two-moment cloud microphysics parameterization for mixed-phase clouds. Part 1: Model description, Meteorol. Atmos. Phys., 92, 45–66, https://doi.org/10.1007/s00703-005-0112-4, 2006. a, b
Seiki, T., Roh, W., and Satoh, M.: Cloud Microphysics in Global Cloud Resolving Models, Atmos.-Ocean, 60, 477–505, https://doi.org/10.1080/07055900.2022.2075310, 2022. a
Sela, M.: Data for “Sensitivity of cloud structure and precipitation to cloud microphysics schemes in ICON and implications for global km-scale simulations”, Zenodo [data set], https://doi.org/10.5281/zenodo.17592760, 2025. a
Sela, M., Weiss, P., and Stier, P.: Code for “Sensitivity of cloud structure and precipitation to cloud microphysics schemes in ICON and implications for global km-scale simulations”, Zenodo [code], https://doi.org/10.5281/zenodo.17581721, 2025. a
Sherwood, S. C., Webb, M. J., Annan, J. D., Armour, K. C., Forster, P. M., Hargreaves, J. C., Hegerl, G., Klein, S. A., Marvel, K. D., Rohling, E. J., Watanabe, M., Andrews, T., Braconnot, P., Bretherton, C. S., Foster, G. L., Hausfather, Z., von der Heydt, A. S., Knutti, R., Mauritsen, T., Norris, J. R., Proistosescu, C., Rugenstein, M., Schmidt, G. A., Tokarska, K. B., and Zelinka, M. D.: An Assessment of Earth's Climate Sensitivity Using Multiple Lines of Evidence, Rev. Geophys., 58, e2019RG000678, https://doi.org/10.1029/2019RG000678, 2020. a
Song, Q., Yang, J., Luo, H., Li, C., and Fu, S.: Idealized 2D Cloud-resolving Simulations for Tidally Locked Habitable Planets, Astrophys. J., 934, 149, https://doi.org/10.3847/1538-4357/ac7879, 2022. a, b
Song, X. and Zhang, G. J.: Microphysics parameterization for convective clouds in a global climate model: Description and single-column model tests, J. Geophys. Res.-Atmos., 116, https://doi.org/10.1029/2010JD014833, 2011. a
Stephens, G. L.: Cloud Feedbacks in the Climate System: A Critical Review, J. Climate, 18, 237–273, https://doi.org/10.1175/JCLI-3243.1, 2005. a
Stevens, B., Satoh, M., Auger, L., Biercamp, J., Bretherton, C. S., Chen, X., Düben, P., Judt, F., Khairoutdinov, M., Klocke, D., Kodama, C., Kornblueh, L., Lin, S.-J., Neumann, P., Putman, W. M., Röber, N., Shibuya, R., Vanniere, B., Vidale, P. L., Wedi, N., and Zhou, L.: DYAMOND: the DYnamics of the Atmospheric general circulation Modeled On Non-hydrostatic Domains, Prog. Earth Pl. Sci., 6, 61, https://doi.org/10.1186/s40645-019-0304-z, 2019. a
Sullivan, S. C., Lee, D., Oreopoulos, L., and Nenes, A.: Role of updraft velocity in temporal variability of global cloud hydrometeor number, P. Natl. Acad. Sci. USA, 113, 5791–5796, https://doi.org/10.1073/pnas.1514039113, 2016. a
Talchabhadel, R., Shah, S., and Aryal, B.: Evaluation of the Spatiotemporal Distribution of Precipitation Using 28 Precipitation Indices and 4 IMERG Datasets over Nepal, Remote Sensing, 14, https://doi.org/10.3390/rs14235954, 2022. a
Tan, J., Petersen, W. A., Kirstetter, P.-E., and Tian, Y.: Performance of IMERG as a Function of Spatiotemporal Scale, J. Hydrometeorol., 18, 307–319, https://doi.org/10.1175/JHM-D-16-0174.1, 2017. a, b
Tang, G., Clark, M. P., Papalexiou, S. M., Ma, Z., and Hong, Y.: Have satellite precipitation products improved over last two decades? A comprehensive comparison of GPM IMERG with nine satellite and reanalysis datasets, Remote Sens. Environ., 240, 111697, https://doi.org/10.1016/j.rse.2020.111697, 2020. a
Tao, W., Shi, J., Chen, S., Lang, S., Lin, P.-L., Hong, S.-Y., Peters-Lidard, C., and Hou, A.: The impact of microphysical schemes on hurricane intensity and track, Asia-Pacific J. Atmos. Sci., 47, 1–16, https://doi.org/10.1007/s13143-011-1001-z, 2011. a
Tao, W.-K., Chen, J.-P., Li, Z., Wang, C., and Zhang, C.: Impact of aerosols on convective clouds and precipitation, Rev. Geophys., 50, https://doi.org/10.1029/2011RG000369, 2012. a
Tao, W.-K., Wu, D., Lang, S., Chern, J.-D., Peters-Lidard, C., Fridlind, A., and Matsui, T.: High-resolution NU-WRF simulations of a deep convective-precipitation system during MC3E: Further improvements and comparisons between Goddard microphysics schemes and observations, J. Geophys. Res., 121, 1278–1305, 2016. a
Tardif, R.: Precipitation and Fog, Springer International Publishing, Cham, 395–423, ISBN 978-3-319-45229-6, https://doi.org/10.1007/978-3-319-45229-6_8, 2017. a
Tomita, H., Miura, H., Iga, S., Nasuno, T., and Satoh, M.: A global cloud-resolving simulation: Preliminary results from an aqua planet experiment, Geophys. Res. Lett., 32, https://doi.org/10.1029/2005GL022459, 2005. a, b
Tompkins, A. M.: Organization of Tropical Convection in Low Vertical Wind Shears: The Role of Cold Pools, J. Atmos. Sci., 58, 1650–1672, https://doi.org/10.1175/1520-0469(2001)058<1650:OOTCIL>2.0.CO;2, 2001. a
Trenberth, K. E., Fasullo, J. T., and Kiehl, J.: Earth's Global Energy Budget, B. Am. Meteorol. Soc., 90, 311–324, https://doi.org/10.1175/2008BAMS2634.1, 2009. a
Uchida, J., Mori, M., Hara, M., Satoh, M., Goto, D., Kataoka, T., Suzuki, K., and Nakajima, T.: Impact of Lateral Boundary Errors on the Simulation of Clouds with a Nonhydrostatic Regional Climate Model, Mon. Weather Rev., 145, 5059–5082, https://doi.org/10.1175/MWR-D-17-0158.1, 2017. a
Van Weverberg, K., Goudenhoofdt, E., Blahak, U., Brisson, E., Demuzere, M., Marbaix, P., and van Ypersele, J.-P.: Comparison of one-moment and two-moment bulk microphysics for high-resolution climate simulations of intense precipitation, Atmos. Res., 147–148, 145–161, https://doi.org/10.1016/j.atmosres.2014.05.012, 2014. a
Varble, A.: Erroneous Attribution of Deep Convective Invigoration to Aerosol Concentration, J. Atmos. Sci., 75, 1351–1368, https://doi.org/10.1175/JAS-D-17-0217.1, 2018. a
Weigum, N., Schutgens, N., and Stier, P.: Effect of aerosol subgrid variability on aerosol optical depth and cloud condensation nuclei: implications for global aerosol modelling, Atmos. Chem. Phys., 16, 13619–13639, https://doi.org/10.5194/acp-16-13619-2016, 2016. a
White, B., Gryspeerdt, E., Stier, P., Morrison, H., Thompson, G., and Kipling, Z.: Uncertainty from the choice of microphysics scheme in convection-permitting models significantly exceeds aerosol effects, Atmos. Chem. Phys., 17, 12145–12175, https://doi.org/10.5194/acp-17-12145-2017, 2017. a, b, c, d
Wisner, C., Orville, H. D., and Myers, C.: A Numerical Model of a Hail-Bearing Cloud, J. Atmos. Sci., 29, 1160–1181, https://doi.org/10.1175/1520-0469(1972)029<1160:ANMOAH>2.0.CO;2, 1972. a
WMO: Manual on Codes – International Codes, Volume I.1, Annex II to the WMO Technical Regulations: Part A – Alphanumeric Codes, Tech. Rep. WMO-No. 306, World Meteorological Organization, Geneva, Switzerland, https://library.wmo.int/idurl/4/35713 (last access: 6 October 2025), 2019. a
Wu, L. and Petty, G. W.: Intercomparison of Bulk Microphysics Schemes in Model Simulations of Polar Lows, Mon. Weather Rev., 138, 2211–2228, https://doi.org/10.1175/2010MWR3122.1, 2010. a
Wyngaard, J. C.: Toward Numerical Modeling in the “Terra Incognita”, J. Atmos. Sci., 61, 1816–1826, https://doi.org/10.1175/1520-0469(2004)061<1816:TNMITT>2.0.CO;2, 2004. a
Zhang, K., Fu, R., Shaikh, M. J., Ghan, S., Wang, M., Leung, L. R., Dickinson, R. E., and Marengo, J.: Influence of Superparameterization and a Higher-Order Turbulence Closure on Rainfall Bias Over Amazonia in Community Atmosphere Model Version 5, J. Geophys. Res.-Atmos., 122, 9879–9902, https://doi.org/10.1002/2017JD026576, 2017. a
Zhang, M., Wang, H., Zhang, X., Peng, Y., and Che, H.: Applying the WRF Double-Moment Six-Class Microphysics Scheme in the GRAPES_Meso Model: A Case Study, J. Meteorol. Res., 32, 246–264, https://doi.org/10.1007/s13351-018-7066-1, 2018. a
Zhou, C., Gao, W., Hu, J., Du, L., and Du, L.: Capability of IMERG V6 Early, Late, and Final Precipitation Products for Monitoring Extreme Precipitation Events, Remote Sensing, 13, https://doi.org/10.3390/rs13040689, 2021. a