
the Creative Commons Attribution 4.0 License.
the Creative Commons Attribution 4.0 License.
 | 20 Aug 2026
GCAM-Europe v7.2.0: enhancing policy-relevant climate modelling through spatial and sectoral detail
Jon Sampedro
Russell Horowitz
Clàudia Rodés-Bachs
Konstantinos Koasidis
Dirk-Jan Van de Ven
Integrated Assessment Models (IAMs) serve as critical instruments for scenario-based analysis and have been instrumental in informing environmental policy at both global and regional scales. However, their limited geographical and sectoral scope constrains their ability to evaluate comprehensive policy packages such as the European Union's Fit-for-55. GCAM-Europe, an expansion of the well-stablished Global Change Analysis Model (GCAM) addresses this gap by explicitly representing energy, land use, agriculture, water, and emissions systems for European Member States and key non-EU countries. Operating within a global framework, the model enables integrated assessment of policy impacts both across and within European regions, while also capturing spillover effects in other regions in the world. As an open-access and continuously evolving platform, it provides a valuable tool for European researchers, policymakers, and stakeholders to design, test, and evaluate climate and environmental strategies that support a just and effective climate transition.
- Article
(7716 KB) - Full-text XML
-
Supplement
(2481 KB) - BibTeX
- EndNote


Integrated assessment models (IAMs) are “simplified representations of complex physical and social systems, focusing on the interaction between economy, society and the environment” (IAMC, 2022). Over the past four decades, IAMs have played an important role in shaping environmental policy and advancing research at both global and regional levels (Weyant, 2017). In recent years, the number of IAM-related publications addressing climate change has grown exponentially, and IAMs have become integral to the development of recent reports from the Intergovernmental Panel on Climate Change (IPCC; IPCC, 2022), supporting scenario analysis, mitigation strategies, and long-term climate projections (Fisher-Vanden and Weyant, 2020). Notably, from the hundreds of scenarios included in the early IPCC reports (van Beek et al., 2020), the contribution of Working Group III in the recent Six Assessment Report (AR6) of IPCC featured a little more than 1200 scenarios, and almost thrice as many submissions (Kikstra et al., 2022).
Among the models inter alia underpinning IPCC reports, the Global Change Analysis Model (GCAM) is a well-reputed multisector IAM developed and maintained at the Pacific Northwest National Laboratory's Joint Global Change Research Institute (Calvin et al., 2019; Joint Global Change Research Institute, 2025a). The model is designed to explore the interdependencies between the energy, agriculture, forestry and land use (AFOLU), water, and climate systems in 32 geopolitical regions across the globe. It enables the analysis of alternative “what-if” type scenarios through a unified computational platform, with projections extending up to the year 2100. GCAM has been used in major cross-regional analyses, including the IPCC reports (IPCC, 2022), the development of the Shared Socioeconomic Pathways (Calvin et al., 2017), or the recent Scenario Model Intercomparison Project for CMIP7 (van Vuuren et al., 2026). A key advantage of GCAM is that it is a fully open-source and accessible model supported by an active and widespread community of practice. Although the IAM community has recently made progress in releasing the source code of many emblematic models, the reliance on proprietary support software remains a core limitation, particularly in the case of optimisation models. By adopting a price-clearing, recursive-dynamic, partial-equilibrium solution mechanism, GCAM has positioned itself among the few models that can be freely used by any potential user without the need for proprietary software (see Table S1 in the Supplement). This openness has fostered a strong community that ensures continuous maintenance, updates, and expansions.
Despite their usefulness in climate science, IAMs have also faced significant criticisms (Ackerman et al., 2009). One common criticism is on the spatial granularity represented. GCAM and other existing IAMs are limited to assess comprehensive packages like the EU's Fit-for-55 or the Inflation Reduction Act (IRA). Global models often lack the geographic and sectoral detail needed to capture national and regional differences, while national models typically miss cross-border interactions and wider economic dynamics (Anderson and Jewell, 2019; Brutschin et al., 2021; Keppo et al., 2021). In fact, out of the 13 models with at least one scenario in IPCC AR6 (Sognnaes and Peters, 2025), only two global models featured a disaggregated representation of all EU member states (see Table S1), namely POLES (Criqui et al., 2015) a closed-source energy system model, and GEM-E3 (Capros et al., 2013) a general equilibrium model, relying on the proprietary Global Trade Analysis Project (GTAP) database (Aguiar et al., 2022). On the other hand, regional bottom-up models with a detailed representation of the EU, like EU-TIMES (Gago et al., 2013), often lack the ability to capture global trends along with the regional dynamics. Additionally, IAMs generally focus on identifying “least-cost” pathways to emission reduction targets (van de Ven et al., 2023), which involves applying a uniform carbon price across all regions and sectors, with little attention to feasibility (Bertram et al., 2024) or non-emission outcomes (Geels et al., 2016). As a result, these models often produce scenarios that diverge significantly from national political realities, such as over-reliance on negative emissions technologies (NETs) (Lamb et al., 2024) and on land removals (Dooley et al., 2024), or unrealistic policy assumptions (Gambhir et al., 2019). In addition, in terms of sectoral and technological granularity, IAMs often fail to adequately represent the diversity of household behaviour and consumption, which critically limits their ability to assess inequality impacts and the broader social and distributional consequences of climate transitions, which are essential to ensure no one is left behind in the shift to a low-carbon future (Emmerling et al., 2024; Low et al., 2025). These limitations of IAMs underscore the critical need to develop new, and refine existing, IAMs (Braunreiter et al., 2021; Koasidis et al., 2023; Skea et al., 2021). Particularly, enhancing the geographical resolution of IAMs is essential to accurately represent the heterogeneity of socio-economic systems, institutional capacities, and political contexts at the national level. Such granularity enables more detailed, bottom-up climate policy modelling within a global context and beyond stylized assumptions like uniform carbon pricing, thereby improving the feasibility, relevance, and robustness of projected outcomes.
The GCAM community has already developed several regional versions of the models for different regions over the world that include the USA (GCAM-USA; (Binsted et al., 2022), China (GCAM-China; Center for Global Sustainability at University of Maryland et al., 2025), Korea (GCAM-Korea; Jeon et al., 2021), Middle East (GCAM-KSA), South America (GCAM-LAC), Canada (GCAM-Canada) or India (GCAM-India). These regional versions have been proven to be better suited for modelling bottom-up environmental policies and assessing their system-wide implications at both national and subnational scales. Therefore, they have garnered significant interest from a diverse array of stakeholders. For instance, GCAM-USA has been widely employed to evaluate the impacts of existing climate policies at the national and state levels (Bistline et al., 2025; Zhao et al., 2024), with its outputs informing both academic research and decision-making in policy and industry. Similarly, the recent launch event for the latest version of GCAM-China drew considerable attention, with nearly 200 participants attending in person and over 10 000 viewers joining online. However, neither the GCAM nor the broader IAM community has so far managed to deliver a European version of a core global model, with full member state granularity that is open source and freely accessible, despite the EU's historical international climate leadership (Oberthür and Dupont, 2021). Within this context, we present GCAM-Europe, a powerful tool for in-depth analysis of European climate policy at the member state level, which, unlike existing regional versions of GCAM, explicitly represents land use, agriculture, water resources, and energy extraction at the subregional level. This constitutes a significant contribution to the European IAM community, enabling more precise assessments of resource dynamics and policy impacts across diverse European contexts, with the potential to receive strong interest from key stakeholders involved in the climate transition of the EU and globally.
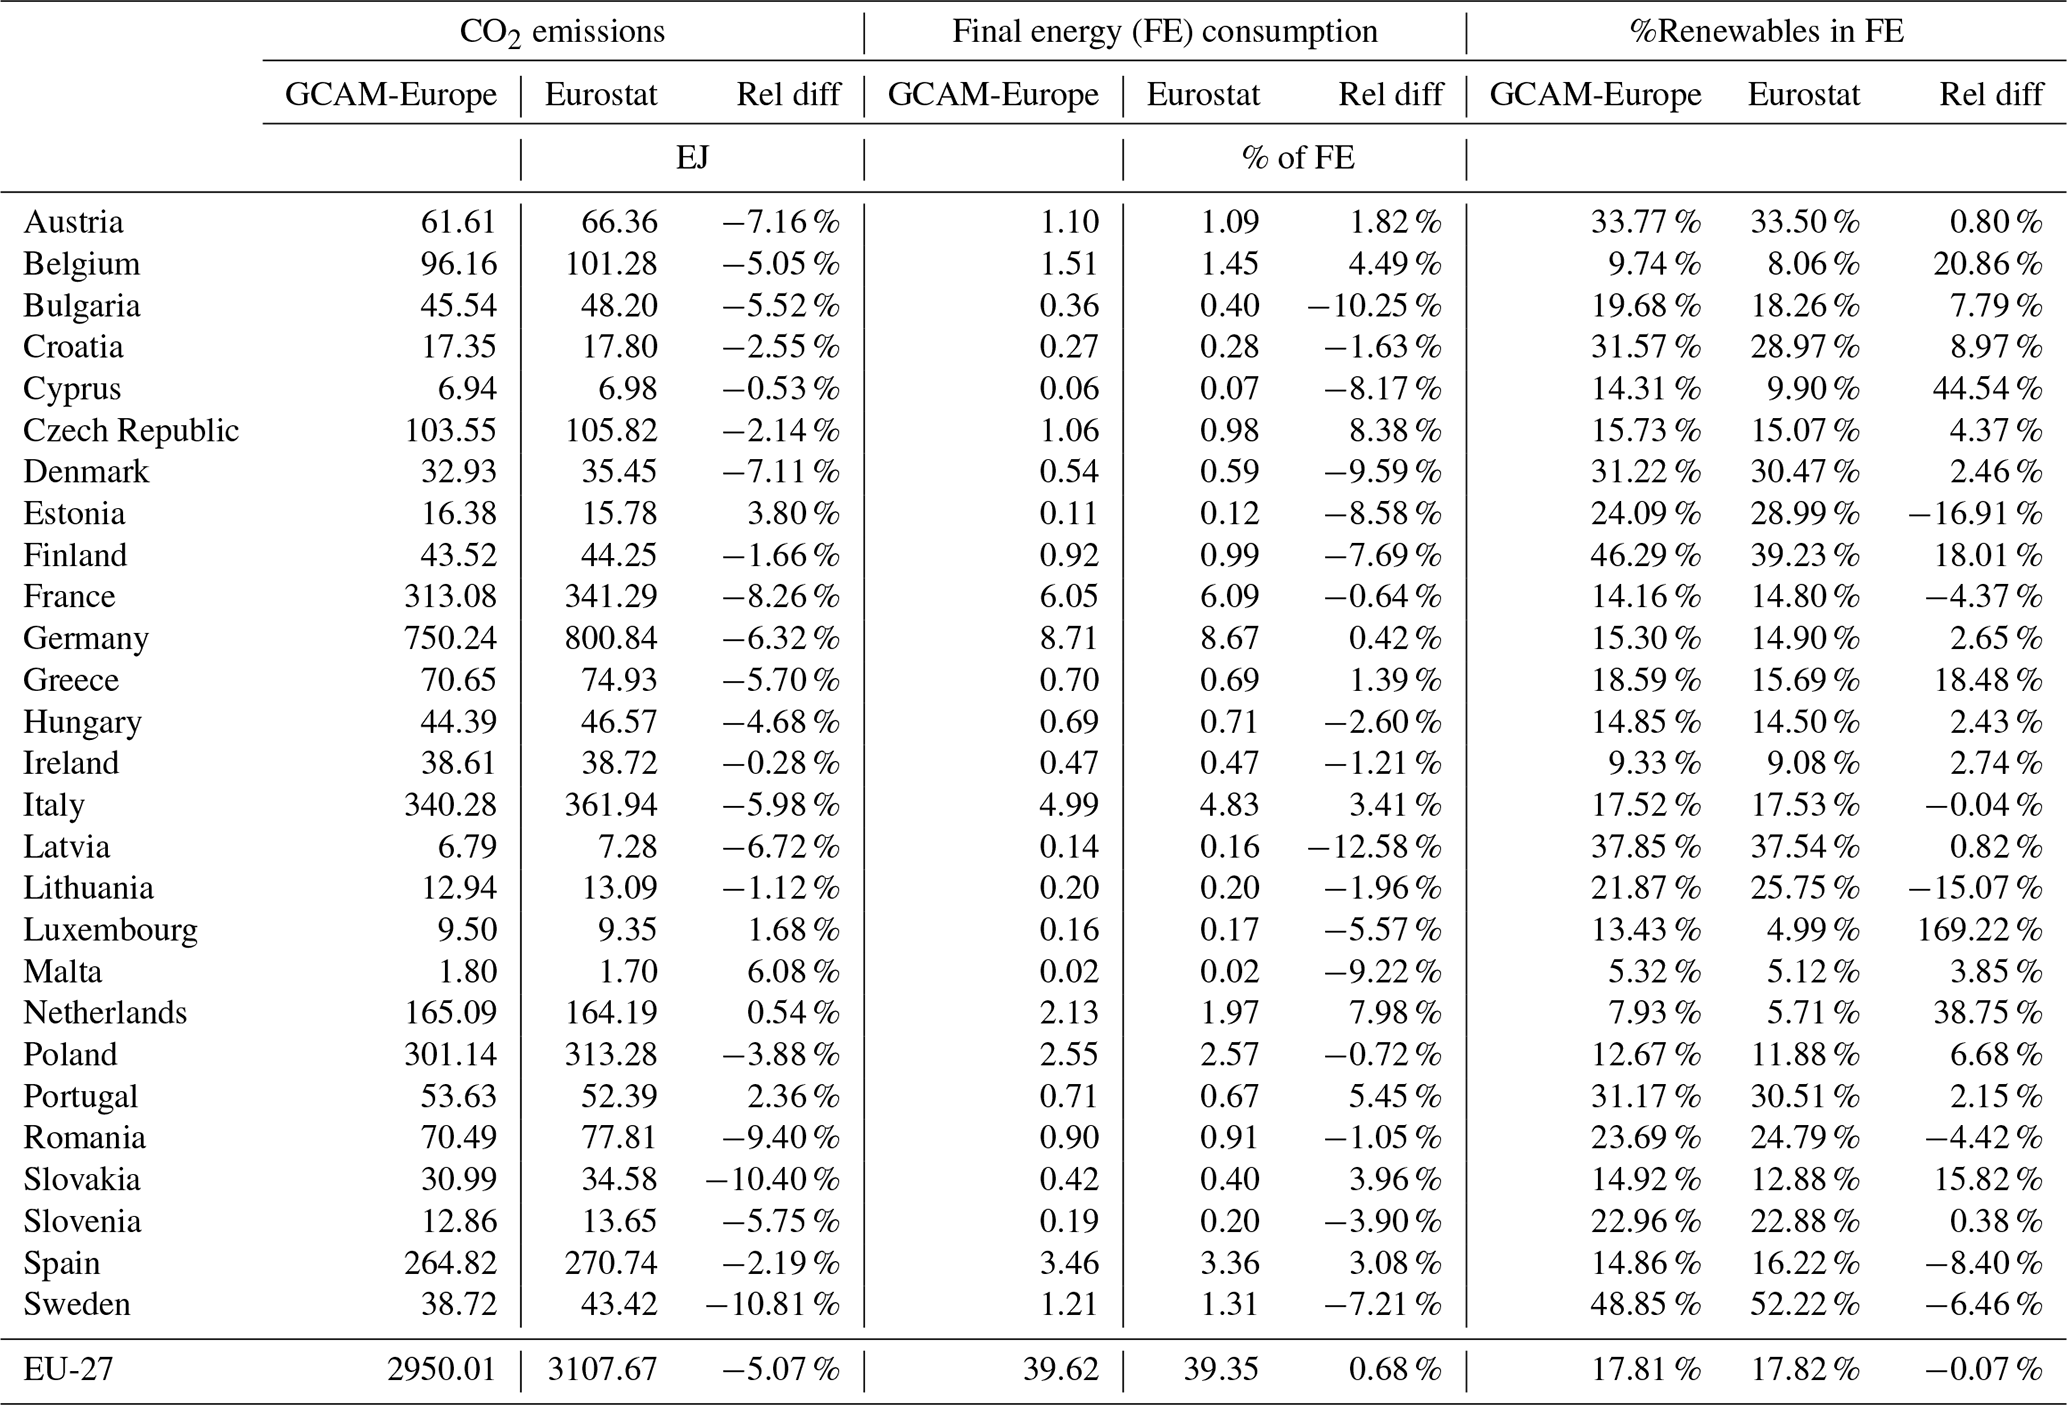
GCAM-Europe's geographical disaggregation is highly-detailed for the European continent. While core GCAM divides the European continent into five different regions, namely EU-12, EU-15, Europe Eastern, Europe-non-EU, and European Free Trade Association (EFTA), in GCAM-Europe all European countries are disaggregated into individual model regions (Fig. 1) for the energy-economy system. These include the 27 Member States of the European Union (EU) and additional key non-EU countries (e.g., Switzerland or the United Kingdom) (see Table A1). In terms of land-use and water systems, GCAM-Europe disaggregates 119 land regions, which result from the interactions between geopolitical regions (countries) with the hydrologic basins. Having this level of detail enables us to explore the country-level effects of European policy packages or transformational strategies, as well as the potential international effects (e.g., carbon leakages).
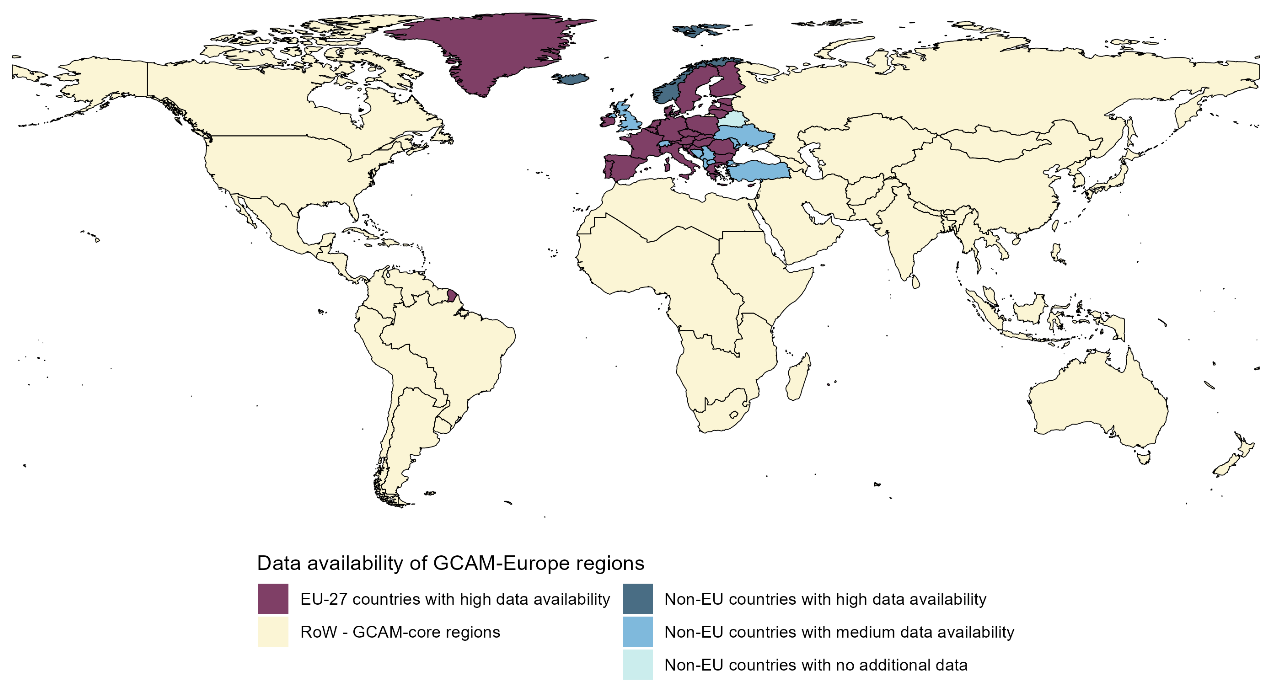
Figure 1Regional disaggregation in GCAM-Europe. Purple and blue areas indicate regional groups that are explicitly disaggregated in this model, while yellow areas represent regional groups from the original model.
GCAM-Europe replaces the default (international) data sources for all newly defined European countries with Europe-specific data, such as energy statistics from Eurostat (Eurostat, 2025a), whenever available. If certain countries lack coverage in these European datasets, alternative sources are used, most commonly reverting to the default GCAM data, such as IEA energy statistics (IEA 2022). Population projections are also replaced by specific data from the EU Ageing Report 2024 (European Commission, 2024), ensuring consistency with official demographic and economic outlooks. While the model applies various data transformation from the crude input data towards the final GCAM inputs to account for structural model issues, Table B1 shows that GCAM-Europe outputs for 2015 align reasonably well in terms of (fossil) CO2 emissions, final energy (FE) consumption, and renewables in FE use. Aggregates for EU-27 closely match FE and renewables reported by EUROSTAT, while country-specific estimates differ in some cases, especially in smaller countries. These country level mismatches are mostly related to structural accounting differences for energy transformation processes, such as (bio-)liquids refining and electricity production. For CO2 emissions, the EU-wide comparison shows a minor deviation of roughly 5 % due to the use of globally uniform CO2 emission factors for fossil fuels in GCAM-Europe. When using the model to develop scenarios that align with specific EU and/or member-state policy targets, it is therefore important to scale official targets to base year values in GCAM-Europe for a proper representation of future dynamics (Frilingou et al., 2026).
Beyond the regional disaggregation and data replacement, GCAM-Europe includes additional features compared to the core version, including the enhanced representation of electricity grids and regional trade, as well as demand segments, which allows to have more sectoral detail in the power sector. In final energy demand, predominantly in building energy demand, new demand categories are included as well as new technologies like heat pumps. Although limited data availability at the global scale constrains the level of sectoral detail in the core model, particularly in areas such as buildings, greater regional data availability allows for more granular sectoral representation in regional model versions like GCAM-Europe and GCAM-USA.
With its higher regional disaggregation (from 32 to 66 regions) and the additional layers of complexity (e.g., electricity grid regions or expanded household technologies), GCAM-Europe requires substantially more input data for setup and a larger number of markets and equations to solve at each time step. This added complexity makes the model considerably more memory intensive: it consumes roughly 50 % more RAM than the core version and increases system-wide committed memory. As a result, GCAM-Europe requires the page file, which reduces CPU efficiency and slows computation. In practice, a full simulation run (e.g., the Reference scenario to 2100) takes about three times longer to complete. To run GCAM-Europe efficiently, systems with at least 128 GB of RAM and high memory bandwidth are advisable, together with SSD (NVMe) storage to reduce paging overhead, since memory capacity and bandwidth remain the critical constraints.
2.1 Power system
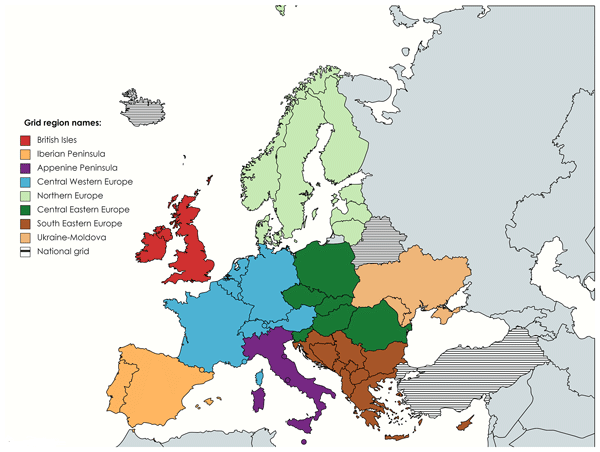
The electricity system in GCAM-Europe is modelled as an interconnected system structured around grid regions, load segments, and inter-segment storage. Like in other regional GCAM versions (e.g., GCAM-USA), the electricity system in GCAM-Europe is subdivided into several “grid-regions”, in which all electricity supply and demand can flow unrestricted, while electricity trade between grid-regions is relatively more constrained. Figure 2 shows the grid region structure for GCAM-Europe, which we have designed largely following the seven “wholesale regions” as defined in the quarterly European electricity market reports, and an additional region joining together the electricity grid of Moldova and Ukraine. This leaves 3 remaining European countries without being integrated in larger grid regions: Belarus, Iceland and Turkey. The electricity grids of these countries are represented as standalone grids without interconnection, as real-world interconnection with other European countries is inexistent (Iceland) or insignificant (Belarus and Turkey).
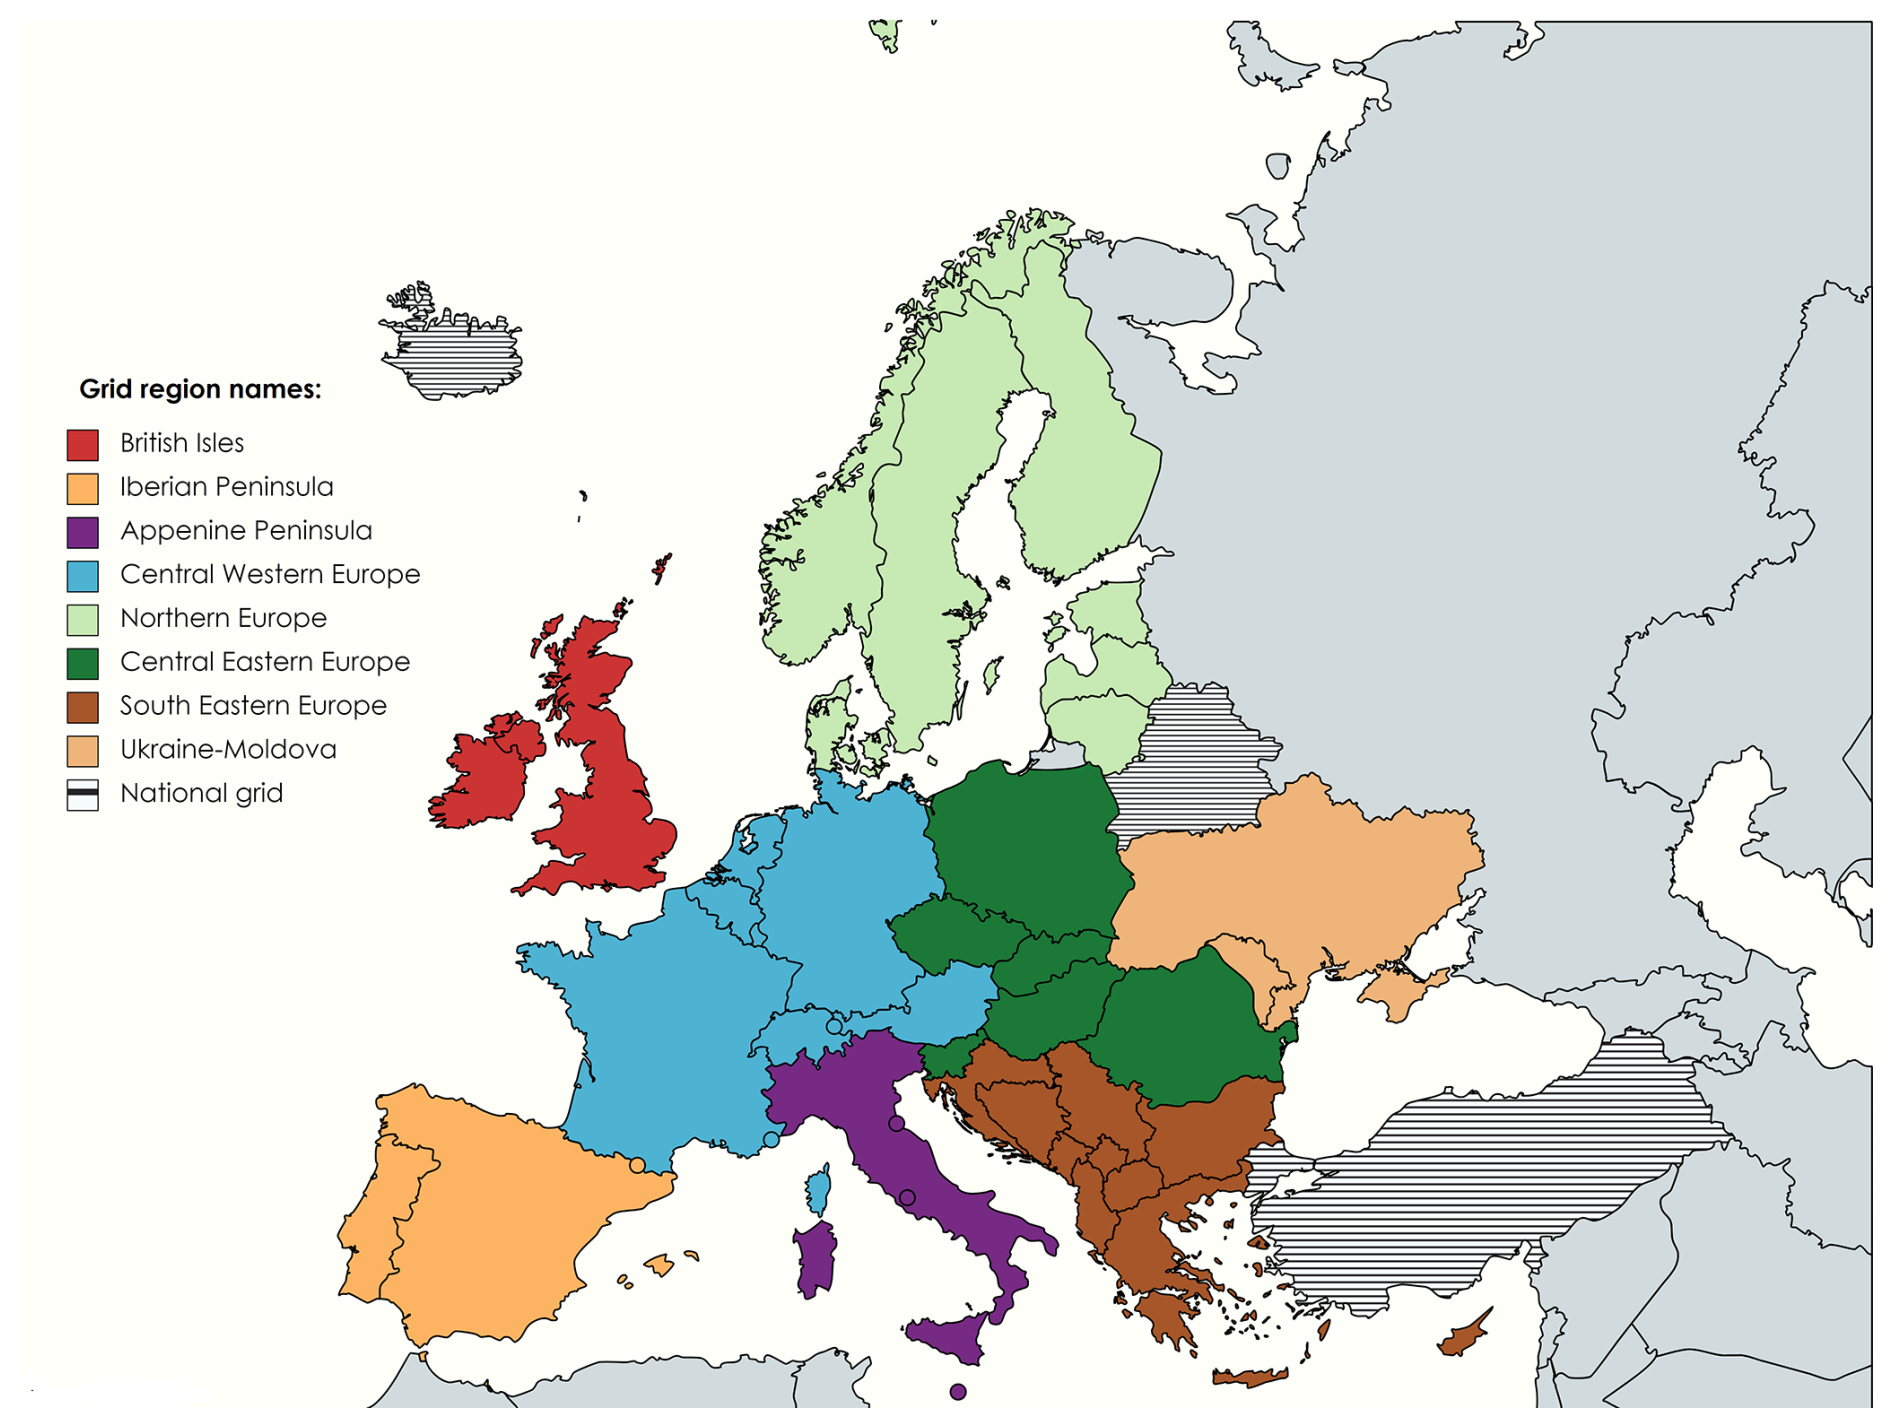
Figure 2Electricity grid regions GCAM-Europe.
The representation of the electricity system is based on the “National trends” scenario of the “Ten-Year Network Development Plans” (TYNDP) 2024 process by the European Network of Transmission System Operators for Electricity (ENTSO-E). This scenario serves as a reference for grid investment planning and electricity demand projections across Europe (ENTSOE, 2024). Load segmentation is derived using data from the openTEPES electricity model (Ramos et al., 2022), resulting in four distinct load segments: base load, intermediate, subpeak, and peak. This segmentation captures temporal variations in electricity demand and supply with greater accuracy and supports detailed analysis of storage technologies and their role in balancing the grid across time periods and regions. Each grid region and load segment operates its own electricity market, with prices typically lowest during off-peak periods and highest during peak demand. These price dynamics can incentivize investment in storage technologies, while regional price differences may encourage cross-border electricity trade.
2.2 Commodity trade structure
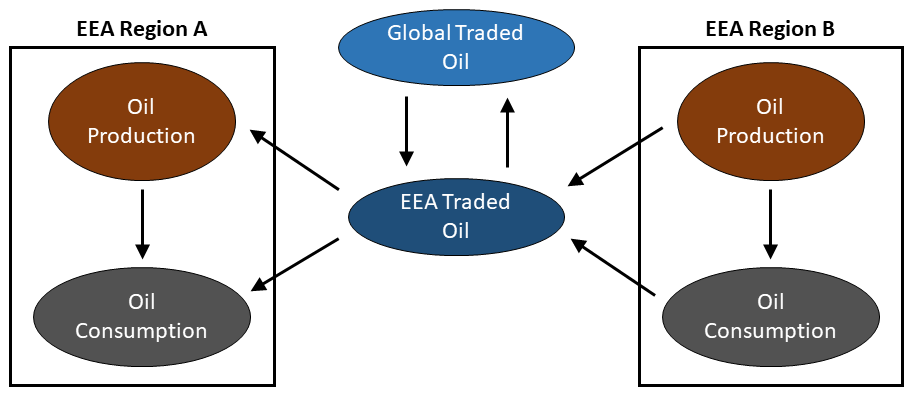
GCAM-Europe incorporates a trade structure that reflects the European Economic Area (EEA) and the internal free-trade market among EU member states, Norway, and Iceland (Fig. 3). By default, commodity trade in GCAM, including energy, food, and selected industrial commodities such as steel and ammonia, is governed by Armington trade specifications (Armington, 1969; Zhao et al., 2022), which define the substitutability between domestically produced and imported goods, both at the international level and within individual regions. Armington trade elasticities are commodity-specific and determined by literature (Hertel et al., 2007) and hindcasting experiments (Zhao et al., 2021). In GCAM-Europe, EEA countries are treated as a single trading block in relation to other GCAM regions in the international market, including the newly separated United Kingdom. Within the EEA, intra-regional trade is modelled with an additional layer of Armington specifications to capture trade flows among member countries. While international trade costs and Armington elasticities between the EEA block and non-EEA regions remain the same as in the default GCAM framework, trade within the EEA is assigned lower costs and friction (e.g. higher elasticities), reflecting reduced trade barriers within the internal markets. For those commodities where trade costs apply, a rule of thumb is applied, determining intra-EEA trade (e.g. between France and Germany) to cost rd of extra-EEA (e.g. between France and USA), reflecting closer distances and lower administrative costs. In terms of trade elasticity, intra-EEA crop trade is assumed to be frictionless, having EEA-wide crop commodity markets rather than national markets. Intra-EEA trade for other commodities (animal, energy and industrial commodities) is assumed to occur with very low friction (logit of −12). Given the dual role of international trade in either hindering mitigation through emission displacement (Peters and Hertwich, 2008) or enabling it when trade measures effectively support collective climate action (Farrokhi and Lashkaripour, 2025; Jakob, 2021), this enhanced structure offers an improved trade realism that facilitates the representation of shared trade policies across the EU and EEA, such as the Carbon Border Adjustment Mechanism (CBAM), enabling more nuanced and policy-relevant modelling in future analyses.
2.3 Sectoral and technological coverage in the buildings sector
Leveraging the richer and more detailed data available for European countries, the model has been expanded across multiple dimensions with a particular emphasis on building energy demand. The core GCAM version disaggregates residential energy consumption into cooling, heating and non-thermal (e.g., appliances) services. In GCAM-Europe, following the categorization in Eurostat (Eurostat, 2025b), we introduce new demand categories, namely hot water, cooking, and various household appliances, enabling more accurate and granular modelling of household energy consumption patterns. In addition, GCAM-Europe includes a detailed representation of heat pump technologies, which are not explicitly modelled in the core version of GCAM. The model distinguishes between several types of systems: air-source heat pumps that extract energy from the outside air (“air-air”), water-source heat pumps that extracts heat from the outside air and transfers it to a water-based heating system (“air-water”), and ground-source heat pumps that draw energy from the ground (“geo-water”). GCAM-Europe also incorporates solar thermal technologies for both space and water heating, providing a more comprehensive view of low-carbon heating solutions.
In terms of household structure, GCAM-Europe includes consumer heterogeneity in the residential energy sector in the form of income deciles, which is aligned with the current structure in the core version of the model. To implement the multiple consumer groups, we adopt the core GCAM approach by applying the corresponding demand functions, calibrated to average income data, to estimate consumption levels for each income decile within a region. Because the aggregation of decile-level estimates does not necessarily match with the observed national (or regional) consumption, a bias-correction term is introduced, defined as the difference between the estimated aggregate and the observed value. The details of this implementation in core GCAM are documented in Sampedro et al. (2024). As a next step, we plan to enhance this representation by integrating empirical data from national Household Budget Surveys (HBS) (Eurostat, 2025c), which are available for all EU member states (see Discussion). Despite these advancements, the current representation cannot capture all relevant dynamics. Key drivers like insulation levels and natural ventilation are omitted, and behavioural or urban policies, such as energy-saving awareness campaigns, cannot be explicitly modelled. Linking with more detailed building-specific tools would enable the analysis of such comprehensive policies (Burleyson et al., 2020).
3.1 Socioeconomics
The socioeconomic projections in GCAM-Europe are aligned with the moderate demographic and economic growth defined in the SSP2 narrative (O'Neill et al., 2014), which is the same assumption in the baseline scenario of the core version of the model (“GCAM-Core-v7p2”). However, the population trajectories for different countries in GCAM-Europe have been updated using EU-specific information from the EU Ageing Report 2024 (European Commission, 2024). This results in higher population projections at European level, compared to the core. Figure 4 shows that European population peaks and start declining at the middle of the century. However, in the core model, population accounts for 685M and 632M people in 2050 and 2100, respectively, while these values represent 696M and 649M in the GCAM-Europe baseline. In terms of GDP, GCAM-Europe does not include any update, and the projections are completely aligned with the moderate economic growth in the core model (Fig. S1 in the Supplement). In principle, it is possible to adapt socioeconomic assumptions to other SSPs. However, the EU Ageing Report 2024 provides only one baseline demographic projection that is generally more consistent with SSP2, and not a range of alternative scenarios like the SSPs. Opting for different SSP socio-economic assumptions, might entail avoiding the adaptation to EU-specific data, and reverting to the native SSP population data at the national level. Additionally, fully harmonising a model to different SSP storylines would require not just adapting socio-economic but also techno-economic assumptions and scenario drivers both at the global level (core) and the EU part.
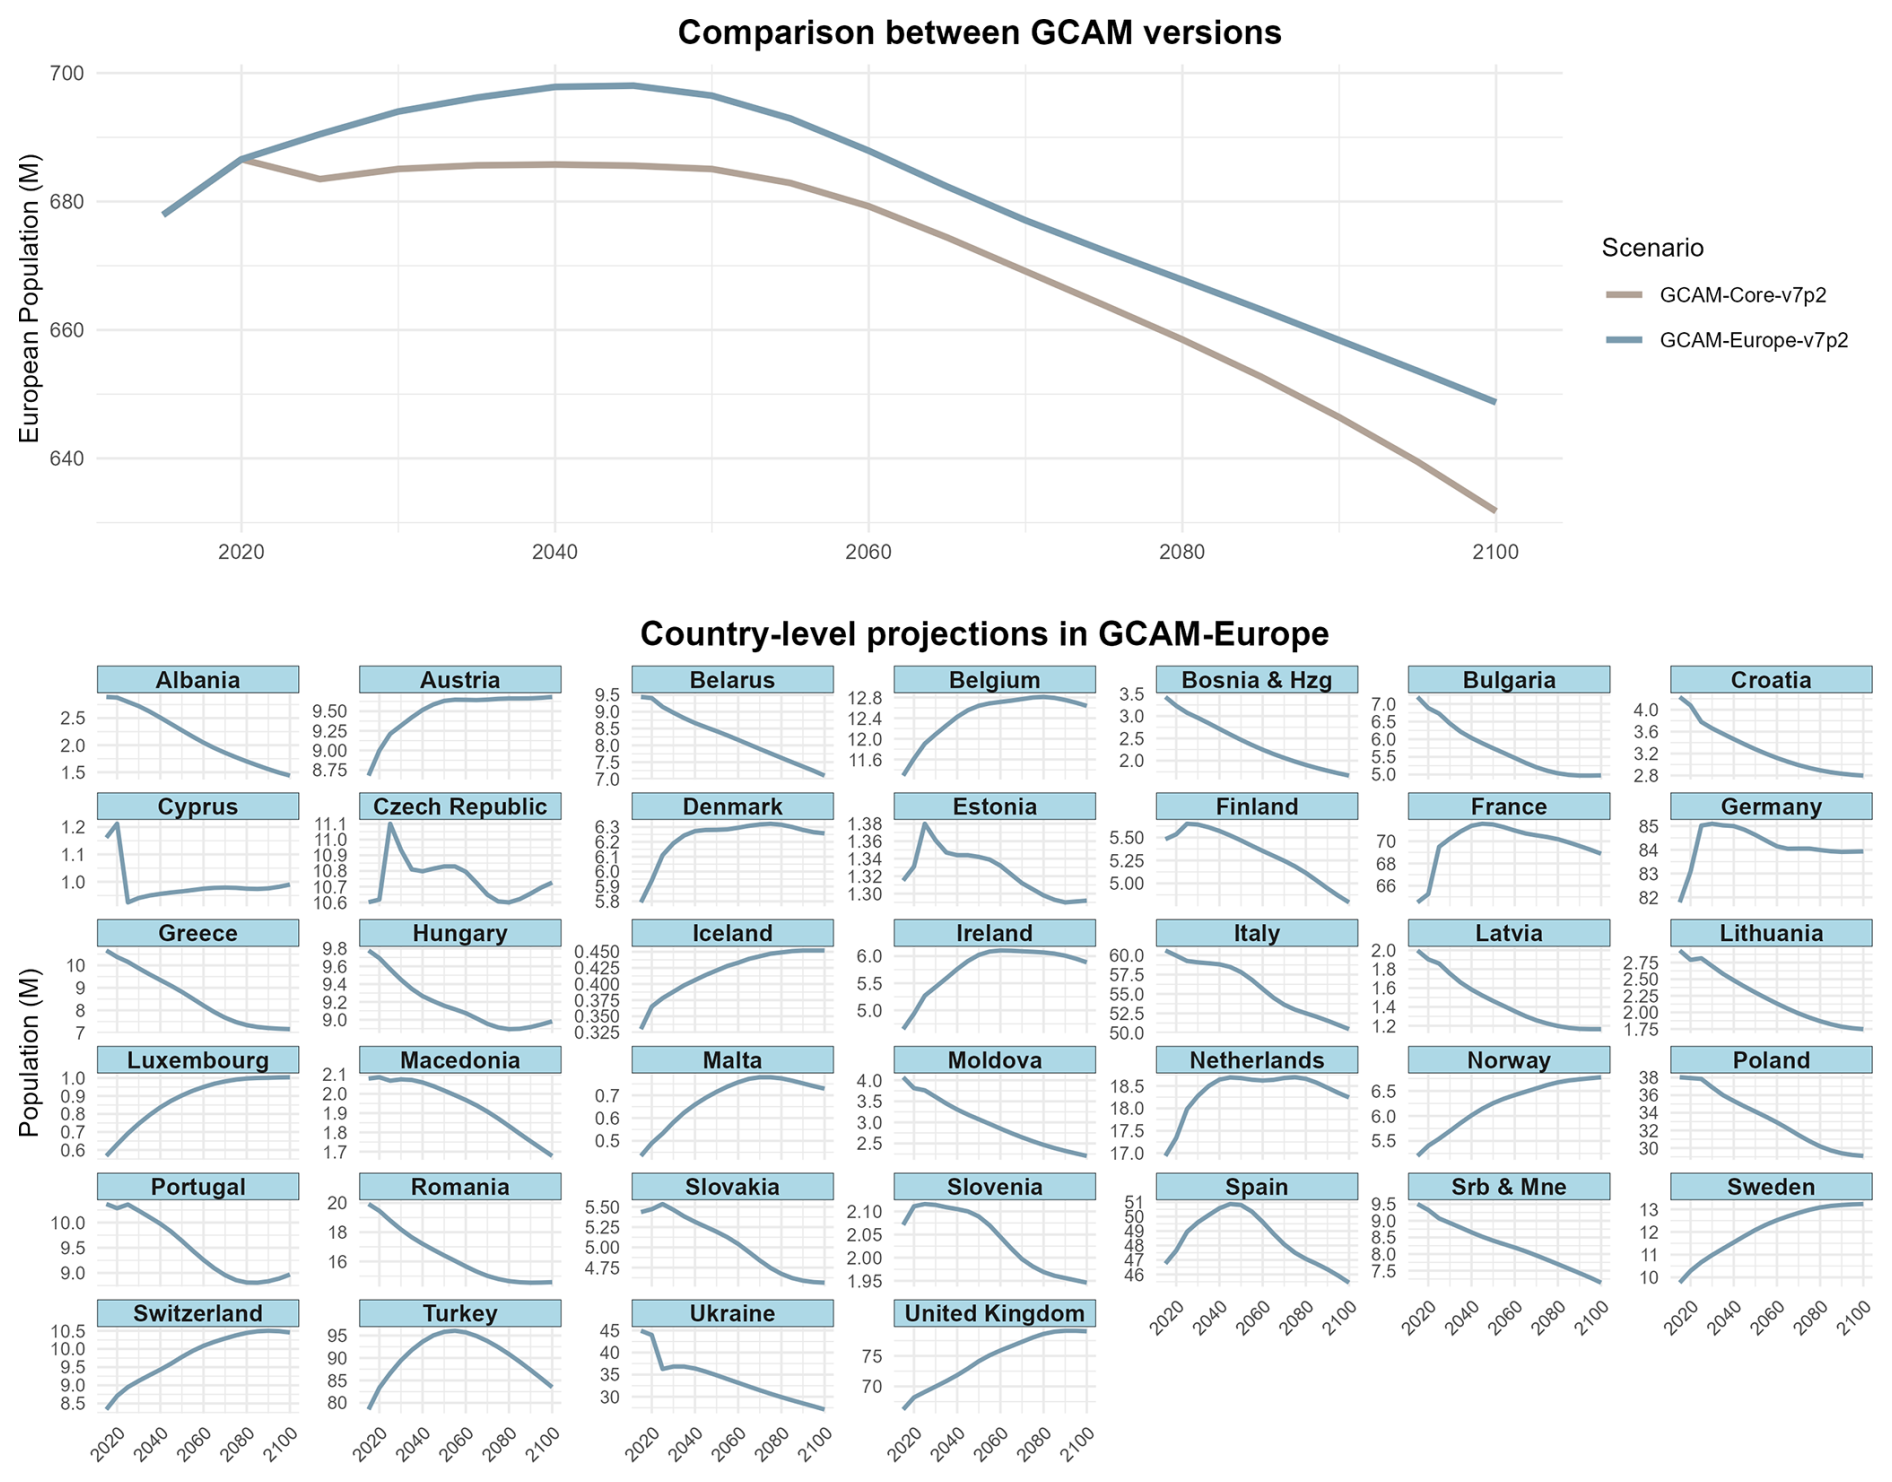
Figure 4Population by period, region, and scenario (Million). Panel (A) compares population projections between the GCAM-Europe and the core baseline scenarios. Panel (B) shows population by European country in the GCAM-Europe baseline.
3.2 Energy
In the GCAM-Europe baseline scenario, energy consumption gradually increases over time, peaking in the last quarter of the century, in line with socioeconomic trends and influenced by the adoption of more efficient technologies across end-use sectors. Primary energy consumption in Europe increases from 77 EJ in 2015 to 90 EJ in 2070, and then slightly declines to 87 EJ by the end of the century. Total final energy consumption shows a similar trend, increasing from 65 EJ in 2015 to 69 EJ in 2070, and then decreasing to 67 EJ by 2100. These trends in both primary and final energy consumption are consistent with the projections in the core version of the model. However, the implementation of new features, such as the grid regions and load segments in the power system, as well as the highly-efficient heat pump technologies implies that the values in the GCAM-Europe baseline are lower than in the core GCAM model (Fig. 5). In the core version, primary energy in Europe increases to 100 EJ in 2070 and declines to 97 EJ in 2100. Likewise, final energy achieves around 77 and 75 EJ in 2050 and 2100 respectively, which are higher than the values in the GCAM-Europe baseline.
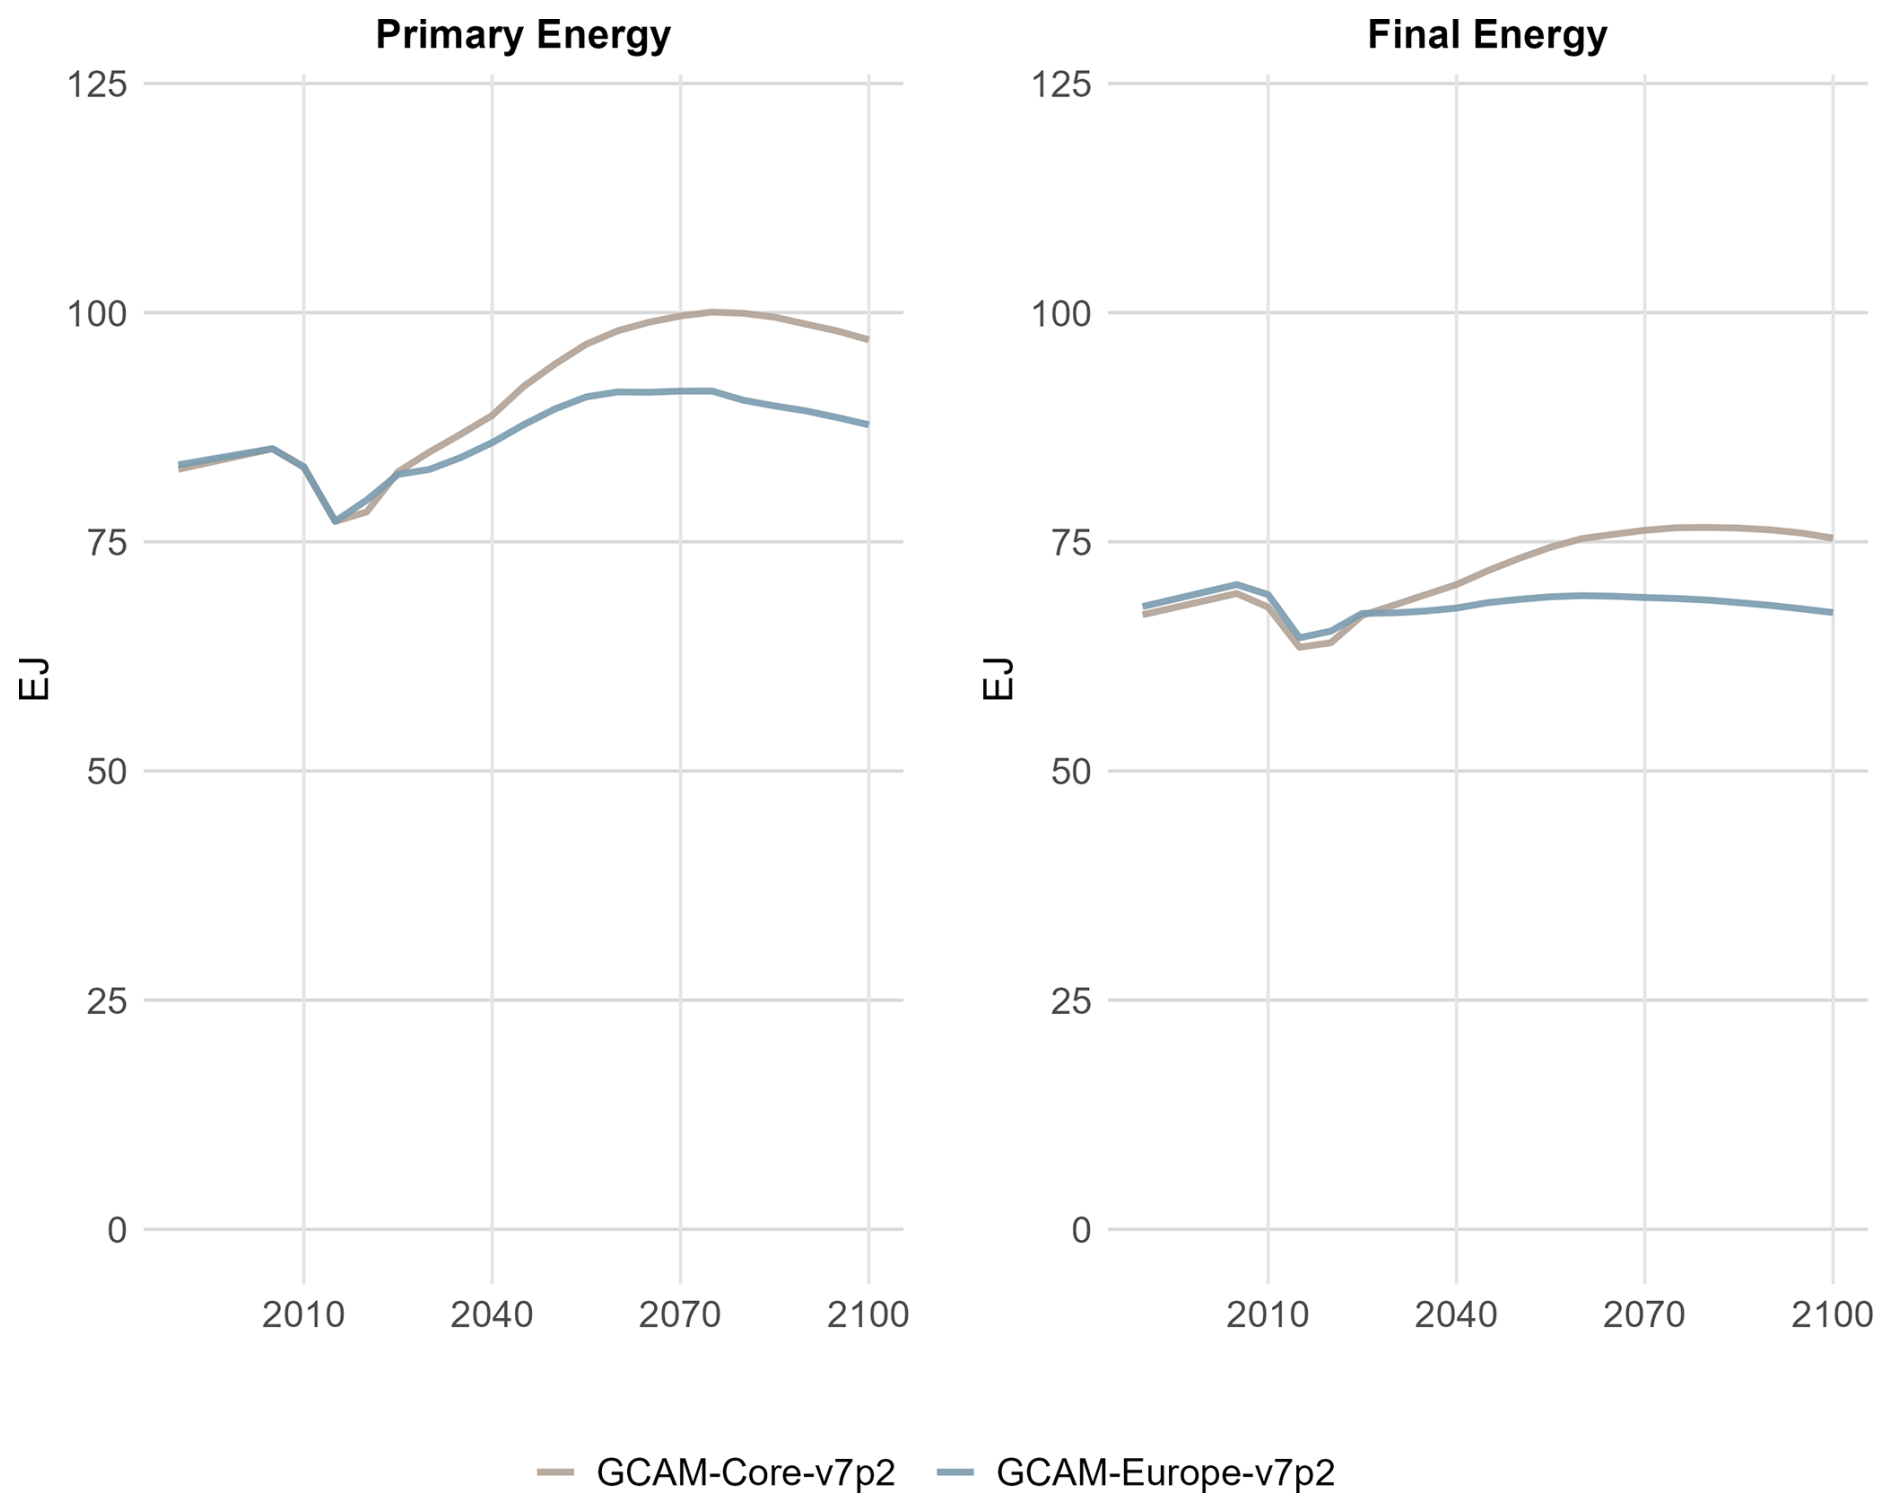
Figure 5Primary energy (left) and final energy (right) in Europe by period and scenario (EJ).
Fossil fuels are the main source of primary energy during the entire time horizon in the GCAM-Europe baseline scenario. However, the share of renewable energy gradually increases as technological advancements reduce costs and therefore increase their competitiveness. In 2015, fossil fuels represent around 80 % of total primary energy at European level and by 2050 this share is reduced to around 70 %. This share is similar to the value observed in the core GCAM version. However, there are some differences across fuels. In GCAM-Europe there is a higher penetration of biomass technologies, reaching about 13 EJ in 2050 and comprising 15 % of the primary energy mix. This value is smaller in GCAM core, as in the same period biomass consumption accounts for 11 EJ (12 % of the mix). Contrarily, the baseline scenario in GCAM-Europe shows a more pessimistic penetration of wind energy. In 2050, wind power achieves 1.8 EJ, representing around 2 % of the primary energy mix. In the core model, these values rise to 4.5 EJ and 4 %, respectively. A comparison of primary energy across scenarios in 2050 is presented in Fig. 6.
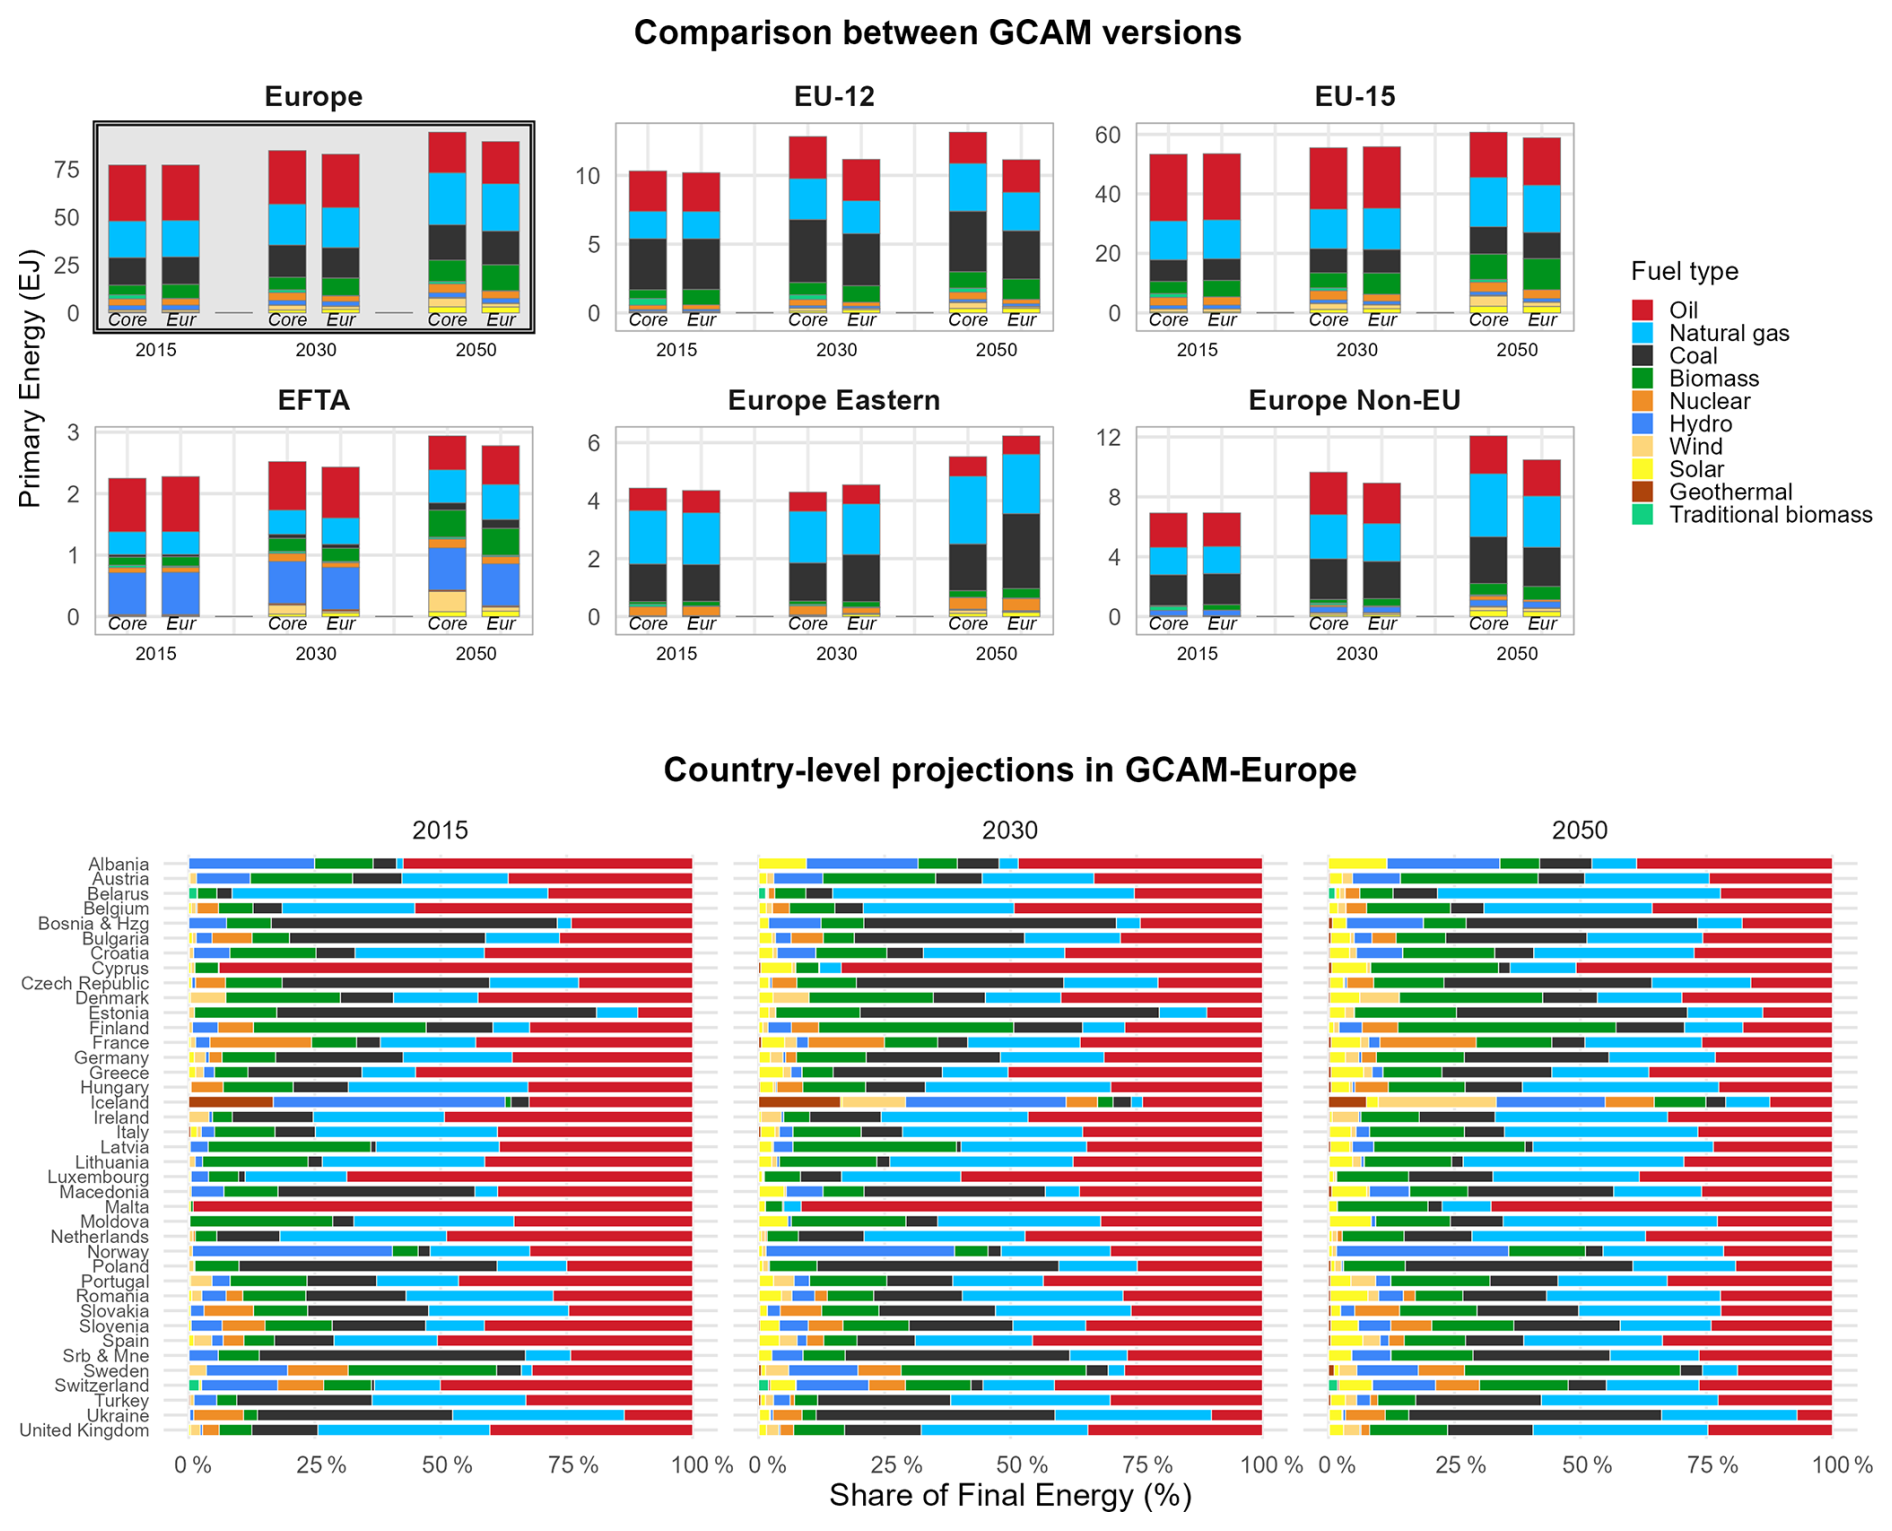
Figure 6Primary energy consumption by scenario, region, period, and fuel (EJ). The top panel shows total primary energy for the European continent and the five core European regions (EJ). The bottom panel shows the share of different fuels in each country's primary energy mix (%) in the GCAM-Europe baseline by period. Total primary energy by European country is shown in Fig. S2 the Supplement.
Total final energy shows similar trends and differences across scenarios and fuels (Fig. S3). Focusing on final energy by sector, industry is projected to be the most energy-intensive sector during the analysed time horizon. Industrial energy demand increases from 24 EJ in 2015 to 27 EJ by 2030 and 31 EJ by 2050, driven by growing industrial activity associated with the projected population growth and economic expansion. In contrast, energy demand in the transportation sector remains nearly constant through 2050 at approximately 19 EJ. Although demand for freight transportation services increases over time, the resulting growth in energy consumption is offset by a transition to more energy-efficient transport modes (e.g., high-speed rail) and improvements in vehicle efficiency. Likewise, the building sector presents a decrease over time in energy consumption from 21 EJ in 2015 to 19 EJ in 2050. This is largely due to most European households approaching energy satiation levels, meaning that rising incomes no longer lead to increased demand for thermal services such as heating and cooling. As residential demand for energy services stabilizes, the growing adoption of efficient heat pump technologies (Fig. S4), which become increasingly competitive in the near future, directly contributes to the overall decline in energy use within the sector. There are some differences when comparing these trends with the GCAM core baseline scenario (Fig. 7). Energy demand in the transportation sector is slightly higher in the GCAM-Europe baseline, whereas demand in both the industrial and building sectors is higher in the core scenario. The disparity is especially pronounced in the building sector, considering that the core version does not explicitly model the highly efficient heat pump technologies.
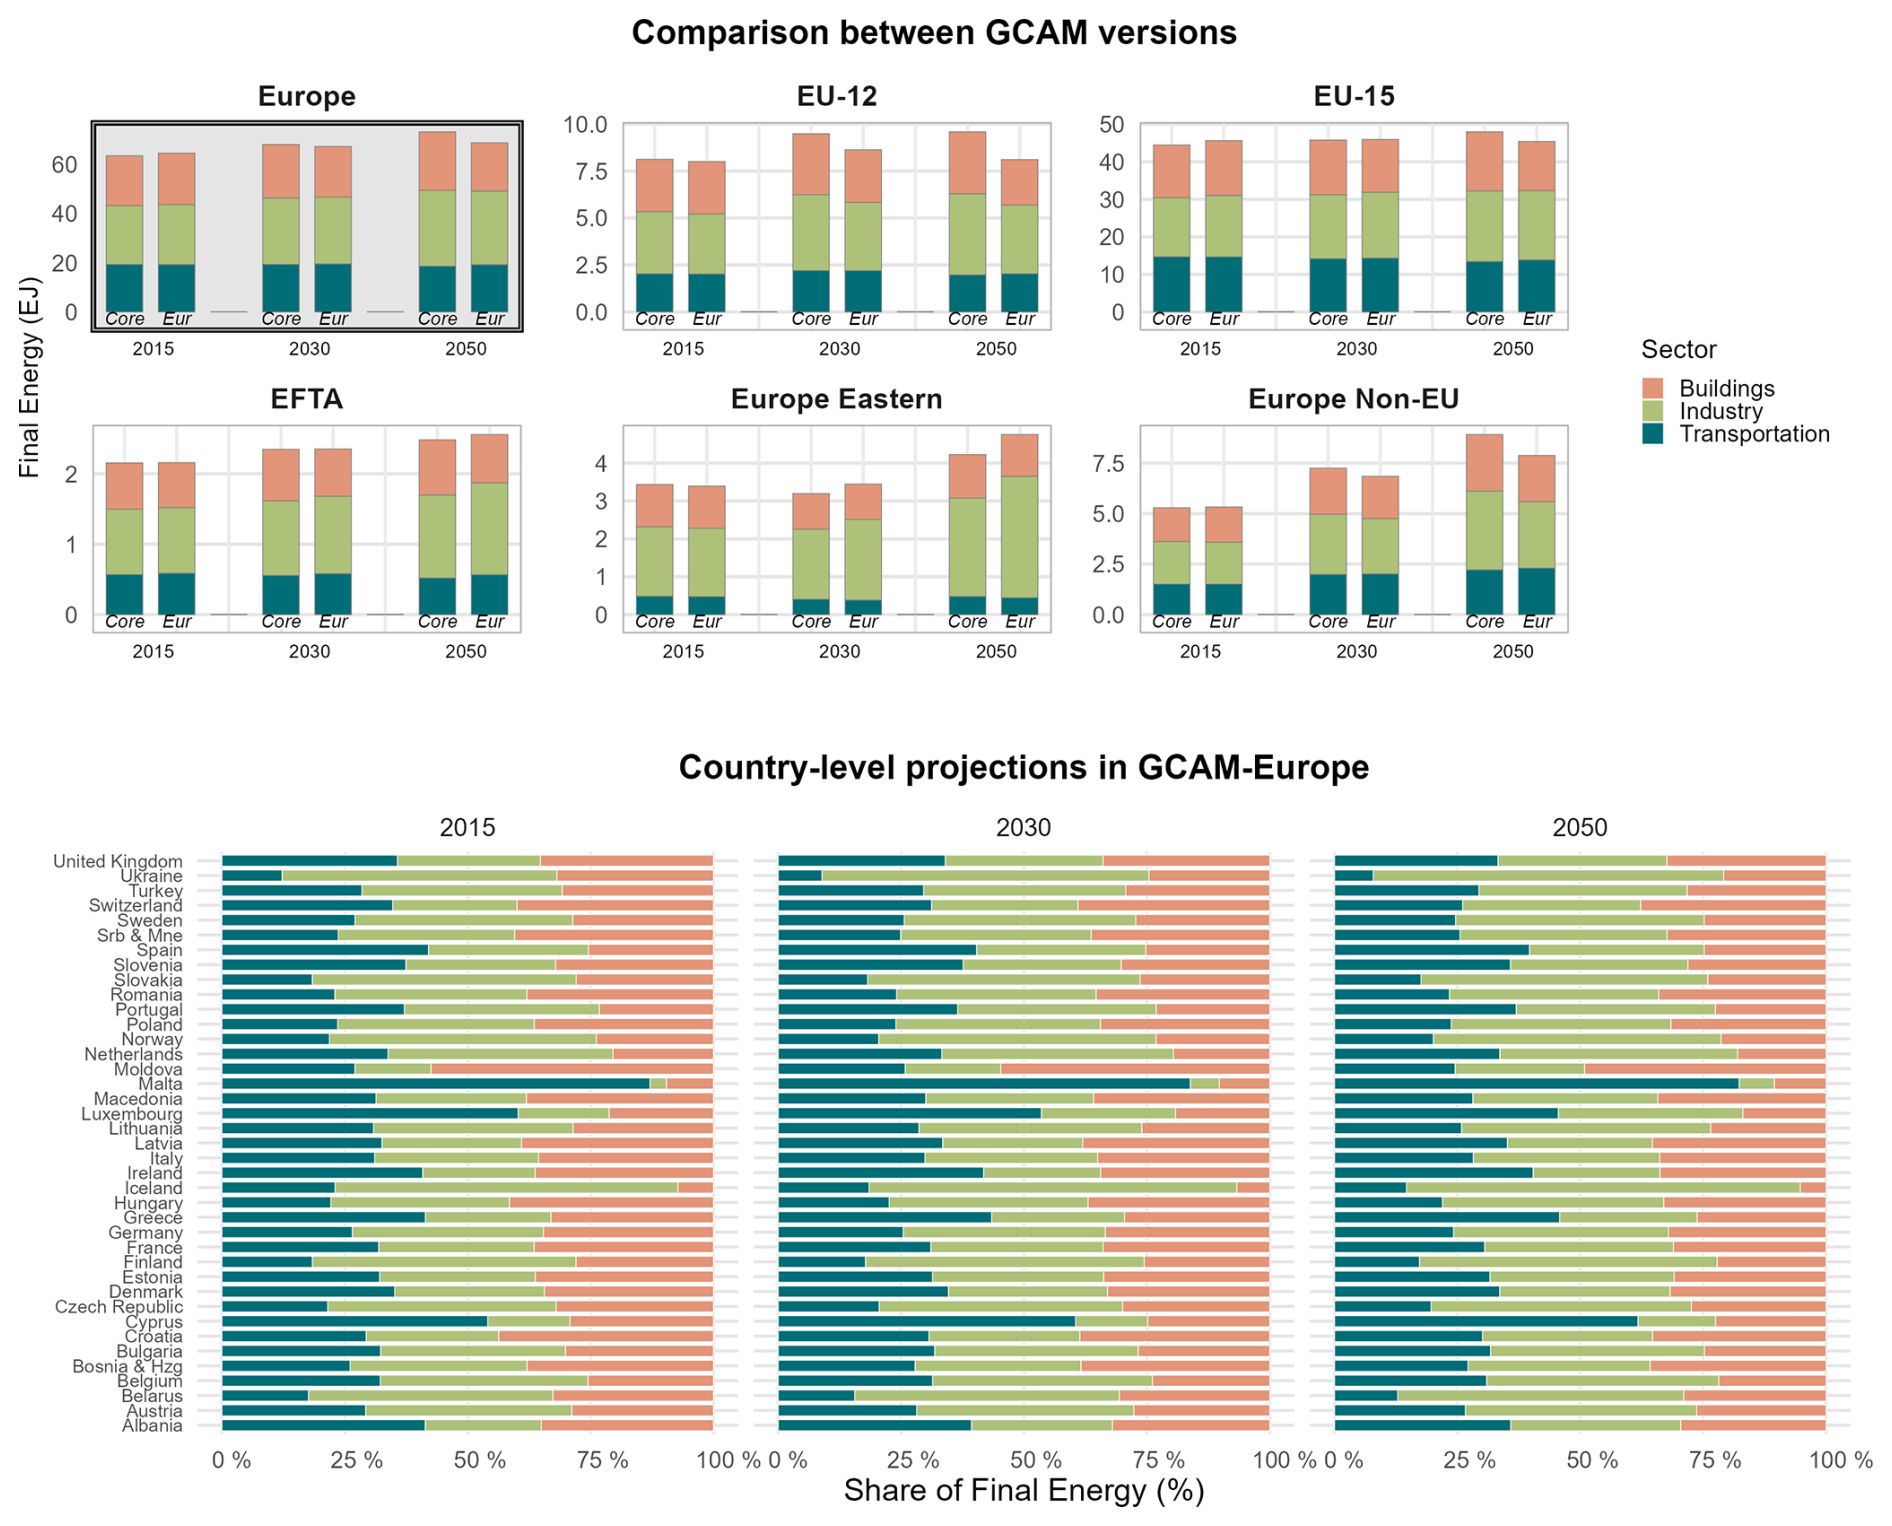
Figure 7Final energy consumption by scenario region, period, and fuel (EJ). The top panel shows total final energy for the European continent and for the five core European regions (EJ) by period. The bottom panel shows the weight of different sectors in each country's final energy consumption (%) in the GCAM-Europe baseline scenario by period. Total final energy by European country is shown in the Supplement Fig. S5.
Focusing on the power sector, electricity production in the GCAM-Europe baseline scenario shows a steady increase during the analysed time horizon. Total generation accounts for approximately 14 EJ in 2015, consistent with the 14.7 EJ reported by the IEA, and is projected to rise to around 24 EJ by 2050. However, this growth is slightly smaller than the one in the core baseline, which accounts for 25 EJ of electricity generation in 2050, and achieving 29 EJ by 2100 (Fig. S6). The notable differences between the core and GCAM-Europe are driven by variations in total final energy demand, as well as differences in the representation of the power system. As a result, the two model versions show divergent shares of electricity in total final energy demand (Fig. S7). In 2015, this share was approximately 20 % in Europe, consistent with the 21.7 % reported by the IEA (IEA, 2017). However, the lower growth in electricity generation in GCAM-Europe leads to a slightly lower share by 2050 compared to the core model, at 28 % versus 30 %, respectively. This pattern is observed across all European regions in the core GCAM model. Similarly, sectoral electrification levels align well with historical data: in 2015, electricity represents 33 % of final energy use in buildings, 22 % in industry, and less than 5 % in transport (Fig. S8). Both model versions project gradual increases in electrification across these sectors over time, following comparable trajectories. The share of fossil fuel in total electricity generation is almost similar in the two model versions. We see that in the two scenarios coal and gas still represent around 20 % and 15 % of the European electricity mix by 2050. However, notable differences emerge between GCAM-Europe and the core model version in the deployment of renewable energy sources within the electricity sector, largely driven by the load segments, inter-segment storage, and grid regions included in GCAM-Europe. For example, grid storage represents around 6 % of the electricity mix by 2050 in the GCAM-Europe baseline, which is not represented in the core. Likewise, there are large differences in wind power generation. In 2015, wind generation in both GCAM-Europe and the core model amounts to 1.15 EJ, consistent with the value reported by the IEA. However, while it represents around 18 % of the total electricity mix in 2050 in the core, this share decreases to 7 % in the GCAM-Europe baseline. The share of total solar power is also similar across scenarios, but there are some technological differences. In GCAM-Europe there is a higher penetration of distributed rooftop photovoltaics, while centralised photovoltaics power sources are the main solar energy source in the core. Nuclear energy follows a broadly similar trajectory in both scenarios. In 2015, generation amounts to 3.5 EJ, consistent with the IEA data, and it is projected to supply roughly 18 % of Europe's electricity mix by 2050 in both model versions.
There are also large differences across European regions, with different countries showing completely different electricity mixes, depending on their access to alternative energy sources (Fig. 8). By 2050, some regions are projected to rely almost entirely on renewable energy (e.g., Switzerland). In contrast, fossil fuels are expected to continue playing a major role in other countries, particularly in Eastern Europe (e.g., Bosnia). We also observe notable differences across electricity system segments, with intermittent technologies playing an increasingly important role in baseload generation, while fossil fuels remain dominant during peak and sub-peak demand periods.
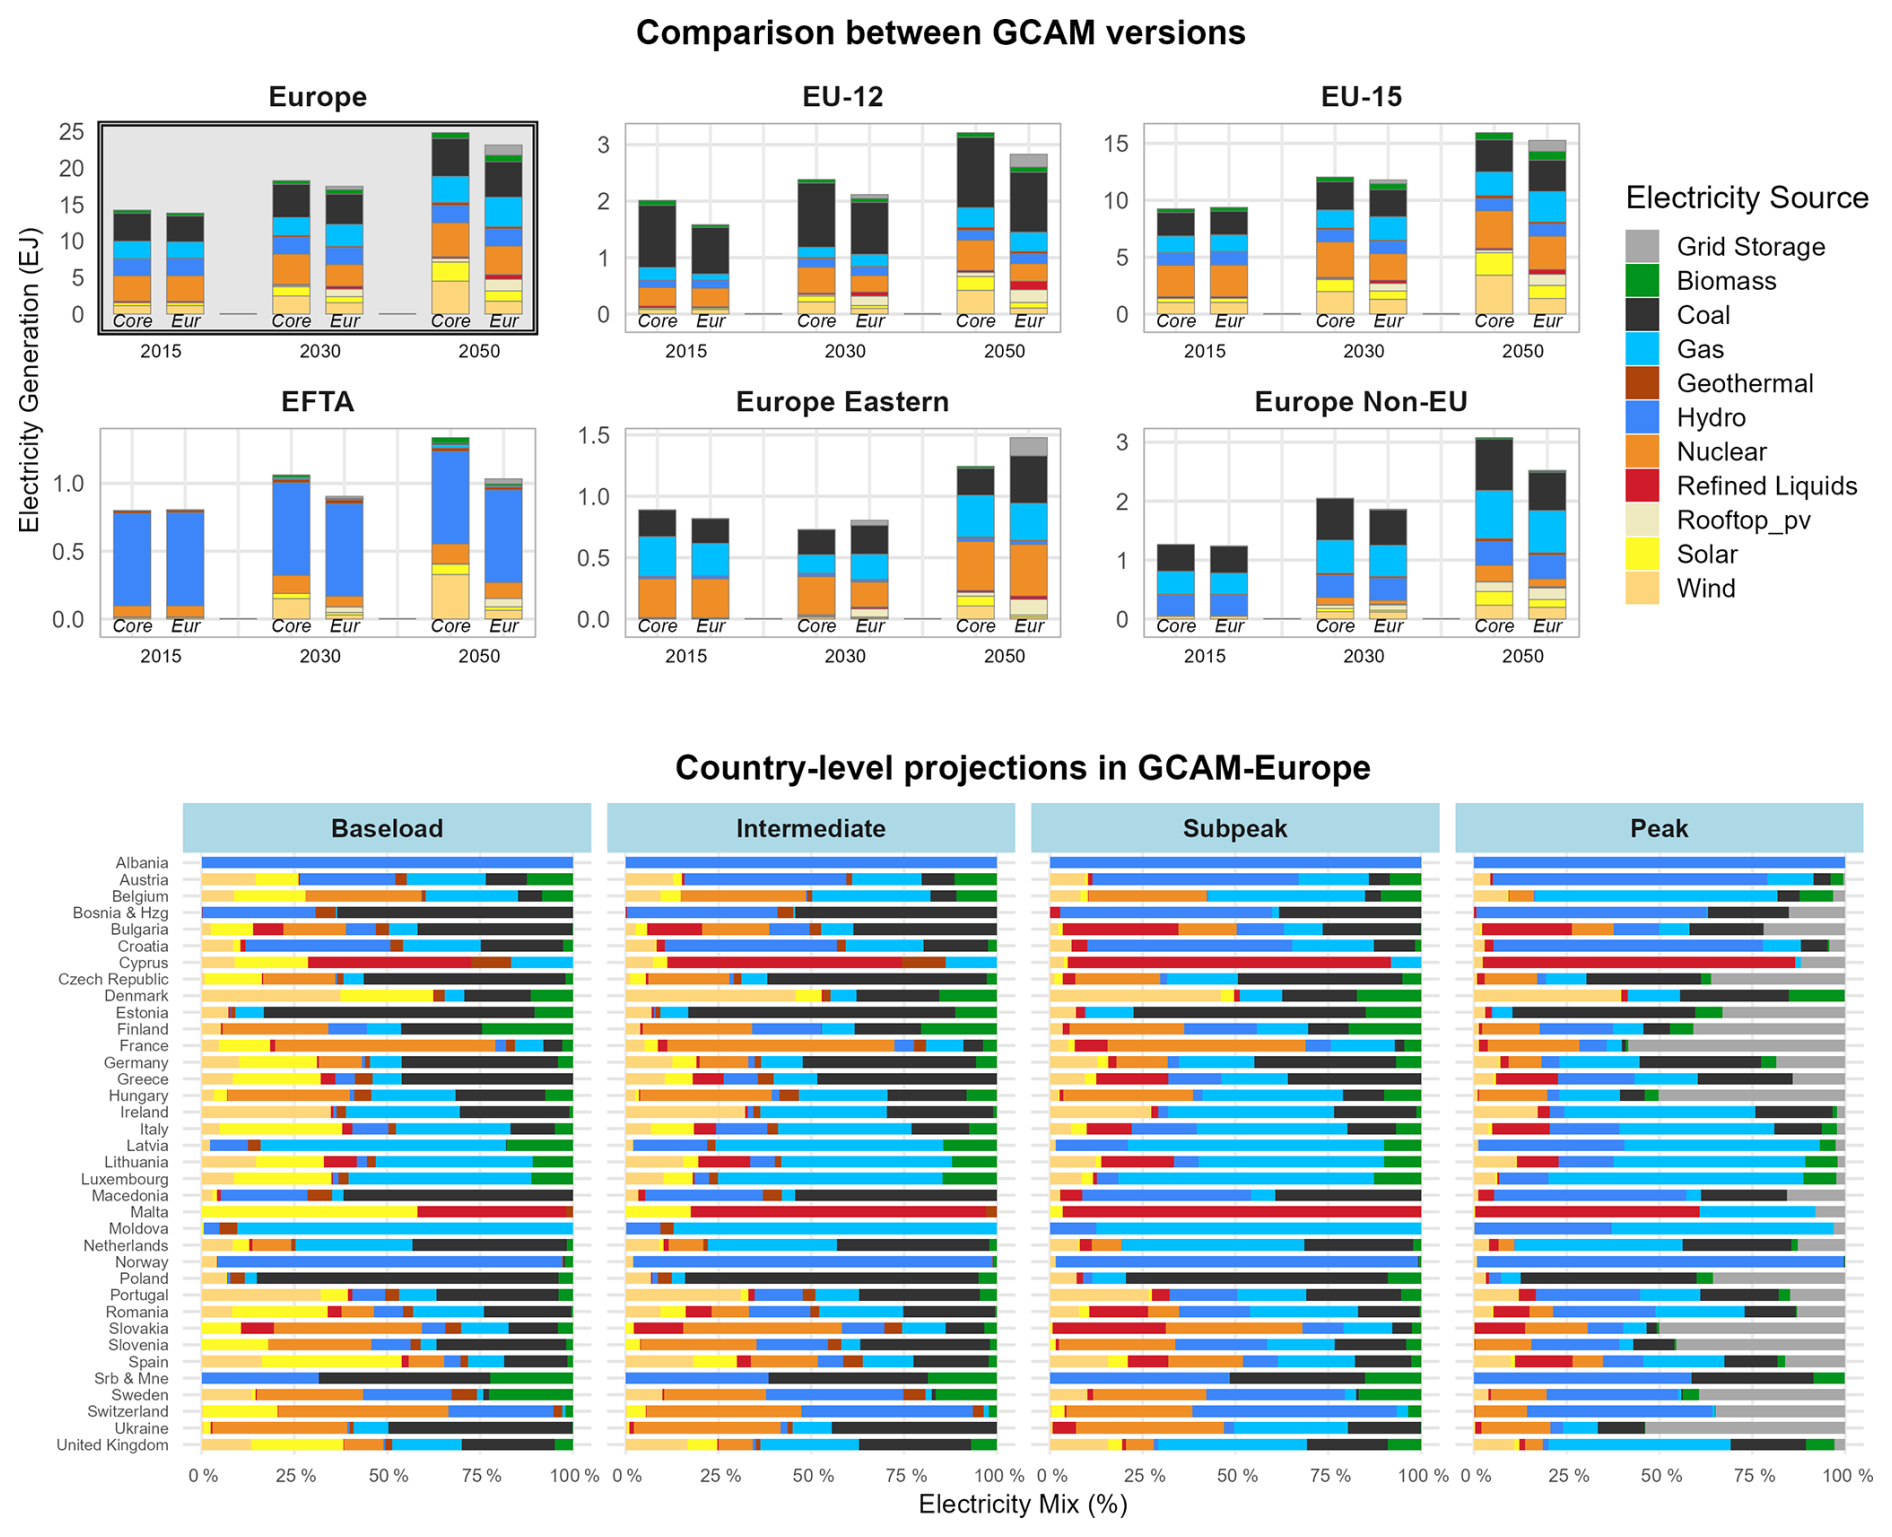
Figure 8Electricity generation by scenario region, period and source (EJ). The top panel shows the total electricity mix for the European continent and the five core European regions (EJ) by period. The bottom panel shows the weight of different sources in each country's final electricity mix (%) in the GCAM-Europe baseline in 2050. 2015 and 2030 are presented in the Supplement (Fig. S9). Total electricity generation by European country is shown in Fig. S10. Belarus, Iceland and Turkey are not included as they are not connected to the European grid regions.
3.3 Land and water
The higher disaggregation and new features incorporated into GCAM-Europe have some direct and indirect impacts on the distribution of land compared to the core version of the model (Fig. 9). In GCAM, there are some land types that are exogenously defined and do not compete with other land types. These include the urban, tundra and “rock and dessert” categories, which are therefore identical in the two scenarios. Some natural land types, such as shrubs or grass, also show minor variations between GCAM-Europe and the core. The most significant differences are found in the distribution of pasturelands and forests. GCAM-Europe projects a larger share of grazed pastures, reaching up to 449 thousand km2 by 2050, which is substantially higher than the 319 thousand km2 projected by the core model. In contrast, the area of non-grazed (“other”) pastures is notably larger in the core version of the model, especially in the near term, with projections of 611 thousand km2 in 2030 compared to 499 thousand km2 in GCAM-Europe. A similar dynamic is observed in the distribution of forestland. The core model has more land allocated for managed forest, representing up to 1720 thousand km2 in 2050, higher than the 1420 thousand km2 in GCAM-Europe. However, the share of natural (unmanaged) forest is larger in the GCAM-Europe baseline. These differences are driven by the use of assumed yields in combination with observed national outputs of forest and animal products to define the relative share of managed pasture and forest relative to all pasture and forest (Zhao and Wise, 2023). Real-world deviations from the assumed yields can lead to under- or overestimation of “managed land”, and by aggregating many regions, such under or overestimations can persist throughout the whole region. Having separated all countries however, the estimated area of “managed land” on aggregate are likely more accurate, as the impact of potential yield deviations are limited to each individual country. Land distribution varies significantly across European countries. While cropland and forests represent the majority of land use in many regions, pasture is particularly prominent in some areas, such as the United Kingdom. In Scandinavian countries, such as Denmark, tundra and “rock and desert” areas also account for a notable portion of the total land area (Fig. 9).
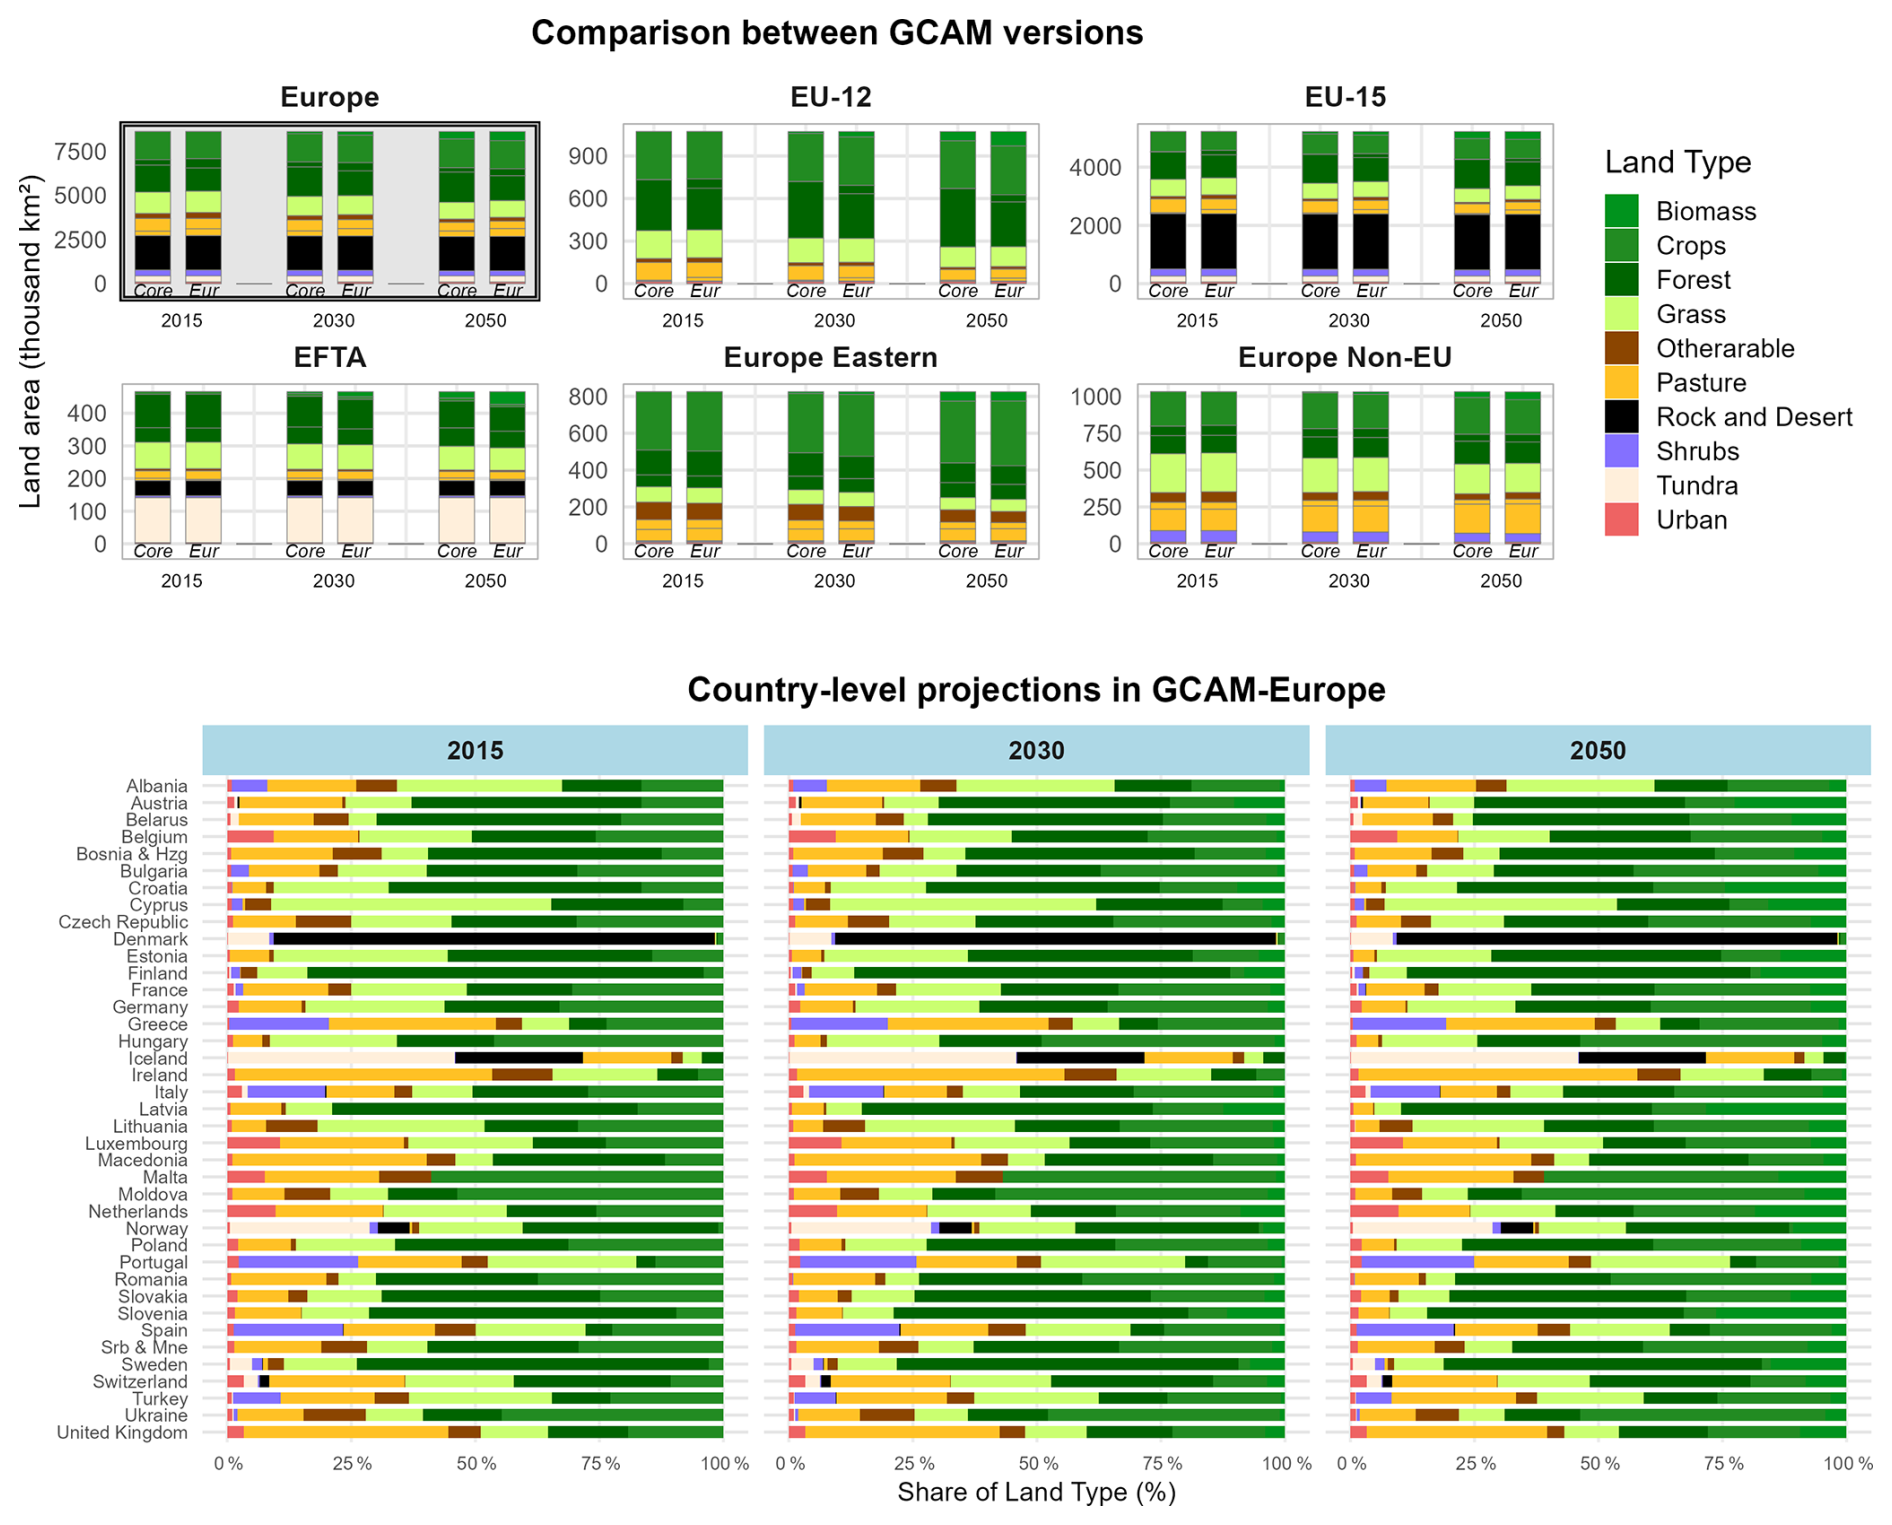
Figure 9Land allocation by scenario, region, period and type. The top panel shows the total land area by scenario, period, region and land type. The bottom panel shows the weight of different land types in each country for different time periods (%) in the GCAM-Europe baseline.
Total water withdrawals for the European continent in GCAM-Europe show a moderate and steady increase over time, rising from 330 km3 in 2020 to 380 km3 in 2085, followed by a slight decline to 365 km3 by 2100 (Fig. 10). The figure also shows how the projected differences in energy mix and land allocation between GCAM-Europe and the core model also result in changes to water systems, with GCAM-Europe showing a slightly higher water withdrawal volume by the end of the century. Water withdrawal levels vary across European countries, with some countries such as Germany, France, and Turkey recording notably higher volumes. While certain countries, like France, exhibit an upward trend in water withdrawals, the overall growth across most of Europe remains relatively moderate. In fact, some countries, such as Poland, show a decline in their water withdrawal volumes over time. On top of water withdrawal projections presented in Fig. 10, the current structure of GCAM-Europe enables analysing multiple aspects of water-energy interactions, such as inter alia water implications of CO2 emission reductions (e.g., increased water use from shift to low-carbon technologies), and co-benefits from energy–carbon–water nexus policies (Li et al., 2020; Srinivasan et al., 2018).
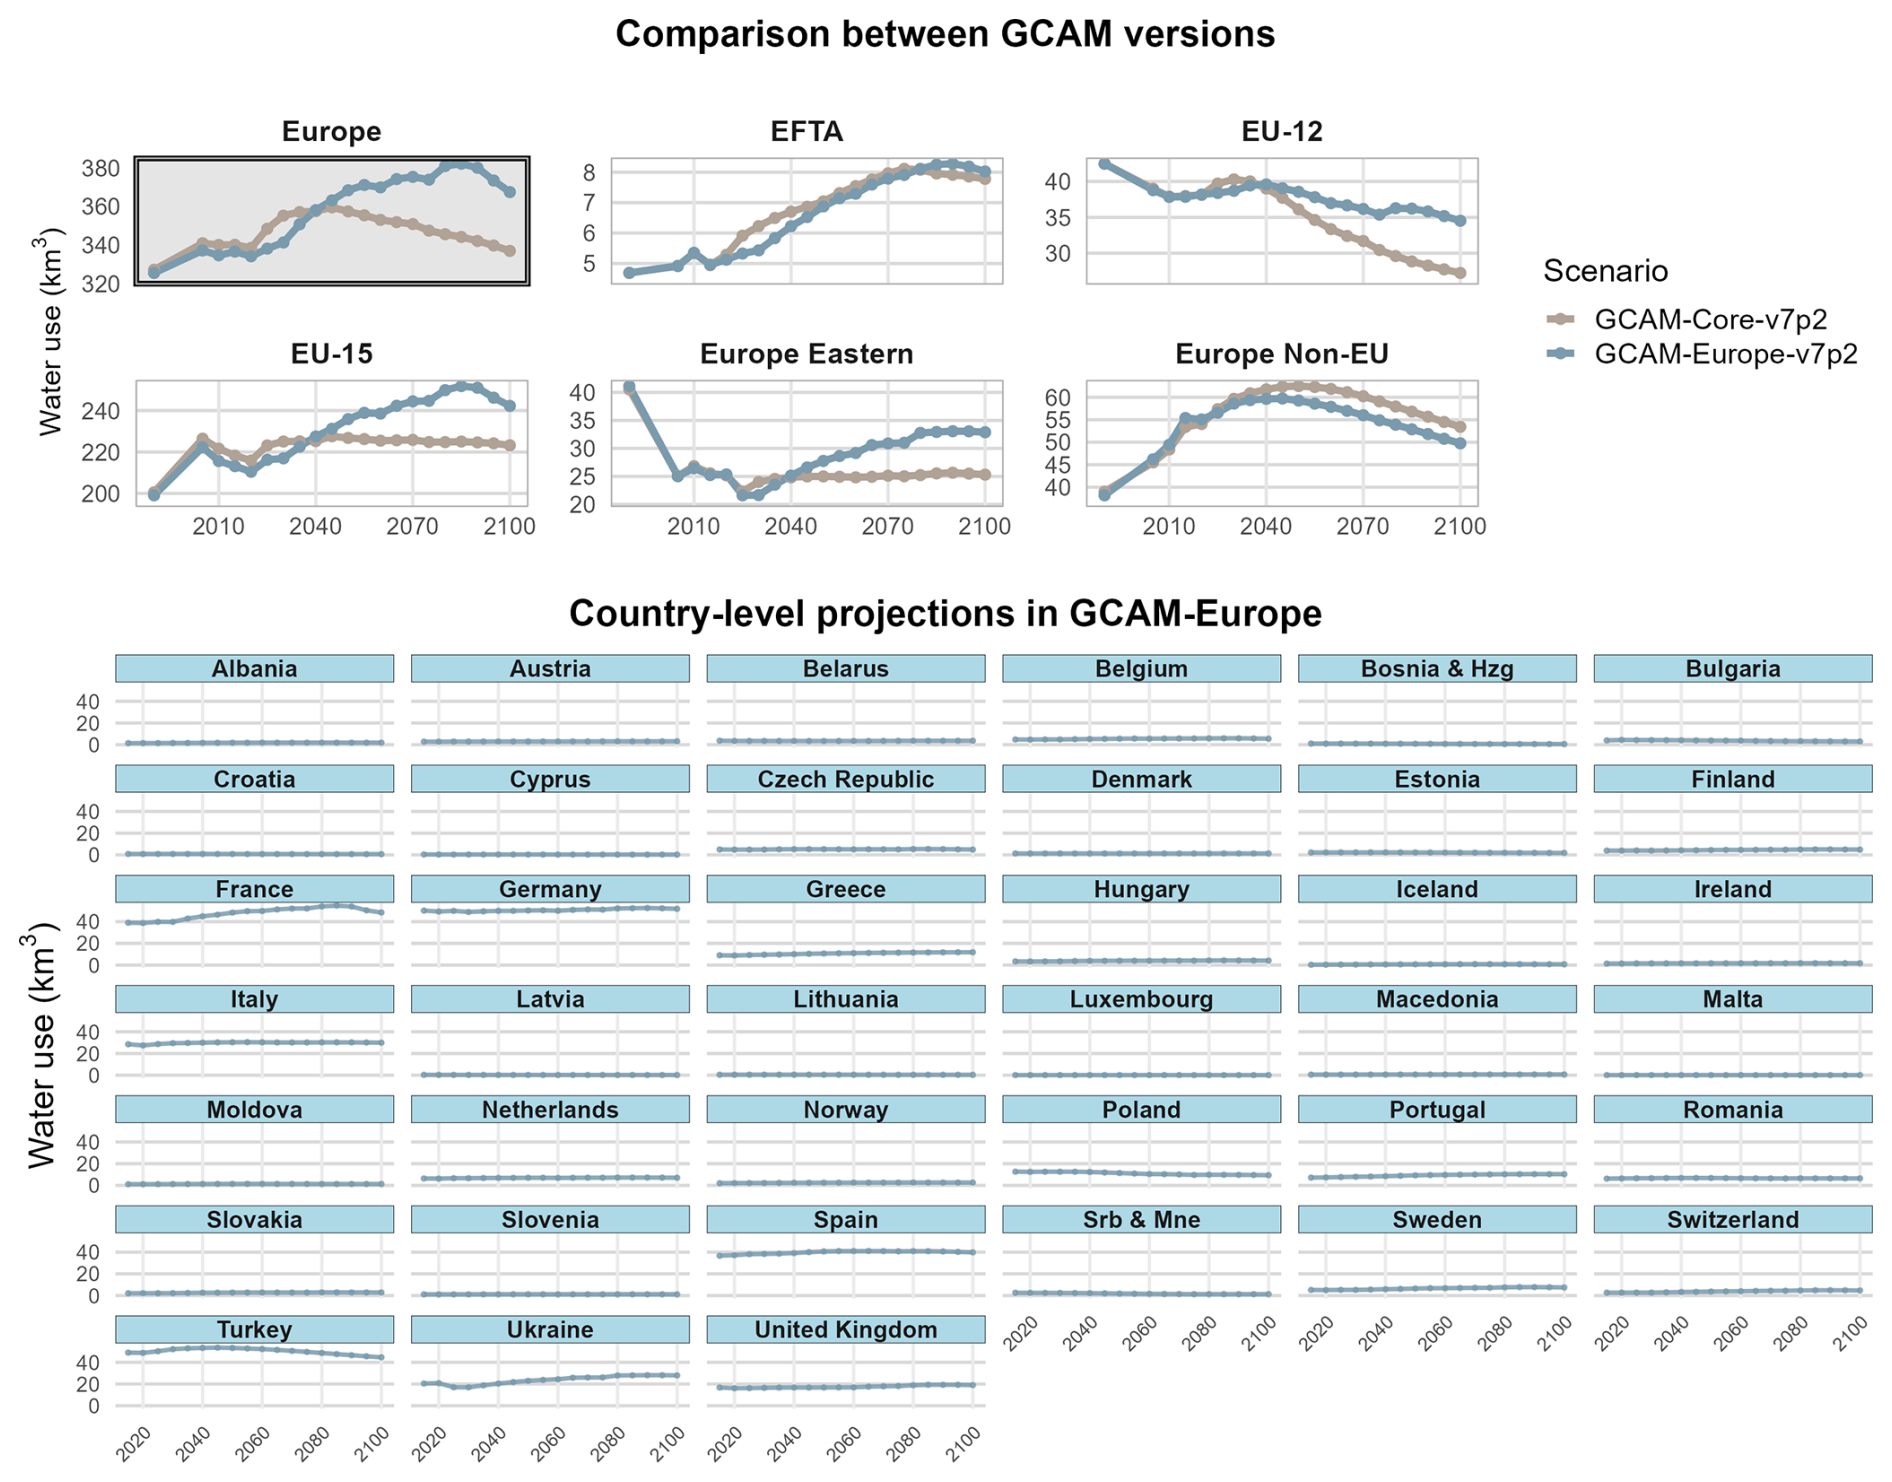
Figure 10Water withdrawals by scenario, region, and period (km3). The top panel shows total water withdrawals by scenario, region, and period (km3). The bottom panel shows water withdrawals by period and country in the GCAM-Europe baseline (km3).
3.4 Emissions
Future emission projections of greenhouse gases and air pollutants in GCAM-Europe substantially varies across regions and species (Fig. 11). Total carbon dioxide (CO2) emissions remain relatively constant at European level, slightly rising from 4434 MTCO2 in 2015 to 4545 MTCO2 in 2050. Detailed CO2 emission projections for different European countries are provided in the Supplement (Fig. S11). Similar trends can be observed in the emissions of other greenhouse gases such as methane (CH4) and nitrogen dioxide (N2O). In contrast, emissions of air pollutants generally decrease over time, with the exception of ammonia (NH3), which increases due to rising livestock production. These decreasing trends in air pollutants are driven by assumed reductions in emission factors (EFs) over time resulting from technological advancements and stricter air quality regulations. There are also some differences across GCAM-Europe and the core model, particularly in terms CH4 and sulphur dioxide (SO2) emissions. The divergence in CH4 emissions are associated with changes in livestock. For example, methane emissions attributable to the production of beef account for 4.6 and 4.1 Tg in the core and GCAM-Europe baselines, respectively in 2050. The differences in SO2 emissions are mainly driven by the lower final energy consumption in the GCAM-Europe baseline.
Figure 11 also highlights significant differences in GHG and air pollutant emissions across European countries, with certain nations emerging as major contributors for specific species. Germany leads emissions of CO2 with nearly 192.5 MTC in 2050, followed closely by Turkey (146.7 MTC), the UK (131.7 MTC), and France (86.3 MTC), reflecting their larger energy demands. CH4 emissions are highest in Turkey (3.96 Tg in 2050), Ukraine (3.51 Tg), and France (3.01 Tg), which is directly related to the size of their of agricultural and waste sectors. In the case of NH3, primarily linked to livestock and fertilizer use, Turkey, Germany, and France show the largest emissions with values in 2050 accounting for above 0.7 Tg. For nitrous oxide (N2O), emissions are more evenly spread, but Turkey, France, and Germany remain the top contributors. Nitrogen oxides (NOx), mainly from combustion processes, show the highest emissions in Turkey, Germany, and Spain, each exceeding 0.5 Tg in 2050. Emissions of primary particulate matter (PM2.5), namely black carbon (BC) and organic carbon (OC), have their highest emissions in Germany, Poland, and Turkey (BC), and Belarus, Italy, and Ukraine (OC). Finally, sulphur dioxide (SO2) emissions, linked to fossil fuel combustion, are highest in Turkey, followed by far by Ukraine, and Poland, highlighting continued reliance on sulphur-intensive energy sources in these regions.
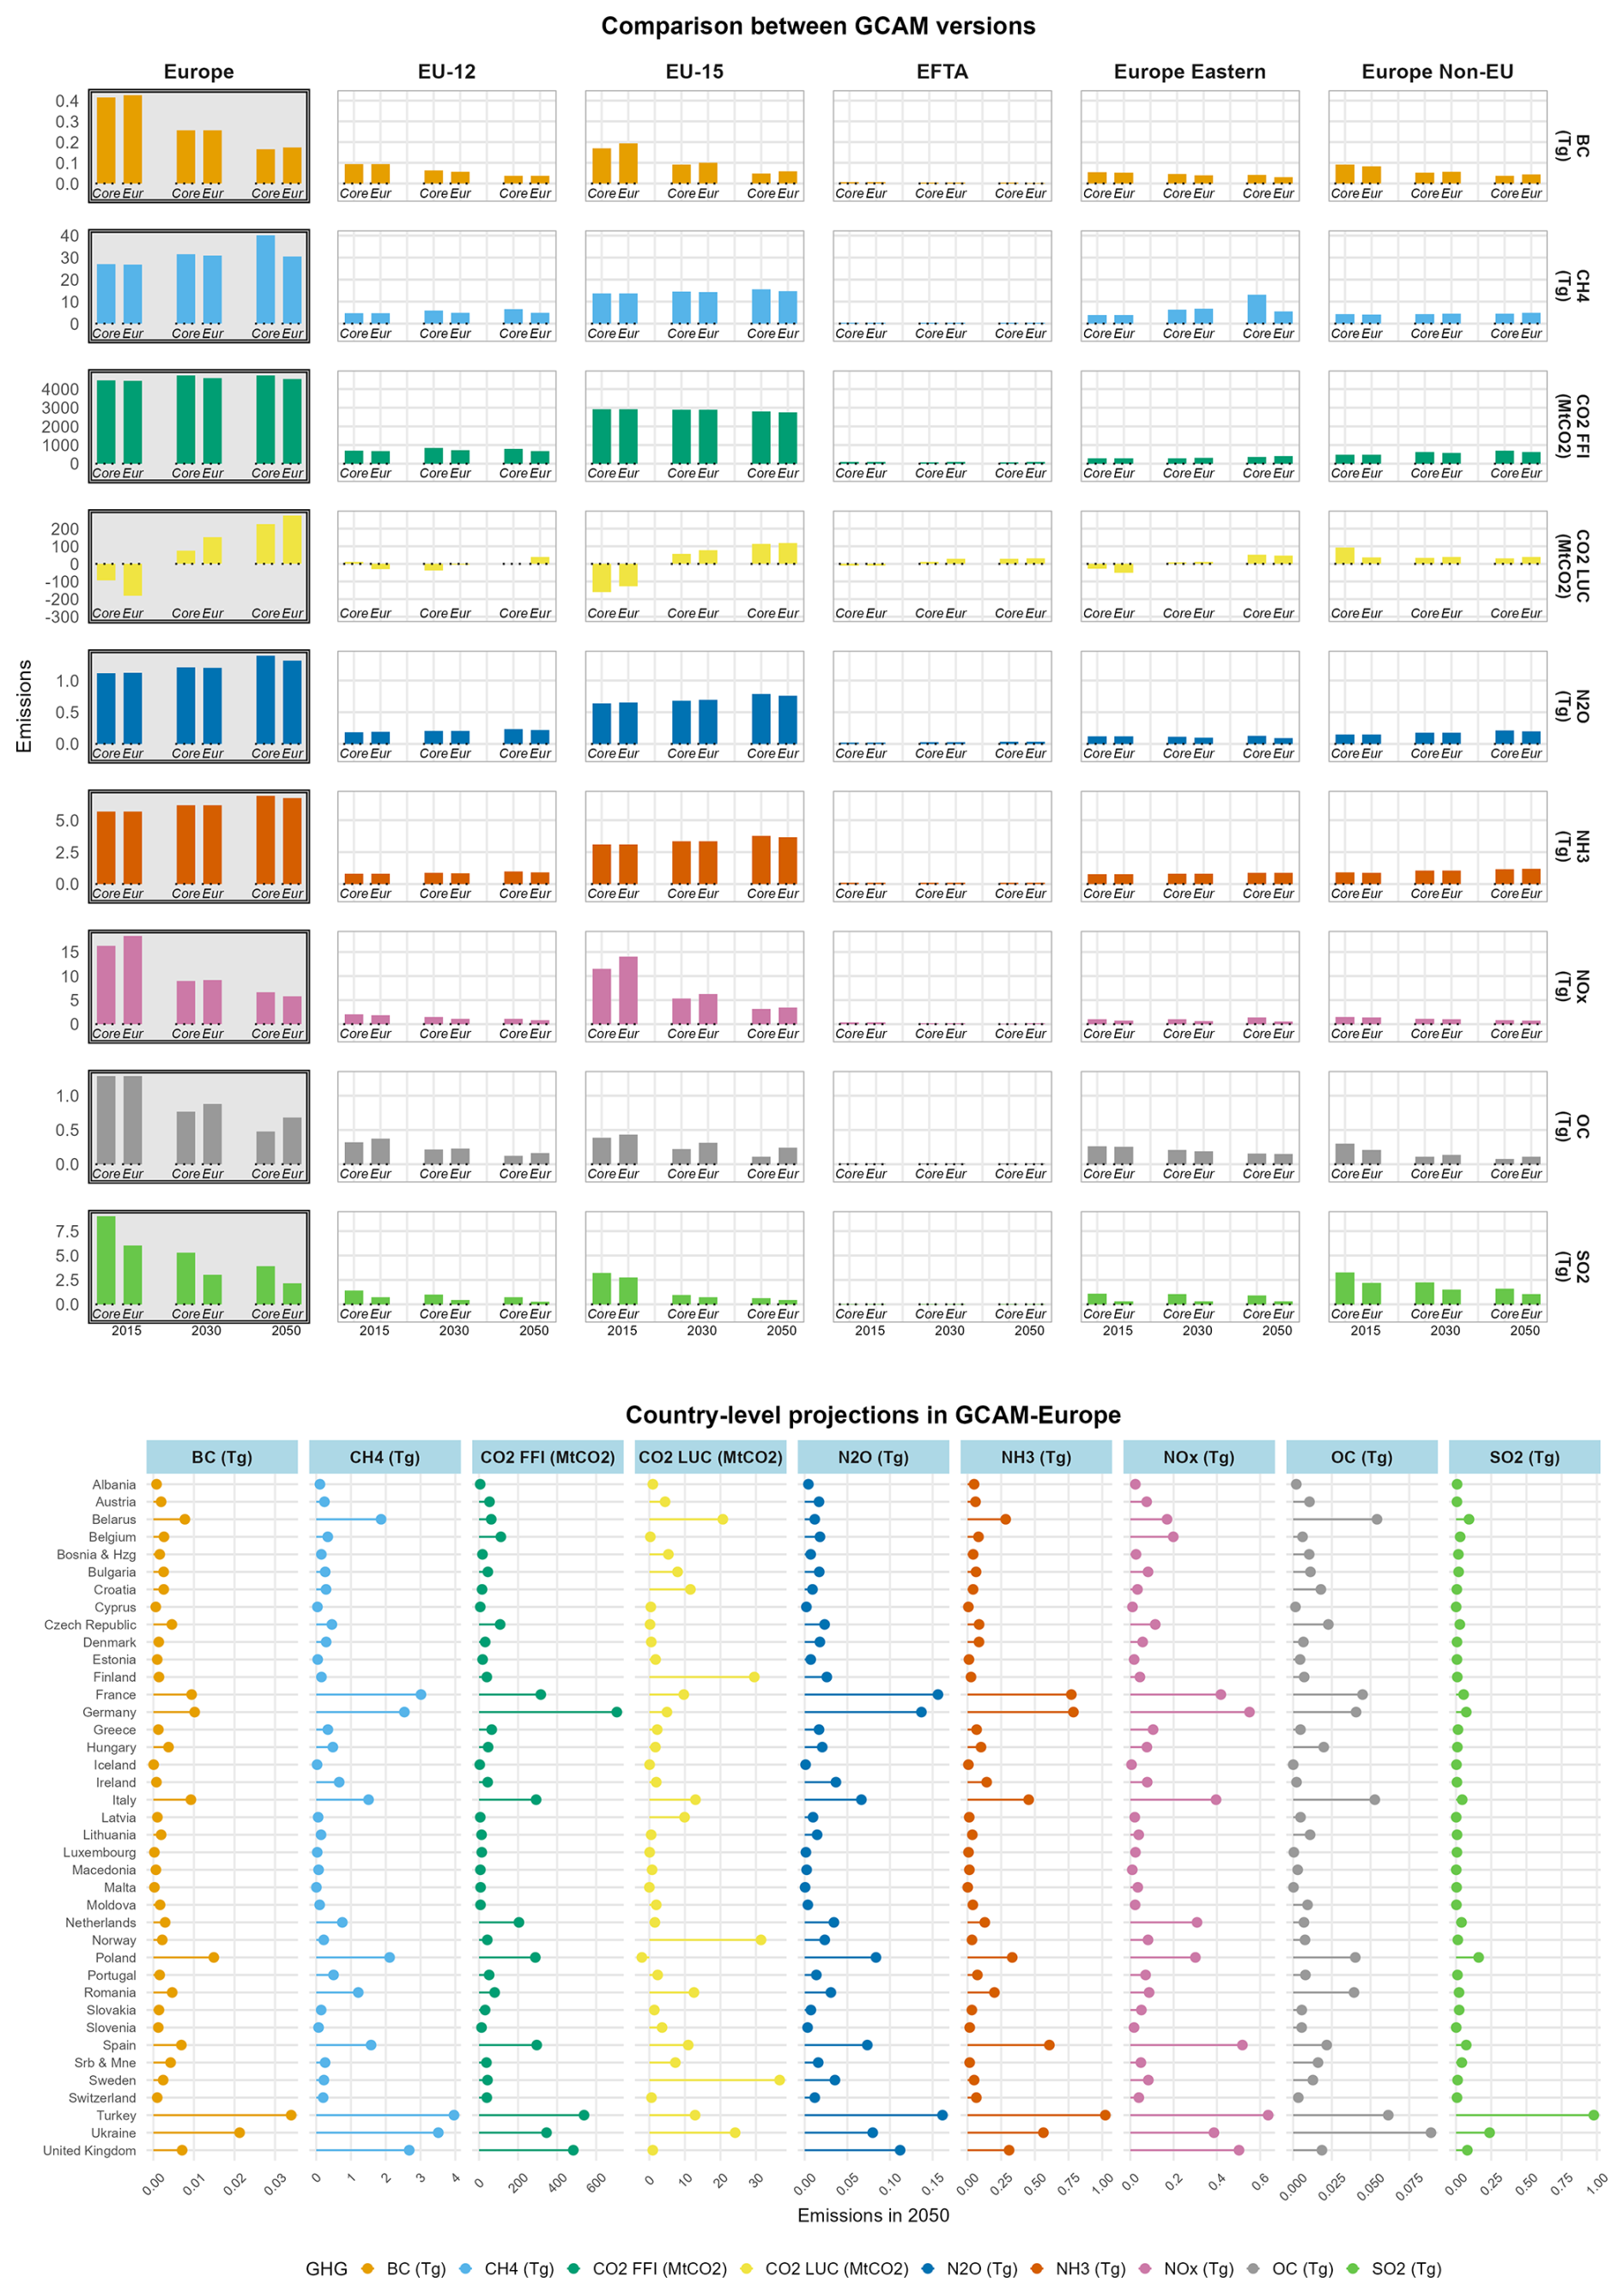
Figure 11GHG and air pollutant emissions by scenario, region, period and specie. The top panel shows total emissions for the by scenario, region, period and specie (MTCO2 and Tg). The bottom panel shows emissions by period, country and specie for 2050 in the GCAM-Europe baseline.
3.5 Trade dynamics
The implementation of the double-Armington structure to represent trade dynamics in GCAM-Europe changes the relation between domestic versus traded commodities in the different European countries, both within EEA countries and internationally (Fig. 12). Taking 2050 as a reference year, we observed several differences across trade commodities. For fossil fuels, both scenarios project strong dependence on international crude oil imports (around 19 EJ in 2050), with minimal intra-EEA trade, a pattern also observed for coal. In contrast, the explicit representation of intra-EEA markets in GCAM-Europe increases natural gas trade within Europe. In 2050, intra-EEA gas imports reach 8 EJ, exceeding total international imports (7.5 EJ).
European biomass production (excluding Russia) rises in GCAM-Europe relative to the core model (17 EJ versus 15 EJ). Of that production, 13 EJ are produced in EU-27, which is comparable with recent biomass production potential estimates of 15–17 EJ for the region (Ruiz et al., 2019). This may still be relatively high for a scenario without climate policy, though typically in IAM modelling exercises, global biomass consumption is typically constrained in mitigation scenarios to account for sustainability limits (Reid et al., 2020). Although intra-EEA biomass trade exists, it remains limited compared to international exchanges. At the country level, Scandinavian nations are major biomass exporters, with Sweden exporting about 1.6 EJ in 2050. Germany is the largest importer (1.2 EJ), nearly matching its domestic production. Iron and steel production and trade also expand under the double-Armington structure, with the largest flows involving Ukraine, Germany, and Turkey. A similar trend is observed for livestock, where intra-EEA trade intensifies, particularly among Germany, France, and the Netherlands.
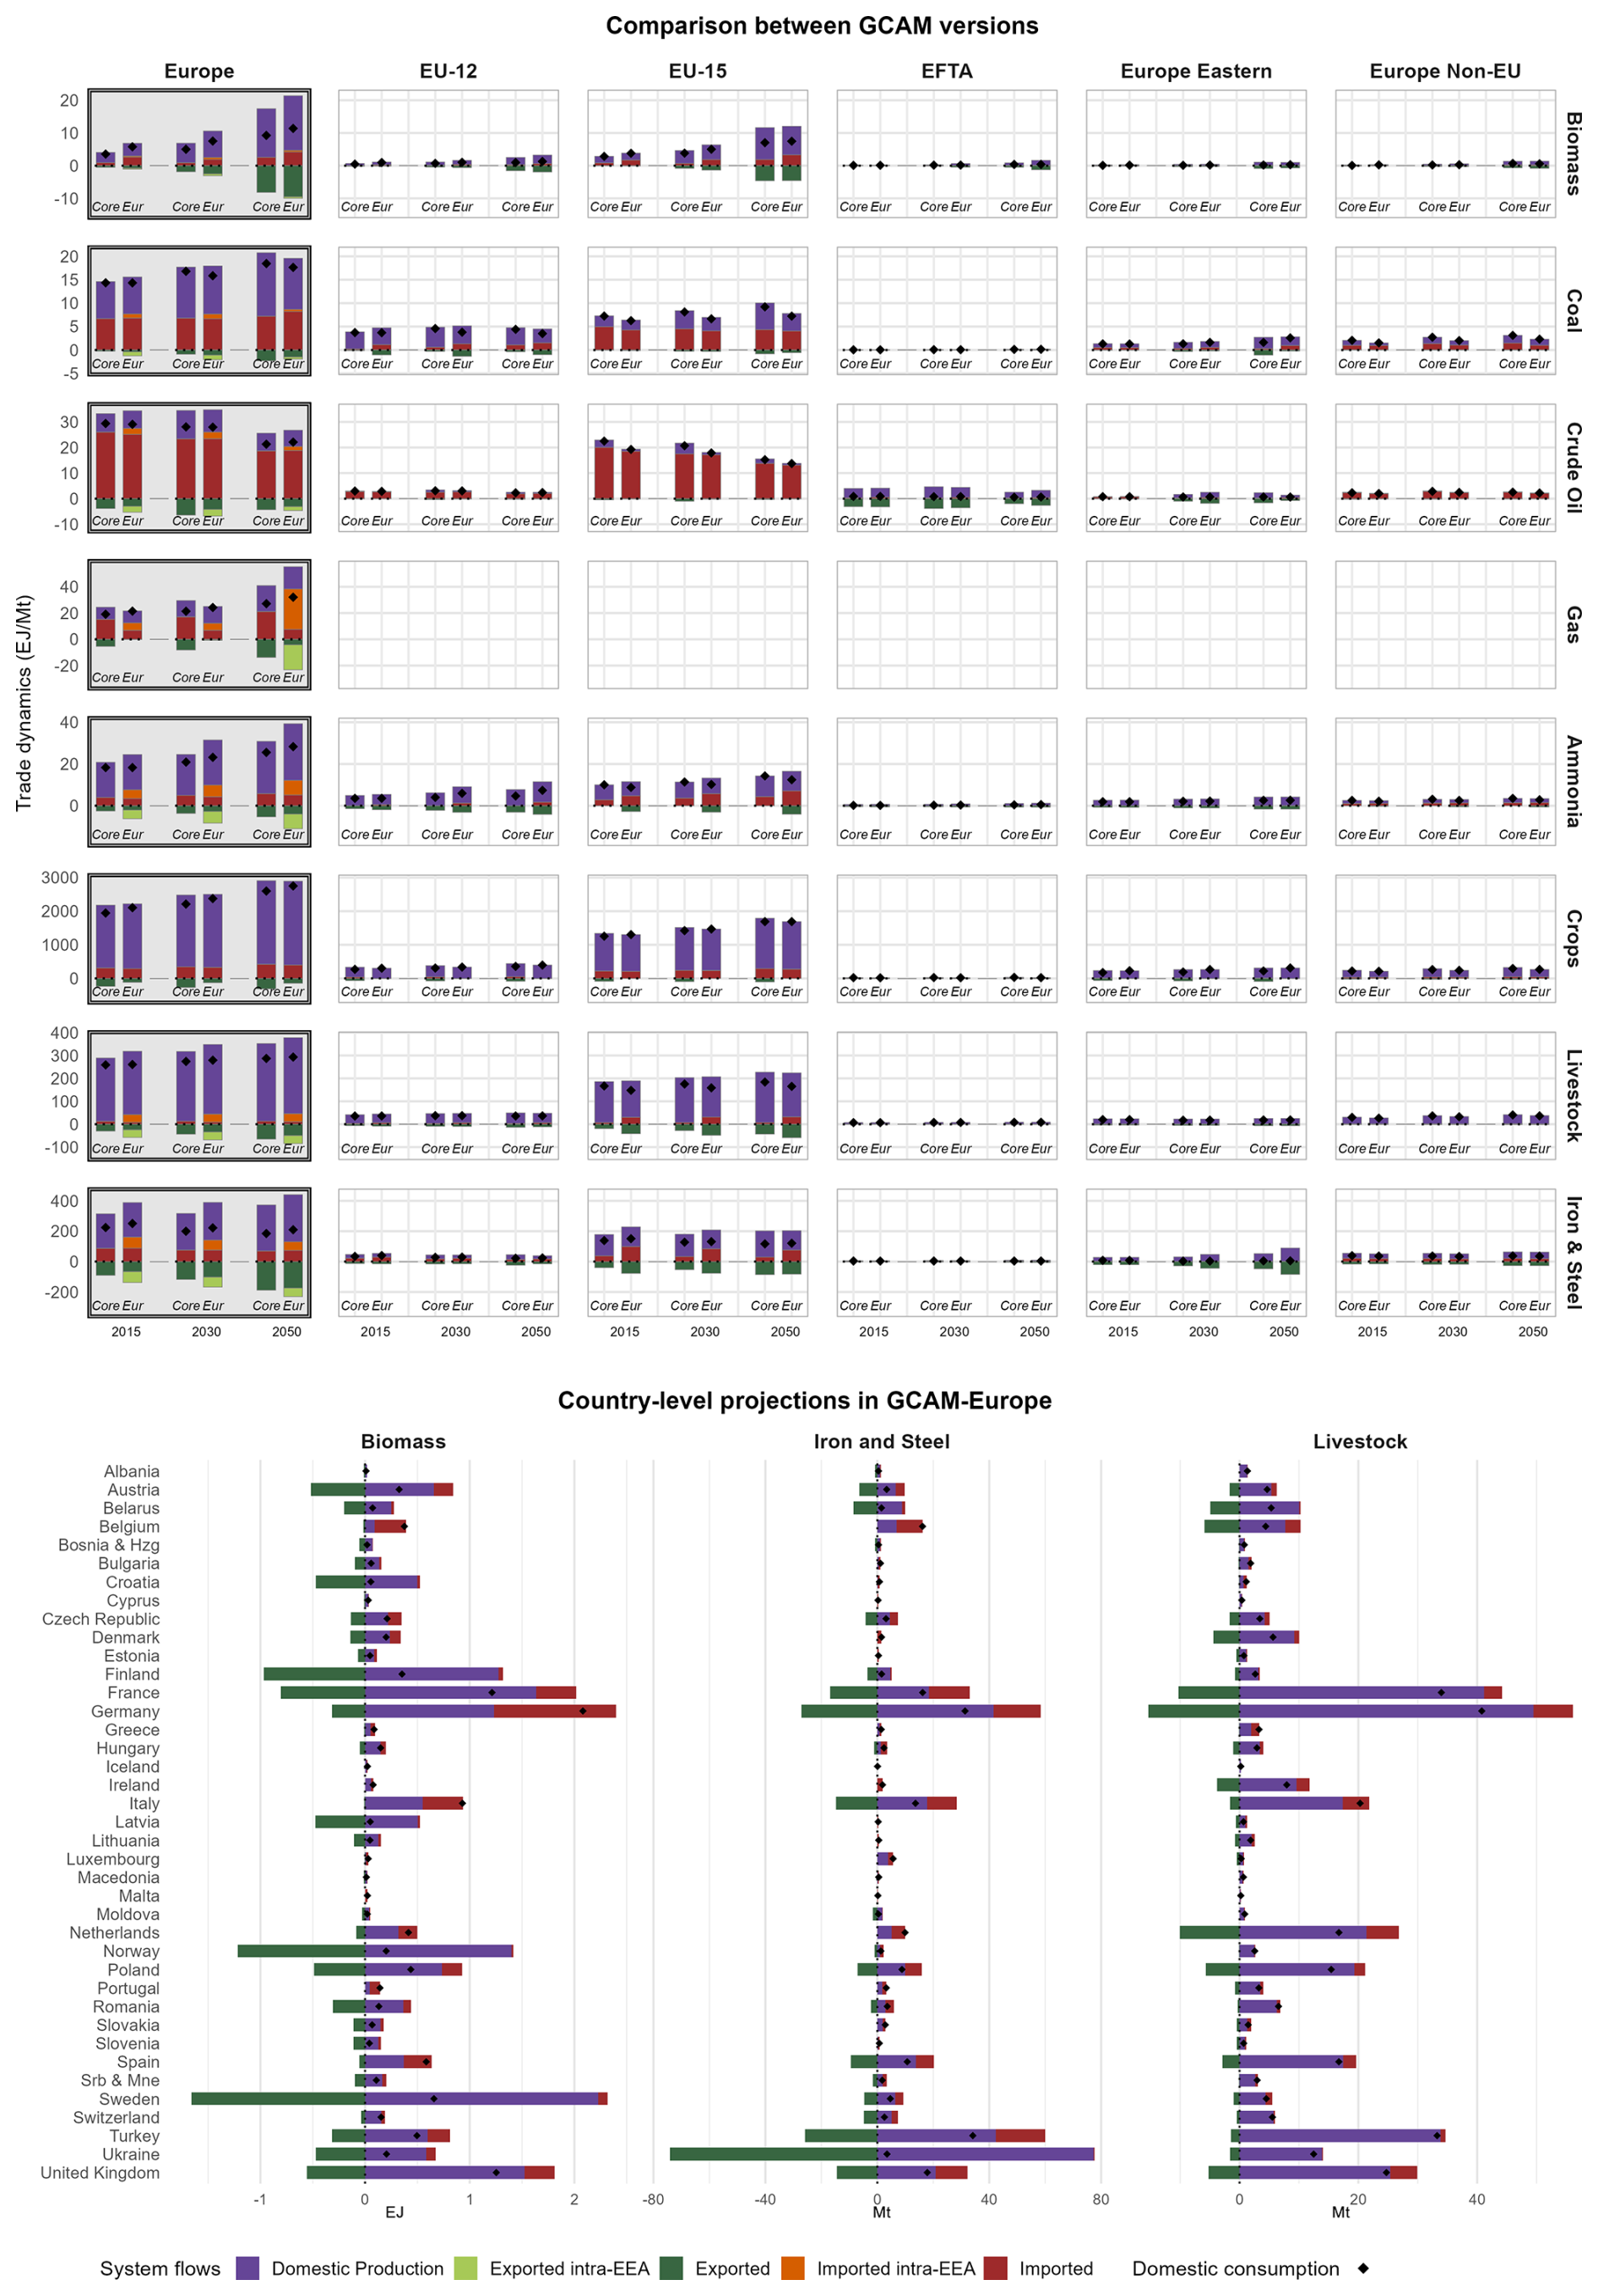
Figure 12Domestic production and trade dynamics by scenario, period and commodity (EJ or Mt). The top panel shows total trade dynamics for the European continent the five core European regions by scenario, and specie in 2050 (EJ or Mt). The bottom panel shows trade dynamics by country and commodity for 2050 in the GCAM-Europe baseline in 2050. 2015 and 2030 are shown in Fig. S12. The bottom panel does not disaggregate intra and extra EEA trade.
The aim of this section is to see how GCAM-Europe responds to the implementation of the European climate policy portfolio and to analyse the resulting changes in energy system development and emissions pathways. Notably, we model a scenario that incorporates both EU-wide policies, such as the Emissions Trading System (ETS) and vehicle emission standards, and country-specific measures, including coal phase-out commitments, nuclear phase-out and expansion plans, energy efficiency targets, and renewable energy targets as specified in each country's National Energy and Climate Plan (NECP). After 2030, a carbon cap is introduced that linearly reduces net CO2 emissions to zero by 2050, while assuming unchanged emissions and removals from the land use, land-use change, and forestry (LULUCF) sector. A more detailed description of the scenario (hereinafter “NECP_LTT”) is provided in Frilingou et al. (2026). However, the version implemented here incorporates several updates and additional constraints to better represent near-term trends. The resulting ETS and post-2030 regional carbon prices by model period are summarised in Table S2.
The implementation of the policy portfolio has a direct impact on primary energy consumption at European level, affecting both total energy demand and the composition of the energy mix (Fig. 13). In the Baseline scenario, total primary energy demand increases from 56 EJ in 2015 to 59 EJ in 2030 and 61 EJ in 2050. In contrast, the NECP_LTT scenario reduces primary energy demand to 50.5 EJ in 2030 and 44 EJ in 2050, reflecting the effects of the European Union's ambitious energy efficiency policies. The policy package also substantially reshapes the primary energy mix. Compared with the baseline, coal, natural gas, and oil consumption decline by 8.3, 3.6, and 3.4 EJ, respectively, in 2030, with reductions widening to 10.5, 12.9, and 13.0 EJ by 2050. This marked decline in fossil fuel use delivers important co-benefits, including improved air quality and enhanced energy security. The displaced fossil fuel demand is primarily replaced by renewable energy sources, particularly wind, solar, and biomass, as well as nuclear power. Whereas the no-policy scenario presented in Section 3 showed only limited growth in renewable energy, the implementation of the European climate policy portfolio drives a system-wide transformation that substantially increases the share of renewables in the primary energy mix. Combined wind and solar generation expands by an additional 4.1 EJ in 2030 and 9.2 EJ in 2050 relative to the baseline, while biomass use increases by 2.4 and 5.8 EJ, respectively. Nuclear energy remains broadly unchanged through 2030 but increases by approximately 4 EJ by 2050.
Although all EU Member States exhibit a consistent decline in fossil fuel demand under the implementation of EU-wide climate policies and National Energy and Climate Plans (NECPs), the portfolio of low-carbon replacement technologies differs across countries (Fig. 13). This variation is influenced by country-specific factors such as current and projected costs of resources and technologies, as well as historical preferences for certain energy carriers. Wind, solar, and biomass emerge as the dominant replacement technologies in most Member States, while nuclear power continues to play a role in countries such as France, where an extensive nuclear fleet is already in place.
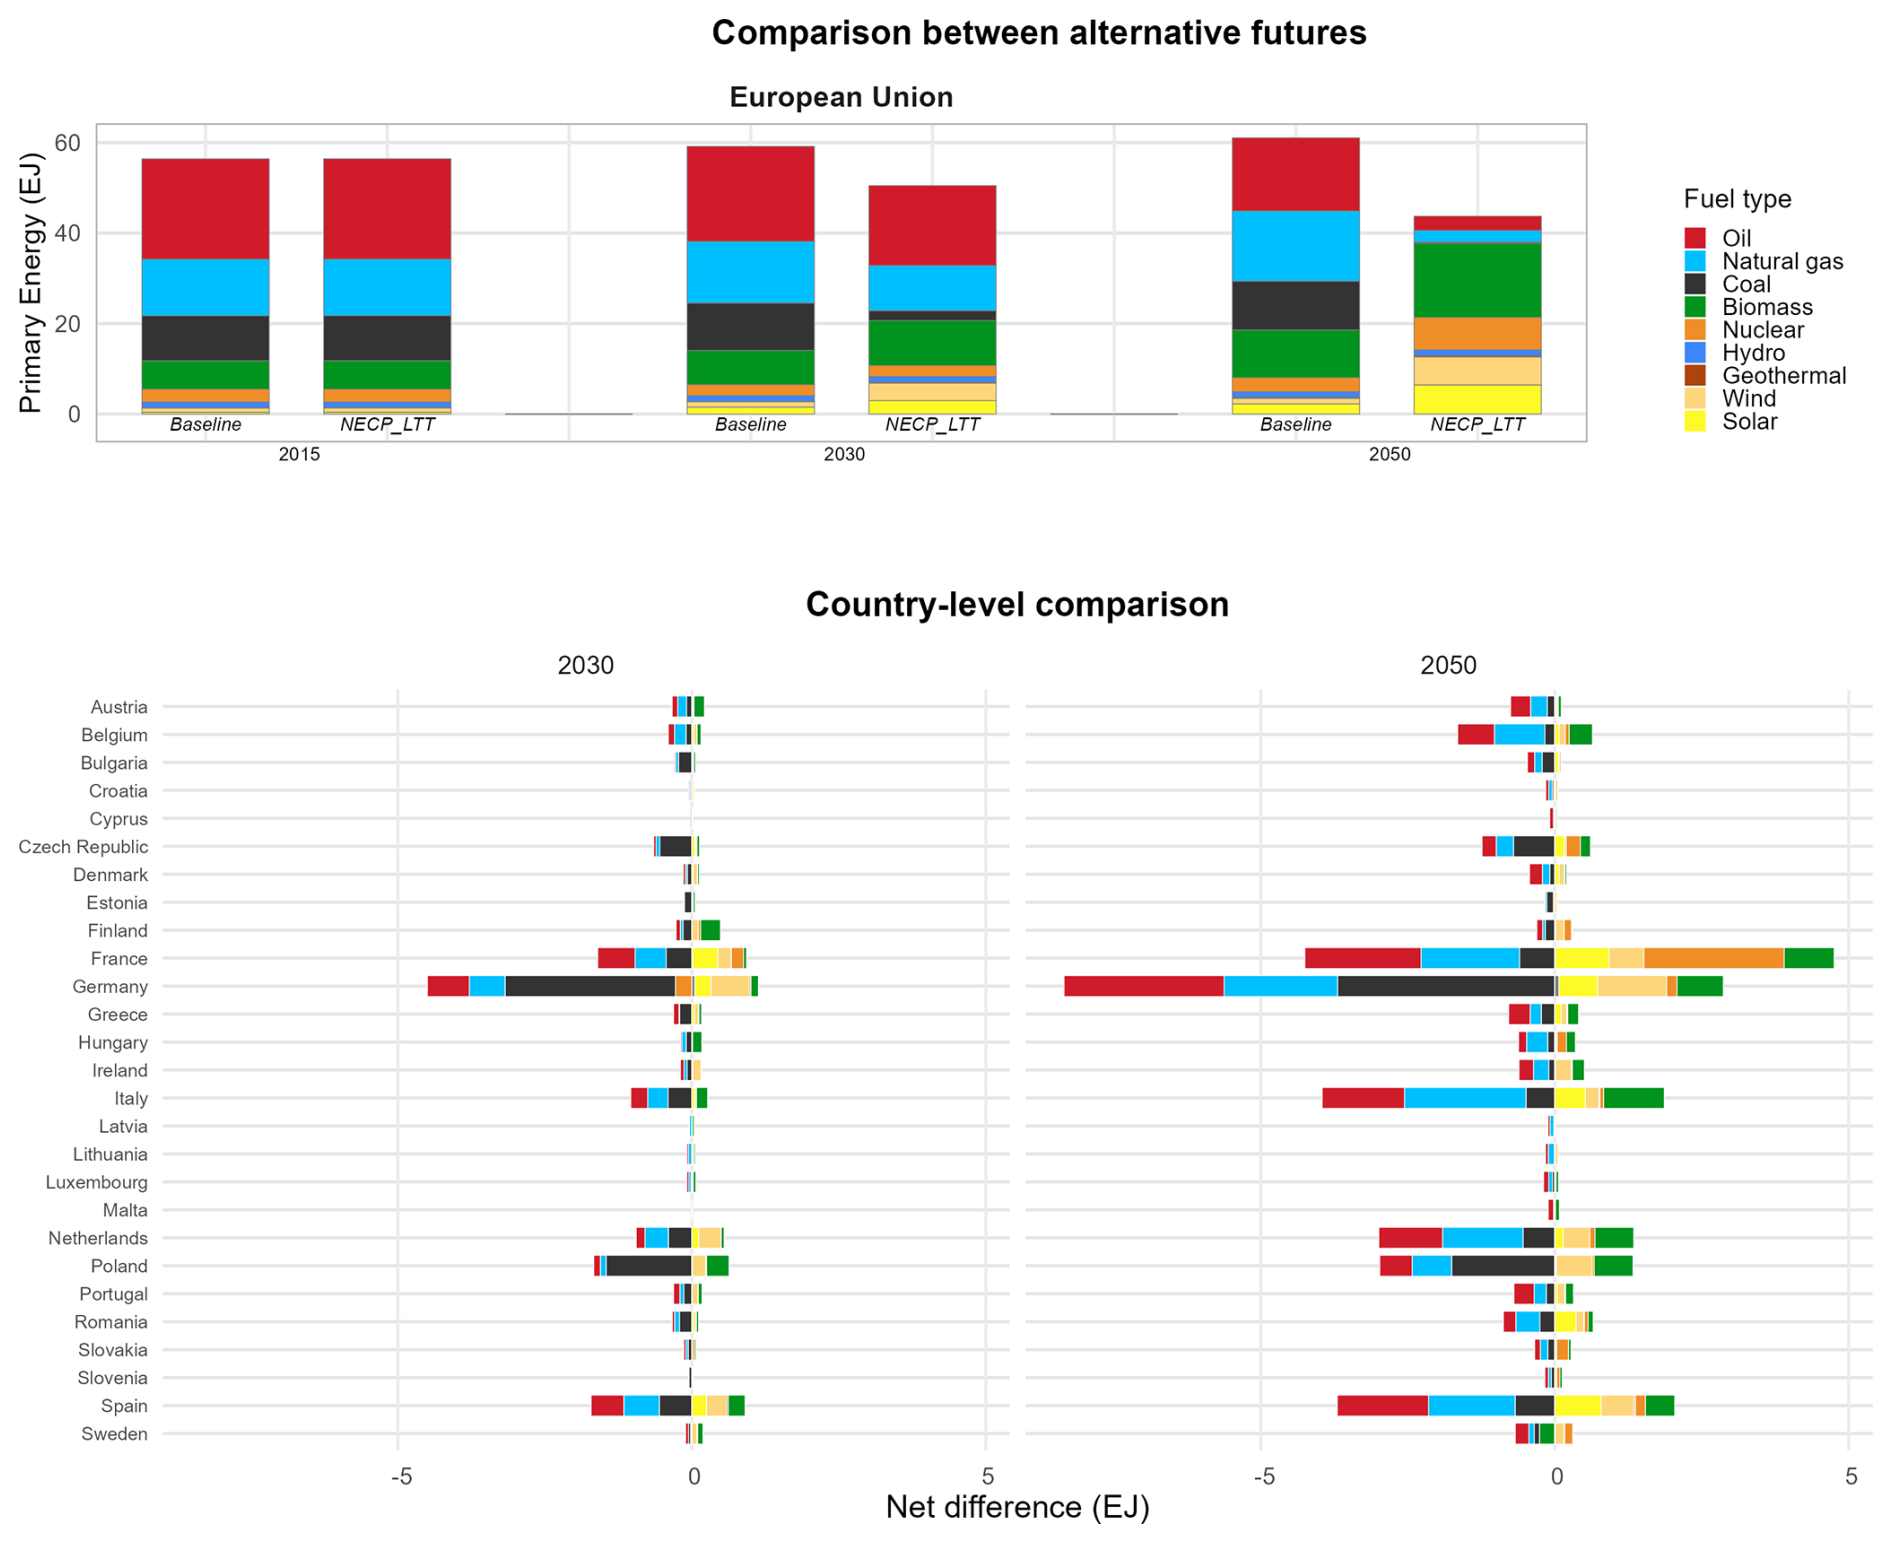
Figure 13Difference in primary energy demand between the policy and the baseline scenarios by period, region, and fuel. The upper panel shows primary energy for the entire EU region by scenario, period, and fuel (EJ). The lower panel shows the country level differences (NECP_LTT – Baseline) by period and fuel (EJ).
Focusing on the power sector, Fig. 14 shows a substantial increase in electricity demand under the NECP_LTT scenario, reflecting the widespread electrification of end-use sectors. At the EU level, the implementation of the European climate policy portfolio increases total electricity consumption to 14.8 EJ in 2030 and 24 EJ in 2050, compared with 13.1 and 16.7 EJ, respectively, in the Baseline scenario.
Renewable energy sources account for most of this transition across EU Member States. Wind power experiences significant growth in countries such as Spain, Germany, and the Netherlands. At the EU level, wind generation in the NECP_LTT scenario increases by 2.7 EJ in 2030 and 4.0 EJ in 2050 relative to the Baseline scenario. Solar power also expands rapidly, with generation increasing by 0.9 EJ in 2030 and 3.2 EJ in 2050. Biomass-based electricity generation grows more modestly, increasing by 0.7 EJ in 2030 and remaining 0.2 EJ above the baseline by 2050. Nuclear generation remains broadly unchanged through 2030 but increases by 3.1 EJ by 2050. This expansion is largely driven by France, where national long-term decarbonisation plans (French National Low-Carbon Strategy, SNBC) envisage the construction of new nuclear reactors alongside the continued operation of the existing fleet. By contrast, the contribution of carbon capture and storage (CCS) to electricity generation remains limited throughout the projection period and does not represent a significant share of the electricity mix in any EU Member State.
We also compare GCAM-Europe projections with available evidence on observed trends and estimated deployment potentials for biomass, carbon capture and storage (CCS), and nuclear energy (Fig. S13). The projected expansion of biomass use, which is particularly pronounced in the NECP_LTT scenario, is slightly above observed consumption levels through 2025 but remains consistent with estimated sustainable biomass potentials. For CCS, GCAM-Europe projects only very limited deployment. Despite the implementation of climate policies, the NECP_LTT scenario projects only around 0.2 MtCO2 of CO2 sequestration by 2030, with emissions reduction targets being achieved primarily through the expansion of more mature renewable energy technologies. For nuclear energy, GCAM-Europe projects a slight decline in electricity generation by 2030 relative to 2015 under both the Baseline and NECP_LTT scenarios, with only minor differences between them. A modest increase in nuclear generation is projected in France and Slovakia, reflecting the finalization of new nuclear units expected by 2026–2027. However, this increase is offset by declining nuclear generation in other regions, most notably Germany.
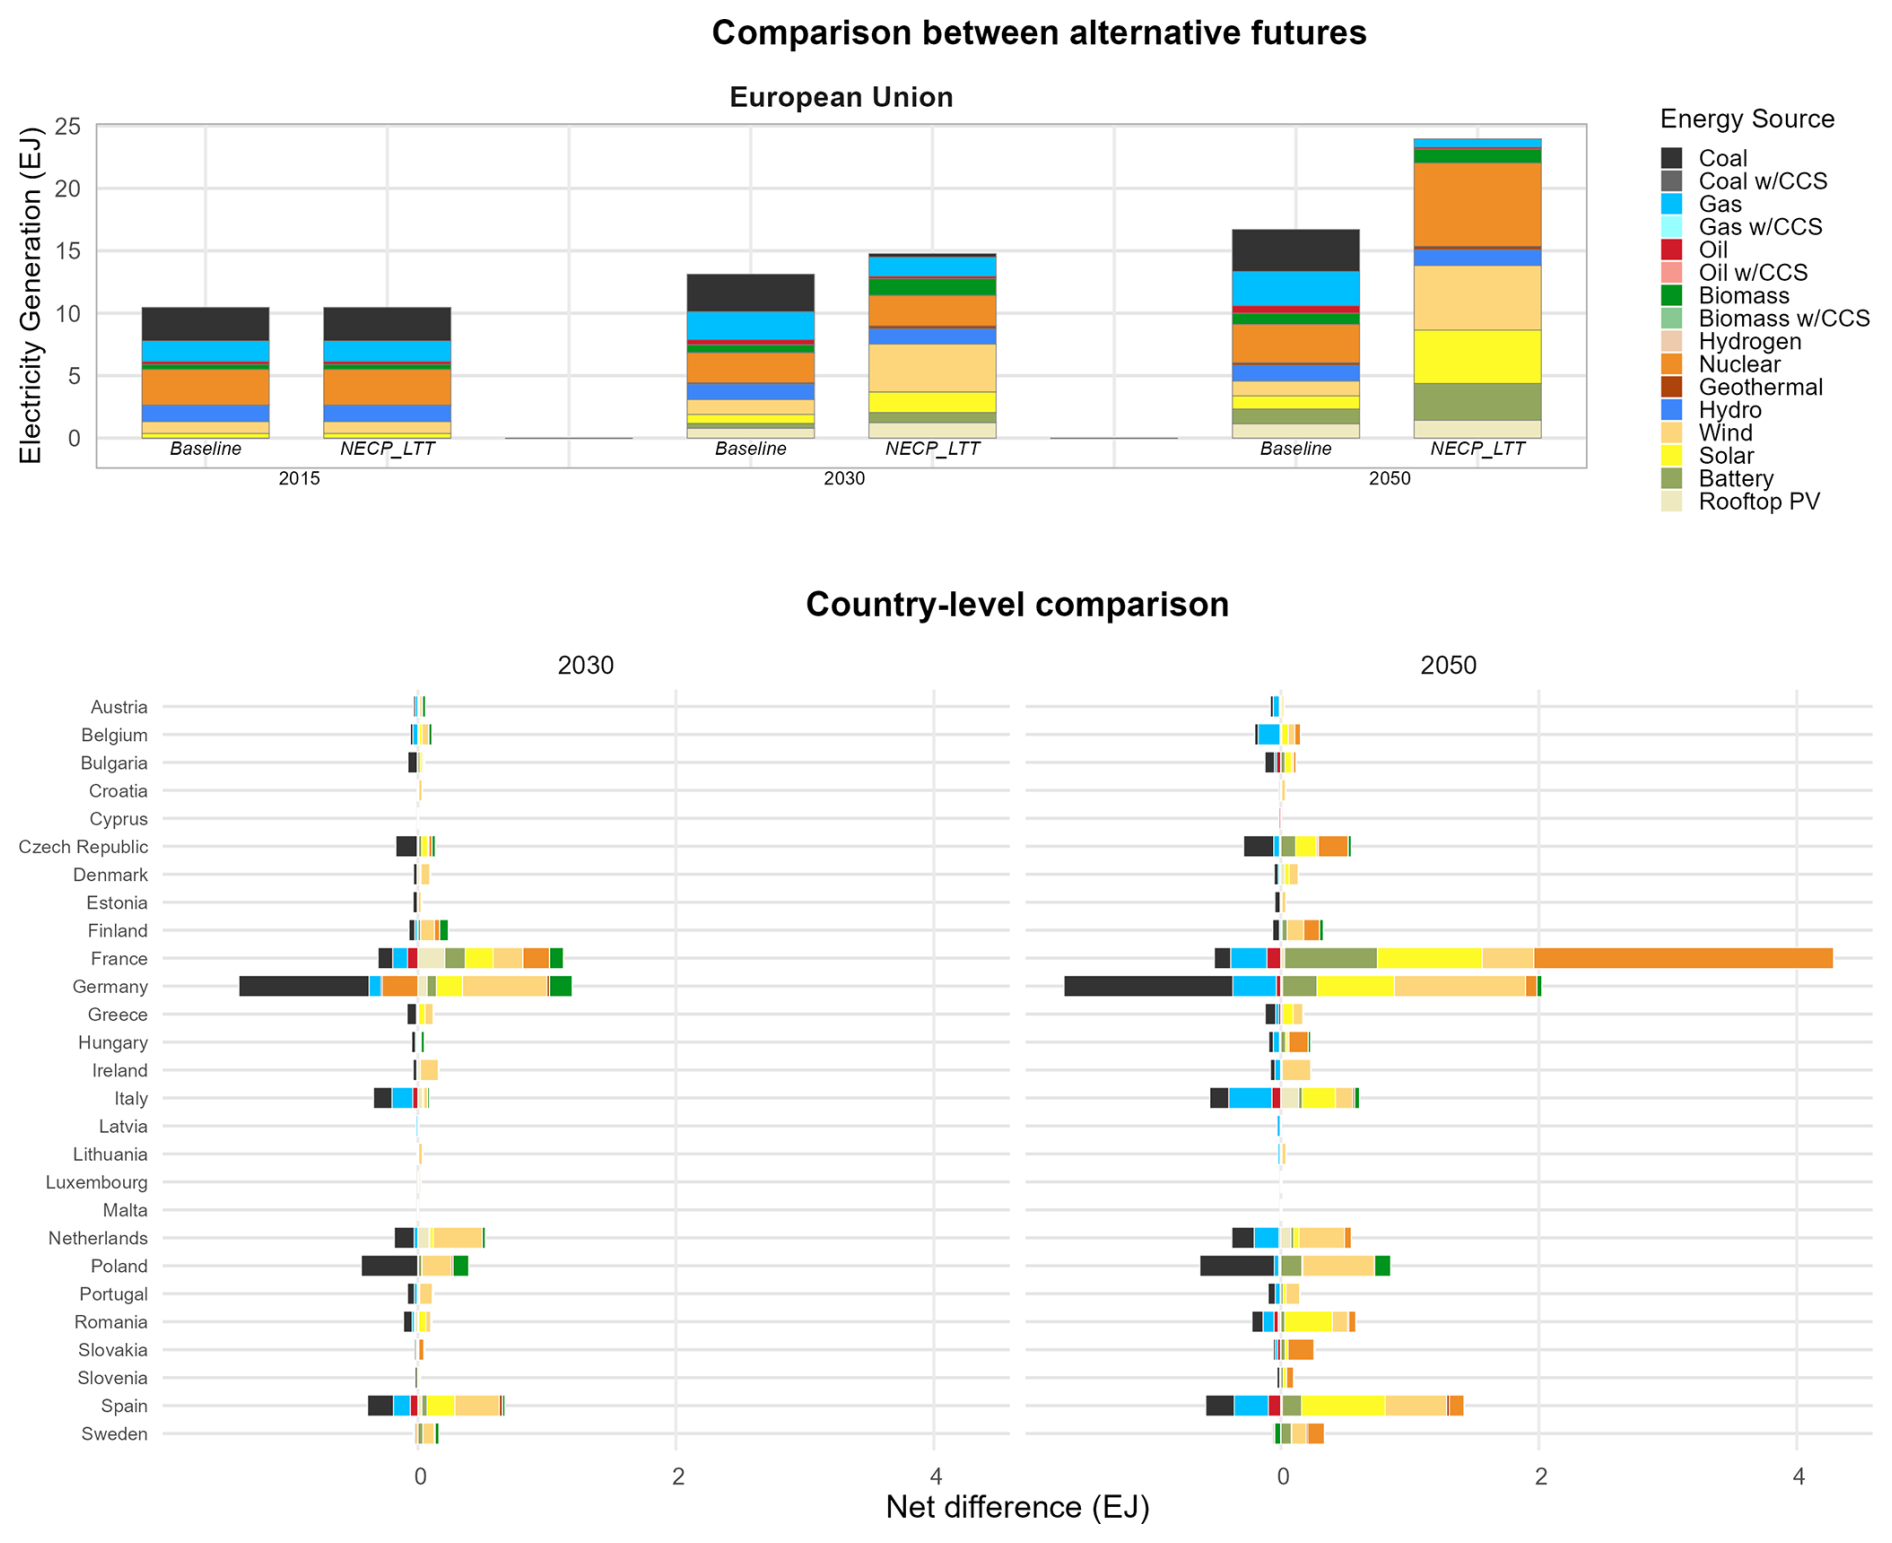
Figure 14Difference in electricity demand between the policy and the baseline scenarios by period, region, and technology. The upper panel shows electricity generation for EU countries by scenario, period, and technology (EJ). The lower panel shows the country level differences (NECP_LTT – Baseline) by period and technology (EJ). Belarus, Iceland and Turkey are not included as they are not connected to the European grid regions.
Projected changes in total energy demand and the composition of the energy mix have direct implications for greenhouse gas (GHG) and air pollutant emissions (Figs. 15 and 16). CO2 emissions decline substantially over the projection period, driven by the reduction in fossil fuel consumption across the EU. Under the NECP_LTT scenario, CO2 emissions decrease by 1.3 GtCO2 in 2030 and 2.7 GtCO2 in 2050 relative to the Baseline scenario.
The implementation of the policy portfolio also leads to significant reductions in non-CO2 GHGs. For example, methane emissions in the EU decrease by 7.8 Tg by 2050. The largest relative reductions are observed in Croatia and the Czech Republic, where methane emissions fall by approximately 60 %–70 % compared with the Baseline scenario.
Most air pollutants show a decreasing trend in the NECP_LTT scenario compared to the baseline throughout the projected period. Nitrogen oxides (NOx), which are closely linked to fossil fuel combustion, particularly in the transport sector, decline steadily across the EU. By 2050, countries such as the Czech Republic and Ireland reduce their NOx emissions by more than 50 % relative to the baseline. Similarly, SO2 emissions, primarily associated with coal combustion, also decrease across Europe. In some Eastern European countries, where dependence on coal remains high in the Baseline scenario (e.g., Poland), SO2 emissions fall more than 60 % by 2050 under the climate policy portfolio. Nevertheless, the deployment of biomass technologies in the near term leads to increases in certain biomass-related emissions, such as organic carbon (OC), by 2030, particularly in some Eastern European countries, including Bulgaria, Latvia, or Hungary. These increases could contribute to localised air quality challenges, highlighting the importance of integrating air quality and public health considerations into climate policy design (Vandyck et al., 2021).
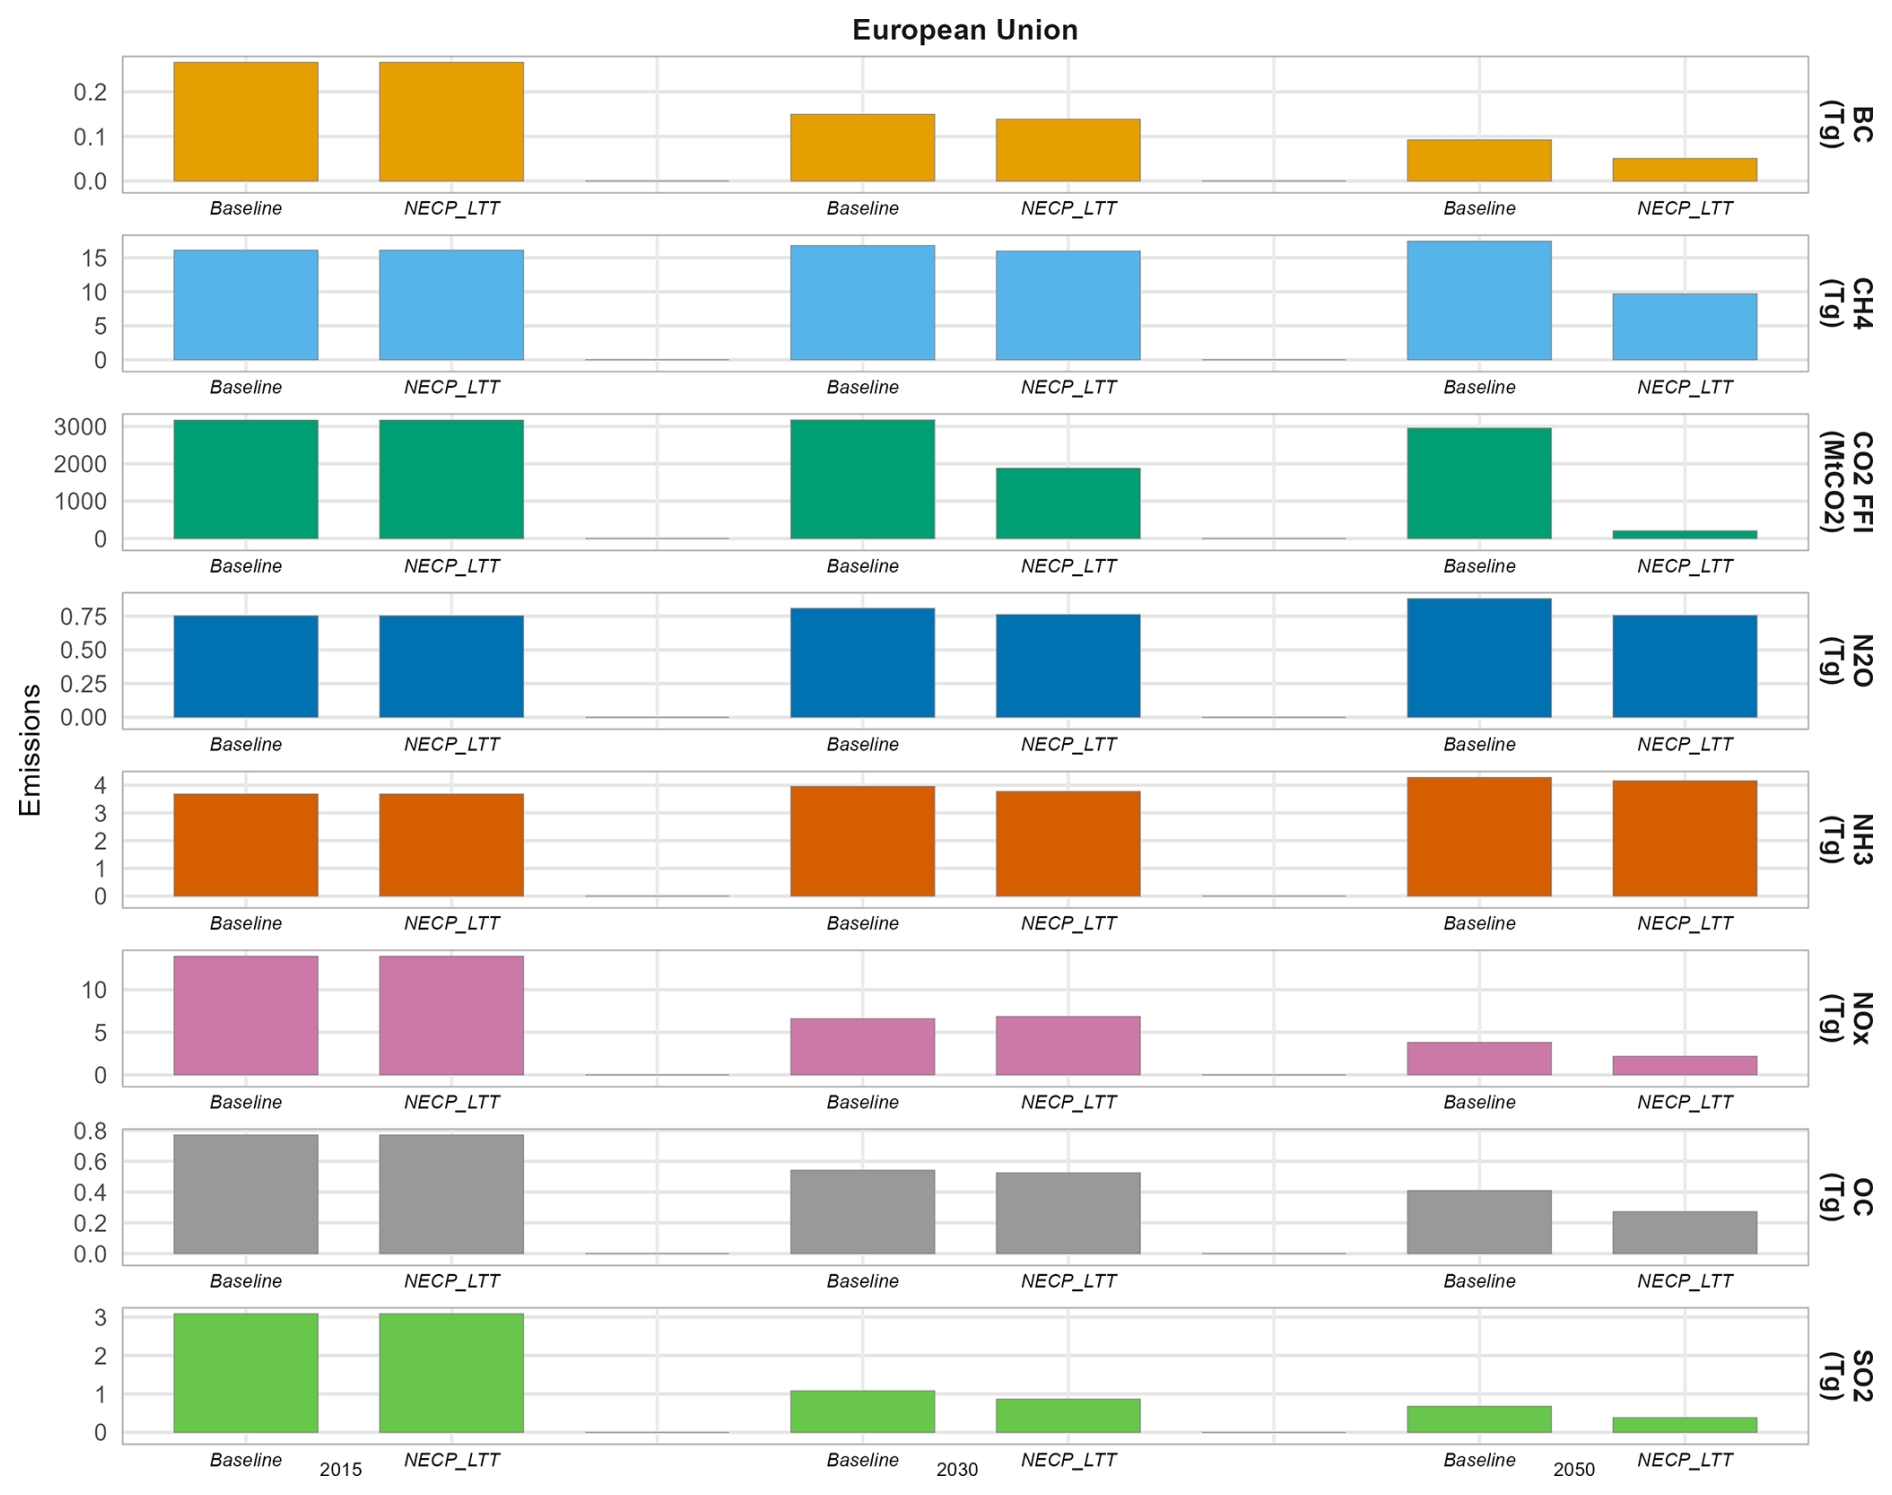
Figure 15Differences in GHG and air pollutant emissions between the policy and the baseline scenarios by period, region, and specie (MTC and Tg).
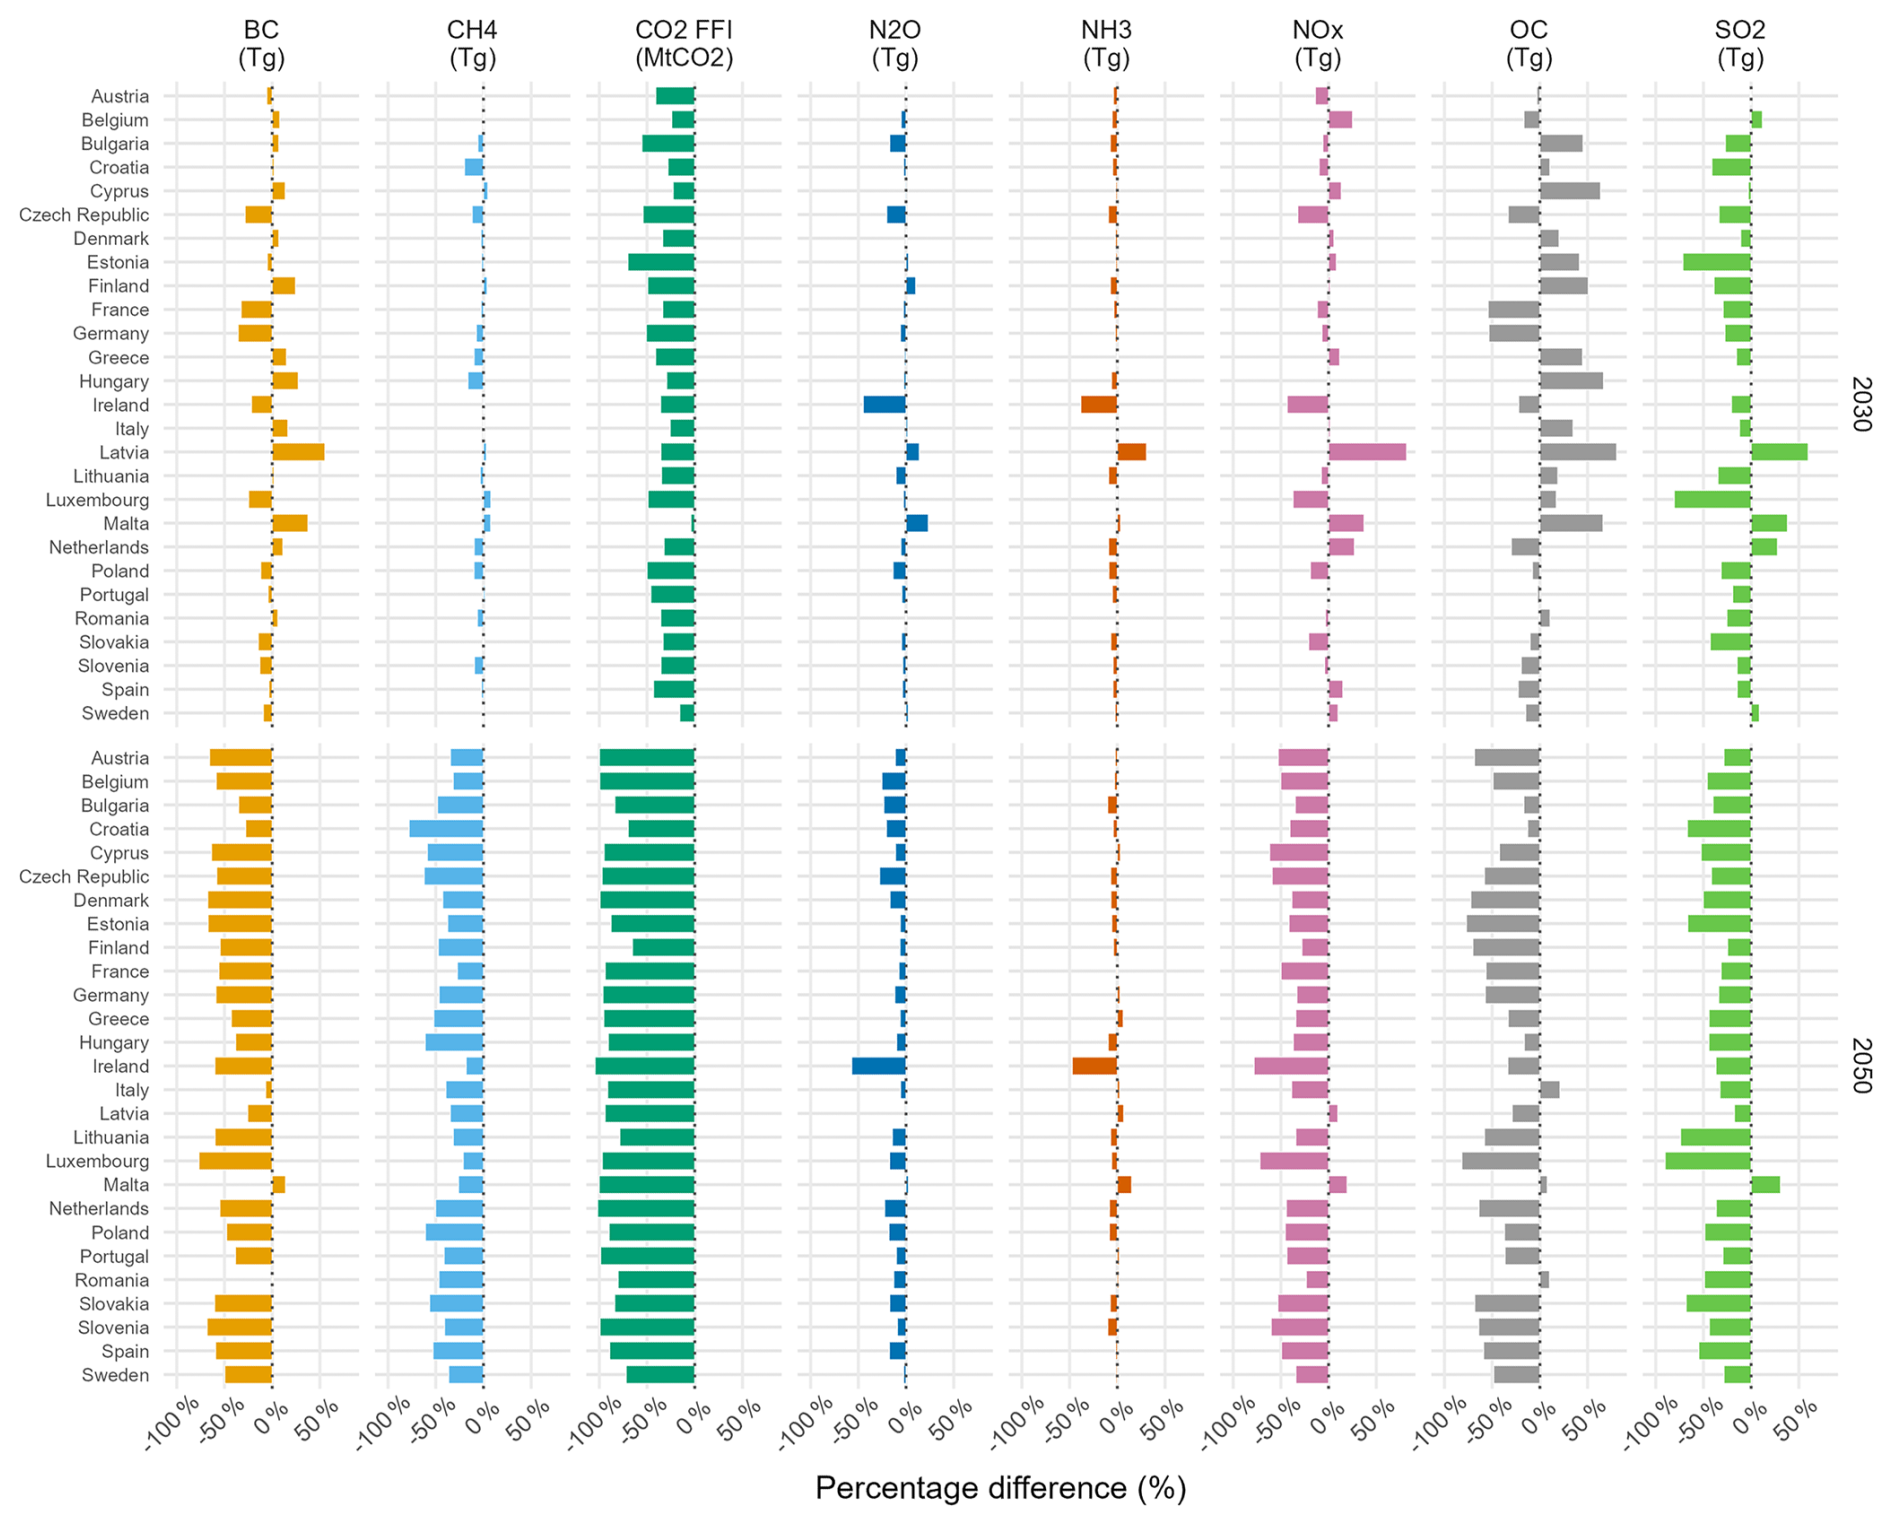
Figure 16Percentage differences in GHG and air pollutant emissions between the NECP_LTT and the baseline scenarios (NECP_LTT - Baseline) by period, country, and specie (%).
While the present analysis focuses on the representation of the current European climate policy portfolio, GCAM-Europe also enables the assessment of individual country-level and sector-specific energy and climate policies. In addition, the model supports index decomposition analyses that can help disentangle and quantify the effects of specific policy interventions (Riemer et al., 2023). Initial applications have already been conducted using the open release of GCAM-Europe v7.2, examining the multi-sectoral implications of alternative implementations of the EU Fit-for-55 policy package (Frilingou et al., 2026), including geographically explicit assessments of human health impacts (Rodés-Bachs et al., 2025). Given these capabilities, future applications could be extended to evaluate trade-related measures such as the Carbon Border Adjustment Mechanism (CBAM), explore the effects of alternative behavioural and technological assumptions, and investigate policies and interactions across the climate–land–energy–water nexus (International Atomic Energy Agency, 2024).
GCAM-Europe represents a significant advancement for both academic and policy-focused communities. With its improved geographical and sectoral detail, alongside an integrated representation of energy, water, emissions, and socioeconomic systems, GCAM-Europe offers a robust platform for comprehensive climate and environmental analysis. The model supports detailed assessments of climate policy impacts both between European countries and within them, reflecting regional differences and sector-specific complexities. Moreover, the model operates within the global version, allowing users to explore how European policies may influence, and be influenced by, developments in the rest of the world. GCAM-Europe's level of disaggregation, combined with its open-source framework, makes it especially valuable to a broad range of stakeholders, ranging from academic institutions to government agencies, non-profit organizations, and private-sector experts. Particularly, the model is well-suited to support policymakers in the design and evaluation of alternative environmental and climate policies in a transparent and evidence-based manner.
While GCAM-Europe improves the model accuracy and relevance to European stakeholders, the predictive capacity in absolute terms should not be overestimated. The validation exercise (Table B1) shows that even in historical years there are minor, though not always negligible, differences between the model and official EU statistics, especially at the country level, driven by structural simplifications in the model. Therefore, model results – and in particular country-level results – should be interpreted with consideration of these deviations, ideally focusing on relative changes.
Furthermore, the higher level of disaggregation aims to better address Europe-specific research questions, but it does not aim to substitute the current representation of the European continent in the GCAM-Core version. The extra level of complexity introduces additional technical challenges that are unnecessary for a model designed to maintain a global perspective. In particular, the expanded number of markets and the new electricity grid structure make the model significantly more memory-intensive, resulting in longer overall run times. As in other models, the inclusion of policy scenarios further constrains the system, increasing computational demands. In the case of GCAM-Europe, these demands can reach technical thresholds that make it more suitable to run in a cluster computer. Beyond computational challenges, the development of a regional version of the model also entails important data-related difficulties that are likely to be relevant for other modelling efforts. In particular, the absence of country-level information in key databases (e.g., Eurostat) often necessitates filling data gaps with alternative sources, such as global balances or national statistics. This process requires extensive harmonization to ensure consistency across datasets and represents a substantial component of the overall modelling effort.
Finally, incorporating modelling European policy frameworks, such as the Fit for 55 package and the National Energy and Climate Plans (NECPs), requires systematic validation of model outputs against the most recent historical data and short-term trends to ensure the relevance of the produced results (Rodrigues et al., 2026). The implementation of an automatized validation process is planned for near-term integration and will follow established protocols for model validation (Weigmann et al., 2025) and feasibility assessment (Brutschin et al., 2021). In this line, the model is planned to remain under continuous development, progressively integrating features from successive releases of the core GCAM model, while also further improving the detailed European representation of the model in future versions of GCAM-Europe to enable the implementation of more policy-relevant exercises. In the near term, the most immediate update will be the incorporation of features from GCAM v8.2 (Joint Global Change Research Institute, 2025b), which includes the shift of the final calibration year to 2021. As the current version of GCAM-Europe is calibrated to 2015, adopting this updated calibration will better align the model with recent techno-economic assumptions and is therefore expected to improve the robustness and reliability of future projections.
Regarding consumer heterogeneity, the core GCAM model includes multiple consumers in the form of income deciles only in the residential sector, and allocates different residential energy services across consumers using exogenous assumptions based on the form of the demand function within each of the sectors. GCAM-Europe is planned to incorporate multiple consumers in all end-use sectors, namely food, transportation and municipal water. The within-region allocation of energy services across consumers will be improved by using country-level empirical data from the country-level Household Budget Surveys (HBS), which are available for all EU-27 Member States. In addition, we plan to explore new dimensions of consumer heterogeneity beyond income groups, including urban–rural distinctions, gender, and subregional classifications (e.g., NUTS levels). Finally, additional model expansion plans are under consideration, contingent on data availability. These include endogenizing industrial material use and building efficiency improvements, enhancing the representation of technology adoption, and refining consumer-specific elasticities to better capture behavioural responses. Further planned developments also involve sectoral and technological refinements, such as disaggregating diesel and gasoline vehicles, improving the representation of district heating, or incorporating hydrogen trade.
Table A1Overview of the GCAM-Europe regions, and comparison with the core model.
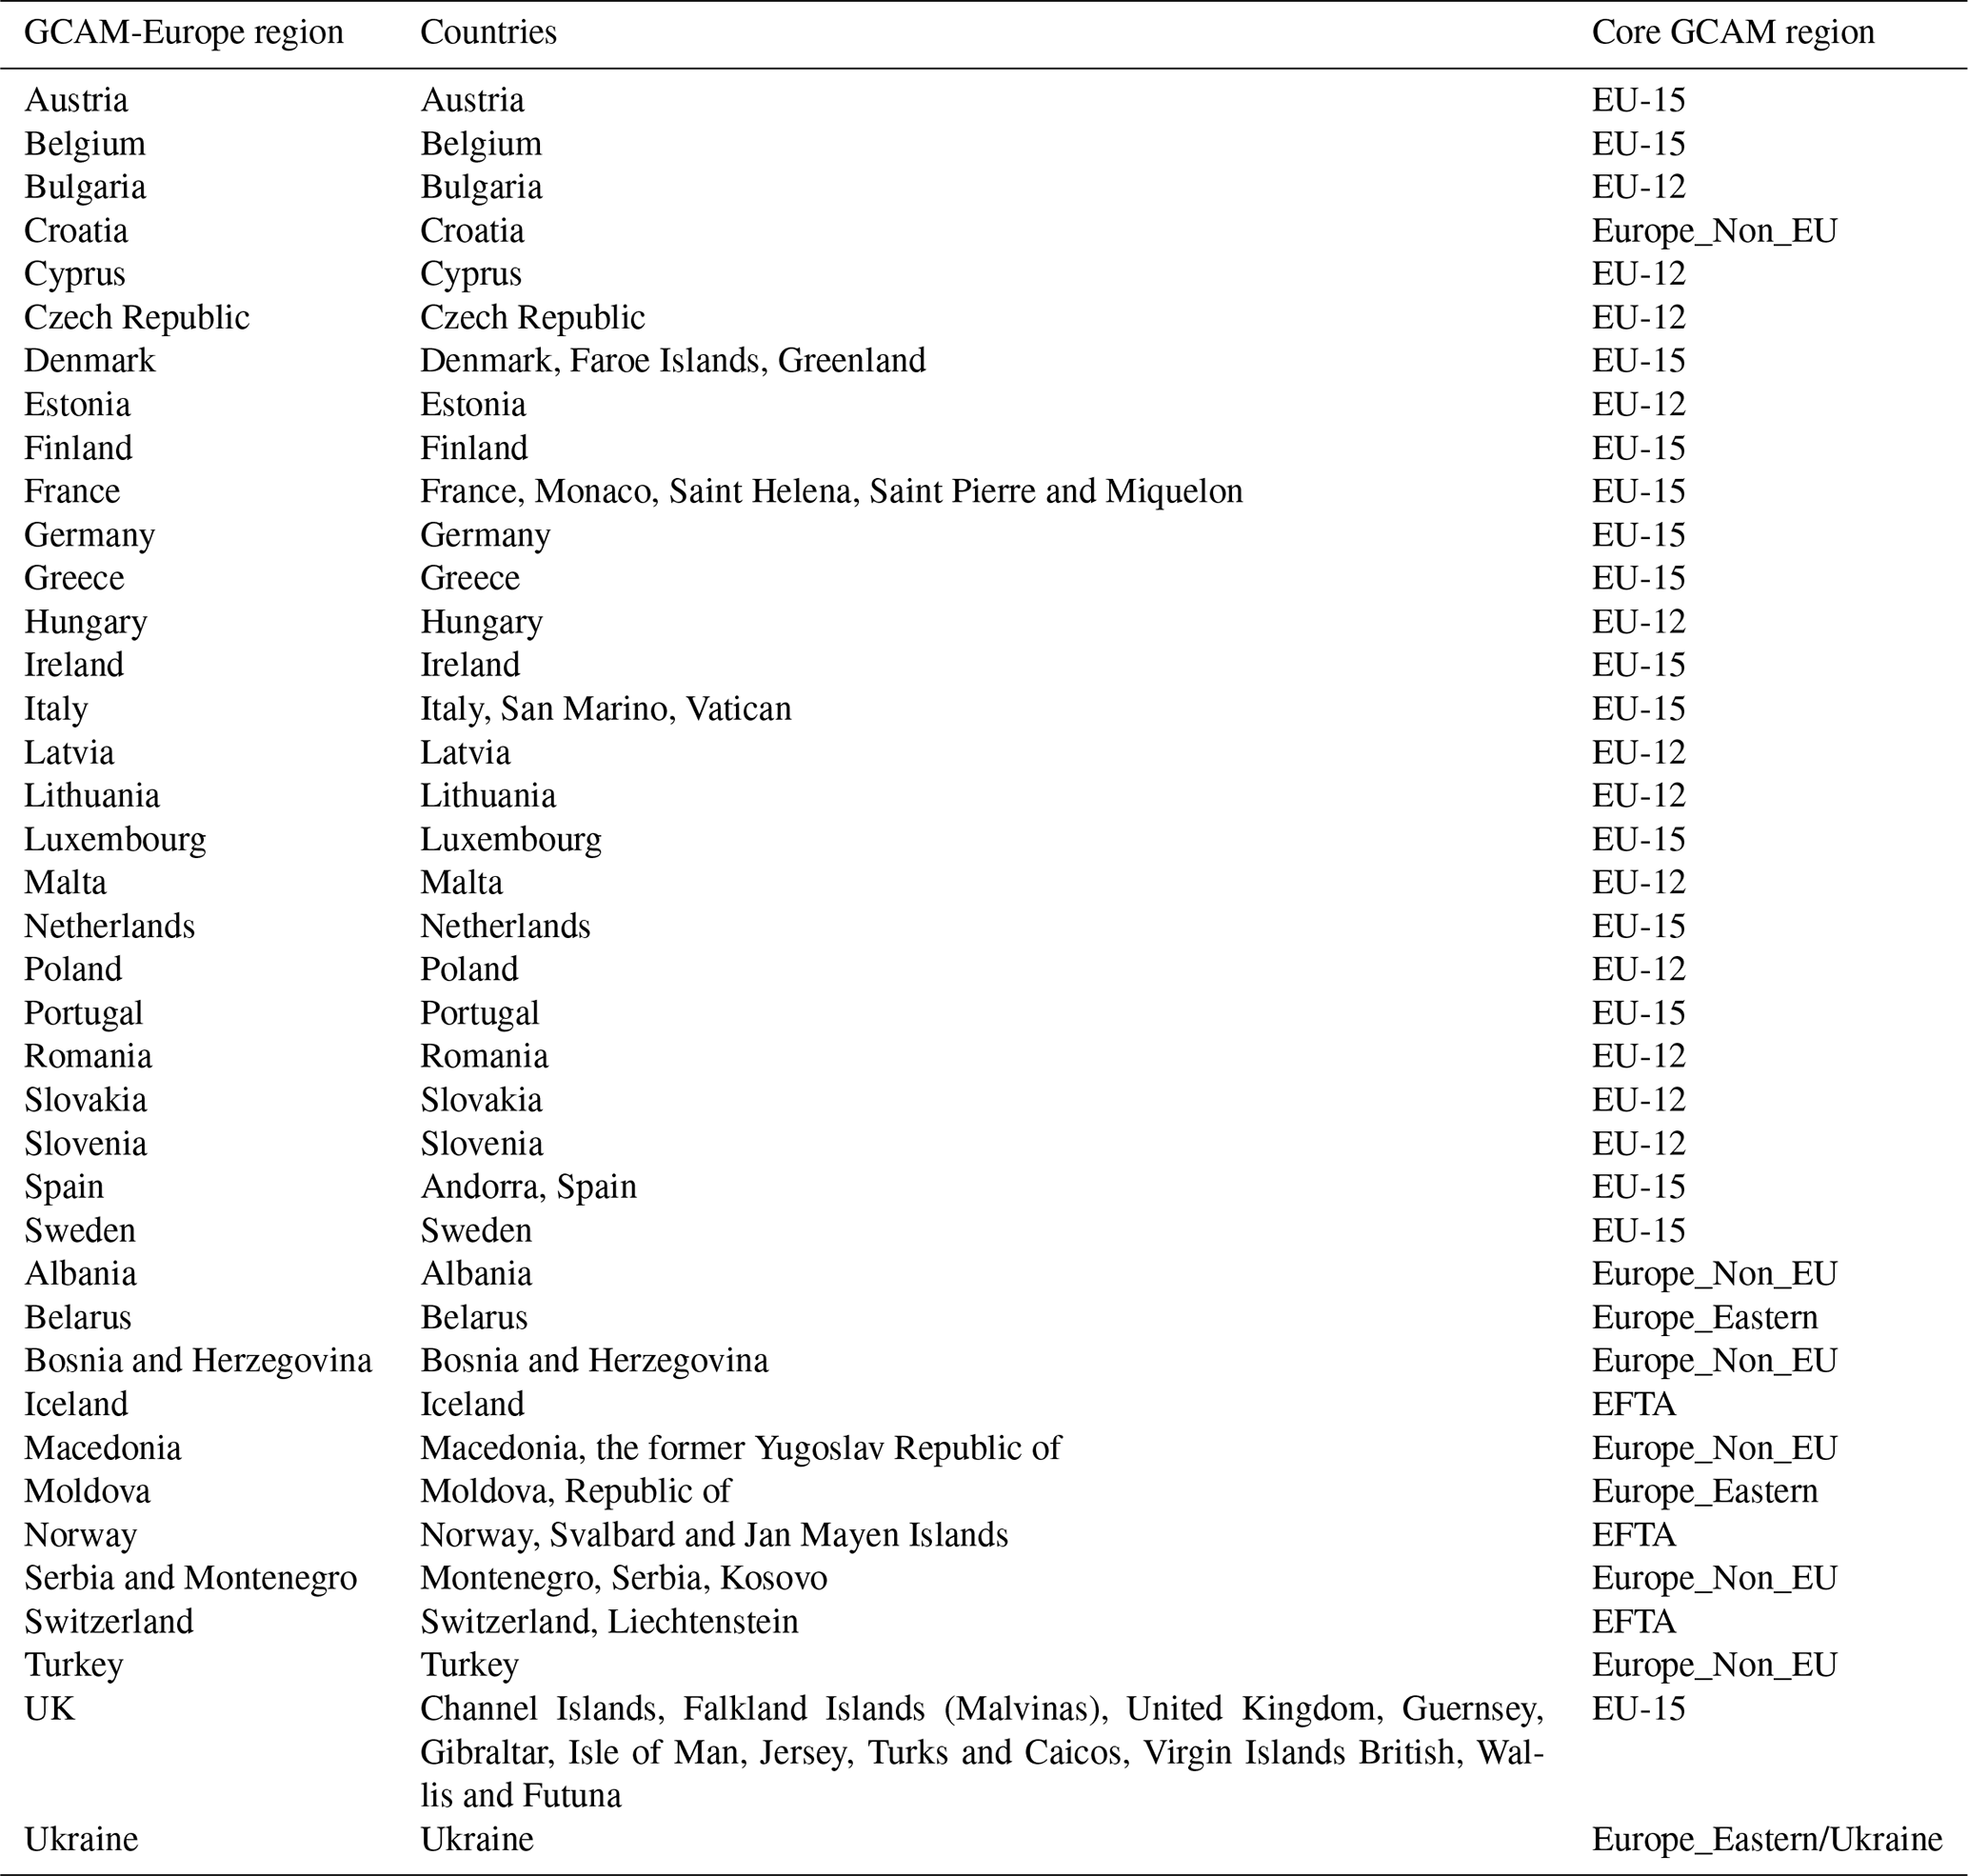
Table B1Comparison between GCAM-Europe outputs and historical data in 2015.
The current version of GCAM-Europe is available from the project website https://github.com/bc3LC-GCAMEurope/gcam-core (last access: 17 August 2026) under the Educational Community License, Version 2.0 (ECL-2.0) licence. The exact version of the model used to produce the results used in this paper (GCAM-Europe v7.2.0) is archived on Zenodo under https://doi.org/10.5281/zenodo.15655568 (Sampedro et al., 2025). The code for reproducing the results and generating the figures has been stored in an open-access repository: https://github.com/bc3LC-GCAMEurope/sampedro_etal_gcameurope (last access: 17 August 2026). A detailed documentation for all the input assumptions used in the core GCAM model can be found in the following open-access repository: https://github.com/JGCRI/gcam-doc (Joint Global Change Research Institute, 2025b).
The repository (https://github.com/bc3LC-GCAMEurope/sampedro_etal_gcameurope) provides the code and processed data needed to reproduce all figures and tables in this paper.
The supplement related to this article is available online at https://doi.org/10.5194/gmd-19-7741-2026-supplement.
All the authors contributed to the development of the model. JS wrote the original draft and RH, CR and DV contributed to Writing (review and editing). DV contributed to Funding acquisition.
The contact author has declared that none of the authors has any competing interests.
The views and opinions expressed in this paper are those of the authors alone.
Publisher's note: Copernicus Publications remains neutral with regard to jurisdictional claims made in the text, published maps, institutional affiliations, or any other geographical representation in this paper. The authors bear the ultimate responsibility for providing appropriate place names. Views expressed in the text are those of the authors and do not necessarily reflect the views of the publisher.
The authors acknowledge the entire GCAM development team at the Joint Global Change Research Institute and at the Centre for Global Sustainability. In particular, they thank Pralit Patel, Matthew Binsted, Steven Smith, Andy Miller, Christoph Bertram, and Ryna Cui for their support during the development of the model. The authors also acknowledge Natasha Frilingou and Alexandros Nikas for their support in the model validation activities. The authors acknowledge the use of Artificial Intelligence (AI), exclusively for language and grammar checks.
This research is supported by the Horizon Europe European Commission Project `DIAMOND' (grant no. 101081179). The authors also acknowledge financial support from María de Maeztu Excellence Unit 2023-2027 Ref. CEX2021-001201-M, funded by MCIN/AEI /10.13039/501100011033; and by the Basque Government through the BERC 2022-2025 program. JS acknowledges financial support from the European Union's Horizon research program under grant agreement 101060679 (GRAPHICS project).
This paper was edited by Gunnar Luderer and reviewed by two anonymous referees.
Ackerman, F., DeCanio, S. J., Howarth, R. B., and Sheeran, K.: Limitations of integrated assessment models of climate change, Climatic Change, 95, 297–315, https://doi.org/10.1007/s10584-009-9570-x, 2009.
Aguiar, A., Chepeliev, M., Corong, E., and Mensbrugghe, D. van der: The Global Trade Analysis Project (GTAP) Data Base: Version 11, Journal of Global Economic Analysis, 7, https://doi.org/10.21642/JGEA.070201AF, 2022.
Anderson, K. and Jewell, J.: Debating the bedrock of climate-change mitigation scenarios, Nature, 573, 348–349, https://doi.org/10.1038/d41586-019-02744-9, 2019.
Armington, P. S.: A Theory of Demand for Products Distinguished by Place of Production (Une théorie de la demande de produits différenciés d'après leur origine)(Una teoría de la demanda de productos distinguiéndolos según el lugar de producción), Staff Papers-International Monetary Fund, 159–178, https://doi.org/https://doi.org/10.5089/9781451956245.024, 1969.
Bertram, C., Brutschin, E., Drouet, L., Luderer, G., van Ruijven, B., Aleluia Reis, L., Baptista, L. B., de Boer, H.-S., Cui, R., Daioglou, V., Fosse, F., Fragkiadakis, D., Fricko, O., Fujimori, S., Hultman, N., Iyer, G., Keramidas, K., Krey, V., Kriegler, E., Lamboll, R. D., Mandaroux, R., Rochedo, P., Rogelj, J., Schaeffer, R., Silva, D., Tagomori, I., van Vuuren, D., Vrontisi, Z., and Riahi, K.: Feasibility of peak temperature targets in light of institutional constraints, Nat. Clim. Change, 14, 954–960, https://doi.org/10.1038/s41558-024-02073-4, 2024.
Binsted, M., Iyer, G., Patel, P., Graham, N. T., Ou, Y., Khan, Z., Kholod, N., Narayan, K., Hejazi, M., Kim, S., Calvin, K., and Wise, M.: GCAM-USA v5.3_water_dispatch: integrated modeling of subnational US energy, water, and land systems within a global framework, Geosci. Model Dev., 15, 2533–2559, https://doi.org/10.5194/gmd-15-2533-2022, 2022.
Bistline, J. E. T., Binsted, M., Blanford, G., Boyd, G., Browning, M., Cai, Y., Edmonds, J., Fawcett, A. A., Fuhrman, J., Gao, R., Harris, C., Hoehne, C., Iyer, G., Johnson, J. X., Kaplan, P. O., Loughlin, D., Mahajan, M., Mai, T., McFarland, J. R., McJeon, H., Melaina, M., Mousavi, S. S., Muratori, M., Orvis, R., Prabhu, A., Rossmann, C., Sands, R. D., Sarmiento, L., Showalter, S., Sinha, A., Starke, E., Stewart, E., Vaillancourt, K., Weyant, J., Wood, F., and Yuan, M.: Policy implications of net-zero emissions: A multi-model analysis of United States emissions and energy system impacts, Energy and Climate Change, 6, 100191, https://doi.org/10.1016/j.egycc.2025.100191, 2025.
Braunreiter, L., van Beek, L., Hajer, M., and van Vuuren, D.: Transformative pathways – Using integrated assessment models more effectively to open up plausible and desirable low-carbon futures, Energy Research & Social Science, 80, 102220, https://doi.org/10.1016/j.erss.2021.102220, 2021.
Brutschin, E., Pianta, S., Tavoni, M., Riahi, K., Bosetti, V., Marangoni, G., and Van Ruijven, B. J.: A multidimensional feasibility evaluation of low-carbon scenarios, Environ. Res. Lett., 16, 064069, https://doi.org/10.1088/1748-9326/abf0ce, 2021.
Burleyson, C. D., Iyer, G., Hejazi, M., Kim, S., Kyle, P., Rice, J. S., Smith, A. D., Taylor, Z. T., Voisin, N., and Xie, Y.: Future western US building electricity consumption in response to climate and population drivers: A comparative study of the impact of model structure, Energy, 208, 118312, https://doi.org/10.1016/j.energy.2020.118312, 2020.
Calvin, K., Bond-Lamberty, B., Clarke, L., Edmonds, J., Eom, J., Hartin, C., Kim, S., Kyle, P., Link, R., and Moss, R.: The SSP4: A world of deepening inequality, Global Environ. Chang., 42, 284–296, 2017.
Calvin, K., Patel, P., Clarke, L., Asrar, G., Bond-Lamberty, B., Cui, R. Y., Di Vittorio, A., Dorheim, K., Edmonds, J., Hartin, C., Hejazi, M., Horowitz, R., Iyer, G., Kyle, P., Kim, S., Link, R., McJeon, H., Smith, S. J., Snyder, A., Waldhoff, S., and Wise, M.: GCAM v5.1: representing the linkages between energy, water, land, climate, and economic systems, Geosci. Model Dev., 12, 677–698, https://doi.org/10.5194/gmd-12-677-2019, 2019.
Capros, P., Van Regemorter, D., Paroussos, L., Karkatsoulis, P., Fragkiadakis, C., Tsani, S., Charalampidis, I., Revesz, T., Perry, M., and Abrell, J.: GEM-E3 model documentation, JRC Scientific and Policy Reports, 26034, https://doi.org/10.2788/47872, 2013.
Center for Global Sustainability at University of Maryland, Department of Earth System Science at Tsinghua University, and College of Environmental Sciences and Engineering at Peking University: umd-cgs/gcam-china: gcam-china-v7.1 (Version gcam-china-v7.1), Zenodo [code], https://doi.org/10.5281/zenodo.15499108, 2025.
Criqui, P., Mima, S., Menanteau, P., and Kitous, A.: Mitigation strategies and energy technology learning: An assessment with the POLES model, Technol. Forecast. Soc., 90, 119–136, https://doi.org/10.1016/j.techfore.2014.05.005, 2015.
Dooley, K., Christiansen, K. L., Lund, J. F., Carton, W., and Self, A.: Over-reliance on land for carbon dioxide removal in net-zero climate pledges, Nat. Commun., 15, 9118, https://doi.org/10.1038/s41467-024-53466-0, 2024.
Emmerling, J., Andreoni, P., Charalampidis, I., Dasgupta, S., Dennig, F., Feindt, S., Fragkiadakis, D., Fragkos, P., Fujimori, S., Gilli, M., Grottera, C., Guivarch, C., Kornek, U., Kriegler, E., Malerba, D., Marangoni, G., Méjean, A., Nijsse, F., Piontek, F., Simsek, Y., Soergel, B., Taconet, N., Vandyck, T., Young-Brun, M., Zhao, S., Zheng, Y., and Tavoni, M.: A multi-model assessment of inequality and climate change, Nat. Clim. Change, 14, 1254–1260, https://doi.org/10.1038/s41558-024-02151-7, 2024.
ENTSOE: TYNDP 2024 Scenarios Report, https://tyndp.entsoe.eu/resources/tyndp2024-scenarios-report (last access: 17 August 2026), 2024.
European Commission: 2024 Ageing Report, Economic and Budgetary Projections for the EU Member States (2022–2070), https://doi.org/10.2765/022983, 2024.
Eurostat: Complete energy balances, https://doi.org/10.2908/NRG_BAL_C, 2025a.
Eurostat: Disaggregated final energy consumption in households – quantities, https://doi.org/10.2908/NRG_D_HHQ, 2025b.
Eurostat: EU harmonised household budget survey (HBS) microdata, https://ec.europa.eu/eurostat/web/microdata/collections-research/household-budget-survey (last access: 17 August 2026), 2025c.
Farrokhi, F. and Lashkaripour, A.: Can Trade Policy Mitigate Climate Change?, Econometrica, 93, 1561–1599, https://doi.org/10.3982/ECTA20153, 2025.
Fisher-Vanden, K. and Weyant, J.: The evolution of integrated assessment: Developing the next generation of use-inspired integrated assessment tools, Annu. Rev. Resour. Econ., 12, 471–487, 2020.
Frilingou, N., Van de Ven, D.-J., Sampedro, J., Torné, A., Trutnevyte, E., Horowitz, R., Rodés-Bachs, C., Koasidis, K., Mittal, S., Xexakis, G., and Nikas, A.: Cost-optimal vs. policy-driven scenarios for a decarbonised European energy system, Environ. Res. Lett., 21, 034023, https://doi.org/10.1088/1748-9326/ae3f45, 2026.
Gago, D., Nijs, W., Ruiz, C. P., Sgobbi, A., Radu, D., Bolat, P., Thiel, C., and Peteves, E.: The JRC-EU-TIMES model-Assessing the long-term role of the SET Plan Energy technologies, https://doi.org/10.2790/97596, 2013.
Gambhir, A., Butnar, I., Li, P.-H., Smith, P., and Strachan, N.: A Review of Criticisms of Integrated Assessment Models and Proposed Approaches to Address These, through the Lens of BECCS, Energies, 12, 1747, https://doi.org/10.3390/en12091747, 2019.
Geels, F. W., Berkhout, F., and van Vuuren, D. P.: Bridging analytical approaches for low-carbon transitions, Nat. Clim. Change, 6, 576–583, https://doi.org/10.1038/nclimate2980, 2016.
Hertel, T., Hummels, D., Ivanic, M., and Keeney, R.: How confident can we be of CGE-based assessments of Free Trade Agreements?, Economic Model., 24, 611–635, https://doi.org/10.1016/j.econmod.2006.12.002, 2007.
IAMC: IAMC Documentation Wiki, https://www.iamcdocumentation.eu/IAMC_wiki (last access: 17 August 2026), 2022.
IEA: Electricity Information 2017, IEA, Paris, https://doi.org/10.1787/electricity-2017-en, 2017.
International Atomic Energy Agency: The Climate, Land, Energy and Water Framework, IAEA TECDOC Series No. 2065, IAEA, Vienna, https://doi.org/10.61092/iaea.uiu5-lz0j, 2024.
International Energy Agency (IEA): World Energy Balances 2022, https://www.iea.org/data-and-statistics/data-product/world-energy-balances (last access: 17 August 2026), 2022.
IPCC: Climate Change 2022: Mitigation of Climate Change. Contribution of Working Group III to the Sixth Assessment Report of the Intergovernmental Panel on Climate Change, edited by: Shukla, P. R., Skea, J., Slade, R., Al Khourdajie, A., van Diemen, R., McCollum, D., Pathak, M., Some, S., Vyas, P., Fradera, R., Belkacemi, M., Hasija, A., Lisboa, G., Luz, S., and Malley, J., https://doi.org/10.1017/9781009157926, 2022.
Jakob, M.: Climate policy and international trade – A critical appraisal of the literature, Energy Policy, 156, 112399, https://doi.org/10.1016/j.enpol.2021.112399, 2021.
Jeon, S., Roh, M., and Kim, S.: The derivation of sectoral and provincial implications from power sector scenarios using an integrated assessment model at Korean provincial level: GCAM-Korea, Energy Strateg. Rev., 38, 100694, https://doi.org/10.1016/j.esr.2021.100694, 2021.
Joint Global Change Research Institute: GCAM Documentation, Zenodo, https://doi.org/10.5281/zenodo.15581183, 2025a.
Joint Global Change Research Institute: GCAM Documentation, Zenodo, https://doi.org/10.5281/zenodo.15581183, 2025b.
Keppo, I., Butnar, I., Bauer, N., Caspani, M., Edelenbosch, O., Emmerling, J., Fragkos, P., Guivarch, C., Harmsen, M., and Lefevre, J.: Exploring the possibility space: taking stock of the diverse capabilities and gaps in integrated assessment models, Environ. Res. Lett., 16, 053006, https://doi.org/10.1088/1748-9326/abe5d8, 2021.
Kikstra, J. S., Nicholls, Z. R. J., Smith, C. J., Lewis, J., Lamboll, R. D., Byers, E., Sandstad, M., Meinshausen, M., Gidden, M. J., Rogelj, J., Kriegler, E., Peters, G. P., Fuglestvedt, J. S., Skeie, R. B., Samset, B. H., Wienpahl, L., van Vuuren, D. P., van der Wijst, K.-I., Al Khourdajie, A., Forster, P. M., Reisinger, A., Schaeffer, R., and Riahi, K.: The IPCC Sixth Assessment Report WGIII climate assessment of mitigation pathways: from emissions to global temperatures, Geosci. Model Dev., 15, 9075–9109, https://doi.org/10.5194/gmd-15-9075-2022, 2022.
Koasidis, K., Nikas, A., and Doukas, H.: Why integrated assessment models alone are insufficient to navigate us through the polycrisis, One Earth, 6, 205–209, 2023.
Lamb, W. F., Gasser, T., Roman-Cuesta, R. M., Grassi, G., Gidden, M. J., Powis, C. M., Geden, O., Nemet, G., Pratama, Y., Riahi, K., Smith, S. M., Steinhauser, J., Vaughan, N. E., Smith, H. B., and Minx, J. C.: The carbon dioxide removal gap, Nat. Clim. Change, 14, 644–651, https://doi.org/10.1038/s41558-024-01984-6, 2024.
Li, H., Zhao, Y., and Lin, J.: A review of the energy–carbon–water nexus: Concepts, research focuses, mechanisms, and methodologies, WIREs Energy Environ., 9, e358, https://doi.org/10.1002/wene.358, 2020.
Low, S., Brutschin, E., Baum, C. M., and Sovacool, B. K.: Expert perspectives on incorporating justice considerations into integrated assessment modelling, npj Climate Action, 4, 10, https://doi.org/10.1038/s44168-025-00218-5, 2025.
Oberthür, S. and Dupont, C.: The European Union's international climate leadership: towards a grand climate strategy?, J. Eur. Public Policy, 28, 1095–1114, https://doi.org/10.1080/13501763.2021.1918218, 2021.
O'Neill, B. C., Kriegler, E., Riahi, K., Ebi, K. L., Hallegatte, S., Carter, T. R., Mathur, R., and van Vuuren, D. P.: A new scenario framework for climate change research: the concept of shared socioeconomic pathways, Climatic Change, 122, 387–400, https://doi.org/10.1007/s10584-013-0905-2, 2014.
Peters, G. P. and Hertwich, E. G.: CO2 Embodied in International Trade with Implications for Global Climate Policy, Environ. Sci. Technol., 42, 1401–1407, https://doi.org/10.1021/es072023k, 2008.
Ramos, A., Alvarez, E. F., and Lumbreras, S.: OpenTEPES: Open-source Transmission and Generation Expansion Planning, SoftwareX, 18, 101070, https://doi.org/10.1016/j.softx.2022.101070, 2022.
Reid, W. V., Ali, M. K., and Field, C. B.: The future of bioenergy, Glob. Change Biol., 26, 274–286, https://doi.org/10.1111/gcb.14883, 2020.
Riemer, M., Wachsmuth, J., Boitier, B., Elia, A., Al-Dabbas, K., Alibaş, Ş., Chiodi, A., and Neuner, F.: How do system-wide net-zero scenarios compare to sector model pathways for the EU? A novel approach based on benchmark indicators and index decomposition analyses, Energy Strateg. Rev., 50, 101225, https://doi.org/10.1016/j.esr.2023.101225, 2023.
Rodés-Bachs, C., Sampedro, J., Amich, M., Nikas, A., Koasidis, K., Belis, C. A., and Van de Ven, D.-J.: A Socioeconomic Assessment of Projected Health Impacts from Outdoor Air Pollution under Current European Climate Policy, https://doi.org/10.2139/ssrn.5597772, 14 October 2025.
Rodrigues, R., Pietzcker, R., Sitarz, J., Merfort, A., Hasse, R., Hoppe, J., Pehl, M., Ershad, A. M., Muessel, J., Schreyer, F., Baumstark, L., and Luderer, G.: 2040 greenhouse gas reduction targets and energy transitions in line with the EU Green Deal, Nat. Commun., 17, 3417, https://doi.org/10.1038/s41467-026-71159-8, 2026.
Ruiz, P., Nijs, W., Tarvydas, D., Sgobbi, A., Zucker, A., Pilli, R., Jonsson, R., Camia, A., Thiel, C., Hoyer-Klick, C., Dalla Longa, F., Kober, T., Badger, J., Volker, P., Elbersen, B. S., Brosowski, A., and Thrän, D.: ENSPRESO – an open, EU-28 wide, transparent and coherent database of wind, solar and biomass energy potentials, Energy Strateg. Rev., 26, 100379, https://doi.org/10.1016/j.esr.2019.100379, 2019.
Sampedro, J., Waldhoff, S. T., Edmonds, J. A., Iyer, G., Msangi, S., Narayan, K. B., Patel, P., and Wise, M.: Residential energy demand, emissions, and expenditures at regional and income-decile level for alternative futures, Environm. Res. Lett., 19, 084031, https://doi.org/10.1088/1748-9326/ad6015, 2024.
Sampedro, J., Horowitz, R., Rodés Bachs, C., and Van de Ven, D.-J.: GCAM-Europe v7.2.0, Zenodo [code], https://doi.org/10.5281/zenodo.15655568, 2025.
Skea, J., Shukla, P., Al Khourdajie, A., and McCollum, D.: Intergovernmental Panel on Climate Change: Transparency and integrated assessment modeling, Wires Clim. Change, 12, e727, https://doi.org/10.1002/wcc.727, 2021.
Sognnaes, I. and Peters, G. P.: Influence of individual models and studies on quantitative mitigation findings in the IPCC Sixth Assessment Report, Nat. Commun., 16, 8343, https://doi.org/10.1038/s41467-025-64091-w, 2025.
Srinivasan, S., Kholod, N., Chaturvedi, V., Ghosh, P. P., Mathur, R., Clarke, L., Evans, M., Hejazi, M., Kanudia, A., Koti, P. N., Liu, B., Parikh, K. S., Ali, M. S., and Sharma, K.: Water for electricity in India: A multi-model study of future challenges and linkages to climate change mitigation, Appl. Energ., 210, 673–684, https://doi.org/10.1016/j.apenergy.2017.04.079, 2018.
van Beek, L., Hajer, M., Pelzer, P., van Vuuren, D., and Cassen, C.: Anticipating futures through models: the rise of Integrated Assessment Modelling in the climate science-policy interface since 1970, Global Environ. Chang., 65, 102191, https://doi.org/10.1016/j.gloenvcha.2020.102191, 2020.
van de Ven, D.-J., Mittal, S., Gambhir, A., Lamboll, R. D., Doukas, H., Giarola, S., Hawkes, A., Koasidis, K., Köberle, A. C., and McJeon, H.: A multimodel analysis of post-Glasgow climate targets and feasibility challenges, Na. Clim. Change, 1–9, https://doi.org/10.1038/s41558-023-01661-0, 2023.
Vandyck, T., Rauner, S., Sampedro, J., Lanzi, E., Reis, L. A., Springmann, M., and Van Dingenen, R.: Integrate health into decision-making to foster climate action, Environ. Res. Lett., 16, 041005, https://doi.org/10.1088/1748-9326/abef8d, 2021.
Van Vuuren, D. P., O'Neill, B. C., Tebaldi, C., Sanderson, B. M., Chini, L. P., Friedlingstein, P., Hasegawa, T., Riahi, K., Govindasamy, B., Bauer, N., Eyring, V., Fall, C. M. N., Frieler, K., Gidden, M. J., Gohar, L. K., Högner, A., Jones, A. D., Kikstra, J., King, A., Knutti, R., Kriegler, E., Lawrence, P., Lennard, C., Lowe, J., Mathison, C., Mehmood, S., Nicholls, Z., Prado, L. F., Zhang, Q., Rose, S. K., Ruane, A. C., Sandstad, M., Schleussner, C.-F., Seferian, R., Sillmann, J., Smith, C., Sörensson, A. A., Panickal, S., Tachiiri, K., Vaughan, N., Vishwanathan, S. S., Yokohata, T., Zecchetto, M., and Ziehn, T.: The Scenario Model Intercomparison Project for CMIP7 (ScenarioMIP-CMIP7), Geosci. Model Dev., 19, 2627–2656, https://doi.org/10.5194/gmd-19-2627-2026, 2026.
Weigmann, P., Mandaroux, R., Lécuyer, F., Merfort, A., Dorndorf, T., Hoppe, J., Muessel, J., Pietzcker, R., Richters, O., Baumstark, L., Kriegler, E., Bauer, N., Benke, F., Gong, C. C., and Luderer, G.: Validation of climate mitigation pathways, Geosci. Model Dev., 18, 9897–9912, https://doi.org/10.5194/gmd-18-9897-2025, 2025.
Weyant, J.: Some contributions of integrated assessment models of global climate change, Rev. Env. Econ. Policy, https://doi.org/10.1093/reep/rew018, 2017.
Zhao, A., O'Keefe, K. T. V., Binsted, M., McJeon, H., Bryant, A., Squire, C., Zhang, M., Smith, S. J., Cui, R., Ou, Y., Iyer, G., Kennedy, S., and Hultman, N.: High-ambition climate action in all sectors can achieve a 65 % greenhouse gas emissions reduction in the United States by 2035, npj Clim. Action, 3, 63, https://doi.org/10.1038/s44168-024-00145-x, 2024.
Zhao, X. and Wise, M.: Core Model Proposal #360: GCAM agriculture and land use (AgLU) data and method updates: connecting land hectares to food calories, https://doi.org/10.13140/RG.2.2.34673.29282, 2023.
Zhao, X., Calvin, K. V., Wise, M. A., and Iyer, G.: The role of global agricultural market integration in multiregional economic modeling: Using hindcast experiments to validate an Armington model, Economic Analysis and Policy, 72, 1–17, 2021.
Zhao, X., Wise, M. A., Waldhoff, S. T., Kyle, G. P., Huster, J. E., Ramig, C. W., Rafelski, L. E., Patel, P. L., and Calvin, K. V.: The impact of agricultural trade approaches on global economic modeling, Global Environ. Chang., 73, 102413, https://doi.org/10.1016/j.gloenvcha.2021.102413, 2022.
- Abstract
- Introduction
- Model description
- Results
- Implementation of the European climate policy portfolio
- Discussion and conclusion
- Appendix A: GCAM-Europe regions
- Appendix B: GCAM-Europe outputs
- Code and data availability
- Interactive computing environment (ICE)
- Author contributions
- Competing interests
- Disclaimer
- Acknowledgements
- Financial support
- Review statement
- References
- Supplement
- Abstract
- Introduction
- Model description
- Results
- Implementation of the European climate policy portfolio
- Discussion and conclusion
- Appendix A: GCAM-Europe regions
- Appendix B: GCAM-Europe outputs
- Code and data availability
- Interactive computing environment (ICE)
- Author contributions
- Competing interests
- Disclaimer
- Acknowledgements
- Financial support
- Review statement
- References
- Supplement