
the Creative Commons Attribution 4.0 License.
the Creative Commons Attribution 4.0 License.
 | 03 Aug 2026
Reduced Complexity Model Intercomparison Project phase 3: experimental protocol for coordinated constraining and evaluation of reduced-complexity models
Alejandro Romero-Prieto
Marit Sandstad
Benjamin M. Sanderson
Zebedee R. J. Nicholls
Norman J. Steinert
Thomas Gasser
Camilla Mathison
Jarmo Kikstra
Thomas J. Aubry
Katsumasa Tanaka
Konstantin Weber
Chris Smith
Reduced-Complexity Models (RCMs) are a critical tool for synthesising climate science knowledge and providing climate projections for a wide range of emissions scenarios. The Reduced-Complexity Model Intercomparison Project (RCMIP) provides a framework for the coordinated evaluation and application of these models. Here, we introduce the experimental protocol for RCMIP Phase 3 (RCMIP3), which is timed to inform the upcoming seventh assessment cycle of the Intergovernmental Panel on Climate Change (IPCC AR7). Taking stock of lessons from previous phases, RCMIP3 builds on community climate assessment products to support a common framework to compare RCM output against historical climate benchmarks. The experimental design aims to support a comprehensive assessment of RCMs across multiple climate-relevant domains, with a particular focus on carbon cycle dynamics and climate reversibility. The protocol is designed in tandem with the Coupled Model Intercomparison Project Phase 7 (CMIP7), replicating its “Assessment Fast Track” together with complementary experiments which explore wider state dependencies, sampling multiple scenario generations, long timescale response and diverse emissions-driven process representation.
- Article
(2364 KB) - Full-text XML
-
Supplement
(36571 KB) - BibTeX
- EndNote


Reduced-Complexity Models (RCMs), also known as Simple Climate Models (SCMs), are a highly parametrised variety of climate models designed to simulate Earth system dynamics in a computationally efficient manner. To achieve this, RCMs operate at low spatial and temporal resolutions, typically using global-mean annual averages, and represent many processes through parametrisation rather than explicit simulation. For instance, their temperature components commonly consist of zero-dimensional energy balance models that translate the imbalance between incoming and outgoing radiation into changes in global mean temperature. The nature and diversity of RCMs are discussed in greater detail by Romero-Prieto et al. (2026a).
As a result of this efficiency, RCMs play an indispensable role in the climate science and policy landscape. By capturing the fundamental dynamics of the global climate system and carbon cycle with vastly greater computational speed than Earth System Models (ESMs), they enable systematic exploration of parametric and structural uncertainties across large numbers of climate simulations and the probabilistic quantification of uncertainty, tasks which are infeasible for ESMs alone. Further, the transparency and modularity of many RCMs allows for direct assessments of key physical and biogeochemical processes, thereby providing insights into the drivers of uncertainty. As such, RCMs enable the rapid integration of emerging scientific understanding, supporting real-time assessment of climate mitigation pathways, temperature goals and feedback sensitivities. Moreover, the absence of chaotic behaviour in these models enables the evaluation of climate impacts arising from comparatively small forcings that would otherwise be undistinguishable from interannual variability in ESMs. For instance, RCMs are a key tool in the calculation of the Social Cost from additional emissions of greenhouse gases (GHGs, Rennert et al., 2022; EPA, 2023). These capabilities make them a vital accompaniment for process-resolving models for the assessment reports of the Intergovernmental Panel on Climate Change (IPCC).
RCMs have a long history of important scientific applications. Examples include assessing climate outcomes from Integrated Assessment Model (IAM)-derived emissions scenarios (Nicholls et al., 2022), direct coupling with IAMs (Baumstark et al., 2021; Stehfest et al., 2014; Hartin et al., 2021), providing non-CO2 adjustments to the remaining carbon budget (Lamboll et al., 2023), producing rapid answers in response to climate policy announcements (Bertram et al., 2021), and assessing uncertainties induced by volcanic forcing on climate projections (Chim et al., 2025), to name a few. However, the trustworthiness of RCMs relies on their simulation skill. They need to be able to adequately emulate the behaviour of more complex climate models (Smith et al., 2024), to appropriately reproduce large-scale indicators of observed climate (Forster et al., 2025), and produce plausible projections of past and future climate change (Smith et al., 2021; Verkerk et al., 2025).
The Reduced-Complexity Model Intercomparison Project (RCMIP) was established to bring a coordinated and systematic approach to the use and analysis of these models. The first two phases of RCMIP (Nicholls et al., 2020, 2021) focused on global responses to emissions scenarios. RCMIP Phase 1 (Nicholls et al., 2020) provided a standardised protocol for generating the global-mean temperature projections for the IPCC's Sixth Assessment Report (AR6), demonstrating that the ensemble of RCMs was fit-for-purpose in reproducing historical warming and emulating the behaviour of the more complex models from CMIP5. This first protocol requested a single best-estimate ensemble member from each model provided, with the stipulation that this member should have an equilibrium climate sensitivity of 3 °C. RCMIP Phase 2 (Nicholls et al., 2021) shifted focus from projection to evaluation, performing a deep diagnostic “stress test” of the probabilistic setups of various RCMs against a wide range of observational and ESM-derived benchmarks. A key finding was that no single model perfectly captured all assessed metrics, highlighting the importance of model diversity and the need to understand model-specific strengths and weaknesses.
These previous phases have provided critical lessons that motivate the design of RCMIP Phase 3 for the IPCC-AR7 cycle. Firstly, the model-specific calibration approaches used in Phase 1 made it difficult to disentangle the influence of model structural differences from calibration choices, limiting the robustness of structural uncertainty assessments. Further, an expanded evaluation beyond some key climate metrics such as global-mean temperature or effective radiative forcings was largely missing, limiting the ability to diagnose compensating errors and process-level biases. Moreover, with the scientific and policy focus demanding greater fidelity in understanding of net-zero emissions targets, a more rigorous evaluation of carbon cycle dynamics is required.
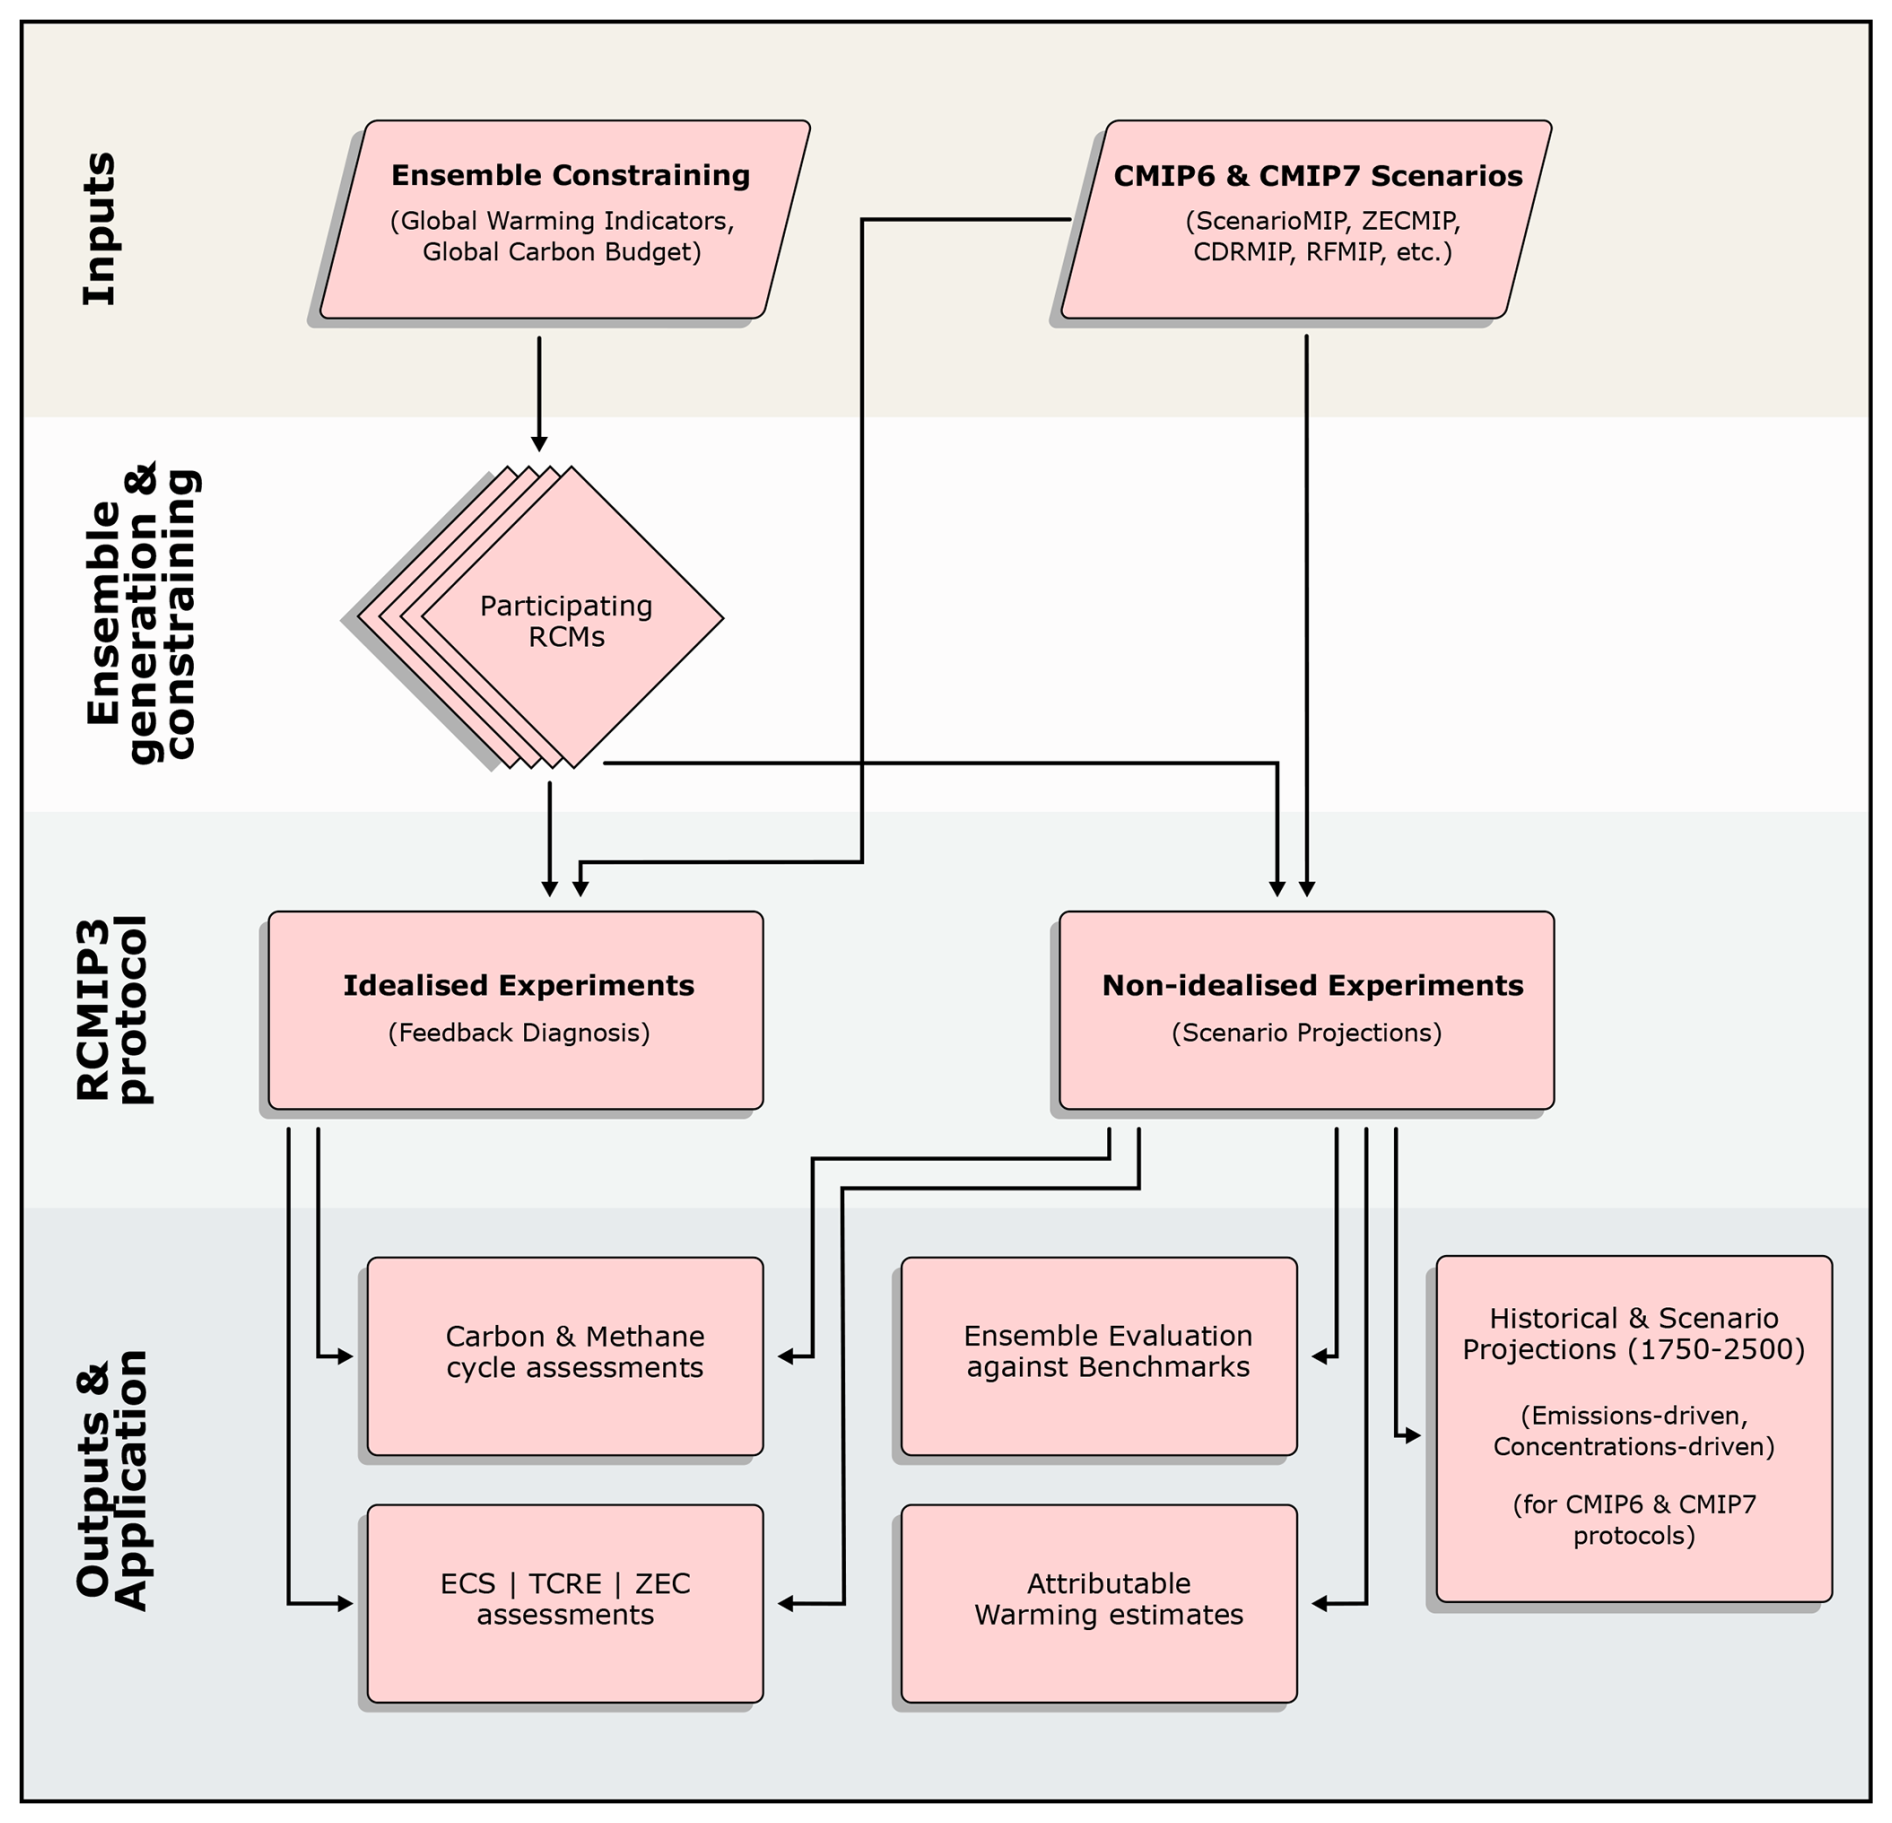
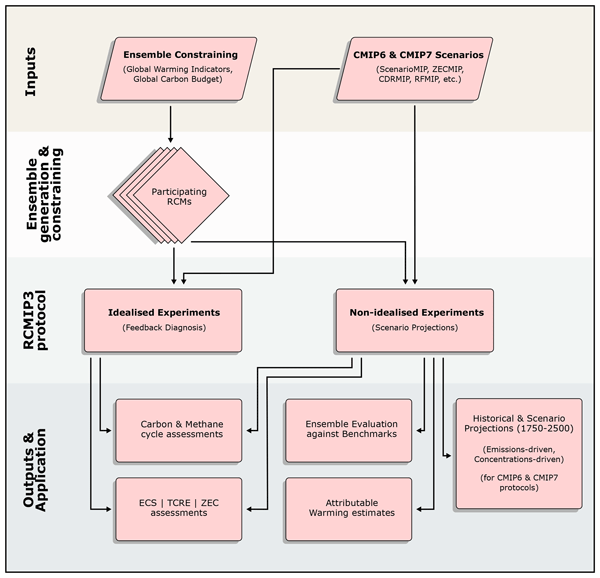
Figure 1General strategy of RCMIP3, with linkages to wider assessment efforts which feed into, and benefit from, RCMIP activities.
RCMIP Phase 3 (RCMIP3 hereafter) is therefore designed with two central goals: (1) to introduce a common, coordinated constraining protocol for model ensembles to enable a consistent assessment of inter-model structural differences, and (2) to focus the experimental design on key carbon cycle processes and climate indicators. This new phase is designed for maximum synergy with the upcoming Coupled Model Intercomparison Project Phase 7 (CMIP7) (Dunne et al., 2025). The increasing focus of CMIP7 on emissions-driven simulations (Sanderson et al., 2024), including the new idealised experiments from flat10MIP (Sanderson et al., 2025) which feature a constant CO2 emissions rate of 10 Gt C yr−1, provides a direct bridge to the native way of operating RCMs. RCMIP3 will leverage these synergies to provide rapid, probabilistic projections for CMIP7's “Assessment Fast Track” (AFT) experiments and to robustly assess key climate indicators like the Transient Climate Response to cumulative CO2 Emissions (TCRE) and the Zero Emissions Commitment (ZEC). These indicators are central to the latest assessments of the state of the climate system (Forster et al., 2021).
Notwithstanding this focus on carbon cycle evaluation, the protocol has been designed alongside the community to transcend these objectives and support a wider evaluation of climate simulation by RCMs. The data request includes a comprehensive list of variables covering different aspects of RCM climate simulation, as well as thematic experiments focusing on specific climate factors such as methane emissions. As a result, we expect this protocol to enable multiple evaluation studies associated with this data request.
This paper outlines the full experimental protocol for RCMIP3, as illustrated in Fig. 1. The protocol is structured to systematically evaluate model behaviour and provide projections relevant to the IPCC AR7. In the following, we describe the experimental design including the new suite of idealised and non-idealised scenarios (Sect. 2), the common constraining benchmarks (Sect. 3), and the required output variables (Sect. 4). Our goal is to enable a wide range of analyses based on this data request: carbon and methane cycle assessments, evaluations of key climate metrics such the TCRE and ZEC, and attributable warming studies.
The RCMIP3 experimental protocol has been compiled with broad community collaboration, following an open call for feedback on the draft protocol from RCM groups between August and October 2025. This allowed the co-design of the protocol with the wider RCM modelling community, incorporating input from representatives of multiple RCMs (ACC2, CICERO-SCM, FaIR, MAGICC, and OSCAR). The experiments are divided into two primary categories: idealised experiments designed to diagnose fundamental model properties, and non-idealised experiments that use comprehensive scenarios for historical simulation and future projection. The protocol is extensive, with 97 experiments in total, owing to the efficient nature of RCMs that enables this wider assessment. Notwithstanding, we have tiered our request, so that modelling teams can prioritise scenarios based on resource availability. The design and naming conventions of these experiments are consistent with those used in earlier MIPs where most of them were first formulated, thereby maintaining continuity across intercomparison projects and promoting consistency in interpretation. A spreadsheet with the full list of experiments, descriptions, durations and references is provided in the supplement materials (“scenario_info” sheet).
Input emissions, concentrations and forcing data (primarily natural forcing from solar cycles and volcanic eruptions) are provided for all experiments except those that need to be derived from model states (e.g., esm-1pct-brch-1000PgC). This input data includes an additional “spin-up” period of 1750–1850, which for idealised experiments is equal to piControl inputs, and for historical and scenario experiments are equal to historical inputs. Scenario durations are defined here as starting at the end of this spin-up period (see Tables 1 and 2). All inputs include data for the full 1750–2500 period, but for experiments of a shorter duration, the period post experiment is denoted by missing values. For experiments where we recommend a longer run length (typically 1000 years) it is up to the discretion of the modellers how long they wish to extend the experiment. For all these, the last part is a continuation of values prior in the time series, recommended to look at slow-timescale dynamics, and extending the emissions or concentrations beyond what is provided should be trivial. If running the full 1000 years is prohibitive, a higher number of simulations for a shorter time period is preferable. For the most part, running the provided 751 years (including spin-up) will be sufficient. Reporting the output for the spin-up period is also not mandatory, and it is not necessary for models to run the spin-up period if it is not required for one or more experiments.
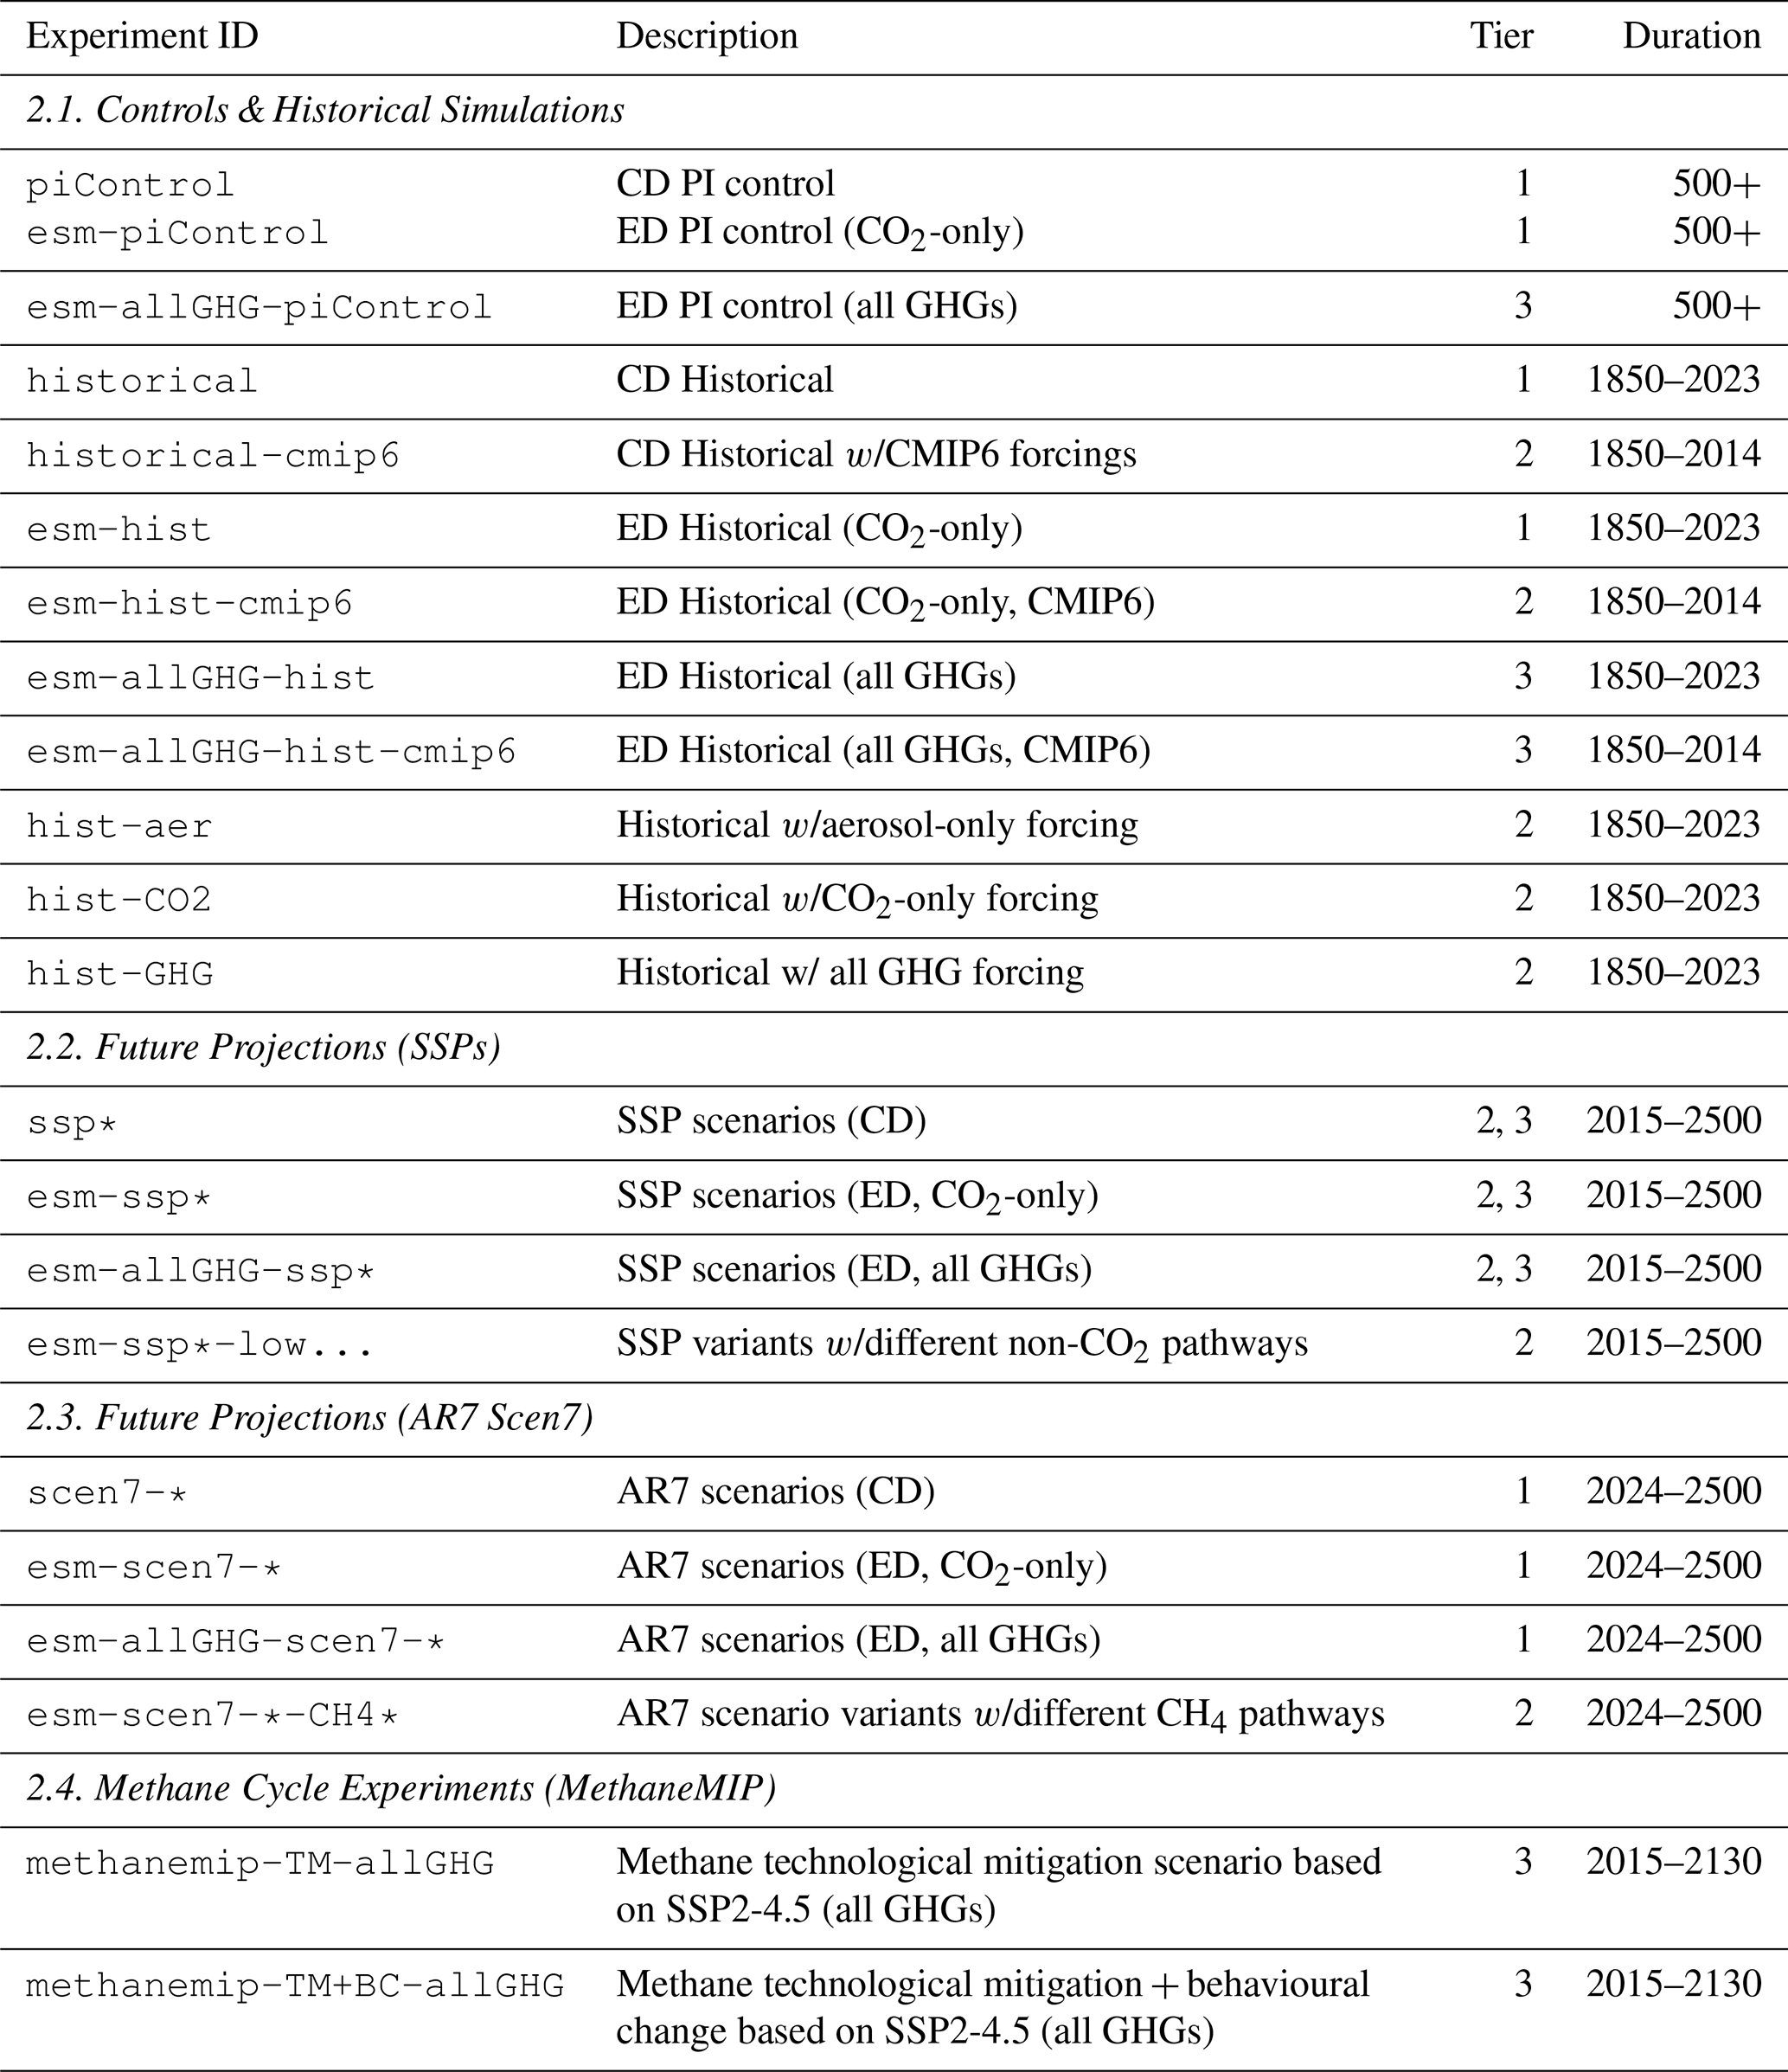
Table 1Master list of idealised experiments requested as part of RCMIP3 (CD: Concentration-Driven; CE: Cumulative Emissions, ED: Emissions-Driven; FD: Feedback-Decoupling, PI: Pre-Industrial).
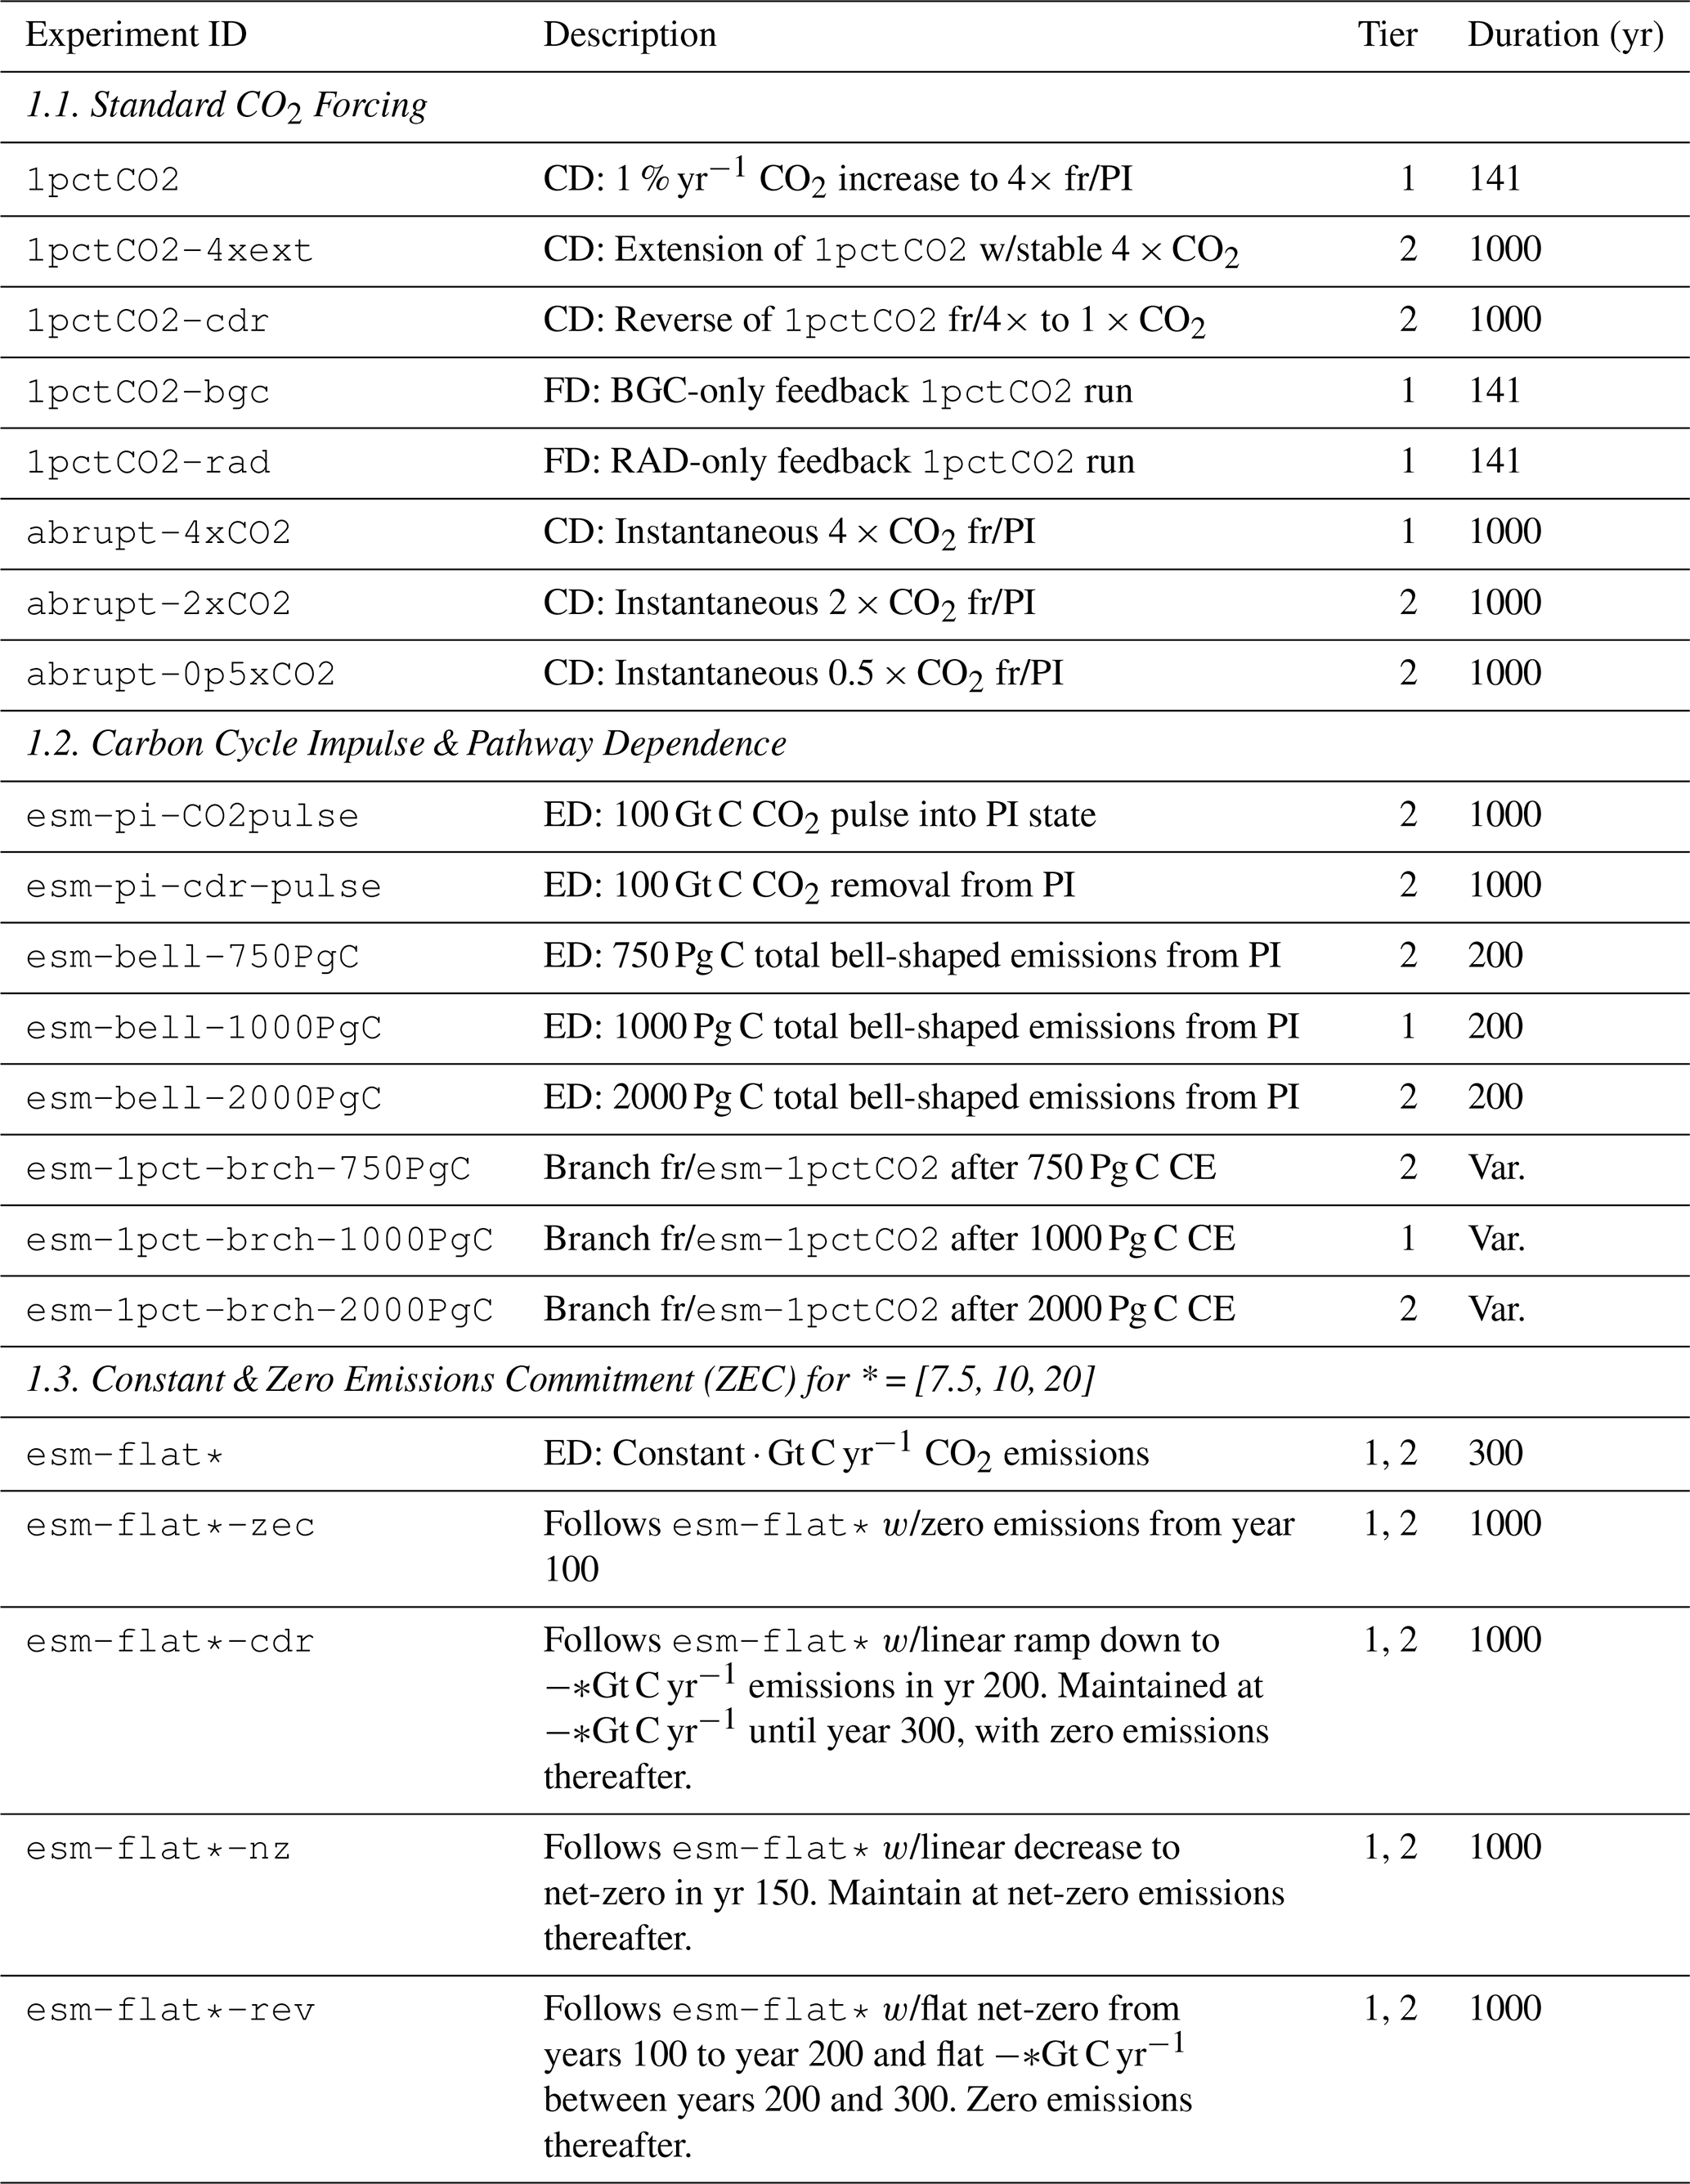
Table 2Master list of non-idealised (Scenario) experiments requested as part of RCMIP3 (CD: Concentration-Driven; ED: Emissions-Driven; PI: Pre-Industrial). Asterisks (*) denote sets of scenarios. The ssp* set includes: ssp119, ssp126, ssp245, ssp370, ssp434, ssp460, ssp534-over, and ssp585. The esm-ssp*-low... set includes variants for ssp370 and ssp585 with different non-CO2 pathways. The scen7-* set includes scenarios: H, HL, M, ML, L, VL and LN. The esm-scen7-*-CH4* set includes CH4 variants for scen7-H and scen7-L.
The emissions and concentrations data for experiments included in RCMIP phases I (Nicholls et al., 2020) and II (Nicholls et al., 2021) were taken from the datasets provided for those rounds (Nicholls and Gieseke, 2019). New data have either been generated according to stated protocols in the case of idealised datasets, or in the case of CMIP7, the inputs are from official CMIP7 sources including the CMIP7 Greenhouse Gas Concentrations (Nicholls et al., 2025), emissions (Hoesly et al., 2025; van Marle and van der Werf, 2025; Friedlingstein et al., 2025; Velders et al., 2022; Adam et al., 2024; WMO, 2022; Crippa et al., 2024) and solar (Funke, 2025) and volcanic forcing (Aubry et al., 2026). An extensive overview of the CMIP7 forcing and data providers is found in (O'Rourke et al., 2023). MethaneMIP data were generated according to the MethaneMIP protocol (England et al., 2025).
2.1 Idealised scenario experiments
Idealised experiments are designed to quantify fundamental characteristics of the climate and carbon cycle response in a controlled setting. The stylised nature of the forcings allows for a clean diagnosis of key metrics, which can be obscured in more complex scenarios. The results from these experiments will inform our understanding of baseline model behaviour, allow for the decomposition of feedbacks, and facilitate assessments of response linearity. This suite of experiments is designed to be directly comparable with key CMIP7 DECK (e.g., 1pctCO2, abrupt-4xCO2) and AFT experiments. The magnitude of these experiments was chosen deliberately to coincide across experiments in order to enable path-/state-dependence and reversibility analysis via inter-experiment evaluation. For example, the total cumulative CO2 emissions is the same in esm-bell-*, esm-flat* and esm-1pct-brch-* experiments. An illustration of the experimental setup for these experiments is presented in Fig. 2 while Table 1 lists their priority (Tier) and duration.
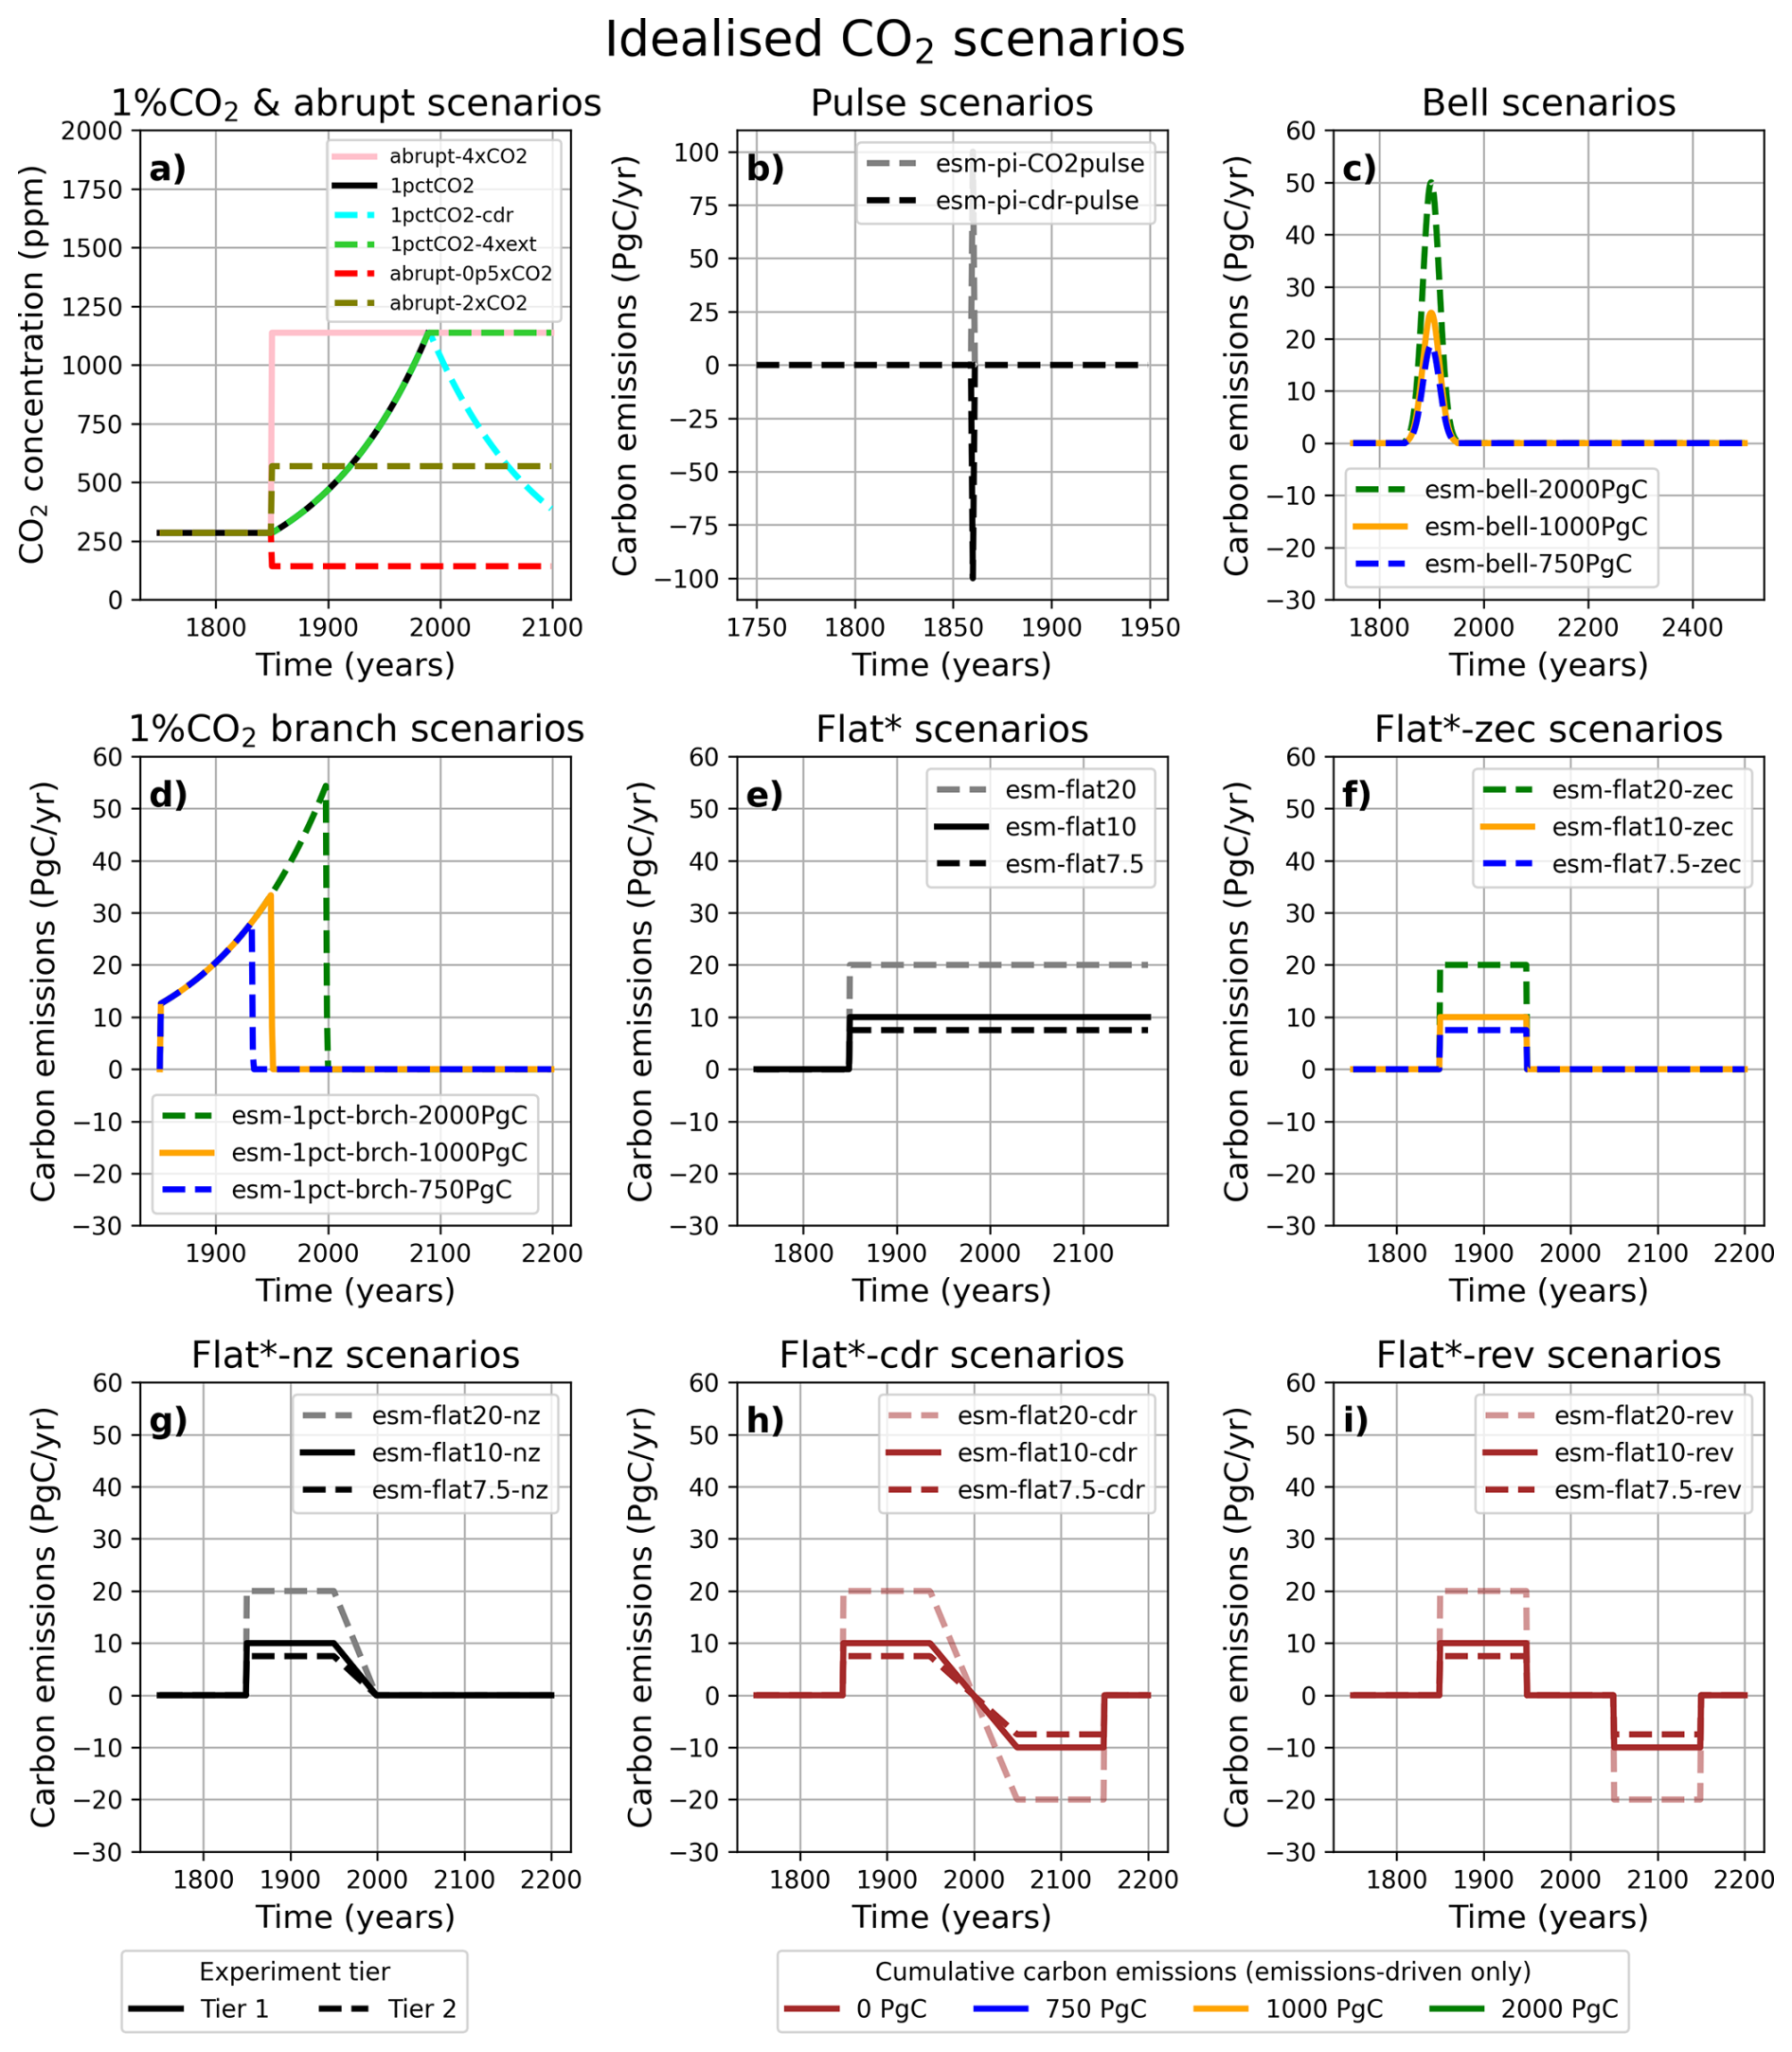
Figure 2Annual carbon concentrations and emissions as a function of time for the idealised experiments included in RCMIP3. For clarity, flux magnitudes are shown in petagrams of carbon (Pg C), although the accompanying dataset provides emissions time series in megatons of CO2 (Mt CO2), consistent with the requested CO2 emissions variable. Similarly, years in the x axis are indicative, with the actual requested experiment durations being detailed in Table 1. Line style indicates the experiment tier or running priority (solid for Tier 1 and dashed for Tier 2), while colour (except black) represents the shared cumulative carbon emissions across emissions experiments.
2.1.1 Concentration-driven CO2 response experiments
This group of experiments follows established CMIP protocols (Dunne et al., 2025) to diagnose the primary climate response to changes in atmospheric CO2. They are the principal means for calculating metrics such as the Transient Climate Response (TCR) and Equilibrium Climate Sensitivity (ECS), and for assessing the state-dependence of climate feedbacks.
-
1pctCO2: a concentration-driven simulation where atmospheric CO2 increases by 1 % per year from the pre-industrial value until quadrupling. This is the standard experiment for diagnosing TCR. -
1pctCO2-4xext: an extension of1pctCO2, where concentrations are held constant at 4 × CO2 for at least 150 years (ideally, up to a total experiment duration of 1000 years) to assess adjustment from transient to equilibrium response to CO2 forcing. Running of this experiment can be combined with1pctCO2into a single experiment. -
abrupt-4xCO2,abrupt-2xCO2,abrupt-0p5xCO2: concentration-driven simulations where pre-industrial CO2 is instantaneously quadrupled, doubled, or halved, respectively, and then held constant for 1000 years to allow the system to reach equilibrium. The climate system's relaxation from this abrupt forcing is used to evaluate climate feedbacks and their potential linearity or state-dependence.abrupt-4xCO2provides a standard method for calculating ECS through regression analysis (Gregory et al., 2004; Zehrung et al., 2025). -
1pctCO2-bgcand1pctCO2-rad: a pair of feedback-decoupling experiments following the C4MIP (Jones et al., 2016) protocol. In1pctCO2-bgc, only the biogeochemical components are forced by the increasing CO2, while the radiative components see pre-industrial levels. Conversely, in1pctCO2-rad, only the radiative components are forced. These allow for the formal decomposition of the carbon-concentration (β) and carbon-climate (γ) feedback parameters (Jones et al., 2016) when compared to the fully coupled1pctCO2simulation. The input for this experiment is the same as for1pctCO2, and it is left to modelling teams to arrange how the set-up described above is achieved.
2.1.2 Carbon cycle impulse and path-dependence experiments
This suite of emissions-driven experiments is designed to probe the carbon cycle's response to different emission pathways including CO2 pulses and carbon dioxide removal (CDR). This should allow an assessment of linearity and path-dependence, mirroring the CDRMIP (Keller et al., 2018) and ZECMIP (Jones et al., 2019) protocols.
-
esm-pi-CO2pulseandesm-pi-cdr-pulse: idealised positive and negative CO2 emission pulses of 100 Gt C are applied to a pre-industrial control state. ESM output from these experiments has been used to derive the impulse-response function of the carbon cycle to emissions and removals in simplified models such as RCMs. Thus, RCM output from these experiments provide an opportunity to compare responses between RCMs and ESMs. -
esm-bell-750PgC,esm-bell-1000PgC,esm-bell-2000PgC: a set of experiments where total emissions follow a symmetric bell-shaped curve, allowing for the assessment of carbon cycle responses to different total cumulative emission amounts according to the ZECMIP “B” protocol (Jones et al., 2019). -
esm-1pct-brch-750PgC,esm-1pct-brch-1000PgC,esm-1pct-brch-2000PgC: compatible carbon emissions with anesm-1pctCO2experiment are back-calculated for each model, and subsequently set to zero after certain levels of cumulative emissions are reached (750, 1000 and 2000 Pg C). The branching happens at the first timepoint where the cumulative emissions level is exceeded, with an experiment duration after that of ideally 500 years (minimum 100 years). Due to the model-specific nature of these experiments, the CO2 emissions time series needs to be sourced by the modelling groups themselves. These experiments enable the assessment of the Zero Emissions Commitment (ZEC) at various cumulative emissions levels according to the ZECMIP “A” protocol (Jones et al., 2019). -
1pctCO2-cdr: a concentration-driven experiment where, after reaching four times the pre-industrial CO2 concentration in the1pctCO2run, concentrations are returned to pre-industrial levels following the same path in reverse, testing the reversibility of the climate system following the CDRMIP protocol (Keller et al., 2018).
2.1.3 Constant and Zero Emissions Commitment (ZEC) experiments
This family of emissions-driven experiments, aligned with the “flat10MIP” protocol (Sanderson et al., 2025), is designed to cleanly diagnose key policy-relevant carbon cycle metrics like TCRE, the Zero Emissions Commitment (ZEC), and the response to net-negative emissions. The experiments are performed with three different constant emission rates (7.5, 10, and 20 Gt C yr−1) to test the linearity of these responses.
-
esm-flat7.5,esm-flat10,esm-flat20: a constant CO2 emission rate is maintained for 300 years. -
esm-flat7.5-zec,esm-flat10-zec,esm-flat20-zec: following an initial 100-year constant emission period, emissions are abruptly set to zero to diagnose the Zero Emission Commitment. -
esm-flat7.5-nz,esm-flat10-nz,esm-flat20-nz: following an initial 100-year period, emissions are linearly reduced to net-zero value over a 50 year period, and held at net-zero from year 150 onwards. -
esm-flat7.5-cdr,esm-flat10-cdr,esm-flat20-cdr: following an initial 100-year period, emissions are linearly reduced over a 100 year period to the negative of the original flat rate (e.g., from +10 to −10 Gt C yr−1 inesm-flat10-cdr) to assess the system's response to large-scale CDR. Then, after 300 years, when cumulative emissions reach zero, emissions are abruptly set to zero. -
esm-flat7.5-rev,esm-flat10-rev,esm-flat20-rev: following an initial 100-year period, emissions are held constant at zero for another 100-year period, then reversed to the negative of the original period for another 100 years, and finally abruptly set to 0 until the end of the experiment. This is a new addition with respect to the original flat10MIP protocol, similar to theesm-flat*-cdrexperiments but with an abrupt emissions cessation rather than linear. The objective is to allow a cleaner assessment of the transient response to cumulative removals by introducing an interim period without external forcing between the positive and negative emissions regimes.
2.2 Non-idealised scenario experiments
Non-idealised experiments use comprehensive, time-evolving forcing datasets to simulate past and future climate change. These experiments are essential for model evaluation against observations, attribution of past changes, and providing projections for use in the IPCC AR7 and other assessments. A key reason for adding these experiments is to be able to directly compare and analyse RCM projections with ESMs for the same set of scenarios. Note that for historical and scenario runs, we provide natural forcing input for solar and volcanic forcing as part of the input dataset. For CMIP6, these are split by experiment, but for CMIP7 the data are provided as a single time series for the experiment called historical in the forcing input file.
2.2.1 Control and historical simulations
This group of experiments provides the necessary baseline control simulations and simulates the historical period (1850–2023) to enable model evaluation against observations.
-
piControl,esm-piControlandesm-allGHG-piControl: pre-industrial control simulations with constant forcings, providing a baseline for calculating anomalies and assessing model drift. The first experiment is concentrations-driven, the second is CO2-only emissions-driven, and the third includes all GHGs in emissions-driven mode. -
historicalandhistorical-cmip6: standard concentration-driven historical simulations from CMIP. The former uses CMIP7-era forcing agents and runs from 1850 to 2023, while the latter uses CMIP6-era forcing agents and runs for the 1850–2014 period. -
esm-hist,esm-hist-cmip6,esm-allGHG-hist,esm-allGHG-hist-cmip6: emissions-driven historical simulations, differing in the forcing agents included (CO2-only vs. all GHGs) and the vintage of the forcing data (CMIP7 vs. CMIP6). -
hist-aer,hist-GHG, andhist-CO2: single-forcing historical simulations driven by emissions of aerosols-only, concentrations of all GHGs and concentrations of CO2-only, respectively. These are crucial for attribution studies. To align with the original experiment design and better isolate aerosol impacts, thehist-aerexperiment should be run without interactive ozone and methane chemistry modules, as some reactive gas species (e.g., CO and VOC) interact with these atmospheric gases.
2.2.2 Standard future projections (CMIP6 SSP scenarios)
This core set of experiments provides future projections from 2015–2500 based on the ScenarioMIP CMIP6 protocol (O'Neill et al., 2016) and extensions. Both concentration- and emissions-driven versions are included for direct comparison. Again, by following the same standard scenarios as CMIP6 we expect that the RCM output can be compared with CMIP6 ESM output, and assess to what extent RCMs are able to emulate ESMs (in whatever variable is analysed in a given study). In addition, this allows direct comparison of ScenarioMIP output across generations.
-
Concentration-driven SSPs:
ssp119,ssp126,ssp245,ssp370,ssp434,ssp460,ssp534-over,ssp585. -
Emissions-driven (CO2 only) SSPs:
esm-ssp119,esm-ssp126,esm-ssp245,esm-ssp370,esm-ssp434,esm-ssp460,esm-ssp534-over,esm-ssp585. -
Emissions-driven (all GHG) SSPs:
esm-allGHG-ssp119,esm-allGHG-ssp126,esm-allGHG-ssp245,esm-allGHG-ssp370,esm-allGHG-ssp434,esm-allGHG-ssp460,esm-allGHG-ssp534-over,esm-allGHG-ssp585.
2.2.3 Standard future projections (CMIP7 “Scen7” scenarios)
These are the ScenarioMIP experiments developed specifically for the CMIP7 cycle (Van Vuuren et al., 2026). Similarly to the CMIP6 suite, this includes both emissions-driven (CO2-only and all GHG variants) and concentrations-driven experiments to ensure consistent analysis across forcing methodologies. The scenarios encompass a wide range of plausible futures, from very low emissions (-VL) compatible with the highest possible ambition on climate change, to high emissions (-H) arising from a rollback of current mitigation policies. There is also a “medium” scenario (-M) similar to current policies, as well as variations of the previous scenarios with differing assumptions around policy strengthening and negative emissions (-HL, -ML, -VL, and -LN). Although it is unlikely that there will be significant ESM output to compare with on the RCMIP3 timescale, CMIP7 scenarios produced under RCMIP3 will give advanced insight to ESM modellers on what these scenarios might look like for different variables.
-
Concentration-driven:
scen7-HC,scen7-HLC,scen7-MC,scen7-MLC,scen7-LC,scen7-VLC,scen7-LNC. -
Emissions-driven (CO2 only):
esm-scen7-H,esm-scen7-HL,esm-scen7-M,esm-scen7-ML,esm-scen7-L,esm-scen7-VL,esm-scen7-LN. -
Emissions-driven (all GHG):
esm-allGHG-scen7-H,esm-allGHG-scen7-HL,esm-allGHG-scen7-M,esm-allGHG-scen7-ML,esm-allGHG-scen7-L,esm-allGHG-scen7-VL,esm-allGHG-scen7-LN.
2.2.4 Non-CO2 variants of standard future projections
A key development in this phase of RCMIP is a dedicated set of experiments designed to explore the climate system response to a range of non-CO2 forcing pathways. In particular, several experiments seek to explore futures with different methane concentrations as a key policy area. Experiments were based on those from MethaneMIP (England et al., 2025) and a series of sensitivity experiments from core ScenarioMIP CMIP6 and CMIP7 scenarios, exploring CH4 pathway uncertainty.
-
methanemip-TM-allGHG: an all-GHG emissions-driven run from MethaneMIP branching off fromssp245to assess the impact of additional technical measures (TM) to mitigate methane emissions. -
methanemip-TM+BC-allGHG: a variant of the previous MethaneMIP experiment that also includes emission reductions from widespread behavioural change (BC) such as dietary shift. -
esm-allGHG-ssp370-lowCH4: a sensitivity run based on theesm-allGHG-ssp370scenario, but following a low methane emissions pathway to explore decoupling of CH4 from other drivers. -
esm-allGHG-ssp370-lowNTCF: a similar sensitivity analysis based on theesm-allGHG-ssp370scenario that follows a low emissions pathway of Near-Term Climate Forcers (NTCFs) to explore the impact of decoupling these forcers from other drivers. -
esm-allGHG-ssp370-lowNTCF-HighCH4: a variant of the previous NTCF scenario, but with high methane emissions. This is designed to isolate the specific impact of a high methane pathway against an otherwise low non-GHG forcing background. -
esm-allGHG-ssp534-over-highCH4: a sensitivity run based on theesm-allGHG-ssp534-overovershoot scenario, but with a high methane pathway to assess its impact on the nature and magnitude of the temperature overshoot. -
esm-allGHG-ssp585-lowCH4: a variant of the fossil-fuel intensiveesm-allGHG-ssp585scenario, but with a low methane pathway, again designed to explore the consequences of decoupling CH4 emissions from CO2. -
esm-allGHG-scen7-H-CH4Landesm-allGHG-scen7-L-CH4H: a pair of scenario-swapping experiments. The first combines the high CO2 emissions from Scen7-H with the low methane emissions from Scen7-L, while the second combines the low CO2 of Scen7-L with the high methane of Scen7-H. These experiments should help diagnose the independent impact of different methane pathways.
A central innovation of RCMIP3 is the introduction of a coordinated set of benchmarks for ensemble constraining and model evaluation. A key lesson from previous RCMIP phases was that model-specific calibration choices made it difficult to distinguish differences in projections arising from fundamental model structure versus those arising from the tuning process (Nicholls et al., 2021). To mitigate this problem, RCMIP3 includes a harmonised set of benchmarks all modelling teams are encouraged to use to constrain their ensemble output prior to submission, thereby fostering greater comparability and coordination across the RCM community. Additionally, these benchmarks will be used to evaluate model output once it is received from modelling teams, enabling a cleaner assessment of inter-model structural uncertainty, a key objective for the AR7 assessment cycle.
While providing this collection of climatic benchmarks, RCMIP3 does not prescribe to what extent the benchmarks are employed. This strategy allows participating groups to calibrate their models using their own preferred methods, while providing a common standardised experimental dataset that can be used where relevant. Ideally, all modelling groups incorporate these benchmarks in their tuning phases, but it is acknowledged that this may not be possible in all cases due to technical reasons or resource availability. Consequently, the use of these benchmarks is optional, but encouraged. Notwithstanding this flexibility, all benchmarks should be compared to simulation output for the CMIP7 esm-allGHG-historical scenario, including volcanic and solar forcing timeseries for CMIP7 as provided in the input datasets. Output from this scenario will also be used for model evaluation when comparing model submissions with the benchmarks.
These benchmarks are drawn from the latest observational datasets and community assessments, particularly the annual Indicators of Global Climate Change effort (Forster et al., 2025) and the Global Carbon Budget (Friedlingstein et al., 2025). This ensures that the RCMIP3 process is anchored to the most up-to-date understanding of the Earth system. The number and nature of these targets have been carefully selected to encompass fundamental climate properties while minimising the burden on modelling groups.
3.1 Constraining targets
The constraining targets are divided into two main categories: those constraining the broader global climate system response and those constraining the carbon cycle. Figure 4 shows the constraining time series offered by the protocol and the related evaluation targets.
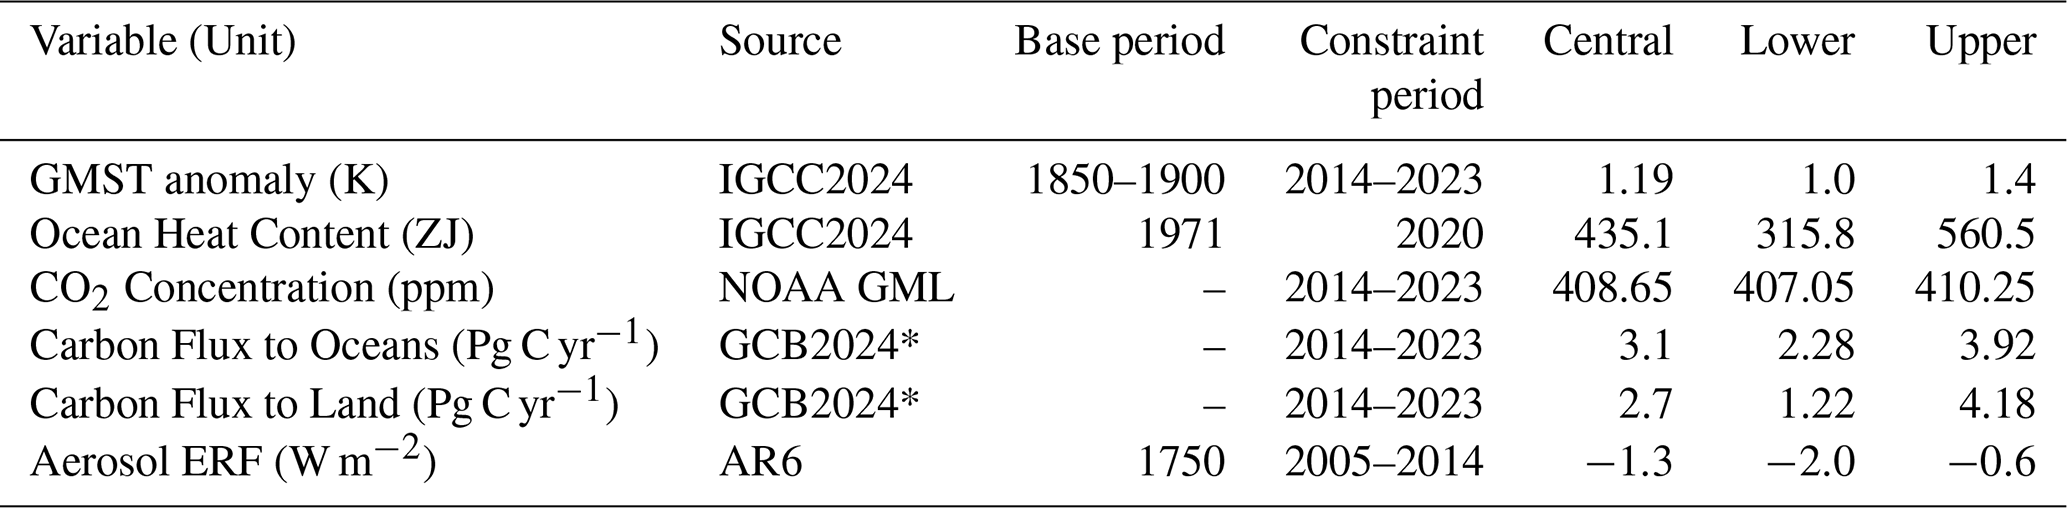
Table 3RCMIP recommended constraints. The target is mean value over the constraint period, possibly calculated as change from base period. Sources are IGCC2024 = Forster et al. (2024), NOAA GML = Lan et al. (2024), GCB2024* = revised version of Friedlingstein et al. (2025) following Friedlingstein et al. (2026) and AR6 = Forster et al. (2021). Lower and upper bounds of estimates denote the 5th and 95th percentile estimates respectively. Where the original sources gave uncertainties not for periods but single years, quadrature has been used to derive combined uncertainty bounds. Where the sources gave uncertainty in terms of one standard deviation, an underlaying normal distribution has been used to make the conversion.
3.1.1 Climate system targets
These targets ensure that the models' fundamental climate responses are consistent with historical observations and the broader climate science assessment.
-
Historical Global Mean Surface Temperature (GMST): models should be able to reproduce the observed GMST evolution from the pre-industrial period (1850–1900) to the present. We provide the best-fit historical temperature time series as reported by Forster et al. (2024) as the temperature target. Direct evaluation will involve the temperature anomaly between the 1850–1900 and 2014–2023 periods.
-
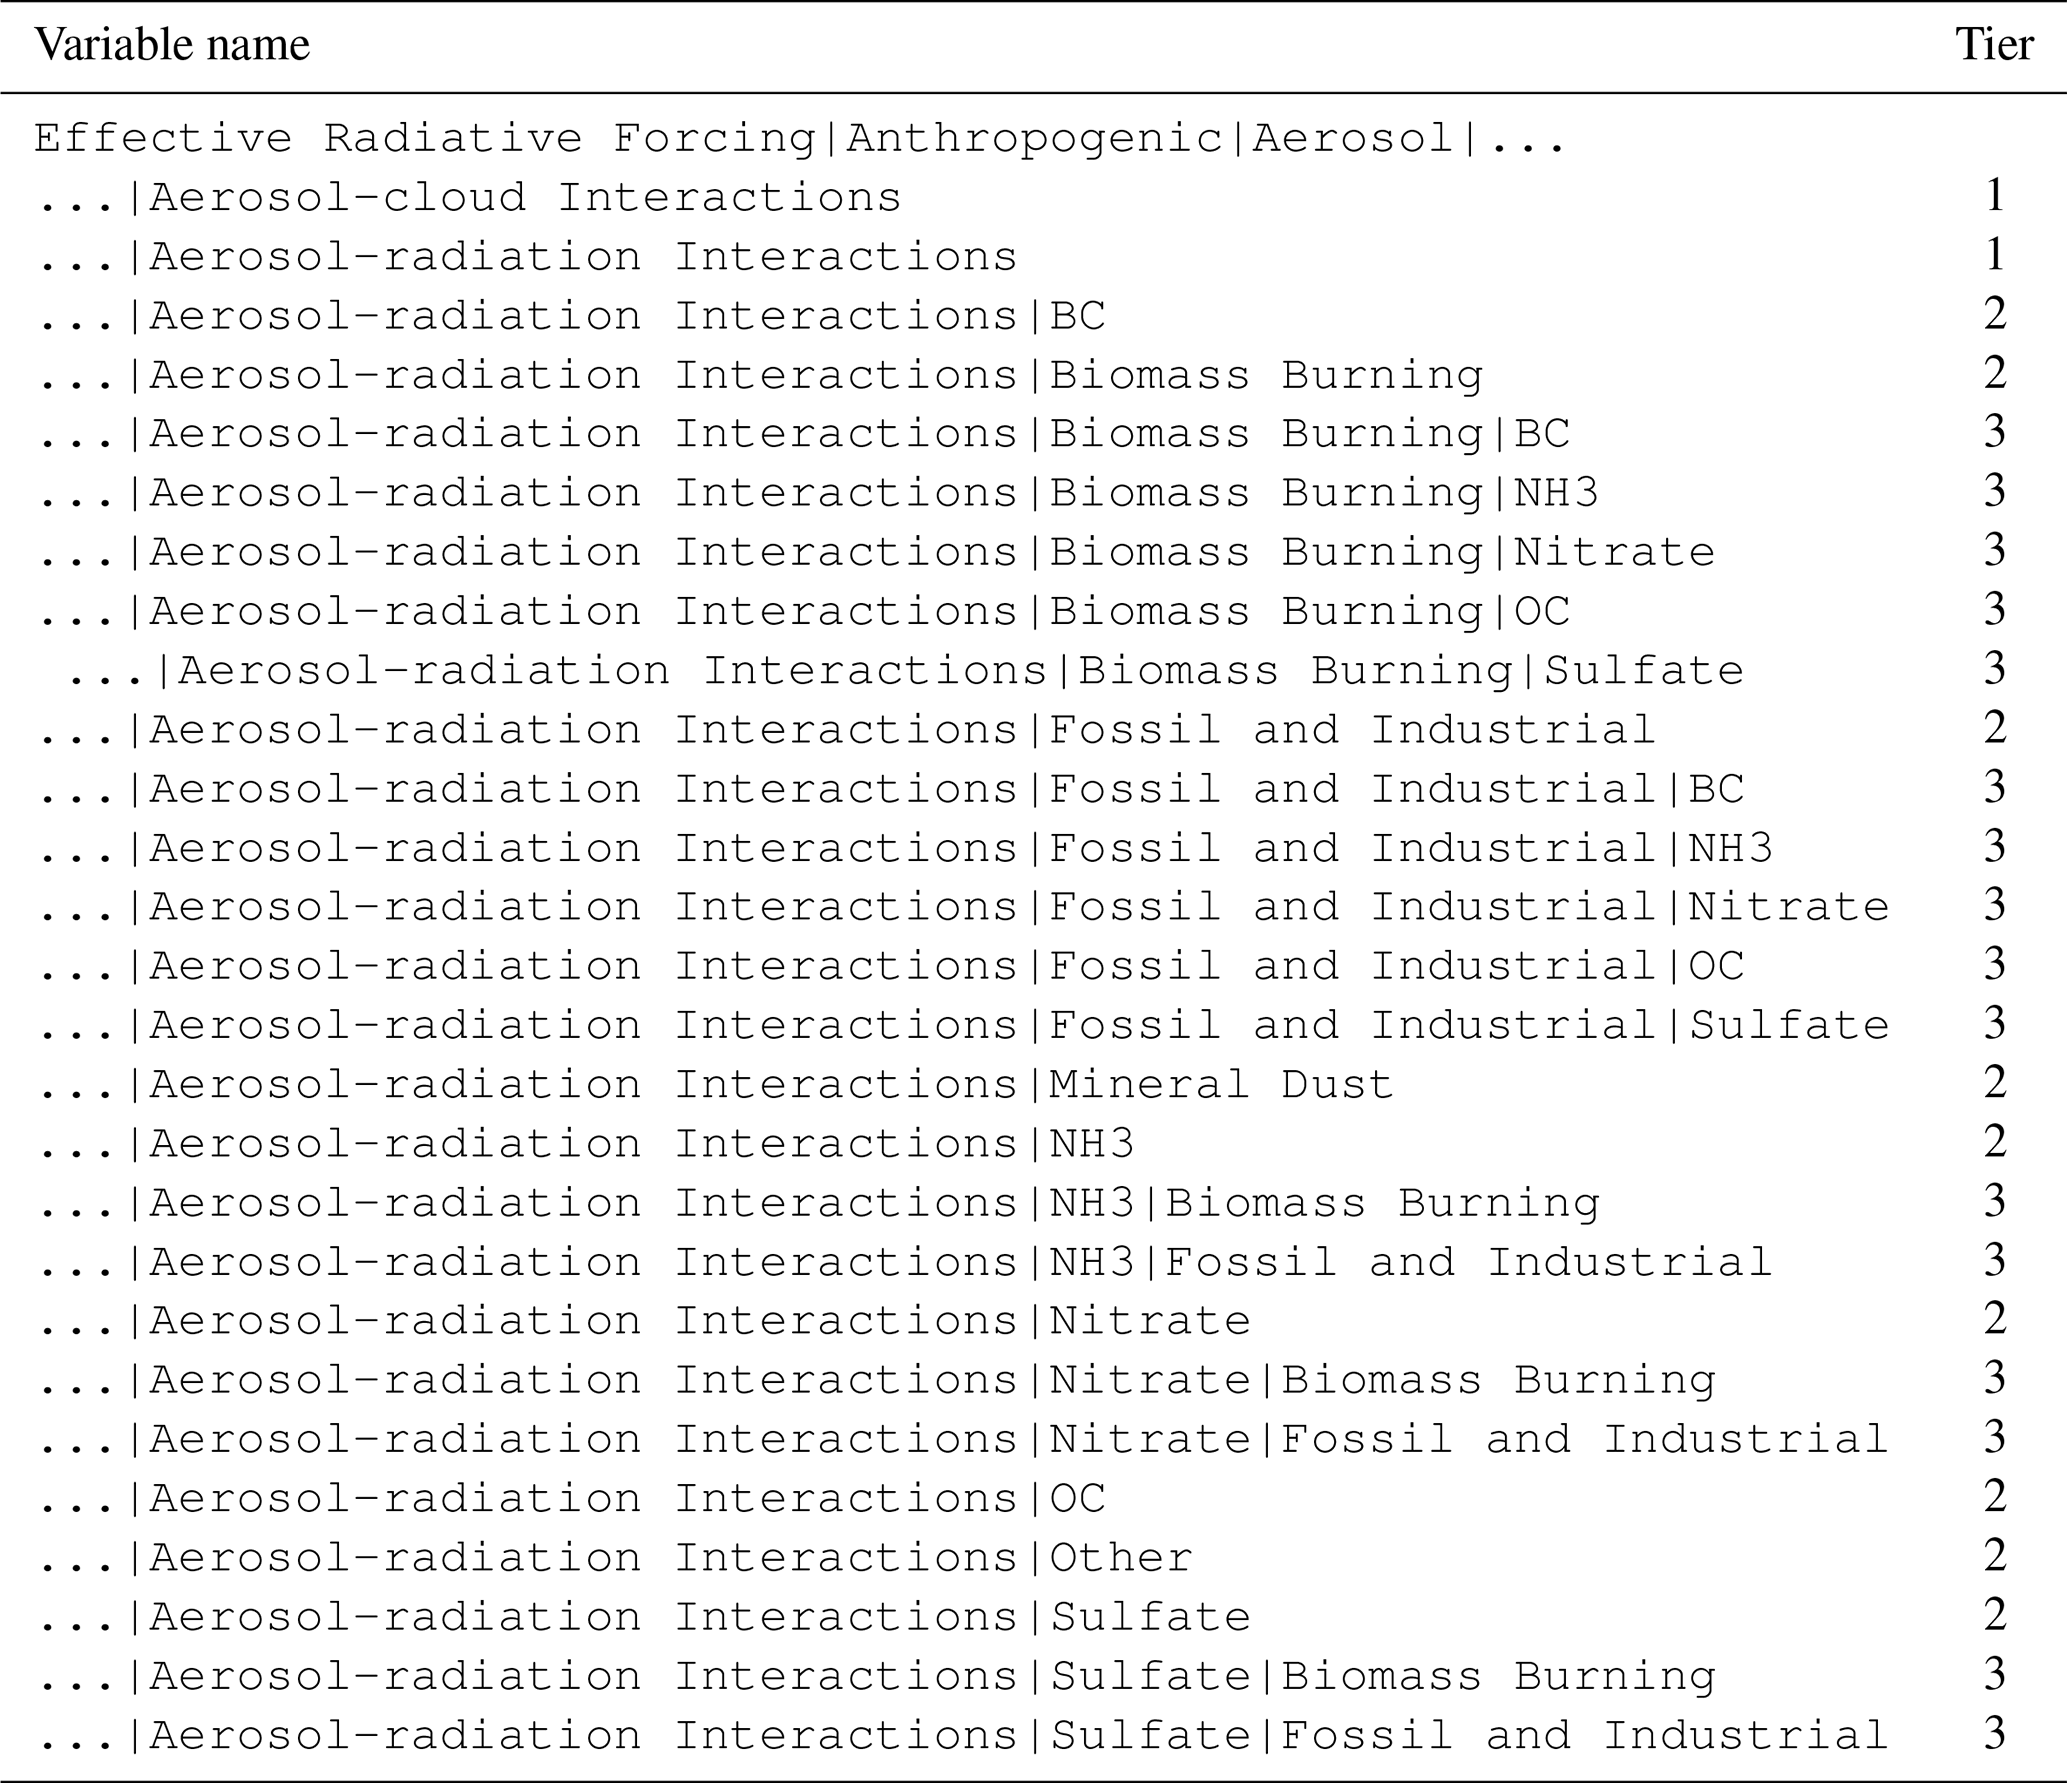
Aerosol Effective Radiative Forcing (ERF): as a key component of the climate system with substantial uncertainty, we will also provide an estimate to constrain the aerosol effective radiative forcing with respect to 1750 for the 2005–2014 mean (Forster et al., 2024), comprising aerosol-radiation and aerosol-cloud interactions (Forster et al., 2021). Evaluation will involve the average aerosol ERF for the same period.
-
Global Heat Content: the simulated increase in global heat content over the historical period should be consistent with observational estimates, particularly for the well-observed period from 1971 to 2020. We provide the historical time series for both the total and ocean heat contents, as synthesised in Forster et al. (2024), since those are the quantities most likely to be represented in RCMs. The constraint target evaluation (see Table 3) will be based on the 1971 to 2020 change in Ocean Heat Content only, as available estimates for global heat content did not have any associated uncertainty.
With regards to the global heat content, care should be taken to identify what the RCM is reporting. The total Earth's energy uptake includes heat stored in the atmosphere, cryosphere and land, as well as by the ocean (Fig. 3 and Von Schuckmann et al. (2023)). For example, an RCM that is based on the common linear energy balance relationship (Romero-Prieto et al., 2026a) is likely modelling the change in total Earth energy uptake (ΔN) rather than the ocean component in isolation. Only RCMs that explicitly model the energy uptake into ocean and non-ocean reservoirs separately can resolve the difference. In Fig. 3, the time integral of ΔN is represented by the sum of each component, and the light yellow bar on the right for 1971–2020.
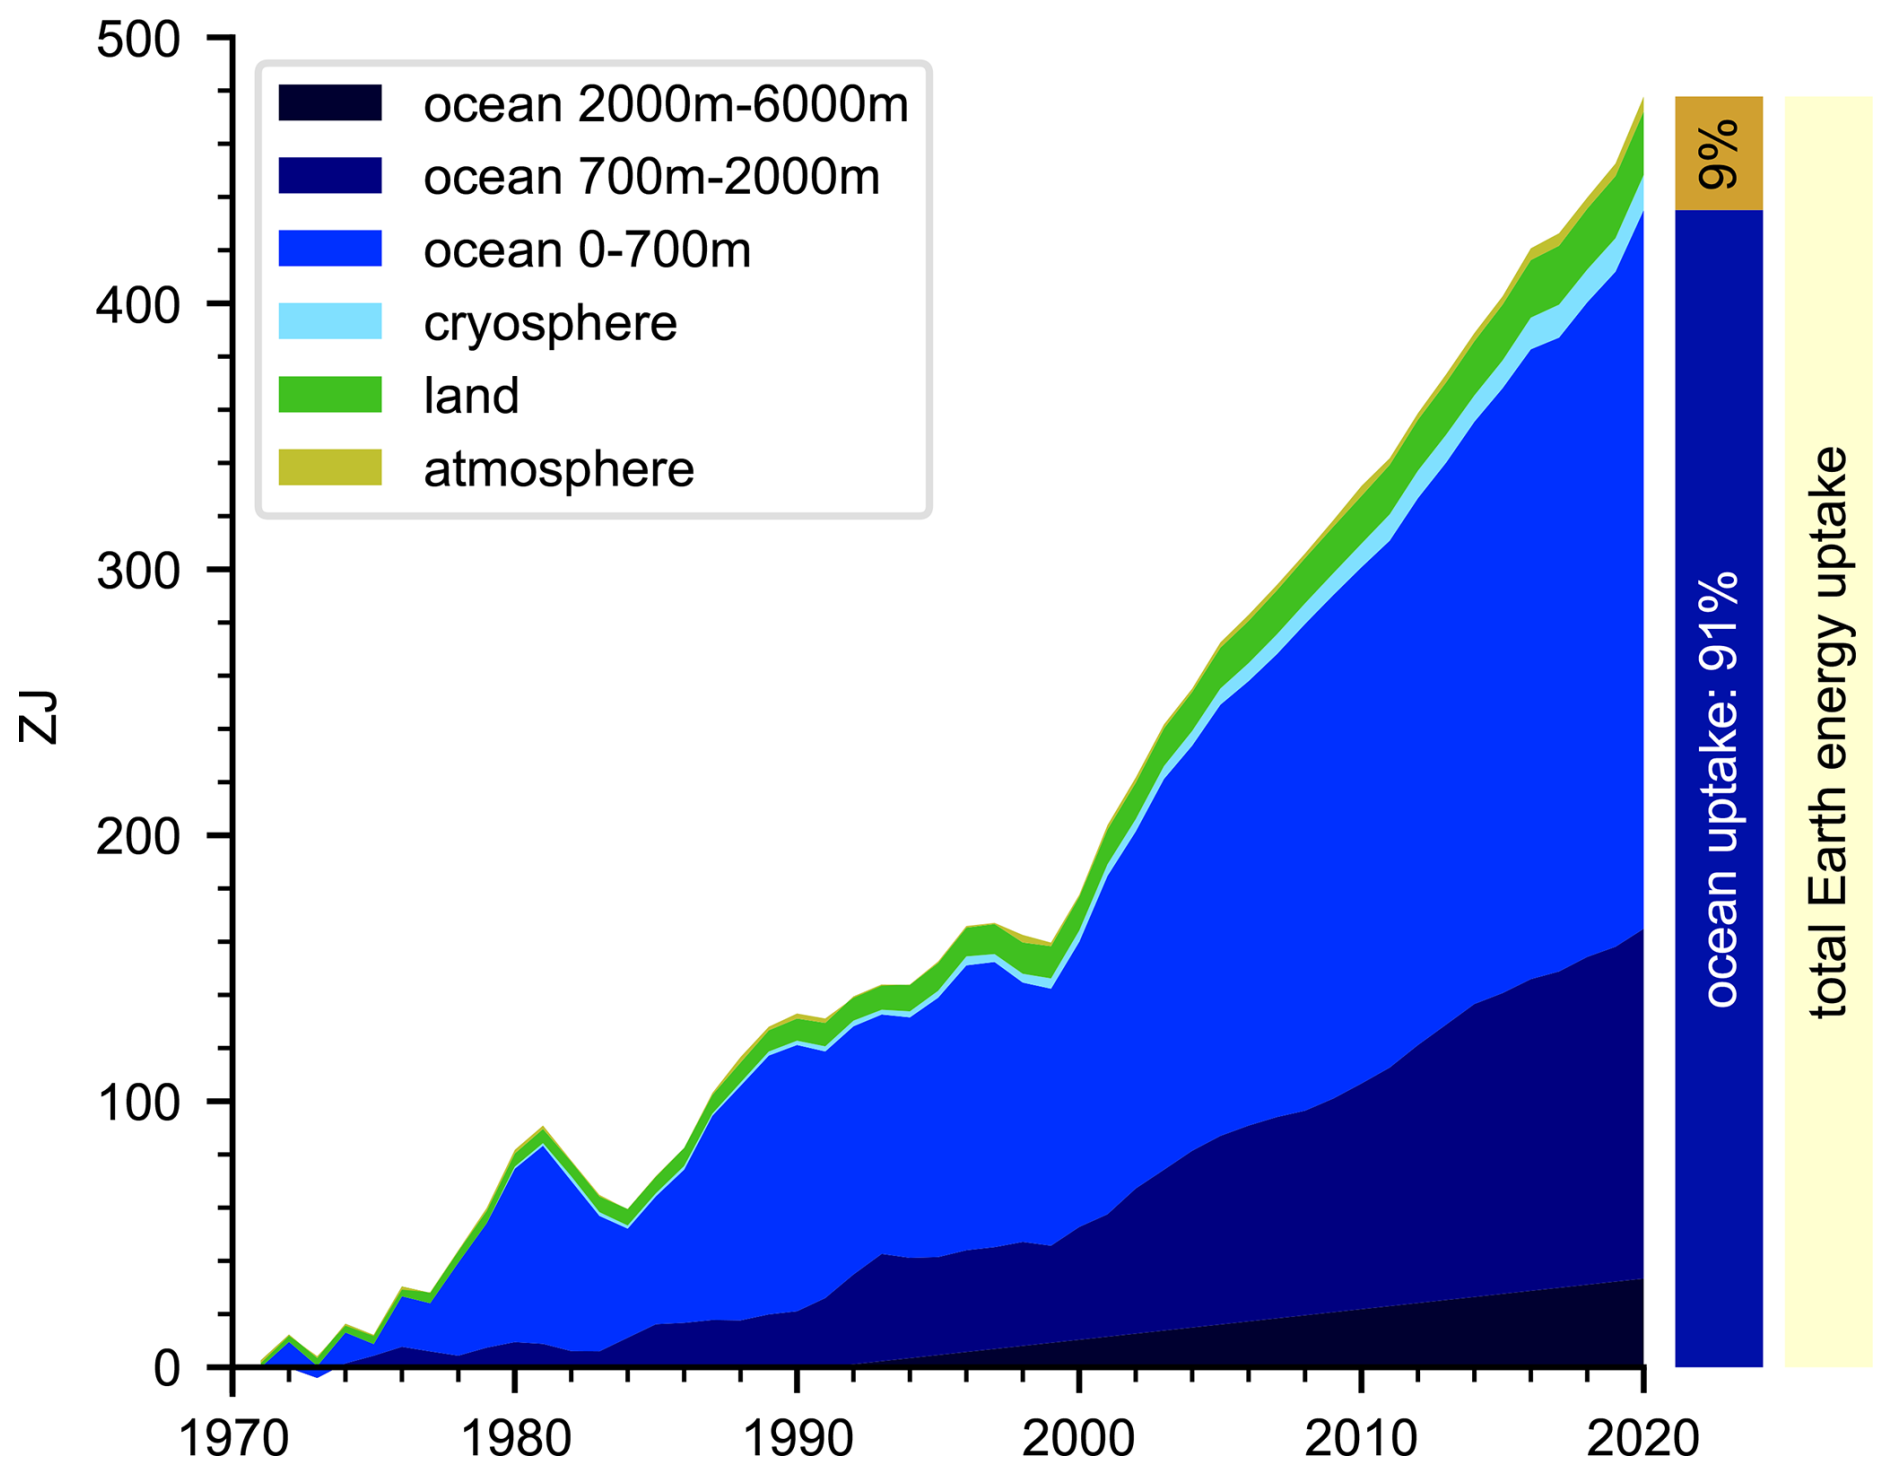
Figure 3Comparison of the total Earth energy uptake 1971–2020 with the ocean component. RCMs may report the total (light yellow bar, right) and not be able to separate into land, cryosphere, atmosphere and ocean. In RCMs where this is the case, the ocean heat content can be reported by multiplying the total energy uptake by 0.91. Data from Von Schuckmann et al. (2023).
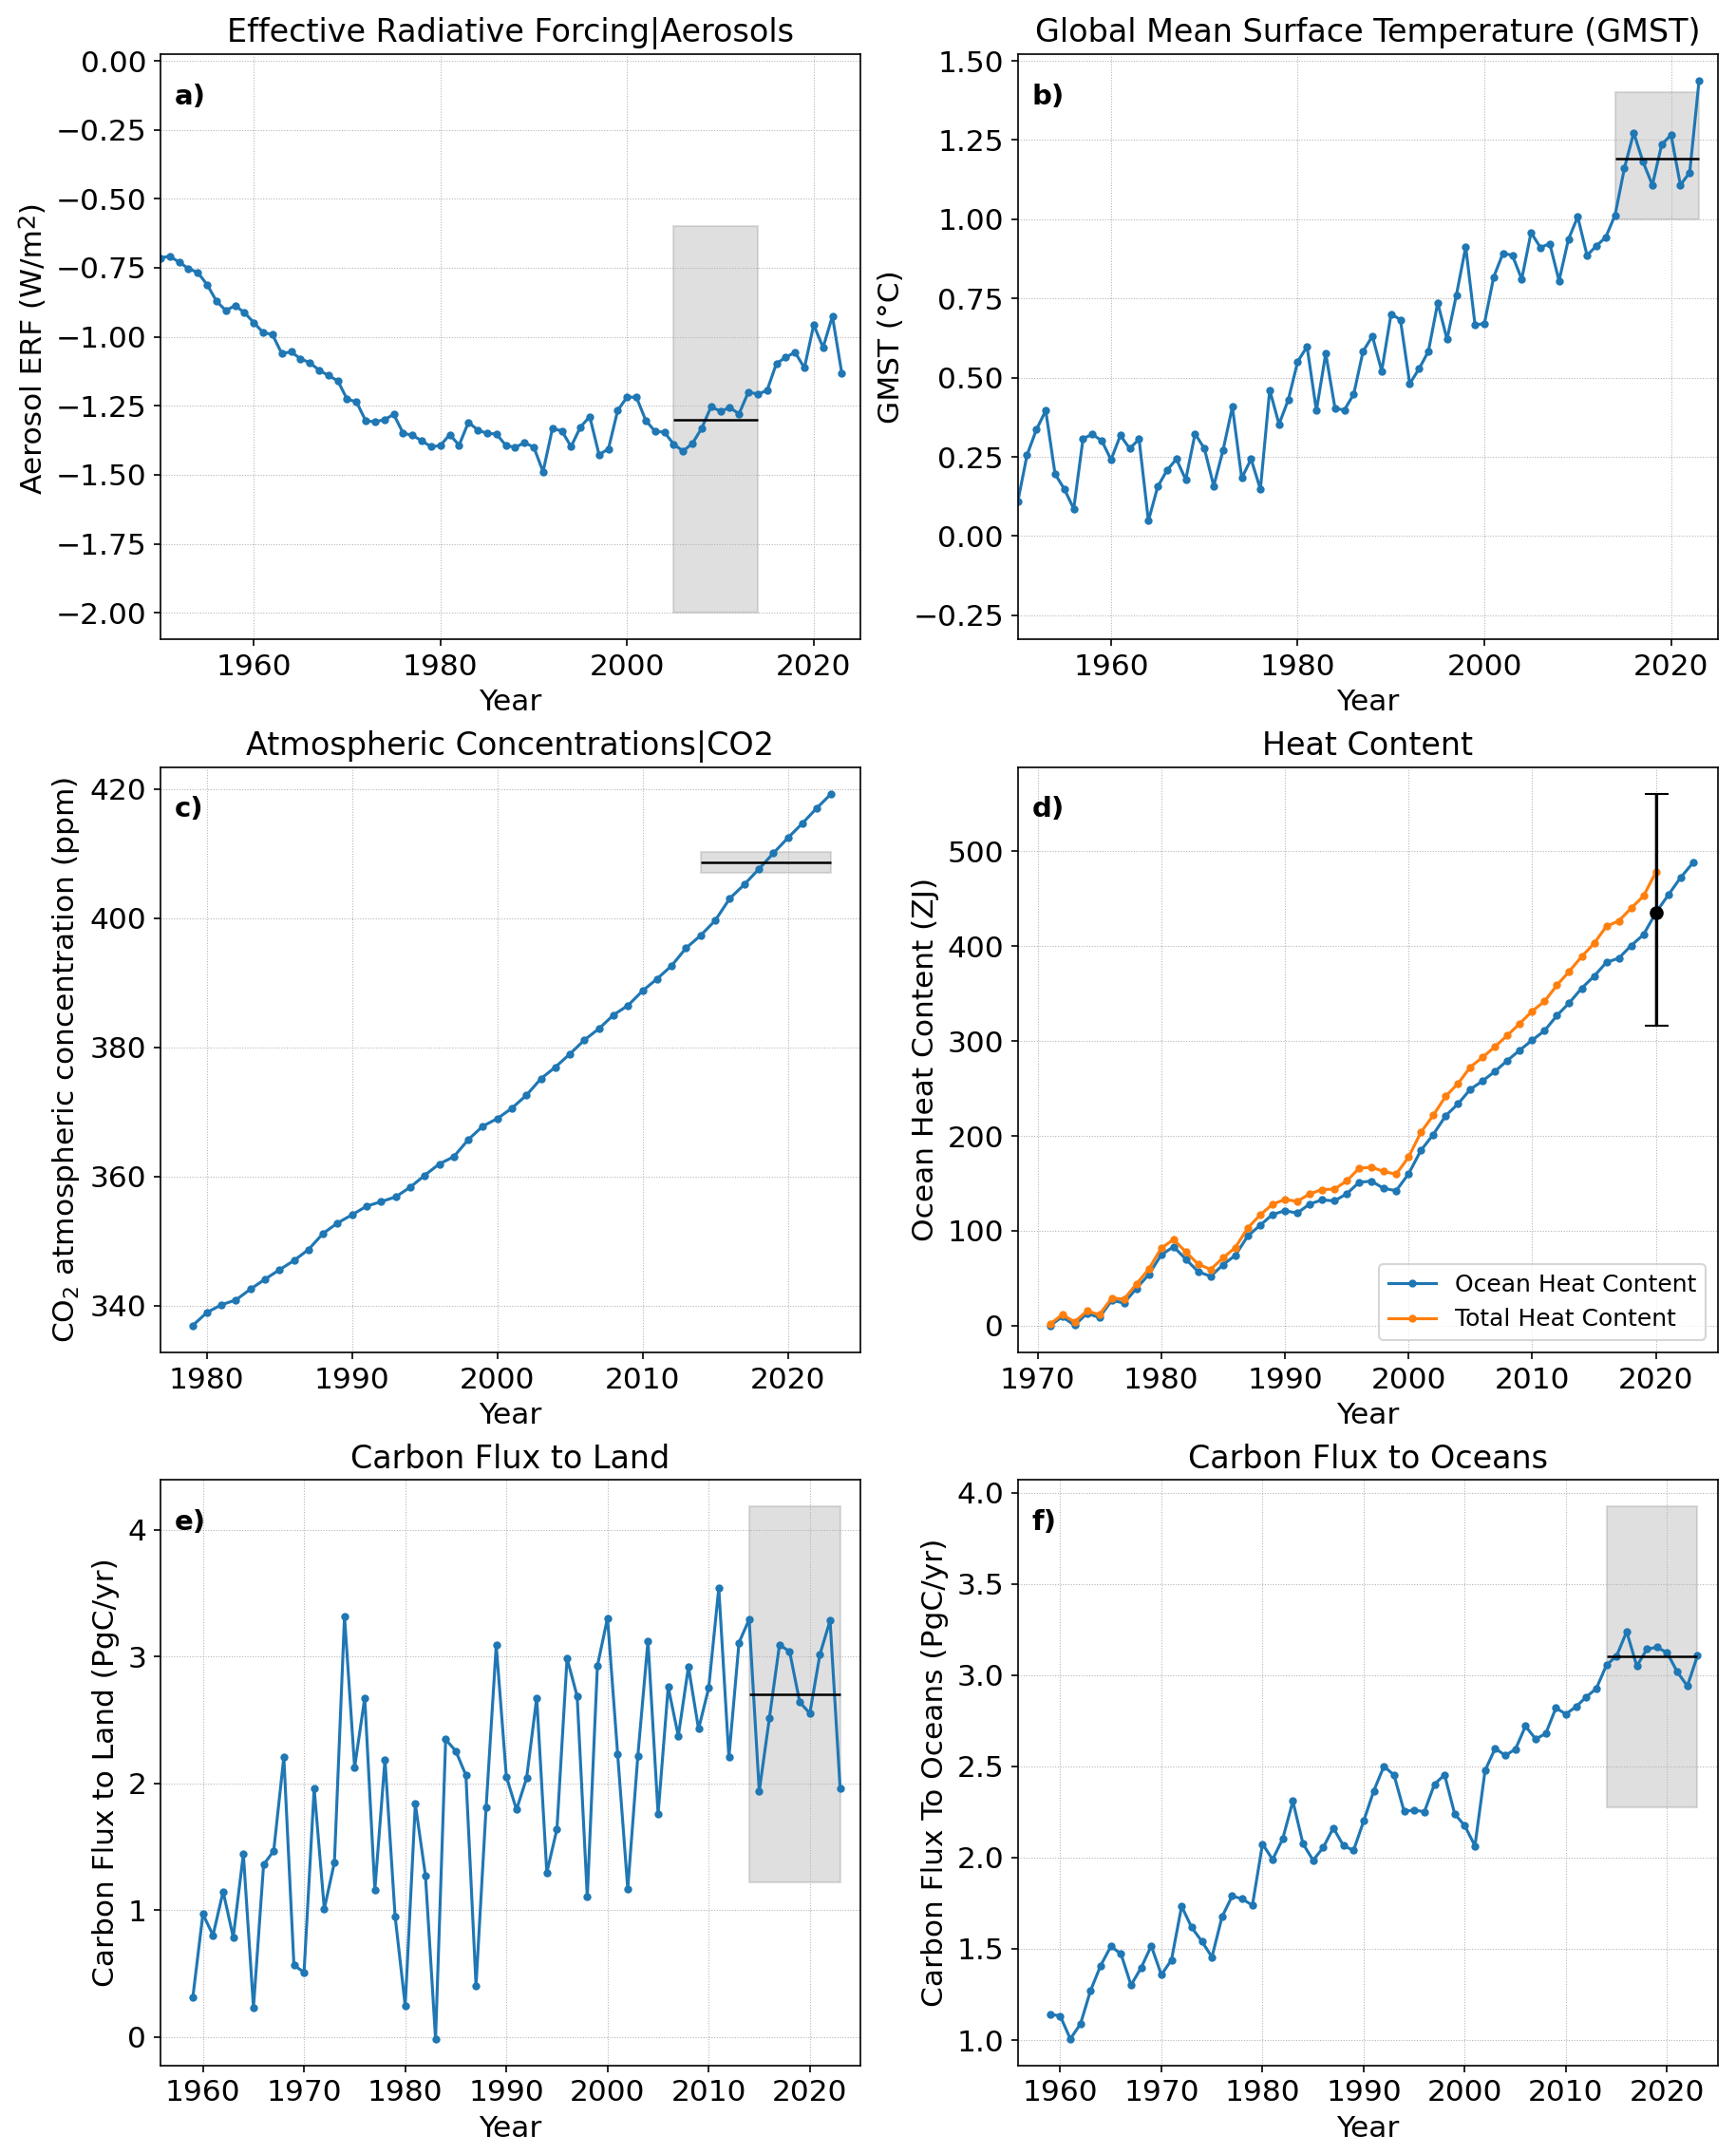
Figure 4Observational constraint time series (blue lines) and constraint targets (black lines/dots) with uncertainties (shaded rectangles). Quantity names follow the naming scheme from this protocol. Each constraint is presented in one subplot: (a) effective radiative forcing from aerosols, (b) global mean surface temperature, (c) atmospheric concentrations of CO2, (d) increase in heat content in the entire Earth system and in the ocean, (e) carbon flux into the land and (f) carbon flux into the oceans. Although subplot (d) shows both total and ocean heat content time series, the constraint target is for Ocean Heat Content change between 1971 and 2020 only.
3.1.2 Carbon cycle targets
Given the explicit focus of RCMIP3 on the carbon cycle, a robust set of biogeochemical constraints is included following the Global Carbon Budget (Friedlingstein et al., 2025). These targets aim to ensure that emissions-driven models partition anthropogenic carbon between the atmosphere, ocean, and land reservoirs in a manner consistent with observations.
-
Historical atmospheric CO2 concentration: for emissions-driven historical runs, the simulated atmospheric CO2 concentration must closely match the observational record of direct atmospheric measurements, as supplied by Lan et al. (2024) via the latest Global Carbon Budget (Friedlingstein et al., 2025). Evaluation will involve the mean CO2 concentration anomaly from pre-industrial for the 2014–2023 period.
-
Global Carbon Budget components: for models able to partition carbon into ocean and land reservoirs, RCM carbon fluxes should be consistent with the central estimates and uncertainties of the land and ocean carbon fluxes we provide. These fluxes are reported by a revised version of the 2024 Global Carbon Budget following an updated methodology (Friedlingstein et al., 2026). This updated methodology will underpin future annual updates of the Global Carbon Budget and the upcoming AR7 assessment, and has therefore been included in this intercomparison to maximise its relevance in future assessments. RCMs will be evaluated against the 2014–2023 assessed budgets for the net ocean and land carbon sinks from this revised methodology.
It is recognised that RCMs represent these carbon cycle processes with varying levels of complexity. Models with explicit, separate representations of the land and ocean carbon cycles are expected to evaluate their performance against the individual land and ocean sink targets above. In contrast, models with a more aggregated carbon cycle representation where land and ocean sinks are not explicitly resolved (e.g., impulse-response models like FaIR; Leach et al., 2021) should evaluate their simulated total sink against the sum of the observationally-based land and ocean sinks. This ensures a fair and appropriate evaluation across different model structures.
Table 4Requested Variables: Atmospheric Composition: Major GHGs.

Table 5Requested Variables: Atmospheric Composition: Other GHGs. Only requested for non-idealised scenarios. Refer to template sheet in the supplement materials for full protocol names (e.g., the full name for |HFC|HFC125 should be Atmospheric Concentrations|F-Gases|HFC|HFC125).
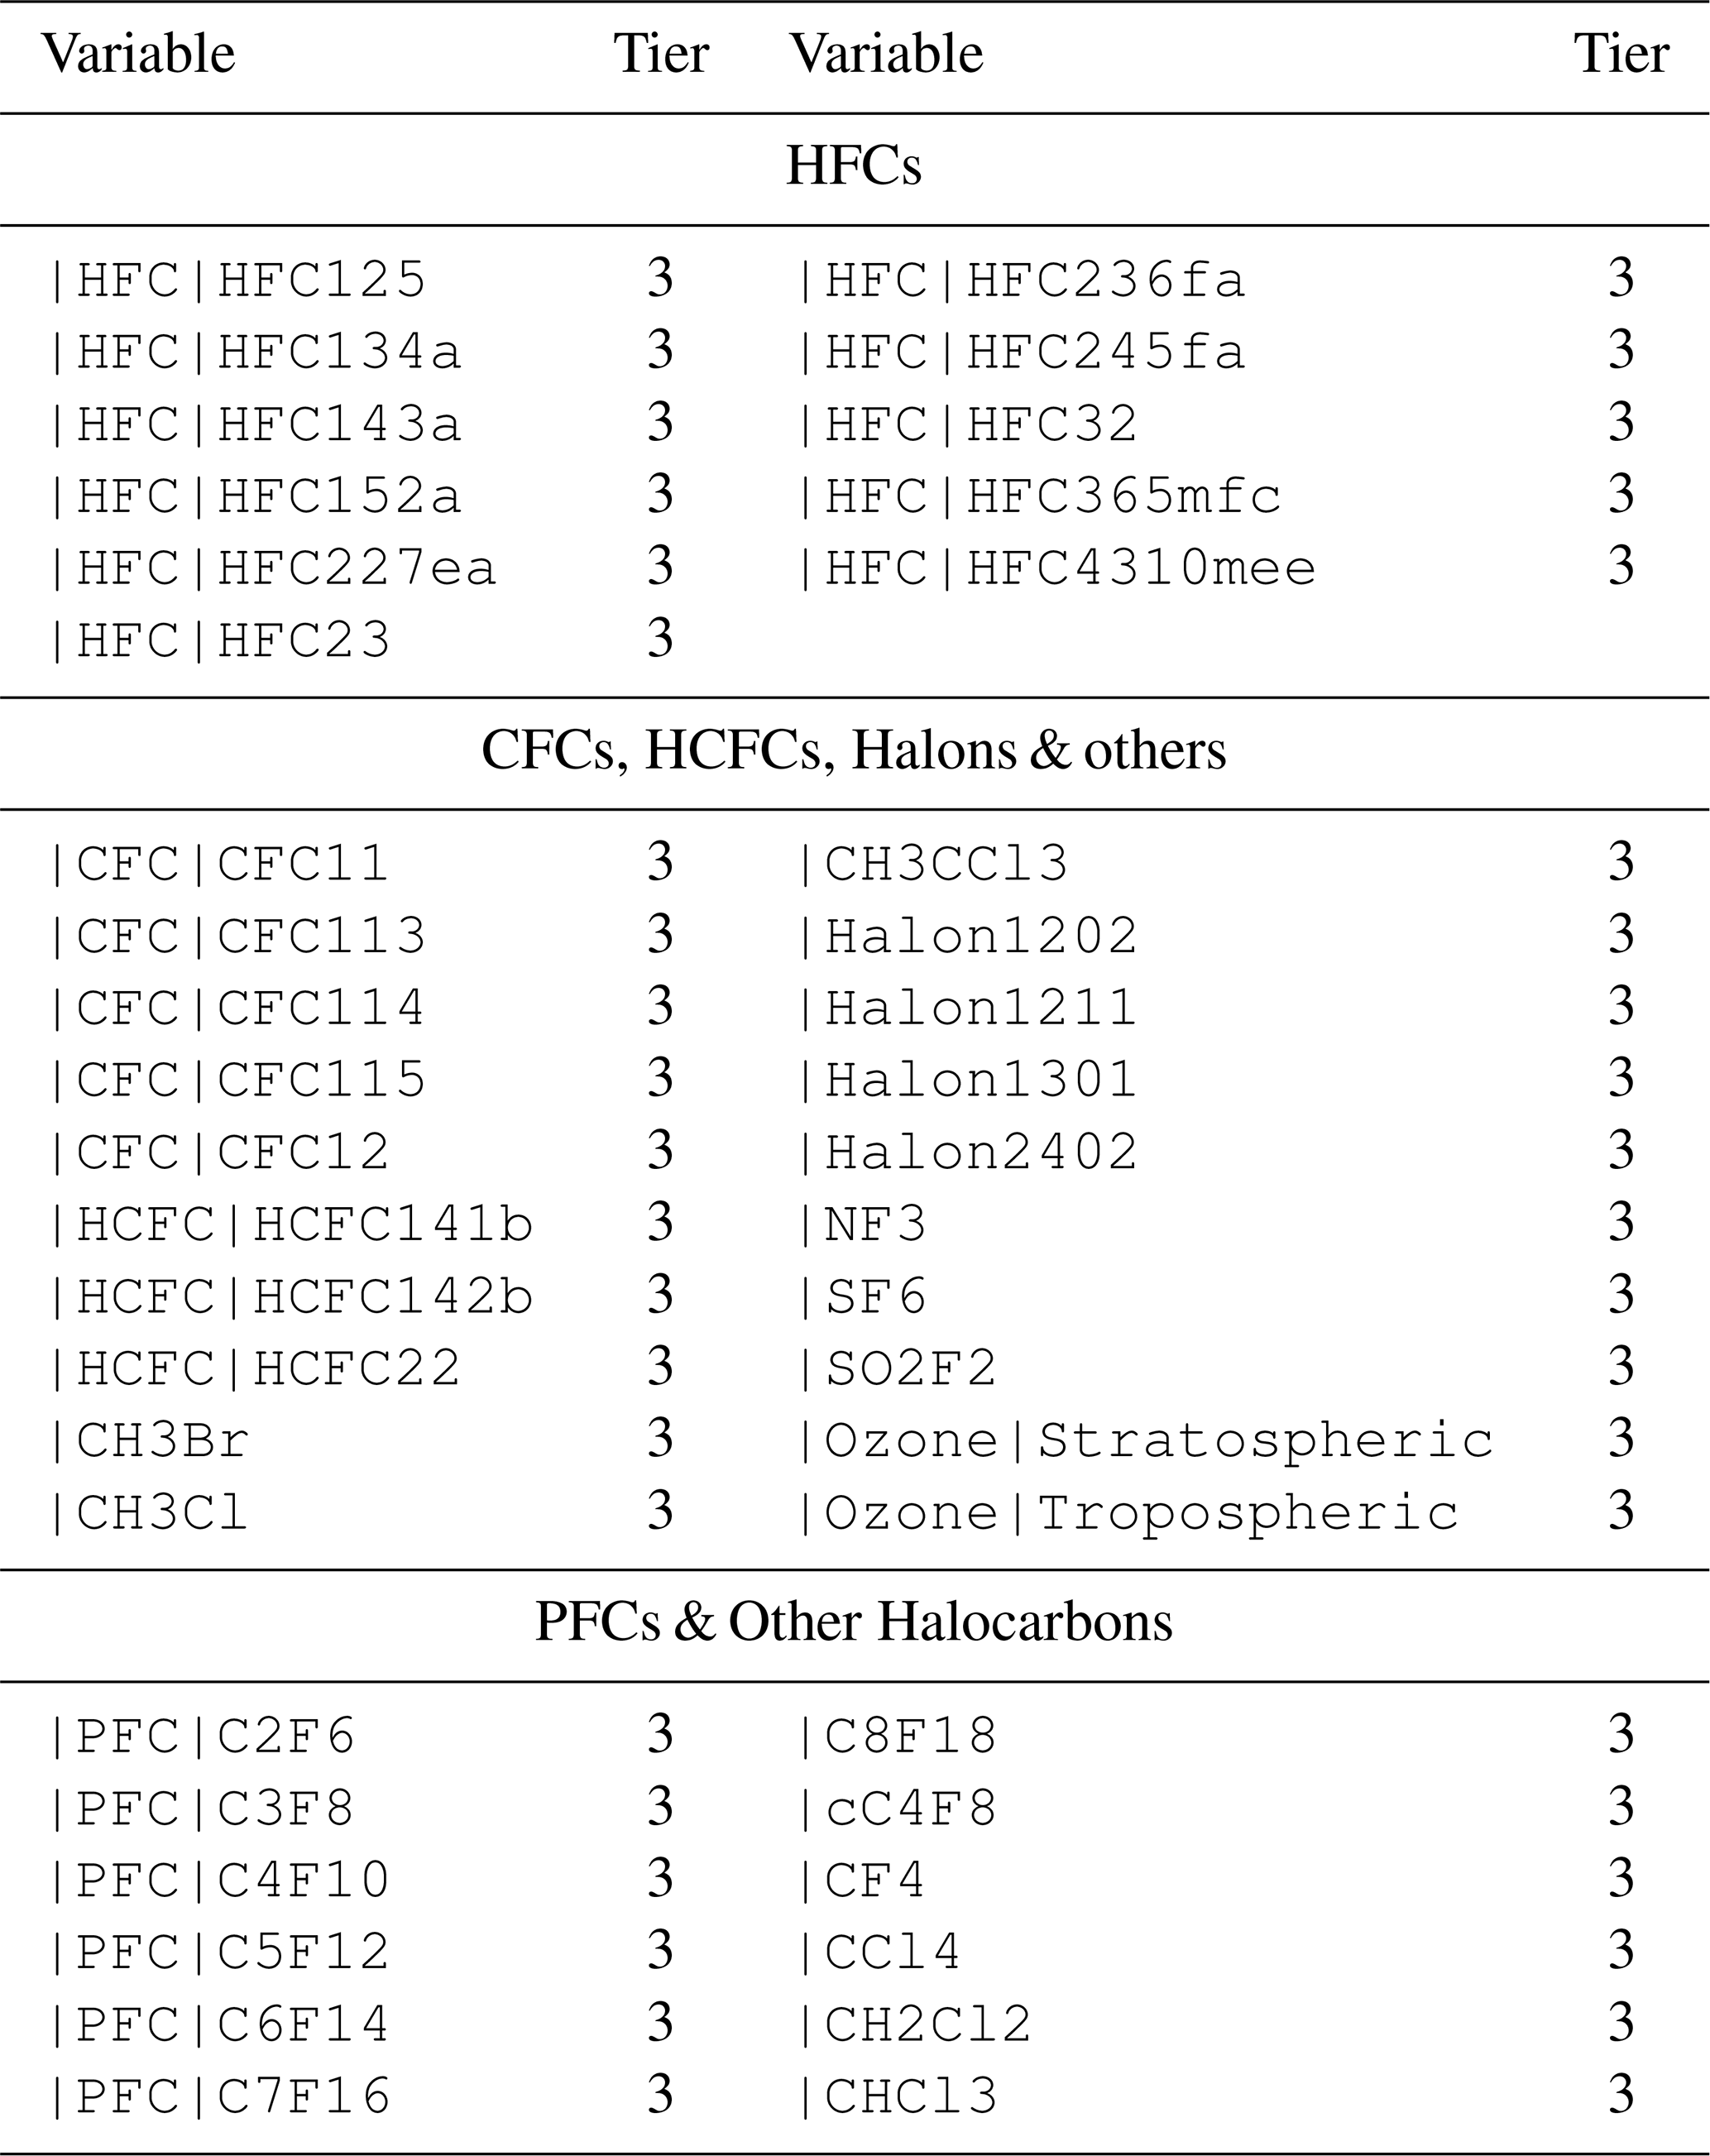
Table 6Requested Variables: Effective Radiative Forcing from different agents. An “Other” category is added to account for any other forcing agents not covered by the existing variables. Notice that in addition to these forcings, the effective radiative forcing for every single forcer in Table 5 is requested. A full list can be found in the supplementary material, along with tier information.
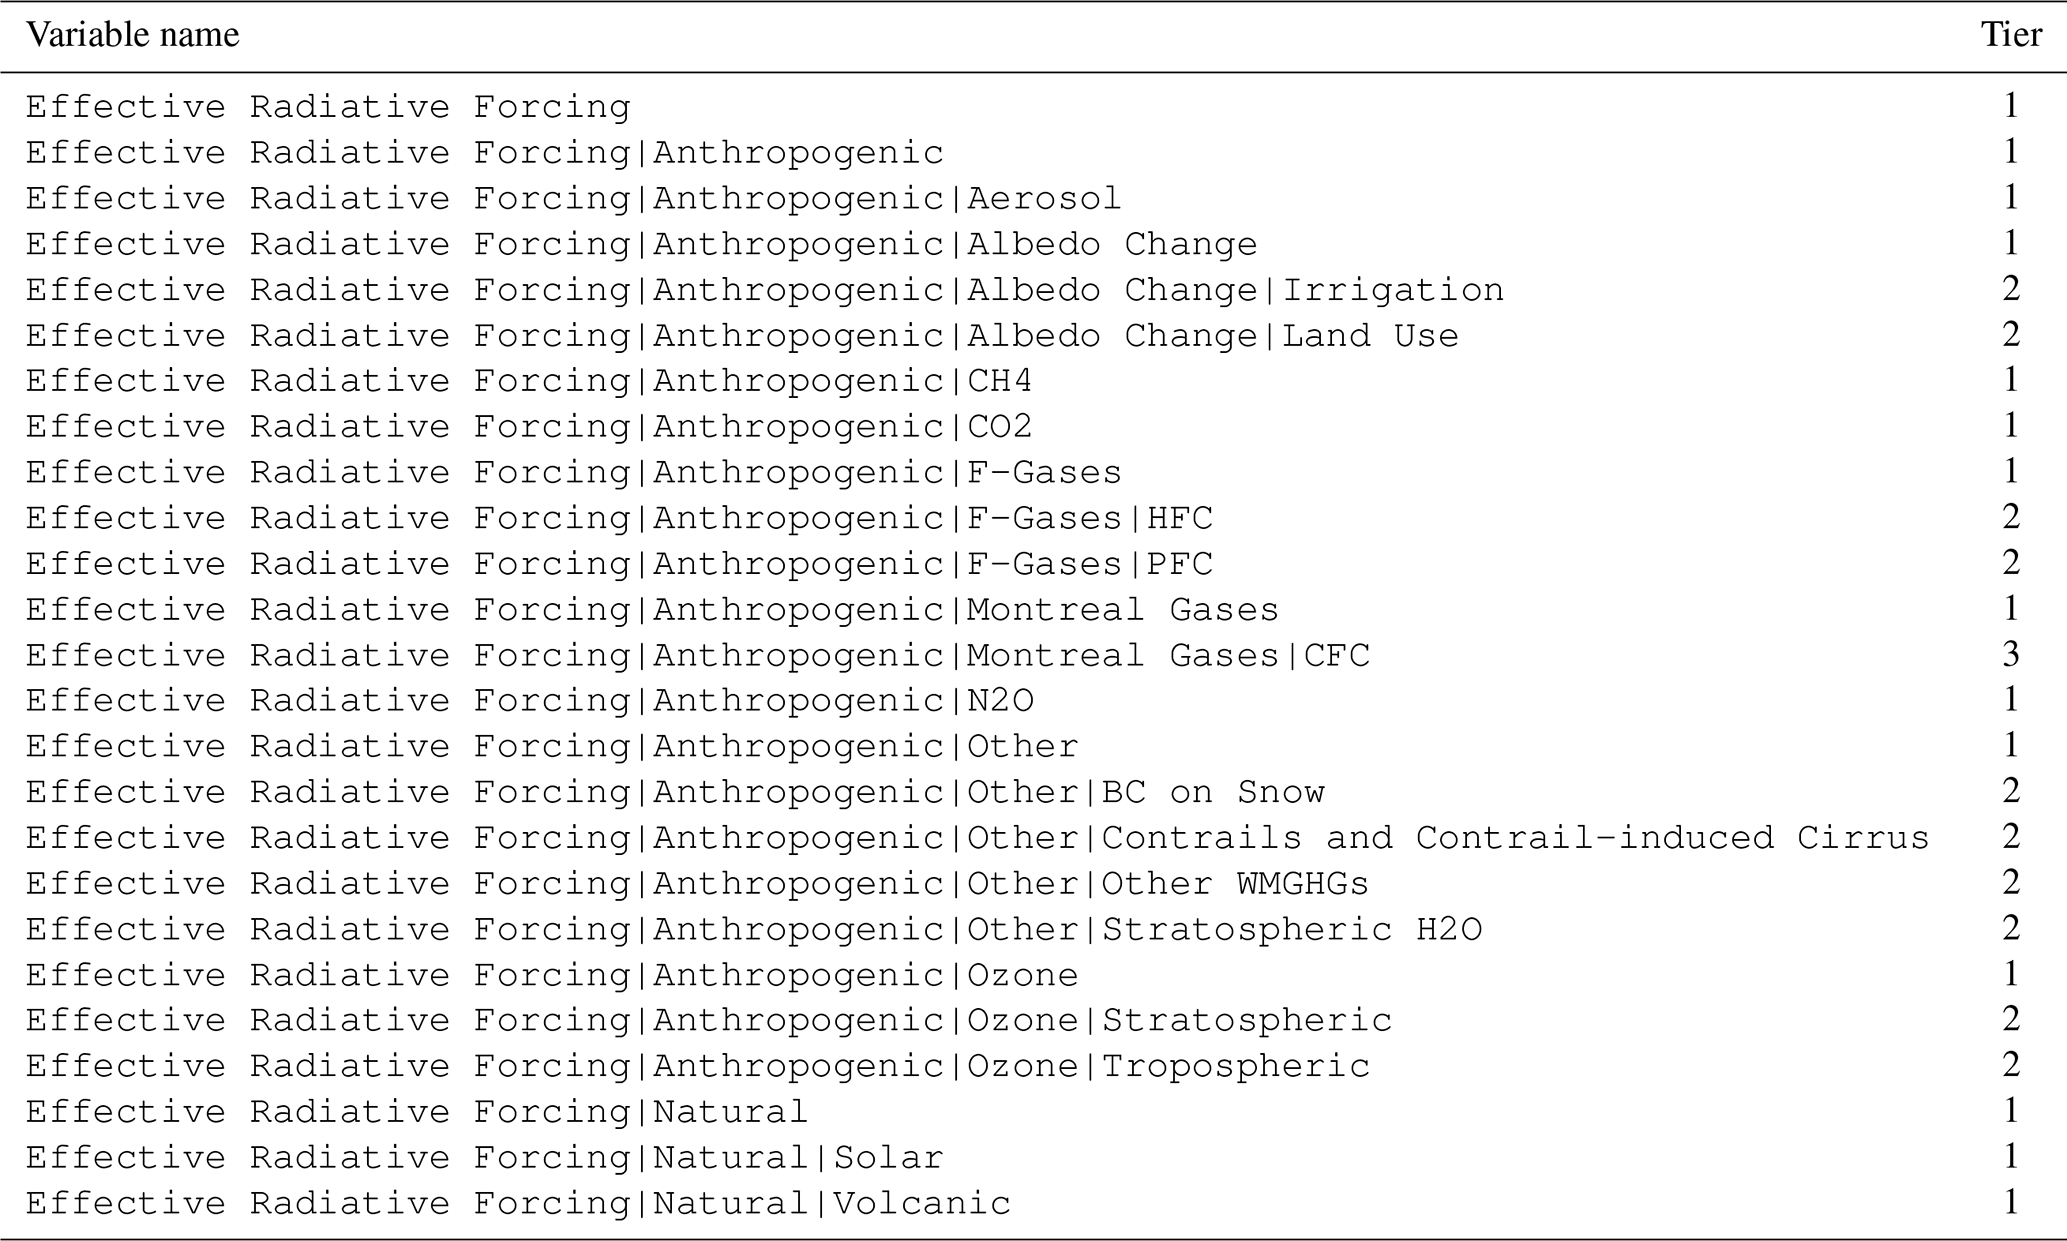
Table 7Requested Variables: disaggregation of Effective Radiative Forcing from aerosol effects. An “Other” category is added to cover any other forcing agents not covered by the existing variables.
While not direct calibration targets, emergent metrics such as the Transient Climate Response to cumulative CO2 Emissions (TCRE) and the Zero Emissions Commitment (ZEC), diagnosed from the idealised experiments, will be evaluated against the assessed ranges in the literature to further assess model performance. This decision to produce climate metrics as an output, rather than input of the protocol, was taken due to the lack of a post-AR6 assessment for ECS and TCRE, together with the unresolved issue of several exceptionally warm years (Esper et al., 2024; Blanchard-Wrigglesworth et al., 2025) with large energetic imbalances (Hakuba et al., 2024). Given these factors, it was decided that our protocol could more usefully provide an assessment of the degree to which the observed record constrain and update estimates of climate metrics, rather than assuming that past assessments remain static.
To facilitate a consistent and efficient analysis of model results, a standardised data submission protocol is required. The format for RCMIP3 will broadly follow the structure used in previous phases with some modifications. Users should use the latest version of the pyrcmip tooling (Romero Prieto et al., 2026b) to validate and submit their model output, which has been modified to work with RCMIP3 and accepts both comma-separated value (CSV) as in previous phases and netCDF formats. A template for CSV formats for submitted time series data is provided in the supplementary material. The template also includes sheets for detailed model metadata and any regional definitions used, together with the possibility to add comments regarding the submitted model output. Jupyter notebooks providing an example on how to produce, validate and submit model output can be found in the notebooks folder in the pyrcmip tool referenced above. A complete list of all requested output variables, along with more detailed descriptions, tiers (see below), and units is provided in the supplementary material as well.
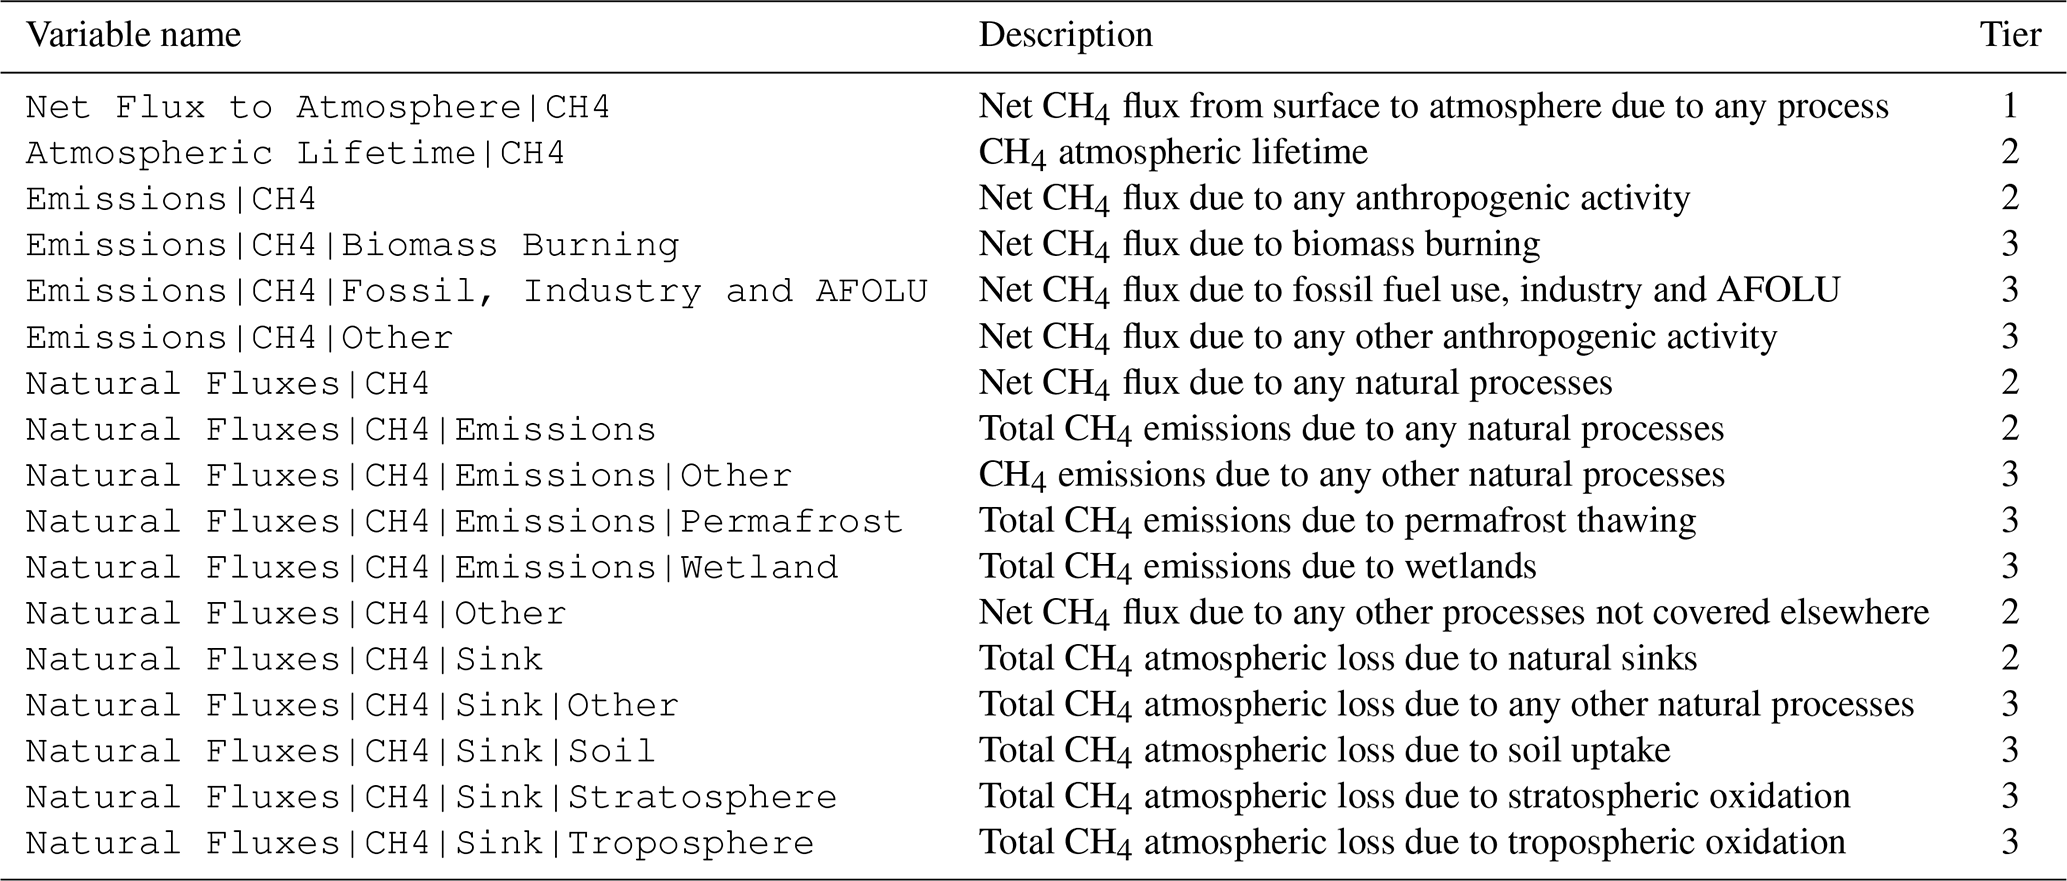
Our data request is divided into 3 main tiers [1–3], where tier 1 is the highest priority requested output which all groups are strongly encouraged to return to the extent they are capable. Subsequent lower tiers (2 and 3) cover domains less central to this RCMIP phase, supporting a more in-depth analysis. Additionally, there are also carbon (1-carbon) and methane (2-methane, 3-methane) specific tiers that are optionally requested from models that include the relevant processes. In this section, we describe the highest-priority variables, or tier 1, while categories entirely beyond tier 1 are listed in Table 12 (sea-level rise), Table 13 (emissions of minor species), Table 14 (methane cycle), and Table 15 (nitrogen cycle).
4.1 Tier 1 output variables
Tier 1 variables represent the ideal minimum output for participation in the core analysis of RCMIP3. However, it is acknowledged that some models may not possess the technical capabilities to report all of them while still interested in participating in the exercise to the extent of their capabilities. It is therefore acceptable to not submit some of these variables. Modelling groups should still aim to submit as much of this output as possible.
4.1.1 Atmospheric composition and forcing
This group of variables is essential for diagnosing the link between emissions and climate response.
-
Atmospheric Concentrations: global mean concentrations for greenhouse gases (GHG), including CO2, CH4, and N2O, as well as a variety of minor GHGs. These concentrations should only be reported for scenarios run in emissions-driven mode for the relevant species or for instances where the model sees a different concentration to that supplied by this protocol as input. -
Effective Radiative Forcing (ERF): the total global mean ERF from all anthropogenic and natural forcings, as well as the ERF decomposed by forcing agent (e.g., CO2, CH4, total aerosol ERF).
Notice that for idealised CO2-only experiments, only CO2 concentration and forcing data should be reported. A complete list of requested variables in this category can be found in Tables 4–7.
4.1.2 Climate system response (temperature and energy)
These variables characterise the top-level climate response of the model.
-
Surface air temperature change: global mean surface air temperature anomaly relative to the pre-industrial baseline period. -
Surface ocean temperature change: global mean surface ocean temperature anomaly relative to the pre-industrial baseline period. -
Heat uptake: the total yearly change in global heat content, representing the net energy imbalance of the planet. -
Ocean heat uptake: the yearly change in global ocean heat content. -
Ocean heat content: the total increase in ocean heat content with respect to pre-industrial.
The full list of climate and energy budget variables is provided in Table 8.
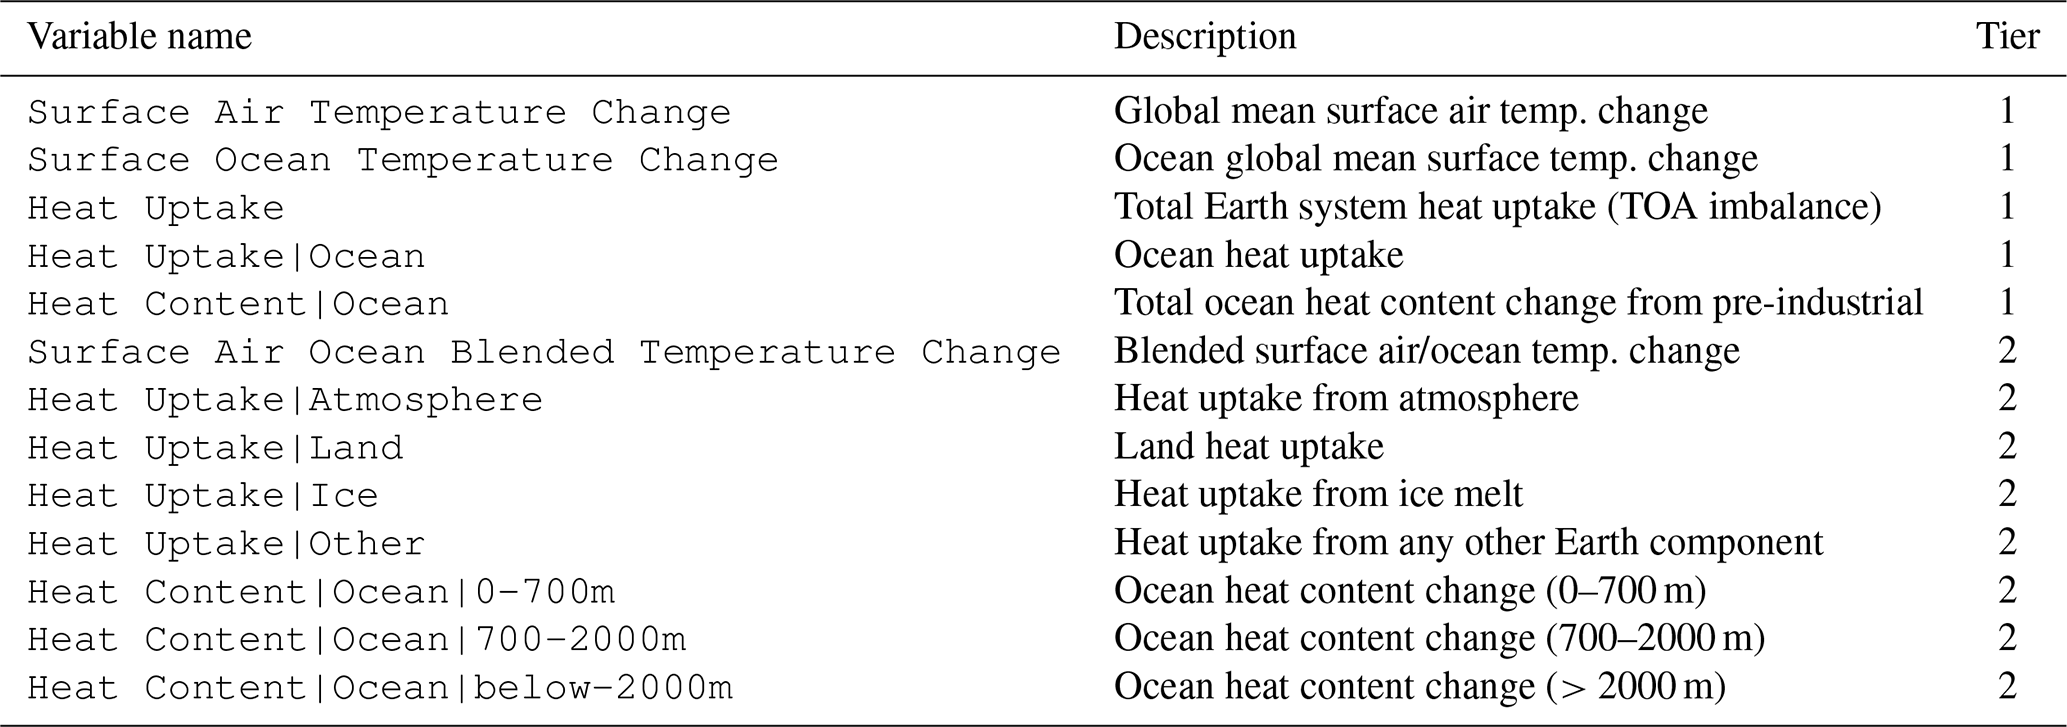
Table 9Requested Variables: Carbon Pools. Total amount of CO2 contained in the different component of the Earth's system.
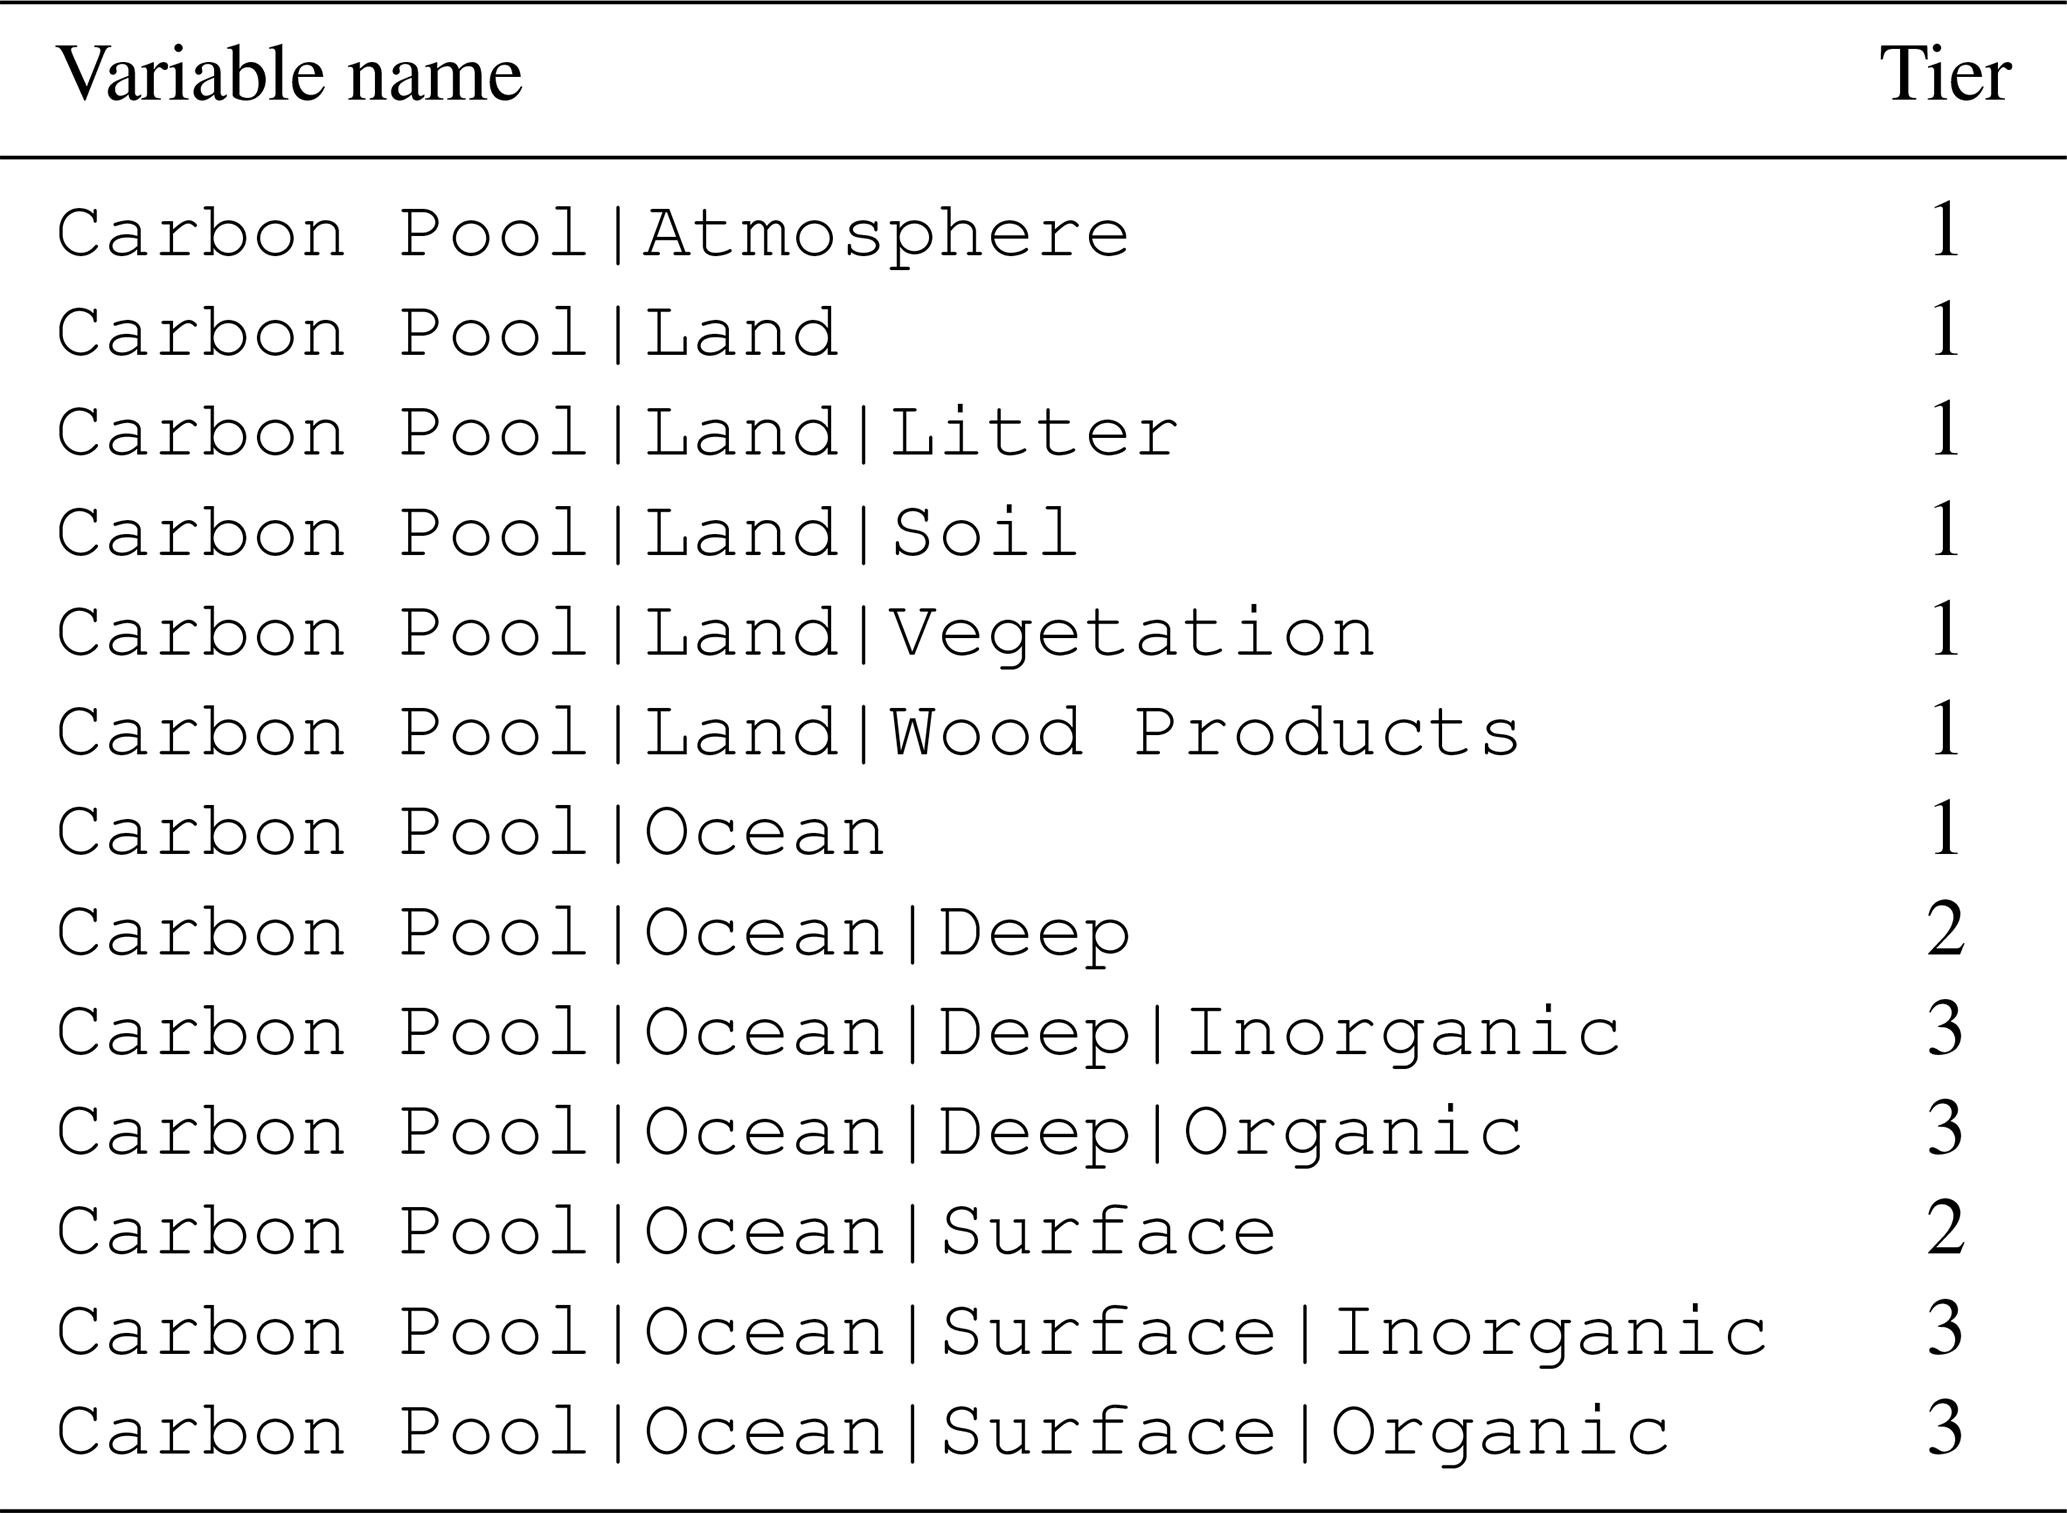
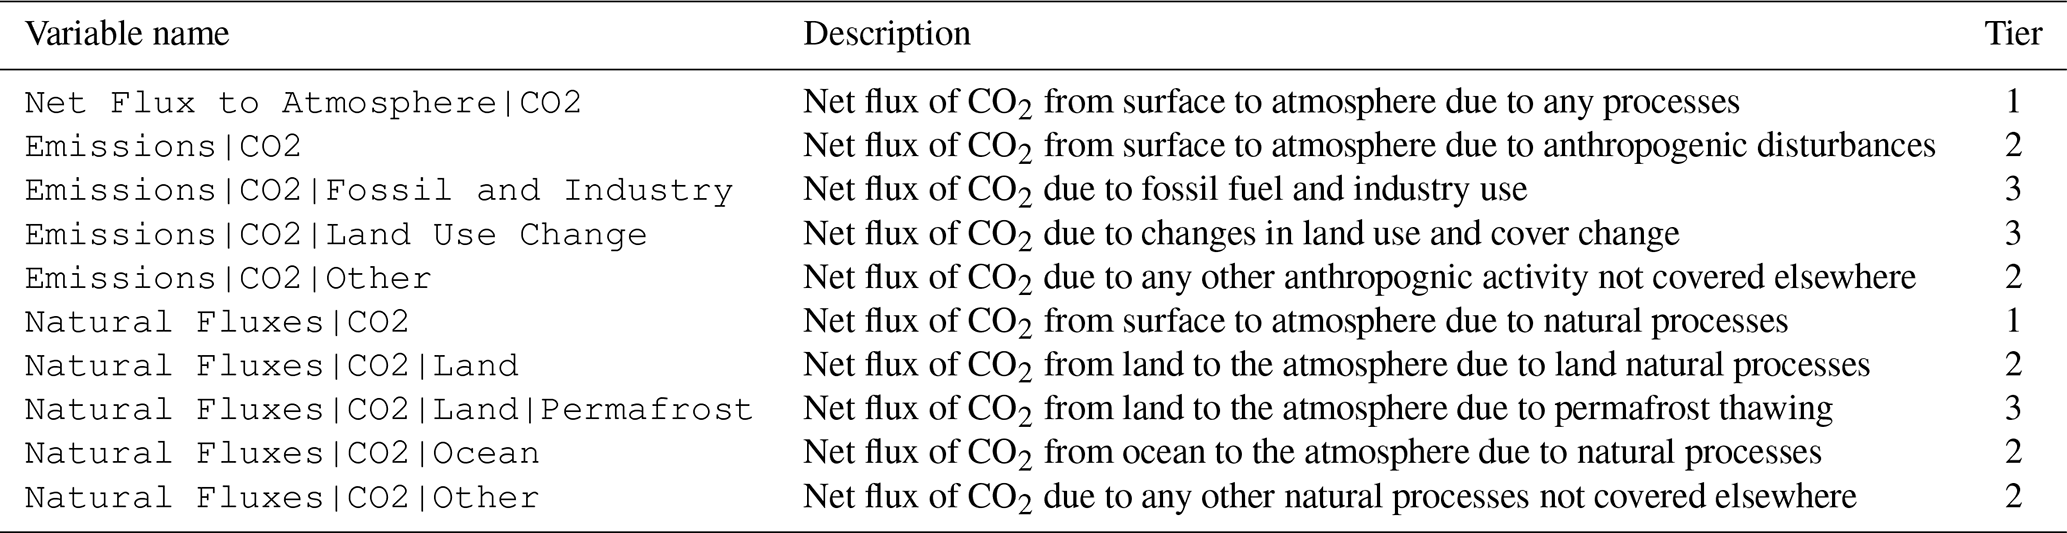
Table 11Requested Variables: Process-based carbon fluxes. Some fluxes are disaggregated further depending on the target pool they are transporting carbon to.
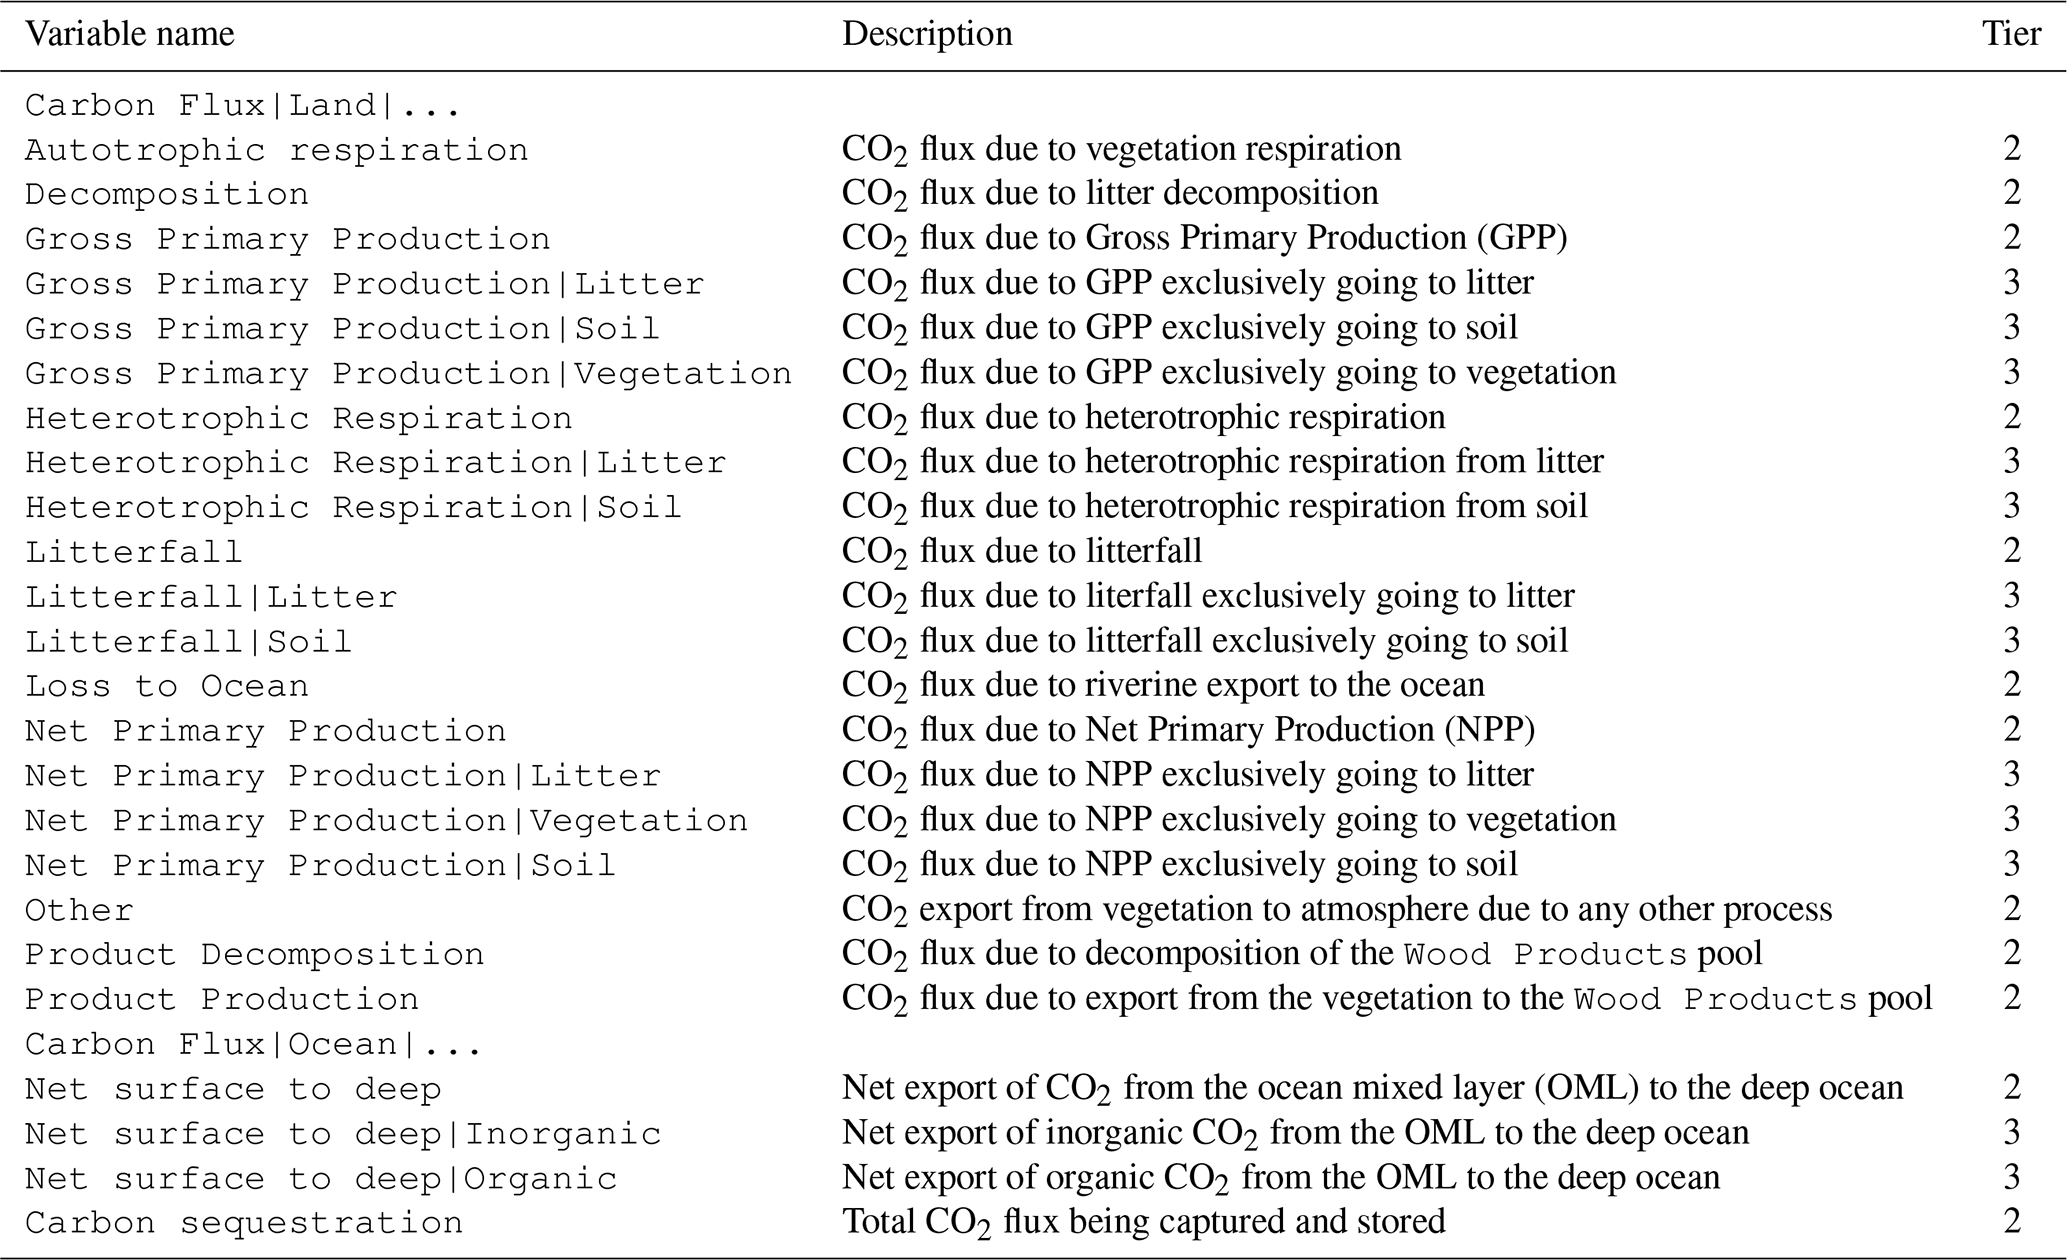
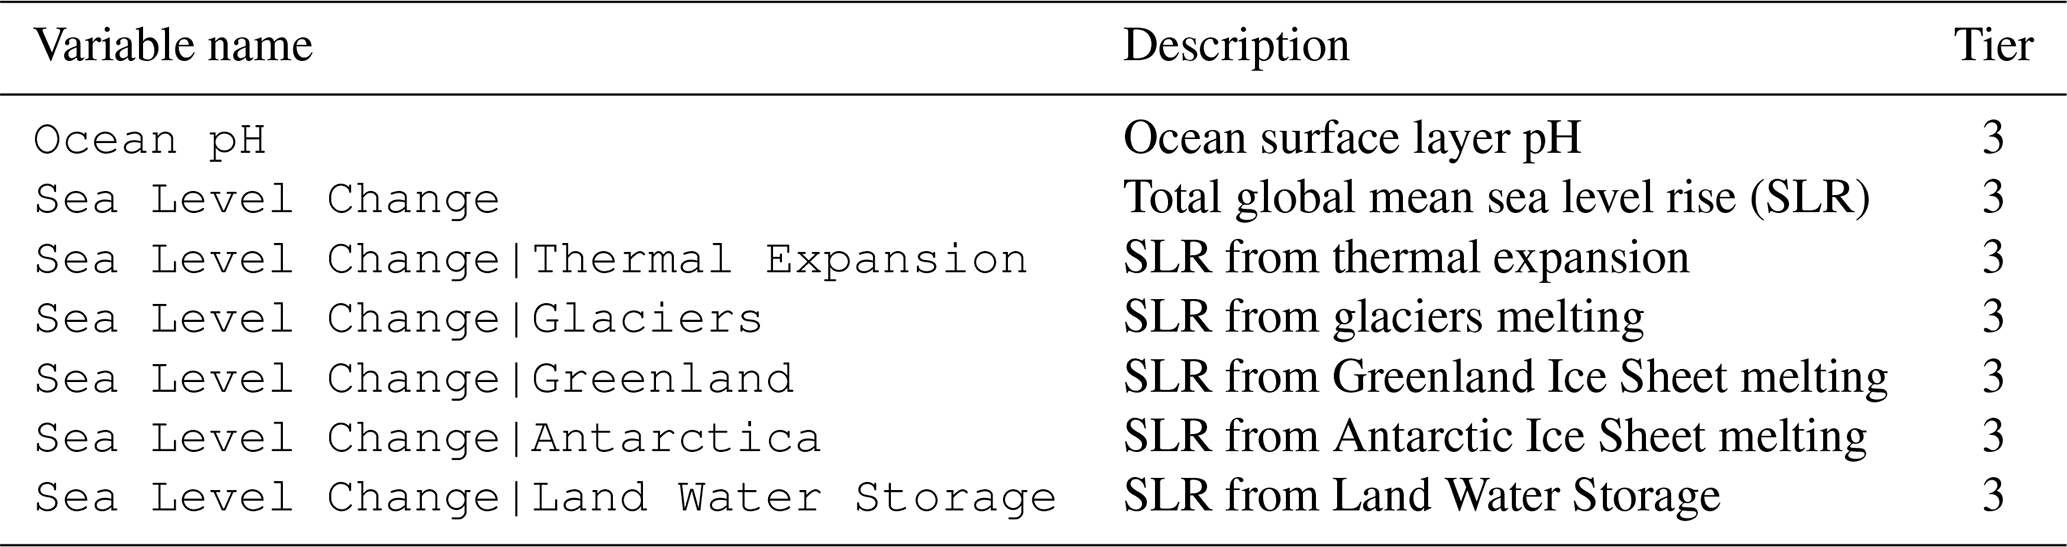
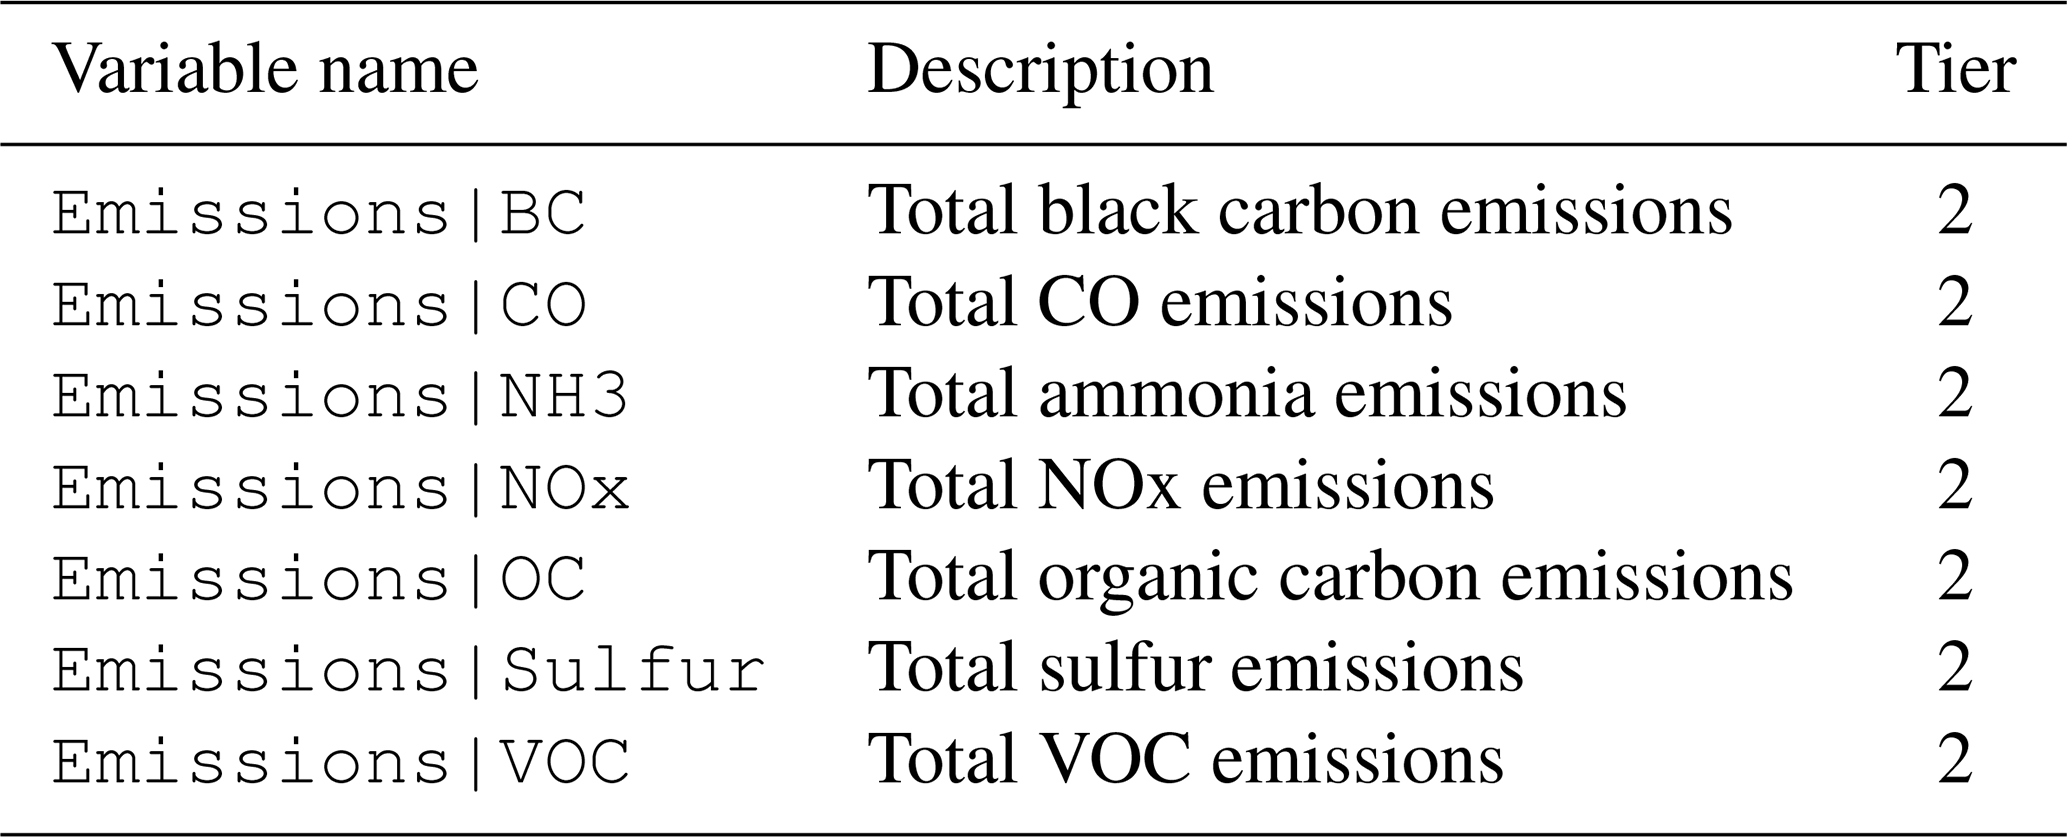
Table 13Requested Variables: Emissions (as diagnosed by the model in concentration-driven runs. Do not report for emissions-driven runs unless different from supplied model input). Notice that some emissions have already been listed as part of the carbon cycle (Table 10), methane cycle (Table 14), and the nitrogen cycle (Table 15). Additionally, we also request emissions from all the species in Table 5.

4.1.3 Carbon cycle
Given the importance of the carbon cycle both for Earth system modelling in general and for this RCMIP phase in particular, the list of requested variables is quite extensive. These variables are critical for evaluating the performance of a model's carbon cycle in emissions-driven experiments, and will allow a more in-depth analysis than previous RCMIP phases. Broadly speaking, these variables cover:
-
Carbon pools: the amount of CO2 contained in different parts of the Earth system. -
Carbon Fluxes: the amount of CO2 moving between Earth system components due to predominantly natural processes in varying degrees of detail. -
Net Flux to Atmosphere|CO2: the net amount of CO2 moving from the Earth's surface to the Atmosphere due to any processes, natural or anthropogenic. -
Natural Fluxes: the net amount of CO2 moving from the Earth's surface to the atmosphere due to natural processes. -
Emissions|CO2: the net amount of CO2 moving from the Earth's surface to the atmosphere due to anthropogenic processes.
Notice that, while the addition of Natural Fluxes and Emissions|CO2 should be equal to the variable Net Flux to Atmosphere|CO2, we make no prescription on how the Carbon Flux quantities should map to the other carbon cycle aggregated variables. This is primarily due to the complex interactions between natural fluxes and land-use land-cover change (LULCC) disturbances, and the representation diversity of these interactions within the reduced-complexity community. As a result, Carbon Flux variables should be used to provide a process-based understanding of carbon cycle dynamics, while the Net Flux to Atmosphere|CO2, Natural Fluxes, and Emissions|CO2 should provide a high-level view of a model's carbon sources and sinks.
All requested carbon cycle and ocean chemistry variables are detailed in Tables 9–11.
4.2 Data format and submission
All time series data should be reported as annual means. Participants are required to submit their data using the official RCMIP data submission template and Python tooling libraries. This template includes a sheet for reporting time series output (“your_data”), a sheet for documenting the model version and key parameters (“meta_model”), and a sheet for documenting different region definitions for models that report non-global variables (“region_definitions”). Submissions will be uploaded to a central repository with details to be provided at the start of the submission period. We estimate that a complete experimental submission consisting of several hundred ensemble members for a medium-complexity RCM would require several dozen gigabytes of storage space.
Alternatively, data can be submitted in the native netCDF format that RCMIP3 results will be stored in. In this case, each data file should include three dimensions: ensemble member index, year, and variable. The file should also include the relevant global and variable-specific metadata (units). Global metadata includes: model name, model version number, brief model description, model literature reference, configuration label, authorship, and contact details. An example netCDF file that conforms to this structure can be found in the supplementary material, in the Python tooling (at https://gitlab.com/rcmip/pyrcmip/-/blob/master/tests/data/rcmip3_model_output_test.nc, last access: 23 July 2026), and in the RCMIP3 protocol zenodo archive (Romero Prieto et al., 2026b).
Participating modelling groups agree to have their submitted data made available under CC BY-SA 4.0 Licence so it can be freely available after the open call for submissions closes. Additionally, every modelling team should publish a file with the specific parameters used to generate the ensembles submitted to this intercomparison, along with a corresponding ensemble member index. This index should then be included in the submitted data, ensuring the reproducibility of the results.
In this paper, we have presented the experimental design, constraining strategy, and data requirements for Phase 3 of the Reduced-Complexity Model Intercomparison Project (RCMIP3). This new phase is a significant evolution from its predecessors, designed to address key lessons learned and to provide a robust framework for the application of Reduced-Complexity Models in the IPCC AR7 assessment cycle and beyond.
The design philosophy of RCMIP3 is centred on two pillars: a coordinated and transparent approach to model evaluation and a special focus on carbon cycle dynamics. A major advancement from previous phases is the introduction of a common constraining strategy, encouraging all participating models to be benchmarked against a consistent set of observational and assessment-based targets. These targets are derived from the latest climate indicators (Forster et al., 2024) and the Global Carbon Budget (Friedlingstein et al., 2025), and will allow for a much cleaner separation of uncertainty stemming from model structure versus calibration choices – a key ambiguity in past intercomparisons.
In thematic terms, this experimental design lays the foundation for the first comprehensive evaluation of RCM carbon cycle representations, a key component of Earth's climate system and a major limitation of past RCMIP phases. This focus on carbon cycle dynamics and metrics such as TCRE and ZEC is particularly timely, aligning directly with the scientific priorities of the AR7 cycle. Collectively, these design choices position RCMIP3 as a key tool to strengthen the integration across AR7 Working Groups I, II, and III, by providing a benchmarked and consistently calibrated ensemble of RCMs that supports a more robust assessment of climate outcomes for the full suite of emissions scenarios.
Furthermore, RCMIP3 is designed to provide substantial co-benefits for the wider climate modelling community, particularly in its synergy with CMIP7 (Dunne et al., 2025). The efficiency of RCMs allows a comprehensive intercomparison protocol with 97 experiments, enabling a much broader set of results than would be available with an ESM ensemble of opportunity. The RCMIP3 protocol also aids in the exploration of different classes of model simulations, including all-GHG emissions-driven runs which are not yet a standard part of the CMIP protocol and methane-specific experiments. By running a broad suite of scenarios from current and previous CMIP phases, RCMIP3 provides a valuable link across assessment cycles. Furthermore, the experimental design significantly expands on CMIP7 idealised experiments like “flat10MIP” (Sanderson et al., 2025), using the computational efficiency of RCMs to explore sensitivities and overshoot dynamics in far greater detail than is feasible with comprehensive ESMs.
By establishing this common framework, RCMIP3 will not only provide critical data for the AR7 assessment but also deliver a lasting resource for the scientific community to better understand the behaviour of RCMs and their role in synthesising our knowledge of the Earth system.
The latest versions of the protocol – including requested experiments and variables with associated units – as well as the input dataset and the code to generate that dataset can be found at https://gitlab.com/rcmip/rcmip-phase-3. A copy of those files at the time of publication can be found at https://doi.org/10.5281/zenodo.20720521 (Romero Prieto et al., 2026b). The code and installation instructions for pyrcmip, the tool developed to support the data submission for RCMIP3, live at https://gitlab.com/rcmip/pyrcmip (last access: 23 July 2026) with an archived version at https://doi.org/10.5281/zenodo.20308242 (Romero Prieto et al., 2026b).
The supplement related to this article is available online at https://doi.org/10.5194/gmd-19-7111-2026-supplement.
ARP led the conceptualization and methodology of the manuscript. All authors contributed to the conceptualisation. MS, ZRJN, JK, TJA and CS contributed to the data curation associated to the protocol experimental design. ARP and MS contributed to the software supporting the protocol design and data submission. ARP, MS, CS, NJS, and BMS contributed to the writing of the manuscript. All authors contributed to the review and editing of the manuscript.
The contact author has declared that none of the authors has any competing interests.
Publisher's note: Copernicus Publications remains neutral with regard to jurisdictional claims made in the text, published maps, institutional affiliations, or any other geographical representation in this paper. The authors bear the ultimate responsibility for providing appropriate place names. Views expressed in the text are those of the authors and do not necessarily reflect the views of the publisher.
The authors would like to thank the colleagues who graciously provided feedback on the RCMIP3 experimental protocol: Victor Couplet, Kalyn Dorheim, Doris Folini, Robert Gieseke, Chris D. Jones, Steven J. Smith, Xuanming Su, Gang Tang, and Junichi Tsutsui. We also thank the RCMIP Steering Committee – comprised of Maisa Corradi, Piers Forster, Jan Fuglestvedt, Malte Meinshausen, Joeri Rogelj and Steven Smith – for their support and guidance.
Alejandro Romero Prieto was supported by the Leeds-York-Hull Natural Environment Research Council (NERC) Doctoral Training Partnership (DTP) Panorama under grant NE/S007458/1. Marit Sandstad, Norman J. Steinert and Benjamin Sanderson were supported by the Norwegian Research Council through the project TRIFECTA (grant no. 334811), the European Union Horizon Europe Research and Innovation programme projects DIAMOND (grant no. 101081179) and ESM2025 (grant no. 101003536). The Norwegian Research Council project TRIFECTA also funded travel for Chris Smith, Zebedee R. J. Nicholls and Alejandro Romero Prieto which contributed to various stages of the planning of RCMIP phase 3. Zebedee R. J. Nicholls received funding from the European Union's Horizon 2020 research and innovation program (grant agreement no. 101003536) (ESM2025) and the European Space Agency (ESA) as part of the GHG Forcing For CMIP project of the Climate Change Initiative (CCI) (ESA Contract No. 4000146681/24/I-LR-cl). Camilla Mathison was supported by the Met Office Hadley Centre Climate Programme funded by DSIT and UK Research and Innovation (UKRI) under the UK government's Horizon Europe funding Guarantee through the projects TipESM (grant no. 101137673) and OptimESM (grant no. 101081193). Thomas Aubry acknowledges generous support from the European Space Agency “Volcanic forcing for CMIP” project of the Climate Change Initiative (CCI) (ESA Contract no. 4000145911/24/I-LR). Chris Smith was supported by European Union Horizon Europe Research and Innovation programme projects WorldTrans (grant no. 101081661) and SPARCCLE (grant no. 101081369).
This paper was edited by Peter Caldwell and reviewed by Marcus Sarofim and one anonymous referee.
Adam, B., Western, L. M., Mühle, J., Haklim, C., Krummel, P. B., O'Doherty, S., Young, D., Stanley, K. M. N. F. P. J., Harth, C. M., Salameh, P. K., Weiss, R. F., Prinn, R. G., Kim, J., Park, H., Park, S., and Rigby, M.: Emissions of HFC-23 do not reflect commitments made under the Kigali Amendment, Commun. Earth Environ., 5, 2662–4435, https://doi.org/10.1038/s43247-024-01946-y, 2024. a
Aubry, T. J., Toohey, M., Khanal, S., Chim, M. M., Verkerk, M., Johnson, B., Schmidt, A., Kovilakam, M., Sigl, M., Nicholls, Z., Thomason, L., Naik, V., Rieger, L., Stiller, D., Ziegler, E., Durack, P., and Smith, I. H.: Stratospheric aerosol forcing for CMIP7 – Part 1: optical properties for pre-industrial, historical, and scenario simulations, Geosci. Model Dev., 19, 3725–3756, https://doi.org/10.5194/gmd-19-3725-2026, 2026. a
Baumstark, L., Bauer, N., Benke, F., Bertram, C., Bi, S., Gong, C. C., Dietrich, J. P., Dirnaichner, A., Giannousakis, A., Hilaire, J., Klein, D., Koch, J., Leimbach, M., Levesque, A., Madeddu, S., Malik, A., Merfort, A., Merfort, L., Odenweller, A., Pehl, M., Pietzcker, R. C., Piontek, F., Rauner, S., Rodrigues, R., Rottoli, M., Schreyer, F., Schultes, A., Soergel, B., Soergel, D., Strefler, J., Ueckerdt, F., Kriegler, E., and Luderer, G.: REMIND2.1: transformation and innovation dynamics of the energy-economic system within climate and sustainability limits, Geosci. Model Dev., 14, 6571–6603, https://doi.org/10.5194/gmd-14-6571-2021, 2021. a
Bertram, C., Hilaire, J., Kriegler, E., Beck, T., Bresch, D. N., Clarke, L., Cui, R., Edmonds, J., Min, J., Piontek, F., Rogelj, J., Schleussner, C.-F., van Ruijven, B., and Yu, S.: NGFS Climate Scenarios Database: Technical Documentation, https://pure.iiasa.ac.at/id/eprint/17509/ (last access: 23 July 2026), 2021. a
Blanchard-Wrigglesworth, E., Bilbao, R., Donohoe, A., and Materia, S.: Record Warmth of 2023 and 2024 was Highly Predictable and Resulted From ENSO Transition and Northern Hemisphere Absorbed Shortwave Anomalies, Geophys. Res. Lett., 52, https://doi.org/10.1029/2025GL115614, 2025. a
Chim, M. M., Aubry, T. J., Smith, C., and Schmidt, A.: Neglecting future sporadic volcanic eruptions underestimates climate uncertainty, Commun. Earth Environ., 6, 236, https://doi.org/10.1038/s43247-025-02208-1, 2025. a
Crippa, M., Guizzardi, D., Pagani, F., Banja, M., Muntean, M., Schaaf, E., Monforti-ferrario, F., Becker, W., Quadrelli, R., Risquez martin, A., Taghavi-moharamli, P., Köykkä, J., Grassi, G., Rossi, S., Melo, J., Oom, D., Branco, A., San-miguel, J., Manca, G., Pisoni, E., Vignati, E., and Pekar, F.: GHG emissions of all world countries (EDGAR), European Union, https://doi.org/10.2760/4002897, 2024. a
Dunne, J. P., Hewitt, H. T., Arblaster, J. M., Bonou, F., Boucher, O., Cavazos, T., Dingley, B., Durack, P. J., Hassler, B., Juckes, M., Miyakawa, T., Mizielinski, M., Naik, V., Nicholls, Z., O'Rourke, E., Pincus, R., Sanderson, B. M., Simpson, I. R., and Taylor, K. E.: An evolving Coupled Model Intercomparison Project phase 7 (CMIP7) and Fast Track in support of future climate assessment, Geosci. Model Dev., 18, 6671–6700, https://doi.org/10.5194/gmd-18-6671-2025, 2025. a, b, c
England, M., Shindell, D., O'Connor, F., Smith, C., Xu, Y., Chuan, F., Gaubert, B., Law, R., Ziehn, T., Jöckel, P., Winterstein, F., Kleinen, T., Naik, V., Cussac, M., Graff, L. S., Olivié, D., and Sigmond, M.: An introduction to MethaneMIP: investigating the climate and health benefits of methane mitigation using Earth System Models, in: EGU General Assembly 2025, Vienna, Austria, eGU25-4867, https://doi.org/10.5194/egusphere-egu25-4867, 2025. a, b
EPA: Report on the Social Cost of Greenhouse Gases: Estimates Incorporating Recent Scientific Advances, Tech. rep., EPA, Washington, D.C., https://www.epa.gov/system/files/documents/2023-12/epa_scghg_2023_report_final.pdf (last access: 23 July 2026), 2023. a
Esper, J., Torbenson, M., and Büntgen, U.: 2023 summer warmth unparalleled over the past 2,000 years, Nature, 631, 94–97, 2024. a
Forster, P., Storelvmo, T., Armour, K., Collins, W., Dufresne, J.-L., Frame, D., Lunt, D., Mauritsen, T., Palmer, M. D., Watanabe, M., Wild, M., and Zhang, H.: The Earth's Energy Budget, Climate Feedbacks, and Climate Sensitivity, in: Climate Change 2021: The Physical Science Basis. Contribution of Working Group I to the Sixth Assessment Report of the Inter-governmental Panel on Climate Change, Cambridge University Press, Cambridge, UK and New York, NY, USA, https://doi.org/10.1017/9781009157896.009, 2021. a, b, c
Forster, P. M., Smith, C., Walsh, T., Lamb, W. F., Lamboll, R., Hall, B., Hauser, M., Ribes, A., Rosen, D., Gillett, N. P., Palmer, M. D., Rogelj, J., Von Schuckmann, K., Trewin, B., Allen, M., Andrew, R., Betts, R. A., Borger, A., Boyer, T., Broersma, J. A., Buontempo, C., Burgess, S., Cagnazzo, C., Cheng, L., Friedlingstein, P., Gettelman, A., Gütschow, J., Ishii, M., Jenkins, S., Lan, X., Morice, C., Mühle, J., Kadow, C., Kennedy, J., Killick, R. E., Krummel, P. B., Minx, J. C., Myhre, G., Naik, V., Peters, G. P., Pirani, A., Pongratz, J., Schleussner, C.-F., Seneviratne, S. I., Szopa, S., Thorne, P., Kovilakam, M. V. M., Majamäki, E., Jalkanen, J.-P., Van Marle, M., Hoesly, R. M., Rohde, R., Schumacher, D., Van Der Werf, G., Vose, R., Zickfeld, K., Zhang, X., Masson-Delmotte, V., and Zhai, P.: Indicators of Global Climate Change 2023: annual update of key indicators of the state of the climate system and human influence, Earth Syst. Sci. Data, 16, 2625–2658, https://doi.org/10.5194/essd-16-2625-2024, 2024. a, b, c, d, e
Forster, P. M., Smith, C., Walsh, T., Lamb, W. F., Lamboll, R., Cassou, C., Hauser, M., Hausfather, Z., Lee, J.-Y., Palmer, M. D., Von Schuckmann, K., Slangen, A. B. A., Szopa, S., Trewin, B., Yun, J., Gillett, N. P., Jenkins, S., Matthews, H. D., Raghavan, K., Ribes, A., Rogelj, J., Rosen, D., Zhang, X., Allen, M., Aleluia Reis, L., Andrew, R. M., Betts, R. A., Borger, A., Broersma, J. A., Burgess, S. N., Cheng, L., Friedlingstein, P., Domingues, C. M., Gambarini, M., Gasser, T., Gütschow, J., Ishii, M., Kadow, C., Kennedy, J., Killick, R. E., Krummel, P. B., Liné, A., Monselesan, D. P., Morice, C., Mühle, J., Naik, V., Peters, G. P., Pirani, A., Pongratz, J., Minx, J. C., Rigby, M., Rohde, R., Savita, A., Seneviratne, S. I., Thorne, P., Wells, C., Western, L. M., Van Der Werf, G. R., Wijffels, S. E., Masson-Delmotte, V., and Zhai, P.: Indicators of Global Climate Change 2024: annual update of key indicators of the state of the climate system and human influence, Earth Syst. Sci. Data, 17, 2641–2680, https://doi.org/10.5194/essd-17-2641-2025, 2025. a, b
Friedlingstein, P., O'Sullivan, M., Jones, M. W., Andrew, R. M., Hauck, J., Landschützer, P., Le Quéré, C., Li, H., Luijkx, I. T., Olsen, A., Peters, G. P., Peters, W., Pongratz, J., Schwingshackl, C., Sitch, S., Canadell, J. ., Ciais, P., Jackson, R. B., Alin, S. R., Arneth, A., Arora, V., Bates, N. R., Becker, M., Bellouin, N., Berghoff, C. F., Bittig, H. C., Bopp, L., Cadule, P., Campbell, K., Chamberlain, M. A., Chandra, N., Chevallier, F., Chini, L. P., Colligan, T., Decayeux, J., Djeutchouang, L. M., Dou, X., Duran Rojas, C., Enyo, K., Evans, W., Fay, A. R., Feely, R. A., Ford, D. J., Foster, A., Gasser, T., Gehlen, M., Gkritzalis, T., Grassi, G., Gregor, L., Gruber, N., Gürses, O., Harris, I., Hefner, M., Heinke, J., Hurtt, G. C., Iida, Y., Ilyina, T., Jacobson, A. R., Jain, A. K., Jarníková, T., Jersild, A., Jiang, F., Jin, Z., Kato, E., Keeling, R. F., Klein Goldewijk, K., Knauer, J., Korsbakken, J. I., Lan, X., Lauvset, S. K., Lefèvre, N., Liu, Z., Liu, J., Ma, L., Maksyutov, S., Marland, G., Mayot, N., McGuire, P. C., Metzl, N., Monacci, N. M., Morgan, E. J., Nakaoka, S. I., Neill, C., Niwa, Y., Nützel, T., Olivier, L., Ono, T., Palmer, P. I., Pierrot, D., Qin, Z., Resplandy, L., Roobaert, A., Rosan, T. M., Rödenbeck, C., Schwinger, J., Smallman, T. L., Smith, S. M., Sospedra-Alfonso, R., Steinhoff, T., Sun, Q., Sutton, A. J., Séférian, R., Takao, S., Tatebe, H., Tian, H., Tilbrook, B., Torres, O., Tourigny, E., Tsujino, H., Tubiello, F., van der Werf, G., Wanninkhof, R., Wang, X., Yang, D., Yang, X., Yu, Z., Yuan, W., Yue, X., Zaehle, S., Zeng, N., and Zeng, J.: Global Carbon Budget 2024, Earth Syst. Sci. Data, 17, 965–1039, https://doi.org/10.5194/essd-17-965-2025, 2025. a, b, c, d, e, f
Friedlingstein, P., Le Quéré, C., O'Sullivan, M., Hauck, J., Landschützer, P., Luijkx, I. T., Li, H., van der Woude, A., Schwingshackl, C., Pongratz, J., Regnier, P., Andrew, R. M., Bakker, D. C. E., Canadell, J. G., Ciais, P., Gasser, T., Jones, M. W., Lan, X., Morgan, E., Olsen, A., Peters, G. P., Peters, W., Sitch, S., and Tian, H.: Emerging climate impact on carbon sinks in a consolidated carbon budget, Nature, 649, 98–103, https://doi.org/10.1038/s41586-025-09802-5, 2026. a, b
Funke, B.: CEDS v_2025_04_18 Gridded Data 0.1 degree, ESFG, https://doi.org/10.25981/ESGF.input4MIPs.CMIP7/2522675, 2025. a
Gregory, J. M., Ingram, W. J., Palmer, M. A., Jones, G. S., Stott, P. A., Thorpe, R. B., Lowe, J. A., Johns, T. C., and Williams, K. D.: A new method for diagnosing radiative forcing and climate sensitivity, Geophys Res. Lett., 31, https://doi.org/10.1029/2003GL018747, 2004. a
Hakuba, M. Z., Fourest, S., Boyer, T., Meyssignac, B., Carton, J. A., Forget, G., Cheng, L., Giglio, D., Johnson, G. C., Kato, S., Killick, R. E., Kolodziejczyk, N., Kuusela, M., Landerer, F., Llovel, W., Locarnini, R., Loeb, N., Lyman, J. M., Mishonov, A., Pilewskie, P., Reagan, J., Storto, A., Sukianto, T., and von Schuckmann, K.: Trends and Variability in Earth's Energy Imbalance and Ocean Heat Uptake Since 2005, Surv. Geophys., 45, 1721–1756, https://doi.org/10.1007/s10712-024-09849-5, 2024. a
Hartin, C., Link, R., Patel, P., Mundra, A., Horowitz, R., Dorheim, K., and Clarke, L.: Integrated modeling of human-earth system interactions: An application of GCAM-fusion, Energy Econ., 103, 105566, https://doi.org/10.1016/j.eneco.2021.105566, 2021. a
Hoesly, R., Smith, S., Ahsan, H., Prime, N., O'Rourke, P., Crippa, M., Klimont, Z., Guizzardi, D., Feng, L., Harkins, C., McDonald, B., and Wang, S.: CEDS v_2025_04_18 Gridded Data 0.1 degree, Zenodo [data set], https://doi.org/10.5281/zenodo.15001546, 2025. a
Jones, C. D., Arora, V., Friedlingstein, P., Bopp, L., Brovkin, V., Dunne, J., Graven, H., Hoffman, F., Ilyina, T., John, J. G., Jung, M., Kawamiya, M., Koven, C., Pongratz, J., Raddatz, T., Randerson, J. T., and Zaehle, S.: C4MIP – The Coupled Climate–Carbon Cycle Model Intercomparison Project: experimental protocol for CMIP6, Geosci. Model Dev., 9, 2853–2880, https://doi.org/10.5194/gmd-9-2853-2016, 2016. a, b
Jones, C. D., Frölicher, T. L., Koven, C., MacDougall, A. H., Matthews, H. D., Zickfeld, K., Rogelj, J., Tokarska, K. B., Gillett, N. P., Ilyina, T., Meinshausen, M., Mengis, N., Séférian, R., Eby, M., and Burger, F. A.: The Zero Emissions Commitment Model Intercomparison Project (ZECMIP) contribution to C4MIP: quantifying committed climate changes following zero carbon emissions, Geosci. Model Dev., 12, 4375–4385, https://doi.org/10.5194/gmd-12-4375-2019, 2019. a, b, c
Keller, D. P., Lenton, A., Scott, V., Vaughan, N. E., Bauer, N., Ji, D., Jones, C. D., Kravitz, B., Muri, H., and Zickfeld, K.: The Carbon Dioxide Removal Model Intercomparison Project (CDRMIP): rationale and experimental protocol for CMIP6, Geosci. Model Dev., 11, 1133–1160, https://doi.org/10.5194/gmd-11-1133-2018, 2018. a, b
Lamboll, R. D., Nicholls, Z. R., Smith, C. J., Kikstra, J. S., Byers, E., and Rogelj, J.: Assessing the size and uncertainty of remaining carbon budgets, Nat. Clim. Change, 13, 1360–1367, 2023. a
Lan, X., Tans, P., and Thoning, K. W.: Trends in atmospheric carbon dioxide, NOAA/ESRL – National Oceanic & Atmospheric Administration, EarthSystem Research Laboratory, http://www.esrl.noaa.gov/gmd/ccgg/trends/global.html (last access: 23 July 2026), 2024. a, b
Leach, N. J., Jenkins, S., Nicholls, Z., Smith, C. J., Lynch, J., Cain, M., Walsh, T., Wu, B., Tsutsui, J., and Allen, M. R.: FaIRv2.0.0: a generalized impulse response model for climate uncertainty and future scenario exploration, Geosci. Model Dev., 14, 3007–3036, https://doi.org/10.5194/gmd-14-3007-2021, 2021. a
Nicholls, Z. and Gieseke, R.: RCMIP Phase 1 Data, Zenodo [data set], https://doi.org/10.5281/zenodo.3593570, 2019. a
Nicholls, Z., Meinshausen, M., Lewis, J., Corradi, M. R., Dorheim, K., Gasser, T., Gieseke, R., Hope, A. P., Leach, N. J., McBride, L. A., Quilcaille, Y., Rogelj, J., Salawitch, R. J., Samset, B. H., Sandstad, M., Shiklomanov, A., Skeie, R. B., Smith, C. J., Smith, S. J., Su, X., Tsutsui, J., Vega-Westhoff, B., and Woodard, D. L.: Reduced Complexity Model Intercomparison Project Phase 2: Synthesizing Earth System Knowledge for Probabilistic Climate Projections, Earth's Future, 9, https://doi.org/10.1029/2020EF001900, 2021. a, b, c, d
Nicholls, Z., Meinshausen, M., Lewis, J., Smith, C. J., Forster, P. M., Fuglestvedt, J. S., Rogelj, J., Kikstra, J. S., Riahi, K., and Byers, E.: Changes in IPCC Scenario Assessment Emulators Between SR1.5 and AR6 Unraveled, Geophys. Res. Lett., 49, e2022GL099788, https://doi.org/10.1029/2022GL099788, 2022. a
Nicholls, Z., Meinshausen, M., Pflüger, M., and Lewis, J.: CMIP GHG Forcing, Zenodo [data set], https://doi.org/10.5281/zenodo.14892947, 2025. a
Nicholls, Z. R. J., Meinshausen, M., Lewis, J., Gieseke, R., Dommenget, D., Dorheim, K., Fan, C.-S., Fuglestvedt, J. S., Gasser, T., Golüke, U., Goodwin, P., Hartin, C., Hope, A. P., Kriegler, E., Leach, N. J., Marchegiani, D., McBride, L. A., Quilcaille, Y., Rogelj, J., Salawitch, R. J., Samset, B. H., Sandstad, M., Shiklomanov, A. N., Skeie, R. B., Smith, C. J., Smith, S., Tanaka, K., Tsutsui, J., and Xie, Z.: Reduced Complexity Model Intercomparison Project Phase 1: introduction and evaluation of global-mean temperature response, Geoscientific Model Development, 13, 5175–5190, https://doi.org/10.5194/gmd-13-5175-2020, 2020. a, b, c
O'Neill, B. C., Tebaldi, C., van Vuuren, D. P., Eyring, V., Friedlingstein, P., Hurtt, G., Knutti, R., Kriegler, E., Lamarque, J.-F., Lowe, J., Meehl, G. A., Moss, R., Riahi, K., and Sanderson, B. M.: The Scenario Model Intercomparison Project (ScenarioMIP) for CMIP6, Geosci. Model Dev., 9, 3461–3482, https://doi.org/10.5194/gmd-9-3461-2016, 2016. a
O'Rourke, E., Dingley, B., Durack, P., Naik, V., Aubry, T., Chini, L., Fasullo, J., Fiedler, S., Funke, B., Graven, H., Hegglin, M., Lutron, T., MacIntosh, C., Nicholls, Z., Plummer, D., Riahi, K., Smith, S., van Marle, M., and Ziehn, T.: CMIP drop in session reports: Forcings, Tech. rep., Zenodo [data set], https://doi.org/10.5281/zenodo.8046147, 2023. a
Rennert, K., Errickson, F., Prest, B. C., Rennels, L., Newell, R. G., Pizer, W., Kingdon, C., Wingenroth, J., Cooke, R., Parthum, B., Smith, D., Cromar, K., Diaz, D., Moore, F. C., Müller, U. K., Plevin, R. J., Raftery, A. E., Ševčíková, H., Sheets, H., Stock, J. H., Tan, T., Watson, M., Wong, T. E., and Anthoff, D.: Comprehensive evidence implies a higher social cost of CO2, Nature, 610, 687–692, https://doi.org/10.1038/s41586-022-05224-9, 2022. a
Romero-Prieto, A., Mathison, C., and Smith, C.: Review of climate simulation by Simple Climate Models, Geosci. Model Dev., 19, 115–165, https://doi.org/10.5194/gmd-19-115-2026, 2026a. a, b
Romero Prieto, A., Nicholls, Z., and Lewis, J.: Pyrcmip archive, Zenodo [code], https://doi.org/10.5281/zenodo.20308242, 2026b. a, b
Romero Prieto, A., Sandstad, M., Sanderson, B., Nicholls, Z., Steinert, N. J., Gasser, T., Mathison, C., Kikstra, J., Aubry, T., and Smith, C.: RCMIP phase 3 protocol, Zenodo [data set], https://doi.org/10.5281/zenodo.20720521, 2026b (data also available at: https://gitlab.com/rcmip/pyrcmip/-/blob/master/tests/data/rcmip3_model_output_test.nc, last access: 23 July 2026). a, b
Sanderson, B. M., Booth, B. B. B., Dunne, J., Eyring, V., Fisher, R. A., Friedlingstein, P., Gidden, M. J., Hajima, T., Jones, C. D., Jones, C. G., King, A., Koven, C. D., Lawrence, D. M., Lowe, J., Mengis, N., Peters, G. P., Rogelj, J., Smith, C., Snyder, A. C., Simpson, I. R., Swann, A. L. S., Tebaldi, C., Ilyina, T., Schleussner, C.-F., Séférian, R., Samset, B. H., van Vuuren, D., and Zaehle, S.: The need for carbon-emissions-driven climate projections in CMIP7, Geosci. Model Dev., 17, 8141–8172, https://doi.org/10.5194/gmd-17-8141-2024, 2024. a
Sanderson, B. M., Brovkin, V., Fisher, R. A., Hohn, D., Ilyina, T., Jones, C. D., Koenigk, T., Koven, C., Li, H., Lawrence, D. M., Lawrence, P., Liddicoat, S., MacDougall, A. H., Mengis, N., Nicholls, Z., O'Rourke, E., Romanou, A., Sandstad, M., Schwinger, J., Séférian, R., Sentman, L. T., Simpson, I. R., Smith, C., Steinert, N. J., Swann, A. L. S., Tjiputra, J., and Ziehn, T.: flat10MIP: an emissions-driven experiment to diagnose the climate response to positive, zero and negative CO2 emissions, Geosci. Model Dev., 18, 5699–5724, https://doi.org/10.5194/gmd-18-5699-2025, 2025. a, b, c
Smith, C., Nicholls, Z., Armour, K., Collins, W., Forster, P., Meinshausen, M., Palmer, M., and Watanabe, M.: The Earth's Energy Budget, Climate Feedbacks, and Climate Sensitivity Supplementary Material, in: Climate Change 2021: The Physical Science Basis, Contribution of Working Group I to the Sixth Assessment Report of the Intergovernmental Panel on Climate Change, edited by: Masson-Delmotte, V., Zhai, P., Pirani, A., Connors, S., Péan, C., Berger, S., Caud, N., Chen, Y., Goldfarb, L., Gomis, M., Huang, M., Leitzell, K., Lonnoy, E., Matthews, J., Maycock, T., Waterfield, T., Yelekçi, O., Yu, R., and Zhou, B., Cambridge University Press, ISBN 978-1-00-915789-6, https://doi.org/10.1017/9781009157896, 2021. a
Smith, C., Cummins, D. P., Fredriksen, H.-B., Nicholls, Z., Meinshausen, M., Allen, M., Jenkins, S., Leach, N., Mathison, C., and Partanen, A.-I.: fair-calibrate v1.4.1: calibration, constraining, and validation of the FaIR simple climate model for reliable future climate projections, Geosci. Model Dev., 17, 8569–8592, https://doi.org/10.5194/gmd-17-8569-2024, 2024. a
Stehfest, E., van Vuuren, D. P., Kram, T., Bouwman, L., Alkemade, R., Bakkenes, M., Biemans, H., Bouwman, A. F., den Elzen, M. G. J., Janse, J. H., Lucas, P. L., van Minnen, J. G., Müller, C., and Prins, A. G.: Integrated Assessment of Global Environmental Change with IMAGE 3.0: Model Description and Policy Applications, PBL Netherlands Environmental Assessment Agency, the Hague, the Netherlands, ISBN 978-94-91506-71-0, 2014. a
van Marle, M. and van der Werf, G.: BB4CMIP7, ESGF, https://doi.org/10.25981/ESGF.input4MIPs.CMIP7/2524040, 2025. a
Van Vuuren, D. P., O'Neill, B. C., Tebaldi, C., Sanderson, B. M., Chini, L. P., Friedlingstein, P., Hasegawa, T., Riahi, K., Govindasamy, B., Bauer, N., Eyring, V., Fall, C. M. N., Frieler, K., Gidden, M. J., Gohar, L. K., Högner, A., Jones, A. D., Kikstra, J., King, A., Knutti, R., Kriegler, E., Lawrence, P., Lennard, C., Lowe, J., Mathison, C., Mehmood, S., Nicholls, Z., Prado, L. F., Zhang, Q., Rose, S. K., Ruane, A. C., Sandstad, M., Schleussner, C.-F., Seferian, R., Sillmann, J., Smith, C., Sörensson, A. A., Panickal, S., Tachiiri, K., Vaughan, N., Vishwanathan, S. S., Yokohata, T., Zecchetto, M., and Ziehn, T.: The Scenario Model Intercomparison Project for CMIP7 (ScenarioMIP-CMIP7), Geosci. Model Dev., 19, 2627–2656, https://doi.org/10.5194/gmd-19-2627-2026, 2026. a
Velders, G. J. M., Daniel, J. S., Montzka, S. A., Vimont, I., Rigby, M., Krummel, P. B., Muhle, J., O'Doherty, S., Prinn, R. G., Weiss, R. F., and Young, D.: Projections of hydrofluorocarbon (HFC) emissions and the resulting global warming based on recent trends in observed abundances and current policies, Atmos. Chem. Phys., 22, 6087–6101, https://doi.org/10.5194/acp-22-6087-2022, 2022. a
Verkerk, M., Aubry, T. J., Smith, C., Hopcroft, P. O., Sigl, M., Tierney, J. E., Anchukaitis, K., Osman, M., Schmidt, A., and Toohey, M.: Using reduced-complexity volcanic aerosol and climate models to produce large ensemble simulations of Holocene temperature, Clim. Past, 21, 1755–1778, https://doi.org/10.5194/cp-21-1755-2025, 2025. a
Von Schuckmann, K., Minière, A., Gues, F., Cuesta-Valero, F. J., Kirchengast, G., Adusumilli, S., Straneo, F., Ablain, M., Allan, R. P., Barker, P. M., Beltrami, H., Blazquez, A., Boyer, T., Cheng, L., Church, J., Desbruyeres, D., Dolman, H., Domingues, C. M., García-García, A., Giglio, D., Gilson, J. E., Gorfer, M., Haimberger, L., Hakuba, M. Z., Hendricks, S., Hosoda, S., Johnson, G. C., Killick, R., King, B., Kolodziejczyk, N., Korosov, A., Krinner, G., Kuusela, M., Landerer, F. W., Langer, M., Lavergne, T., Lawrence, I., Li, Y., Lyman, J., Marti, F., Marzeion, B., Mayer, M., MacDougall, A. H., McDougall, T., Monselesan, D. P., Nitzbon, J., Otosaka, I., Peng, J., Purkey, S., Roemmich, D., Sato, K., Sato, K., Savita, A., Schweiger, A., Shepherd, A., Seneviratne, S. I., Simons, L., Slater, D. A., Slater, T., Steiner, A. K., Suga, T., Szekely, T., Thiery, W., Timmermans, M.-L., Vanderkelen, I., Wjiffels, S. E., Wu, T., and Zemp, M.: Heat stored in the Earth system 1960–2020: where does the energy go?, Earth Syst. Sci. Data, 15, 1675–1709, https://doi.org/10.5194/essd-15-1675-2023, 2023. a, b
WMO – World Meteorological Organization: Scientific Assessment of Ozone Depletion: 2022, Tech. Rep. 278, WMO, Geneva, https://csl.noaa.gov/assessments/ozone/2022/ (last access: 27 July 2026), 2022. a
Zehrung, A., King, A. D., Nicholls, Z., Zelinka, M. D., and Meinshausen, M.: Standardising the “Gregory method” for calculating equilibrium climate sensitivity, Geosci. Model Dev., 18, 9433–9450, https://doi.org/10.5194/gmd-18-9433-2025, 2025. a