
the Creative Commons Attribution 4.0 License.
the Creative Commons Attribution 4.0 License.
 | 17 Jul 2026
Machine learning significantly improves the simulation of hourly-to-yearly scale cloud nuclei concentration and radiative forcing in polluted atmosphere
Jingye Ren
Songjian Zou
Honghao Xu
Guiquan Liu
Zhe Wang
Anran Zhang
Chuanfeng Zhao
Dongjie Shang
Lizi Tang
Ru-Jin Huang
The accurate prediction of cloud condensation nuclei (CCN) number concentration (NCCN) on a large spatiotemporal scale is challenging but critical to evaluate the aerosol cloud interaction effect. Combining multi-source dataset and the NCCN simulated by the Weather Research and Forecasting coupled with Chemistry (WRF-Chem) model, we have developed a Random Forest Regression method (RFRM) model which achieves well prediction of hourly-to-yearly scale NCCN at typical supersaturations in polluted North China Plain (NCP). We show that the prediction bias of NCCN compared to observations is reduced from −59 % with the WRF-Chem model to approximately −31 % with the RFRM model (the prediction precision is improved by 1.6 times accordingly) during the campaigns. The greatest improvement is seen in both very polluted and clean cases. The RFRM model captures well the spatial variation and better describes long-term trends of NCCN. More importantly, the prediction reveals a significant long-term decreasing trend of NCCN in NCP due to a rapid reduction in aerosol concentrations from 2014 to 2018, during which a series of strict emission reduction measures were implemented by the Chinese government. This reflects the climate benefit of pollution control. Our study further illustrates that the RFRM model reduces the uncertainty in simulating cloud radiative forcing from an overestimation of 1.89 ± 0.78 to 0.81 ± 0.63 W m−2, illustrating the high sensitivity of climate forcing to changes in NCCN. This work offers a new modeling framework that guides the way to simulate CCN in other regions around the world and has the potential to effectively filling the observation gap of CCN concentrations.
- Article
(6806 KB) - Full-text XML
-
Supplement
(1938 KB) - BibTeX
- EndNote


Aerosol indirect radiative effects caused by aerosol-cloud interactions (ACI) are the largest source of uncertainty when assessing climate change (IPCC, 2021). A major issue is the lack of an accurate characterization of cloud condensation nuclei (CCN, or cloud nuclei) number concentrations (NCCN) in global climate models (Sotiropoulou et al., 2007; Fanourgakis et al., 2019). This is largely due to the nonlinear interactions between the aerosol physical and chemical properties and CCN, making the quantification of the NCCN remain highly uncertain. Current models tend to underestimate CCN number concentrations by 20 %–40 % on average, based on comparisons between results from 14 models and observations at sites distributed globally (Fanourgakis et al., 2019). Biases were greater in the Northern Hemisphere due to intensive human activities (Sotiropoulou et al., 2007). It has been proposed that ∼ 10 %–30 % changes in cloud droplet concentrations might be associated with the uncertainties in cloud radiative forcing by ∼ 0.1–2 W m−2 (Charlson et al., 1987; Sotiropoulou et al., 2007; Yu et al., 2022). Towards improving estimates of the ACI effect in modeling, it is critical to obtain accurate spatiotemporal distributions of CCN.
Predicting NCCN remains challenging because aerosol CCN activity varies greatly in time and space and involves microphysical and chemical processes. Previous studies have underscored that the main uncertainties in simulating NCCN at regional and global scales are the simplified representations of particle size distribution (Menon and Rotstayn, 2006), as well as the lack of detailed treatment of the microphysical and chemical processes in current models (Sha et al., 2019; Yu et al., 2020). Therefore, a considerable number of CCN closure studies have been carried out to predict NCCN in different environments (Moore et al., 2012; Zhang et al., 2014, 2016, 2017, 2019; Xu et al., 2021; Ren et al., 2018, 2023). Although extensive CCN observations and closure studies might help to reconcile this uncertainty, field measurements are relatively sparse and have only been collected during a few campaigns at a few sites (Schmale et al., 2018; Rose et al., 2021) due to the limitations of techniques and cost. Closure studies, however, have mostly focused on investigating the relative importance of the aerosol physical and chemical properties to CCN prediction and have not yet provided a CCN parameterization scheme that is applicable to different regions over the globe. Some studies have attempted to develop a correlation between aerosol optical properties and CCN number concentrations (Rosenfeld et al., 2016). Compared with the measurement of CCN at ground sites, satellite retrieval methods offer global coverage with high spatial and temporal resolutions (Rosenfeld et al., 2016; Liu et al., 2020). However, they are limited to clear-sky conditions. Due to the aerosol swelling effect (Liu and Li, 2018), there are typically large deviations of −30 % to +90 % in the estimation accuracy of NCCN in different environments (Shen et al., 2019).
In recent years, machine learning (ML) has been used for the inversion of atmospheric environmental parameters such as tropospheric ozone and particulate matter with a diameter of 2.5 µm or smaller (PM2.5) (Grange et al., 2018; Geng et al., 2021; Wei et al., 2023). To our knowledge, ML-based prediction of CCN properties is few and far between, with studies only focused on analyzing the importance of different variables to estimating CCN spectra at a single field site (Liang et al., 2022) or were conducted in relative clean regions (Nair and Yu, 2020; Nair et al., 2021). It would be a step forward to use an ML-based method to predict NCCN in polluted areas because it would help to verify the applicability of the method in different regions, but most importantly, it would improve model simulations of the ACI effect in polluted regions where errors in predicting NCCN are greater than in clean regions.
In this study, we have developed a ML-based model for predicting NCCN on hourly-to-yearly scale in the heavily polluted North China Plain (NCP) by using a multi-source dataset of atmospheric variables and CCN concentration outputs from the Weather Research and Forecasting coupled with online chemistry (WRF-Chem) model. We have presented and analyzed the relative importance of the different parameters to CCN prediction. Moreover, we have verified the performance of the RFRM model in predicting the NCCN over different temporal and spatial scales in the NCP. Finally, by incorporating the NCCN prediction biases into the evaluation of cloud parameters and radiative forcing, we investigate the sensitivity of aerosols indirect climate forcing to CCN concentrations changes.
2.1 Study area
In this work, we select the North China Plain (NCP) (32–40° N and 114–121° E) as the study area. Being one of the most polluted areas in China, the aerosol particles in NCP are with more complex composition and mixing state, which leads to great challenge in accurate prediction of cloud concentration nuclei (CCN) concentrations. In recent years, emissions of gas pollutants and fine particles have shown a significant downward trend year by year (Wei et al., 2023) due to the implementation of the vigorous emission reduction in China (Zheng et al., 2018). This also makes changes in aerosols CCN activity in the study area from the point of view in assessment of the climate effect of aerosols.
2.2 Model construction and validation
Here we develop the ML-based NCCN prediction model by employing the Random Forest Regression method (RFRM) that has been demonstrated and can solve multivariate and nonlinear regression problems (Nair and Yu, 2020; Liang et al., 2022). The diagram of the model construction and the NCCN prediction is shown in Fig. 1. The main dataset that are used to construct the ML-based NCCN prediction model were from six field campaigns at three sites in the NCP (more details see Sect. 2.3.1). The observed CCN number concentration (at supersaturations of 0.2 % and 0.4 %) is as targeted parameter, and the simultaneously measured atmospheric gaseous precursors, fine particles chemical compositions, and meteorological parameters are as model input parameters. Considering the motivation and main goal of this study is to achieve the prediction of CCN number concentration on a relatively large spatiotemporal scale (e.g. regional scale), especially in polluted areas. Therefore, to better constrain the performance and accuracy of the model in regional-scale predictions, we also incorporated the NCCN simulated by WRF-Chem (more details see Sect. 2.3.2) as an input parameter for model training when constructing the model.
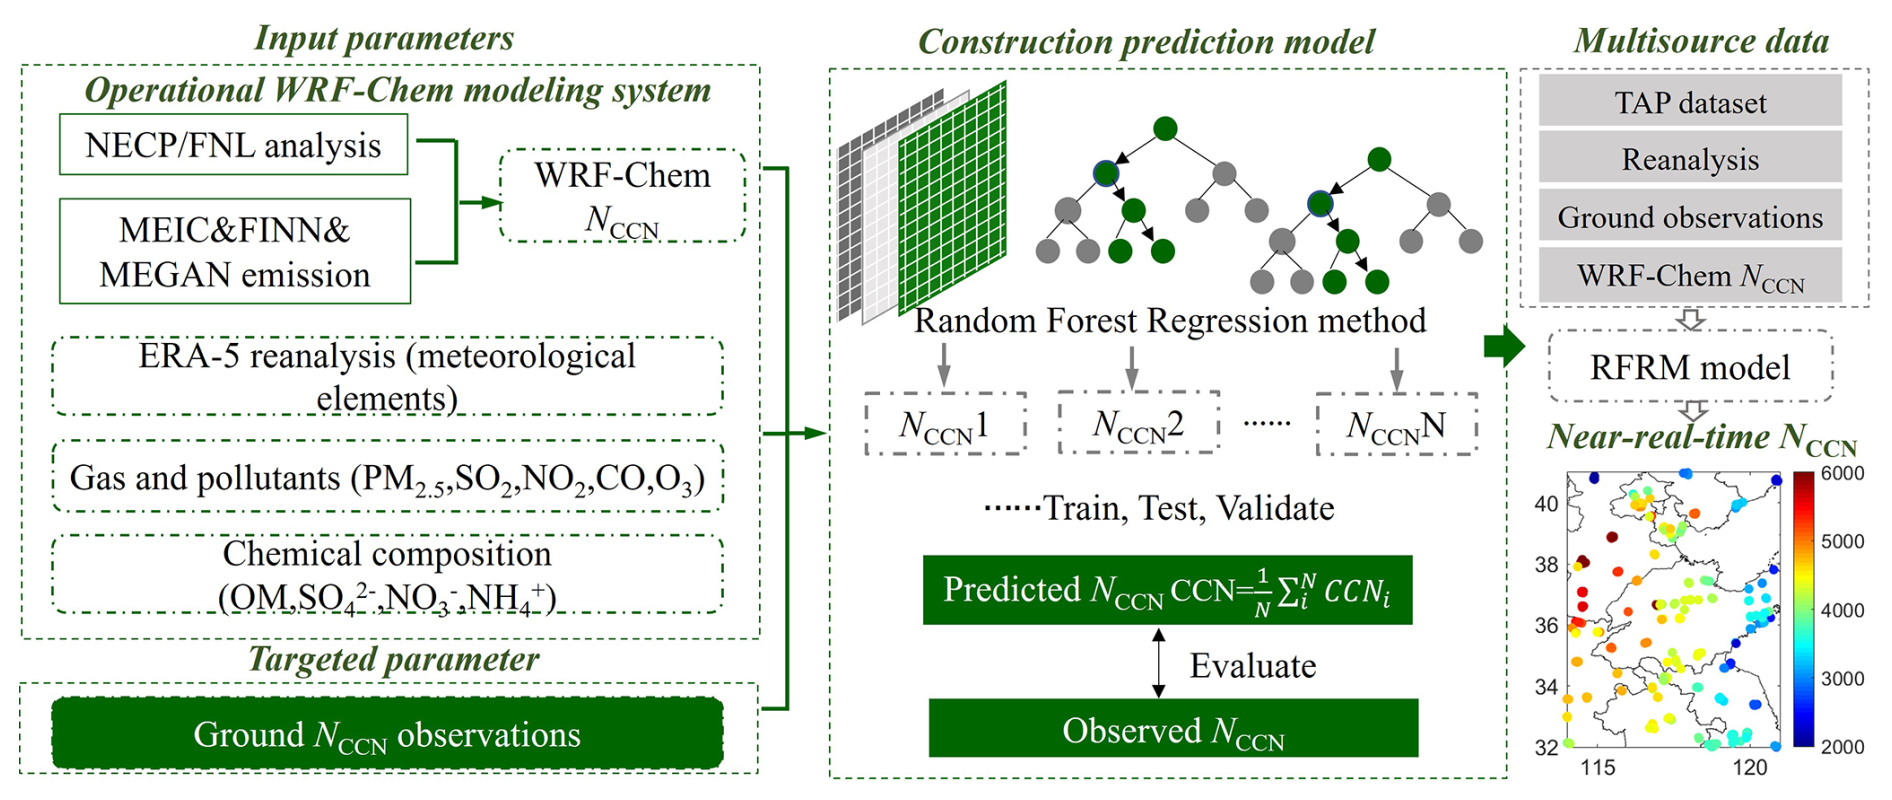
Figure 1Methodological framework of CCN number concentration prediction.
When constructing the model, the NCCN simulated by WRF-Chem were processed to match the locations of each observation site and their corresponding measurement periods. The data were split into 7:3 ratio for model training and testing respectively. In order to assure a stronger generalization ability of the NCCN prediction model, the 10-fold cross-validation is adopted (Wei et al., 2023). The optimization parameters of RFRM model were examined by varying hyperparameters. In addition, cross-validation (CV) is applied to select the hyperparameters during the data preprocessing (Yang et al., 2022).
Here the quality metrics for model performance are based on the correlation coefficient (R2), root mean square error (RMSE), the slope of the RFRM predicted with the observed CCN concentrations and the normalized mean bias (NMB). It showed that the estimated NCCN are highly correlated with the observed values for the testing dataset, with the correlation R2 of ∼ 0.86–0.95 and slopes of 0.80–0.88 at S= 0.2 % and S= 0.4 % (Fig. 2). This suggests that our model works well in estimating NCCN with a high aerosol loading environment.
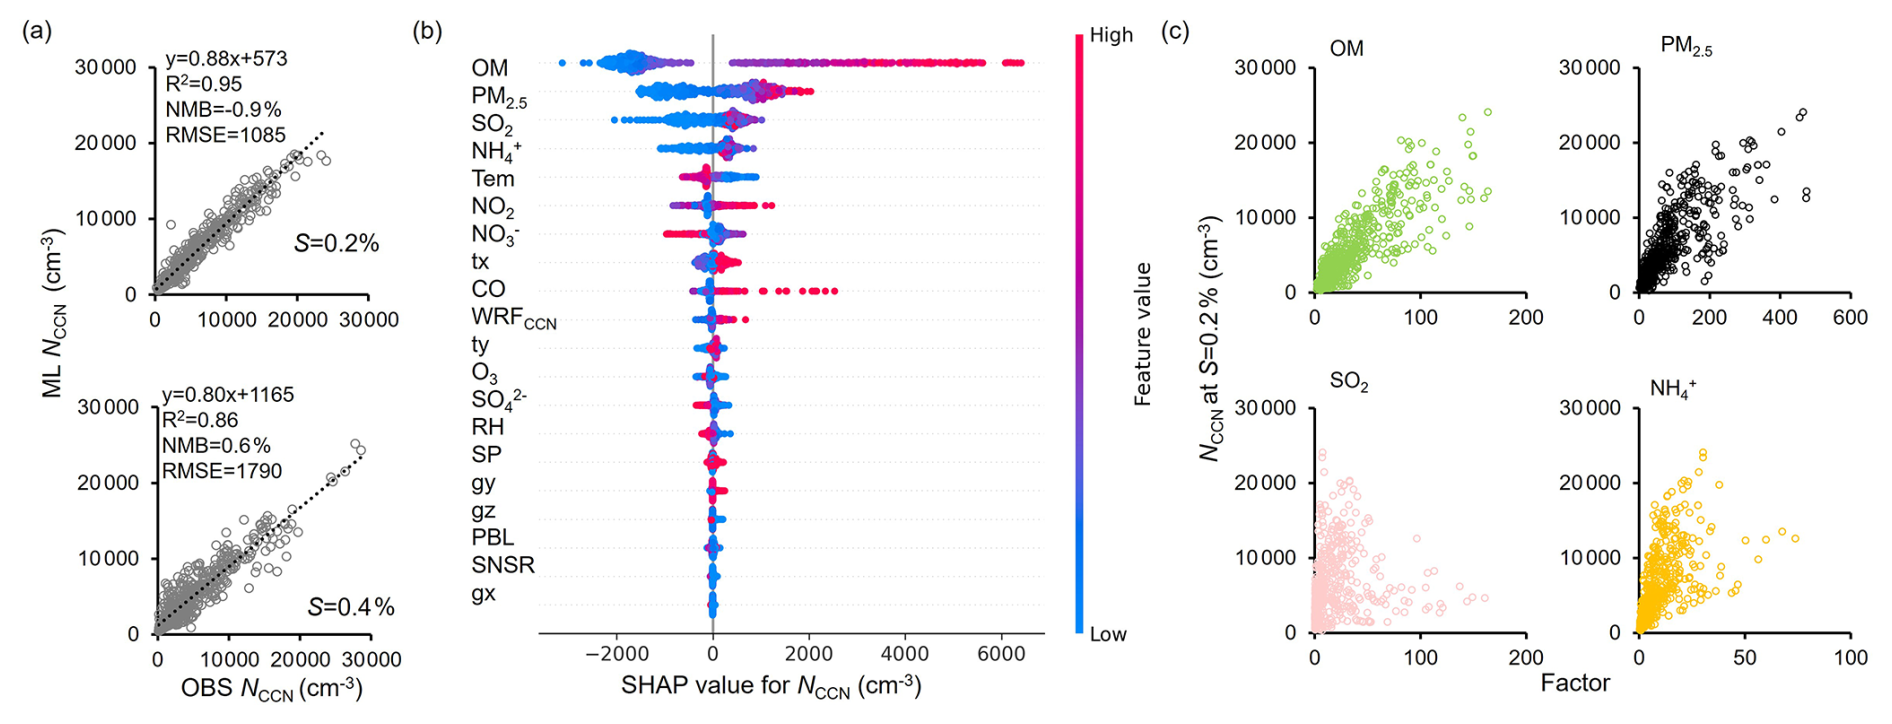
Figure 2Comparison of RFRM model retrieval and observed NCCN at S= 0.2 % and 0.4 % for the testing dataset (a), The SHAP value of the input parameters to the prediction of NCCN (b), Scatter plots of the input parameters (OM, PM2.5, SO2, NH) with CCN number concentration at S= 0.2 % (c).
Given that the primary goal of model development is to more accurately predict the relatively large spatial and temporal CCN concentrations, finally, the RFRM model was employed by integrating with multisource-fusion datasets (more details see Sect. 2.3.3) to predict regional and yearly scale CCN concentrations. Table S1 in the Supplement also provides more details about the multisource-fusion datasets. According to the results of the RFRM model and SHAP (SHapley Additive exPlanations) analysis (Fig. 2), fine particle chemical components such as organic matter (OM), ammonium ions (NH), and nitrate ions (NO) are the top-ranked factors with significant impacts on the prediction results. Particularly, OM is the most important factor among all influencing factors for the predictions. Therefore, prior to conducting predictions based on the multi-source dataset, we compared and validated the reliability of the Tracking Air Pollution in China (TAP) multi-source dataset against the available observational data (Fig. S1). Compared with the observations at the BJ site, mass concentrations for the OM and sulfate from TAP dataset were largely underestimated by approximately 50 % (Fig. S1). Therefore, a twofold correction factor was applied to these components when estimating the regional scale and interannual CCN concentrations in NCP. Cartesian coordinates were also added as input due to the spatiotemporal nature of the input data (Yang et al., 2022).
2.3 Data and other details in the model construction
2.3.1 Gound-based measurements and datasets
Ground measurements of atmospheric gaseous precursors, fine particles chemical compositions, and CCN number concentration (at supersaturations of 0.2 % and 0.4 %) were collected during six field campaigns at three sites in the NCP, used to construct the ML-based NCCN prediction model. The six campaigns were conducted as follows: at the Beijing (BJ) site from 8–30 November 2014, 20 August to 6 October 2015, 16 November to 20 December 2016, and 28 May to 27 June 2017; at the Xingtai (XT) site from 17 May to 14 June 2016; and at the Gucheng (GC) site from 16 November to 15 December 2018. Here it should be noted that this study additionally selected six independent cases to assess the performance of the developed ML-based model in predicting NCCN (Fig. S2). They are accordingly named BJ2014_WIN, BJ2015_AUT, BJ2016_WIN, BJ2017_SUM, XT2016_SPR, and GC2018_WIN (Fig. 3a). These cases were excluded from both the training and testing datasets described in Sect. 2.2.
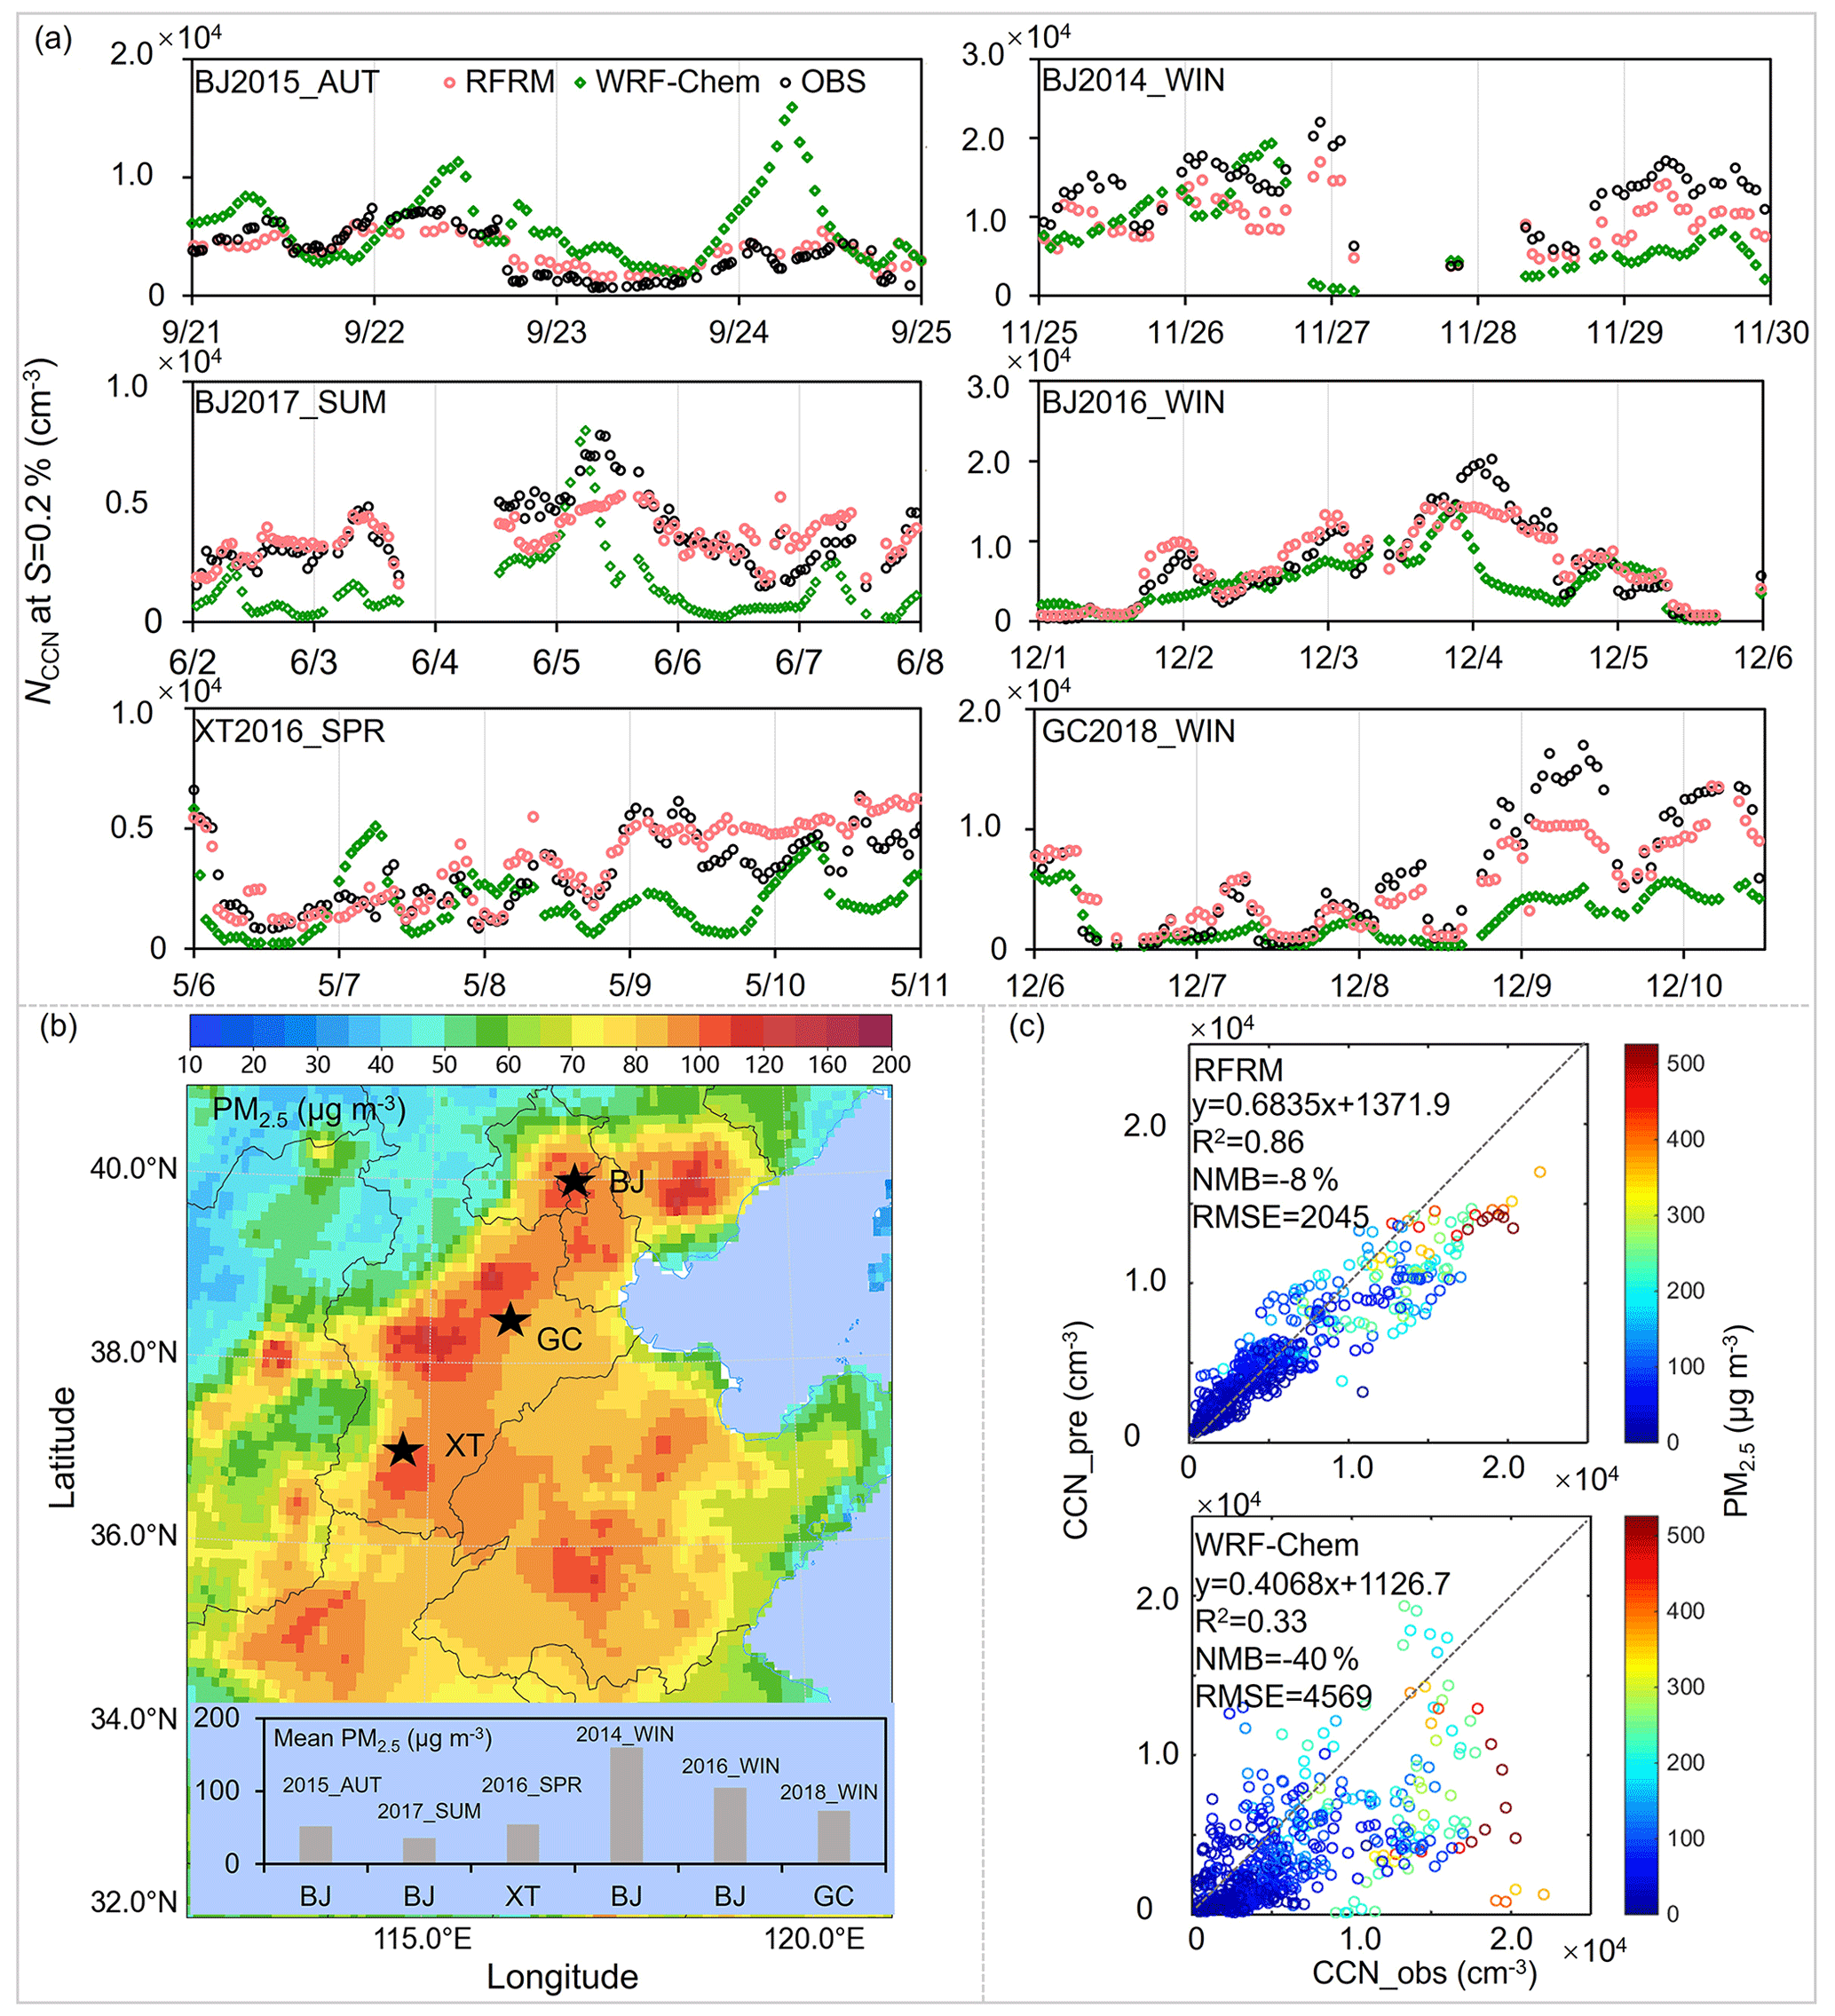
Figure 3Performance of the RFRM model in predicting NCCN at field sites in NCP. (a) Time series of the observed and predicted NCCN at S= 0.2 % for the six periods (BJ2015_AUT, BJ2017_SUM, XT2016_SPR, BJ2014_WIN, BJ2016_WIN, GC2018_WIN) in the North China Plain for the validation set; (b) Map for average mass concentration of PM2.5 of 2014 from TAP dataset in NCP (http://tapdata.org.cn/, last access: 2 July 2024) and field observed average mass concentration of PM2.5 during the six field campaigns (see embedded histogram); (c) Scatter plots of the observed NCCN at S= 0.2 % with the RFRM model predicted (top) and WRF-Chem simulated (bottom) respectively.
The BJ site (Longitude: 116.37° E; Latitude: 39.97° N) is located at the meteorological tower station of the Institute of Atmospheric Physics, Chinese Academy of Sciences. It is representative of the general emission conditions in urban areas of the northern NCP. The primary pollution sources here are surrounding traffic and residential emissions. The XT site (Longitude: 114.37° E; Latitude: 37.18° N) is situated at a national weather station. It is primarily influenced by emissions from surrounding towns and factories (e.g., coal-fired power plants, coking, steel, cement, and chemical industries) and thus reflects polluted suburban conditions in the southern NCP. The GC site (Longitude: 115.74° E; Latitude: 39.15° N) is located at the Integrated Ecological-Meteorological Observation and Experiment Station of the Chinese Academy of Meteorological Sciences. Surrounded mainly by nearby villages, farmland, and transportation networks, this site represents the regional background pollution in the northern NCP.
The CCN number concentrations were measured by using the Droplet Measurement Technologies CCN counter (model CCNC-100, DMT Inc. Lance et al., 2006) at BJ and XT site. The supersaturation (S) levels set for each CCN measurement cycle were 0.1 %, 0.2 %, 0.4 %, and 0.8 %, respectively. Another measurement at GC site was referred from Tao et al. (2021). In this study, the comparisons between the measured and predicted NCCN were mostly based on the value at S= 0.2 % and S= 0.4 %. The observed NCCN varies from a few hundred to tens of thousands at these sites, indicating that the observations can represent various atmospheric conditions, spanning from clean to polluted in the region. More details about the observations could be found in Fan et al. (2020), Ren et al. (2018), and Zhang et al. (2019). In addition, the long-term measurement of particle number size distribution (PNSD) at a field site in Beijing (Fig. S3, Shang et al., 2022) is also used for deriving the long-term trend of yearly averaged NCCN.
2.3.2 NCCN simulated by WRF-Chem model
The WRF-Chem version 4.1.5 is used to simulate NCCN in this study, which nested a domain in 10 km × 10 km covering the entire NCP (Fig. S4) and contained 181 × 170 grids. The simulation in WRF-Chem is conducted from 1 January 2014 to 31 December 2018 with an hourly resolution. In the WRF-Chem modeling system, the sectional Model for Simulating Aerosol Interactions and Chemistry (MOSAIC), the Morrison two-moment scheme (Morrison et al., 2009) and the Carbon Bond Mechanism Z photochemical mechanism (Zaveri and Peters, 1999) are employed. We also compared the simulation using the Regional Acid Deposition Model (Stockwell et al., 1990) and the Lin microphysics scheme (Lin et al., 1983). Considering the calculation efficiency and accuracy with the measurements, the CBMZ-MOSAIC and Morrison 2-monment scheme were finally applied to simulate the long-term CCN concentration. More details about the other parameterizations used for WRF-Chem simulation were given in the Supplement.
2.3.3 Multisource-Fusion datasets
The RFRM model was further employed by integrating with multisource-fusion datasets to estimate regional scale and long-term CCN concentrations (Sect. 3.3 and 3.4). Those dataset include the NCCN simulated by WRF-Chem, the chemical components of PM2.5 (organic, sulfate, nitrate, ammonium) that were taken from the Tsinghua University Tracking Air Pollution in China dataset (Liu et al., 2022), the gas and particulate pollutants (nitrogen dioxide (NO2), sulfur dioxide (SO2), carbon monoxide (CO), ozone (O3) and PM2.5) which were collected from the China National Environmental Monitoring Centre network, meteorological parameters (from the European Centre for Medium-range Weather Forecasts Reanalysis version 5, ERA-5) of temperature (Tem), relative humidity (RH), planetary boundary layer height (BLH), surface pressure (SP) and surface net solar radiation (SNSR).
3.1 The relative importance of the input parameters to the prediction of NCCN
The SHAP algorithm is employed to interpret the outputs of the RFRM model, as illustrated in Fig. 2. Organic matter emerges as the most crucial indicator with the highest SHAP value. The wide range of SHAP values for OM reflects the diversity of its physicochemical properties. Specifically, low-concentration or freshly emitted hydrophobic OM contributes negatively to NCCN (suppressing activation), whereas high-concentration or aged/oxidized OM contributes positively (promoting activation). From an overall perspective, SHAP values increase monotonically with OM concentration, and the absolute values of positive SHAP values exceed those of negative ones, demonstrating a synergistic positive effect of OM concentration on the variation of CCN number concentration. This finding differs from the conventional view that inorganic salts contribute more to CCN due to their strong hygroscopicity (Petters and Kreidenweis, 2007). However, in fact, we also note that under conditions of high OM, the concentrations of CN and CCN indeed show an increasing trend (Fig. S5). In addition, previous studies have shown that in the North China region where the proportion and concentration of OM are both high, organic particles affected by strong anthropogenic emission sources was found exhibit strong hygroscopicity, enabling them to serve as more effective CCN (Liu et al., 2021); in addition, the surface tension lowering effect of OM particles in this region can also enhance particle CCN activity (Fan et al., 2024). Therefore, the SHAP analysis results further confirm the conclusions of previous studies. PM2.5 concentration is the second most important factor, only after OM. It shows that higher PM2.5 mass concentration correspond to positive SHAP contributions, meaning that increase in PM2.5 will increase CCN concentrations. Actually, it has been demonstrated that the strong association of PM2.5 mass concentration with the CCN concentrations in NCP, due to the synchronously growth in particle size and enhanced hygroscopicity (Zhang et al., 2019). The SO2 and NO2 are also among the relatively top-ranked factors, with positive effect on CCN levels according to the SHAP value. This highlights the potential impact of gaseous precursors on CCN activity. Ammonium (NH) also contributes positively to CCN predictions, with relative larger SHAP values, though occasional negative values might suggest context-dependent effects under certain chemical regimes (Dinar et al., 2008). Nitrate (NO) exhibited a moderate positive effect in the model, with relatively concentrated SHAP value distributions indicating its stable contribution to the model output. Temperature demonstrated a bidirectional influence, suggesting nonlinear modulation of CCN activity potentially associated with the temperature dependence of nucleation growth and secondary generation of particles (Song et al., 2022). Specifically, temperature-driven enhancements in emissions exacerbate the formation of secondary organic aerosols, thereby affecting CCN concentrations (Lian et al., 2025). In addition, temperature significantly influences aerosol formation, aging, and transformation processes by regulating photochemical reaction rates, particle aging processes, and gas-particle partitioning, which in turn affect nucleation processes and exert important impacts on CCN concentrations.
In contrast, other meteorological parameters (RH, SP, PBL, SNSR) showed lower SHAP values, implying marginal contribution to the model output during the study period. Overall, the high SHAP values of organic matter (OM), PM2.5, SO2 and NO2 underscore the critical role of chemical constituents and gaseous precursors in CCN predictions, which can be well explained by previous known physical mechanisms of the impact of aerosol particles atmospheric processes on CCN activity.
3.2 Performance of the RFRM model in predicting NCCN at field sites in the NCP
To assess the performance of the RFRM model in predicting NCCN, we compare the predicted NCCN with both the simulations by WRF-Chem and the observations in NCP (Fig. 3). Here, the selected independent cases of the six campaigns (BJ2014_WIN, BJ2015_AUT, BJ2016_WIN, BJ2017_SUM, XT2016_SPR, and GC2018_WIN) used for validating the model performance (Fig. 3a). The observed NCCN varies from a few hundred to tens of thousands at these sites, and the campaign mean mass concentration of PM2.5 ranges from 35.6 to 160 µg m−3 (Fig. 3b), indicating that the observations can represent various atmospheric conditions, spanning from clean to polluted in the region. Figure 3a shows NCCN at a supersaturation of 0.2 % (the typical range of supersaturations in clouds). It shows that, for all the six periods, the time series of NCCN predicted by the RFRM model agrees better with the observed NCCN compared to simulations by the WRF-Chem model. Although both the RFRM model and WRF-Chem exhibit underestimations in observed NCCN, the slope between the predicted and observed NCCN ranged from 0.41 by the WRF-Chem model (with the NMB of −40 %, RMSE of 4569 cm−3) to 0.68 by the RFRM model (the NMB of −8 % and RMSE of 2045 cm−3) (Fig. 3c), corresponding the R2 increased from 0.33 to 0.86. Compared to WRF-Chem simulations, the RFRM model showed the greatest improvement during the winter campaigns with the NMB decreased from −45 % to −14 % (eg., slope increased from 0.39 to 0.67, R2 from 0.32 to 0.83) when PM2.5 concentrations were usually higher. For example, during the GC2018_WIN campaign, the observed NCCN is underestimated as large as 71 % by the WRF-Chem (Fig. S6), while the underestimation of observed values by the RFRM has been significantly improved, with an enhancement of approximately 36 % (Fig. S6). WRF-Chem simulations for warm seasons noticeably improved (the NMB of −29 %), e.g., the uncertainty decreased to 25 % during the BJ2017_SUM campaign (Fig. S6). Overall, the RFRM model still performs better than the WRF-Chem model and is with the NMB of 4 % during summer campaigns (eg., slope of 0.67 and R2 of 0.67). Occasionally, the WRF-Chem model overestimated the NCCN apparently, e.g., the episodes of 24 to 25 September during the BJ2015_AUT campaign, and 7 to 8 May during the XT2017_SPR campaign. In addition, we also evaluated the model performance based on another observation at GC site in January (Zhang et al., 2020) (Fig. S7). Compared to WRF-Chem simulations, the RFRM model could more accurately captures the peak and valley CCN concentrations. The mode showed the greatest improvement and the underestimation is largely improved with the predicted bias of only 4 % in the RFRM model (Fig. S7). And Figure S8 shows comparisons of NCCN at S= 0.4 %. Both exhibit similarly good performance as shown in Fig. 3. Overall, the RFRM model performs well and can accurately capture the observed fluctuations during these episodes. The improvements in RFRM model also demonstrate the effectiveness of the model trained on atmospheric variables to revise the simulation in model.
In our case, the underestimation of NCCN by the WRF-Chem model is likely due to the overestimation of the organics and BC mass fraction induced by WRF-Chem (Fig. S9), along with the underestimation of the hygroscopic parameter of organics, and the simplified prescriptions in particle size distribution (Fanourgakis et al., 2019). In fact, the much lower and fixed hygroscopicity parameter value in WRF-Chem model does not represent the hygroscopicity of organics throughout the study period (Liu et al., 2021). Neglecting to distinguish between POA and SOA information during the training of the RFRM model may cause the overestimation of NCCN when POA dominates. Uncertainties incurred by the RFRM model could also originate from the lack of physical interpretability in these ML-based models (Wei et al., 2023). Additional input parameters that carry rich and more meaningful information (e.g., particle number size distribution, aerosol sources and other secondary processes) are expected to further improve the predictability ofNCCN in future.
3.3 Performance of the RFRM model in predicting hourly-to-yearly-scale NCCN
To further examine the performance of the RFRM model in predicting NCCN at different time scales, we compare the RFRM model-predicted hourly-to-yearly NCCN in Beijing with both WRF-Chem simulations and observed values (Fig. 4). The RFRM model captures well the diurnal cycle (Fig. 4a), while the WRF-Chem model underestimates NCCN, especially at night. Concerning seasonal variations, similarly, the RFRM model performs better with the NMB of ∼ 4 % compared to observations. While the mean bias can increase to be ∼ 28 % by the WRF-Chem (Fig. 4b). Note that, the bias is much greater in the cold seasons than that in the warm seasons for the WRF-Chem. This is probably due to the higher wintertime CN and CCN concentrations which are more difficult for models to capture and simulate (Fanourgakis et al., 2019).
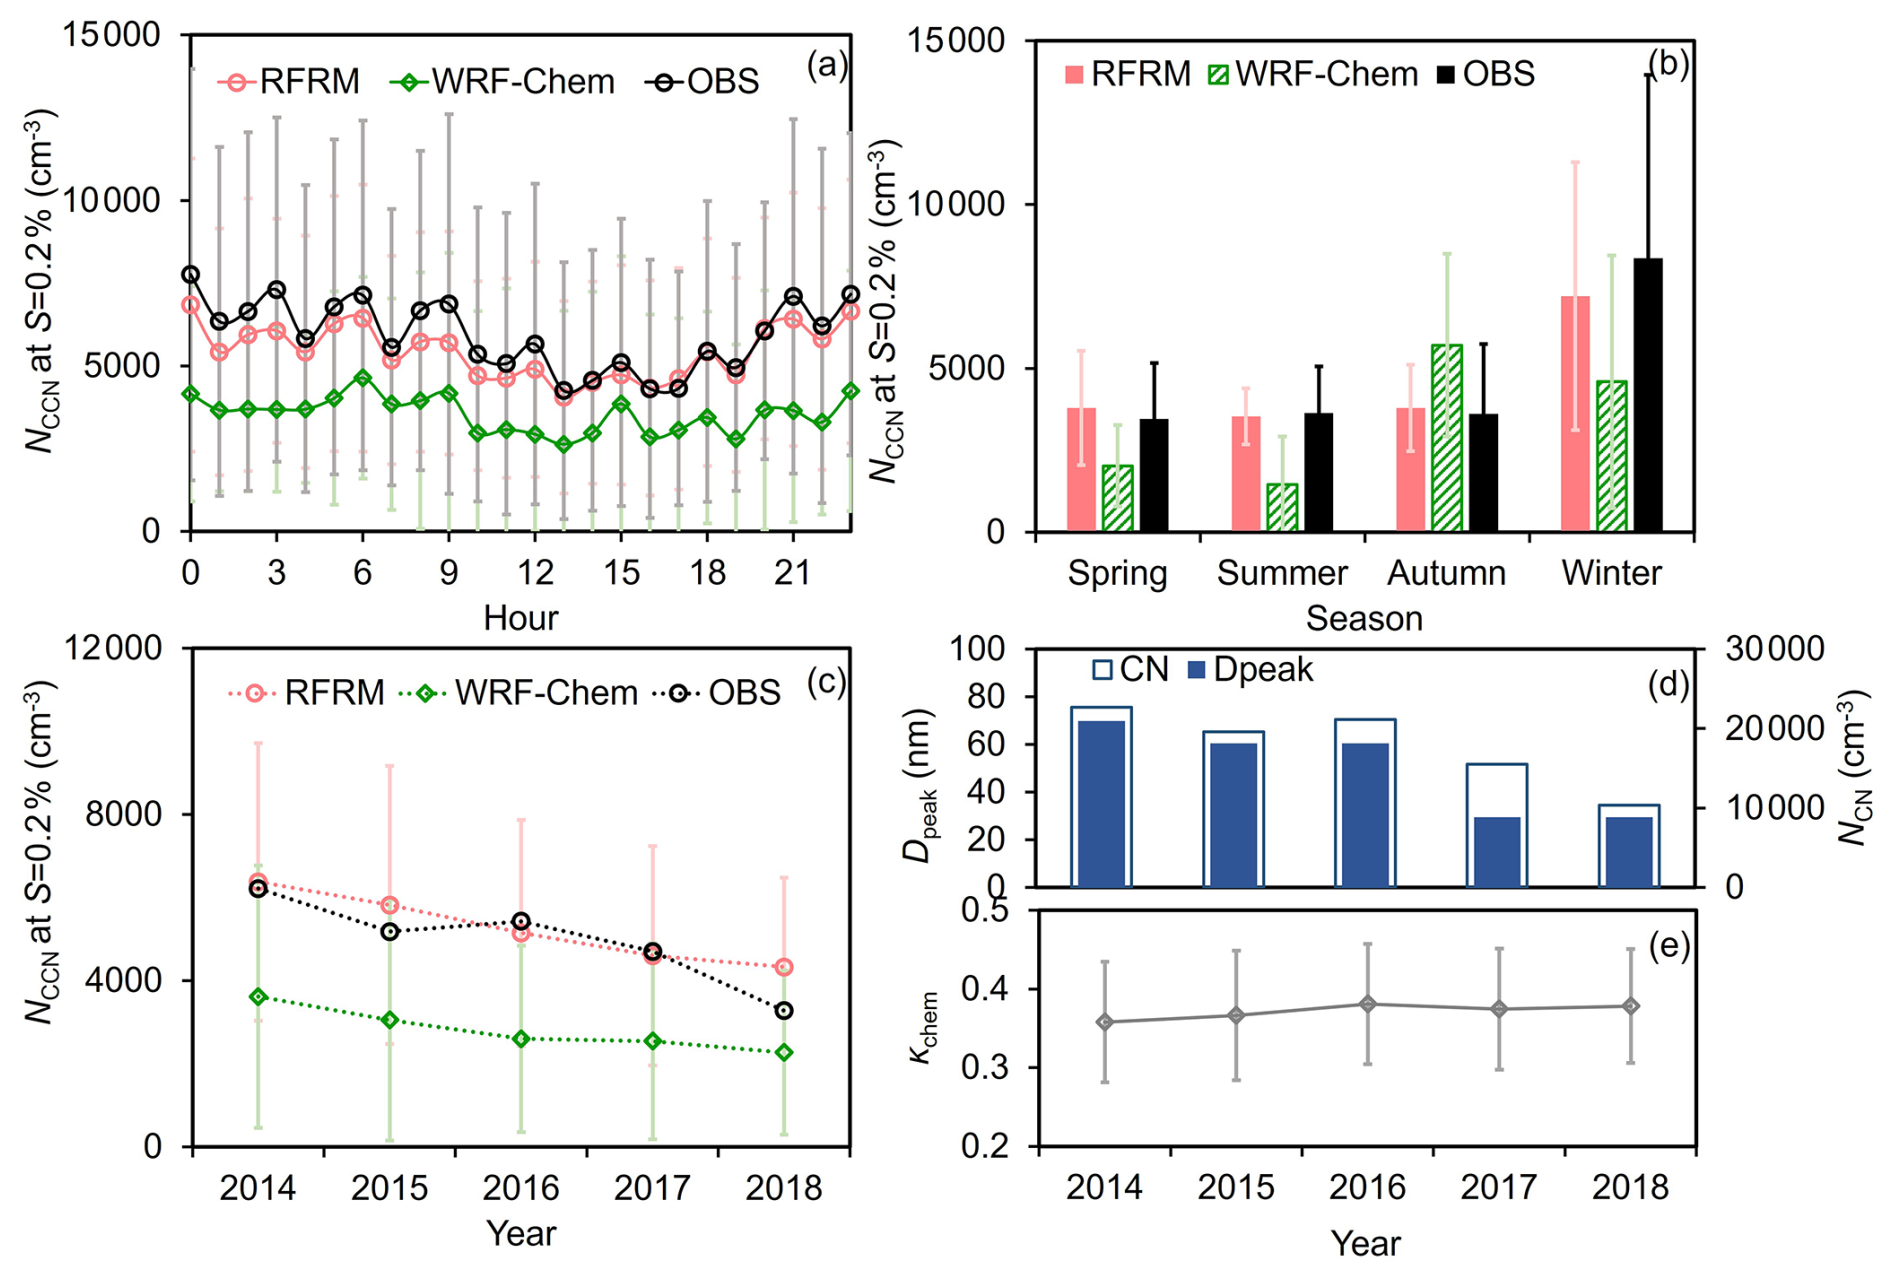
Figure 4Performance of the RFRM model in predicting hourly-to-yearly scale NCCN. (a) Diurnal variations of NCCN at S= 0.2 % derived from the RFRM model, the WRF-Chem, and the observations from the field campaigns; (b) Seasonal variations, here the comparison in spring, summer, autumn and winter were conducted using the campaign averages of XT2016_SPR, BJ2017_SUM, BJ2015_AUT, and BJ2014_WIN & BJ2016_WIN respectively with the RFRM model and WRF-Chem predictions at corresponding periods; (c) Trends of annual mean NCCN from 2014 to 2018; (d) Trends of annual mean particle number concentration and peak diameter; (e) Trends of annual mean of the hygroscopic parameter κchem calculated from TAP dataset in Beijing.
Figure 4c shows the long-term trend of yearly averaged NCCN. Here, the real atmospheric long-term trend of NCCN (denoted as NCCN_Obs) is derived using the long-term measurement of particle number size distribution (PNSD) at a field site in Beijing (Fig. S3) (Fig. 4d, Shang et al., 2022) and the κ calculated from the measured chemical compositions based on the κ-Köhler theory (Petters and Kreidenweis, 2007). The results show that the predicted average annual NCCN at S= 0.2 % based on the RFRM model agrees well with NCCN_Obs in terms of magnitude and long-term trend (Fig. 4c), showing a decreasing trend year by year with the average annual CCN number concentration of about 6216 ± 3624 cm−3 in 2014 and 3278 ± 2306 cm−3 in 2018; however, although the WRF-Chem simulations also show a similar decreasing trend year by year, it significantly underestimates the average annual NCCN of all years (with the NMB of 43 %), resulting in the inter-annual trend lines being parallel but not coincident. The small bias (within ±6 %) between the RFRM model predictions and the observations may be due to the uncertainty from how NCCN_Obs is calculated , i.e., using the Tracking Air Pollution in China (TAP) dataset to calculate κ. A comparison of the values of κ and NCCN between that derived using field observations and the TAP dataset shows little differences (Fig. S10); actually, the long-term change of NCCN is much less sensitive to changes in κ values compared to the PNSD (Fig. S10c). Sensitivity analysis showed that a ±20 % change in κ leads to a change in NCCN of approximately ±8 %. Comparing the κchem derived from the TAP method and the OBS method, the difference is approximately ±6 %, the estimated deviation in the critical activation diameter ranges from −2 % to 3 %. Although absolute concentrations of components in the TAP dataset deviate from observations, their mass fractions are consistent (Fig. S10d), rendering the impact on the calculated κ negligible. In addition, the method to calculate NCCN at S= 0.2 % based on κ-Köhler theory would cause an upper-limit uncertainty of 7 % (Ren et al., 2018).
According to Fig. 4d–e, the long-term decreasing trend of NCCN at S= 0.2 % from 2014 to 2018 is mainly attributed to a significant reduction in aerosol particle number concentrations in the atmosphere. In addition, the peak diameter of the PNSD shows a shift toward the left, decreasing slightly from about 70 nm in 2014 to 30 nm in 2018 due to the enhanced new particle formation events in recent years (Zhu et al., 2021). This would also result in less aerosol particles serving as CCN. Although the κchem has a slight upward trend from 2014 to 2018 (Fig. 4e), yielding decreases in activation diameter and thereby more CCN, the aerosol particle hygroscopicity, however, plays less significant role in regulating the long-term total NCCN variations compared to the changes in particle number size distribution during the period.
3.4 Spatial variations of NCCN derived by the RFRM model
We further examine the spatiotemporal changes of NCCN at S= 0.2 % in the NCP derived by the RFRM model (Fig. 5). Regionally, the NCCN predicted by the RFRM model is also generally higher than that simulated by WRF-Chem at most of the sites. The NCCN derived by the RFRM model and WRF-Chem both decrease from 2014 to 2018 but with different decreasing rates (Fig. 5c–e). On average, NCCN derived by the RFRM model and WRF-Chem decrease from 4415 ± 643 to 2910 ± 789 cm−3 and from 2834 ± 1366 to 2111 ± 546 cm−3 respectively from 2014 to 2018 in the NCP region (Fig. 5c), corresponding to annual decreasing rates of approximately ∼ −250 cm−3 yr−1 for the RFRM model and ∼ −167 cm−3 yr−1 for the WRF-Chem model (Fig. 5d–e). Moreover, NCCN and its changes from 2014 to 2018 predicted by the RFRM model show more significant spatial variations than that simulated by the WRF-Chem model. Differences in RFRM -model-predicted NCCN between 2014 and 2018 (2018 minus 2014) show negative values at ∼ 90 % of the sites, i.e., downward trends in NCCN (Fig. 5(c1)). The sites with apparent NCCN reduction are mainly located in the central and northern of NCP, especially in Beijing-Tianjin-Hebei (BTH) and central Shandong. Sites in southern NCP have slight downward trends in NCCN. The downward trend is consistent with the variations in concentration of gaseous pollutants due to the emission reduction in past years in China (Fig. S11). Interestingly, note a few sites with positive values (upward trends in NCCN) are mainly located along the coast. An increase in the fraction of accumulation-mode particles in coastal areas has been reported contributing more CCN (Zhu et al., 2021). In fact, previous studies have revealed that in Qingdao, enhanced primary combustion emissions from sources other than on-road vehicles (e.g., industrial and residential coal burning) serve as the main driver of increased accumulation-mode number concentrations (Zhu et al., 2021). Furthermore, coastal observations have identified sea salt aerosols as an important source of accumulation-mode particles (Zou et al., 2024). This demonstrates the good performance of the RFRM model in capturing the real-time spatial variations of CCN on a regional scale. While the WRF-Chem model might mask the variations of NCCN among different sites. This will smooth out the true impact of aerosols on weather and climate at regional or local scales, leading to uncertainties in model simulations.
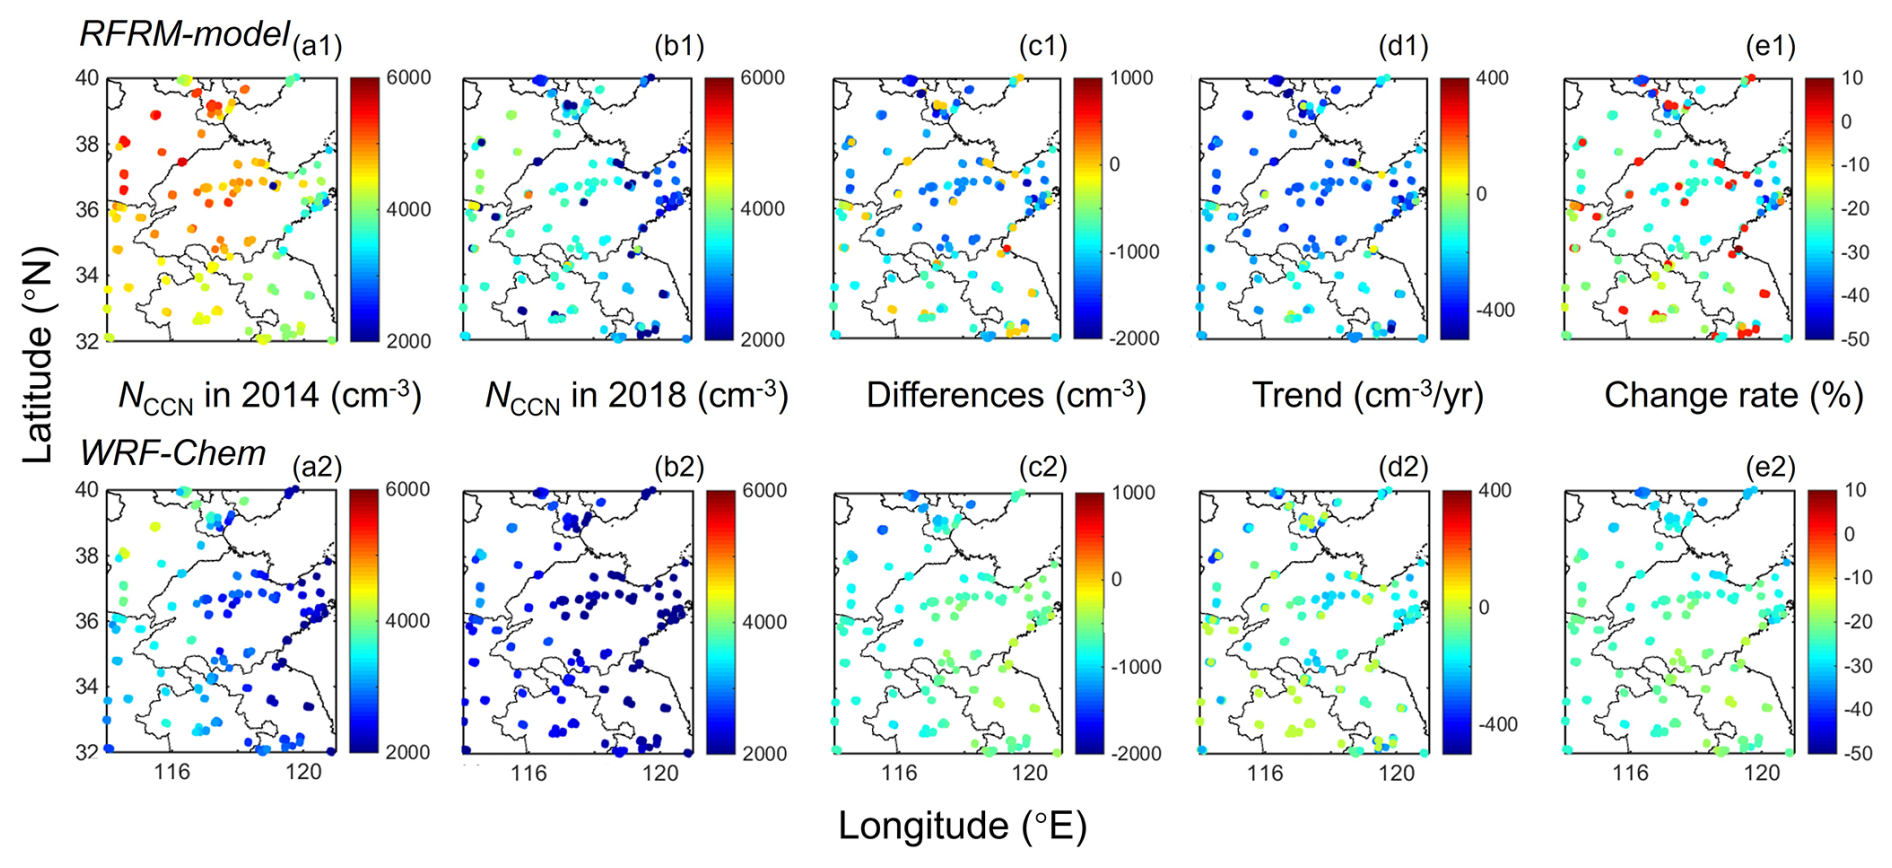
Figure 5Spatial variations of NCCN derived by the RFRM model (top) and WRF-Chem (bottom) at the sites in the studied region. (a1) Average NCCN at S= 0.2 % in 2014 predicted by the RFRM model; (a2) Average NCCN at S= 0.2 % in 2014 by the WRF-Chem; (b1, b2) Same as (a1) and (a2) but in 2018; (c1) Differences in NCCN at S= 0.2 % between the year of 2014 and 2018 predicted by the RFRM model; (c2) Same as (c1) but by the WRF-Chem; (d1) Trends of NCCN at S= 0.2 % from 2014 to 2018 predicted by the RFRM model; (d2) Same as (d1) but by the WRF-Chem; (e1) Change rates of NCCN at S= 0.2 % from 2014 to 2018 predicted by the RFRM model; (e2) Same as (e1) but by the WRF-Chem.
3.5 Sensitivity of the cloud parameters and radiative forcing to CCN prediction biases
To evaluate the effects introduced by NCCN prediction biases to the aerosol indirect effects, we further incorporate the deviations between observed NCCN (denoted as CCNOBS) and NCCN predicted by the RFRM model (denoted as CCNRFRM) and the simulated by the WRF-Chem model (denoted as CCNWRF-Chem) into calculations of the cloud parameters and radiative forcing, as are shown in Fig. 6 (for S= 0.2 %) and Fig. S12 (for S= 0.4 %). Typically, aerosol particles serving as CCN could indirectly affect the global climate by the Twomey (Twomey, 1977) and Albrecht effects (Albrecht, 1989). According to Wang et al. (2019), two parameters of cloud optical thickness (τ) and the absorption coefficient (1−ω0) can be used to estimate the Twomey effects. The process of cloud-to-rain conversion, which can be parameterized by the critical radius (rc) and the cloud-to-rain conversion threshold function (TA), is critical to estimate the Albrecht effect. Therefore, the rc and TA is also calculated here. Indirect (cloud) radiative forcing (Fc) is also evaluated based on the deviations in CCN number concentration under the assumption of a constant liquid water content (Charlson et al., 1992; Wang et al., 2008). Section S1.2 provides details about the methods used to evaluate aerosol indirect effects.
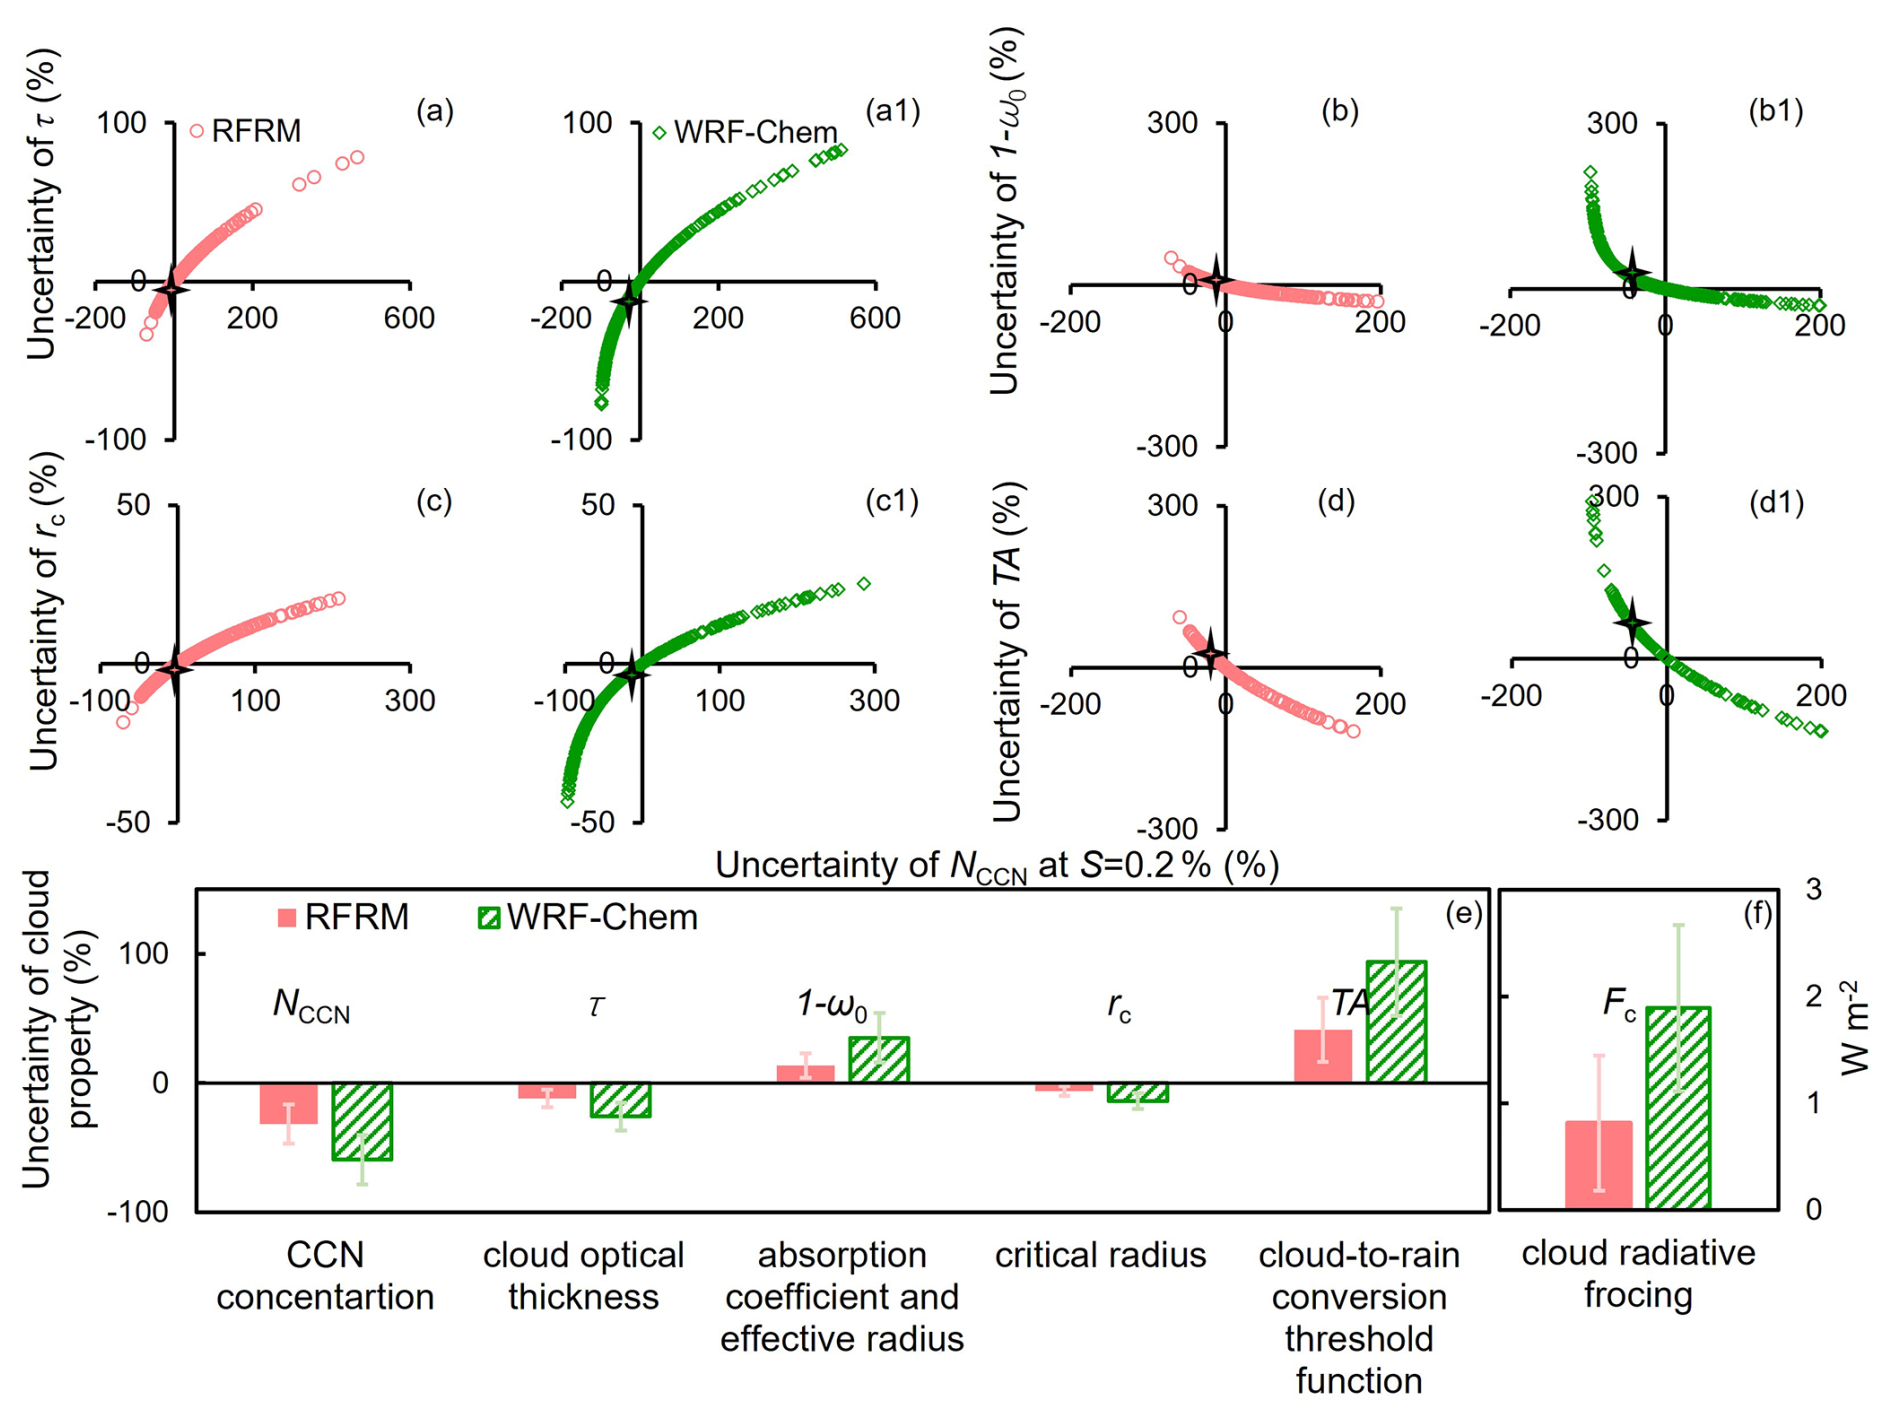
Figure 6Sensitivity of the cloud parameters and radiative forcing to CCN prediction biases. (a) Dependence of the uncertainty of the cloud optical thickness (τ) on the uncertainty of NCCN at S= 0.2 % with the RFRM model; (a1) Same as (a) but by the WRF-Chem; (b) Dependence of the uncertainty of the absorption coefficient (1−ω0) on the uncertainty of NCCN at S= 0.2 % with the RFRM model; (b1) Same as (b) but by the by the WRF-Chem; (c) Dependence of the uncertainty of the critical radius (rc) on the uncertainty of NCCN at S= 0.2 % with the RFRM model; (c1) Same as (c) but by the WRF-Chem; (d) Dependence of the uncertainty of the cloud-to-rain conversion threshold function (TA) on the uncertainty of NCCN at S= 0.2 % with the RFRM model; (d1) Same as (d) but by the WRF-Chem; (e) Mean uncertainty in simulating the cloud properties and (f) radiative forcing (Fc) by the RFRM model and the WRF-Chem; Black star shows the mean value for the observation.
In general, the results show that these cloud properties are more sensitive to the changes in NCCN when the models underestimate the CCN number concentrations (ΔNCCN<0) compared to the cases with an overestimation (Fig. 6a–d). For example, a ∼ 50 % underestimation (overestimation) of NCCN could lead to relative deviations (uncertainties) of −21 % (14 %) for τ, 27 % (−12 %) for (1−ω0), and −11 % (7 %) for rc at S= 0.2 %. Note that, on average, both the RFRM model and WRF-Chem in this study show underestimations in NCCN within the sensitivity zone of the cloud effect (Fig. 6), It is thus expected to cause large uncertainties in evaluating the cloud radiative forcing, a topic worthy of further attention. Given that the uncertainty in NCCN predicted by the WRF-Chem model is much greater than that of RFRM model, the uncertainties and variation ranges of these cloud parameters from WRF-Chem simulations are also greater. Specifically, the uncertainties of CCNRFRM and CCNWRF-Chem lead to the uncertainties of −33 % to +78 % and −77 % to +92 % respectively, for the τ (Fig. 6a and a1), −44 % to +50 % and −48 % to +344 % respectively, for the 1−ω0 (Fig. 6b and b1), −18 % to +34 % and −53 % to +38 % respectively, for the rc (Fig. 6c and c1), and −118 % to +94 % and −258 % to +353 % respectively, for the TA (Fig. 6d and d1).
In addition, the underestimation of CCN would lead to underestimations of cloud optical thickness τ and the critical radius rc of the automatic cloud/rain transformation, but overestimations of (1−ω0) and the threshold function TA of the automatic cloud/rain transformation, all of which depend on their physical mechanisms within the realm of aerosol-cloud interactions (Stier et al., 2024) (Fig. S13). This is also the case at the other supersaturation levels considered (Fig. S12).
As a result, we derive that the mean underestimation of ∼ 59 ± 19 % in NCCN at S= 0.2 % caused by the WRF-Chem leads to underestimations of 26 ± 11 % in the τ, 14 ± 7 % in the rc, and an overestimation of 35 ± 191 % in the absorption coefficient (1−ω0) and 93 ± 42 % in the TA. While, the mean uncertainties for all these parameters are largely reduced when the mean underestimation of ∼ 31 ± 15 % in NCCN at S= 0.2 % that is caused by RFRM model is applied (Fig. 6e). For example, the underestimation of cloud optical thickness τ decreases to ∼ 12 %, an improvement compared to the underestimation of about 14 % by the WRF-Chem model. Also, the RFRM model reduces the underestimation of the critical radius rc of the automatic cloud/rain transformation to only ∼ 6 %. Ultimately, the uncertainty of cloud radiative forcing Fc has been significantly reduced from an overestimation of 1.89 ± 0.78 W m−2 by the WRF-Chem model to only 0.81 ± 0.63 W m−2 by the RFRM model, showing the high sensitivity of climate forcing to the uncertainties in CCN number concentrations. Note that a limitation when evaluating the cloud radiative forcing based on the assumption of cloud fraction and the fractional transmission is the approximate analytical expression. Therefore, the results presented here may represent the upper limit, and the sensitivity of the radiative forcing to changes in NCCN would be weaker over continental areas (Wang et al., 2008; Yu et al., 2022).
4.1 Discussion and conclusions
In this study, using a multisource dataset of ground-based observations, atmospheric variables, the NCCN simulations by the WRF-Chem model, we have developed a new machine-learning-based model that predicts well the regional-scale NCCN in the polluted NCP region. The results show that the prediction bias of NCCN compared to observations is approximately −31 % from the RFRM model. Good accuracy has also been achieved during heavy pollution periods or cold seasons. This improvement is much more pronounced under severely polluted winter conditions, demonstrating the model's particular value for CCN prediction in heavily polluted environments. In general, the RFRM model better captures the spatial differences of NCCN than the WRF-Chem model. In addition, the prediction reveals a long-term downward trend of NCCN coincident with the observed trend for the period of 2014–2018. By further incorporating the NCCN prediction biases into the evaluation of cloud parameters and radiative forcing, we found that the cloud properties are more sensitive to the changes in NCCN when the models underestimated the CCN number concentrations compared to the cases when the models overestimated NCCN. As a result, the simulated uncertainty of cloud radiative forcing Fc could be significantly reduced from an overestimation of 1.89 ± 0.78 W m−2 by the WRF-Chem model to 0.81 ± 0.63 W m−2 by the RFRM model. Given the simplified setting in current climate models, this work emphasizes the necessity and urgency to obtain the precise NCCN values, offering a new framework for predicting CCN concentrations based on machine learning algorithms and effectively filling the observation gap of CCN concentrations.
4.2 Limitations and outlook
Although the machine learning-based model established in this study has been shown to significantly improve the prediction of CCN number concentration, the prediction results still exhibit considerable deviations, which may be attributed to several factors. First, it is related to the inherent limitation of the random forest method in describing time series with extreme values and large short-term fluctuations. In the future, other advanced machine learning algorithms (e.g., Long Short-Term Memory, Transformer) can be integrated to optimize and improve the results. Second, this study analyzes observational data from six campaigns conducted at three sites. Although the number of sites is limited, these sites represent urban, suburban, and regional background conditions, respectively, and the observation periods cover different seasons and years. Therefore, the current dataset can reasonably characterize the overall aerosol and CCN conditions in North China, and may also provide useful implications for other polluted regions with similar emission characteristics. Validating the simulated NCCN through comparisons with observations at more ground sites is warranted in future. Also, it is crucial to obtain comprehensive monitoring data of CCN and other key aerosol properties (e.g., particle size distribution, chemical compositions) in different environments. Overall, the RFRM framework presented here relies on available atmospheric state variables (e. g., chemical compositions, gas pollutants, and meteorology elements) and significantly improves the accuracy of NCCN prediction, thereby helping to bridge observational gaps. Our modeling framework could then be used to simulate ground-level CCN data in other regions around the world and even on a global scale. This new modeling framework could also guide the development of machine learning based models to predict CCN vertical profiles, which are critical for the accurate evaluation of the ACI effect.
The data and code are publicly accessible at https://doi.org/10.5281/zenodo.18932004 (Ren et al., 2026). This includes the WRF-Chem model version 4.1.5 used in this study, the machine learning code, the corresponding training, testing datasets and the CCN observation datasets, the emissions inventory and scripts used in WRF-Chem and the scripts used for plotting, supporting the findings of this study. The release version of WRF-Chem is also open-access and can be publicly available at NCAR https://www2.mmm.ucar.edu/wrf/users/download/get_source.html (last access: 10 May 2025, Skamarock et al., 2019). The initial meteorological variables are from the National Center for Environmental Prediction's Final Operational Global (NCEP/FNL) and available at https://doi.org/10.5065/D6M043C6 (NCEP, 2000).
The Supplement contains the information of additional descriptions of the WRF-Chem simulation (parameterization scheme, emission inventory and initial and boundary conditions), the method to evaluate aerosol indirect effects and additional figures applied in this study. The supplement related to this article is available online at https://doi.org/10.5194/gmd-19-6403-2026-supplement.
JYR: Conceptualization, Investigation, Formal analysis, Writing – original draft. SJZ: Data curation. HHX and GQL: Formal analysis. ZW: Formal analysis. ARZ: Data curation. CFZ: Technical support. MH: Data curation. DJS: Data curation. LZT: Data curation. RJH: Funding acquisition. YLS: Technical support. FZ: Writing – Reviewing and Editing, Funding acquisition. All authors read and approved the final manuscript.
The contact author has declared that none of the authors has any competing interests.
Publisher's note: Copernicus Publications remains neutral with regard to jurisdictional claims made in the text, published maps, institutional affiliations, or any other geographical representation in this paper. The authors bear the ultimate responsibility for providing appropriate place names. Views expressed in the text are those of the authors and do not necessarily reflect the views of the publisher.
We thank all participants in the field campaigns for their tireless work and cooperation. We also sincerely thank the anonymous reviewers for their valuable comments and suggestions, which have greatly improved the quality of this paper.
This research has been supported by the National Natural Science Foundation of China (NSFC) research project (grant nos. 42405118, 42475112, 41975174), the State Key Laboratory of Loess Science, the Institute of Earth Environment, Chinese Academy of Sciences (grant no. SKLLQG2429), Shenzhen Science and Technology Plan Project (grant nos. KCXST20221021111404011, GXWD20220818172959001, SYSPG20241211173609007), Guangdong Natural Science Foundation (grant no. 2024A1515011005).
This paper was edited by Holger Tost and reviewed by two anonymous referees.
Albrecht, B.: Aerosols, cloud microphysics, and fractional cloudiness, Science, 245, 1227–1230, https://doi.org/10.1126/science.245.4923.1227, 1989.
Charlson, R., Lovelock, J., Andreae, M., and Warren, S.: Oceanic phytoplankton, atmospheric sulphur, cloud albedo and climate, Nature, 326, 655–661, https://doi.org/10.1038/326655a0, 1987.
Charlson, R. J., Schwartz, S. E., Hales, J. M., Cess, R. D., Coakley Jr., J. A., Hansen, J. E., and Hofmann, D. J.: Climate forcing by anthropogenic aerosols, Science, 255, 423–430, https://doi.org/10.1126/science.255.5043.423, 1992.
Dinar, E., Anttlia, T., and Rudich, Y.: CCN activity and hygroscopic growth of organic aerosols following reactive uptake of ammonia, Environ. Sci. Technol., 42, 912–918, https://doi.org/10.1021/es071874p, 2008.
Fanourgakis, G. S., Kanakidou, M., Nenes, A., Bauer, S. E., Bergman, T., Carslaw, K. S., Grini, A., Hamilton, D. S., Johnson, J. S., Karydis, V. A., Kirkevåg, A., Kodros, J. K., Lohmann, U., Luo, G., Makkonen, R., Matsui, H., Neubauer, D., Pierce, J. R., Schmale, J., Stier, P., Tsigaridis, K., van Noije, T., Wang, H., Watson-Parris, D., Westervelt, D. M., Yang, Y., Yoshioka, M., Daskalakis, N., Decesari, S., Gysel-Beer, M., Kalivitis, N., Liu, X., Mahowald, N. M., Myriokefalitakis, S., Schrödner, R., Sfakianaki, M., Tsimpidi, A. P., Wu, M., and Yu, F.: Evaluation of global simulations of aerosol particle and cloud condensation nuclei number, with implications for cloud droplet formation, Atmos. Chem. Phys., 19, 8591–8617, https://doi.org/10.5194/acp-19-8591-2019, 2019.
Fan, T., Ren, J., Liu, C., Li, Z., Liu, J., Sun, Y., Wang, Y., Jin, X., and Zhang, F.: Evidence of surface-tension lowering of atmospheric aerosols by organics from field observations in an urban atmosphere: Relation to particle size and chemical composition, Environ. Sci. Technol., 58, 11363–11375, https://doi.org/10.1021/acs.est.4c03141, 2024.
Fan, X., Liu, J., Zhang, F., Chen, L., Collins, D., Xu, W., Jin, X., Ren, J., Wang, Y., Wu, H., Li, S., Sun, Y., and Li, Z.: Contrasting size-resolved hygroscopicity of fine particles derived by HTDMA and HR-ToF-AMS measurements between summer and winter in Beijing: the impacts of aerosol aging and local emissions, Atmos. Chem. Phys., 20, 915–929, https://doi.org/10.5194/acp-20-915-2020, 2020.
Grange, S. K., Carslaw, D. C., Lewis, A. C., Boleti, E., and Hueglin, C.: Random forest meteorological normalisation models for Swiss PM10 trend analysis, Atmos. Chem. Phys., 18, 6223–6239, https://doi.org/10.5194/acp-18-6223-2018, 2018.
Geng, G., Xiao, Q., Liu, S., Liu, X., Cheng, J., Zheng, Y., Xue, T., Tong, D., Zheng, B., Peng, Y., Huang, X., He, K., and Zhang, Q.: Tracking air pollution in China: near real-time PM2.5 retrievals from multisource data fusion, Environ. Sci. Technol., 55, 12106–12115, https://doi.org/10.1021/acs.est.1c01863, 2021.
IPCC: Climate Change 2021: The Physical Science Basis. Contribution of Working Group I to the Sixth Assessment Report of the Intergovernmental Panel on Climate Change, edited by: Masson, Delmotte, V., Zhai, P., Pirani, A., Connors, S. L., Péan, C., Berger, S., Caud, N., Chen, Y., Goldfarb, L., Gomis, M. I., Huang, M., Leitzell, K., Lonnoy, E., Matthews, J. B. R., Maycock, T. K., Waterfield, T., Yelekçi, O., Yu, R., and Zhou, B., Cambridge University Press, Cambridge, United Kingdom and New York, NY, USA, 2391 pp., https://doi.org/10.1017/9781009157896, 2021.
Lance, S., Nenes, A., Medina, J., and Smith, J.: Mapping the operation of the DMT continuous flow CCN counter, Aerosol Sci. Tech., 40, 242–254, https://doi.org/10.1080/02786820500543290, 2006.
Lian, J., Wang, Y., Li, K., Zhang, R., and Smith, D. M.: Nature of temperature-induced phase transitions in secondary organic aerosol particles, Environ. Sci. Technol., 59, 24359–24367, https://doi.org/10.1021/acs.est.5c08582, 2025.
Liang, M., Tao, J., Ma, N., Kuang, Y., Zhang, Y., Wu, S., Jiang, X., He, Y., Chen, C., Yang, W., Zhou, Y., Cheng, P., Xu, W., Hong, J., Wang, Q., Zhao, C., Zhou, G., Sun, Y., Zhang, Q., Su, H., and Cheng, Y.: Prediction of CCN spectra parameters in the North China Plain using a random forest model, Atmos. Environ., 289, 119323, https://doi.org/10.1016/j.atmosenv.2022.119323, 2022.
Lin, Y., Farley, R., and Orville, H.: Bulk parameterization of the snow field in a cloud model, J. Appl. Meteorol. Clim., 22, 1065–1092, https://doi.org/10.1175/1520-0450(1983)022<1065:BPOTSF>2.0.CO;2, 1983.
Liu, C., Wang, T., Rosenfeld, D., Zhu, Y., Yue, Z., Yu, X., Xie, X., Li, S., Zhuang, B., Cheng, T., and Niu, S.: Anthropogenic effects on cloud condensation nuclei distribution and rain initiation in East Asia, Geophys. Res. Lett., 47, https://doi.org/10.1029/2019GL086184, 2020.
Liu, J. and Li, Z.: Significant underestimation in the optically based estimation of the aerosol first indirect effect induced by the aerosol swelling effect, Geophys. Res. Lett., 45, 5690–5699, https://doi.org/10.1029/2018GL077679, 2018.
Liu, J., Zhang, F., Xu, W., Sun, Y., Chen, L., Li, S., Ren, J., Hu, B., Wu, H., and Zhang, R.: Hygroscopicity of organic aerosols linked to formation mechanisms, Geophys. Res. Lett., 48, https://doi.org/10.1029/2020GL091683, 2021.
Liu, S., Geng, G., Xiao, Q., Zheng, Y., Liu, X., Cheng, J., and Zhang, Q.: Tracking daily concentrations of PM2.5 chemical composition in China since 2000, Environ. Sci. Technol., 56, 16517–16527, https://doi.org/10.1021/acs.est.2c06510, 2022.
Menon, S. and Rotstayn, L.: The radiative influence of aerosol effects on liquid-phase cumulus and stratiform clouds based on sensitivity studies with two climate models, Clim. Dynam., 27, 345–356, https://doi.org/10.1007/s00382-006-0139-3, 2006.
Moore, R., Cerully, K., Bahreini, R., Brock, C., Middlebrook, A., and Nenes, A.: Hygroscopicity and composition of California CCN during summer 2010, J. Geophys. Res.-Atmos., 117, https://doi.org/10.1029/2011JD017352, 2012.
Morrison, H., Thompson, G., and Tatarskii, V.: Impact of cloud microphysics on the development of trailing stratiform precipitation in a simulated squall line: Comparison of one-and two-moment schemes, Mon. Weather Rev., 137, 991–1007, https://doi.org/10.1175/2008MWR2556.1, 2009.
Nair, A. A. and Yu, F.: Using machine learning to derive cloud condensation nuclei number concentrations from commonly available measurements, Atmos. Chem. Phys., 20, 12853–12869, https://doi.org/10.5194/acp-20-12853-2020, 2020.
Nair, A., Yu, F., Campuzano-Jost, P., DeMott, P., Levin, E., Jimenez, J., Peischl, J., Pollack, I., Fredrickson, C., Beyersdorf, A., Nault, B., Park, M., Yum, S., Palm, B., Xu, L., Bourgeois, I., Anderson, B., Nenes, A., Ziemba, L., Moore, R., Lee, T., Park, T., Thomp son, C., Flocke, F., Huey, L., Kim, M., and Peng, Q.: Machine Learning Uncovers Aerosol Size Information From Chemistry and Meteorology to Quantify Potential Cloud-Forming Particles, Geophys. Res. Lett., 48, https://doi.org/10.1029/2021GL094133, 2021.
NCEP: NCEP FNL Operational Model Global Tropospheric Analyses, continuing from July 1999, National Centers for Environ mental Prediction, NCEP [Data set], https://doi.org/10.5065/D6M043C6, 2000.
Petters, M. D. and Kreidenweis, S. M.: A single parameter representation of hygroscopic growth and cloud condensation nucleus activity, Atmos. Chem. Phys., 7, 1961–1971, https://doi.org/10.5194/acp-7-1961-2007, 2007.
Ren, J., Zhang, F., Wang, Y., Collins, D., Fan, X., Jin, X., Xu, W., Sun, Y., Cribb, M., and Li, Z.: Using different assumptions of aerosol mixing state and chemical composition to predict CCN concentrations based on field measurements in urban Beijing, Atmos. Chem. Phys., 18, 6907–6921, https://doi.org/10.5194/acp-18-6907-2018, 2018.
Ren, J., Chen, L., Liu, J., and Zhang, F.: The density of ambient black carbon retrieved by a new method: implications for cloud condensation nuclei prediction, Atmos. Chem. Phys., 23, 4327–4342, https://doi.org/10.5194/acp-23-4327-2023, 2023.
Ren, J., Zou, S., Xu, H., Liu, G., Wang, Z., Zhang, A., Zhao, C., Hu, M., Shang, D., Tang, L., Huang, R.-J., Sun, Y., and Zhang, F.: Machine learning significantly improves the simulation of hourly-to-yearly scale cloud nuclei concentration and radiative forcing in polluted atmosphere, Zenodo [code, data set], https://doi.org/10.5281/zenodo.18932004, 2026.
Rose, C., Collaud Coen, M., Andrews, E., Lin, Y., Bossert, I., Lund Myhre, C., Tuch, T., Wiedensohler, A., Fiebig, M., Aalto, P., Alastuey, A., Alonso-Blanco, E., Andrade, M., Artíñano, B., Arsov, T., Baltensperger, U., Bastian, S., Bath, O., Beukes, J. P., Brem, B. T., Bukowiecki, N., Casquero-Vera, J. A., Conil, S., Eleftheriadis, K., Favez, O., Flentje, H., Gini, M. I., Gómez-Moreno, F. J., Gysel-Beer, M., Hallar, A. G., Kalapov, I., Kalivitis, N., Kasper-Giebl, A., Keywood, M., Kim, J. E., Kim, S.-W., Kristensson, A., Kulmala, M., Lihavainen, H., Lin, N.-H., Lyamani, H., Marinoni, A., Martins Dos Santos, S., Mayol-Bracero, O. L., Meinhardt, F., Merkel, M., Metzger, J.-M., Mihalopoulos, N., Ondracek, J., Pandolfi, M., Pérez, N., Petäjä, T., Petit, J.-E., Picard, D., Pichon, J.-M., Pont, V., Putaud, J.-P., Reisen, F., Sellegri, K., Sharma, S., Schauer, G., Sheridan, P., Sherman, J. P., Schwerin, A., Sohmer, R., Sorribas, M., Sun, J., Tulet, P., Vakkari, V., van Zyl, P. G., Velarde, F., Villani, P., Vratolis, S., Wagner, Z., Wang, S.-H., Weinhold, K., Weller, R., Yela, M., Zdimal, V., and Laj, P.: Seasonality of the particle number concentration and size distribution: a global analysis retrieved from the network of Global Atmosphere Watch (GAW) near-surface observatories, Atmos. Chem. Phys., 21, 17185–17223, https://doi.org/10.5194/acp-21-17185-2021, 2021.
Rosenfeld, D., Zheng, Y., Hashimshoni, E., Pöhlker, M., Jeffersong, A., Pöhlker, C., Yu, X., Zhu, Y., Liu, G., Yue, Z., Fischmana, B., Li, Z., Giguzin, D., Goren, T., Artaxo, P., Barbosa, H., Pöschle, U., and Andreae, M.: Satellite retrieval of cloud condensation nuclei concentrations by using clouds as CCN chambers, P. Natl. Acad. Sci. USA, 113, 5828–5834, https://doi.org/10.1073/pnas.1514044113, 2016.
Stockwell, W., Middleton, P., Chang, J., and Tang, X.: The second generation regional acid deposition model chemical mechanism for regional air quality modeling, J. Geophys. Res.-Atmos., 95, 16343–16367, https://doi.org/10.1029/JD095iD10p16343, 1990.
Sotiropoulou, R., Nenes, A., Adams, P., and Seinfeld, J.: Cloud condensation nuclei prediction error from application of Köhler theory: Importance for the aerosol indirect effect, J. Geophys. Res.-Atmos., 112, https://doi.org/10.1029/2006JD007834, 2007.
Shen, Y., Virkkula, A., Ding, A., Luoma, K., Keskinen, H., Aalto, P. P., Chi, X., Qi, X., Nie, W., Huang, X., Petäjä, T., Kulmala, M., and Kerminen, V.-M.: Estimating cloud condensation nuclei number concentrations using aerosol optical properties: role of particle number size distribution and parameterization, Atmos. Chem. Phys., 19, 15483–15502, https://doi.org/10.5194/acp-19-15483-2019, 2019.
Sha, T., Ma, X., Jia, H., Van Der A, R., Ding, J., Zhang, Y., and Chang, Y.: Exploring the influence of two inventories on simulated air pollutants during winter over the Yangtze River Delta, Atmos. Environ., 206, 170–182, https://doi.org/10.1016/j.atmosenv.2019.03.006, 2019.
Schmale, J., Henning, S., Decesari, S., Henzing, B., Keskinen, H., Sellegri, K., Ovadnevaite, J., Pöhlker, M. L., Brito, J., Bougiatioti, A., Kristensson, A., Kalivitis, N., Stavroulas, I., Carbone, S., Jefferson, A., Park, M., Schlag, P., Iwamoto, Y., Aalto, P., Äijälä, M., Bukowiecki, N., Ehn, M., Frank, G., Fröhlich, R., Frumau, A., Herrmann, E., Herrmann, H., Holzinger, R., Kos, G., Kulmala, M., Mihalopoulos, N., Nenes, A., O'Dowd, C., Petäjä, T., Picard, D., Pöhlker, C., Pöschl, U., Poulain, L., Prévôt, A. S. H., Swietlicki, E., Andreae, M. O., Artaxo, P., Wiedensohler, A., Ogren, J., Matsuki, A., Yum, S. S., Stratmann, F., Baltensperger, U., and Gysel, M.: Long-term cloud condensation nuclei number concentration, particle number size distribution and chemical composition measurements at regionally representative observatories, Atmos. Chem. Phys., 18, 2853–2881, https://doi.org/10.5194/acp-18-2853-2018, 2018.
Song, C., Becagli, S., Beddows, D. C. S., Brean, J., Browse, J., Dai, Q., Dall'Osto, M., Ferracci, V., Harrison, R. M., Harris, N., Li, W., Jones, A. E., Kirchgäßner, A., Kramawijaya, A. G., Kurganskiy, A., Lupi, A., Mazzola, M., Severi, M., Traversi, R., and Shi, Z.: Understanding sources and drivers of size-resolved aerosol in the High Arctic islands of Svalbard using a receptor model coupled with machine learning, Environ. Sci. Technol., 56, 11189–11198, https://doi.org/10.1021/acs.est.1c07796, 2022.
Shang, D., Tang, L., Fang, X., Wang, L., Yang, S., Wu, Z., Chen, S., Li, X., Zeng, L., Guo, S., and Hu, M.: Variations in source contributions of particle number concentration under long-term emission control in winter of urban Beijing, Environ. Pollut., 304, 119072, https://doi.org/10.1016/j.envpol.2022.119072, 2022.
Skamarock, W., Klemp, J., Dudhia, J., Gill, D. O., Liu, Z., Berner, J., Wang, W., Powers, J. G., Duda, M. G., Barker, D., and Huang, X.-Y.: A Description of the Advanced Research WRF Model Version 4.1, UCAR/NCAR, https://doi.org/10.5065/1dfh-6p97, 2019 (code available at: https://www2.mmm.ucar.edu/wrf/users/download/get_source.html, last access: 10 May 2025).
Stier, P., Van Den Heever, S. C., Christensen, M. W., Gryspeerdt, E., Dagan, G., Saleeby, S. M., Bollasina, M., Donner, L., Emanuel, K., Ekman, A. M. L., Feingold, G., Field, P., Forster, P., Hay wood, J., Kahn, R., Koren, I., Kummerow, C., L'Ecuyer, T., Lohmann, U., Ming, Y., Myhre, G., Quaas, J., Rosenfeld, D., Samset, B., Seifert, A., Stephens, G., and Tao, W.-K.: Multifaceted aerosol effects on precipitation, Nat. Geosci., 17, 719–732, https://doi.org/10.1038/s41561-024-01482-6, 2024.
Tao, J., Kuang, Y., Ma, N., Hong, J., Sun, Y., Xu, W., Zhang, Y., He, Y., Luo, Q., Xie, L., Su, H., and Cheng, Y.: Secondary aerosol formation alters CCN activity in the North China Plain, Atmos. Chem. Phys., 21, 7409–7427, https://doi.org/10.5194/acp-21-7409-2021, 2021.
Twomey, S.: The influence of pollution on the shortwave albedo of clouds, J. Atmos. Sci., 34, 1149–1152, https://doi.org/10.1175/1520-0469(1977)034<1149:TIOPOT>2.0.CO;2, 1977.
Wang, J., Lee, Y.-N., Daum, P. H., Jayne, J., and Alexander, M. L.: Effects of aerosol organics on cloud condensation nucleus (CCN) concentration and first indirect aerosol effect, Atmos. Chem. Phys., 8, 6325–6339, https://doi.org/10.5194/acp-8-6325-2008, 2008.
Wang, Y., Niu, S., Lv, J., Lu, C., Xu, X., Wang, Y., Ding, J., Zhang, H., Wang, T., and Kang, B.: A new method for distinguishing unactivated particles in cloud condensation nuclei measurements: implications for aerosol indirect effect evaluation, Geophys. Res. Lett., 46, 14185–14194, https://doi.org/10.1029/2019GL085379, 2019.
Wei, J., Li, Z., Wang, J., Li, C., Gupta, P., and Cribb, M.: Ground-level gaseous pollutants (NO2, SO2, and CO) in China: daily seamless mapping and spatiotemporal variations, Atmos. Chem. Phys., 23, 1511–1532, https://doi.org/10.5194/acp-23-1511-2023, 2023.
Xu, W., Fossum, K. N., Ovadnevaite, J., Lin, C., Huang, R.-J., O'Dowd, C., and Ceburnis, D.: The impact of aerosol size-dependent hygroscopicity and mixing state on the cloud condensation nuclei potential over the north-east Atlantic, Atmos. Chem. Phys., 21, 8655–8675, https://doi.org/10.5194/acp-21-8655-2021, 2021.
Yang, N., Shi, H., Tang, H., and Yang, X.: Geographical and temporal encoding for improving the estimation of PM2.5 concentrations in China using end-to-end gradient boosting, Remote Sens. Environ., 269, 112828, https://doi.org/10.1016/j.rse.2021.112828, 2022.
Yu, F., Luo, G., Nair, A. A., Schwab, J. J., Sherman, J. P., and Zhang, Y.: Wintertime new particle formation and its contribution to cloud condensation nuclei in the Northeastern United States, Atmos. Chem. Phys., 20, 2591–2601, https://doi.org/10.5194/acp-20-2591-2020, 2020.
Yu, F., Luo, G., Nair, A. A., Tsigaridis, K., and Bauer, S. E.: Use of machine learning to reduce uncertainties in particle number concentration and aerosol indirect radiative forcing predicted by climate models, Geophys. Res. Lett., 49, https://doi.org/10.1029/2022GL098551, 2022.
Zaveri, R. A. and Peters, L. K.: A new lumped structure photochemical mechanism for large-scale applications, J. Geophys. Res.-Atmos., 104, 30387–30415, https://doi.org/10.1029/1999JD900876, 1999.
Zhang, F., Li, Y., Li, Z., Sun, L., Li, R., Zhao, C., Wang, P., Sun, Y., Liu, X., Li, J., Li, P., Ren, G., and Fan, T.: Aerosol hygroscopicity and cloud condensation nuclei activity during the AC3Exp campaign: implications for cloud condensation nuclei parameterization, Atmos. Chem. Phys., 14, 13423–13437, https://doi.org/10.5194/acp-14-13423-2014, 2014.
Zhang, F., Li, Z., Li, Y., Sun, Y., Wang, Z., Li, P., Sun, L., Wang, P., Cribb, M., Zhao, C., Fan, T., Yang, X., and Wang, Q.: Impacts of organic aerosols and its oxidation level on CCN activity from measurement at a suburban site in China, Atmos. Chem. Phys., 16, 5413–5425, https://doi.org/10.5194/acp-16-5413-2016, 2016.
Zhang, F., Wang, Y., Peng, J., Ren, J., Collins, D., Zhang, R., Sun, Y., Yang, X., and Li, Z.: Uncertainty in predicting CCN activity of aged and primary aerosols, J. Geophys. Res.-Atmos., 122, 11723–11736, https://doi.org/10.1002/2017JD027058, 2017.
Zhang, F., Ren, J., Fan, T., Chen, L., Xu, W., Sun, Y., Zhang, R., Liu, J., Jiang, S., Jin, X., Wu, H., Li, S., Cribb, M. C., and Li, Z.: Significantly Enhanced Aerosol CCN Activity and Number Concentrations by Nucleation-Initiated Haze Events: A Case Study in Urban Beijing, J. Geophys. Res.-Atmos., 124, 14102–14113, https://doi.org/10.1029/2019JD031457, 2019.
Zhang, Y., Tao, J., Ma, N., Kuang, Y., Wang, Z., Cheng, P., Xu, W., Yang, W., Zhang, S., Xiong, C., Dong, W., Xie, L., Sun, Y., Fu, P., Zhou, G., Cheng, Y., and Su, H.: Predicting cloud condensation nuclei number concentration based on conventional measurements of aerosol properties in the North China Plain, Sci. Total Environ., 719, 137473, https://doi.org/10.1016/j.scitotenv.2020.137473, 2020.
Zheng, B., Tong, D., Li, M., Liu, F., Hong, C., Geng, G., Li, H., Li, X., Peng, L., Qi, J., Yan, L., Zhang, Y., Zhao, H., Zheng, Y., He, K., and Zhang, Q.: Trends in China's anthropogenic emissions since 2010 as the consequence of clean air actions, Atmos. Chem. Phys., 18, 14095–14111, https://doi.org/10.5194/acp-18-14095-2018, 2018.
Zhu, Y., Shen, Y., Li, K., Meng, H., Sun, Y., Yao, X., Gao, H., Xue, L., and Wang, W.: Investigation of particle number concentrations and new particle formation with largely reduced air pollutant emissions at a coastal semi-urban site in northern China, J. Geophys. Res.-Atmos., 126, e2021JD035419, https://doi.org/10.1029/2021JD035419, 2021.
Zou, S., Chen, L., Xu, H., Zhang, R., Liu, M., Liu, G., Ye, J., Yang, H., Wu, H., Yang, Y., and Zhang, F.: Observed size-dependent effect of the marine air on aerosols hygroscopicity at a coastal site of Shenzhen, China, Atmos. Res., 315, 107835. https://doi.org/10.1016/j.atmosres.2024.107830, 2024.