the Creative Commons Attribution 4.0 License.
the Creative Commons Attribution 4.0 License.
 | 07 Apr 2026
The Scenario Model Intercomparison Project for CMIP7 (ScenarioMIP-CMIP7)
Detlef P. Van Vuuren
Brian C. O'Neill
Claudia Tebaldi
Benjamin M. Sanderson
Louise P. Chini
Pierre Friedlingstein
Tomoko Hasegawa
Keywan Riahi
Bala Govindasamy
Nico Bauer
Veronika Eyring
Cheikh M. N. Fall
Katja Frieler
Matthew J. Gidden
Laila K. Gohar
Annika Högner
Andrew D. Jones
Jarmo Kikstra
Andrew King
Reto Knutti
Elmar Kriegler
Peter Lawrence
Chris Lennard
Jason Lowe
Camilla Mathison
Shahbaz Mehmood
Zebedee Nicholls
Luciana F. Prado
Qiang Zhang
Steven K. Rose
Alex C. Ruane
Marit Sandstad
Carl-Friedrich Schleussner
Roland Seferian
Jana Sillmann
Chris Smith
Anna A. Sörensson
Swapna Panickal
Kaoru Tachiiri
Naomi Vaughan
Saritha S. Vishwanathan
Tokuta Yokohata
Marco Zecchetto
Tilo Ziehn
Scenarios serve as a critical tool in climate change analysis, enabling the exploration of future evolution of the climate system, climate impacts, and the human system (including mitigation and adaptation actions). This paper describes the scenario framework for ScenarioMIP as part of CMIP7. The design process has involved various rounds of interaction with the research community and user groups at large. The proposal covers a set of scenarios exploring high levels of climate change (to explore high-end climate risks), medium levels of climate change (anchored to current policy), and low levels of climate change (aligned with current international agreements). These scenarios follow very different trajectories in terms of emissions, with some likely to experience peaks and subsequent declines in greenhouse gas concentrations in this century. An important innovation is that most scenarios are intended to be run, if possible, in emission-driven mode, providing a better representation of the Earth system uncertainty space. The proposal also includes plans for long-term extensions (up to 2500 AD) to study long-term impacts, climate change-related processes on long timescales, and (ir)reversibility. This proposal forms the basis for further implementation of the framework in terms of the derivation of emissions and land use pathways for use by Earth system models and additional variants for adaptation and mitigation studies.
- Article
(5424 KB) - Full-text XML
- BibTeX
- EndNote


Scenarios serve as a critical tool in climate change analysis. Defined as plausible alternative descriptions of how the future may develop based on a coherent set of assumptions, they are used by different research communities to explore potential future avenues of socio-economic conditions, assess the effects of different drivers of climate change, characterize future climatic conditions, and assess impacts of climate change as well as adaptation and mitigation responses. As such, scenarios are also useful to bridge across different research communities. The World Climate Research Programme's (WCRP) Coupled Model Intercomparison Project (CMIP) has organized several rounds of the development and use of such scenarios. The CMIP scenarios play not only a pivotal role in climate research but also act as integrating tools for scientific assessment processes and policy analysis. In the most recent phase 6 (CMIP6), CMIP delegated the organization of experiments targeting specific research areas and questions to the scientific community, and CMIP6-Endorsed Model Intercomparison Projects were established (Eyring et al., 2016). The Scenario Model Intercomparison Project (ScenarioMIP) formed a primary activity within CMIP6 that facilitated multi-model climate projections based on alternative plausible forcing scenarios that are directly relevant to societal concerns regarding climate change mitigation, adaptation, and future climate impacts and risks1 (O'Neill et al., 2016; Tebaldi et al., 2021).
In this continuing role, ScenarioMIP's goal for CMIP7 is the design of a limited set of scenario-based experiments to be run by climate models, that (1) serve direct science questions, (2) function as input to other (science) communities and (3) support policy. With regard to the direct science contribution, the scenario information is used to study and understand climate processes and how their response to anthropogenic forcings emerges from internal variability and model structural uncertainties. To accomplish this aim, it is important that the set of forcing variables considered is internally consistent and varies over a plausible range of forcing levels, and that the set explores futures that may result in very different climate process dynamics (such as increasing and declining concentrations). With regard to the contribution to other (science) communities, ScenarioMIP ensures that data becomes available about future changes in climate variables (such as temperature, precipitation, humidity, etc.) together with information on human forcings/drivers (such as population, economic activity, land use, etc.) to a diverse set of user communities beyond the physical climate sciences. This aim is to facilitate further understanding of climate change, its impacts, risks and response options, including adaptation and mitigation choices. Targeted communities include, for instance, researchers on impacts and mitigation, but also practitioners, who might use this information for national or sub-national or local risk assessment, climate finance, mitigation policy or adaptation planning. Finally, regarding policy, ScenarioMIP aims to provide relevant outputs to support climate policy development, including through their use in IPCC assessments. Despite these important roles, climate modeling groups participating in ScenarioMIP can only run a limited set of scenarios. Computational expenses associated with setting up, running and archiving output from climate model experiments pose strict constraints on the number of scenarios that ScenarioMIP's protocol can include. Therefore, a small set of scenarios needs to be selected such that the set satisfies the three critical goals but does not require resources that are beyond reach for current scientific and computational capacity.
In preparation of the ScenarioMIP experimental design, the first meeting of the ScenarioMIP project under CMIP7 was held on 20–22 June 2023, in Reading, UK. Based on the meeting report, the Scientific Steering Committee (SSC) of ScenarioMIP formed several task groups, including external experts, and continued to work on an experimental design for the next round of ScenarioMIP. The results are captured in this document. The meeting also led to the expansion of the SSC for ScenarioMIP as well as the creation of a large advisory group (CMIP, 2026). Both these changes responded to the desire to make ScenarioMIP more inclusive and broaden awareness of diverse viewpoints and concerns. Since then, the ScenarioMIP proposal was elaborated through various rounds of review and participation. In September 2023, the first ideas were shared with the research community in two webinars, asking for direct feedback. Subsequently, draft versions of the proposal were sent out for review in late 2023 (to a group of around 80 people worldwide that expressed interest in being involved as an advisory group) and in May 2024 (through an open review process to scientists and other user groups). Both rounds resulted in a large set of review comments. The paper was also subject to public review as part of the EGUsphere review process. Development of IAM emissions and land use scenarios based on the experimental design described in this proposal began in September 2024 and is currently nearing completion. For each CMIP7 scenario, a marker was selected that accurately represented the description of the scenario. The results of this selection were discussed with representatives of the CMIP panel as well as potential scenario users. Earth system model simulations are planned to start in spring 2026 for some scenarios and be completed about three months later. Additional scenario simulations are planned to begin in June 2026.
2.1 Role of ScenarioMIP in CMIP6
Before discussing the design of the current scenario round, it is useful to briefly evaluate the role of ScenarioMIP in CMIP6 (O'Neill et al., 2016; Tebaldi et al., 2021). In CMIP6, ScenarioMIP specified four Tier 1 and four Tier 2 scenarios to be run by ESMs, coordinating the production of these scenarios by the IAM community and the process to deliver them in the form that ESMs need to make use of them as external forcings. These experiments (especially those in Tier 1) were run by most modeling teams participating in CMIP6 and are by far the most used scenario-based simulations of CMIP6. The results of the ScenarioMIP experiments led to many physical science2 papers describing changes in climate characteristics, but also to many papers characterizing the impacts of those changes on society and ecosystems. Further, ScenarioMIP results contributed to the assessment reports of all Working Groups of IPCC, supplying a dimension of integration that is reflected in the Synthesis Report of AR6 (IPCC, 2023a). The most direct use was in WGI, where ScenarioMIP climate model simulations formed the backbone of the assessment (IPCC, 2021). The use in WGII (IPCC, 2022b) was more limited because of a lag in production of literature on impacts and adaptation based on ScenarioMIP results. In WGIII, ScenarioMIP results made an indirect but fundamental contribution via the calibration of simple climate models (SCMs) that allowed characterization of probabilistic global temperature projections and the resulting classification of a large set of baseline and mitigation scenarios produced by Integrated Assessment Models that were not run by ESMs (IPCC, 2022a; Kikstra et al., 2022). There were some difficulties related to the process. This includes the relatively long period from data production (IAM model runs and harmonization) until final climate model runs (from 2015 to 2020). This means that studies on climate impacts (relying on ESM runs) could even start later given the need for additional downscaling and bias adjustment. This even meant that the underlying projections from IAMs were somewhat outdated by the time climate model output became available (several projected years (2015–2020) had already become historical by that time). Also, over time, critiques emerged about the plausibility of the most extreme scenarios (SSP5-8.5 and its precursor, RCP8.5; SSP1-1.9) (Hausfather and Peters, 2020; Engels et al., 2024; Ritchie and Dowlatabadi, 2017).
2.2 General design principles
In view of the multiple aims of the ScenarioMIP scenarios, the experimental design was created with a set of general principles in mind. The principles will be further discussed below:
-
The scenarios form illustrative, internally consistent descriptions of future emissions and land use.
-
The scenario set covers a wide and plausible range of emissions and climate forcing.
-
Most scenarios will be run in emission-driven mode (for CO2) in ESMs.
-
The scenarios cover the period up to 2100 AD, and long-term extensions are stylized continuations of the narrative without large discontinuities.
2.2.1 The scenarios form illustrative, internally consistent descriptions of future emissions and land use
The primary purpose of the ScenarioMIP scenarios is to provide emissions and land use pathways to drive ESMs. ScenarioMIP will produce these pathways based on plausible, internally consistent socio-economic and technological scenarios3. It should be noted, however, that there are many different scenarios that could produce similar emissions and land use outcomes. The particular storylines and quantitative drivers constituting the ScenarioMIP scenarios are therefore illustrative. In fact, the resulting ESM simulations are intended to be used in future studies in combination with many different pathways describing future socioeconomic development (van Vuuren et al., 2014). In this context, it is useful to note that even the regional patterns of emissions of short-lived forcers and land use, found to have effects within single model studies (Lau and Kim, 2017; Lin et al., 2018) do not necessarily translate to a unique climate change pathway, since they, for now, have been shown to lack a robust regional climate signal in a multi-model context (Westervelt et al., 2020; Tebaldi et al., 2023).
In CMIP6, the Shared Socioeconomic Pathways (SSPs) provided the socio-economic and technological storylines and drivers underlying the emissions and land use pathways in ScenarioMIP (Riahi et al., 2017). The SSPs continue to be in wide use and recently the demographic and economic drivers for these scenarios have been updated (IIASA, 2024). However, other storylines and drivers could be adopted or created as a basis for the ScenarioMIP emissions and land use pathways. In practice, the IAM teams have based their current scenarios on various SSPs, as it was generally deemed pragmatic as these come with already available, suitably rich quantifications and were implemented by the participating modelling teams within the given timeline.
2.2.2 The scenario set covers a wide and plausible range of emissions and climate forcing
The scenarios should encompass a wide range of policy-relevant emission trajectories considered to be plausible (i.e. that have a non-negligible likelihood of occurring; see Box 1 for a definition of a plausible scenario and other related terms). As a set, the ScenarioMIP scenarios should thus cover plausible outcomes ranging from a high level of climate change (in the case of policy failure) to low levels of climate change resulting from stringent policies. For the 21st century, this range will be smaller than assessed before: on the high-end of the range, the CMIP6 high emission levels (quantified by SSP5-8.5) have become implausible, based on trends in the costs of renewables, the emergence of climate policy and recent emission trends (Hausfather and Peters, 2020). At the low end, many CMIP6 emission trajectories have become inconsistent with observed trends during the 2020–2030 period.
Plausibility is a subjective judgment. Moreover, in several cases our plausibility judgments are conditional on assumptions that are themselves hypothetical. For example, in all scenarios we assume that there are no climate change impacts (see further in this document). This can be justified by the overall scenarios framework in which impact analyses will be carried out by impact models using ScenarioMIP ESM simulations (and human drivers) as inputs. In other words, the ScenarioMIP scenarios are judged to be plausible conditional on the assumption of no climate change impacts. This conditionality is most consequential for the high climate change scenarios, in which impacts would be largest. The medium scenarios make subjective assumptions on current policies (see further). For low scenarios, we take into account geophysical and techno-economic limits, particularly regarding ramp-up rates of emission reduction and CDR, and technology and policy trends/constraints in the short-run. Views on plausibility evolve over time, as evidenced by the changing scenarios assumptions in successive IPCC WGIII assessment reports. It should therefore be acknowledged that there might be potential futures outside the ScenarioMIP scenario range.
Recent attempts have been made in the scenario literature to produce probabilistic emissions projections (Rennert et al., 2022; Moore et al., 2022; Liu and Raftery, 2021). While such studies can provide valuable insights, they require several methodological choices and subjective judgments that are not widely shared across the community. We therefore do not provide probabilities of occurrence for the scenarios of this experimental design. We only prescribe that all scenarios should be plausible (see Box 1). That said, the design criteria specify that the High scenario should be “as high as plausible” while the Very Low scenario should be “as low as plausible”, particularly in its degree of exceedance of 1.5 °C warming. To meet these criteria, assumptions about one or more of the elements driving emissions outcomes in these scenarios will need to push the boundaries of plausibility. By construction, then, we anticipate that these scenarios will be considered less likely than those in the interior of the emissions range. However, we leave likelihood judgments as a research question to be addressed by the community on the basis of the emissions scenarios ultimately produced.
One aspect of the future also concerns elements of equity and justice. Given the focus of the ScenarioMIP scenarios to explore the broad, global relationships between the main drivers of climate change and the resulting global climate outcomes, the scenarios described here do not explicitly address a range of justice assumptions. However, it is critically important that the wider scenario literature, related to the ScenarioMIP scenarios, pays more attention to equity and justice issues. This is discussed further in Box 2.
2.2.3 Most scenarios will be run in emission-driven mode for CO2
Up to now, ScenarioMIP experiments were driven by CO2 concentrations. As this does not account for uncertainty in the carbon cycle response to climate, the decision was made for CMIP7 to run most simulations preferably in emission-driven mode (Sanderson et al., 2024). This means that for Earth System Models (ESMs), their carbon-cycle representation determines the concentration of CO2 in the atmosphere that ensues from the prescribed emissions. This may lead to a wider concentration range as processes related to carbon cycle-climate feedbacks are newly involved in the scenario simulations, with their uncertainties. While the wider range may lead to some challenges in interpretation, it will better represent the uncertainty range resulting from both the carbon cycle and the climate system. The climate model simulations would also take better advantage of current ESM capabilities, especially regarding the outcomes of land-based mitigation solutions, which are heavily dependent on feedbacks that are not represented in concentration-driven experiments.
Concentration data will also be provided for all scenarios for ESMs that can only run in concentration-driven mode (without an active carbon cycle; see for a discussion of the current capabilities of state-of-the-art ESMs (Hajima et al., 2025; Séférian et al., 2020). For the concentration-driven simulations, the median values of the concentrations as estimated by the carbon cycle emulators calibrated to CMIP6 included in Simple Climate Models (SCMs) can be used (Nicholls et al., 2025b). This means that the concentration-driven models will likely have a narrower outcome space compared to the emission-driven set, which will have consequences for interpretation and use of certain variables. Regarding CDR options, only afforestation and reforestation will be based on endogenous representation of land use in ESMs. For all other CDR options, we will include their emission impact within the IAM emission output (see Sect. 5). To better assess the impact of running in emission-driven mode over the range of climate system outcomes produced by the multi-model ensemble, we propose that modeling groups adopting the emission-driven mode also run at least one scenario in concentration-driven mode, for comparison.
It is proposed that under the ScenarioMIP protocol models be run in emission-driven mode for CO2 only. Other well-mixed greenhouse gases (CH4, N2O, halocarbons) remain with prescribed concentrations in the core experiments. Aerosol precursor emissions (e.g., SO2, NOx, VOCs, black carbon, organic carbon) will be provided for models with interactive aerosol schemes, though tropospheric and stratospheric 3d optical aerosol properties will be provided for those models which require it. Similarly, ozone concentrations will be provided for models which require this as an input (while models with full interactive chemistry can calculate it based on emissions).
Running historical simulations in an emission-driven configuration presents a challenge, as a model's simulated CO2 concentration can drift from observations. However, this approach is a deliberate and core feature of the CMIP7 experimental design (Sanderson et al., 2024). Rather than taking measures to artificially correct this bias, we encourage ESM groups to quantify CO2 concentration evolution as a key diagnostic of model performance and carbon cycle sensitivity. To facilitate this analysis, the ScenarioMIP protocol includes at least one parallel concentration-driven simulation specifically to allow for a clean diagnosis of the impact of these emergent carbon cycle feedbacks on climate outcomes.
2.2.4 The scenarios cover the period 2025–2100 (AD) with long-term extensions up to 2500 (AD)
The expectation is that the CMIP results will inform the process of the upcoming IPCC Seventh Assessment Report and the 2028 global stocktake as well as future research and assessments in subsequent years. As IAM narratives do not start until after 2025, ideally emissions would be harmonized until that point. However, historical emissions data for all relevant emissions species are not immediately available. Moreover, the historical emissions dataset used for harmonization must align with what is used for historical emissions in CMIP7. Emissions were therefore harmonized for the year 2023. For the 2024–2025 period, IAMs were asked to stay close to current trends – but based on individual model output. This is a major update compared to CMIP6 that had historical data up to 2015, and means that several critical periods (Covid-19, trends in natural gas use) will be included. IAM modelled emissions changes following the scenario narratives cover the period 2026–2100. It is also expected that differences among emission scenarios will remain within a relatively narrow plausibility range until 2030 (see Box 1 for a definition of plausibility).
There are important reasons to model long-term climate system dynamics beyond the end of the century, which serves the needs of communities studying long-term impacts and (ir)reversibilities over multi-century time scales (e.g., ice sheet, sea level rise, and species extinction researchers). The period after 2100 AD is covered by long-term extensions of emissions and land use to 2500 AD based on simple extension narratives and harmonization logic (See Sect. 4). We recognize that the period up to the end of the century, traditionally covered by future scenarios, becomes significantly shorter with every new phase of CMIP. Future phases will see IAM-based scenarios reach beyond 2100, but that technical development was not possible within the current timeline. Rather, for this iteration of ScenarioMIP, we request that the ESM models run all scenarios at least to 2150 AD, using the 2100–2150 AD forcing from the extension protocol (see Sect. 4). In addition, teams are also requested to run at least two long-term extensions up to 2500 (preferably H-ext and VL-ext).
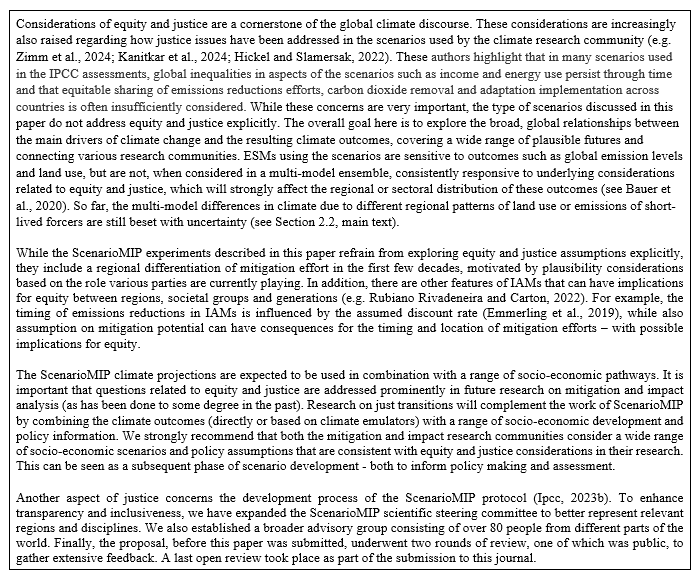
Considerations of equity and justice are a cornerstone of the global climate discourse. These considerations are increasingly also raised regarding how justice issues have been addressed in the scenarios used by the climate research community (e.g. Zimm et al., 2024; Kanitkar et al., 2024; Hickel and Slamersak, 2022). These authors highlight that in many scenarios used in the IPCC assessments, global inequalities in aspects of the scenarios such as income and energy use persist through time and that equitable sharing of emissions reductions efforts, carbon dioxide removal and adaptation implementation across countries is often insufficiently considered. While these concerns are very important, the type of scenarios discussed in this paper do not address equity and justice explicitly. Their overall goal is to explore the broad, global relationships between the main drivers of climate change and the resulting climate outcomes, covering a wide range of plausible futures and connecting various research communities. ESMs using the scenarios are sensitive to outcomes such as global emission levels and land use, but are not, when considered in a multi-model ensemble, consistently responsive to underlying considerations related to equity and justice, which will strongly affect the regional or sectoral distribution of these outcomes (see Bauer et al., 2020). So far, the multi-model differences in climate due to different regional patterns of land use or emissions of short-lived forcers are still beset with uncertainty (see Sect. 2.2, main text).
While the ScenarioMIP experiments described in this paper refrain from exploring equity and justice assumptions explicitly, they include a regional differentiation of mitigation effort in the first few decades, motivated by plausibility considerations based on the role various parties are currently playing. In addition, there are other features of IAMs that can have implications for equity between regions, societal groups and generations (e.g. Rubiano Rivadeneira and Carton, 2022). For example, the timing of emissions reductions in IAMs is influenced by the assumed discount rate (Emmerling et al., 2019), while also assumptions on mitigation potential can have consequences for the timing and location of mitigation efforts – with possible implications for equity.
The ScenarioMIP climate projections are expected to be used in combination with a range of socio-economic pathways. It is important that questions related to equity and justice are addressed prominently in future research on mitigation and impact analysis (as has been done to some degree in the past). Research on just transitions will complement the work of ScenarioMIP by combining the climate outcomes (directly or based on climate emulators) with a range of socio-economic development and policy information. We strongly recommend that both the mitigation and impact research communities consider a wide range of socio-economic scenarios and policy assumptions that are consistent with equity and justice considerations in their research. This can be seen as a subsequent phase of scenario development - both to inform policy making and assessment.
Another aspect of justice concerns the development process of the ScenarioMIP protocol (IPCC, 2023b). To enhance transparency and inclusiveness, we have expanded the ScenarioMIP scientific steering committee to better represent relevant regions and disciplines. We also established a broader advisory group consisting of over 80 people from different parts of the world. Finally, the proposal, before this paper was submitted, underwent two rounds of review, one of which was public, to gather extensive feedback. A last open review took place as part of the submission to this journal.
2.3 Scenarios
Based on the design principles and interactions with relevant communities, the following scenarios are proposed. Two scenarios populate the high-end of the emission range to explore risks in case the world does very little to combat climate change throughout the century and beyond (in one case) or until the second half of the century (in the second case). The storylines for these scenarios include substantially slowing current observed trends towards rapid expansion of renewable energy. A pair of medium scenarios explore the impact of current policies either remaining at current levels or, after a delay, leading to a pathway towards net zero emissions. On the low side of the spectrum, three scenarios explore the temperature range that has been associated with the Paris climate goals. In the full set, several scenarios explore overshoot dynamics at high and low concentrations levels. This leads to the following proposal (see further details in Sect. 3):
-
High emission scenario: A scenario with emissions as high as judged to be plausible, based on assuming developments that include a rollback of current mitigation policies. This scenario is expected to result in forcings below SSP5-8.5.
High-to-Low emission scenario: A scenario that follows approximately the same emissions pathway as the High, but changes course in the second half of the century, applying strong mitigation measures to reach net zero CO2 emissions by 2100.
-
Medium emission scenario: A middle scenario exploring consequences of extending current policies and trends into the future.
-
Medium-to-Low emission scenario: A scenario exploring a delayed increase in mitigation efforts, short of the Paris temperature goal but achieving net-zero CO2 emissions by the end of the century, with a period of net negative CO2 emissions thereafter to achieve 1.5 °C on a multi-century timescale.
-
Low emission scenario: The Low emission scenario is designed to be consistent with the pursuit of holding warming to a level likely below 2 °C, without returning to 1.5 °C before the end of the century. The scenario is extended beyond 2100 by an emissions trajectory leading to a slow decrease of warming afterwards.
-
Very Low emission scenario: The Very Low emission scenario is designed to keep the temperature level as low as plausible given feasibility constraints. This scenario is thus relevant for the low end of the Paris range (staying as close as plausible to 1.5 °C at the time of peak warming and limiting warming to 1.5 °C by the end of the century).
-
Low-to-Negative emission scenario: The last trajectory is a scenario with a higher overshoot of the 1.5 °C goal, followed by stringent climate policies resulting in net-negative greenhouse gas emissions to return to lower warming levels, thus supporting research into the reversibility of climate outcomes and their impacts.
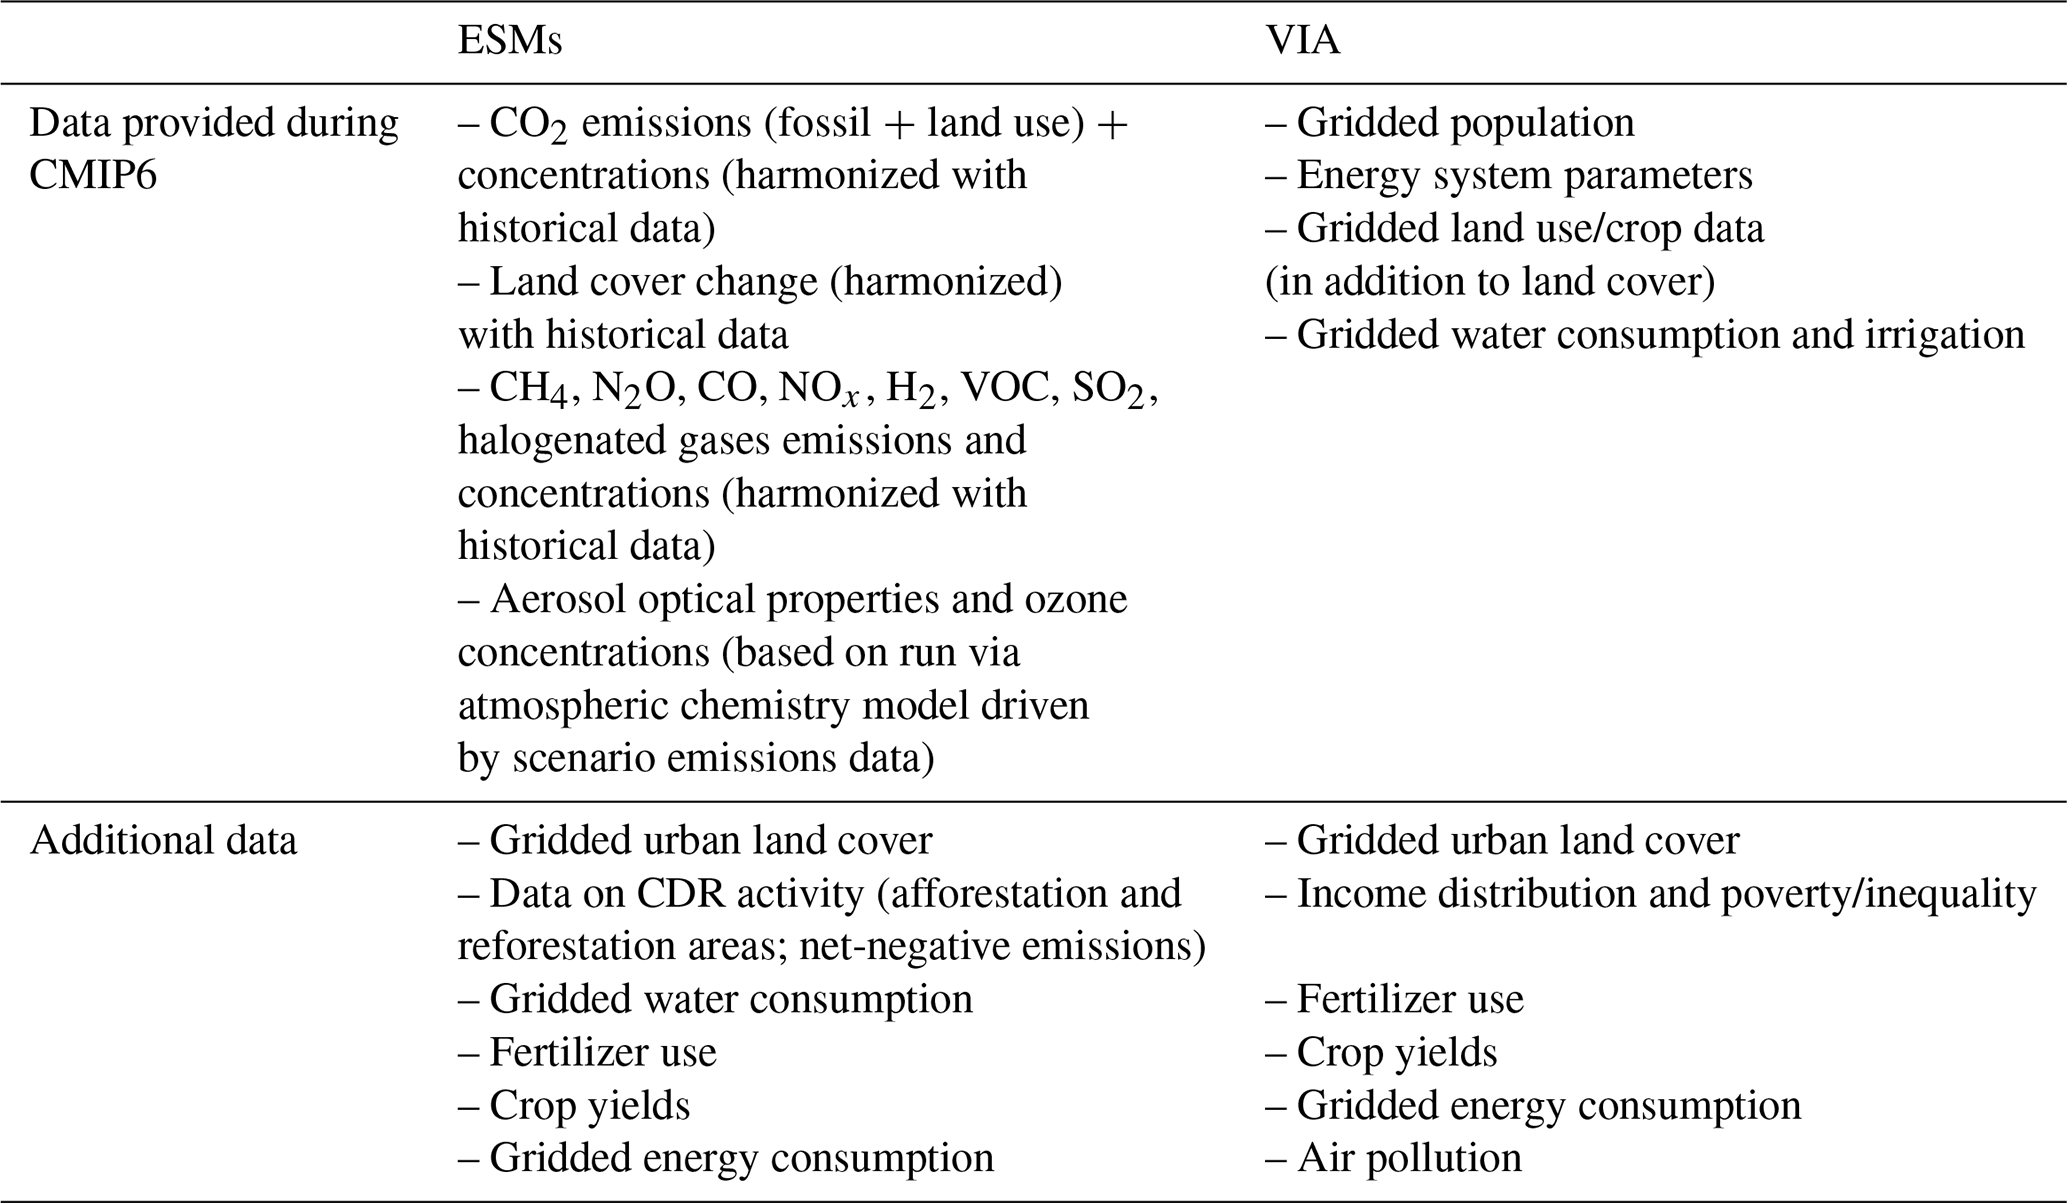
Note that all scenarios are named after emission trends. The global mean temperature associated with these scenarios will be determined by ESM experiments and will form a range of outcomes. The temperature levels discussed above only guide the scenario design and are being assessed during the design phase using SCMs. The overall logic of the current design shares key characteristics with the proposal of Meinshausen et al. (2024). A summary of the scenario definitions is given in Table 1 while Fig. 1 illustrates the potential outcomes, based on preliminary results from IAMs and an SCM. In Sects. 3, 4 and 5 we further explore ideas and considerations relevant to the various scenarios.
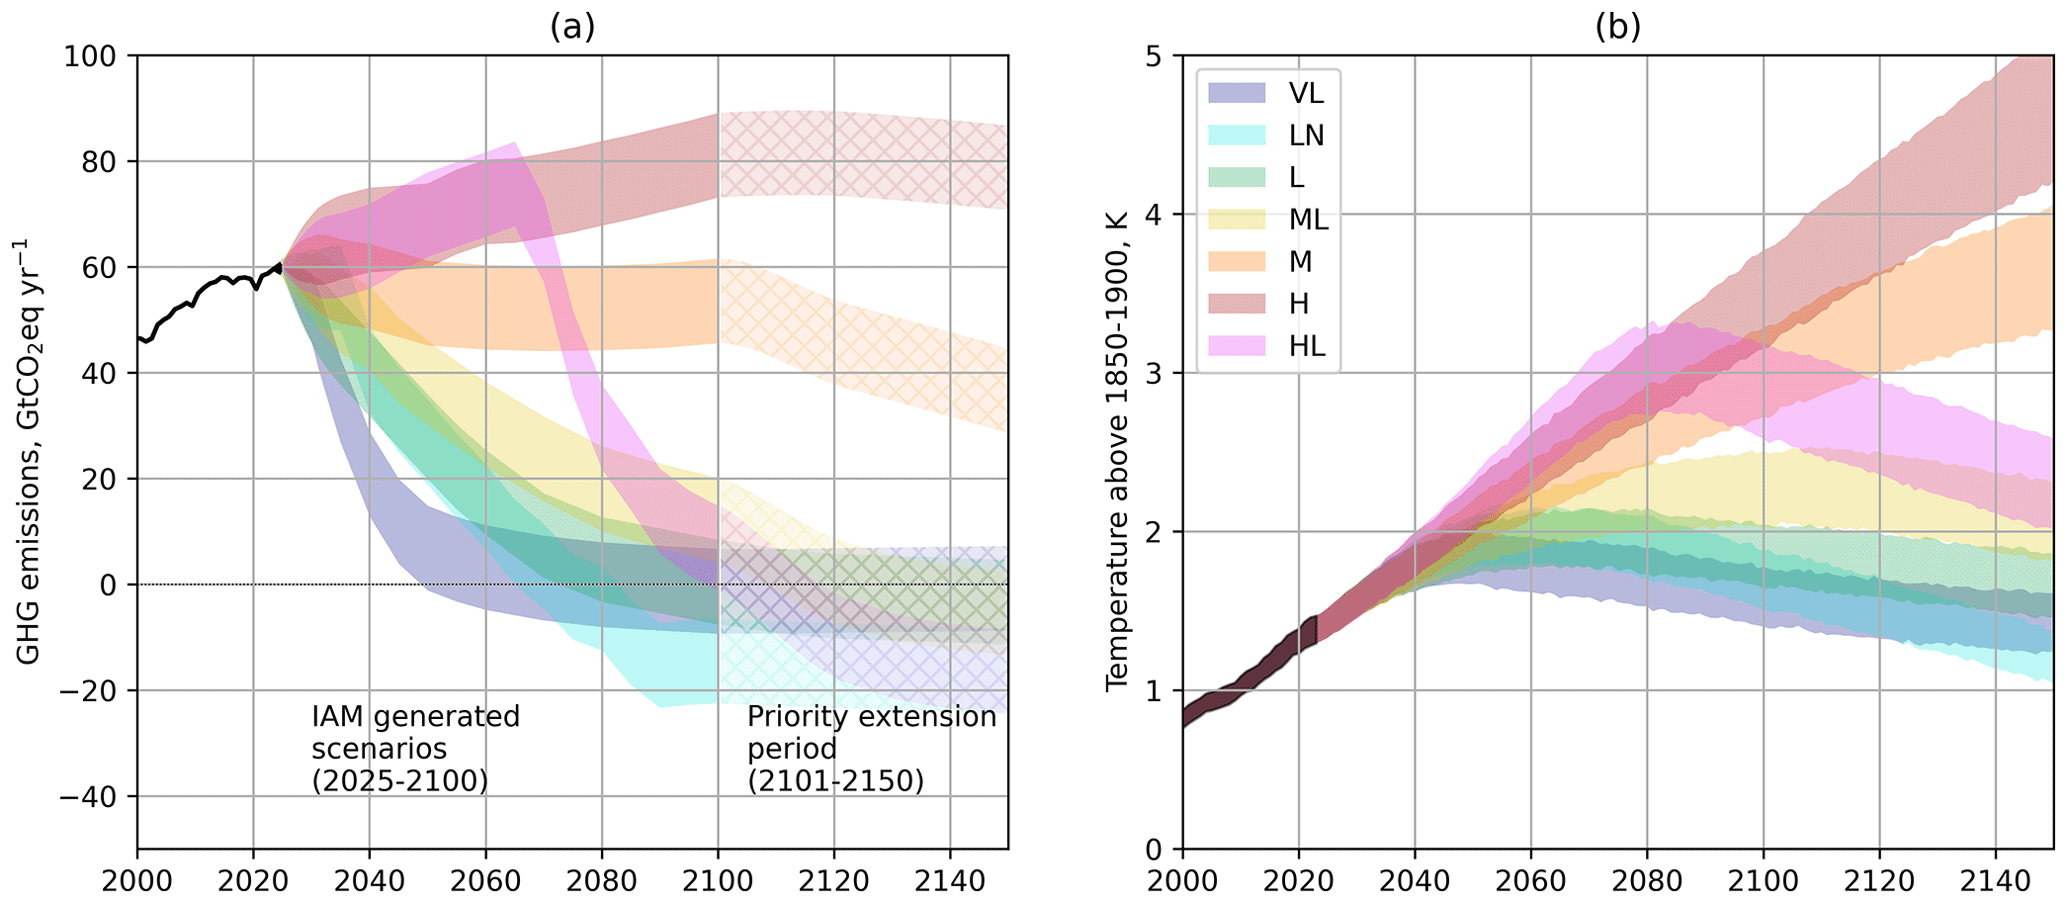
Figure 1Proposed scenarios for CMIP7 ScenarioMIP, showing (a) GHG emissions pathways as a function of time for each of the proposed scenarios (based on GWP-100) and (b) the associated global average temperature outcomes using the probabilistic FaIR ensemble used in IPCC AR6 (Smith, 2025; Smith et al., 2024). The shaded area for emissions shows ±8 GtCO2 around the expected marker scenario value while for temperature outcomes, it shows the 33–67 percentile range of the distribution for the same expected marker scenario. Data for the historical period can be found in Nicholls et al. (2025a). Scenarios are (H) High, (HL) High-to-Low, (M) Medium, (ML) Medium-to-Low, (L) Low, (LN) Low-to-Negative and (VL) Very Low. The final emission trajectories will depend on the finalized IAM runs but are expected to be roughly consistent with the illustrations provided here. The final temperature outcomes will be known only at completion of Earth system models' experiments, and will, for this phase of ScenarioMIP, include also the effects of carbon cycle feedbacks. Models are requested to run the scenarios for the period 2025–2150; the textured regions for the 2100–2150 period (AD) indicate that these emissions and forcings are defined in the extension protocol.
The global average temperature trajectories shown in Fig. 1 were produced using an ensemble of the FaIR simple climate model calibrated during the IPCC Sixth Assessment Report (AR6) (IPCC, 2021). FaIR is a reduced-complexity climate model useful for scenario assessment and idealized climate runs (for a full description (FaIR team, 2025). Data in the figures is available at Zenodo (Sanderson and Smith, 2025). It should be noted, however, that the final emission and forcing data will be produced by IAM model runs that will replace the stylized data shown here. The figures include the first 50 years of the extensions discussed in Sect. 4, since ESMs are requested to run scenarios for the period 2025–2150. The overall set of scenarios covers a plausible range of global emissions in 2100, from around −10 to −20 GtCO2 yr−1 up to levels of about a third greater than today's emissions. It is expected that the temperature results from the scenarios range from around 1.5 to almost 3.5 °C increase in 2100 over the 1850–1900 level.
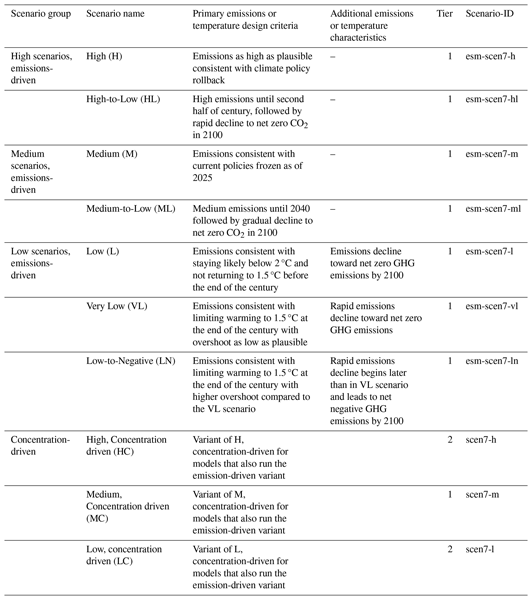
Table 1Scenarios, naming, key design criteria, and their priority (expressed as Tier 1 and 2). These priorities are meant to be for models participating in emission-driven mode. We also request that these groups run, as part of Tier 1, the Medium scenario in concentration driven mode in order to distinguish the effects of the active carbon-cycle on the outcomes. Two more scenarios in concentration driven mode for these models are part of Tier 2. All the scenarios listed here will be provided also as concentrations for models that want to run ScenarioMIP in concentration mode, and for which Tier 1 will include all 7 scenarios. If run concentration driven, the scenario-ID is the current name without the prefix “esm-”.
2.4 Other design issues
2.4.1 Natural forcings (Solar and Volcanic)
The solar forcing recommendations for CMIP7 are provided by the SOLARIS-HEPPA group. The historical forcing reconstruction covers the period up to 31 December 2023, and is extended through 31 December 2024. For future simulations from 1 January 2025, through 2299, the data uses an intermediate scenario from a stochastic ensemble of future solar activity, which is based on a surrogate analysis of cosmogenic isotope datasets. The complete recommendations and dataset construction are described in Funke et al. (2024). The CMIP7 forcing task team has developed a new historical reconstruction for stratospheric aerosol optical properties and volcanic sulfur emissions covering the period from January 1750 to December 2023 (Aubry et al., 2025). The future volcanic forcing will involve a 9-year linear ramp-up from the historical values at the end of 2023 to a new background level. This background is defined as the mean stratospheric aerosol optical depth (SAOD) calculated over the 1850–2021 period (a value that results to be higher than the average between 2000 and 2020, a relatively quiescent volcanic eruption period). The SAOD will ramp up until 2033 and then hold steady at this piControl climatological value for the remainder of the future simulations. Notably, the major eruption of Hunga Tonga-Hunga Ha'apai in 2022 is deliberately excluded from the future forcing scenarios to avoid its large and anomalous cooling signal from complicating the analysis of the anthropogenic warming signal in the scenario runs. Full details of the methodology and dataset are forthcoming (Aubry et al., 2025).
2.4.2 Air pollution control
All scenarios include air pollution representation (Short Lived Climate Forcers (SLCFs), among which aerosols including sulfur, black carbon (BC) and organic carbon (OC) emissions) and assumptions related to air quality measures. The effects of air quality measures on global radiative forcing can be significant (Skeie et al., 2024). Despite lack of agreement among different ESMs over the response of regional climate to aerosol forcings, and a low signal to noise ratio of these responses, aerosol emissions have been observed to shape regional climate and will be one of the major drivers to influence climate change in coming decades (Persad et al., 2022). In the low scenarios, sulfur and aerosol emissions will be low as a result of the reduction in fossil fuel use. For the higher GHG emission scenarios, the emissions of air pollutants are also strongly influenced by specific air pollution control policies (as observed in many regions historically). In the High and High-to-low scenarios, the levels of air pollution control vary consistent with underlying assumptions on socio-economic development. Alternative scenarios could be run in AerChemMIP and RAMIP (Wilcox et al., 2023)
2.4.3 Ensembles
Recommendations on the use and size of initial condition ensembles are particularly relevant at the low end of the scenario range where the emergence of a climate signal relative to other low scenarios is expected to require relatively larger ensembles but are also important to enable sampling of longer return period events (rarer events) at all levels of forcing. For CMIP7, we encourage running ensembles of at least 5 members or more for each scenario ideally, to quantify the role of initial condition/internal variability uncertainty in scenario outcomes. The three low scenarios could be prioritized forthe creation of ensembles, depending on modeling centers' capacities. Sufficient representation of natural variability is decisive to inform climate risk assessments and adaptation decisions (Lehner and Deser, 2023; Pfleiderer et al., 2025).
2.4.4 IAM model runs
Based on the mostly qualitative formulation of the seven scenarios in this document, ScenarioMIP asked the IAM community to provide a database of alternative (i.e., ideally more than one) quantitative interpretations of each of the scenarios (see also Box 3). The Scenario Working Group of IAMC organized the planning, development, and vetting of the emissions and land use scenarios, including the selection of single “marker” implementations of each scenario for provision to ESMs. This process and its results were nearly finished at the time of the final publication of this protocol and will be documented in further publications. The final set of IAM scenarios is fully consistent with the scenarios described in this paper. The full database of alternative scenarios will provide a basis for the broader IAM community to explore variants that alter key parameters, such as underlying socio-economic assumptions, climate policy and equity considerations and CDR use. These variants could also explore the implications of climate change impacts for the scenarios (see below under “Impacts and adaptation” for a discussion of this particular issue). Additional quantifications from models beyond those doing the initial quantification is strongly encouraged.
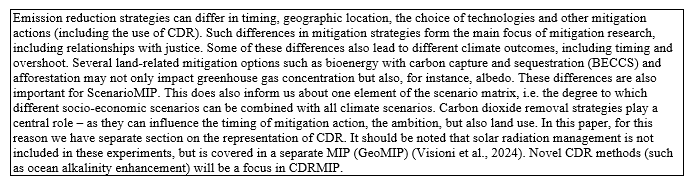
Emission reduction strategies can differ in timing, geographic location, the choice of technologies and other mitigation actions (including the use of CDR). Such differences in mitigation strategies form the main focus of mitigation research, including relationships with justice. Some of these differences also lead to different climate outcomes, including timing and overshoot. Several land-related mitigation options such as bioenergy with carbon capture and sequestration (BECCS) and afforestation may not only impact greenhouse gas concentration but also, for instance, albedo. These differences are also important for ScenarioMIP. This does also inform us about one element of the scenario matrix, i.e. the degree to which different socio-economic scenarios can be combined with all climate scenarios. Carbon dioxide removal strategies play a central role – as they can influence the timing of mitigation action, the ambition, but also land use. In this paper, for this reason we have a separate section on the representation of CDR. It should be noted that solar radiation management is not included in these experiments, but is covered in a separate MIP (GeoMIP) (Visioni et al., 2024). Novel CDR methods (such as ocean alkalinity enhancement) will be a focus in CDRMIP.
2.4.5 Impacts and adaptation
ScenarioMIP requests that the IAM teams produce simulations that do not include climate change impacts on society or ecosystems (e.g. on agriculture, energy use, economic growth, or biodiversity). There are two main reasons for this. First, one of the main uses of the scenarios and their climate outcomes is to drive impacts estimation by the impact modeling community, which uses both the climate projections and the direct human drivers (such as land use and agricultural systems changes) as input to their analyses. If the IAM scenarios (and therefore the climate projections based on them) already include impacts, further impact modeling based on these scenarios would lead to double counting. Second, IAMs currently do not represent a full range of potential impacts and generally lack the required detail needed to represent many regional impacted systems and adaptation strategies. Including impacts in the IAM scenarios would therefore only provide a partial and somewhat arbitrary accounting of potential climate effects. The IAM and ESM scenarios are therefore not intended to provide complete pictures of potential future worlds. Rather, they must be augmented by impact and adaptation studies that complete that picture so that it includes climate shifts, mitigation, impacts, adaptation, and development. At the same time, demand for fully consistent scenarios is growing. It is, therefore, encouraged that IAM developers undertake research projects to produce additional scenarios in which impacts are accounted for. This work may also lead to different scenario protocols for future ScenarioMIP exercises.
2.4.6 Modeling assumptions
The modeling paradigms and assumptions underlying IAM implementations relate to questions of socio-economic development, technological progress, mitigation preferences and climate justice. Exploring the implications of these assumptions, and alternative implementations, is of critical importance to provide policy relevant science to inform the deliberations on mitigation efforts and their regional distribution. These important questions, however, are outside the scope of ScenarioMIP, which is an exercise of CMIP that is focused on providing scenario forcing data for ESMs (see Box 2). The use of IAMs within ScenarioMIP is limited to providing emissions and land use forcing time series that allow for the exploration of different global climate futures. An exploration of alternative implementations of the ScenarioMIP scenario narratives using different modeling paradigms and normative assumptions is explicitly encouraged. Meanwhile, our working assumptions, from a climate modeling perspective, are that the regional distribution of carbon emissions do not matter to ESM outcomes, having long been characterized by their “well-mixed” nature, and therefore do not produce regional responses linked to the location of the sources of emissions. Regional distributions of land use, aerosols and other localized forcers have been shown to produce local responses that are, for now, model dependent and result in non-robust patterns of climatic changes in a multi-model context, such as CMIP-type ensemble experiments (Westervelt et al., 2020; Tebaldi et al., 2023).
2.4.7 The role of complex climate models vs emulators
Some further exploration is needed of the role of different tools at different levels of the modeling hierarchy, especially ESMs vs emulators of climate model output. By emulators we refer to computationally efficient tools that, when driven by a scenario, are able to provide impact-relevant variables akin to climate model output in spatial resolution and time frequency, bypassing the need to run ESMs. Emulators need to critically rely on available ESM ensembles over a wide range of scenarios for training. Their use can be attractive both to fill gaps in the design and to accelerate the uptake of some of the outcomes of new scenarios by the wider research community. Thus, it is useful to consider how emulators can further reduce the computational load on complex climate models for scenario exercises and the expectation is that, given the rapid developments in the emulation space of the last few years, especially with the deployment of machine learning and more broadly AI climate models, the use of emulators to augment or even substitute for ESM output may become more feasible in the not-so-distant future (Eyring et al., 2024). As of now, however, no emulator can address the provision of all outputs from an ESM and for all types of scenarios. High frequency (e.g. daily) output, jointly simulated variables (respecting correlations between them), and more generally variables other than average temperature and precipitation still present a challenge to emulators. In the scenario space, overshoot/peak-and decline scenarios (intended here as temperature trajectories that exceed a global warming level of interest for a limited time and later experience a decline, due to declining GHG concentrations including from negative emissions) constitute particularly open questions, given the scarcity of this type of scenario simulation by ESMs on which emulators could be trained. The ScenarioMIP protocol therefore requests all scenarios to be run using ESMs. However, we expect emulator to be useful in filling the scenario space. Emulators may also be useful to boost ensembles sizes of existing ESM simulations.
2.4.8 Input variables for ESMs and impact models
ScenarioMIP will provide data as external forcing for Earth system model simulations and additional information on socio-economic development and related parameters for the Impacts, Adaptation and Vulnerability research community. Table 2 illustrates what type of data could be made available, although further parameters may also be provided. We note here that some variables, such as gridded population and urban land cover, are the result of dedicated efforts by the larger research community, rather than being a byproduct of IAM simulations.
Table 2Input data for Earth System Model (ESMs) and Vulnerability, Impact and Adaptation (VIA) research communities (illustrative list).
Further, the CMIP7 Forcings Task Team is in place to address some of these issues (required forcing input files, harmonization) and coordinate the provision of ESM forcings through the input4mips effort. This includes, for instance, harmonization of historical emission data and provision of consistent gridded land use data.
2.4.9 Consistency with earlier scenario sets
In CMIP6, one of the scenario design's stated goals was to facilitate comparison with CMIP5 and some studies were published that quantified the relative contribution of different scenario composition versus different models to the changes in temperature range under comparable global radiative forcing pathways. However, we believe that for the study of consistencies and differences due to model development, the experiments prescribed as part of CMIP's Diagnostics, Evaluation and Characterization of Klima (DECK) are more suitable. Therefore, no design choice was added to produce global forcings comparable to CMIP6 scenarios.
2.5 Timeline
One of the goals of ScenarioMIP is to produce scenarios that can be useful to the 7th Assessment Report of IPCC. This means that studies forming the basis of the assessment and relying on the new scenarios outcomes need to start appearing in the peer-reviewed literature in the 2026–2027 time-frame. We recognize that although the IPCC and CMIP7 timelines will facilitate a rigorous assessment of CMIP7 simulations by Working Group I, the research time available for the vulnerability, impacts and adaptation (VIA) research using CMIP7 data is quite constrained. Therefore, several of the IAM scenarios based on this proposal and the subsequent data steps to create input data for ESMs are intended to be completed around the end of 2025/early 2026, so that the climate model simulations can start early in 2026. This should allow for some of the ESM experiments based on the Tier1 scenarios to start becoming available in mid-2026.
The ScenarioMIP scenarios are elaborated using IAMs. As indicated in Table 2, the key output data for ESM model runs include emissions of CO2, non-CO2 greenhouse gases and air pollutants and land use. Subsequently, the emission data is harmonized with historical data (Nicholls et al., 2025a) (following similar methods as used in CMIP6 (Gidden et al., 2019)). The output is run through simple climate models and an atmospheric chemistry model to provide concentration data for ESM that need such input. For land use, the data is harmonised to a historical data set, again following a procedure similar to CMIP6, but now also including additional information for CDR (see Sect. 5) (Hurtt et al., 2020). Below, further guidance is given to the elaboration of the individual scenarios and their role in the overall set.
3.1 Design of the High emission scenario (H)
The High emission scenario explores a future world that weakens or even abandons mitigation actions and policies – in combination with other development trends that could lead to high emissions. A scenario exploring the high-end of the plausibility range is important for addressing questions such as: what are the impacts associated with a scenario in which climate mitigation policy largely fails? What is the risk of reaching potential tipping points in the Earth system at a relatively high level of future warming? What do extreme events look like at such warming levels? And how far beyond current conditions are known adaptation measures viable?
The scenario is based on trends that may not be the most likely (based on a current assessment), but that are still plausible (see Box 1). These trends can be characterized as policy roll-back, lack of cooperation in addressing global environmental concerns, increased interest in fossil fuel resources, adoption of resource- and energy-intensive technologies and lifestyles and lack of development in low-emission technology. Clearly, this scenario is not a “business-as-usual” scenario nor the no-policy reference scenario for the other scenarios. The scenario is intended to explore the upper end of GHG emissions resulting from deep political, technological, and structural deviation from current trends. The are various reasons why such a scenario could emerge. For instance, a rollback of climate policies could result from a lack of public support for the energy transition. This could be related to, for instance, local opposition to building new wind farms or concerns about impacts on fossil industries related to jobs and national energy security. Also, the rapid cost decrease in renewable energy of the past decade could be discontinued, possibly as a result of regional scarcity and limited tradability in materials for solar and wind technologies and EV batteries (IEA, 2021; Schlichenmaier and Naegler, 2022).
In terms of socio-economic development, a High-emission scenario could be consistent with a range of pathways, including high economic growth scenarios (e.g. SSP5) and regional competition scenarios (such as SSP3). In the development process for CMIP7, IAM teams have explored several possibilities, showing that the emissions associated with SSP3 and SSP5 based variants could be reasonably similar, with SSP5 often being slightly above SSP3 scenarios. The high challenges to adaptation in SSP3 would make these variants more interesting from an impact perspective. In SSP3-based High scenario, resurgent nationalism, concerns about competitiveness and security, and regional conflicts push countries to increasingly focus on domestic or regional issues. Policies shift to becoming increasingly oriented toward national and regional security issues, including barriers to trade. A low international priority for addressing climate concerns leads to a collapse of international and national climate policies. This means that the SSP3 variant was preferred to the High emission scenario. For the High-to-Low marker scenario (discussed below), instead the SSP5 scenario was used as the SSP5 storyline is more amendable to a shift in policy trends. However, the exercise demonstrates that multiple development pathways can lead to high emissions. It is important to realize that the climate outcomes resulting from the High scenarios can still be combined with different socio-economic development pathways.
The High emission scenario, by design, does not include climate impacts (Sect. 2). This implies that the judgment of plausibility of this scenario is conditional on this assumption. Another plausibility question relates to the volume of fossil fuel reserves and resources. Clearly, the cumulative amount of fossil fuel use in the High emission scenario is considerably larger than the estimated total reserves (known deposits that are extractable at current prices and technologies) (Bauer et al., 2016; Rogner, 1997). However, it is also considerably lower than total resources estimates (estimates of undiscovered deposits and/or those not recoverable at current prices) meaning that future technologies and price trends could make the resource trend possible.
3.2 Design of the High-to-Low emission scenario (HL)
The High-to-Low scenario represents a global emission trend that is similar to the High scenario up to the middle of the century, but that is followed by a deep reduction towards net zero CO2 by 2100. Such a trend could result from climate policy based on observed impacts. The scenario can address questions like: What would the climate consequences be of substantially delayed mitigation after following a high emissions pathway? And, assuming that emissions of CO2 become net negative beyond 2100 (which is part of the scenario extensions design, see Sect. 4), how large of a temperature overshoot might this lead to, and what would its consequences be for natural, managed, and human systems?
This scenario has similar considerations as the High scenario regarding the socio-economic pathway that could lead to high emissions and, in addition, must consider what type of pathway would also produce the capacity for rapid mitigation late in the century. The SSP5 pathway could provide a consistent story as it assumes rapid technological development and high economic growth. Based on this, the scenario would assume little effort to avoid global environmental concerns up to the second half of this century; after that, increased concerns and technology development may lead to deep reductions. The high technological capacity for mitigation in this scenario, combined with strong international institutions that can support coordinated action, fosters rapid reductions to net zero CO2 emissions by the end of the century.
3.3 Design of the Medium emission scenario (M)
The Medium emission scenario is a benchmark that shows the consequences of the current policy situation (as of 2025) and trends continuing over the century. In the scenario, it is assumed that policy effort is continued at the current level. As for other scenarios, also this scenario should not be considered as a “most likely” scenario. It can be used to address questions such as: what future physical, socio-economic, and ecological risks are implied by current levels of climate change policy (Roelfsema et al., 2020; Rogelj et al., 2023)? When comparing lower scenarios, what are the relative benefits and costs of taking further mitigation actions? What are the needs for adaptation implied by current policy levels? What are limits to adaptation if mitigation actions are not strengthened?
A key assumption in the Medium scenario is that only policies are considered that are actually officially being implemented, similar to current policies scenarios in the literature (Roelfsema et al., 2020). The scenario does not include future policy goals if not backed up (yet) by actual policy. This means that also the pledges of the Nationally Determined Contributions (NDC) and the net zero announcements are not included, if not backed up by explicit policies. As a result, the Medium scenario does not meet the aggregated NDCs expressed for 2030, as current policies are less ambitious.
In determining the impact of current policies, we assume that they stay in place during the announced period. For the period beyond this, the IAM community has developed several methods to extend current policies (typically beyond 2030) (van Soest et al., 2021). Here, it is assumed that current policies stay in place, while no new policies are accounted for. This does provide a clearer baseline against which the effect of new long-term policies can be evaluated in future studies. The scenario can be seen as an updated version of the reasoning from the “CurPol” scenario assumptions used in Working Group III of IPCC AR6 (IPCC, 2022a).
The marker implementation of this scenario is based on SSP2, with its middle of the road assumptions about socio-economic development. However, it would be interesting to explore these scenarios under a wider set of socio-economic assumptions. While we assume that climate policies remain at current levels, other policy areas could still develop. In addition, underlying technology assumptions are allowed to evolve, and the sensitivity of results to these assumptions should be assessed.
3.4 Design of the Medium to Low emission scenario (ML)
The Medium to Low emission scenario (see Fig. 1) describes a future in which strengthened mitigation efforts are delayed, falling short of the levels required to meet the objectives of the Paris Agreement. As such, the scenario can be used to explore the impacts of temperature levels between the Medium and Low scenarios. Moreover, after 2100 AD, when the scenario's extension transitions to net negative CO2 emissions, the scenario explores an overshoot trajectory to assess the possibly related impacts, The underlying logic of the scenario is that political constraints limit rapid near-term action; however, these lessen over time as the magnitude of observed climate impacts increases and mitigation costs decline with technological progress. As a result, the scenario is expected to reach peak warming and net-zero CO2 emissions at approximately the end of the century, with modest levels of net-negative CO2 emissions thereafter aiming at the 1.5 °C level on a multi-century time scale. It is based on the same socio-economic development pathway assumed for the Medium scenario. In terms of underlying socio-economic development, multiple SSPs could be possible. In the elaboration of the IAMs, SSP2 was mostly used.
3.5 Design of the Low emission scenario (L)
The Low, Very Low and Low-to-Negative emission scenarios are all aimed to explore relevant trajectories in the context of the Paris Agreement. In all three scenarios, emissions are reduced rapidly, but with different levels of ambition and with different timing. Specifically, in the Low scenario, the aim is to stay likely (>66 % probability) below 2 °C at all times, comparable to the C3 category of IPCC AR6 WGIII (Kikstra et al., 2022; Riahi et al., 2022). Questions related to this scenario are the associated climate impacts (vis-à-vis scenario with higher emissions, but also those with even lower emissions), as well as the required emission reduction measures.
In 2030, the emissions of the Low emission scenario will be similar to the current emission pledges as captured by the NDCs for 2030 (thus going beyond current policies). After that, emissions are projected to be reduced further and reach net-zero CO2 emissions around 2070. Before 2070, some carbon dioxide removal (CDR) use might offset hard-to-abate emissions. After 2070, emissions reductions continue, reaching net-zero GHG emissions before 2100 and staying at approximately that level in the long term. This design helps to better understand the long-term climate implications of sustained net-zero GHG emissions.
To conform with the design specifications and plausibility criteria for short-term developments in 2030, carbon prices need to be regionally differentiated in 2030 (leading to higher taxes in high-income countries). After 2030, regional carbon prices should converge until they reach a globally uniform level in 2070. The exact elaboration is described further in the IAM papers related to ScenarioMIP.
3.6 Design of the Very Low emission scenario (VL)
At this point of time, some overshoot of the 1.5 °C seems unavoidable (Reisinger et al., 2025.) The Very Low (VL) emission scenario is designed to keep climate change at the time of peak warming are as low as can still be plausibly achieved (see Box 1 on plausibility) and to return warming below 1.5 °C by the end of the century. Key questions therefore are to what level can an overshoot be constrained and how fast can warming be reduced after it peaks? As for other scenarios, the actual temperature trajectory will be determined by the ESM model runs.
Critical design elements of the VL scenario are reducing CO2 emissions rapidly and deeply and reaching net-zero CO2 emissions as quickly as possible. Also, non-CO2 emissions are reduced deeply, including rapid CH4 emissions reductions in the near-term to limit peak warming levels as much as plausible. After the point of net-zero CO2 emissions, the pathway is designed to transition to sustained net-negative CO2 emissions to increase the likelihood of limiting warming to 1.5 °C in the second half of the century as computed by SCMs. The scenario also considers other Sustainable Development Goals (SDGs), such as protecting biodiversity. The scenario also has ambitious assumptions about air pollution controls. This is not to say that consideration of SDGs is unimportant in other scenarios, but that they may be of particular concern in the VL scenario, also given the possible concerns related to rapid emissions reduction in relation to development goals. IAM teams are strongly encouraged to explore this further in subsequent research on VL-type scenarios.
The VL scenario includes a range of measures and underlying trends leading to rapid emissions reductions, based on plausible assumptions about the underlying pace of the system transformations (see e.g. Brutschin et al., 2021), general characteristics of low-carbon technology innovation (Odenweller et al., 2022; Wilson et al., 2020) and the dynamics of sociotechnical innovation (Jewell and Cherp, 2023). An important contribution to such very low emission pathway can also be formed by a shift towards low greenhouse gas emitting diets (e.g. the Lancet Planetary diet) (Willett et al., 2019; Stehfest et al., 2009; Beier et al., 2025). Rapid emission reductions also limit the deployment of CDR in the VL scenario compared to the Low-to-Negative, LN scenario discussed in the next Section.
Plausibility considerations play an important role in the VL scenario. In the short-term (up to 2030), it should include ambitious but realistic reductions, also to make sure that the scenario can still represent a viable policy future in 2028-30 when the scenarios are assessed and used. Concretely, IAM teams were asked to make an assessment of “as low as plausible”, based on considerations with regard to how fast current technology and policy trends/constraints could change until 2030 taking into account stated policy objectives up to 2030 (including commitments beyond NDCs such as the Renewable Energy and Energy Efficiency pledge, the deforestation pledge, the Global Methane Pledge, etc.). After 2030, the assumption is that policies can be sped up to limit peak warming and reach the long-term climate target of limiting warming to below 1.5 °C. This ambition is bounded by considerations of techno-economic feasibility of low carbon technology deployment and, where relevant, sustainable development goals.
A range of emissions abatement measures (not exhaustive) are included in the VL scenario to reduce emissions: (1) reduction in final energy demand, (2) rapid decarbonization of electricity supply (as measured by carbon intensity of electricity based on gross CO2 emissions), (3) deep electrification of industry, transport and buildings, (4) deep decarbonization of residual non-electric fuel mix in industry, transport and buildings, (5) widespread behavioral changes in diet, transportation and consumption, (6) deep reduction of industrial process emissions, including also reducing fluorinated greenhouse gases in line with the Kigali amendment, (7) deep reduction of non-CO2 gases, in particular methane, (8) elimination of net CO2 emissions from land use and rapid deployment of land-based CDR measures (within sustainability limits) to move to net-negative CO2 emissions from land use in the medium to long term, and (9) deployment of CDR measures assuming plausible deployment rates, as well as keeping geological storage (or storage in materials) within technological and sustainability limits. Similar to the Low emission scenario, also this scenario is run with differentiated carbon prices. The suggested convergence year, however, is 2050.
A number of particularly relevant scenario dimensions for ESMs were identified that could be explored in variants of the VL scenario in the future including: (1) land use and afforestation/reforestation policy, (2) land- and ocean-based CDR strategies, and (3) regionally defined renewable energy production. Future coupling on these dimensions between IAMs and ESMs (beyond this ScenarioMIP round) could permit improved linkages in research.
3.7 Design of the Low-to-Negative emission scenario (LN)
While the VL scenario aims to limit the overshoot of the 1.5 °C warming level, an alternative pathway would include more overshoot. Looking into scenarios with more substantial overshoot and compare them with less overshoot is certainly relevant, also considering that as of today, global fossil-fuel related greenhouse gas emissions continue to rise (Friedlingstein et al., 2025). There are several key questions related to a scenario that aims to achieve the 1.5 °C target, but with more overshoot. The first is related to how reversible the climate system is (or whether a lot of hysteresis occurs). This provides information on the viability of such an approach. Second, the scenario can facilitate the assessment of the impacts of a larger temperature overshoot, compared to the more limited overshoot. This includes understanding the benefits, costs, and trade-offs of achieving declining temperatures in the long term. This means that the scenario can be used to gain a better understanding of the near- and long-term consequences of delaying emission reductions. This will help inform ongoing policy discussions around plausibility and implications of overshoot resulting from delayed actions.
There are several considerations regarding the design of the Low-to-Negative (LN) scenario. First, the scenario should be based on plausible levels of CDR. To compensate for the overshoot, this pathway has much higher CDR levels than the Very Low (VL) scenario, but this needs to be within the assessed plausible range in the literature. Second, the emission trajectories and scenario temperature outcome of the Low-to-Negative scenario is still targeted to be consistent with the Paris climate objectives (thus limiting warming overshoot to well-below 2 °C). Third, the scenario needs to be sufficiently different from other scenarios in ScenarioMIP, in terms of resolving differences between ESM runs. Such differences include the timing of the CO2 emission profile and differences in emissions of short-lived climate forcers. Earlier, for CMIP6, a separation of 0.25–0.3 °C was proposed (Tebaldi et al., 2015); in the current set, this difference might be somewhat smaller. As we suggest in Section 6, it would be useful to explore whether a smaller separation would still produce distinguishable outcomes in ESMs (McKenna et al., 2021) also given the use of emission-driven scenarios (McKenna et al., 2021). The Very Low and Low-to-Negative (LN) scenarios differ along dimensions in addition to peak warming, including policies targeting methane and those related to land use. The VL scenario also includes a sustainable land future in line with the SDG narrative, including reduced pressure from agricultural land and considering environmental constraints. In contrast, the LN scenario has very large scale and rapid upscaling of CDR in order to reduce warming after its higher peak. Finally, also this scenario is run with differentiated carbon prices (like the other mitigation scenarios). The suggested convergence year is 2070.
Several climate science research communities expressed the desire to consider a set of scenario extensions going beyond the 21st century. The purpose of these extensions is twofold: to explore the long-term Earth System dynamics in response to warming at different stabilized levels, including the risk of breaching tipping points and triggering large scale irreversible changes, and also to explore reversibility of the system under different long term net-negative emissions pathways, exploring overshoots from different peak warming levels and different target long term climate states.
Table 3Main characteristics of the scenario extensions.
Note: All dates mentioned in the Table refer to AD.
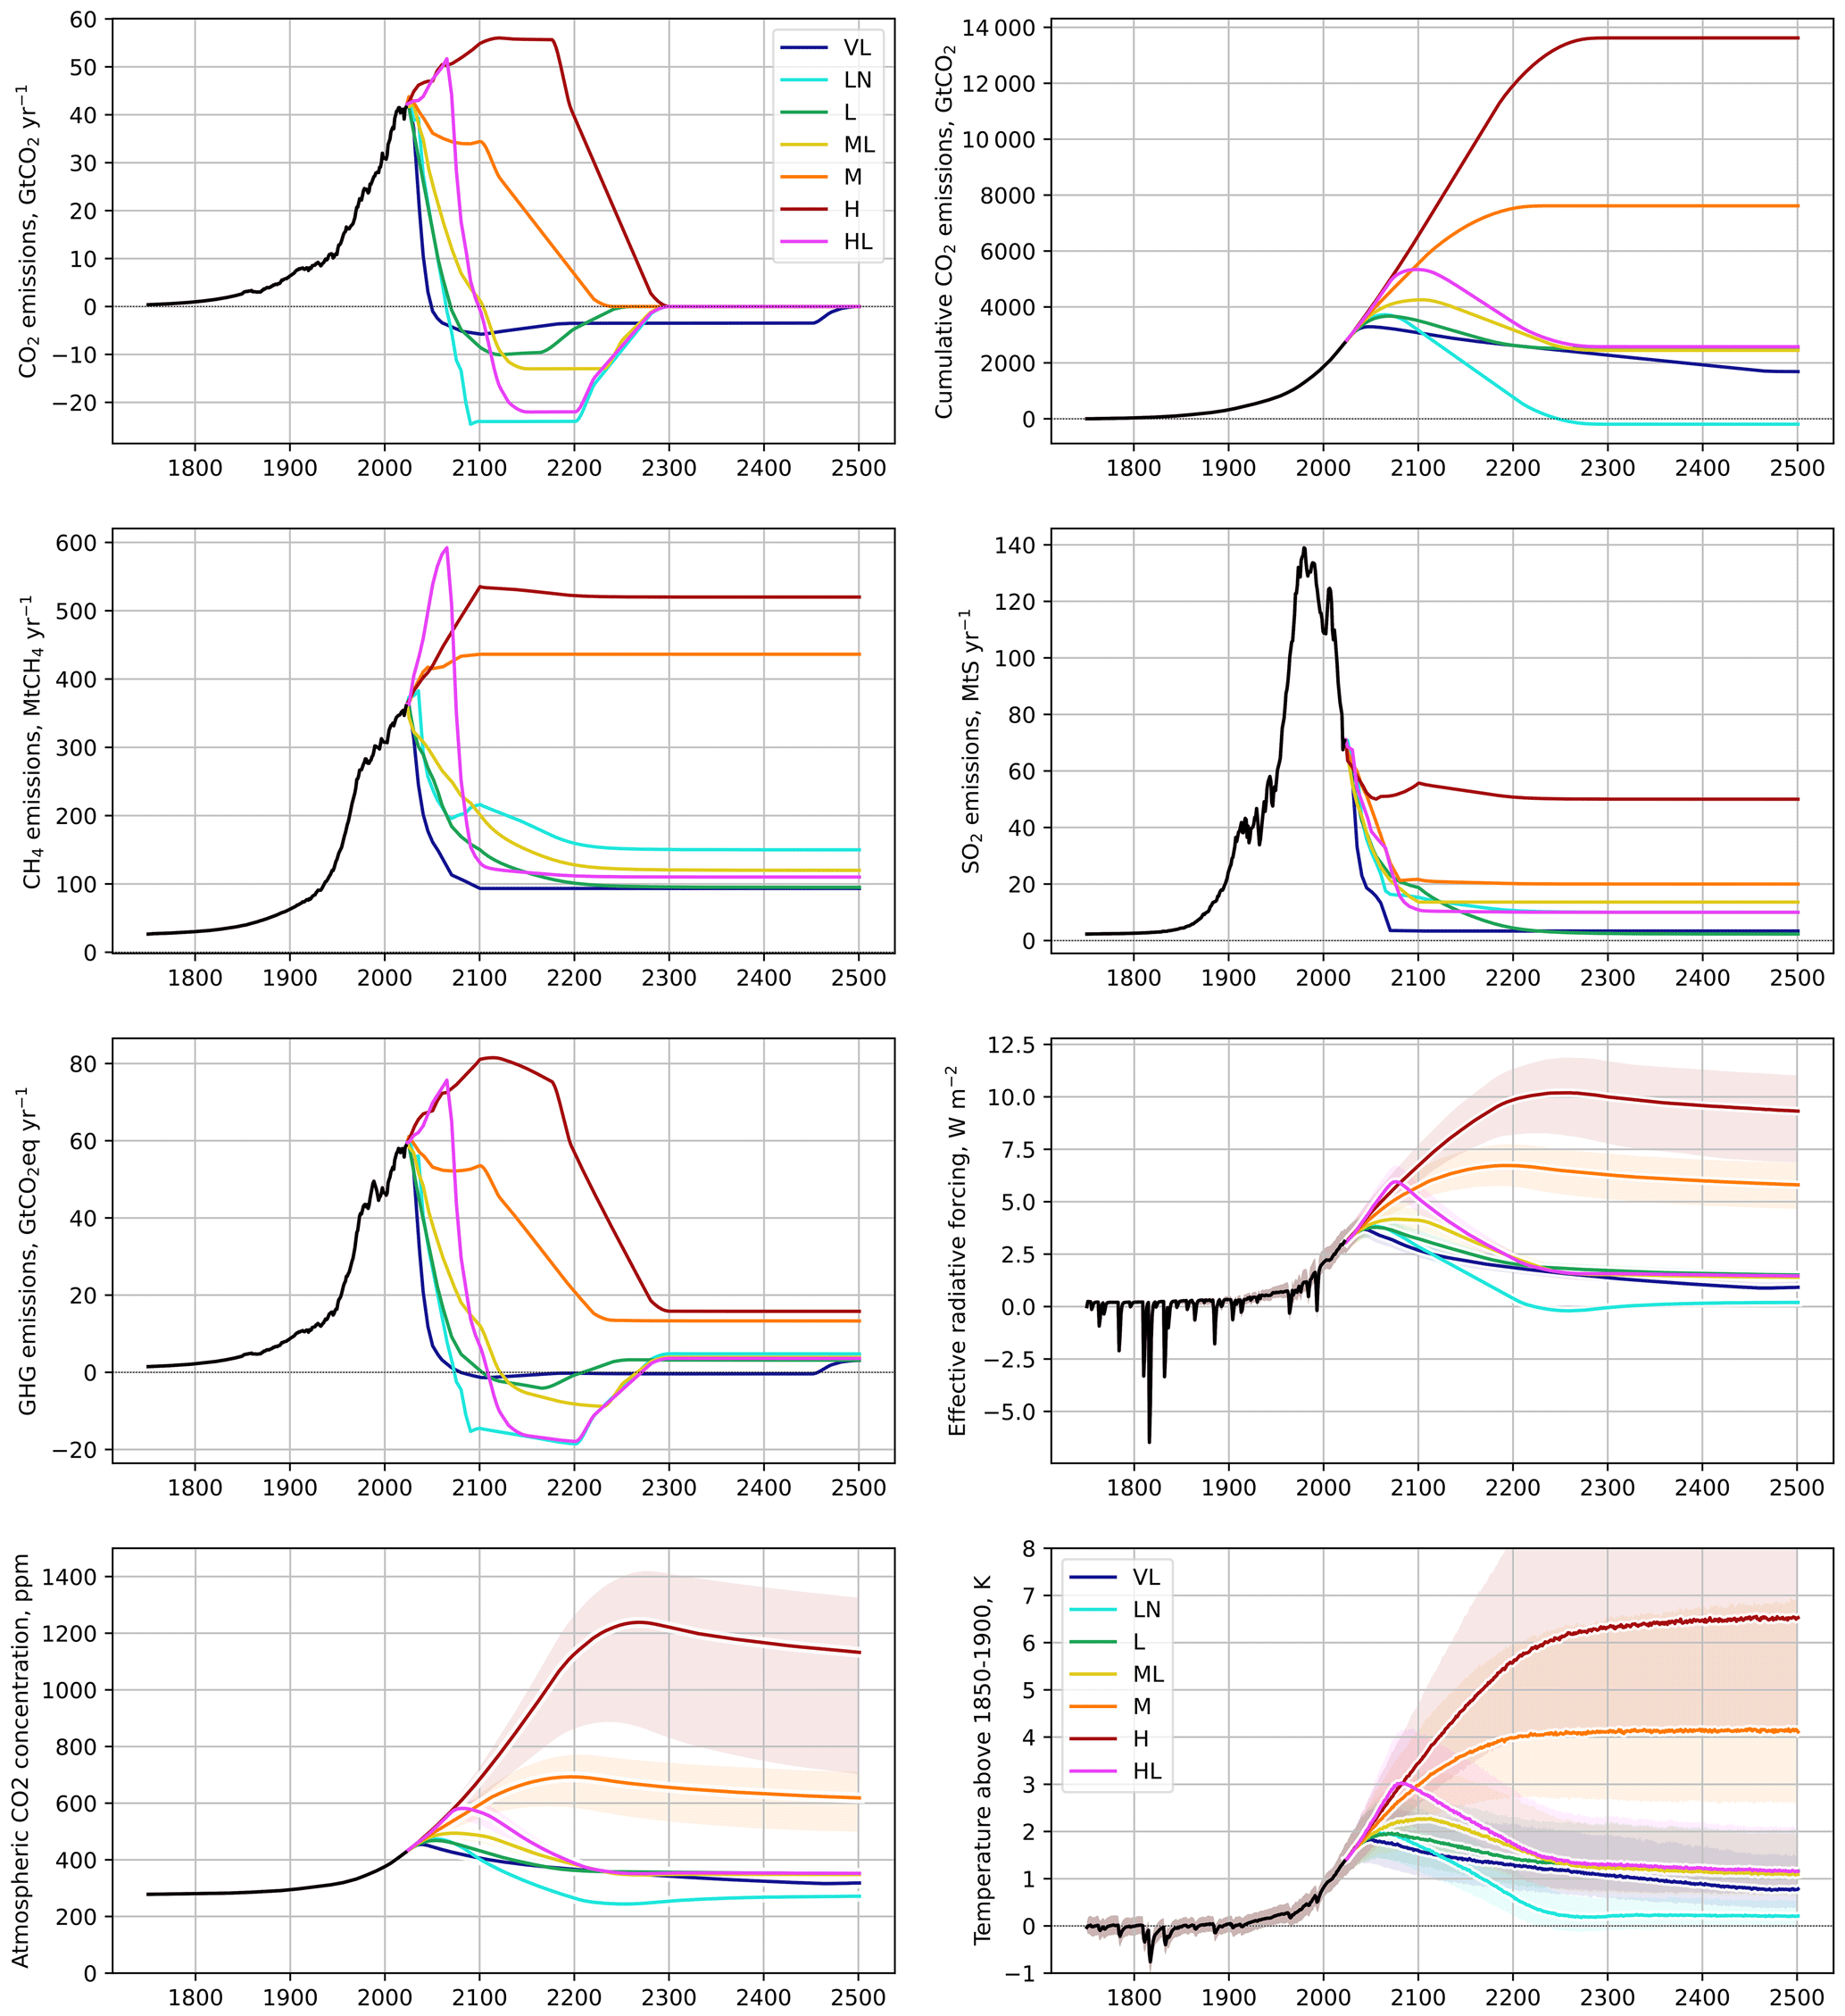
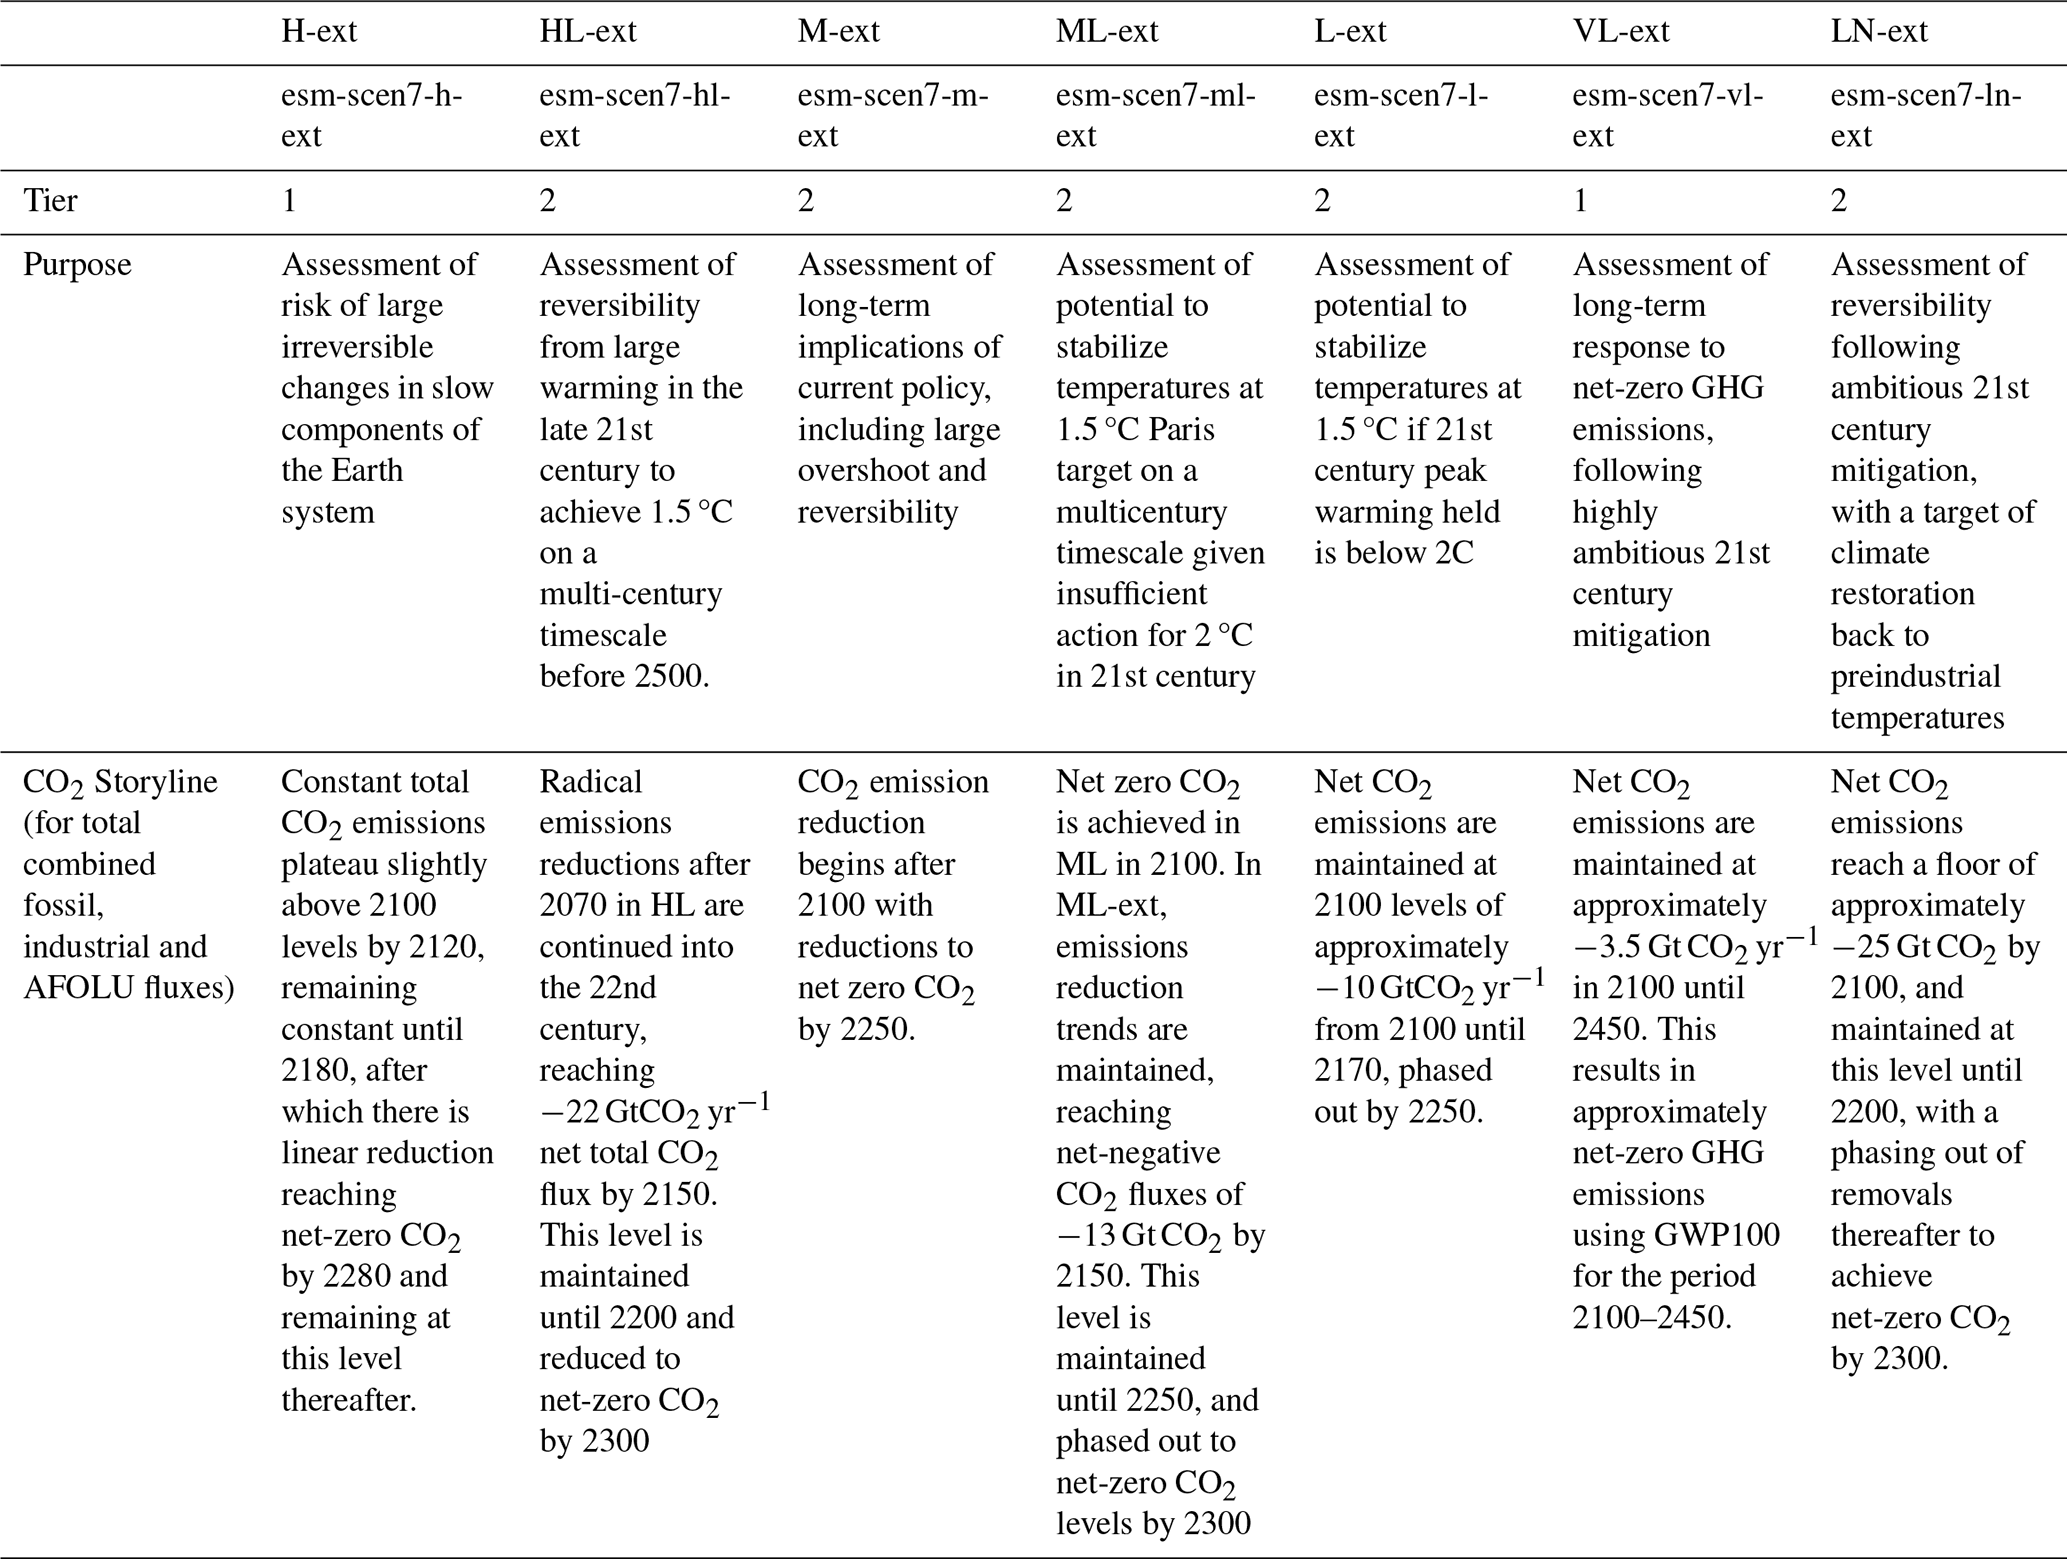
Figure 2Extensions for ScenarioMIP in CMIP7. Top row shows CO2 emissions and cumulative emissions. Second row shows methane and sulfur dioxide emissions. Third row shows GHG emissions (calculated using GWP100) and total radiative forcing. Fourth row shows atmospheric CO2 concentrations and projected temperature outcomes. Simulations are conducted with a calibrated ensemble of the FaIR simple climate model (Smith, 2025; Smith et al., 2024; see Fig. 1 caption), where solid lines show the 50th percentile outcome and shaded regions show the 5–95 percentile range. Data for the historical period is based on (Nicholls et al., 2025a). Scenarios are (H) High, (HL) High-to-Low, (M) Medium, (ML) Medium-to-Low, (L) Low, (LN) Low-to-Negative and (VL) Very Low. The final emission trajectories will depend on the finalized IAM runs but are expected to be consistent with the illustrations provided here.
As has been the case under the CMIP6 ScenarioMIP design, the scenario extensions will consist of emission and concentration trajectories to 2500 AD that are decoupled from the outcomes of IAM simulations. While IAMs are useful in generating the plausible evolution of greenhouse gas emissions in the shorter-term, beyond the end of this century the uncertainties that increasingly affect the socio-economic drivers of these trajectories end up limiting the usefulness of IAMs for scenario design. The longer time-period of the extensions (relative to the 2300 AD time horizon in CMIP6) is proposed to allow for a simulation of climate stabilization at different warming levels, and to provide sufficient time to allow for a range of diverse overshoot trajectories. The period 2100–2150 covered by the extensions is meant to be run as a continuation of each 21st century scenario simulation in Tier 1.
We extend the seven marker scenarios (H, HL, M, ML, L, LN, VL) from 2101 to 2500 using differentiated methodologies tailored to the characteristics of each emission category. For fossil and industrial CO2, a storyline-based approach has been applied combined with a functional representation of post-2100 emissions. This has been harmonized to produce continuous emissions trends during the transition and, after that, fit the storylines outlined in Table 3. The CO2 emission trends described in the table are disaggregated by defining post-2100 AFOLU CO2 emissions as a linear ramp-down approach from 2100 levels, such that land use fluxes are reduced to have zero net effect on emissions post 2150. Non-CO2 species (including air pollution) are extended regionally, preserving spatial emission patterns from the IAM scenarios towards a global relaxation level consistent with each species lowest emission value through the harmonized history and scenario trajectory. The extensions of methane and sulfur emissions follow a similar logic for regional patterns, but tend toward scenario narrative specific global relaxation targets. Several scenarios include CDR options (described in more detail in Sect. 5). The long-term extensions are all designed to achieve temperature stabilization post-2300 AD. The rationale and proposed GHG emissions trajectories for the extensions of the main scenarios (Fig. 2) are described below and summarized in Table 3.
The High (H) and Very Low (VL) scenario extensions are put in Tier 1. The High scenario extension (H-ext) simulates the multi-century implications of the highest plausible emissions levels, while the Very Low extension (VL-ext) simulates a long-term future relevant to the Paris agreement goal. The other scenarios are requested with lower priority and are part of Tier 2; Each extension pathway is designed to maintain narrative consistency with each scenario's underlying socioeconomic and technological assumptions. All scenarios (except VL-ext) ultimately reach net-zero CO2 by 2300, which results in temperature stabilization on multi-centennial timescales (Allen et al., 2018).
The Very Low (VL) scenario represents ambitious action to meet 1.5 °C-consistent targets leading to net-zero greenhouse gas emissions. Modest net negative CO2 fluxes are maintained in the extension to compensate for emissions of other greenhouse gases for the duration of the extension in the GWP100 calculation, and this results in a gradual, multi-century cooling. The Low (L-ext), Medium-to-Low (ML-ext) and High-to-Low (HL-ext) extensions explore increasingly extreme overshoot scenarios, requiring protracted periods of net CO2 removal to achieve long term 1.5 °C-consistent targets. Each scenario continues reducing emissions trends in 2100, reaching significant net-negative CO2 fluxes in the mid-22nd century (−9, −11 and −22 Gt CO2 respectively), which are phased out post-2200 to achieve net-zero CO2 in the mid-23rd century. In FaIR ensemble experiments, these three extensions each reach likely stable warming levels of 1.5 °C by 2300 (Fig. 2). A more extreme overshoot is explored in LN-ext, which maintains very large net carbon removal rates to achieve net-zero cumulative CO2 by 2300. This “climate reversal” experiment explores the potential to return temperatures to near pre-industrial levels from 2300 onwards. Stabilization at higher warming levels is explored in the Medium (M-ext) and High (H-ext) scenarios. In each case, the extension narrative describes an eventual reduction to net-zero CO2 which allows the assessment of climate impacts at higher, stable warming levels. As such, the Medium scenario describes little or no advancement from current policy until 2100, but M-ext assumes that CO2 emissions will be reduced to net-zero emissions throughout the 22nd century. H-ext maintains emissions at slightly above 2100 levels until 2180, reducing emissions to net zero by 2250. These narratives result in estimates of long-term stable warming levels of around 4 and 6 °C above pre-industrial levels, respectively, for M-ext and H-ext.
The extension parameters are calibrated to maintain these narrative distinctions across the full 2101–2500 period. For AFOLU emissions, all scenarios converge toward declining land-use emissions as agricultural intensification and ecosystem restoration reduce deforestation and increase carbon sequestration, though at rates proportional to each scenario's overall ambition. Efforts will be made to implement this assumption in the workflow for producing spatial land use emissions (LUH2) through a linear phase-down of 2100 afforestation/deforestation rates to maintenance levels in 2150.
Non-CO2 extensions similarly reflect scenario-specific assumptions: methane targets range from 95 Mt yr−1 in ambitious scenarios to 520 Mt yr−1 in the High emission pathway, representing varying degrees of agricultural transformation and fossil fuel phase-out; sulfur dioxide follows air quality policy stringency, declining to 10 Mt yr−1 in scenarios with strong environmental governance while remaining higher in the high-emission cases. As is the case for the 21st century scenarios in ScenarioMIP, emission-driven simulations are favored for the extensions to allow carbon-climate dynamics to be simulated in the Earth System Models, with prescribed CO2 emissions, prescribed land cover change, and prescribed non-CO2 concentrations.
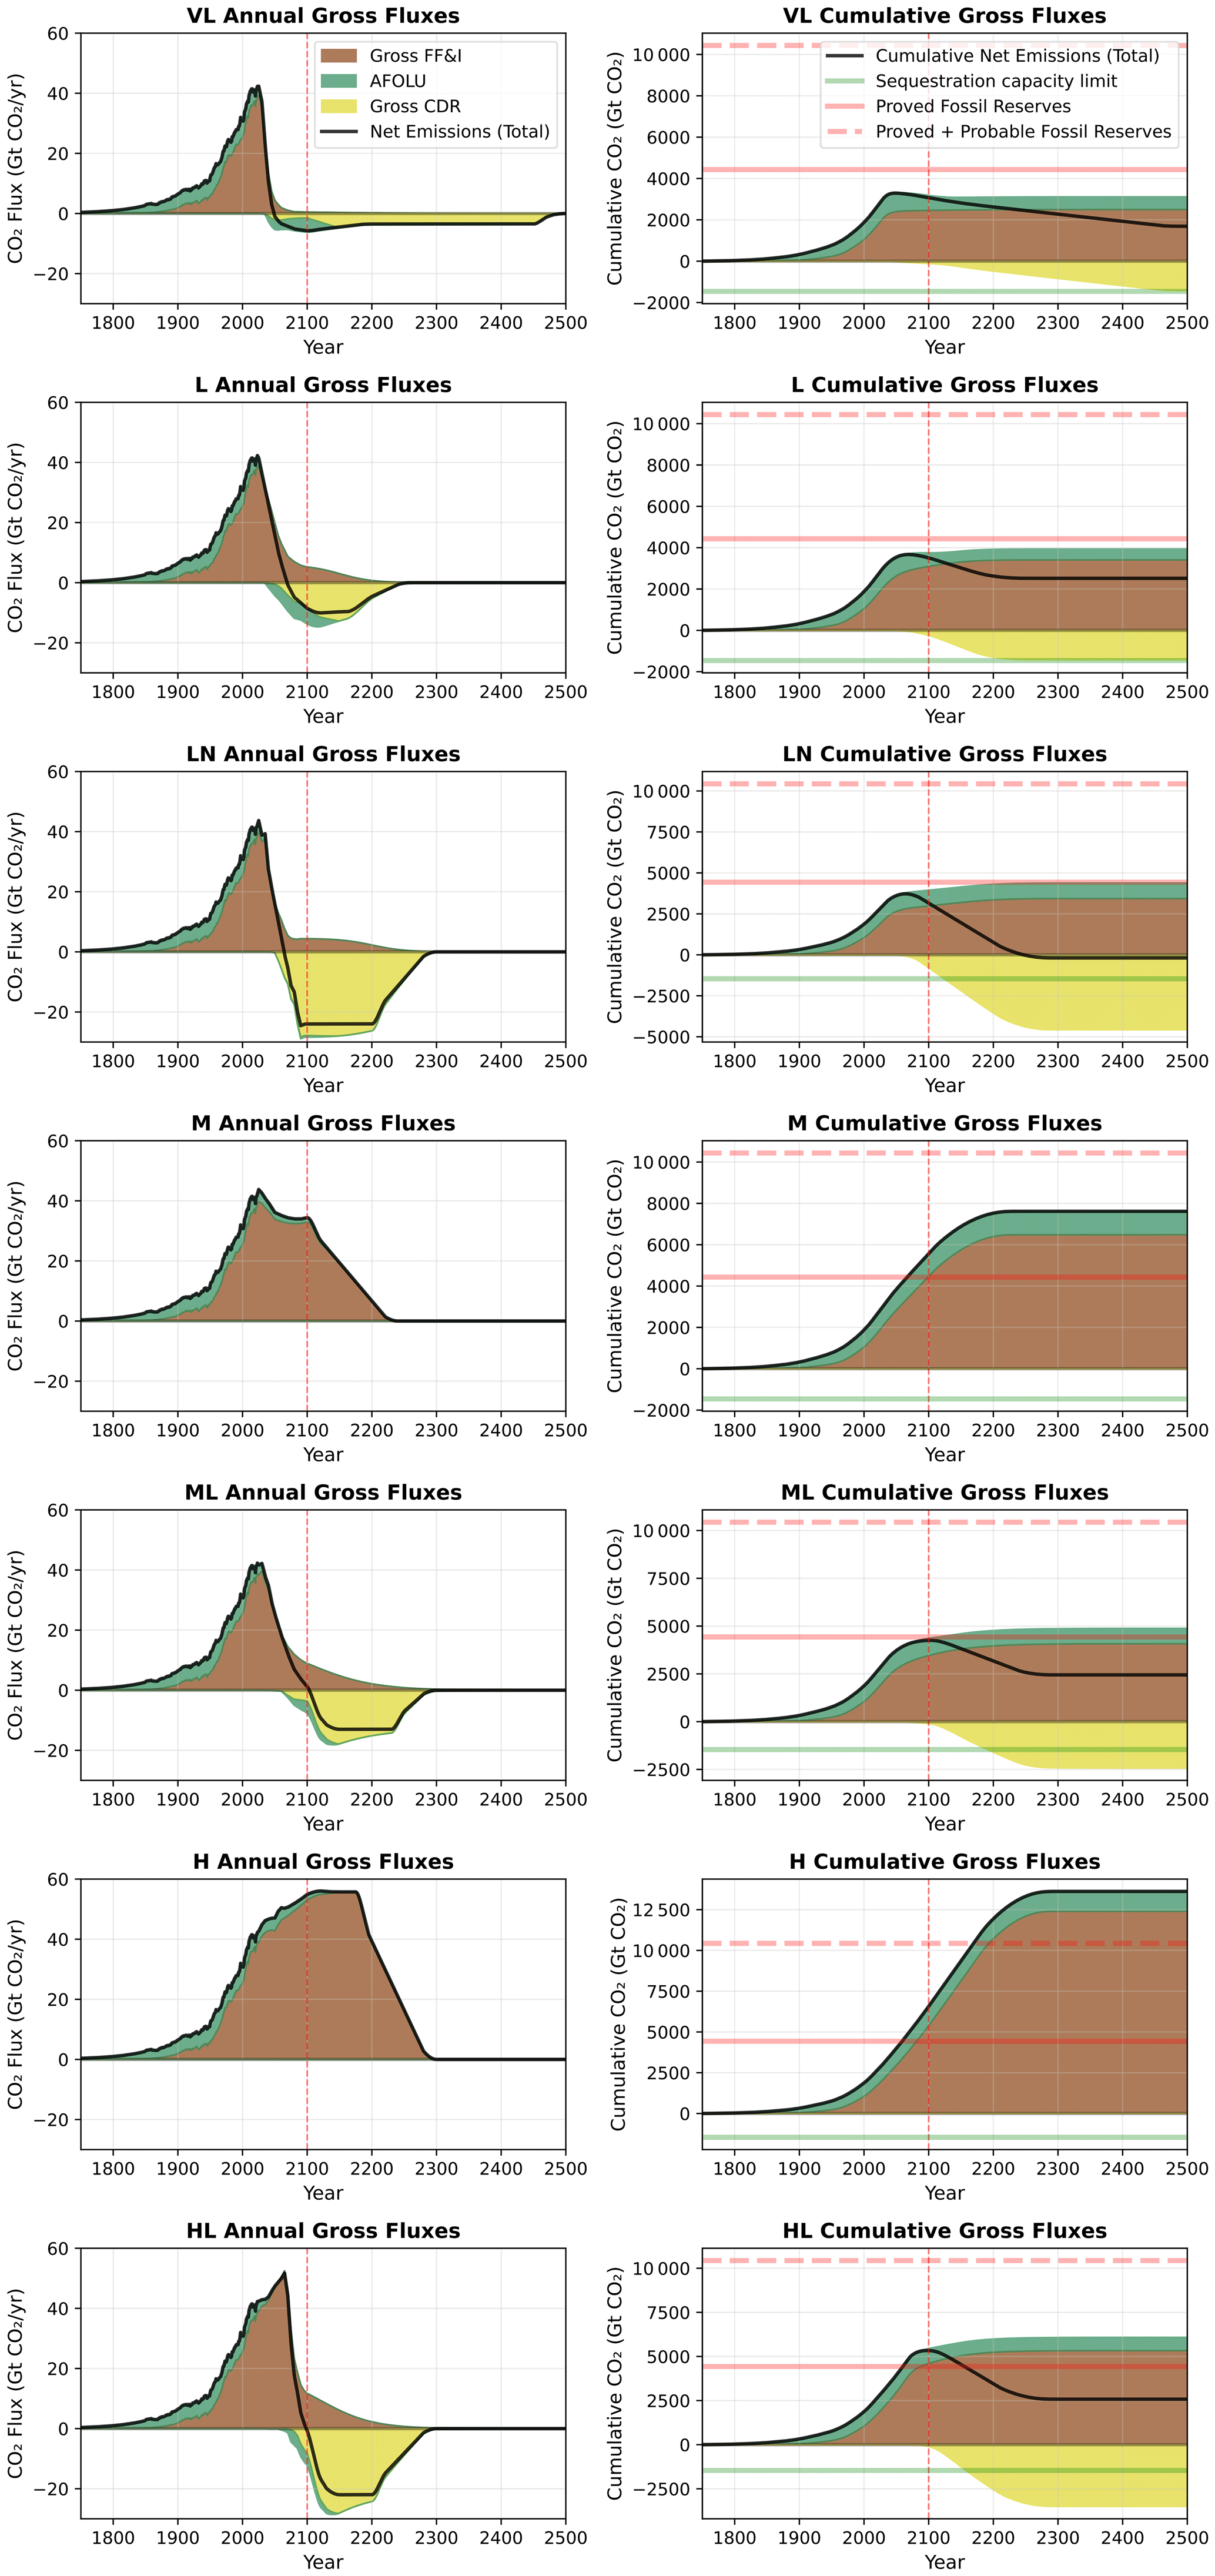
Figure 3Annual and cumulative CO2 fluxes for extended climate scenarios (1850–2500). Left panels show annual emission rates, right panels show cumulative totals. Brown areas represent gross positive emissions from fossil fuel combustion and industrial processes. Green areas show emissions and removals from agriculture, forestry and other land use (AFOLU). Yellow areas represent aggregated carbon dioxide removal (CDR) technologies including bioenergy with carbon capture and storage, direct air capture, ocean-based CDR, and enhanced weathering. Black lines indicate net emissions (positive values) or net removals (negative values). The red dashed vertical line marks 2100, separating historical data and original scenario projections (left) from extensions (right). Horizontal reference lines on cumulative plots (right panels) show: green line = prudent CDR storage limit (Gidden et al., 2025), red solid line = proven fossil fuel reserves, red dashed line = proved plus probable fossil fuel reserves (McGlade and Ekins, 2015). Scenario codes: VL = Very Low, LN = Low-to-Negative, L = Low, ML = Medium-to-Low, M = Medium, H = High, HL = High-to-Low (see Table 1 for full scenario definitions).
4.1 Geophysical plausibility of extensions
The extension methodology incorporates extended pathways for carbon dioxide removal (CDR) technologies beyond 2100. Figure 3 presents a comprehensive analysis of CO2 fluxes including historical data (1850–2100) and future extensions (2101–2500) for each scenario, displaying both annual gross emission and removal rates and cumulative totals.
Carbon dioxide removal encompasses multiple technologies including bioenergy with carbon capture and storage (BECCS), direct air capture with carbon storage (DACCS), ocean-based CDR, and enhanced weathering (see Sect. 5). In the extended scenarios, CDR deployment is scaled to maintain consistent 2100 baseline ratios. Gross unabated fossil fuel emissions are defined using functional forms which are continuous with 2100 values and continued according to the scenario narrative (though all scenarios are defined to have zero unabated fossil fuel emissions by 2300). Required gross CDR fluxes are calculated as the difference between the net fossil fuel and industrial flux trajectory, and the gross positive fluxes.
This approach ensures technological deployment patterns remain consistent with the original scenario logic while extending to the end-of-millennium timeframe. The methodology preserves regional heterogeneity in CDR deployment, maintaining the spatial distribution patterns established in the 2100 baseline year. This regional consistency is crucial for Earth system model implementations, as some CDR technologies have spatially dependent climate impacts and implementation constraints.
Figure 3 shows both cumulative emissions and removals for each scenario in the context of geophysical constraints as assessed in the literature. The prudent cumulative CDR limit of −1460 Gt CO2 estimated by Gidden et al. (2025) represents an assessment of potential limits of geologic carbon storage, reflecting both geological storage capacity and risk management considerations. This indicates that both the ML and HL scenario assumptions risk exceeding limits of prudent use of sequestration capacity.
Similarly, the cumulative emission analysis provides critical context by comparing net emissions trajectories with estimates of fossil fuel reserves. Proved fossil fuel reserves, 2866 Gt CO2 (McGlade and Ekins, 2015), represent currently economically extractable resources, while proved plus probable reserves (8032 Gt CO2) include additionally discovered resources that may become economically viable. Cumulative emissions to 2300 in M-ext, HL-ext and H-ext all exceed proven reserves, while H-ext may also exceed proven plus probable reserves.
This consideration of geophysical limits to both fossil fuel availability and sequestration capacity underlines that the judgment of the plausibility of the extended scenarios is limited to their geophysical dimension and is not as comprehensive as the plausibility judgments for the pre-2100 scenarios. In addition, some outlier scenarios challenge current estimates of geophysical feasibility. However, they are included for three reasons: first, assessments of geophysical feasibility are highly uncertain and are expected to evolve on the century timescale. Second, one of the goals of the extensions is to assess nonlinearities in Earth System responses; as such, it is advantageous to include scenarios such as H-ext, which explore the upper limits of feasible fossil carbon emissions, and large overshoots such as LN-ext, which explore the upper feasible limits of removals. Third, extensions are designed to ultimately serve as narratives for interactive CDR deployment experiments in Earth System Models (for example, in CDRMIP), and scenarios in which the limits of CDR are challenged are useful for identifying where Earth System Models are unable to deliver the scenario negative emissions rates (for example if bioenergy yields in the ESM are lower than the IAM estimates).
Carbon dioxide removal (CDR) methods are an important component of climate action and mitigation plans and have a unique role in reducing greenhouse gas concentrations via their potential to enable net-negative emissions. How these methods are deployed will affect both land use and land management, as well as energy system compositions, impacting broader sustainable development and biodiversity considerations (Mace et al., 2021). Currently, a broad range of CDR methods is being discussed within the policy communities and considered as part of climate action plans. IAMs only represent a subset of these approaches. The main CDR methods represented in IAMs are Bioenergy with Carbon Capture and Storage (BECCS), Direct Air Capture with Carbon Storage (DACCS), and afforestation and reforestation. In addition, IAMs are exploring new CDR methods such as biochar, soil carbon sequestration, enhanced weathering, storage in long-lived materials, agroforestry, improved forest management, and ocean-based CDR, although only a subset of those are included in most ScenarioMIP scenarios. CDR methods will be investigated in ScenarioMIP scenarios, as well as within other related MIPs such as CDR-MIP and LUMIP.
The IAM land-use and emissions data that is provided to ESM teams, including data related to CDR, will be harmonized to ensure continuity with historical datasets and to ensure a consistent data format for all scenarios. Both IAMs and ESMs are expected to report gross as well as net emissions for each sector to help with analysis of each scenario. It is important to ensure a high level of consistency between the IAM and ESM models regarding land-use change and CDR activities. This requires increasing our understanding of the way relevant processes are implemented in various models. This also means that underlying information on drivers of land-use change (especially food production vs bioenergy crop production) will be reported. Below, we briefly discuss how the various CDR methods are implemented.
5.1 Reforestation and Afforestation
For reforestation and afforestation, the IAMs provide gridded representations of where they intend trees to be planted (and protected) to store carbon as vegetation biomass. Since ESMs typically have capabilities for modeling tree/forest growth and carbon storage, in ScenarioMIP the IAM information on land use and land-cover change and hence afforestation/reforestation is forwarded (after harmonization) to the ESM frameworks (with land use representation) to create a process-based representation of the uptake and storage of carbon by these biomes in the ESMs. This will allow the calculation of the net emissions associated with reforestation and afforestation in ESMs that can be compared with the IAM information. However, since forest growth rates, forest management, potential biomass density as well as the representation of wildfires are likely to differ between individual ESMs and IAMs, there will still inevitably be differences between the carbon stored in trees/forests between these models (e.g. Melnikova et al., 2022). In-depth comparison is possible if IAMs also report the carbon storage in a geographically explicit way, similar to the “secondary mean biomass density” variable used in historical data for LUH3 (including information about the intended species and management practices used).
In the exchange between IAMs and ESMs, information on afforestation and reforestation will be provided as gridded areas of land-use for new forested areas in previously non-forested locations (afforestation) and/or previously forested areas (reforestation). This will be reported as two separate areas, along with existing forest areas. This information (from both IAMs and ESMs) will allow comparison of the differences in carbon storage from afforestation/reforestation between IAMs and ESMs and also will be used in biodiversity and impacts analysis. For ESMs, it should be noted that afforested and reforested area need to be represented as managed forests.
5.2 Bioenergy with Carbon Capture and Storage (BECCS)
IAMs typically include a detailed description of bioenergy and BECCS. This includes the representation of a variety of feedstocks, including bioenergy crops, forest biomass, and agricultural/forest residues. Moreover, in IAMs bio-energy yields are typically improving over time resulting from research, development, and innovation. This means that the carbon content for a given plot of bioenergy crop can increase over time and that a smaller area is needed to produce the same amount of bio-energy (or CDR).
Table 4Results of a survey among ESMs participating in CMIP7 on their capabilities of BECCS representation.
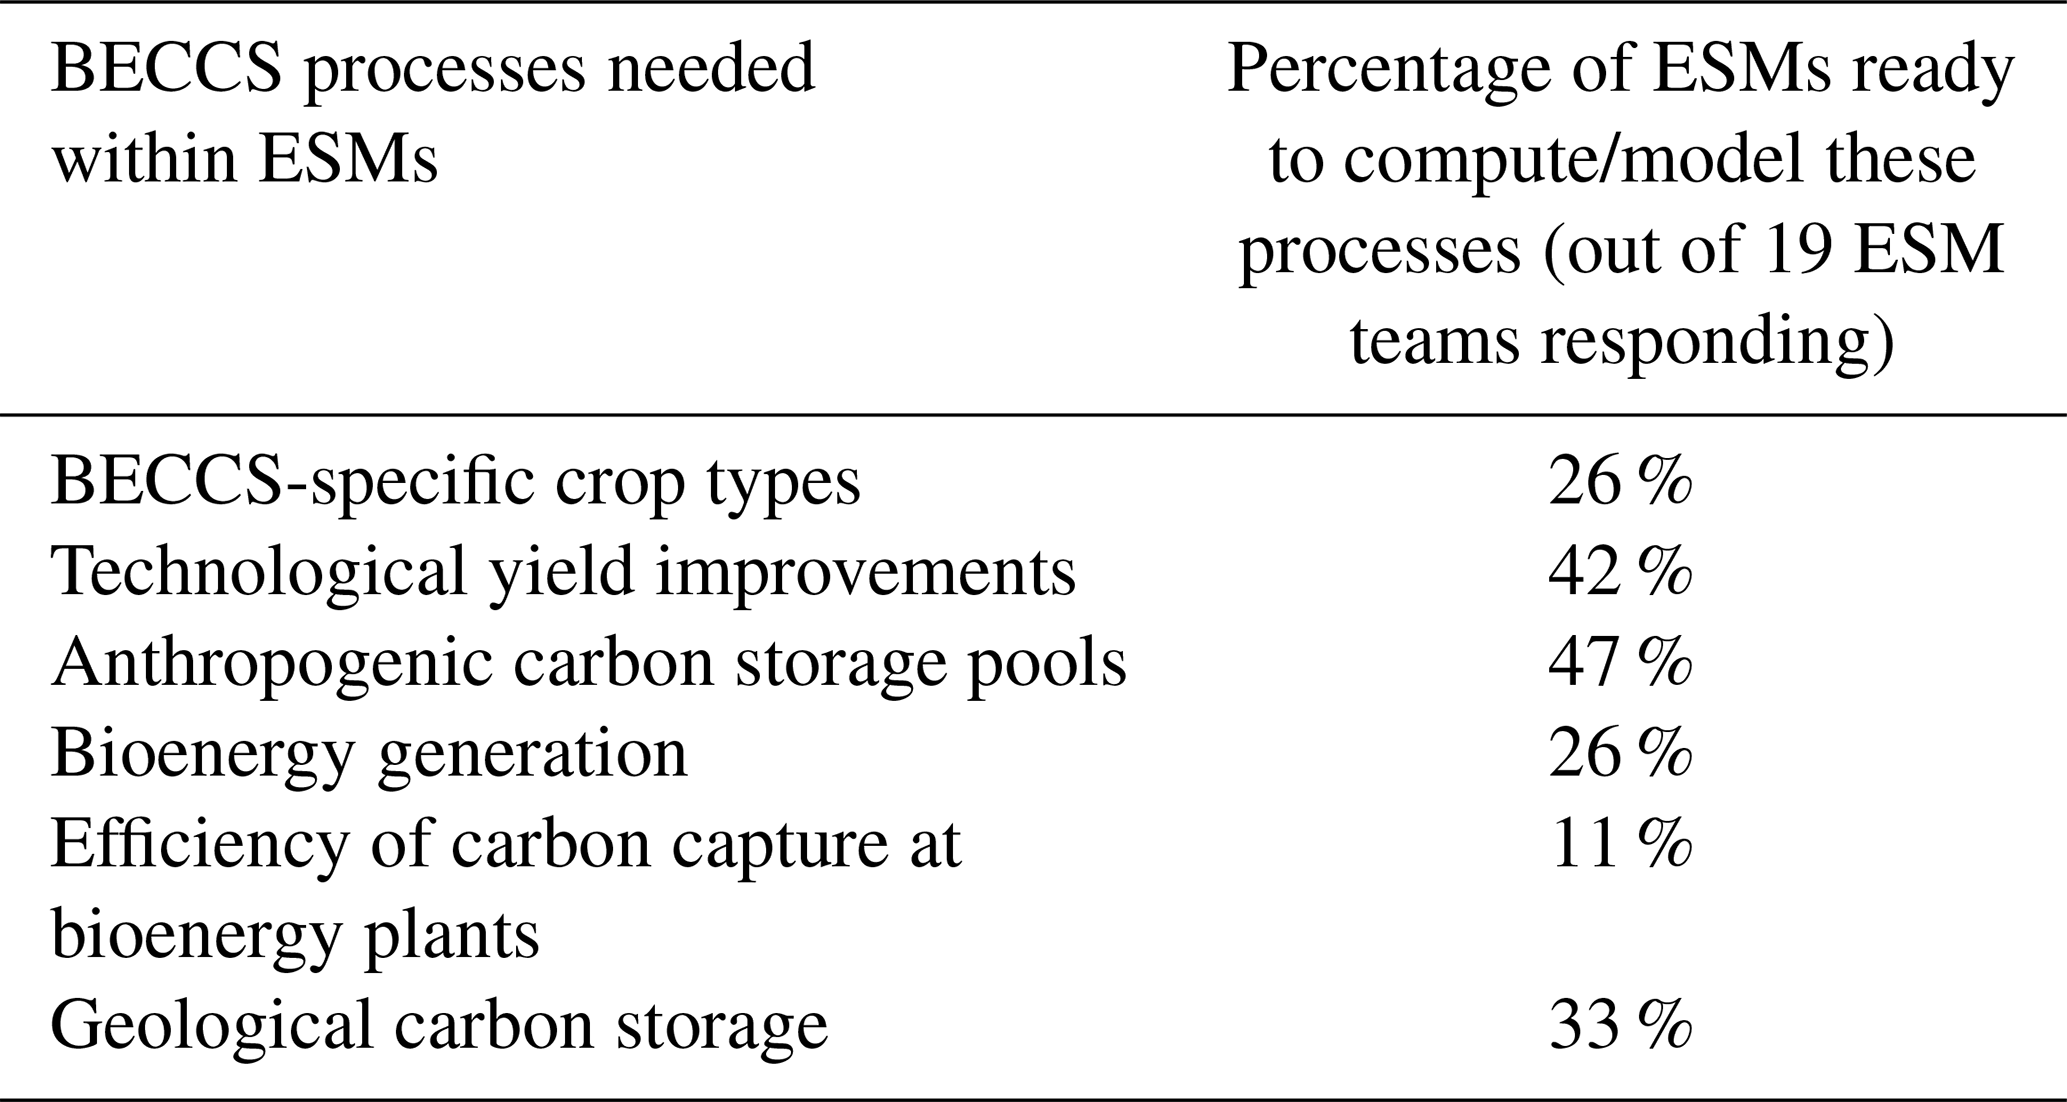
Table 4 (based on a recent survey of ESMs in preparation for CMIP7) summarizes the current readiness of ESMs to model CDR processes, including BECCS. Based on this survey, it was concluded that most ESMs are not yet ready to simulate the specific crop types used for BECCS and to include the bioenergy crop management and harvest schemes needed to compute the associated emissions and storage. Therefore, it has been decided that for BECCS, the carbon storage and/or net emissions from BECCS will be provided to ESMs as part of the emissions data from IAMs (rather than computing these emissions in the ESMs). Still, it is useful to try and harmonize as much as possible the representation of bio-energy and BECCS in the two model types.
ESMs will still need to model the emissions and biogeophysical climate impacts associated with land-use change and management for bioenergy (and other) crops. To facilitate this, they will be provided with harmonized gridded areas of bioenergy crops from IAMs. However, since many ESMs are actually preparing to fully calculate the net BECCS emissions as well, as much information as possible will be transferred from IAMs to ESMs so that those analyses and experiments can be undertaken in separate MIPs or research projects that will take place over longer time periods than ScenarioMIP. In principle, the results of the ESM BECCS calculations can feed into future versions of IAMs to highlight areas of highest BECCS carbon uptake potential.
To relay key information around BECCS to ESMs, IAMs will report the land-use change areas associated with first and second-generation bioenergy crop deployment at the gridded level. Also irrigation and fertilizer usage associated with bioenergy crops will be provided. These data will enable ESMs to model the climate impacts of land-use change associated with increasing or decreasing areas of bioenergy crops, along with the climate impacts of managing these agricultural systems. Regional BECCS-related carbon removals will also be gridded and reported to enable ESMs to capture the effects of the emissions from bioenergy that replace other emissions in the energy system and the emissions. Essentially, the ESMs will use the harmonized land-use data to calculate emissions associated with changes in land carbon pools and they will be provided with IAM data on emissions (including the reductions associated with BECCS carbon storage). Table 5 further summarizes the AFOLU processes associated with BECCS and whether the emissions/storage for each process will be provided by IAMs or computed by ESMs in ScenarioMIP.
In comparing the IAM and ESM output, it is important to realize that IAMs models report the impact of BECCS in the region in which the bioenergy is used, not where the biomass is grown. At the same time, IAMs report the biomass growth in the original location. Therefore, biomass growth as a driver of carbon dioxide removal will be consistent with the underlying IAM, but emissions flux field could be inconsistent because of biomass trade. However, since CO2 is a well-mixed gas, for emissions fluxes, the importance of the spatial pattern is not very important..
Table 5The role of IAMs and ESMs in representing individual processes associated with BECCS.
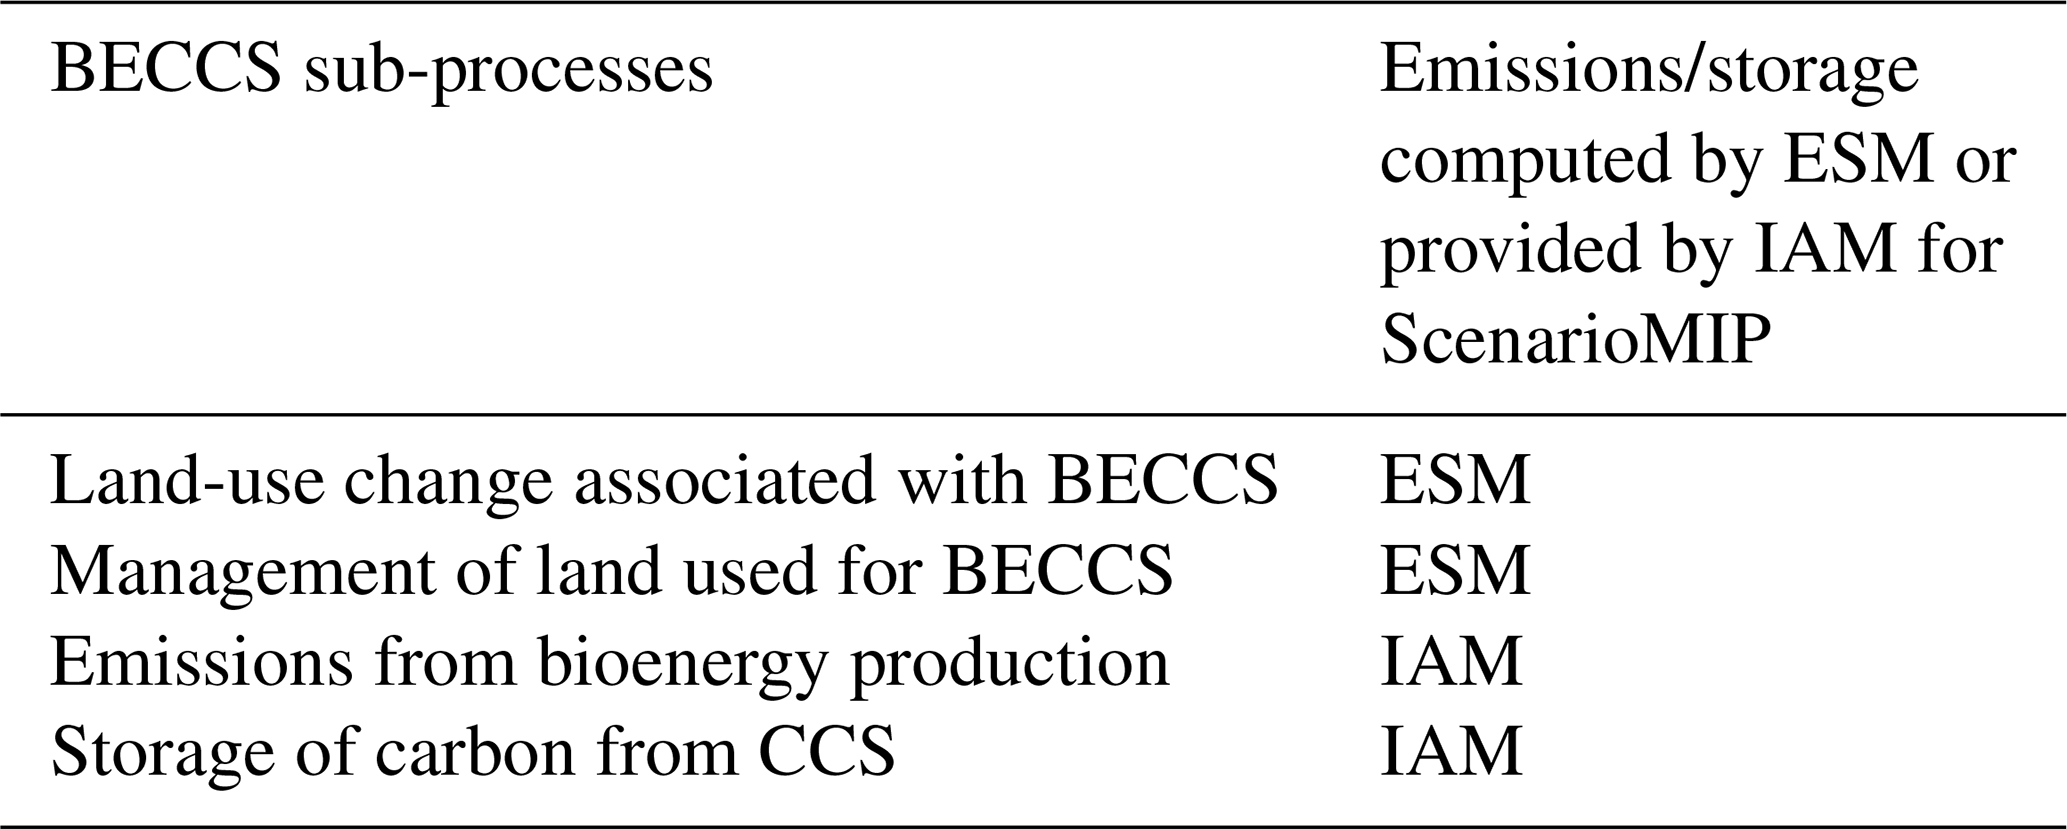
5.3 Direct Air Capture with Carbon Storage (DACCS) and other forms of CDR
Outputs from IAMs for other CDR methods (such as DACCS, enhanced rock weathering, biochar, soil carbon management, and ocean-based CDR) will be provided by IAMs as part of the total emissions data as well. Work is ongoing to provide gridded DACCS and “Other CDR” flows as an output from IAMs for future simulations and studies outside of ScenarioMIP. In some cases, IAMs may also model carbon removals related to agroforestry and improved forest management. As these flows relate closely to the woody carbon stocks included in the harmonized land-use forcing product, they are not included in the emissions data – similar to other land-use CO2 emissions. However, since the harmonized land-use forcing product, and ESMs generally do not model the processes related to CDR methods such as enhanced rock weathering, biochar, and soil carbon management, they are provided as part of the net emissions flux.
5.4 Overall information flows on CDR
Table 6 summarizes the data passed between IAMs and ESMs for CDR. In addition to the required datasets that are passed from IAMs to ESMs, as much additional information as possible on the IAM intentions and assumptions associated with CDR should be provided for additional analysis by ESMs and impact models. Moving forward, our goal is for IAMs and ESMs to work towards enabling full calculations of land-based CDR emissions/storage within ESMs for future MIPs and research projects.
Table 6CDR data passed from IAMs to ESMs annually as part of ScenarioMIP in CMIP7, along with intended ESM usage of these data.
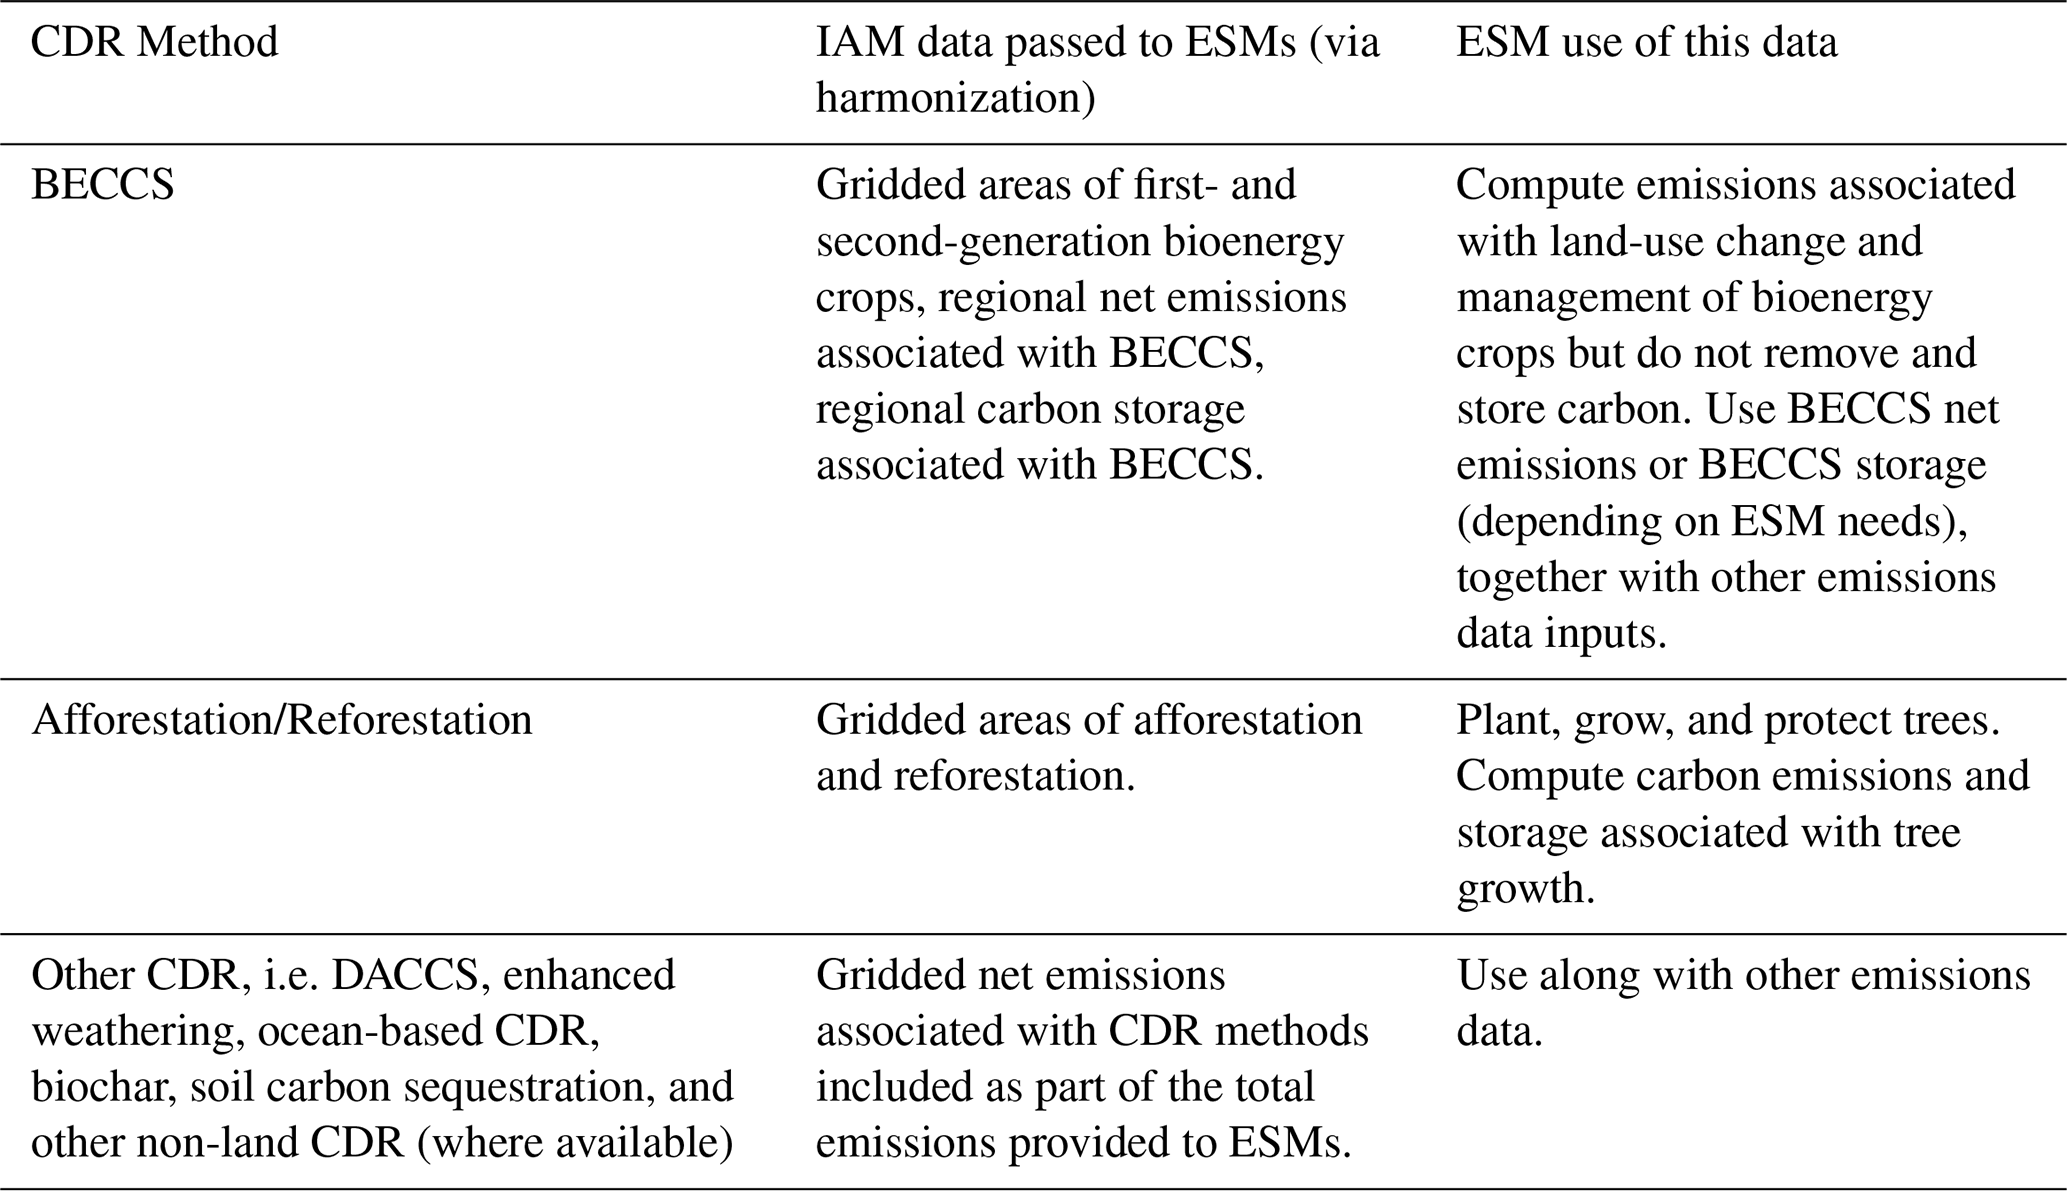
We have proposed a limited set of scenarios that, modeled by IAMs, would provide pathways of emissions, concentrations, and land use for use as external forcings for ESMs participating in CMIP7. These scenarios with their climate system outcomes are intended to facilitate studies of climate processes; provide inputs to a wide range of studies of impacts, adaptation, and mitigation; and support climate policy development and communication. They cover a wide range of plausible outcomes, from a High scenario representing policy failure and strong drivers of greenhouse gas emissions, to a Very Low scenario with dramatic emissions reductions.
The implementation of these scenarios in IAMs and ESMs poses a number of challenges, not all of which can be addressed or fully explored within the ScenarioMIP process. As a result, in a number of cases it became necessary to make design choices on the basis of current literature. Throughout the article, we have indicated where further research could advance the field and summarize important directions here.
Produce wider set of IAM scenarios:
-
Produce idealized or counterfactual emissions and land use scenarios to complement the plausible scenarios proposed here. The ScenarioMIP design is limited to scenarios judged to be plausible, but other scenarios could also provide useful insight. For example, scenarios that are higher or lower than those proposed here, or that imagine counter-factual historical outcomes (Meinshausen et al., 2024), can be of scientific interest or policy relevant.
-
Develop alternative implementations of the scenarios requested here from the IAM community using different modeling paradigms and normative assumptions. There are a number of questions of wide interest to the scientific and policy communities that would be unlikely to imply forcing pathways different enough to substantially affect climate system outcomes, given the role of ScenarioMIP. They therefore fall outside the scope of ScenarioMIP but are worth pursuing through other means. For example, different normative bases for approaches to mitigation may lead to different regional or sectoral emissions pathways, within approximately the same global forcing pathway. Similarly, alternative socio-economic pathways such as sustainable development scenarios with rapid convergence of regional incomes and living standards are useful to pursue but, if coupled with a target of limiting warming to (for example) likely below 2 °C, would lead to similar global forcing pathways to other 2 °C scenarios.
-
Produce versions of the scenarios described here that account for climate change impacts. The SSP-RCP scenario framework by design does not include impacts in community scenarios. This enables an independent assessment of impact-climate relationships conditional on a given SSP in the impact research community. However, incorporating impacts in these scenarios would also be of interest, in particular to test whether this would substantially alter global emissions and land use pathways.
-
Consider options to better integrate adaptation and mitigation. There are several interactions between impacts, adaptation and mitigation. At the moment, these are not considered given the way information is forwarded from one community to another. It will become increasingly important to see how this issue can be overcome.
-
Explore methods for further characterizing the relative likelihood of different scenarios. In this proposal we have limited likelihood judgments to whether scenarios are plausible or not, with some suggestion that the H and VL scenarios may be considered less likely than the others, by construction. It will be worth undertaking a variety of approaches to judge the relative likelihood of the various scenarios more broadly to help inform risk assessments.
Explore climate (model) processes:
-
Explore the effect of carbon cycle uncertainty, including climate feedbacks, on climate system outcomes. ESMs are encouraged to run all scenarios in CO2 emissions-driven mode, so that the carbon cycle is modeled within the ESMs. The multi-model ensemble will then capture uncertainty in the carbon cycle across models. A complementary analysis could test uncertainties in the carbon cycle parameters in the emulators (derived from the behavior of the CMIP6 ESMs) by deriving high and low CO2 concentration pathways for a given emissions scenario using emulators. These concentration variants could then be run with ESMs (in concentration-driven mode) in addition to the median concentration pathway recommended as part of the ScenarioMIP protocol, to investigate the sensitivity of the climate system to the emulators' implementation.
-
Explore the effect of atmospheric chemistry uncertainty on climate system outcomes. The ScenarioMIP design calls for non-CO2 greenhouse gases and air pollutants to be incorporated primarily in the form of atmospheric concentrations, with a single atmospheric chemistry model providing concentration fields based on the emissions scenarios. A fuller representation of uncertainty would run emissions through additional atmospheric chemistry models and then run through ESMs to assess the sensitivity of climate outcomes to the representation of atmospheric chemistry.
Explore climate model sensitivities:
-
Further explore whether different mitigation strategies achieving approximately the same global forcing pathways would produce detectable differences in climate outcomes. The overall SSP-RCP scenario framework is based on the premise that in a multi-model setting ESM projections resulting from a given pathway of global average forcing can be considered consistent with alternative emissions and land use scenarios producing a similar global forcing pathway (van Vuuren et al., 2017). In that way, ESM simulations based on one of the ScenarioMIP scenarios can be used in studies with alternative assumptions about socio-economic pathways or mitigation strategies, as long as global forcing is similar. Limited existing research supports this assumption, but further study of the degree to which variations in regional forcing due to short-lived climate forcers or land use could produce significantly different climate and impact outcomes would be useful.
-
Further explore what minimum difference in global forcing is required to produce significantly different climate system outcomes. Global forcing pathways that are not sufficiently separated from each other may not produce multi-model ESM ensembles with statistically significant differences in important climate variables. It may be that a forcing difference sufficient to produce a difference of 0.25–0.3 °C global average temperature is required (Tebaldi et al., 2015), but further analysis with the latest generation of ESMs is desirable.
Foster development of ESM emulators:
-
Develop spatially explicit, multi-variable emulators that can emulate ESM outcomes, especially for temperature overshoot scenarios. Progress is being made in the development of ESM emulators, but currently there are not enough overshoot scenarios run by ESMs to train these emulators and test their accuracy in overshoot conditions. Emulators can subsequently be used to explore the outcomes of a much wider range of scenarios and can help better quantify uncertainties, even facilitating a probabilistic representation of climate outcomes.
Improve ESM representation of mitigation strategies:
-
Develop and explore methods for ESMs to be able to compute CDR-related emissions and storage (including BECCS). Because the implementation of CDR directly in ESMs is not yet a widespread practice, the ScenarioMIP design calls for IAMs to estimate the emissions associated with these measures and pass these results to ESMs. In future CMIP activities it would be desirable to implement CDR measures directly in ESMs. This requires research on what CDR related output is important for IAMs to provide, and how ESMs can implement it in a way that is consistent with the original IAM intentions.
| AerChemMIP | Aerosol Chemistry Model Intercomparison Project |
| AFOLU | Agriculture, Forestry and Other Land Use |
| BECCS | Bioenergy with Carbon Capture and Storage |
| CCS | Carbon Capture and Storage |
| CMIC | Climate Model of Intermediate Complexity |
| CMIP | Coupled Model Intercomparison Project |
| CDR | Carbon Dioxide Removal |
| DAC | Direct Air Capture |
| DACCS | Direct Air Capture with Carbon Storage |
| DECK | Diagnostics, Evaluation and Characterization |
| of Klima | |
| ESM | Earth System Model |
| EV | Electric Vehicle |
| GCM | Global Circulation Model/Global Climate Model |
| GHG | Green-house gas |
| GMST | Global Mean Surface Temperature |
| GSAT | Global-mean Surface Air Temperature |
| GWP100 | Global Warming Potential over 100 years |
| H | High emission scenario |
| H-ext | High emission scenario extension |
| H-ext-OS | High overshoot extension |
| IAM | Integrated Assessment Model |
| IAMC | Integrated Assessment Modeling Consortium |
| IEA | International Energy Agency |
| input4mip | CMIP activity tasked with processing and |
| availability of input data for ESM | |
| experiments under CMIP | |
| IPCC | Intergovernmental Panel on Climate Change |
| L | Low emission scenario |
| L-ext | Low emission scenario extension |
| LN | Low to negative emission scenario |
| LN-ext | Low to negative emission scenario extension |
| LUMIP | Land Use Model Intercomparison Project |
| M | Medium emission scenario |
| M-ext | Medium emission scenario extension |
| ML | Medium-to-Low emission scenario |
| ML-ext | Medium-to-Low emission scenario extension |
| MIP | Model Intercomparison Project |
| NDC | Nationally Determined Contributions |
| RAMIP | Regional Aerosol Model intercomparison Project |
| RCP | Representative Concentration Pathway |
| SCM | Simple Climate Model |
| SDG | Sustainable Development Goal |
| SLCF | Short-Lived Climate Forcer |
| SSC | Scientific Steering Committee |
| SSP | Shared Socio-economic Pathways |
| TCRE | Transient Climate Response to cumulative |
| Emissions | |
| VIA | Vulnerability, Impacts and Adaptation |
| VIACS | Vulnerability, Impacts, Adaptation and |
| Climate Services | |
| VL | Very Low emission scenario |
| VL-ext | Very Low emission scenario extension |
| WGI/II/III | Working Group I/II/III. |
Data on the figures is available at Zenodo: https://doi.org/10.5281/zenodo.14382495 (Sanderson and Smith, 2025).
DvV, BCO and CT coordinated the development process of the manuscript and took a lead in the writing. LC, TH, KR, PF and BMS coordinated subgroups in the writing process that worked on particular sections. BS and CS created the figures. All authors contributed to the design and the writing of the proposal.
At least one of the (co-)authors is a member of the editorial board of Geoscientific Model Development. The peer-review process was guided by an independent editor, and the authors also have no other competing interests to declare.
Publisher's note: Copernicus Publications remains neutral with regard to jurisdictional claims made in the text, published maps, institutional affiliations, or any other geographical representation in this paper. The authors bear the ultimate responsibility for providing appropriate place names. Views expressed in the text are those of the authors and do not necessarily reflect the views of the publisher.
This proposal and the scenario development process was endorsed by WCRP JSC. We would like to thank Helene Hewitt, John Dunne and Eleanor O'Rourke for their support in developing this proposal. We also thank all participants of the Reading Workshop in 2023 for their contributions as well as the members of the ScenarioMIP advisory board. We thank Aleh Cherp for his input on the descriptions on scenario feasibility. Finally, we acknowledge the valuable suggestions and comments of the two formal reviewers, all those that provided comments during the discussion period and all those that provided comments to the original draft posted on the CMIP ScenarioMIP website.
DVV is supported by the EERIE project (Grant Agreement No 101081383) and the ELEVATE project (under grant agreement No 101056873) funded by the European Union's Horizon Europe programme. NB is supported by the RESCUE and OptimESM projects funded by the European Union's Horizon Europe programme under grant number 101056939 and 101081193. JS is funded by the German Research Foundation (DFG) under Germany's Excellence Strategy – EXC 2037: ”CLICCS–Climate, Climatic Change, and Society” – Project Number: 390683824, contribution to the Center for Earth System Research and Sustainability (CEN) at the University of Hamburg. LFP was supported by National Council for Scientific and Technological Development (CNPq grant number 405607/2023-7) and Carlos Chagas Foundation for Research Support of the State of Rio de Janeiro (FAPERJ grant number E-26/210.291/2024). CM, LKG, CS and JL were supported by the Met Office Hadley Centre Climate Programme funded by DSIT. LPC was supported by the NASA Carbon Monitoring System (grant number 80NSSC21K1059) and the University of Maryland Grand Challenges program. CS and JS were supported by the European Union's Horizon Europe programme project WorldTrans under grant number 101081661. V.E.'s work is supported by the European Research Council (ERC) Synergy Grant `Understanding and Modeling the Earth System with Machine Learning' (USMILE) under the Horizon 2020 Research and Innovation programme (grant agreement no. 855187) and the Deutsche 1079 Forschungsgemeinschaft (DFG, German Research Foundation) through the Gottfried Wilhelm Leibniz Prize awarded to V.E. (reference no. EY 22/2-1). CM was supported by both OptimESM and the TipESM projects funded by the European Union's Horizon Europe research and innovation program under grant agreement no. 101081193 and 101137673 and is therefore funded by UK Research and Innovation (UKRI) under the UK government's Horizon Europe funding Guarantee. BMS and MS were supported by the Norwegian Research Council through the project TRIFECTA (grant number 334811) and the European Union Horizon Europe Research and Innovation programme projects DIAMOND (grant-no. 101081179) and ESM2025 (grant-no. 101003536). KT and TY were supported by the Program for the Advanced Studies of Climate Change Projection (SENTAN, grant no. JPMXD0722681344) from the Ministry of Education, Culture, Sports, Science and Technology of Japan.
This paper was edited by Carlos Sierra and reviewed by Jean-Francois Lamarque and Colin Jones.
Allen, M. R., Dube, O. P., Solecki, W., Aragón-Durand, F., Cramer, W., Humphreys, S., Kainuma, M., Kala, J., Mahowald, N., Mulugetta, Y., Perez, R., Wairiu, M., and Zickfeld, K.: Framing and Context, in: Global Warming of 1.5° C. An IPCC Special Report on the impacts of global warming of 1.5° C above pre-industrial levels and related global greenhouse gas emission pathways, in the context of strengthening the global response to the threat of climate change, sustainable development, and efforts to eradicate poverty, edited by: Masson-Delmotte, V., Zhai, P., Pörtner, H.-O., Roberts, D., Skea, J., Shukla, P. R., Pirani, A., Moufouma-Okia, W., Péan, C., Pidcock, R., Connors, S., Matthews, J. B. R., Chen, Y., Zhou, X., Gomis, M. I., Lonnoy, E. T., Maycock Tignor, M. T., and Waterfield, T., Cambridge University Press, Cambridge, UK and New York, NY, USA, 49–92, https://doi.org/10.1017/9781009157940.003, 2018.
Aubry, T. J., Toohey, M., Khanal, S., Chim, M. M., Verkerk, M., Johnson, B., Schmidt, A., Kovilakam, M., Sigl, M., Nicholls, Z., Thomason, L., Naik, V., Rieger, L., Stiller, D., Ziegler, E., and Smith, I.: Stratospheric aerosol forcing for CMIP7 (part 1): Optical properties for pre-industrial, historical, and scenario simulations (version 2.2.1), EGUsphere [preprint], https://doi.org/10.5194/egusphere-2025-4990, 2025.
Bauer, N., Hilaire, J., Brecha, R. J., Edmonds, J., Jiang, K., Kriegler, E., Rogner, H. H., and Sferra, F.: Assessing global fossil fuel availability in a scenario framework, Energy, 111, 580–592, https://doi.org/10.1016/j.energy.2016.05.088, 2016.
Bauer, N., Bertram, C., Schultes, A., Klein, D., Luderer, G., Kriegler, E., Popp, A., and Edenhofer, O.: Quantification of an efficiency-sovereignty trade-off in climate policy, Nature, 588, 261–266, https://doi.org/10.1038/s41586-020-2982-5, 2020.
Beier, F. D., Dietrich, J. P., Heinke, J., Abrahao, G., von Jeetze, P., Bodirsky, B. L., Crawford, M., Humpenöder, F., Merfort, L., Weindl, I., Herrero, M., Mason-D'Croz, D., Rockström, J., Sundiang, M., Wierik, S. t., Norberg, A., Klein, D., Müller, C., Lotze-Campen, H., and Popp, A.: Planetary boundaries under a land-based climate change mitigation scenario with a food demand transformation: a modelling study, The Lancet Planetary Health, 9, https://doi.org/10.1016/S2542-5196(25)00087-7, 2025.
Brutschin, E., Pianta, S., Tavoni, M., Riahi, K., Bosetti, V., Marangoni, G., and Van Ruijven, B. J.: A multidimensional feasibility evaluation of low-carbon scenarios, Environ. Res. Lett., 16, https://doi.org/10.1088/1748-9326/abf0ce, 2021.
Carter, T. R., Jones, R. N., Lu, X., Bhadwal, S., Conde, C., Mearns, L. O., O'Neill, B. C., Rounsevell, M. D. A., and Zurek, M. B.: New Assessment Methods and the Characterisation of Future Conditions, in: Climate Change 2007 Impacts, Adaptation and Vulnerability. Contribution of Working Group II to the Fourth Assessment Report of the Intergovernmental Panel on Climate Change, edited by: Parry, M. L., Canziani, O. F., Palutikof, J. P., van der Linden, P. J., and Hanson, C. E., Cambridge University Press, Cambridge, UK, 133–171, 2007.
CMIP: ScenarioMIP, https://wcrp-cmip.org/model-intercomparison-projects-mips/scenariomip/ (last access: 8 February 2026), 2026.
Emmerling, J., Drouet, L., van der Wijst, K.-I., Vuuren, D., Bosetti, V., and Tavoni, M.: The role of the discount rate for emission pathways and negative emissions, Environmental Research Letters, https://doi.org/10.1088/1748-9326/ab3cc9, 2019.
Engels, A., Marotzke, J., Ratter, B. M. W., Gonçalves Gresse, E., López-Rivera, A., Pagnone, A., and Wilkens, J.: Hamburg Climate Futures Outlook. Conditions for Sustainable Climate Change Adaptation, Cluster of Excellence Climate, Climatic Change, and Society (CLICCS), transcript Verlag, Bielefeld (Germany), 2024.
Eyring, V., Bony, S., Meehl, G. A., Senior, C. A., Stevens, B., Stouffer, R. J., and Taylor, K. E.: Overview of the Coupled Model Intercomparison Project Phase 6 (CMIP6) experimental design and organization, Geosci. Model Dev., 9, 1937–1958, https://doi.org/10.5194/gmd-9-1937-2016, 2016.
Eyring, V., Collins, W. D., Gentine, P., Barnes, E. A., Barreiro, M., Beucler, T., Bocquet, M., Bretherton, C. S., Christensen, H. M., Dagon, K., Gagne, D. J., Hall, D., Hammerling, D., Hoyer, S., Iglesias-Suarez, F., Lopez-Gomez, I., McGraw, M. C., Meehl, G. A., Molina, M. J., Monteleoni, C., Mueller, J., Pritchard, M. S., Rolnick, D., Runge, J., Stier, P., Watt-Meyer, O., Weigel, K., Yu, R., and Zanna, L.: Pushing the frontiers in climate modelling and analysis with machine learning, Nature Climate Change, 14, 916–928, https://doi.org/10.1038/s41558-024-02095-y, 2024.
FaIR-team: FaIR: Finite Amplitude Impulse Response simple climate model, https://docs.fairmodel.net/en/latest/ (last access: 8 February 2026), 2026.
Friedlingstein, P., O'Sullivan, M., Jones, M. W., Andrew, R. M., Bakker, D. C. E., Hauck, J., Landschützer, P., Le Quéré, C., Li, H., Luijkx, I. T., Peters, G. P., Peters, W., Pongratz, J., Schwingshackl, C., Sitch, S., Canadell, J. G., Ciais, P., Aas, K., Alin, S. R., Anthoni, P., Barbero, L., Bates, N. R., Bellouin, N., Benoit-Cattin, A., Berghoff, C. F., Bernardello, R., Bopp, L., Brasika, I. B. M., Chamberlain, M. A., Chandra, N., Chevallier, F., Chini, L. P., Collier, N. O., Colligan, T. H., Cronin, M., Djeutchouang, L., Dou, X., Enright, M. P., Enyo, K., Erb, M., Evans, W., Feely, R. A., Feng, L., Ford, D. J., Foster, A., Fransner, F., Gasser, T., Gehlen, M., Gkritzalis, T., Goncalves De Souza, J., Grassi, G., Gregor, L., Gruber, N., Guenet, B., Gürses, Ö., Harrington, K., Harris, I., Heinke, J., Hurtt, G. C., Iida, Y., Ilyina, T., Ito, A., Jacobson, A. R., Jain, A. K., Jarníková, T., Jersild, A., Jiang, F., Jones, S. D., Kato, E., Keeling, R. F., Klein Goldewijk, K., Knauer, J., Kong, Y., Korsbakken, J. I., Koven, C., Kunimitsu, T., Lan, X., Liu, J., Liu, Z., Liu, Z., Lo Monaco, C., Ma, L., Marland, G., McGuire, P. C., McKinley, G. A., Melton, J., Monacci, N., Monier, E., Morgan, E. J., Munro, D. R., Müller, J. D., Nakaoka, S.-I., Nayagam, L. R., Niwa, Y., Nutzel, T., Olsen, A., Omar, A. M., Pan, N., Pandey, S., Pierrot, D., Qin, Z., Regnier, P. A. G., Rehder, G., Resplandy, L., Roobaert, A., Rosan, T. M., Rödenbeck, C., Schwinger, J., Skjelvan, I., Smallman, T. L., Spada, V., Sreeush, M. G., Sun, Q., Sutton, A. J., Sweeney, C., Swingedouw, D., Séférian, R., Takao, S., Tatebe, H., Tian, H., Tian, X., Tilbrook, B., Tsujino, H., Tubiello, F., van Ooijen, E., van der Werf, G., van de Velde, S. J., Walker, A., Wanninkhof, R., Yang, X., Yuan, W., Yue, X., and Zeng, J.: Global Carbon Budget 2025, Earth Syst. Sci. Data Discuss. [preprint], https://doi.org/10.5194/essd-2025-659, in review, 2025.
Funke, B., Dudok de Wit, T., Ermolli, I., Haberreiter, M., Kinnison, D., Marsh, D., Nesse, H., Seppälä, A., Sinnhuber, M., and Usoskin, I.: Towards the definition of a solar forcing dataset for CMIP7, Geosci. Model Dev., 17, 1217–1227, https://doi.org/10.5194/gmd-17-1217-2024, 2024.
Gidden, M. J., Riahi, K., Smith, S. J., Fujimori, S., Luderer, G., Kriegler, E., van Vuuren, D. P., van den Berg, M., Feng, L., Klein, D., Calvin, K., Doelman, J. C., Frank, S., Fricko, O., Harmsen, M., Hasegawa, T., Havlik, P., Hilaire, J., Hoesly, R., Horing, J., Popp, A., Stehfest, E., and Takahashi, K.: Global emissions pathways under different socioeconomic scenarios for use in CMIP6: a dataset of harmonized emissions trajectories through the end of the century, Geosci. Model Dev., 12, 1443–1475, https://doi.org/10.5194/gmd-12-1443-2019, 2019.
Gidden, M. J., Joshi, S., Armitage, J. J., Christ, A.-B., Boettcher, M., Brutschin, E., Köberle, A. C., Riahi, K., Schellnhuber, H. J., Schleussner, C.-F., and Rogelj, J.: A prudent planetary limit for geologic carbon storage, Nature, 645, 124–132, https://doi.org/10.1038/s41586-025-09423-y, 2025.
Hajima, T., Kawamiya, M., Ito, A., Tachiiri, K., Jones, C. D., Arora, V., Brovkin, V., Séférian, R., Liddicoat, S., Friedlingstein, P., and Shevliakova, E.: Consistency of global carbon budget between concentration- and emission-driven historical experiments simulated by CMIP6 Earth system models and suggestions for improved simulation of CO2 concentration, Biogeosciences, 22, 1447–1473, https://doi.org/10.5194/bg-22-1447-2025, 2025.
Hausfather, Z. and Peters, G. P.: Emissions – the “business as usual” story is misleading, Nature, 577, 618–620, https://doi.org/10.1038/d41586-020-00177-3, 2020.
Hickel, J. and Slamersak, A.: Existing climate mitigation scenarios perpetuate colonial inequalities, The Lancet Planetary Health, 6, e628–e631, https://doi.org/10.1016/S2542-5196(22)00092-4, 2022.
Hurtt, G. C., Chini, L., Sahajpal, R., Frolking, S., Bodirsky, B. L., Calvin, K., Doelman, J. C., Fisk, J., Fujimori, S., Klein Goldewijk, K., Hasegawa, T., Havlik, P., Heinimann, A., Humpenöder, F., Jungclaus, J., Kaplan, J. O., Kennedy, J., Krisztin, T., Lawrence, D., Lawrence, P., Ma, L., Mertz, O., Pongratz, J., Popp, A., Poulter, B., Riahi, K., Shevliakova, E., Stehfest, E., Thornton, P., Tubiello, F. N., van Vuuren, D. P., and Zhang, X.: Harmonization of global land use change and management for the period 850–2100 (LUH2) for CMIP6, Geosci. Model Dev., 13, 5425–5464, https://doi.org/10.5194/gmd-13-5425-2020, 2020.
IEA: The Role of Critical Minerals in Clean Energy Transitions, IEA, Paris, 2021.
IIASA: SSP Scenario Explorer, https://data.ece.iiasa.ac.at/ssp/#/login?redirect=/workspaces, (last access: 8 February 2026), 2026.
IPCC: Climate Change 2021 – The Physical Science Basis, Summary for Policymakers, Working Group I contribution to the Sixth Assessment Report of the Intergovernmental Panel on Climate Change, Cambridge University Press, Cambridge, UK, 2021.
IPCC: Climate change – Mitigation of Climate Change, Contribution of Working Group III to the Sixth Assessment Report of the Intergovernmental Panel on Climate Change, Cambridge University Press, Cambridge, https://doi.org/10.1017/9781009157926.001, 2022a.
IPCC: Climate Change 2022: Impacts, Adaptation and Vulnerability. Contribution of Working Group II to the Sixth Assessment Report of the Intergovernmental Panel on Climate Change Cambridge, UK, Cambridge University Press, Cambridge, UK, 2022b.
IPCC: Climate Change 2023: Synthesis Report. Contribution of Working Groups I, II and III to the Sixth Assessment Report of the Intergovernmental Panel on Climate Change. IPCC, Geneva, Switzerland, 35–115, https://doi.org/10.59327/IPCC/AR6-9789291691647, 2023a.
IPCC: Workshop Report of the Intergovernmental Panel on Climate Change Workshop on the Use of Scenarios in the Sixth Assessment Report and Subsequent Assessments. Working Group III Technical Support Unit, Imperial College London, United Kingdom, 2023b.
Jewell, J. and Cherp, A.: The feasibility of climate action: Bridging the inside and the outside view through feasibility spaces, WIREs Climate Change, 14, https://doi.org/10.1002/wcc.838, 2023.
Ju, Y., Sugiyama, M., and Shiraki, H.: Perceived feasibility and potential barriers of a net-zero system transition among Japanese experts, Communications Earth & Environment, 4, 431, https://doi.org/10.1038/s43247-023-01079-8, 2023.
Kanitkar, T., Mythri, A., and Jayaraman, T.: Equity assessment of global mitigation pathways in the IPCC Sixth Assessment Report, Climate Policy, 24, 1129–1148, https://doi.org/10.1080/14693062.2024.2319029, 2024.
Kikstra, J. S., Nicholls, Z. R. J., Smith, C. J., Lewis, J., Lamboll, R. D., Byers, E., Sandstad, M., Meinshausen, M., Gidden, M. J., Rogelj, J., Kriegler, E., Peters, G. P., Fuglestvedt, J. S., Skeie, R. B., Samset, B. H., Wienpahl, L., van Vuuren, D. P., van der Wijst, K.-I., Al Khourdajie, A., Forster, P. M., Reisinger, A., Schaeffer, R., and Riahi, K.: The IPCC Sixth Assessment Report WGIII climate assessment of mitigation pathways: from emissions to global temperatures, Geosci. Model Dev., 15, 9075–9109, https://doi.org/10.5194/gmd-15-9075-2022, 2022.
Lau, W. K.-M. and Kim, K.-M.: Competing influences of greenhouse warming and aerosols on Asian summer monsoon circulation and rainfall, Asia-Pacific Journal of Atmospheric Sciences, 53, 181–194, https://doi.org/10.1007/s13143-017-0033-4, 2017.
Lehner, F. and Deser, C.: Origin, importance, and predictive limits of internal climate variability, Environ. Res.: Climate, 2, 023001, https://doi.org/10.1088/2752-5295/accf30, 2023.
Lin, L., Wang, Z., Xu, Y., Fu, Q., and Dong, W.: Larger Sensitivity of Precipitation Extremes to Aerosol Than Greenhouse Gas Forcing in CMIP5 Models, Journal of Geophysical Research: Atmospheres, 123, 8062–8073, https://doi.org/10.1029/2018JD028821, 2018.
Liu, P. R. and Raftery, A. E.: Country-based rate of emissions reductions should increase by 80% beyond nationally determined contributions to meet the 2 ° C target, Communications Earth & Environment, 2, 29, https://doi.org/10.1038/s43247-021-00097-8, 2021.
Mace, M., Fyson, C., Schaeffer, M., and Hare, W.: Large-Scale Carbon Dioxide Removal to Meet the 1.5°C Limit: Key Governance Gaps, Challenges and Priority Responses, Global Policy, 12, 67–81, https://doi.org/10.1111/1758-5899.12921, 2021.
Mastrandrea, M. D., Mach, K. J., Plattner, G. K., Edenhofer, O., Stocker, T. F., Field, C. B., Ebi, K. L., and Matschoss, P. R.: The IPCC AR5 guidance note on consistent treatment of uncertainties: A common approach across the working groups, Climatic Change, 108, 675–691, https://doi.org/10.1007/s10584-011-0178-6, 2011.
McGlade, C. and Ekins, P.: The geographical distribution of fossil fuels unused when limiting global warming to 2° C, Nature, 517, 187–190, https://doi.org/10.1038/nature14016, 2015.
McKenna, C. M., Maycock, A. C., Forster, P. M., Smith, C. J., and Tokarska, K. B.: Stringent mitigation substantially reduces risk of unprecedented near-term warming rates, Nature Climate Change, 11, 126–131, https://doi.org/10.1038/s41558-020-00957-9, 2021.
Meinshausen, M., Schleussner, C.-F., Beyer, K., Bodeker, G., Boucher, O., Canadell, J. G., Daniel, J. S., Diongue-Niang, A., Driouech, F., Fischer, E., Forster, P., Grose, M., Hansen, G., Hausfather, Z., Ilyina, T., Kikstra, J. S., Kimutai, J., King, A. D., Lee, J.-Y., Lennard, C., Lissner, T., Nauels, A., Peters, G. P., Pirani, A., Plattner, G.-K., Pörtner, H., Rogelj, J., Rojas, M., Roy, J., Samset, B. H., Sanderson, B. M., Séférian, R., Seneviratne, S., Smith, C. J., Szopa, S., Thomas, A., Urge-Vorsatz, D., Velders, G. J. M., Yokohata, T., Ziehn, T., and Nicholls, Z.: A perspective on the next generation of Earth system model scenarios: towards representative emission pathways (REPs), Geosci. Model Dev., 17, 4533–4559, https://doi.org/10.5194/gmd-17-4533-2024, 2024.
Melnikova, I., Boucher, O., Cadule, P., Tanaka, K., Gasser, T., Hajima, T., Quilcaille, Y., Shiogama, H., Séférian, R., Tachiiri, K., Vuichard, N., Yokohata, T., and Ciais, P.: Impact of bioenergy crop expansion on climate–carbon cycle feedbacks in overshoot scenarios, Earth Syst. Dynam., 13, 779–794, https://doi.org/10.5194/esd-13-779-2022, 2022.
Moore, F. C., Lacasse, K., Mach, K. J., Shin, Y. A., Gross, L. J., and Beckage, B.: Determinants of emissions pathways in the coupled climate–social system, Nature, 603, 103–111, https://doi.org/10.1038/s41586-022-04423-8, 2022.
Nicholls, Z., Kikstra, J., Zecchetto, M., and Hoegner, A.: CMIP7 ScenarioMIP historical timeseries for harmonisation and simple climate model workflow (2025.11.04), Zenodo [data set], https://doi.org/10.5281/zenodo.17527153, 2025a.
Nicholls, Z., Meinshausen, M., Pflüger, M., and Lewis, J.: CMIP GHG Forcing (v1.0.0), Zenodo, https://doi.org/10.5281/zenodo.14892947, 2025b.
Odenweller, A., Ueckerdt, F., Nemet, G. F., Jensterle, M., and Luderer, G.: Probabilistic feasibility space of scaling up green hydrogen supply, Nature Energy, 7, 854–865, https://doi.org/10.1038/s41560-022-01097-4, 2022.
O'Neill, B. C., Tebaldi, C., van Vuuren, D. P., Eyring, V., Friedlingstein, P., Hurtt, G., Knutti, R., Kriegler, E., Lamarque, J.-F., Lowe, J., Meehl, G. A., Moss, R., Riahi, K., and Sanderson, B. M.: The Scenario Model Intercomparison Project (ScenarioMIP) for CMIP6, Geosci. Model Dev., 9, 3461–3482, https://doi.org/10.5194/gmd-9-3461-2016, 2016.
Persad, G. G., Samset, B. H., and Wilcox, L. J.: Aerosols must be included in climate risk assessments, Nature 611, 662–664, https://doi.org/10.1038/d41586-022-03763-9, 2022.
Pfleiderer, P., Frölicher, T. L., Kropf, C. M., Lamboll, R. D., Lejeune, Q., Capela Lourenço, T., Maussion, F., McCaughey, J. W., Quilcaille, Y., Rogelj, J., Sanderson, B., Schuster, L., Sillmann, J., Smith, C., Theokritoff, E., and Schleussner, C.-F.: Reversal of the impact chain for actionable climate information, Nature Geoscience, 18, 10–19, https://doi.org/10.1038/s41561-024-01597-w, 2025.
Reisinger, A., Fuglestvedt, J. S., Pirani, A., Geden, O., Jones, C. D., Maharaj, S., Poloczanska, E. S., Morelli, A., Johansen, T. G., Adler, C., Betts, R. A., and Seneviratne, S. I.: Overshoot: A Conceptual Review of Exceeding and Returning to Global Warming of 1.5° C, Annual Review of Environment and Resources, 50, 185–217, https://doi.org/10.1146/annurev-environ-111523-102029, 2025.
Rennert, K., Errickson, F., Prest, B. C., Rennels, L., Newell, R. G., Pizer, W., Kingdon, C., Wingenroth, J., Cooke, R., Parthum, B., Smith, D., Cromar, K., Diaz, D., Moore, F. C., Müller, U. K., Plevin, R. J., Raftery, A. E., Ševčíková, H., Sheets, H., Stock, J. H., Tan, T., Watson, M., Wong, T. E., and Anthoff, D.: Comprehensive evidence implies a higher social cost of CO2, Nature, 610, 687–692, https://doi.org/10.1038/s41586-022-05224-9, 2022.
Riahi, K., van Vuuren, D. P., Kriegler, E., Edmonds, J., O'Neill, B. C., Fujimori, S., Bauer, N., Calvin, K., Dellink, R., Fricko, O., Lutz, W., Popp, A., Cuaresma, J. C., Kc, S., Leimbach, M., Jiang, L., Kram, T., Rao, S., Emmerling, J., Ebi, K., Hasegawa, T., Havlik, P., Humpenöder, F., Da Silva, L. A., Smith, S., Stehfest, E., Bosetti, V., Eom, J., Gernaat, D., Masui, T., Rogelj, J., Strefler, J., Drouet, L., Krey, V., Luderer, G., Harmsen, M., Takahashi, K., Baumstark, L., Doelman, J. C., Kainuma, M., Klimont, Z., Marangoni, G., Lotze-Campen, H., Obersteiner, M., Tabeau, A., and Tavoni, M.: The Shared Socioeconomic Pathways and their energy, land use, and greenhouse gas emissions implications: An overview, Global Environmental Change, 42, 153–168, https://doi.org/10.1016/j.gloenvcha.2016.05.009, 2017.
Riahi, K., Schaeffer, R., Arango, J., Calvin, K., Guivarch, C., Hasegawa, T., Jiang, K., Kriegler, E., Matthews, R., Peters, G., Rao, A., Robertson, S., Sebbit, A. M., Steinberger, J., Tavoni, M., and Vuuren, D. v.: Chapter 3: Mitigation Pathways Compatible with Long-Term Goals, in: IPCC Working Group III contribution to the Sixth Assessment report, IPCC, edited by: Skea, J., Skea, J., Slade, R., Al Khourdajie, A., van Diemen, R., McCollum, D., Pathak, M., Some, S., Vyas, P., Fradera, R., Belkacemi, M., Hasija, A., Lisboa, G., Luz, S., and Malley, J., Cambridge University Press, Cambridge, 2022.
Ritchie, J. and Dowlatabadi, H.: Why do climate change scenarios return to coal?, Energy, 140, 1276–1291, https://doi.org/10.1016/j.energy.2017.08.083, 2017.
Roelfsema, M., van Soest, H. L., Harmsen, M., van Vuuren, D. P., Bertram, C., den Elzen, M., Höhne, N., Iacobuta, G., Krey, V., Kriegler, E., Luderer, G., Riahi, K., Ueckerdt, F., Després, J., Drouet, L., Emmerling, J., Frank, S., Fricko, O., Gidden, M., Humpenöder, F., Huppmann, D., Fujimori, S., Fragkiadakis, K., Gi, K., Keramidas, K., Köberle, A. C., Aleluia Reis, L., Rochedo, P., Schaeffer, R., Oshiro, K., Vrontisi, Z., Chen, W., Iyer, G. C., Edmonds, J., Kannavou, M., Jiang, K., Mathur, R., Safonov, G., and Vishwanathan, S. S.: Taking stock of national climate policies to evaluate implementation of the Paris Agreement, Nature Communications, 11, https://doi.org/10.1038/s41467-020-15414-6, 2020.
Rogelj, J., Fransen, T., den Elzen, M. G. J., Lamboll, R. D., Schumer, C., Kuramochi, T., Hans, F., Mooldijk, S., and Portugal-Pereira, J.: Credibility gap in net-zero climate targets leaves world at high risk, Science, 380, 1014–1016, https://doi.org/10.1126/science.adg6248, 2023.
Rogner, H. H.: An assessment of world hydrocarbon resources, Annual Review of Environment and Resources, 22, 217–262, https://doi.org/10.1146/annurev.energy.22.1.217, 1997.
Rubiano Rivadeneira, N. and Carton, W.: (In)justice in modelled climate futures: A review of integrated assessment modelling critiques through a justice lens, Energy Research & Social Science, 92, 102781, https://doi.org/10.1016/j.erss.2022.102781, 2022.
Sanderson, B. and Smith, C.: Indicative ScenarioMIP emissions and climate projections, Zenodo [data set], https://doi.org/10.5281/zenodo.14382495, 2025.
Sanderson, B. M., Booth, B. B. B., Dunne, J., Eyring, V., Fisher, R. A., Friedlingstein, P., Gidden, M. J., Hajima, T., Jones, C. D., Jones, C. G., King, A., Koven, C. D., Lawrence, D. M., Lowe, J., Mengis, N., Peters, G. P., Rogelj, J., Smith, C., Snyder, A. C., Simpson, I. R., Swann, A. L. S., Tebaldi, C., Ilyina, T., Schleussner, C.-F., Séférian, R., Samset, B. H., van Vuuren, D., and Zaehle, S.: The need for carbon-emissions-driven climate projections in CMIP7, Geosci. Model Dev., 17, 8141–8172, https://doi.org/10.5194/gmd-17-8141-2024, 2024.
Schlichenmaier, S. and Naegler, T.: May material bottlenecks hamper the global energy transition towards the 1.5° C target?, Energy Reports, 8, 14875–14887, https://doi.org/10.1016/j.egyr.2022.11.025, 2022.
Séférian, R., Berthet, S., Yool, A., Palmiéri, J., Bopp, L., Tagliabue, A., Kwiatkowski, L., Aumont, O., Christian, J., Dunne, J., Gehlen, M., Ilyina, T., John, J. G., Li, H., Long, M. C., Luo, J. Y., Nakano, H., Romanou, A., Schwinger, J., Stock, C., Santana-Falcón, Y., Takano, Y., Tjiputra, J., Tsujino, H., Watanabe, M., Wu, T., Wu, F., and Yamamoto, A.: Tracking Improvement in Simulated Marine Biogeochemistry Between CMIP5 and CMIP6, Current Climate Change Reports, 6, 95–119, https://doi.org/10.1007/s40641-020-00160-0, 2020.
Skeie, R. B., Byrom, R., Hodnebrog, Ø., Jouan, C., and Myhre, G.: Multi-model effective radiative forcing of the 2020 sulfur cap for shipping, Atmos. Chem. Phys., 24, 13361–13370, https://doi.org/10.5194/acp-24-13361-2024, 2024.
Smith, C.: fair calibration data (1.5.0), Zenodo [data set], https://doi.org/10.5281/zenodo.17392386, 2025.
Smith, C., Cummins, D. P., Fredriksen, H.-B., Nicholls, Z., Meinshausen, M., Allen, M., Jenkins, S., Leach, N., Mathison, C., and Partanen, A.-I.: fair-calibrate v1.4.1: calibration, constraining, and validation of the FaIR simple climate model for reliable future climate projections, Geosci. Model Dev., 17, 8569–8592, https://doi.org/10.5194/gmd-17-8569-2024, 2024.
Stehfest, E., Bouwman, L., van Vuuren, D. P., den Elzen, M. G. J., Eickhout, B., and Kabat, P.: Climate benefits of changing diet, Climatic Change, 95, 83–102, 2009.
Tebaldi, C., O'Neill, B., and Lamarque, J. F.: Sensitivity of regional climate to global temperature and forcing, Environ. Res. Lett., 10, 074001, https://doi.org/10.1088/1748-9326/10/7/074001, 2015.
Tebaldi, C., Debeire, K., Eyring, V., Fischer, E., Fyfe, J., Friedlingstein, P., Knutti, R., Lowe, J., O'Neill, B., Sanderson, B., van Vuuren, D., Riahi, K., Meinshausen, M., Nicholls, Z., Tokarska, K. B., Hurtt, G., Kriegler, E., Lamarque, J.-F., Meehl, G., Moss, R., Bauer, S. E., Boucher, O., Brovkin, V., Byun, Y.-H., Dix, M., Gualdi, S., Guo, H., John, J. G., Kharin, S., Kim, Y., Koshiro, T., Ma, L., Olivié, D., Panickal, S., Qiao, F., Rong, X., Rosenbloom, N., Schupfner, M., Séférian, R., Sellar, A., Semmler, T., Shi, X., Song, Z., Steger, C., Stouffer, R., Swart, N., Tachiiri, K., Tang, Q., Tatebe, H., Voldoire, A., Volodin, E., Wyser, K., Xin, X., Yang, S., Yu, Y., and Ziehn, T.: Climate model projections from the Scenario Model Intercomparison Project (ScenarioMIP) of CMIP6, Earth Syst. Dynam., 12, 253–293, https://doi.org/10.5194/esd-12-253-2021, 2021.
Tebaldi, C., Wehner, M., Leung, R., and Lawrence, D.: Is land use producing robust signals in future projections from Earth system models, all else being equal?, Environmental Research Letters, 18, 084009, https://doi.org/10.1088/1748-9326/ace3da, 2023.
van Soest, H. L., Aleluia Reis, L., Baptista, L. B., Bertram, C., Després, J., Drouet, L., den Elzen, M., Fragkos, P., Fricko, O., Fujimori, S., Grant, N., Harmsen, M., Iyer, G., Keramidas, K., Köberle, A. C., Kriegler, E., Malik, A., Mittal, S., Oshiro, K., Riahi, K., Roelfsema, M., van Ruijven, B., Schaeffer, R., Silva Herran, D., Tavoni, M., Unlu, G., Vandyck, T., and van Vuuren, D. P.: Global roll-out of comprehensive policy measures may aid in bridging emissions gap, Nature Communications, 12, https://doi.org/10.1038/s41467-021-26595-z, 2021.
van Vuuren, D. P., Kriegler, E., O'Neill, B. C., Ebi, K. L., Riahi, K., Carter, T. R., Edmonds, J., Hallegatte, S., Kram, T., Mathur, R., and Winkler, H.: A new scenario framework for Climate Change Research: Scenario matrix architecture, Climatic Change, 122, 373–386, https://doi.org/10.1007/s10584-013-0906-1, 2014.
van Vuuren, D. P., Riahi, K., Calvin, K., Dellink, R., Emmerling, J., Fujimori, S., Kc, S., Kriegler, E., and O'Neill, B.: The Shared Socio-economic Pathways: Trajectories for human development and global environmental change, Global Environmental Change, 42, 148–152, https://doi.org/10.1016/j.gloenvcha.2016.10.009, 2017.
Visioni, D., Robock, A., Haywood, J., Henry, M., Tilmes, S., MacMartin, D. G., Kravitz, B., Doherty, S. J., Moore, J., Lennard, C., Watanabe, S., Muri, H., Niemeier, U., Boucher, O., Syed, A., Egbebiyi, T. S., Séférian, R., and Quaglia, I.: G6-1.5K-SAI: a new Geoengineering Model Intercomparison Project (GeoMIP) experiment integrating recent advances in solar radiation modification studies, Geosci. Model Dev., 17, 2583–2596, https://doi.org/10.5194/gmd-17-2583-2024, 2024.
Westervelt, D. M., Mascioli, N. R., Fiore, A. M., Conley, A. J., Lamarque, J.-F., Shindell, D. T., Faluvegi, G., Previdi, M., Correa, G., and Horowitz, L. W.: Local and remote mean and extreme temperature response to regional aerosol emissions reductions, Atmos. Chem. Phys., 20, 3009–3027, https://doi.org/10.5194/acp-20-3009-2020, 2020.
Wilcox, L. J., Allen, R. J., Samset, B. H., Bollasina, M. A., Griffiths, P. T., Keeble, J., Lund, M. T., Makkonen, R., Merikanto, J., O'Donnell, D., Paynter, D. J., Persad, G. G., Rumbold, S. T., Takemura, T., Tsigaridis, K., Undorf, S., and Westervelt, D. M.: The Regional Aerosol Model Intercomparison Project (RAMIP), Geosci. Model Dev., 16, 4451–4479, https://doi.org/10.5194/gmd-16-4451-2023, 2023.
Willett, W., Rockström, J., Loken, B., Springmann, M., Lang, T., Vermeulen, S., Garnett, T., Tilman, D., DeClerck, F., Wood, A., Jonell, M., Clark, M., Gordon, L. J., Fanzo, J., Hawkes, C., Zurayk, R., Rivera, J. A., De Vries, W., Majele Sibanda, L., Afshin, A., Chaudhary, A., Herrero, M., Agustina, R., Branca, F., Lartey, A., Fan, S., Crona, B., Fox, E., Bignet, V., Troell, M., Lindahl, T., Singh, S., Cornell, S. E., Srinath Reddy, K., Narain, S., Nishtar, S., and Murray, C. J. L.: Food in the Anthropocene: the EAT–Lancet Commission on healthy diets from sustainable food systems, The Lancet, 393, 447–492, https://doi.org/10.1016/S0140-6736(18)31788-4, 2019.
Wilson, C., Grubler, A., Bento, N., Healey, S., De Stercke, S., and Zimm, C.: Granular technologies to accelerate decarbonization, Science, 368, 36–39, https://doi.org/10.1126/science.aaz8060, 2020.
Zimm, C., Mintz-Woo, K., Brutschin, E., Hanger-Kopp, S., Hoffmann, R., Kikstra, J. S., Kuhn, M., Min, J., Muttarak, R., Pachauri, S., Patange, O., Riahi, K., and Schinko, T.: Justice considerations in climate research, Nature Climate Change, 14, 22–30, https://doi.org/10.1038/s41558-023-01869-0, 2024.
In this paper, we are specifically concerned with those scenarios that are used as external forcings to climate models, including Earth System Models (ESMs), General Circulation Models (GCMs), Climate Models of Intermediate or Reduced Complexity (CMICs) and Simple Climate Models (SCMs). These external forcings encompass elements such as emissions and atmospheric concentrations of greenhouse gases, chemically reactive gases, aerosols, and land use.
Various model types exist to explore the physical climate system, including Earth System Models (ESMs), General Circulation Models (GCMs), EMICs (Earth System Models of Intermediate Complexity) and SCMs (Simple Climate Models). Here, we use the term ESM to refer to all types of climate models.
We use the term scenarios here for internally consistent, comprehensive descriptions of the future. The term pathways is sometimes used to refer to specific scenario elements (such as socio-economic development). We adopt this use of the term pathways here. In other literature, the term pathways is sometimes used to refer to goal-oriented scenarios or the terms scenarios and pathways are sometimes used interchangeably.
- Abstract
- Introduction
- Overall experimental design
- Further elaboration of the design of the emission scenarios for CMIP7
- Scenario extensions beyond 2100 AD
- Representation of carbon dioxide removal
- Discussion and conclusions
- Appendix A: Acronyms
- Code and data availability
- Author contributions
- Competing interests
- Disclaimer
- Acknowledgements
- Financial support
- Review statement
- References