the Creative Commons Attribution 4.0 License.
the Creative Commons Attribution 4.0 License.
 | 19 Mar 2026
Improvement of the computational efficiency in SVD-3DEnVar data assimilation scheme and its preliminary application to the TRAMS 3.0 model
Daosheng Xu
Fei Zheng
Juanxiong He
Chun Li
Jeremy Cheuk-Hin Leung
Mingyang Zhang
Dingchi Zhao
Quanjun He
Yuewei Zhang
Yi Li
Banglin Zhang
Although the Singular Value Decomposition-three Dimensional Ensemble Variational (SVD-3DEnVar) data assimilation scheme has achieved successful application in real case simulations with comprehensive numerical weather prediction models, its computational efficiency still falls short of meeting the demands of operational numerical prediction. The main limitations lie in the generation of three-dimensional perturbations and the implementation of parallel calculations. To bridge this gap towards operational readiness, this study introduces key computational optimizations: a new three-dimensional perturbation field generation scheme that supports multi-process parallelism and can directly generate any specified grid, and an efficient parallel implementation scheme tailored for the local patch assimilation in the SVD-3DEnVar scheme. Results from Observing System Simulation Experiment (OSSE) based on the Tropical Regional Atmospheric Model System (TRAMS) indicate that after computational efficiency optimization, the time required to generate a 3D perturbation field was reduced from 22 min to 2.2 s, while the runtime of the assimilation process decreased from costly serial execution, to 1700 min under single-node parallel execution (with 64 cores), and further to less than 15 min (using 150 nodes in parallel). Finally, we conducted an assimilation experiment using actual observational data of sea surface wind fields to preliminarily validate the reasonableness of the assimilation results from the optimized SVD-3DEnVar scheme.
- Article
(22321 KB) - Full-text XML
- BibTeX
- EndNote


The accuracy of typhoon numerical forecasting is highly sensitive to the quality of the initial conditions. The accuracy of the large-scale environmental flow surrounding a typhoon largely determines the typhoon's subsequent track; meanwhile, initial errors in the mesoscale and convective systems within the typhoon core can rapidly amplify and affect the predictability of typhoon intensity (Wang and Wu, 2004; Weng and Zhang, 2012; Xu et al., 2025a). Data assimilation, by effectively integrating observations from multiple platforms such as satellites, radars, and dropwindsondes with the background field (short-range forecasts) of numerical models, can produce an initial state that is physically consistent and closer to the true atmosphere, including a realistic typhoon vortex structure and its surrounding environment (e.g., steering flow), thereby enhancing the ability of numerical models to forecast typhoon tracks and intensity (Bauer et al., 2015; Wu et al., 2007). With the continuous increase in satellite observations in recent years, the importance of assimilating these data to improve typhoon forecasts has become increasingly evident (Li et al., 2019; Xiao et al., 2023; Yang et al., 2018; Zhang et al., 2022c). Beyond meteorological forecasting, data assimilation has also been effectively applied in hydrological and environmental modeling to integrate multi-source observations, such as combining satellite-derived vegetation indices with in-situ measurements to improve the analysis of land surface and subsurface processes (e.g., Zafarmomen et al., 2024).
Typhoon observations over the ocean primarily rely on satellite data. The nonlinear nature of the observation operators and the high temporal and spatial resolution characteristics of these observations place high demands on the performance of data assimilation schemes. Therefore, the continuous improvement of data assimilation techniques is one of the key factors driving the enhancement of typhoon numerical forecasting accuracy. In early operational typhoon forecasting, 3-Dimensional Variational (3DVAR) scheme was commonly used for data assimilation. The main limitation of this method is that it uses static, climatological background error covariance to propagate observation information (Lorenc, 2003; Bannister, 2008). This poses significant limitations when dealing with strong nonlinear and rapidly evolving weather systems like typhoons. For instance, it may erroneously propagate information from high-level clouds to clear lower-level areas, resulting in spurious structures in the analysis field, which in turn affects the improvement of typhoon forecasts through data assimilation. To overcome the limitation of 3DVar in accounting for the flow-dependent nature of background error covariance, several improvements have been proposed, including four-dimensional variational assimilation and ensemble-variational hybrid assimilation methods, which have led to the development of numerous related schemes (e.g., Qiu et al., 2007; Tian and Feng, 2015; Tian et al., 2008; Tian et al., 2011; Wang et al., 2010, 2008, 2013; Zhang et al., 2022a, 2019). These schemes have gradually become mainstream choices in both research and operational applications (Lorenc and Jardak, 2018).
Compared to traditional ensemble-variational hybrid assimilation schemes, the Singular Value Decomposition-three Dimensional Ensemble Variational (SVD-3DEnVar) method (Qiu et al., 2007) is characterized by using singular value decomposition to implicitly represent the covariance relationship between observation increments and background errors, thereby avoiding the computational and storage burdens associated with directly updating the background error covariance matrix. In early implementations of SVD-3DEnVar (e.g., Shao et al., 2009; Zhang et al., 2009), the method directly performed eigenvector decomposition on the entire background field, which caused observations to also adjust distant parts of the background field. For real weather forecasting models with higher dimensions and fewer ensemble samples, such distant correlations are often unreliable and need to be removed using localization techniques. Xu et al. (2011a, b, 2012) localized the SVD-3DEnVar method by employing a local patch assimilation approach and introduced a Gaussian function to further process the observational data. Although this localization strategy enabled successful assimilation of radar data in WRF (Weather Research and Forecasting)-based experiments, applying it to operational systems still faces challenges in computational efficiency.
The main factors limiting the computational efficiency of the SVD-3DEnVar scheme lie in the initial perturbation generation and parallel implementation. Unlike traditional ensemble assimilation schemes (such as EnKF), which directly update each ensemble member during cyclic assimilation, SVD-3DEnVar only assimilates and updates the control forecast. Therefore, after each assimilation cycle, the updated analysis field must be perturbed again to generate the initial conditions for the next cycle's ensemble forecast. This approach has the advantage of avoiding filter divergence and, in the presence of model errors, performs better than EnKF (Qiu et al., 2007). The original ensemble perturbation generation scheme (Evensen, 1994) adopted in SVD-3DEnVar could only support square two-dimensional data, with the constraint that the number of grid points in a single direction must be odd, necessitating additional transformation to overlay with the model background field. This extra processing increased the time consumed in each assimilation cycle. Regarding the assimilation operation, the use of a serial approach to sequentially assimilate each local patch resulted in extremely low efficiency for the SVD-3DEnVar scheme.
To address these issues, this paper aims to optimize the SVD-3DEnVar scheme and improve its efficiency. It should be noted that the ensemble forecast component (i.e., integrating each perturbed initial condition) is also a major computational burden in SVD-3DEnVar. However, since ensemble members are independent, they can be run concurrently if sufficient computational resources are available. Thus, this study will focus on optimizing the perturbation generation and assimilation steps in SVD-3DEnVar. The performance of the optimized SVD-3DEnVar is then tested by applying to the Tropical Regional Atmosphere Model System (TRAMS), aiming to explore its potential application value in operational typhoon numerical forecasting system. This paper is organized as follows: Sect. 2 introduces the models and data used in the study; Sect. 3 presents the SVD-3DEnVar scheme and related technical improvements; Sect. 4 discusses idealized and real-case experimental results based on the TRAMS model; and Sect. 5 provides conclusions and discussions.
The TRAMS version 3.0 (Xu et al., 2020) is used for data assimilation and numerical simulation experiments in this study. The model employs a semi-implicit, semi-Lagrangian method for time integration. The model prognostic variables include the three-dimensional wind field (), potential temperature (θ), water vapor mixing ratio (q), and dimensionless pressure (π), which are distributed on the horizontal and vertical axes using Arakawa C grids and Charney-Phillips grids, respectively. The physics schemes include the scale-aware New Simplified Arakawa-Schubert (NSAS) cumulus parameterization scheme (Han and Pan, 2011), the WRF single-moment 6-class (WSM6) microphysical scheme (Hong et al., 2004), the NCEP (National Centers for Environmental Prediction) Medium-Range Forecast (NMRF) planetary boundary layer scheme (Han and Pan, 2006), the RRTMG long-wave and short-wave radiation scheme (Iacono et al., 2008), and the Slab land-surface model (Dudhia, 1996).
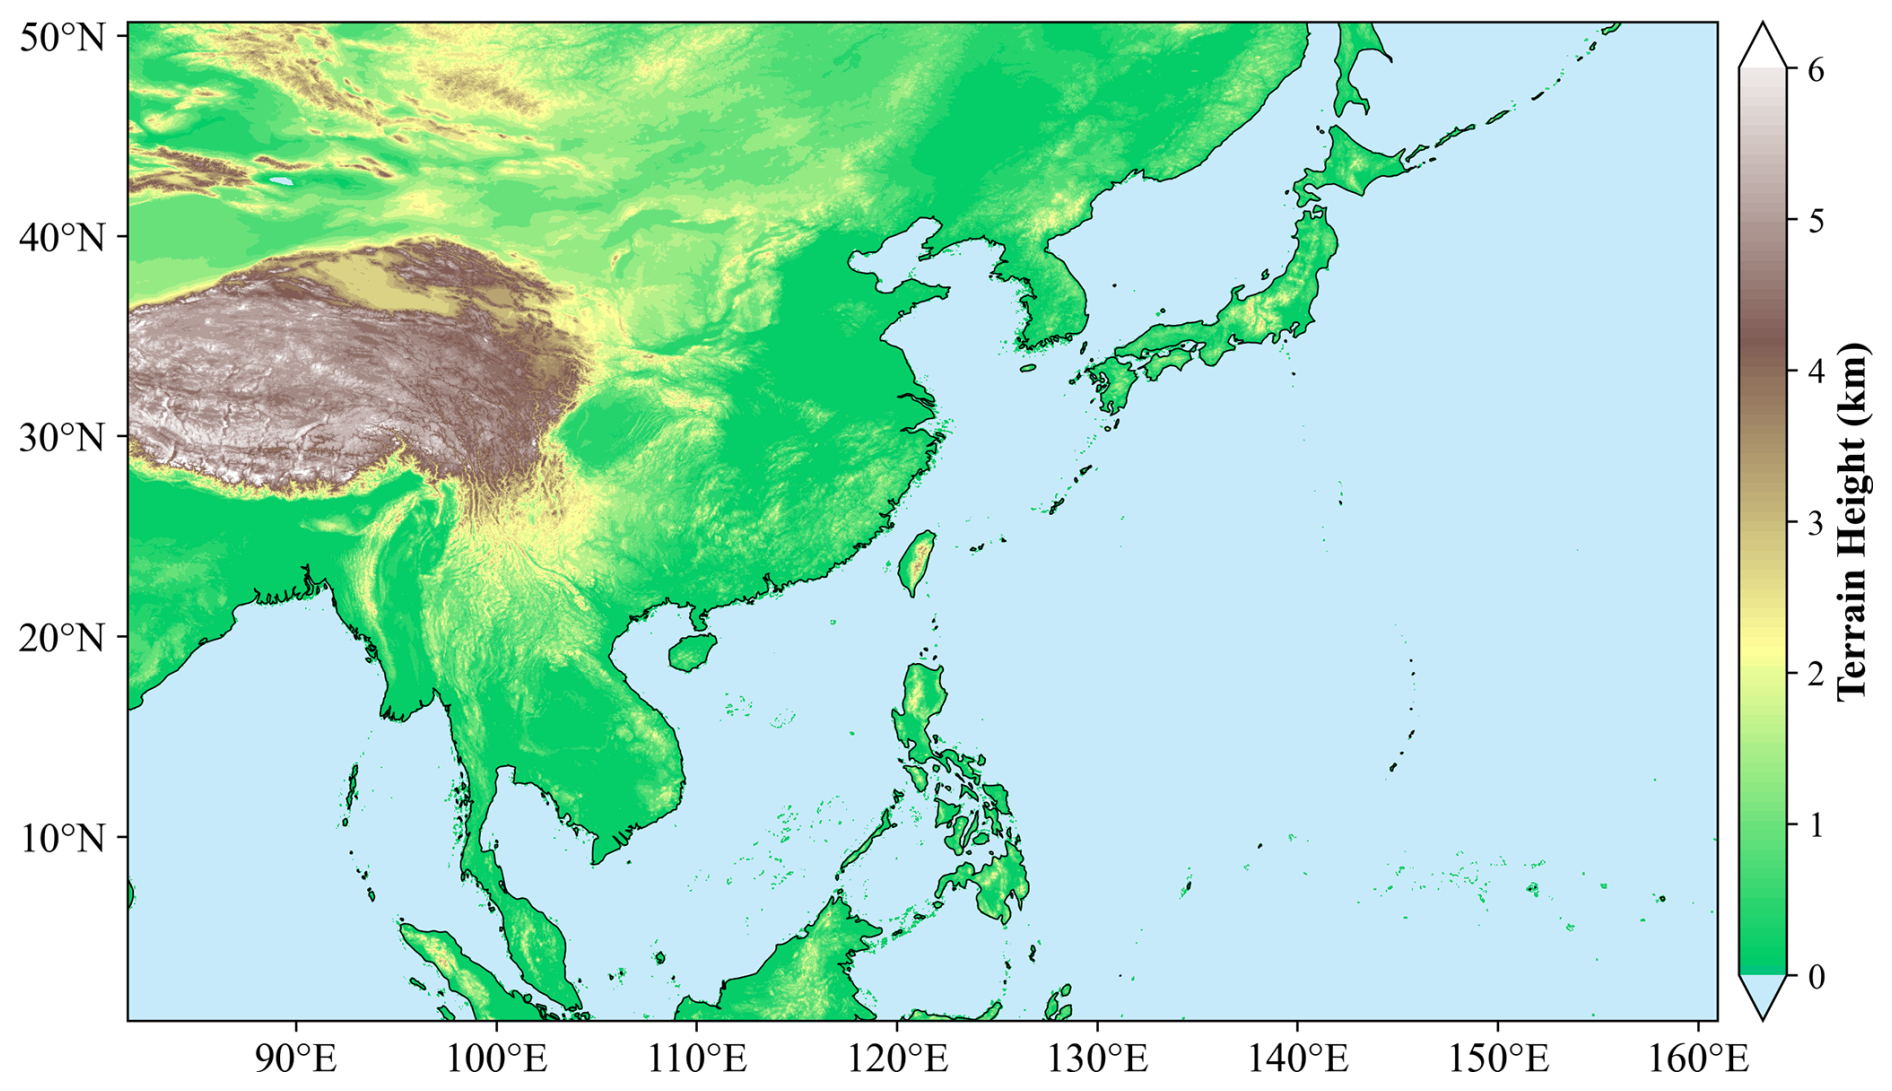
Figure 1Domain of the TRAMS model, with shaded areas representing terrain height (unit: km).
The simulation region is selected based on the area used for operational forecasting (as shown in Fig. 1), with a horizontal resolution of 0.09°. The vertical layering consists of 65 layers, using terrain-following coordinates, with the model top at approximately 31 km.
ERA5 reanalysis data (Hersbach et al., 2020) is used to construct the initial and boundary conditions for the TRAMS model. For the real-data assimilation experiment (Sect. 4.2), sea surface wind field products are derived from multi-source satellite data, including FY3E-WRAD, HY-2B/C/D-SCAT, AMSR2, SMAP, and MWRI. The product has a resolution of 0.25° and a time interval of 6 h. It can effectively capture winds above 30 m s−1, with a root mean square error of approximately 1.5 m s−1 when compared with in-situ ocean observations. Since August 2024, it has been displayed in real time on the operational website of the Guangdong Meteorological Bureau, providing valuable reference for typhoon monitoring and early warning. The satellite-retrieved sea surface wind product used in this study is a blended product that incorporates longer-wavelength microwave radiometer data with better cloud-penetration capability, thereby mitigating the impact of rainfall on wind retrievals. The satellite-derived sea-surface wind product has been bias-corrected prior to assimilation. The typhoon track and intensity observations used for evaluation come from the best-track dataset provided by the China Meteorological Administration's Tropical Cyclone Data Center (Lu et al., 2021; Ying et al., 2014).
Notably, the four-dimensional ensemble-variational (4DEnVar) approach has seen substantial development in recent years, with operational implementations emerging in global forecasting systems such as the UK Met Office's MOGREPS-G (Inverarity et al., 2023) and Météo-France's hybrid covariance framework (Berre and Arbogast, 2024). In specialized applications like hurricane forecasting, advanced 4DEnVar implementations incorporating scale-dependent localization have demonstrated promise in improving vortex analysis (Lu and Wang, 2024). The versatility of ensemble-variational methods is further evidenced by applications in atmospheric chemistry, such as the use of the NLS-4DVar method to improve PM2.5 forecasts through joint optimization of initial conditions and emissions (Zhang et al., 2022b). Although the SVD-based assimilation method can be easily extended to four dimensions (Qiu et al., 2007), the primary goal of this paper is to improve the operational efficiency of the assimilation process. Therefore, the relatively easier-to-implement SVD-En3DVar scheme was chosen. Of course, the optimization improvements proposed in this paper are also applicable to SVD-4DEnVar.
The operational process of the SVD-3DEnVar assimilation scheme includes three main steps: (1) Initialization step (Fig. 2a): The model is initialized to generate the initial field (input) and boundary conditions (bdy). Based on this, the background forecast required for the assimilation process is obtained through direct forecasting. (2) Ensemble perturbation step (Fig. 2b): Perturbations are added to the initial field (the perturbed initial field is denoted as input*) and combined with the boundary conditions (bdy), resulting in a set of ensemble forecast products (ensemble forecast). (3) Assimilation step (Fig. 2c): The observational data (observation) undergo a preprocessing procedure, and valid data are selected according to program input requirements after quality control. Using the preprocessed observation data, ensemble forecast results, and background field, the data assimilation calculation is executed to produce a new analysis field (input_da). This analysis field is used as the initial field for the next forecast cycle. Since the model's start time has changed, the boundary data file (bdy_up) must be updated synchronously before integration begins.
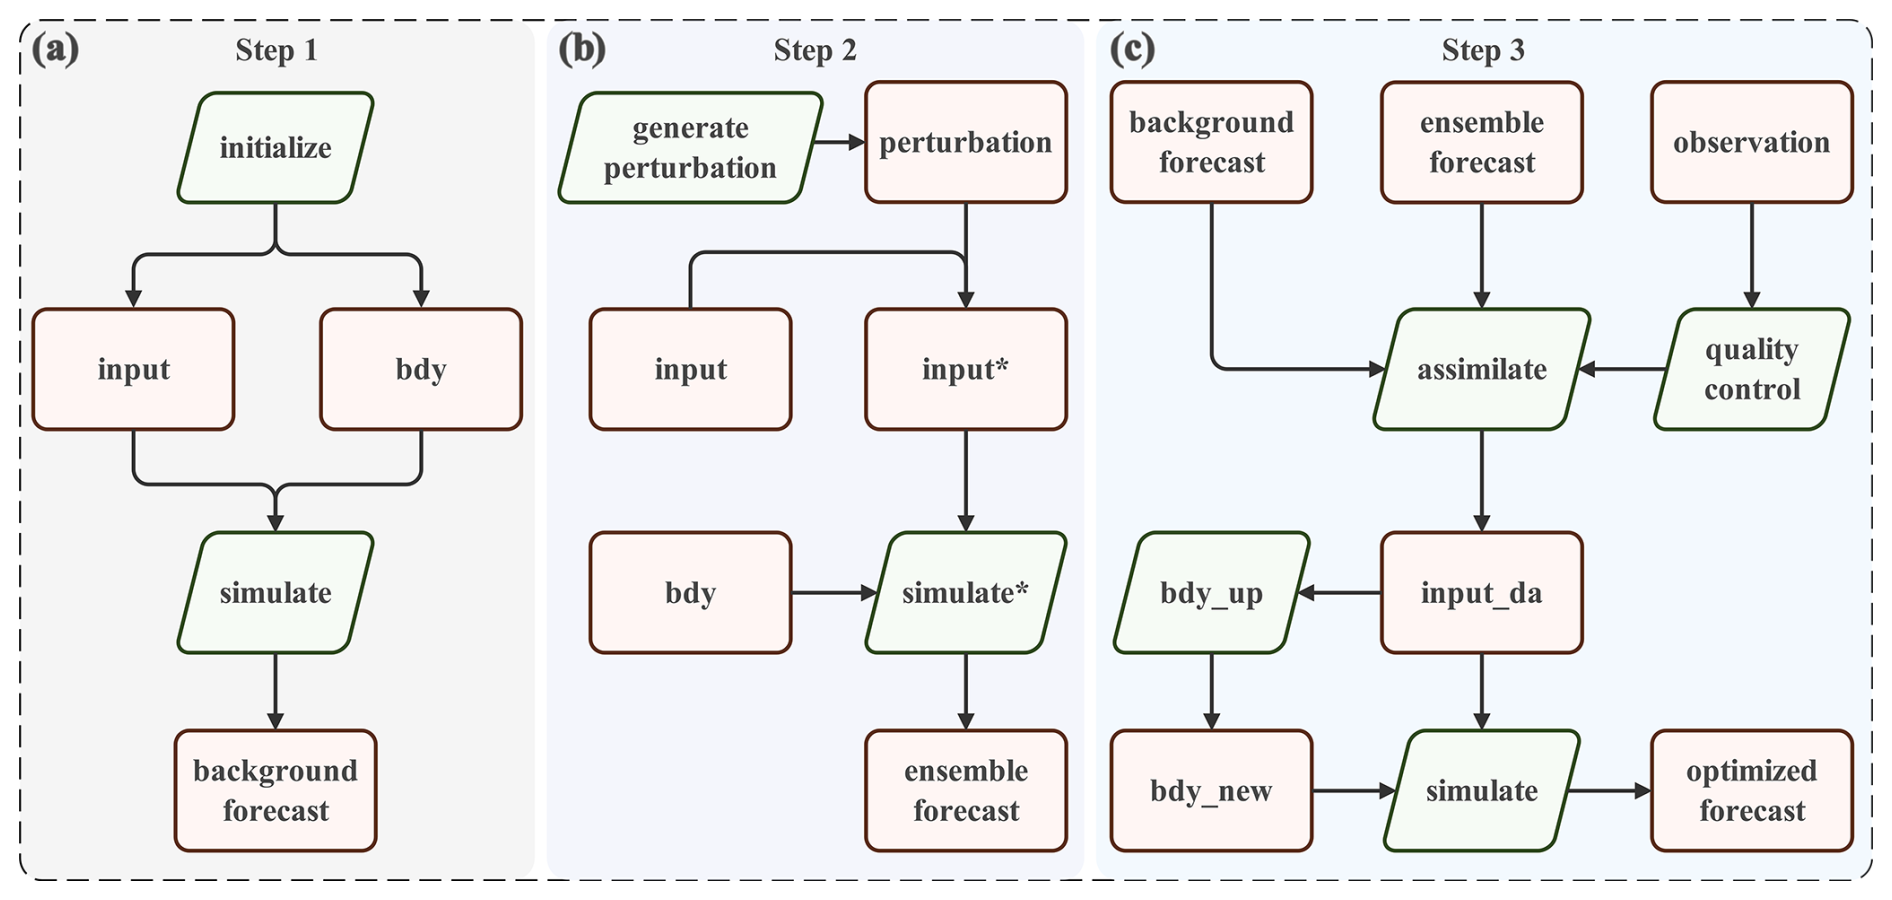
Figure 2Flowchart of the SVD-3DEnVar assimilation scheme: (a) Step 1: Initialization; (b) Step 2: Ensemble perturbation; (c) Step 3: Assimilation. The green parallelograms represent the computational steps included in the assimilation scheme, while the pink rectangles represent the corresponding data files.
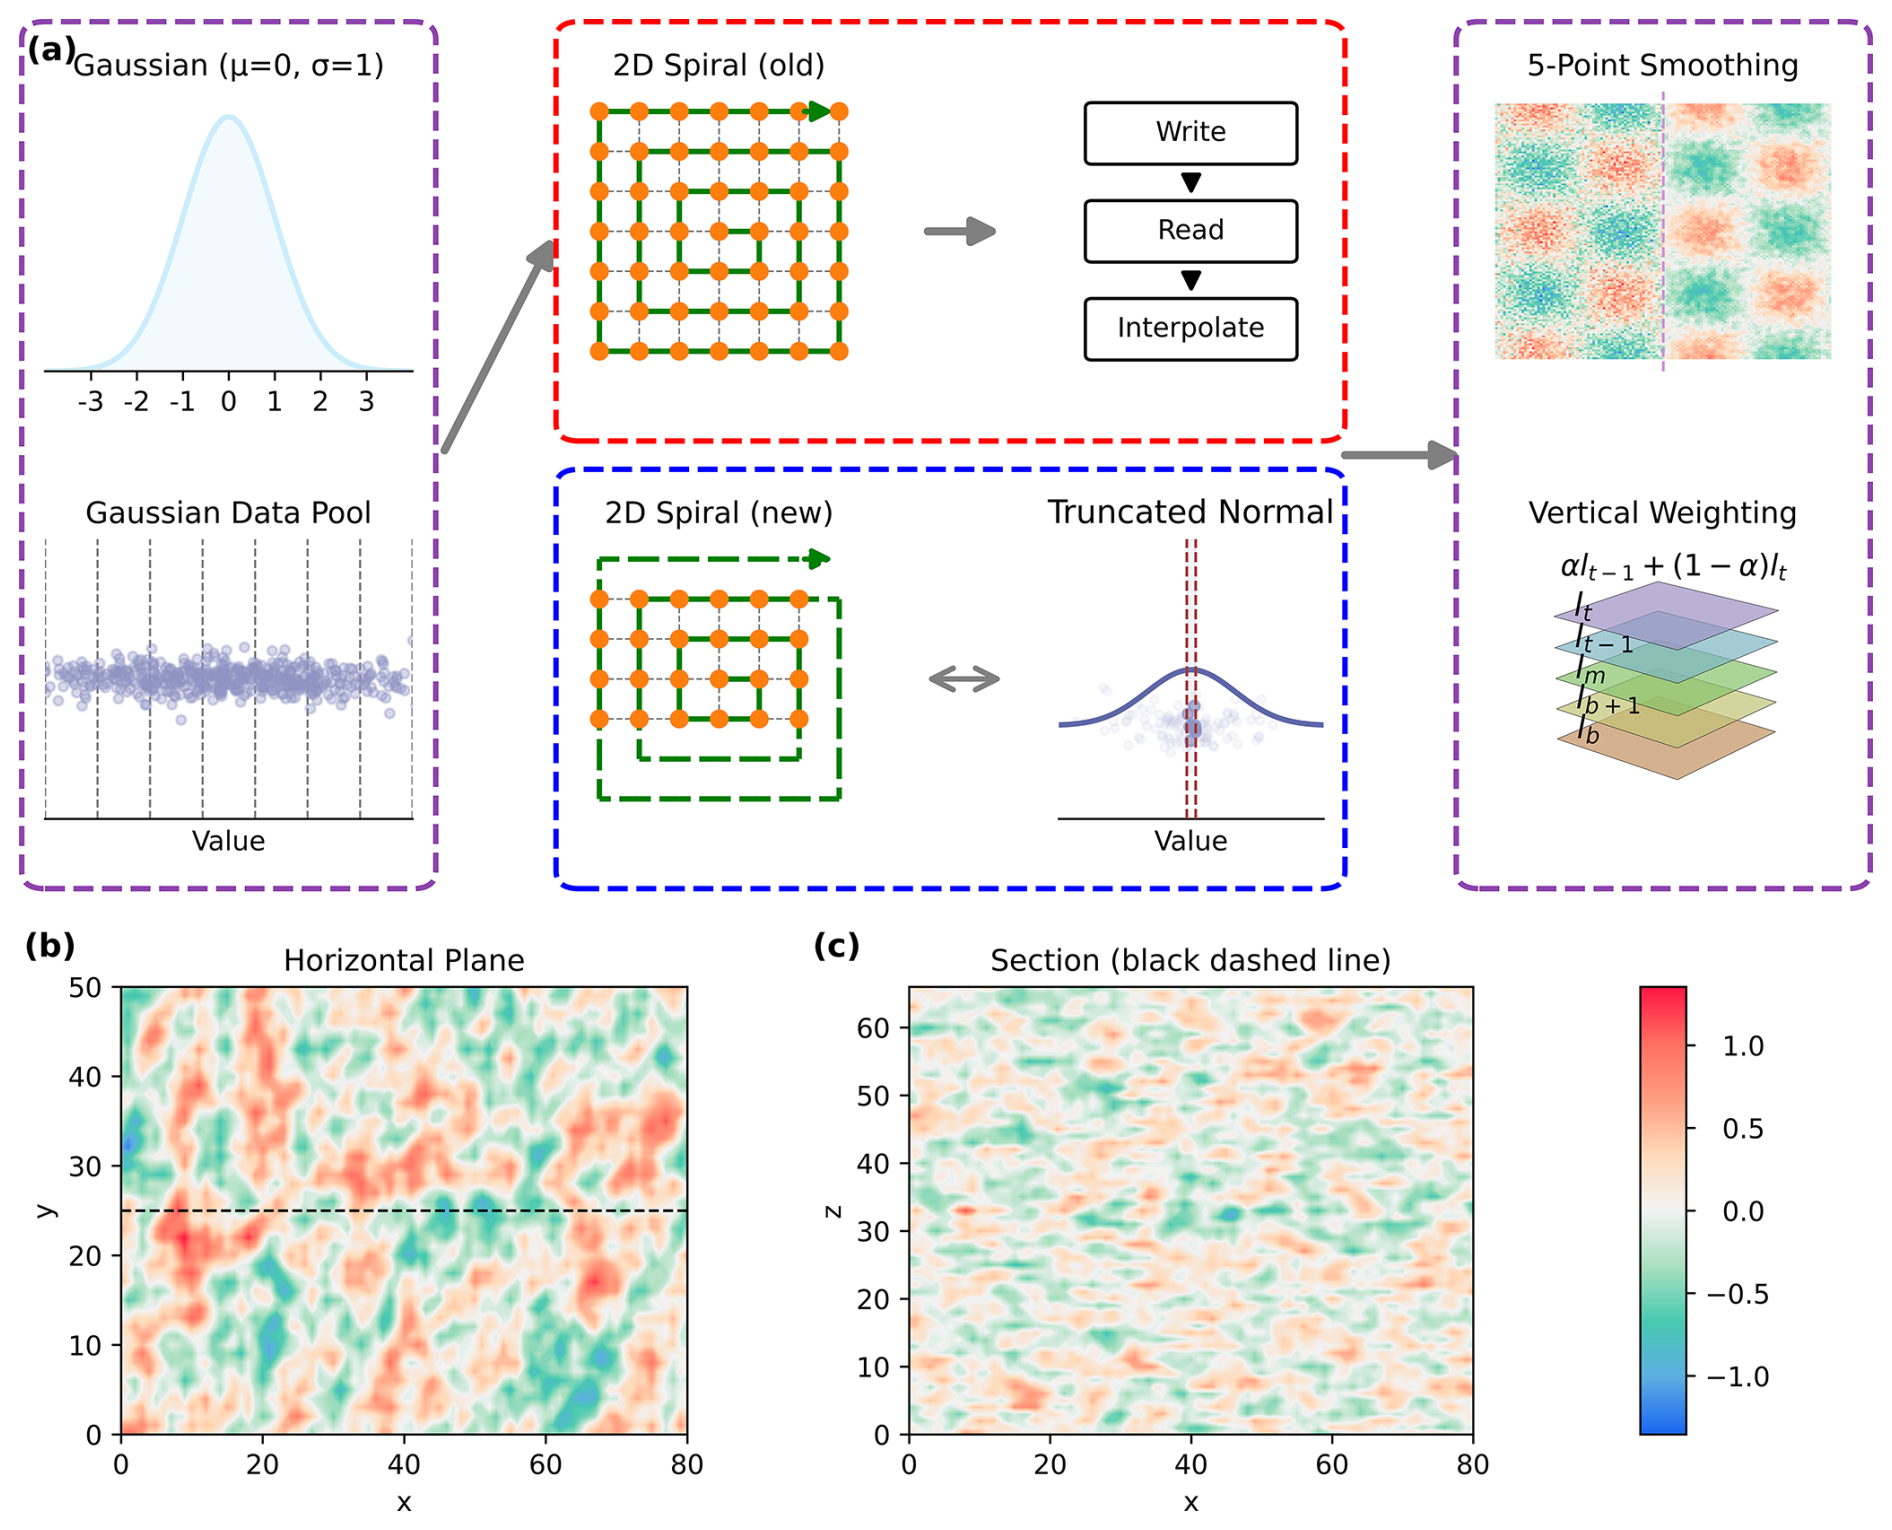
Figure 3(a) Schematic of the optimization process for random perturbation generation in the SVD-3DEnVar scheme; (b) shows the horizontal distribution of the generated perturbation field; (c) shows the vertical cross-section taken along the black dashed line in (b).
The basic principle of the SVD-3DEnVar scheme is introduced below, followed by a description of the optimizations in perturbation construction and parallel implementation developed in this study.
3.1 Overview of SVD-3DEnVar
The assimilation process is set at time t0, where M initial perturbation fields are added to the background field at t0−τ to generate M forecast samples, denoted as the ensemble , where τ is the integration time length. These forecast samples are integrated to the t0 time. At t0, a background field without any perturbation, denoted as ub, is also provided. The forecast perturbation fields are obtained by subtracting the background field from the forecast samples:
Then, the observation perturbation fields are calculated using the observation operator H. The mth forecast perturbation field and the observation perturbation field are combined into a column vector:
These column vectors are assembled into a matrix, denoted as A:
Matrix A is subjected to singular value decomposition (SVD):
where Λ is a diagonal matrix consisting of singular values of A ( arranged in descending order, and B and V are orthogonal matrices composed of the left and right singular vectors of A, respectively. It is noteworthy that the matrix A has dimensions of , where Nx and Ny represent the dimensions of model variables and observations within the local patch, respectively. The local patch strategy effectively reduces both Nx and Ny by restricting the analysis to a small neighborhood around each grid point, making the SVD computationally feasible without sacrificing the flow-dependent covariance information. According to Eq. (2), the matrix B of left singular vectors of A is correspondingly partitioned into two parts:
where and belong to the model variable space and the observation variable space, respectively.
Let be the vector to be expanded in terms of the left singular vectors:
where K is the truncation order, which needs to be less than the rank of the ensemble perturbation matrix A (i.e., r =rank(A)) and cannot exceed the ensemble size M. The coefficient vector is to be determined by minimizing the cost function. From this, the following relations can be derived:
and
where bu and bd are matrices formed by collecting and , respectively.
The incremental form of the 3DVar objective function is as follows:
where P is the background error covariance matrix, which, similar to ensemble-based assimilation methods, can be approximated as , while ΛK is the diagonal matrix consisting of the first K largest singular values of the ensemble perturbation matrix A; O is the observation error covariance, assumed to be a diagonal matrix in this study; y is the observation, with . Based on Eqs. (7) and (8), the objective function (9) can be rewritten as:
By minimizing the objective function (10), the coefficients α are obtained, and the required analysis increment Δu is computed using Eq. (7).
For computational convenience, in the implementation described in this paper, we did not directly minimize the objective function (10) through iterative calculations. Instead, following the approach of Qiu and Chou (2005), we employed the method of least squares to solve for α:
By solving the algebraic Eq. (11), the coefficients α are obtained, and the required analysis increment Δu is computed using Eq. (7). In this SVD-3DEnVar implementation, the coefficients α are determined solely from observational information Δy. When sufficient observations are available (i.e., the number of observations exceeds or equals the truncation order K), the system is well-posed, a stable minimum-norm solution can be obtained because the solution is constrained to the low-dimensional subspace spanned by the singular vectors. This eliminates the dependence on background error statistics required in traditional methods and simplifies the assimilation process.
To prevent any observation point from influencing the global analysis increment, SVD-3DEnVar uses a local patch scheme (Xu et al., 2011a, b, 2012). Specifically, a local block is centered at any model grid point, and a local block with horizontal and vertical radius lh and lv is selected. SVD-3DEnVar assimilation is then performed within this local block to obtain the analysis field at that grid point. Additionally, a Gaussian weight function is introduced to limit the observational influence within the local block:
where rh and rv represent the horizontal and vertical distances between the local block center and the observation point, and σh and σv are the horizontal and vertical localization scale parameters for observations. The Gaussian weight function defined in Eq. (12) is applied to each observation within the local patch. The horizontal and vertical localization scales (σh and σv) control the rate at which observation influence decays with distance. This localization ensures that only observations within a specified radius significantly impact the analysis increment at the center of the local patch, thereby mitigating spurious long-range correlations and improving the stability and accuracy of the assimilation.
3.2 Revision of Perturbation Construction Techniques
To address the limitations of the original random perturbation field generation method (such as only supporting square two-dimensional data, requiring odd grid points in a single direction, and the inefficiency of storing 2D data before constructing 3D perturbations), multi-dimensional optimizations have been implemented. These improvements primarily include: breaking the restrictions on grid shape and number to allow direct generation of perturbation fields that match any model grid; optimizing memory usage and efficiency by designing 3D perturbation construction logic that eliminates the need for 2D data read/write steps; and introducing multi-process parallel computing. This section will provide a detailed introduction to these improvements.
The SVD-3DEnVar method uses a Gaussian distribution-based random perturbation field generation approach (Evensen, 1994, 2003) when producing ensemble samples. To facilitate the understanding of subsequent technical optimizations, the principles of this method are briefly introduced here. The two-dimensional random perturbation field q=q(xy) is generated via a Fourier spectral method, where the Fourier coefficients are modulated to control the spatial correlation structure. The continuous field can be expressed as:
where are the Fourier coefficients and k=(κlγp) is the wavenumber vector. Discretizing on an N×M horizontal grid yields:
with xn=nΔx, ym=mΔy, , , and . The Fourier coefficients are defined as:
where c is a normalization constant controlling the variance, σ is a bandwidth parameter determining the horizontal correlation length, and is a uniformly distributed random phase. Substituting Eq. (15) into (14) gives the complete expression for the discrete random field:
This formulation represents multiplying a Gaussian-shaped filter (spectral window) by a random phase in wavenumber space, followed by an inverse Fourier transform to obtain the spatial random field. The horizontal correlation length and variance of the two-dimensional perturbation field can thus be controlled by adjusting the parameters σ and, respectively.
The perturbation field generation process consists of three main steps (Fig. 3a): first, a data pool satisfying the specified Gaussian distribution is generated and divided into intervals; second, sampling is conducted from the data pool intervals using spiral enumeration and neighborhood statistical relationships; third, to ensure the perturbation field has spatial scale characteristics, a five-point smoothing is applied to the generated 2D perturbation field, and a vertical weighting combination is used to construct the 3D perturbation field.
In the first step, the original scheme pre-generates a sample data pool by specifying the number of sample intervals and the total number of samples (typically a very large number). This approach not only occupies an enormous amount of memory but also results in relatively low efficiency in subsequent sampling. In the second step, the original scheme is limited to square grids and odd grid points, which often do not match the grids used in the model. Additionally, the original method first generates a sufficient number of 2D perturbation fields and stores them locally before constructing the 3D perturbation field. Prior to the 3D perturbation field construction, the 2D perturbation fields are read sequentially from local storage. Since the grids typically do not match, the perturbation fields require 2D interpolation to match the model grid. This approach has several drawbacks: on the one hand, the generation of 2D perturbation fields is indirect, and the interpolation may distort the original statistical characteristics of the perturbations; on the other hand, the additional read/write steps not only impact efficiency but also occupy local storage space.
In light of this, optimizations are made as following: First, the grid limitation issue is addressed. As shown in the blue box of Fig. 3a, given any grid, the relative center point is selected, and spiral sampling begins. If the current point is invalid, it is skipped, and sampling continues until all points are sampled. Meanwhile, it is found that the practice of pre-allocating a sample pool in the first step leads to low efficiency in disturbance field generation. To address this issue, we consider eliminating this step; instead, in the alternative scheme, during sampling, the truncated normal distribution is calculated directly based on neighborhood statistical information, thereby quickly obtaining values that meet the requirements at a relatively low cost. Furthermore, to overcome the inefficiency of the original program – where 2D perturbation fields are first generated, stored locally, and later read and interpolated to form 3D fields – the process is streamlined. Now, the required number of 3D perturbation fields, along with the number of grid points in the horizontal, and vertical directions, are directly specified. The 2D data is immediately used in 3D construction, and once completed, the 3D perturbation file is output in one step. This optimization significantly improves efficiency by eliminating redundant read/write operations, storage and sampling of large sample arrays.
The vertical correlation structure is introduced through a weighted blending scheme, where each layer of the three-dimensional perturbation field combines 40 % of perturbation information from adjacent filled layers with 60 % from a newly generated two-dimensional random field. This yields a three-dimensional perturbation field with a prescribed vertical correlation scale. While perturbations for different model variables (e.g., wind, temperature, humidity) are initially generated independently, they acquire physically consistent cross-variable covariance relationships through a short model integration (typically 6 h). This spin-up period allows the dynamically balanced multivariate structures to develop from the initial uncorrelated perturbations. The resulting three-dimensional perturbation fields thus possess prescribed variance and correlation scales in both horizontal and vertical dimensions, and exhibit multivariate balances consistent with the model dynamics, as verified by calculating sample covariance statistics.
Furthermore, to further enhance computational efficiency, the sample generation process supports multi-process parallelization. The specific strategy is as follows: for each 3D field, the corresponding number of 2D perturbation fields is generated in parallel according to the number of layers. These are then merged and output as the 3D field file, and the same process is repeated for the next 3D field. This approach limits memory usage by controlling the parallelization scope to avoid overflow, and it allows flexible adjustment of the parallelization scale for the 2D data within each 3D field to accommodate different computing resources. Ultimately, this improves performance while maintaining memory stability and resource utilization efficiency.
According to the original scheme, generating a 3D perturbation field with a grid dimension of 101 × 101 × 67 took approximately 1340 s (over 22 min). Note that this time is already close to the duration required for running the SVD-3DEnVar assimilation step (refer to Fig. 5a), making it clearly unacceptable in operational applications. Without enabling 2D field parallel computing, the optimized scheme completes the same task in just 2.2 s, achieving a computational efficiency improvement of approximately 600 times. For the TRAMS model with a grid dimension of 883 × 553 × 67, further efficiency gains can be achieved by activating parallel computing for the 2D fields. Figure 3b and c show the horizontal and vertical distributions of a randomly selected 3D perturbation field, with characteristics that are consistent with the results of Xu et al. (2011b).
3.3 Parallel implementation
The original SVD-3DEnVar data assimilation program performs calculations serially for each local patch corresponding to each grid, and the computation time is insufficient to meet the demands of large-domain model assimilation operations in practical applications. Therefore, a parallelization scheme is required. This study draws inspiration from the LETKF scheme (Miyoshi and Yamane, 2007) and combines patch parallel computing with load balancing strategies. A “grid partitioning – global marking – dimensionality reduction assignment” strategy is adopted to achieve high operational efficiency. At the same time, “node root process pointer sharing” and “local data processing” techniques are employed to optimize data I/O speed and memory management, reducing redundant computations and storage usage.
The specific process is shown in Fig. 4. First, the model grid is partitioned into multiple parallel regions according to the number of processes (marked as tomato boxes). Each process checks each grid point within its assigned region to determine whether it satisfies the assimilation trigger conditions (i.e., whether the number of observations reaches the preset threshold). The grid points that meet the conditions are marked, and after all grid points are checked, global marking information is collected. To reduce unnecessary computational overhead, only the location information of the observation data is used for preliminary judgment and filtering in this stage, avoiding redundant calculations. The filtered model grid points for assimilation are then reduced in dimension to generate corresponding coordinate sequences , which are gathered and evenly redistributed among all available processes via dynamic rebalancing. For example, in Fig. 4, the coordinate sequence is assigned to node N1. This dynamic redistribution ensures that each process is assigned a comparable number of assimilation tasks, thereby mitigating load imbalance that would arise from the non-uniform distribution of observations across static domain partitions.
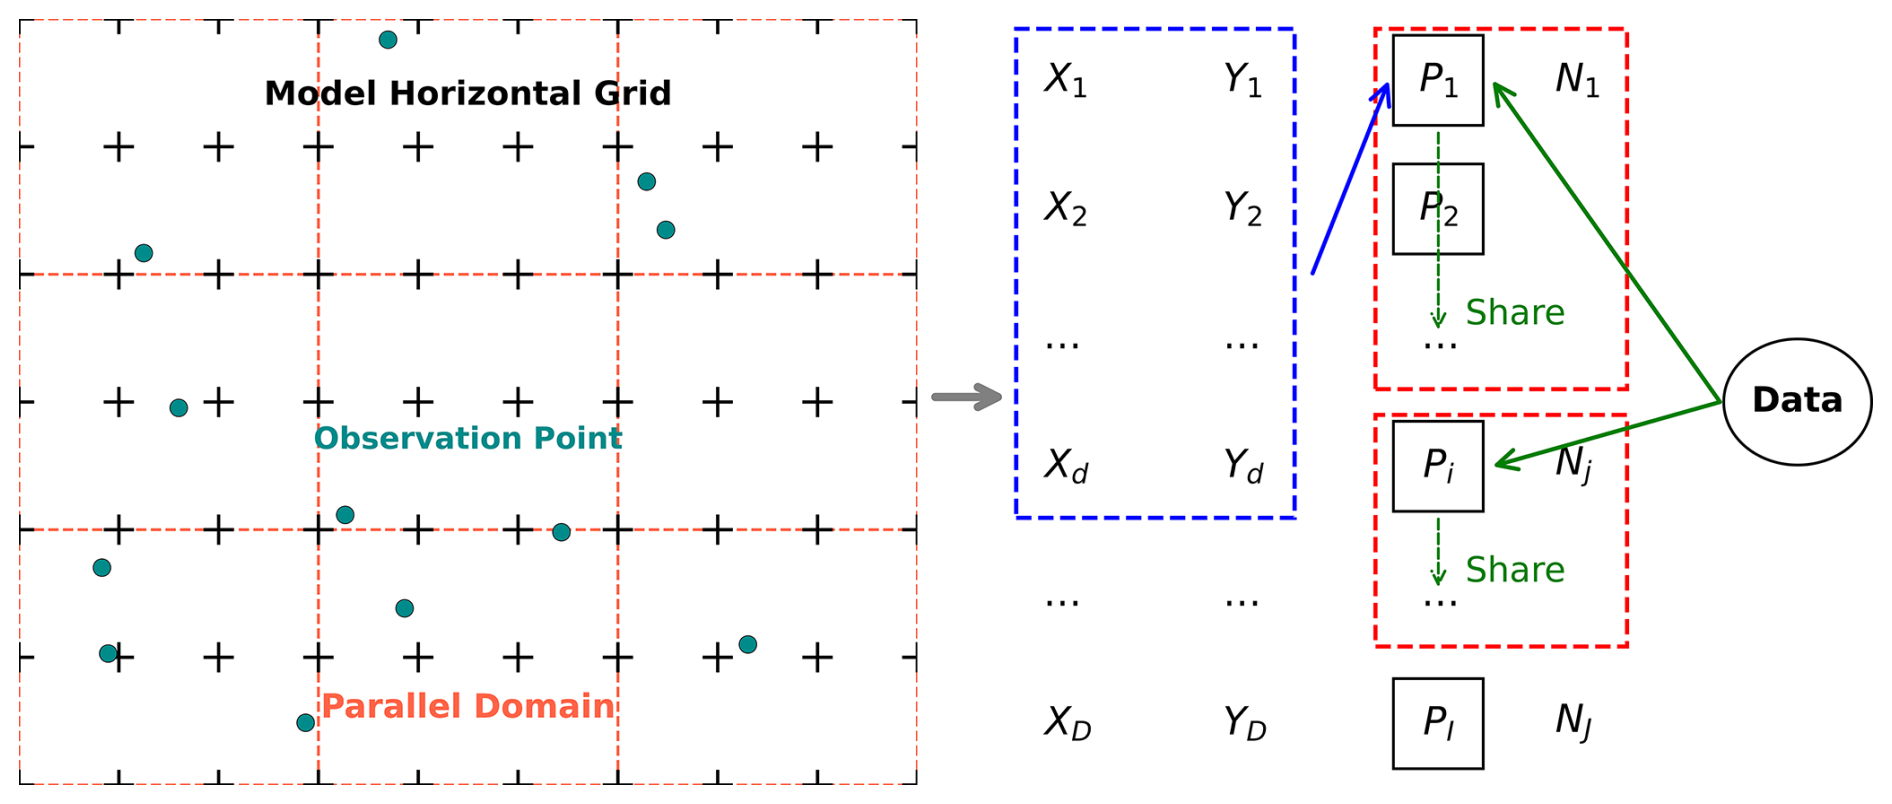
Figure 4Schematic of the parallel mechanism in the SVD-3DEnVar assimilation scheme. The black crosses represent the model's horizontal grid points, the tomato grid divisions represent individual parallel domains, and the solid circle scatter points represent the observation data locations. (xi,yi) denotes the ith () horizontal grid point to be assimilated, Nj represents the jth () node, and P1, Pi, and PJ represent the root processes corresponding to nodes N1, Nj, and NJ, respectively. “Data” refers to the data required for assimilation (including observations, ensemble samples, and background fields).
Additionally, to avoid memory overflow on a single node due to excessive process numbers, this study synchronously optimizes the program's memory management mechanism. First, the data required for assimilation (including observations, ensemble samples, and background fields) are stored in the root process of each node (for example, the root process corresponding to node N1 is labeled P1 in Fig. 4). Other processes within the node (such as P2) then retrieve data from the root process through pointer sharing. The “root process pointer sharing” strategy ensures that large arrays are not redundantly copied, preventing storage space redundancy. At the same time, in local assimilation calculations, only locally scoped data are used for computations, avoiding the processing of global data. Furthermore, localization processing replaces full-scale data structures with small local arrays. This reduces the data volume for processing and enables efficient parallel computation by isolating independent data subsets for concurrent operations. Crucially, it eliminates direct manipulation of the raw data, which remains immutable, thereby removing the need for and potential errors associated with inter-step data restoration. Through the combined strategy of “small local arrays, spatial restriction, and pointer sharing,” this approach optimizes memory usage, enhances computational efficiency, and minimizes operational errors in the parallel assimilation system.
It should be noted that if the model region is directly partitioned into grids, local areas may have insufficient observation counts, causing early termination of assimilation in those regions while other processes continue running. This leads to idle processes and underutilized computational resources, which becomes a significant bottleneck in efficiency improvement. The approach adopted in this study allows for synchronous invocation of all processes, and each process completes the assimilation task around the same time, effectively avoiding the problem of idle waiting in a single process, thus significantly improving resource utilization.
To evaluate the impact of the parallel strategy on the operational efficiency of the SVD-3DEnVar assimilation scheme, targeted test experiments were designed in this study. First, the local block radius was fixed at 10 times the grid size, and only the number of nodes was varied, with all other experimental conditions remaining identical to those in the ideal experiment described in Sect. 4.1. Figure 5a shows the sensitivity of the assimilation computation time to the number of nodes. In the experiment, the number of nodes increased from 1 to 300, with each node equipped with 64 cores. The time spent on each key component of the assimilation scheme was then recorded. As the number of computing nodes increased from 1 to 150, the computation time for the assimilation program decreased linearly. When the number of nodes exceeded 150, the parallel efficiency of the assimilation program reached saturation, and the required time stabilized around 15 min.
Specifically, the computation time for the assimilation program was primarily distributed across three core steps: data I/O, resource allocation, and assimilation computation. In terms of data writing, the time spent remained stable with no significant fluctuation. The reason for this is that data writing is only performed by the root process and is not affected by the increase in the number of nodes. In the resource allocation step, due to the secondary allocation strategy, the time spent during the first allocation phase showed clear dependence on the number of nodes. When the number of nodes was small, the time spent on horizontal statistical processing of the assimilation grid points was relatively high. However, once the number of nodes reached a certain threshold, this time was significantly reduced and eventually approached zero. The data reading step showed a slight increase in time as the number of nodes increased. This phenomenon is likely related to data contention: multiple nodes simultaneously make read requests for the same data, causing data access conflicts and leading to a slight increase in time. This is a common phenomenon in parallel computing and is within a reasonable range. In contrast, the time spent on the assimilation computation step generally showed a downward trend. Notably, between 170 and 210 nodes, the time spent on the assimilation computation increased abnormally. The possible reason for this is that the actual time spent on assimilation computation can vary depending on the location of observations and the characteristics of the data (e.g., due to differences in the number of iterations). When the number of nodes was in this range, the task assignment for the experimental dataset did not achieve “efficiency uniformity,” and some processes were assigned tasks with relatively high computational loads, which increased the overall time. However, since the current task assignment strategy only ensures an even distribution of the number of tasks, without considering differences in the computational time of individual tasks, this anomaly has a limited impact on the overall efficiency in practical applications and can be disregarded.
Since SVD-3DEnVar employs a local patch parallel strategy, the size of each local patch is a key factor in determining the assimilation computation efficiency. Figure 5b tests the assimilation time for different horizontal localization radii with 150 nodes. The results show that as the localization radius increases, the computation time for SVD-3DEnVar also increases linearly. This increase primarily comes from the assimilation computation step.
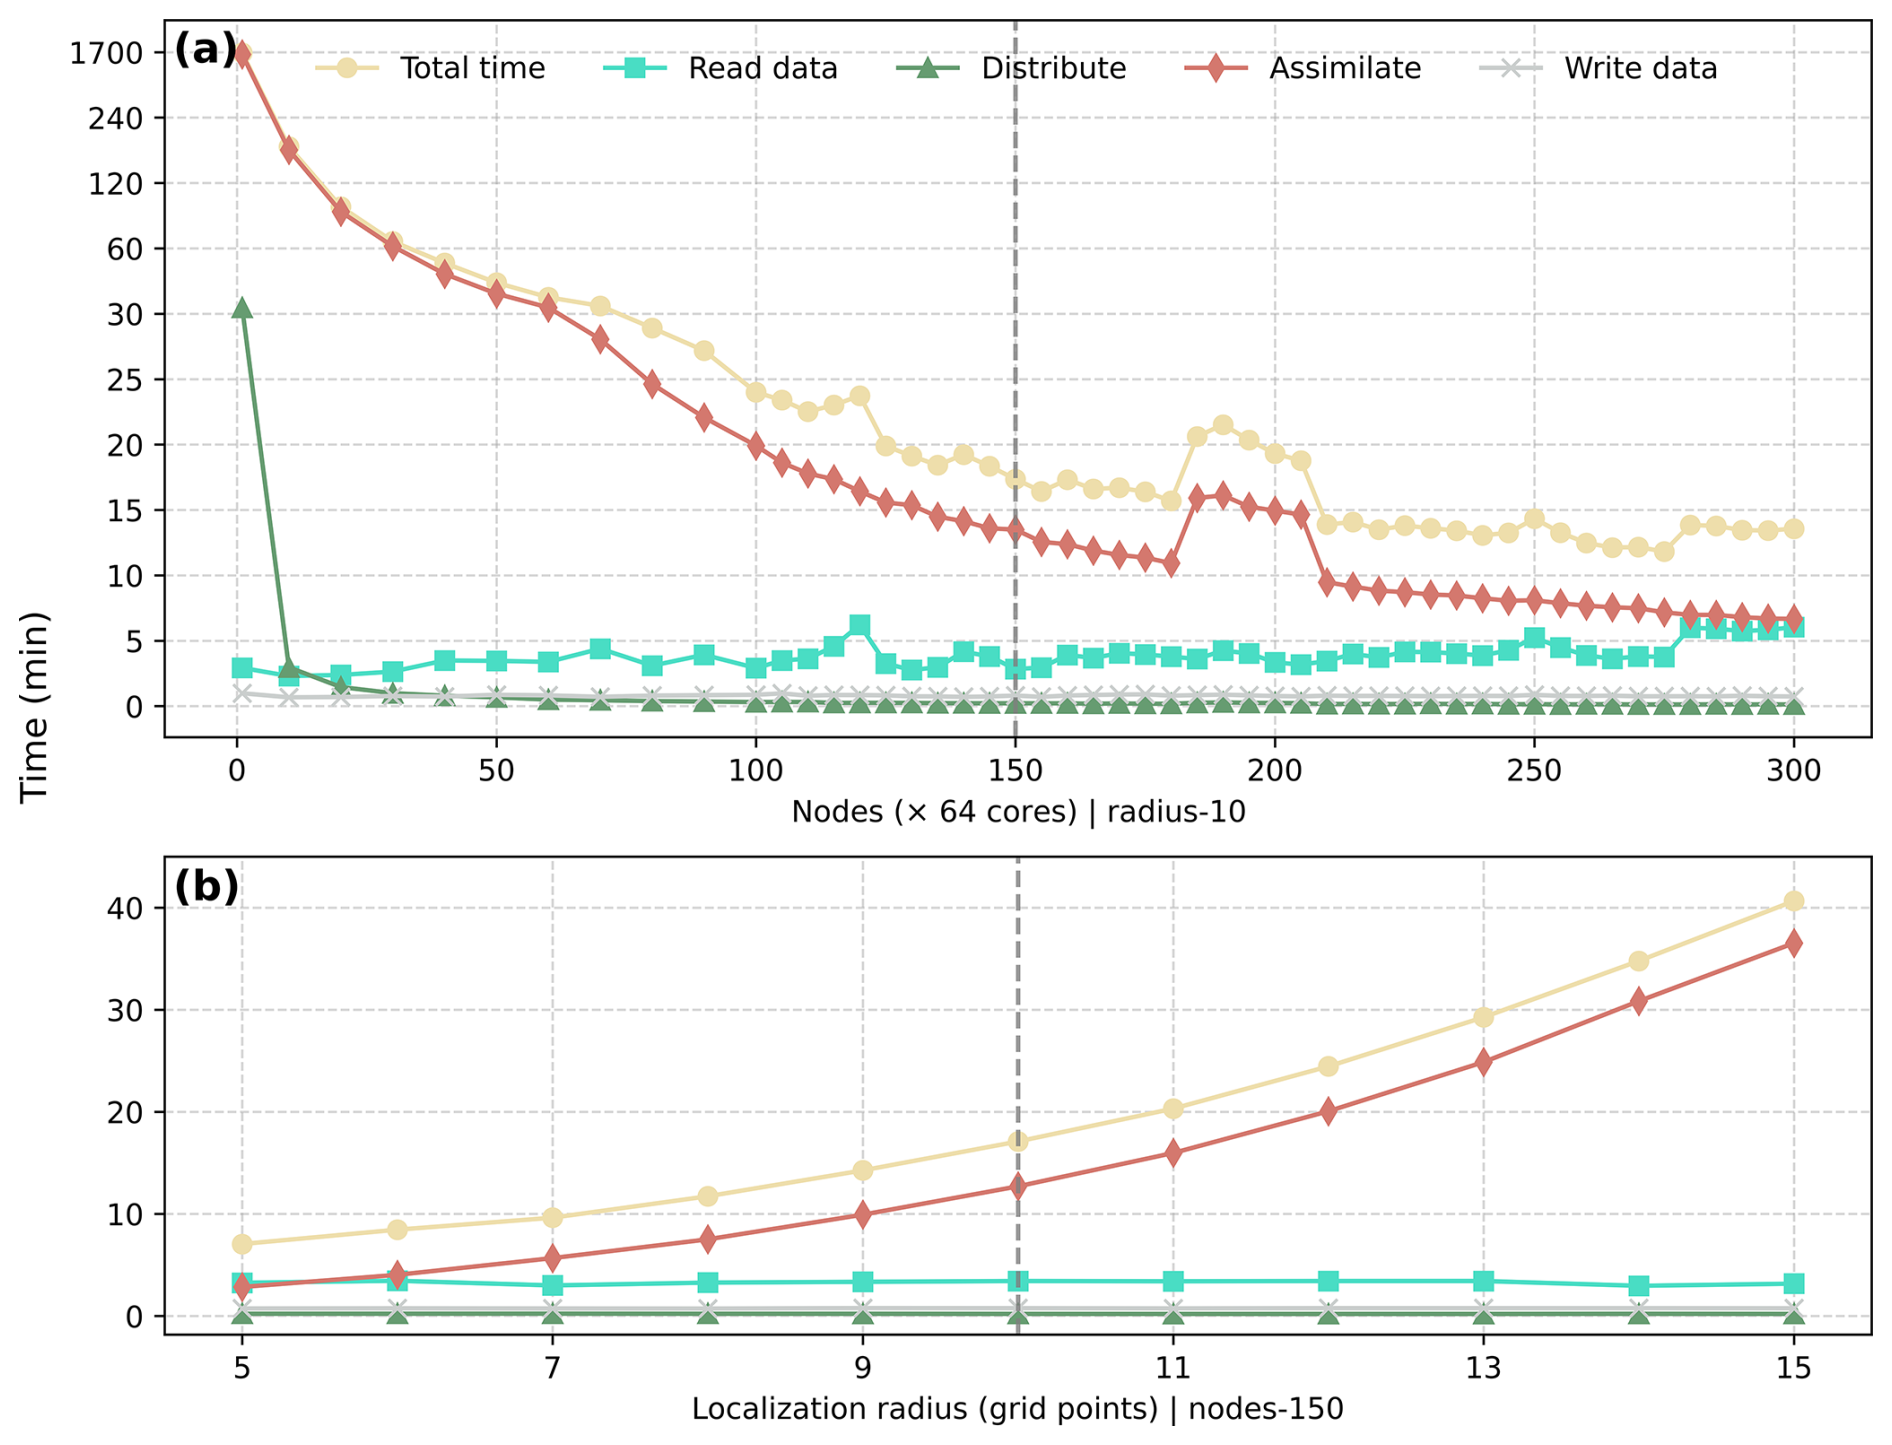
Figure 5Computation time of the SVD-3DEnVar scheme under different numbers of nodes (a) and local patch radii (b). The specific design of the test experiment can be found in Sect. 4.1 of the OSSE simulation experiment. The gray dashed line denotes the computational efficiency when using 150 nodes and a localization radius equal to 10 times the grid spacing, which represents a parallel parameter configuration well-suited for operational applications.
In summary, the parallel assimilation strategy designed in this study demonstrates good load balancing performance, which makes the SVD-3DEnVar scheme suitable for practical operational applications.
4.1 Experimental Design
To test the performance of the revised SVD-3DEnVar scheme, two sets of assimilation experiments were conducted based on the TRAMS model in this section.
The first group of experiments was the Observing System Simulation Experiment (OSSE) for Typhoon Khanun (2023, Typhoon No. 6) under ideal conditions, as shown in Fig. 6a. The control experiment (CTL) was directly integrated forward from 12:00 UTC on 28 July, while the assimilation (DA) experiment had the analysis time at 00:00 UTC on 29 July. The background field for the DA experiment was derived from a 12 h forward integration starting at 12:00 UTC on 28 July, and the true field was obtained from a 24 h forward integration starting at 00:00 UTC on 28 July. The horizontal u-wind component at all grid points on vertical layers 8 to 32 from the true field was used as observations. Considering model resolution, observation data, and parallel efficiency, the radius of the local block was set to 10 times the grid size, and the observation localization scale parameters were set to 3 times the grid size (i.e., , . The model variables updated in the assimilation process include the v-wind field (v), potential temperature (θ), dimensionless pressure (π), and water vapor mixing ratio (q), making a total of 5 variables. The experiment used an ensemble of 30 members, with a truncation order of K=27.
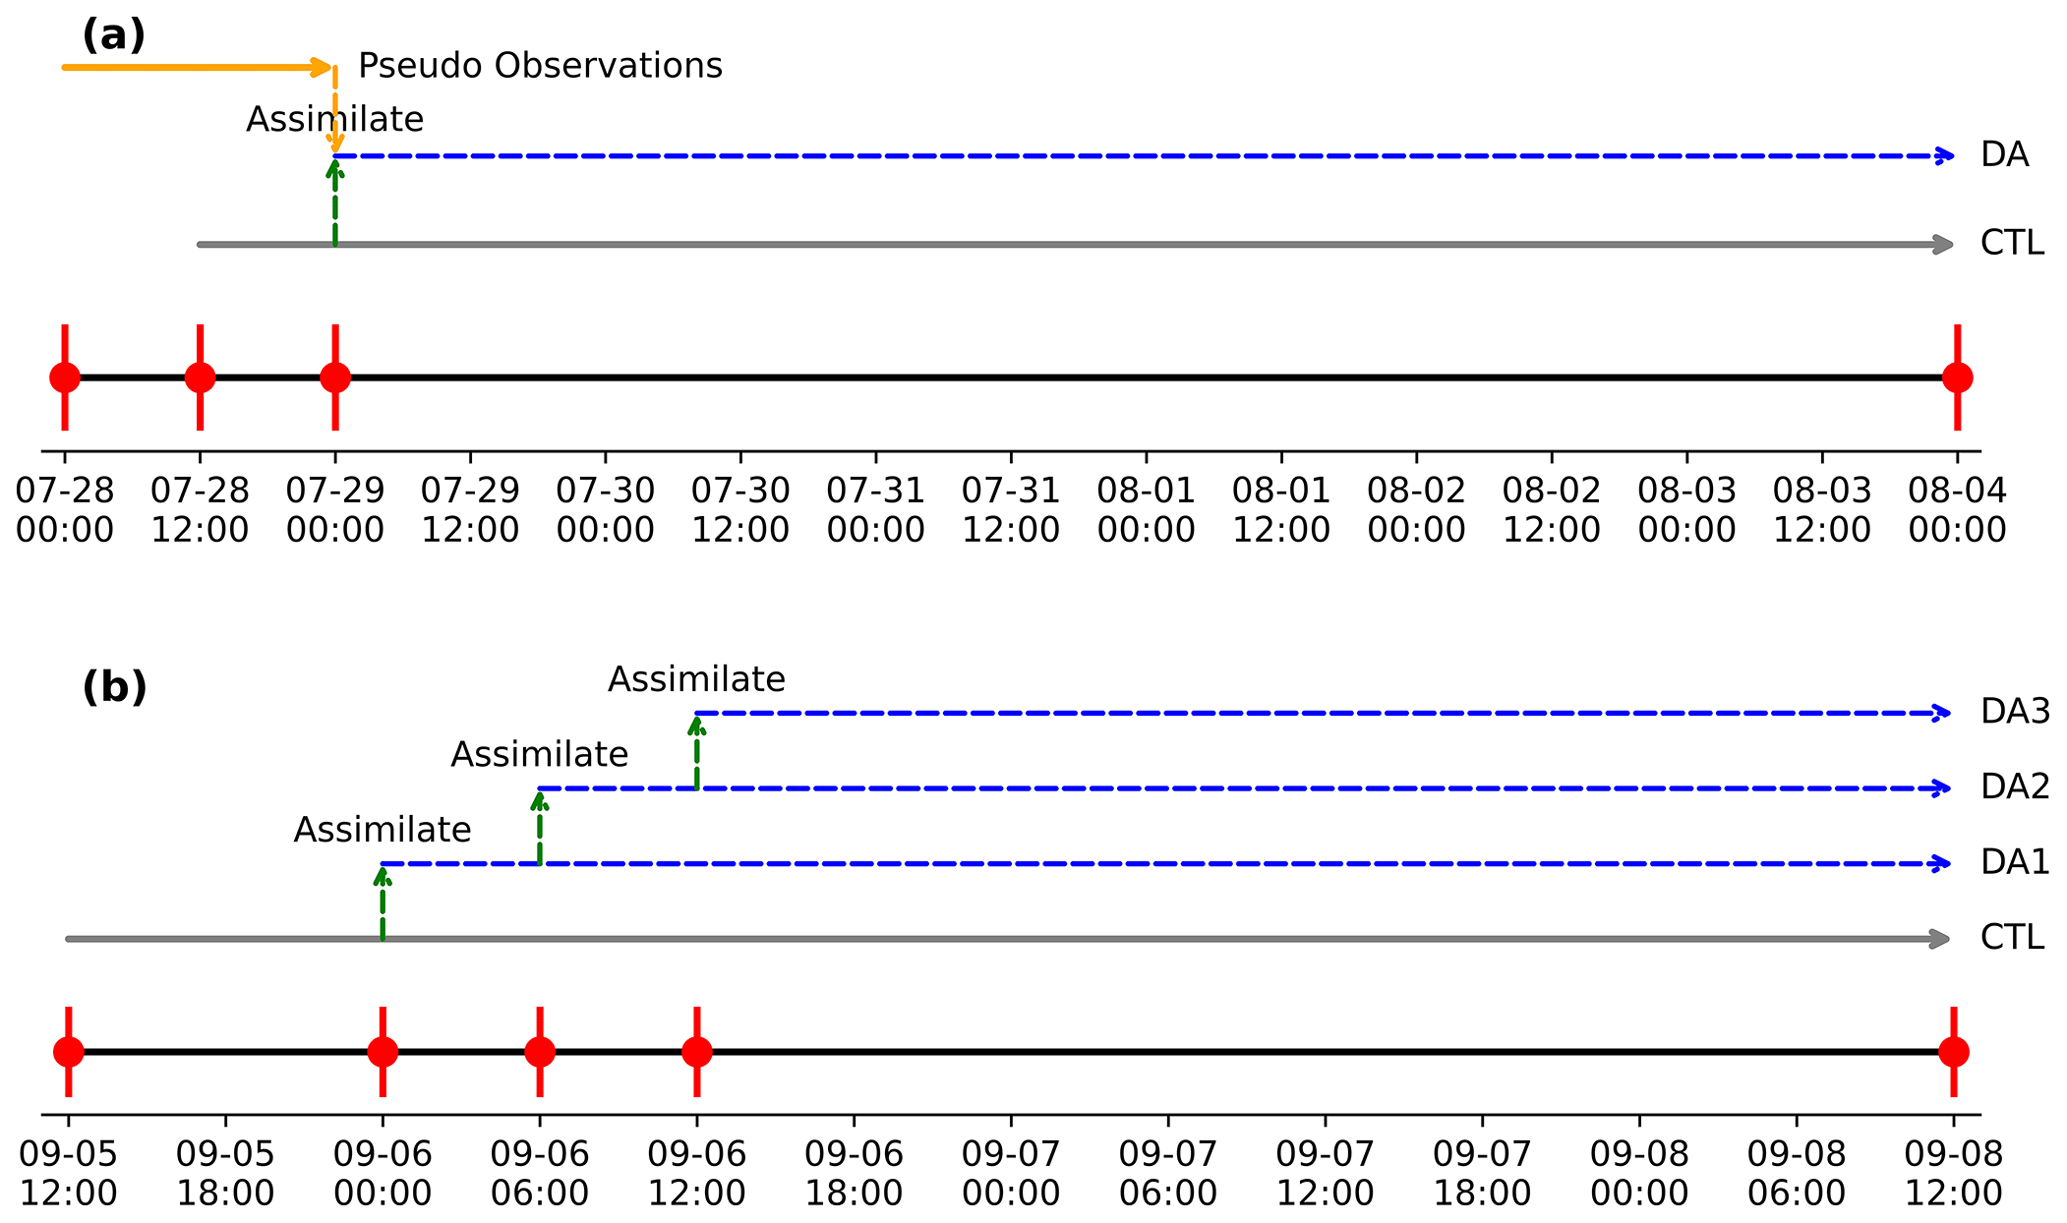
Figure 6Assimilation experiment flow design: (a) OSSE experiment; (b) Sea surface wind assimilation experiment. The horizontal axis represents the corresponding time. CTL refers to the control experiment without any assimilation, and the specific assimilation designs for DA, DA1, DA2, and DA3 are described in the relevant text.
Following the validation of the SVD-3DEnVar assimilation scheme's effectiveness in the OSSE experiment, further assimilation tests were conducted using actual observational data. The testing period was chosen to coincide with Typhoon “Yagi” (2024, Typhoon No. 11), and the assimilated observational data were the satellite-fusion sea surface wind field inversion products described in Sect. 2 (with an observation height of 10 m). The goal was to preliminarily assess the performance of the scheme in a real-world weather process. It should be noted that the reason why the same typhoon case was not selected for both the OSSE and the actual assimilation experiment is that the sea surface wind product has only been made publicly available since September 2024. The experimental design is shown in Fig. 6b.
The control experiment (CTL) was obtained by directly integrating the global analysis field from 12:00 UTC on 5 September 2024. The first assimilation was initiated at 00:00 UTC on 6 September 2024, with the background field being derived from a 12 h forecast starting at 12:00 UTC on 5 September 2024. To further test the impact of multiple-cycle assimilation on model forecasting in an operational environment, after the first assimilation (denoted as DA1), two consecutive assimilation experiments were designed (denoted as DA2 and DA3), with a 6 h interval between each assimilation cycle. The analysis variables, localization parameters, number of ensemble members, and truncation order for this experiment were identical to those used in the previous OSSE experiment.
4.2 Results of OSSE Experiment
This section primarily verifies the rationality of the SVD-3DEnVar assimilation scheme in an idealized typhoon forecasting scenario. The “true error” used in the experiment is obtained by subtracting the pre-defined “true field” from the forecast field (refer to Fig. 6a).
The analysis increments and true errors of the u-wind field at the 10th model level (approximately at 1.5 km in height) are first examined to assess the consistency of their horizontal distributions. The analysis increment of the u-wind field and the true error show very similar spatial distribution and magnitude (Fig. 7a–b). This alignment is expected under the idealized OSSE setup, in which dense u-wind observations are assimilated using the SVD-3DEnVar scheme. Since the analysis increment depends solely on observational information through Eq. (11), the resulting field closely matches the observed (true error) state, confirming the scheme's ability to effectively ingest accurate observations. Moreover, the SVD approach exhibits inherent robustness to observational noise. By constructing the solution from a truncated set of leading K singular vectors, small-scale fluctuations – typically associated with random errors – are naturally filtered, which enhances analysis stability when handling real observations with uncertainties. In contrast, for the other four variables (v, θ, π, q) which lack direct observations, the analysis increments do not match the true errors as closely as those for the u-wind field (Fig. 7c–j). However, the analysis increments still reasonably capture the spatial distribution of the errors, particularly in the typhoon region.
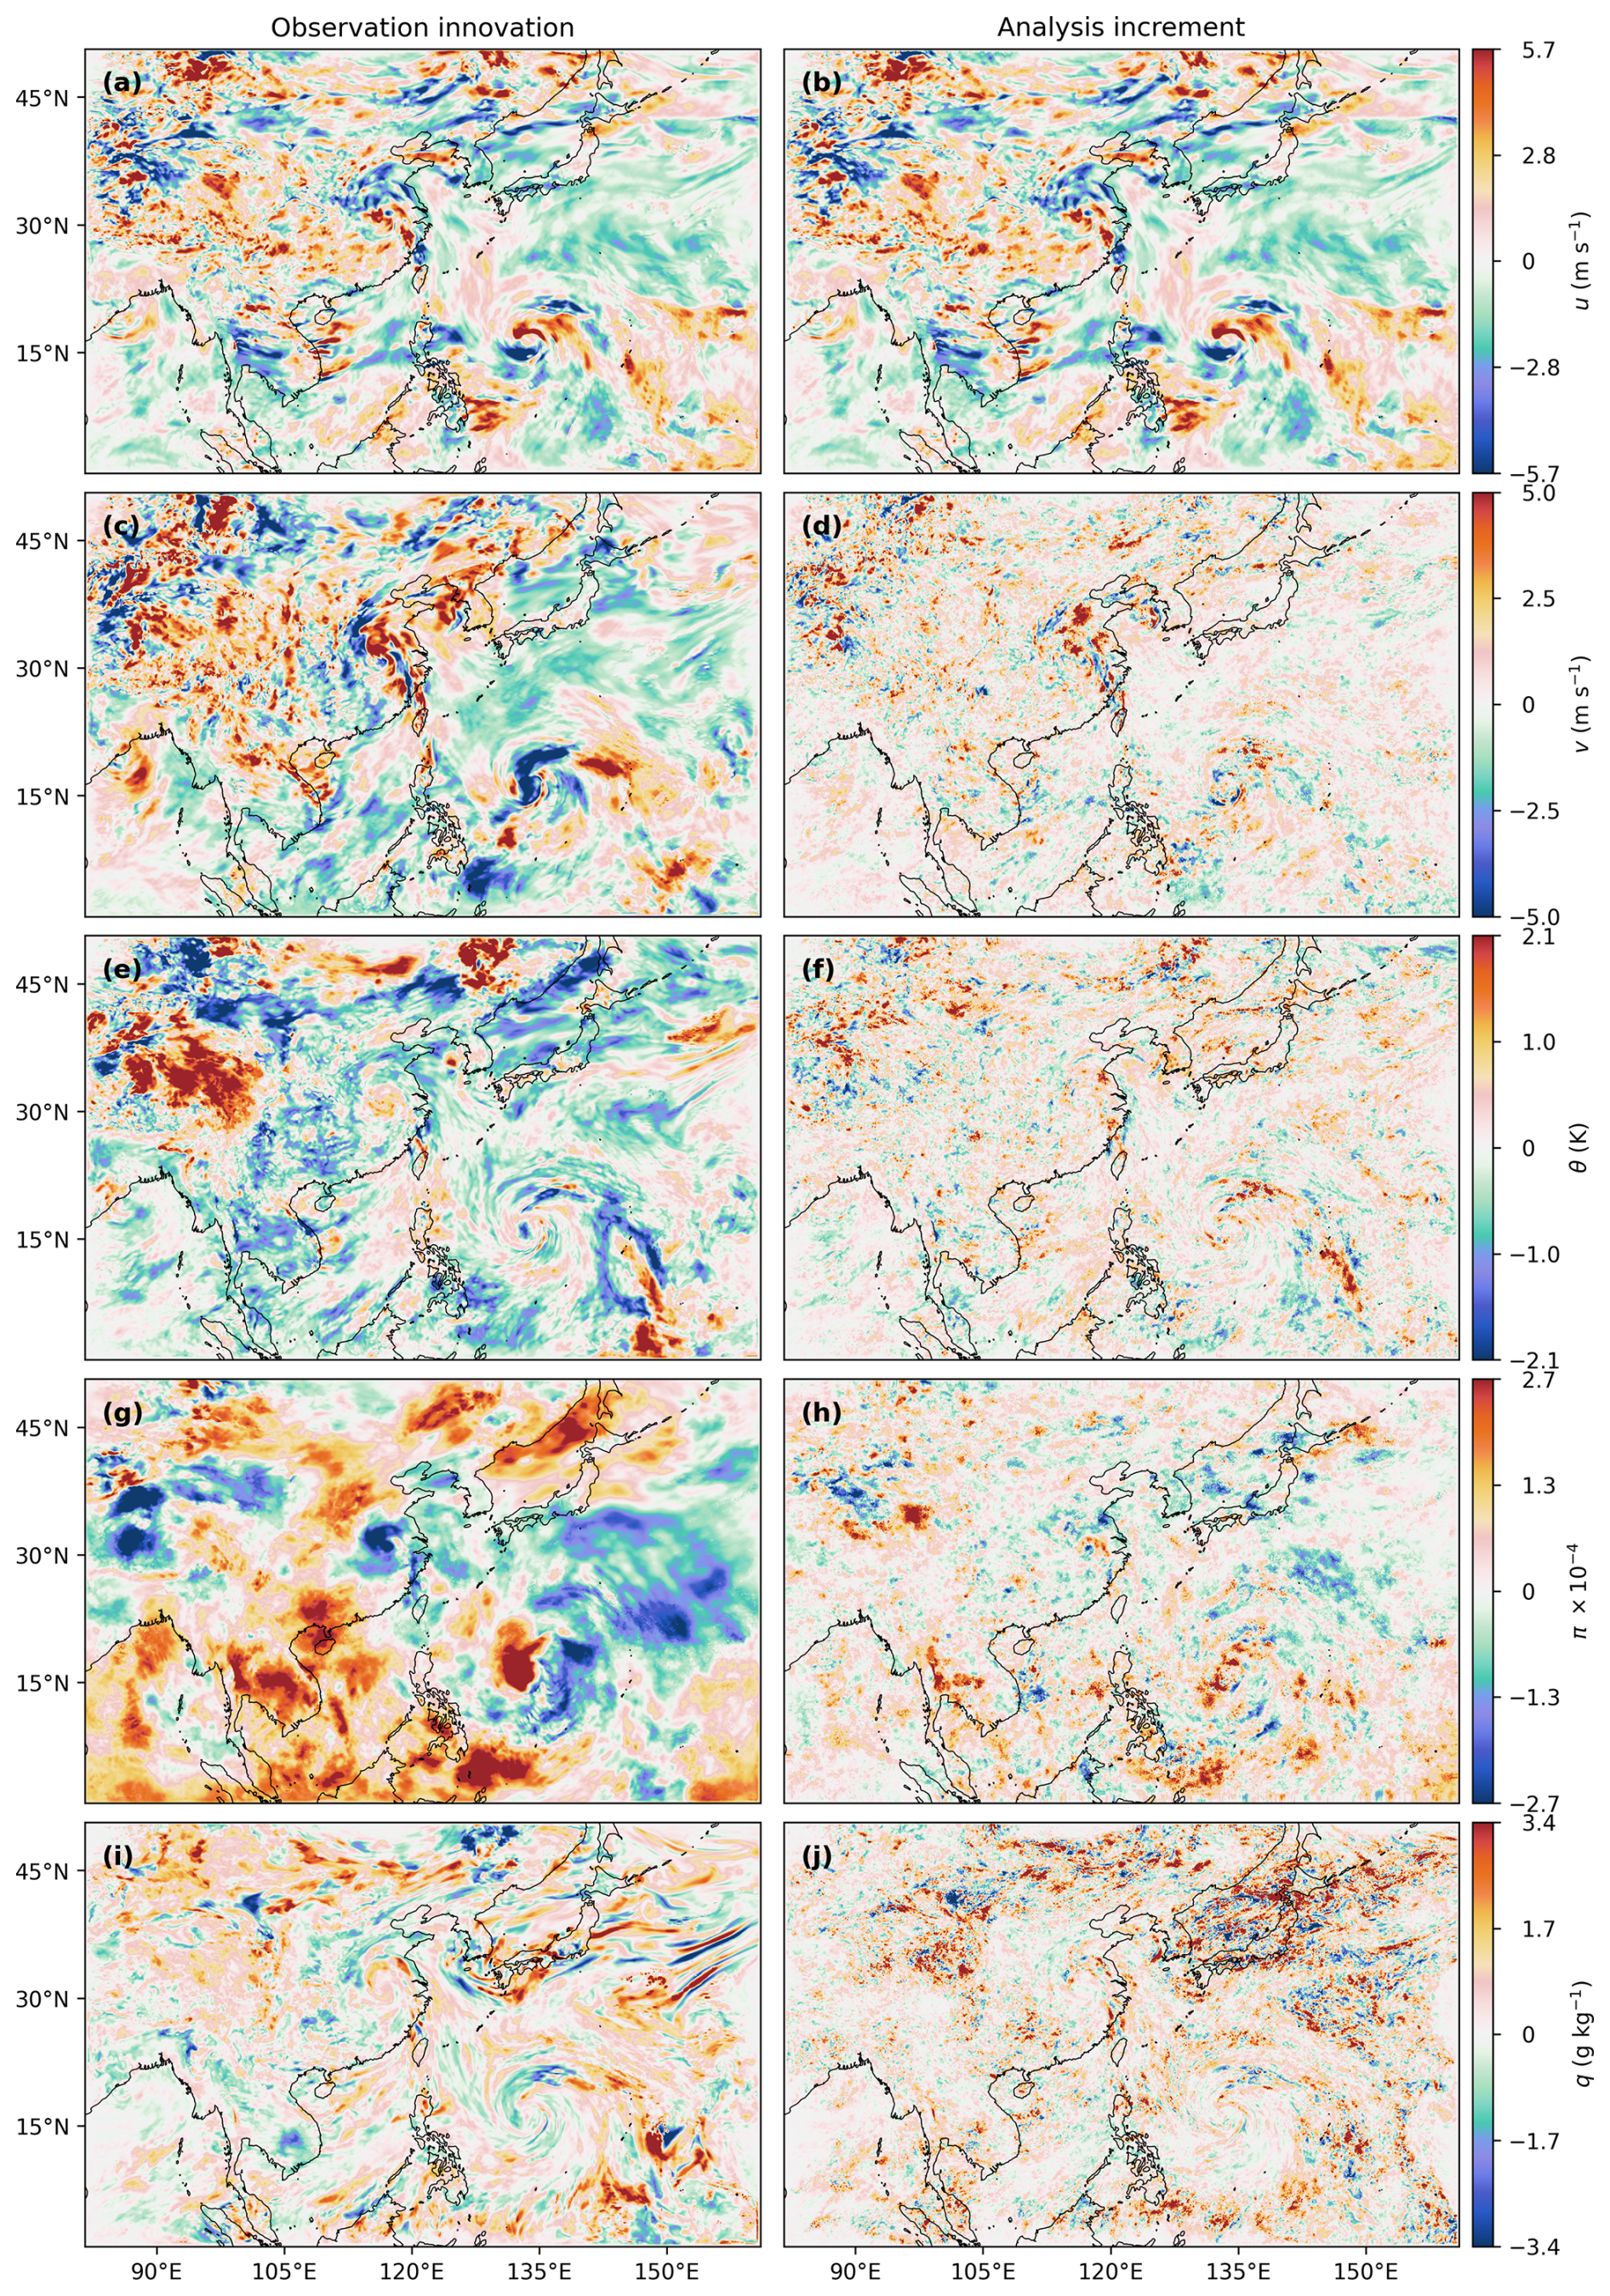
Figure 7The true errors (first column) and analysis increments (second column) at the model's 10th layer (approximately 1.5 km altitude). From top to bottom, the variables correspond to u (a, b), v (c, d), θ (e, f), π (g, h), and q (i, j).
This indicates that the SVD-3DEnVar assimilation scheme can, even when assimilating only a single variable, adjust the other variables indirectly through the flow-dependent background error covariance relationships contained in the ensemble samples, thus producing an initial analysis field that is physically coherent.
Further comparisons are made between the typhoon track and intensity before and after assimilation, using observations from the true field. The CTL experiment forecast shows a systematic northward bias in the typhoon track (Fig. 8a). For typhoon intensity, the CTL experiment exhibits an overestimation of intensity between 24–72 h and an underestimation between 114–144 h (Fig. 8b). The DA experiment effectively reduces the forecast bias in both the typhoon track and intensity for this specific case. These results indicate that after assimilating the wind field, the SVD-3DEnVar scheme demonstrates the potential to improve typhoon track and intensity forecasts in this idealized framework. This improvement is, on one hand, due to a more accurate description of the dynamical and thermo-dynamical structure of the initial typhoon core, and on the other hand, is also related to the reduction of initial errors in the large-scale steering flow through data assimilation.
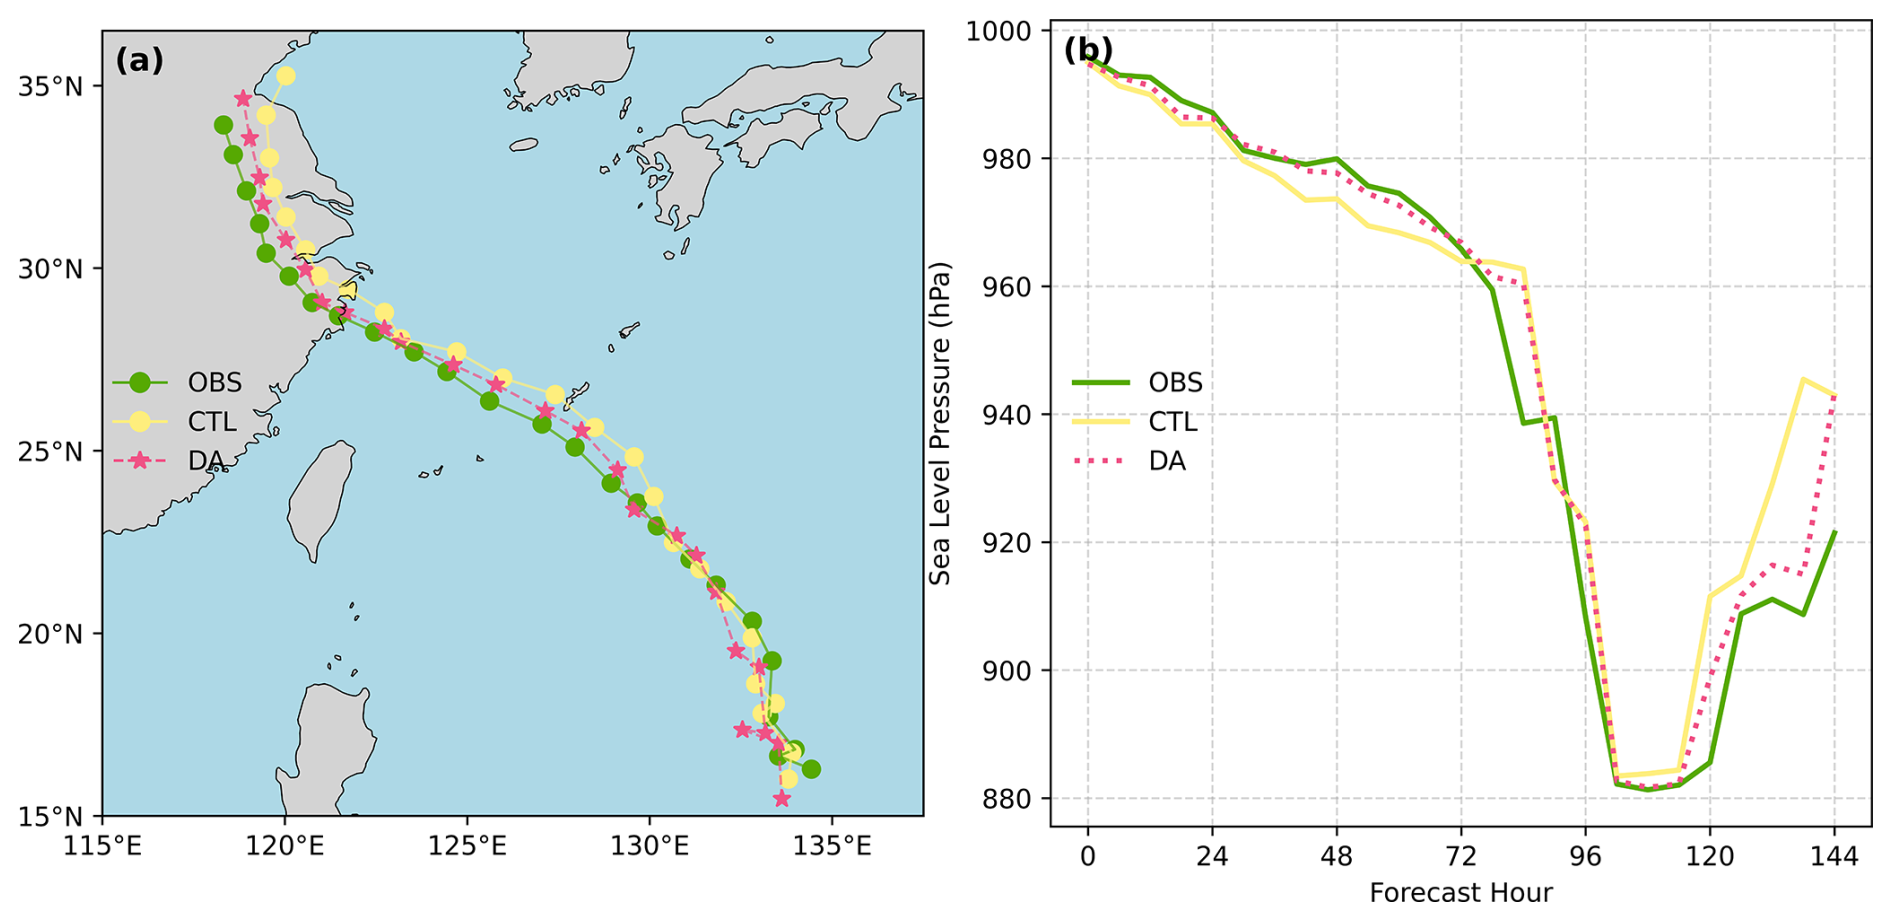
Figure 8OSSE simulation results for Typhoon Khanun under ideal conditions: (a) typhoon track and (b) minimal sea-level pressure (unit: hPa).
4.3 Assimilation of Sea Surface Wind Observations
This section further tests the impact of sea surface wind field (at 10 m height) data assimilation based on SVD-3DEnVar on typhoon forecasting under real-world conditions. The background 10 m wind components (u10, v10) are diagnosed from the model's first-layer winds (ux, vx) at height zx via the dimensionless wind shear function Φx from Monin–Obukhov similarity theory:
where Φ10 and Φx are the wind gradient functions at 10 m and the model's first layer, respectively. Under different stability regimes, Φx is expressed as:
with . Here, Rib is the bulk Richardson number, Ric is a threshold for strongly stable conditions, and z0 is the surface roughness. Over ocean, z0 is diagnosed from wind speed using the Charnock (1955) relation , where zch is the Charnock coefficient, u* is the friction velocity, and g is gravitational acceleration; over land it is prescribed from static surface data.
For the assimilation experiments in this study, the primary quality control step was a background check. Observations were rejected if the absolute innovation (observation minus background) exceeded a predefined threshold (20 m s−1). Due to the lower resolution of observations compared to the model, no additional spatial thinning or super-obbing was applied for these preliminary tests. Representativeness error is effectively mitigated because the SVD-3DEnVar scheme retains only the leading singular vectors, which truncates short-scale observational noise.
First, the deviation characteristics between the available observational data and model forecast results are compared. It is found that at the analysis time (00:00 UTC on 6 September 2024), in the typhoon-affected area, the model forecasted wind speeds are generally lower than the observed wind speeds (as shown in Fig. 9). This is likely due to the underrepresentation of super typhoon intensity in the ERA5 reanalysis data, which provides the initial and boundary conditions for the model (Li et al., 2024).
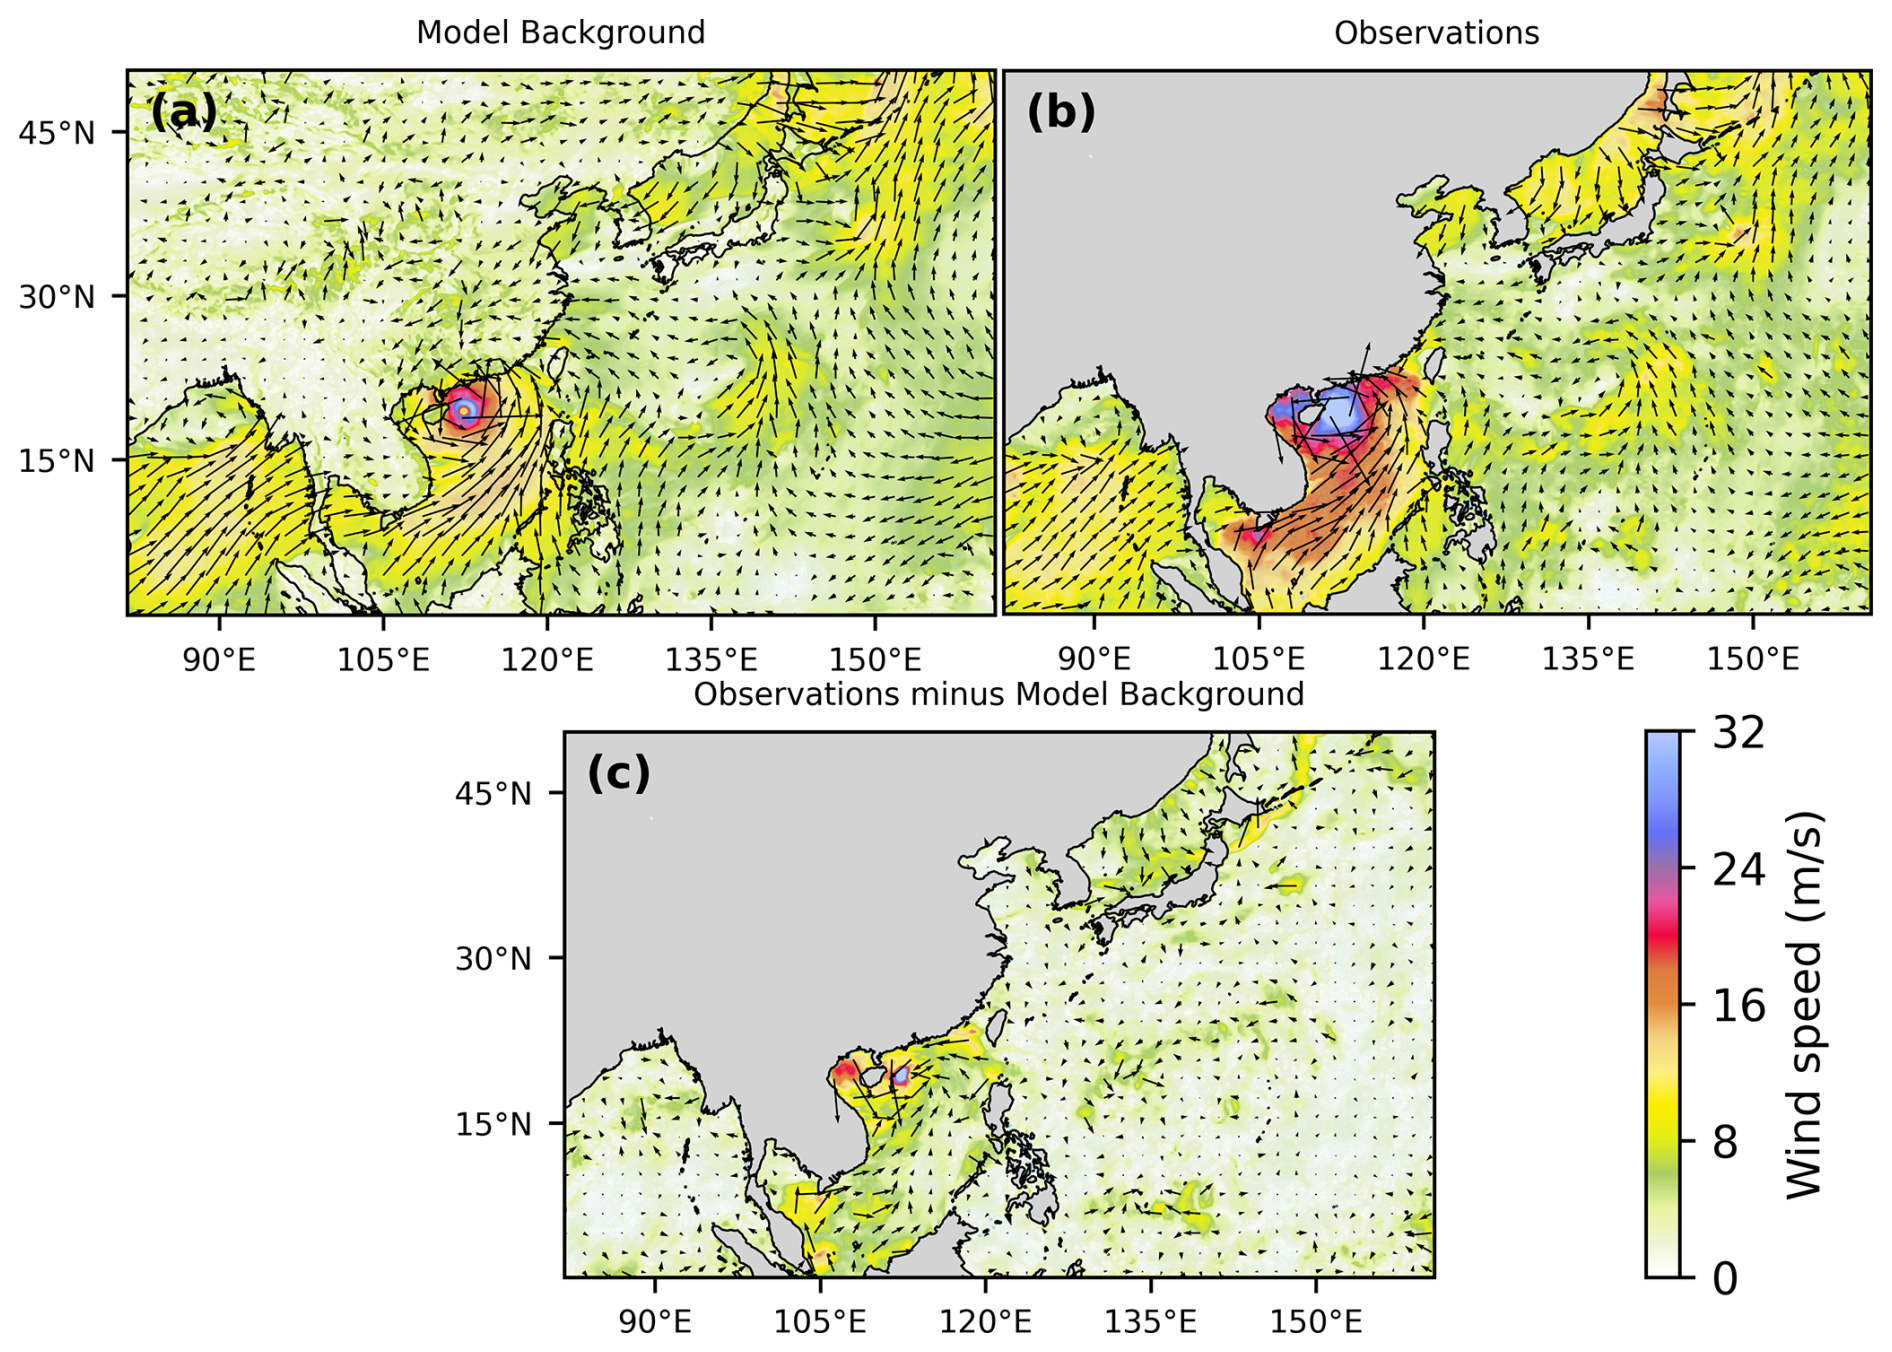
Figure 9Sea surface wind background field (unit: m s−1) at 00:00 UTC on 6 September 2024 (analysis time) (a), observed field (b), and their differences (c).
After assimilating the sea surface wind field observational data using SVD-3DEnVar, the model effectively adjusts the previously weak typhoon circulation (Fig. 10a). The central pressure of the typhoon decreases as the circulation strengthens (Fig. 10c), which is consistent with the gradient wind balance relationship. In terms of the thermodynamic structure, the temperature in the typhoon core increases after adjustment, indicating a more pronounced warm-core structure (Fig. 10e), while the water vapor increases (Fig. 10g). This is due to the enhanced suction effect as wind speed increases, which leads to more water vapor from the sea surface being pumped into the typhoon center, causing an increase in specific humidity in the surrounding region. This also contributes to the subsequent intensification of the typhoon forecast.

Figure 10Assimilation analysis increments at the model's second layer (the first column) and the vertical cross-section along the black line in the first column (the second column). From top to bottom, the corresponding variables are wind speed (a, b), π (c, d), θ (e, f), and q (g, h).
From the vertical profile, the impact of assimilating the sea surface wind field is mainly confined to the boundary layer below 1 km (Fig. 10b, d, f, h). Overall, the incremental distribution of the four key meteorological elements – wind speed, pressure, potential temperature, and specific humidity – after assimilation is consistent with the physical laws and expected adjustments during the typhoon intensification process. This confirms the rationality of assimilating observational data from the perspective of the synergistic evolution of these variables and further validates the reliability of the SVD-3DEnVar scheme in the assimilation application for actual typhoon events.
Building on the validation of the analysis increment's rationality, further tests were conducted to assess the impact of sea surface wind field data assimilation on typhoon track and intensity forecasts. Three assimilation experiments – DA1, DA2, and DA3 – were set up, with the specific details of these experiments provided in Sect. 4.1.
As shown in Fig. 11a, the assimilation experiments have little impact on the typhoon's track. This is primarily because the typhoon's movement is mainly controlled by the large-scale steering flow at the edge of the subtropical high, while the increments from data assimilation (refer to Fig. 10) are mostly concentrated in the typhoon's vortex region, with vertical influence confined to the boundary layer. Assimilating the sea surface wind field effectively corrects the underestimation of the initial typhoon intensity in the CTL experiment (Fig. 11b). However, this correction cannot be maintained, with the forecast returning to the pre-assimilation levels after approximately 6 h forecast. This suggests that adjusting only the low-level typhoon structure is insufficient to substantially improve typhoon intensity forecast biases. Further improvements require combining typhoon initialization (e.g., Zhang et al., 2026) and the assimilation of additional observational data (e.g., cloud steering winds) (e.g., Li et al., 2015) to adjust the middle and upper-level typhoon structures. As the assimilation cycles are conducted at 6 h intervals, the results of DA2 and DA3 show little difference from DA1.
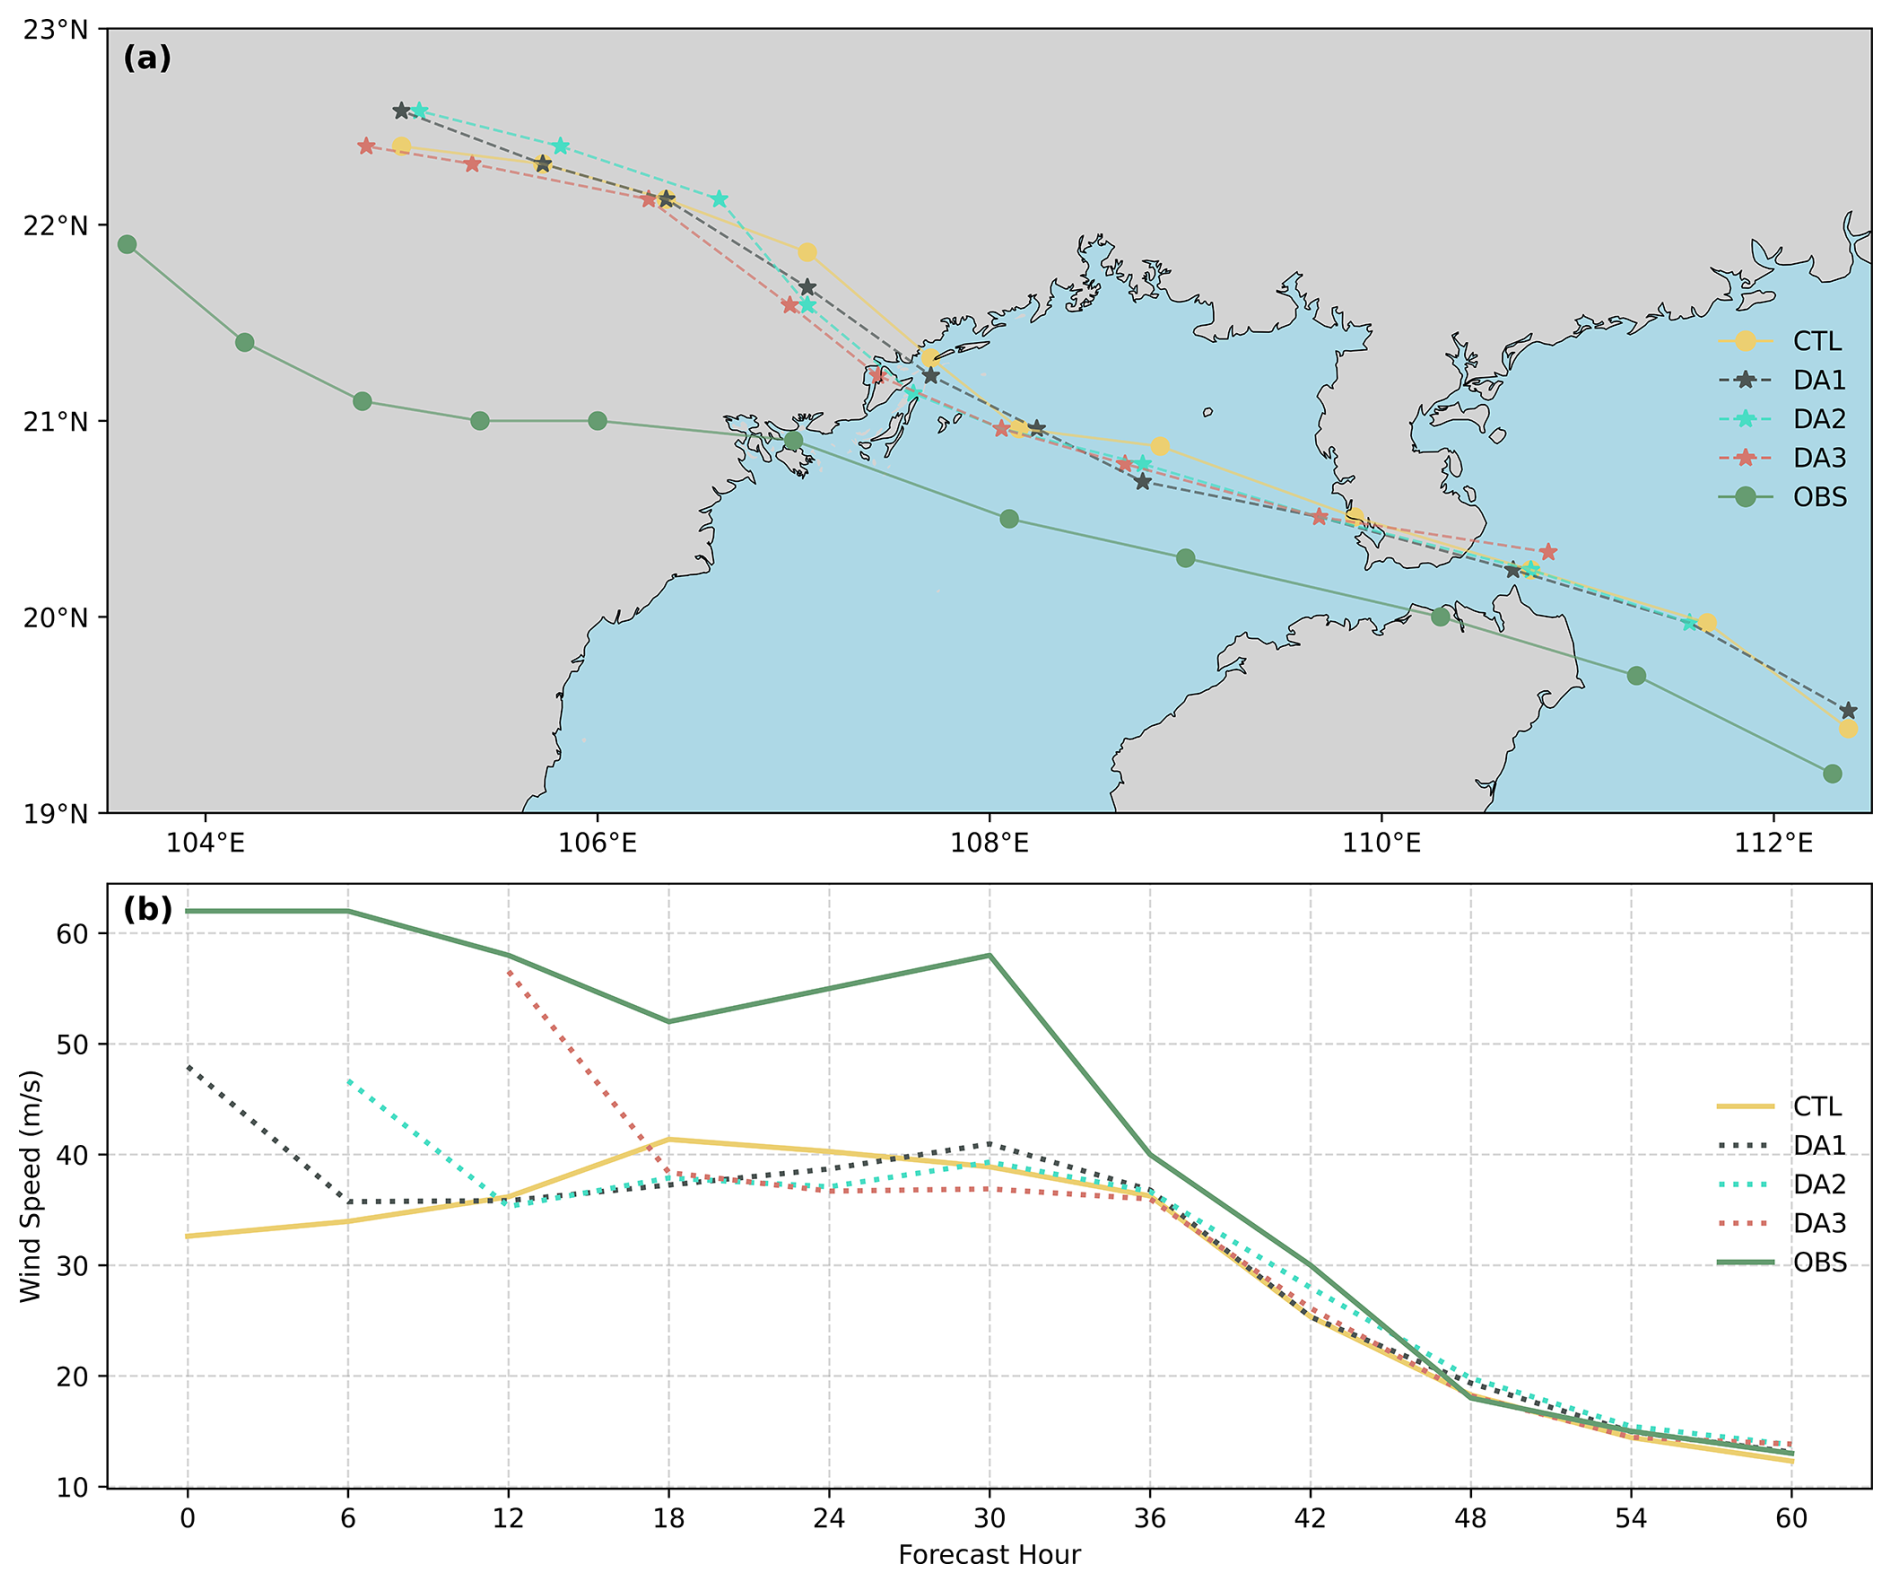
Figure 11Comparison of (a) typhoon tracks and (b) 10 m maximum wind speed (units: m s−1) among the control experiment (CTL), the data assimilation experiments (DA1, DA2, DA3), and observations (OBS) for Typhoon Yagi (2024). Forecasts start at 00:00 UTC on 6 September 2024.
To advance the SVD-3DEnVar assimilation scheme toward operational applications, this study proposes an efficient 3D perturbation generation scheme and a local patch parallel assimilation strategy. The OSSE test results based on the TRAMS model show that after computational efficiency optimization, the time required to generate a 3D perturbation field has been reduced from 22 min to 2.2 s. For the SVD-3DEnVar assimilation scheme – which was originally limited to prohibitively costly serial execution – runtime has been drastically shortened through a two-stage parallelization: first to 1700 min on a single node (using 64 cores), and further to under 15 min by employing parallel processing across 150 nodes. This optimization has rendered the previously impractical scheme fit for real-world application. The scaling tests indicate that major efficiency gains are achievable with moderate resource investment (e.g., ∼ 30 nodes reduced runtime to ∼ 1 h). As operational centers already allocate substantial resources for ensemble forecasting, integrating the optimized SVD-3DEnVar scheme is computationally feasible. Furthermore, the use of standard data thinning for real observations (not applied in these dense OSSE tests) would further reduce the computational burden, enhancing its practicality for operational implementation. Beyond computational efficiency, the reasonableness of optimized SVD-3DEnVar assimilation scheme was preliminarily verified through idealized experiments (Typhoon Khanun, 2023) and real-world experiments (Typhoon Yagi, 2024).
The experimental results in Fig. 11 indicate that assimilating only sea surface wind data is not sufficient to effectively improve the model's typhoon forecasts. To obtain a more accurate initial field, it is necessary to assimilate as much observational data as possible from the middle and upper atmosphere and other forecast variables. Therefore, future work should focus on introducing additional types of observational operators and corresponding quality control systems into the SVD-3DEnVar scheme to meet the multi-source observational data assimilation needs in operational forecasts.
It is noted that the analysis increments from SVD-3DEnVar often contain small-scale noise, especially for variables that lack direct observations (see Figs. 7 and 10). This noise can generate spurious gravity waves in the model, potentially degrading subsequent forecast quality, particularly in cycling assimilation applications. Despite the computational advantages demonstrated in this study, SVD-3DEnVar faces several challenges that warrant further investigation. The use of a single localization scale may not optimally handle multi-scale observations from diverse platforms (e.g., surface, satellite, and radar), as the background error covariance relationships between different analysis variables are embedded in the singular vectors of the local ensemble samples, with the scale characteristics primarily dependent on the localization radius and observation localization scale parameters (as discussed in Sect. 3.1). Moreover, the linear combination of singular vectors in finite ensemble conditions may not fully capture strongly nonlinear relationships, particularly for unobserved variables. These limitations motivate future work on multi-scale assimilation and machine-learning-enhanced methods.
To address these issues, we plan to focus on two aspects. First, we will adopt the Incremental Analysis Update (IAU) technique (Bloom et al., 1996) to alleviate the impact of initial field adjustments on the model. The IAU technique decomposes the analysis increments into smaller components and gradually incorporates them into the model forecast, effectively filtering out short-wavelength noise from the increments, thereby improving the consistency between the model and initial conditions. We have already achieved good practical results using the IAU method in radar data assimilation (Lin et al., 2025). On the other hand, multi-scale assimilation techniques are also an effective way to improve the coordination of increments across different scales. For example, Zhang and Tian (2018) implemented a multi-scale assimilation scheme based on a multi-grid approach (Xie et al., 2011) in their NLS-4DVar method. Given the similarities between this method and SVD-3DEnVar (such as both representing analysis increments via a linear combination of ensemble perturbations), their research provides valuable insights for the future development of multi-scale assimilation in the SVD-3DEnVar framework. These approaches, along with machine-learning-enhanced methods, offer promising directions to overcome the current limitations.
Looking forward, the ongoing advancement of 4DEnVar methodologies presents opportunities for further development. Recent studies have explored specialized applications including convective-scale supercell data assimilation (Thiruvengadam and Wang, 2025) and CubeSat constellation microwave radiance utilization (Wang et al., 2025), demonstrating the continued evolution of ensemble-variational approaches. The computational optimizations achieved in this study for perturbation generation and parallel assimilation could provide a foundation for extending the SVD-EnVar framework to incorporate limited temporal dimensions or hybrid approaches that combine the strengths of both 3D and 4D formulations.
With the rapid development of artificial intelligence (AI) and machine learning (ML) technologies, their application in meteorological data assimilation shows promising prospects. For instance, the machine learning-based data assimilation method DiffDA utilizes a pre-trained GraphCast weather forecasting model as a denoising diffusion model and combines predicted states with sparse observational data to assimilate atmospheric variables (Huang et al., 2024). FuXiDA, based on a unified fusion neural network, effectively adjusts the weights between observations and background without the need to estimate error covariance matrices. This deep learning assimilation framework, when applied to satellite observations, not only reduces analysis errors but also significantly improves forecast performance (Xu et al., 2025b). ADAF also approximates the product of the Kalman gain matrix and the innovation vector using neural networks, replacing traditional assimilation frameworks, and is able to rapidly process large amounts of observations to generate high-quality analysis fields at low computational cost (Xiang et al., 2025). Keller and Potthast (2024) proposed an AI-based variational assimilation method (AI-Var), where a trained neural network minimizes the cost function in the variational process to obtain an accurate initial field needed for numerical forecasts. The further integration of machine learning with the SVD-3DEnVar scheme to address challenges such as complex nonlinear observation operator design and multi-scale assimilation is a promising direction for future research.
The source code for the TRAMS 3.0 model and the SVD-3DEnVar data assimilation framework can be obtained at https://doi.org/10.57760/sciencedb.30837 (Liu and Xu, 2025a).
The simulated and assimilated results, observation data, and plotting scripts can be obtained at https://doi.org/10.57760/sciencedb.28464 (Liu and Xu, 2025b).
KL designed and implemented the data assimilation system, ran all tests and simulations, created visualizations and validation analyses, carried out the formal analysis, and produced the original draft. DX shaped the conceptualization and methodology, shared reference source code from an earlier version, led the investigation efforts, refined the original draft, and obtained funding with MZ and BZ. FZ and JH provided computational resources; separately, JH offered guidance on code-related questions, while FZ provided partial theoretical guidance. JCL and MZ critiqued and polished the manuscript. QH and YZ supplied multi-source satellite data for real data assimilation experiments. DZ, YL, and CL oversaw the project. DX and BZ managed the project administration.
The contact author has declared that none of the authors has any competing interests.
Publisher's note: Copernicus Publications remains neutral with regard to jurisdictional claims made in the text, published maps, institutional affiliations, or any other geographical representation in this paper. The authors bear the ultimate responsibility for providing appropriate place names. Views expressed in the text are those of the authors and do not necessarily reflect the views of the publisher.
We thank for the technical support of the National large Scientific and Technological Infrastructure “Earth System Numerical Simulation Facility” (https://cstr.cn/31134.02.EL, last access: 12 January 2026).
This work was supported by the Innovation Research Foundation of National University of Defense Technology (grant no. 202402-YJRC-LJ-001), the National Natural Science Foundation of China (grant nos. U2142213, 42405162), and the Guangdong Basic and Applied Basic Research Foundation (grant no. 2025A1515011835).
This paper was edited by Yuefei Zeng and reviewed by two anonymous referees.
Bannister, R. N.: A review of forecast error covariance statistics in atmospheric variational data assimilation. I: Characteristics and measurements of forecast error covariances, Q. J. Roy. Meteor. Soc., 134, 1951–1970, https://doi.org/10.1002/qj.339, 2008.
Bauer, P., Thorpe, A., and Brunet, G.: The quiet revolution of numerical weather prediction, Nature, 525, 47–55, https://doi.org/10.1038/nature14956, 2015.
Berre, L. and Arbogast, E.: Formulation and use of 3D-hybrid and 4D-hybrid ensemble covariances in the Météo-France global data assimilation system, Q. J. Roy. Meteor. Soc., 150, 416–435, https://doi.org/10.1002/qj.4603, 2024.
Bloom, S. C., Takacs, L. L., da Silva, A. M., and Ledvina, D.: Data Assimilation Using Incremental Analysis Updates, Mon. Weather Rev., 124, 1256, https://doi.org/10.1175/1520-0493(1996)124<1256:Dauiau>2.0.Co;2, 1996.
Charnock, H.: Wind stress on a water surface, Q. J. Roy. Meteor. Soc., 81, 639–640, https://doi.org/10.1002/qj.49708135027, 1955.
Dudhia, J.: A Multi-layer Soil Temperature Model for MM5, The Sixth PSU/NCAR Mesoscale Model Users' Workshop, Boulder, Colorado, USA, 22–24 July 1996, 49–50, https://www.researchgate.net/publication/259865197_A_Multi-layer_Soil_Temperature_Model_for_MM5, (last access: 25 August 2025), 1996.
Evensen, G.: Sequential data assimilation with a nonlinear quasi-geostrophic model using Monte Carlo methods to forecast error statistics, J. Geophys. Res.-Oceans, 99, 10143–10162, https://doi.org/10.1029/94JC00572, 1994.
Evensen, G.: The Ensemble Kalman Filter: theoretical formulation and practical implementation, Ocean Dynam., 53, 343–367, https://doi.org/10.1007/s10236-003-0036-9, 2003.
Han, J. and Pan, H.-L.: Sensitivity of Hurricane Intensity Forecast to Convective Momentum Transport Parameterization, Mon. Weather Rev., 134, 664, https://doi.org/10.1175/mwr3090.1, 2006.
Han, J. and Pan, H.-L.: Revision of Convection and Vertical Diffusion Schemes in the NCEP Global Forecast System, Weather Forecast., 26, 520–533, https://doi.org/10.1175/WAF-D-10-05038.1, 2011.
Hersbach, H., Bell, B., Berrisford, P., Hirahara, S., Horányi, A., Muñoz-Sabater, J., Nicolas, J., Peubey, C., Radu, R., Schepers, D., Simmons, A., Soci, C., Abdalla, S., Abellan, X., Balsamo, G., Bechtold, P., Biavati, G., Bidlot, J., Bonavita, M., De Chiara, G., Dahlgren, P., Dee, D., Diamantakis, M., Dragani, R., Flemming, J., Forbes, R., Fuentes, M., Geer, A., Haimberger, L., Healy, S., Hogan, R. J., Hólm, E., Janisková, M., Keeley, S., Laloyaux, P., Lopez, P., Lupu, C., Radnoti, G., de Rosnay, P., Rozum, I., Vamborg, F., Villaume, S., and Thépaut, J.-N.: The ERA5 global reanalysis, Q. J. Roy. Meteor. Soc., 146, 1999–2049, https://doi.org/10.1002/qj.3803, 2020.
Hong, S.-Y., Dudhia, J., and Chen, S.-H.: A Revised Approach to Ice Microphysical Processes for the Bulk Parametrisation of Clouds and Precipitation, Mon. Weather Rev., 132, 103–120, https://doi.org/10.1175/1520-0493(2004)132<0103:ARATIM>2.0.CO;2, 2004.
Huang, L., Gianinazzi, L., Yu, Y., Dueben, P. D., and Hoefler, T.: DiffDA: a Diffusion model for weather-scale Data Assimilation, arXiv [preprint] https://doi.org/10.48550/arXiv.2401.05932, 2024.
Iacono, M. J., Delamere, J. S., Mlawer, E. J., Shephard, M. W., Clough, S. A., and Collins, W. D.: Radiative forcing by long-lived greenhouse gases: Calculations with the AER radiative transfer models, J. Geophys. Res.-Atmos., 113, https://doi.org/10.1029/2008JD009944, 2008.
Inverarity, G. W., Tennant, W. J., Anton, L., Bowler, N. E., Clayton, A. M., Jardak, M., Lorenc, A. C., Rawlins, F., Thompson, S. A., Thurlow, M. S., Walters, D. N., and Wlasak, M. A.: Met Office MOGREPS-G initialisation using an ensemble of hybrid four-dimensional ensemble variational (En-4DEnVar) data assimilations, Q. J. Roy. Meteor. Soc., 149, 1138–1164, https://doi.org/10.1002/qj.4431, 2023.
Keller, J. D. and Potthast, R.: AI-based data assimilation: Learning the functional of analysis estimation, arXiv [preprint], https://doi.org/10.48550/arXiv.2406.00390, 2024.
Li, H. R., Ding, W. Y., Xue, J. S., Chen, Z. T., and Gao, Y. D.: A Study on the Application of Fy-2e Cloud Drift Wind Height Reassignment in Numerical Forecast of Typhoon Chanthu (1003) Track, J. Trop. Meteorol., 21, 34–42, https://doi.org/10.16555/j.1006-8775.2015.01.004, 2015.
Li, J., Tian, Q., Shen, Z., Xu, Y., Yan, Z., Li, M., Zhu, C., Xue, J., Lin, Z., Yang, Y., and Zeng, L.: Fidelity of global tropical cyclone activity in a new reanalysis dataset (CRA40), Meteorol. Appl., 31, https://doi.org/10.1002/met.70009, 2024.
Li, N., Zhang, S., and He, J.: Data Assimilation using MWHTS Onboard FY-3C Satellite for Typhoon Case, IGARSS 2022 – 2022 IEEE International Geoscience and Remote Sensing Symposium, https://doi.org/10.1109/igarss.2019.8898363, 2019.
Lin, X., Feng, Y., Jian, Y., Xu, D., Huang, J., Chen, H., and Zhang, B.: Nowcasting of a Warm-Sector Rainfall Event in Southern China With the TRAMS Model: Sensitivity to Different Radar Reflectivity Retrieval Methods and Incremental Updating Strategies, Earth Space Sci., 12, https://doi.org/10.1029/2024ea003724, 2025.
Liu, K. and Xu, D.: TRAMS 3.0 Model and SVD-3DEnVar Data Assimilation Framework Source Code, Science Data Bank [code], https://doi.org/10.57760/sciencedb.30837, 2025a.
Liu, K. and Xu, D.: TRAMS: SVD-3DEnVar Simulations, Observation Data, and Plotting Scripts, Science Data Bank [data set], https://doi.org/10.57760/sciencedb.28464, 2025b.
Lorenc, A. and Jardak, M.: A comparison of hybrid variational data assimilation methods for global NWP, Q. J. Roy. Meteor. Soc., 144, https://doi.org/10.1002/qj.3401, 2018.
Lorenc, A. C.: The potential of the ensemble Kalman filter for NWP – a comparison with 4D-Var, Q. J. Roy. Meteor. Soc., 129, 3183–3203, https://doi.org/10.1256/qj.02.132, 2003.
Lu, X. and Wang, X.: Simultaneous Multiscale 4DEnVar With Scale Dependent Localization (SDL) in Hurricane Analysis and Forecast System (HAFS), J. Geophys. Res.-Atmos., 129, https://doi.org/10.1029/2023jd040550, 2024.
Lu, X., Yu, H., Ying, M., Zhao, B., Zhang, S., Lin, L., Bai, L., and Wan, R.: Western North Pacific Tropical Cyclone Database Created by the China Meteorological Administration, Adv. Atmos. Sci., 38, 690–699, https://doi.org/10.1007/s00376-020-0211-7, 2021.
Miyoshi, T. and Yamane, S.: Local Ensemble Transform Kalman Filtering with an AGCM at a T159/L48 Resolution, Mon. Weather Rev., 135, 3841–3861, https://doi.org/10.1175/2007MWR1873.1, 2007.
Qiu, C. and Chou, J.: Four-dimensional data assimilation method based on SVD: Theoretical aspect, Theor. Appl. Climatol., 83, 51–57, https://doi.org/10.1007/s00704-005-0162-z, 2005.
Qiu, C., Shao, A., Xu, Q., and Wei, L.: Fitting model fields to observations by using singular value decomposition: An ensemble-based 4DVar approach, J. Geophys. Res.-Atmos., 112, https://doi.org/10.1029/2006jd007994, 2007.
Shao, A., Xi, S., Qiu, C., and Xu, Q.: A hybrid space approach for ensemble-based 4-D variational data assimilation, J. Geophys. Res.-Atmos., 114, https://doi.org/10.1029/2009jd012032, 2009.
Thiruvengadam, P. and Wang, X.: A comparison of En4DVar and 4DEnVar in convective-scale supercell data assimilation: A study of the 8 May 2003 Oklahoma City tornadic supercell, Q. J. Roy. Meteor. Soc., 152, e70071, https://doi.org/10.1002/qj.70071, 2025.
Tian, X. and Feng, X.: A non-linear least squares enhanced POD-4DVar algorithm for data assimilation, Tellus A, 67, 25340, https://doi.org/10.3402/tellusa.v67.25340, 2015.
Tian, X., Xie, Z., and Dai, A.: An ensemble-based explicit four-dimensional variational assimilation method, J. Geophys. Res.-Atmos., 113, https://doi.org/10.1029/2008JD010358, 2008.
Tian, X. J., Xie, Z. H., and Sun, Q.: A POD-based ensemble four-dimensional variational assimilation method, Tellus A, 63, 805–816, https://doi.org/10.1111/j.1600-0870.2011.00529.x, 2011.
Wang, B., Liu, J., Wang, S., Cheng, W., Juan, L., Liu, C., Xiao, Q., and Kuo, Y.-H.: An economical approach to four-dimensional variational data assimilation, Adv. Atmos. Sci., 27, 715–727, https://doi.org/10.1007/s00376-009-9122-3, 2010.
Wang, X., Barker, D. M., Snyder, C., and Hamill, T. M.: A Hybrid ETKF–3DVAR Data Assimilation Scheme for the WRF Model. Part I: Observing System Simulation Experiment, Mon. Weather Rev., 136, 5116–5131, https://doi.org/10.1175/2008MWR2444.1, 2008.
Wang, X., Parrish, D., Kleist, D., and Whitaker, J.: GSI 3DVar-Based Ensemble–Variational Hybrid Data Assimilation for NCEP Global Forecast System: Single-Resolution Experiments, Mon. Weather Rev., 141, 4098–4117, https://doi.org/10.1175/mwr-d-12-00141.1, 2013.
Wang, Y. and Wu, C. C.: Current understanding of tropical cyclone structure and intensity changes – a review, Meteorol. Atmos. Phys., 87, 257–278, https://doi.org/10.1007/s00703-003-0055-6, 2004.
Wang, Y., Chen, H., He, J., Chen, Y., and Min, J.: The Potential Benefits of Assimilating Future CubeSat-Constellation Microwave Radiances on Regional NWP for Typhoon and Heavy Rainfall With a Rapid-Update Convection-Permitting 4DEnVar, J. Geophys. Res.-Atmos., 130, https://doi.org/10.1029/2024jd041746, 2025.
Weng, Y. and Zhang, F.: Assimilating Airborne Doppler Radar Observations with an Ensemble Kalman Filter for Convection-Permitting Hurricane Initialization and Prediction: Katrina (2005), Mon. Weather Rev., 140, 841–859, https://doi.org/10.1175/2011MWR3602.1, 2012.
Wu, C.-C., Chou, K.-H., Lin, P.-H., Aberson, S. D., Peng, M. S., and Nakazawa, T.: The Impact of Dropwindsonde Data on Typhoon Track Forecasts in DOTSTAR, Weather Forecast., 22, 1157–1176, https://doi.org/10.1175/2007WAF2006062.1, 2007.
Xiang, Y., Jin, W., Dong, H., Weyn, J., Bai, M., Fang, Z., Zhao, P., Sun, H., Thambiratnam, K., Zhang, Q., and Huang, X.: ADAF: An Artificial Intelligence Data Assimilation Framework for Weather Forecasting, J. Adv. Model. Earth Sy., 17, https://doi.org/10.1029/2024ms004839, 2025.
Xiao, X., Lu, Q., Lv, X., and Shen, W.: Assimilation of FY-4A GIIRS radiance observations in the forecast of Typhoon Bavi, Front. Earth Sci., 10, https://doi.org/10.3389/feart.2022.1033474, 2023.
Xie, Y., Koch, S., McGinley, J., Albers, S., Bieringer, P. E., Wolfson, M., and Chan, M.: A Space-Time Multiscale Analysis System: A Sequential Variational Analysis Approach, Mon. Weather Rev., 139, 1224–1240, https://doi.org/10.1175/2010mwr3338.1, 2011.
Xu, D., Shao, A., and Qiu, C.: Assimilation of Doppler Radar Velocity Observations with SVD-En3DVar Method. Part II – Real Data Experiments, Chinese Journal of Atmospheric Sciences, 35, 818–832, https://doi.org/10.3878/j.issn.1006-9895.2011.05.03, 2011a.
Xu, D., Shao, A., and Qiu, C.: Assimilation of Doppler Radar Velocity Observations with SVD-En3DVar Method. Part I – Simulated Data Experiments, Chinese Journal of Atmospheric Sciences, 35, 753–766, https://doi.org/10.3878/j.issn.1006-9895.2011.04.14, 2011b.
Xu, D., Shao, A., and Qiu, C.: Doppler radar data assimilation with a local SVD-En3DVar method, Acta Meteorol. Sin., 26, 717–734, https://doi.org/10.1007/s13351-012-0604-3, 2012.
Xu, D., Chen, Z., Zhang, Y., Dai, G., Zhong, S., Zhang, B., Chen, D., Wu, N., Wu, K., and Li, H.: Updates in TRAMS 3.0 model version and its verification on typhoon forecast, Meteorological Monthly, 46, 1474–1484, https://doi.org/10.7519/j.issn.1000-0526.2020.11.008, 2020 (in Chinese).
Xu, D., Lu, Z., Leung, J. C.-H., Zhao, D., Li, Y., Shi, Y., Chen, B., Nie, G., Wu, N., Tian, X., Yang, Y., Zhang, S., and Zhang, B.: AI models still lag behind traditional numerical models in predicting sudden-turning typhoons, Sci. Bull., 70, 2705–2708, https://doi.org/10.1016/j.scib.2025.06.010, 2025a.
Xu, X., Sun, X., Han, W., Zhong, X., Chen, L., Gao, Z., and Li, H.: FuXi-DA: a generalized deep learning data assimilation framework for assimilating satellite observations, NPJ Clim. Atmos. Sci., 8, 156, https://doi.org/10.1038/s41612-025-01039-3, 2025b.
Yang, X., Carcione, V., Nunziata, F., Portabella, M., and Migliaccio, M.: Assimilation of SAR-Derived Sea Surface Winds Into Typhoon Forecast Model, IGARSS 2022 – 2022 IEEE International Geoscience and Remote Sensing Symposium, https://doi.org/10.1109/igarss.2018.8518842, 2018.
Ying, M., Zhang, W., Yu, H., Lu, X., Feng, J., Fan, Y., Zhu, Y., and Chen, D.: An Overview of the China Meteorological Administration Tropical Cyclone Database, J. Atmos. Ocean. Tech., 31, 287–301, https://doi.org/10.1175/JTECH-D-12-00119.1, 2014.
Zafarmomen, N., Alizadeh, H., Bayat, M., Ehtiat, M., and Moradkhani, H.: Assimilation of Sentinel-Based Leaf Area Index for Modeling Surface-Ground Water Interactions in Irrigation Districts, Water Resour. Res., 60, https://doi.org/10.1029/2023wr036080, 2024.
Zhang, H. and Tian, X.: A Multigrid Nonlinear Least Squares Four-Dimensional Variational Data Assimilation Scheme With the Advanced Research Weather Research and Forecasting Model, J. Geophys. Res.-Atmos., 123, 5116–5129, https://doi.org/10.1029/2017JD027529, 2018.
Zhang, L., Qiu, C., and Zhang, S.: Experiments on the 4D-variation with ensemble convariances, Acta Meteorol. Sin., 1124–1132, https://doi.org/10.11676/qxxb2009.108, 2009.
Zhang, M., Zhang, L., Zhang, B., Guan, J., and You, W.: Assimilation of MWHS and MWTS radiance data from the FY-3A satellite with the POD-3DEnVar method for forecasting heavy rainfall, Atmos. Res., 219, 95–105, https://doi.org/10.1016/j.atmosres.2018.12.023, 2019.
Zhang, M., Zhang, L., Zhang, B., Guan, J., You, W., and Yu, P.: Preliminary evaluation of all-sky radiance assimilation scheme with POD-3DEnVar method, Atmos. Res., 275, 106198, https://doi.org/10.1016/j.atmosres.2022.106198, 2022a.
Zhang, S., Tian, X., Han, X., Zhang, M., Zhang, H., and Mao, H.: Improvement of PM2.5 forecast over China by the joint adjustment of initial conditions and emissions with the NLS-4DVar method, Atmos. Environ., 271, https://doi.org/10.1016/j.atmosenv.2021.118896, 2022b.
Zhang, S., Leung, J. C.-H., Xu, D., Wang, L., Chen, Y., Huang, Y., Ma, S., Tian, W., and Zhang, B.: Multivariate Adjustment in the IAU-Based Tropical Cyclone Initialization Scheme in the TRAMS Model, Adv. Atmos. Sci., 43, 436–450, https://doi.org/10.1007/s00376-025-4444-3, 2026.
Zhang, X., Xu, D., Liu, R., and Shen, F.: Impacts of FY-4A AGRI Radiance Data Assimilation on the Forecast of the Super Typhoon “In-Fa” (2021), Remote Sens., https://doi.org/10.3390/rs14194718, 2022c.