
the Creative Commons Attribution 4.0 License.
the Creative Commons Attribution 4.0 License.
 | 10 Nov 2026
MSDT v1.0: an open-source multi-method snow drought toolbox
Xiangfei Li
Jinzhi Tian

Chengzhi Wu
Shuo Wang
Snow drought, characterized by anomalously low snow water equivalent (SWE) relative to climatological conditions, has become an increasingly important cryospheric hazard with substantial environmental and socio-economic impacts. Although numerous snow drought identification methods have been developed, existing implementations are typically fragmented into independent scripts and region-specific workflows, hindering methodological consistency, reproducibility, and systematic intercomparison. Here we present the Multi-method Snow Drought Toolbox (MSDT), an open-source Python software package that provides an end-to-end workflow for snow drought research, encompassing SWE data acquisition, multi-method identification, data visualization, and comparative analysis through an intuitive graphical user interface. MSDT integrates seven widely adopted snow drought identification methods spanning yearly, monthly, and daily temporal scales, with flexible and adjustable parameters that enable users to tailor analyses to different climatic regions and research objectives. The toolbox streamlines data access by supporting automated downloading of state-of-the-art SWE datasets together with a curated catalog of commonly used products, and further supports interactive geospatial visualization for data exploration and methodological comparison. In addition, the toolbox adopts a memory- and performance-efficient architecture that supports large spatiotemporal datasets while maintaining responsive snow drought computing. Its modular architecture enables straightforward integration of additional datasets and identification algorithms. We demonstrate the capability of MSDT using ERA5-Land SWE data to reproduce global snow drought climatology, temporal variability, and representative historical events documented in previous studies. The results show that MSDT consistently reproduces published snow drought characteristics while substantially improving computational efficiency, workflow reproducibility, and methodological comparability. By providing a standardized, extensible, and user-friendly platform, MSDT lowers technical barriers and facilitates reproducible snow drought monitoring, model evaluation, and impact assessment.
- Article
(12776 KB) - Full-text XML
-
Supplement
(3681 KB) - BibTeX
- EndNote


Snow drought, characterized by anomalously low snow water equivalent (SWE) relative to climatological conditions, has emerged as a critical component of global change. Recent decades have witnessed a succession of high-impact snow drought events across the western United States (Harpold et al., 2017; Dye et al., 2023), Central Asia (Bair et al., 2018), the European Alps (Colombo et al., 2023), and the Hindu Kush-Himalaya region (ICIMOD, 2025), underscoring the global scope and increasing severity of this hazard. The growing prominence of snow drought are exerting important implications for natural and socioeconomic systems (Sturm et al., 2017; Henderson et al., 2018; Falk and Lin, 2021; Siirila-Woodburn et al., 2021; Han et al., 2025), attracting increasing attention from the research community.
A range of snow drought identification methods has been developed to characterize different aspects of snow deficiency across multiple temporal scales. Annual-scale approaches generally evaluate whether seasonal snow metrics, such as 1 April SWE, peak SWE magnitude, peak SWE timing, seasonal accumulated SWE, or average SWE, fall below climatological thresholds (Harpold et al., 2017; Dierauer et al., 2019; Marshall et al., 2019; Li et al., 2024). Monthly-scale methods, represented by the Standardized Snow Water Equivalent Index (SWEI), extend the standardized precipitation index (SPI) framework by transforming cumulative SWE anomalies into standardized probability distributions, thereby enabling consistent assessment of prolonged snow deficits (Huning and AghaKouchak, 2020b). At finer temporal resolution, daily-scale approaches such as the Phase Diagram Method (PDM) simultaneously track the evolution of SWE and precipitation percentiles, allowing the onset, development, transition, and recovery of snow drought events to be monitored in near real time (Hatchett et al., 2022). Together, these complementary methods provide a comprehensive characterization of snow drought evolution from seasonal accumulation deficits to intra-seasonal persistence and short-term snowpack dynamics.
Despite these methodological advances, practical application remains constrained by the lack of unified computational tools. Unlike meteorological and hydrological drought indices, which benefit from mature, widely adopted computational packages (Hao et al., 2017; Hayes et al., 2011), snow drought analyses remain dependent on ad hoc, investigator-specific scripts written in Python, R, or MATLAB. Differences in implementation details, parameter settings, climatological baselines, temporal aggregation strategies, and output formats frequently lead to inconsistent results among studies, reducing methodological transparency, reproducibility, and comparability (Gottlieb and Mankin, 2022; Fang and Leung, 2023). Moreover, constructing complete snow drought analysis workflows – including data acquisition, preprocessing, identification, visualization, and result export – typically requires considerable programming expertise, creating substantial barriers for hydrologists, cryosphere scientists, operational agencies, and resource managers. Although platforms such as Google Earth Engine, Microsoft Planetary Computer, and Copernicus Climate Data Store have provided scalable cloud computing environments and facilitate retrieval and preprocessing of snow datasets, none currently provides standardized implementations of multiple snow drought identification methods, integrated comparison among alternative definitions, or dedicated graphical workflows tailored to snow drought analysis. Moreover, although existing intercomparisons have demonstrated that method choice can affect inferred drought characteristics (Gottlieb and Mankin, 2022), many studies still rely on a single identification method because of the constraints outlined above, leaving the robustness of their conclusions across alternative definitions insufficiently evaluated.To bridge this gap, we developed the Multi-method Snow Drought Toolbox (MSDT), an open-source Python-based software package that provides an integrated and standardized platform for snow drought analysis. MSDT implements seven widely adopted snow drought identification methods across yearly, monthly, and daily temporal scales within an intuitive graphical user interface (GUI). The toolbox supports automated downloading of ERA5-Land and GlobSnow SWE datasets, flexible parameter customization, multi-file comparison, interactive geospatial visualization, and standardized NetCDF output with embedded metadata to facilitate reproducible downstream analyses. Its modular software architecture separates computational algorithms, data management, visualization, and interface components, allowing new datasets and identification methods to be incorporated with minimal modification. By integrating data acquisition, processing, visualization, and multi-method comparison into a unified workflow, MSDT substantially lowers technical barriers while improving methodological consistency and computational reproducibility for snow drought research and operational applications.
In the following, we introduce the implemented snow drought identification methods together with the software architecture and graphical interface in Sect. 2. Section 3 demonstrates the capability of MSDT using global analyses and representative historical snow drought events. Section 4 examines the scientific implications, computational performance, current limitations, and future development of the toolbox.
2.1 Snow drought identification method
We group existing methods by temporal scale: point-in-time methods for yearly conditions, standardized index methods for monthly anomalies, and diagram methods for daily evolution (Table 1).

2.1.1 Point-in-time method (yearly)
Point-in-time methods identify snow drought when snow metrics, such as 1 April SWE, peak SWE, peak SWE date, or annual accumulated SWE, fall below local climatology or lower-tail percentiles. The 1 April SWE metric is widely used in the western United States because it often approximates maximum seasonal snowpack and separates accumulation from melt seasons (Harpold et al., 2017; Huning and AghaKouchak, 2020a; Pagano et al., 2004; Zeng et al., 2018). Its transferability is limited, however, because peak timing varies across regions and elevations (Gottlieb and Mankin, 2022; Harpold et al., 2012; Musselman et al., 2021). Alternative approaches use peak SWE, peak timing, or annual accumulated SWE relative to climatological means, medians, or percentiles (Cooper et al., 2016; Dierauer et al., 2019; Heldmyer et al., 2023; Li et al., 2024; Marshall et al., 2019; Shrestha et al., 2021).
In MSDT, the thresholds listed in Table 1 are implemented as documented defaults rather than hard-coded constants. Users can define the mean multiplier used by 1AprSWE and PeakSWEMean, the lower-tail percentile used by PeakSWEPctl, PeakSWEDate, AccSWE, and PDM, and the SWEI threshold used for standardized monthly anomalies. These settings are stored in output metadata to support sensitivity analysis and reproducibility.
The point-in-time methods are advantageous for interpreting the state of snowpack in a simple and practical way. Peak SWE, for example, is widely used for revealing interannual changes in snow conditions (Cowherd et al., 2023; Heldmyer et al., 2023; Yeşilköy et al., 2024). The primary limitation is that these methods do not account for the dynamics of snow cover (i.e., the onset, development, and cessation process).
2.1.2 Standardized index method (SI, monthly)
SI methods treat snow drought as a sub-seasonal period of low snowpack. The Standardized Snow Water Equivalent Index (SWEI), inspired by SPI (Keyantash, 2021), describes snow drought using probability-transformed cumulative SWE anomalies (Huning and AghaKouchak, 2020b). In the original SWEI method, a three-month sliding accumulation is performed on monthly SWE datasets to obtain accumulated SWE records:
the probabilities of cumulative SWE were subsequently determined by computing the empirical Gringorten plotting position (Gringorten, 1963):
where i represent the ith rank of Ak,i sorted in ascending order, N is the number of samples in the ranked list. The inverse cumulative distribution function is used to transform the empirical probability, p, into the standard normal distribution to obtain SWEI:
SI methods provide a measure reflecting the combined effects of SWE amount and its persistence over any desired timescale. They allow a more flexible characterization of the temporal evolution of snow drought. In addition, SI values are comparable across regions with different climates, since they are essentially the standardized SWE anomalies after the normalization (Keyantash, 2021). These advantages potentially support their widespread adoption, similar to other drought indices (Hao et al., 2017; Hayes et al., 2011).
2.1.3 Phase Diagram method (PDM, daily)
Hatchett and McEvoy (2018) noted that point-in-time and SI methods do not fully represent the real-time onset, evolution, and termination of snow drought, which can limit impact-oriented interpretation. Hatchett et al. (2022) therefore applied a phase diagram to examine the daily co-variation of SWE and accumulated precipitation. The method basically follows the following steps: (1) calculating daily percentiles for SWE and precipitation. The accumulated SWE and accumulated precipitation since the first day of winter period is calculated first, and a 7 d moving window centered on each calendar day is applied to reduce seasonality effects. (2) scattering and connecting daily percentiles on the phase diagram in chronological order. (3) days falling between the 30th–20th, 20th–10th, 10th–5th, and 5th–2nd percentiles, and below the 2nd percentile, are identified as abnormally dry, moderate drought, severe drought, extreme drought, and exceptional drought, respectively. Dry snow drought occurrs when accumulated precipitation is below the median and warm snow drought occurring when it is above the median. Within below-median precipitation conditions, a precipitation percentile exceeding the SWE percentile indicates dry but warm snow drought, suggesting a comparatively greater snowpack deficit in percentile terms. Thus, this approach does not directly apply a temperature threshold but instead uses the combined precipitation and snowpack anomalies to infer potential warming-related influences, such as rainfall replacing snowfall or enhanced snowmelt.
The PDM provides more than a snow drought identification method and an illustration of variation, it offers a potential tool to link snow drought to its impacts on meteorology, water resources, ecosystems, and recreation within the system of interest. However, because it explicitly includes precipitation but not other drivers such as temperature, solar radiation, humidity, or light-absorbing particles, it cannot represent all snow-evolution mechanisms (Fang and Leung, 2023; Hatchett et al., 2022; Wang et al., 2024).
2.2 Identification of snow-covered area
Accurate snow drought identification requires prior establishment of valid snow persistence zones. In this study, we first calculate the 3 month rolling snow cover fraction climatology from MODIS/Terra Monthly Snow Cover data set (MOD10C1) observations (2000–2022), then apply a 5 % threshold to remove ephemeral snow regions. Monthly SWE records from the land component of the fifth generation of European ReAnalysis (ERA5-Land, 1980–2024) are further used to retain pixels where snow is present for at least 75 % of a given month across the study period (Huning and Agha-Kouchak, 2020b; Li and Wang, 2022). All data are regridded to 0.25° spatial resolution using the bilinear interpolation method before identifing snow-covered area.
The MSDT system does not restrict the method for identifying the snow-covered area. Users can use this as a reference or employ other methods to determine their own snow-covered area. Then, in the form of an Excel table (optional), they can specify the Extent Mask within the MSDT program to reduce the computational load.
2.3 Multi-method snow drought toolbox, MSDT
2.3.1 Software architecture
The MSDT is designed as a modular, end-to-end software framework that integrates SWE data preparation, multi-scale snow drought analysis, visualization, and standardized output generation within a unified workflow (Fig. 1). The software adopts a layered architecture in which individual functional components communicate through standardized NetCDF-based data structures rather than method-specific intermediate files, ensuring consistency, extensibility, and reproducibility.
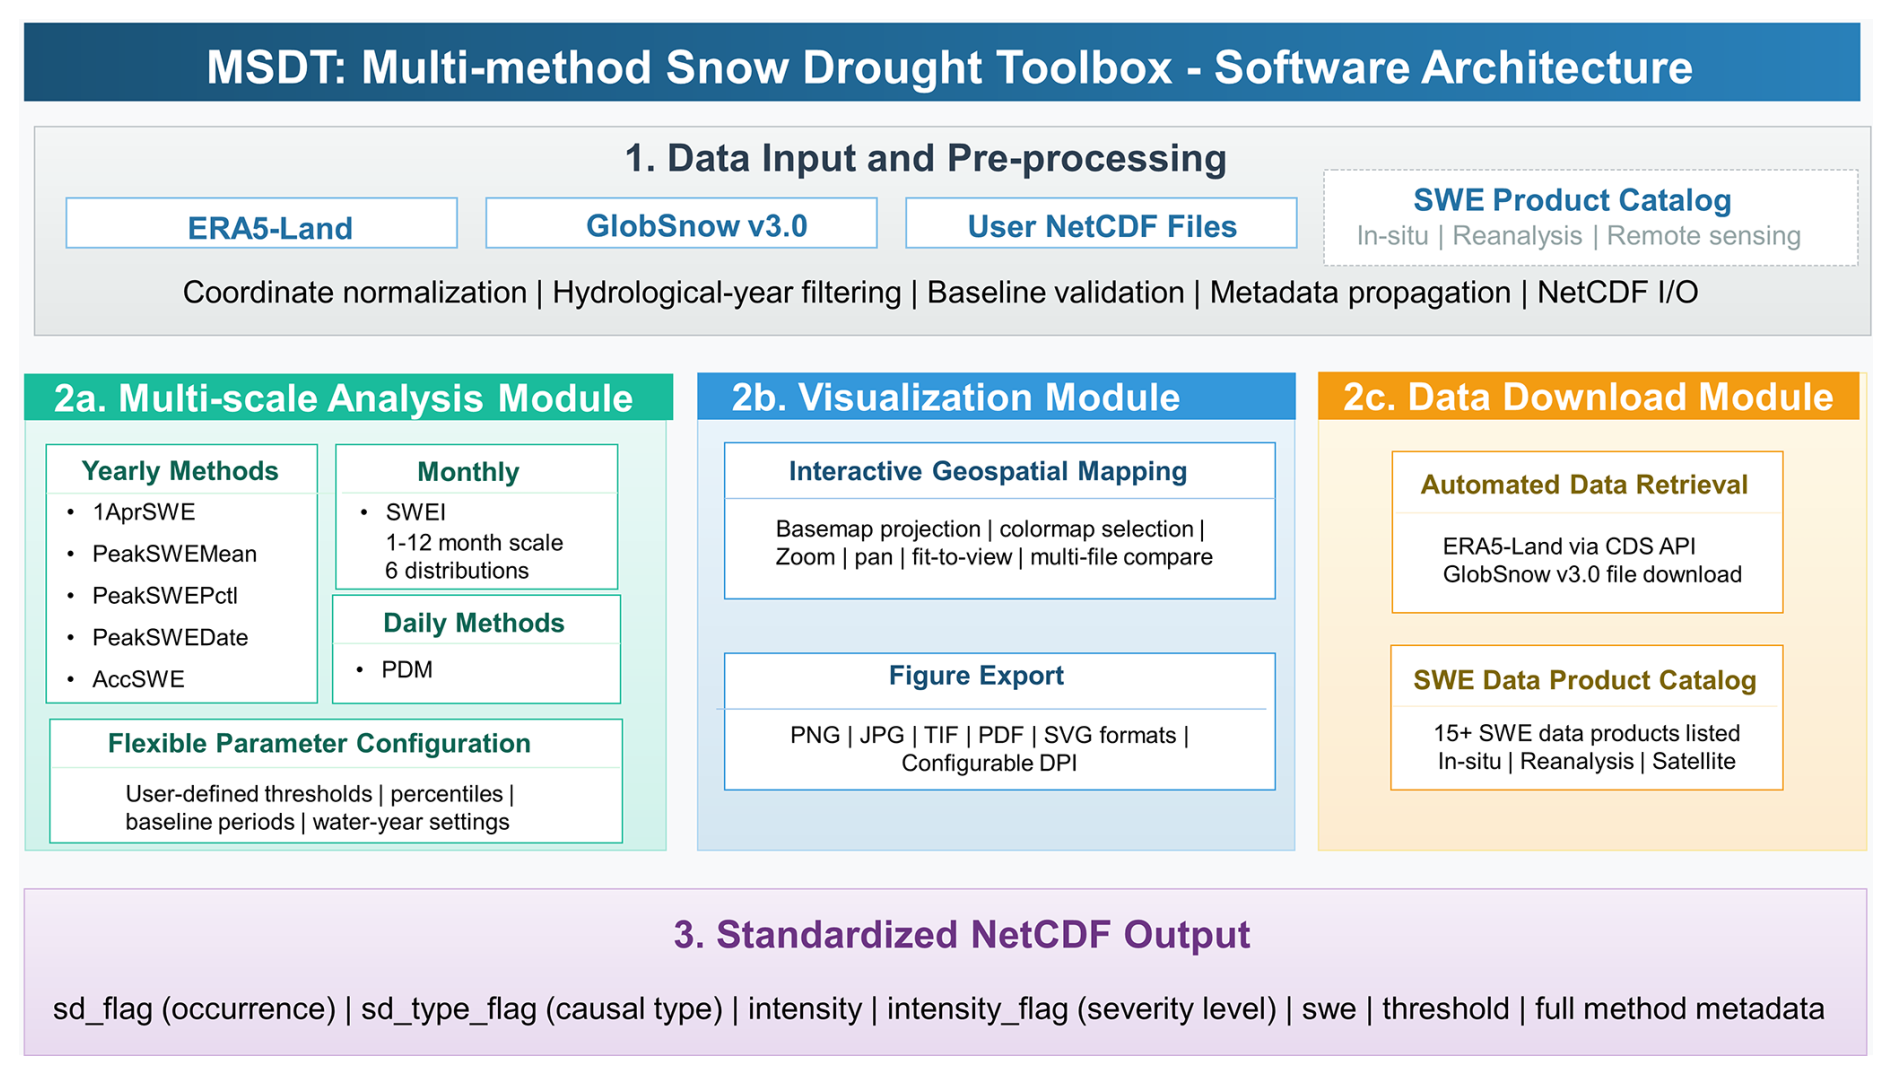
The workflow begins with a data input and preprocessing layer. During data ingestion, coordinate systems, temporal dimensions, hydrological-year definitions, baseline periods, and metadata are automatically validated and standardized. This shared preprocessing framework ensures that all subsequent analysis modules operate on consistent data structures regardless of the original data source. After preprocessing, users access three independent but interconnected functional modules through the graphical user interface. The Multi-scale Analysis Module performs snow drought identification using multiple methods at yearly, monthly, and daily temporal scales. The Visualization Module enables interactive inspection of both original SWE datasets and derived snow drought products through synchronized geospatial mapping and comparison tools. The Data Download Module provides automated retrieval of selected SWE datasets together with a curated catalog of commonly used snow products for convenient data discovery. Finally, all analysis results are exported through a standardized NetCDF output layer, which stores snow drought occurrence, drought type, intensity, SWE values, thresholds, and complete method metadata using a unified data model (Table 2 and Text S2). By separating data management, computational algorithms, visualization, and user-interface components, the architecture facilitates future integration of new datasets and identification algorithms while maintaining a consistent and reproducible workflow.
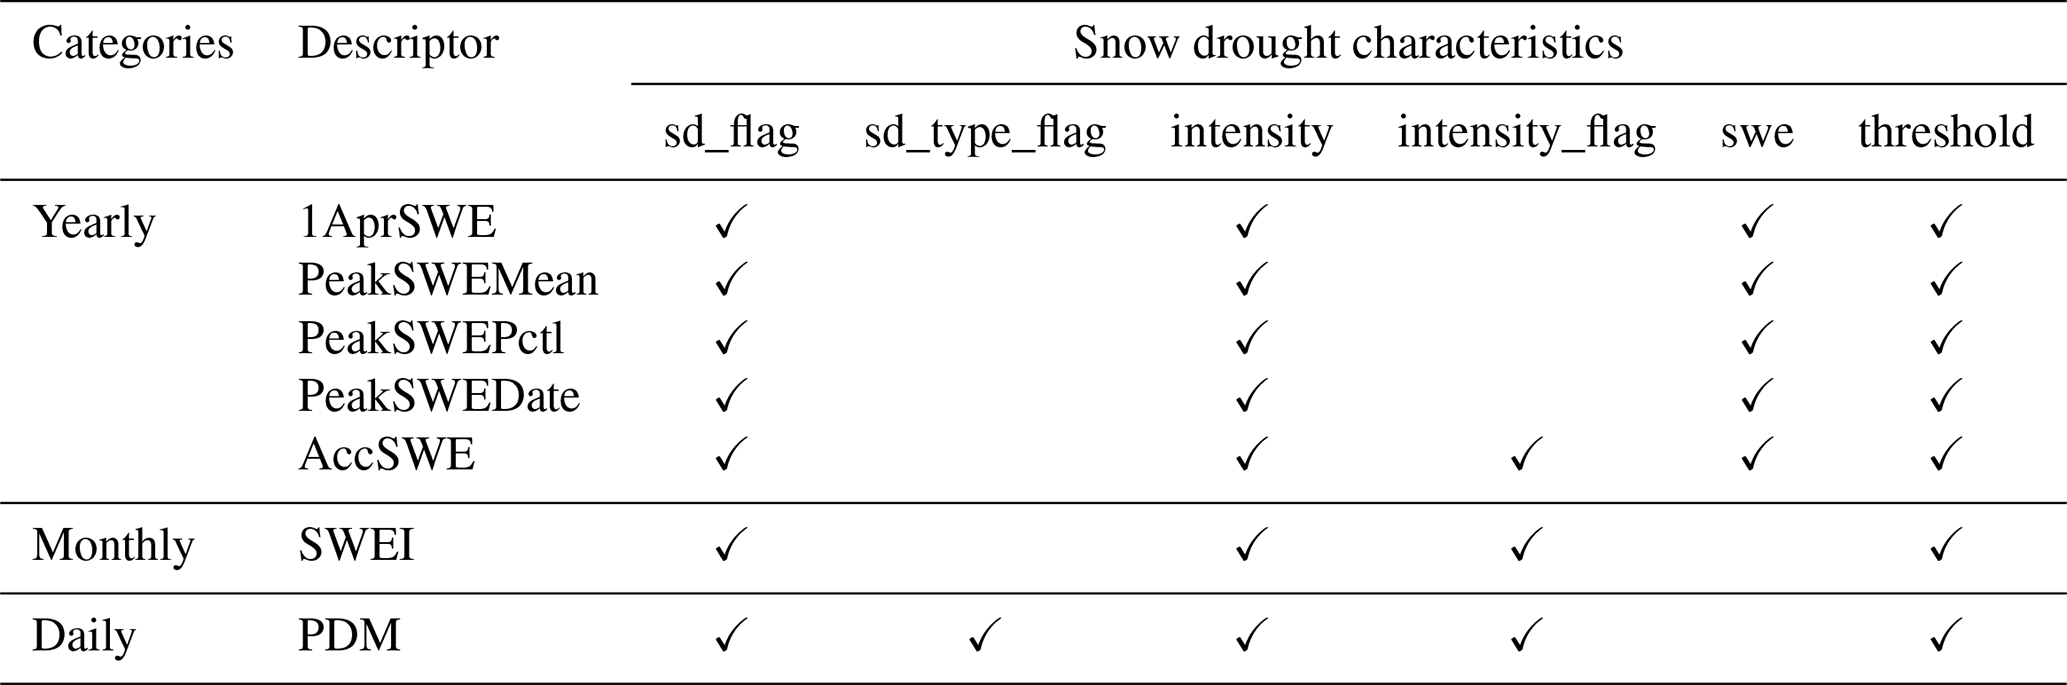
Table 2Main characteristics for different snow drought definitions. sd_flag: binary records of snow drought; sd_type_flag: causes of snow drought; intensity: SWE, date, or SWEI anomaly of each record; intensity_flag: severity level of snow drought, see Table S1 in the Supplement for the classification schemes and flag values; swe: SWE when snow drought occurs; threshold: threshold used to identify snow drought. See Table S2 for detail explanations of those variables.
2.3.2 Multi-scale analysis module
The Multi-scale Analysis Module constitutes the computational core of MSDT (Fig. S1 in the Supplement). It integrates seven widely adopted snow drought identification methods spanning yearly, monthly, and daily temporal scales. Five yearly point-in-time methods (1AprSWE, PeakSWEMean, PeakSWEPctl, PeakSWEDate, and AccSWE) characterize seasonal snow deficits from complementary perspectives, including snow accumulation, peak magnitude, and peak timing. At the daily scale, the PDM method identifies the onset, evolution, and termination of snow drought events based on the joint evolution of SWE and precipitation percentiles.
The monthly module implements SWEI method, allowing users to choose the accumulation window from 1–12 months and to fit the cumulative SWE series using either the empirical Gringorten plotting position or parametric distributions commonly used in drought-index calculations, including Gamma, Pearson type III, normal, lognormal, and Weibull distributions (McKee et al., 1993; Guttman, 1999; Vicente-Serrano et al., 2010; Stagge et al., 2015). For parametric SWEI fitting, positive-support distributions use a zero-probability adjustment before cumulative distribution transformation, whereas real-support distributions are fitted directly to finite accumulated SWE values. If a fitted distribution is numerically unstable or has too few valid samples at a grid cell, MSDT falls back to the empirical estimator and records the selected distribution in the output metadata. The choice of distribution can influence the probability transformation of accumulated snow water equivalent and therefore affect the estimated spatial extent, severity, and duration of snow drought events. The empirical Gringorten approach does not assume a predefined distribution and is useful when sample sizes are limited or the data distribution is complex; however, it has limited ability to represent probabilities beyond the observed record (Gringorten, 1963; Huning and AghaKouchak, 2020). Parametric distributions may provide smoother probability estimates, but their performance depends on how well the assumed distribution matches the observed snow water equivalent characteristics. Gamma, Lognormal, and Weibull distributions are often suitable for non-negative and right-skewed hydroclimatic variables, whereas Pearson type III has been widely recommended in standardized drought-index calculations because of its flexibility in representing skewed distributions (Guttman, 1999; Stagge et al., 2015). The Normal distribution is simple and computationally stable, but it may underestimate extremes in regions with strong skewness or frequent zero-snow conditions. Therefore, probability distribution selection should be treated as a source of methodological uncertainty. Users are encouraged to compare multiple distributions, especially in regions with short records, intermittent snow cover, or complex snow regimes.
Despite their methodological differences, all identification methods follow a common computational workflow consisting of data loading, parameter validation, algorithm execution, metadata generation, and standardized output. This unified processing framework enables direct comparison among snow drought definitions, climatological baselines, threshold selections, temporal scales, and input datasets. Users can flexibly configure baseline periods, winter period definitions, drought thresholds, accumulation windows, and probability distributions through the graphical interface. To minimize invalid parameter combinations, the graphical interface dynamically activates only the configuration options required by the selected identification method. The software also automatically determines the default winter period according to the hemisphere of the input dataset, adopting July–June (Northern Hemisphere) and January–December (Southern Hemisphere) for yearly-scale analyses, and November–March and May–September for daily-scale analyses, respectively. Meanwhile, users can customize the start and end months of the winter period. For the Northern Hemisphere, the end month is interpreted as a month in the following year, whereas for the Southern Hemisphere, it corresponds to a month in the same year. Furthermore, the Intensity outputs generated by the AccSWE, SWEI, and PDM methods support user-defined reclassification, enabling direct comparison of snow drought severity across methods, datasets, and study regions.
More details regarding the pseudocode, flowcharts, input and output conventions, and example parameter files for the seven snow drought identification methods in the Supplement (Text S1).
2.3.3 Visualization module
The Visualization Module provides an integrated environment for interactive exploration of SWE datasets and snow drought products without requiring external geographic information system (GIS) software (Fig. S2). Multiple NetCDF files can be opened simultaneously, allowing direct comparison among datasets, identification methods, variables, and parameter settings. The module synchronizes temporal selection, map projection, color mapping, and navigation across multiple visualization panels, facilitating evaluation of methodological differences and spatial consistency.
Interactive geospatial visualization is implemented using Matplotlib and Basemap, supporting zooming, panning, fit-to-view, and rapid switching between variables and time steps. Variable metadata are displayed within the interface and can be customized to improve figure readability. Final figures can be exported in PNG, JPG, TIF, PDF, and SVG formats with user-defined resolutions, enabling publication-quality graphics to be generated directly within MSDT.
2.3.4 Data download module
The Data Download Module integrates automated data acquisition with a comprehensive SWE product catalog to simplify data preparation for snow drought analysis (Fig. S2). Downloaded datasets are automatically organized using the standardized data structure adopted throughout MSDT and can be transferred directly to the analysis and visualization modules without additional preprocessing.
Currently, MSDT supports automated retrieval of ERA5-Land SWE through the Copernicus Climate Data Store (CDS) API and downloading of GlobSnow v3.0 products (Pulliainen et al., 2020; Muñoz-Sabater et al., 2021). Users specify the spatial domain, temporal range, variables, local storage location, and API credentials (where required), while download progress and execution status are displayed in real time within the application.
To facilitate broader data selection, MSDT also includes a curated SWE product catalog covering more than 9 commonly used in-situ observations, reanalysis and data-assimilation products, and satellite-derived datasets (Table S3). For each product, the catalog summarizes the temporal coverage, spatial resolution, provider, available variables, and access information, enabling users to efficiently identify suitable datasets for regional applications, intercomparison studies, and validation analyses (Robinson et al., 1993; Gelaro et al., 2017; Bormann et al., 2018; Che et al., 2019; Rodell et al., 2004; Takala et al., 2011; Pulliainen et al., 2020; National Operational Hydrologic Remote Sensing Center, 2004).

2.3.5 Computational optimization
To improve computational efficiency and memory stability, MSDT adopts an end-to-end optimization strategy covering the entire workflow from data input to result export (Fig. 2). During data ingestion, NetCDF files are loaded lazily to reduce memory pressure and standardized to consistent variable names, coordinate conventions, and dimension orders, thereby eliminating redundant preprocessing in subsequent computational steps. The input data are further constrained to the optionally selected winter period and user-defined spatial extent, minimizing the volume of data processed throughout the workflow. During computation, optimization strategies are tailored to different identification methods. Yearly methods rely primarily on vectorized hydrological-year aggregation with low memory overhead, whereas SWEI employs compact rolling-accumulation arrays with user-selectable probability distributions. For the computationally intensive daily PDM method, MSDT uses a memory-aware calculation and output workflow. Inputs are first restricted to the selected winter period. Small datasets are processed as a single spatial block, whereas larger datasets are partitioned into latitude blocks that retain the complete temporal sequences needed for percentile estimation. Block size and concurrency are determined from the filtered input dimensions and available system memory, with explicit parallel execution limited to two workers. A bounded task queue controls the number of resident block results, and blocks outside the extent mask are omitted. Floating-point intermediate arrays use float32 precision where appropriate. A single writer incrementally stores block results in annual NetCDF files, and these results are released after writing. Outputs use lossless NetCDF4 compression at level 4, with shuffle enabled and storage chunks aligned with spatial blocks. This workflow controls memory demand throughout calculation and output and reduces storage requirements.
Detailed computational benchmarks are provided in Text S3, including method-specific runtimes and peak memory usage, temporal and spatial scaling, and NetCDF file sizes with and without lossless compression. All benchmarks were conducted using the same hardware and software configuration.
3.1 Global snow drought characteristics
To demonstrate the capabilities of MSDT, we analyzed global snow drought characteristics across yearly, monthly, and daily scales. Snow drought characteristics were calculated from ERA5-Land SWE data at 0.25° spatial resolution for 1980–2024. The default parameters were used for each method.
Figure 3a–e shows the relative changes in snow drought years across the world from 1980–2024 using yearly-scale methods. Positive and negative values indicate increases and decreases in snow drought years during the latter 22 years relative to the first 22 years, respectively. Globally, the methods revealed spatially consistent patterns, with hotspots in western CONUS, eastern Russia, Europe, eastern Siberia, Central Asia, and East Asia, demonstrating the ability of MSDT to reproduce established large-scale snow drought patterns. The temporal evolution of snow drought spatial extent is shown in Fig. 3f–j. Over the past 45 years, snow droughts exhibited significant spatial expansion across all methods except 1AprSWE, potentially reflecting earlier snowmelt timing. The 1AprSWE method, originally designed for western CONUS, showed smaller spatial coverage than the other four methods (Fig. 3a–e) because valid snowpack is often absent on 1 April in southern or low-elevation regions of the Northern Hemisphere. Similarly, PeakSWEPctl showed smaller changes in drought years and spatial extent than PeakSWEMean (Fig. 3b and c, g and h), reflecting its stricter drought identification threshold.

Figure 3Global changes in snow drought year between the first and last 22 years (a–e) and the timeseries of the number of snow drought grid box (f–j) using yearly-scale methods: (a, f) 1AprSWE, (b, g) PeakSWEMean, (c, h) PeakSWEPctl, (d, i) PeakSWEDate, and (e, j) AccSWE.

Figure 4Global map and timeseries of snow drought month (a, b) and snow drought day (c, d). Δ snow drought day is the difference between the later and first 22 years during 1980–2024.
Figure 4 displays the spatiotemporal characteristics of snow drought duration derived from the SWEI and PDM methods. Snow drought duration exhibited distinct latitudinal and altitudinal gradients, with Arctic and mountainous regions experiencing prolonged drought conditions (Fig. 4a). Over the past 45 years, the global mean snow drought duration doubled from 2–4 months, accompanied by a significant increase in drought days (Fig. 4d). The strongest intensification occurred across Eurasia (Fig. 4c). Figure 5 presents the spatial distribution and temporal trends of snow drought intensity calculated with the monthly and daily methods. Intensity patterns were related to snow climate regimes: coastal and intermountain regions exhibited more severe droughts than continental zones (Fig. 5a). Concurrently, global snow drought intensification was evident from declining SWEI values and daily intensity metrics (Fig. 5b–d), consistent with previous studies (Cowherd et al., 2023; Huning and AghaKouchak, 2020b). The spatial patterns of duration and intensity changes closely matched those of snow drought occurrence (Figs. 3a–e, 4c, and 5c), indicating systematic aggravation of snow droughts across the globe.
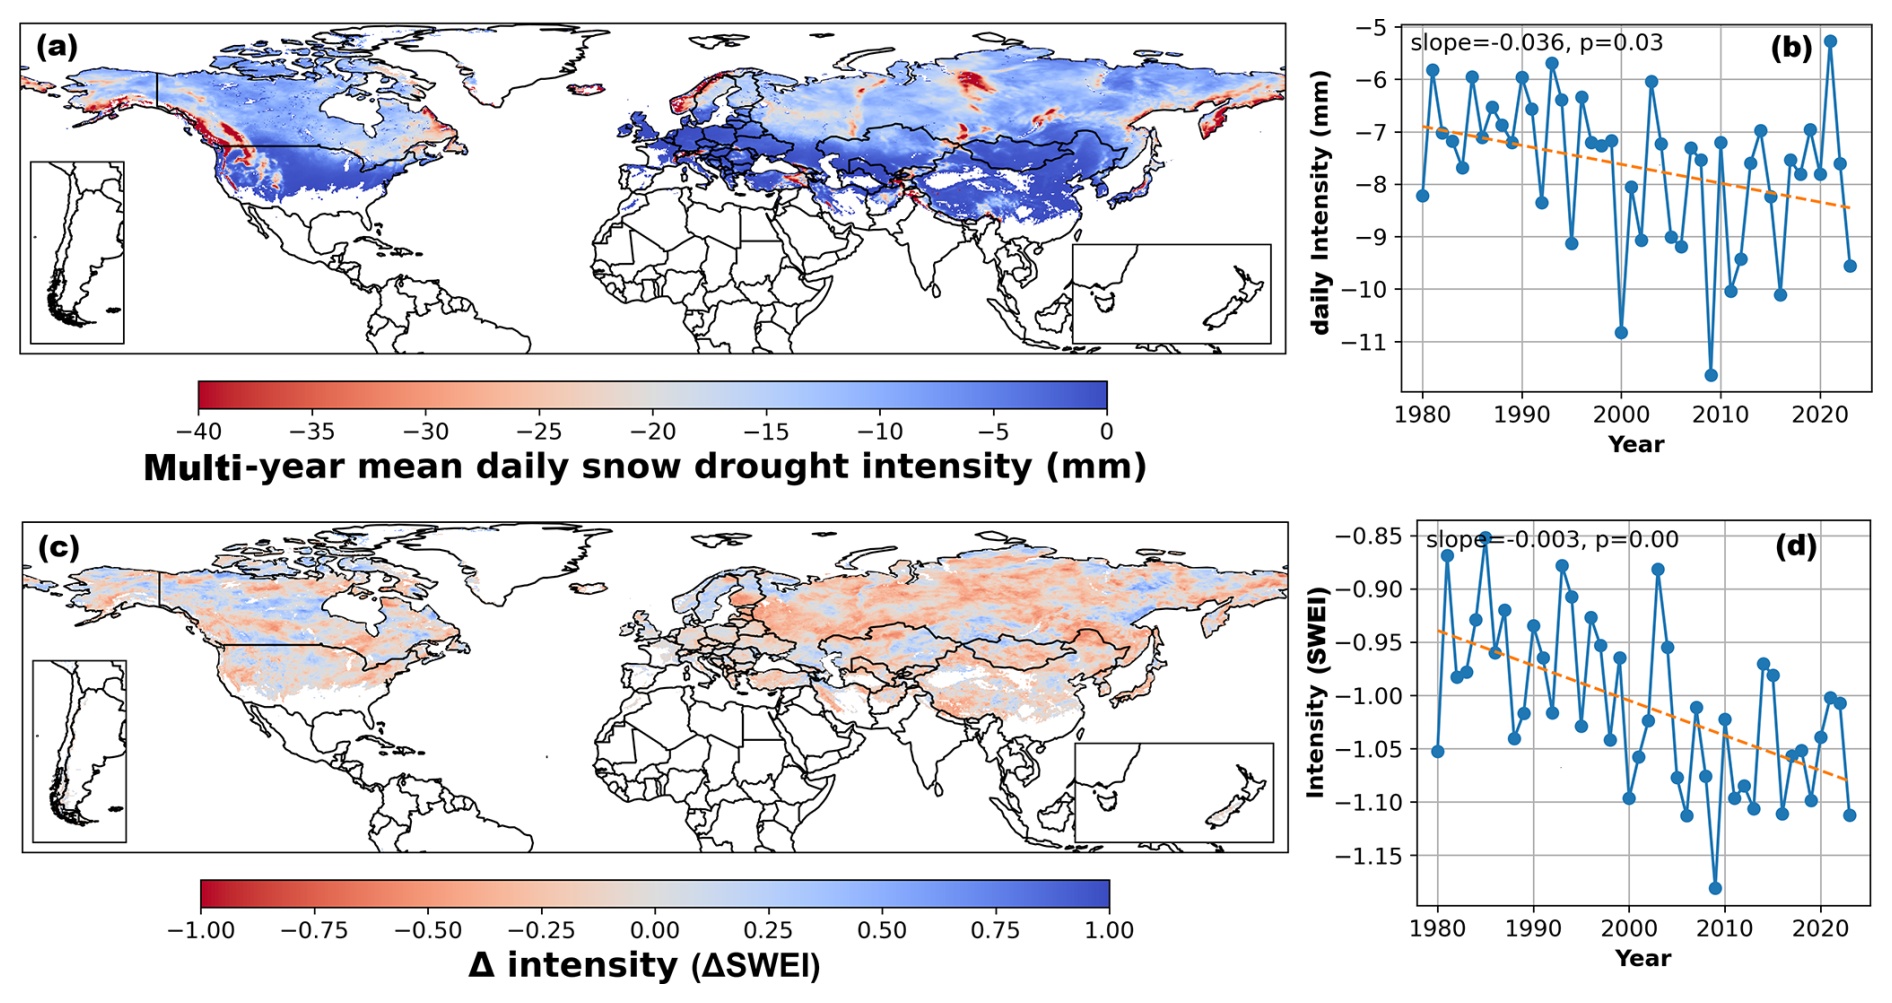
Figure 5Global map and timeseries of daily (a, b) and monthly (c, d) snow drought intensity. Δ intensity is the difference of SWEI values between the later and first 22 years during 1980–2024.
3.2 High-impact snow drought characteristics
Three recent high-impact snow drought events were selected to further demonstrate the applicability of MSDT: the 2014/2015 and 2016/2017 events in the contiguous United States (CONUS) and the 2017/2018 event in Central Asia. Statistics for these events are presented below, and the consistency among different snow drought identification methodologies was evaluated.
3.2.1 Snow drought in the contiguous United States (CONUS)
The CONUS has suffered from chronic snow droughts over recent decades. The 2014/2015 winter saw unprecedented and widespread snow drought in western CONUS, breaking records of the past three to four centuries (Fosu et al., 2016; Margulis et al., 2016; Dye et al., 2023; Harley et al., 2020). Driven by anomalously high temperatures in the Pacific Northwest and precipitation deficits in the Sierra Nevada, the 2014/2015 snow drought triggered abnormal winter streamflow and extreme summer water shortages, prompting drought emergency declarations in Washington and Oregon (Cooper et al., 2016; Harley et al., 2020). In contrast, the 2016/2017 winter brought substantial snowpack recovery to western CONUS following a series of winter storms (Folger, 2017), while an atypical snow drought emerged in eastern regions (Huning and AghaKouchak, 2020b; Koch and Coulston, 2020).
Figure 6 maps snow drought intensity across the CONUS during the 2014/2015 and 2016/2017 water years, with negative values denoting drought conditions. Method-specific intensities are not directly comparable because the methods use different thresholds and measurement dimensions. All yearly-scale methods effectively detected the 2014/2015 western drought and eastern wet anomalies. Snow drought intensity varied among methods in central CONUS, reflecting differences in snow drought definitions (Fig. 6a, c, e, g, i). In 2016/2017, most methods captured the “wet west, dry east” pattern across CONUS, except for 1AprSWE, which showed “dry west, no data in the east”. This result indicates that 1AprSWE can overestimate snow drought in western CONUS and is less suitable for regions with early snowmelt, such as eastern CONUS. The encircled anomalies in Fig. 6g and h further mark strong peak-SWE timing deviations, with early peaks in the north-central United States and late peaks in the northern and central Great Plains. These align well with the November 2014 storms in central Minnesota (National Weather Service, 2014), blue (late) aligns with May 2015 heavy snow in South Dakota and April 2017 blizzards in Kansas-Colorado (National Weather Service, 2015, 2017), demonstrating the PeakSWEDate method's capability to detect anomalous snow timing compared with the other yearly methods.

Figure 6Snow drought intensity (negative values) in CONUS during the water year of 2014/2015 (left) and 2016/2017 (right) using yearly-scale methods: (a, b) 1AprSWE, (c, d) PeakSWEMean, (e, f) PeakSWEPctl, (g, h) PeakSWEDate, and (i, j) AccSWE.
The evolution patterns of the 2014/2015 and 2016/2017 snow droughts are depicted in Figs. 7 and 8. During the 2014/2015 water year, concurrent snow droughts initiated in both western and eastern CONUS, escalating and expanding westward while subsiding eastward in the following months (days). In contrast, the 2016/2017 water year began with opposing anomalies: drought developing in eastern CONUS and wet conditions in the west. These patterns progressively worsened and spatially expanded in subsequent months (days).
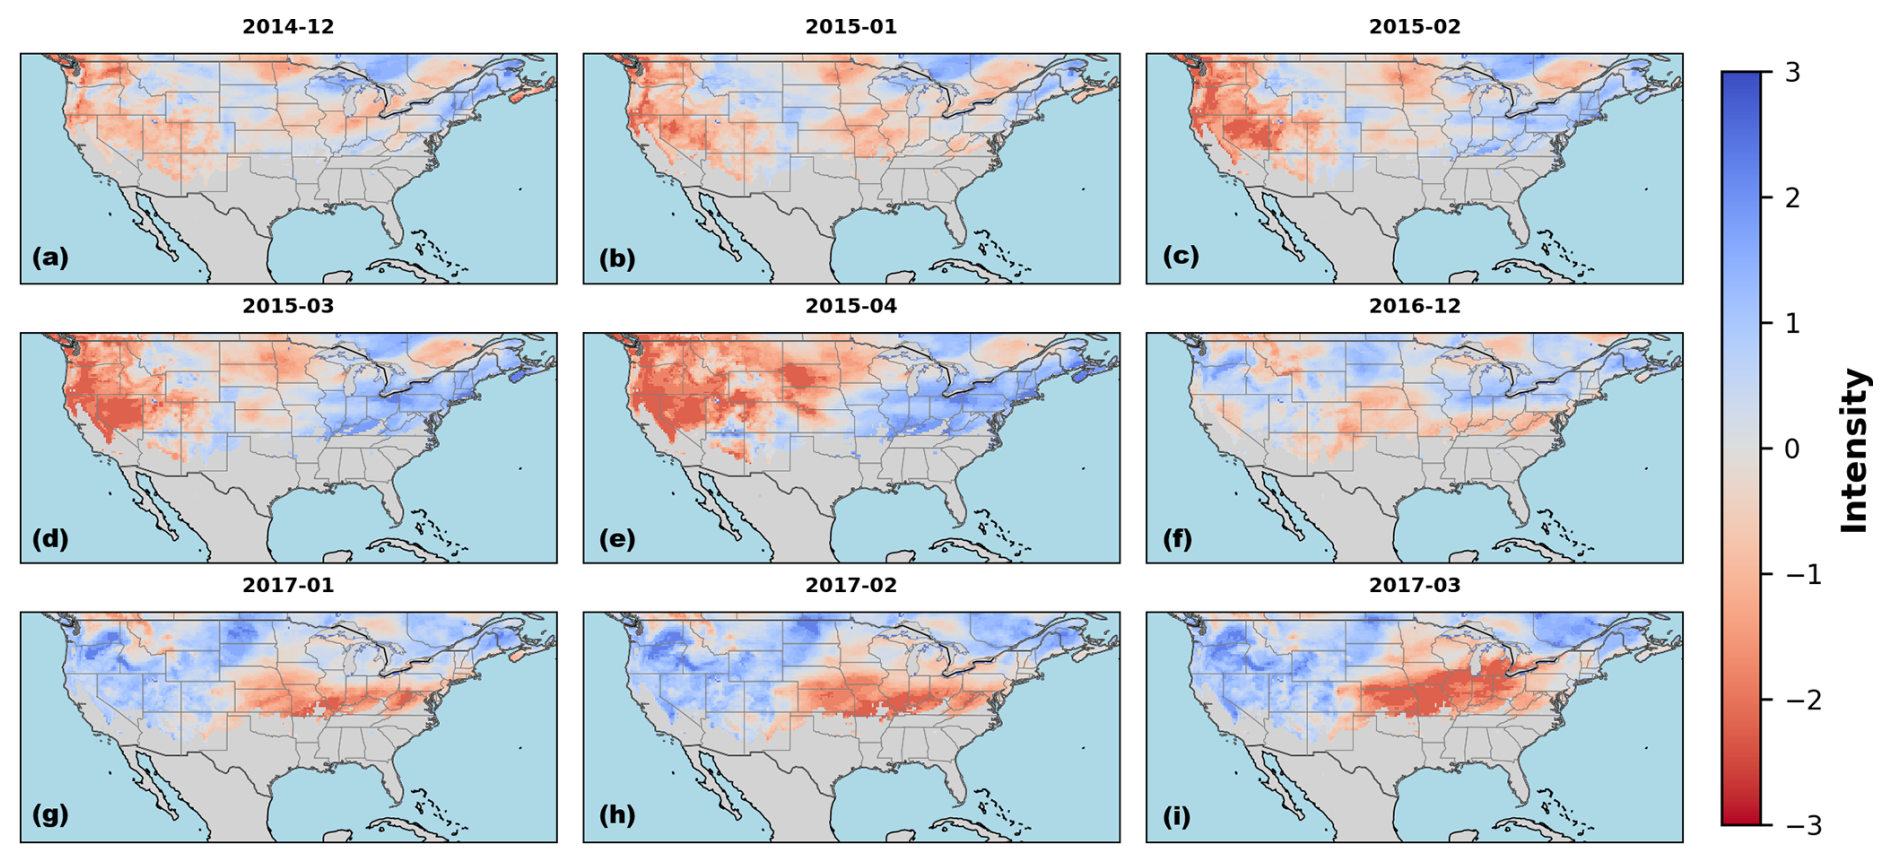
Figure 7Snow drought intensity across CONUS during the water year of 2014/2015 (a–e) and 2016/2017 (f–i) using monthly-scale method.
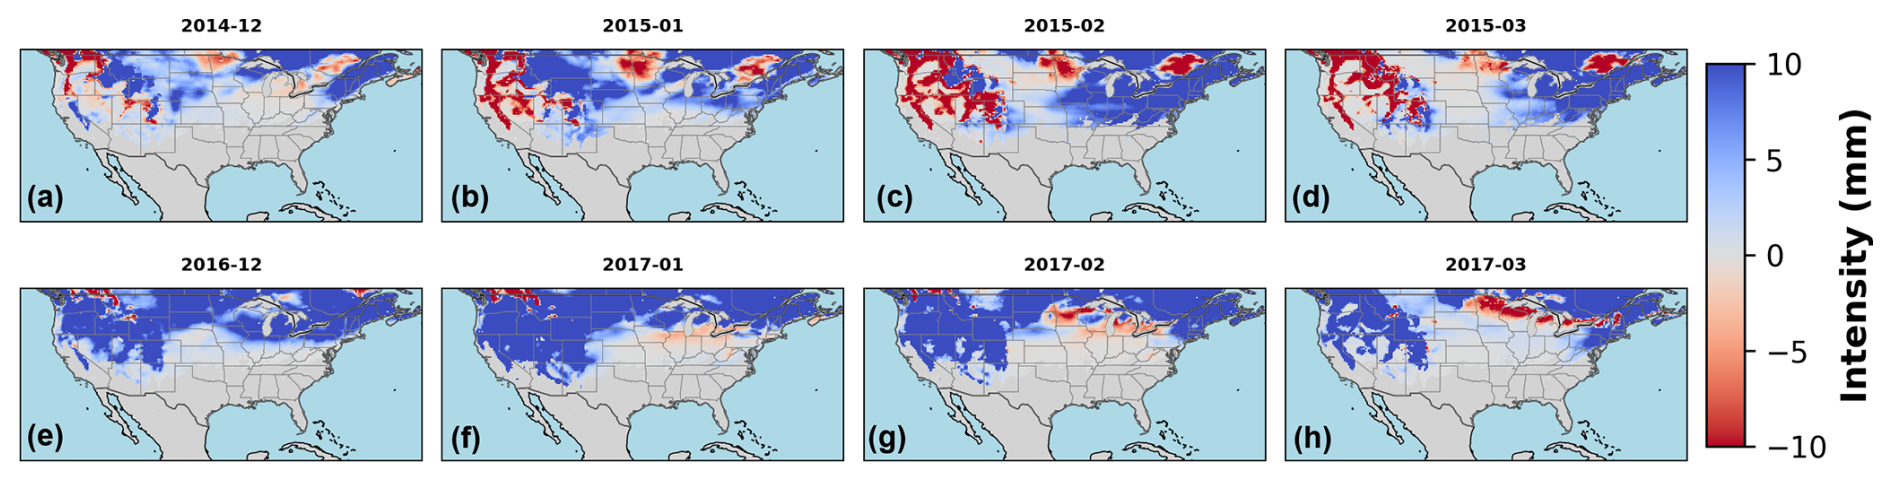
Figure 8Snow drought intensity across CONUS during the water year of 2014/2015 (a–d) and 2016/2017 (e–h) using daily-scale method.
3.2.2 Snow drought in Central Asia (2017/2018)
During the 2017–2018 winter, Central Asia experienced an extraordinary snow drought event, with the most pronounced deficits extending from the western Tianshan Mountains through Afghanistan's high-altitude regions to the northwestern Himalayas. More than three-quarters of Afghanistan's snow-covered districts experienced snow drought intensities fourfold higher than average. The snow drought led to drying of wells and rivers, widespread crop failures, livestock losses, and displacement of more than 260 000 people, severely disrupting agricultural production and contributing to a humanitarian crisis (Bair et al., 2018; Muhammad et al., 2017).
Figure 9 displays the spatial distribution of yearly snow drought intensity across Central Asia during the 2017/2018 water year. Snow droughts are represented as negative values. All methods consistently identified Tianshan wet anomalies in the north and Himalayan-Afghan drought signals in the south. The 1AprSWE method yielded the most limited spatial extent (Fig. 9a), followed by PeakSWEDate (Fig. 9d), while PeakSWEMean, PeakSWEPctl, and AccSWE showed comparable snow drought coverage (Fig. 9b, c, and e). Temporal analysis revealed initially normal snowpack conditions in the Himalayas and southeastern Afghanistan at the onset of the 2017/2018 water year, followed by progressive drought intensification. Conversely, the Tianshan Mountains exhibited a gradual wetting trend from December 2017–March 2018 (Fig. 10). These asymmetric patterns were corroborated by daily-scale snow drought analyses (Fig. 11).
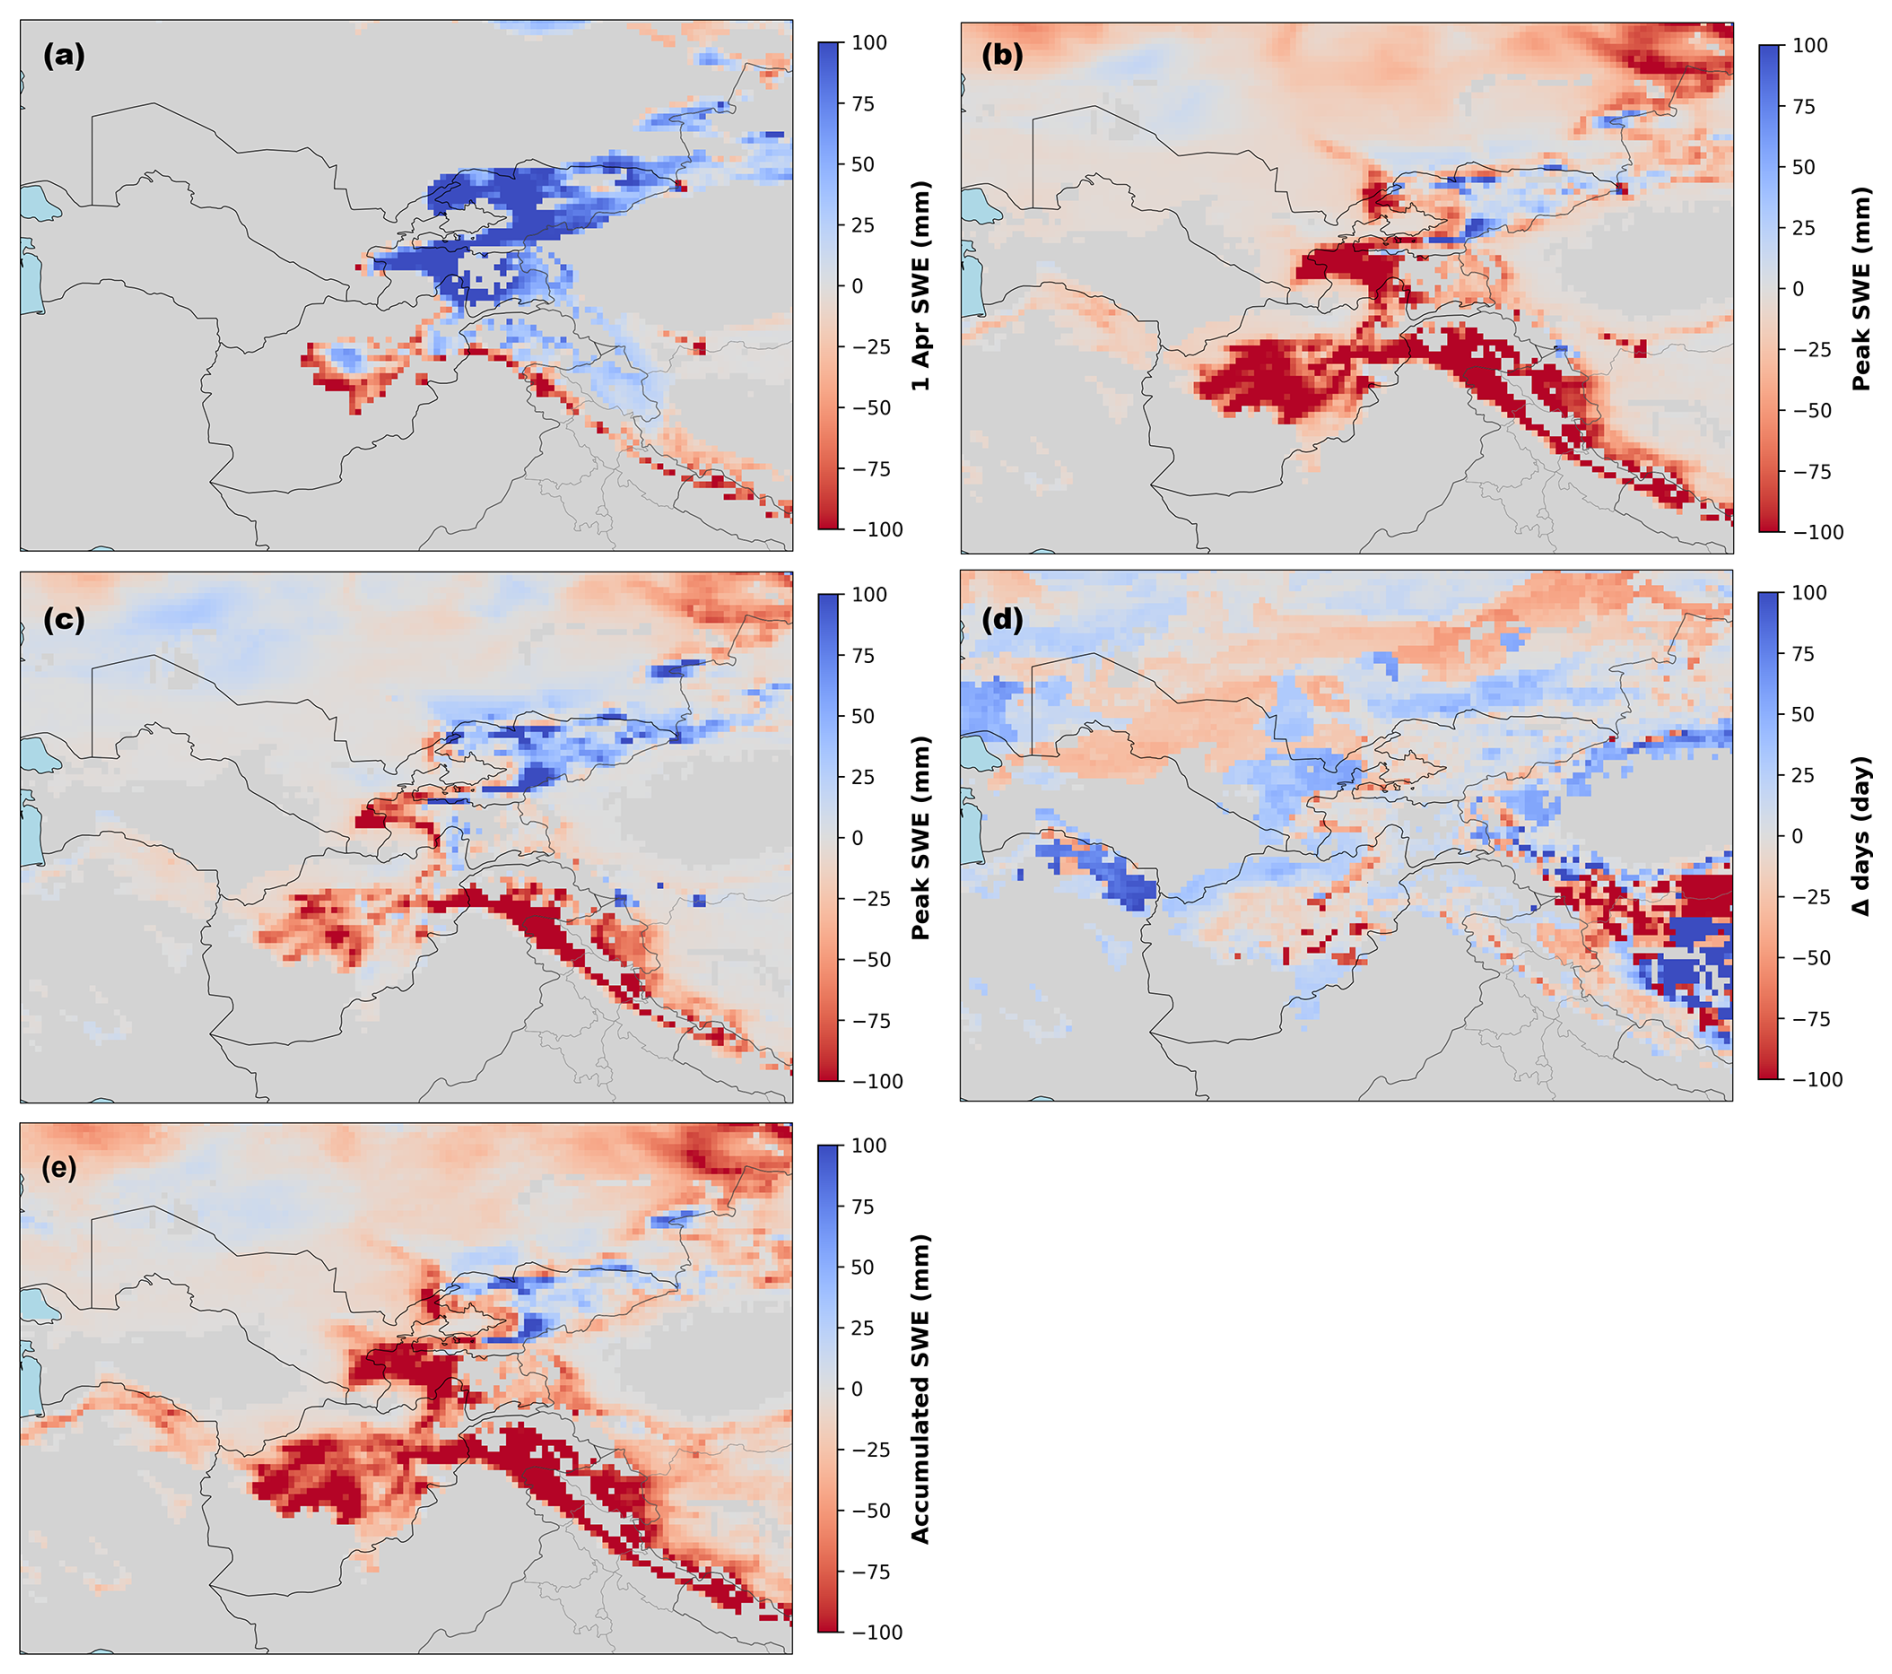
Figure 9Snow drought intensity in Central Asia during the water year of 2017/2018 using yearly-scale methods: (a) 1AprSWE, (b) PeakSWEMean, (c) PeakSWEPctl, (d) PeakSWEDate, and (e) AccSWE.

Figure 10Snow drought intensity in Central Asia during the water year of 2017/2018 using monthly-scale method.
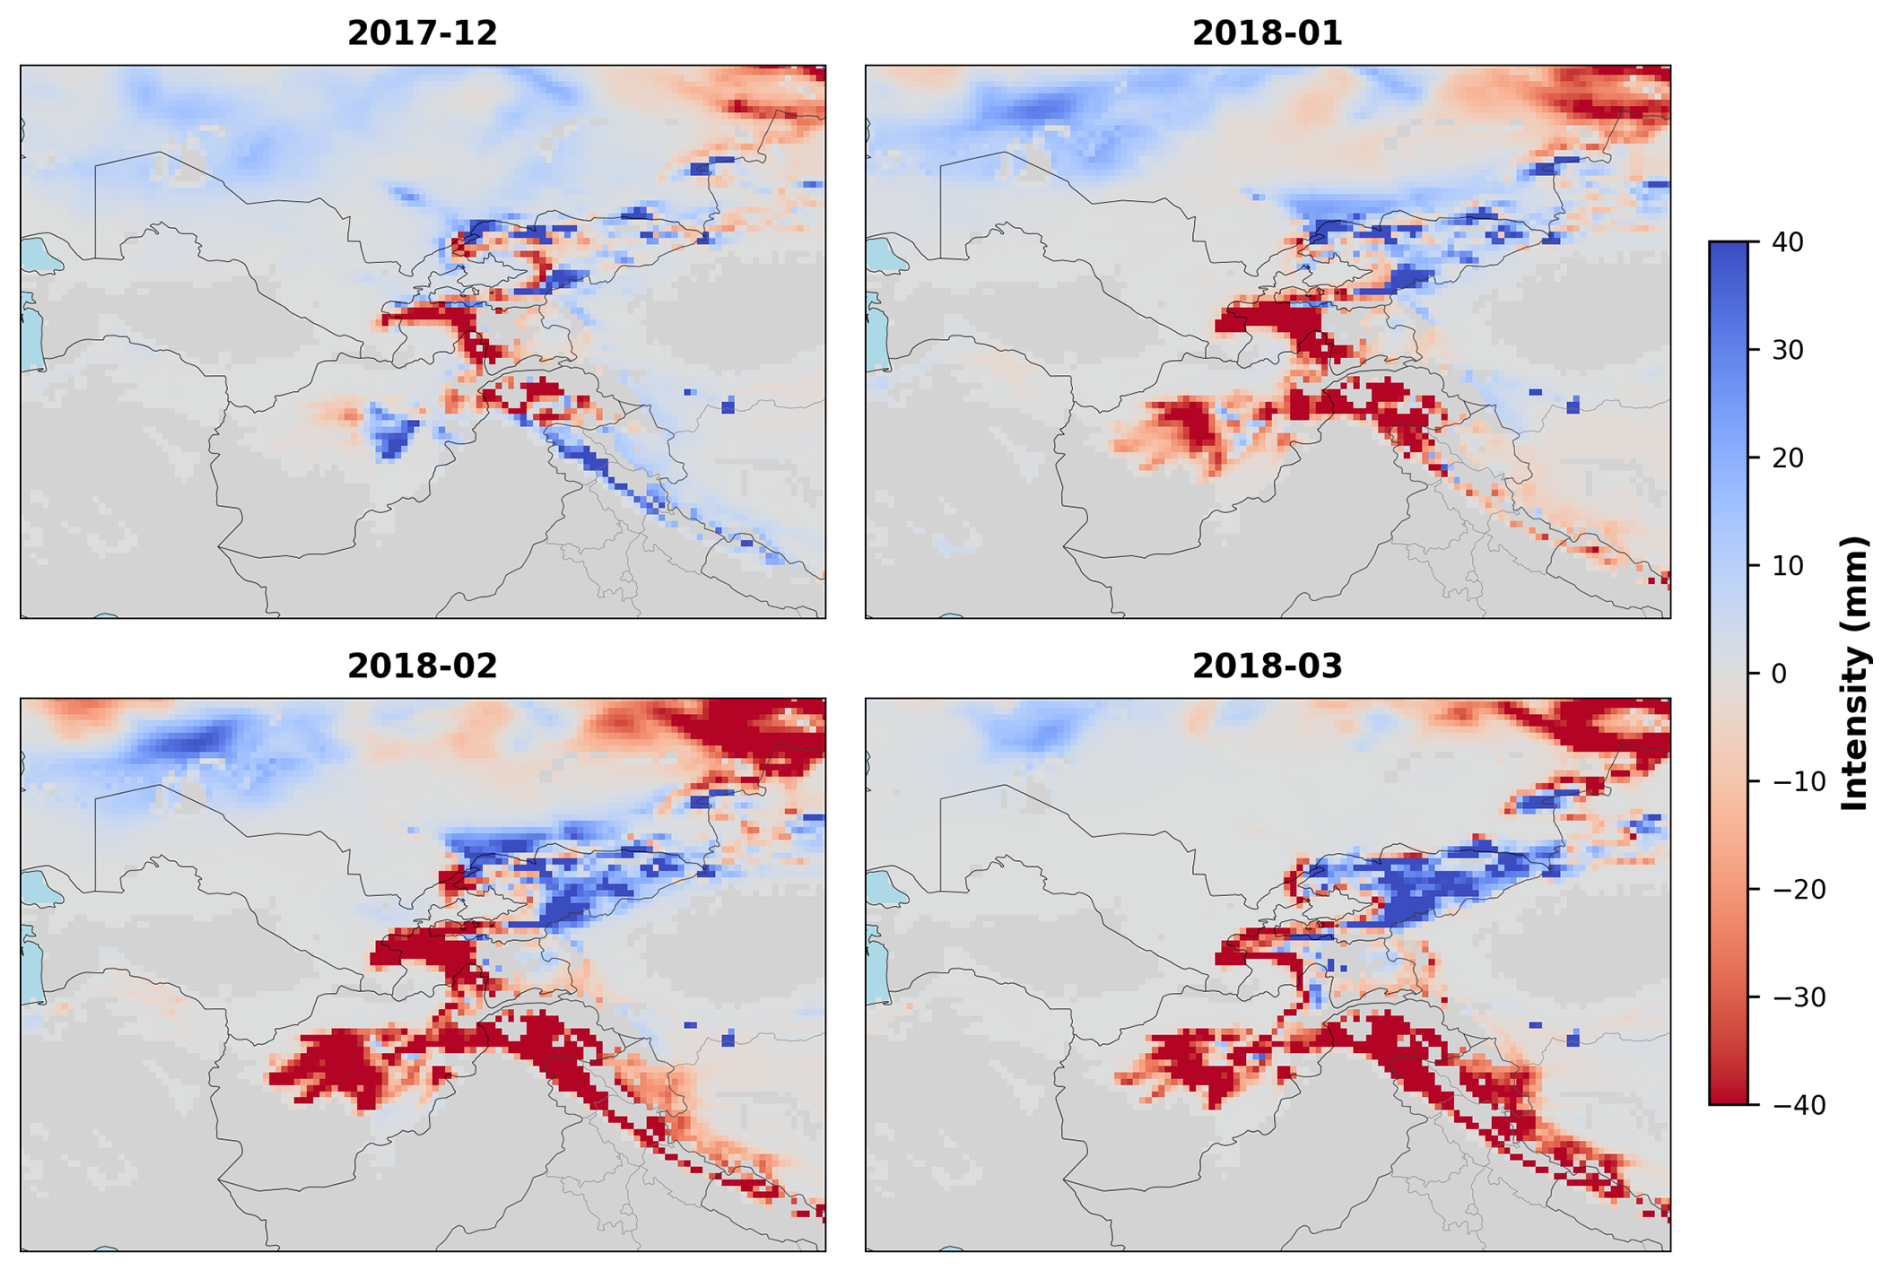
Figure 11Snow drought intensity in Central Asia during the water year of 2017/2018 using daily-scale method.
This study presents the MSDT, an open-source Python software package that provides an integrated platform for standardized snow drought identification, visualization, and SWE data management across yearly, monthly, and daily temporal scales. MSDT integrates seven widely adopted snow drought identification methods within a unified graphical interface, enabling reproducible workflows for data acquisition, preprocessing, multi-method analysis, visualization, and standardized NetCDF export. Its modular software architecture supports future extension to additional datasets and algorithms while ensuring methodological consistency and reproducibility (Hao et al., 2017; Gottlieb and Mankin, 2022).
The development of MSDT can be situated within the broader movement towards standardized, reusable drought and climate-analysis software. The SPEI R package exposes accumulation scales, probability distributions, fitting methods, and reference periods through documented arguments, illustrating the importance of making statistical choices explicit and reproducible (Beguería and Vicente-Serrano, 2023). MSDT follows a similar principle by allowing users to select SWEI accumulation scales and probability distributions rather than relying on a single fixed configuration. The scPDSI package provides explicit calibration-period settings, highlighting the importance of reference conditions when interpreting drought severity across locations and periods (Zhong et al., 2018). This principle is reflected in MSDT's baseline-dependent thresholds and configurable classification rules, although these are not equivalent to the self-calibration procedure used by scPDSI. Meanwhile, xclim separates numerical index calculations from an indicator framework that handles metadata, units, and missing-data checks (Bourgault et al., 2023). MSDT's separation of analysis routines from its graphical interface is consistent with this modular approach, while xclim provides a more developed model for systematic data validation. MSDT's complementary contribution is a graphical workflow integrating seven snow drought identification methods with data acquisition, visualization, and result export.
Application of MSDT to ERA5-Land SWE data for 1980–2024 showed that the toolbox reproduced previously reported global snow drought characteristics and representative historical events, while also providing a unified framework for interpreting methodological differences among existing snow drought definitions (Figs. 3–11). It should be aware that ERA5-Land SWE may be affected by forcing, model-physics, and terrain-representation uncertainties, particularly in mountainous regions. The dataset is used here to demonstrate MSDT functionality; users should evaluate alternative SWE products for region-specific applications. Although the seven implemented methods differ in their conceptual basis and therefore produce different estimates of drought intensity, spatial extent, and evolution, they consistently identified the major global snow drought hotspots and long-term intensification trends, indicating that the principal signals of snow drought are robust across methodologies. Rather than competing alternatives, these methods should be regarded as complementary tools addressing different scientific questions, consistent with previous work showing that point-in-time metrics, standardized SWE anomalies, and daily phase-diagram approaches emphasize different aspects of snow drought development (Harpold et al., 2017; Huning and AghaKouchak, 2020b; Hatchett et al., 2022; Fang and Leung, 2023). Annual point-in-time methods are most appropriate for seasonal water-resource assessments based on representative snow metrics, monthly SWEI is better suited for monitoring persistent snow deficits and interregional comparison through standardized anomalies, and the daily PDM provides detailed characterization of drought onset, development, and recovery for operational monitoring and impact assessment. By integrating these complementary methods into a standardized computational framework, MSDT enables reproducible multi-method analyses and facilitates more comprehensive understanding of snow drought processes than any individual method alone.
Beyond software implementation, MSDT provides a standardized computational framework that improves the reproducibility and comparability of snow drought research. Such standardization follows broader recommendations for operational drought monitoring systems and drought-index implementation (Hayes et al., 2011; Hao et al., 2017). By adopting unified parameter management, metadata recording, and standardized NetCDF outputs, the toolbox facilitates integration with GIS analyses, hydrological modelling, climate model evaluation, and climate-impact assessment. The availability of a common multi-method platform also enables more rigorous intercomparison among alternative snow drought definitions, supporting future methodological development and community benchmarking. As snow droughts become increasingly frequent under continued climate warming, MSDT provides an open and extensible platform for both scientific research and operational monitoring.
The computational performance of MSDT depends mainly on the spatial resolution, temporal coverage, and selected identification method. Annual methods are generally efficient, followed by the monthly SWEI analyses which require additional processing for rolling accumulation and probability fitting. The daily PDM method is the most computationally demanding because it involves repeated moving-window and grid-wise percentile calculations. According to the end-to-end optimization strategy of MSDT (Fig. 2), users are advised to define an appropriate winter period and apply an extent mask where possible before calculation. For large-domain or long-term daily analyses, memory allocation and parallel execution are adaptively configured according to the input data volume and the available hardware resources of the local computing environment. Because each worker requires its own data block and temporary arrays, increasing the number of workers may therefore not always improve performance and can substantially increase peak memory use. In practice, moderate block sizes and a small number of parallel workers generally provide a more stable configuration. Nevertheless, large-scale, high-resolution analyses remain mainly constrained by NetCDF input/output and grid-wise statistical calculations.
There remains considerable scope for future development of MSDT. Future versions will extend support beyond SWE-based diagnostic methods by incorporating additional snow datasets, emerging snow drought identification algorithms, and predictive capabilities. An important direction is to integrate snow drought identification methods that account for drivers beyond air temperature and precipitation, such as radiation, humidity, and blowing-snow processes Fang and Leung, 2023; Wang et al., 2024). These factors can strongly influence snow accumulation, redistribution, and ablation, particularly in open, alpine, and high-latitude environments where surface energy balance and wind exposure play major roles. Planned improvements also include parallel and distributed computing, cross-platform and containerized deployment, enhanced visualization functionality, and community-contributed modules enabled by the modular software architecture. These extensions will help the toolbox support drought monitoring across different hydrological regimes and user communities (Baez-Villanueva et al., 2024). Through continuous community development and methodological expansion, MSDT is expected to evolve into a comprehensive open-source platform supporting both scientific research and operational applications in snow drought monitoring and cryosphere studies.
The source code for MSDT is publicly available at https://doi.org/10.5281/zenodo.21396772 (Li and Tian, 2026a).
The produced global snow drought characteristics, together with the input SWE and precipitation data, are publicly available at https://doi.org/10.5281/zenodo.21396300 (Li and Tian, 2026b). The case-study analyses use ERA5-Land SWE data obtained from the Copernicus Climate Data Store (https://cds.climate.copernicus.eu/datasets/reanalysis-era5-land?tab=overview, last access: 16 July 2026). The snow-covered area extraction uses the MODIS Snow Cover data from National Snow and Ice Data Center (https://nsidc.org/data/MOD10CM/versions/6, last access: 16 July 2026). Additional SWE product links listed in the MSDT catalog are provided for user discovery and intercomparison; users should cite the relevant product provider when using those datasets.
The supplement related to this article is available online at https://doi.org/10.5194/gmd-19-10669-2026-supplement.
XL and JT conceived the study, developed the software, and carried out the test application. XL and CW processed data and drafted the manuscript. SW and LZ revised the manuscript. All authors contributed to manuscript writing and approved the final version.
The contact author has declared that none of the authors has any competing interests.
Publisher's note: Copernicus Publications remains neutral with regard to jurisdictional claims made in the text, published maps, institutional affiliations, or any other geographical representation in this paper. The authors bear the ultimate responsibility for providing appropriate place names. Views expressed in the text are those of the authors and do not necessarily reflect the views of the publisher.
The authors acknowledge the European Centre for Medium-Range Weather Forecasts (ECMWF) and the National Aeronautics and Space Administration (NASA) for providing open-access data. AI tools are used to polish the manuscript.
This research has been supported by the National Natural Science Foundation of China (grant no. 42501158), the Natural Science Research of Jiangsu Higher Education Institutions of China (grant no. 25KJB170017), and the Startup Foundation for Introducing Talent of Nanjing University of Information Science and Technology (grant no. 2024r084).
This paper was edited by Lele Shu and reviewed by three anonymous referees.
Baez-Villanueva, O. M., Zambrano-Bigiarini, M., Miralles, D. G., Beck, H. E., Siegmund, J. F., Alvarez-Garreton, C., Verbist, K., Garreaud, R., Boisier, J. P., and Galleguillos, M.: On the timescale of drought indices for monitoring streamflow drought considering catchment hydrological regimes, Hydrol. Earth Syst. Sci., 28, 1415–1439, https://doi.org/10.5194/hess-28-1415-2024, 2024.
Bair, E. H., Abreu Calfa, A., Rittger, K., and Dozier, J.: Using machine learning for real-time estimates of snow water equivalent in the watersheds of Afghanistan, The Cryosphere, 12, 1579–1594, https://doi.org/10.5194/tc-12-1579-2018, 2018.
Beguería, S. and Vicente-Serrano, S. M.: SPEI: Calculation of the Standardized Precipitation-Evapotranspiration Index, R package version 1.8.1, CRAN [code], https://doi.org/10.32614/CRAN.package.SPEI, 2023.
Bormann, K. J., Brown, R. D., Derksen, C., and Painter, T. H.: Estimating snow-cover trends from space, Nat. Clim. Change, 8, 924–928, https://doi.org/10.1038/s41558-018-0318-3, 2018.
Bourgault, P., Huard, D., Smith, T. J., Logan, T., Aoun, A., Lavoie, J., Dupuis, É., Rondeau-Genesse, G., Alegre, R., Barnes, C., Laperrière, A. B., Biner, S., Caron, D., Ehbrecht, C., Fyke, J., Keel, T., Labonté, M.-P., Lierhammer, L., Low, J.-F., Quinn, J., Roy, P., Squire, D., Stephens, A., Tanguy, M., and Whelan, C.: xclim: xarray-based climate data analytics, J. Open Source Softw., 8, 5415, https://doi.org/10.21105/joss.05415, 2023.
Che, T., Hao, X., Dai, L., Li, H., Huang, X., and Xiao, L.: Snow cover variation and its impacts over the Qinghai-Tibet Plateau, Bull. Chin. Acad. Sci., 34, 1247–1253, https://bulletinofcas.researchcommons.org/journal/vol34/iss11/5/, 2019.
Colombo, N., Guyennon, N., Valt, M., Salerno, F., Godone, D., Cianfarra, P., Freppaz, M., Maugeri, M., Manara, V., Acquaotta, F., Petrangeli, A. B., and Romano, E.: Unprecedented snow-drought conditions in the Italian Alps during the early 2020s, Environ. Res. Lett., 18, 074014, https://doi.org/10.1088/1748-9326/acdb88, 2023.
Cooper, M. G., Nolin, A. W., and Safeeq, M.: Testing the recent snow drought as an analog for climate warming sensitivity of Cascades snowpacks, Environ. Res. Lett., 11, 084009, https://doi.org/10.1088/1748-9326/11/8/084009, 2016.
Cowherd, M., Ruby Leung, L., and Girotto, M.: Evolution of global snow drought characteristics from 1850 to 2100, Environ. Res. Lett., 18, 064043, https://doi.org/10.1088/1748-9326/acd804, 2023.
Dierauer, J. R., Allen, D. M., and Whitfield, P. H.: Snow drought risk and susceptibility in the western United States and Southwestern Canada, Water Resour. Res., 55, 3076–3091, https://doi.org/10.1029/2018WR023229, 2019.
Dye, L. A., Coulthard, B. L., Hatchett, B. J., Homfeld, I. K., Salazar, T. N., Littell, J. S., and Anchukaitis, K. J.: The Severity of the 2014–2015 Snow drought in the Oregon Cascades in a multicentury context, Water Resour. Res., 59, e2022WR032875, https://doi.org/10.1029/2022WR032875, 2023.
Falk, M. and Lin, X.: Time-varying impact of snow depth on tourism in selected regions, Int. J. Biometeorol., 65, 645–657, https://doi.org/10.1007/s00484-019-01848-1, 2021.
Fang, Y. and Leung, L. R.: Northern Hemisphere Snow Drought in Earth System Model Simulations and ERA5-Land Data in 1980–2014, J. Geophys. Res.-Atmos., 128, e2023JD039308, https://doi.org/10.1029/2023JD039308, 2023.
Folger, P.: Drought in the United States: Causes and current understanding, congressional research service, Washington DC, https://www.congress.gov/crs-product/R43407 (last access: 31 October 2026), 2017.
Fosu, B. O., Simon Wang, S.-Y., and Yoon, J.-H.: The 2014/2015 snowpack drought in Washington State and its climate forcing, B. Am. Meteorol. Soc., 97, S19–S24, https://doi.org/10.1175/BAMS-D-16-0154.1, 2016.
Gelaro, R., McCarty, W., Suarez, M. J., Todling, R., Molod, A., Takacs, L., Randles, C. A., Darmenov, A., Bosilovich, M. G., Reichle, R., Wargan, K., Coy, L., Cullather, R., Draper, C., Akella, S., Buchard, V., Conaty, A., da Silva, A. M., Gu, W., Kim, G. K., Koster, R., Lucchesi, R., Merkova, D., Nielsen, J. E., Partyka, G., Pawson, S., Putman, W., Rienecker, M., Schubert, S. D., Sienkiewicz, M., and Zhao, B.: The Modern-Era Retrospective Analysis for Research and Applications, Version 2 (MERRA-2), J. Climate, 30, 5419–5454, https://doi.org/10.1175/JCLI-D-16-0758.1, 2017.
Gottlieb, A. R. and Mankin, J. S.: Observing, measuring, and assessing the consequences of snow drought, B. Am. Meteorol. Soc., 103, E1041–E1060, https://doi.org/10.1175/BAMS-D-20-0243.1, 2022.
Gringorten, I. I.: A plotting rule for extreme probability paper, J. Geophys. Res., 68, 813–814, https://doi.org/10.1029/JZ068i003p00813, 1963.
Guttman, N. B.: Accepting the standardized precipitation index: a calculation algorithm, J. Am. Water Resour. As., 35, 311–322, https://doi.org/10.1111/j.1752-1688.1999.tb03592.x, 1999.
Han, J., Yang, Y., Guo, Y., Li, C., Liu, Z., Tu, Z., and Xi, H.: Changes in snow drought and the impacts on streamflow across Northern Catchments, Water Resour. Res., 61, e2024WR037492, https://doi.org/10.1029/2024WR037492, 2025.
Hao, Z., Yuan, X., Xia, Y., Hao, F., and Singh, V. P.: An overview of drought monitoring and prediction systems at regional and global scales, B. Am. Meteorol. Soc., 98, 1879–1896, https://doi.org/10.1175/BAMS-D-15-00149.1, 2017.
Harley, G. L., Maxwell, R. S., Black, B. A., and Bekker, M. F.: A multi-century, tree-ring-derived perspective of the North Cascades (USA) 2014–2016 snow drought, Climatic Change, 162, 127–143, https://doi.org/10.1007/s10584-020-02719-0, 2020.
Harpold, A., Brooks, P., Rajagopal, S., Heidbuchel, I., Jardine, A., and Stielstra, C.: Changes in snowpack accumulation and ablation in the intermountain west, Water Resour. Res., 48, https://doi.org/10.1029/2012WR011949, 2012.
Harpold, A., Dettinger, M., and Rajagopal, S.: Defining snow drought and why it matters, EOS, 98, https://doi.org/10.1029/2017EO068775, 2017.
Hatchett, B. J. and McEvoy, D. J.: Exploring the origins of snow drought in the Northern Sierra Nevada, California, Earth Interact., 22, 1–13, https://doi.org/10.1175/EI-D-17-0027.1, 2018.
Hatchett, B. J., Rhoades, A. M., and McEvoy, D. J.: Monitoring the daily evolution and extent of snow drought, Nat. Hazards Earth Syst. Sci., 22, 869–890, https://doi.org/10.5194/nhess-22-869-2022, 2022.
Hayes, M., Svoboda, M., Wall, N., and Widhalm, M.: The lincoln declaration on drought indices: Universal meteorological drought index recommended, B. Am. Meteorol. Soc., 92, 485–488, https://doi.org/10.1175/2010BAMS3103.1, 2011.
Heldmyer, A. J., Bjarke, N. R., and Livneh, B.: A 21st-Century perspective on snow drought in the Upper Colorado River Basin, J. Am. Water Resour. As., 59, 396–415, https://doi.org/10.1111/1752-1688.13095, 2023.
Henderson, G. R., Peings, Y., Furtado, J. C., and Kushner, P. J.: Snow-atmosphere coupling in the Northern Hemisphere, Nat. Clim. Change, 8, 954–963, https://doi.org/10.1038/s41558-018-0295-6, 2018.
Huning, L. S. and AghaKouchak, A.: Approaching 80 years of snow water equivalent information by merging different data streams, Sci. Data, 7, 333, https://doi.org/10.1038/s41597-020-00649-1, 2020a.
Huning, L. S. and AghaKouchak, A.: Global snow drought hot spots and characteristics, P. Natl. Acad. Sci. USA, 117, 19753–19759, https://doi.org/10.1073/pnas.1915921117, 2020b.
ICIMOD: Snow Update Report 2025: Snow persistence across the Hindu Kush Himalaya, International Centre for Integrated Mountain Development, Kathmandu, Nepal, https://doi.org/10.53055/ICIMOD.1087, 2025.
Keyantash, J.: Indices for Meteorological and Hydrological Drought, in: Hydrological Aspects of Climate Change, edited by: Pandey, A., Kumar, S., and Kumar, A., Springer Singapore, Singapore, 215–235, https://doi.org/10.1007/978-981-16-0394-5_11, 2021.
Koch, F. H. and Coulston, J. W.: Drought and moisture surplus patterns in the conterminous United States: 2018, 2016–2018, and 2014–2018, Chapt. 4, Forest health monitoring: national status, trends, and analysis 2019, Gen. Tech. Rep. SRS-250, Asheville, NC, https://research.fs.usda.gov/treesearch/60384, 2020.
Li, X. and Tian, J.: MSDT_Software [Computer software], Zenodo [code], https://doi.org/10.5281/zenodo.21396772, 2026a.
Li, X. and Tian, J.: MSDT_Input_Output [data set], Zenodo [data set], https://doi.org/10.5281/zenodo.21396300, 2026b.
Li, X. and Wang, S.: Recent increase in the occurrence of snow droughts followed by extreme heatwaves in a warmer world, Geophys. Res. Lett., 49, e2022GL099925, https://doi.org/10.1029/2022GL099925, 2022.
Li, Y., Huang, X., Ma, Y., Feng, Q., and Liang, T.: Snow drought patterns and their spatiotemporal heterogeneity in China, IEEE J. Sel. Top. Appl., 17, 2029–2036, https://doi.org/10.1109/JSTARS.2023.3344763, 2024.
Margulis, S. A., Cortés, G., Girotto, M., Huning, L. S., Li, D., and Durand, M.: Characterizing the extreme 2015 snowpack deficit in the Sierra Nevada (USA) and the implications for drought recovery, Geophys. Res. Lett., 43, 6341–6349, https://doi.org/10.1002/2016GL068520, 2016.
Marshall, A. M., Abatzoglou, J. T., Link, T. E., and Tennant, C. J.: Projected changes in interannual variability of peak snowpack amount and timing in the Western United States, Geophys. Res. Lett., 46, 8882–8892, https://doi.org/10.1029/2019GL083401, 2019.
McKee, T. B., Doesken, N. J., and Kleist, J.: The relationship of drought frequency and duration to time scales, in: Proc. 8th Conf. Appl. Climatol., California, 179–183, https://www.droughtmanagement.info/literature/AMS_Relationship_Drought_Frequency_Duration_Time_Scales_1993.pdf (last access: 16 July 2026), 1993.
Muhammad, A., Kumar Jha, S., and Rasmussen Peter, F.: Drought characterization for a snow-dominated region of Afghanistan, J. Hydrol. Eng., 22, 05017014, https://doi.org/10.1061/(ASCE)HE.1943-5584.0001543, 2017.
Musselman, K. N., Addor, N., Vano, J. A., and Molotch, N. P.: Winter melt trends portend widespread declines in snow water resources, Nat. Clim. Change, 11, 418–424, https://doi.org/10.1038/s41558-021-01014-9, 2021.
Muñoz-Sabater, J., Dutra, E., Agustí-Panareda, A., Albergel, C., Arduini, G., Balsamo, G., Boussetta, S., Choulga, M., Harrigan, S., Hersbach, H., Martens, B., Miralles, D. G., Piles, M., Rodríguez-Fernández, N. J., Zsoter, E., Buontempo, C., and Thépaut, J.-N.: ERA5-Land: a state-of-the-art global reanalysis dataset for land applications, Earth Syst. Sci. Data, 13, 4349–4383, https://doi.org/10.5194/essd-13-4349-2021, 2021.
National Operational Hydrologic Remote Sensing Center: Snow Data Assimilation System (SNODAS) Data Products at NSIDC, Version 1, National Snow and Ice Data Center, Boulder, Colorado USA, https://doi.org/10.7265/N5TB14TC, 2004.
National Weather Service: 10–14 November 2014, Storm Summary, https://www.weather.gov/dlh/112014snow (last access: 16 July 2026), 2014.
National Weather Service: Event Summary: 9–11 May 2015 Storm System: Rain, Snow and Hail, https://www.weather.gov/abr/May9-11stormsystem (last access: 16 July 2026), 2015.
National Weather Service: Event Summary: 29–30 April 2017 Blizzard, https://www.weather.gov/gld/April29-30Blizzard (last access: 16 July 2026), 2017.
Pagano, T., Garen, D., and Sorooshian, S.: Evaluation of official western U. S. seasonal water supply outlooks, 1922–2002, J. Hydrometeorol., 5, 896–909, https://doi.org/10.1175/1525-7541(2004)005<0896:EOOWUS>2.0.CO;2, 2004.
Pulliainen, J., Luojus, K., Derksen, C., Mudryk, L., Lemmetyinen, J., Salminen, M., Ikonen, J., Takala, M., Cohen, J., Smolander, T., and Norberg, J.: Patterns and trends of Northern Hemisphere snow mass from 1980 to 2018, Nature, 581, 294–298, https://doi.org/10.1038/s41586-020-2258-0, 2020.
Robinson, D. A., Dewey, K. F., and Heim, R. R.: Global snow cover monitoring: An update, B. Am. Meteorol. Soc., 74, 1689–1696, https://doi.org/10.1175/1520-0477(1993)074<1689:GSCMAU>2.0.CO;2, 1993.
Rodell, M., Houser, P. R., Jambor, U., Gottschalck, J., Mitchell, K., Meng, C.-J., Arsenault, K., Cosgrove, B., Radakovich, J., Bosilovich, M., Entin, J. K., Walker, J. P., Lohmann, D., and Toll, D.: The global land data assimilation system, B. Am. Meteorol. Soc., 85, 381–394, https://doi.org/10.1175/BAMS-85-3-381, 2004.
Shrestha, R. R., Bonsal, B. R., Bonnyman, J. M., Cannon, A. J., and Najafi, M. R.: Heterogeneous snowpack response and snow drought occurrence across river basins of northwestern North America under 1.0 °C to 4.0 °C global warming, Climatic Change, 164, 40, https://doi.org/10.1007/s10584-021-02968-7, 2021.
Siirila-Woodburn, E. R., Rhoades, A. M., Hatchett, B. J., Huning, L. S., Szinai, J., Tague, C., Nico, P. S., Feldman, D. R., Jones, A. D., Collins, W. D., and Kaatz, L.: A low-to-no snow future and its impacts on water resources in the western United States, Nat. Rev. Earth Environ., 2, 800–819, https://doi.org/10.1038/s43017-021-00219-y, 2021.
Stagge, J. H., Tallaksen, L. M., Gudmundsson, L., Van Loon, A. F., and Stahl, K.: Candidate distributions for climatological drought indices (SPI and SPEI), Int. J. Climatol., 35, 4027–4040, https://doi.org/10.1002/joc.4267, 2015.
Sturm, M., Goldstein, M. A., and Parr, C.: Water and life from snow: A trillion dollar science question, Water Resour. Res., 53, 3534–3544, https://doi.org/10.1002/2017WR020840, 2017.
Takala, M., Luojus, K., Pulliainen, J., Derksen, C., Lemmetyinen, J., Kärnä, J.-P., Koskinen, J., and Bojkov, B.: Estimating northern hemisphere snow water equivalent for climate research through assimilation of space-borne radiometer data and ground-based measurements, Remote Sens. Environ., 115, 3517–3529, https://doi.org/10.1016/j.rse.2011.08.014, 2011.
Vicente-Serrano, S. M., Beguería, S., and López-Moreno, J. I.: A multiscalar drought index sensitive to global warming: The Standardized Precipitation Evapotranspiration Index, J. Climate, 23, 1696–1718, https://doi.org/10.1175/2009JCLI2909.1, 2010.
Wang, Z., Huang, S., Mu, Z., Leng, G., Duan, W., Ling, H., Xu, J., Zheng, X., Li, P., Li, Z., Guo, W., Li, Y., Deng, M., and Peng, J.: Relative humidity and solar radiation exacerbate snow drought risk in the headstreams of the Tarim River, Atmos. Res., 297, 107091, https://doi.org/10.1016/j.atmosres.2023.107091, 2024.
Yeşilköy, S., Baydaroğlu, Ö., and Demir, I.: Is snow drought a messenger for the upcoming severe drought period? A case study in the Upper Mississippi River Basin, Atmos. Res., 309, 107553, https://doi.org/10.1016/j.atmosres.2024.107553, 2024.
Zeng, X., Broxton, P., and Dawson, N.: Snowpack change from 1982 to 2016 over conterminous United States, Geophys. Res. Lett., 45, 12940–12947, https://doi.org/10.1029/2018GL079621, 2018.
Zhong, R., Chen, X., Wang, Z., and Lai, C.: scPDSI: Calculation of the Conventional and Self-Calibrating Palmer Drought Severity Index, R package version 0.1.3, GitHub [code], https://github.com/Sibada/scPDSI (last access: 15 October 2026), 2018.