the Creative Commons Attribution 4.0 License.
the Creative Commons Attribution 4.0 License.
 | 12 Nov 2025
Benchmarking and evaluating the NASA Land Information System (version 7.5.2) coupled with the refactored Noah-MP land surface model (version 5.0)
Tzu-Shun Lin
David M. Mocko
Ronnie Abolafia-Rosenzweig
Jerry W. Wegiel
Sujay V. Kumar
We integrate the refactored community Noah-MP version 5.0 model with the NASA Land Information System (LIS) version 7.5.2 to streamline the synchronization, development, and maintenance of Noah-MP within LIS and to enhance their interoperability and applicability. We evaluate and compare 5-year (2018–2022) global and regional benchmark simulations of LIS/Noah-MPv5.0 and LIS/Noah-MPv4.0.1 for a set of key land surface variables. Both models capture the spatial and seasonal distributions of observed soil moisture, latent heat (LH), snow water equivalent (SWE), snow depth, snow cover, and surface albedo, with similar bias patterns. Both models tend to underestimate soil moisture over wet soil regimes and overestimate over dry soil regimes, with slightly higher (≤ ∼ 0.01 m3 m−3 for global mean) soil moisture in LIS/Noah-MPv5.0 than LIS/Noah-MPv4.0.1 across most regions. The model bias patterns of LH overall follow those of soil moisture, while LIS/Noah-MPv5.0 has a lower LH across many non-polar regions than LIS/Noah-MPv4.0.1, which reduces the global mean LH bias from 0.99 to −0.39 W m−2. The model SWE bias patterns are dominated by the precipitation and temperature forcing uncertainties, with slightly lower SWE values in LIS/Noah-MPv5.0 (global mean bias of −13.2 mm) than LIS/Noah-MPv4.0.1 (global mean bias of −10.1 mm). The model bias patterns of snow depth generally follow those of SWE. LIS/Noah-MPv4.0.1 consistently overestimates snow cover globally with a mean bias of 0.11, while LIS/Noah-MPv5.0 effectively reduces the overestimates across the global snowpacks with a mean bias of 0.07 because of updated snow cover parameters. Both models show widespread overestimates of surface albedo over mid-latitude and high-latitude regions but significant underestimates in the Sahara Desert and Antarctica. Overall, LIS/Noah-MPv5.0 outperforms or is similar to LIS/Noah-MPv4.0.1 in the evaluated land surface variables, except for slight degradation in simulated surface soil moisture and SWE. This study reveals possible model deficiencies, motivates future improvements in coupled canopy-snowpack-soil processes and input soil data, and points to the importance of considering observational and forcing data uncertainties in model evaluation.
- Article
(22732 KB) - Full-text XML
-
Supplement
(19387 KB) - BibTeX
- EndNote


Land processes play a profound role in the Earth and climate systems through altering surface water and energy balances and feedback to the atmosphere (Fisher and Koven, 2020; Blyth et al., 2021). Earth's land surface provides important boundary conditions for atmospheric processes and climate/weather predictions particularly at the subseasonal-to-seasonal (S2S) time scale (Koster and Walker, 2015; Benson and Dirmeyer, 2023). Furthermore, as climate changes, increasing climate/weather extremes (e.g., drought, flood, heatwave, and fire) and food-water security issues (e.g., agricultural production and irrigation management) are happening at the land surface, triggering key crises for the society (Sillmann et al., 2017; AghaKouchak et al., 2020). To tackle these critical land-related environmental issues, accurate land modeling systems are needed.
There have been substantial efforts in the past decades to develop and improve various land modeling systems (e.g., Dickinson et al., 1993; Liang et al., 1994; Chen et al., 1997; Ek et al., 2003; Oleson et al., 2004; Best et al., 2011; Niu et al., 2011; Haverd et al., 2018). Among them, the NASA Land Information System (LIS) is a widely used, established open-source framework for high performance land surface and terrestrial hydrology modeling as well as data assimilation (DA) of satellite and ground-based observations (Kumar et al., 2006; Peters-Lidard et al., 2007; Kumar et al., 2008a). The LIS system integrates different land surface models (LSMs), satellite and ground observations, and advanced computing and data management tools, to enable an interoperable environment that is applicable across different spatial and temporal scales. Various model developments and applications using LIS have been conducted in the past decade, such as coupling with atmospheric models to improve weather predictions (Kumar et al., 2008b; Wu et al., 2016), DA of observed vegetation, snow, terrestrial water storage, albedo, and soil conditions to improve land surface modeling (Liu et al., 2015; Santanello et al., 2016; Kumar et al., 2016, 2019, 2020), and applications for hydrological predictions (Arsenault et al., 2020), food security (Hazra et al., 2023), and land analysis (Nie et al., 2024).
LIS allows the use of an ensemble of LSMs, such as Noah (Chen et al., 1997; Ek et al., 2003), Noah-MP (Niu et al., 2011), CLM (Oleson et al., 2004), VIC (Liang et al., 1994), JULES (Best et al., 2011), and CABLE (Haverd et al., 2018). Among them, Noah-MP is one of the most commonly used state-of-the-art LSMs in the world (He et al., 2023a). Built upon the Noah LSM, Noah-MP has significant enhancements in representations of canopy-snow-soil-hydrology processes and interactions as well as capabilities of modeling human activity impacts (e.g., crop dynamics, irrigation dynamics, tile drainage, and urbanization). The multi-parameterization options of Noah-MP further allow for uncertainty analysis and model performance optimization/calibration based on multi-physics model ensembles (Li et al., 2020). Noah-MP has been serving as a key land component of various research and operational weather and hydroclimate models, such as the NOAA Unified Forecast System (UFS), the Weather Research and Forecasting (WRF) model, the U.S. National Water Model (NWM), the Model for Prediction Across Scales (MPAS), the Korean Integrated Model (KIM), and the Chinese Global-to-Regional Integrated Forecast System (GRIST). Because of its advantages, Noah-MP has been applied in numerous applications, including high-resolution climate modeling (Liu et al., 2017; Rasmussen et al., 2023), vegetation and soil DA (Kumar et al., 2019; Xu et al., 2021), climate extremes (Arsenault et al., 2020; Kumar et al., 2021; Abolafia-Rosenzweig et al., 2022a, 2023, 2024a), snowpack and hydrology (He et al., 2019; Jiang et al., 2020; Hazra et al., 2023), agriculture and groundwater (Barlage et al., 2021; Zhang et al., 2023, 2025), and urban climate (Xue et al., 2024, 2025).
Recently, the community Noah-MP has undergone a substantial code modernization effort (version 5.0) to improve its modularity and interoperability (He et al., 2023b), with many physics updates and bug fixes compared to the versions 3.6 and 4.0.1 in LIS. These two earlier Noah-MP versions in the current LIS (version 7.5.2) were implemented by manually replicating the Noah-MP source code and updating LIS/Noah-MP interface and drivers, which does not allow easy model upgrades and hence leads to a long-delayed version update compared to the community Noah-MP. Thus, in this effort, we describe the streamlining of the development and maintenance of Noah-MP in LIS to enable the seamless integration between LIS and the community Noah-MP version to further enhance the interoperability and applicability of both models. Specifically, we couple the refactored community Noah-MPv5.0 with the LIS framework through the GitHub submodule mechanism accompanied by developing a new LIS/Noah-MP interface, which provides a direct, automatic link between the two models' source codes. This integration will allow easy code updates, synchronization, and maintenance for the coupled LIS/Noah-MP framework. The second goal of this study is to evaluate and compare global and regional benchmark simulations between LIS/Noah-MPv5.0 and LIS/Noah-MPv4.0.1 for key land surface conditions. Such systematic benchmarking is needed to examine the realism of LIS/Noah-MP model simulations, quantify the gaps between modeling and observations, and identify key processes for future model enhancements. This study is a step toward establishing a “scorecard” type of practice for LSMs.
2.1 NASA LIS
The LIS system is a land surface hydrology digital twin environment, with the development led by the Hydrological Sciences Laboratory at NASA's Goddard Space Flight Center. Because of its extensible and flexible software infrastructure, LIS allows customized land DA systems and multiple LSMs to be integrated, assembled, and reconfigured easily using shared plugins and standard interfaces. Currently, LIS is the land component for several Earth system models, such as the NASA Unified WRF (NU-WRF) model, and the key component of several land DA system (LDAS) such as Global LDAS (GLDAS), North American LDAS (NLDAS), the Famine Early Warning Systems Network (FEWS NET) LDAS (FLDAS), and the operational land DA analysis environment at the U.S. Air Force Weather (Eylander et al., 2022).
Specifically, the LIS software suite consists of three main components: (1) Land Data Toolkit (LDT; Arsenault et al., 2018), which handles the data-related requirements of LIS including land surface parameter processing, geospatial transformations, consistency checks, data assimilation preprocessing, and forcing bias correction; (2) Land Information System (LIS), which is the modeling system that encapsulates land and hydrological models, DA algorithms, optimization and uncertainty estimation algorithms, and high performance computing (HPC) support; and (3) Land Verification Toolkit (LVT; Kumar et al., 2012), which is a model verification and benchmarking environment that can be used for enabling rapid prototyping and evaluation of model simulations by comparing against a large suite of in-situ, remote sensing, and model and reanalysis data products. More details can be found at the LIS website: https://lis.gsfc.nasa.gov/ (last access: 25 November 2024). In this study, we use the LIS version 7.5.2 (latest version at the time of this work) coupled with Noah-MP in benchmark simulations and the LVT for model evaluation.
2.2 Integration of refactored Noah-MPv5.0 with LIS
In this study, we couple the LIS system with the refactored community Noah-MPv5.0 model through the GitHub submodule mechanism to streamline the synchronization of Noah-MP between the community version and the LIS version, which will simplify future code updates and maintenance of Noah-MP within LIS. The GitHub submodule mechanism (https://gist.github.com/gitaarik/8735255, last access: 20 October 2025) allows (1) separated source code maintenance and updates for Noah-MP (by the Noah-MP team) and LIS (by the NASA/LIS team), and (2) convenient updates of Noah-MP inside LIS by updating the submodule link to a newer Noah-MP GitHub tag/branch version. Compared to the Noah-MPv4.0.1 model in LIS, the community Noah-MPv5.0 model includes several important updates and new features: (1) improved modularization with modern Fortran code structures, (2) new hierarchical model data types and structures, (3) enhanced subroutine interface and calling workflow based on the modularization and new data types, (4) new self-explanatory model variable and module names, and (5) model bug fixes and new physics schemes. The key bug fixes include updates in vegetation properties (e.g., bug fixes in vegetation fraction scaling treatments) and processes (e.g., bug fixes in canopy wind absorption parameters) as well as snowpack processes. The new physics schemes include improved parameters related to various snowpack processes, a new wet-bulb temperature-based snow-rain partitioning scheme, a new snow meltwater retention process, a new dynamic irrigation scheme, updated crop growth parameters, a new tile drainage scheme, a new canopy heat storage treatment, additional runoff schemes, and new capabilities to control the soil process timestep. More details of Noah-MPv5.0 features can be found in He et al. (2023b). The detailed Noah-MP physics and formulations are described in He et al. (2023c). The major code changes from Noah-MPv4.0.1 to Noah-MPv5.0 are described in the model release notes available at: https://github.com/NCAR/noahmp/blob/master/RELEASE_NOTES.md (last access: 25 November 2024). The key components we modify to couple LIS and Noah-MPv5.0 are the LIS/Noah-MP land model driver interface to create new input/output variable mapping, and the LIS initialization and master driver parts to leverage new modularized Noah-MP code modules. By taking advantage of the plugin and standard interfaces in LIS, the Noah-MPv5.0 model is also connected to other components of LIS, such as data assimilation, river routing, etc.
2.3 LIS/Noah-MP benchmark simulations
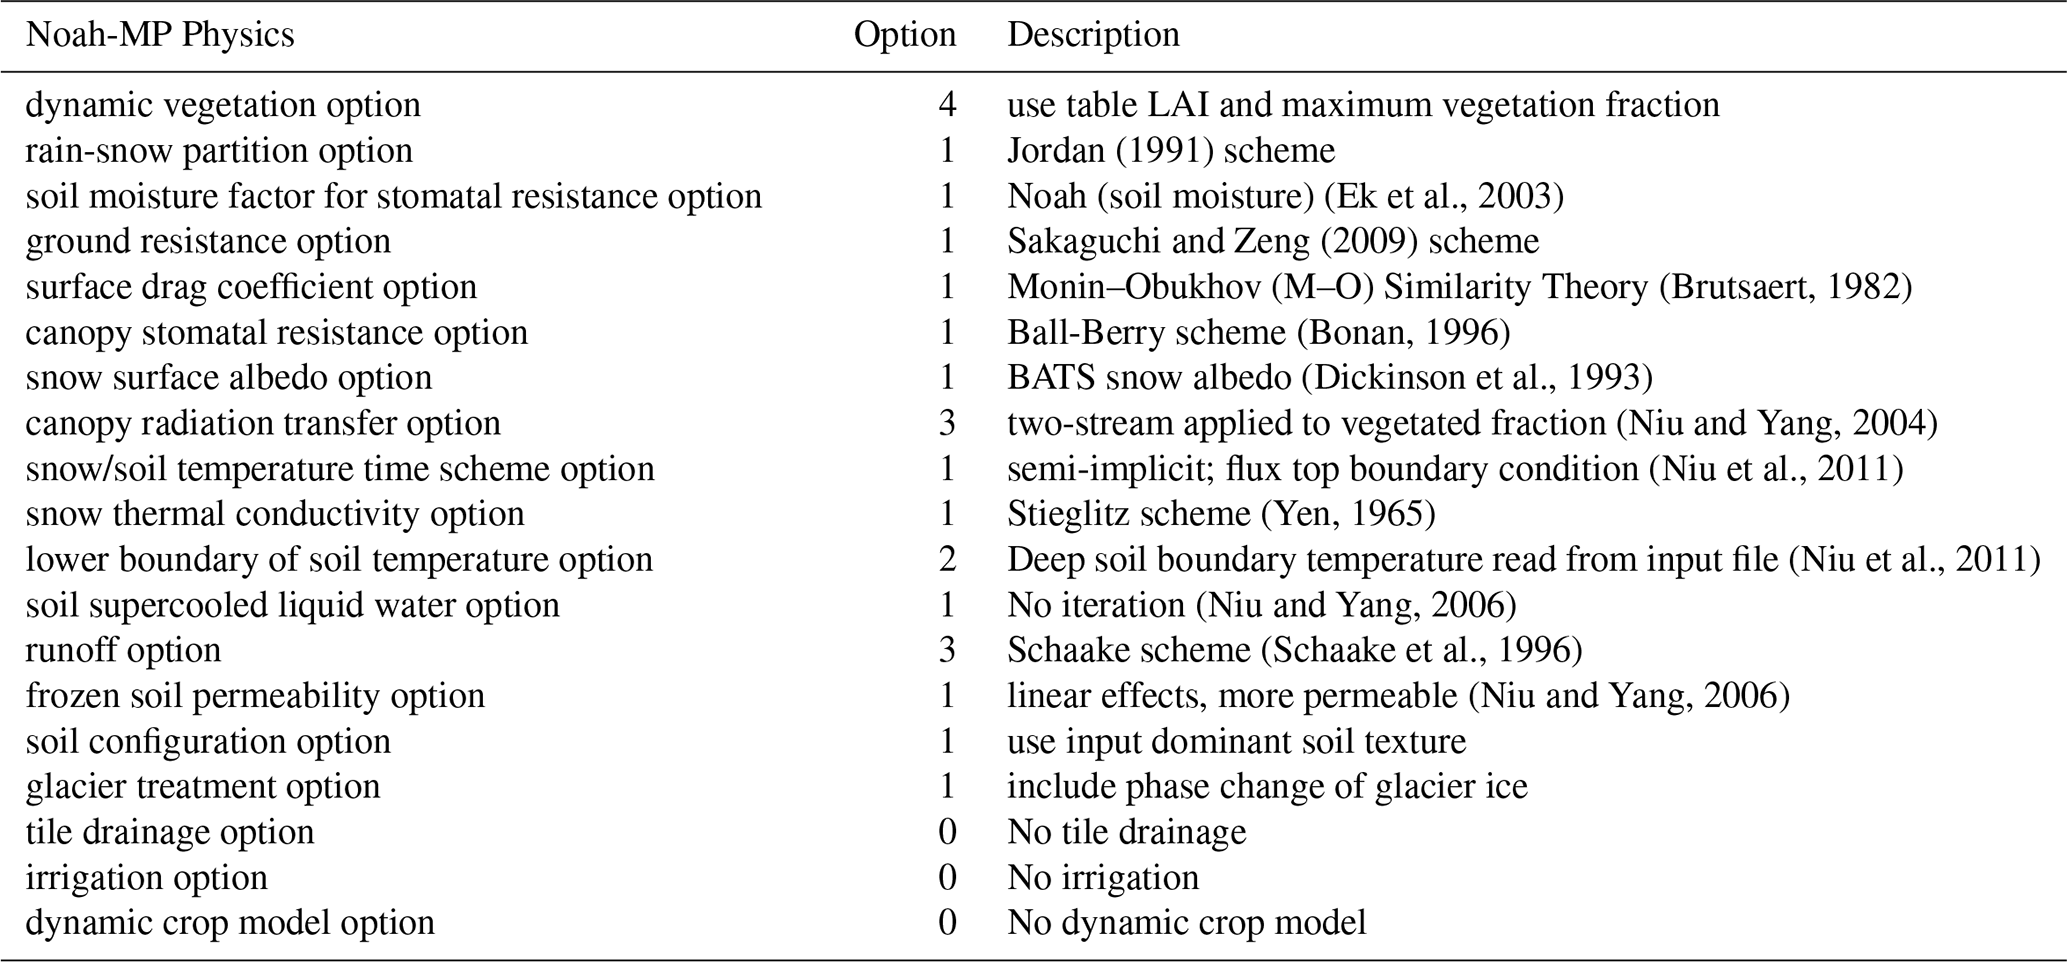
We conduct and evaluate two sets of benchmark simulations with LIS coupled with Noah-MP, including one set of regional simulations over the contiguous U.S. (CONUS) and one set of global simulations. Each set of the simulations includes one LIS/Noah-MPv4.0.1 simulation and one LIS/Noah-MPv5.0 simulation to compare their performance and quantify differences between versions. The regional simulations are conducted for 10 years (2013–2022) with a 5-year spin-up, which are driven by the hourly 0.125° North American Land Data Assimilation System (NLDAS-2) atmospheric forcing data (i.e., precipitation, surface temperature, surface pressure, surface specific humidity, wind speed, downward surface shortwave and longwave radiation). More details of NLDAS-2 data are described in Xia et al. (2012). The global simulations are conducted for 5 years (2018–2022) with a 5-year spin-up, and are driven by the global hourly ∼ 10 km U.S. Air Force (USAF) atmospheric forcing reanalysis data (Kemp et al., 2022). More details of the forcing data (formerly known as AGRMET, AGRiculture METeorology) are described in Eylander et al. (2022). For all the simulations, the static land type map is from the Moderate Resolution Imaging Spectroradiometer (MODIS) satellite data (Fig. 1), while the MODIS monthly climatological (2000–2008) leaf area index (LAI) and stem area index (SAI) are used (Yang et al., 2011). The static soil type map is from the State Soil Geographic (STATSGO)/Food and Agriculture Organization (FAO) soil database (FAO, 1991). For both LIS/Noah-MPv4.0.1 and LIS/Noah-MPv5.0 simulations, we adopt the same default Noah-MP physics options (see Table A1), which have been commonly used in previous Noah-MP applications to produce skilled model performance (He et al., 2023b). Model evaluations for both the regional and global simulations are focused on the 5-year period of 2018–2022.

Figure 1MODIS land cover maps used for LIS/Noah-MP (a) global and (b) CONUS benchmark simulations.
We use a suite of reference datasets to evaluate the LIS/Noah-MP simulations of key land surface variables over the globe and CONUS, including soil moisture, latent heat flux (LH), snow water equivalent (SWE), snow depth, snow cover fraction, and surface albedo. Specifically, for surface soil moisture, we use the global daily 36 km Soil Moisture Active Passive (SMAP) version 8 Level 3 satellite data (O'Neill et al., 2021; https://nsidc.org/data/spl3smp/versions/8, last access: 25 November 2024). We also use the surface and root-zone soil moisture from the International Soil Moisture Network (ISMN) ground station hourly measurements (Dorigo et al., 2021; https://ismn.earth/en/, last access: 25 November 2024). The data quality control is done via LVT. For LH, we use the global 0.25° daily Global Land Evaporation Amsterdam Model (GLEAMv3.8a) reanalysis data (Miralles et al., 2011; https://www.gleam.eu/, last access: 25 November 2024) and the global 0.05° hourly FLUXCOM-X-BASE observation-based data (Nelson et al., 2024; https://gitlab.gwdg.de/fluxcom/fluxcomxdata, last access: 6 July 2025). For SWE and snow depth, we use the daily 1 km NOAA National Weather Service's National Operational Hydrologic Remote Sensing Center (NOHRSC) Snow Data Assimilation System (SNODAS) data (Barrett, 2003; https://nsidc.org/data/g02158/, last access: 25 November 2024) and the global 0.1° ERA-5 land (ERA5-Land) reanalysis data (Muñoz-Sabater et al., 2021; https://www.ecmwf.int/en/era5-land, last access: 25 November 2024). For snow cover fraction, we use the global daily 500 m MODIS Terra Snow Cover version 6 data (Hall and Riggs, 2016; https://nsidc.org/data/mod10a1/versions/6, last access: 25 November 2024). For surface albedo, we use the global daily 0.05° MODIS Terra/Aqua merged data (Schaaf and Wang, 2021; https://lpdaac.usgs.gov/products/mcd43c3v061/, last access: 25 November 2024). For model evaluation, we re-map the reference gridded datasets to the LIS/Noah-MP model grids or bilinearly interpolate model values to in-situ measurement locations via LVT, which will likely introduce uncertainties to model evaluations. We also note that those reference datasets have their own uncertainties, which may impact model evaluation results.
4.1 Soil moisture
Figure 2 shows the global 5-year (2018–2022) mean surface soil moisture comparison between SMAP retrievals and LIS/Noah-MP simulations driven by the USAF forcing. Both LIS/Noah-MPv4.0.1 and LIS/Noah-MPv5.0 simulations capture the spatial and seasonal distributions of surface soil moisture globally (Figs. 2 and S1 in the Supplement), with similar bias patterns. Both simulations tend to underestimate in wet soil regimes (e.g., northern and eastern Canada, Amazon forests, northern Europe, tropical Africa, and southeast Asia) and overestimate in dry soil regimes (e.g., western US, west and east coasts of South America, southern and northern Africa, mid-latitudinal Eurasia, and Australia), partially caused by the USAF precipitation forcing bias (Fig. S2), except for northern Canada and southern Brazil which requires further investigation. We note that SMAP data quality is less reliable over regions with thick vegetation (e.g., Southeast US, Amazon rainforest, Congo Basin). The evapotranspiration (ET) biases caused by model deficiencies in plant hydraulics and root water uptake processes may also contribute to the soil moisture bias, as revealed by previous Noah-MP studies (Niu et al., 2020; Li et al., 2021). These global model bias patterns are consistent across all seasons (Fig. S1). Due to the offset of model overestimates and underestimates across different regions, the global annual mean model bias is small (0.003 m3 m−3 for LIS/Noah-MPv4.0.1 and 0.008 m3 m−3 for LIS/Noah-MPv5.0). Overall, LIS/Noah-MPv5.0 shows consistently higher surface soil moisture than LIS/Noah-MPv4.0.1 but the difference is small (Fig. 2f), which is expected since there is no direct soil physics update but changes in snowpack (e.g., snow cover parameter updates) and vegetation processes (e.g., vegetation fraction scaling treatments) from Noah-MPv4.0.1 to Noah-MPv5.0.

Figure 2Surface soil moisture (m3 m−3) comparison between SMAP retrievals and LIS/Noah-MP simulations driven by USAF forcing globally averaged during 2018–2022: (a) SMAP data, (b) LIS/Noah-MPv4.0.1 simulation, (c) LIS/Noah-MPv5.0 simulation, (d) LIS/Noah-MPv4.0.1 biases (model minus SMAP), (e) LIS/Noah-MPv5.0 biases (model minus SMAP), and (f) differences between LIS/Noah-MPv5.0 and LIS/Noah-MPv4.0.1 simulations. Grids with statistically significant differences (p<0.05) are shown with gray dots in panels (d)–(f). The statistical significance over each grid is computed using daily time series and the t-test method. The global mean value is also provided in the lower right of each panel. See Fig. S1 for seasonal plots.
Further model evaluation with the ISMN global in-situ measurements indicates systematic model overestimates of surface soil moisture at most sites (Fig. 3), particularly over the CONUS and Europe that have very dense measurement networks, with global mean biases of 0.062 and 0.067 m3 m−3 for LIS/Noah-MPv4.0.1 and LIS/Noah-MPv5.0, respectively. This bias pattern is consistent with the SMAP comparisons (Fig. 2). LIS/Noah-MPv5.0 shows slightly (0.005 m3 m−3) higher mean surface soil moisture than LIS/Noah-MPv4.0.1 across all sites (Fig. 3f). We further compute the soil moisture anomaly correlation between the model simulations and ISMN observations following Navari et al. (2024), where the anomaly is computed as daily anomaly by subtracting monthly mean values. Both models show similar anomaly correlation spatial patterns (Fig. 3g–h), with a mean value of ∼ 0.53 and higher values in North America and Europe than in Asia and Africa. Compared to the surface soil moisture, the root-zone soil moisture shows similar spatial distributions (Fig. 4a–c), model bias patterns (Fig. 4d–e), and anomaly correlation patterns (Fig. 4g–i) across most ISMN sites, with global annual mean biases of 0.039 and 0.050 m3 m−3 for LIS/Noah-MPv4.0.1 and LIS/Noah-MPv5.0, respectively.
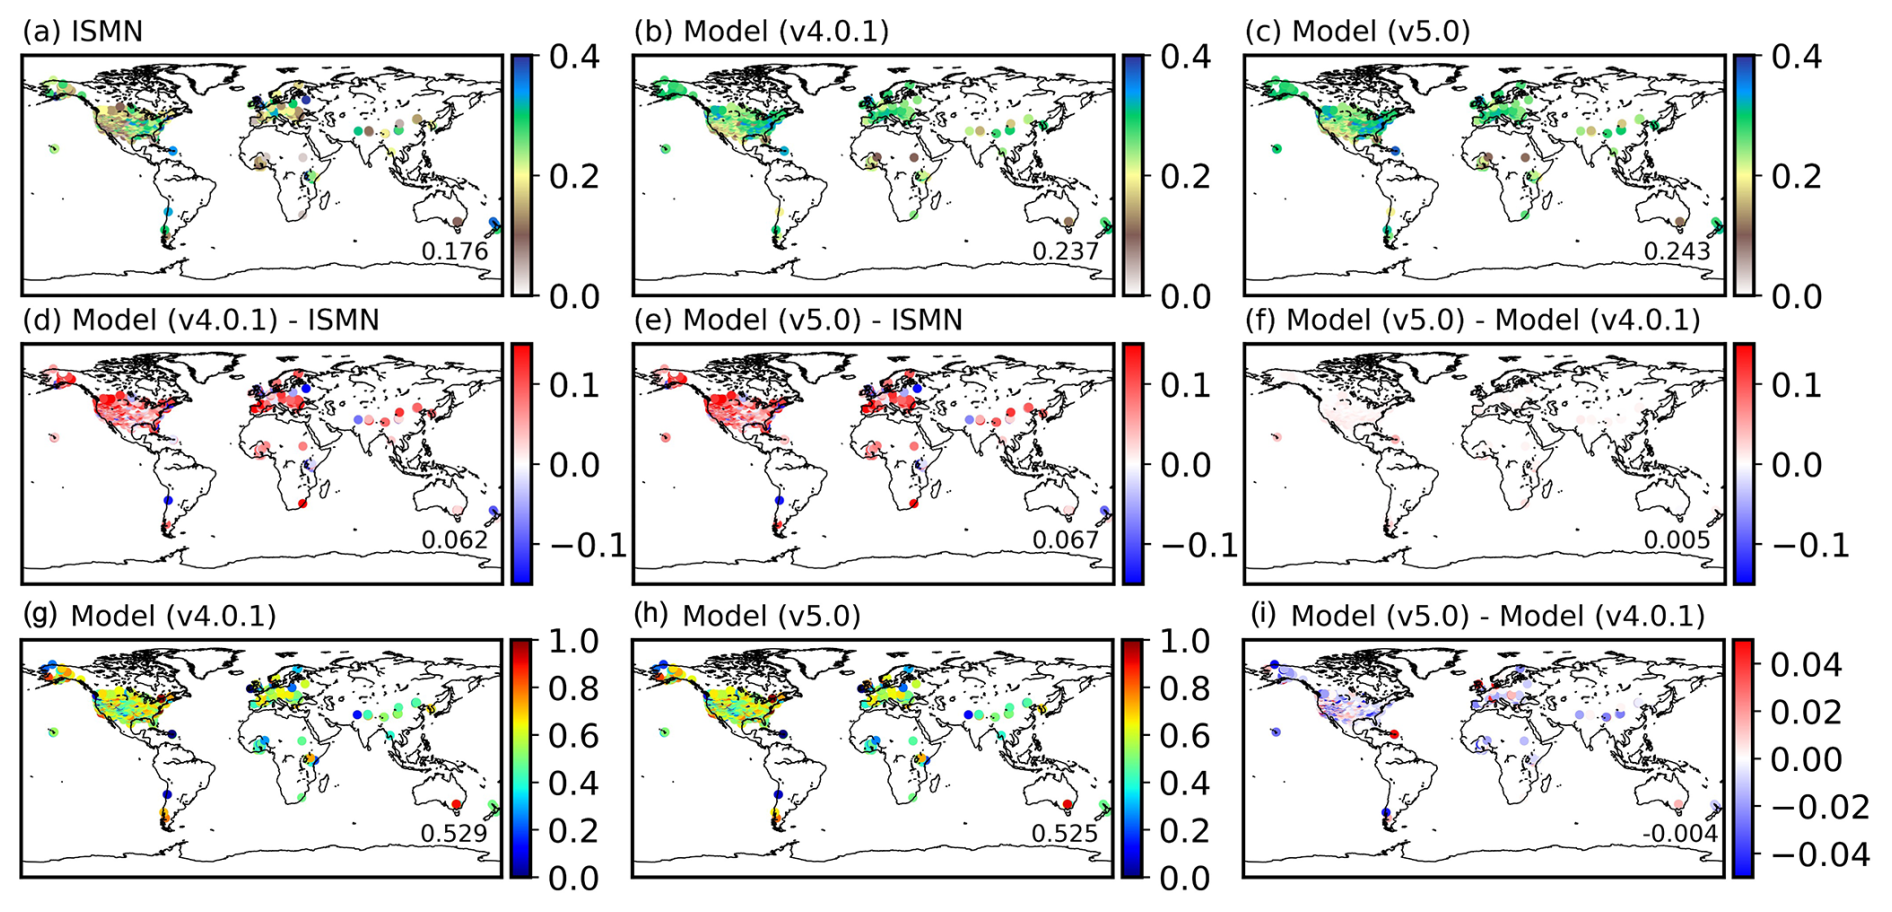
Figure 3Surface soil moisture (m3 m−3) comparison between ISMN station measurements and LIS/Noah-MP simulations driven by USAF forcing globally averaged during 2018–2022: (a) ISMN data, (b) LIS/Noah-MPv4.0.1 simulation, (c) LIS/Noah-MPv5.0 simulation, (d) LIS/Noah-MPv4.0.1 biases (model minus ISMN), (e) LIS/Noah-MPv5.0 biases (model minus ISMN), (f) differences between LIS/Noah-MPv5.0 and LIS/Noah-MPv4.0.1 simulations, (g) LIS/Noah-MPv4.0.1 anomaly correlation, (h) LIS/Noah-MPv5.0 anomaly correlation, and (i) differences between LIS/Noah-MPv5.0 and LIS/Noah-MPv4.0.1 anomaly correlation. The global mean value is also provided in the lower right of each panel.
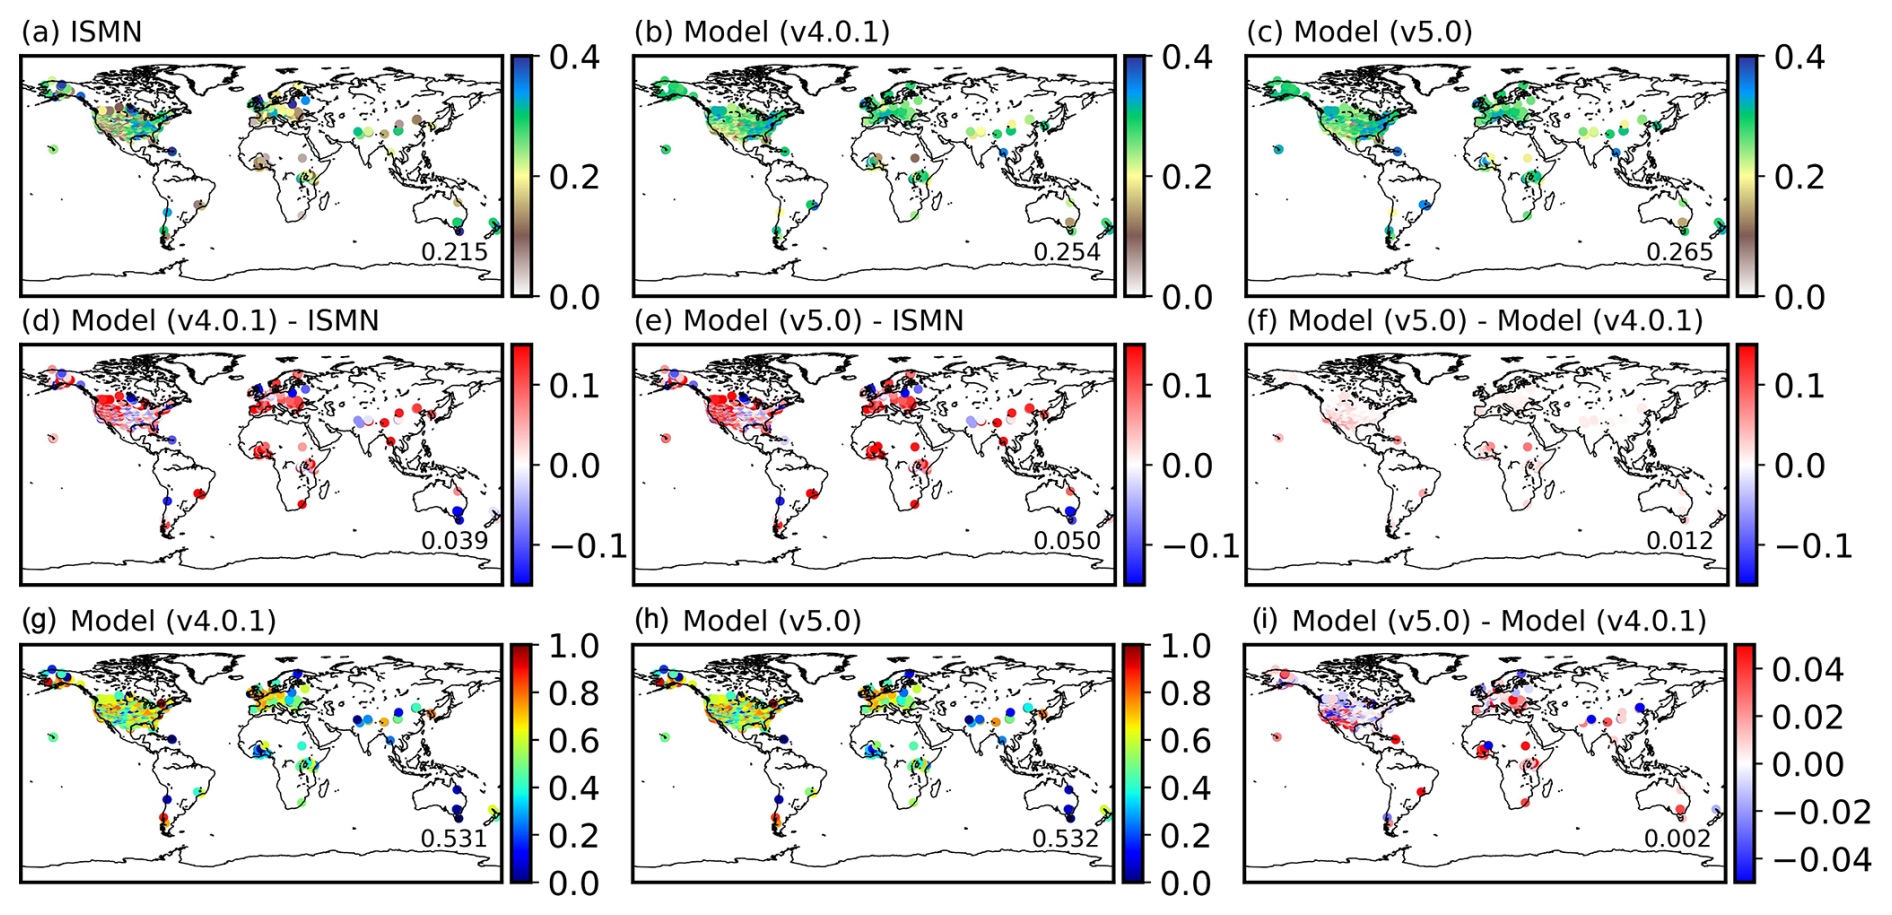
Figure 4Same as Fig. 3, but for root-zone soil moisture (m3 m−3) evaluation.
Over the CONUS, both LIS/Noah-MPv4.0.1 and LIS/Noah-MPv5.0 simulations driven by the NLDAS-2 forcing capture the spatial distribution of SMAP surface soil moisture with similar spatial bias patterns (Fig. 5), which show model underestimates over wet soil regimes (e.g., the northwest coast and southeast and northeast US) and overestimates over dry soil regimes (e.g., western and central US). This is consistent with the global evaluation albeit using a different forcing dataset. LIS/Noah-MPv5.0 also produces consistently but slightly (0.007 m3 m−3) higher soil moisture than LIS/Noah-MPv4.0.1 using the NLDAS-2 forcing (Fig. 5f), similar to the results using the USAF forcing, revealing a robust difference pattern between the two model versions. The comparison with ISMN surface soil moisture data over the CONUS shows similar model bias patterns with those evaluated against SMAP (Fig. 6), except for the northwest coast and Florida, where ISMN indicates dry soil regimes that are opposite to SMAP. This points to the importance of considering observational data uncertainty in model evaluation. The CONUS mean biases across all ISMN sites are 0.041 and 0.047 m3 m−3 for LIS/Noah-MPv4.0.1 and LIS/Noah-MPv5.0, respectively. The CONUS mean anomaly correlation is about 0.6 for both models (Fig. 6g–h), with slightly lower values particularly over many western US sites for LIS/Noah-MPv5.0 than LIS/Noah-MPv4.0.1 (Fig. 6i). The model bias pattern of root-zone soil moisture is similar to that of surface soil moisture but with larger underestimates at some central US sites (Fig. 7).
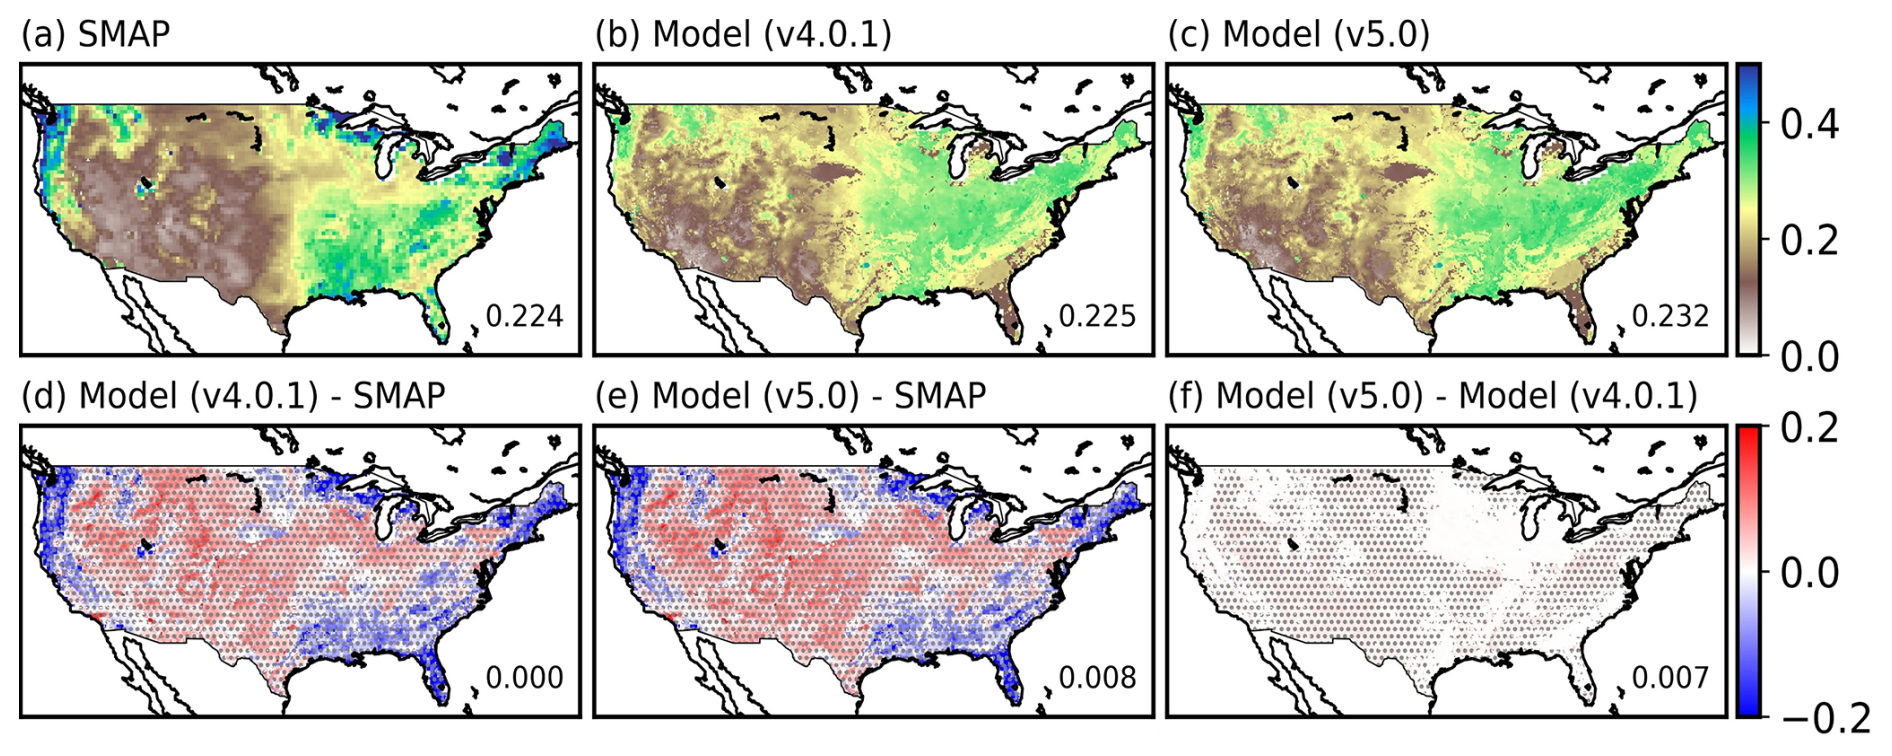
Figure 5Same as Fig. 2, but for evaluation of LIS/Noah-MP simulations driven by the NLDAS-2 forcing over the CONUS averaged during 2018–2022.
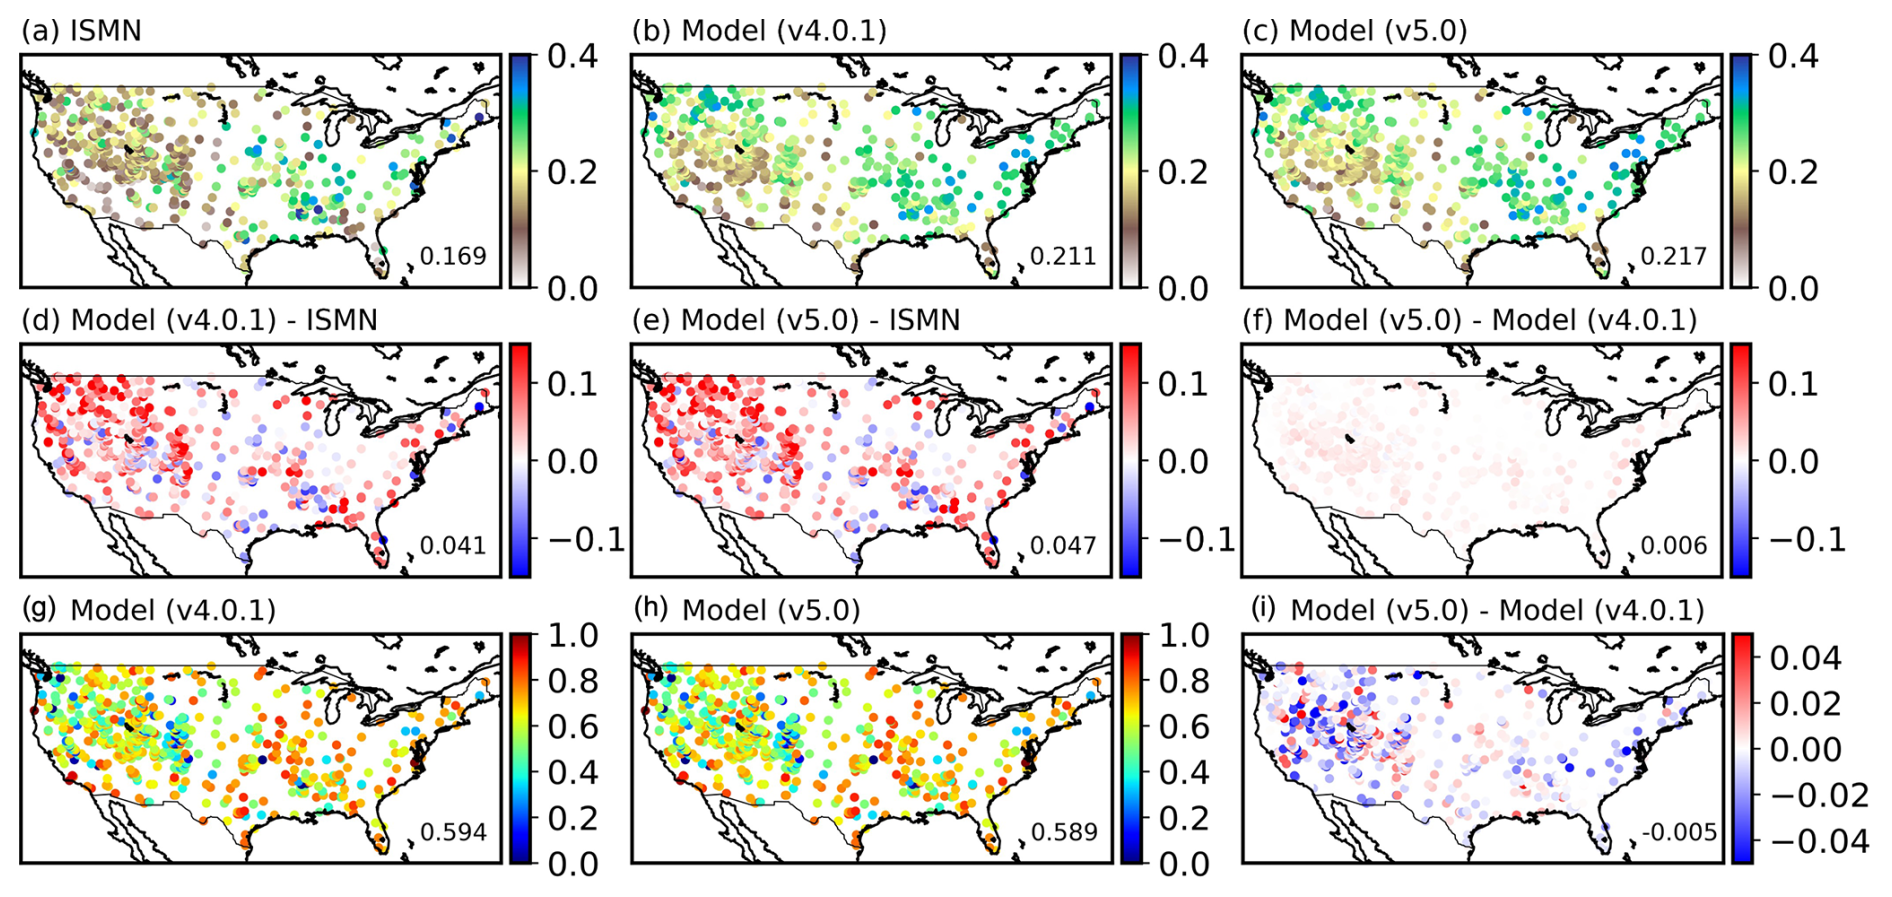
Figure 6Same as Fig. 3, but for evaluation of LIS/Noah-MP simulated surface soil moisture (m3 m−3) driven by the NLDAS-2 forcing over the CONUS averaged during 2018–2022.
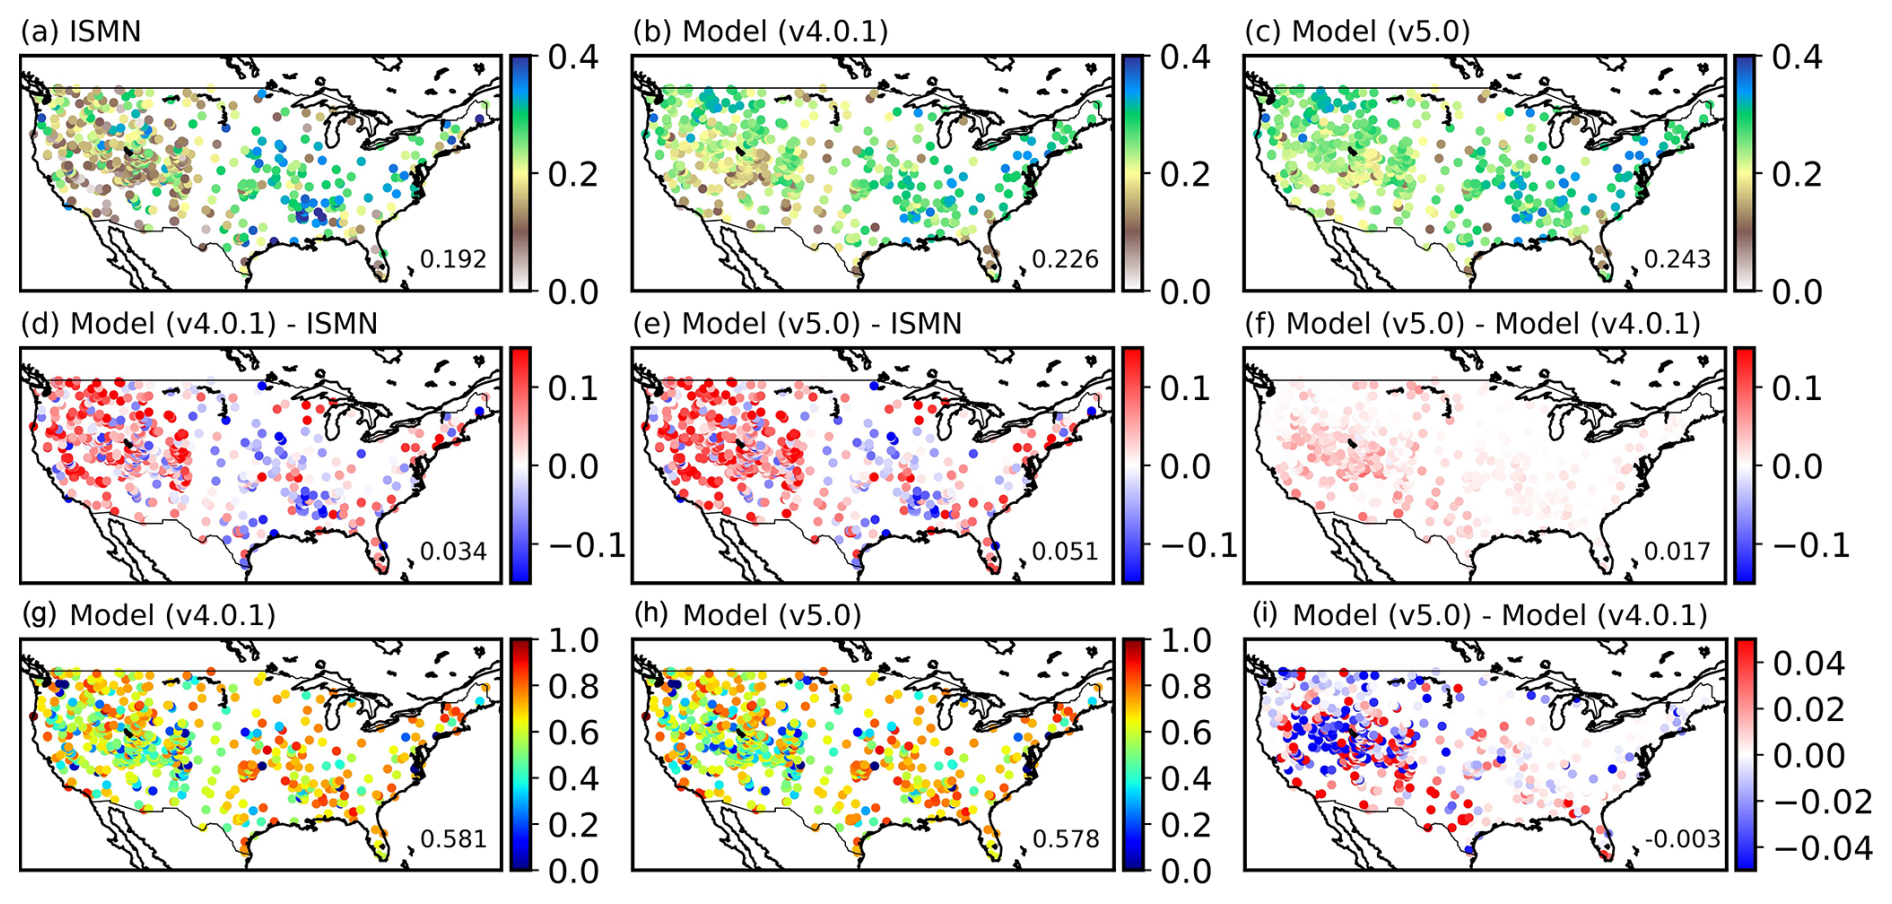
Figure 7Same as Fig. 4, but for evaluation of LIS/Noah-MP simulated root-zone soil moisture (m3 m−3) driven by the NLDAS-2 forcing over the CONUS averaged during 2018–2022.
4.2 Latent heat flux
Figure 8 shows the global 5-year (2018–2022) mean latent heat (LH) flux comparison between the GLEAM data and LIS/Noah-MP simulations driven by the USAF forcing. Both LIS/Noah-MPv4.0.1 and LIS/Noah-MPv5.0 simulations capture the spatial and seasonal LH distributions with similar bias patterns (Figs. 8 and S3). The model LH biases are generally consistent with the surface soil moisture bias patterns (Fig. 2), with the underestimated (overestimated) LH over regions with the underestimated (overestimated) soil moisture, except for northern Eurasia and northwest North America (Alaska and west Canada). Although LIS/Noah-MPv5.0 has a slightly higher soil moisture than LIS/Noah-MPv4.0.1 (Figs. 2–4), it shows a lower LH (by up to ∼ 15 W m−2) over some tropical and mid-latitude regions with the largest difference in the tropics, which reduces the global mean LH bias from 0.99 W m−2 (LIS/Noah-MPv4.0.1) to −0.39 W m−2 (LIS/Noah-MPv5.0). This difference in the two Noah-MP versions is mainly due to the code updates related to vegetation properties (e.g., bug fixes in vegetation fraction scaling treatments) and processes (e.g., added canopy heat storage treatment) which alters ET and LH (see Sect. 5 for discussion). The minor LH difference (up to ∼ 5 W m−2) between the two model versions over the Antarctica and Greenland is mainly caused by updates in the glacier scheme that uses snowpack physics consistent with other land snowpacks in LIS/Noah-MPv5.0. We note that the LH (or ET) reference data product also has nontrivial uncertainties which may confound model evaluations here (see Sect. 5 for detail).
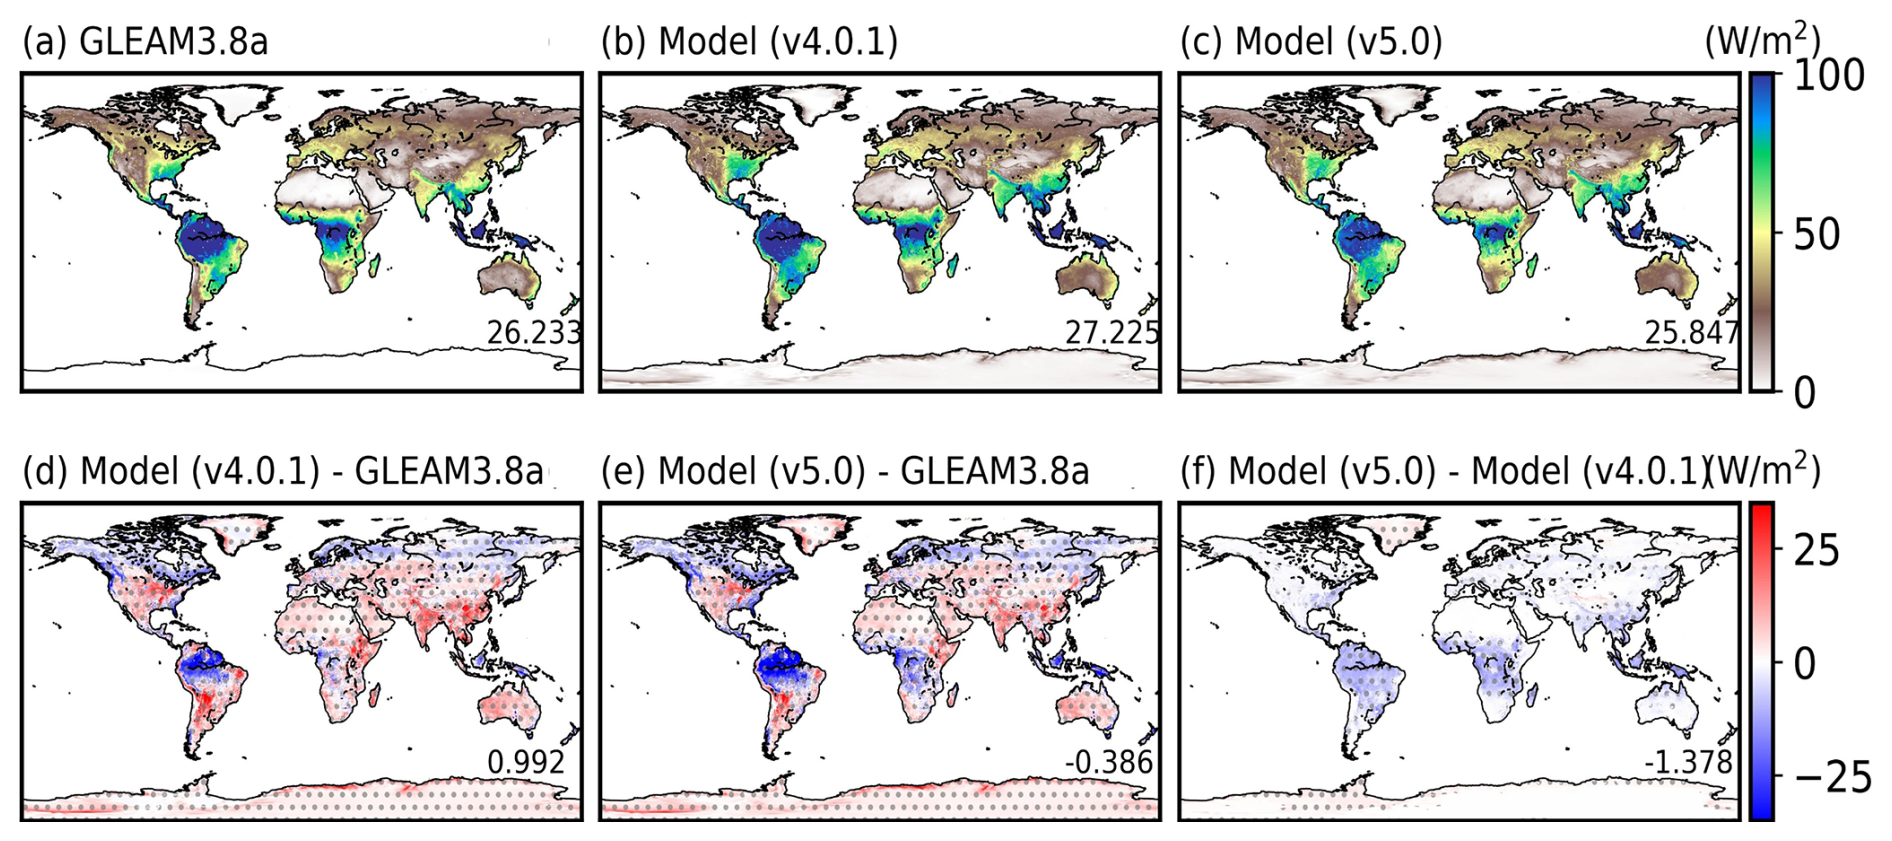
Figure 8Latent heat flux (W m−2) comparison between the GLEAM data and LIS/Noah-MP simulations driven by USAF forcing globally averaged during 2018–2022: (a) GLEAM3.8a data, (b) LIS/Noah-MPv4.0.1 simulation, (c) LIS/Noah-MPv5.0 simulation, (d) LIS/Noah-MPv4.0.1 biases (model minus GLEAM), (e) LIS/Noah-MPv5.0 biases (model minus GLEAM), and (f) differences between LIS/Noah-MPv5.0 and LIS/Noah-MPv4.0.1 simulations. Grids with statistically significant differences (p<0.05) are shown with gray dots in panels (d)–(f). The statistical significance over each grid is computed using daily time series and the t-test method. The global mean value is also provided in the lower right of each panel. See Fig. S3 for seasonal plots.
Further CONUS evaluation of model simulations driven by the NLDAS-2 forcing also reveals that model LH bias patterns (Fig. 9) generally follow the soil moisture bias patterns (Fig. 5) except for many western US mountainous regions, where both model simulations have very small LH biases despite the overestimation of soil moisture (Figs. 5–7). Compared to LIS/Noah-MPv4.0.1, LIS/Noah-MPv5.0 shows a lower LH over southwest US and eastern US by up to about 10 W m−2, which degrades the CONUS-mean model bias from −0.21 to −2.30 W m−2. We note that GLEAM is a model-based reanalysis data that has its own uncertainty.

Figure 9Same as Fig. 8 but for evaluation of LIS/Noah-MP simulations driven by the NLDAS-2 forcing over the CONUS averaged during 2018–2022.
4.3 Snow water equivalent (SWE)
Figure 10 shows the global 5-year (2018–2022) mean SWE comparison for seasonal snowpack between ERA5-Land data and LIS/Noah-MP simulations driven by the USAF forcing. Both LIS/Noah-MPv4.0.1 and LIS/Noah-MPv5.0 simulations capture the spatial and seasonal SWE distributions with similar bias patterns (Figs. 10 and S4). Both simulations tend to have much lower SWE (by up to 50 mm) in the Himalayas and west Canada than ERA5-Land, with slightly less SWE in eastern Russia, partially driven by overestimated surface temperature (Sect. 4.7). Both simulations have higher SWE than ERA5-Land in most other mid-latitude and high-latitude snowpacks, mainly driven by overestimated precipitation (Fig. S2) and underestimated surface temperature (Fig. S8). The global annual mean SWE biases are −10.1 and −13.2 mm for LIS/Noah-MPv4.0.1 and LIS/Noah-MPv5.0, respectively. Overall, LIS/Noah-MPv5.0 shows lower SWE than LIS/Noah-MPv4.0.1, particularly in spring when differences reach up to 25 mm (Figs. 10f and S4) due to the updated snow cover parameters (He et al., 2021) that reduces snow cover fraction (Sect. 4.5) and enhances snow ablation particularly in spring through the positive surface albedo feedback. We note that the ERA5-Land SWE data also has uncertainties, which tends to overestimate SWE over mountainous areas (Monteiro and Morin, 2023).
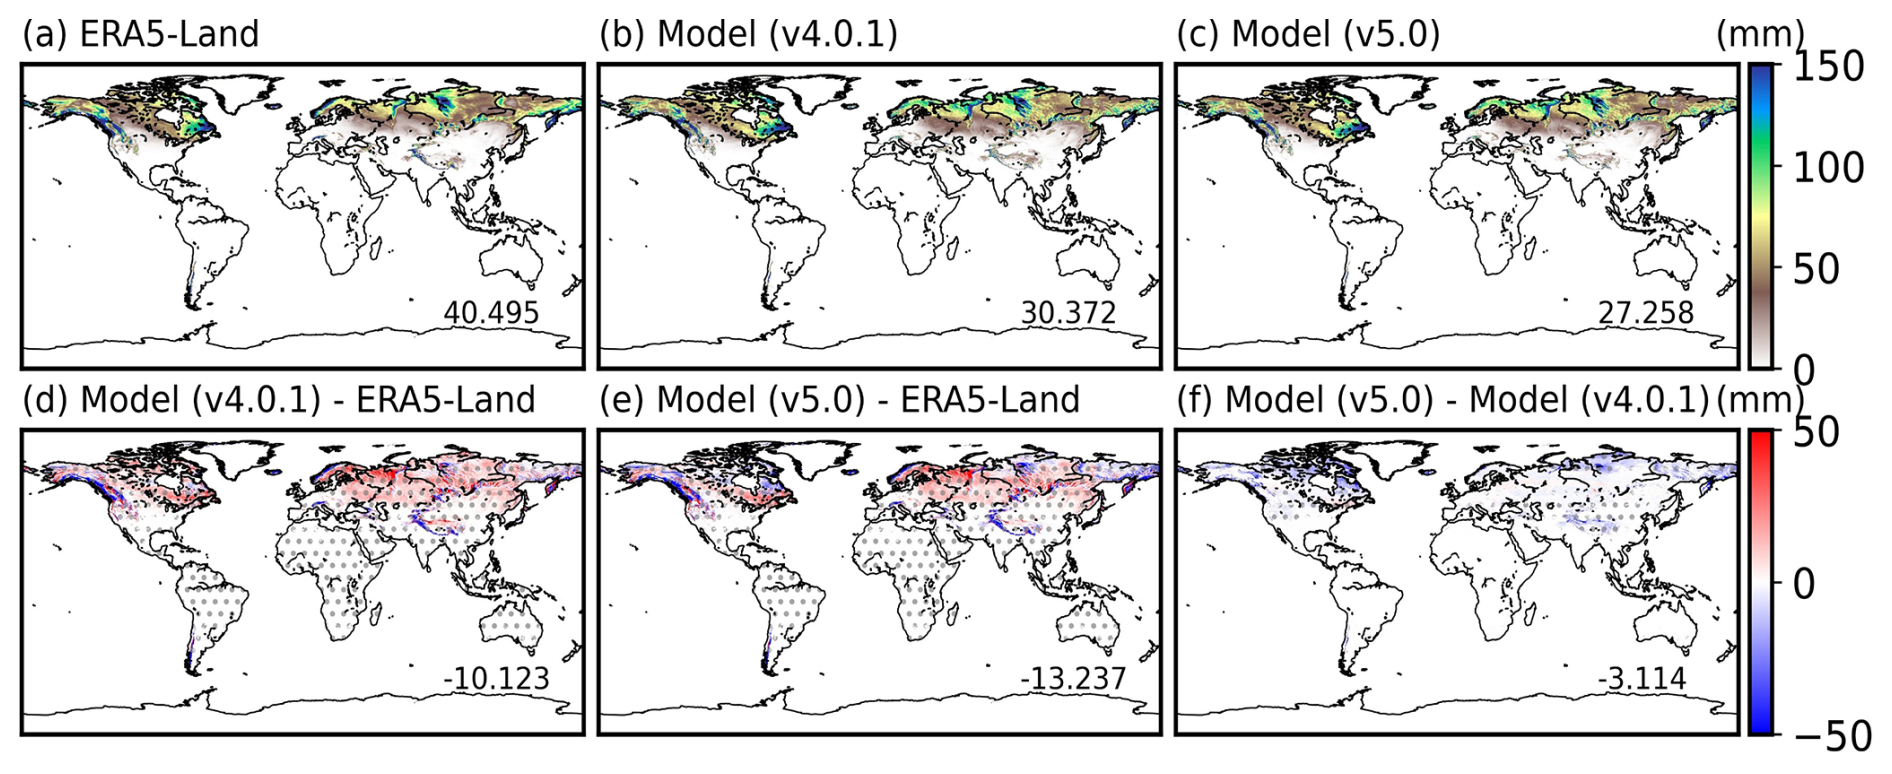
Figure 10SWE (mm) comparison between ERA5-Land and LIS/Noah-MP simulations driven by USAF forcing globally averaged during 2018–2022: (a) ERA5-Land data, (b) LIS/Noah-MPv4.0.1 simulation, (c) LIS/Noah-MPv5.0 simulation, (d) LIS/Noah-MPv4.0.1 biases (model minus ERA5-Land), (e) LIS/Noah-MPv5.0 biases (model minus ERA5-Land), and (f) differences between LIS/Noah-MPv5.0 and LIS/Noah-MPv4.0.1 simulations. Grids with statistically significant differences (p<0.05) are shown with gray dots in panels (d)–(f). The statistical significance over each grid is computed using daily time series and the t-test method. The global mean value is also provided in the lower right of each panel. See Fig. S4 for seasonal plots.
The CONUS-wide regional evaluation between SNODAS and LIS/Noah-MP simulations driven by the NLDAS-2 forcing indicates large SWE underestimates by up to 50 mm or more in high-elevation mountains in the western US and very small biases across other CONUS regions (Fig. 11), mainly due to the underestimated mountain precipitation in NLDAS-2 (He et al., 2019). The CONUS mean SWE biases are −4.2 and −5.0 mm for LIS/Noah-MPv4.0.1 and LIS/Noah-MPv5.0, respectively, with slightly lower SWE in LIS/Noah-MPv5.0 than LIS/Noah-MPv4.0.1 over most CONUS snowpacks (Fig. 11f).
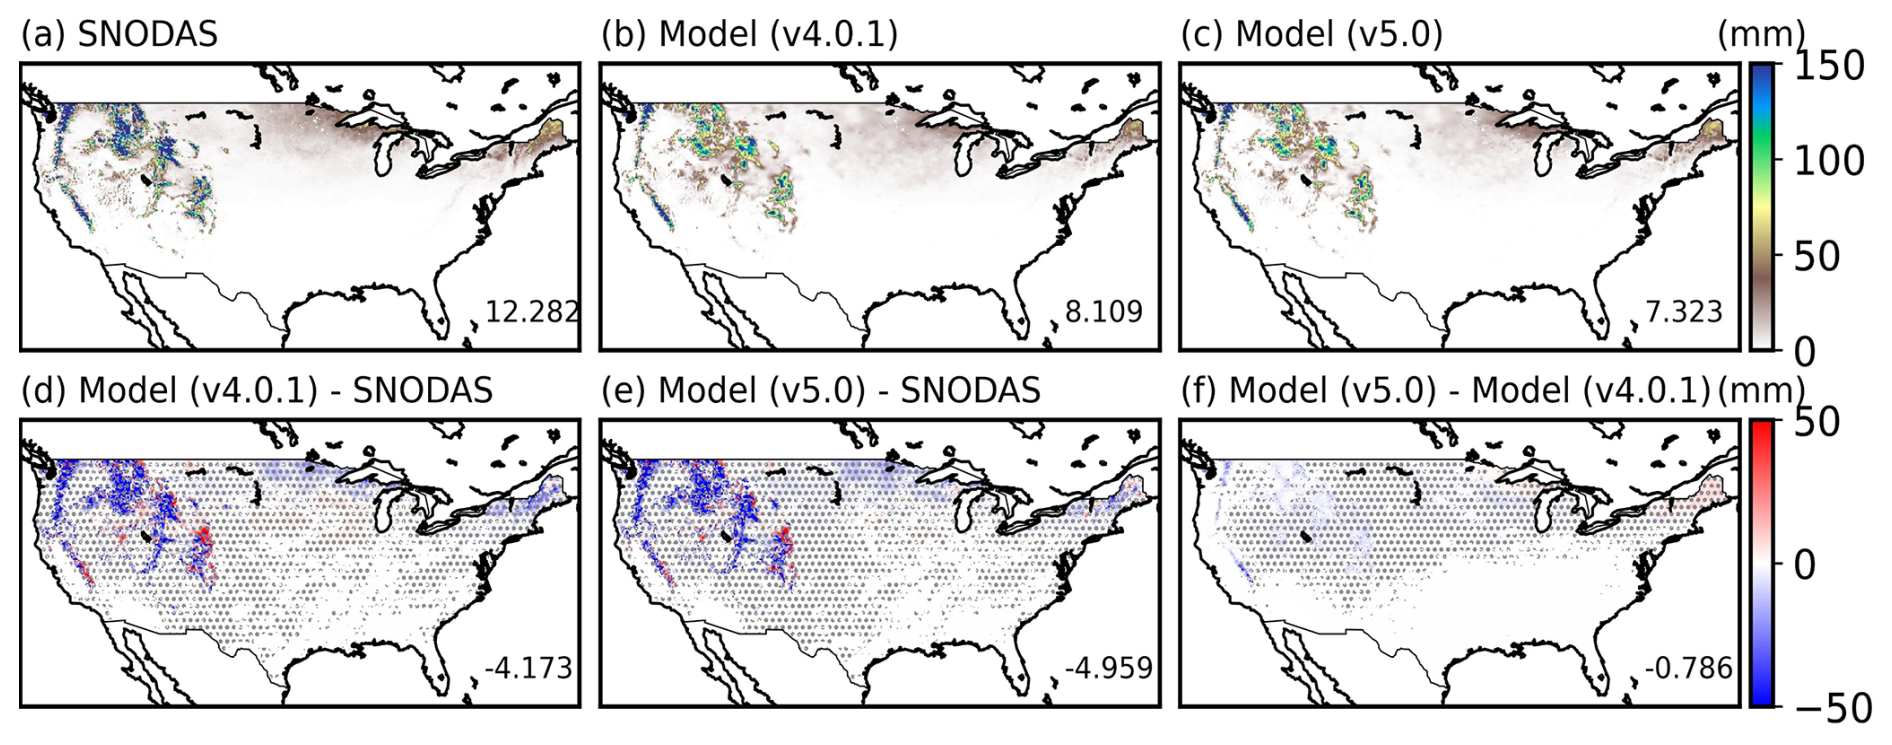
Figure 11Same as Fig. 10 but for SWE (mm) comparison between SNODAS and LIS/Noah-MP simulations driven by the NLDAS-2 forcing over the CONUS averaged during 2018–2022.
4.4 Snow depth
Figure 12 shows the global 5-year (2018–2022) mean snow depth comparison for seasonal snowpack between ERA5-Land data and LIS/Noah-MP simulations driven by the USAF forcing. Both LIS/Noah-MPv4.0.1 and LIS/Noah-MPv5.0 simulations reproduce the spatial and seasonal snow depth distributions with similar bias patterns (Figs. 12 and S5). The snow depth bias pattern generally follows the SWE bias pattern (Fig. 10) with global annual mean biases of ∼ 0.06 m for both simulations, except for the lower snow depth over some regions with higher SWE in northern Canada and northern Russia compared to ERA5-Land. The snow depth difference (global mean of 0.003 m) between LIS/Noah-MPv4.0.1 and LIS/Noah-MPv5.0 is small (Fig. 12f).
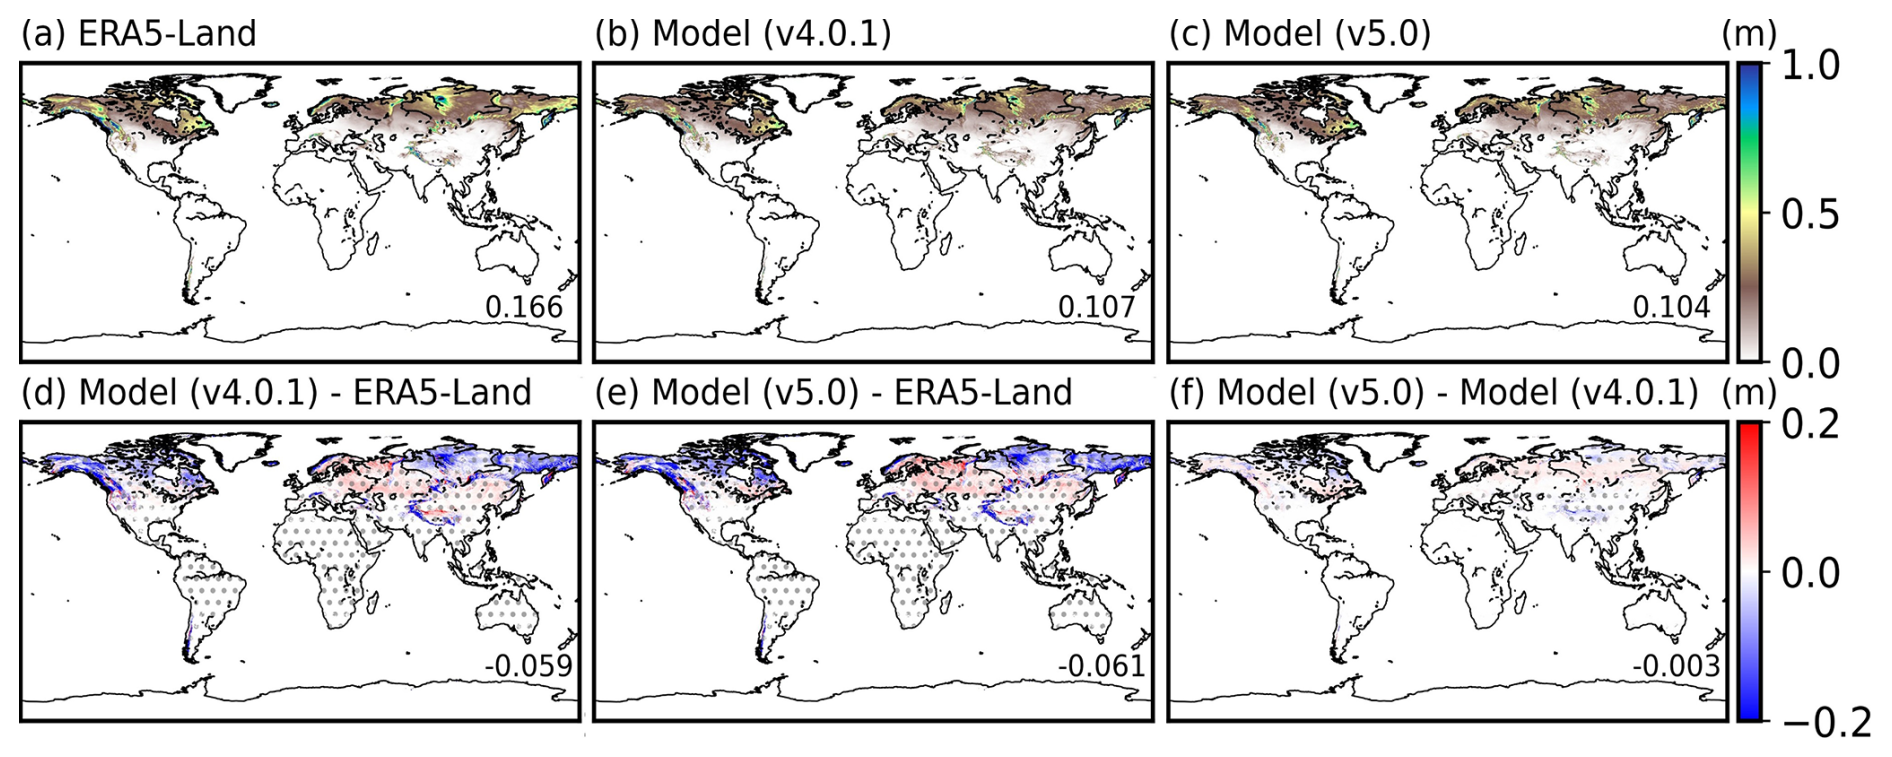
Figure 12Snow depth (m) comparison between ERA5-Land and LIS/Noah-MP simulations driven by USAF forcing globally averaged during 2018–2022: (a) ERA5-Land data, (b) LIS/Noah-MPv4.0.1 simulation, (c) LIS/Noah-MPv5.0 simulation, (d) LIS/Noah-MPv4.0.1 biases (model minus ERA5-Land), (e) LIS/Noah-MPv5.0 biases (model minus ERA5-Land), and (f) differences between LIS/Noah-MPv5.0 and LIS/Noah-MPv4.0.1 simulations. Grids with statistically significant differences (p<0.05) are shown with gray dots in panels (d)–(f). The statistical significance over each grid is computed using daily time series and the t-test method. The global mean value is also provided in the lower right of each panel. See Fig. S5 for seasonal plots.
The CONUS-wide regional snow depth evaluation between SNODAS and LIS/Noah-MP simulations driven by the NLDAS-2 forcing also reveals a similar bias pattern (Fig. 13) as the SWE evaluation, with largely underestimated snow depth over most western US high mountains due to the underestimated SWE. The CONUS mean snow depth biases are −0.013 and −0.015 m for LIS/Noah-MPv4.0.1 and LIS/Noah-MPv5.0, respectively, with very minor differences between the two simulations (Fig. 13f).
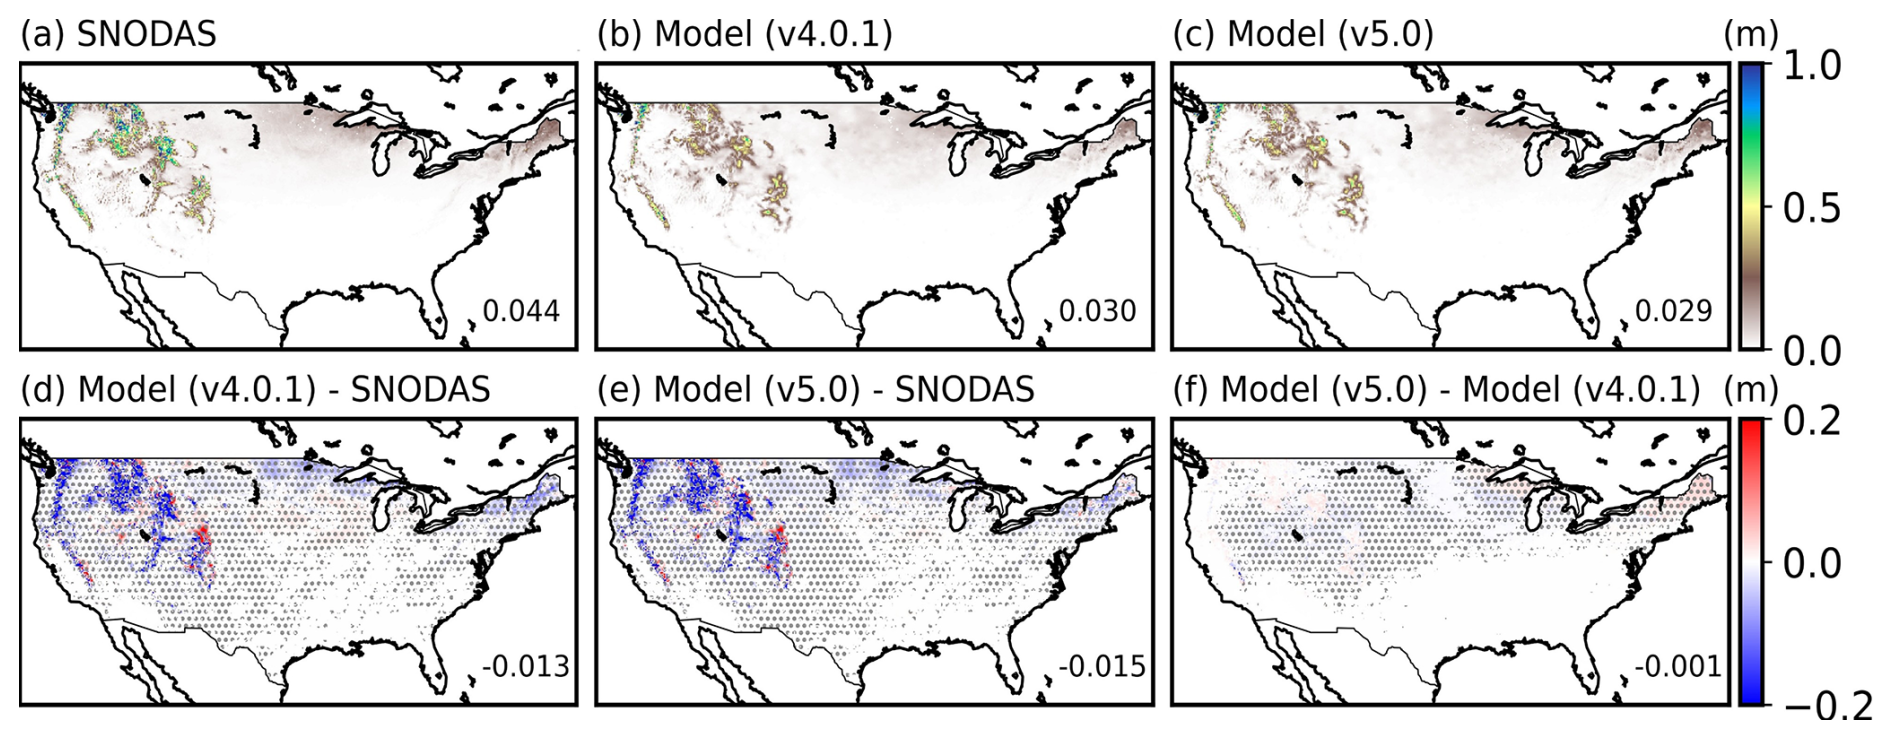
Figure 13Same as Fig. 12, but for snow depth (m) comparison between SNODAS and LIS/Noah-MP simulations driven by the NLDAS-2 forcing over the CONUS averaged during 2018–2022.
4.5 Snow cover fraction
Although LIS/Noah-MPv4.0.1 and LIS/Noah-MPv5.0 simulations capture the spatial and seasonal snow cover distributions, they systematically overestimate snow cover globally relative to MODIS observations (Figs. 14 and S6). This high bias in snow cover is particularly outstanding considering the underestimated SWE and snow depth (Figs. 10 and 12), which has been a long-standing problem in Noah-MP (He et al., 2019; Jiang et al., 2020; Zhou et al., 2023). Specifically, LIS/Noah-MPv4.0.1 tends to overestimate snow cover across the global snowpack by up to 0.3 with a global mean bias of 0.11, while LIS/Noah-MPv5.0 reduces the snow cover overestimate particularly in northern high-latitudes and the Tibetan Plateau, which effectively reduces the global mean bias to 0.07. This bias reduction is attributable to the updated snow cover parameters in LIS/Noah-MPv5.0 (He et al., 2021). However, LIS/Noah-MPv5.0 still systematically overestimates snow cover over most mid-latitude and high-latitude snowpacks, which suggests the need for improved snowpack physics in Noah-MP (see Sect. 6 for discussion). The spatial heterogeneity of the snow cover change magnitude caused by the snow cover parameter updates may be due to several reasons: (1) The snow cover parameter updates are more effective for regions with snow depth less than about 0.3 m, since this is the most sensitive snow depth regime for snow cover calculations based on the parameterization used in Noah-MP (He et al., 2019); (2) The snow cover parameter updates are vegetation type dependent, so the effectiveness of this change also depends on vegetation types; (3) Due to the positive surface albedo feedback, the snow cover change is more effective over ablation regions and periods; (4) The snow cover impact is further complicated by the spatial heterogeneity of SWE biases (Abolafia-Rosenzweig et al., 2025).
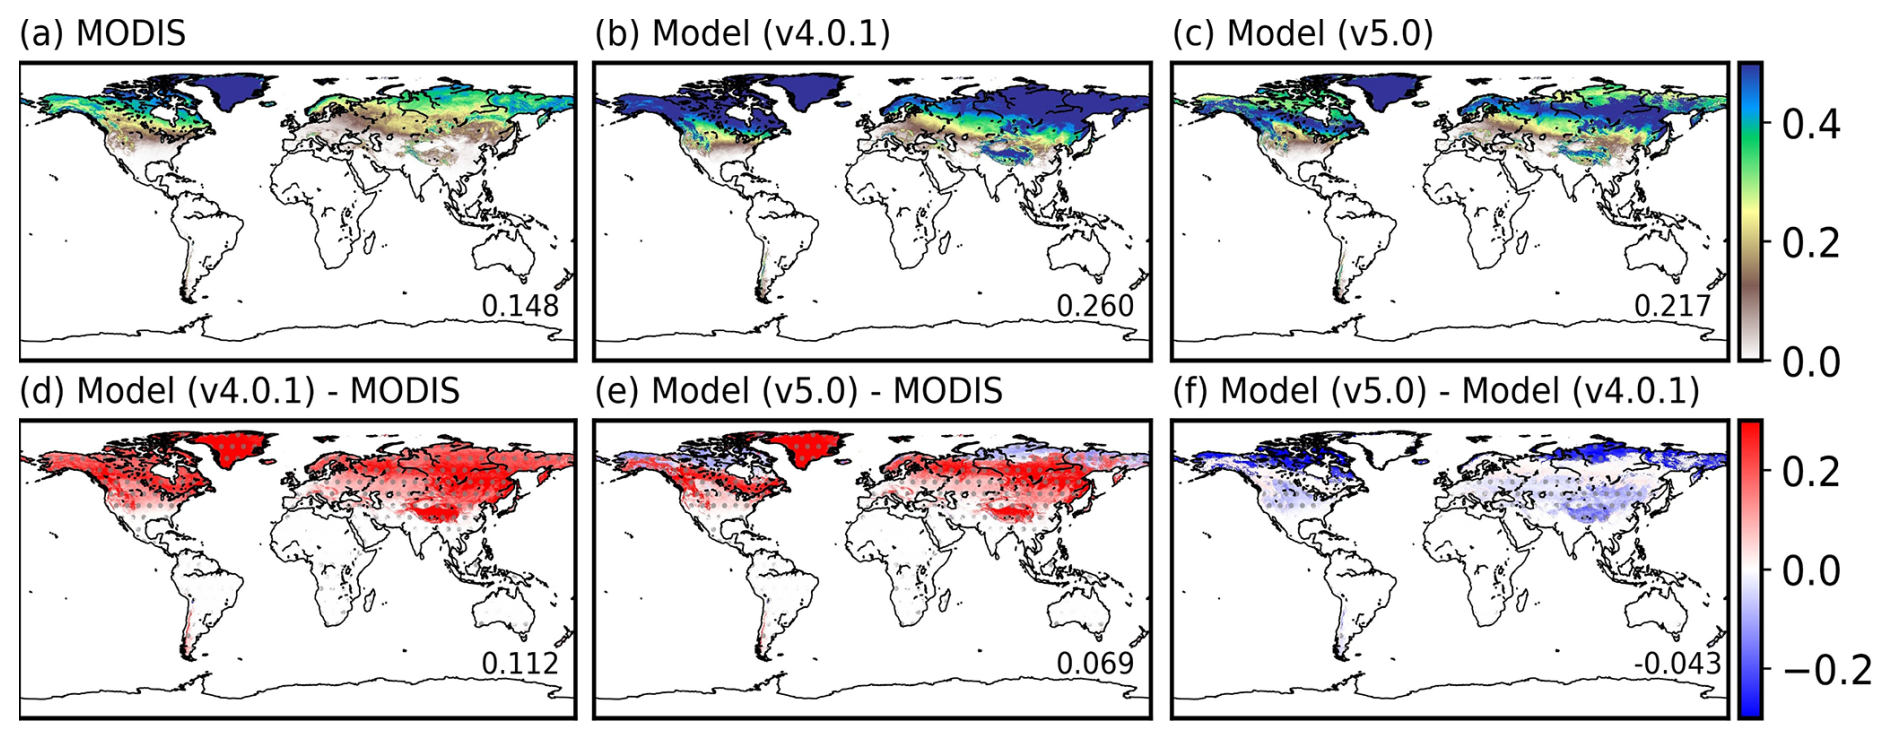
Figure 14Snow cover fraction comparison between MODIS and LIS/Noah-MP simulations driven by the USAF forcing globally averaged during 2018–2022: (a) MODIS data, (b) LIS/Noah-MPv4.0.1 simulation, (c) LIS/Noah-MPv5.0 simulation, (d) LIS/Noah-MPv4.0.1 biases (model minus MODIS), (e) LIS/Noah-MPv5.0 biases (model minus MODIS), and (f) differences between LIS/Noah-MPv5.0 and LIS/Noah-MPv4.0.1 simulations. Grids with statistically significant differences (p<0.05) are shown with gray dots in panels (d)–(f). The statistical significance over each grid is computed using daily time series and the t-test method. The global mean value is also provided in the lower right of each panel. See Fig. S6 for seasonal plots.
The CONUS-wide regional evaluation between MODIS and LIS/Noah-MP simulations driven by the NLDAS-2 forcing also reveals a consistently high bias in snow cover in LIS/Noah-MPv4.0.1, particularly over western US mountains, with a CONUS mean bias of 0.055 (Fig. 15). LIS/Noah-MPv5.0 effectively removes the snow cover overestimates in snowpacks outside high-elevation mountains in the western US, which halves the CONUS mean bias. The remaining snow cover overestimate in western US high mountains, which notably correspond to the regions with underestimated SWE and snow depth (Figs. 11 and 13), needs further investigation.
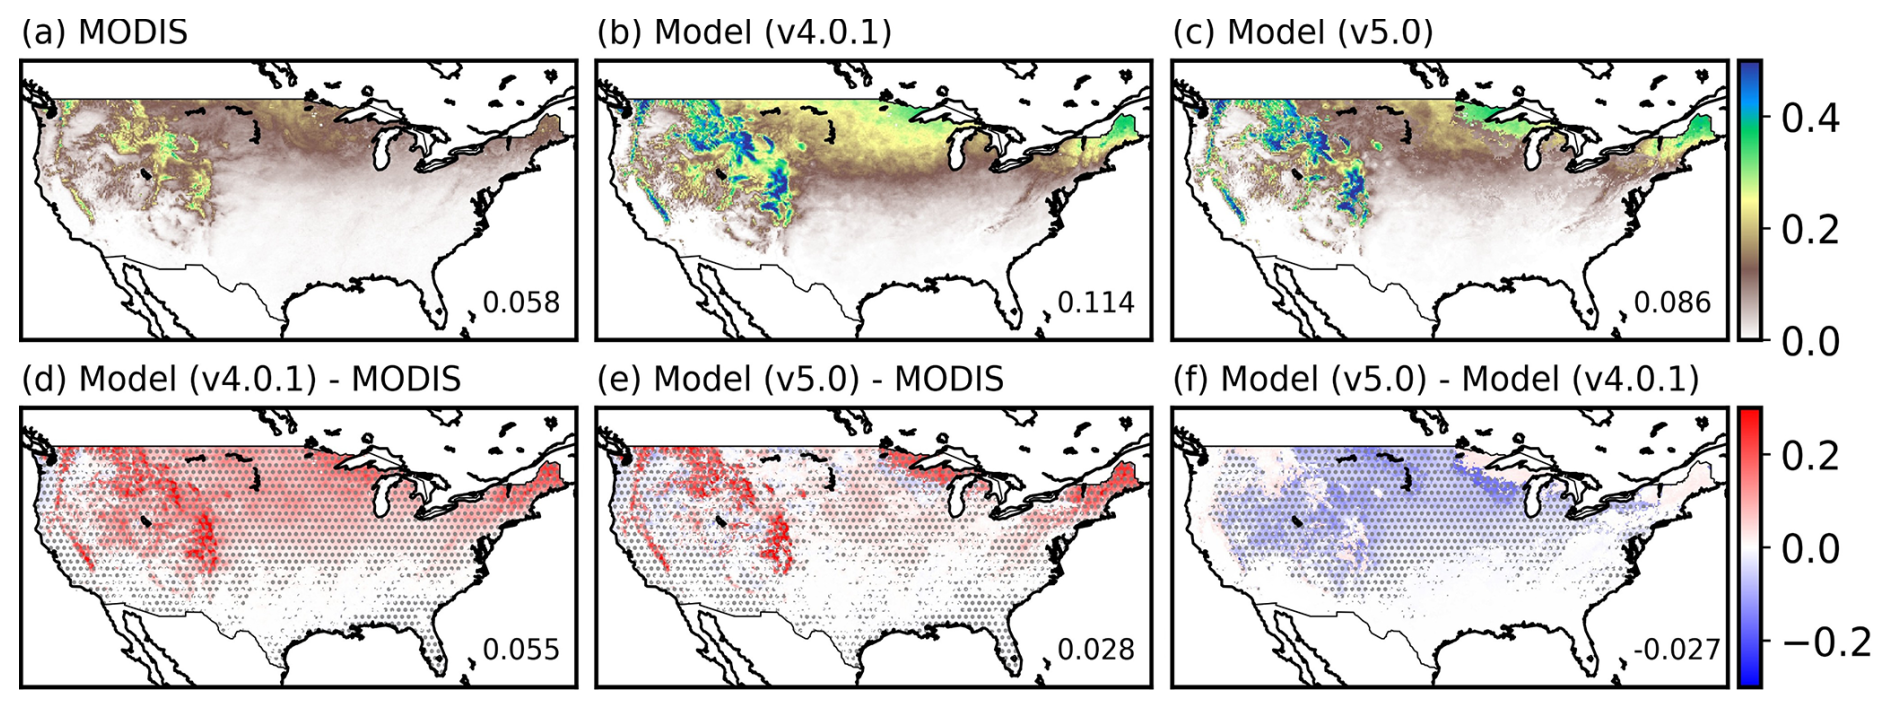
Figure 15Same as Fig. 14, but for evaluation of LIS/Noah-MP simulations driven by the NLDAS-2 forcing over the CONUS averaged during 2018–2022.
4.6 Surface albedo
Figure 16 shows the global 5-year (2018–2022) mean surface albedo comparison between MODIS and LIS/Noah-MP simulations driven by the USAF forcing. Both LIS/Noah-MPv4.0.1 and LIS/Noah-MPv5.0 simulations capture the spatial and seasonal surface albedo distributions with similar bias patterns (Figs. 16 and S7). LIS/Noah-MPv4.0.1 shows consistently overestimated surface albedo over most global regions by up to 0.05 or more, except for significant underestimates in the Sahara Desert and Antarctica which dominate the global mean bias (−0.02). This bias pattern is consistent across different seasons (Fig. S7). Compared to LIS/Noah-MPv4.0.1, LIS/Noah-MPv5.0 shows an overall reduction of surface albedo across mid-latitudes and high-latitudes due to lower snow cover (Sect. 4.5), which reduces the high bias of surface albedo particularly in the midlatitudes (Fig. 16). The remaining albedo overestimates in LIS/Noah-MPv5.0 in the mid-latitude and high-latitude snowpacks are partially caused by the overestimated snow cover (Fig. 14e) and also likely by the soil and vegetation albedo uncertainties. The systematic surface albedo underestimates in the Sahara Desert, Antarctica, and Greenland further indicate model biases in the background albedo for desert soil and glacier ice/snow albedo.
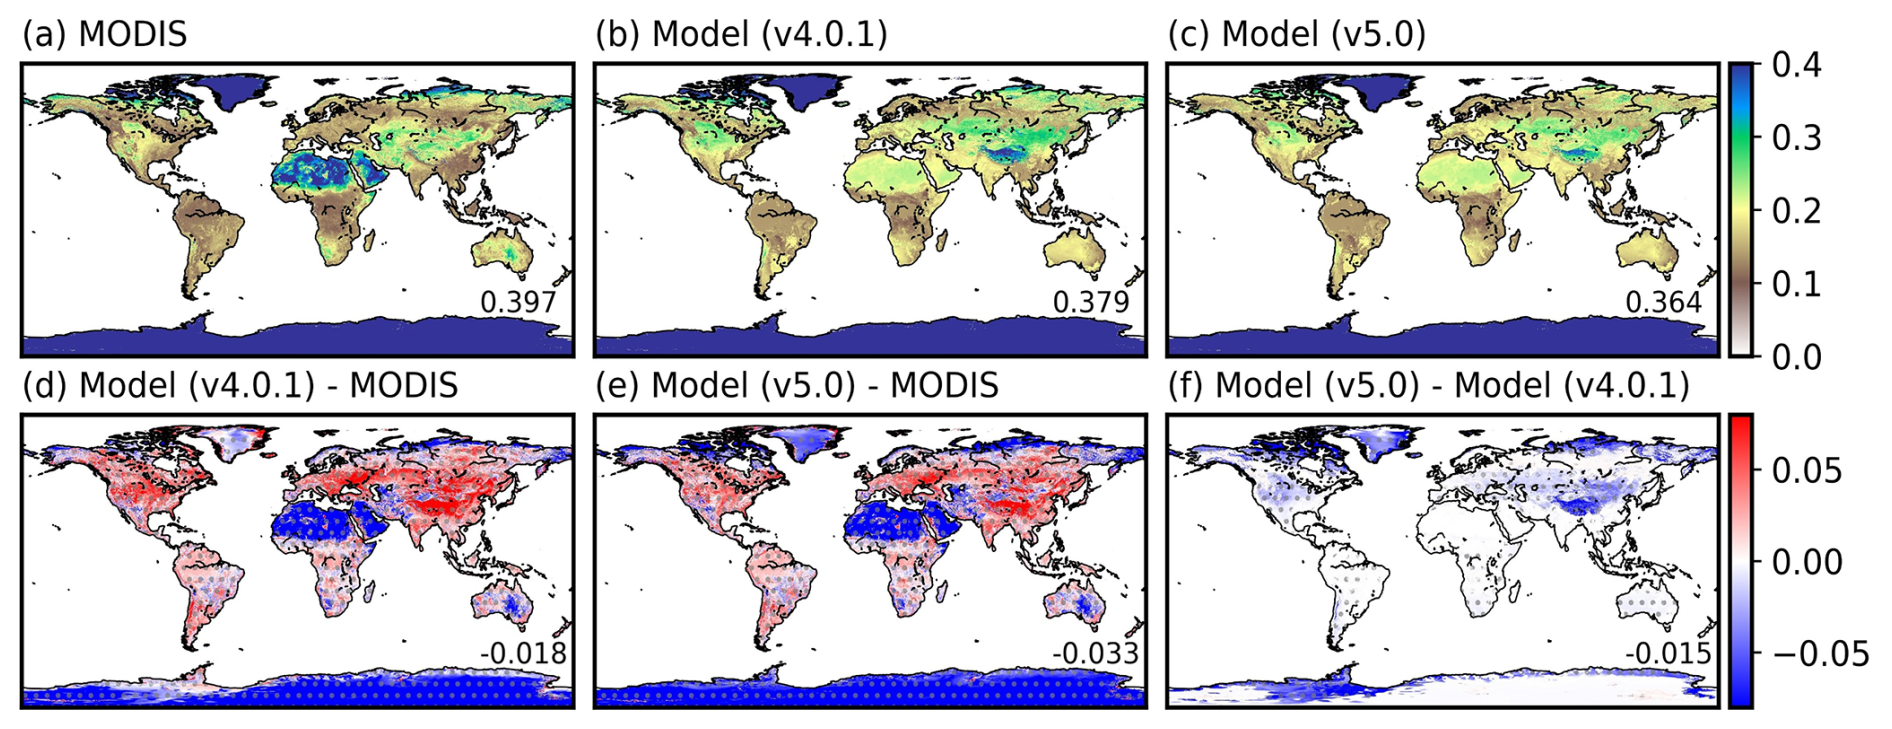
Figure 16Surface albedo comparison between MODIS and LIS/Noah-MP simulations driven by USAF forcing globally averaged during 2018–2022: (a) MODIS data, (b) LIS/Noah-MPv4.0.1 simulation, (c) LIS/Noah-MPv5.0 simulation, (d) LIS/Noah-MPv4.0.1 biases (model minus MODIS), (e) LIS/Noah-MPv5.0 biases (model minus MODIS), and (f) differences between LIS/Noah-MPv5.0 and LIS/Noah-MPv4.0.1 simulations. Grids with statistically significant differences (p<0.05) are shown with gray dots in panels (d)–(f). The statistical significance over each grid is computed using daily time series and the t-test method. The global mean value is also provided in the lower right of each panel. See Fig. S7 for seasonal plots.
The CONUS-wide regional evaluation between MODIS and LIS/Noah-MP simulations driven by the NLDAS-2 forcing also reveals a consistently high bias in surface albedo in LIS/Noah-MPv4.0.1 across the CONUS, except in some parts of southwest US (Fig. 17), with a CONUS mean bias of 0.031. LIS/Noah-MPv5.0 effectively reduces the mean albedo bias to 0.023 due to improved snow cover simulations (Figs. 15f and 17f). The remaining albedo overestimates in the western US is partially due to the snow cover bias (Fig. 15e) and snow albedo bias (He et al., 2019; Abolafia-Rosenzweig et al., 2022b). The albedo overestimates in the rest of CONUS may be related to the model uncertainty in background soil and vegetation albedo (see Sect. 5 for discussion).
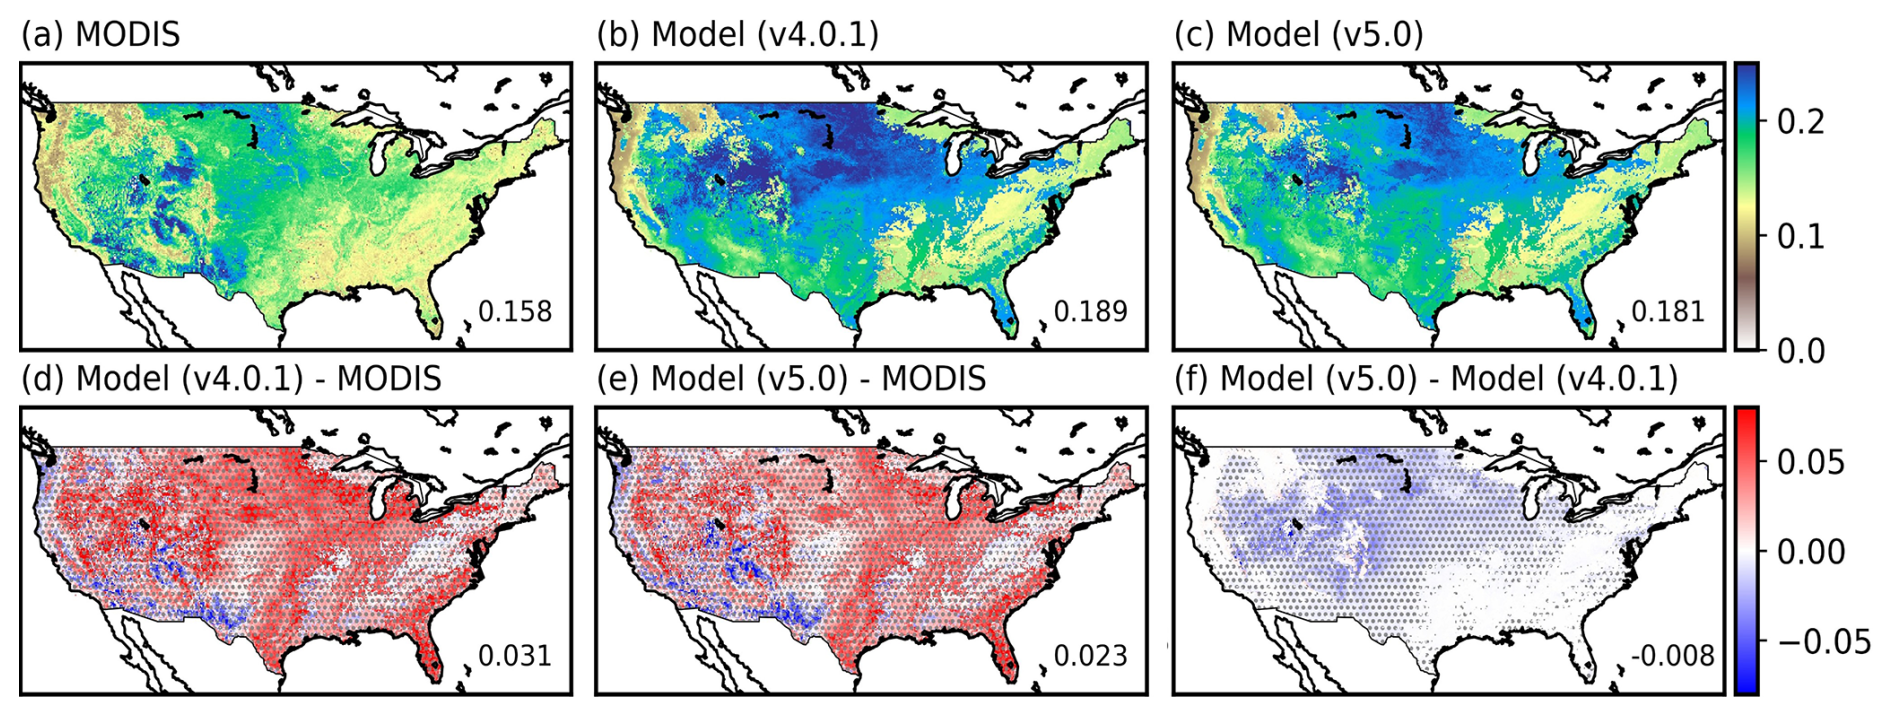
Figure 17Same as Fig. 16, but for evaluation of LIS/Noah-MP simulations driven by the NLDAS-2 forcing over the CONUS averaged during 2018–2022.
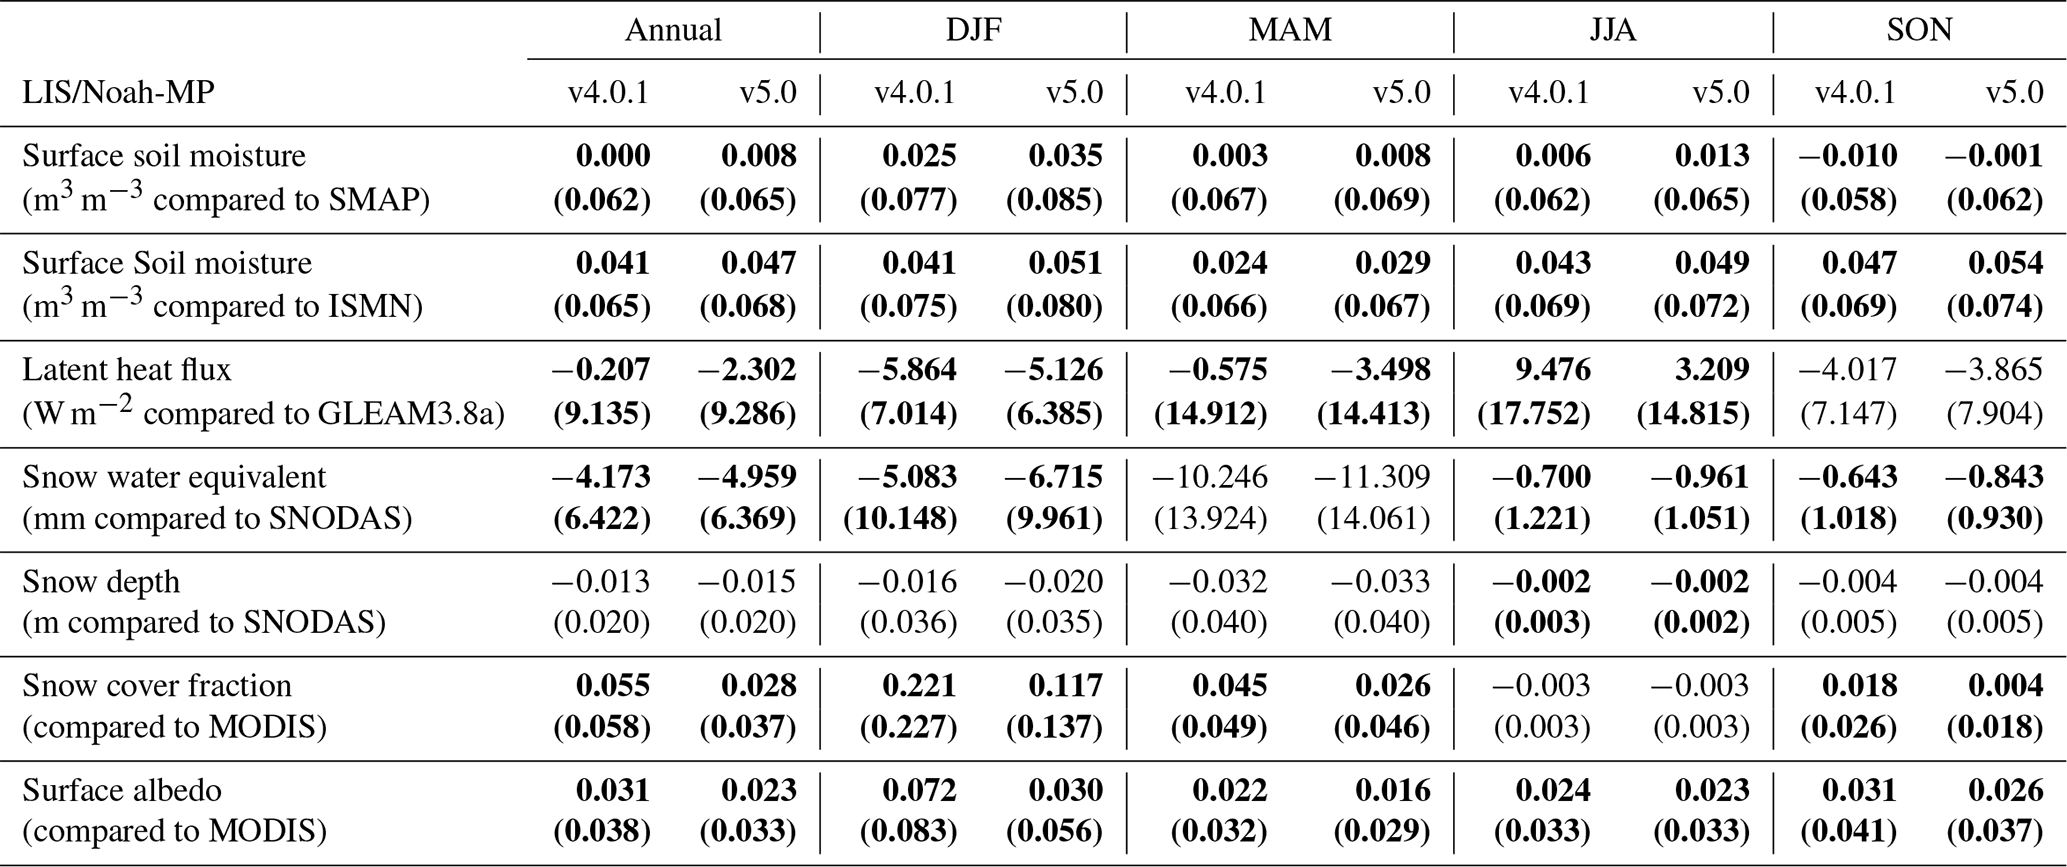
To summarize the evaluation metrics for all the investigated variables from both model simulations in this study, we adopted the International Land Model Benchmarking (ILAMBv2.7.2; Collier et al., 2018) package and applied it to our model simulations and reference datasets. Overall, the result (Fig. 18) shows that LIS/Noah-MPv5.0 outperforms or is similar to LIS/Noah-MPv4.0.1 globally in the key land surface variables evaluated in this study, except for slight degradation in simulated surface soil moisture and SWE. In addition, we summarized all the bias values for different seasons and regions for both model simulations in Tables 1 and 2. The slightly degraded surface soil moisture simulation in LIS/Noah-MPv5.0 mainly comes from the degraded performance over northern and southern mid-latitudes, while the slightly degraded SWE in LIS/Noah-MPv5.0 is mainly caused by the degraded performance in the northern high-latitudes (Table 1). The soil moisture and SWE differences between the two model simulations are primarily caused by the model updates in vegetation processes (added canopy heat storage and bug fix of vegetation fraction scaling) and improved snow cover parameters.
Table 1Model evaluation metrics for LIS/Noah-MPv4.0.1 and LIS/Noah-MPv5.0 simulations driven by the USAF forcing averaged during 2018–2022 on the global and regional scale. The values are the annual mean model bias (LIS/Noah-MP simulations minus reference datasets). The statistically significant difference between LIS/Noah-MP v4.0.1 and LIS/Noah-MPv5.0 simulations (p<0.05 using a t-test for daily time series) are marked as bold font. The values in the parentheses are the annual mean absolute model biases. The seasonal biases are shown in Tables S1–S4.
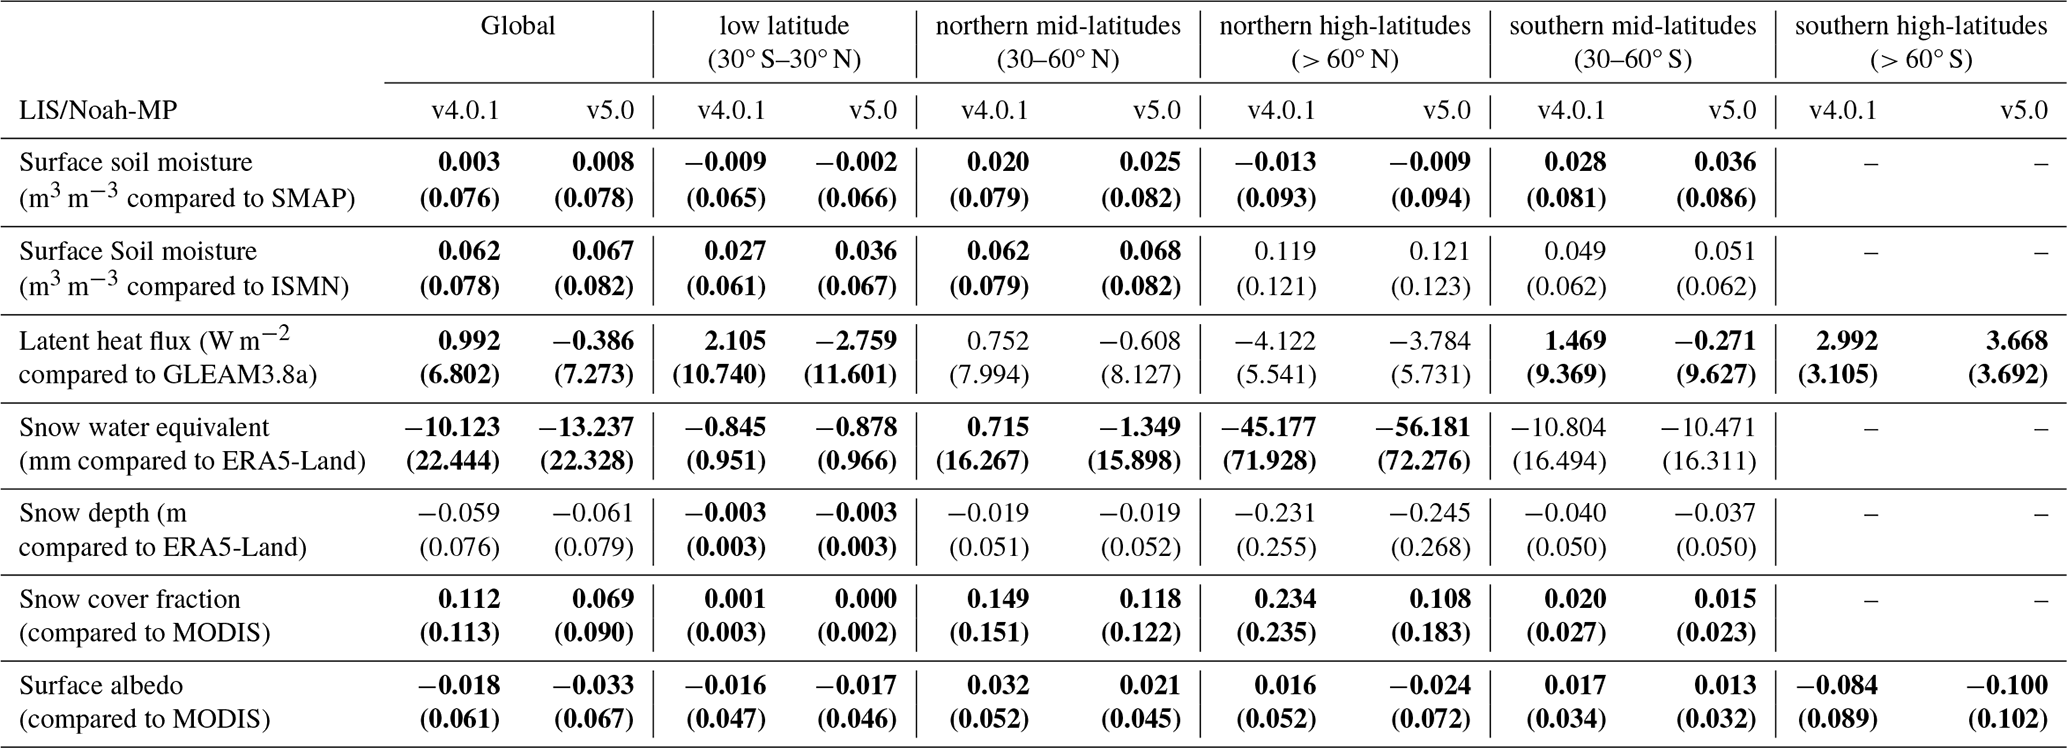
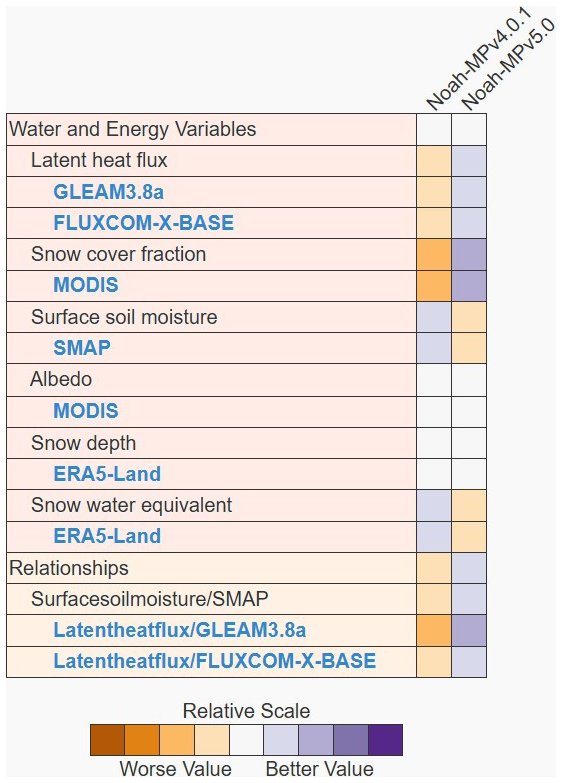
Figure 18Scorecard-type comparison for LIS/Noah-MPv4.0.1 and LIS/Noah-MPv5.0 model performance in simulating key surface variables evaluated against the reference datasets used in this study based on the ILAMB tool.
The modeled LH and soil moisture assessments in Sect. 4 indicate a slightly higher soil moisture but lower LH over some mid-latitude (e.g., the eastern US) and the tropics in LIS/Noah-MPv5.0 compared to LIS/Noah-MPv4.0.1. To further understand this seemingly conflicting model differences, we conducted a series of additional analyses.
First, to quantify the uncertainty of reference ET data products, we conducted additional model evaluations using the FLUXCOM-X-BASE (Nelson et al., 2024) data. The results indicate large inconsistency between the FLUXCOM-X-BASE and GLEAM data, where the model biases reverse the signs across many global regions particularly in the low-latitudes (Fig. S9). For the CONUS, the bias sign also reverses in the northeastern US and many parts of the western US (Fig. S10). Previous studies (Nelson et al., 2024) showed that FLUXCOM-X-BASE has consistently lower ET in evergreen tropics as well as the temperate and high latitudes of the Northern Hemisphere than GLEAM, whereas FLUXCOM-X-BASE has higher ET in the semiarid and arid ecosystems of the lower and middle latitudes. This is consistent with previous studies (e.g., Abolafia-Rosenzweig et al., 2021a) finding large disagreements across ET reference datasets in general. These results suggest that the modeled ET in this study falls into the range of observational uncertainty over many global regions and the uncertainty in ET reference data products can confound model assessments which should be accounted for in future studies.
Table 2Model evaluation metrics for LIS/Noah-MPv4.0.1 and LIS/Noah-MPv5.0 simulations driven by the NLDAS-2 forcing averaged over the CONUS during 2018–2022. The values are the mean model bias (LIS/Noah-MP simulations minus reference datasets). The statistically significant difference between LIS/Noah-MP v4.0.1 and LIS/Noah-MPv5.0 simulations (p<0.05 using a t-test for daily time series) are marked as bold font. The values in the parentheses are the mean absolute model biases.
Then, to assess the role of soil temperature change, we further analyzed the soil temperature differences between the two model simulations, which indicates a consistently higher soil temperature in LIS/Noah-MPv5.0 than LIS/Noah-MPv4.0 across all soil layers over the majority of the globe except for polar regions (Figs. S11–12), which hence is not a driver but rather a result of the decrease in LH.
Furthermore, our additional analyses indicate that the bug fix of vegetation fraction scaling in LIS/Noah-MPv5.0 dominates the impact on the ET (and LH) reduction, with minor opposite effects from the added canopy heat storage term which generally increases sensible and latent heat fluxes (Fig. S19). Furthermore, the LH changes tend to be larger over regions with higher vegetation fraction (Fig. S20), which underlines potentially large and heterogeneous impacts in response to this.
In addition, we quantified the differences in each of the modeled ET components between the two model versions and their biases by comparing with the GLEAM data. Using the CONUS region as an example, the results show that the lower LH in LIS/Noah-MPv5.0 over the eastern US is mainly caused by the lower plant transpiration and soil evaporation compared to LIS/Noah-MPv4.0.1, which outweigh the higher canopy-intercepted water evaporation (Figs. S13–S15). The slightly lower LH in LIS/Noah-MPv5.0 over the western US is dominated by the lower plant transpiration and canopy-intercepted water evaporation, which outweigh the higher soil evaporation. Overall, the generally opposite patterns in the western and eastern US in these model differences in each ET component likely reflect the spatially heterogeneous impacts across water limited vs. non-water limited regimes, which needs further investigation. These patterns are generally consistent throughout the seasons (Figs. S16–S18), with stronger signals for plant transpiration and soil evaporation in spring and summer due to warmer temperature and higher solar radiation. Thus, the slightly higher soil moisture appears to be a result of the lower total ET in LIS/Noah-MPv5.0 compared to LIS/Noah-MPv4.0.1. Besides, the slightly higher soil moisture in LIS/Noah-MPv5.0 is also partially contributed by the updated snow cover parameters in LIS/Noah-MPv5.0 that lead to enhanced snow melting and hence increased soil moisture in winter, spring, and early summer.
For snowpack and surface albedo, LIS/Noah-MPv5.0 generally shows a lower SWE than LIS/Noah-MPv4.0.1 particularly during ablation periods, mainly due to the updated snow cover parameters in LIS/Noah-MPv5.0 resulting in lower snow cover and hence reduced surface albedo and subsequently enhanced melting. This triggers positive surface albedo feedback.
The evaluation of global and regional benchmark simulations (Sect. 4) reveals several important Noah-MP model uncertainties and deficiencies, which calls for future model improvements.
First, the model biases in soil moisture and LH (Sect. 4.1 and 4.2) partially reflect the inadequate representation of plant hydraulics and root schemes and/or too shallow soil column configuration (e.g., in the Amazon), which have also been highlighted by a few previous studies (e.g., Niu et al., 2020; Li et al., 2021; Bieri et al., 2025). Recently, Li et al. (2021) developed a new whole-plant hydraulics scheme for Noah-MP with observation-constrained parameters (Sun et al., 2024), which largely improves simulations of ET and terrestrial water storage (TWS) compared to the default soil hydraulics scheme in Noah-MP. Other studies (e.g., Niu et al., 2020; Bieri et al., 2025) developed dynamic root uptake schemes in Noah-MP that improve modeled soil moisture, ET, and TWS. These model updates have not been included in the community Noah-MPv5.0, which needs to be done in the future. Another possible model deficiency that could result in the LH bias is the canopy turbulence scheme. Noah-MP uses the Monin–Obukhov (M–O) similarity theory to compute momentum and heat exchange coefficients above and through the canopy, which however does not account for the canopy-induced turbulence in the roughness sublayer (RSL) and hence fails above and within dense forests (Bonan et al., 2018). Abolafia-Rosenzweig et al. (2021b) implemented and evaluated a unified RSL turbulence scheme throughout the canopy in an earlier Noah-MP version, which demonstrates the potential of improving modeled surface heat fluxes. We are currently working on a comprehensive assessment of this RSL canopy turbulence scheme in Noah-MPv5.0 across global FLUXNET sites. However, we note that the satellite soil moisture data has large uncertainties over dense forests. In addition, the input soil texture data could also impact the modeled soil moisture and hence ET. Li et al. (2024) recently developed a global 1 km high-quality datasets for key land surface parameters (including soil texture), and we plan to test the effect of using this new dataset in Noah-MP simulations in our next step.
Second, the model biases in snowpack, including SWE, snow depth, and snow cover, reveal inadequate treatments of snow physics. For example, the SWE underestimates over midlatitude mountains (e.g., the Himalayas and western US high mountains) could be caused by the snow ablation bias in the model, in addition to the precipitation and temperature forcing uncertainty (Sect. 4.3). He et al. (2021) found that Noah-MP tends to melt snow faster than observations in some western US mountain areas, likely due to wind and solar radiation forcing biases and/or model deficiencies in above-snowpack turbulence, canopy radiative transfer, and snow albedo. Recently, Lin et al. (2025) coupled Noah-MPv5.0 with a widely used physical snow albedo scheme, SNICAR-ADv3 (Flanner et al., 2021; He et al., 2024a), and found improved snow albedo relative to the default semi-empirical snow albedo scheme in Noah-MP. This snow albedo physics update will be included in the next Noah-MP major version release. The snow depth bias is not only driven by the SWE bias but also by uncertainty in snow compaction processes. A recent study (Abolafia-Rosenzweig et al., 2024b) enhanced the Noah-MP snow compaction parameterization constrained by in-situ measurements across ∼ 800 SNOTEL sites in the western US, which is currently being transferred to the Noah-MPv5.0 (https://github.com/NCAR/noahmp/pull/148; last access: 24 November 2024). In addition, a new flexible framework was recently developed to couple the LSMs (including Noah-MPv4.0.1) in LIS with a physical snow model, Crocus, which shows promising improvements in modeling snow depth and SWE (Navari et al., 2024). The systematically overestimated snow cover fraction in Noah-MP is a long-standing model problem, which has been investigated by several studies over different mountain regions (He et al., 2019; Jiang et al., 2020; Zhou et al., 2023). A number of improvements in the model snow cover parameterization have been proposed for the Tibetan Plateau (Jiang et al., 2020; Zhou et al., 2023) and the western US (Abolafia-Rosenzweig et al., 2025). These solutions, however, need to be tested for global applications.
Third, the model biases in surface albedo, particularly over the Sahara Desert and glaciers, suggest possible deficiencies in background desert soil albedo and glacier albedo. Currently, Noah-MPv5.0 assumes a uniform medium soil color everywhere, whereas using a spatially-varying soil color map (Lawrence and Chase, 2007) tends to reduce Noah-MP surface albedo particularly over the desert (Michael Barlage, personal communication, 2024), which will be tested in NoahMPv5.0 together with the aforementioned Li et al. (2024) global 1 km input datasets. To improve glacier modeling, Eidhammer et al. (2021) coupled the Crocus snow/ice model with Noah-MP within the WRF-Hydro framework, which reproduces the observed glacier surface albedo and mass balance in Norwegian glaciers. Future Noah-MP model improvements need to also focus on glacier regions, which were less studied in previous Noah-MP applications. In addition, vegetation albedo (and canopy radiative transfer) may also contribute to the surface albedo biases in Noah-MP, which however lacks systematic assessments in the literature and hence needs more future investigations.
In this study, we integrated the refactored community Noah-MPv5.0 model with the NASA LIS system (version 7.5.2) through the GitHub submodule mechanism to streamline the synchronization, development, and maintenance of Noah-MP within LIS and to enhance the interoperability and applicability of both models. The GitHub submodule mechanism also allows for more rapid implementation of bug fixes as well as new versions of Noah-MP (such as including the new physics detailed in Sect. 5) into the LIS software framework. We systematically evaluated multi-year (2018–2022) global and regional (CONUS) LIS/Noah-MP benchmark simulations driven by the USAF and NLDAS-2 atmospheric forcing, respectively, for a set of key land surface variables. Overall, LIS/Noah-MPv5.0 outperforms or is similar to LIS/Noah-MPv4.0.1 globally in simulating the key land surface variables evaluated in this study, except for slight degradation in simulated surface soil moisture and SWE.
Specifically, both LIS/Noah-MPv4.0.1 and LIS/Noah-MPv5.0 simulations capture the spatial and seasonal distributions of observed surface and root-zone soil moisture, LH, SWE, snow depth, snow cover, and surface albedo, with similar bias patterns. For surface and root-zone soil moisture, model simulations tend to underestimate over wet soil regimes and overestimate over dry soil regimes, with slightly higher soil moisture in LIS/Noah-MPv5.0 than LIS/Noah-MPv4.0.1 across most regions. Due to the offset of model overestimates and underestimates across different regions, the global mean soil moisture biases of both models are relatively small.
For LH, the model bias patterns generally follow those of soil moisture, with the underestimated (overestimated) LH over areas with the underestimated (overestimated) soil moisture across most global regions. Although LIS/Noah-MPv5.0 has a slightly higher soil moisture than LIS/Noah-MPv4.0.1, it shows a lower LH across most non-polar regions, which reduces the global mean LH bias from 0.99 W m−2 (LIS/Noah-MPv4.0.1) to −0.39 W m−2 (LIS/Noah-MPv5.0).
For snowpack conditions, the model SWE bias patterns are dominated by the precipitation and temperature forcing uncertainties, with large SWE underestimates in the Himalayas, west Canada, and western US mountains and overestimates in most other mid-latitude and high-latitude snowpacks. The SWE biases are similar for both models, with slightly larger underestimates in LIS/Noah-MPv5.0 (global mean bias of −13.2 mm) than LIS/Noah-MPv4.0.1 (global mean bias of −10.1 mm). The model bias patterns of snow depth generally follow those of SWE, with a global mean bias of ∼ 0.06 m for both simulations. For snow cover, LIS/Noah-MPv4.0.1 has a systematic large overestimate across the globe, even over regions with underestimated SWE, which is a long-standing Noah-MP problem. LIS/Noah-MPv5.0 with updated snow cover parameters effectively reduces the snow cover overestimates globally, decreasing the global mean bias from 0.11 to 0.07.
For surface albedo, both models show widespread overestimates over most mid-latitude and high-latitude regions partially due to the snow cover overestimate, and significant underestimates in the Sahara Desert, Greenland, and Antarctica, which dominate the global mean bias. Because of the reduced snow cover, LIS/Noah-MPv5.0 shows consistently lower surface albedo than LIS/Noah-MPv4.0.1, which degrades the global mean bias from −0.018 to −0.033.
The model evaluation in this study reveals several important Noah-MP uncertainties and deficiencies and motivates future improvements in model processes/components including plant hydraulics and dynamic root uptake, canopy turbulence and interaction with snowpack, input soil texture and color data, snow cover and albedo, glacier ice, and vegetation albedo (canopy radiative transfer).
The data and scripts produced in this study is available at https://doi.org/10.5281/zenodo.14567220 (He et al., 2025). The LIS/Noah-MPv5.0 model code produced and used in this study is available at https://doi.org/10.5281/zenodo.14567645 (He et al., 2024b).
The supplement related to this article is available online at https://doi.org/10.5194/gmd-18-8439-2025-supplement.
CH, JW, and SK proposed research idea. CH performed technical coding and model coupling with help of DM. TL performed model simulations and evaluations with contribution from CH, DM, and RA. CH drafted the paper with contribution from TL, DM, RA, JW, and SK.
At least one of the (co-)authors is a member of the editorial board of Geoscientific Model Development. The peer-review process was guided by an independent editor, and the authors also have no other competing interests to declare.
Publisher's note: Copernicus Publications remains neutral with regard to jurisdictional claims made in the text, published maps, institutional affiliations, or any other geographical representation in this paper. While Copernicus Publications makes every effort to include appropriate place names, the final responsibility lies with the authors. Also, please note that this paper has not received English language copy-editing. Views expressed in the text are those of the authors and do not necessarily reflect the views of the publisher.
This study was supported by the NASA grant no. 80NSSC24K0121. The NSF National Center for Atmospheric Research (NCAR) is a major facility sponsored by the National Science Foundation (NSF). We would like to acknowledge computing support from the Casper system (https://ncar.pub/casper, last access: 24 November 2024) provided by the NSF National Center for Atmospheric Research (NCAR), sponsored by the National Science Foundation. Any opinions, findings, conclusions, or recommendations expressed in this publication are those of the authors and do not necessarily reflect the views of the National Science Foundation or NASA.
This research has been supported by the National Aeronautics and Space Administration, Goddard Space Flight Center (grant no. 80NSSC24K0121).
This paper was edited by Wolfgang Kurtz and reviewed by Vincent Fortin and one anonymous referee.
Abolafia-Rosenzweig, R., Pan, M., Zeng, J. L., and Livneh, B.: Remotely sensed ensembles of the terrestrial water budget over major global river basins: An assessment of three closure techniques, Remote Sensing of Environment, 252, 112191, https://doi.org/10.1016/j.rse.2020.112191, 2021a.
Abolafia-Rosenzweig, R., He, C., Burns, S. P., and Chen, F.: Implementation and evaluation of a unified turbulence parameterization throughout the canopy and roughness sublayer in Noah-MP Snow Simulations, J. Adv. Model. Earth Sy., 13, https://doi.org/10.1029/2021ms002665, 2021b.
Abolafia-Rosenzweig, R., He, C., and Chen, F.: Winter and spring climate explains a large portion of interannual variability and trend in western U.S. summer fire burned area, Environ. Res. Lett., 17, 054030, https://doi.org/10.1088/1748-9326/ac6886, 2022a.
Abolafia-Rosenzweig, R., He, C., McKenzie Skiles, S., Chen, F., and Gochis, D.: Evaluation and optimization of snow albedo scheme in Noah-MP land surface model using in situ spectral observations in the Colorado Rockies, J. Adv. Model. Earth Sy., 14, e2022MS003141, https://doi.org/10.1029/2022MS003141, 2022b.
Abolafia-Rosenzweig, R., He, C., Chen, F., Ikeda, K., Schneider, T., and Rasmussen, R.: High resolution forecasting of summer drought in the western United States, Water Resour. Res., 59, e2022WR033734, https://doi.org/10.1029/2022WR033734, 2023.
Abolafia-Rosenzweig, R., He, C., Chen, F., Zhang, Y., Dugger, A., Livneh, B., and Gochis, D.: Evaluating Noah-MP simulated runoff and snowpack in heavily burned Pacific-Northwest snow-dominated catchments, Journal of Geophysical Research: Atmospheres, 129, e2023JD039780, https://doi.org/10.1029/2023JD039780, 2024a.
Abolafia-Rosenzweig, R., He, C., Chen, F., and Barlage, M.: Evaluating and enhancing snow compaction process in the Noah-MP land surface model, Journal of Advances in Modeling Earth Systems, 16, e2023MS003869, https://doi.org/10.1029/2023MS003869, 2024b.
Abolafia-Rosenzweig, R., He, C., Lin, T. S., Barlage, M., and Rittger, K.: Improved cross-scale snow cover simulations by developing a scale – aware ground snow cover fraction parameterization in the Noah-MP land surface model, J. Adv. Model. Earth Sy., 17, e2024MS004704, https://doi.org/10.1029/2024MS004704, 2025.
AghaKouchak, A., Chiang, F., Huning, L.S., Love, C.A., Mallakpour, I., Mazdiyasni, O., Moftakhari, H., Papalexiou, S.M., Ragno, E., and Sadegh, M.: Climate extremes and compound hazards in a warming world, Annu. Rev. Earth Planet. Sci., 48, 519–548, https://doi.org/10.1146/annurev-earth-071719-055228, 2020.
Arsenault, K. R., Kumar, S. V., Geiger, J. V., Wang, S., Kemp, E., Mocko, D. M., Beaudoing, H. K., Getirana, A., Navari, M., Li, B., Jacob, J., Wegiel, J., and Peters-Lidard, C. D.: The Land surface Data Toolkit (LDT v7.2) – a data fusion environment for land data assimilation systems, Geosci. Model Dev., 11, 3605–3621, https://doi.org/10.5194/gmd-11-3605-2018, 2018.
Arsenault, K. R., Shukla, S., Hazra, A., Getirana, A., McNally, A., Kumar, S. V., Koster, R. D., Peters-Lidard, C. D., Zaitchik, B. F., Badr, H., Jung, H. C., Narapusetty, B., Navari, M., Wang, S., Mocko, D. M., Funk, C., Harrison, L., Husak, G. J., Adoum, A., Galu, G., Magadzire, T., Roningen, J., Shaw, M., Eylander, J., Bergaoui, K., McDonnell, R. A., and Verdin, J. P.: Better Ad- vance Warnings of Drought, B. Am. Meteorol. Soc., 101, 899–903, 2020.
Barlage, M., Chen, F., Rasmussen, R., Zhang, Z., and Miguez- Macho, G.: The importance of scale-dependent groundwa- ter processes in land-atmosphere interactions over the cen- tral United States, Geophys. Res. Lett., 48, e2020GL092171, https://doi.org/10.1029/2020GL092171, 2021.
National Operational Hydrologic Remote Sensing Center: Snow Data Assimilation System (SNODAS) Data Products at NSIDC, G02158, Version 1, National Snow and Ice Data Center [data set], https://doi.org/10.7265/N5TB14TC, 2004.
Benson, D. O. and Dirmeyer, P. A.: The soil moisture–surface flux relationship as a factor for extreme heat predictability in subseasonal to seasonal forecasts, J. Climate, 36, 6375–6392, 2023.
Best, M. J., Pryor, M., Clark, D. B., Rooney, G. G., Essery, R. L. H., Ménard, C. B., Edwards, J. M., Hendry, M. A., Porson, A., Gedney, N., Mercado, L. M., Sitch, S., Blyth, E., Boucher, O., Cox, P. M., Grimmond, C. S. B., and Harding, R. J.: The Joint UK Land Environment Simulator (JULES), model description – Part 1: Energy and water fluxes, Geosci. Model Dev., 4, 677–699, https://doi.org/10.5194/gmd-4-677-2011, 2011.
Bieri, C. A., Dominguez, F., Miguez-Macho, G., and Fan, Y.: Implementing deep soil and dynamic root uptake in Noah-MP (v4.5): impact on Amazon dry-season transpiration, Geosci. Model Dev., 18, 3755–3779, https://doi.org/10.5194/gmd-18-3755-2025, 2025.
Blyth, E. M., Arora, V. K., Clark, D. B., Dadson, S. J., De Kauwe, M. G., Lawrence, D. M., Melton, J. R., Pongratz, J., Turton, R. H., Yoshimura, K., and Yuan, H.: Advances in land surface modelling, Curr. Clim. Change Rep., 7, 45–71, https://doi.org/10.1007/s40641-021-00171-5, 2021
Bonan, G. B.: A land surface model (LSM version 1.0) for ecological, hydrological, and atmospheric studies: Technical description and user's guide, NCAR Tech. Note, NCAR/TN-417+STR, Natl. Cent. for Atmos. Res., Boulder, Colorado, 150 pp., https://doi.org/10.5065/D6DF6P5X, 1996.
Bonan, G. B., Patton, E. G., Harman, I. N., Oleson, K. W., Finnigan, J. J., Lu, Y., and Burakowski, E. A.: Modeling canopy-induced turbulence in the Earth system: a unified parameterization of turbulent exchange within plant canopies and the roughness sublayer (CLM-ml v0), Geosci. Model Dev., 11, 1467–1496, https://doi.org/10.5194/gmd-11-1467-2018, 2018.
Brutsaert, W.: Evaporation into the Atmosphere: Theory, History, and Applications, Springer, Dordrecht, 299 pp., https://doi.org/10.1007/978-94-017-1497-6, 1982.
Chen, F., Janjić, Z., and Mitchell, K.:. Impact of atmospheric surface-layer parameterizations in the new land-surface scheme of the NCEP mesoscale Eta model, Boundary Layer Meteorol., 85, 391–421, 1997.
Collier, N., Hoffman, F. M., Lawrence, D. M., Keppel‐Aleks, G., Koven, C. D., Riley, W. J., Mu, M., and Randerson, J. T.: The International Land Model Benchmarking (ILAMB) system: design, theory, and implementation, J. Adv. Model. Earth Sy., 10, 2731–2754, https://doi.org/10.1029/2018MS001354, 2018.
Dickinson, R. E., Henderson-Sellers, A., and Kennedy, P. J.: Biosphere-Atmosphere Transfer Scheme (BATS) version 1e as coupled to the NCAR Community Climate Model, NCAR Tech. Note, NCAR/TN-387+STR, Natl. Cent. for Atmos. Res., Boulder, Colorado, 80 pp., https://doi.org/10.5065/D67W6959, 1993.
Dorigo, W., Himmelbauer, I., Aberer, D., Schremmer, L., Petrakovic, I., Zappa, L., Preimesberger, W., Xaver, A., Annor, F., Ardö, J., Baldocchi, D., Bitelli, M., Blöschl, G., Bogena, H., Brocca, L., Calvet, J.-C., Camarero, J. J., Capello, G., Choi, M., Cosh, M. C., van de Giesen, N., Hajdu, I., Ikonen, J., Jensen, K. H., Kanniah, K. D., de Kat, I., Kirchengast, G., Kumar Rai, P., Kyrouac, J., Larson, K., Liu, S., Loew, A., Moghaddam, M., Martínez Fernández, J., Mattar Bader, C., Morbidelli, R., Musial, J. P., Osenga, E., Palecki, M. A., Pellarin, T., Petropoulos, G. P., Pfeil, I., Powers, J., Robock, A., Rüdiger, C., Rummel, U., Strobel, M., Su, Z., Sullivan, R., Tagesson, T., Varlagin, A., Vreugdenhil, M., Walker, J., Wen, J., Wenger, F., Wigneron, J. P., Woods, M., Yang, K., Zeng, Y., Zhang, X., Zreda, M., Dietrich, S., Gruber, A., van Oevelen, P., Wagner, W., Scipal, K., Drusch, M., and Sabia, R.: The International Soil Moisture Network: serving Earth system science for over a decade, Hydrol. Earth Syst. Sci., 25, 5749–5804, https://doi.org/10.5194/hess-25-5749-2021, 2021.
Eidhammer, T., Booth, A., Decker, S., Li, L., Barlage, M., Gochis, D., Rasmussen, R., Melvold, K., Nesje, A., and Sobolowski, S.: Mass balance and hydrological modeling of the Hardangerjøkulen ice cap in south-central Norway, Hydrol. Earth Syst. Sci., 25, 4275–4297, https://doi.org/10.5194/hess-25-4275-2021, 2021.
Ek, M. B., Mitchell, K. E., Lin, Y., Rogers, E., Grunmann, P., Koren, V., Gayno, G., and Tarpley, J. D.: Implementation of Noah land surface model advances in the National Centers for Environmental Prediction operational mesoscale Eta model, Journal of Geophysical Research: Atmospheres, 108, https://doi.org/10.1029/2002JD003296, 2003.
Eylander, J., Kumar, S., Peters-Lidard, C., Lewiston, T., Franks, C., and Wegiel, J.: History and Development of the USAF Agriculture Meteorology Modeling System and Resulting USAF–NASA Strategic Partnership, Weather and Forecasting, 37, 2293–2312, https://doi.org/10.1175/WAF-D-22-0064.1, 2022.
FAO: The digitized soil map of the world, World Soil Resource Rep. 67, FAO, Rome, https://www.fao.org/soils-portal/data-hub/soil-maps-and-databases/faounesco-soil-map-of-the-world/en/ (last access: 20 October 2025), 1991.
Fisher, R. A. and Koven, C. D.: Perspectives on the future of land surface models and the challenges of representing complex terrestrial systems, Journal of Advances in Modeling Earth Systems, 12, e2018MS001453, https://doi.org/10.1029/2018MS001453, 2020.
Flanner, M. G., Arnheim, J. B., Cook, J. M., Dang, C., He, C., Huang, X., Singh, D., Skiles, S. M., Whicker, C. A., and Zender, C. S.: SNICAR-ADv3: a community tool for modeling spectral snow albedo, Geosci. Model Dev., 14, 7673–7704, https://doi.org/10.5194/gmd-14-7673-2021, 2021.
Hall, D. K. and Riggs, G. A.: MODIS/Terra Snow Cover Daily L3 Global 500m Grid, Version 6. Boulder, Colorado USA, NASA National Snow and Ice Data Center Distributed Active Archive Center [data set], https://doi.org/10.5067/MODIS/MOD10A1.006, 2016.
Haverd, V., Smith, B., Nieradzik, L., Briggs, P. R., Woodgate, W., Trudinger, C. M., Canadell, J. G., and Cuntz, M.: A new version of the CABLE land surface model (Subversion revision r4601) incorporating land use and land cover change, woody vegetation demography, and a novel optimisation-based approach to plant coordination of photosynthesis, Geosci. Model Dev., 11, 2995–3026, https://doi.org/10.5194/gmd-11-2995-2018, 2018.
Hazra, A., McNally, A., Slinski, K., Arsenault, K. R., Shukla, S., Getirana, A., Jacob, J. P., Sarmiento, D. P., Peters-Lidard, C., Kumar, S. V., and Koster, R. D.: NASA's NMME- based S2S hydrologic forecast system for food insecurity early warning in southern Africa, J. Hydrol., 617, 129005, https://doi.org/10.1016/j.jhydrol.2022.129005, 2023.
He, C., Chen, F., Barlage, M., Liu, C., Newman, A., Tang, W., Ikeda, K., and Rasmussen, R.: Can convection-permitting modeling provide decent precipitation for offline high-resolution snowpack simulations over mountains, J. Geophys. Res.-Atmos., 124, 12631–12654, https://doi.org/10.1029/2019JD030823, 2019.
He, C., Chen, F., Abolafia-Rosenzweig, R., Ikeda, K., Liu, C., and Rasmussen, R.: What causes the unobserved early-spring snowpack ablation in convection-permitting WRF modeling over Utah mountains?, J. Geophys. Res.-Atmos, 126, e2021JD035284, https://doi.org/10.1029/2021JD035284, 2021.
He, C., Chen, F., Barlage, M., Yang, Z. L., Wegiel, J. W., Niu, G. Y., Gochis, D., Mocko, D. M., Abolafia-Rosenzweig, R., Zhang, Z., Lin, T. S., Valayamkunnath, P., Ek, M., and Niyogi, D.: Enhancing the community Noah-MP land model capabilities for Earth sciences and applications, Bulletin of the American Meteorological Society, 104, E2023–E2029, https://doi.org/10.1175/BAMS-D-23-0249.1, 2023a.
He, C., Valayamkunnath, P., Barlage, M., Chen, F., Gochis, D., Cabell, R., Schneider, T., Rasmussen, R., Niu, G.-Y., Yang, Z.-L., Niyogi, D., and Ek, M.: Modernizing the open-source community Noah with multi-parameterization options (Noah-MP) land surface model (version 5.0) with enhanced modularity, interoperability, and applicability, Geosci. Model Dev., 16, 5131–5151, https://doi.org/10.5194/gmd-16-5131-2023, 2023b.
He, C., Valayamkunnath, P., Barlage, M., Chen, F., Gochis, D., Cabell, R., Schneider, T., Rasmussen, R., Niu, G.-Y., Yang, Z.-L., Niyogi, D., and Ek, M.: The Community Noah-MP Land Surface Modeling System Technical Description Version 5.0, (No. NCAR/TN-575+STR), https://doi.org/10.5065/ew8g-yr95, 2023c.
He, C., Flanner, M., Lawrence, D. M., and Gu, Y.: New features and enhancements in community land model (CLM5) snow albedo modeling: Description, sensitivity, and evaluation, Journal of Advances in Modeling Earth Systems, 16, e2023MS003861, https://doi.org/10.1029/2023MS003861, 2024a.
He, C., Lin, T.-S., and Mocko, D.: LIS/Noah-MPv5.0 coupled source code, Zenodo [code], https://doi.org/10.5281/zenodo.14567646, 2024b.
He, C., Lin, T.-S., and Mocko, D.: LIS/Noah-MP model benchmark and evaluation dataset, Zenodo [data set], https://doi.org/10.5281/zenodo.14567220, 2025.
Jiang, Y., Chen, F., Gao, Y., He, C., Barlage, M., and Huang, W.: As- sessment of uncertainty sources in snow cover simulation in the Tibetan Plateau, J. Geophys. Res.-Atmos., 125, e2020JD032674, https://doi.org/10.1029/2020JD032674, 2020.
Jordan, R.: A one-dimensional temperature model for a snow cover, Spec. Rep. 91–16, Cold Reg. Res. and Eng. Lab., U.S. Army Corps. of Eng., Hanover, N. H., https://hdl.handle.net/11681/11677 (last access: 20 October 2025), 1991.
Kemp, E., Wegiel, J. W., Kumar, S. V., Geiger, J. V., Mocko, D. M., Jacob, J., and Peters-Lidard, C. D.: A NASA-Air Force precipitation analysis for near-real-time Ooerations, J. Hydrometeorol., 23, 965–989, https://doi.org/10.1175/JHM-D-21-0228.1, 2022.
Koster, R. D. and G. K. Walker: Interactive Vegetation Phenology, Soil Moisture, and Monthly Temperature Forecasts, J. Hydrometeorol., 16, 1456–1465, 2015.
Kumar, S. V., Peters-Lidard, C. D., Tian, Y., Houser, P. R., Geiger, J., Olden, S., Lighty, L., Eastman, J. L., Doty, B., Dirmeyer, P., Adams, J., Mitchell, K., Wood, E. F., and Sheffield, J.: Land Information System – An interoperable framework for high resolution land surface modeling, Environ. Modeling & Software, 21, 1402–1415, https://doi.org/10.1016/j.envsoft.2005.07.004, 2006.
Kumar, S. V., Reichle, R. H., Peters-Lidard, C. D., Koster, R. D., Zhan, X., Crow, W. T., Eylander, J. B., and Houser, P. R.: A land surface data assimilation framework using the land information system: Description and applications, Advances in Water Resources, 31, 1419–1432, https://doi.org/10.1016/j.advwatres.2008.01.013, 2008a.
Kumar, S. V., Peters-Lidard, C. D., Eastman, J. L., and Tao, W.-K.: An integrated high resolution hydrometeorological modeling testbed using LIS and WRF, Environ. Modelling & Software, 23, 169–181, https://doi.org/10.1016/j.envsoft.2007.05.012, 2008b.
Kumar, S. V., Peters-Lidard, C. D., Santanello, J., Harrison, K., Liu, Y., and Shaw, M.: Land surface Verification Toolkit (LVT) – a generalized framework for land surface model evaluation, Geosci. Model Dev., 5, 869–886, https://doi.org/10.5194/gmd-5-869-2012, 2012.
Kumar, S. V., Zaitchik, B. F., Peters-Lidard, C. D., Rodell, M., Reichle, R., Li, B., Jasinski, M., Mocko, D., Getirana, A., De Lannoy, G., Cosh, M. H., Hain, C. R., Anderson, M., Arsenault, K. R., Xia, Y., and Ek, M.: Assimilation of gridded GRACE terrestrial water storage estimates in the North American Land Data Assimilation System, Journal of Hydrometeorology, 17, 1951–1972, https://doi.org/10.1175/JHM-D-15-0157.1, 2016.
Kumar, S. V., M. Mocko, D., Wang, S., Peters-Lidard, C. D., and Borak, J.: Assimilation of remotely sensed Leaf Area Index into the Noah-MP land surface model: Impacts on water and carbon fluxes and states over the Continental U.S, Journal of Hydrometeorology, 20, 1359–1377, https://doi.org/10.1175/jhm-d-18-0237.1, 2019.
Kumar, S. V., Mocko, D. M., Vuyovich, C., and Peters-Lidard, C. D.: Impact of surface albedo assimilation on snow estimation, Remote Sens., 12, 645, https://doi.org/10.3390/rs12040645, 2020.
Kumar, S. V., Holmes, T., Andela, N., Dharssi, I., Vinodku- mar, Hain, C., Peters-Lidard, C., Mahanama, S. P., Arsenault, K. R., Nie, W., and Getirana, A.: The 2019–2020 Aus- tralian drought and bushfires altered the partitioning of hydrological fluxes, Geophys. Res. Lett., 48, e2020GL091411, https://doi.org/10.1029/2020GL091411, 2021.
Lawrence, P. J. and Chase, T. N.: Representing a new MODIS consistent land surface in the Community Land Model (CLM 3.0), J. Geophys. Res. Biogeosci., 112, https://doi.org/10.1029/2006JG000168, 2007.
Li, J., Chen, F., Lu, X., Gong, W., Zhang, G., and Gan, Y.: Quantifying contributions of uncertainties in physical parameterization schemes and model parameters to overall errors in Noah-MP dynamic vegetation modeling, J. Adv. Model. Earth Sy., 12, e2019MS001914, https://doi.org/10.1029/2019MS001914, 2020.
Li, L., Yang, Z. L., Matheny, A. M., Zheng, H., Swenson, S. C., Lawrence, D. M., Barlage, M., Yan, B., McDowell, N. G., and Leung, L. R.: Representation of plant hydraulics in the Noah-MP land surface model: Model development and multiscale evaluation, J. Adv. Model. Earth Sy., 13, e2020MS002214, https://doi.org/10.1029/2020MS002214, 2021.
Li, L., Bisht, G., Hao, D., and Leung, L. R.: Global 1 km land surface parameters for kilometer-scale Earth system modeling, Earth Syst. Sci. Data, 16, 2007–2032, https://doi.org/10.5194/essd-16-2007-2024, 2024.
Liang, X., Lettenmaier, D. P., Wood, E. F., and Burges, S. J.: A simple hydrologically based model of land surface water and energy fluxes for general circulation models, J. Geophys. Res., 99, 14415–14428, https://doi.org/10.1029/94JD00483, 1994.
Lin, T.-S., He, C., Abolafia-Rosenzweig, R., Chen, F., Wang, W., Barlage, M., and Gochis, D.: Improved snow albedo evolution in Noah-MP land surface model coupled with a physical snowpack radiative transfer scheme, J. Hydrometeorol., 26, 185–200, https://doi.org/10.1175/JHM-D-24-0082.1, 2025
Liu, C., Ikeda, K., Rasmussen, R., Barlage, M., Newman, A. J., Prein, A. F., Chen, F., Chen, L., Clark, M., Dai, A., Dudhia, J., Eidhammer, T., Gochis, D., Gutmann, E., Kurkute, S., Li, Y., Thompson, G., and Yates, D.: Continental- scale convection-permitting modeling of the current and fu- ture climate of North America, Clim. Dynam., 49, 71–95, https://doi.org/10.1007/s00382-016-3327-9, 2017.
Liu, Y., Peters-Lidard, C. D., Kumar, S. V., Arsenault, K. R., and Mocko, D. M.: Blending satellite-based snow depth products with in situ observations for streamflow predictions in the Upper Colorado River Basin, Water Resour. Res., 51, 1182–1202, https://doi.org/10.1002/2014WR016606, 2015.
Miralles, D. G., Holmes, T. R. H., De Jeu, R. A. M., Gash, J. H., Meesters, A. G. C. A., and Dolman, A. J.: Global land-surface evaporation estimated from satellite-based observations, Hydrol. Earth Syst. Sci., 15, 453–469, https://doi.org/10.5194/hess-15-453-2011, 2011.
Monteiro, D. and Morin, S.: Multi-decadal analysis of past winter temperature, precipitation and snow cover data in the European Alps from reanalyses, climate models and observational datasets, The Cryosphere, 17, 3617–3660, https://doi.org/10.5194/tc-17-3617-2023, 2023.
Muñoz-Sabater, J., Dutra, E., Agustí-Panareda, A., Albergel, C., Arduini, G., Balsamo, G., Boussetta, S., Choulga, M., Harrigan, S., Hersbach, H., Martens, B., Miralles, D. G., Piles, M., Rodríguez-Fernández, N. J., Zsoter, E., Buontempo, C., and Thépaut, J.-N.: ERA5-Land: a state-of-the-art global reanalysis dataset for land applications, Earth Syst. Sci. Data, 13, 4349–4383, https://doi.org/10.5194/essd-13-4349-2021, 2021.
Navari, M., Kumar, S., Wang, S., Geiger, J., Mocko, D. M., Arsenault, K. R., and Kemp, E. M.: Enabling advanced snow physics within land surface models through an interoperable model-physics coupling framework, J. Adv. Model. Earth Sy., 16, e2022MS003236, https://doi.org/10.1029/2022MS003236, 2024.
Nelson, J. A., Walther, S., Gans, F., Kraft, B., Weber, U., Novick, K., Buchmann, N., Migliavacca, M., Wohlfahrt, G., Šigut, L., Ibrom, A., Papale, D., Göckede, M., Duveiller, G., Knohl, A., Hörtnagl, L., Scott, R. L., Dušek, J., Zhang, W., Hamdi, Z. M., Reichstein, M., Aranda-Barranco, S., Ardö, J., Op de Beeck, M., Billesbach, D., Bowling, D., Bracho, R., Brümmer, C., Camps-Valls, G., Chen, S., Cleverly, J. R., Desai, A., Dong, G., El-Madany, T. S., Euskirchen, E. S., Feigenwinter, I., Galvagno, M., Gerosa, G. A., Gielen, B., Goded, I., Goslee, S., Gough, C. M., Heinesch, B., Ichii, K., Jackowicz-Korczynski, M. A., Klosterhalfen, A., Knox, S., Kobayashi, H., Kohonen, K.-M., Korkiakoski, M., Mammarella, I., Gharun, M., Marzuoli, R., Matamala, R., Metzger, S., Montagnani, L., Nicolini, G., O'Halloran, T., Ourcival, J.-M., Peichl, M., Pendall, E., Ruiz Reverter, B., Roland, M., Sabbatini, S., Sachs, T., Schmidt, M., Schwalm, C. R., Shekhar, A., Silberstein, R., Silveira, M. L., Spano, D., Tagesson, T., Tramontana, G., Trotta, C., Turco, F., Vesala, T., Vincke, C., Vitale, D., Vivoni, E. R., Wang, Y., Woodgate, W., Yepez, E. A., Zhang, J., Zona, D., and Jung, M.: X-BASE: the first terrestrial carbon and water flux products from an extended data-driven scaling framework, FLUXCOM-X, Biogeosciences, 21, 5079–5115, https://doi.org/10.5194/bg-21-5079-2024, 2024.
Nie, W., Kumar, S. V., Getirana, A., Zhao, L., Wrzesien, M., Konapala, G., Ahmad, S., Locke, K., Holmes, T., Loomis, B., and Rodell, M.: Nonstationarity in the global terrestrial water cycle and its interlinkages in the Anthropocene, P. Natl. Acad. Sci. USA, 121, e2403707121, https://doi.org/10.1073/pnas.2403707121, 2024
Niu, G.-Y. and Yang, Z.-L.: The effects of canopy processes on snow surface energy and mass balances, J. Geophys. Res.-Atmos., 109, D23111, https://doi.org/10.1029/2004JD004884, 2004.
Niu, G.-Y. and Yang, Z.-L.: Effects of frozen soil on snowmelt runoff and soil water storage at a continental scale, J. Hydrometeorol., 7, 937–952, https://doi.org/10.1175/JHM538.1, 2006.
Niu, G. Y., Yang, Z. L., Mitchell, K. E., Chen, F., Ek, M. B., Barlage, M., Kumar, A., Manning, K., Niyogi, D., Rosero, E., Tewari, M., and Xia, Y.: The community Noah land surface model with multiparameterization options (Noah-MP): 1. Model description and evaluation with local-scale measurements, J. Geophys. Res.-Atmos., 116, D12109, https://doi.org/10.1029/2010JD015139, 2011.
Niu, G. Y., Fang, Y. H., Chang, L. L., Jin, J., Yuan, H., and Zeng, X.: Enhancing the Noah-MP ecosystem response to droughts with an explicit representation of plant water storage supplied by dynamic root water uptake, J. Adv. Model. Earth Sy., 12, e2020MS002062, https://doi.org/10.1029/2020MS002062, 2020.
O'Neill, P. E., Chan, S., Njoku, E. G., Jackson, T., Bindlish, R., and Chaubell, J.: SMAP L3 Radiometer Global Daily 36 km EASE-Grid Soil Moisture. (SPL3SMP, Version 8), Boulder, Colorado USA. NASA National Snow and Ice Data Center Distributed Active Archive Center [data set], https://doi.org/10.5067/OMHVSRGFX38O, 2021.
Oleson, K., Dai, Y., Bonan, B., Bosilovichm, M., Dickinson, R., Dirmeyer, P., Hoffman, F., Houser, P., Levis, S., Niu, G. Y., Thornton, P., Vertenstein, M., Yang, Z. L., and Zeng, X.: Technical description of the Community Land Model (CLM), NCAR Tech. Note, NCAR/TN-461+STR, Natl. Cent. for Atmos. Res., Boulder, Colo., 174 pp., https://doi.org/10.5065/D6N877R0, 2004.
Peters-Lidard, C. D., Houser, P. R., Tian, Y., Kumar, S. V., Geiger, J., Olden, S., Lighty, L., Doty, B., Dirmeyer, P., Adams, J., Mitchell, K., Wood, E. F., and Sheffield, J.: High-performance Earth system modeling with NASA/GSFC's Land Information System, Innovations in Systems and Software Engineering, 3, 157–165, https://doi.org/10.1007/s11334-007-0028-x, 2007.
Rasmussen, R., Chen, F., Liu, C., Ikeda, K., Prein, A., Kim, J.-H., Schneider, T., Dai, A., Gochis, D., Dugger, A., Zhang, Y., Jaye, A., Dudhia, J., He, C., Harrold, M., Xue, L., Chen, S., New- man, A., Dougherty, E., Abolafia-Rosenzweig, R., Lybarger, N., Viger, R., Lesmes, D. P., Skalak, K., Brakebill, J. W., Clline, D., Dunne, K., Rasmussen, K., and Miguez-Macho, G.: CONUS404: The NCAR-USGS 4-km long-term regional hydroclimate reanal- ysis over the CONUS, B. Am. Meteorol. Soc., E1382–E1408, https://doi.org/10.1175/BAMS-D-21-0326.1, 2023.
Sakaguchi, K. and Zeng, X.: Effects of soil wetness, plant litter, and under-canopy atmospheric stability on ground evaporation in the Community Land Model (CLM3.5), J. Geophys. Res.-Atmos., 114, https://doi.org/10.1029/2008JD010834, 2009.
Santanello, J. A., Kumar, S. V., Peters-Lidard, C. D., and Lawston, P. M.: Impact of soil moisture assimilation on land surface model spinup and coupled land–atmosphere prediction, J. Hydrometeorol., 17, 517–540, https://doi.org/10.1175/JHM-D-15-0072.1, 2016.
Schaake, J. C., Koren, V. I., Duan, Q. Y., Mitchell, K., and Chen, F.: Simple water balance model for estimating runoff at different spatial and temporal scales, J. Geophys. Res.-Atmos., 101, 7461–7475, https://doi.org/10.1029/95JD02892, 1996.
Schaaf, C. and Wang, Z.: MODIS/Terra+Aqua BRDF/Albedo Albedo Daily L3 Global 0.05Deg CMG V061, NASA EOSDIS Land Processes Distributed Active Archive Center [data set], https://doi.org/10.5067/MODIS/MCD43C3.061, 2021.
Sillmann, J., Thorarinsdottir, T., Keenlyside, N., Schaller, N., Alexander, L.V., Hegerl, G., Seneviratne, S. I., Vautard, R., Zhang, X., and Zwiers, F.W.: Understanding, modeling and predicting weather and climate extremes: Challenges and opportunities, Weather Clim. Extrem., 18, 65–74, https://doi.org/10.1016/j.wace.2017.10.003, 2017.
Sun, S., Li, L., Yang, Z. L., Wang, G., McDowell, N. G., Matheny, A. M., Wu, J., Xu, S., Zheng, H., Yu, M., and Wang, D.: Refining water and carbon fluxes modeling in terrestrial ecosystems via plant hydraulics integration, Agr. Forest Meteorol., 359, 110256, https://doi.org/10.1016/j.agrformet.2024.110256, 2024.
Wu, D., Peters-Lidard, C., Tao, W. K., and Petersen, W.: Evaluation of NU-WRF rainfall forecasts for IFloodS, J. Hydrometeorol., 17, 1317–1335, 2016.
Xia, Y., Mitchell, K., Ek, M., Sheffield, J., Cosgrove, B., Wood, E., Luo, L., Alonge, C., Wei, H., Meng, J., and Livneh, B.: Continental-scale water and energy flux analysis and validation for the North American Land Data Assimilation System project phase 2 (NLDAS-2): 1. Intercomparison and application of model products, J. Geophys. Res.-Atmos., 117, https://doi.org/10.1029/2011JD016048, 2012.
Xu, T., Chen, F., He, X., Barlage, M., Zhang, Z., Liu, S., and He, X.: Improve the performance of the noah-MP-crop model by jointly assimilating soil moisture and vegetation phenol- ogy data, J. Adv. Model. Earth Sy., 13, e2020MS002394, https://doi.org/10.1029/2020MS002394, 2021.
Xue, L., Doan, Q. V., Kusaka, H., He, C., and Chen, F.: Insights into urban heat island and heat waves synergies revealed by a Land-Surface-Physics-Based Downscaling method, J. Geophys. Res.-Atmos., 129, e2023JD040531, https://doi.org/10.1029/2023JD040531, 2024.
Xue, L., Doan, Q.-V., Kusaka, H., He, C., and Chen, F.: Land-Surface-Physics-Based Downscaling versus Conventional Dynamical Downscaling for High-Resolution Urban Climate Change Information: The Case Study of Two Cities, Urban Clim., 59, 102228, https://doi.org/10.1016/j.uclim.2024.102228, 2025.
Yang, Z.-L., Niu, G.-Y., Mitchell, K.E., Chen, F., Ek, M.B., Barlage, M., Longuevergne, L., Manning, K., Niyogi, D., Tewari, M., and Xia, Y.: The community Noah land surface model with multiparameterization options (Noah-MP): 2. Evaluation over global river basins, J. Geophys. Res. 116, D12110, https://doi.org/10.1029/2010JD015140, 2011.
Yen, Y. C.: Effective thermal conductivity and water vapor diffusivity of naturally compacted snow, J. Geophys. Res.-Atmos., 70, 1821–1825, https://doi.org/10.1029/JZ070i008p01821, 1965.
Zhang, Z., Li, Y., Chen, F., Harder, P., Helgason, W., Famiglietti, J., Valayamkunnath, P., He, C., and Li, Z.: Developing spring wheat in the Noah-MP land surface model (v4.4) for growing season dynamics and responses to temperature stress, Geosci. Model Dev., 16, 3809–3825, https://doi.org/10.5194/gmd-16-3809-2023, 2023.
Zhang, Z., He, C., Chen, F., Miguez-Macho, G., Liu, C., and Rasmussen, R.: US Corn Belt enhances regional precipitation recycling, P. Natl. Acad. Sci. USA, 122, e2402656121, https://doi.org/10.1073/pnas.2402656121, 2025.
Zhou, X., Ding, B., Yang, K., Pan, J., Ma, X., Zhao, L., Li, X., and Shi, J.: Reducing the Cold Bias of the WRF Model Over the Tibetan Plateau by Implementing a Snow Coverage-Topography Relationship and a Fresh Snow Albedo Scheme, J. Adv. Model. Earth Sy., 15, e2023MS003626, https://doi.org/10.1029/2023MS003626, 2023.
- Abstract
- Introduction
- Model descriptions and simulations
- Reference data for model evaluation
- Results and discussions
- Discussion on resulting differences in two LIS/Noah-MP model versions
- Implications for future model improvements
- Conclusions
- Appendix A
- Code and data availability
- Author contributions
- Competing interests
- Disclaimer
- Acknowledgements
- Financial support
- Review statement
- References
- Supplement