the Creative Commons Attribution 4.0 License.
the Creative Commons Attribution 4.0 License.
 | 10 Nov 2025
Modeling wheat development under extreme weather with WOFOST-EW v1
Jinhui Zheng
Zhenrong Du
Liujun Xiao
Xiaomeng Huang
Extreme weather events pose significant challenges to crop production, making their assessment essential for developing effective climate adaptation strategies. Process-based crop models are valuable for evaluating climate change impacts on crop yields but often struggle to simulate the effects of extreme weather accurately. To fill this knowledge gap, this study introduces WOFOST-EW v1, an enhanced version of the World Food Studies Simulation Model (WOFOST), which integrates extreme weather indices and deep learning algorithm to improve simulations of winter wheat growth under extreme conditions. Deep learning offers powerful nonlinear fitting capabilities, enabling it to capture subtle and intricate interactions between extreme weather events and crop development, thereby significantly improving simulation accuracy under extreme scenarios. We validate WOFOST-EW using phenological, yield, and extreme weather data from agricultural meteorological stations in the North China Plain. The results show that WOFOST-EW improves simulation accuracy. The RRMSE for heading and maturity decreases from 4.61 % to 3.73 % and from 4.74 % to 3.98 %, respectively (with RMSE reductions of 10.64 % and 12.86 %). The R2 value for yield simulations increases from 0.67 to 0.76. In addition, we further validate the WOFOST-EW model in years affected by extreme weather and find that, compared to the original WOFOST model (R2 ranging from 0.61 to 0.71), WOFOST-EW achieves more accurate results (R2 ranging from 0.80 to 0.86). WOFOST-EW effectively captures the impacts of extreme weather, offering a reliable tool for agricultural planning and climate adaptation. As extreme weather events become increasingly frequent, WOFOST-EW can assist decision-makers in more accurately evaluating crop yields, providing technical support for agricultural systems in the context of global climate change.
- Article
(5684 KB) - Full-text XML
-
Supplement
(1111 KB) - BibTeX
- EndNote


Climate change is one of the most important determinants of crop yield, explaining 30 %–50 % of global yield variability (Ray et al., 2015; Rezaei et al., 2018). Extreme weather events driven by climate change are increasingly frequent and have become a major factor causing fluctuations in crop yields and declines in agricultural income (Lesk et al., 2016; Lobell et al., 2011; Powell and Reinhard, 2016; Shen et al., 2022). In the future, the frequency and intensity of extreme weather events such as droughts, floods, and heatwaves are expected to rise, further stressing agricultural production (Bai et al., 2022a).
China is a major producer of wheat globally, with a wheat production of 137 million tons in 2021, accounting for 17.8 % of the world's total production (FAO, 2021). Wheat plays a crucial role globally in food security, economy, agriculture, and culture (Beyene et al., 2022; Erenstein et al., 2022; Reynolds et al., 2022). The North China Plain is the primary wheat-producing region in China, contributing to more than 50 % of the national output (Xiao et al., 2020). This region is highly vulnerable to climate change impacts (Hu et al., 2014), with the frequency of climate anomalies increasing since 1980 (Mo et al., 2017). Extreme weather events significantly affect wheat production in the North China Plain. Winter wheat, typically sown in October or November and harvested in May or June, is particularly vulnerable to drought during its growing season (Chen et al., 2018; Li et al., 2021). During winter, wheat grows slowly or remains dormant, making it less sensitive to climate change. However, in spring, it grows rapidly and becomes more sensitive to extreme weather such as drought or low temperatures (Ali et al., 2017; Shi et al., 2011). Moreover, wheat is highly susceptible to frost during the jointing and booting stages (Li et al., 2014a), with each additional day of frost causing a 4.3 %–6.7 % reduction in grain yield (Ji et al., 2017). Excessive rainfall and insufficient sunlight in May and June, often linked to flooding, diseases, and pests, further reduce both the yield and quality of wheat (Song et al., 2019).
Currently, scholars worldwide have proposed various methods to estimate crop yields. Many studies use statistical regression models to investigate the relationship between climate change and crop yields (Ai et al., 2020; Ai and Hanasaki, 2023; Dinh and Aires, 2022; Li et al., 2020a; Lu and Yang, 2021; Ringeval et al., 2021; Tao et al., 2012; Wang et al., 2022; Wei et al., 2023; Zhang et al., 2017a; Zheng and Zhang, 2025a). The main advantage of statistical models is their relatively low dependence on field calibration data, and their ability to transparently assess model uncertainty through higher coefficients of determination and narrower confidence intervals (Lobell and Burke, 2010). Current research primarily focuses on combining climate variables with yield data to develop linear regression models, in order to quantify the role of climate variables in yield variations (Li et al., 2020a; Tao et al., 2012; Wang et al., 2022; Wei et al., 2023; Zhang et al., 2017a). However, only a few studies have considered the multicollinearity characteristics of climate variables (Li et al., 2020a; Wang et al., 2022). Given the complexity of climate change impacts on crop growth, it is necessary to consider their nonlinear characteristics. Compared to linear regression models, machine learning algorithms significantly improve the accuracy of crop yield simulations (Khanal et al., 2018). Machine learning algorithms are advanced methods for exploring the relationships between climate and yield, capable of capturing hierarchical and nonlinear relationships between predictors and response variables. Numerous studies have demonstrated the effectiveness of machine learning in crop yield estimation (Boori et al., 2022; Cao et al., 2021; Han et al., 2020; Iniyan et al., 2023; Maimaitijiang et al., 2019; Ruan et al., 2022; Singh Boori et al., 2023; Sun et al., 2020; Tian et al., 2021; Torsoni et al., 2023; Wang et al., 2018, 2020). However, both statistical models such as linear regression and machine learning models focus on establishing correlations between climate and yield data, neglecting the physiological and ecological processes of crops and failing to fully consider the mechanisms of crop growth (Bai et al., 2024; Roberts et al., 2017; Xiao et al., 2024; Zhao et al., 2022).
Process-based crop models have been developed to explain the complex interactions between local environments, crop genotypes, and management practices (Chenu et al., 2017). Compared to statistical models, process-based crop models are mechanistic, flexible, and applicable (Li et al., 2024; Tang et al., 2023; Zhang et al., 2017b; Zheng and Zhang, 2023). However, most crop models are developed under relatively stable climatic conditions. The impacts of extreme weather events – such as abnormal temperature, precipitation, or drought during the crop growing season – are often oversimplified and vaguely represented in crop models, leading to inaccurate simulations under extreme climatic conditions (Bai et al., 2024; Feng et al., 2019a; Yu et al., 2025; Zheng and Zhang, 2025b). This also leads to global process-based crop models often underestimating the magnitude of crop yield losses caused by extreme heatwaves and excessive rainfall (Fu et al., 2023; Heinicke et al., 2022; Liu et al., 2020).
Given the limitations of crop models and statistical regression models, some studies have combined crop models with machine learning to achieve better yield prediction results. Li et al. (2023) improved the accuracy and reduced uncertainty in predicting corn and soybean yields under extreme weather by combining machine learning algorithms with nine global gridded crop models. Feng et al. (2019a) incorporated APSIM model outputs and extreme climate indicators into a random forest algorithm, resulting in improved model prediction accuracy. Shahhosseini et al. (2021) coupled crop model outputs with machine learning models to enhance crop yield predictions in the US corn belt. However, most previous studies simply input crop model outputs into machine learning models, overlooking some key dynamic changes in crop growth processes, especially under extreme weather events. For example, extreme heat or drought may cause wheat to head or mature earlier (Hou et al., 2024; Liu et al., 2023), and such nonlinear changes can significantly affect the process of dry matter accumulation. However, they are often overlooked in traditional machine learning frameworks. Furthermore, these methods lack accuracy and robustness in dealing with the impact of extreme weather on crop yields, failing to fully capture the effects of extreme weather on crop growth (Bai et al., 2024; Feng et al., 2019a; Yu et al., 2025; Zheng and Zhang, 2025b).
In this study, we introduce WOFOST-EW v1, an enhanced version of the WOFOST (World Food Studies Simulation Model) model that integrates extreme weather indices and the Long Short-Term Memory (LSTM) algorithm to improve simulations of winter wheat growth under extreme conditions. The main objectives of the research are (1) Calibration and validation of the WOFOST model using wheat yield and phenology data from the North China Plain for the period 1980–2020; (2) Evaluate the simulation performance of WOFOST-EW in yield and phenology; (3) Validation in agricultural meteorological station impacted by extreme weather to assess the model's robustness.
2.1 Study areas
The North China Plain (Fig. 1) features a warm temperate continental monsoon climate, characterized by abundant sunlight and warmth, although precipitation is unevenly distributed, with the majority falling during the summer months (June to August). The predominant soil type in the North China Plain is aeolian soil deposited over geological periods by rivers. This study focuses on wheat cultivation in the North China Plain, the second-largest plain in China, which plays a crucial role in grain production. The dominant cropping system in this region is a double-cropping system of winter wheat and summer maize. To ensure data quality and integrity, we selected 25 counties for this research (Fig. 1). Table S1 in the Supplement provides detailed information on the crops and climate at these research stations.
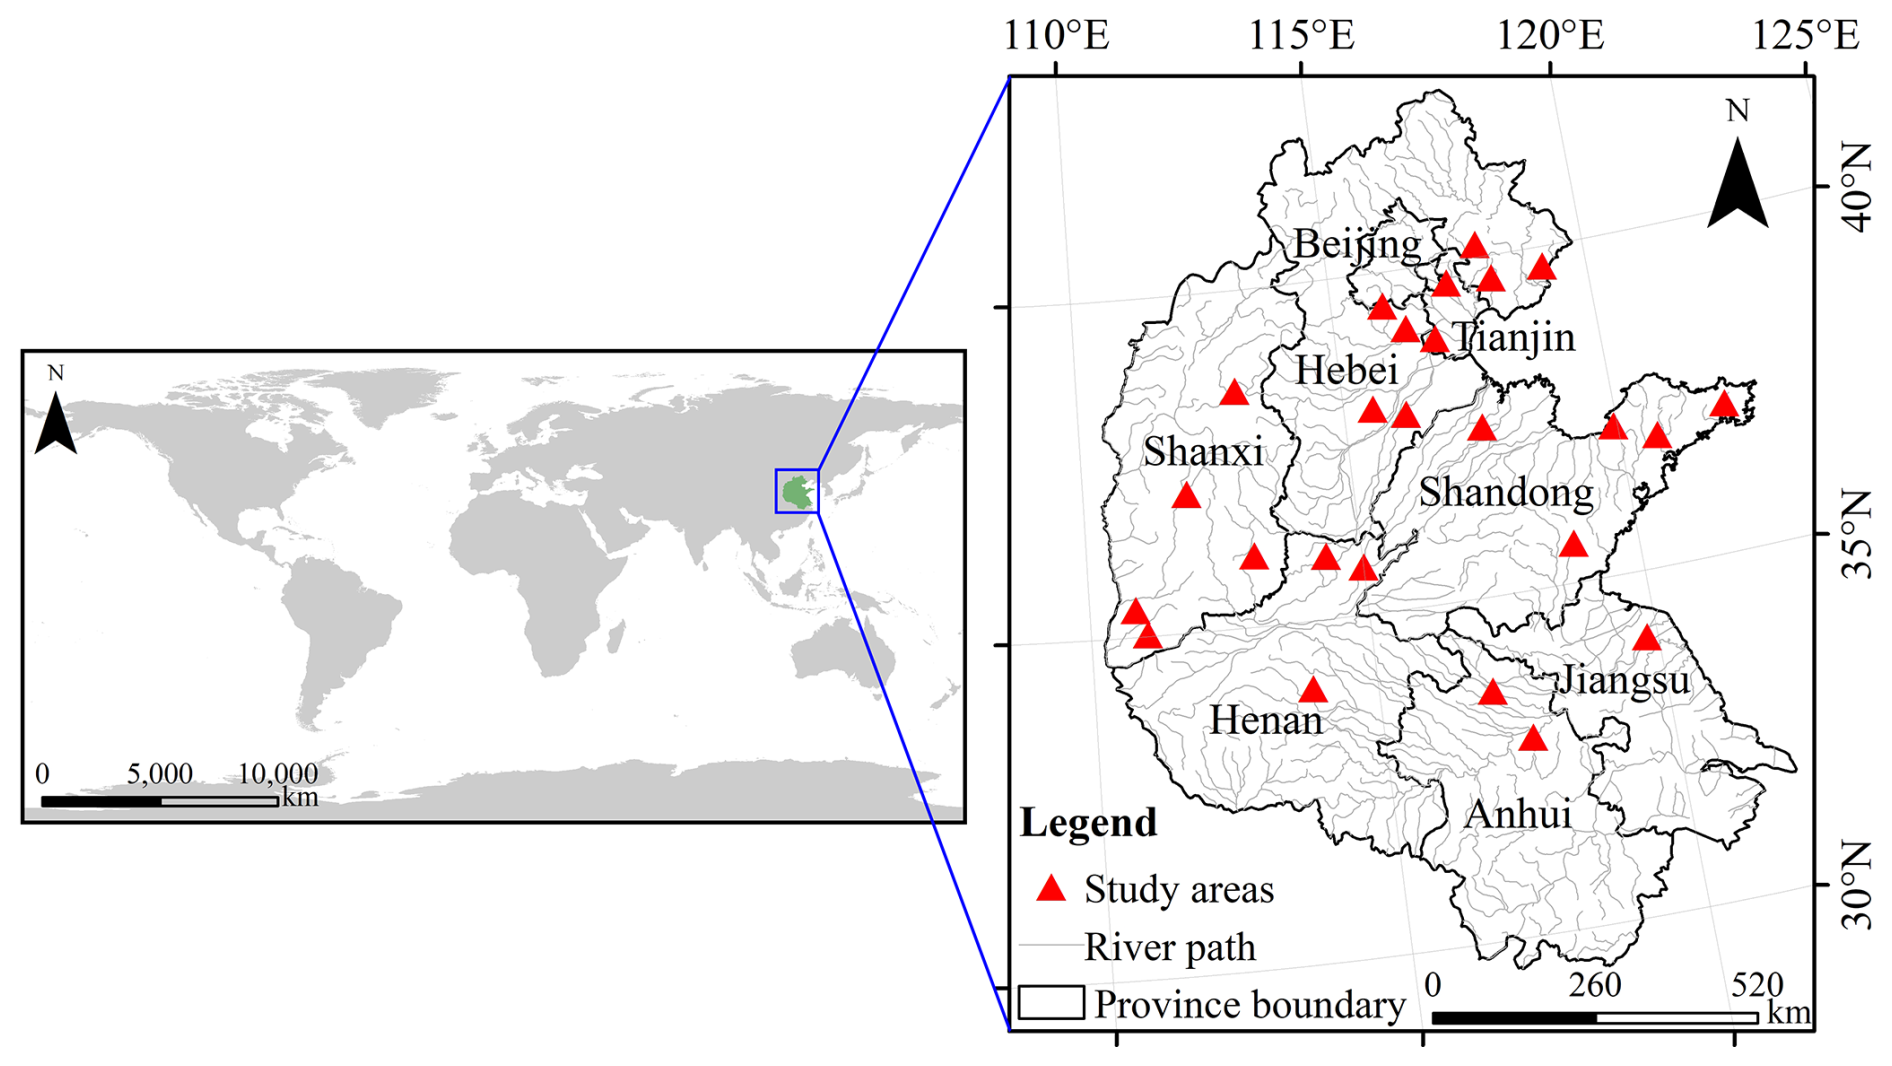
Figure 1Location of the study areas.
2.2 Datasets
2.2.1 WOFOST input data
The input data for the WOFOST model includes weather, crop, soil, and field management parameters. The meteorological data used in this study is sourced from the United States National Centers for Environmental Information (https://www.ncei.noaa.gov, last access: 5 January 2024), providing key climate variables from 1980 to 2020, including air pressure, temperature, humidity, precipitation, and wind speed and direction from over 9000 stations. This dataset covers meteorological observation stations across the country and undergoes rigorous quality control and validation, ensuring high reliability and usability.
The field management data required by the WOFOST model mainly includes simulation start and end dates, crop type, and cultivar information. In this study, the simulation period is determined based on phenological observations of winter wheat provided by agricultural meteorological stations of the China Meteorological Administration (https://www.cma.gov.cn/, last access: 10 January 2024), while other parameters are obtained from model literature and calibration. In the study area, winter wheat is typically sown in September or October and harvested in mid-June. To achieve high yields, farmers usually apply more than 300 mm of irrigation water over three to four irrigation cycles during the growing season (Li et al., 2012; Sun et al., 2011). Regarding fertilization, traditional practices involve the application of a base fertilizer at sowing, followed by topdressing before irrigation during the greening to jointing stages of winter wheat (Bai et al., 2020; Liu et al., 2022). In this study, seasonal irrigation was set to 320 mm in four equal events of 80 mm, scheduled according to winter wheat phenology: 30 d after sowing (mid-November) for overwintering, late February–early March for tillering, late March–early April for stem elongation, and early May for grain filling. The irrigation efficiency was set at 70 %. Since the WOFOST model used in this study does not include a nutrient cycling module, it was assumed that crop growth in the model was not limited by nutrient availability.
Soil data were obtained from the ISRIC global database (https://www.isric.org, last access: 15 January 2024), encompassing soil type, profile depth (cm), bulk density (cg cm−3), cation exchange capacity (mmol kg−1), volumetric fraction of coarse fragments (cm3 dm−3), clay content (g kg−1), total nitrogen content (cg kg−1), available water capacity (mm m−1), etc. The depth of the soil profile was categorized into intervals: 0–5, 5–15, 15–30, 30–60, 60–100, and 100–200 cm.
2.2.2 Yield data
The county-level wheat yields time series data from 1980 to 2020 were sourced from the Agricultural Yearbook of each province (https://www.stats.gov.cn, last access: 21 January 2024).
2.2.3 Extreme weather data
The extreme weather data used in this study was sourced from the Yearbook of Meteorological Disasters in China (https://data.cma.cn, last access: 3 February 2024), Ministry of Ecology and Environment of the People's Republic of China (https://www.mee.gov.cn, last access: 3 February 2024), and previous research (Bai et al., 2022a; Guo et al., 2024; Wang et al., 2019; Yang et al., 2022; Yin et al., 2017; Zhao et al., 2019a). This dataset comprehensively records the occurrence of various extreme weather events in China, including typhoons, heavy rainfall, droughts, strong winds, snow disasters, and more. The yearbook provides statistics on the frequency of extreme events, affected areas, population impact, and resulting economic losses. Table S2 provides information on the stations affected by extreme weather events in 2009, 2010, 2012, and 2018.
2.3 Methods
2.3.1 Climate indices
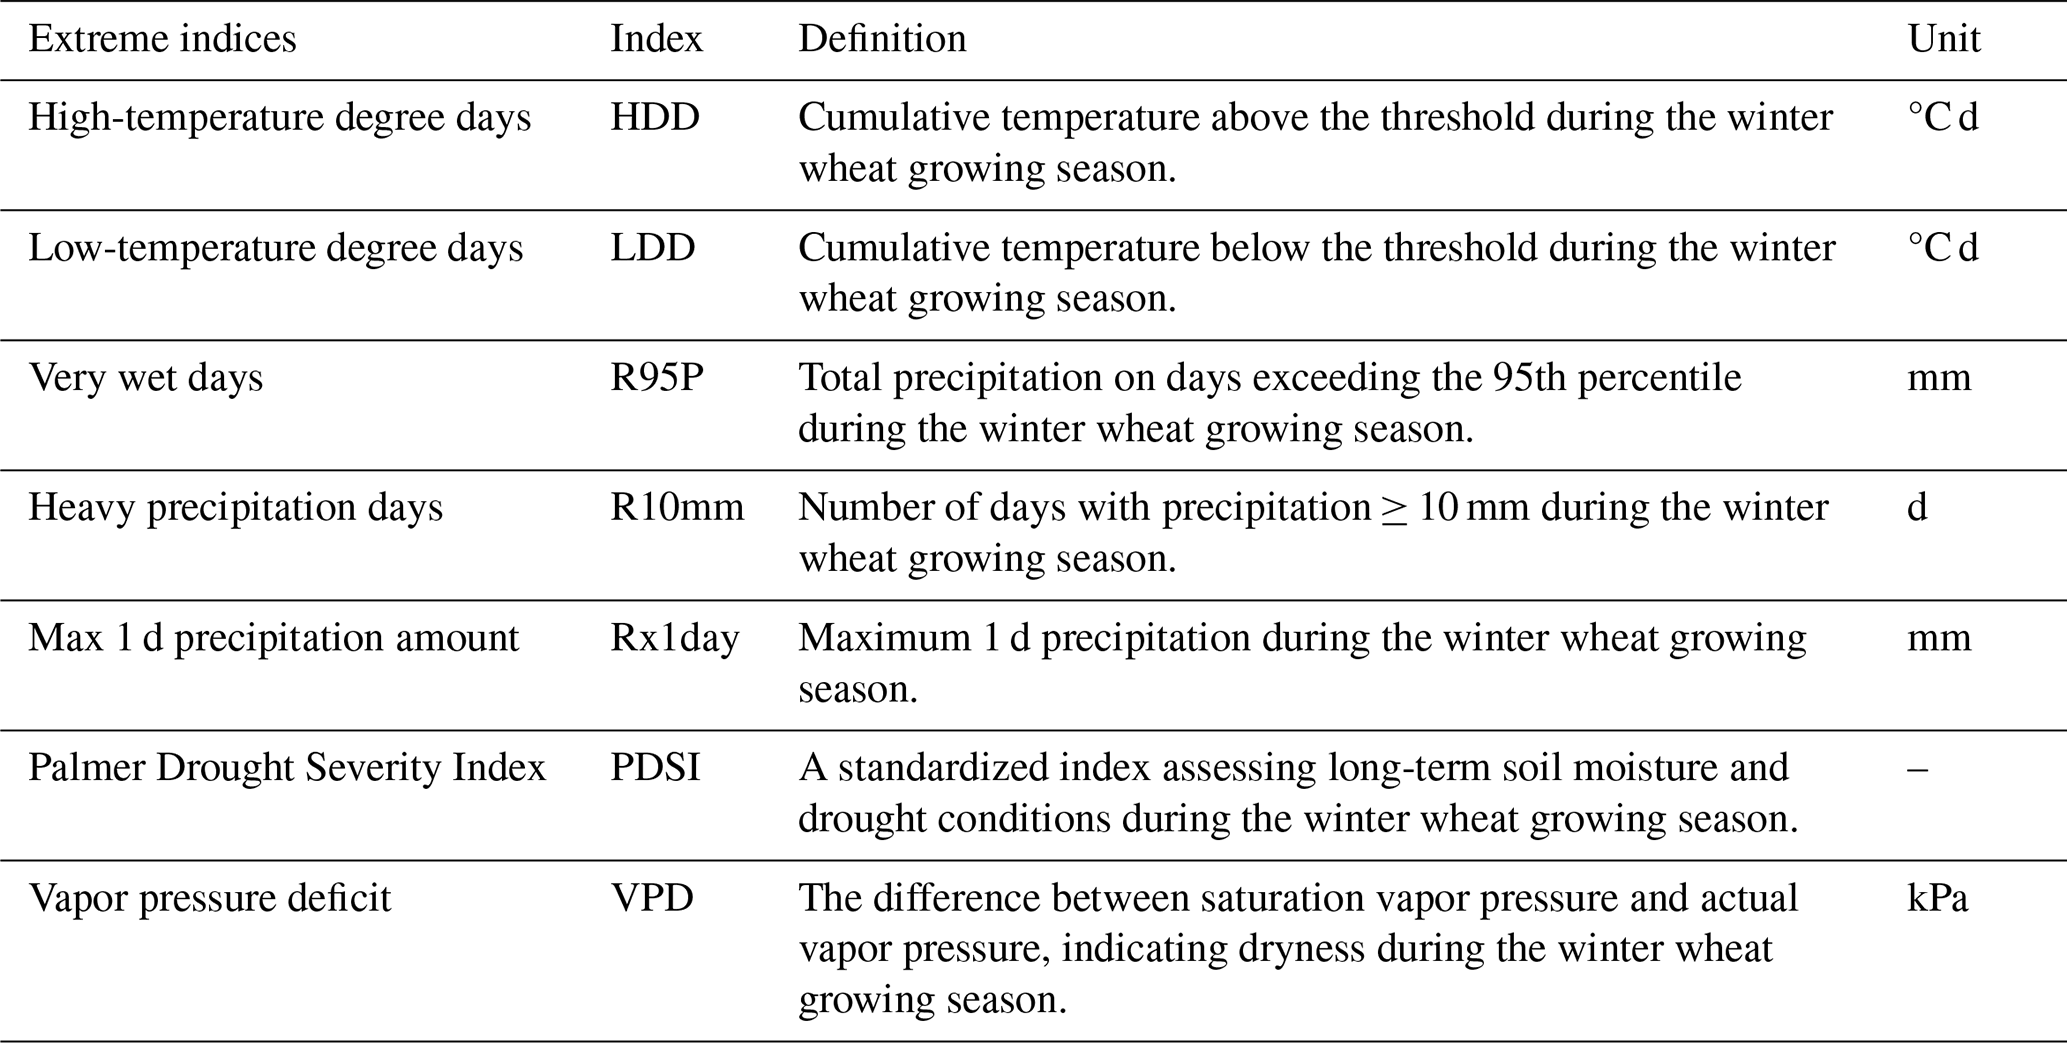
We quantified the impact of extreme weather on wheat production using seven metrics (Table 1). Among these, the high-temperature degree day (HDD) and low-temperature degree day (LDD) are widely used in studies on crops such as rice and wheat, as they reflect the influence of extreme weather on crop growth (Dong et al., 2023; Osman et al., 2020; Zhang et al., 2016; Zhang and Tao, 2019). The methods for calculating HDD and LDD follow those outlined in previous research (Osman et al., 2020). Previous studies have shown that wheat exhibits varying sensitivity to temperature during different developmental stages (Porter and Gawith, 1999; Tack et al., 2015). Based on prior research (Farooq et al., 2011; Liu et al., 2013; Porter and Gawith, 1999), we set the high-temperature thresholds for wheat at 25 °C from planting to heading and 30 °C from heading to maturity. The low-temperature thresholds were defined as −5.7 °C for planting to heading and −2 °C for heading to maturity. In this study, HDD and LDD are calculated and accumulated on a daily basis. These indicators directly reflect the sustained impact of extreme temperatures during key phenological stages. Their timing is precisely aligned with the wheat growth cycle, making them suitable as input features for the LSTM model to characterize the intensity of stage-specific climate stress.
The calculations for R95P, R10mm, and Rx1day were based on the ETCCDI indices, as applied in previous studies (Al-Sakkaf et al., 2024; Hong and Ying, 2018). Data for the Palmer Drought Severity Index (PDSI) and Vapor Pressure Deficit (VPD) (Zhang and Miao, 2024) were spatially processed to extract site-specific values. PDSI is one of the most widely used drought indices (Oubaha et al., 2024; Yang et al., 2024; Zhang et al., 2025), as it accounted for preseason precipitation and the balance between water supply and demand, providing clear physical meaning – particularly suitable for assessing agricultural drought. In this study, we focused on the wheat growing season, during which PDSI effectively captured drought dynamics. Numerous studies demonstrated significant correlations between PDSI and crop yield (Baydaroğlu et al., 2024; Kumar and Mahapatra, 2024; Peethani et al., 2024; Pei et al., 2024; SM et al., 2025). Moreover, the validity of PDSI has been widely demonstrated in crop-related studies (Peethani et al., 2024; Pei et al., 2024; Yan et al., 2016). VPD, on the other hand, is a key variable reflecting atmospheric dryness and directly influenced crop transpiration and water stress. Studies reported a steady global increase in VPD from 2010 to 2019, which posed a serious constraint on agricultural productivity (Koehler et al., 2023; Nesmith and Ritchie, 1992). Under extreme heat and low humidity conditions, elevated VPD intensifies transpiration and water loss, exacerbating plant water stress and posing a direct threat to yield. Therefore, VPD can partially reflect the intensity of short-term extreme heat and drought stress (Yu et al., 2024). In this study, we used seasonal averages or cumulative values of these indices as model inputs.
2.3.2 Deep learning algorithm
LSTM algorithm, a type of recurrent neural network (RNN), was first proposed by Sepp Hochreiter and Jürgen Schmidhuber in 1997 to address the problem of the error back-flow problems (Kalchbrenner et al., 2019). This study utilizes the “Keras” library in Python to implement LSTM, which is distinguished by its multiple self-parameterizing control gates. These gates facilitate the selective storage and exclusion of information, allowing for the accumulation of specific data units.
We developed a five-layer deep neural network consisting of an input layer, two LSTM layers, a dense layer, and an output layer (Fig. 2). The input data include seven extreme weather indices corresponding to the winter wheat growth period. The model's output predicts the extreme weather impact factor, which represents the influence of extreme weather on phenological stages of wheat growth and is determined during the model calibration period. To prevent overfitting, a dropout mechanism is applied to the input of the dense layer. The number of hidden units is determined empirically, as there is no universally applicable rule. Data from 1980 to 2000 are used for LSTM model training and internal validation. During this phase, we adopt the leave-one-year-out cross-validation (LOOCV) method (Ji et al., 2022; Ma et al., 2021; Pei et al., 2025), in combination with “GridSearchCV” (Kalchbrenner et al., 2019; Panigrahy, 2024) to determine optimal hyperparameters and conduct model training. It is noteworthy that the model training period encompassed abnormal weather events, including severe drought, low temperatures, and short-term heavy rainfall. After completing model training and hyperparameter optimization on the 1980–2000 dataset, we use data from 2001 to 2020 as a fully independent test set to evaluate the final performance of the WOFOST-EW model. For network parameter optimization, we employ the Adam optimizer based on gradient descent, with a learning rate of 0.001.
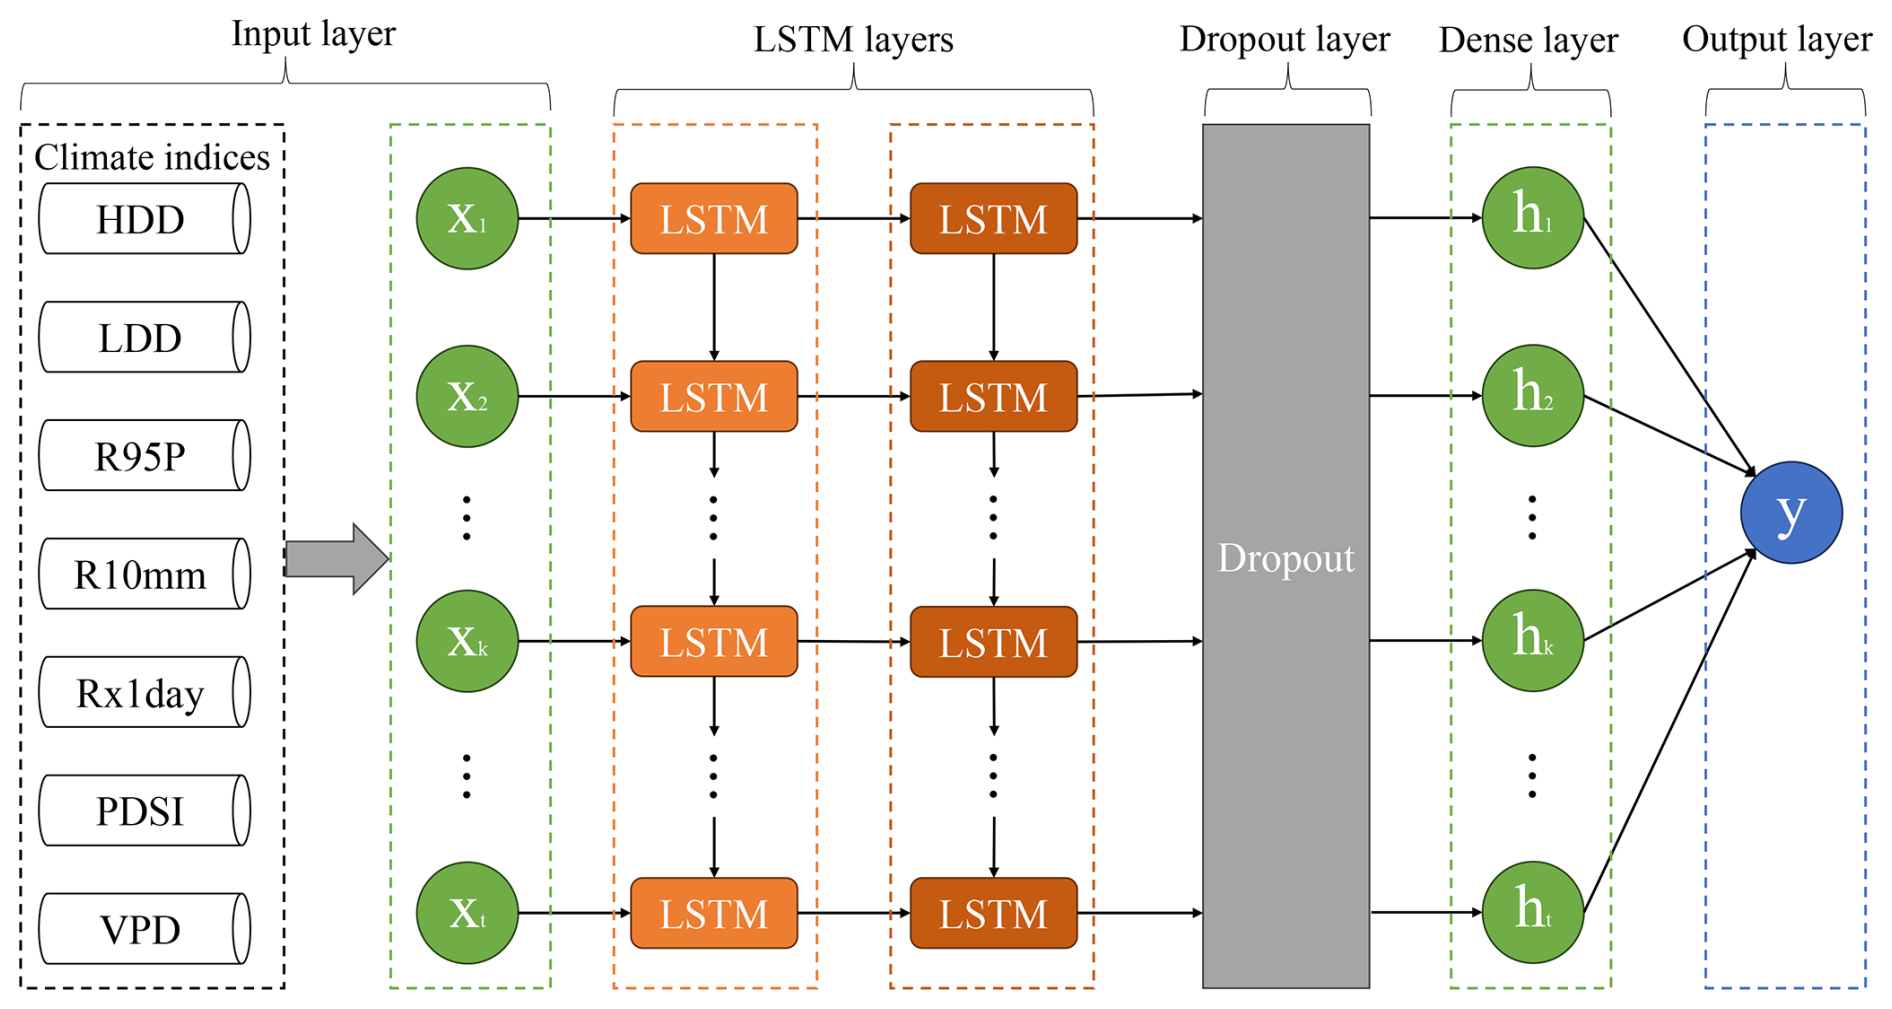
Figure 2The workflow of a Long Short-Term Memory (LSTM) network. In the figure, the training target y refers to the extreme weather impact factor.
2.3.3 WOFOST model improvement protocol
The WOFOST model, developed by Wageningen University in the Netherlands in collaboration with the World Food Studies Center, is used to calculate the daily biomass accumulation of crops based on photosynthesis and its distribution across various crop components (De Wit et al., 2020). The model includes several modules, such as phenological development, CO2 assimilation, respiration, dry matter allocation, leaf area development (source and sink limitations), soil water and nutrient balance, and more. The outputs of the WOFOST model include simulated total crop biomass, crop yield, leaf area, and crop water use efficiency. For a detailed description of the WOFOST calculation process, refer to the relevant literature (de Wit et al., 2018; De Wit and Boogaard, 2021; Supit et al., 1994).
Here, we utilized the Python Crop Simulation Environment (PCSE 6.0.6) framework to run the WOFOST crop growth model (Wofost72_WLP_CWB). The research flowchart is shown in Fig. 3. In the WOFOST, phenological development is guided by the daily thermal time (DTT) (De Wit et al., 2020). It is noteworthy that in WOFOST, crop emergence occurs when the cumulative daily effective temperature exceeds a specific threshold temperature for the crop. The calculation of DVI is accumulated from the Development Rate (DVR):
where DVIt is the developmental index at day t, and DVRi is the developmental rate on the ith day from planting.
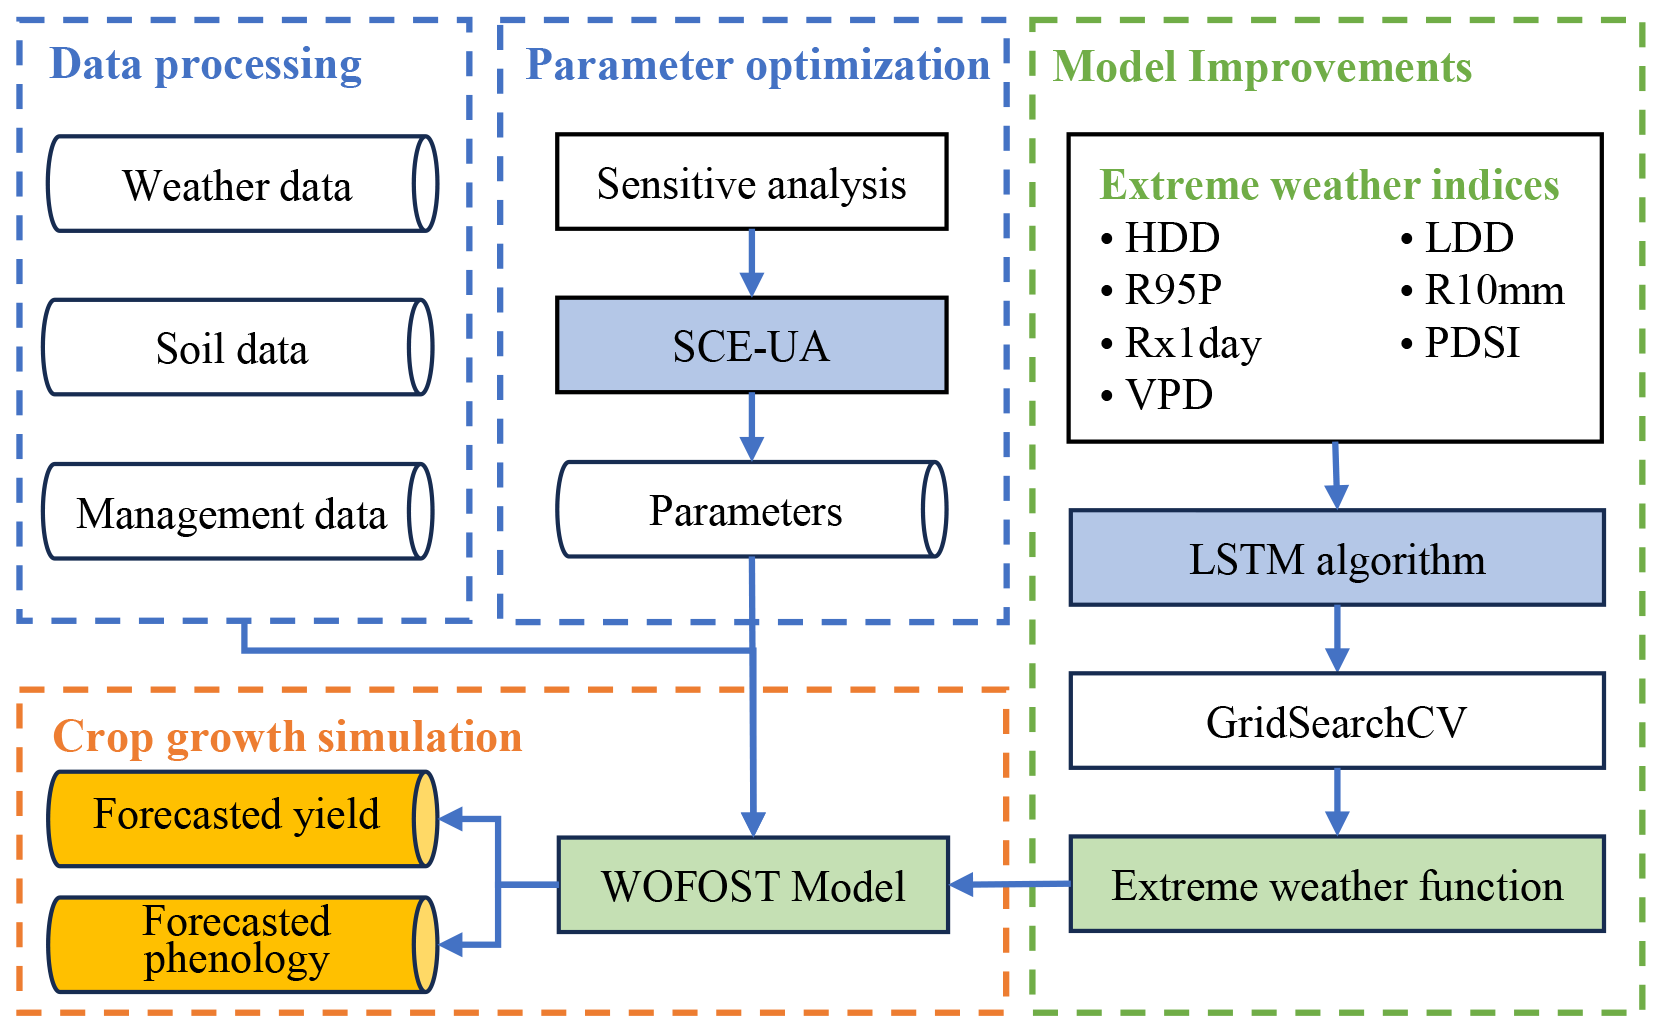
Figure 3The program flowchart used in this study. HDD, LDD, R95P, R10mm, Rx1day, PDSI, and VPD represent different climate indices, and LSTM represents the Long Short-Term Memory algorithm.
The calculation for DVR is:
where F(T) represents the daily effective temperature, and ∑Ti denotes the temperature sum required to complete stage i. We modified Ti to represent the sum of effective temperatures between emergence and heading or between heading and maturity. Accordingly, the DVI values were reset, with 1 corresponding to the heading stage and 2 to the maturity stage. F(T) is calculated as:
where Tb refers to the base temperature below which phenological development stops, Tm represents the maximum temperature beyond which phenological activity does not increase, and T represents the average daily temperature. In this study, Tb is set to 0 °C and Tm to 30 °C.
The vernalization (F(V)) and photoperiod functions (F(P)) also affected the daily development of wheat. Each function is defined as follows:
where Vbase represents the minimum vernalization requirement (lower threshold) for development, while Vsat defines the maximum vernalization limit (upper threshold). Pc represents the threshold for day length in development; when the day length falls below Pc, F(P) equals 0. Po is the optimum day length for development, above which F(P) equals 1.
In this study, we proposed an improved WOFOST model incorporating an extreme weather function, referred to as WOFOST-EW v1. The algorithm improvement workflow is shown in Fig. S1. We developed an extreme weather function (F(EW)) to enhance the DVI calculation of the WOFOST model.
The calculation is as follows:
where fLSTM represents the LSTM algorithm, while HDD, LDD, R95P, R10mm, Rx1day, PDSI, and VPD respectively represent climate indices.
The core objective of the LSTM algorithm is to learn and estimate a spatiotemporally dynamic extreme weather function, F(EW). During the calibration period (1980–2000), F(EW) is treated as an optimizable parameter, and its values are estimated through calibration. These calibrated values are subsequently used as the target variable for LSTM training. Specifically, the extreme weather indices serve as input features, while the SCE-UA–derived F(EW) values are used as outputs to train the LSTM network. This process establishes a nonlinear mapping between extreme weather conditions and their regulatory effects on crop development. Finally, we applied F(EW) to the WOFOST model and obtained the updated DVREW:
Extreme weather impacts on phenology were represented as a re-modulation of multiple interacting factors. The correction factor F(EW) was thus multiplicatively incorporated into development rate calculations, preserving the original multi-factor structure while proportionally reflecting the influence of extreme events. This approach maintains the physiological framework and enhances the model's realism under extreme climate conditions.
2.3.4 Model calibration and validation
First, we applied the Sobol algorithm to evaluate the sensitivity of crop model parameters on the total weight of storage organs (TWSO), which allowed us to identify the parameters requiring calibration (Sect. S1 and Table S3). Calibration was then performed accordingly (Sect. S2). To enhance the performance of the crop model, calibration is essential. We employed the SCE-UA (Shuffled Complex Evolution-University of Arizona) algorithm to determine the optimal parameter set for each agricultural meteorological station. Parameters were considered optimal when the root mean square error (RMSE) between observed and simulated yields, as well as between observed and simulated phenological stages, was minimized. Specifically, three objective functions were defined in the SCE-UA algorithm: the RMSE between simulated and observed values for yield, heading date, and maturity date. The objective function prioritized phenological errors to ensure biologically realistic crop responses under extreme climate conditions. Yield errors were included as a low-weight auxiliary constraint to prevent large deviations from observed yields without compromising phenology fitting (Sect. S2).
The WOFOST model was calibrated using observational data from 1980 to 2000. The resulting optimal parameter sets were then applied to each simulated growing season at each location. The model was validated using independent data from 2001 to 2020. It is important to note that once calibrated, the model parameters remained fixed throughout the entire experiment, including in the WOFOST-EW simulations. Detailed WOFOST parameter values are provided in Table S4.
2.3.5 Model performance assessment
The performance of the model is evaluated by calculating the regression coefficients of determination (R2), Pearson's rank correlation coefficient (Pearson's r), and RMSE using the following equations:
where yi is the observed value, is the simulated value, and n is the number of observations.
3.1 Phenological simulation results
The phenological period simulation results for the 25 sites in the study area showed good performance in both the calibration and validation datasets (Fig. 4, Tables S5 and S6). In the calibration dataset (Fig. 4, Table S5), the WOFOST model's RMSE for heading ranged from 1.4 to 12.8 d, with an average of 5.7 d. The best-performing site was Jiexiu, while the worst-performing site was Fengyang. For the maturity period, the RMSE ranged from 3.1 to 13.1 d, with an average of 8.0 d. In comparison, The WOFOST-EW model's RMSE results for heading and maturity periods were 4.2 and 5.4 d, respectively.

Figure 4Simulation results of phenological stages for winter wheat using the WOFOST model and the WOFOST-EW model at 25 agrometeorological stations in the study area. (a) shows the Root Mean Square Error (RMSE) of simulated heading dates for the calibration and validation datasets at different stations for both models. (b) shows the RMSE of simulated maturity dates for the calibration and validation datasets at different stations for both models. (c) and (d) present boxplots of the RMSE for simulated heading and maturity dates, respectively. The × symbol represents the mean RMSE value, and the horizontal line within the box indicates the median (Q2). The box represents the interquartile range (IQR), with the top and bottom edges of the box denoting the upper quartile (Q3) and lower quartile (Q1), respectively. The whiskers extend to the maximum and minimum values, where the maximum value is defined as Q3 + 1.5 × IQR, and the minimum value is defined as Q1 – 1.5 × IQR.
In the phenological simulation results for the validation dataset (Fig. 4, Table S6), the RMSE for heading and maturity periods using the WOFOST model ranged from 1.0 to 9.5 d (average of 4.7 d) and from 3.2 to 11.8 d (average of 7.0 d), respectively. For the WOFOST-EW model, the RMSE for heading date simulations ranged from 1.0 to 6.0 d, with an average of 4.2 d, while for maturity date simulations, the RMSE ranged from 3.2 to 8.0 d, with an average of 6.1 d. The best and worst-performing sites for heading and maturity dates simulations using the WOFOST-EW model were Bazhou and Shenzhou, and Laiyang and Shenzhou, respectively.
Figure 4c and d present box plots of the RMSE for heading and maturity dates simulated by the WOFOST and WOFOST-EW models. In the validation dataset, for the heading date, the lower and upper quartiles for the WOFOST model were 3.8 and 5.5 d, respectively, while for the WOFOST-EW model, they were 3.9 and 4.7 d (Fig. 4c). For the maturity date, the lower and upper quartiles for the WOFOST model were 5.4 and 7.7 d (Fig. 4d), while for the WOFOST-EW model, they were 4.6 and 7.0 d. These results indicate that, compared to the WOFOST model, the proposed WOFOST-EW model significantly reduced the RMSE for both heading and maturity dates, thus improving accuracy. Furthermore, the smaller interquartile range suggests a narrower error range, indicating more stable and precise simulation results.
During the validation period, the original WOFOST model exhibited an RRMSE of 4.61 % for heading and 4.74 % for maturity, with R2 of 0.53 and 0.45 (p<0.05), and MAE of 4.4 and 5.6 d, respectively (Fig. 4). In contrast, the improved WOFOST-EW model substantially enhanced phenological simulation performance, achieving lower RRMSEs of 3.74 % (heading) and 3.98 % (maturity), higher R2 values of 0.69 and 0.56 (p<0.05), and reduced MAEs of 3.8 and 5.3 d, respectively (Fig. 4). These results indicate that WOFOST-EW improves both the accuracy and precision of phenological predictions. Based on the evaluation using the validation dataset, the RMSE for heading simulation is reduced by 10.64 %, and for maturity by 12.86 % (Fig. 4).
3.2 Simulation results of yield
Despite some differences in simulation results across counties, the WOFOST model's simulated yields aligned well with observed yields (Figs. 5, 6, and 7, Tables S5 and S6). In the calibration dataset, the average RMSE in the simulated counties was 673.01 kg ha−1 (RRMSE = 16.66 %) (Figs. 5 and 6, Table S5). Among these, Dingxiang performed the best, with an RMSE of 355.83 kg ha−1 (RRMSE = 9.75 %), while Changli showed poorer results, with an RMSE of 844.58 kg ha−1 (RRMSE = 21.38 %). For the validation dataset, the RMSE of simulated yields by the WOFOST model ranged from 256.61 to 938.19 kg ha−1, with an average RMSE of 665.76 kg ha−1 (RRMSE = 13.55 %) (Figs. 5 and 6, Table S6).
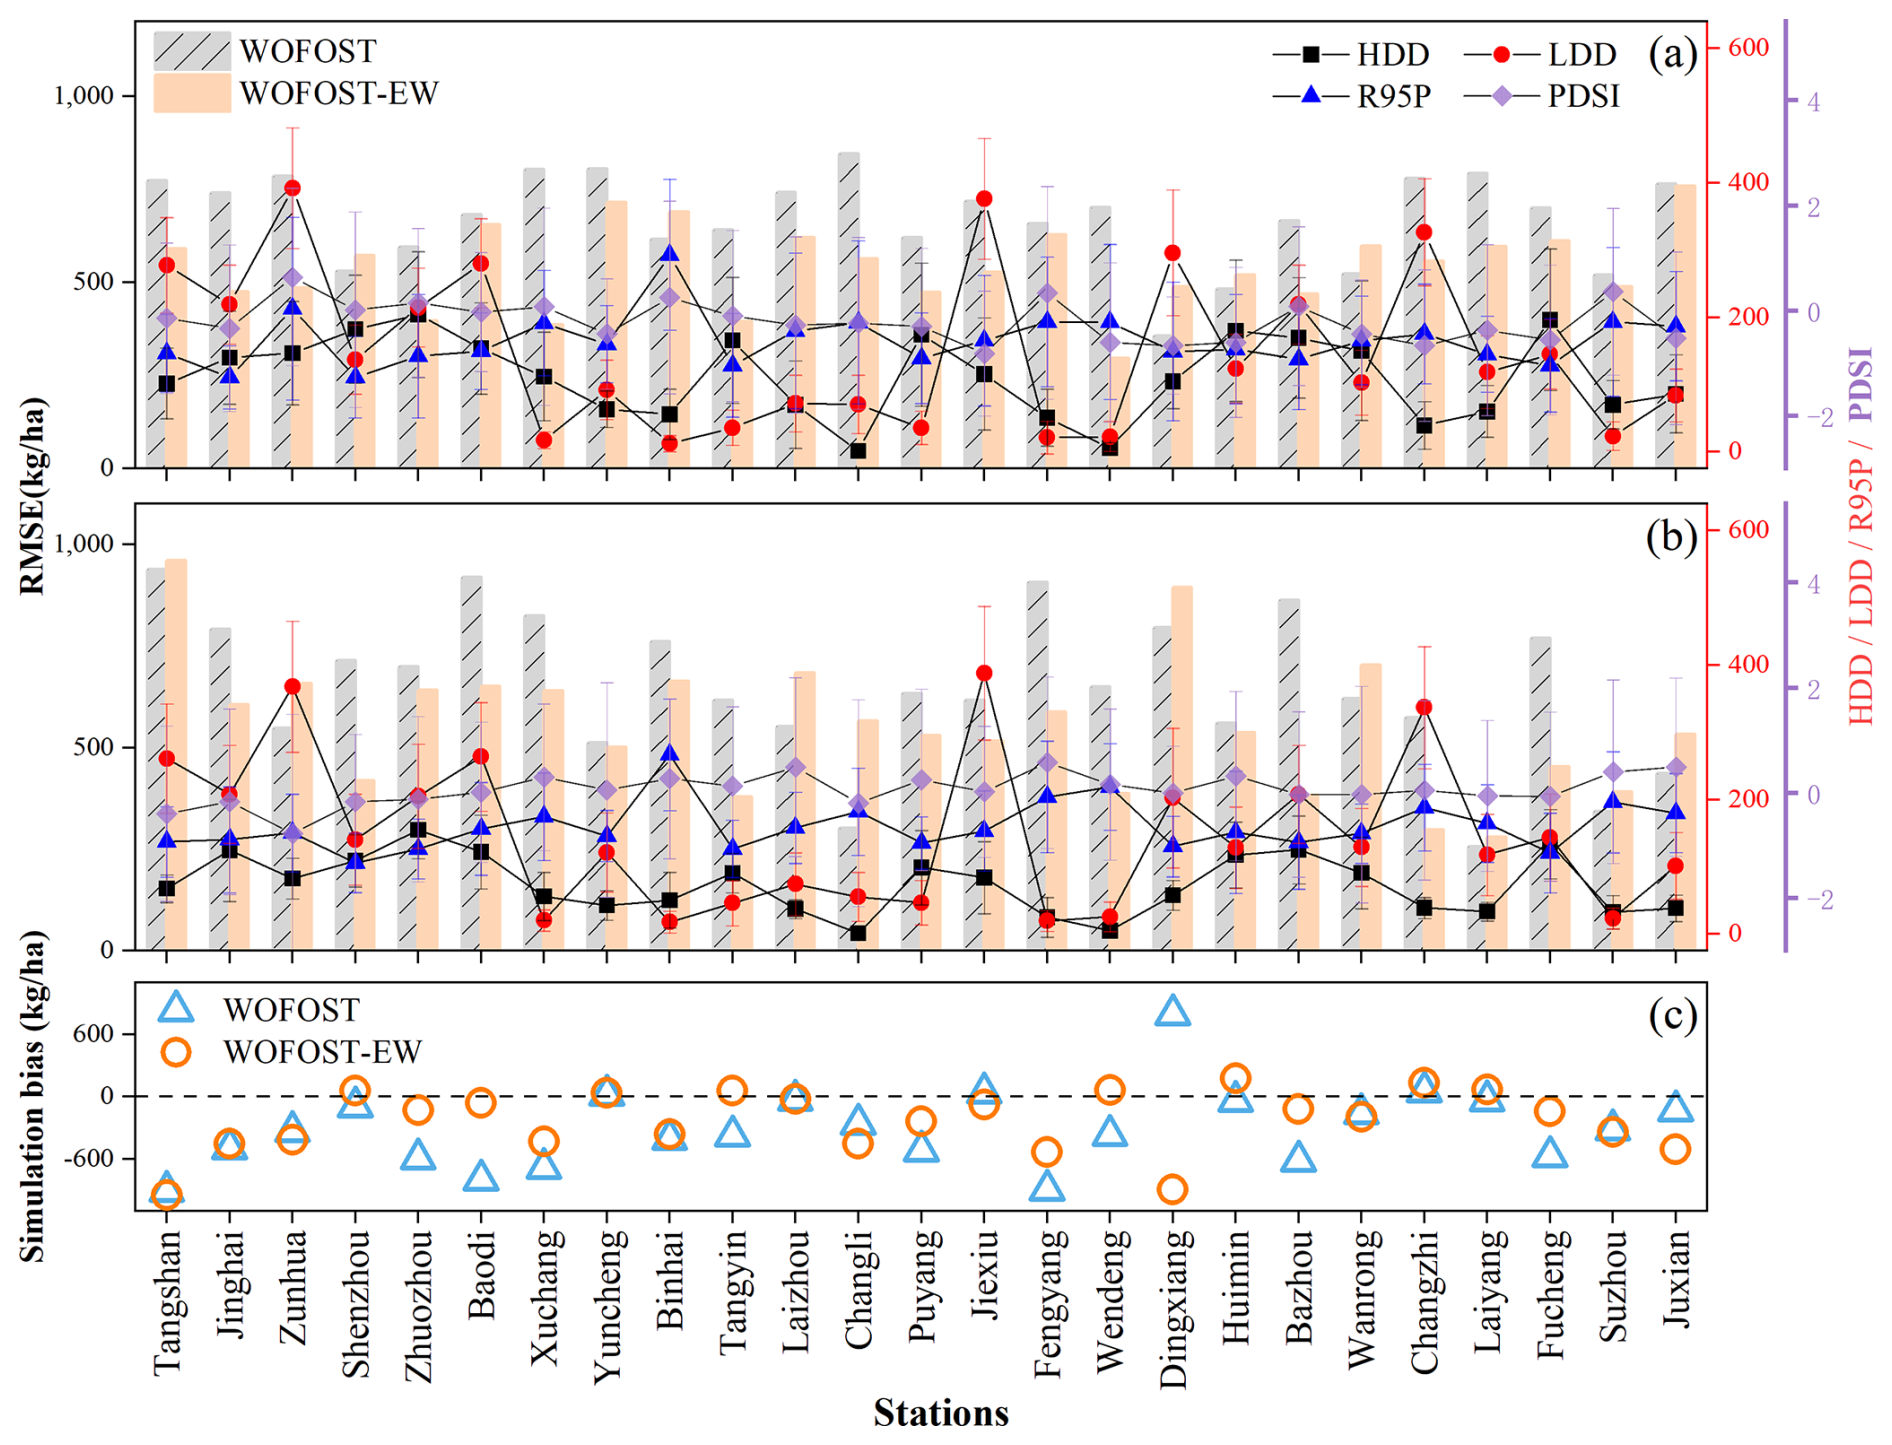
Figure 5Root Mean Square Error (RMSE) values for winter wheat yield simulated by the WOFOST model and the WOFOST-EW model in the study area for the calibration dataset (a) and validation dataset (b). (c) illustrates the distribution of simulation errors for the two models during the validation period. HDD, LDD, and R95P represent climatic indices related to extremely high temperatures, low temperatures, and precipitation, respectively. PDSI represents the Palmer Drought Severity Index.
The improved WOFOST-EW model more accurately simulated winter wheat yields from 1980 to 2020 (Figs. 5, 6, and 7, Tables S5 and S6). In the calibration dataset, the RMSE for yield simulations ranged from 295.63 to 758.14 kg ha−1, with an average of 541.90 kg ha−1 (RRMSE = 13.60%). In the validation dataset, the RMSE ranged from 279.64 to 960.75 kg ha−1, with an average of 565.63 kg ha−1 (RRMSE = 11.30 %).
From 1990 to 2020, a comprehensive evaluation of annual yield simulations by the WOFOST model was performed (Fig. 6). The WOFOST model utilized a set of optimal parameters obtained through the SCE-UA method, allowing for effective simulation of wheat yields. During the verification period, in the WOFOST model, the MAE of the simulation results was 566.08 kg ha−1 (MRE = 12.09 %), while the WOFOST-EW model reduced the MAE to 463.82 kg ha−1 (MRE = 10.11 %) (Fig. 6). Despite the overall high accuracy, errors were identified in yield simulations for certain years (Fig. 6b).
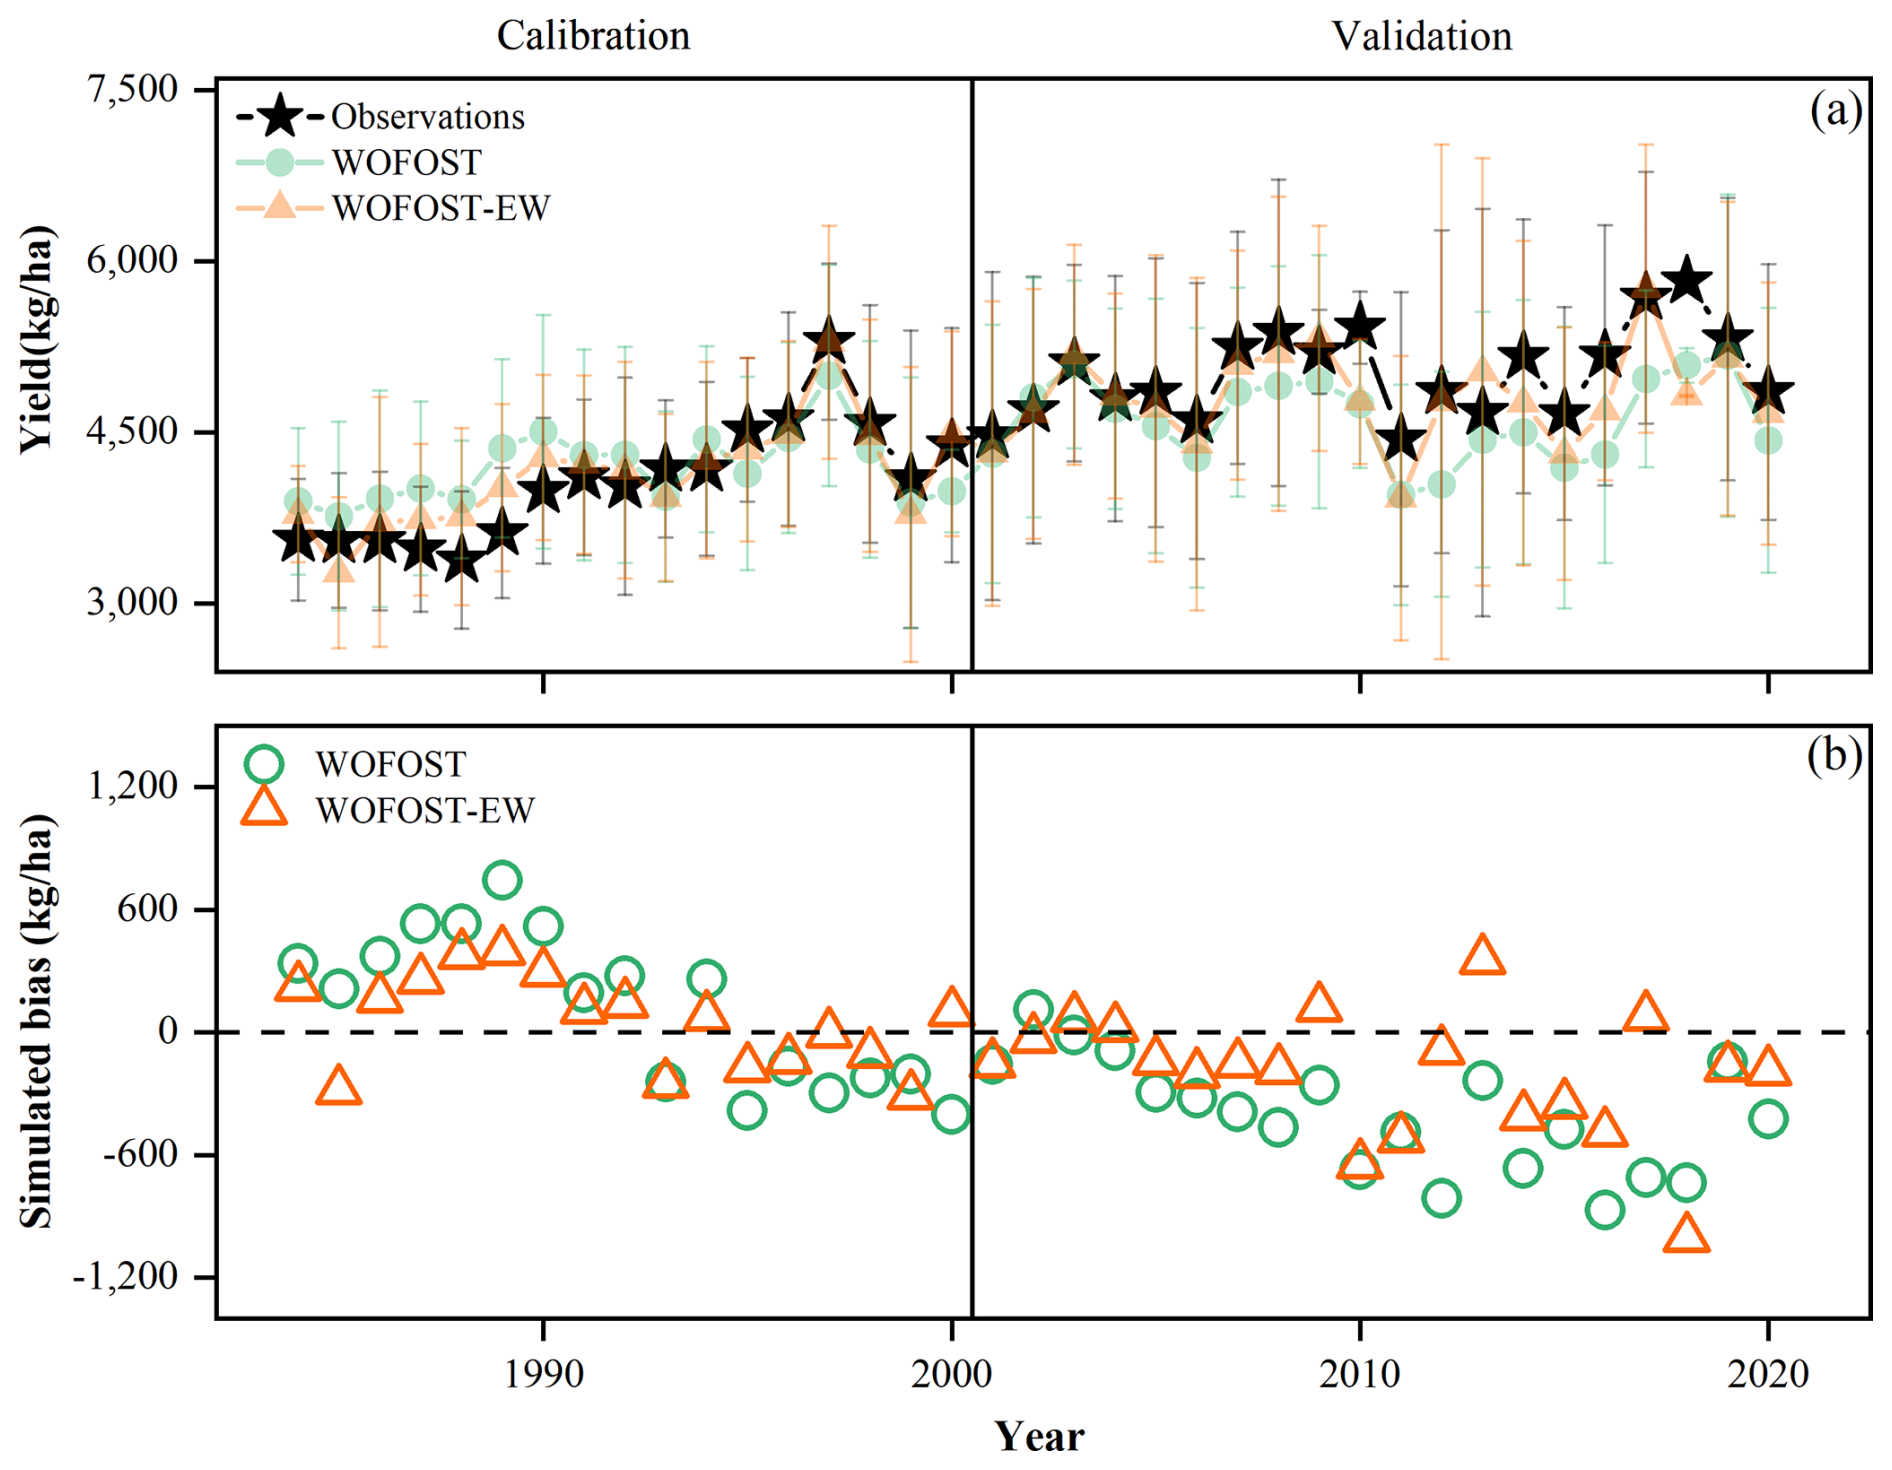
Figure 6Model simulation results by year. Panel (a) represent the winter wheat yield prediction results during the calibration and validation periods using the WOFOST and WOFOST-EW models. Panel (b) indicates the simulation errors of yield.
To further evaluate the performance of the two models, we analyzed the results for the validation dataset from 2001 to 2020 (Fig. 7). The simulation results of the WOFOST model showed a Pearson's r of 0.83 and an R2 of 0.67 (p<0.01). In comparison, the WOFOST-EW model demonstrated enhanced yield estimation accuracy, with a Pearson's r of 0.86 and an improved R2 of 0.76 (p<0.01) (Fig. 7). In addition, we compared the annual distribution of traditional extreme weather indices with the extreme weather function values F(EW) proposed in this study (Fig. 8). We used 1 − F(EW) to represent the intensity of extreme weather impacts on crop growth. The results indicate that in years with extreme climatic conditions, this metric exhibits higher values, reflecting stronger weather-induced stress on crops. Conversely, in years with relatively normal climate conditions, F(EW) values remain stable, suggesting limited impact. These findings demonstrate that the model effectively captures and quantifies the influence of extreme weather on crop development.
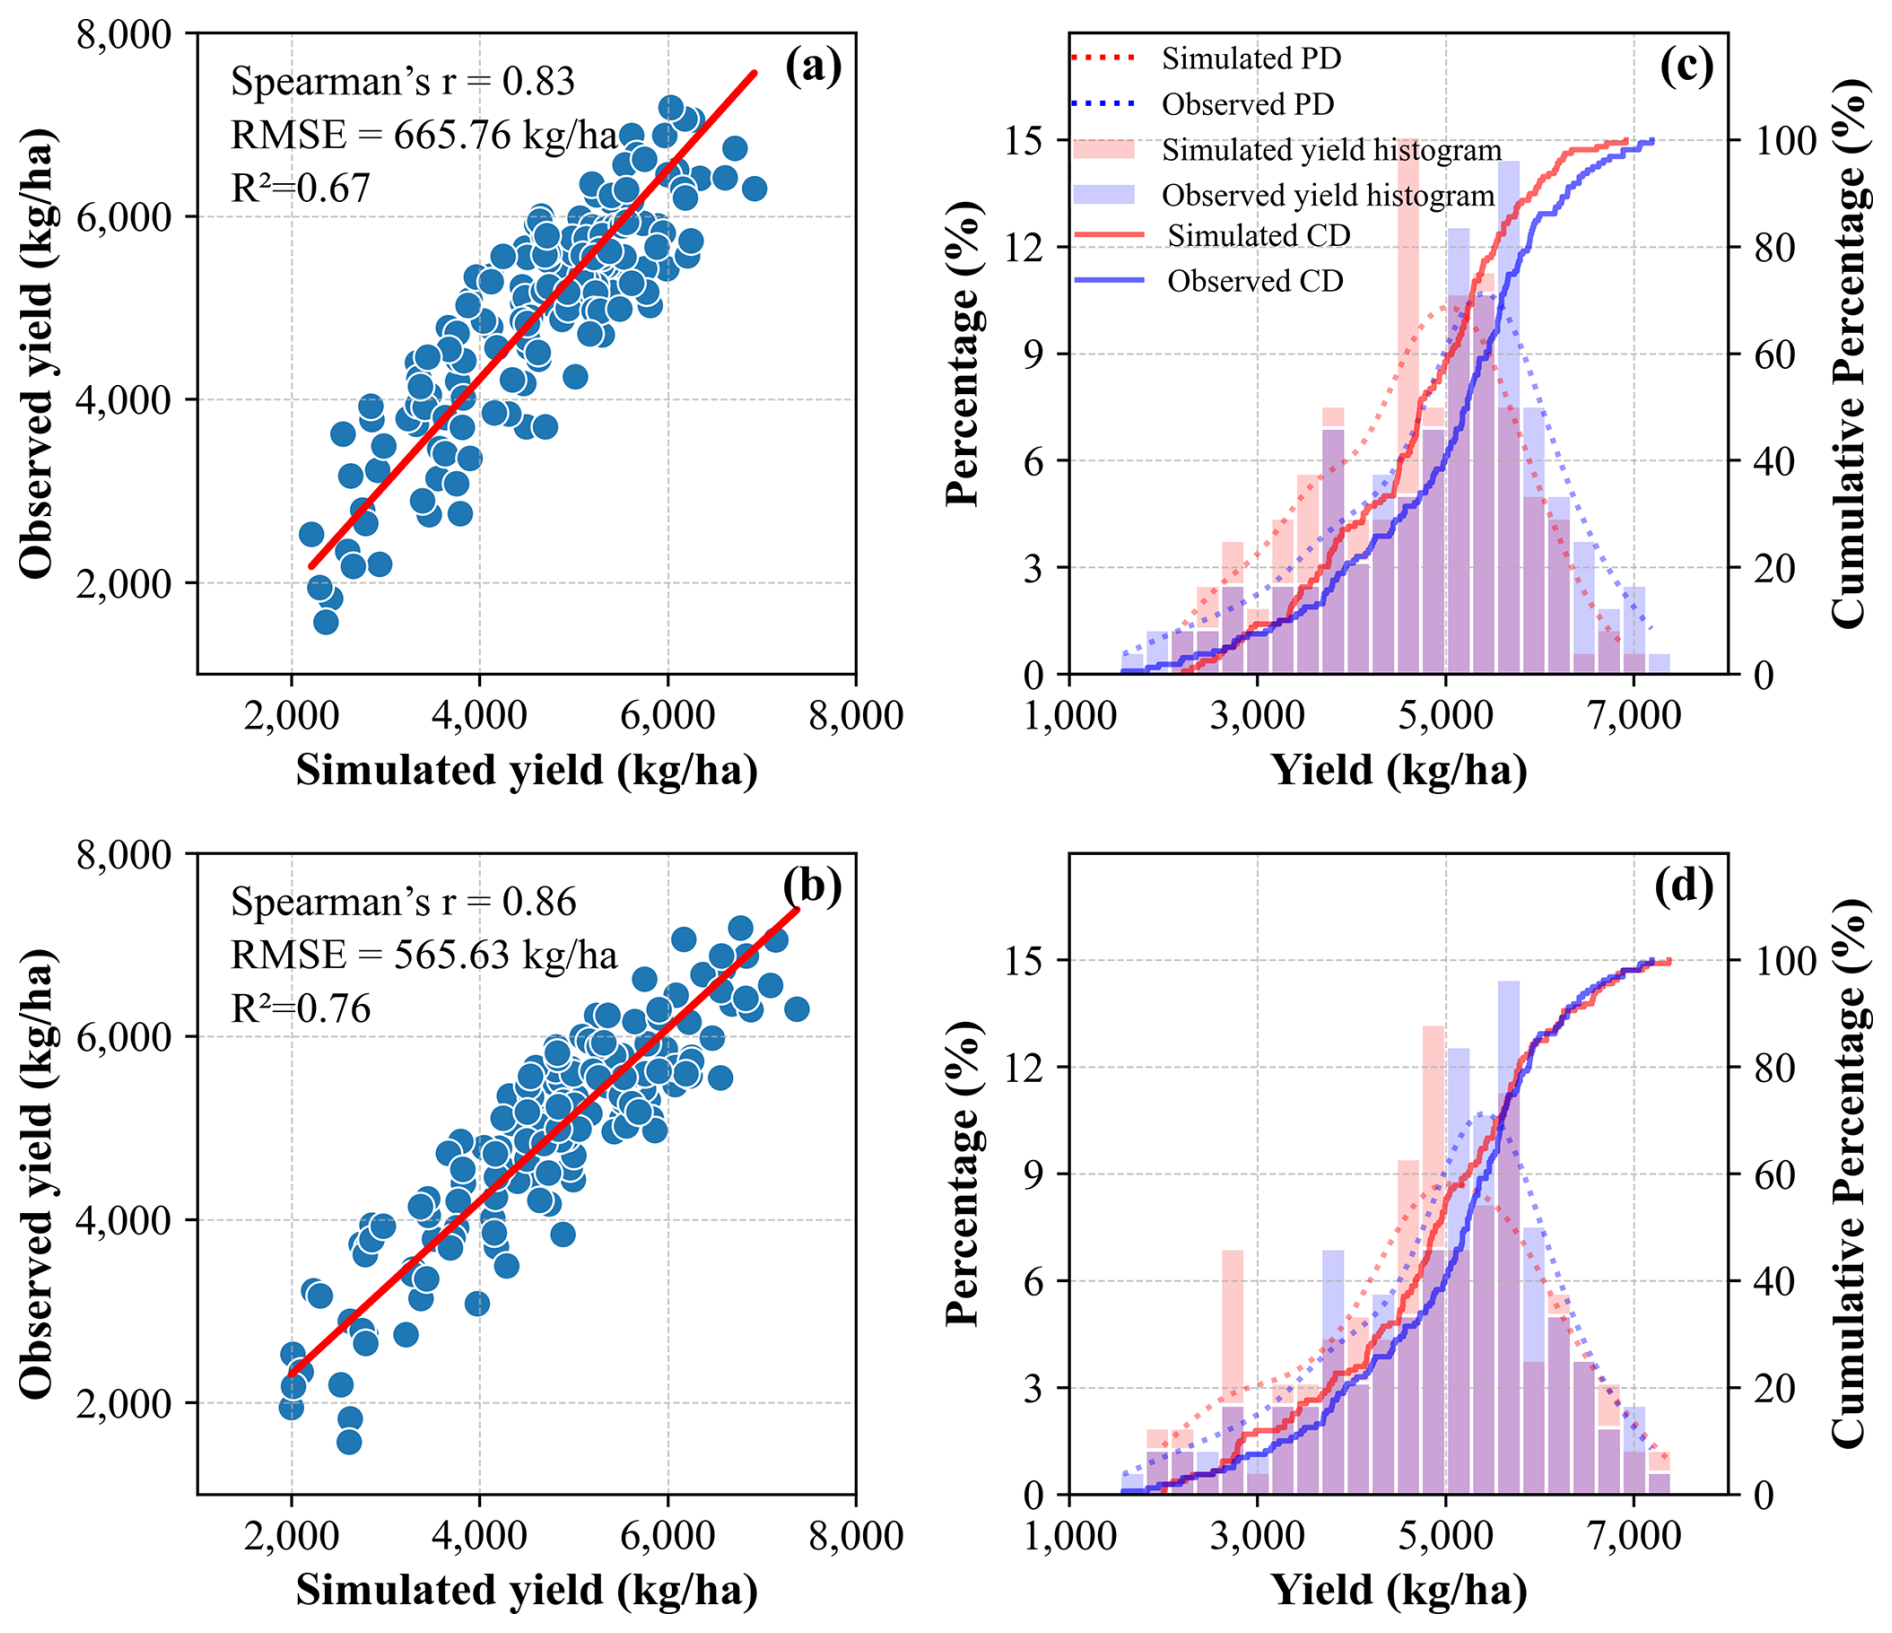
Figure 7Comparison of simulated winter wheat yield distributions with observed yield records in the study area from 2001 to 2020. Subplots (a) and (c) show the comparison between the WOFOST model simulation results and observed yields; (b) and (d) display the comparison between the WOFOST-EW model results and observed yields. Here, PD denotes Probability Density, and CD denotes Cumulative Distribution.
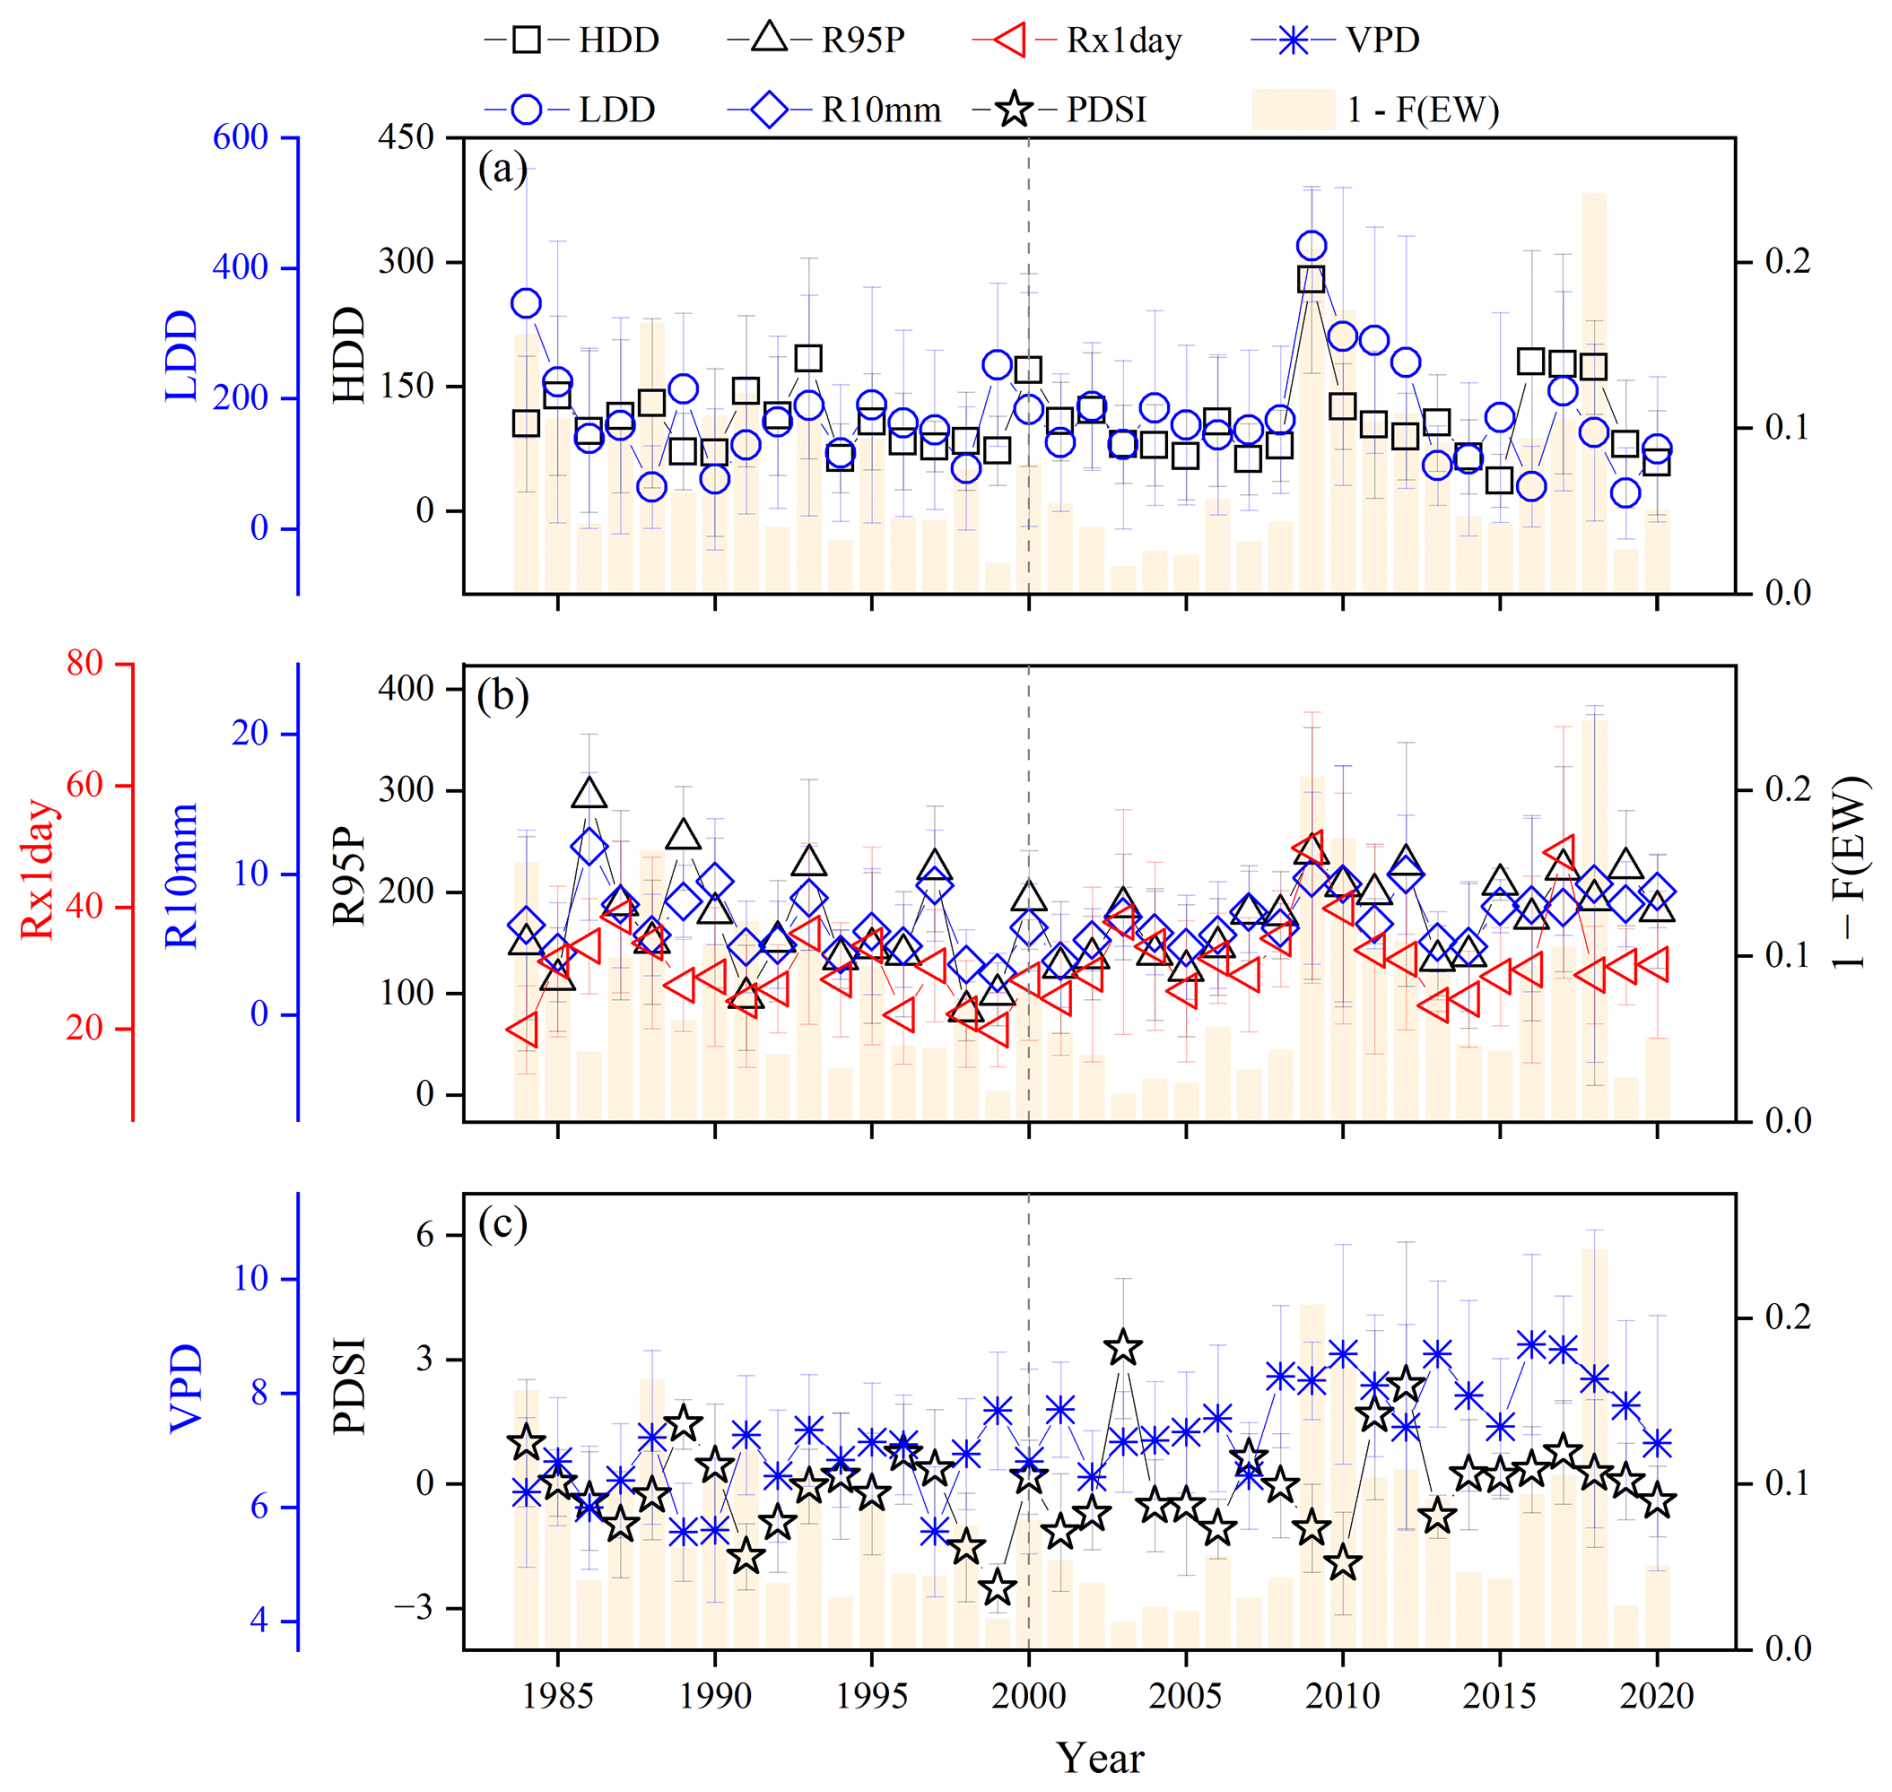
Figure 8Distribution of extreme weather indices and the proposed extreme weather function values (F(EW)) across the study area from 1980 to 2020. Panel (a) shows HDD and LDD, representing extreme temperature conditions; panel (b) includes R95p, R10mm, and Rx1day, which capture extreme precipitation events; panel (c) presents drought-related indices, PDSI and VPD. F(EW) denotes the extreme weather function developed in this study, representing the influence of extreme weather factors as modeled using deep learning.
3.3 Simulation analysis of counties affected by extreme weather
To further evaluate the effectiveness of the improved model, we conducted yield simulations at specific sites affected by extreme weather events. Based on prior reports, the years 2009, 2010, 2012, and 2018 were selected for modeling analysis under extreme weather conditions. Detailed information on the agricultural meteorological experimental stations impacted during these events is provided in Table S2.
According to the Ministry of Ecology and Environment of the People's Republic of China (https://www.mee.gov.cn, last access: 3 February 2024), the study region experienced record-breaking high temperatures in 2009, with several locations breaking previous historical records. In 2010, the frequency of meteorological disasters increased, with numerous extreme weather events reported. In 2012, China experienced 38 heavy rainfall events, 21 of which occurred during the summer. Some regions were hit by exceptionally extreme weather events, most notably the “7.21” event (Zhao et al., 2019b). Additional disasters – including droughts and cold waves – also occurred during this period (Zhao et al., 2019b; Zheng et al., 2018). In 2018, extreme low-temperature events caused frost damage, significantly affecting agricultural productivity (China Meteorological Administration, https://www.cma.gov.cn, last access: 10 January 2024). These extreme events in the selected years contributed to significant yield reductions in the study area (Figs. 6 and 8)
In the four experimental years (Figs. 9 and 10, Table S7), WOFOST produced simulation results with a Pearson's r ranging from 0.81 to 0.87 (p<0.01), an R2 of 0.61 to 0.71 (p<0.01), an RMSE of 781.56 to 1043.28 kg ha−1 (RRMSE of 16.22 % to 23.83 %), and an MAE of 654.78 to 871.20 kg ha−1 (MRE of 14.07 % to 26.65 %). In comparison, WOFOST-EW achieved a Pearson's r of 0.91 to 0.94 (p<0.01), an R2 of 0.80 to 0.86 (p<0.01), an RMSE of 555.72 to 711.38 kg ha−1 (RRMSE of 11.53 % to 16.25 %), and an MAE of 372.25 to 587.84 kg ha−1 (MRE of 8.21 % to 19.15 %). Overall, WOFOST-EW demonstrated higher simulation accuracy.
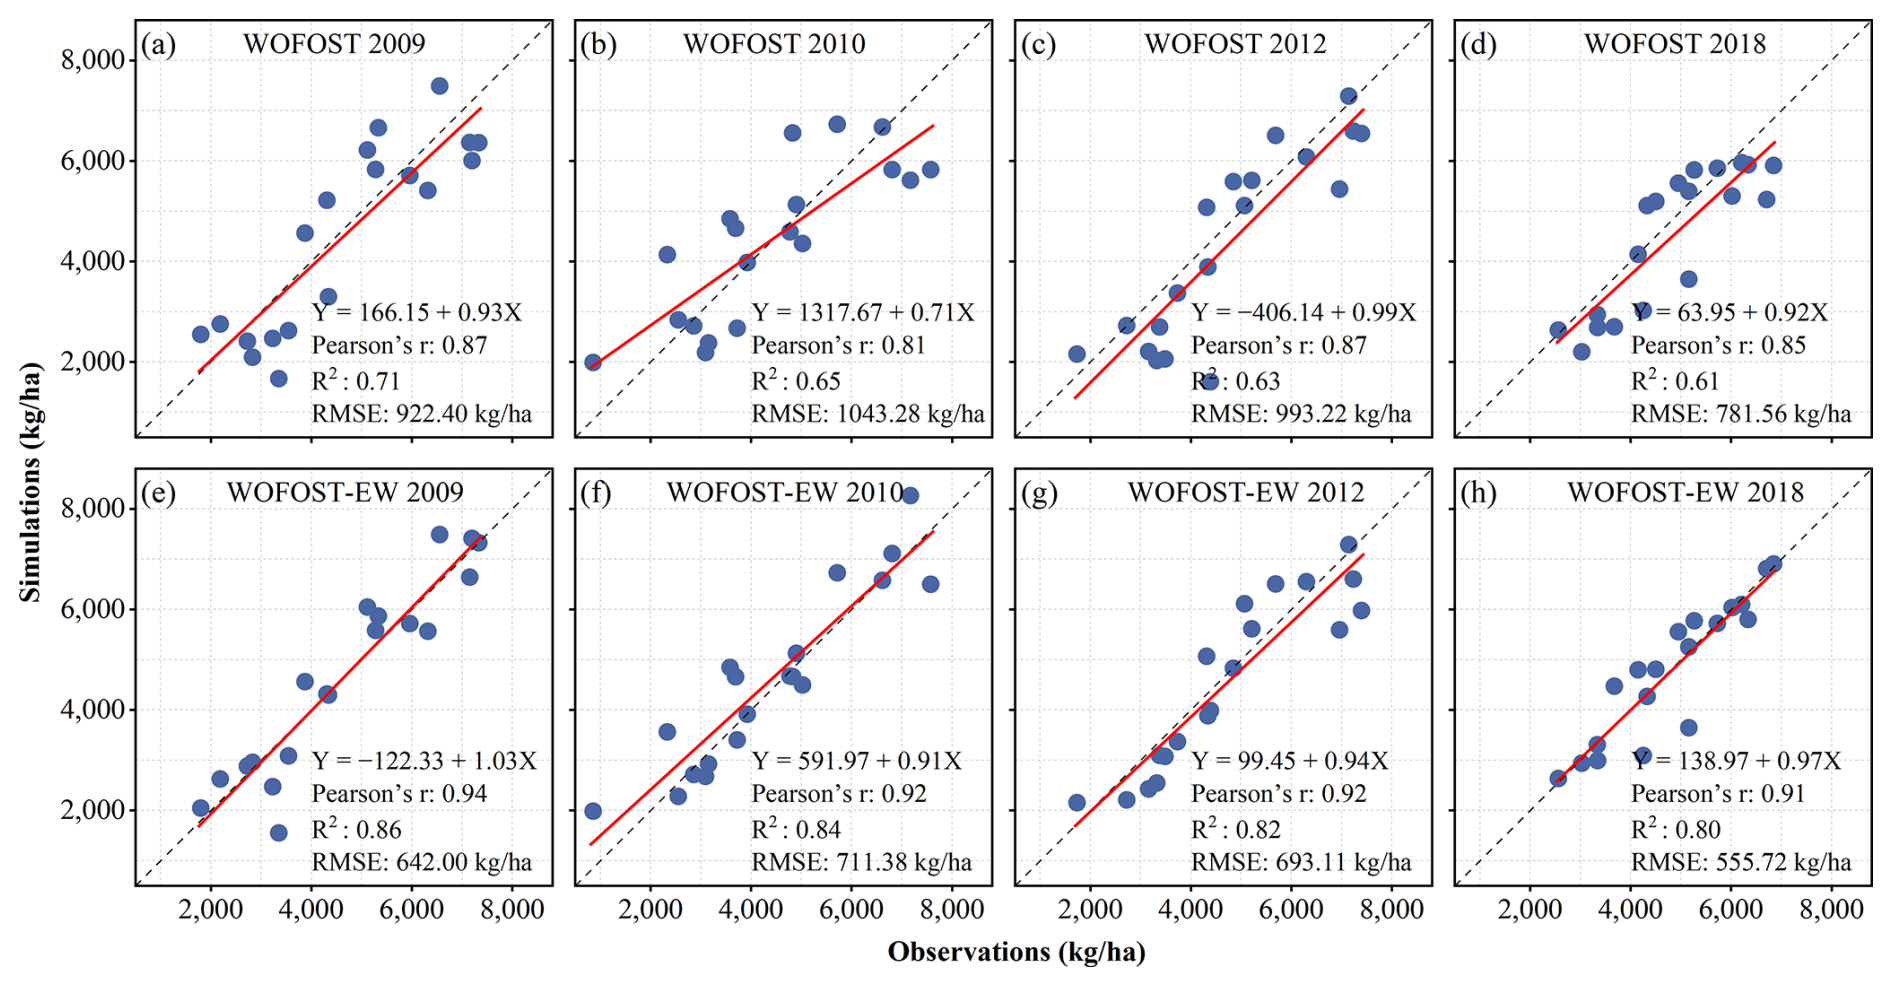
Figure 9Comparison of observed yields with simulated yields by the original WOFOST and the improved WOFOST-EW models in counties affected by extreme weather during 2009, 2010, 2012, and 2018. Panels (a) and (e) show the comparisons for 2009, (b) and (f) for 2010, (c) and (g) for 2012, and (d) and (h) for 2018. All correlation coefficients and R2 values are statistically significant at p<0.001.
4.1 Limitations of the temperature response function in the WOFOST model
In the WOFOST model, crop responses to temperature are represented by the function F(T) (Eqs. 2–5), which is simple and intuitive in form. Within the optimal temperature range, F(T) can approximate a linear relationship between temperature and crop development rates. However, it exhibits notable limitations in capturing the nonlinear stress effects associated with extreme temperature conditions.
First, the model does not account for the suppressive impacts of heat stress. When temperatures exceed the upper threshold Tm, F(T) remains constant, implying that crops cease to respond to further temperature increases. This overlooks the detrimental effects of extreme heat, such as inhibited photosynthesis, elevated respiration rates, and damage to reproductive organs, potentially leading to an overestimation of crop growth under high-temperature conditions. Second, the model oversimplifies cold stress. When temperatures fall below the base temperature Tb, the development rate is set to zero. While this indicates a conceptual halt in growth, it fails to differentiate between varying intensities of cold stress and their distinct physiological impacts on crops.
To address these limitations, this study introduces an extreme weather function F(EW), which incorporates the cumulative and phenological-stage-specific impacts of stressors such as heat, drought, and heavy precipitation. This function dynamically adjusts phenological development and enhances the model's sensitivity to extreme climatic events. Importantly, F(EW) does not replace F(T) but complements it – offering a more comprehensive framework for assessing the effects of climate extremes and climate change on crop production.
4.2 Impact of extreme weather events on the growth of winter wheat
Extreme weather events – such as heatwaves, frosts, droughts, and floods – have substantial impacts on crop growth and yield (Lüttger and Feike, 2017; Xiao et al., 2018; Zahra et al., 2021). Wheat phenology is particularly sensitive to meteorological factors like temperature and moisture, and extreme weather often leads to stage-specific disruptions in its developmental process (Asseng et al., 2015; Sadras and Monzon, 2006; Tao and Zhang, 2013; Zahra et al., 2021). In the North China Plain, both HDD and LDD fluctuate considerably during the winter wheat growing season, reflecting frequent exposure to severe heat and cold stress. This is consistent with previous findings indicating that winter wheat is often subject to extreme low temperatures prior to flowering and extreme high temperatures afterward – both of which significantly reduce yield (Bai et al., 2024). Studies have shown that elevated temperatures tend to shorten the wheat growing period, particularly affecting the sowing-to-flowering phase (Asseng et al., 2015; Li et al., 2020b; Sadras and Monzon, 2006; Tao and Zhang, 2013; Zahra et al., 2021). During early growth stages, moderate warming can enhance thermal accumulation and stimulate photosynthetic enzyme activity, promoting leaf area expansion and chlorophyll synthesis, and thereby accelerating heading and flowering (Chen et al., 2014; Li et al., 2020b; Tao et al., 2017a; Tao et al., 2017b). However, high temperatures following flowering can trigger premature leaf senescence and reduced photosynthetic capacity, leading to early maturity and shortened grain-filling duration (Harrison, 2021; Liu et al., 2023). Conversely, extreme low temperatures – particularly frost – can significantly delay development. Frost events may damage young spikes and floral organs, disrupting reproductive development (Fuller et al., 2007), while cold stress during the vegetative stage can cause visible injuries such as leaf tip burn (Shroyer et al., 1995). Rapid temperature drops are more damaging than gradual cooling (Al Issawi et al., 2013; Li et al., 2014b) and can impair organ formation even without reaching lethal thresholds. Cold stress also suppresses metabolic activity and delays cell division and elongation, especially prolonging the jointing-to-heading interval (Xiao et al., 2021). If such events occur during spike differentiation, they can lead to spikelet abortion or sterility, posing a severe threat to final yield.
Although drought or water stress is not typically the primary factor influencing phenology, it can still exert a significant impact in drought-prone regions (McMaster and Smika, 1988; McMaster and Wilhelm, 2003). The effect of drought depends on its timing, intensity, and the crop's developmental stage, often resulting in either accelerated development or developmental arrest (Chachar et al., 2016; Ihsan et al., 2016). Wheat has evolved several drought-resistance strategies to cope with water stress, including drought escape (accelerating the life cycle to avoid drought periods), drought avoidance (e.g., regulating stomatal behavior to minimize water loss), and drought tolerance (maintaining cellular function under stress conditions) (Nyaupane et al., 2024). While these adaptive responses enhance survival and confer a degree of yield stability, they are often associated with a shortened developmental cycle and advancement of phenological phases (Chachar et al., 2016; Chowdhury et al., 2021; Ihsan et al., 2016; McMaster and Wilhelm, 2003). Extreme precipitation events can also disrupt wheat development, primarily through waterlogging. Under flooded conditions, oxygen deficiency in the root zone inhibits root elongation and nutrient uptake (Chachar et al., 2016; Chowdhury et al., 2021; Ihsan et al., 2016; McMaster and Wilhelm, 2003), and in severe cases, may cause root death (Herzog et al., 2016). Additional negative effects include reduced root front expansion (Ebrahimi-Mollabashi et al., 2019), nutrient leaching (Kaur et al., 2020), and impaired water transport, all of which contribute to stomatal closure and diminished photosynthetic activity (Jitsuyama, 2017). Waterlogged conditions also elevate the risks of lodging and disease outbreaks (Nguyen et al., 2016). While most research has focused on the impacts of waterlogging on crop growth and yield, there is increasing recognition of the need to understand its effects on crop phenology (Nóia Júnior et al., 2023). Empirical studies have shown that waterlogging during critical early stages such as tillering and jointing can significantly suppress chlorophyll synthesis and photosynthetic capacity, impeding early growth and potentially delaying or disrupting subsequent phenological stages, including jointing and heading (Dickin and Wright, 2008; Wu et al., 2015).
Phenological stages play a crucial role in determining crop yield, and the phenological process itself serves as a primary pathway through which extreme weather influences crop production (Chachar et al., 2016; Chowdhury et al., 2021; Ihsan et al., 2016; McMaster and Wilhelm, 2003). However, most current crop models struggle to accurately simulate phenology under extreme conditions and often fail to capture phenological shifts induced by extreme weather events (Zhang and Tao, 2019). Enhancing the accuracy of phenology prediction under such conditions is therefore essential for overcoming key limitations in crop models and improving their ability to simulate crop performance under climate extremes (Pei et al., 2025). In this study, we employed seven climate indices to quantify extreme climate conditions and observed spatial variability in the impacts of extreme weather across different counties (Fig. 8). Against the backdrop of global warming, future changes in the frequency and intensity of extreme weather events may pose increasing risks to wheat production.
4.3 Uncertainty in simulation results
The uncertainty of crop model parameters is a complex and significant issue, with limited empirical data on crop development rates under extreme temperature conditions being a key factor. Previous studies have shown that the parameters of temperature response functions largely depend on field experimental data; however, these data often lack coverage of extreme temperature environments (Bai et al., 2022b; Ellis et al., 1992; Tollenaar, 1979; Watts, 1971; Zhang and Tao, 2019). A recent study (Zheng and Zhang, 2025b) highlighted that the rising frequency of extreme weather events leads to increased variability and unpredictability in meteorological observations (e.g., temperature and precipitation). Such variability complicates the derivation of stable and representative input parameters (e.g., thermal time, stress thresholds) for crop models, thereby introducing uncertainty into model simulations (Gao et al., 2020, 2021). This instability may lead to deviations in model outputs, ultimately affecting the accuracy of crop growth predictions. Additionally, obtaining reliable crop simulation parameters under extreme weather conditions is highly challenging. For instance, in the North China Plain, frequent high and low-temperature extremes can disrupt the consistency of daily weather inputs used in models (Gu et al., 2024). This inconsistency affects the reliability of key model parameters (e.g., effective temperature accumulation, phenological thresholds), ultimately reducing the accuracy of crop growth and yield simulations under such extreme conditions (Bai et al., 2024).
To address these challenges, we developed the WOFOST-EW model to better quantify the impacts of extreme weather events. This improved model demonstrated lower uncertainty and reduced fluctuation in simulation results. The phenological simulation results (Fig. 4) and yield simulation results (Figs. 5–7) showed that the improved model simulated crop growth more accurately, reducing bias and increasing the model's reliability.
4.4 Advantages and limitations of the WOFOST-EW model
In this study, we developed the F(EW) function, leveraging climate indices and LSTM algorithms, and successfully integrated it into the WOFOST model. The results demonstrate that the WOFOST-EW model significantly enhanced yield prediction accuracy in the counties impacted by extreme weather events (Figs. 9 and 10). By incorporating climate indices, the model achieves improved accuracy in predicting heading dates, maturity dates, and yield. After an evaluation of simulations from 1990 to 2020, the WOFOST-EW model demonstrated superior predictive accuracy. These findings confirm that the F(EW) function is a robust approach for enhancing model performance. Future research could explore its potential applications across other crops and regions to broaden its utility. Further analysis revealed that the WOFOST-EW model excelled in simulating wheat yields under extreme climate conditions. Notably, extreme weather events in 2009, 2010, 2012, and 2018 presented significant challenges for traditional modeling approaches. However, by integrating climate indices and LSTM algorithms, the improved model achieved a substantial enhancement in simulation accuracy (Figs. 9 and 10). The extreme weather correction factor F(EW) developed in this study relies on the complete growing-season weather sequence to capture stage-specific crop responses, enhancing end-of-season yield simulation. This dependence limits its use for in-season forecasts when future weather data are unavailable. Future work could address this by generating scenario-based F(EW) from seasonal forecasts or ensemble predictions, coupled with data assimilation to update it dynamically during crop growth.

Figure 10Distribution of simulation errors of the WOFOST model and WOFOST-EW in the counties affected by extreme weather in 2009 (a), 2010 (b), 2012 (c), and 2018 (d).
Previous studies have attempted to estimate the impacts of extreme weather events on crop yields using machine learning approaches. However, many of these studies have relied on outputs from crop models as inputs to machine learning algorithms, rather than directly modeling the weather-crop relationship (Feng et al., 2019a; Li et al., 2023; Shahhosseini et al., 2021; Zhuang et al., 2024). The key innovation of our model lies in the integration of an extreme weather function, F(EW), which enhances the ability of the model to capture the dynamic effects of extreme weather events on wheat yields. This theoretically improves prediction accuracy while maintaining a strong physiological basis. The WOFOST-EW model performs robustly not only under general climatic conditions but also under extreme weather scenarios, owing to the responsiveness and spatial-temporal specificity of the F(EW) variable. Moreover, WOFOST-EW exhibits broad applicability and holds potential for extension beyond the North China Plain to other regions and crop types. Future research could further improve the model by incorporating additional environmental and management-related data to enhance its adaptability and predictive accuracy under diverse conditions. Nevertheless, the physiological diversity across crops – including differences in growth cycles and environmental responses – presents challenges for direct transferability of the model. While WOFOST is a generic crop simulation model, its current structure and parameters are particularly well-suited to cereal crops. Application to crops with fundamentally different morphological or physiological characteristics (e.g., root vegetables, oilseeds, or perennials) would require substantial recalibration and structural adjustments. Additionally, although the LSTM-based deep learning component of WOFOST-EW lacks the biological transparency of traditional physiological models, the hybrid design enhances the model's explanatory power regarding extreme weather impacts. Regional variation in crop growth due to differences in climate, soil properties, and management practices further underscores the need for localized parameter calibration when applying the model to new regions or crop types. Currently, the F(EW) function in WOFOST-EW focuses primarily on meteorological stressors. However, crop performance is also influenced by complex and interacting non-meteorological factors such as soil fertility, pest and disease outbreaks, irrigation, and fertilization practices. This study assumes that crop growth is not limited by nutrient availability, it cannot reflect the dynamic regulatory effects of fertilization management and may underestimate the potential interactions between nutrient stress and climatic factors. A key direction for future development is the integration of these additional stressors – particularly sudden biotic pressures or severe nutrient limitations – and their interactions with extreme weather into the WOFOST-EW framework. Such advancements would further strengthen the model's realism and utility for decision-making under climate extremes.
During validation, the WOFOST-EW model underperformed in several counties (Fig. 5). Further investigation revealed that the primary reason for this was that, due to data limitations, we only accounted for the heading and maturity stages and omitted other key phenological periods of winter wheat. In addition, the F(EW) generated by the model is a season-scale scalar correction factor, which is applied to the calculation of crop development rates throughout the entire growing period. This incomplete consideration of growth stages likely impacted the model's ability to fully capture the crop's growth dynamics under varying conditions. Previous studies have shown that the effects of extreme climate events on crop production vary across different growth stages (Feng et al., 2019b; Porter and Gawith, 1999; Tack et al., 2015). During the wheat growth cycle, different stages experience varying types and intensities of climatic stress, resulting in significant differences in yield impacts. Moreover, severe droughts occurring during the critical growth stages from April to May are particularly likely to affect winter wheat yields (Xu et al., 2018; Yang et al., 2020). Additionally, a series of studies on different crop types and regions have demonstrated that crop yields are more vulnerable to droughts occurring during key growth stages (Pena-Gallardo et al., 2018; Potopova et al., 2015; Zipper et al., 2016). This phenomenon can be attributed to two main factors: (1) physiological differences and variations in field management practices across phenological stages (Wu et al., 2004), which result in distinct drought resistance capacities at different growth stages (Nesmith and Ritchie, 1992); and (2) the varying impacts of droughts on yield formation depending on the growth stage at which they occur (Zhao, 2001). This presents an important direction for future research and model improvement. By further refining the model to account for specific types and intensities of climatic stress at different growth stages, we can enhance prediction accuracy and better capture the impacts of extreme weather events on wheat yields.
In this study, we introduced the WOFOST-EW v1 by integrating extreme weather indices with the LSTM deep learning algorithm, aiming to improve the simulation of crop yield and phenology under extreme weather conditions, thereby enhancing its accuracy and robustness. Validation results from study stations in the study area over the period 1980–2020 show that the WOFOST-EW model outperformed the WOFOST model in both yield and phenology simulations. We validate WOFOST-EW using phenological, yield, and extreme weather data from agricultural meteorological stations in the North China Plain. The results show that WOFOST-EW improves simulation accuracy. The RRMSE for heading and maturity decreases from 4.61 % to 3.73 % and from 4.74 % to 3.98 %, respectively (with RMSE reductions of 10.64 % and 12.86 %). The R2 value for yield simulations increases from 0.67 to 0.76.
In addition, we further validate the WOFOST-EW model in years affected by extreme weather and find that, compared to the original WOFOST model (R2 ranging from 0.61 to 0.71), WOFOST-EW achieves more accurate results (R2 ranging from 0.80 to 0.86). The WOFOST-EW model we proposed not only enhances the simulation capability of crop growth under extreme weather events but also improves its robustness and accuracy. As extreme weather events become more frequent in the future, our model holds significant potential for application. WOFOST-EW model can help decision-makers more accurately assess the potential impacts of these events on crop yields, thereby supporting more effective agricultural planning and risk management. This will provide practical experience and technical support for the adaptation of agricultural systems and their sustainable development in the context of global climate change.
The WOFOST model used in this study is from version 6.0.6 of the PCSE (De Wit, 2018), available at https://pcse.readthedocs.io/en/stable/ (last access: 1 September 2024). The improved version of the model, WOFOST-EW v1, used in this study, is available at https://doi.org/10.5281/zenodo.15698320 (Zheng, 2025).
Meteorological data were obtained from https://www.ncei.noaa.gov (last access: 5 January 2024) (GSOD, 2023). Soil data were obtained from https://www.isric.org (last access: 15 January 2024) (https://doi.org/10.5194/soil-7-217-2021, Poggio et al., 2021).
The supplement related to this article is available online at https://doi.org/10.5194/gmd-18-8379-2025-supplement.
LY designed the project. JZ developed the model code with help from LY, ZD, XH, and LX. JZ wrote an initial draft of the paper. LY, ZD, and LX supervised the research, co-designed the experiments, and contributed to the manuscript. All authors participated in interpreting the results and refining the paper.
At least one of the (co-)authors is a member of the editorial board of Geoscientific Model Development. The peer-review process was guided by an independent editor, and the authors also have no other competing interests to declare.
Publisher's note: Copernicus Publications remains neutral with regard to jurisdictional claims made in the text, published maps, institutional affiliations, or any other geographical representation in this paper. While Copernicus Publications makes every effort to include appropriate place names, the final responsibility lies with the authors. Views expressed in the text are those of the authors and do not necessarily reflect the views of the publisher.
The authors would like to thank Wenchao Qi, Tao Liu, and Xiyu Li for their support and contributions to this work.
This work is supported by the National Key R&D Program of China (grant no. 2022YFE0195900), the National Key Scientific and Technological Infrastructure project “Earth System Science Numerical Simulator Facility” (EarthLab), and the open project of State Key Laboratory of Efficient Utilization of Arable Land in China, the Institute of Agricultural Resources and Regional Planning, Chinese Academy of Agricultural Sciences (grant no. EUAL-2025-03).
This paper was edited by Christian Folberth and reviewed by Theodoros Mavrommatis and one anonymous referee.
Ai, Z. and Hanasaki, N.: Simulation of crop yield using the global hydrological model H08 (crp.v1), Geosci. Model Dev., 16, 3275–3290, https://doi.org/10.5194/gmd-16-3275-2023, 2023.
Ai, Z., Hanasaki, N., Heck, V., Hasegawa, T., and Fujimori, S.: Simulating second-generation herbaceous bioenergy crop yield using the global hydrological model H08 (v.bio1), Geosci. Model Dev., 13, 6077–6092, https://doi.org/10.5194/gmd-13-6077-2020, 2020.
Al Issawi, M., Rihan, H. Z., El Sarkassy, N., and Fuller, M. P.: Frost Hardiness Expression and Characterisation in Wheat at Ear Emergence, J. Agron. Crop Sci., 199, 66–74, 2013.
Ali, T., Huang, J., Wang, J., and Xie, W.: Global Footprints of Water and Land Resources through China's Food Trade, Glob. Food Secur.-Agric. Policy, 12, 139–145, https://doi.org/10.1016/j.gfs.2016.11.003, 2017.
Al-Sakkaf, A. S., Zhang, J., Yao, F., Hamed, M. M., Simbi, C. H., Ahmed, A., and Shahid, S.: Assessing Exposure to Climate Extremes Over the Arabian Peninsula Using Era5 Reanalysis Data: Spatial Distribution and Temporal Trends, Atmos. Res., 300, 107224, https://doi.org/10.1016/j.atmosres.2024.107224, 2024.
Asseng, S., Ewert, F., Martre, P., Rötter, R. P., Lobell, D. B., Cammarano, D., Kimball, B. A., Ottman, M. J., Wall, G. W., and White, J. W.: Rising Temperatures Reduce Global Wheat Production, Nat. Clim. Chang., 5, 143–147, 2015.
Bai, H., Tang, J., Wang, B., Cao, J., and Feng, P.: Projecting Future Changes in Extreme Climate for Maize Production in the North China Plain and the Role of Adjusting the Sowing Date, Mitig. Adapt. Strateg. Glob. Chang., 27, 21, https://doi.org/10.1007/s11027-022-09995-4, 2022a.
Bai, H., Xiao, D., Wang, B., Liu, D. L., and Tang, J.: Simulation of Wheat Response to Future Climate Change Based on Coupled Model Inter-Comparison Project Phase 6 Multi-Model Ensemble Projections in the North China Plain, Front. Plant Sci., 13, 829580, https://doi.org/10.3389/fpls.2022.829580, 2022b.
Bai, H., Xiao, D., Tang, J., and Liu, D. L.: Evaluation of Wheat Yield in North China Plain Under Extreme Climate by Coupling Crop Model with Machine Learning, Comput. Electron. Agric., 217, 108651, https://doi.org/10.1016/j.compag.2024.108651, 2024.
Bai, S., Kang, Y., and Wan, S.: Drip Fertigation Regimes for Winter Wheat in the North China Plain, Agric. Water Manag., 228, 105885, https://doi.org/10.1016/j.agwat.2019.105885, 2020.
Baydaroğlu, Ö., Yeşilköy, S., and Demir, I.: A Causality Perspective on the Impact of Hydroclimatic Extremes on Crop Yields, EMS Annual Meeting 2024, Barcelona, Spain, 1–6 Sep 2024, EMS2024-291, https://doi.org/10.5194/ems2024-291, 2024.
Beyene, A. N., Zeng, H., Wu, B., Zhu, L., Gebremicael, T. G., Zhang, M., and Bezabh, T.: Coupling Remote Sensing and Crop Growth Model to Estimate National Wheat Yield in Ethiopia, Big Earth Data, 6, 18–35, https://doi.org/10.1080/20964471.2020.1837529, 2022.
Boori, M. S., Choudhary, K., Paringer, R., and Kupriyanov, A.: Machine Learning for Yield Prediction in Fergana Valley, Central Asia, Journal of the Saudi Society of Agricultural Sciences, 22, 107–120, https://doi.org/10.1016/j.jssas.2022.07.006, 2022.
Cao, J., Zhang, Z., Tao, F., Zhang, L., Luo, Y., Zhang, J., Han, J., and Xie, J.: Integrating Multi-Source Data for Rice Yield Prediction Across China Using Machine Learning and Deep Learning Approaches, Agric. For. Meteorol., 297, 108275, https://doi.org/10.1016/j.agrformet.2020.108275, 2021.
Chachar, M. H., Chachar, N. A., Chachar, Q., Mujtaba, S. M., Chachar, S., and Chachar, Z.: Physiological Characterization of Six Wheat Genotypes for Drought Tolerance, International Journal of Research – Granthaalayah, 4, 184–196, 2016.
Chen, J., Tian, Y., Zhang, X., Zheng, C., Song, Z., Deng, A., and Zhang, W.: Nighttime Warming Will Increase Winter Wheat Yield through Improving Plant Development and Grain Growth in North China, J. Plant Growth Regul., 33, 397–407, 2014.
Chen, Y., Zhang, Z., and Tao, F.: Improving Regional Winter Wheat Yield Estimation through Assimilation of Phenology and Leaf Area Index from Remote Sensing Data, Eur. J. Agron., 101, 163–173, https://doi.org/10.1016/j.eja.2018.09.006, 2018.
Chenu, K., Porter, J. R., Martre, P., Basso, B., Chapman, S. C., Ewert, F., Bindi, M., and Asseng, S.: Contribution of Crop Models to Adaptation in Wheat, Trends Plant Sci., 22, 472–490, https://doi.org/10.1016/j.tplants.2017.02.003, 2017.
Chowdhury, M. K., Hasan, M. A., Bahadur, M. M., Islam, M. R., Hakim, M. A., Iqbal, M. A., Javed, T., Raza, A., Shabbir, R., Sorour, S., Elsanafawy, N. E. M., Anwar, S., Alamri, S., Sabagh, A. E., and Islam, M. S.: Evaluation of Drought Tolerance of some Wheat (Triticum Aestivum L.) Genotypes through Phenology, Growth, and Physiological Indices, Agronomy, https://doi.org/10.3390/agronomy11091792, 2021.
De Wit, A.: PCSE: The Python Crop Simulation Environment, PCSE [code], https://pcse.readthedocs.io/en/stable/ (last access: 5 February 2024), 2018.
De Wit, A. and Boogaard, H.: A Gentle Introduction to WOFOST, Wageningen Environmental Research, November, https://www.wur.nl (last access: 5 February 2024), 2021.
De Wit, A., Boogaard, H. L., Supit, I., and van den Berg, M.: System Description of the WOFOST 7.2, Cropping Systems Model, Wageningen Environmental Research, https://research.wur.nl/en/publications/system-description-of-the-wofost-72-cropping-systems-model/ (last access: 5 February 2024), 2020.
de Wit, A., Boogaard, H., Fumagalli, D., Janssen, S., Knapen, R., van Kraalingen, D., Supit, I., van der Wijngaart, R., and van Diepen, K.: 25 Years of the WOFOST Cropping Systems Model, Agric. Syst., 168, 154–167, https://doi.org/10.1016/j.agsy.2018.06.018, 2018.
Dickin, E. and Wright, D.: The Effects of Winter Waterlogging and Summer Drought on the Growth and Yield of Winter Wheat (Triticum Aestivum L.), Eur. J. Agron., 28, 234–244, https://doi.org/10.1016/j.eja.2007.07.010, 2008.
Dinh, T. L. A. and Aires, F.: Nested leave-two-out cross-validation for the optimal crop yield model selection, Geosci. Model Dev., 15, 3519–3535, https://doi.org/10.5194/gmd-15-3519-2022, 2022.
Dong, X., Zhang, T., Yang, X., Li, T., and Li, X.: Rice Yield Benefits from Historical Climate Warming to be Negated by Extreme Heat in Northeast China, Int. J. Biometeorol., 67, 835–846, https://doi.org/10.1007/s00484-023-02458-8, 2023.
Ebrahimi-Mollabashi, E., Huth, N. I., Holzwoth, D. P., Ordóñez, R. A., Hatfield, J. L., Huber, I., Castellano, M. J., and Archontoulis, S. V.: Enhancing APSIM to Simulate Excessive Moisture Effects on Root Growth, Field Crops Res., 236, 58–67, 2019.
Ellis, R. H., Summerfield, R. J., Edmeades, G. O., and Roberts, E. H.: Photoperiod, Temperature, and the Interval from Sowing to Tassel Initiation in Diverse Cultivars of Maize, Crop Sci., 32, 1225–1232, https://doi.org/10.2135/cropsci1992.0011183X003200050033x, 1992.
Erenstein, O., Jaleta, M., Mottaleb, K. A., Sonder, K., Donovan, J., and Braun, H.: Global Trends in Wheat Production, Consumption and Trade, in: Wheat improvement: food security in a changing climate, Springer International Publishing Cham, 47–66, https://doi.org/10.1007/978-3-030-90673-3_4, 2022.
FAO: Food and Agriculture Organization of the United Nations, Roma: FAO, https://www.fao.org (last access: 5 February 2024), 2021.
Farooq, M., Bramley, H., Palta, J. A., and Siddique, K. H. M.: Heat Stress in Wheat During Reproductive and Grain-Filling Phases, Crit. Rev. Plant Sci., 30, 491–507, https://doi.org/10.1080/07352689.2011.615687, 2011.
Feng, P., Wang, B., Liu D. L., Waters, C., and Yu, Q.: Incorporating Machine Learning with Biophysical Model Can Improve the Evaluation of Climate Extremes Impacts on Wheat Yield in South-Eastern Australia, Agric. For. Meteorol., 275, 100–113, https://doi.org/10.1016/j.agrformet.2019.05.018, 2019a.
Feng, P., Wang, B., Li Liu, D., Waters, C., and Yu, Q.: Incorporating Machine Learning with Biophysical Model Can Improve the Evaluation of Climate Extremes Impacts on Wheat Yield in South-Eastern Australia, Agric. For. Meteorol., 275, 100–113, 2019b.
Fu, J., Jian, Y., Wang, X., Li, L., Ciais, P., Zscheischler, J., Wang, Y., Tang, Y., Müller, C., Webber, H., Yang, B., Wu, Y., Wang, Q., Cui, X., Huang, W., Liu, Y., Zhao, P., Piao, S., and Zhou, F.: Extreme Rainfall Reduces One-Twelfth of China'S Rice Yield Over the Last Two Decades, Nat. Food, 4, 416–426, https://doi.org/10.1038/s43016-023-00753-6, 2023.
Fuller, M. P., Fuller, A. M., Kaniouras, S., Christophers, J., and Fredericks, T.: The Freezing Characteristics of Wheat at Ear Emergence, Eur. J. Agron., 26, 435–441, 2007.
Gao, Y., Wallach, D., Liu, B., Dingkuhn, M., Boote, K. J., Singh, U., Asseng, S., Kahveci, T., He, J., and Zhang, R.: Comparison of Three Calibration Methods for Modeling Rice Phenology, Agric. For. Meteorol., 280, 107785, https://doi.org/10.1016/j.agrformet.2019.107785, 2020.
Gao, Y., Wallach, D., Hasegawa, T., Tang, L., Zhang, R., Asseng, S., Kahveci, T., Liu, L., He, J., and Hoogenboom, G.: Evaluation of Crop Model Prediction and Uncertainty Using Bayesian Parameter Estimation and Bayesian Model Averaging, Agric. For. Meteorol., 311, 108686, https://doi.org/10.1016/j.agrformet.2021.108686, 2021.
GSOD: Global Surface Summary of the Day, National Centers for Environmental Information [data set], https://www.ncei.noaa.gov (last access: 5 January 2024), 2023.
Gu, W., Ma, G., Wang, R., Scherer, L., He, P., Xia, L., Zhu, Y., Bi, J., and Liu, B.: Climate Adaptation through Crop Migration Requires a Nexus Perspective for Environmental Sustainability in the North China Plain, Nat. Food, 5, 569–580, 2024.
Guo, H., Hu, W., Yang, C., and Wan, F.: Moisture Sources and Atmospheric Circulation Patterns for Extreme Rainfall Event Over North China Plain from 29 July to 2 August 2023, Earth Space Sci., 11, e2024EA003956, https://doi.org/10.1029/2024ea003956, 2024.
Han, J., Zhang, Z., Cao, J., Luo, Y., Zhang, L., Li, Z., and Zhang, J.: Prediction of Winter Wheat Yield Based on Multi-Source Data and Machine Learning in China, Remote Sens., 12, 236, https://doi.org/10.3390/rs12020236, 2020.
Harrison, M. T.: Climate Change Benefits Negated by Extreme Heat, Nat. Food, 2, 855–856, https://doi.org/10.1038/s43016-021-00387-6, 2021.
Heinicke, S., Frieler, K. A., Jagermeyr, J., and Mengel, M.: Global Gridded Crop Models Underestimate Yield Responses to Droughts and Heatwaves, Environ. Res. Lett., 17, 44026, https://doi.org/10.1088/1748-9326/ac592e, 2022.
Herzog, M., Striker, G. G., Colmer, T. D., and Pedersen, O.: Mechanisms of Waterlogging Tolerance in Wheat – a Review of Root and Shoot Physiology, Plant Cell Environ., 39, 1068–1086, 2016.
Hong, Y. and Ying, S.: Characteristics of Extreme Temperature and Precipitation in China in 2017 Based on ETCCDI Indices, Adv. Clim. Chang. Res., 9, 218–226, https://doi.org/10.1016/j.accre.2019.01.001, 2018.
Hou, M., Li, Y., Biswas, A., Chen, X., Xie, L., Liu, D., Li, L., Feng, H., Wu, S., and Satoh, Y.: Concurrent Drought Threaten Wheat and Maize Production and Widen Crop Yield Gaps in the Future, Agric. Syst., 220, 104056, https://doi.org/10.1016/j.agsy.2024.104056, 2024.
Hu, S., Mo, X., and Lin, Z.: The Contribution of Climate Change to the Crop Phenology and Yield in Haihe River Basin, Geogr. Res., 33, 3–12, 2014.
Ihsan, M. Z., El-Nakhlawy, F. S., Ismail, S. M., Fahad, S., and Daur, I.: Wheat Phenological Development and Growth Studies as Affected by Drought and Late Season High Temperature Stress Under Arid Environment, Front. Plant Sci., 7, 795, https://doi.org/10.3389/fpls.2016.00795, 2016.
Iniyan, S., Akhil Varma, V., and Teja Naidu, C.: Crop Yield Prediction Using Machine Learning Techniques, Adv. Eng. Softw., 175, 103326, https://doi.org/10.1016/j.advengsoft.2022.103326, 2023.
Ji, H., Xiao, L., Xia, Y., Song, H., Liu, B., Tang, L., Cao, W., Zhu, Y., and Liu, L.: Effects of Jointing and Booting Low Temperature Stresses on Grain Yield and Yield Components in Wheat, Agric. For. Meteorol., 243, 33–42, https://doi.org/10.1016/j.agrformet.2017.04.016, 2017.
Ji, Z., Pan, Y., Zhu, X., Zhang, D., and Wang, J.: A Generalized Model to Predict Large-Scale Crop Yields Integrating Satellite-Based Vegetation Index Time Series and Phenology Metrics, Ecol. Indic., 137, 108759, https://doi.org/10.1016/j.ecolind.2022.108759, 2022.
Jitsuyama, Y.: Hypoxia-Responsive Root Hydraulic Conductivity Influences Soybean Cultivar-Specific Waterlogging Tolerance, American Journal of Plant Sciences, 8, 770, https://doi.org/10.4236/AJPS.2017.84054, 2017.
Kalchbrenner, N. E., Danihelka, I., and Graves, A. B.: Grid Long Short-Term Memory Neural Networks, Neural Comput., 9, 1735–1780, https://doi.org/10.1162/neco.1997.9.8.1735, 2019.
Kaur, G., Singh, G., Motavalli, P. P., Nelson, K. A., Orlowski, J. M., and Golden, B. R.: Impacts and Management Strategies for Crop Production in Waterlogged or Flooded Soils: A Review, Agron. J., 112, 1475–1501, 2020.
Khanal, S., Fulton, J., Klopfenstein, A., Douridas, N., and Shearer, S.: Integration of High Resolution Remotely Sensed Data and Machine Learning Techniques for Spatial Prediction of Soil Properties and Corn Yield, Comput. Electron. Agric., 153, 213–225, https://doi.org/10.1016/j.compag.2018.07.016, 2018.
Koehler, T., Wankmüller, F. J., Sadok, W., and Carminati, A.: Transpiration Response to Soil Drying Versus Increasing Vapor Pressure Deficit in Crops: Physical and Physiological Mechanisms and Key Plant Traits, J. Exp. Bot., 74, 4789–4807, 2023.
Kumar, R. and Mahapatra, R. P.: Severity of Natural Calamities and Crop Yield Prediction Using Hybrid Deep Learning Model in Uttar Pradesh, World Water Policy, 10, 244–279, 2024.
Lesk, C., Rowhani, P., and Ramankutty, N.: Influence of Extreme Weather Disasters on Global Crop Production, Nature, 529, 84–87, https://doi.org/10.1038/nature16467, 2016.
Li, L., Zhang, Y., Wang, B., Feng, P., He, Q., Shi, Y., Liu, K., Harrison, M. T., De Li Liu, Yao, N., Li, Y., He, J., Feng, H., Siddique, K. H. M., and Yu, Q.: Integrating Machine Learning and Environmental Variables to Constrain Uncertainty in Crop Yield Change Projections Under Climate Change, Eur. J. Agron., 149, 126917, https://doi.org/10.1016/j.eja.2023.126917, 2023.
Li, N., Lin, H., Wang, T., Li, Y., Liu, Y., Chen, X., and Hu, X.: Impact of Climate Change on Cotton Growth and Yields in Xinjiang, China, Field Crops Res., 247, 107590, https://doi.org/10.1016/j.fcr.2019.107590, 2020a.
Li, Q., Zhou, X., Chen, Y., and Yu, S.: Water Consumption Characteristics of Winter Wheat Grown Using Different Planting Patterns and Deficit Irrigation Regime, Agric. Water Manag., 105, 8–12, 2012.
Li, X., Cai, J., Liu, F., Dai, T., Cao, W., and Jiang, D.: Spring Freeze Effect on Wheat Yield is Modulated by Winter Temperature Fluctuations: Evidence from Meta-Analysis and Simulating Experiment, J. Agron. Crop Sci., 201, 288–300, https://doi.org/10.1111/jac.12115, 2014a.
Li, X., Cai, J., Liu, F., Dai, T., Cao, W., and Jiang, D.: Cold Priming Drives the Sub-Cellular Antioxidant Systems to Protect Photosynthetic Electron Transport Against Subsequent Low Temperature Stress in Winter Wheat, Plant Physiol. Biochem., 82, 34–43, 2014b.
Li, X., Tan, J., Wang, X., Han, G., Qian, Z., Li, H., Wang, L., and Niu, G.: Responses of Spring Wheat Yield and Growth Period to Different Future Climate Change Models in the Yellow River Irrigation Area Based on CMIP6 and WOFOST Models, Agric. For. Meteorol., 353, 110071, https://doi.org/10.1016/j.agrformet.2024.110071, 2024.
Li, Y., Hou, R., and Tao, F.: Interactive Effects of Different Warming Levels and Tillage Managements on Winter Wheat Growth, Physiological Processes, Grain Yield and Quality in the North China Plain, Agric. Ecosyst. Environ., 295, 106923, https://doi.org/10.1016/j.agee.2020.106923, 2020b.
Li, Z., Qing-Quan, C., Yu-Lin, J., Fu, C., and Yong-Deng, L.: Impacts of Climate Change on Drought Risk of Winter Wheat in the North China Plain, J. Integr. Agric., 20, 2601–2612, https://doi.org/10.1016/s2095-3119(20)63273-7, 2021.
Liu, B., Liu, L., Tian, L., Cao, W., Zhu, Y., and Asseng, S.: Post-Heading Heat Stress and Yield Impact in Winter Wheat of China., Glob. Change Biol., 20, 372–381, https://doi.org/10.1111/gcb.12442, 2013.
Liu, K., Harrison, M. T., Shabala, S., Meinke, H., Ahmed, I., Zhang, Y., Tian, X., and Zhou, M.: The State of the Art in Modeling Waterlogging Impacts on Plants: What Do we Know and What Do we Need to Know, Earth Future, 8, https://doi.org/10.1029/2020ef001801, 2020.
Liu, L., Xu, H., Liu, S., and Liu, X.: China's Response to Extreme Weather Events Must be Long Term, Nat. Food, 4, 1022–1023, https://doi.org/10.1038/s43016-023-00892-w, 2023.
Liu, Y., Han, M., Zhou, X., Li, W., Du, C., Zhang, Y., Zhang, Y., Sun, Z., and Wang, Z.: Optimizing Nitrogen Fertilizer Application Under Reduced Irrigation Strategies for Winter Wheat of the North China Plain, Irrig. Sci., 1–11, https://doi.org/10.1007/s00271-021-00764-w, 2022.
Lobell, D. B. and Burke, M. B.: On the Use of Statistical Models to Predict Crop Yield Responses to Climate Change, Agric. For. Meteorol., 150, 1443–1452, https://doi.org/10.1016/j.agrformet.2010.07.008, 2010.
Lobell, D. B., Schlenker, W., and Costa-Roberts, J.: Climate Trends and Global Crop Production Since 1980, Science, 333, 616–620, 2011.
Lu, Y. and Yang, X.: Using the anomaly forcing Community Land Model (CLM 4.5) for crop yield projections, Geosci. Model Dev., 14, 1253–1265, https://doi.org/10.5194/gmd-14-1253-2021, 2021.
Lüttger, A. B. and Feike, T.: Development of Heat and Drought Related Extreme Weather Events and their Effect on Winter Wheat Yields in Germany, Theor. Appl. Climatol., 132, 15–29, https://doi.org/10.1007/s00704-017-2076-y, 2017.
Ma, Y., Zhang, Z., Kang, Y., and Ozdogan, M.: Corn Yield Prediction and Uncertainty Analysis Based on Remotely Sensed Variables Using a Bayesian Neural Network Approach, Remote Sens. Environ., 259, 112408, https://doi.org/10.1016/j.rse.2021.112408, 2021.
Maimaitijiang, M., Sagan, V., Sidike, P., Hartling, S., Esposito, F., and Fritschi, F. B.: Soybean Yield Prediction from UAV Using Multimodal Data Fusion and Deep Learning, Remote Sens. Environ., 237, 111599, https://doi.org/10.1016/j.rse.2019.111599, 2019.
McMaster, G. S. and Smika, D. E.: Estimation and Evaluation of Winter Wheat Phenology in the Central Great Plains, Agric. For. Meteorol., 43, 1–18, https://doi.org/10.1016/0168-1923(88)90002-0, 1988.
McMaster, G. S. and Wilhelm, W. W.: Phenological Responses of Wheat and Barley to Water and Temperature: Improving Simulation Models, The Journal of Agricultural Science, 141, 129–147, 2003.
Mo, X., Hu, S., Lin, Z., Liu, S., and Xia, J.: Impacts of Climate Change on Agricultural Water Resources and Adaptation on the North China Plain, Adv. Clim. Chang. Res., 8, 93–98, https://doi.org/10.1016/j.accre.2017.05.007, 2017.
Nesmith, D. S. and Ritchie, J. T.: Maize (Zea Mays L.) Response to a Severe Soil Water-Deficit During Grain-Filling, Field Crops Res., 29, 23–35, https://doi.org/10.1016/0378-4290(92)90073-i, 1992.
Nguyen, T., Son, S., Jordan, M. C., Levin, D. B., and Ayele, B. T.: Lignin Biosynthesis in Wheat (Triticum Aestivum L.): Its Response to Waterlogging and Association with Hormonal Levels, BMC Plant Biol., 16, 1–16, 2016.
Nóia Júnior, R. D. S., Asseng, S., García-Vila, M., Liu, K., Stocca, V., Dos Santos Vianna, M., Weber, T. K. D., Zhao, J., Palosuo, T., and Harrison, M. T.: A Call to Action for Global Research on the Implications of Waterlogging for Wheat Growth and Yield, Agric. Water Manag., 284, 108334, https://doi.org/10.1016/j.agwat.2023.108334, 2023.
Nyaupane, S., Poudel, M. R., Panthi, B., Dhakal, A., Paudel, H., and Bhandari, R.: Drought Stress Effect, Tolerance, and Management in Wheat – a Review, Cogent Food Agr., 10, 2296094, https://doi.org/10.1080/23311932.2023.2296094, 2024.
Osman, R., Zhu, Y., Ma, W., Zhang, D., Ding, Z., Liu, L., Tang, L., Liu, B., and Cao, W.: Comparison of Wheat Simulation Models for Impacts of Extreme Temperature Stress on Grain Quality, Agric. For. Meteorol., 288–289, 107995, https://doi.org/10.1016/j.agrformet.2020.107995, 2020.
Oubaha, A., Ongoma, V., Hssaine, B. A., Bouchaou, L., and Chehbouni, A.: Evaluation of the Performance of Meteorological Drought Indices in Morocco: A Case Study of Different Climatic Zones, Int. J. Climatol., 44, 4009–4031, 2024.
Panigrahy, S.: SMOTE-Based Deep LSTM System with GridSearchCV Optimization for Intelligent Diabetes Diagnosis, J. Electr. Syst., 20, 804–815, https://doi.org/10.52783/jes.3455, 2024.
Peethani, S., Pathakoti, M., Kheir, A. M., Singh, A., and Govind, A.: Variability of ENSO Teleconnections Indices, and its Impacts on Moroccan Agriculture, J. Atmos. Sol.-Terr. Phys., 265, 106386, https://doi.org/10.1016/j.jastp.2024.106386, 2024.
Pei, J., Zou, Y., Liu, Y., He, Y., Tan, S., Wang, T., and Huang, J.: Downscaling Administrative-Level Crop Yield Statistics to 1 Km Grids Using Multi-Source Remote Sensing Data and Ensemble Machine Learning, IEEE J. Sel. Top. Appl. Earth Observ. Remote Sens., https://doi.org/10.1109/JSTARS.2024.3441252, 2024.
Pei, J., Tan, S., Zou, Y., Liao, C., He, Y., Wang, J., Huang, H., Wang, T., Tian, H., Fang, H., Wang, L., and Huang, J.: The Role of Phenology in Crop Yield Prediction: Comparison of Ground-Based Phenology and Remotely Sensed Phenology, Agric. For. Meteorol., 361, 110340, https://doi.org/10.1016/j.agrformet.2024.110340, 2025.
Pena-Gallardo, M., Vicente-Serrano, S. M., Quiring, S., Svoboda, M., Hannaford, J., Tomas-Burguera, M., Martin-Hernandez, N., Dominguez-Castro, F., and Kenawy, A. E.: Response of Crop Yield to Different Time-Scales of Drought in the United States: Spatio-Temporal Patterns and Climatic and Environmental Drivers, Agric. For. Meteorol., 264, 40–55, https://doi.org/10.1016/j.agrformet.2018.09.019, 2018.
Poggio, L., De Sousa, L. M., Batjes, N. H., Heuvelink, G. B., Kempen, B., Ribeiro, E., and Rossiter, D.: SoilGrids 2.0: producing soil information for the globe with quantified spatial uncertainty, Soil, 7, 217–240, https://doi.org/10.5194/soil-7-217-2021, 2021.
Porter, J. R. and Gawith, M.: Temperatures and the Growth and Development of Wheat: A Review, Eur. J. Agron., 10, 23–36, https://doi.org/10.1016/s1161-0301(98)00047-1, 1999.
Potopova, V., Stepanek, P., Mozny, M., Tuerkott, L., and Soukup, J.: Performance of the Standardised Precipitation Evapotranspiration Index at Various Lags for Agricultural Drought Risk Assessment in the Czech Republic, Agric. For. Meteorol., 202, 26–38, https://doi.org/10.1016/j.agrformet.2014.11.022, 2015.
Powell, J. P. and Reinhard, S.: Measuring the Effects of Extreme Weather Events on Yields, Weather Clim. Extremes, 12, 69–79, https://doi.org/10.1016/j.wace.2016.02.003, 2016.
Ray, D. K., Gerber, J. S., Macdonald, G. K., and West, P. C.: Climate Variation Explains a Third of Global Crop Yield Variability, Nat. Commun., 6, 5989, https://doi.org/10.1038/ncomms6989, 2015.
Reynolds, M. P., Slafer, G. A., Foulkes, J. M., Griffiths, S., Murchie, E. H., Carmo-Silva, E., Asseng, S., Chapman, S. C., Sawkins, M., Gwyn, J., and Flavell, R. B.: Author Correction: A Wiring Diagram to Integrate Physiological Traits of Wheat Yield Potential, Nat. Food, 3, 665, https://doi.org/10.1038/s43016-022-00574-z, 2022.
Rezaei, E. E., Siebert, S., Manderscheid, R., Mueller, J., Mahrookashani, A., Ehrenpfordt, B., Haensch, J., Weigel, H., and Ewert, F.: Quantifying the Response of Wheat Yields to Heat Stress: The Role of the Experimental Setup, Field Crops Res., 217, 93–103, https://doi.org/10.1016/j.fcr.2017.12.015, 2018.
Ringeval, B., Müller, C., Pugh, T. A. M., Mueller, N. D., Ciais, P., Folberth, C., Liu, W., Debaeke, P., and Pellerin, S.: Potential yield simulated by global gridded crop models: using a process-based emulator to explain their differences, Geosci. Model Dev., 14, 1639–1656, https://doi.org/10.5194/gmd-14-1639-2021, 2021.
Roberts, M. J., Braun, N. O., Sinclair, T. R., Lobell, D. B., and Schlenker, W.: Comparing and Combining Process-Based Crop Models and Statistical Models with some Implications for Climate Change, Environ. Res. Lett., 12, 95010, https://doi.org/10.1088/1748-9326/aa7f33, 2017.
Ruan, G., Li, X., Yuan, F., Cammarano, D., Ata-Ui-Karim, S. T., Liu, X., Tian, Y., Zhu, Y., Cao, W., and Cao, Q.: Improving Wheat Yield Prediction Integrating Proximal Sensing and Weather Data with Machine Learning, Comput. Electron. Agric., 195, 106852, https://doi.org/10.1016/j.compag.2022.106852, 2022.
Sadras, V. O. and Monzon, J. P.: Modelled Wheat Phenology Captures Rising Temperature Trends: Shortened Time to Flowering and Maturity in Australia and Argentina, Field Crops Res., 99, 136–146, 2006.
Shahhosseini, M., Hu, G., Huber, I., and Archontoulis, S. V.: Coupling Machine Learning and Crop Modeling Improves Crop Yield Prediction in the US Corn Belt, Sci. Rep., 11, 1606, https://doi.org/10.1038/s41598-020-80820-1, 2021.
Shen, R., Dong, J., Yuan, W., Han, W., Ye, T., and Zhao, W.: A 30 M Resolution Distribution Map of Maize for China Based on Landsat and Sentinel Images, Journal of Remote Sensing, 2022, https://doi.org/10.34133/2022/9846712, 2022.
Shi, J., Wang, Z., Zhang, Z., Fei, Y., Li, Y., Zhang, F. E., Chen, J., and Qian, Y.: Assessment of Deep Groundwater Over-Exploitation in the North China Plain, Earth Science Frontiers, 2, 593–598, https://doi.org/10.1016/j.gsf.2011.07.002, 2011.
Shroyer, J. P., Mikesell, M. E., and Paulsen, G. M. (Eds.): Spring Freeze Injury to Kansas Wheat, Cooperative Extension Service, Kansas State University, https://bookstore.ksre.k-state.edu/item/spring-freeze-injury-to-kansas-wheat_C646 (last access: 10 February 2024), 1995.
Singh Boori, M., Choudhary, K., Paringer, R., and Kupriyanov, A.: Machine Learning for Yield Prediction in Fergana Valley, Central Asia, Journal of the Saudi Society of Agricultural Sciences, 22, 107–120, https://doi.org/10.1016/j.jssas.2022.07.006, 2023.
SM, S. I., Mount, J., and Demir, I.: Assessment of Drought Impacts on Crop Yields (Corn and Soybeans) Across Iowa During 2000–2022, Authorea, https://doi.org/10.22541/au.173890810.01900586/v1, 2025.
Song, Y., Linderholm, H. W., Wang, C., Tian, J., Huo, Z., Gao, P., Song, Y., and Guo, A.: The Influence of Excess Precipitation on Winter Wheat Under Climate Change in China from 1961 to 2017., Sci. Total Environ., 690, 189–196, https://doi.org/10.1016/j.scitotenv.2019.06.367, 2019.
Sun, J., Lai, Z., Di, L., Sun, Z., Tao, J., and Shen, Y.: Multilevel Deep Learning Network for County-Level Corn Yield Estimation in the Us Corn Belt, IEEE J. Sel. Top. Appl. Earth Observ. Remote Sens., 13, 5048–5060, https://doi.org/10.1109/JSTARS.2020.3019046, 2020.
Sun, Q., Kröbel, R., Müller, T., Römheld, V., Cui, Z., Zhang, F., and Chen, X.: Optimization of Yield and Water-Use of Different Cropping Systems for Sustainable Groundwater Use in North China Plain, Agric. Water Manag., 98, 808–814, 2011.
Supit, I., Hooijer, A. A., and Van Diepen, C. A.: System Description of the WOFOST 6.0 Crop Simulation Model Implemented in CGMS, Vol. 1: Theory and Algorithms, Joint Research Centre, Commission of the European Communities, EUR, 15956, 146 pp., https://op.europa.eu/en/publication-detail/-/publication/a99325a7-c776-11e6-a6db-01aa75ed71a1 (last access: 5 February 2024), 1994.
Tack, J., Barkley, A., and Nalley, L. L.: Effect of Warming Temperatures on US Wheat Yields, P. Natl. Acad. Sci. USA, 112, 6931–6936, https://doi.org/10.1073/pnas.1415181112, 2015.
Tang, R., Supit, I., Hutjes, R., Zhang, F., Wang, X., Chen, X., Zhang, F., and Chen, X.: Modelling Growth of Chili Pepper (Capsicum Annuum L.) With the WOFOST Model, Agric. Syst., 209, 103688, https://doi.org/10.1016/j.agsy.2023.103688, 2023.
Tao, F. and Zhang, Z.: Climate Change, Wheat Productivity and Water Use in the North China Plain: A New Super-Ensemble-Based Probabilistic Projection, Agric. For. Meteorol., 170, 146–165, 2013.
Tao, F., Zhang, Z., Zhang, S., Zhu, Z., and Shi, W.: Response of Crop Yields to Climate Trends Since 1980 in China, Clim. Res., 54, 233–247, https://doi.org/10.3354/cr01131, 2012.
Tao, F., Rötter, R. P., Palosuo, T., Díaz-Ambrona, C. G. H., Mínguez, M. I., Semenov, M. A., Kersebaum, K. C., Nendel, C., Cammarano, D., and Hoffmann, H.: Designing Future Barley Ideotypes Using a Crop Model Ensemble, Eur. J. Agron., 82, 144–162, 2017a.
Tao, F., Xiao, D., Zhang, S., Zhang, Z., and Rötter, R. P.: Wheat Yield Benefited from Increases in Minimum Temperature in the Huang-Huai-Hai Plain of China in the Past Three Decades, Agric. For. Meteorol., 239, 1–14, 2017b.
Tian, H., Wang, P., Tansey, K., Zhang, J., Zhang, S., and Li, H.: An LSTM Neural Network for Improving Wheat Yield Estimates by Integrating Remote Sensing Data and Meteorological Data in the Guanzhong Plain, PR China, Agric. For. Meteorol., 310, 108629, https://doi.org/10.1016/j.agrformet.2021.108629, 2021.
Tollenaar, M.: Effect of Temperature on Rate of Leaf Appearance and Flowering Date in Maize, Crop Sci., 19, https://doi.org/10.2135/cropsci1979.0011183X001900030022x, 1979.
Torsoni, G. B., de Oliveira Aparecido, L. E., Santos, G. M. D., Chiquitto, A. G., Moraes, J. R. D. S., and de Souza Rolim, G.: Correction to: Soybean Yield Prediction by Machine Learning and Climate, Theor. Appl. Climatol., 151, 1709–1725, https://doi.org/10.1007/s00704-023-04389-1, 2023.
Wang, B., Waters, C., Orgill, S., Cowie, A., Clark, A., De Li Liu, Simpson, M., Mcgowen, I., and Sides, T.: Estimating Soil Organic Carbon Stocks Using Different Modelling Techniques in the Semi-Arid Rangelands of Eastern Australia, Ecol. Indic., 88, 425–438, https://doi.org/10.1016/j.ecolind.2018.01.049, 2018.
Wang, J., Yang, Y., Huang, J., and Adhikari, B.: Adaptive Irrigation Measures in Response to Extreme Weather Events: Empirical Evidence from the North China Plain, Reg. Environ. Change, 19, 1009–1022, https://doi.org/10.1007/s10113-018-1442-3, 2019.
Wang, T., Li, N., Li, Y., Lin, H., Yao, N., Chen, X., De Li Liu, Yu, Q., and Feng, H.: Impact of Climate Variability on Grain Yields of Spring and Summer Maize, Comput. Electron. Agric., 199, 107101, https://doi.org/10.1016/j.compag.2022.107101, 2022.
Wang, X., Wang, S., Li, X., Chen, B., Wang, J., Huang, M., and Rahman, A.: Modelling Rice Yield with Temperature Optima of Rice Productivity Derived from Satellite NIRv in Tropical Monsoon Area, Agric. For. Meteorol., 294, 108135, https://doi.org/10.1016/j.agrformet.2020.108135, 2020.
Watts, W. R.: Role of Temperature in the Regulation of Leaf Extension in Zea Mays, Nature, 229, 46–47, 1971.
Wei, Z., Bian, D., Du, X., Gao, Z., Li, C., Liu, G., Yang, Q., Jiang, A., and Cui, Y.: An Increase in Solar Radiation in the Late Growth Period of Maize Alleviates the Adverse Effects of Climate Warming on the Growth and Development of Maize, Agronomy-Basel, 13, 1284, https://doi.org/10.3390/agronomy13051284, 2023.
Wu, H., Hubbard, K. G., and Wilhite, D. A.: An Agricultural Drought Risk-Assessment Model for Corn and Soybeans, Int. J. Climatol., 24, 723–741, https://doi.org/10.1002/joc.1028, 2004.
Wu, X., Tang, Y., Li, C., Wu, C., and Huang, G.: Chlorophyll Fluorescence and Yield Responses of Winter Wheat to Waterlogging at Different Growth Stages, Plant Prod. Sci., 18, 284–294, 2015.
Xiao, D., De Li Liu, Wang, B., Feng, P., Bai, H., and Tang, J.: Climate Change Impact on Yields and Water Use of Wheat and Maize in the North China Plain Under Future Climate Change Scenarios, Agric. Water Manag., 238, 106238, https://doi.org/10.1016/j.agwat.2020.106238, 2020.
Xiao, L., Liu, L., Asseng, S., Xia, Y., Tang, L., Liu, B., Cao, W., and Zhu, Y.: Estimating Spring Frost and its Impact on Yield Across Winter Wheat in China, Agric. For. Meteorol., 260, 154–164, https://doi.org/10.1016/j.agrformet.2018.06.006, 2018.
Xiao, L., Liu, B., Zhang, H., Gu, J., Fu, T., Asseng, S., Liu, L., Tang, L., Cao, W., and Zhu, Y.: Modeling the Response of Winter Wheat Phenology to Low Temperature Stress at Elongation and Booting Stages, Agric. For. Meteorol., 303, 108376, https://doi.org/10.1016/j.agrformet.2021.108376, 2021.
Xiao, L., Wang, G., Wang, E., Liu, S., Chang, J., Zhang, P., Zhou, H., Wei, Y., Zhang, H., Zhu, Y., Shi, Z., and Luo, Z.: Spatiotemporal Co-Optimization of Agricultural Management Practices Towards Climate-Smart Crop Production, Nat. Food, 5, 59–71, https://doi.org/10.1038/s43016-023-00891-x, 2024.
Xu, X., Gao, P., Zhu, X., Guo, W., Ding, J., and Li, C.: Estimating the Responses of Winter Wheat Yields to Moisture Variations in the Past 35 Years in Jiangsu Province of China, PLoS One, 13, e0191217, https://doi.org/10.1371/journal.pone.0191217, 2018.
Yan, H., Wang, S. Q., Wang, J. B., Lu, H. Q., Guo, A. H., Zhu, Z. C., Myneni, R. B., and Shugart, H. H.: Assessing Spatiotemporal Variation of Drought in China and its Impact on Agriculture During 1982–2011 by Using PDSI Indices and Agriculture Drought Survey Data, J. Geophys. Res.-Atmos., 121, 2283–2298, 2016.
Yang, H., Gao, X., Sun, M., Wang, A., Sang, Y., Wang, J., Zhao, X., Zhang, S., and Ariyasena, H.: Spatial and Temporal Patterns of Drought Based on RW-PDSI Index on Loess Plateau in the Past Three Decades, Ecol. Indic., 166, 112409, https://doi.org/10.1016/j.ecolind.2024.112409, 2024.
Yang, J., Wu, J., Liu, L., Zhou, H., Gong, A., Han, X., and Zhao, W.: Responses of Winter Wheat Yield to Drought in the North China Plain: Spatial–Temporal Patterns and Climatic Drivers, Water, 12, 3094, https://doi.org/10.3390/w12113094, 2020.
Yang, R., Dai, P., Wang, B., Jin, T., Liu, K., Fahad, S., Harrison, M. T., Man, J., Shang, J., Meinke, H., Liu, D., Wang, X., Zhang, Y., Zhou, M., Tian, Y., and Yan, H.: Over-Optimistic Projected Future Wheat Yield Potential in the North China Plain: The Role of Future Climate Extremes, Agronomy-Basel, 12, 145, https://doi.org/10.3390/agronomy12010145, 2022.
Yin, Z., Wang, H., and Chen, H.: Understanding severe winter haze events in the North China Plain in 2014: roles of climate anomalies, Atmos. Chem. Phys., 17, 1641–1651, https://doi.org/10.5194/acp-17-1641-2017, 2017.
Yu, L., Du, Z., Li, X., Zheng, J., Zhao, Q., Wu, H., Weise, D., Yang, Y., Zhang, Q., Li, X., Ma, X., and Huang, X.: Enhancing Global Agricultural Monitoring System for Climate-Smart Agriculture, Climate Smart Agriculture, 2, 100037, https://doi.org/10.1016/j.csag.2024.100037, 2025.
Yu, X., Niu, L., Zhang, Y., Xu, Z., Zhang, J., Zhang, S., and Li, J.: Vapour Pressure Deficit Affects Crop Water Productivity, Yield, and Quality in Tomatoes, Agric. Water Manag., 299, 108879, https://doi.org/10.1016/j.agwat.2024.108879, 2024.
Zahra, N., Wahid, A., Hafeez, M. B., Ullah, A., Siddique, K. H. M., and Farooq, M.: Grain Development in Wheat Under Combined Heat and Drought Stress: Plant Responses and Management, Environ. Exp. Bot., 188, 104517, https://doi.org/10.1016/j.envexpbot.2021.104517, 2021.
Zhang, Q. and Miao, C.: A New High-Resolution Multi-Drought Indices Dataset for Mainland China; CHM_Drought, figshare [data set], https://doi.org/10.6084/m9.figshare.25656951.v2, 2024.
Zhang, Q., Miao, C., Su, J., Gou, J., Hu, J., Zhao, X., and Xu, Y.: A new high-resolution multi-drought-index dataset for mainland China, Earth Syst. Sci. Data, 17, 837–853, https://doi.org/10.5194/essd-17-837-2025, 2025.
Zhang, S. and Tao, F.: Improving Rice Development and Phenology Prediction Across Contrasting Climate Zones of China, Agric. For. Meteorol., 268, 224–233, https://doi.org/10.1016/j.agrformet.2019.01.019, 2019.
Zhang, S., Tao, F., and Zhang, Z.: Changes in Extreme Temperatures and their Impacts on Rice Yields in Southern China from 1981 to 2009, Field Crops Res., 189, 43, https://doi.org/10.1016/j.fcr.2016.02.008, 2016.
Zhang, S., Tao, F., and Zhang, Z.: Spatial and Temporal Changes in Vapor Pressure Deficit and their Impacts on Crop Yields in China During 1980–2008, J. Meteorol. Res., 31, 800–808, 2017a.
Zhang, S., Tao, F., and Zhang, Z.: Uncertainty from Model Structure is Larger than that from Model Parameters in Simulating Rice Phenology in China, Eur. J. Agron., 87, 30–39, https://doi.org/10.1016/j.eja.2017.04.004, 2017b.
Zhao, S.: Effects of Water Deficits on Yield and WUE in Winter Wheat, Irrig. Drain., 20, 56–69, 2001.
Zhao, Y., Xu, X., Li, J., Zhang, R., Kang, Y., Huang, W., Xia, Y., Liu, D., and Sun, X.: The Large-Scale Circulation Patterns Responsible for Extreme Precipitation Over the North China Plain in Midsummer, J. Geophys. Res.-Atmos., 124, 12794–12809, https://doi.org/10.1029/2019jd030583, 2019a.
Zhao, Y., Xu, X., Li, J., Zhang, R., Kang, Y., Huang, W., Xia, Y., Liu, D., and Sun, X.: The Large-Scale Circulation Patterns Responsible for Extreme Precipitation Over the North China Plain in Midsummer, J. Geophys. Res.-Atmos., 124, 12794–12809, 2019b.
Zhao, Y., Xiao, D., Bai, H., Tang, J., De Li Liu, Qi, Y., and Shen, Y.: The Prediction of Wheat Yield in the North China Plain by Coupling Crop Model with Machine Learning Algorithms, Agriculture-Basel, 13, 99, https://doi.org/10.3390/agriculture13010099, 2022.
Zheng, J.: WOFOST-EW v1: Enhanced WOFOST for Extreme Weather, Zenodo [code], https://doi.org/10.5281/zenodo.15698320, 2025.
Zheng, J. and Zhang, S.: Improving Rice Phenology Simulations Based on the Bayesian Model Averaging Method, Eur. J. Agron., 142, 126646, https://doi.org/10.1016/j.eja.2022.126646, 2023.
Zheng, J. and Zhang, S.: Assessing the Impact of Climate Change on Winter Wheat Production in the North China Plain from 1980 to 2020, Agriculture-Basel, 15, 449, https://doi.org/10.3390/agriculture15050449, 2025a.
Zheng, J. and Zhang, S.: Decomposing the Total Uncertainty in Wheat Modeling: An Analysis of Model Structure, Parameters, Weather Data Inputs, and Squared Bias Contributions, Agric. Syst., 224, 104215, https://doi.org/10.1016/j.agsy.2024.104215, 2025b.
Zheng, J., Yu, Y., Zhang, X., and Hao, Z.: Variation of extreme drought and flood in North China revealed by document-based seasonal precipitation reconstruction for the past 300 years, Clim. Past, 14, 1135–1145, https://doi.org/10.5194/cp-14-1135-2018, 2018.
Zhuang, H., Zhang, Z., Cheng, F., Han, J., Luo, Y., Zhang, L., Cao, J., Zhang, J., He, B., Xu, J., and Tao, F.: Integrating Data Assimilation, Crop Model, and Machine Learning for Winter Wheat Yield Forecasting in the North China Plain, Agric. For. Meteorol., 347, 109909, https://doi.org/10.1016/j.agrformet.2024.109909, 2024.
Zipper, S. C., Qiu, J., and Kucharik, C. J.: Drought Effects on US Maize and Soybean Production: Spatiotemporal Patterns and Historical Changes, Environ. Res. Lett., 11, 94021, https://doi.org/10.1088/1748-9326/11/9/094021, 2016.