the Creative Commons Attribution 4.0 License.
the Creative Commons Attribution 4.0 License.
Combining empirical and mechanistic understanding of spruce bark beetle outbreak dynamics in the LPJ-GUESS (v4.1, r13130) vegetation model
Fredrik Lagergren
Anna Maria Jönsson
Mats Lindeskog
Thomas A. M. Pugh
For exploring forest performance in the future, dynamic vegetation models are important tools. Tree mortality is a crucial process in these models, but explicit representations of major agents of mortality have often been relatively underdeveloped. In needle-leaved forest in the temperate and boreal zones, bark beetles are often important for the mortality pattern. The European spruce bark beetle (SBB, Ips typographus) has, in recent years, replaced wind as the most important disturbance agent in European forests. Historically, SBB damage is typically triggered by wind storms as they create breeding material with no defences to overcome for the beetles. Drought can contribute to increased damage and prolonged outbreaks by lowering the defence of the trees, but it has also been the main ultimate driver of some of the European forest damage by bark beetles in the last decade. In this study we implemented an SBB damage module in a dynamic vegetation model (LPJ-GUESS) that includes representation of wind damage and forest management, with the aim to present a general concept that can be used for other bark beetle species as well. The module was calibrated against observations of storm and SBB damage in Sweden, Switzerland, Austria and France. The model was driven by SBB phenology, drought, storm felled spruce trees and a dynamic beetle population density. The model was able to catch the start and duration of outbreaks triggered by storm damage reasonably well, but with discrepancies in levels which can be at least partly related to salvage logging of storm felled forest and sanitary cutting of infested trees. The model showed increased damage in the most recent years with warm and dry conditions, although below the level reported, which may suggest that the drought response of spruce in LPJ-GUESS is underestimated. The new model forms a basis to explore vulnerability of European forests to spruce bark beetle infestations.
- Article
(5229 KB) - Full-text XML
-
Supplement
(1395 KB) - BibTeX
- EndNote
Intensified forest management, reforestation and fertilization effects from increased CO2 concentration and nitrogen deposition have promoted the growth and stock of European forests over recent decades (Ciais et al., 2008; Scheel et al., 2022). However, over the most recent years this trend no longer exists, due to increased harvest and disturbances (Palahi et al., 2021; Patacca et al., 2022; Wernick et al., 2021). The disturbances and associated tree mortality can be related to weather and climate, directly or in combination with a biological agent. In the case of biological agents, the forest structure and species composition is particularly important as most epidemic species are selective in host preference (Balla et al., 2021). The prevailing paradigm of European forestry has increased the vulnerability of forests to disturbances by promoting monocultures (Forzieri et al., 2021). Forest policy in Europe is determined both at the national and European Union levels. Tools that can provide projections of how disturbances are likely to change under different climate conditions and management actions at these national-to-continental scales are important to be able to develop appropriate forest policy.
Bark beetles are a group of insect species that in most cases colonize dead or stressed trees. A few species are, however, also able to kill healthy trees, potentially leading to outbreaks that can cause severe mortality, especially in temperate and boreal needle-leaved forests (Kautz et al., 2017; Lindgren and Raffa, 2013). In Europe, the most damaging bark beetle is the spruce bark beetle (Ips typographus, hereafter referred to as SBB), causing tree death corresponding to tens of million m3 wood per year (Patacca et al., 2022). The most recent years have seen accelerating losses of trees from SBB outbreaks, mainly related to droughts reducing the tree-defence capacity and climate warming accelerating the lifecycle of the beetles (Hlásny et al., 2021). Historically, however, outbreaks have mainly been triggered by storm damage, which creates breeding material in which the beetles are not required to overcome the tree defence (Schroeder, 2001). Norway spruce (Picea abies), the host tree, is favoured by forestry and is often managed with thinning and clear-cuts that creates dense even-aged stands, that over time becomes increasingly vulnerable to both storm damage and SBB attacks. Thinning may increase the trees' resistance by reducing competition (Singh et al., 2024) but, on the other hand, it can cause direct damage by the logging operation (Hwang et al., 2018), introduce root rot (Vollbrecht and Agestam, 1995) and make the stand more prone to wind damage (Nielsen, 1995). It also increases the growth rate of the remaining trees, making them accessible to SBB at a younger age.
To further complicate the situation, counter measures such as salvage and sanitary cutting (SSC), which can be effective in preventing and shortening outbreaks of SBB (Jönsson et al., 2012; Stadelmann et al., 2013), have a high variation in intensity over time and space. Salvage logging of storm felled trees reduce the material where SBB can have very efficient reproduction and can even reduce the SBB population if the harvest is done between infestation and emergence of the new generation. Sanitary cutting of infested living trees will take away the new SBB generation if it is done at the first signs of infestation in summer. This can contribute to ending an outbreak situation. Sanitary cutting is less efficient when done in autumn or winter as only a fraction of the new beetles is still present (Singh et al., 2024). Whilst landscape- and national-level models for SBB exist (de Bruijn et al., 2014; Jönsson et al., 2012; Marie et al., 2024; Seidl and Rammer, 2017; Seidl et al., 2014; Temperli et al., 2013), the capability to explicitly model historical forest damage from SBB has not yet been demonstrated at European-scale.
How to address this modelling challenge? The life cycle and temperature dependent phenology of SBB are well studied (Wermelinger and Seifert, 1998). However, to be able to evaluate model simulations on spruce bark beetle population dynamics and the shift between endemic and epidemic conditions, not only phenological understanding is needed, but also detailed knowledge about forest conditions. This includes stand composition and structure, timing and magnitude of storm damage, and subsequent management actions such as SSC (Jönsson et al., 2012). So far, empirical approaches have been applied in SBB modelling at continental (Marini et al., 2017) and regional scale (Soukhovolsky et al., 2022). Most empirical models include response functions of storm felling, temperature and precipitation deficit, but require prior knowledge of the SBB population, as the output from such models is a relative change in SBB population or damage, limiting the simulation of full outbreak cycles. Whereas the timing of SSC countermeasures is an important component in one dynamical vegetation model (DVM) with SSB implementation for individual events (Jönsson et al., 2012), it is not included in another DVM with the SBB implementation being based on general statistics (Marie et al., 2024). The iLand landscape simulator has mechanistic SBB components and can simulate salvage logging, but has only been evaluated in protected areas to rule out the influence of SSC (Seidl and Rammer, 2017). Whereas the population-specific response is dependent on both SSC timing and intensity, documentation is often lacking, which makes data availability a limitation to large-scale model calibration. A model without mechanistic responses of climate and forest structure may, however, not be able to project future conditions and the effect of adaption in proactive and reactive forest management strategies. In addition, the SBB lifecycle has several temperature dependent stages for reproduction and survival, which makes representation by a continuous response function, as typically employed by empirical models, difficult. Yet, when working over large regions with gridded climate datasets, the weather variability within a grid cell related to altitude, aspect and forest edge effects smooth out some of the non-linearity. This means that an empirical approach can be efficient in applications over large regions, also when considering the highest resolution of gridded climate data available today (typically 3 km, e.g. Lind et al., 2020). An approach that blends the insight of mechanistic modelling with the ability of large-scale empirical assessments to capture the net effects of unrepresented smaller-scale processes is needed.
Here, we seek to develop and evaluate a model for forest damage from SBB outbreaks within the LPJ-GUESS dynamic vegetation model (Smith et al., 2001, 2014). The model should allow questions around the impact of SBB on future forest carbon cycling, productivity and resilience over national to European scales to be explored within LPJ-GUESS. This requires that the model is able to simulate the magnitude and frequency of large outbreak events, as well as the typical background rates. It should also be able to simulate the impacts of management interventions such as SSC, and systematic changes in forest structure. Furthermore, because SBB is only one of many bark beetles that have large impacts on forest dynamics across northern forests (Kautz et al., 2017), there is also a need to develop a model structure that is flexible to simulate multiple bark beetle species with different characteristics across a wide variety of forest across the temperate and boreal forest biomes. The aim of this study was therefore to develop a model with the following characteristics:
-
To be able to catch outbreak dynamics, triggered by storm damage, drought stress and temperature-driven changes in beetle phenology, without detailed accounting of the SBB population.
-
To utilise simple empirical relationships available, but also make use of suitable mechanistic knowledge that is relevant at the scale of interest.
-
To generate fractions of killed individuals in tree size/age cohorts for feedback to modelled vegetation dynamics
-
To provide a generalised concept to use for different types of bark beetles by changing the underlying functions related to weather and insect – host tree interactions.
To achieve this, a semi-empirical SBB damage model, with components of negative feedback from a dense SBB population, amplification of damage after storm felling, where warm and dry weather can trigger and contribute to sustained outbreaks and SSC functionality was developed. The model was calibrated based on storm and SBB damage statistics from four countries in Europe. This modelling concept represents key aspects of the interaction of SBB with climate and forest state, creating a tool for addressing climate change and forest management scenarios.
2.1 General description of LPJ-GUESS
LPJ-GUESS is a dynamic vegetation model adapted to both global and European simulation domains, which simulates the development of vegetation cohorts belonging to different plant functional types (PFT) in replicate patches (Smith et al., 2001, 2014). The cohorts compete for water, nutrients and light within the patches, driven by climate, nitrogen deposition and atmospheric CO2 concentration. The PFTs differ in parameters related to physiological response functions, allometry and bioclimatic restrictions. Replicate patches are subject to the same climatic and edaphic conditions, but differ due to stochastic elements in the processes of cohort establishment and individual tree mortality and disturbance. A range of different forest management classes can be simulated in each model grid cell, from clear-cut or continuous harvesting following a particular regime to unmanaged vegetation (Lindeskog et al., 2021). Within these classes, there may be patches of different ages since the last patch-destroying (i.e. stand-replacing) natural disturbance or clear-cut harvest event. Processes in the model includes e.g. light absorption, photosynthesis, auto- and heterotrophic respiration, allocation and different types of tree mortality. Patch destroying disturbances apart from fire have typically been simulated as random events with a fixed average return time.
In the present study LPJ-GUESS version 4.1, subversion revision 13130 was used. In addition to the standard trunk version of the model and the SBB module outlined herein, this revision also included the storm damage module from Lagergren et al. (2012). In this module, the simulated storm-damaged fraction of a cohorts is the product of a cohort's sensitivity index (SI), the triggering wind load (WL) and a calibration factor (CF).
The SI is based on tree shape (height to diameter ratio), neighbouring cohorts' and stands' height and time since thinning.
2.2 Setup of simulations representing the current state of spruce forest
The global set of PFTs were used in the simulations, as the aim was to produce a biotic model that could be applied routinely in the standard version of LPJ-GUESS. This set has seven boreal and temperate tree PFTs, of which spruce is represented by the shade tolerant boreal needle leaved evergreen tree type (BNE). The spruce forest for each region/country was represented in the simulations by nine age classes of clear-cut forestry with a 90-year rotation period established at 10-year intervals after the year 1859, continuous-cover forestry (CCF) with short cutting interval (12 years, 15 % of biomass removed at each occasion) and long (25 years, 30 %) and unmanaged forest. For the clear-cut rotations thinning was done at age 9, 27 and 45 years with strength of 10 %, 30 % and 25 % of biomass removed. Planting or establishment in the managed forest types were set to BNE only. The results were weighted across these different managements and age classes based on the stand age distribution from Poulter et al. (2019) for the year 2010. The age-class data had a regional resolution for France and a national for Austria and Switzerland. For Sweden, national inventory data for 2008–2012 with a county resolution were used instead of the Poulter et al. (2019) data (Nilsson and Cory, 2013). Stand ages of less than 90 years were assumed to be clear-cut forestry, the short and long CCF classes were used to represent the fraction of stands with ages 91–110 and 111–140 years respectively, and potential natural vegetation (PNV) was used to represent the fraction of forest older than 140 years. To generate this structurally-complex forests in LPJ-GUESS we used the weights as input to the landcover functionality (Lindeskog et al., 2021): We initialised LPJ-GUESS using PNV everywhere but then specified transitions in the appropriate year such that the desired age structure and management mix was achieved in LPJ-GUESS. Each age class, CCF type and natural forest was run for five replicate patches in each grid cell. Random patch-destroying disturbances were initially set to a return time of 500 years, but after the transition to a managed forest in a patch, these were turned off to avoid resetting the age structure. Fire disturbance was simulated with the SIMFIRE-BLAZE module (Knorr et al., 2016; Rabin et al., 2017) and it was also turned off for managed patches.
In Europe, BNE also represents silver fir (Abies alba), which is not attacked by SBB, this could potentially lead to overestimation of SBB damage in stands simulated as unmanaged, as BNE in those stands would represent both species. In Switzerland that has the highest fraction of PNV (25 %), silver fir only makes up 6.6 % of the total spruce and fir standing volume. In the French regions there are 0 %–12 % PNV, but here silver fir makes up 49 % of total fir and spruce. Austria has only 7 % PNV and in Sweden there are no silver fir. Since PNV multiplied by fir fraction was low (< 6 %) in all regions/countries, we ignored this. Furthermore, as Picea abies is the primary species constituting the BNE PFT within Europe, the parameterisation here can also be considered applicable in the European version of the model which works at species level (Pugh et al., 2025).
2.3 Implementation of a bark beetle damage module in LPJ-GUESS
European storm and bark beetle damage statistics were compiled by Marini et al. (2017), and they used the dataset to derive empirical models describing the increase rate (R) of forest volume loss due to bark beetles (DSBB) to one year (t) from the previous year (t−1):
The top-rated model was:
depending on the thermal sum between 1 May and 30 July (T) with a threshold of +5 °C, storm felled volume (Dstorm), DSBB, and cumulative rainfall between 1 March and 31 July (W). All variables were standardized to mean 0 and standard deviation 1, Dstorm was log-transformed before standardization.
This additive model concept captures the dynamics of SBB outbreaks based on a tractable set of process-linked predictors that are empirically-supported at large scales. We therefore found this to be a strong basis for our approach and implemented an additive model drawing on this concept for bark beetle damage in LPJ-GUESS. In this implementation we took advantage of the existing LPJ-GUESS formulations for water stress and mortality of trees (L, stem litter from spruces larger than a limit (dlim) killed by other agents than bark beetles last year) as inputs, as well as the available and proven bark-beetle phenology sub-model of Jönsson et al. (2007).
An index of the population size at the start of the year (Ppatch t−1), calculated both at patch and grid-cell level, determines the mass of bark-beetle killed trees (M) together with R and a calibration factor (k0). At start of a simulation Ppatch was initiated with a value of 10 for all patches. As there is a linear dependency of M on Ppatch (Eq. 6), R representing an increasing rate of damage (Eq. 2) corresponds to R representing an increase rate of Ppatch. Of the components of R (Fig. 1, Eq. 4); represents the negative feedback from a denser population relative to the amount of substrate with no defence (L, typically with a high value after storm damage) for a group of trees (patch); f(Pgridcell) represents the negative feedback when a high population in the landscape leads to lower patch level R because of swarming induced competition; f(water stress) has a positive impact on R as the defence in healthy trees is reduced with water limitation; and f(phenology) has a positive impact resulting from faster phenological development of the SBB.
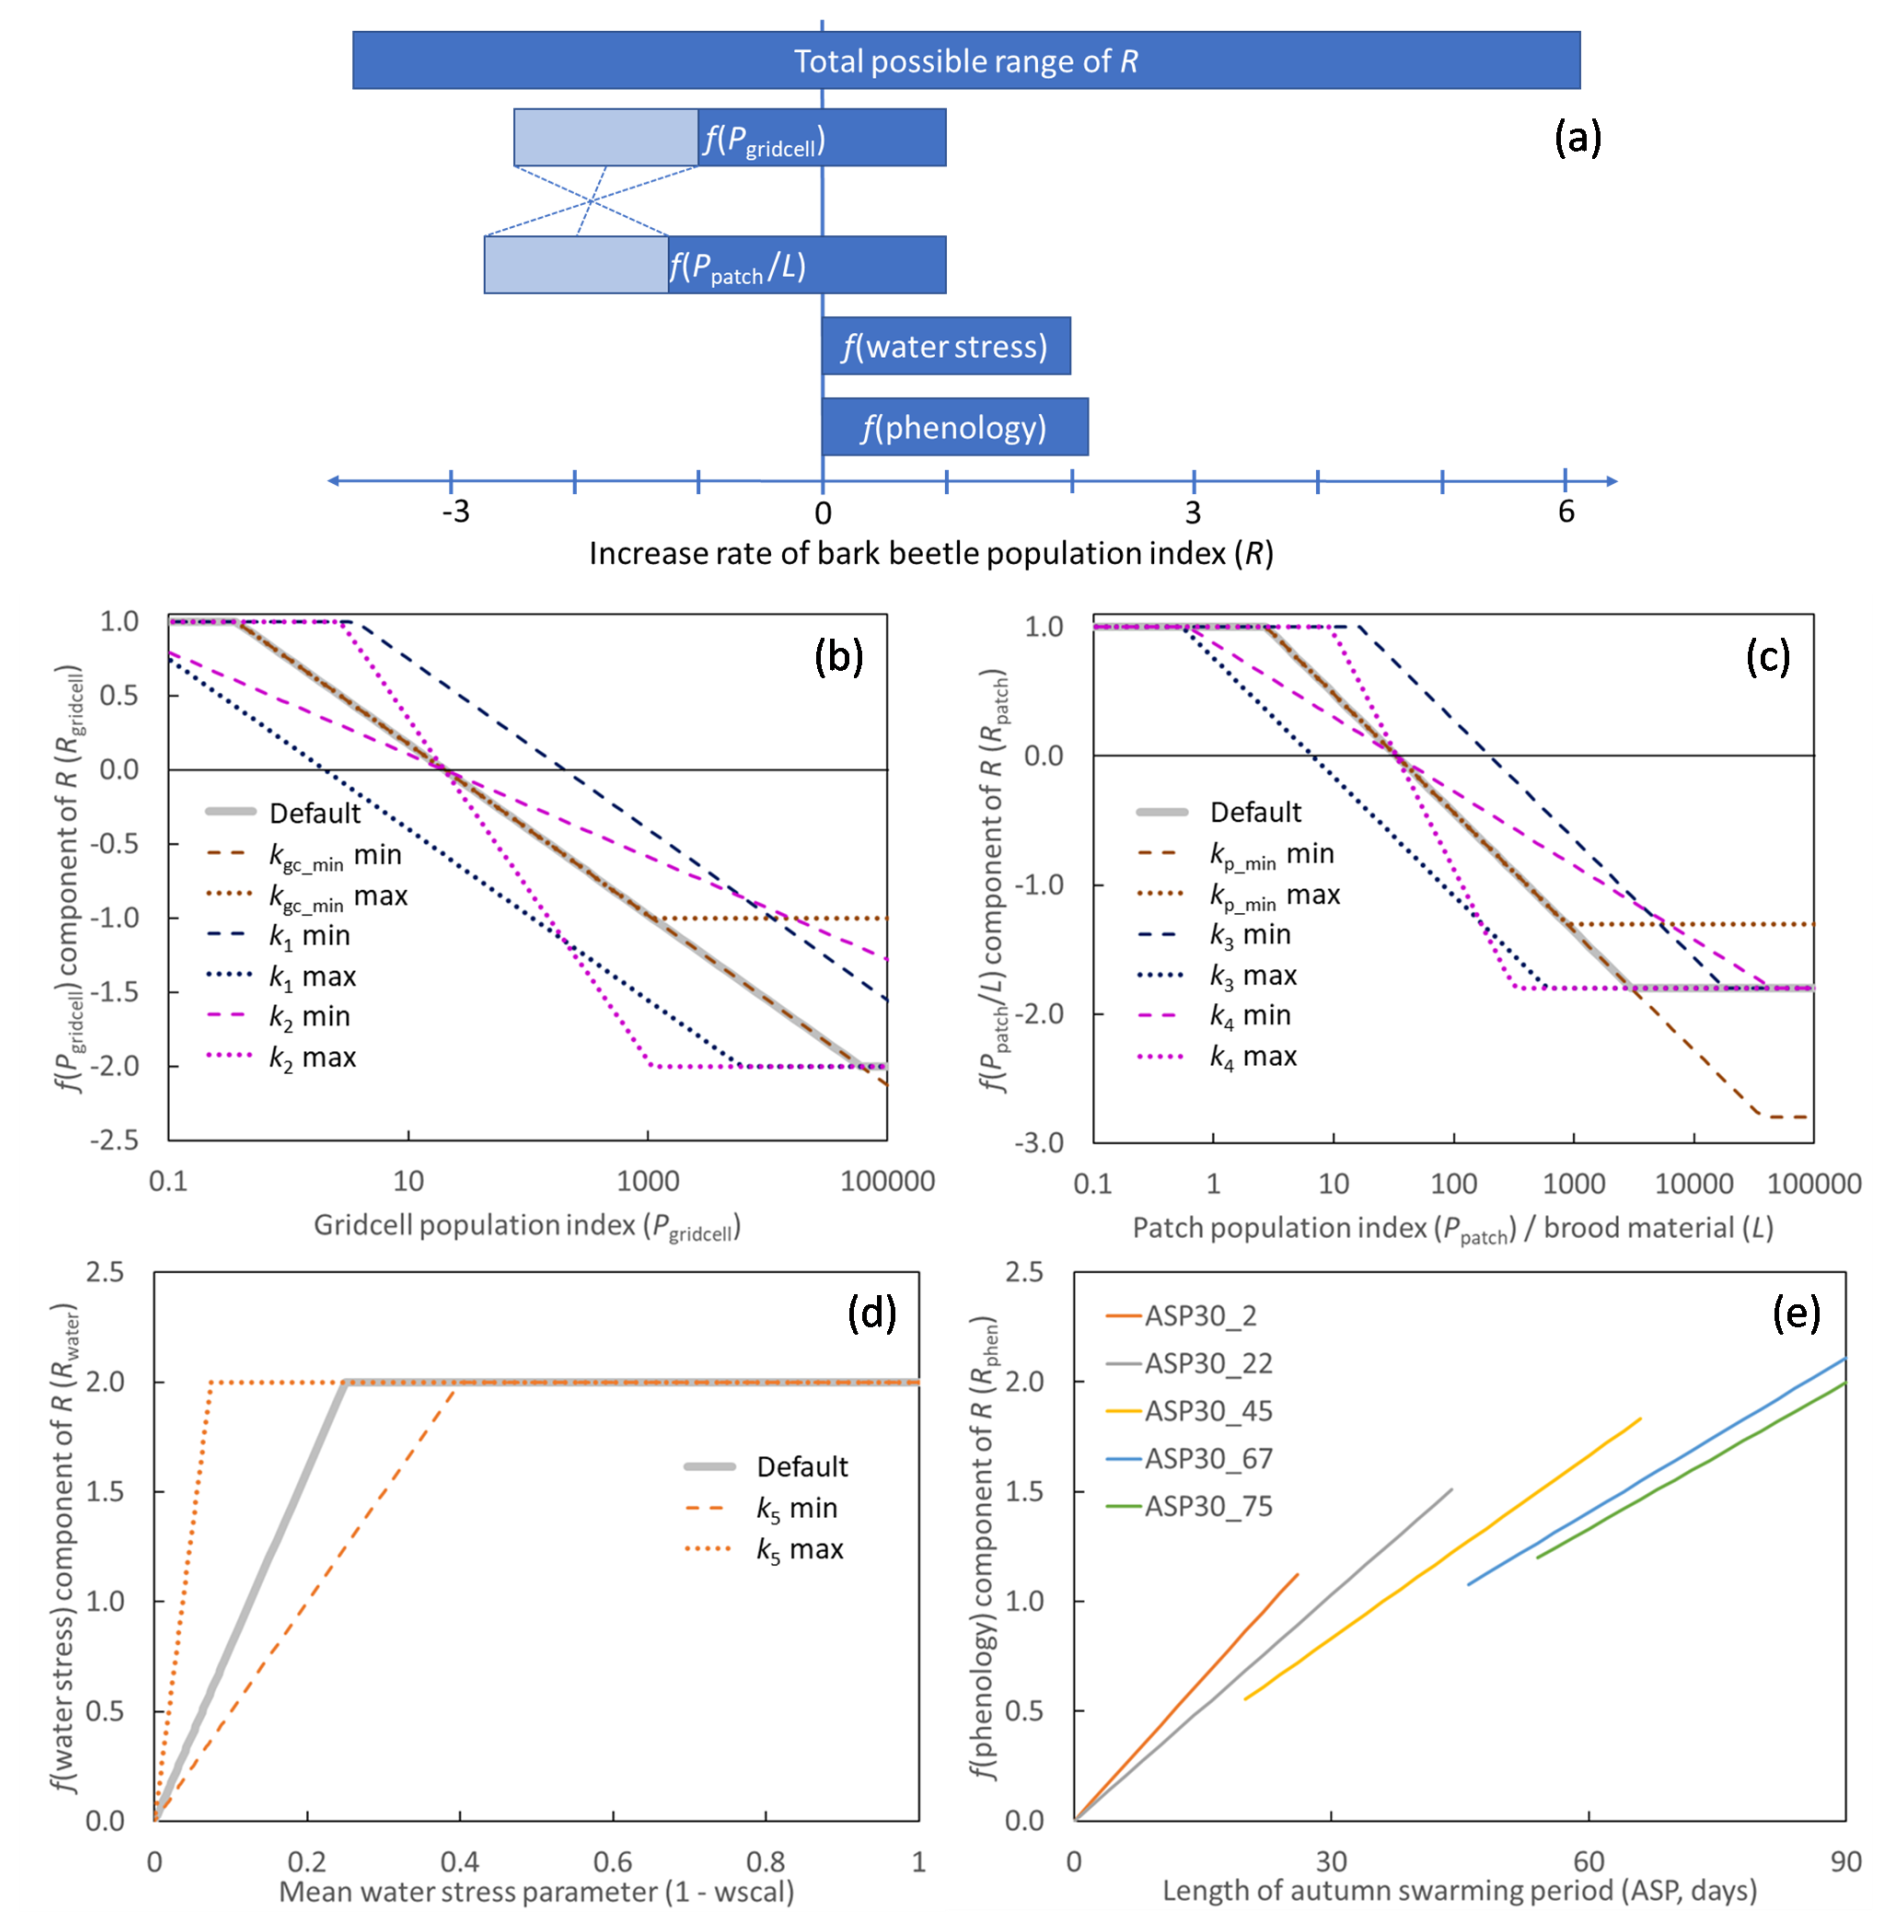
Figure 1The different components of the increase rate of the bark beetle population index (R). Depending on the state of the model and climate, R and its components take a value within the possible ranges. (a) Possible ranges of the components and the total (Eq. 4). For f(Pgridcell) and , the light shaded areas show the part of the ranges that were varied in the parameter optimization, where the sum of the minimum of f(Pgridcell) and was kept constant to have the possible total negative feedback from the population index constant (illustrated with the dotted lines, see Sect. 2.6). (b–e) Shape of the functions for the components of the increase rate of the bark beetle population index (R), (b) Eq. (7), (c) Eq. (8), (d) Eq. (10), (e) Eq. (12). The default parameter setting (Table 2) is shown by thick grey lines (b–d). The functions are also shown in colour for the min and max value of parameters included in the calibration and sensitivity analysis (Sect. 2.6), using the default setting for the other parameters. For f(phenology), (e), no parameters were tested but the response depends on the grid-cell's 30-year running mean of the length of the autumn swarming period (ASP, ASP30) and function are shown for ASP30 from 2 to 75 d.
From PpatchPgridcell was calculated as a weighted mean across the area fractions of all the different age and management classes within a grid cell. In the Marini et al. (2017) model with all variables set at ±2 standard deviation from the mean, R has a range of −4.66 to 3.36. Interactions between variables prevent R from reaching higher numbers. R calculated in this way from the observation data used in the present study (see Sect. 2.4 below) has a range of −2.2 to 2.9. It should be considered, however, that in both cases initial high numbers in the start of an outbreak were often missing as inventories only began when already under an outbreak situation. In the present application, R is applied at patch level while observed data have been aggregated over large regions or countries, a minimum number closer to the Marini et al. (2017) value is therefore motivated. At the other end of the scale, the maximum R can also be translated to an extreme case of population increase rate with two successful generations in a year with 20 female offspring per mother (e6=20.12). Based on this, the total possible range of R (Fig. 1a) in the presented model was set to −3.8 to 6.0, where the possible outcome range of the different parts of the model (Eq. 4, Fig. 1a) were given weights (relative contribution to the total range) of the similar magnitude as in the Marini et al. (2017) model. To enable that an outbreak can be sustained also during the epidemic phase with the highest population levels (Hlásny et al., 2021), the lowest possible total negative feedback from population size was set to be just below the highest possible positive impact of water stress and phenology.
The representation of landscape scale and substrate scale competition (or relief of competition at low densities) was formulated in two equations (Eqs. 7 and 8), respectively. The response function for the Pgridcell component of R (Fig. 1b, Eq. 4) was:
where kgc_max and kgc_min determine the range, k1 the intercept and k2 the slope of the expression. The same type of function was used for the combined response of Ppatch and L(Fig. 1c, Eq. 4):
where the min and max are set by kp_max and kp_min respectively, and k3 and k4 set the intercept and slope. To avoid division by zero, a fixed background level (kbase_bm, set to 0.0001 kg C m−2) was added to the available brood material (L):
where Lmort is C mass of stem mortality of spruce trees above a diameter threshold (dlim) for previous year caused by other reasons than bark beetles (including storm), dlim was set to 15 cm (Jönsson et al., 2012). The beetle larvae feed from the phloem in galleries under the bark (Six and Wingfield, 2011). The amount of phloem depends on thickness and area of the bark, and is closely related to stem biomass. The trees are normally no longer suitable for breeding one or two seasons after tree death (Göthlin et al., 2000; Louis et al., 2014), which is why Lmort is based only on the mortality of the previous year. The dependency of Pgridcell, Ppatch and L corresponds to Dstorm and DSBB in the Marini et al. (2017) model. To take advantage of the ability of LPJ-GUESS to model drought impact, the Marini et al. (2017) dependency of rainfall was replaced with a dependency of the ratio between water supply to the canopy and canopy water demand (wscal), as calculated by LPJ-GUESS in its standard water stress function. The value goes from zero at complete shutdown of photosynthesis and transpiration to one at no stress, and it was used to assess the dependency of drought (1 – wscal, Fig. 1d, Eq. 4):
where k5 is the slope, determining the point of full effect on R. The mean wscal calculated over the month May–July for both previous year (wscalt−1) and current year (wscalt) for the BNE PFT were used. Based on the (Marini et al., 2017) model, the data from the previous year were given a three times higher weight in the default setting, but in the calibration and sensitivity analysis (see Sect. 2.4 below) the previous year weight (kpyw) was varied between to 4:
For a more mechanistic approach of taking phenology into account, the dependency of T in the (Marini et al., 2017) model was replaced with a dependency on the length of the autumn swarming period (ASP, Eq. 4) in comparison with the grid-cell specific 30-year average as:
where ASP is the number of flight days of the first new generation according to Jönsson et al. (2011). The slope depends on the grid-cell-level 30-year running mean of ASP (ASP30) and two parameters k6 (slope) and k7 (dampening). Calculated ASP was capped at 90 d (ASPmax). Normalizing with ASP30 instead of a direct relationship () gives a more responsive function at lower ASP30 (Fig. 1e). The use of ASP instead of a discrete variable such as the number of generations per year, was chosen as ASP is a continuous variable which better catch the average conditions within a climate grid cell when there is a high variability in temperature, such as in mountainous regions. Furthermore, a well-defined model with constrained parameters already existed for ASP (Jönsson et al., 2011).
In the managed forest of Europe, countermeasures against outbreaks are often performed. We included functionality of salvage cutting of storm-felled trees and sanitary cutting of infested trees (SSC). The salvage cutting part was represented by reducing Lmort by 90 % for larger storm events (> 5 m3 ha−1 wood at patch level). In Sweden forest owners are not allowed to leave more than 5 m3 ha−1 of damaged spruce wood with d > 10 cm after a storm, as regulated by the Swedish Forestry Act (Swedish Forest Agency, https://www.skogsstyrelsen.se/en/laws-and-regulations/skogsvardslagen/, last access: 12 May 2025). The total grid-cell maximum salvage cutting capacity (salvmax) was set to 50 % of the 10-year average harvest rate, as it has to be done before the new generation of bark beetles emerge (which occurs approximately 6 months into the year) in order to have an effect. If the 90 % of the storm damage (damage_available) was > salvmax, Lmort was reduced by salvmax/damage_available instead of 90 %. Sanitary cutting was applied by reducing Ppatch by 25 % (as also used as the default setting by Jönsson et al., 2012) if the fraction of available spruce volume that would be killed was >1 %. In situ, this 25 % reduction depends on how large a fraction of infested trees are removed and if infested trees are removed early in summer (most beetles are captured) or during winter (about 50 % overwinter in the trees, with large differences between regions) (Weslien et al., 2024). As the numbers for the SSC setting vary over time, regions and countries (Jönsson et al., 2012; Stadelmann et al., 2013; Wichmann and Ravn, 2001), we do not claim that we have found the most representative numbers for all of Europe but they rather should be seen as a starting point for evaluating SSC dependency in this modelling concept. This reduction was done before Eq. (6) was applied.
The bark beetle accounting and application of damage is placed in the “mortality_guess” function within the vegdynam.cpp code together with the wind damage application, and it is called at the end of each simulated year (Lagergren et al., 2024a). At this stage of the model development the effect of the SSC was just applied in the bark beetle accounting; the damaged trees were not removed in the main carbon accounting of the model. This can cause some underestimation of the heterotrophic respiration, but it was considered as insignificant for the present study which only focuses on SBB outbreak dynamics.
2.4 Data of storm and bark beetle damage to forest in Europe
Data of damaged volume of spruce forest were combined with statistics of standing spruce volume to assess the fractions in a country/region damaged by storm (DFstorm) or killed by SBB (DFSBB), which were calculated and used for further analysis.
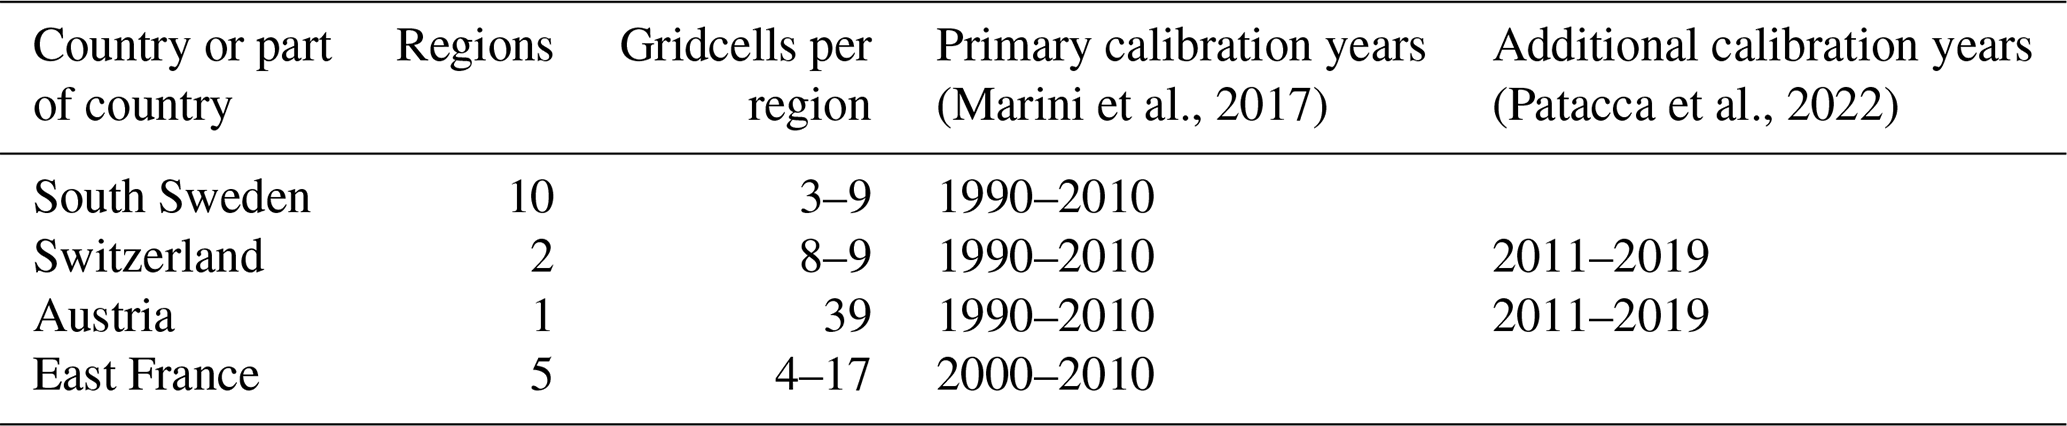
European storm and bark beetle damage statistics were compiled by Marini et al. (2017), for some countries separated into administrative or topographical units. From that data set we used damage statistics (m3 yr−1) from South Sweden (data separated into 10 counties), North-East France (five former administrative units), Switzerland (lowland and mountains) and Austria (whole country), to cover regions with large interannual variability in ASP. In the LPJ-GUESS model, mortality is applied once per year at the end of December. Storms in Europe occur mainly in autumn and winter, and the modelled vegetation and bark beetle effect, e.g., should be the same for a storm event in October or in February the next year. The storm damage statistics for a specific year were, therefore compiled for a storm year (cf. the commonly used “water year” term, Johnstone and Cross, 1949) of 12 months from July until June the next year when building the dataset used for the calibration.
Data of spruce standing volume were available by year (1961–2010) for Sweden (https://skogsstatistik.slu.se/pxweb/en/OffStat/OffStat__ProduktivSkogsmark__Virkesforrad/PS_Virkesf_tradslag_diameter_1923_tab.px/, last access: 16 September 2025), for year 2008 for France (https://inventaire-forestier.ign.fr/spip.php?rubrique250, last access: 16 September 2025), for year 1985, 1995 and 2006 for Switzerland (https://www.lfi.ch/en/publications, last access: 16 September 2025) and for 2008 in Austria (https://www.bfw.gv.at/en/departments-en/forest-inventory/, last access: 16 September 2025). For the other countries than Sweden with data only for one or three years, the data were interpolated between the inventory years and kept constant before the first and after the last year.
In recent years Europe has faced several SBB outbreaks that have been driven by warm and dry conditions rather than triggered by storm events (Nardi et al., 2023; Trubin et al., 2022). To test if this new situation in driving factors was important for the model parameterization, national level storm and bark beetle damage statistics from the Standardized Disturbance Index (SDI) dataset (Patacca et al., 2022) in years 2011–2019 for Switzerland and Austria were used. For Switzerland the damage was split between Lowland and Mountain assuming that the proportion of the country totals for Lowland and Mountain parts were the same as in the 1990–2010 data described above.
In order to focus on bark beetle outbreak dynamics without introducing additional uncertainties associated with wind data and wind damage modelling, we prescribed wind damage from observed data. As we wished to use the existing wind module's capability to distribute wind damage among cohorts' in different patches depending on their sensitivity (Eq. 1), the model could not be driven directly by the available observations of DFstorm. Therefore, instead of calculating WL from the cubed exceedance of the 99.5 percentile of daily wind speed accumulated over storm season as in Lagergren et al. (2012), a calibration was done to adjust WL so that modelled damage followed the observed DFstorm (denoted WLstat). In a first step, a factor of 2 was found to approximately generate the same average level of WLstat calculated from DFstorm as WL calculated from wind (see Sect. 2.5 below) data for years 1990–2010.
After evaluating the ratio between preliminary LPJ-GUESS simulation results and inventoried DFstorm at regional level for all available years (Table 1), we concluded to use a separate function for northern Europe (Sweden) depending also on latitude (LAT):
where Eq. (15) was fitted to DFstorm quotients in S Sweden 1965–2010. As a common linear scaling was used to go from DFstorm to WLstat, the exact DFstorm time series will not be reproduced by this approach, but the pattern and level should be reasonable well captured. The WLstat time series were then used as external input to the model runs. This procedure was followed purely to provide an observationally consistent wind damage level for the calibration of the SBB model and is not intended as a European-scale parameterisation of the Lagergren et al. (2012) wind module, which will be carried out in a separate study.
Table 1Summary of available storm and SBB damage data from Marini et al. (2017), data used in the primary calibration and additional data from SDI (Patacca et al., 2022) used in the validation as well as the number of simulated climate grid-cells in the different parts.
2.5 Climate data and area delimitation
The simulations were driven by daily weather data 1901–2019 at 0.5° resolution from the CRU-JRA V2.1 dataset (https://catalogue.ceda.ac.uk/uuid/10d2c73e5a7d46f4ada08b0a26302ef7, last access: 28 October 2025). For nitrogen deposition, monthly data from Lamarque et al. (2010) were used. The model was run with forest vegetation for all grid cells within each region/country (Fig. 2). For the years with no wind damage statistics, WL was calculated from CRU-JRA windspeed as in Lagergren et al. (2012). Wind damage was applied from 1951 and forward in the simulations.
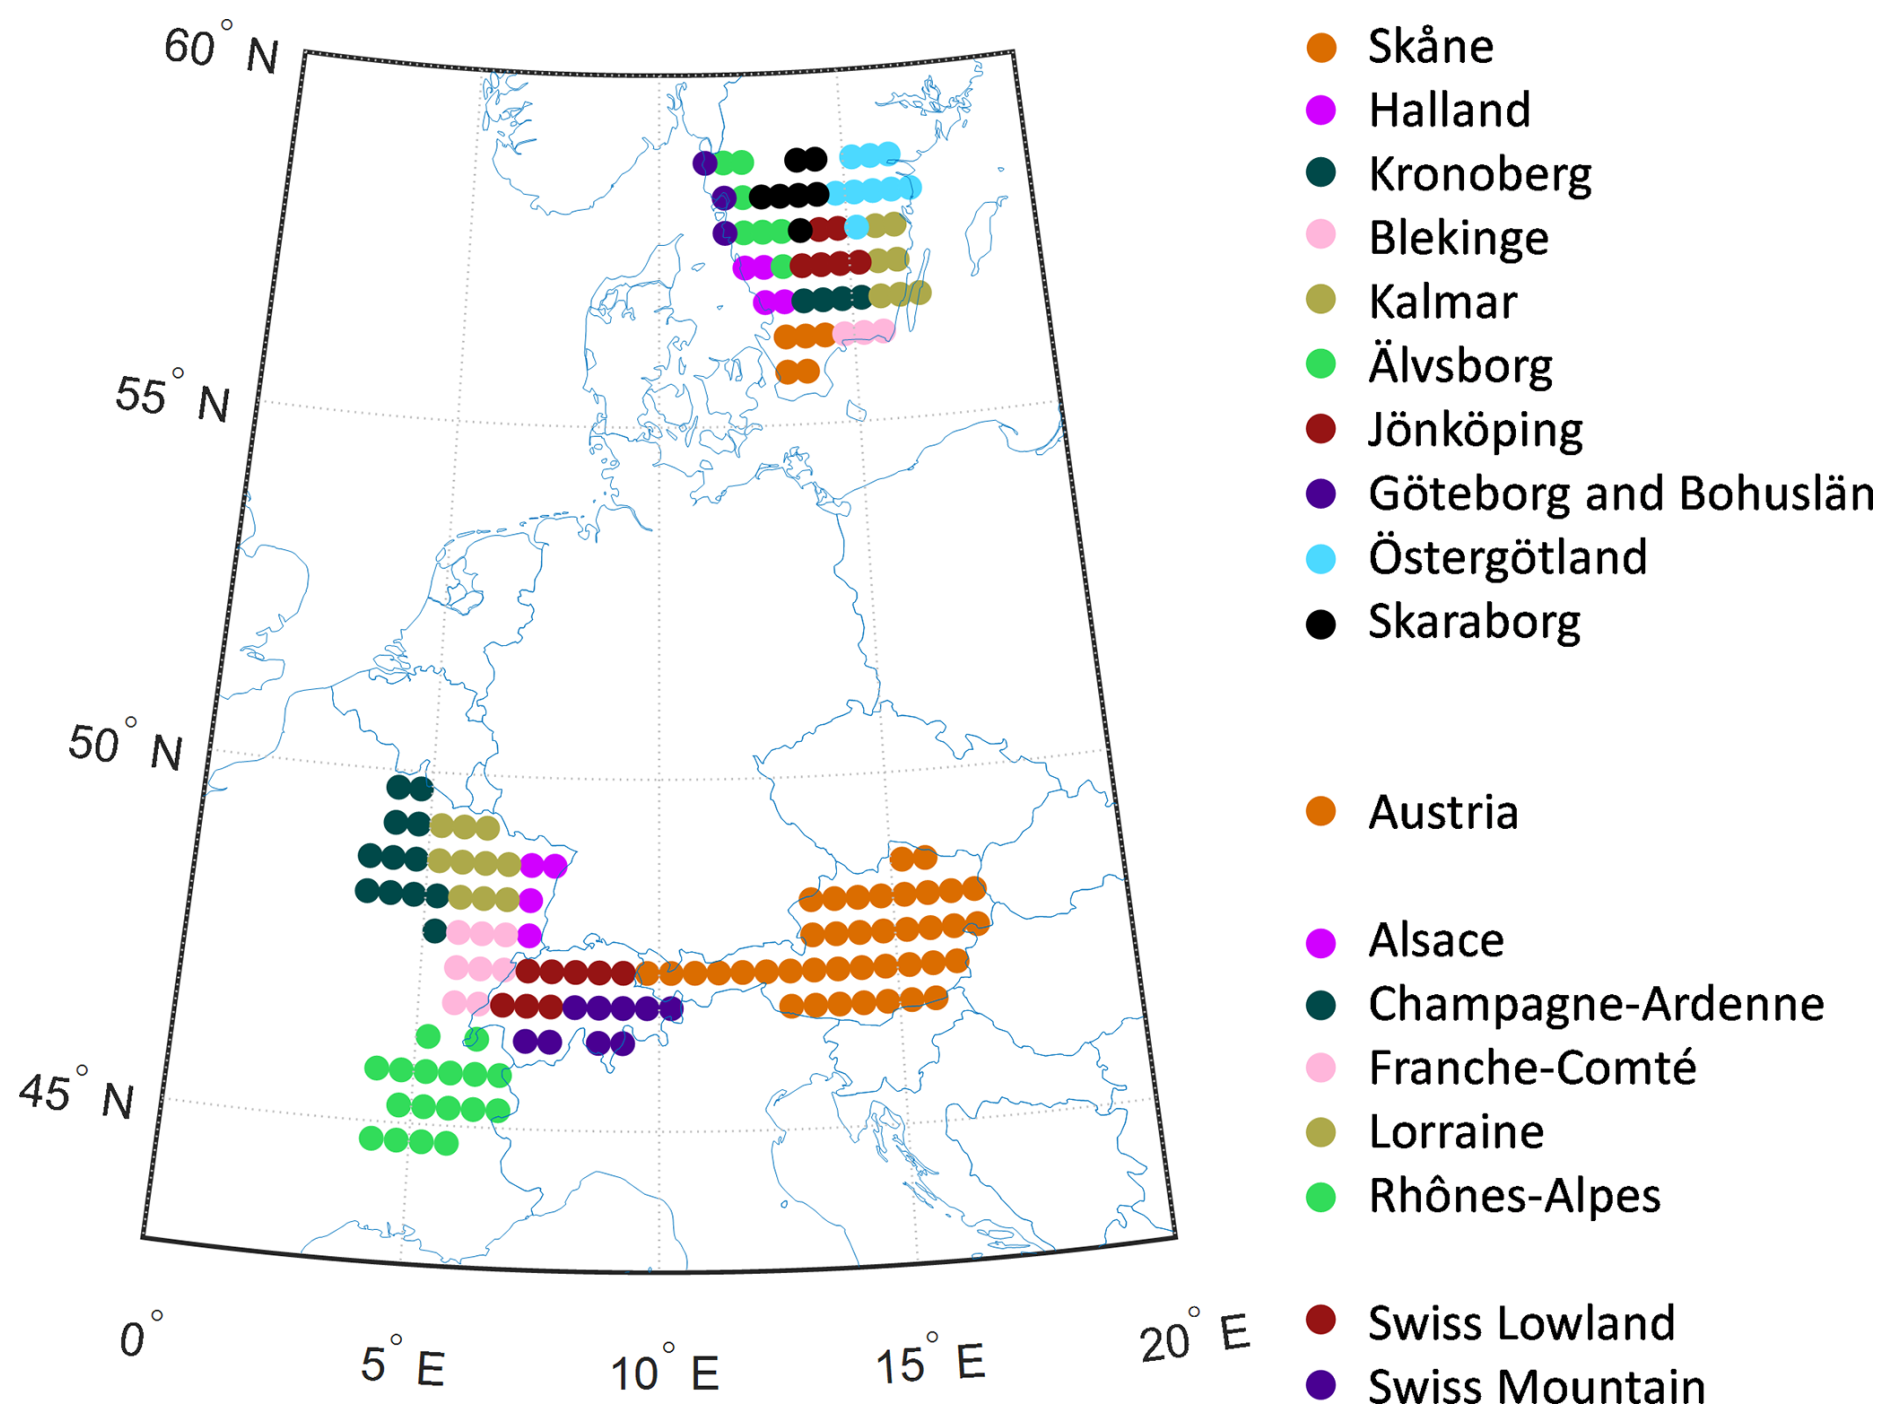
Figure 2The climate gridcells simulated for the ten counties in South Sweden, the five counties in North-East France, the two larger regions in Switzerland and in Austria.
2.6 Calibration and sensitivity test
For calibrating and testing the parameter sensitivity of the model, data for 1990–2010 from the 10 southern counties in South Sweden (excluding the island of Gotland, which has a low fraction of spruce forest and non-typical soils), 5 counties in North-East France (only data for 1999–2010), Austria (whole country) and the lowland and mountain regions of Switzerland were used. For South Sweden, North-East France and Switzerland the modelling results and calibration data of DFSBB were averaged over the counties/regions for use in the calibration and sensitivity test. The parameters were first adjusted based on expert judgement, giving a default set of parameters (Table 2).
Table 2Parameters in the bark beetle model and reference to the equation they were used in. Min and max value shown for parameters used in the calibration and sensitivity analysis.
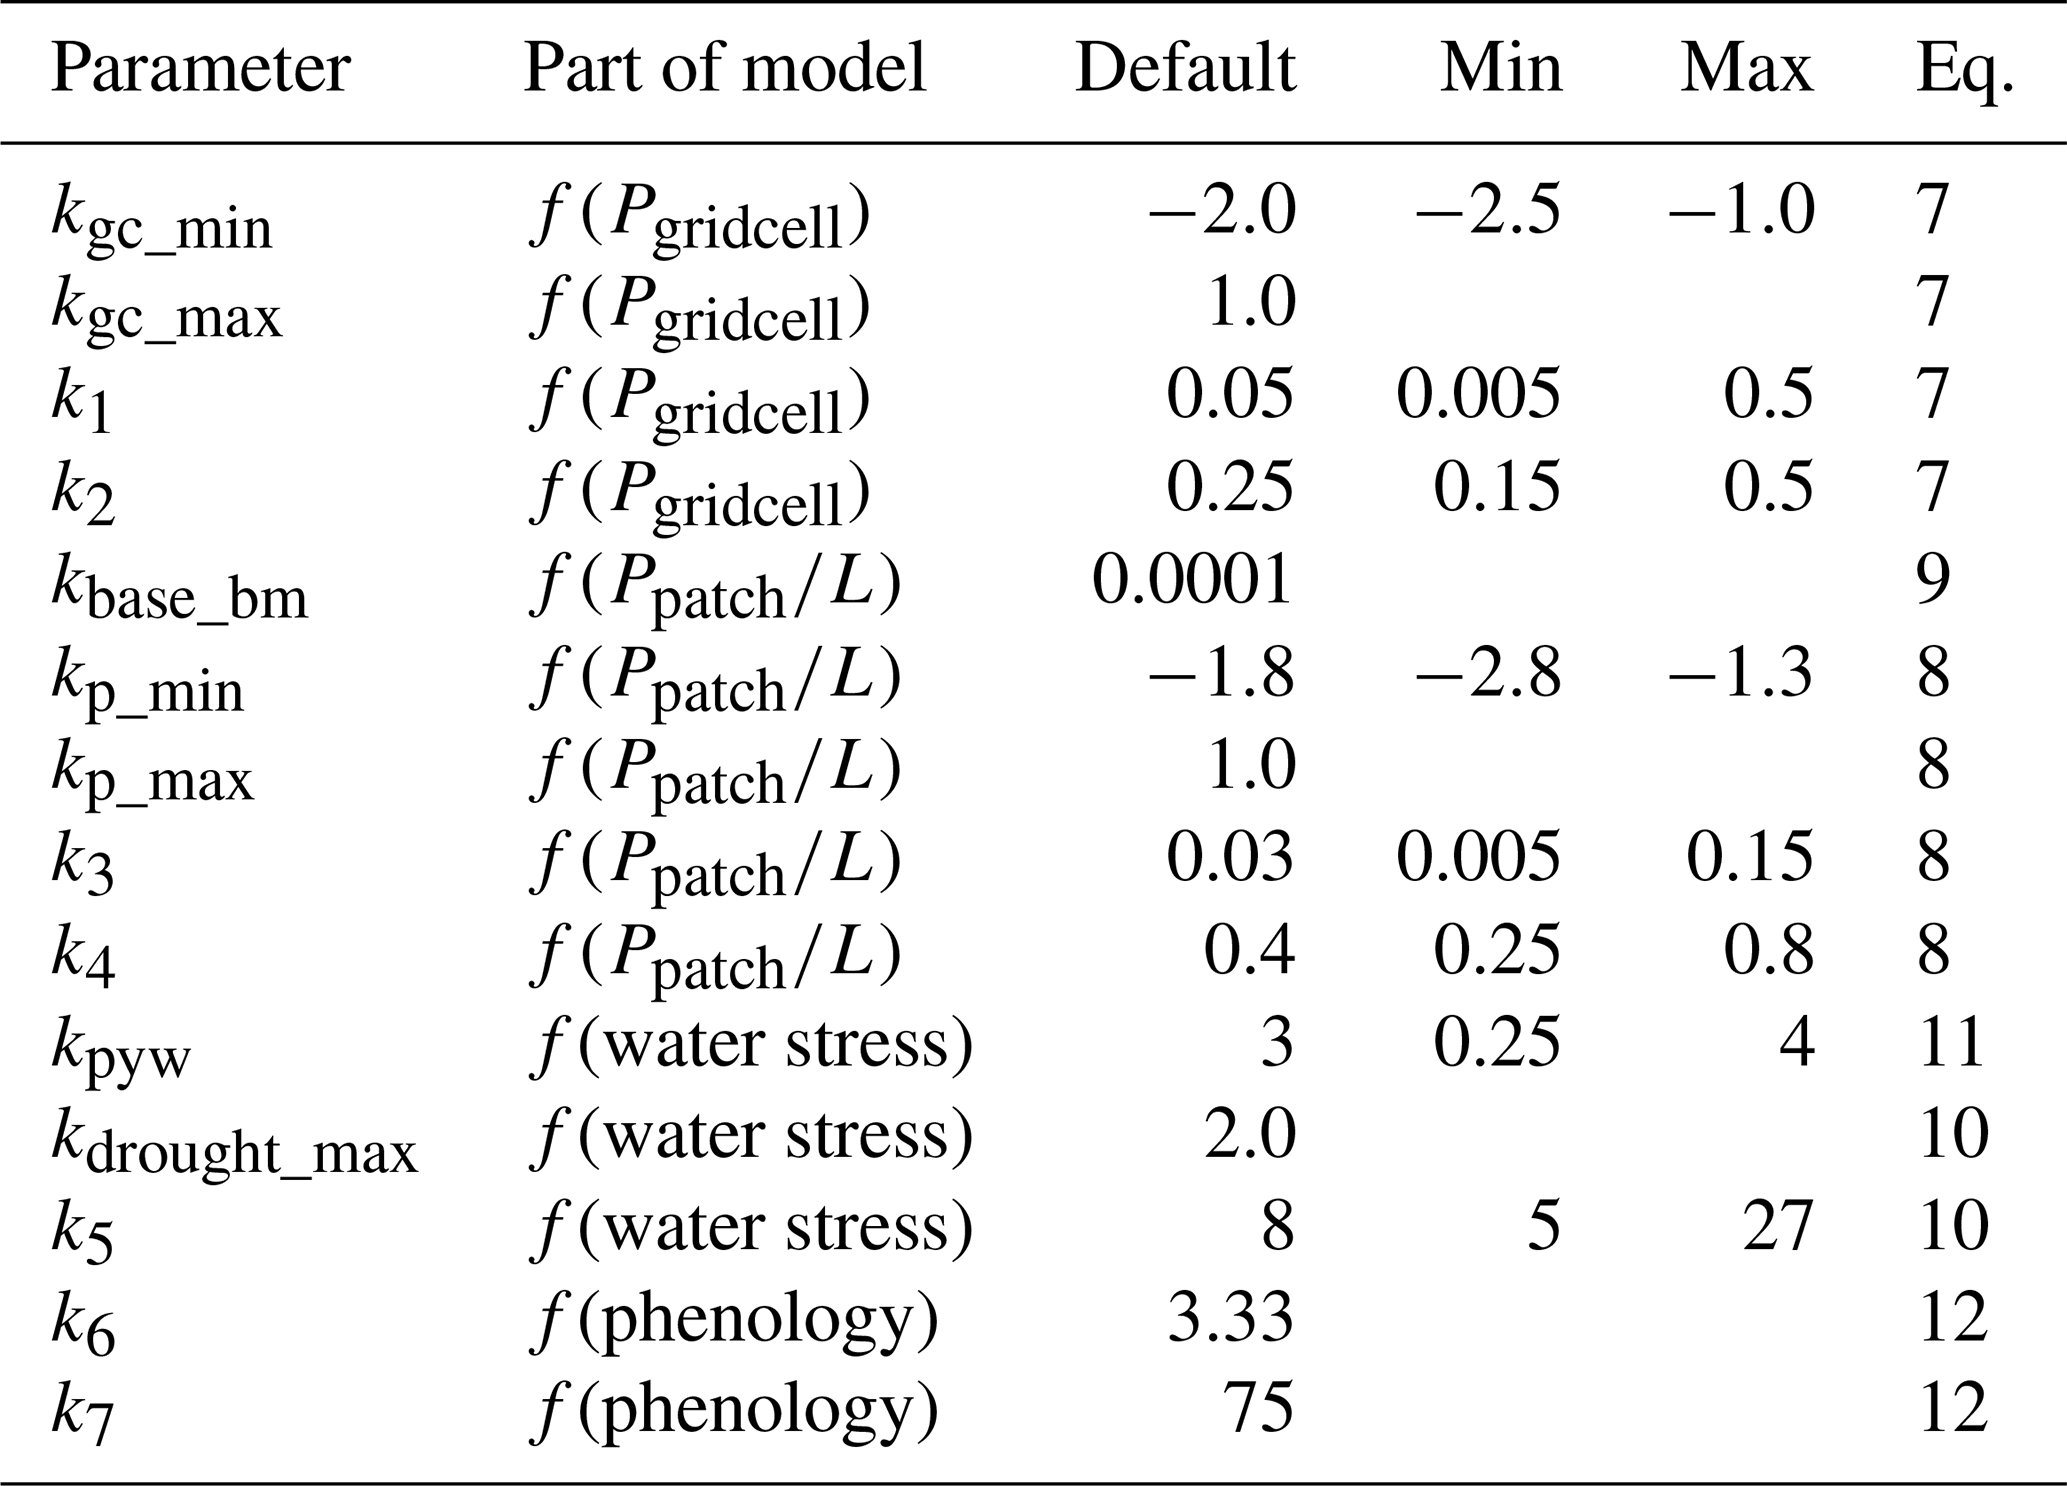
Eight of the 14 parameters were then selected for a calibration procedure and a sensitivity test. These selected parameters were mainly related to the shape of the functions; other parameters were not included as we wanted to keep the range of the response functions at approximately the same magnitude as the weight of the original Marini et al. (2017) model (Eq. 3, see Sect. 2.3). For this reason, the max parameters were excluded from the calibration. As previously stated, the kbase_bm parameter was set to a low value to avoid division by zero. To have a linear response within the wanted range (Fig. 1a) of the f(phenology) function for the space of ASP (Fig. 1e) there was little room to adjust the parameters of Eq. (12) and they were therefore set fixed. To further reduce the number of calculations and to keep the total weight of the population size dependency constant, the sum of the minimum of the ranges f(Pgridcell) and was kept constant (). This meant that the number of tested parameters could be reduced to 7 as kp_min could be replaced with . For each tested parameter 7 discrete numbers were used, evenly spread between the ranges in Table 2. LPJ-GUESS was first run with the default parameter setting. Output at cohort level of all variables used in the bark beetle module was produced for this simulation. These data were then applied in a stand-alone version of the bark beetle module implemented in Matlab (R2018b) for all 77 parameter combinations. This approach misses the feedback from bark-beetle mortality to the vegetation state that is simulated within LPJ-GUESS, but greatly reduces the calculation time. Each parameter combination was first run with the default k0, k0 was then iteratively adjusted until the mean quotient between simulated and observed maximum DFSBB for the calibration period over the four regions/countries equalled 1. The results were sorted by R2, root mean square error (RMSE) and absolute bias both at country level (arithmetic mean over the 1–10 regions, Table 1) and by arithmetic mean over the four countries' mean values, and the top ranked parameter combination was selected based on highest R2, lowest RMSE and lowest absolute Bias. A combined statistic measure (CSM) was also calculated for all 77 models (X) by summing normalized 1−R2, RMSE and absolute Bias as:
where the normalization is based on deviation from mean relative to the range (max–min). The CSMX values were sorted in ascendant order and we present parameters and statistics for the highest rated model as well as the range of parameters for the 50 highest rated models.
LPJ-GUESS was run both with and without SSC, then the parameter testing and calibration procedure was repeated both with and without inclusion of the 2011–2019 calibration data for Switzerland and Austria. As a final test of the impact of SSC for the results, the stand-alone implementation was also run with inclusion of SSC for the parameter set obtained without SSC and vice versa. The setting including SSC using only the 1990–2010 data was considered as the main base run, results from the other runs are in most cases presented in the Supplement.
2.7 Robustness test and exploration of the climate change signal
To test the robustness of the approach to calibrate the model for different parameter combinations with structure and Lmort prescribed from an LPJ-GUESS simulation with default parameters, LPJ-GUESS was finally run with the optimized parameter set, which generated the appropriate corresponding feedback of the damage associated with that setting on the simulated vegetation. A simple test of climate sensitivity was also done for this setting by applying +2 °C to the climate data throughout the simulation.
3.1 Model optimization
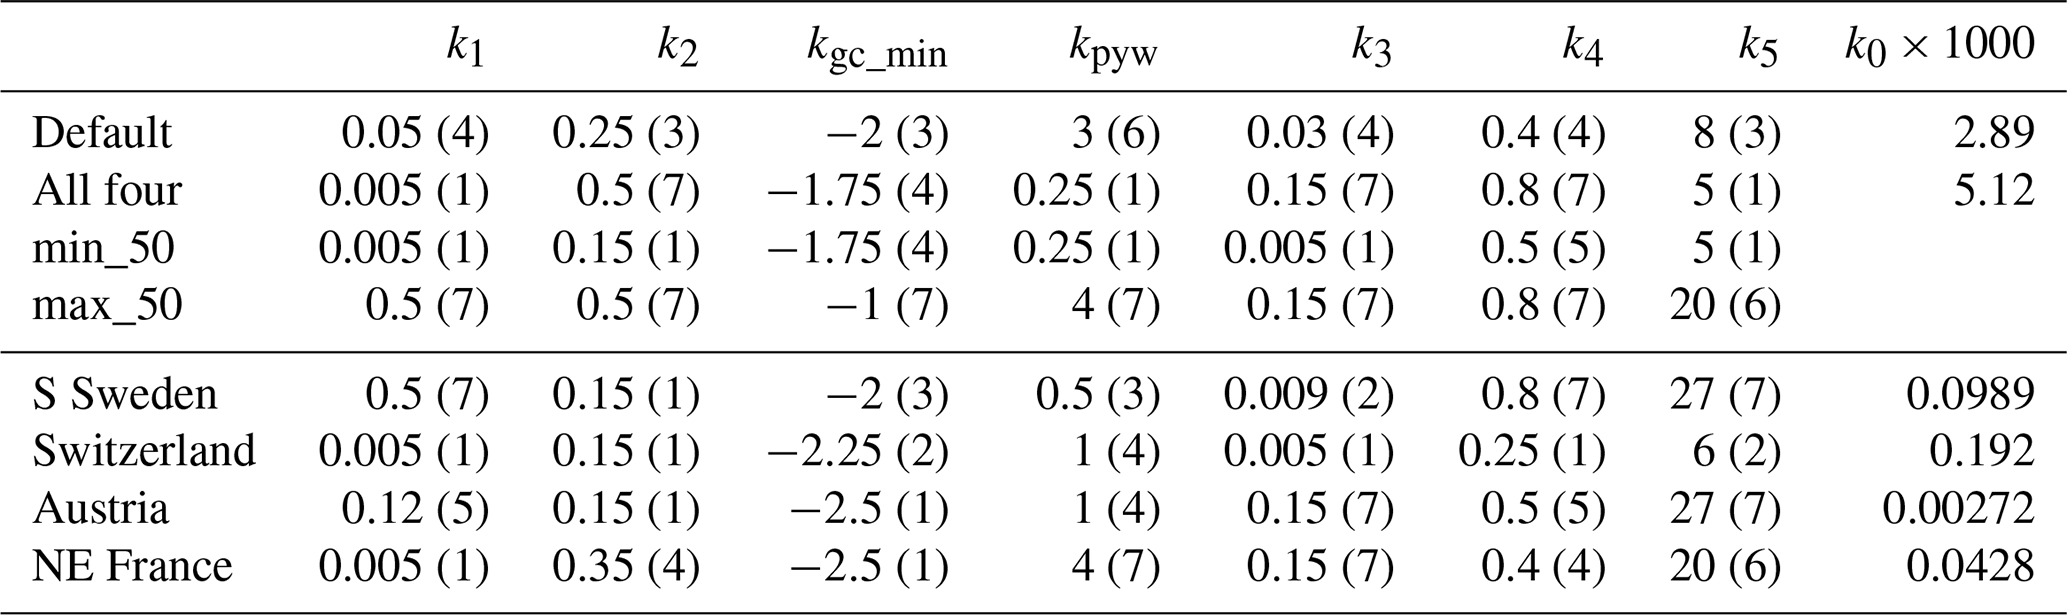
The top ranked set of model parameters differed depending on the country or region assessed (Table 3), the calibration period included and whether SSC was included or not (Table S1). Most of the parameters of the model common for all four regions in the main base-run optimization (with SSC and not including calibration data for Switzerland and Austria 2011–2019) had a large range within the 50 highest ranked models (Table 3) but only one parameter value or a narrow span was dominant (Fig. S1 in the Supplement). It should be noted that all calibrations included a calibration of k0 based on data from all countries, then the optimum model among the 77-parameter space for the regions, countries, or all together, was selected, which explains why there is a difference for S Sweden and NE France when including calibration data 2011–2019 for Austria and Switzerland (Table 3 vs. Table S1a (in the Supplement) and Table S1b vs. Table S1c).
Table 3Parameters in the main base run setting (with SSC and not including calibration data for Switzerland and Austria 2011–2019), for the top-ranked model in terms of combined statistics of bias, RMSE and R2 for all four regions/countries together and for each region/country separately. For all four regions/countries together, also the parameter range for the 50 highest ranked combinations is shown (min_50, max_50). The k0 values are the results of the calibration, LPJ-GUESS was run with a k0 of 0.003. The numbers in parenthesis is the order number (from smallest to largest) of the seven values tested within the full parameter range (Table 2).
3.2 Model performance
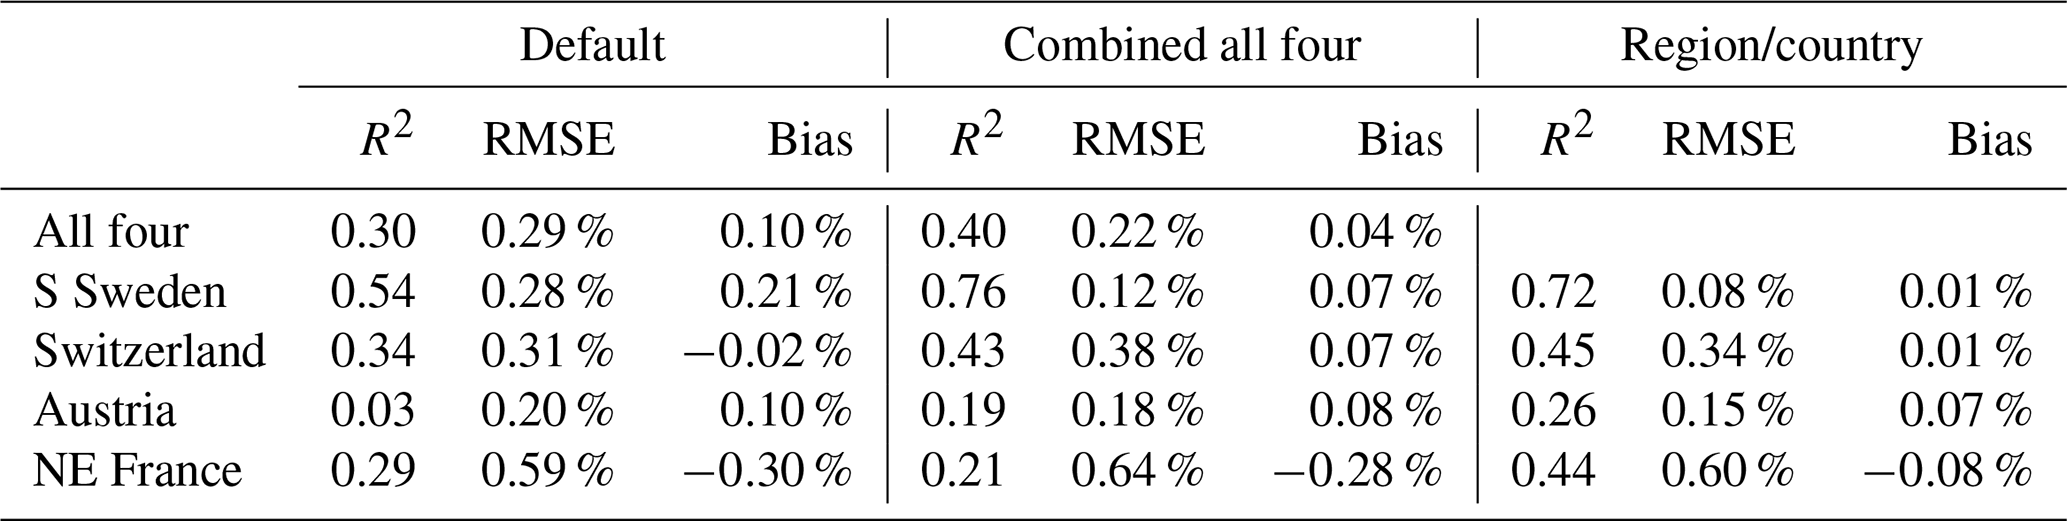
The optimization procedure resulted in reduced bias and RMSE and increased R2 compared to the default setting (Table 4, Fig. 3, Table S2, Fig. S2–4). The model captured the outbreak dynamics well for S Sweden. In Switzerland R2 was rather low, mainly because the peak in damage after the 1999 storm in 2001 was not captured. In North-East France there was a large spread in the observed outbreak after the 1999 storm, with Alsace and Lorraine having a large peak in 2001, while the other counties had a more slowly evolving progress. In Austria the outbreak starting in 2003 after the 2002 storm, with significant storm damage also in 2008 and 2008, lasted almost a decade though the response from the functions of phenology and drought did not indicate that these factors supported the outbreak, resulting in low R2. Including years 2011–2019 data from Austria and Switzerland in the calibration resulted in similar outbreak pattern (Figs. 3, S2).
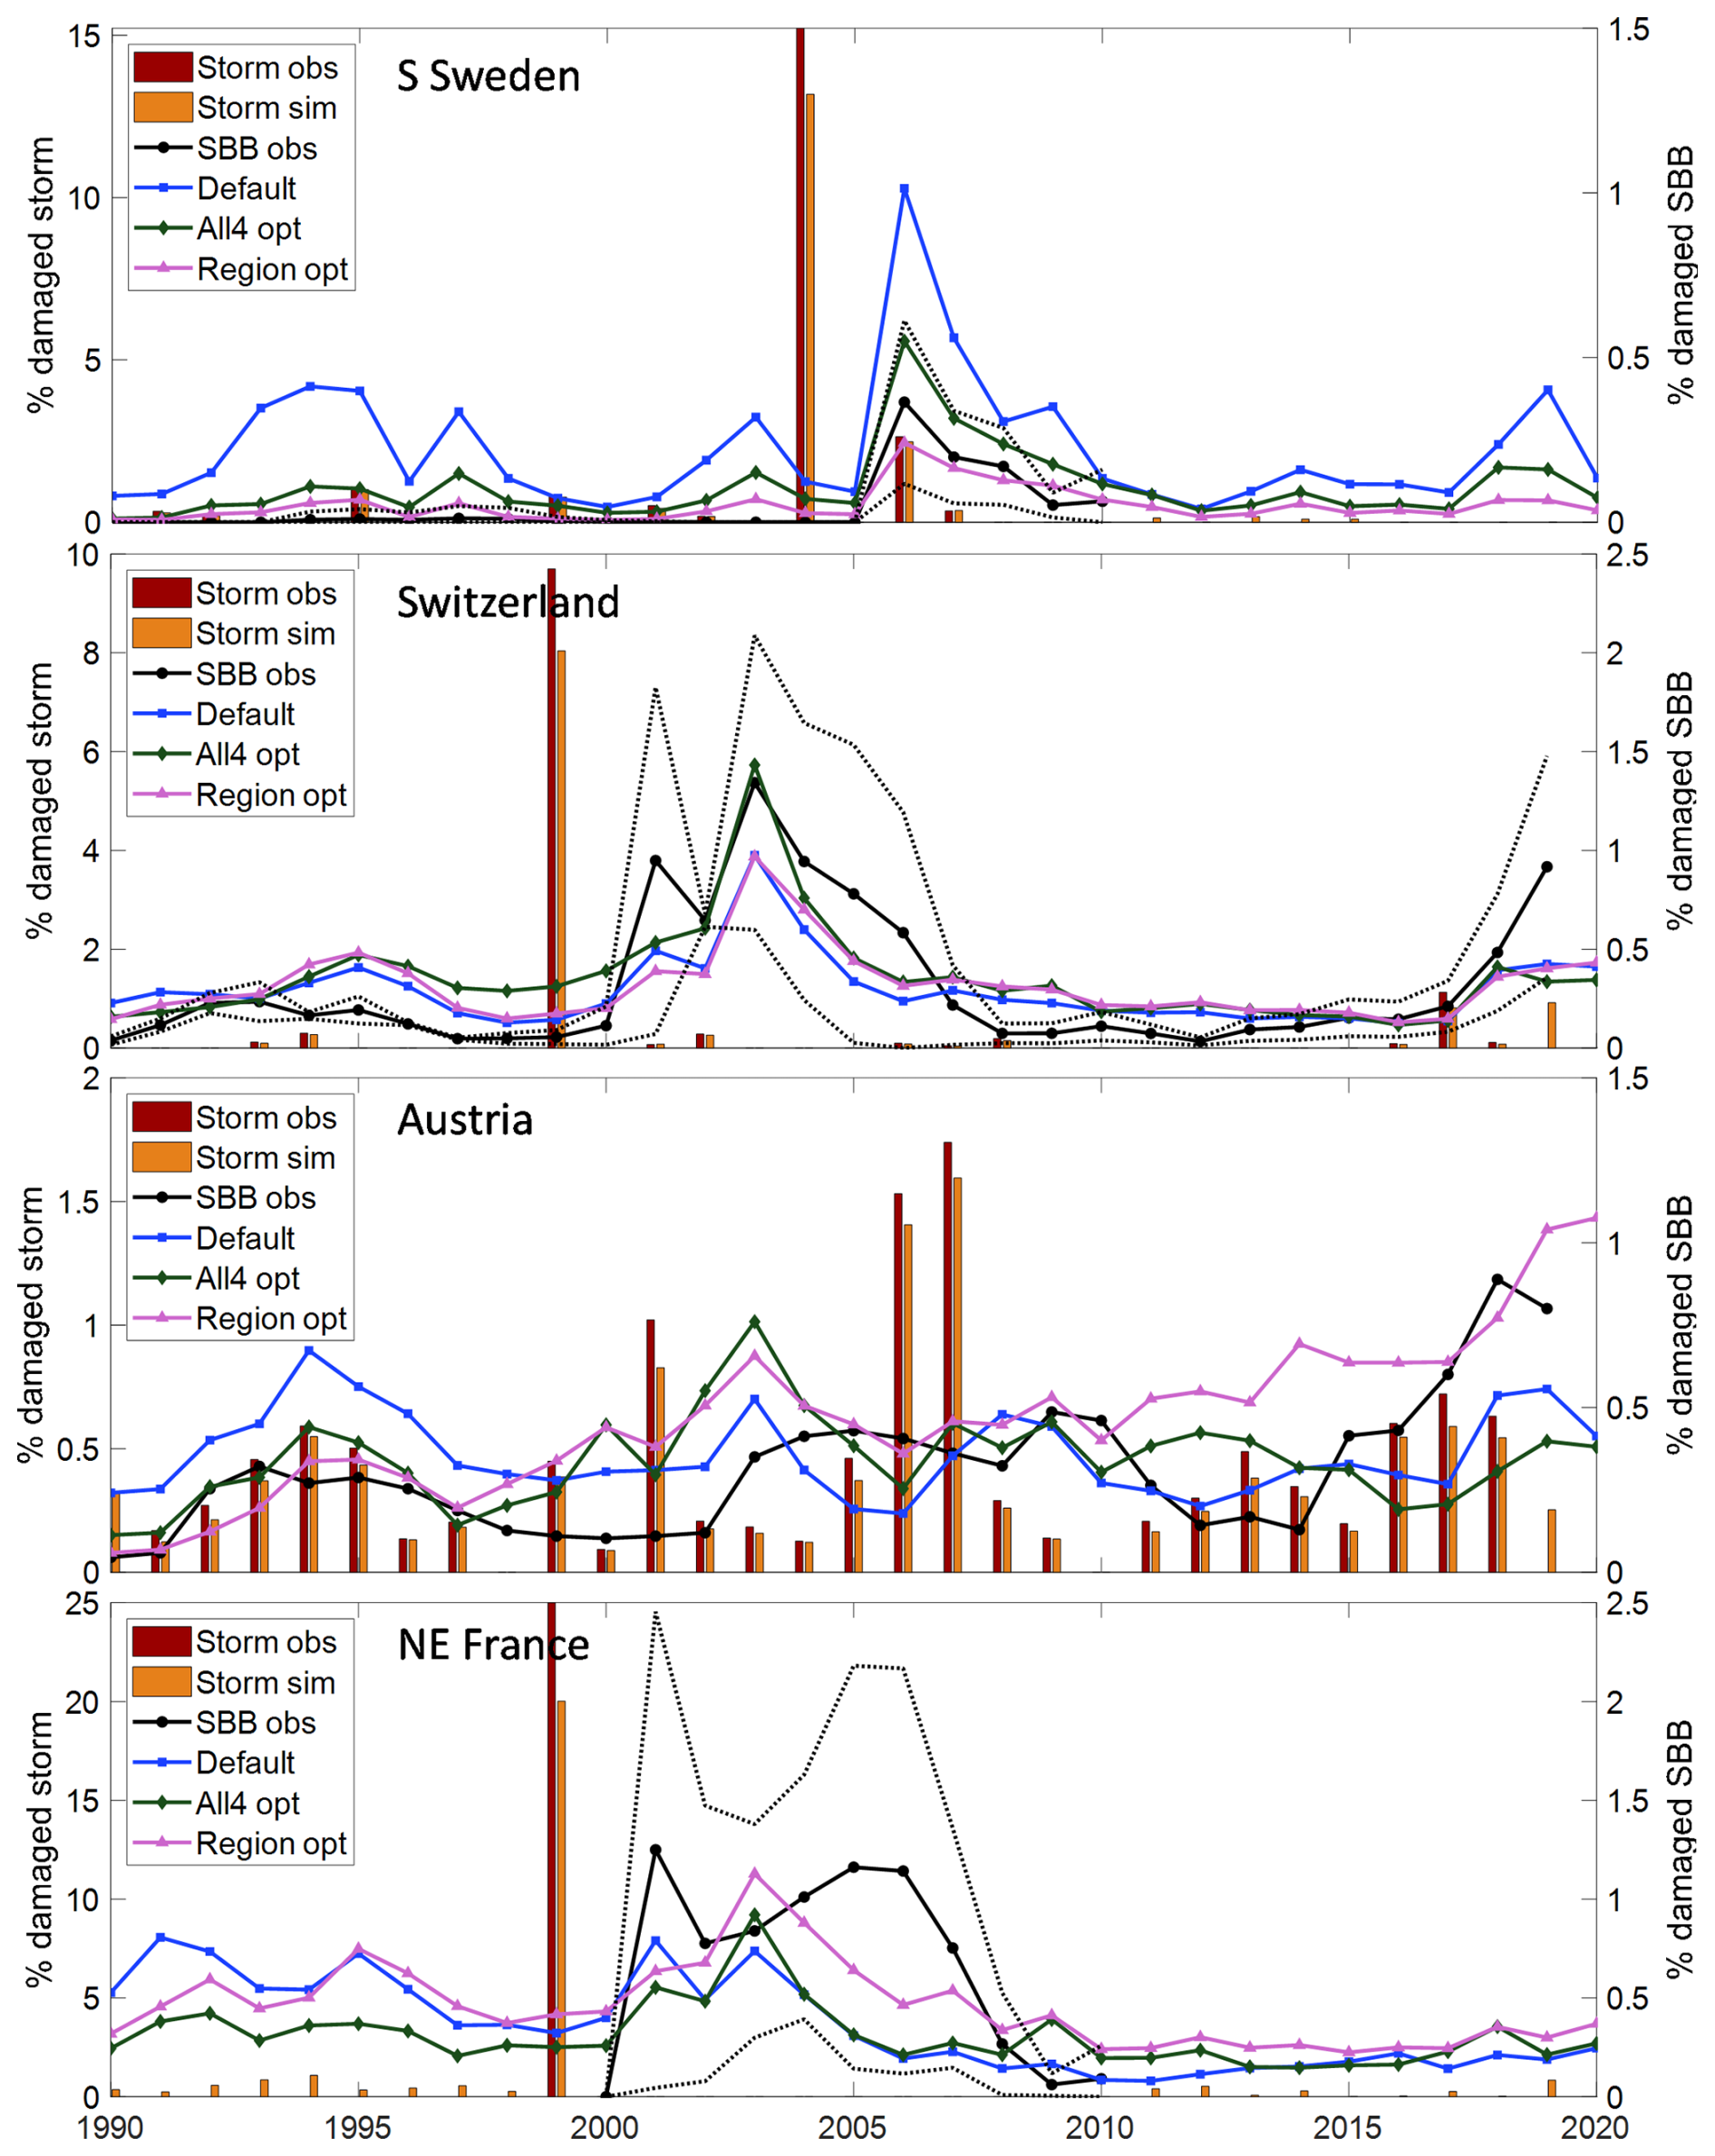
Figure 3Observed and modelled fraction of spruce forest damaged by storm (left y-axis) and SBB (right y-axis) in four regions/countries, with modelled SBB damage from different parameter settings (Table 3) in the main base run. For Sweden (n=10), Switzerland (n=2) and France (n=5) ± standard deviation between regions in observed SBB damage is shown with dotted lines.
Table 4Statistics for different parameter settings; default (Table 2), the top-ranked model in terms of combined statistics of bias, RMSE and R2 for all four regions/countries together and for each region/country separately, in the main base run.
Accumulating the SBB damage over time shows that level of damage during outbreak situations was generally well captured for all four region/countries (Fig. 4). The difference depending on setting for the calibration was quite large, and in the main base run the total damage for SE France was underestimated. During non-outbreak situation in Sweden the accumulated damage is higher than observed while it agrees better in Austria and Switzerland but this may to a large extend depend on the way damage is reported, as discussed in Sect. 4.
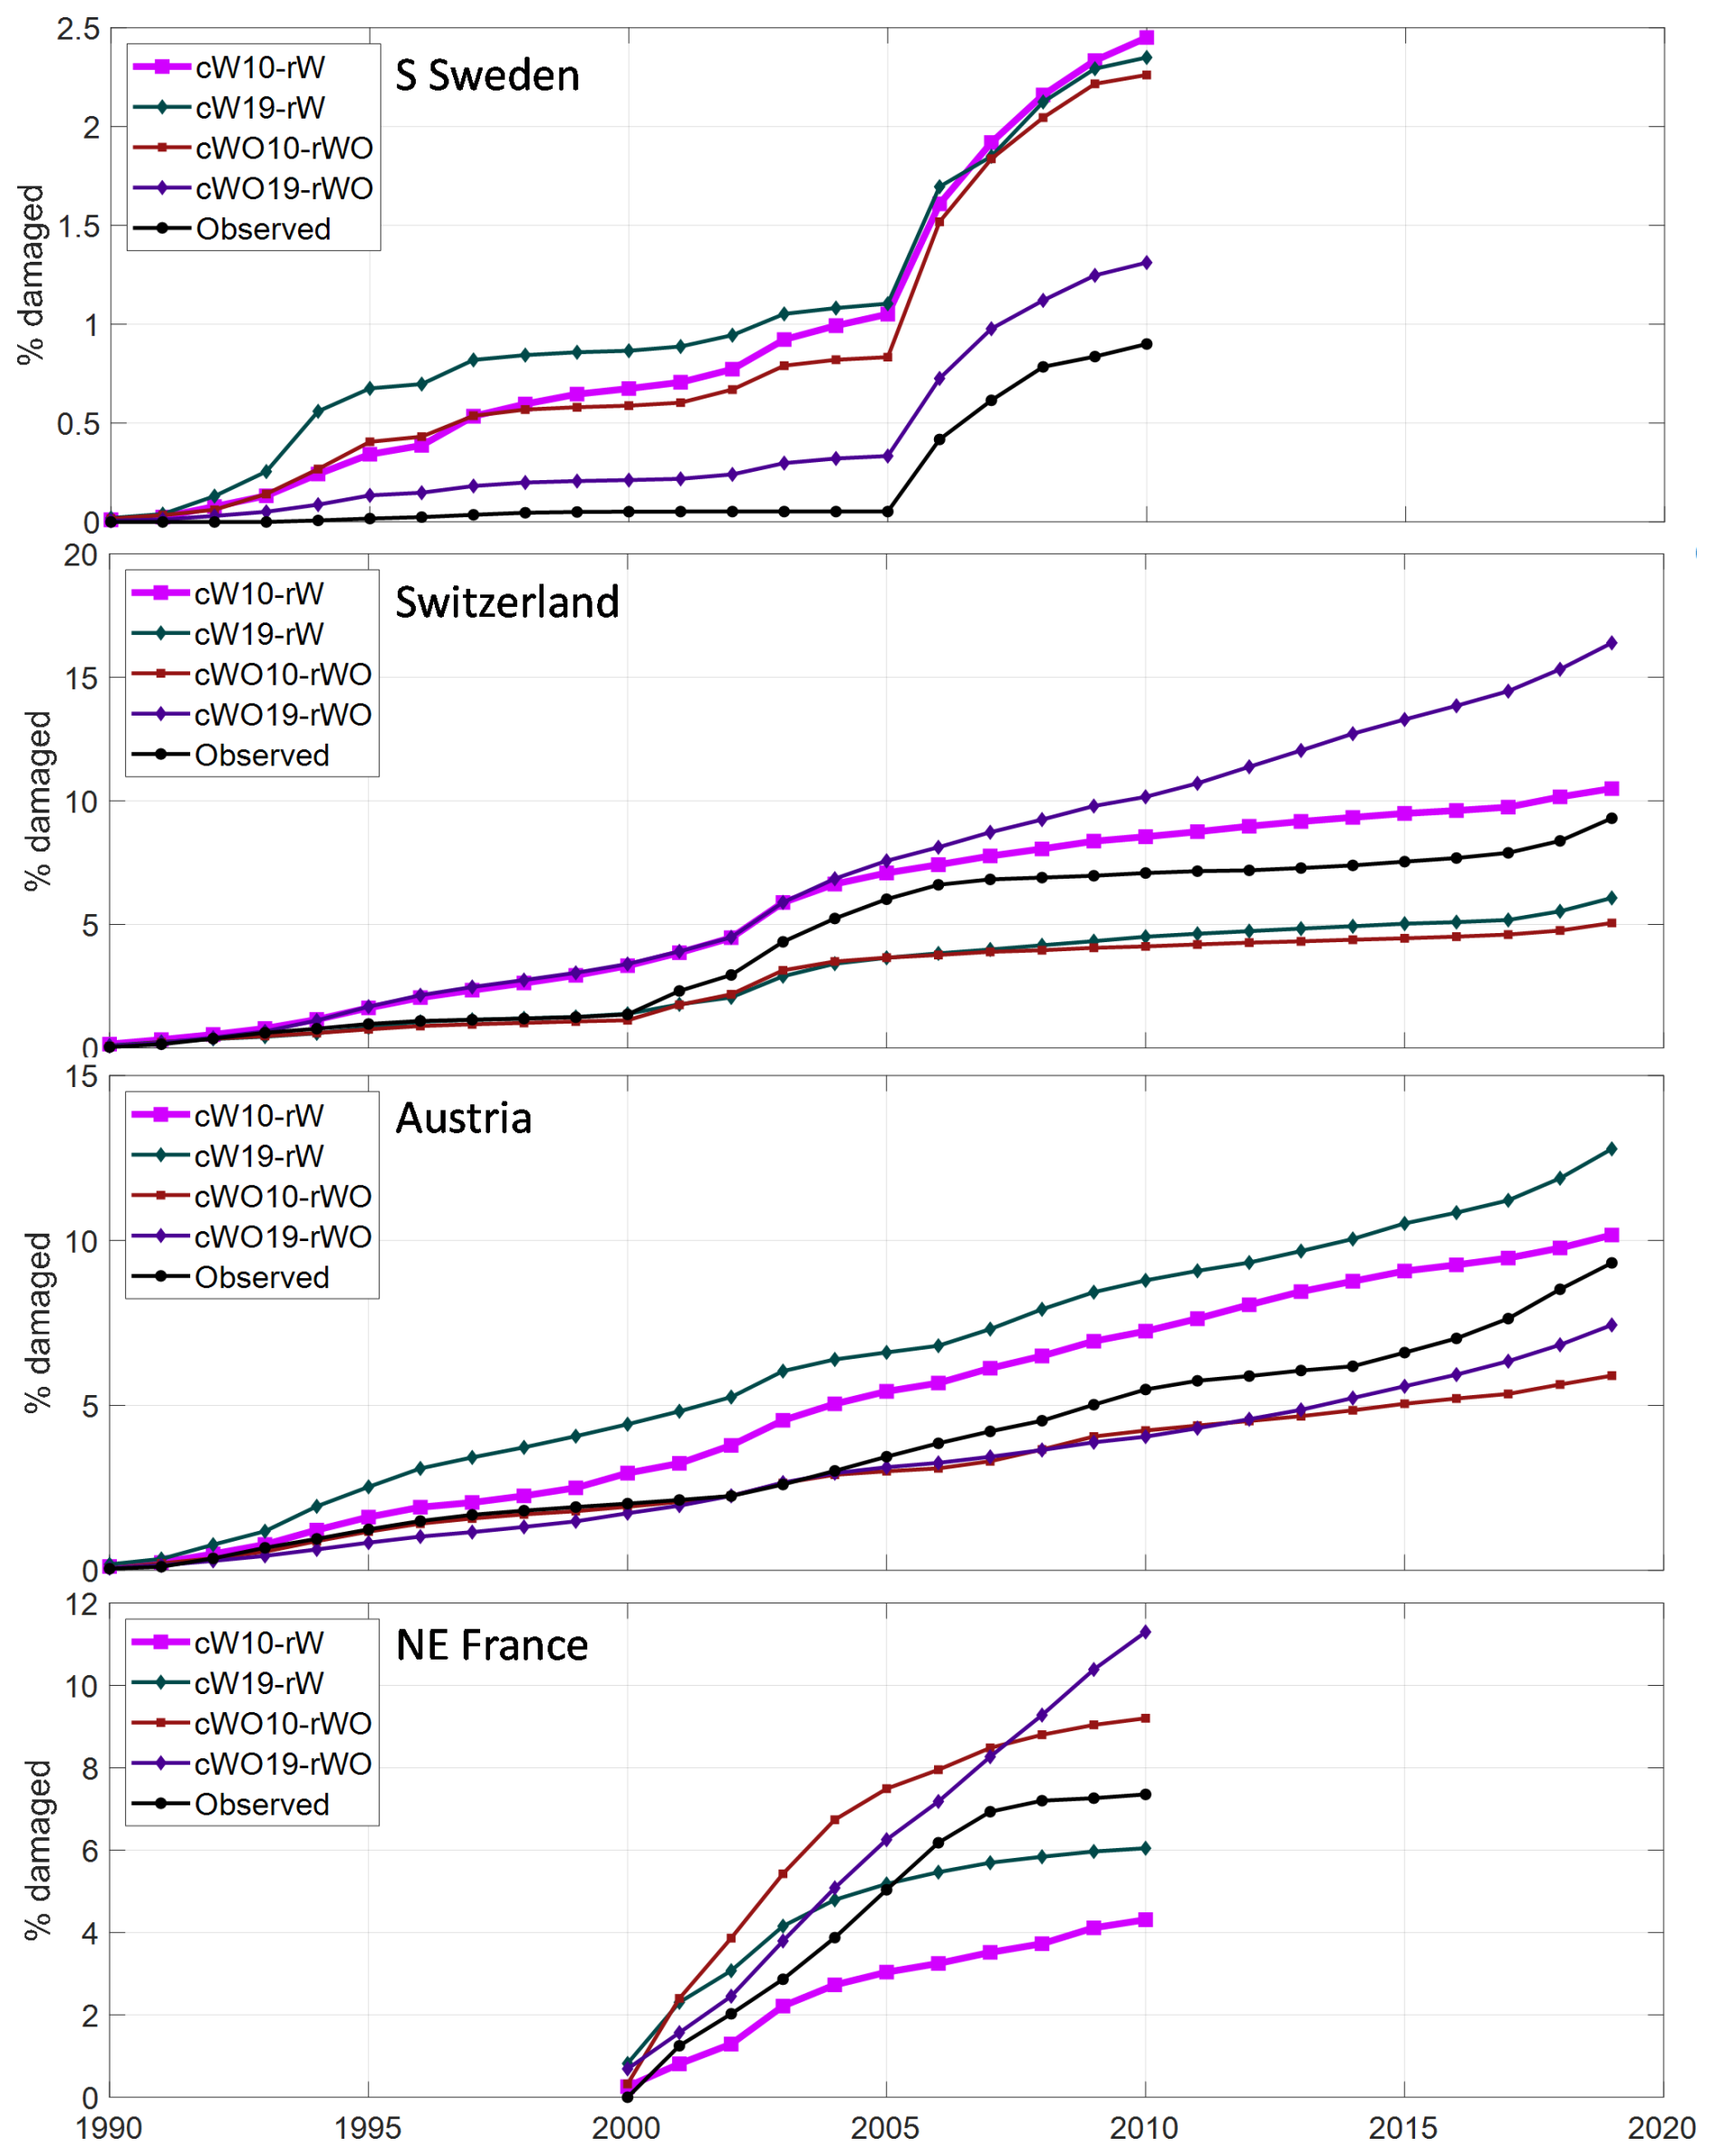
Figure 4Accumulated fraction of simulated and observed spruce forest damaged by SBB in the four regions/countries over the period with observations. Calibrations are shown using only data up until 2010 (10) and also including data for Switzerland and Austria 2011–2019 (19) as well as with (W) or without (WO) salvage and sanitary cutting. The main base run setting, cW10-rW, is showed by bold line.
3.3 Model sensitivity
Including the 2011–2019 data for Austria and Switzerland in the calibration resulted in higher accumulated SBB damage in Austria and NE France but lower level in Switzerland with SSC (Fig. 4). Without SSC it resulted in substantially higher accumulated damage in Switzerland and NE France as the outbreaks continued at a high level for more years (Figs. S3–S4).
Applying the parameter set obtained with SSC without SSC resulted in 1.7 (Austria) to seven (Sweden) times higher simulated damage levels and the calibration without SSC run with SSC showed reductions of similar magnitude (Figs. 5, S5). It should be noted though that the negative feedback on forest vulnerability when trees are killed is not included in these stand-alone implementations, giving a higher background damage level in the run without SSC.
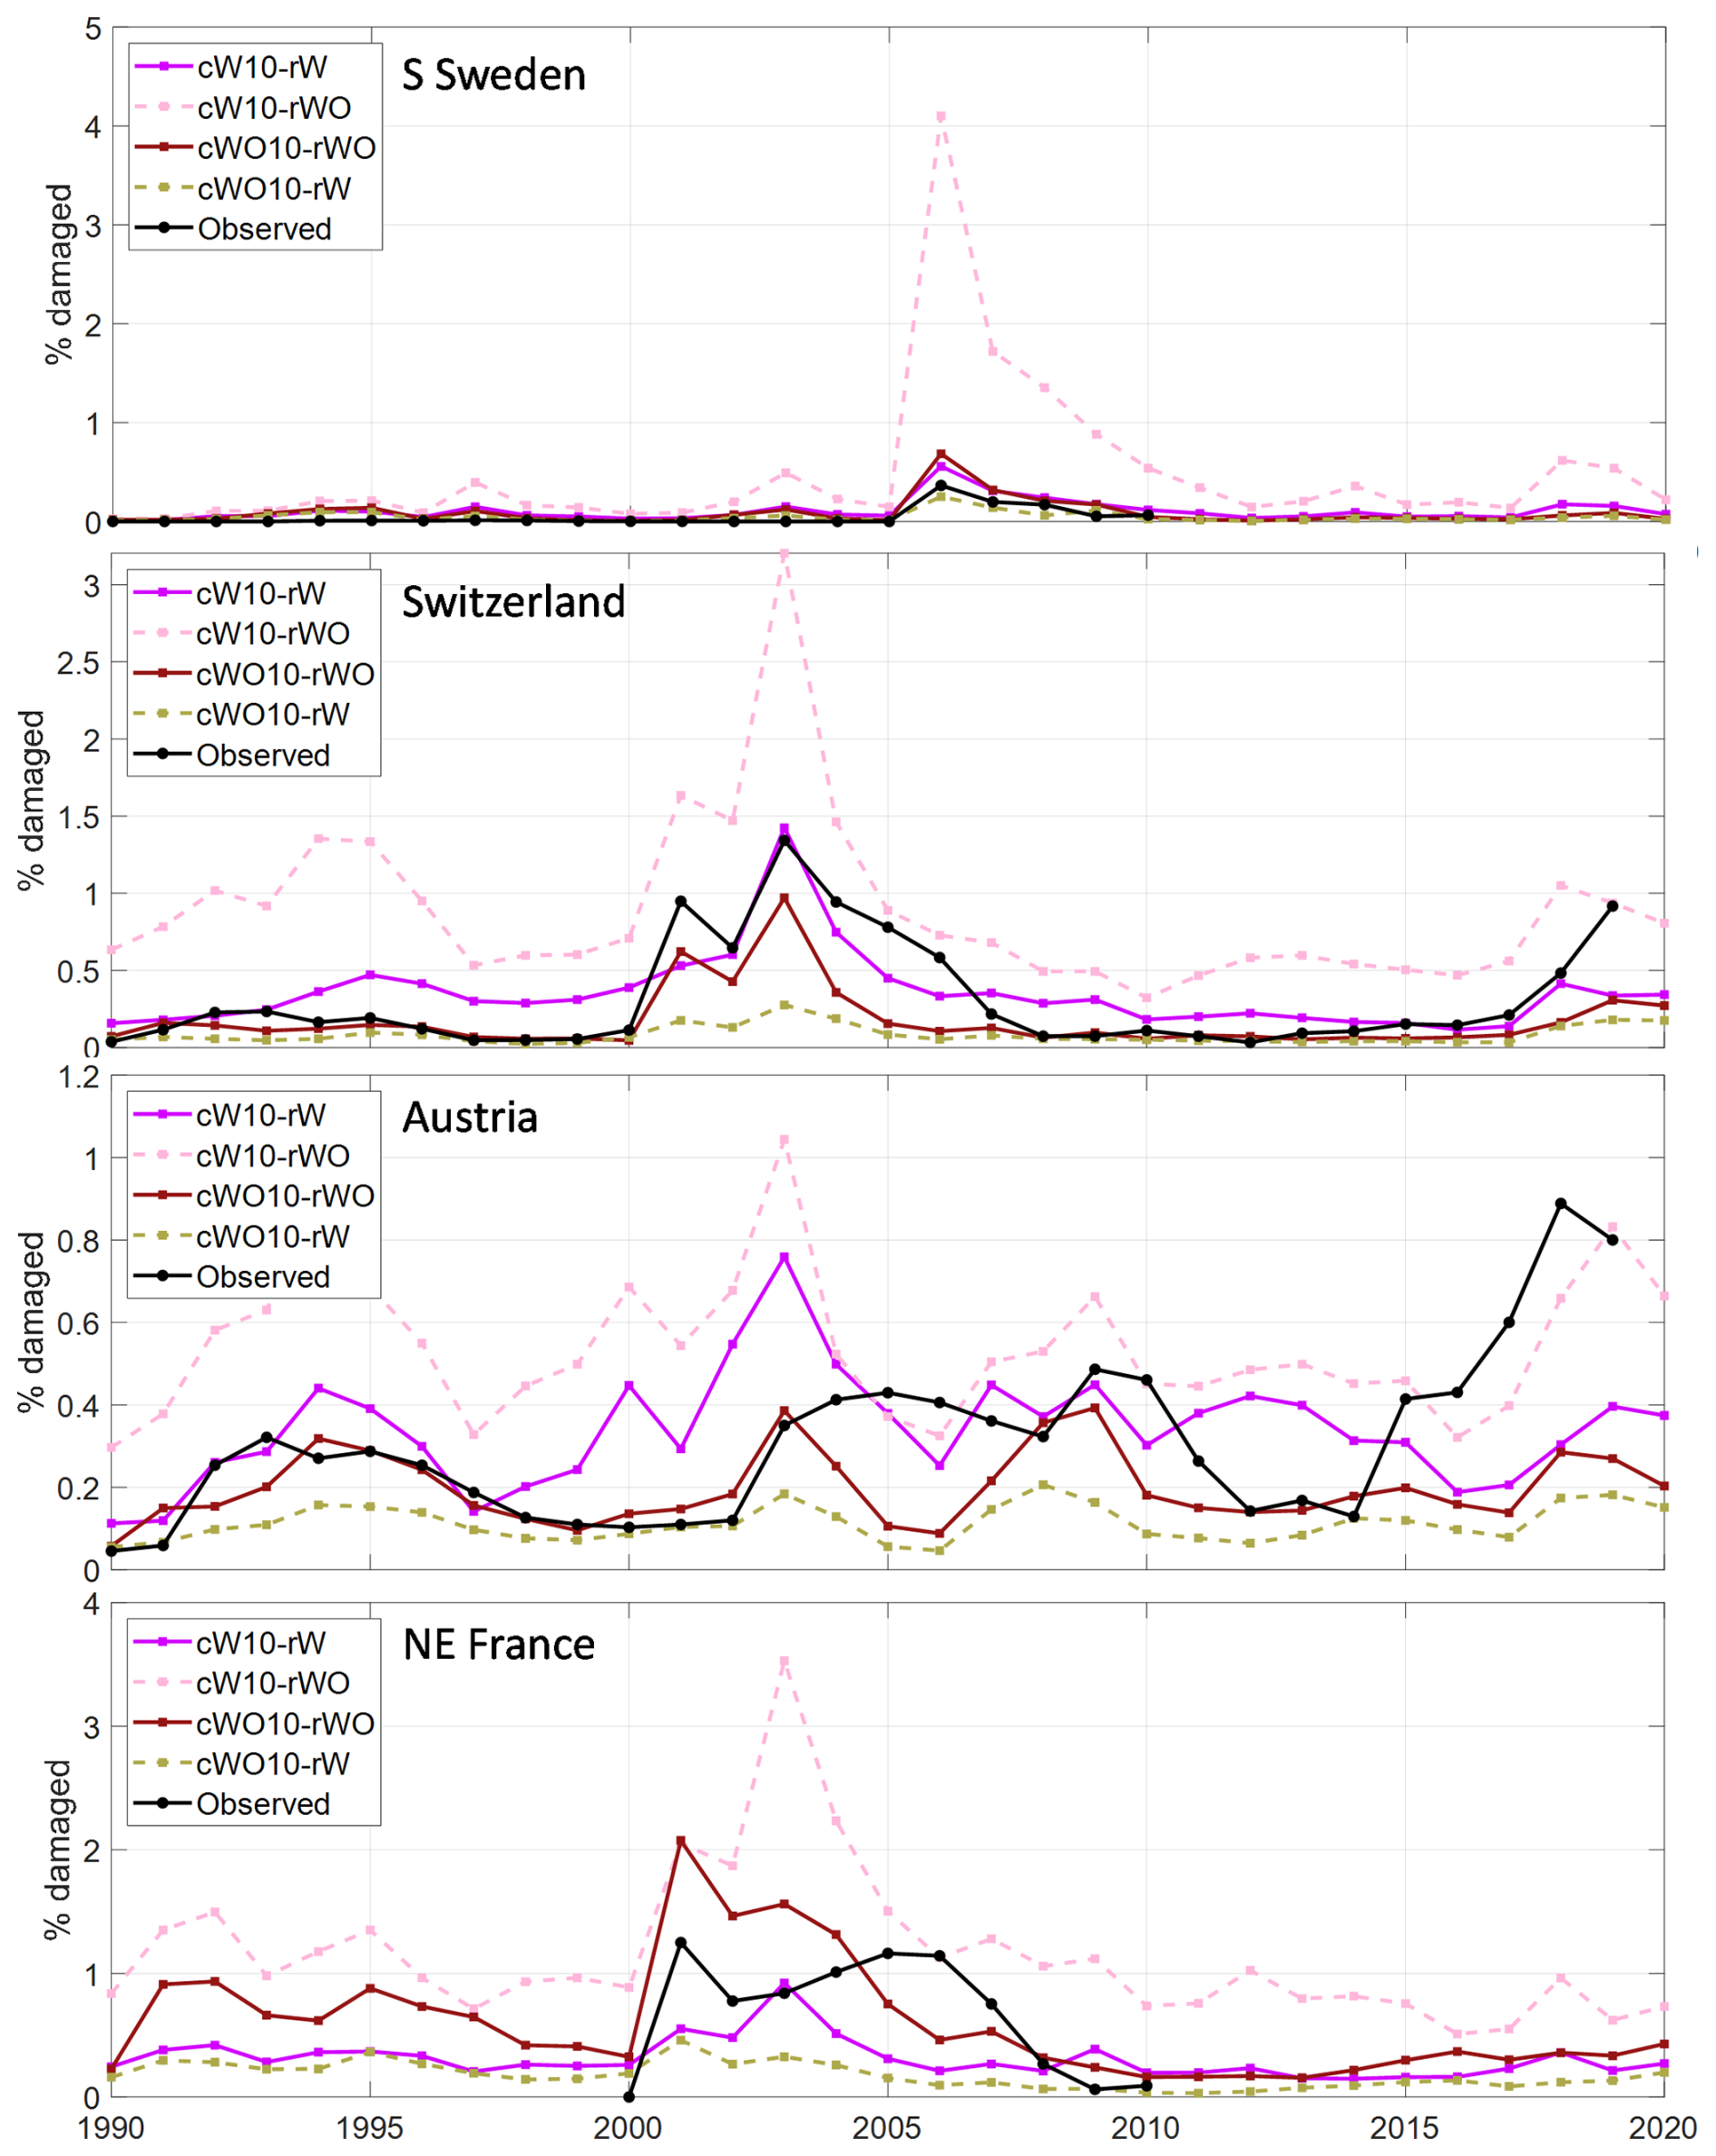
Figure 5Test of the sensitivity of including salvage cutting of storm felled trees and sanitary cutting of infested trees (SSC) for the fraction of SBB killed trees in the four regions/countries. The calibrations with (cW) and without (cWO) SSC using calibration data for 1990–2010 (10) were run both with (rW) and without (rWO) SSC. In Fig. S5, the calibrations also including 2011–2019 data for Austria and Switzerland are shown.
Up to this point all results are for the stand-alone Matlab implementation based on the vegetation from the default LPJ-GUESS run, i.e. with feedback on vegetation structure from SBB damage from the default run instead of from the what a fully-coupled simulation with the calibrated parameters would generate. Applying the calibrated parameter set of the “All4 opt” calibration in LPJ-GUESS showed a very good match with the stand-alone simulation for S Sweden, a minor underestimation in NE France and underestimations by 35 % and 70 % in Switzerland and Austria, respectively (Fig. 6). An in-depth analysis for Austria showed that the difference was due to one grid cell where the missing negative feedback from spruce killing resulted in accumulated modelled damage in the stand-alone version that widely exceeded the availability of spruce trees. Removing this grid cell gave similarly low levels as for the LPJ-GUESS run with calibrated parameters, showing that the applied stand-alone optimization methodology resulted in a parameter set that gave an underestimation when implemented in LPJ-GUESS in this case. It can, therefore, be concluded that this calibration process resulted in a calibrated model with conservative damage estimates.
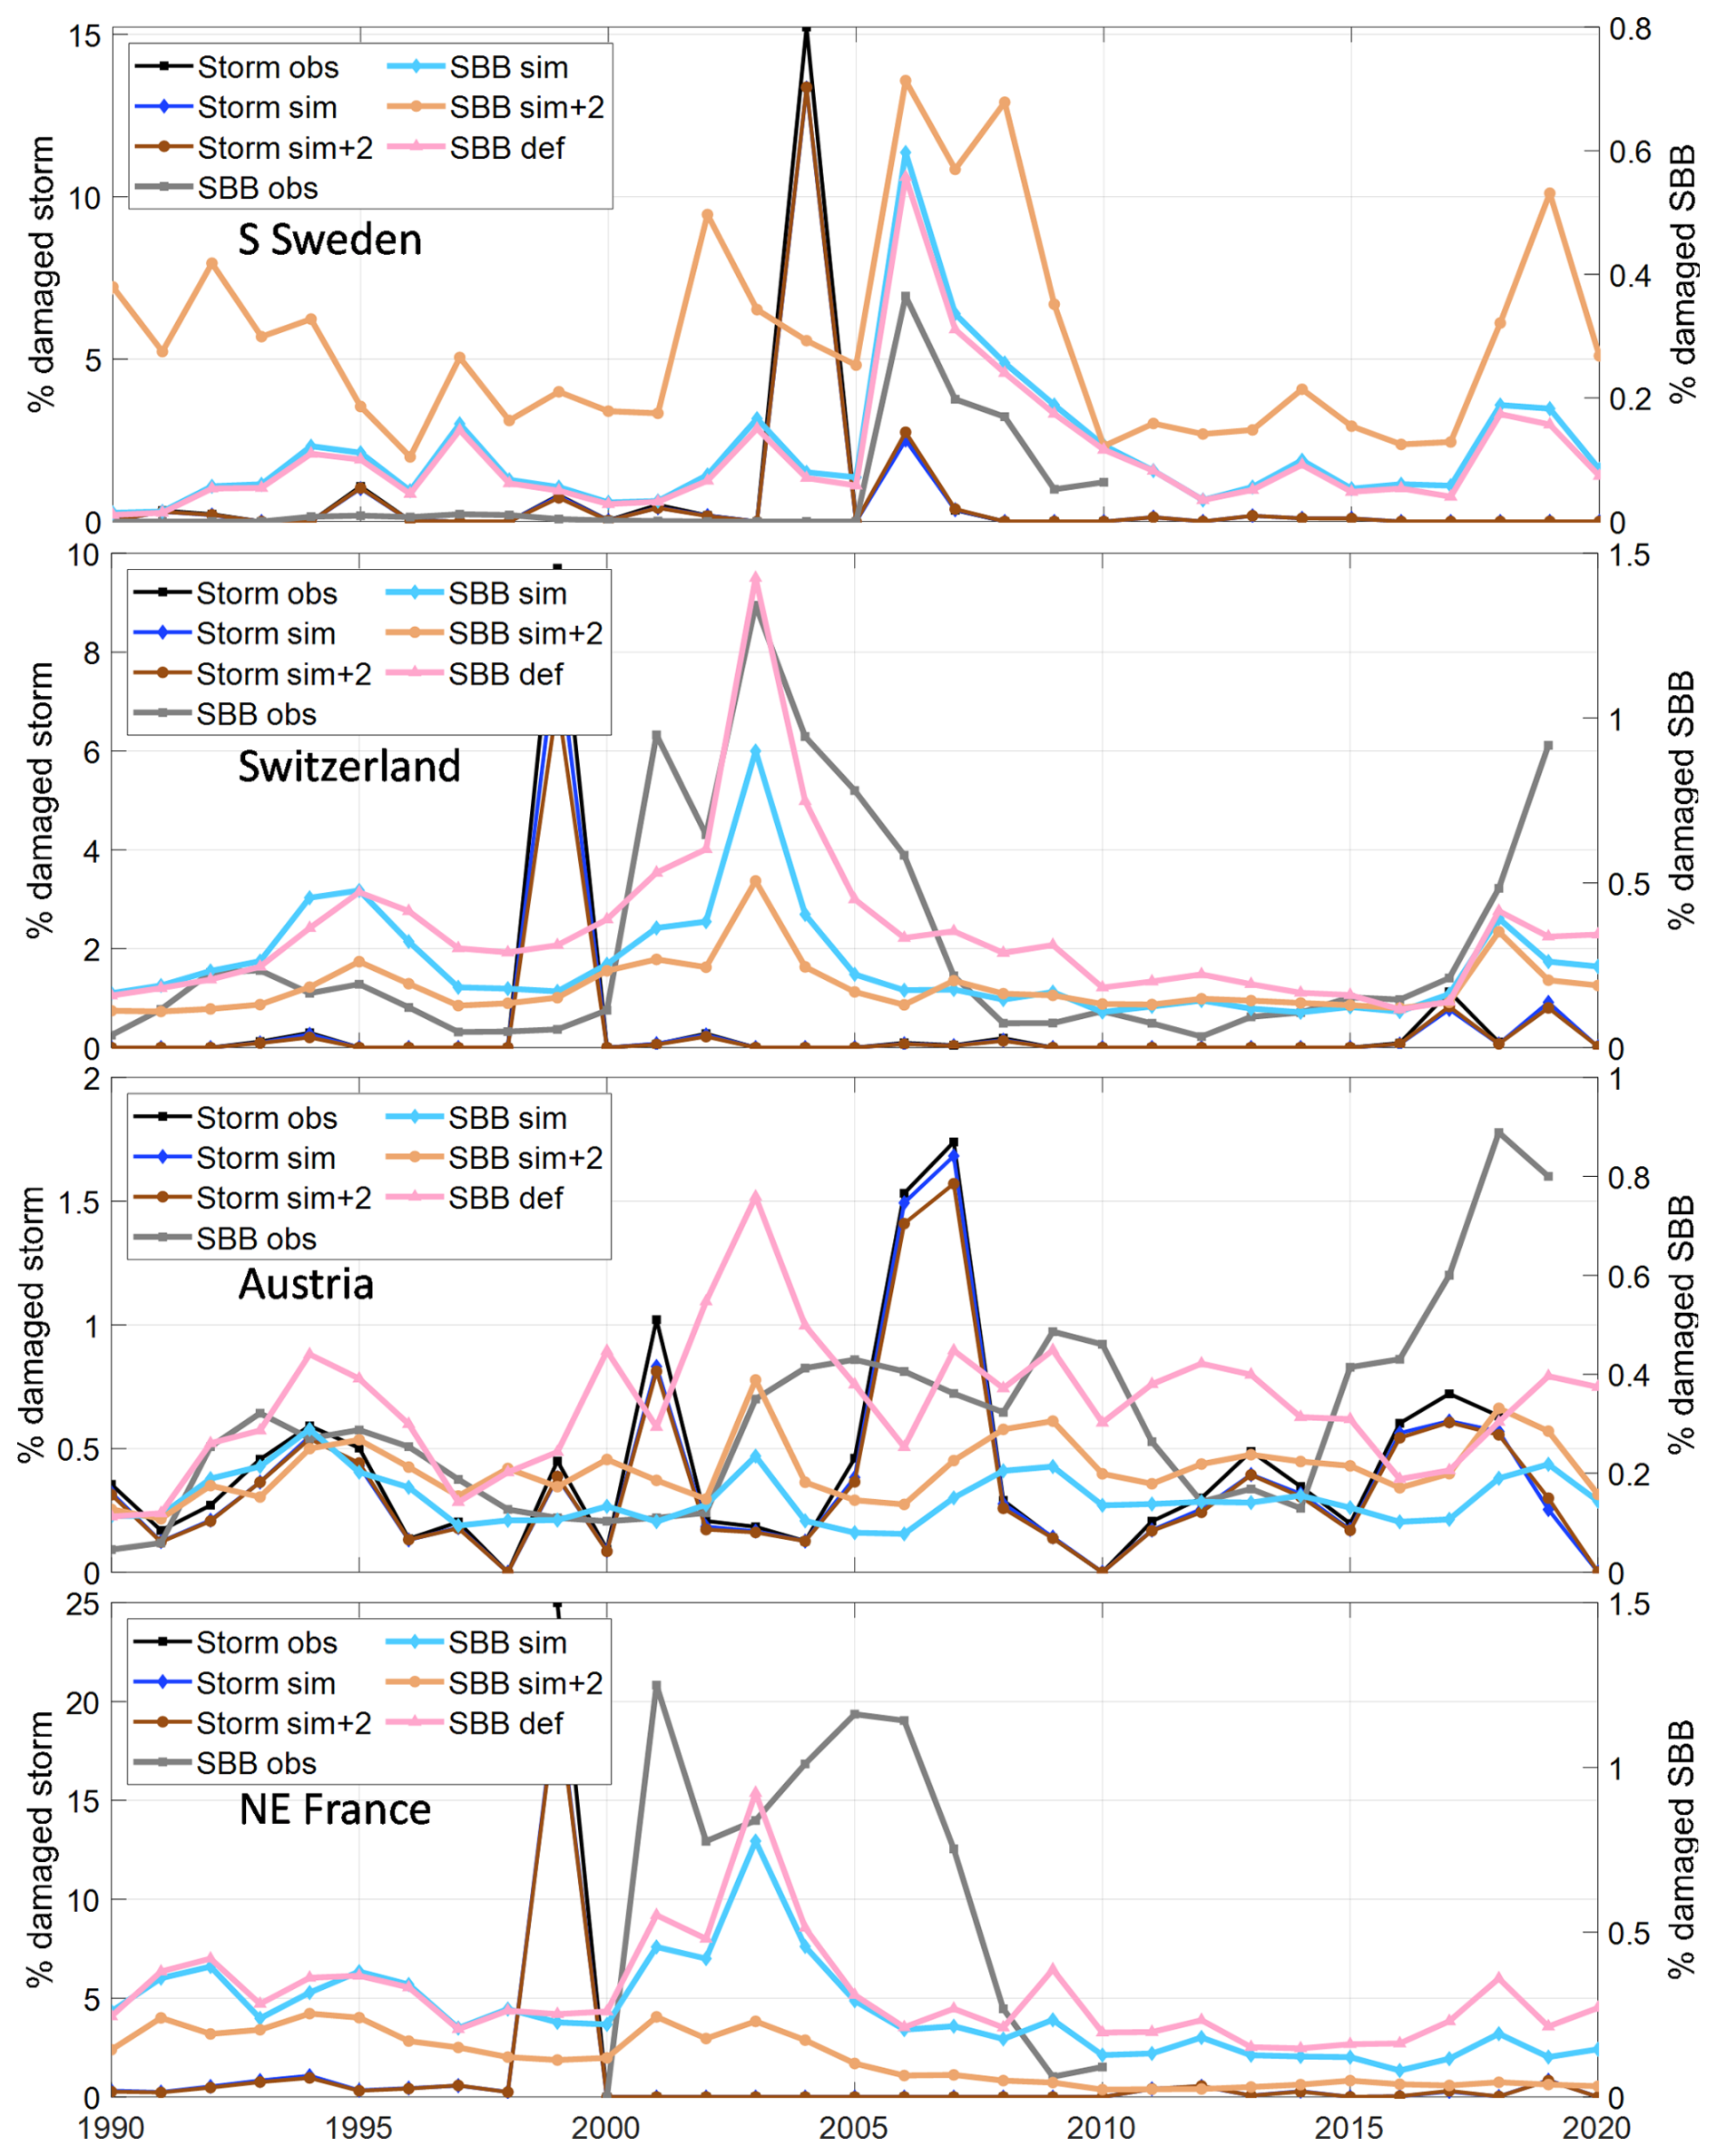
Figure 6Sensitivity test of modelled storm and spruce bark beetle damage for temperature and model environment in the four regions/countries. Model output from the calibrated stand-alone version with tree structure and storm damage input from the default LPJ-GUESS run (def, “All4 opt” in Fig. 3) and the calibrated model run within LPJ-GUESS with normal climate (SBB sim) and with +2° temperature (sim + 2) compared to observations (obs).
The simple climate sensitivity test of increasing the temperature by 2 °C resulted in an expected increase in SBB damage in S Sweden and Austria (Fig. 6). In Switzerland and NE France, the warming resulted in significantly reduced biomass of the boreal BNE PFT and consequently a reduction in SBB damage as this PFT was close to its environmental limits and outside Norway spruce's native distribution in these regions (Caudullo et al., 2016), already in the present climate.
The modelling approach tested here was able to catch the main features of bark beetle outbreaks but for single outbreaks there were some discrepancies. For evaluating these discrepancies, the course of an insect outbreak can be boiled down to predisposing, triggering and contributing factors (Saxe, 1993). A summary of these factors by country is shown in Fig. 7, and will be the base for our discussion.
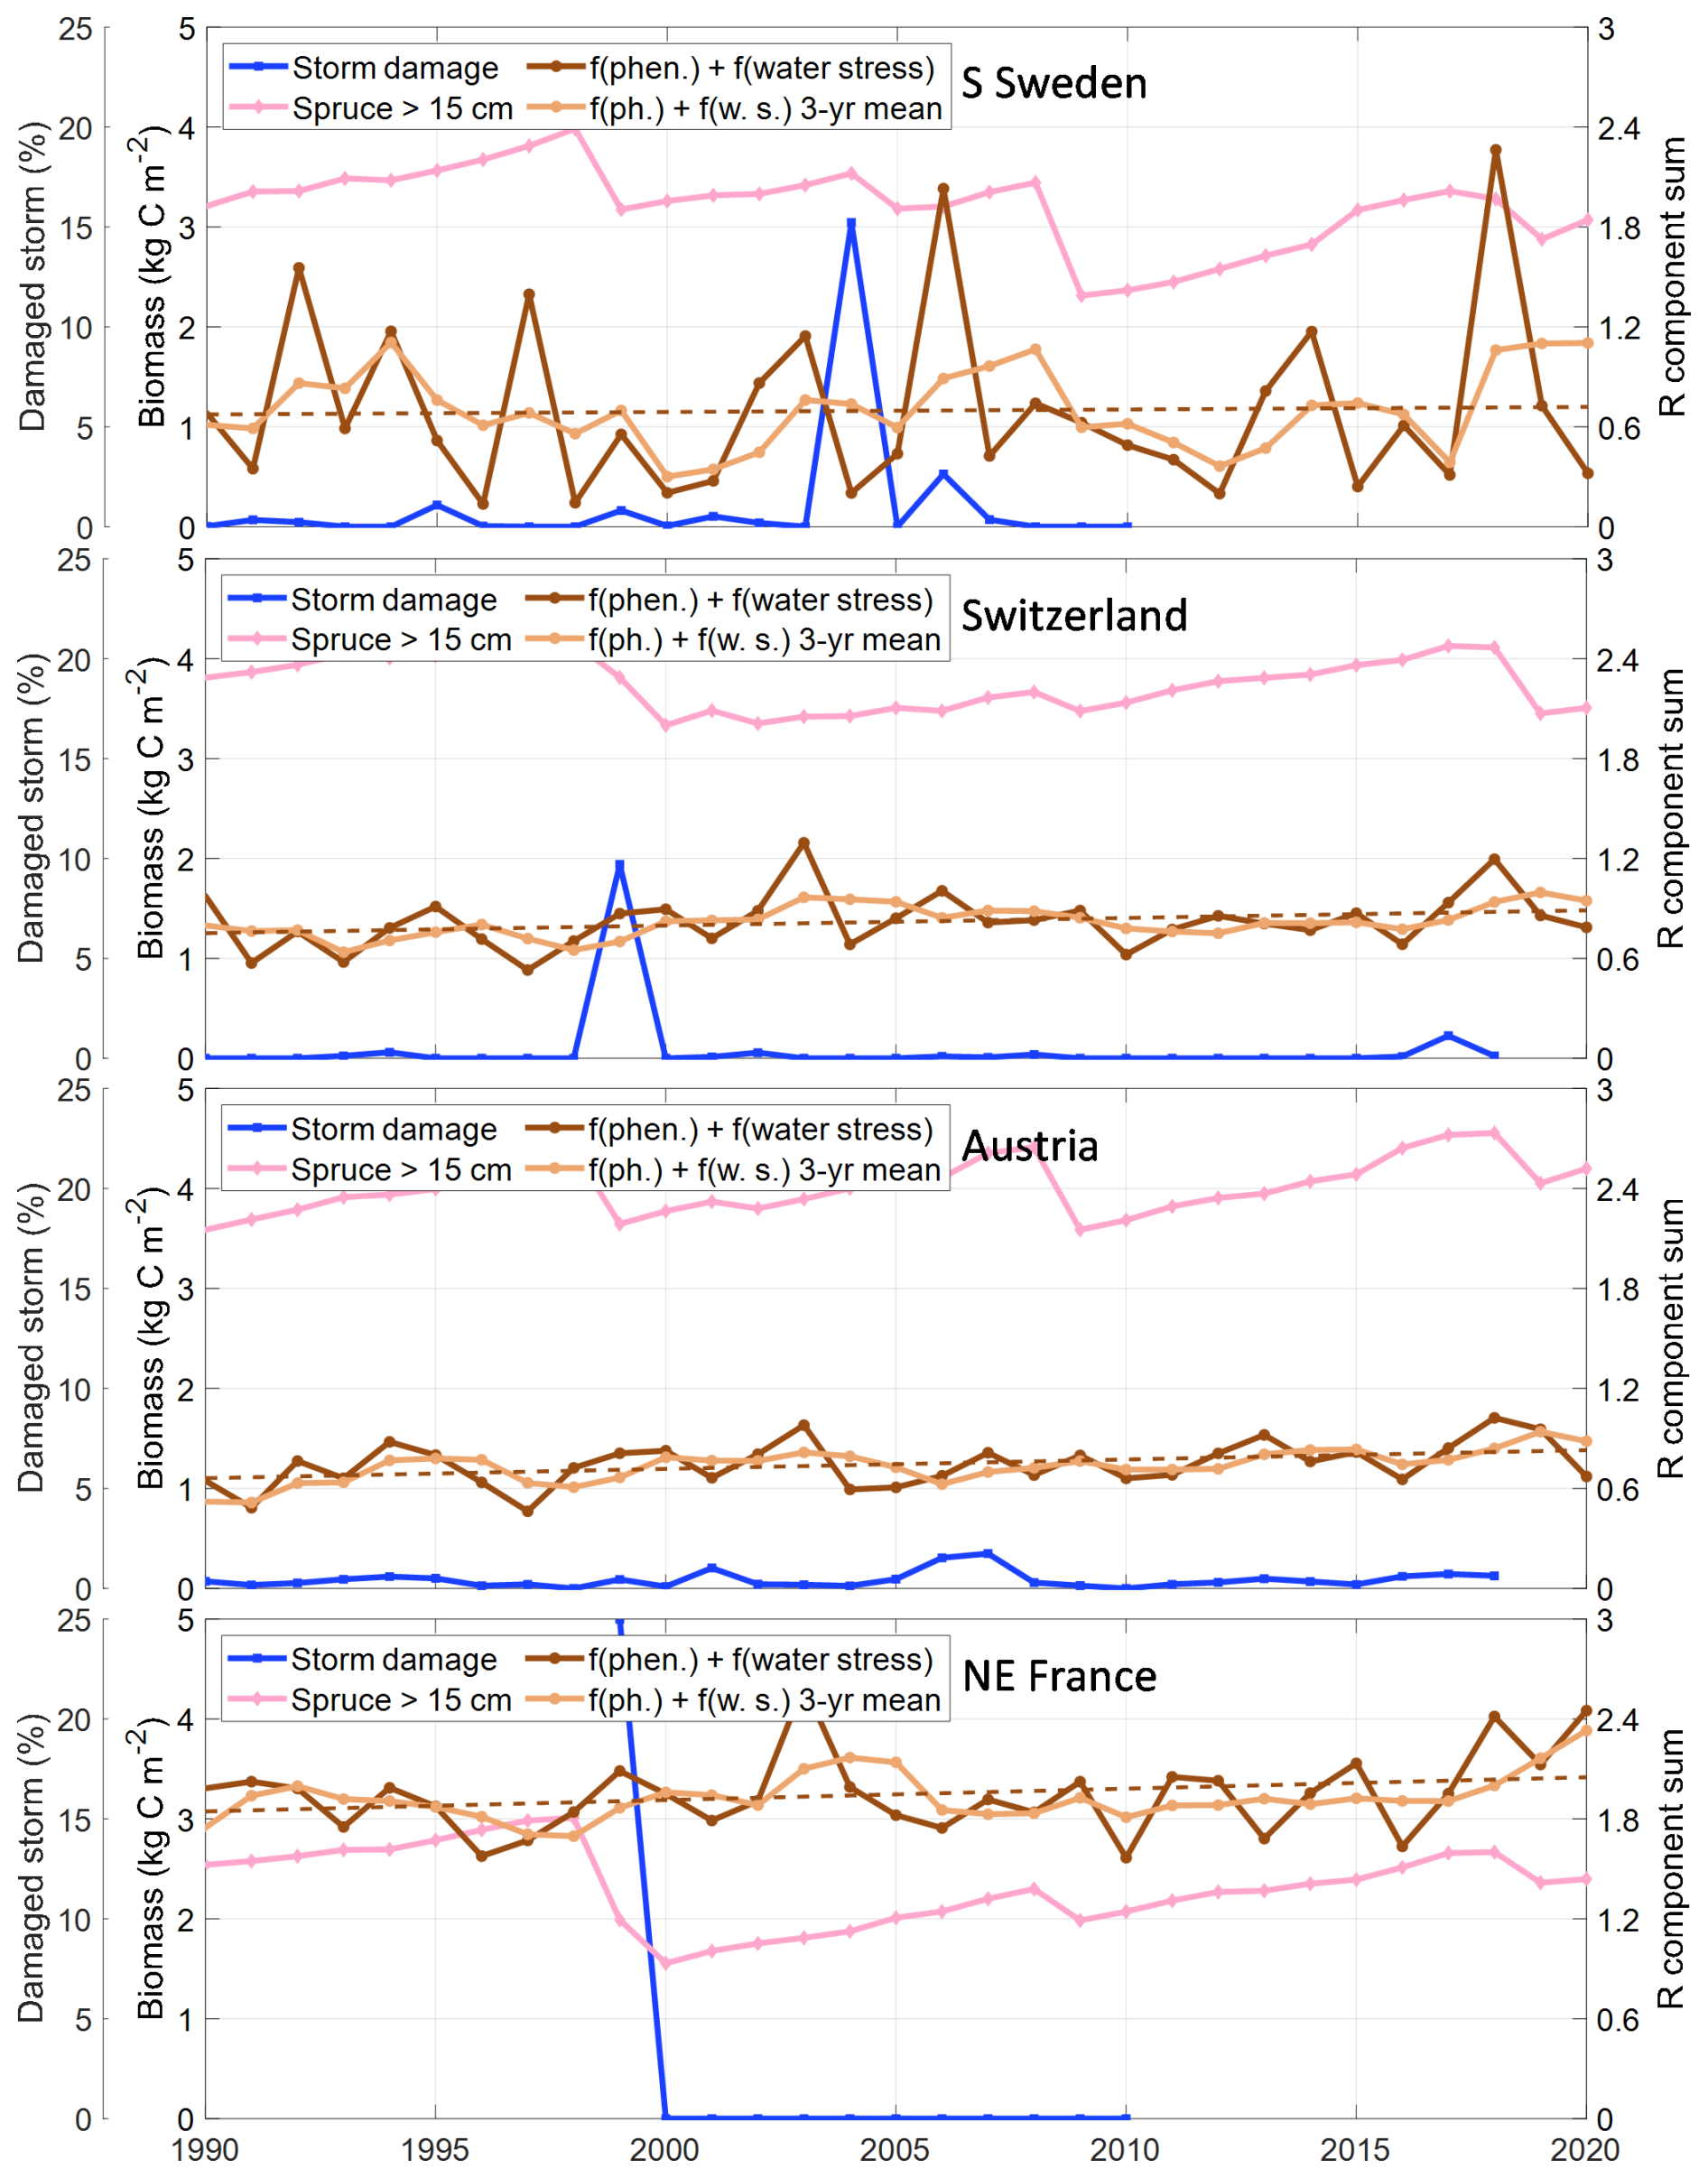
Figure 7Sensitivity for SBB outbreak in the four regions/countries divided in predisposing (biomass of spruce trees with a diameter larger than 15 cm), triggering (fraction of spruce volume damaged by storm) and contributing (the sum of the phenology and water stress related components for the increase rate of the bark beetle population index, R Eq. 4) factors. For the phenology and water stress R components sum the running 3-year mean and the trend over time (dashed line) are also shown.
Several empirical models based on inventories and remote sensing exist that are built to capture different stands' predisposition to SBB outbreaks, supporting risk management in silvicultural planning (Blomqvist et al., 2018; Jakus et al., 2011; Müller et al., 2022; Overbeck and Schmidt, 2012). Just as in empirical studies, our results are strongly dependent on the structure of the simulated forest. Trees are only predisposed to SBB infestation in LPJ-GUESS if their diameter at breast height exceeds 15 cm (parameter dlim). The 15 cm threshold is relatively well-supported as a rule of thumb, but is certainly overly binary. The diameter limit has, in fact, no direct physiological relationship to SBB preference but is related to bark thickness, which is directly related to the possibility to breed (Schlyter and Anderbrant, 1993), with more bark beetle offspring per unit bark area in larger trees (Weslien and Regnander, 1990). A direct modelling of bark thickness would introduce several poorly-constrained parameters, but combining high resolution information on forest structure and bark beetle outbreaks may allow to refine the threshold in the future.
The role of forest structure in predisposition means that our SBB outbreak simulations are strongly dependent on the available information on stand age used to drive LPJ-GUESS. The stand-age observations which we used as the basis for age structure are derived from forest inventory data (Pugh et al., 2019) and therefore should be representative of the forest. Differences in how stand age is defined and assessed between countries (Chirici et al., 2011), as well as different underlying census dates in the inventories which mean, however, that they are not exactly representative of 2010. This could introduce regionally-specific systematic errors of several years or more. The use of discrete 10-year age classes in our simulations and the concept of cohorts in which all planted trees in a patch have the same size (and reach dlim at the same time) create an irregular pattern of the predisposing volume (Fig. 7), which influence the results. The stand age data used is also simplified, being determined for one occasion at country or county scale and is not specific to Picea abies. Currently available large-scale datasets do not intersect stand age and species composition, which induces a substantial uncertainty when attempting to model outbreaks that are strongly dependent on the availability of trees of a particular species and size.
Levels and timing of thinning and natural mortality since stand establishment will have a substantial effect on the size and density of the trees that remain, yet little information is available to parameterise these aspects at large scales for the 20th century in Europe, leading to the simplified approach that we have applied in this study. Even setting aside uncertainties in stand age, the spruce trees in LPJ-GUESS on a stand of given age will be strongly influenced by simulated growth rate, as well as the allometries assumed for those trees and the management applied. LPJ-GUESS reproduces well country-level statistics for wood growth in Europe (Lindeskog et al., 2021). Allometries, however, are currently generic across each of needleleaf and broadleaf tree species (Smith et al., 2014) and do not take account of how tree shape is affected by stand density, which could introduce quite substantial deviations in diameter increase estimates at the species level. At a finer scale, there are also factors such as aspect, slope, nutrient status, soil type and edge effects, which have been identified as important in empirical studies (Blomqvist et al., 2018; Jakus et al., 2011), which are not captured at the scale LPJ-GEUSS is applied. A step forward in dealing with these substantial problems in initialisation could be to directly initialise tree size and composition from national forest inventories using plot level information on individual trees instead of using stand age, and to use inventory-based (Suvanto et al., 2025) or satellite-based (Senf and Seidl, 2021) observations to directly parameterise damage, thinning and clear-cut levels, which then in turn determine the tree composition and size distribution.
Bark beetles commonly develop epidemic levels during the growing season following a storm event ramping up the populations in the defenceless damaged trees. This trigger event then leads to killing of trees the second season after the storm. In this study, the wind trigger events were prescribed (Fig. 7), but the shape of the following outbreaks is quite well captured by the presented model, but sometimes with substantial discrepancies in the level of SBB damage. In managed forest, however, the occurrence and timing of counter measures such as salvage logging of storm-felled trees, sanitary cutting of infested trees and insect traps can have a big impact on the outcome (Jönsson et al., 2012), factors that vary greatly in time and by region over Europe, as well as at finer scale (Wichmann and Ravn, 2001). Stadelmann et al. (2013), e.g., reports that higher fractions of wind damage were associated with lower intensity of salvage logging after 1999 storm Lothar in Switzerland, while after the Gudrun 2005 storm in Sweden extra resources were brought in from other parts of the country, as well as from abroad, to increase the rate of salvage cutting (Fridh, 2006). By timely salvage logging, a large fraction of the beetles can be removed from the forest, substantially dampening the damage done (Jönsson et al., 2012; Stadelmann et al., 2013). An indirect indicator of the effect of counter measures is that the risk for SBB infestations are higher with nature reserves in the landscape where no SSC is done (Kärvemo et al., 2023). European-wide models calibrated over a longer time span (e.g. Marini et al., 2017) should not therefore be expected to have a high explanation of particular events in comparison to more local model applications (e.g. Soukhovolsky et al., 2022). However, they should be able to capture the general characteristics of these events well. One possible route forward to improved evaluation of large-scale models is assembling local-scale datasets that combine high-resolution information on species composition and forest structure, with detailed information on bark beetle detection and SSC. With on-going developments in remote sensing of forest structure and composition combined with datasets on forest harvesting, this may be increasingly feasible in the near future (e.g. Jamali et al., 2024).
The challenges inherent in modelling specific events at this scale are illustrated by the case of Southern Sweden. After a major storm, the remaining trees may have disturbed root systems making them more vulnerable to drought which may enhance SBB outbreaks, but also making them unstable – predisposing them to further storm damage. As SBB prefers defenceless trees even in an outbreak situation, such wind damage can serve as traps for the beetles if the wood is salvaged in time. This situation occurred in Southern Sweden when the – January 2007 storm (storm-year 2006) dampened the outbreak following the major – January 2005 storm (storm-year 2004). This relatively subtle mechanism is not captured in our model, which overestimated SBB damage in this outbreak. The outcome after a trigger also depends on the initial level of the SBB population, but many SBB models require an initial population or damage level, which means that they only need to work in relative terms (Marini et al., 2017; Soukhovolsky et al., 2022). A dynamic forest model, on the other hand, needs to operate with absolute damage levels making the modelling more challenging.
The way damage is inventoried and reported may also be different between countries and over time, which means that model evaluation is challenging. For example, the neighbouring countries Austria and Switzerland have very different reported patterns, in which Austria has a relatively high damage level for almost all years for both wind and SBB damage but relatively low peaks, while Switzerland has large storm damage followed by large SBB damage after the 1999 storm, but low or absent storm damage except from that. Our simulated results, on the other hand, show rather similar pattern of SBB damage between the countries. Because monitoring intensity follows outbreak intensity, the periods of zero bark beetle damage recorded in the observations also indicate periods with low monitoring activity caused by low bark beetle activity. It is unlikely that outbreak damage is really zero during these years. For instance, the country level compilation and gap filling of the DFDE database (Patacca et al., 2022) shows seven times higher expert gap filled SBB damage than reported 1990–2005 for Sweden, and in France the machine learning gap filling resulted in 2.4 times higher damage during 1991–2000. In our simulations, tree mortality from other causes provides brood material, contributing to a background endemic SBB population that is well above zero, but that, based on the above observational limitations, does appear to be plausible.
It is also clear that physiological drought modelling is a challenge (Trugman et al., 2021). Warm weather accompanied by drought is often seen as a factor contributing to sustained outbreaks (e.g. Bakke, 1983), but in recent year it has also triggered outbreaks of SBB in Europe (Nardi et al., 2023; Trubin et al., 2022). There was no county-level data of SBB damage available for Sweden and France later than 2010, but country totals (Patacca et al., 2022) show levels that greatly exceed our small peak in modelled damage during 2018–2019. Drought has generally been seen as the main driver of these events (George et al., 2022; Kärvemo et al., 2023). With the data used in our calibration and the additive form of the response function we might have underestimated this response; for Austria and Switzerland the model also underestimated the drought-induced peak even when data for those years were included. Part of the reason for underestimating the damage could be that LPJ-GUESS may be failing to simulate sufficiently increased water stress in the vegetation during this time period. For instance, in Austria and Switzerland, there were no abnormally low values of the water stress scaler wscal (indicating water stress) post 2015. This may be a failing of the model parameterization for water stress or of the input climate forcing dataset (Steinkamp and Hickler, 2015). Similar results were also found for the most recent application of SBB damage with the ORCHIDEE vegetation model, concluding a shortcoming linked to high damage levels associated with extreme drought (Marie et al., 2024). We note, however, that the 2018 drought generates a fairly strong water stress response in the simulations for southern Sweden (Fig. 7) and this is reflected in the beetle damage both 2018 and 2019 (Fig. 3). An additional contributing factor that has not been explicitly accounted for in the present study is root rot, which can significantly increase the local severity of an outbreak (Honkaniemi et al., 2018).
The simple test with a 2 °C higher temperature gave the expected increase in modelled damage in S Sweden and Austria. Similar tests resulting in a strong increase in modelled SBB damage have also been done by (Jönsson et al., 2012) and (Seidl and Rammer, 2017). In Switzerland and NE France, however, a reduction was simulated, mainly related to a change of the predisposing spruce biomass >dlim as simulated growth of the boreal-parameterized BNE PFT was reduced in the warmer climate. The SBB phenology response, which is a function of the length of the first generation's swarming period, also reaches a plateau when the climate is warm enough to allow a complete second generation to emerge every year. A third generation can be completed with very hot conditions (Jönsson et al., 2011), but the consequences for SBB population dynamics depends on host tree availability.
Whilst predicting absolute damage levels is challenging, our model is generally effective at indicating when there are elevated periods of damage risk due to SBB (Fig. 7). The most obvious case is year 2003 with a strong drought (Granier et al., 2007) that contributed to prolonged outbreaks in Switzerland, Austria and NE France, but also in the recent years (2017–2019) the indicators also show increased risks coinciding with observed damage for all assessed countries (Patacca et al., 2022). Combined with the process detail related to forest structure and management, this means that the model can be a powerful tool to explore how different forest structures and climate and management scenarios might interact to shift forests towards increased or decreased vulnerability.
The model that we have developed here is parameterised for SBB. However, there are many different species of bark beetles that have the potential to cause large outbreaks and tree mortality, meaning that effectively accounting for the impact of these species on large-scale forest dynamics requires that we can develop methods to generalise responses across species to some degree. These other species of bark beetles can be specific in temperature sums for evolving and dormancy periods and for density dependent defence overcome and competition (Bentz et al., 2019). A common pattern for many species is increased risk for outbreaks related to drought (Reed and Hood, 2021), which is supportive for finding a general concept of bark beetle damage modelling. The implementation of the SBB outbreak dynamics in LPJ-GUESS has introduced a concept of insect functional types (IFTs), which can be modelled in parallel with different response functions and specific PFT hosts. With this concept the model could also be applied in other parts of the world, if sufficient data on bark beetle phenology and damage exist to parameterise and calibrate the model.
Nature and human interactions drive and control SBB outbreaks in the intensively managed forest in Europe, which makes modelling challenging. The modelling concept we present here was able to catch the main timing and duration of observed damage but there was a substantial spread in absolute agreement, as also reflected by uncertainty in parameter estimates. With more detailed information of the human impact on outbreak dynamics, mainly in form of salvage logging and sanitary cutting, it should be possible to improve the explanatory power of the model. The SBB module is sensitive to the climate change signal, though the magnitude of temperature and drought driven SBB damage seen in recent years was underestimated. In the modelling framework of the powerful LPJ-GUESS dynamical vegetation model, it can be a useful tool for exploring the SBB vulnerability of spruce forest in future climate and management scenarios, but with careful consideration of the specific case it is applied for.
The underlying LPJ-GUESS code subversion revision 13130 and simulation settings are archived at Zenodo https://doi.org/10.5281/zenodo.14411974 (Lagergren et al., 2024a). Analysis code is also available via Zenodo https://doi.org/10.5281/zenodo.17256409 (Lagergren and Pugh, 2025).
Model simulations underlying the results herein are archived at Zenodo https://doi.org/10.5281/zenodo.14415079 (Lagergren et al., 2024b).
The supplement related to this article is available online at https://doi.org/10.5194/gmd-18-8071-2025-supplement.
TP initiated the study. FL developed the SBB damage modelling concept with input from AMJ and TP. ML conceived and implemented the insect functional type concept and coded the phenology of SBB into LPJ-GUESS. FL conducted all simulations and analysis of the results with feedback from all authors. FL lead the writing of the manuscript with contribution from all authors.
The contact author has declared that none of the authors has any competing interests.
Publisher's note: Copernicus Publications remains neutral with regard to jurisdictional claims made in the text, published maps, institutional affiliations, or any other geographical representation in this paper. While Copernicus Publications makes every effort to include appropriate place names, the final responsibility lies with the authors. Views expressed in the text are those of the authors and do not necessarily reflect the views of the publisher.
The model developments described in this paper have been funded under the European Union's Horizon Europe research and innovation programme (grant agreement numbers 101059888, CLIMB-Forest; 101056755, ForestPaths; 101084481, FORWARDS) and the EU Horizon 2020 programme (grant agreement no. 758873, TreeMort) as well as from the ForestValue programme, the European Commission, Vinnova, the Swedish Energy Agency and Formas for the project FORECO. This study is a contribution to the Swedish government's strategic research areas BECC and MERGE and the Nature-based Future Solutions profile area at Lund University. We thank Arjan Meddens, Rupert Seidl, Nikica Ogris and Cornelius Senf for discussions on the early stages of this work and Markus Kautz for providing phenology data.
This research has been supported by the HORIZON EUROPE European Research Council (grant nos. 101059888, 101056755, and 101084481), the EU Horizon 2020 (grant no. 758873), and the VINNOVA (grant no. 2021-05016).
The publication of this article was funded by the Swedish Research Council, Forte, Formas, and Vinnova.
This paper was edited by Roslyn Henry and reviewed by Tomas Hlasny and one anonymous referee.
Bakke, A.: Host tree and bark beetle interactions during a mass outbreak of Ips typographus in Norway, Journal of Applied Entomology, 96, 118–125, https://doi.org/10.1111/j.1439-0418.1983.tb03651.x, 1983.
Balla, A., Silini, A., Cherif-Silini, H., Bouket, A. C., Moser, W. K., Nowakowska, J. A., Oszako, T., Benia, F., and Belbahri, L.: The Threat of Pests and Pathogens and the Potential for Biological Control in Forest Ecosystems, Forests, 12, https://doi.org/10.3390/f12111579, 2021.
Bentz, B. J., Jönsson, A. M., Schroeder, M., Weed, A., Wilcke, R. A. I., and Larsson, K.: Ips typographus and Dendroctonus ponderosae Models Project Thermal Suitability for Intra- and Inter-Continental Establishment in a Changing Climate, Frontiers in Forests and Global Change, 2, https://doi.org/10.3389/ffgc.2019.00001, 2019.
Blomqvist, M., Kosunen, M., Starr, M., Kantola, T., Holopainen, M., and Lyytikäinen-Saarenmaa, P.: Modelling the predisposition of Norway spruce to Ips typographus L. infestation by means of environmental factors in southern Finland, European Journal of Forest Research, 137, 675–691, https://doi.org/10.1007/s10342-018-1133-0, 2018.
Caudullo, G., Tinner, W., and de Rigo, D.: Picea abies in Europe: distribution, habitat, usage and threats, in: European Atlas of Forest Tree Species, edited by: San-Miguel-Ayanz, J., de Rigo, D., Caudullo, G., Houston Durrant, T., and Mauri, A., Publ. Off. EU, Luxembourg, e012300+, https://doi.org/10.2788/038466, 2016.
Chirici, G., Winter, S., and McRoberts, R. E.: National Forest Inventories: Contributions to Forest Biodiversity Assessments, Managing Forest Ecosystems, Springer Dordrecht, 206 pp., https://doi.org/10.1007/978-94-007-0482-4, 2011.
Ciais, P., Schelhaas, M. J., Zaehle, S., Piao, S. L., Cescatti, A., Liski, J., Luyssaert, S., Le-Maire, G., Schulze, E. D., Bouriaud, O., Freibauer, A., Valentini, R., and Nabuurs, G. J.: Carbon accumulation in European forests, Nature Geoscience, 1, 425–429, https://doi.org/10.1038/ngeo233, 2008.
de Bruijn, A., Gustafson, E. J., Sturtevant, B. R., Foster, J. R., Miranda, B. R., Lichti, N. I., and Jacobs, D. F.: Toward more robust projections of forest landscape dynamics under novel environmental conditions: Embedding PnET within LANDIS-II, Ecological Modelling, 287, 44–57, https://doi.org/10.1016/j.ecolmodel.2014.05.004, 2014.
Forzieri, G., Girardello, M., Ceccherini, G., Spinoni, J., Feyen, L., Hartmann, H., Beck, P. S. A., Camps-Valls, G., Chirici, G., Mauri, A., and Cescatti, A.: Emergent vulnerability to climate-driven disturbances in European forests, Nature Communications, 12, https://doi.org/10.1038/s41467-021-21399-7, 2021.
Fridh, M.: Stormen 2005 – en skoglig analys, Swedish Forest Agency, 208, ISSN: 1100-0295, 2006.
George, J. P., Bürkner, P. C., Sanders, T. G. M., Neumann, M., Cammalleri, C., Vogt, J. V., and Lang, M.: Long-term forest monitoring reveals constant mortality rise in European forests, Plant Biology, 24, 1108–1119, https://doi.org/10.1111/plb.13469, 2022.
Göthlin, E., Schroeder, L. M., and Lindelöw, Å.: Attacks by Ips typographus and Pityogenes chalcographus an windthrown spruces (Picea abies) during the two years following a storm felling, Scandinavian Journal of Forest Research, 15, 542–549, https://doi.org/10.1080/028275800750173492, 2000.
Granier, A., Reichstein, M., Bréda, N., Janssens, I. A., Falge, E., Ciais, P., Grünwald, T., Aubinet, M., Berbigier, P., Bernhofer, C., Buchmann, N., Facini, O., Grassi, G., Heinesch, B., Ilvesniemi, H., Keronen, P., Knohl, A., Köstner, B., Lagergren, F., Lindroth, A., Longdoz, B., Loustau, D., Mateus, J., Montagnani, L., Nys, C., Moors, E., Papale, D., Peiffer, M., Pilegaard, K., Pita, G., Pumpanen, P., Rambal, S., Rebmann, C., Rodrigues, A., Seufert, G., Tenhunen, J., Vesala, T., and Wang, Q.: Evidence for soil water control on carbon and water dynamics in European forests during the extremely dry year: 2003, Agricultural and Forest Meteorology, 143, 123–145, https://doi.org/10.1016/j.agrformet.2006.12.004, 2007.
Hlásny, T., König, L., Krokene, P., Lindner, M., Montagné-Huck, C., Müller, J., Qin, H., Raffa, K. F., Schelhaas, M. J., Svoboda, M., Viiri, H., and Seidl, R.: Bark Beetle Outbreaks in Europe: State of Knowledge and Ways Forward for Management, Current Forestry Reports, 7, 138–165, https://doi.org/10.1007/s40725-021-00142-x, 2021.
Honkaniemi, J., Ojansuu, R., Kasanen, R., and Heliövaara, K.: Interaction of disturbance agents on Norway spruce: A mechanistic model of bark beetle dynamics integrated in simulation framework WINDROT, Ecological Modelling, 388, 45–60, https://doi.org/10.1016/j.ecolmodel.2018.09.014, 2018.
Hwang, K., Han, H. S., Marshall, S. E., and Page-Dumroese, D. S.: Amount and Location of Damage to Residual Trees from Cut-to-Length Thinning Operations in a Young Redwood Forest in Northern California, Forests, 9, https://doi.org/10.3390/f9060352, 2018.
Jakus, R., Zajíèkova, L., Cudlín, P., Blaženec, M., Turèani, M., Ježík, M., Lieutier, F., and Schlyter, F.: Landscape-scale Ips typographus attack dynamics: from monitoring plots to GIS-based disturbance models, Iforest-Biogeosciences and Forestry, 4, 256–261, https://doi.org/10.3832/ifor0589-004, 2011.
Jamali, S., Olsson, P. O., Müller, M., and Ghorbanian, A.: Kernel-Based Early Detection of Forest Bark Beetle Attack Using Vegetation Indices Time Series of Sentinel-2, Ieee Journal of Selected Topics in Applied Earth Observations and Remote Sensing, 17, 12868–12877, https://doi.org/10.1109/jstars.2024.3425795, 2024.
Johnstone, D. L. and Cross, W. P. (Eds.): The Water Year, in: Elements of applied hydrology, Ronald Press Co., New York, 102–103, OCLC: 1150788749, 1949.
Jönsson, A. M., Harding, S., Bärring, L., and Ravn, H. P.: Impact of climate change on the population dynamics of Ips typographus in southern Sweden, Agricultural and Forest Meteorology, 146, 70–81, https://doi.org/10.1016/j.agrformet.2007.05.006, 2007.
Jönsson, A. M., Harding, S., Krokene, P., Lange, H., Lindelöw, Å., Okland, B., Ravn, H. P., and Schroeder, L. M.: Modelling the potential impact of global warming on Ips typographus voltinism and reproductive diapause, Climatic Change, 109, 695–718, https://doi.org/10.1007/s10584-011-0038-4, 2011.
Jönsson, A. M., Schroeder, L. M., Lagergren, F., Anderbrant, O., and Smith, B.: Guess the impact of Ips typographus – An ecosystem modelling approach for simulating spruce bark beetle outbreaks, Agricultural and Forest Meteorology, 166–167, 188–200, https://doi.org/10.1016/j.agrformet.2012.07.012, 2012.
Kärvemo, S., Huo, L., Öhrn, P., Lindberg, E., and Persson, H. J.: Different triggers, different stories: Bark-beetle infestation patterns after storm and drought-induced outbreaks, Forest Ecology and Management, 545, https://doi.org/10.1016/j.foreco.2023.121255, 2023.
Kautz, M., Meddens, A. J. H., Hall, R. J., and Arneth, A.: Biotic disturbances in Northern Hemisphere forests – a synthesis of recent data, uncertainties and implications for forest monitoring and modelling, Global Ecology and Biogeography, 26, 533–552, https://doi.org/10.1111/geb.12558, 2017.
Knorr, W., Arneth, A., and Jiang, L.: Demographic controls of future global fire risk, Nature Climate Change, 6, 781–785, https://doi.org/10.1038/nclimate2999, 2016.
Lagergren, F. and Pugh, T. A. M.: LPJ-GUESS/spruce_bark_beetle: Processing scripts for LPJ-GUESS spruce bark beetle model simulations (Version ver1), Zenodo [code], https://doi.org/10.5281/zenodo.17256409, 2025.
Lagergren, F., Jönsson, A. M., Blennow, K., and Smith, B.: Implementing storm damage in a dynamic vegetation model for regional applications in Sweden, Ecological Modelling, 247, 71–82, https://doi.org/10.1016/j.ecolmodel.2012.08.011, 2012.
Lagergren, F., Jönsson, A. M., Lindeskog, M., and Pugh, T. A. M.: Code and simulation setting underlaying: Combining empirical and mechanistic understanding of spruce bark beetle outbreak dynamics in the LPJ-GUESS (v4.1, r13130) vegetation model (Version 1), Zenodo [code, data set], https://doi.org/10.5281/zenodo.14411974, 2024a.
Lagergren, F., Jönsson, A. M., Lindeskog, M., and Pugh, T. A. M.: Simulation results underlaying: Combining empirical and mechanistic understanding of spruce bark beetle outbreak dynamics in the LPJ-GUESS (v4.1, r13130) vegetation model (Version 1), Zenodo [data set], https://doi.org/10.5281/zenodo.14415079, 2024b.
Lamarque, J.-F., Bond, T. C., Eyring, V., Granier, C., Heil, A., Klimont, Z., Lee, D., Liousse, C., Mieville, A., Owen, B., Schultz, M. G., Shindell, D., Smith, S. J., Stehfest, E., Van Aardenne, J., Cooper, O. R., Kainuma, M., Mahowald, N., McConnell, J. R., Naik, V., Riahi, K., and van Vuuren, D. P.: Historical (1850–2000) gridded anthropogenic and biomass burning emissions of reactive gases and aerosols: methodology and application, Atmos. Chem. Phys., 10, 7017–7039, https://doi.org/10.5194/acp-10-7017-2010, 2010.
Lind, P., Belušiæ, D., Christensen, O. B., Dobler, A., Kjellström, E., Landgren, O., Lindstedt, D., Matte, D., Pedersen, R. A., Toivonen, E., and Wang, F. X.: Benefits and added value of convection-permitting climate modeling over Fenno-Scandinavia, Climate Dynamics, 55, 1893–1912, https://doi.org/10.1007/s00382-020-05359-3, 2020.
Lindeskog, M., Smith, B., Lagergren, F., Sycheva, E., Ficko, A., Pretzsch, H., and Rammig, A.: Accounting for forest management in the estimation of forest carbon balance using the dynamic vegetation model LPJ-GUESS (v4.0, r9710): implementation and evaluation of simulations for Europe, Geosci. Model Dev., 14, 6071–6112, https://doi.org/10.5194/gmd-14-6071-2021, 2021.
Lindgren, B. S. and Raffa, K. F.: Evolution of tree killing in bark beetles (Coleoptera: Curculionidae): trade-offs between the maddening crowds and a sticky situation, Canadian Entomologist, 145, 471–495, https://doi.org/10.4039/tce.2013.27, 2013.
Louis, M., Grégoire, J.-C., and Pélisson, P.-F.: Exploiting fugitive resources: How long-lived is “fugitive”? Fallen trees are a long-lasting reward for Ips typographus (Coleoptera, Curculionidae, Scolytinae), Forest Ecology and Management, 331, 129–134, https://doi.org/10.1016/j.foreco.2014.08.009, 2014.
Marie, G., Jeong, J., Jactel, H., Petter, G., Cailleret, M., McGrath, M. J., Bastrikov, V., Ghattas, J., Guenet, B., Lansø, A. S., Naudts, K., Valade, A., Yue, C., and Luyssaert, S.: Simulating Ips typographus L. outbreak dynamics and their influence on carbon balance estimates with ORCHIDEE r8627, Geosci. Model Dev., 17, 8023–8047, https://doi.org/10.5194/gmd-17-8023-2024, 2024.
Marini, L., Økland, B., Jönsson, A. M., Bentz, B., Carroll, A., Forster, B., Grégoire, J.-C., Hurling, R., Nageleisen, L. M., Netherer, S., Ravn, H. P., Weed, A., and Schroeder, M.: Climate drivers of bark beetle outbreak dynamics in Norway spruce forests, Ecography, 40, 1426–1435, https://doi.org/10.1111/ecog.02769, 2017.
Müller, M., Olsson, P.-O., Eklundh, L., Jamali, S., and Ardö, J.: Features predisposing forest to bark beetle outbreaks and their dynamics during drought, Forest Ecology and Management, 523, https://doi.org/10.1016/j.foreco.2022.120480, 2022.
Nardi, D., Jactel, H., Pagot, E., Samalens, J. C., and Marini, L.: Drought and stand susceptibility to attacks by the European spruce bark beetle: A remote sensing approach, Agricultural and Forest Entomology, 25, 119–129, https://doi.org/10.1111/afe.12536, 2023.
Nielsen, C. C. N.: Recommendations for stabilisation of Norway spruce stands based on ecological surveys, in: Wind and Trees, edited by: Coutts, M. P. and Grace, J., Cambridge Univeristy Press, 424–435, https://doi.org/10.1017/CBO9780511600425.024, 1995.
Nilsson, P. and Cory, N.: Forestry statistics 2013 – Official Statistics of Sweden, Arkitektkopia AB, Umeå, 162 pp., ISSN: 0280-0543, 2013.
Overbeck, M. and Schmidt, M.: Modelling infestation risk of Norway spruce by Ips typographus (L.) in the Lower Saxon Harz Mountains (Germany), Forest Ecology and Management, 266, 115–125, https://doi.org/10.1016/j.foreco.2011.11.011, 2012.
Palahi, M., Valbuena, R., Senf, C., Acil, N., Pugh, T. A. M., Sadler, J., Seidl, R., Potapov, P., Gardiner, B., Hetemäki, L., Chirici, G., Francini, S., Hlásny, T., Lerink, B. J. W., Olsson, H., Olabarria, J. R. G., Ascoli, D., Asikainen, A., Bauhus, J., Berndes, G., Donis, J., Fridman, J., Hanewinkel, M., Jactel, H., Lindner, M., Marchetti, M., Marušák, R., Sheil, D., Tomé, M., Trasobares, A., Verkerk, P. J., Korhonen, M., and Nabuurs, G. J.: Concerns about reported harvests in European forests, Nature, 592, E15–E17, https://doi.org/10.1038/s41586-021-03292-x, 2021.
Patacca, M., Lindner, M., Lucas-Borja, M. E., Cordonnier, T., Fidej, G., Gardiner, B., Hauf, Y., Jasinevièius, G., Labonne, S., Linkevièius, E., Mahnken, M., Milanovic, S., Nabuurs, G. J., Nagel, T. A., Nikinmaa, L., Panyatov, M., Bercak, R., Seidl, R., Ostrogoviæ Sever, M. Z., Socha, J., Thom, D., Vuletic, D., Zudin, S., and Schelhaas, M. J.: Significant increase in natural disturbance impacts on European forests since 1950, Global Change Biology, https://doi.org/10.1111/gcb.16531, 2022.
Poulter, B., Aragão, L., Andela, N., Bellassen, V., Ciais, P., Kato, T., Lin, X., Nachin, B., Luyssaert, S., Pederson, N., Peylin, P., Piao, S., Pugh, T., Saatchi, S., Schepaschenko, D., Schelhaas, M., and Shivdenko, A.: The global forest age dataset and its uncertainties (GFADv1.1), PANGAEA [data set], https://doi.org/10.1594/PANGAEA.897392, 2019.
Pugh, T. A. M., Lindeskog, M., Smith, B., Poulter, B., Arneth, A., Haverd, V., and Calle, L.: Role of forest regrowth in global carbon sink dynamics, Proceedings of the National Academy of Sciences of the United States of America, 116, 4382–4387, https://doi.org/10.1073/pnas.1810512116, 2019.
Pugh, T. A. M., Arneth, A., Eckes-Shephard, A. H., Jönsson, A. M., Lagergren, F., Lindeskog, M., Miller, P. A., Nieradzik, L., Olin, S., Piltz, K., Rammig, A., Suvanto, S., Wittenbrink, M., Zhong, H., Astigarraga, J., Cienciala, E., Esquivel-Muelbert, A., Fridman, J., Lehtonen, A., Ruiz Benito, P. R., Peltoniemi, M., Schelhaas, M.-J., Senf, C., Viana-Soto, A., Stadelmann, G., Tagesson, T., Talarczyk, A., and Zavala, M. A.: Dynamic vegetation modelling for the past and future of Europe's forests, in preparation, 2025.
Rabin, S. S., Melton, J. R., Lasslop, G., Bachelet, D., Forrest, M., Hantson, S., Kaplan, J. O., Li, F., Mangeon, S., Ward, D. S., Yue, C., Arora, V. K., Hickler, T., Kloster, S., Knorr, W., Nieradzik, L., Spessa, A., Folberth, G. A., Sheehan, T., Voulgarakis, A., Kelley, D. I., Prentice, I. C., Sitch, S., Harrison, S., and Arneth, A.: The Fire Modeling Intercomparison Project (FireMIP), phase 1: experimental and analytical protocols with detailed model descriptions, Geosci. Model Dev., 10, 1175–1197, https://doi.org/10.5194/gmd-10-1175-2017, 2017.
Reed, C. C. and Hood, S. M.: Few generalizable patterns of tree-level mortality during extreme drought and concurrent bark beetle outbreaks, Science of the Total Environment, 750, https://doi.org/10.1016/j.scitotenv.2020.141306, 2021.
Saxe, H.: Triggering and predisposing factors in the “Red” decline syndrome of Norway spruce (Picea abies), Trees-Structure and Function, 8, 39–48, 1993.
Scheel, M., Lindeskog, M., Smith, B., Suvanto, S., and Pugh, T. A. M.: Increased Central European forest mortality explained by higher harvest rates driven by enhanced productivity, Environmental Research Letters, 17, https://doi.org/10.1088/1748-9326/ac9635, 2022.
Schlyter, F. and Anderbrant, O.: Competition and niche separation between 2 bark beetles – existance and mechanism, Oikos, 68, 437–447, https://doi.org/10.2307/3544911, 1993.
Schroeder, L. M.: Tree Mortality by the Bark Beetle Ips typographus (L.) in storm-disturbed stands, Integrated Pest Management Reviews, 6, 169–175, https://doi.org/10.1023/A:1025771318285, 2001.
Seidl, R. and Rammer, W.: Climate change amplifies the interactions between wind and bark beetle disturbances in forest landscapes, Landscape Ecology, 32, 1485–1498, https://doi.org/10.1007/s10980-016-0396-4, 2017.
Seidl, R., Rammer, W., and Spies, T. A.: Disturbance legacies increase the resilience of forest ecosystem structure, composition, and functioning, Ecological Applications, 24, 2063–2077, https://doi.org/10.1890/14-0255.1, 2014.
Senf, C. and Seidl, R.: Mapping the forest disturbance regimes of Europe, Nature Sustainability, 4, 63-U102, https://doi.org/10.1038/s41893-020-00609-y, 2021.
Singh, V. V., Naseer, A., Mogilicherla, K., Trubin, A., Zabihi, K., Roy, A., Jakuš, R., and Erbilgin, N.: Understanding bark beetle outbreaks: exploring the impact of changing temperature regimes, droughts, forest structure, and prospects for future forest pest management, Reviews in Environmental Science and Bio-Technology, 23, 257–290, https://doi.org/10.1007/s11157-024-09692-5, 2024.
Six, D. L. and Wingfield, M. J.: The Role of Phytopathogenicity in Bark Beetle-Fungus Symbioses: A Challenge to the Classic Paradigm, in: Annual Review of Entomology, Vol. 56, edited by: Berenbaum, M. R., Carde, R. T., and Robinson, G. E., Annual Review of Entomology, 255–272, https://doi.org/10.1146/annurev-ento-120709-144839, 2011.
Smith, B., Prentice, I. C., and Sykes, M. T.: Representation of vegetation dynamics in the modelling of terrestrial ecosystems: comparing two contrasting approaches within European climate space, Global Ecology and Biogeography, 10, 621–637, https://doi.org/10.1046/j.1466-822X.2001.t01-1-00256.x, 2001.
Smith, B., Wårlind, D., Arneth, A., Hickler, T., Leadley, P., Siltberg, J., and Zaehle, S.: Implications of incorporating N cycling and N limitations on primary production in an individual-based dynamic vegetation model, Biogeosciences, 11, 2027–2054, https://doi.org/10.5194/bg-11-2027-2014, 2014.
Soukhovolsky, V., Kovalev, A., Tarasova, O., Modlinger, R., Køenová, Z., Mezei, P., Škvarenina, J., Rožnovský, J., Korolyova, N., Majdák, A., and Jakuš, R.: Wind Damage and Temperature Effect on Tree Mortality Caused by Ips typographus L.: Phase Transition Model, Forests, 13, https://doi.org/10.3390/f13020180, 2022.
Stadelmann, G., Bugmann, H., Meier, F., Wermelinger, B., and Bigler, C.: Effects of salvage logging and sanitation felling on bark beetle (Ips typographus L.) infestations, Forest Ecology and Management, 305, 273–281, https://doi.org/10.1016/j.foreco.2013.06.003, 2013.
Steinkamp, J. and Hickler, T.: Is drought-induced forest dieback globally increasing?, Journal of Ecology, 103, 31–43, https://doi.org/10.1111/1365-2745.12335, 2015.
Suvanto, S., Esquivel-Muelbert, A., Schelhaas, M. J., Astigarraga, J., Astrup, R., Cienciala, E., Fridman, J., Henttonen, H. M., Kunstler, G., Kändler, G., König, L. A., Ruiz-Benito, P., Senf, C., Stadelmann, G., Starcevic, A., Talarczyk, A., Zavala, M. A., and Pugh, T. A. M.: Understanding Europe's Forest Harvesting Regimes, Earths Future, 13, https://doi.org/10.1029/2024ef005225, 2025.
Temperli, C., Bugmann, H., and Elkin, C.: Cross-scale interactions among bark beetles, climate change, and wind disturbances: a landscape modeling approach, Ecological Monographs, 83, 383–402, https://doi.org/10.1890/12-1503.1, 2013.
Trubin, A., Mezei, P., Zabihi, K., Surový, P., and Jakuš, R.: Northernmost European spruce bark beetle Ips typographus outbreak: Modelling tree mortality using remote sensing and climate data, Forest Ecology and Management, 505, https://doi.org/10.1016/j.foreco.2021.119829, 2022.
Trugman, A. T., Anderegg, L. D. L., Anderegg, W. R. L., Das, A. J., and Stephenson, N. L.: Why is Tree Drought Mortality so Hard to Predict?, Trends in Ecology & Evolution, 36, 520–532, https://doi.org/10.1016/j.tree.2021.02.001, 2021.
Vollbrecht, G. and Agestam, E.: Modeling incident of root rot in Picea abies plantations in southern Sweden, Scandinavian Journal of Forest Research, 10, 74–81, https://doi.org/10.1080/02827589509382870, 1995.
Wermelinger, B. and Seifert, M.: Analysis of the temperature dependent development of the spruce bark beetle Ips typographus (L) (Col, Scolytidae), Journal of Applied Entomology, 122, 185–191, https://doi.org/10.1111/j.1439-0418.1998.tb01482.x, 1998.
Wernick, I. K., Ciais, P., Fridman, J., Högberg, P., Korhonen, K. T., Nordin, A., and Kauppi, P. E.: Quantifying forest change in the European Union, Nature, 592, E13–E14, https://doi.org/10.1038/s41586-021-03293-w, 2021.
Weslien, J. and Regnander, J.: Colonization densities and offspring production in the bark beetle Ips typographus (L.) in standing spruce trees, Journal of Applied Entomology, 109, 358–366, https://doi.org/10.1111/j.1439-0418.1990.tb00064.x, 1990.
Weslien, J., Öhrn, P., Rosenberg, O., and Schroeder, M.: Effects of sanitation logging in winter on the Eurasian spruce bark beetle and predatory long-legged flies, Forest Ecology and Management, 554, https://doi.org/10.1016/j.foreco.2023.121665, 2024.
Wichmann, L. and Ravn, H. P.: The spread of Ips typographus (L.) (Coleoptera, Scolytidae) attacks following heavy windthrow in Denmark, analysed using GIS, Forest Ecology and Management, 148, 31–39, https://doi.org/10.1016/s0378-1127(00)00477-1, 2001.