the Creative Commons Attribution 4.0 License.
the Creative Commons Attribution 4.0 License.
 | 15 Oct 2025
Improved vapor pressure predictions using group contribution-assisted graph convolutional neural networks (GC2NN)
Matteo Krüger
Tommaso Galeazzo
Ivan Eremets
Bertil Schmidt
Ulrich Pöschl
The vapor pressures (pvap) of organic molecules play a crucial role in the partitioning of secondary organic aerosol (SOA). Given the vast diversity of atmospheric organic compounds, experimentally determining pvap of each compound is unfeasible. Machine Learning (ML) algorithms allow the prediction of physicochemical properties based on complex representations of molecular structure, but their performance crucially depends on the availability of sufficient training data. We propose a novel approach to predict pvap using group contribution-assisted graph convolutional neural networks (GC2NN). The models use molecular descriptors like molar mass alongside molecular graphs containing atom and bond features as representations of molecular structure. The model's group contribution component is a shallow fully-connected neural network which processes numerical molecular descriptors and complements the model's graph component. Molecular graphs allow the ML model to better infer molecular connectivity compared to methods using other, non-structural embeddings. We achieve best results with an adaptive-depth GC2NN, where the number of evaluated graph layers depends on molecular size. We present two vapor pressure estimation models that achieve strong agreement between predicted and experimentally-determined pvap. The first is a general model with broad scope that is suitable for both organic and inorganic molecules and achieves a mean absolute error (MAE) of 0.69 log-units (R2= 0.86). The second model is specialized on organic compounds with functional groups often encountered in atmospheric SOA, achieving an even stronger correlation with the test data (MAE = 0.37 log-units, R2= 0.94). The adaptive-depth GC2NN models clearly outperform existing methods, including parameterizations and group-contribution methods, demonstrating that graph-based ML techniques are powerful tools for the estimation of physicochemical properties, even when experimental data are scarce.
- Article
(6686 KB) - Full-text XML
-
Supplement
(2338 KB) - BibTeX
- EndNote


Secondary organic aerosols (SOA) account for a substantial mass fraction (20 %–90 %) of tropospheric aerosols (Jimenez et al., 2009). They affect the atmosphere's radiative budget and serve as nuclei in cloud droplet and ice crystal formation (Kanakidou et al., 2005; Shrivastava et al., 2017). Furthermore, SOA play a major role in the context of air quality and have been linked to adverse health effects (Pöschl and Shiraiwa, 2015). Understanding SOA formation and evolution is complicated by the large number and variety of involved organic species and associated reactions and properties, making SOA a source of large uncertainties in climate and air quality modelling (Intergovernmental Panel on Climate Change, 2023).
The saturation vapor pressure (pvap) of a compound determines its partitioning equilibrium between the condensed and gas phase. In the following, we will classify compounds into volatility ranges based on their saturation mass concentrations over the pure liquid (C0) as proposed by Donahue et al. (2009). The classes are extremely low-volatility organic compounds (ELVOC, 10−6 µg m−3), low-volatility organic compounds (LVOC, 3 × 10 3 × 10⁻⁴ µg m−3), semi-volatile organic compounds (SVOC, 3 × 10 300 µg m−3), intermediate-volatility organic compounds (IVOC, 300 106 µg m−3) and volatile organic compounds (IVOC, µg m−3). In the atmosphere, saturation vapor pressure governs new particle formation and gas-particle partitioning, such that SOA mass yield is largely determined by pvap (Pankow, 1987; Kulmala and Kerminen, 2008). However, due to the large number of atmospherically-relevant compounds, exhaustive experimental determination of pvap is not feasible (Goldstein and Galbally, 2007; Bilde et al., 2015).
Various quantitative structure-activity relationship (QSAR) methods for the approximation of thermodynamic properties like pvap or reactivity have been developed to address this limitation: empirical structure-property relationship models often map a sum formula to a thermodynamic property of interest, using algebraic equations with parameters that are fitted to experimental data (Donahue et al., 2011; Li et al., 2016). Group contribution models such as SIMPOL (Pankow and Asher, 2008) and EVAPORATION (Compernolle et al., 2011) can be classified as semi-empirical (Gani, 2019) as they incorporate existing theoretical knowledge about the relationships of structural features and chemical behavior into mathematical equations. This often includes the consideration the occurrences, positions, or interactions of functional groups, while also determining fit parameters using experimental data (Nannoolal et al., 2004; Moller et al., 2008). The consideration of specific functional groups limits group contribution models to certain compound classes, possibly leading to significant errors when applied to molecules outside their applicable range (Tahami et al., 2019). Quantum-mechanical calculation (QM) models based on density functional theory are a common non-empirical approach to property determination (Geerlings et al., 2003), and can be combined with empirical approaches (Ratcliff et al., 2017). Such quantum-mechanical calculations have been used for the generation of large data sets (Wang et al., 2017; Tabor et al., 2019; Besel et al., 2023), facilitating the development of machine learning (ML)-based QSAR models (Lumiaro et al., 2021; Krüger et al., 2022). When categorising ML-based QSAR models, we can distinguish the actual algorithm and the molecular representation that encodes molecular structures into suitable model input, which together majorly determine a ML model's performance in deriving properties from molecular structures (Lumiaro et al., 2021). Combinations successfully applied in previous studies include one-hot encoded Simplified Molecular Input Line Entry System (SMILES) strings with convolutional neural networks (OHE-CNN; Krüger et al., 2022), specific molecular descriptors with decision trees (Armeli et al., 2023) or topological fingerprints with Gaussian process regression (Besel et al., 2024). Galeazzo and Shiraiwa (2022) developed a method to predict glass transition temperature and melting points of small molecules using Extreme Gradient Boosting (XGBoost) and a neural network, respectively, in combination with derived molecular embeddings as molecular fingerprints. The transformation of molecular structures into such machine-readable molecular representations requires the ML models to learn the representation principles along with the physicochemical principles that determine the target property, to the detriment of limiting their application to the prediction of properties with extensive amounts of data (von Lilienfeld and Burke, 2020). This limitation can be mitigated using foundation models, pre-trained networks that are fine-tuned on relatively small data sets for a specific property (Burns et al., 2025). Data curation techniques can improve model accuracy, e.g., through identification and deletion of data points associated with large experimental uncertainty (Gadaleta et al., 2018; Ulrich et al., 2021). Within atmospheric chemistry, only few ML-based QSAR models have been trained exclusively on experimental measurements, as they generally require a large quantity of training data for sufficient model generalization, and a careful and computationally expensive error estimation when only limited amounts of data are available (Galeazzo and Shiraiwa, 2022; Armeli et al., 2023). The overall moderate to poor accuracy of existing QSAR models for pvap prediction exemplifies the need for more accurate, publicly available models (Longnecker et al., 2025).
Graph neural networks (GNNs) are a class of algorithms within the domain of geometric deep learning which have emerged as a powerful addition to machine learning methods in computational chemistry and material sciences in the last decade (von Lilienfeld and Burke, 2020; Reiser et al., 2022). GNNs can be interpreted as an extension of convolutional neural networks beyond fixed dimension grids of data to include irregularly shaped structures (Kipf and Welling, 2017; Bronstein et al., 2017), such as graph-based representations of molecules (Duvenaud et al., 2015; Atz et al., 2021). Molecular graph representations and algorithms that operate on such graphs omit an additional representation learning step and can directly infer intramolecular spatial relations along with properties assigned to graph elements. Furthermore, in contrast to sum formula-based methods, structure-based methods can distinguish structural isomers, which may differ significantly in their properties (Isaacman-VanWertz and Aumont, 2021). Lumiaro et al. (2021) compared a variety of molecular fingerprints in combination with Kernel Ridge Regression, finding graph-based representations to be advantageous compared to canonical descriptive chemical features based methods. For the prediction of absorption, distribution, metabolism, excretion and toxicity (ADMET) properties, Xiong et al. (2021) employed a multi-task graph attention framework addressing classification and regression tasks.
In this work, we propose group contribution-assisted graph convolutional neural network (GC2NN) models that are simultaneously trained on lists of molecular descriptors as well as graph representations of molecules, in which atom features are mapped to nodes, and bond features mapped to edges of a graph structure. We test model performance on data sets from experimental measurements and QM calculations (Besel et al., 2023), and compare our models with established methods for the determination of pvap: one ML approach, where convolutional neural networks are trained on one-hot encoded SMILES representations (Krüger et al., 2022), two parameterizations, where pvap are derived only from the compounds' elemental composition (Donahue et al., 2011; Li et al., 2016), and SIMPOL (Pankow and Asher, 2008), EVAPORATION (Compernolle et al., 2011), and EPI-Suite (EPI, 2024), which are commonly used semi-empirical group-contribution methods.
2.1 Vapor pressure data
We assembled a data set of SMILES representations of 6042 compounds with experimental saturation vapor pressure (pvap) measurements at 298 K by crawling data from pubchem (Kim et al., 2016). In addition, we retrieved the data set published in Naef and Acree (2021), comprised of 2070 compounds. After removal of species present in both data sets, and species that contain elements that occur in fewer than 30 compounds, a total of 6178 unique compounds with experimental pvap measurements are obtained and referred to as broad data. An overview of molecular substructures in the broad data set is displayed in Fig. 1a. It encompasses various compound types, such as aromatics, alcohols, carboxylic acids, esters, amines, amides, carbonyls, sulfides and nitriles. As the broad data set also contains ∼ 5 % inorganic compounds, we refer to compounds in this data set more generally as extremely low-volatility compounds (ELVOC), low-volatility compounds (LVOC), semi-volatile compounds (SVOC), intermediate-volatility compounds (IVOC) and volatile compounds (VOC), thus keeping the same acronyms and vapor pressures bins as Donahue et al. (2009) established for organic compounds. Experimental pvap measurements range from 10−10 to 107 Pa. The distribution of saturation concentrations and the number of ELVOC, LVOC, SVOC, IVOC and VOC are summarized in Fig. 1e. For a comparison with established methods for pvap prediction, and to test the method on a data set of compounds that are relevant for the atmosphere, we extract all compounds that lie within the scope of these methods (Pankow and Asher, 2008; Compernolle et al., 2011; Donahue et al., 2011; Li et al., 2016), confining the data set to molecules only consisting of C, H, and O atoms and belonging to the following compound classes: alkanes, (non-aromatic) alkenes, aldehydes, ketones, ethers, esters, peroxides, nitrates, peroxy acyl nitrates, alcohols, acids, hydroperoxides and peracids. This subset of the broad data, referred to as confined data, contains a total of 1349 compounds with much smaller variety of compound classes, including carboxyl, hydroxyl, ester and carbonyl functional groups (Fig. 1b). While the overall pvap range is very similar, the confined data set exhibits a smaller fraction of ELVOC, LVOC and SVOC than the broad data set (Fig. 1c, d, e, f). This skew towards higher vapor pressures in the confined data can be attributed to smaller molecules that contain fewer heavy atoms, as indicated by its lower average molecular mass of 154.8 g mol−1, compared to 205.8 g mol−1 in the broad data set. Both data sets are available for download, as specified in the data availability statement.
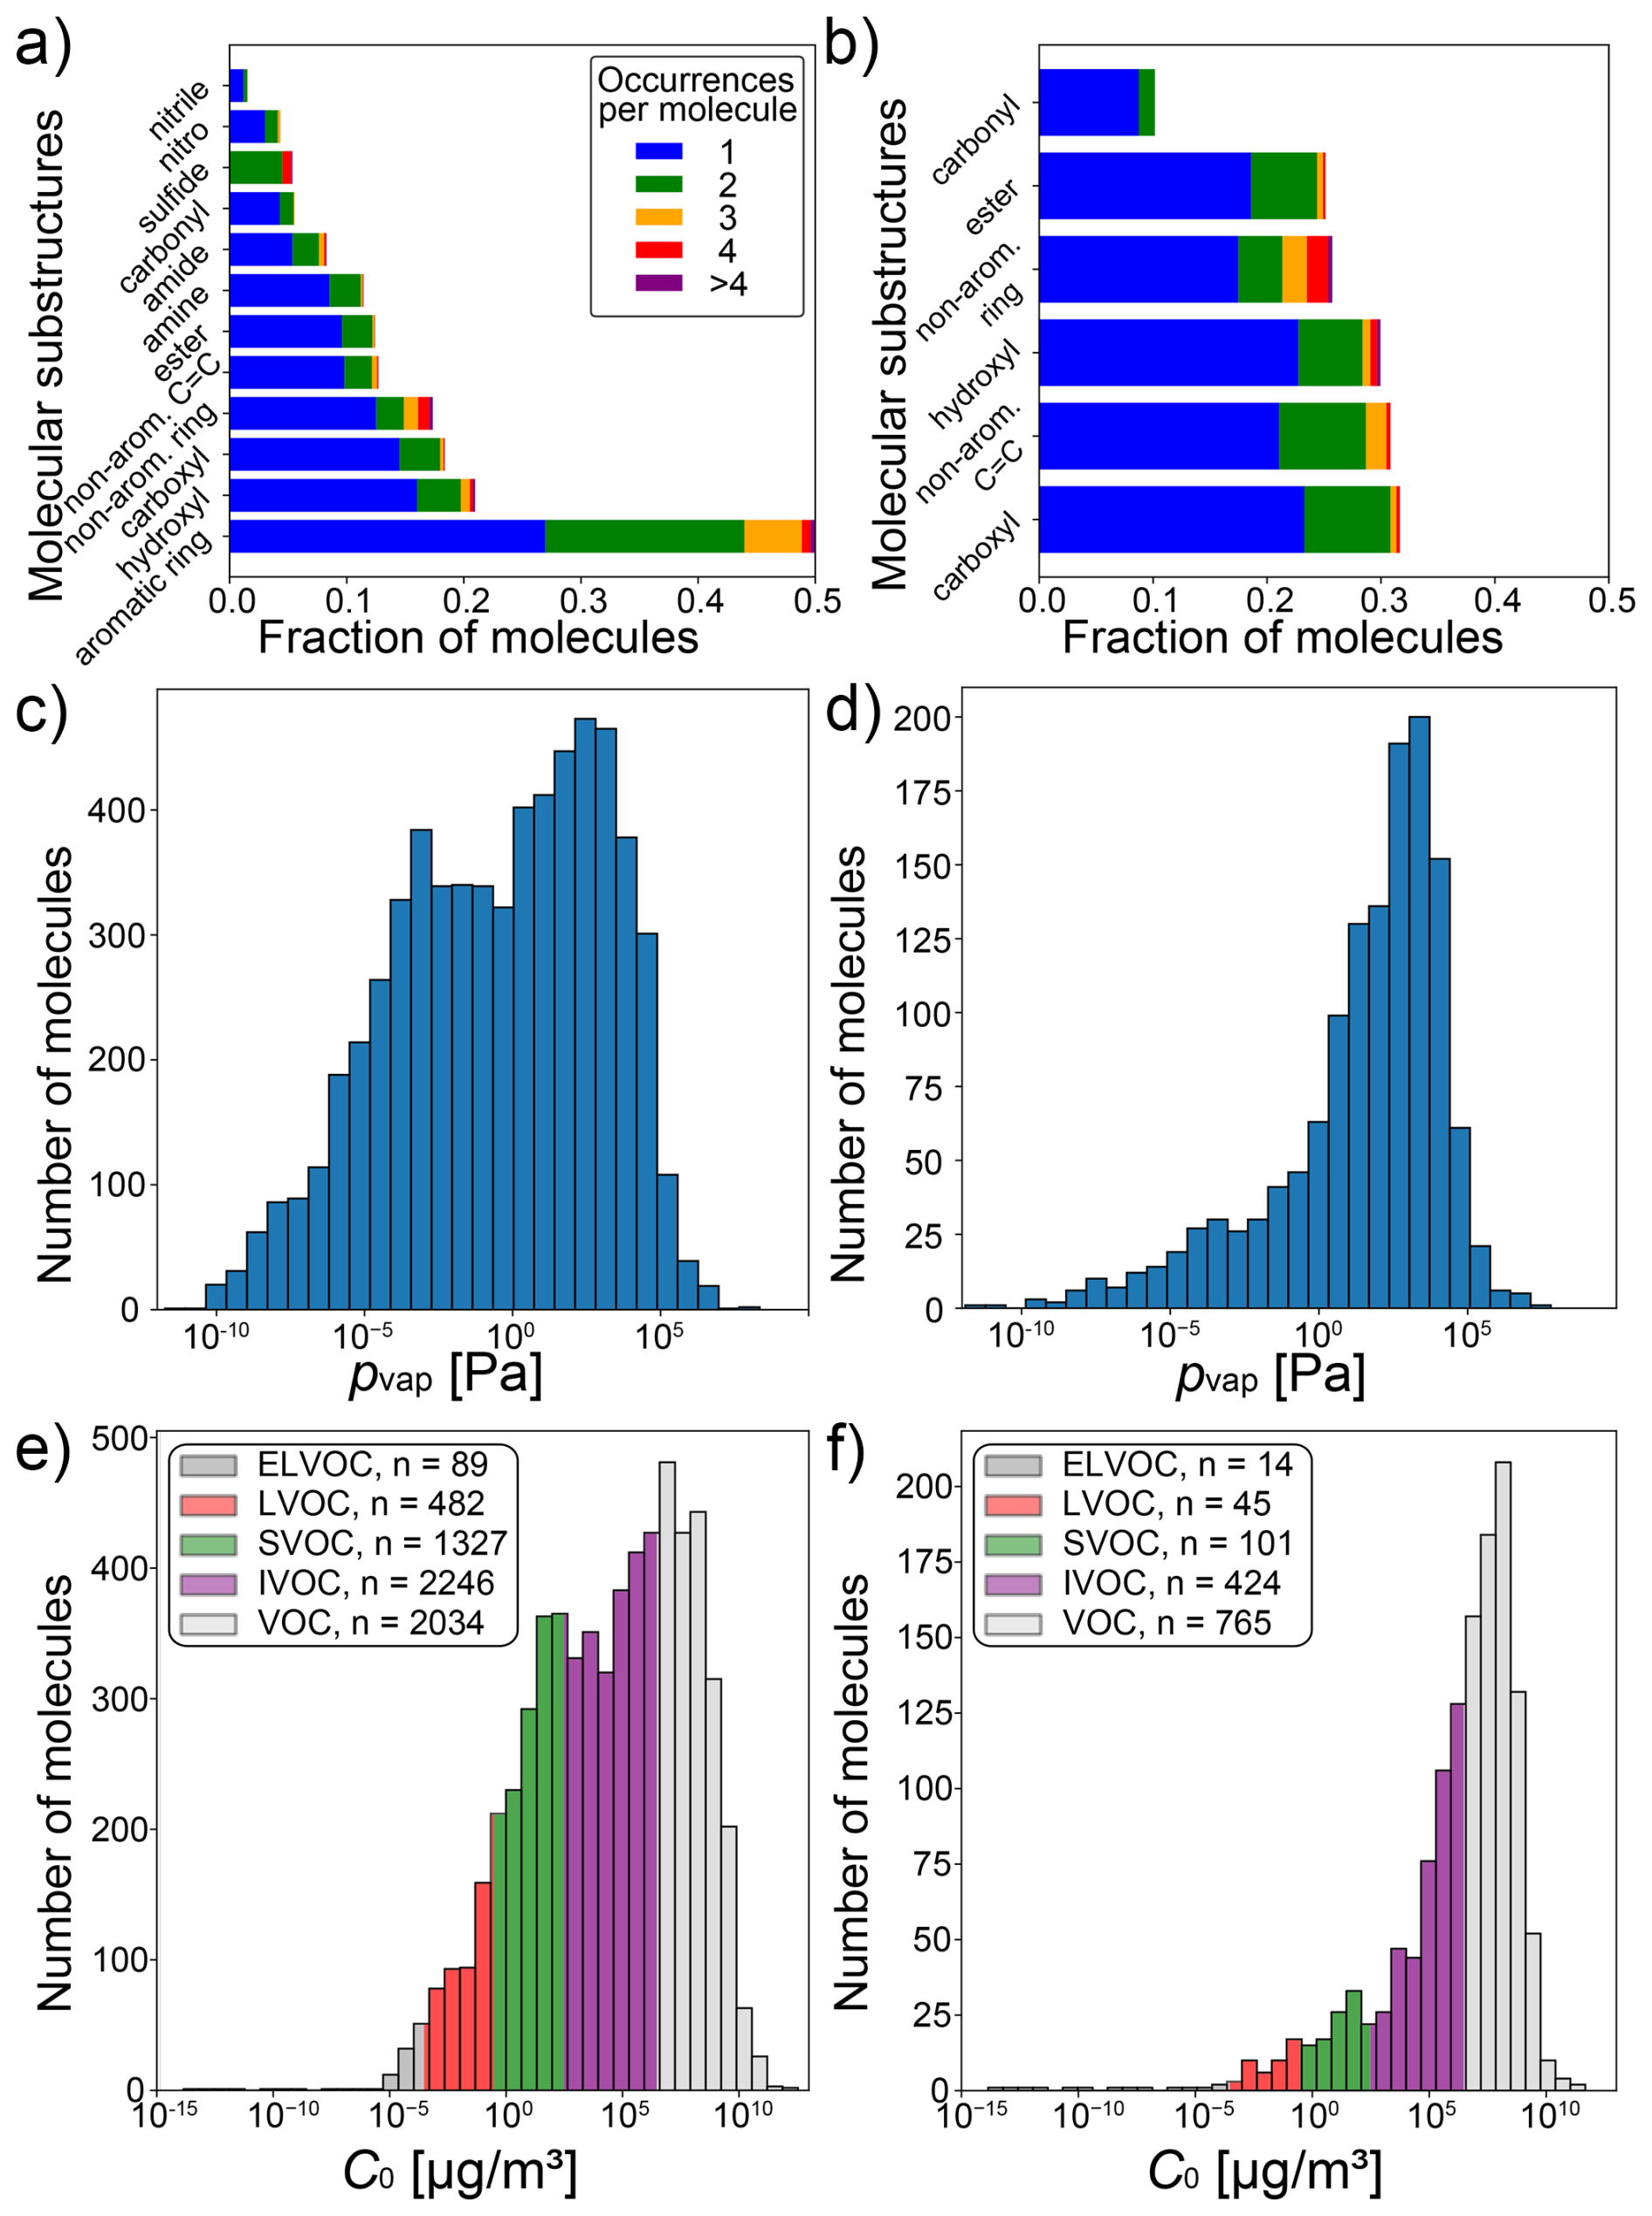
Figure 1Overview of the two experimental data sets used in this study: broad data set (n=6178; a, c, e) and confined subset (n=1349; b, d, f). Panels (a) and (b) show all substructures which are present in more than 1 % of molecules in the respective data set (not shown: a: nitrate, sulfo, peroxide, organosulfate, peroxy acyl nitrate; b: peroxide). Panels (c) and (d) display histograms of experimental vapor pressure measurements in each data set, whereas Panels (e) and (f) show the same data as saturation mass concentrations (C0). The volatility classes are adopted from Donahue et al. (2009).
In addition to the experimental data, we train and evaluate GC2NN models based on the quantum-mechanical (QM) data set GeckoQ (Besel et al., 2023). This data set contains a total of 31 637 compounds with calculated pvap. Compounds in this data are carbon backbones derived from decane, toluene and α-pinene with various functional groups (including C, O, H). These structures were generated by the GECKO-A mechanism generator following Isaacman-VanWertz and Aumont (2021). GECKO-A simulates the atmospheric oxidation of hydrocarbons (Aumont et al., 2005), ensuring the atmospheric relevance of the compounds in this data set. Besel et al. conducted a conformer search using the COSMOconf program, calculated individual conformer pvap values with COSMOtherm, and determined a single pvap accounting for the population of conformers according to the Boltzmann distribution (Wang et al., 2017; Kurtén et al., 2018; Hyttinen et al., 2022).
From each data set, we sample test sets (10 % of compounds) that are fully withheld from model training and used to evaluate the trained GC2NN models. The remaining compounds in each data set (90 %) are used for training of the GC2NN models, applying 5-fold cross-validation with 80 % of data in the training and 20 % in the validation set. The resulting data set sizes are the following: broad training: 4449, broad validation: 1112, broad test: 617, confined training: 972, confined validation: 243, confined test: 134, GeckoQ training: 22 778, GeckoQ validation: 5695, and GeckoQ test: 3164. pvap measurements in Pa are logarithmized and scaled to a [0, 1]-interval using min-max scaling.
Of the 1349 molecules in the confined data set, 474 are also contained in the EVAPORATION training data (Compernolle et al., 2011). We ensure that no EVAPORATION training data are present in the test set that is used for comparison between the methods. Note that this only applies to EVAPORATION due to data availability and practicability; any other pre-trained or fitted method is likely to contain some fraction of the test set used in this study in their training data, including Donahue et al. (2011), Li et al. (2016), SIMPOL, and EPI-Suite.
2.2 Molecular representation
For the graph convolution component of the GC2NN, we transform SMILES representations of molecular structures into graph-representations where atom features are mapped to node features, and bond features to edge features (Tables S1 and S2 in the Supplement). The final graph structure is comprised of three tensors. Each node and bond in the graph is associated with a vector of atom features and bond features, respectively. An adjacency matrix indicates the connectivity of atoms in the molecule. Graph convolution layers receive the adjacency matrix indicating which nodes (i.e., atoms) are connected, as well as the node feature matrix as inputs, graph attention layers additionally receive edge features. While the adjacency matrix remains unmodified to allow deduction of the connectivity for the following layers, each graph layer alters the feature matrix or matrices by aggregating features from neighboring nodes or edges, using the adjacency matrix to guide the aggregation.
For the model's group contribution component, a list of molecular descriptors (including molar mass, number of atoms for each element, and the number of common functional groups) are derived directly from the SMILES representation of the molecule. The descriptors are specific to each data set and are summarized in Table S3. All descriptors and features are one-hot encoded or normalized to a [0, 1] interval.
2.3 Model architecture and training
We test and compare two group contribution-assisted graph convolutional neural networks (GC2NN) models in this work: a fixed-depth GC2NN (fdGC2NN) model with a fixed number of graph layers, and an adaptive-depth GC2NN (adGC2NN) model where the number of graph layers is dynamically adapted based on a compound's size. Schematic overviews of the adGC2NN and fdGC2NN models are shown in Figs. 2 and S1, respectively. All GC2NN models encompass two components with separate inputs that are derived from the SMILES-encoded molecular structure. The graph convolution component is comprised of multiple graph convolution layers and graph attention layers. Graph convolution layers apply convolution operations on each node, deriving information from the current node’s properties, as well as its neighbors (Kipf and Welling, 2017; Zhang et al., 2019). Graph attention layers utilize attention mechanisms, enabling them to weigh convoluted nodes and features by their importance (Veličković et al., 2017; Withnall et al., 2020; Tang et al., 2020). This capability allows the assessment of feature importances by evaluating attention weights (Sanchez-Lengeling et al., 2020). Furthermore, graph attention layers enable the model to also derive information from edge attributes (Battaglia et al., 2018). Each graph attention or convolution layer increases the nodes' receptive fields, i.e. the distance between two nodes (and hence atoms) that still affect each other. To account for variable molecule sizes, we use the maximum distance between two atoms of a compound (maxdist) to determine the number of processing graph layers in the adGC2NN, with a maximum of five layers for molecules with maxdist >4. In the fdGC2NN, all compounds are indiscriminately passed through five graph layers. The models' group contribution component is comprised of fully connected hidden layers that process additional molecular descriptors in parallel. Graph layer-specific merging layers map the information obtained from both model components to the output layer and a vapor pressure prediction. We use the Python packages RDKit and PyTorch (and PyTorch_Geometric) to generate the graph representations of molecular species from SMILES and train GC2NN models (Landrum, 2013; Paszke et al., 2019).
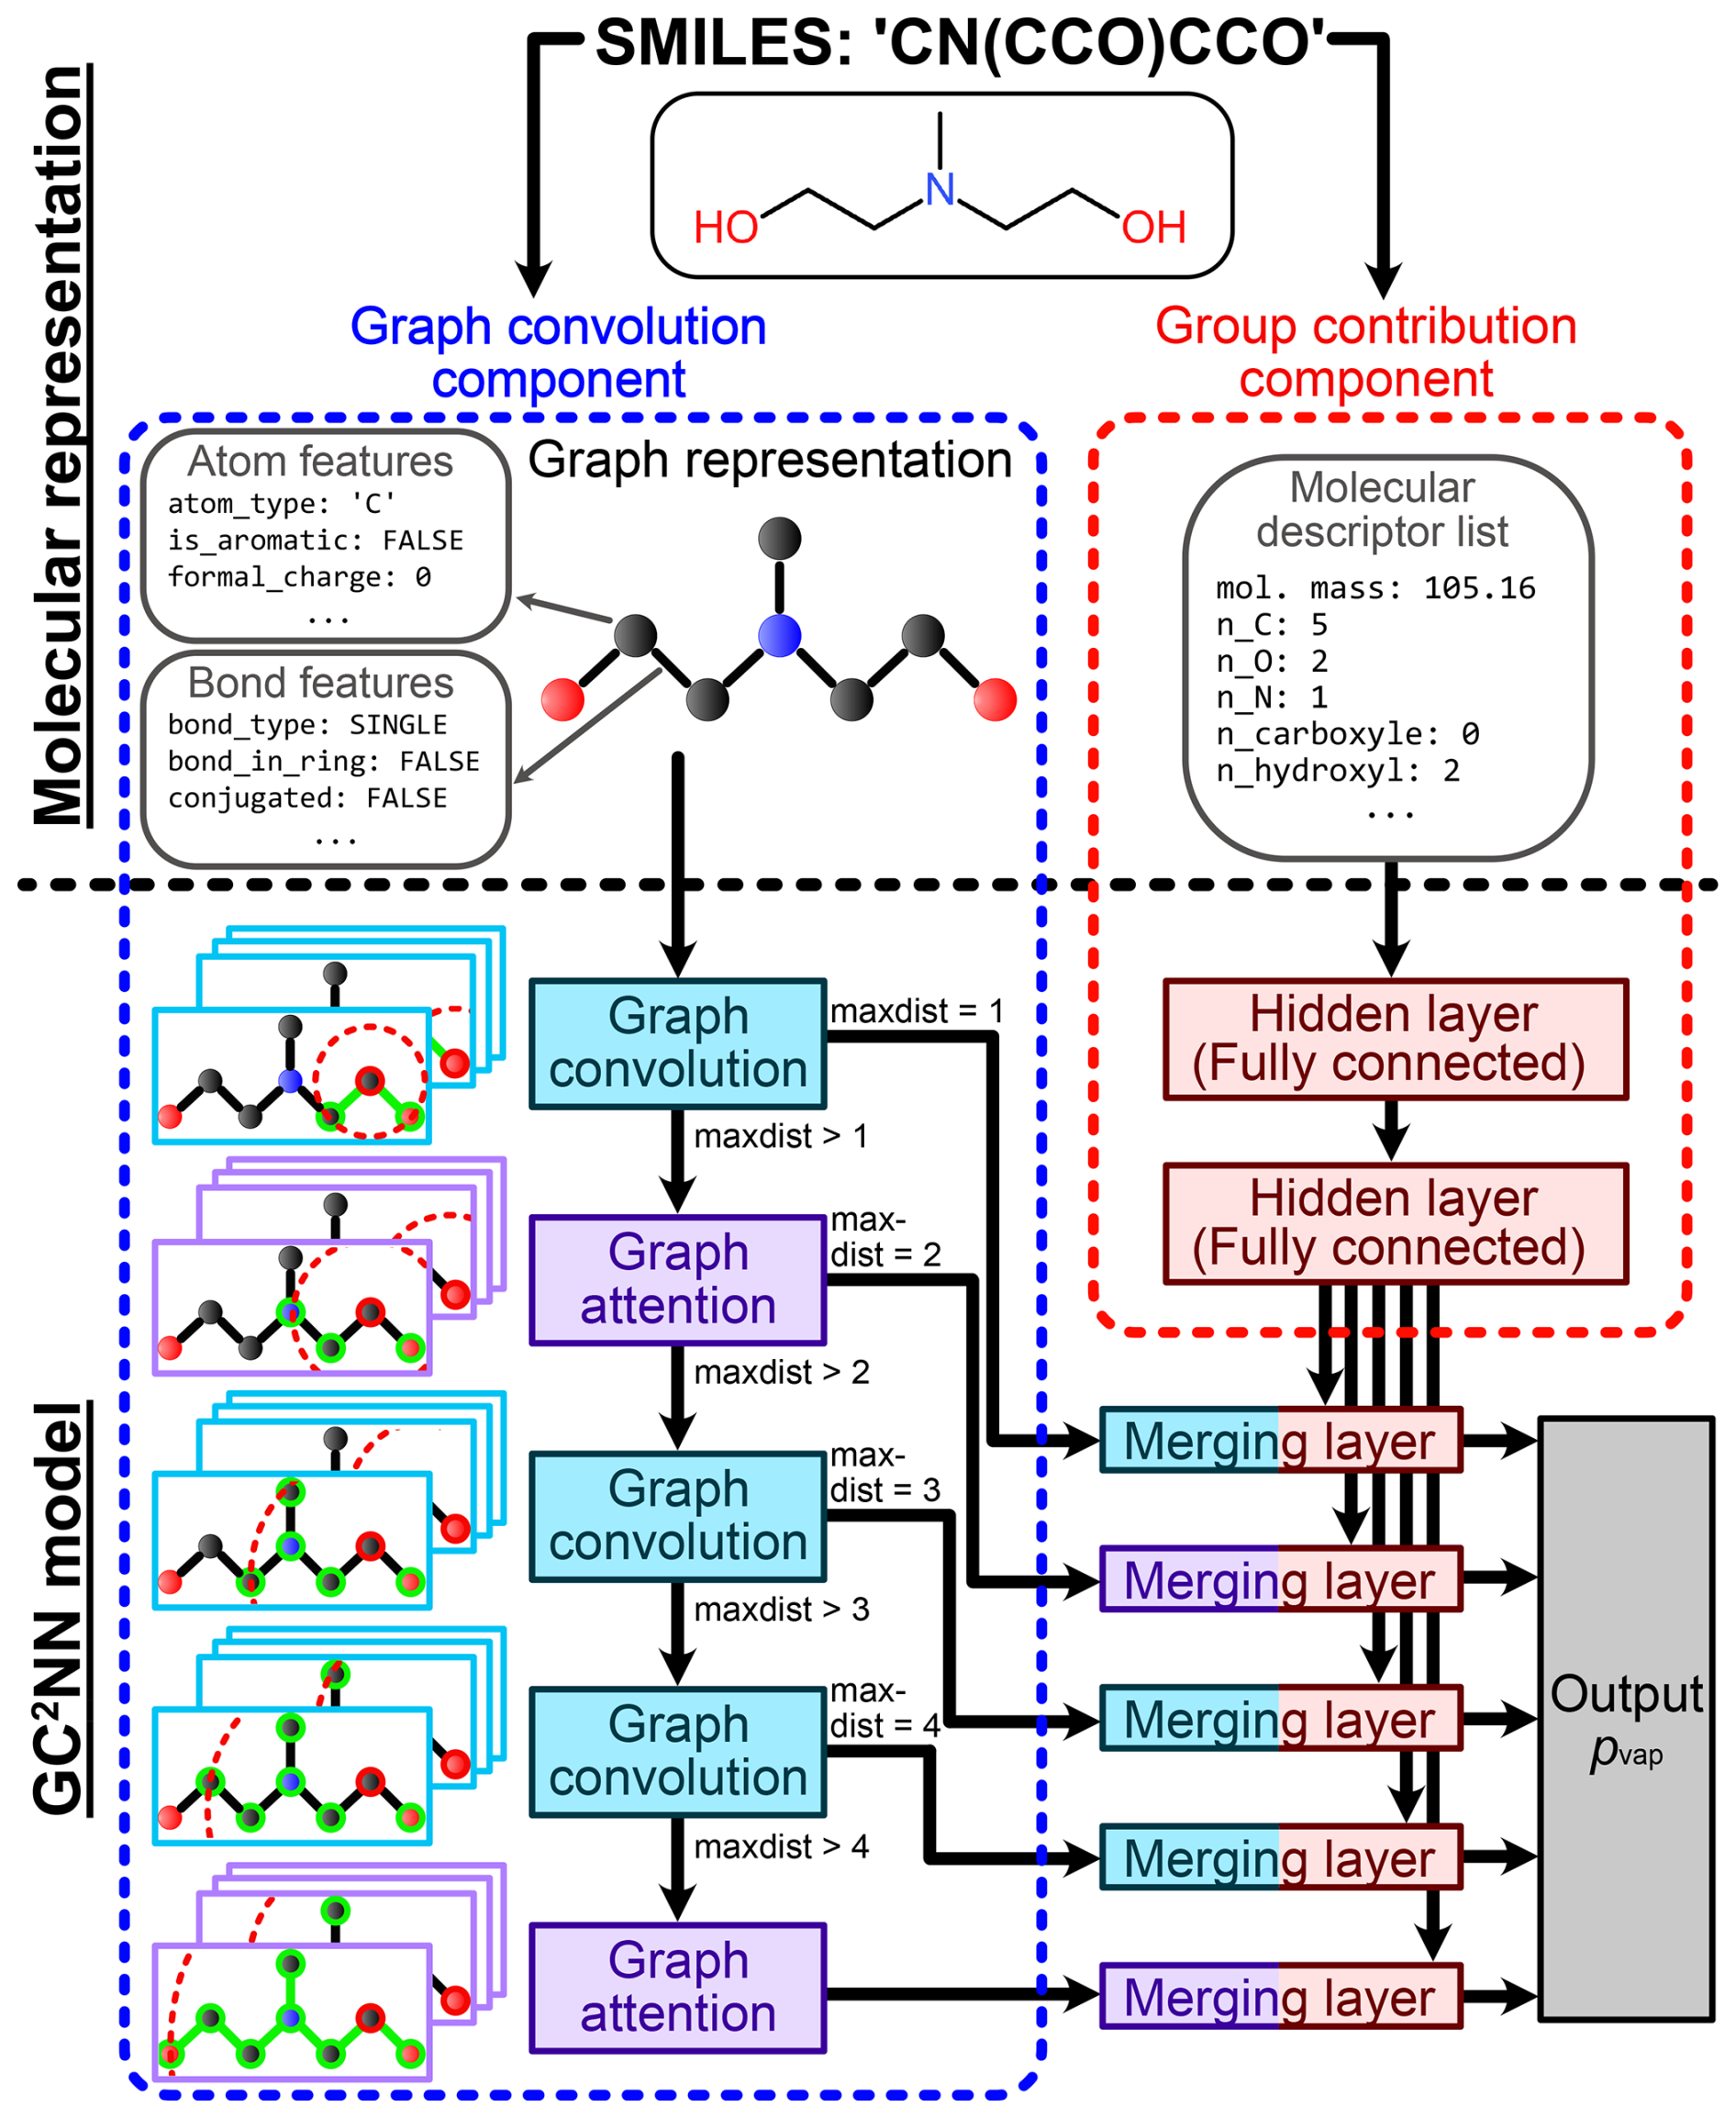
Figure 2Schematic overview of molecular representation and model functionality in the adaptive-depth GC2NN models. Right: for the group contribution component, Simplified Molecular Input Line Entry System (SMILES) strings are used to derive holistic information on the molecule, such as its molar mass and the presence of atoms and functional groups (Table S3). Left: for the model's graph convolution component, SMILES strings are transformed into graph representations, encoded as adjacency matrices, node features, and edge features. This molecular representation is transformed using graph attention and graph convolution layers. The maximum distance (maxdist) between two nodes in the input graph determines the number of utilized graph layers, matching the nodes' receptive fields with the respective compound's size. After passing all graph layers applicable to a compound, the convoluted and flattened node and edge feature matrices are concatenated with the processed data from the group contribution component. Fully-connected merging layers process these vectors and map them to the single-node output layer, the pvap prediction.
The Python package Optuna (Akiba et al., 2019) is used to efficiently optimize hyperparameters of each GC2NN model, using 5-fold cross-validation to mitigate variability due to the small data sets. We select mean absolute error (MAE) as loss function for model training, as well as model evaluation and comparison with established methods, due to its robustness over methods that give more weight to outliers such as root mean squared error (RMSE). This is particularly important given that the training data consist of experimental measurements that may possess high uncertainty and could be subject to systematic biases originating from different experimental setups. Measurements in the ELVOC range are particularly susceptible to higher experimental uncertainties, which would receive disproportionate weighting under RMSE-based training and consequently degrade model performance on other ranges. MAE allows for a reliable and interpretable evaluation of model accuracy without being overly influenced by extreme values. Hyperparameters are optimized by minimizing average validation loss across all cross-validation folds, but we reject models if the MAE standard deviation is larger than 0.08, to ensure robust model architectures. All models are trained to a maximum of 400 training epochs, unless validation loss does not decrease for 20 consecutive epochs. If so, model parameters are reset to the state of the epoch where the last validation loss decrease occurred, and training is terminated to avoid over-fitting. After the selection of suitable hyperparameters, a single model is trained by merging training and validation data to a single training data set, referred to as T+V model. To account for the additional training data, we locally optimize the number of training epochs around the number determined during hyperparameter tuning. A summary of the relevant hyperparameters including descriptions and tested ranges is displayed in Table S4. Hyperparameter optimization and model training are conducted on the Raven high-performance computing (HPC) system of Max Planck Computing and Data Facility (MPCDF), which provides GPU-accelerated compute nodes, each with four Nvidia A100-SXM4 GPUs and 160 GB HBM2. Each model is trained on a single Nvidia A100-SXM4 GPU using up to 24 GB of memory and PyTorch version 2.4.0 with CUDA version 12.1 support.
We train and evaluate group contribution-assisted graph convolutional neural network (GC2NN) models on two sets of experimental vapor pressure (pvap) data and the GeckoQ data set where pvap was derived from quantum-mechanical calculations (Besel et al., 2023). We distinguish between models trained on experimental data sets with different scopes: the GC2NN-confined are trained on a confined data set that only contains compounds relevant in the atmosphere within the scope of the methods used for benchmarking, i.e. only containing C, H, and O, and excluding aromatics and some additional functional groups (Fig. 1b, d, f). GC2NN-broad are trained on the full experimental data set (Fig. 1a, c, e).
3.1 GC2NN-confined
Figure 3a shows that the adGC2NN model exhibits excellent agreement with the experimental measurements in the independent test set, except from a small number of outliers (MAE = 0.37 log-units). Average training time of the five adGC2NN cross-validation models is 55 min on a Nvidia A100, and the average test set mean absolute error (MAE) is 0.40 log-units with a standard deviation of 2.04 × 10⁻². The T+V fdGC2NN performs worse with an MAE of 0.47 log-units. Average training time of the five fdGC2NN cross-validation models is 22 min on a Nvidia A100, and the average test set mean absolute error (MAE) is 0.46 log-units with a standard deviation of 3.0 × 10⁻². The selected hyperparameters for all fdGC2NN models are summarized in Table S5. The adGC2NN model is more robust regarding the choice of hyperparameters, which permits the use of a single model architecture for all data sets. All adGC2NN models possess two hidden layers with each 32 nodes in the group contribution component and a single merging layer with eight nodes for each graph convolution layer. The graph component of the adGC2NN models is comprised of a total of five layers with 32, 16, 64, 16 and 32 nodes, using “LeakyReLU”, “LeakyReLU”, “ReLU”, “ReLU” and “LeakyReLU” activation functions, respectively. Among these, the second and fifth layers are graph attention layers with six attention heads each, processing additional edge information. Training is conducted with a learning rate of 6.25 × 10⁻⁴, a learning rate decay of 0.985 per training epoch, no weight decay and a batch size of four (Fig. 2, Table S6). The adGC2NN significantly outperforms the Krüger et al. (2022) one hot-encoding convolutional neural network approach (OHE-CNN; MAE =0.79 log-units; average MAE =0.93 log-units for five cross-validation folds), the Donahue et al. (2011) (MAE =1.61 log-units) and Li et al. (2016) (MAE =1.05 log-units) parameterizations, as well as EPI-Suite (MAE = 0.43 log-units), SIMPOL (MAE = 0.61 log-units) and EVAPORATION (MAE = 0.54 log-units) group contribution methods (Fig. 3). Note that the exclusion of a large fraction of molecules (>30 %) from the test set biases the populations of chemical species in the training and test set for the GC2NN and OHE-CNN models (Fig. S2). This may be disadvantageous for the GC2NN models, however, separate calculations with unbiased test set sampling show that the choice of the test set does not have a strong effect on the test set error of the GC2NN models.
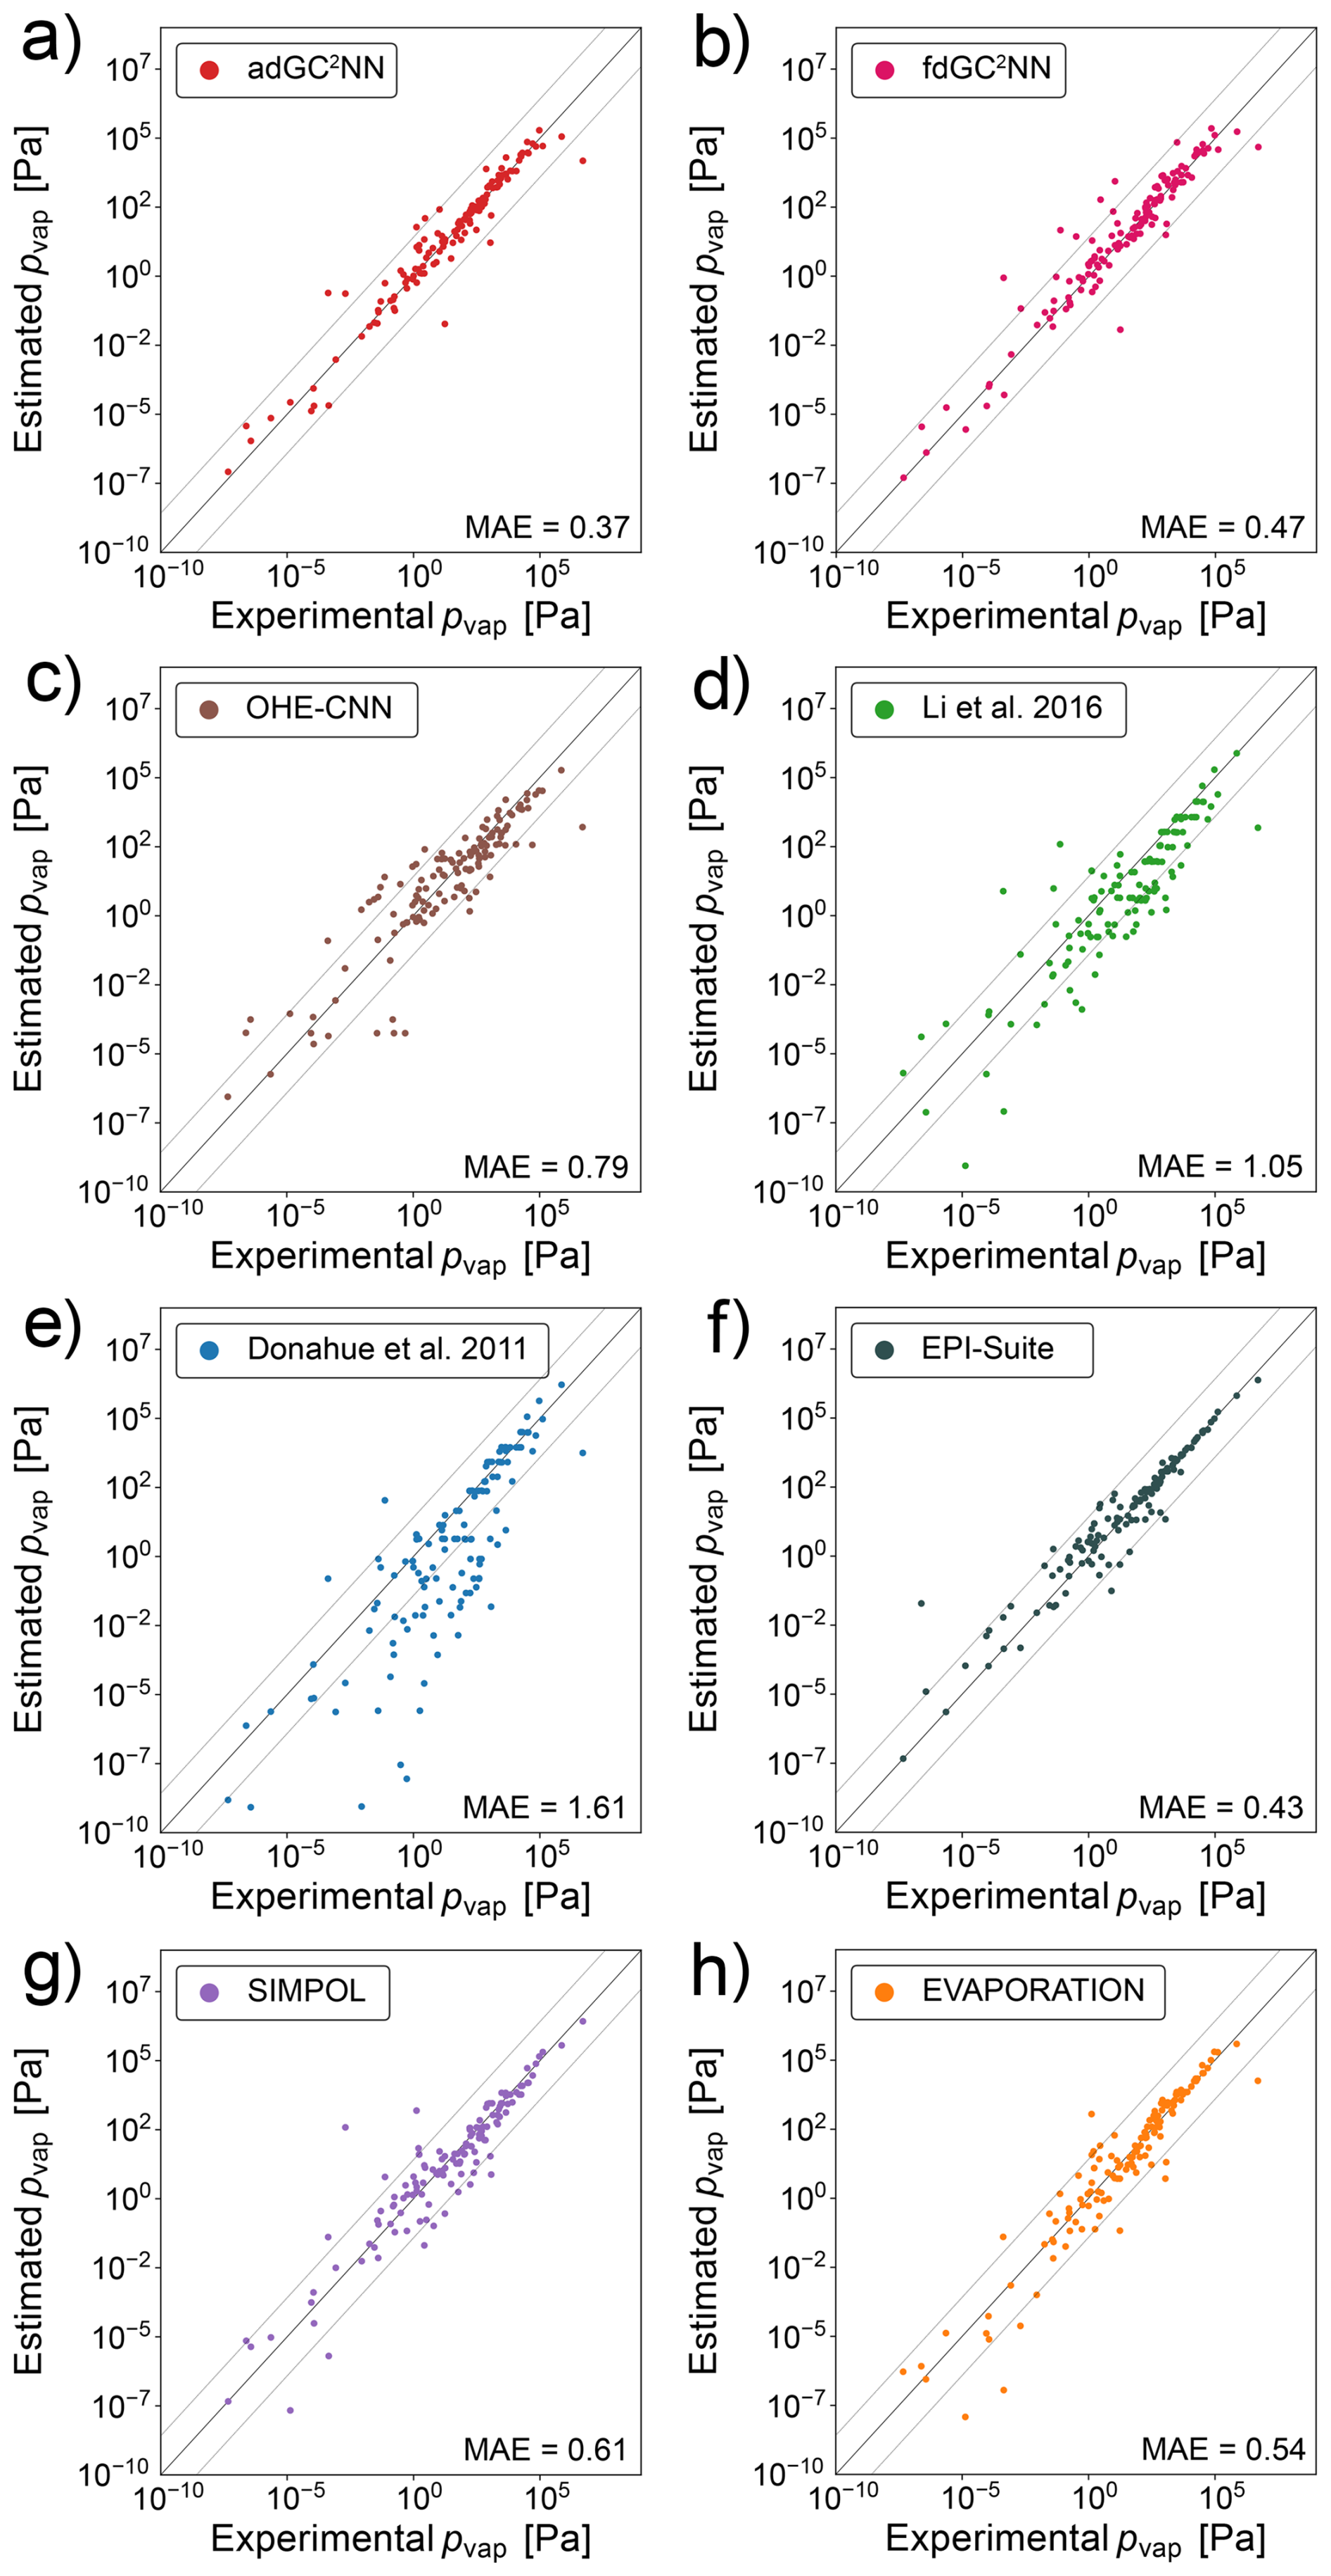
Figure 3Correlation scatter plots of model-predicted and experimentally-measured vapor pressures for the confined data set. Displayed are data from the independent test set only. The adGC2NN-confined (a) and fdGC2NN-confined (b) models are compared with established methods: (c) shows the results using a convolutional neural network approach on one-hot encoded SMILES strings following Krüger et al. (2022). (d) Li et al. (2016) and (e) Donahue et al. (2011) are empirical parameterizations, whereas (f) EPI-Suite (EPI, 2024), (g) Pankow and Asher (2008) and (h) Compernolle et al. (2011) are group contribution methods. All molecules present in the EVAPORATION training data have been excluded from the test data set. Mean absolute error (MAE) values are in log10(pvap/[Pa]). The dashed lines (±1.5 log-units from the 1:1 line) are used to indicate significant outliers.
Figure 4 shows the distributions of the individual errors for chemical species in the test set for all methods. The fdGC2NN-confined, SIMPOL and EVAPORATION methods exhibit near-identical error distributions where the majority of predictions are very accurate (MAE < 0.5 log-units), and few predictions fall within the range of 0.5 to 1.5 log-units. Only the adGC2NN model has a larger density of very accurate predictions with only few compounds exceeding an MAE of 1.0. EPI-Suite shows an hour-glass shaped profile with a large fraction of very accurate predictions, as well as a large fraction of outliers. This is likely due to the presence of EPI-Suite training data in our test set. Methods for which this is likely the case are marked with an asterisk in Fig. 4. All methods generally perform better at higher pvap (Fig. S3). This behavior correlates with a similar, but weaker bias with regards to molar mass (Fig. S4). The parameterization methods (Li et al., 2016; Donahue et al., 2011), which are solely based on elemental composition without considering functional group and molecular structure, exhibit the highest percentage of significant outliers.
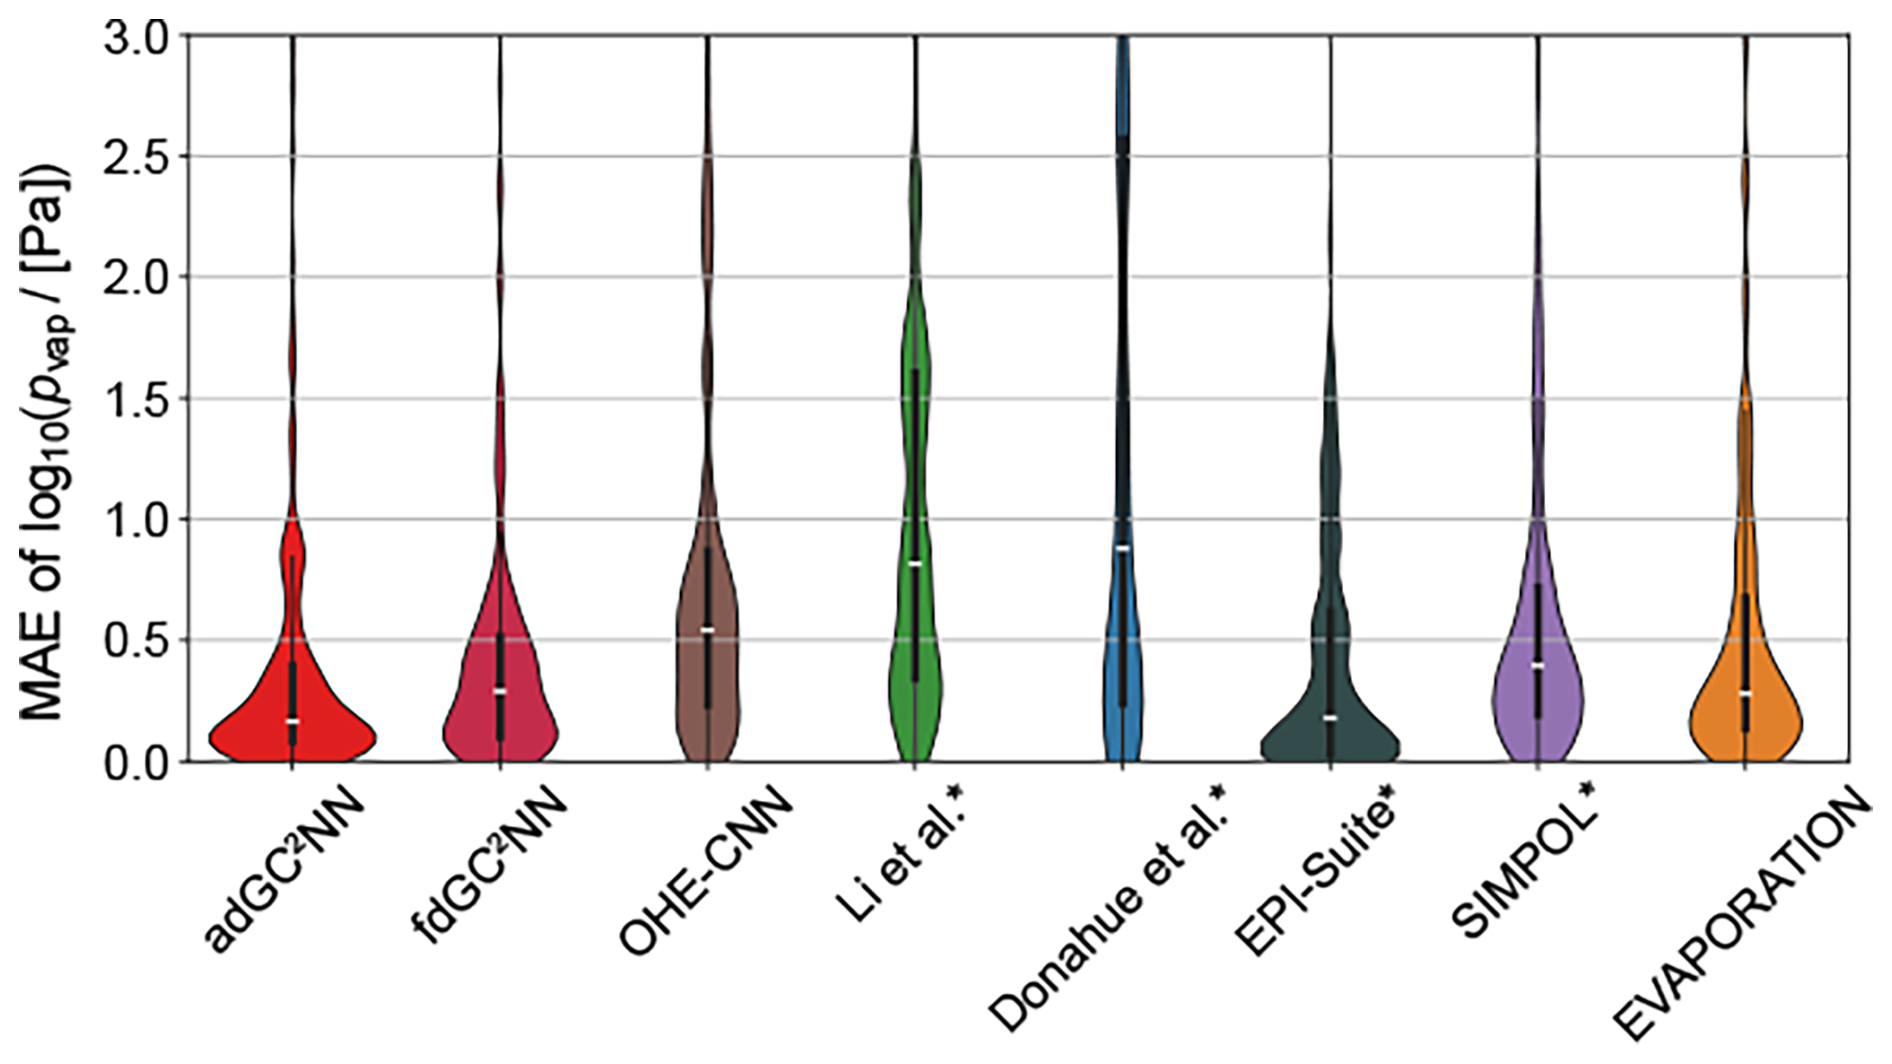
Figure 4Violin plots representing confined test set error distribution of models shown in Fig. 3. Medians are displayed as white markers, interquartile ranges as vertical wide black lines and 1.5× interquartile ranges as vertical narrow black lines. Outliers with an MAE >3 log-units are not shown. Methods marked with an asterisk likely used a fraction of our test data in their training.
For a general feature attribution analysis, we investigate attention scores of the second layer (graph attention) of the trained model's graph component. The attention weights, which are trained parameters of the model, are applied to each chemical compound and graph node (i.e., atom) to compute attention scores. They represent the calculated importances, quantifying the contribution of each node to the pvap prediction relative to its neighboring nodes for a specific compound. For functional groups, importances of all associated atoms are averaged. With regards to single atoms, oxygen (0.36) scores a slightly larger attention score than carbon (0.32) in the confined test set (Fig. S5). Among functional groups, hydroxyl groups achieve the highest score.
To investigate the effect of experimental error in the low volatility range, we train fdGC2NN models on a subset of the confined data with log10(pvap/[Pa]) > 0, encompassing only VOC and IVOC, resulting in 1057 compounds. The average test set MAE of the cross-validation folds of this high-volatility fdGC2NN model is 0.32 log-units. This suggests that not only does experimental uncertainty of ELVOC and LVOC lead to model uncertainty in this low-volatility range, but it impedes the accuracy of fdGC2NN models in general. To assess model uncertainty, we analyze ensemble predictions from the 5-fold cross-validation models on both confined and broad test data sets with regards to their prediction errors and standard deviations (Fig. S6). While the ensemble mean error represents model bias, the ensemble standard deviation can serve as an indicator for overall model uncertainty.
We use the trained adGC2NN-confined model to review the concept of molecular corridors, following Shiraiwa et al. (2014), where the chemical evolution of molecules constituting SOA is contextualized through their vapor pressure, molar mass, and oxygen-to-carbon (O:C) ratio. The tight inverse correlation between volatility and molar mass mostly holds for the confined test set (Fig. 5a) as well as a data set of atmospherically-relevant compounds from Shiraiwa et al. (2014) (Fig. 5b). For the confined test set, the adGC2NN predictions even tend to fall more strictly into these molecular corridors than the experimental measurements, a potential indicator for experimental uncertainties. When applied to the data from Shiraiwa et al. (2014), we observe a few compounds that appear to deviate from the molecular corridors by exceeding the upper boundary line corresponding to n-alkanes (). This deviation is either due to a mismatch between the adGC2NN and the EVAPORATION model that was used to determine the boundary lines established in Shiraiwa et al. (2014), or could be due to a systematic error of the adGC2NN as a result of the sparsity of ELVOC data in the training set (Fig. S2b). Furthermore, the difficulties of accurately determining vapor pressures of ELVOC experimentally (Huisman et al., 2013; Bilde et al., 2015) may contribute to this error. In atmospheric context, the accurate determination of ELVOC vapor pressure is not critical with regards to SOA formation, as such compounds condense anyway. Note however, that the accurate determination of ELVOC may be relevant in the context of nucleation, as recent experimental studies found ultra-low-volatility organic compounds (ULVOC) to nucleate, but not LVOC or ELVOC (Kirkby et al., 2023). Attempts have thus been undertaken previously to increase the representation of ELVOC molecules in training data sets for vapor pressure estimation models (Besel et al., 2024).
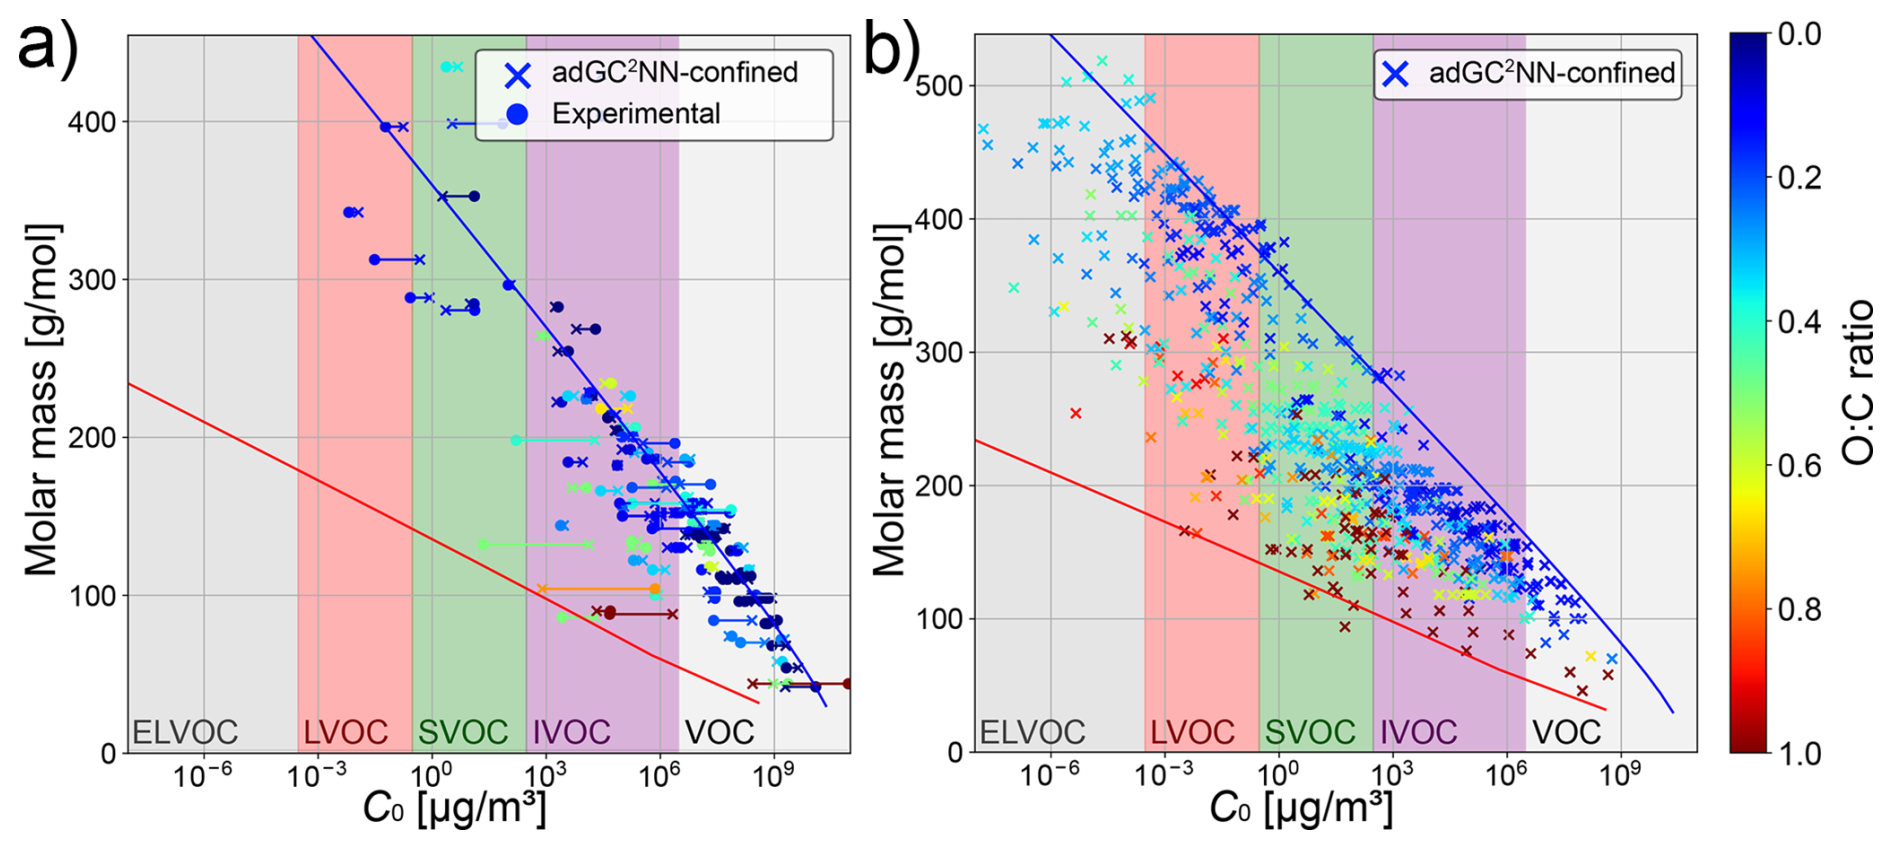
Figure 5Molecular corridor plots following Shiraiwa et al. (2014). Left: comparison between adGC2NN-confined predictions and experimental measurements in the confined test set. Right: application of the adGC2NN-confined to a data set of atmospherically relevant compounds (Shiraiwa et al., 2014). Blue and red boundary lines correspond to the volatility of n-alkanes and sugar alcohols (as determined by EVAPORATION), respectively.
3.2 GC2NN-broad
Compared to the confined data set, the broad data set encompasses a much larger range of molecular complexity, going far beyond molecules relevant for atmospheric SOA. Thus, despite a much larger training set size, the adGC2NN-broad model achieves a lower test set accuracy than the adGC2NN-confined model, with an MAE of 0.69 log-units for the T+V model (Fig. 6). Average training time of the cross-validation models is 4.4 hours on a Nvidia A100 GPU, and the average test set mean absolute error (MAE) is 0.71 log-units with a standard deviation of 3.02 × 10⁻². The T+V fdGC2NN model performs worse with an MAE of 0.77 log-units. Cross-validation fdGC2NN models have an average test set MAE of 0.78 with a standard deviation of 2.36 × 10⁻² and an average training time of 2.4 h. Both GC2NN models outperform the OHE-CNN approach from Krüger et al. (2022) (MAE = 0.99 log-units; average MAE = 0.96 log-units for five cross-validation folds), but have a similar test set error than EPI-Suite (EPI, 2024) (MAE = 0.69 log-units). Error distributions for the broad test set are displayed in Fig. S7. Note that EPI-Suite was trained on larger data sets that are not publicly available. As discussed above, the MAE that EPI-Suite achieves in our test set is likely biased through overlap of training and test data and thus not fully representative for unknown molecules.
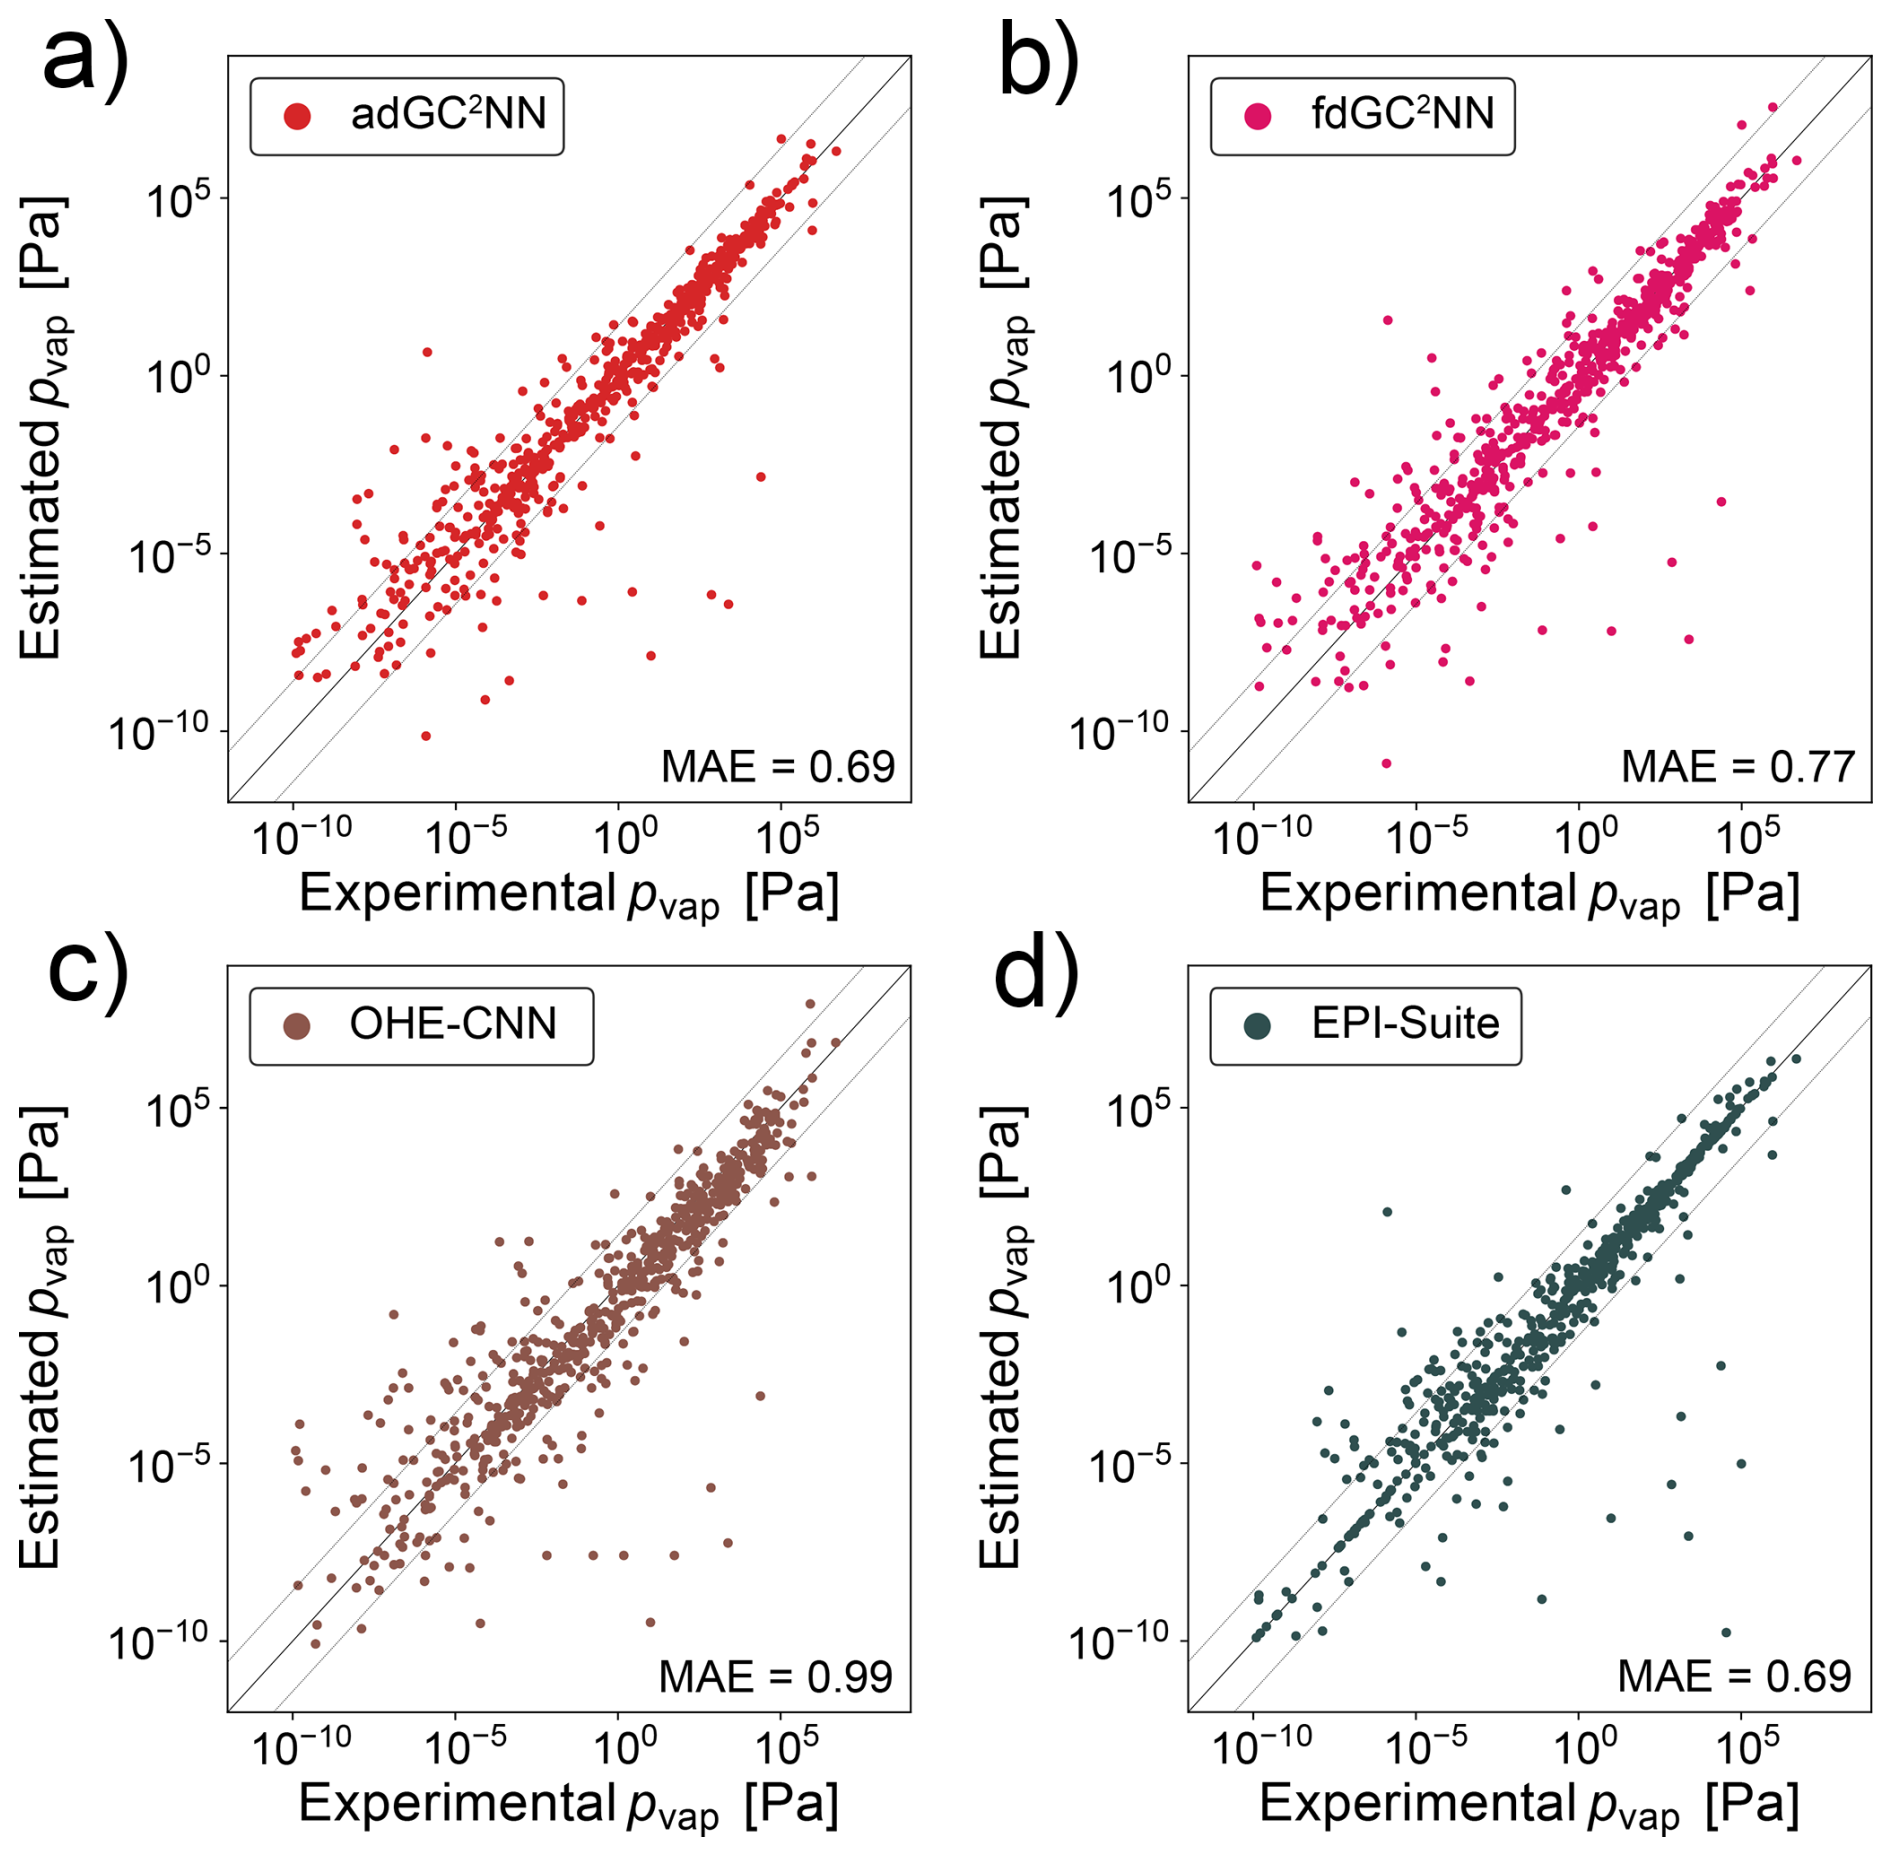
Figure 6Correlation scatter plots of model-predicted and experimentally-measured vapor pressures for the broad data set. Displayed are data from the independent test set only. (a) adGC2NN-broad model, (b) fdGC2NN-broad model, (c) OHE-CNN method presented in Krüger et al. (2022), and (d) EPI-Suite (EPI, 2024). Mean absolute error (MAE) values are in log10(pvap/[Pa]). The dashed lines (±1.5 log-units from the 1:1 line) are used to indicate significant outliers.
We also train a fdGC2NN model on a subset of the broad data with log10(pvap/[Pa]) >0 to investigate the effect of experimental uncertainty in the low-volatility range. Due to the large fraction of low-volatile compounds in the broad data, the high-volatility subset only contains roughly 50 % of the original compounds (n=3116). The cross-validation models achieve an average MAE of 0.37 log-units, greatly reducing the error by nearly 50 % and outperforming EPI-Suite (Figs. S8, S9). An uncertainty analysis based on ensemble predictions for the broad test data of the 5-fold cross validation adGC2NN-broad models is shown in Fig. S10. Calculated attention scores for single atoms and functional groups are summarized in Fig. S11. Notably, we observe a good agreement between the attention score orders of functional groups between adGC2NN-confined and adGC2NN-broad, with hydroxyl groups having the highest scores, followed by carbonyl groups, ester groups and finally non-aromatic C=C double bonds. The importance of hydroxyl groups may be attributed to their ability to form hydrogen bonds that reduce the compound’s vapor pressure. Note that feature importances assigned by trained models are not exclusively governed by chemical principles, but also the prevalence and distribution of substructures in the training data. Rarity and commonness of certain substructures may both decrease associated feature importances, as high importances are attributed to relevant features that enable the model to distinguish compounds of the training population. To differentiate between chemistry-governed and prevalence-governed importances, feature attribution analyses could be supported by generative sensitivity studies, where the effect of substructures on pvap predictions is statistically tested through systematic substitution of substructures in template compounds. A molecular corridor plot following Shiraiwa et al. (2014) for the adGC2NN-broad model is displayed in Fig. S12, exhibiting a much stronger overestimation of ELVOC vapor pressures than the confined model (Fig. 5). Thus, it appears that the higher diversity of molecular features in the broad data set exacerbates the problem of sparse data in the ELVOC range.
3.3 GC2NN-GeckoQ
In addition to the experimental data sets, we train GC2NN models on the GeckoQ data from Besel et al. (2023), which were derived from quantum-mechanical calculations. For the T+V adGC2NN model, the average test set mean absolute error (MAE) is 0.66 log-units (Fig. 7). The five adGC2NN cross-validation models achieve an MAE of 0.67 log-units, average training time is 13.77 h on a Nvidia A100. Again, the adGC2NN model achieves a better result than the fdGC2NN model (MSE = 0.71 log-units; average MAE = 0.74 log-units for five cross-validation folds with an average training time of 3.4 h on a Nvidia A100), as well as the model adapted from Krüger et al. (2022) for pvap prediction (MAE = 0.77 log-units; average MAE = 0.77 log-units for five cross-validation folds). It also outperforms the Gaussian Process Regression model presented in Besel et al. (2023) which achieved a test set MAE of 0.82 log-units.
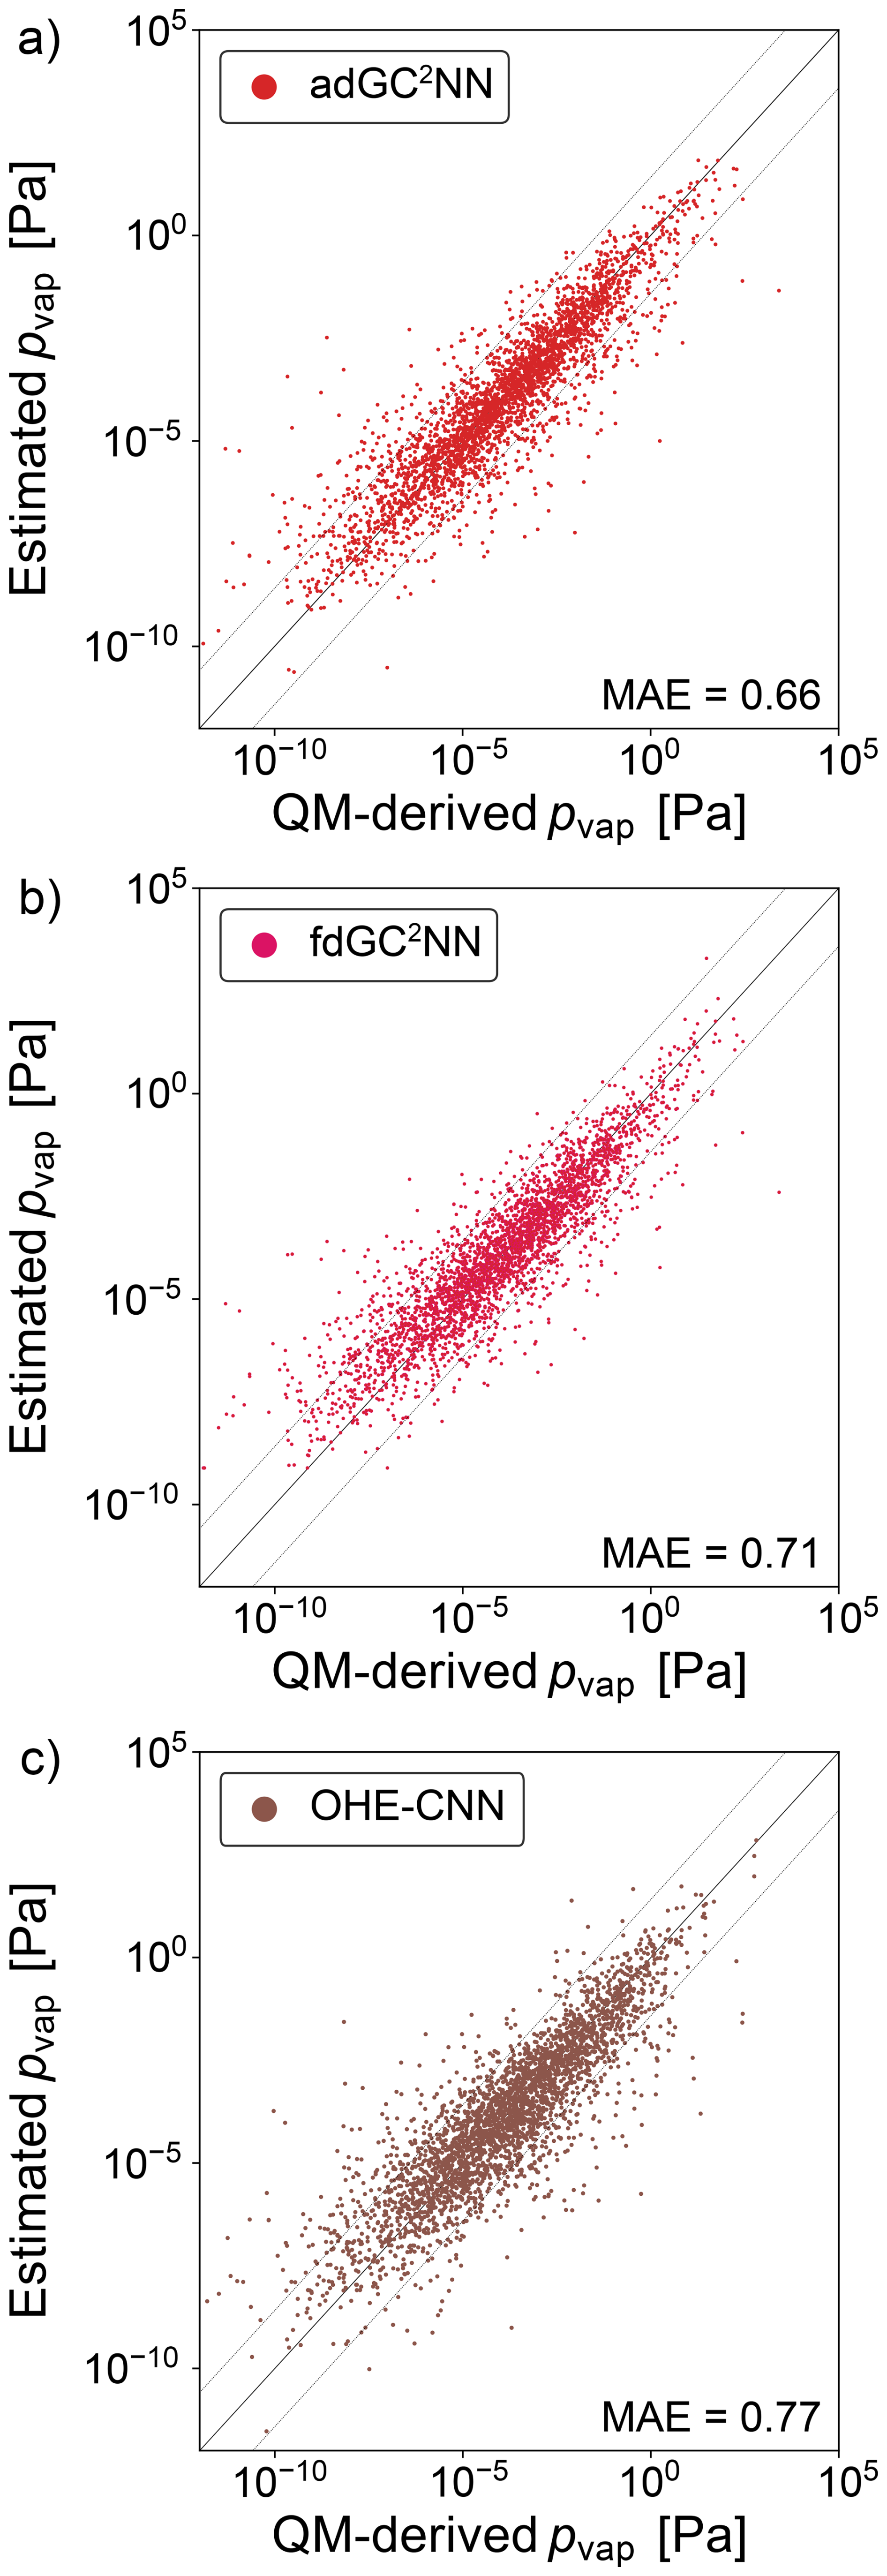
Figure 7Correlation scatter plots of model-predicted and experimentally-measured vapor pressures for the GeckoQ data set. Displayed are data from the independent test set only. (a) adGC2NN-GeckoQ model (b) fdGC2NN-GeckoQ model, and (c) OHE-CNN method presented in Krüger et al. (2022). Mean absolute error (MAE) values are in log10(pvap/[Pa]). The dashed lines (±1.5 log-units from the 1:1 line) are used to indicate significant outliers.
3.4 Learning curves
Figure 8 shows learning curves for the adGC2NN and fdGC2NN models for each of the three data sets (broad, confined, GeckoQ). Learning curves are obtained by training on data subsets of specific sizes, while consistently using the hyperparameter sets optimized for the full data sets (Tables S5, S6). Gradients and convergence rates of the learning curves significantly differ between the models and data sets. In general, the fdGC2NN models exhibit steeper learning curves than the adGC2NN models, demonstrating the superiority of the adG2NN model architecture across various data set sizes and data sets. Note that only one adGC2NN architecture and hyper parameter set is consistently used across the study, while fdGC2NN models are optimized individually for each of the three data sets. We observe that significantly more data are needed to achieve the same accuracy if the data contain a large variety of compound classes, as the broad and GeckoQ data models show consistently higher MAE than the confined data models for data sets of similar size. In the broad and GeckoQ data, the high diversity of molecular features and, potentially, their complex interactions require much more data for accurate predictions. None of the learning curves appear to fully level-off for large data set sizes, which means that the models can be expected to improve significantly with additional training data.
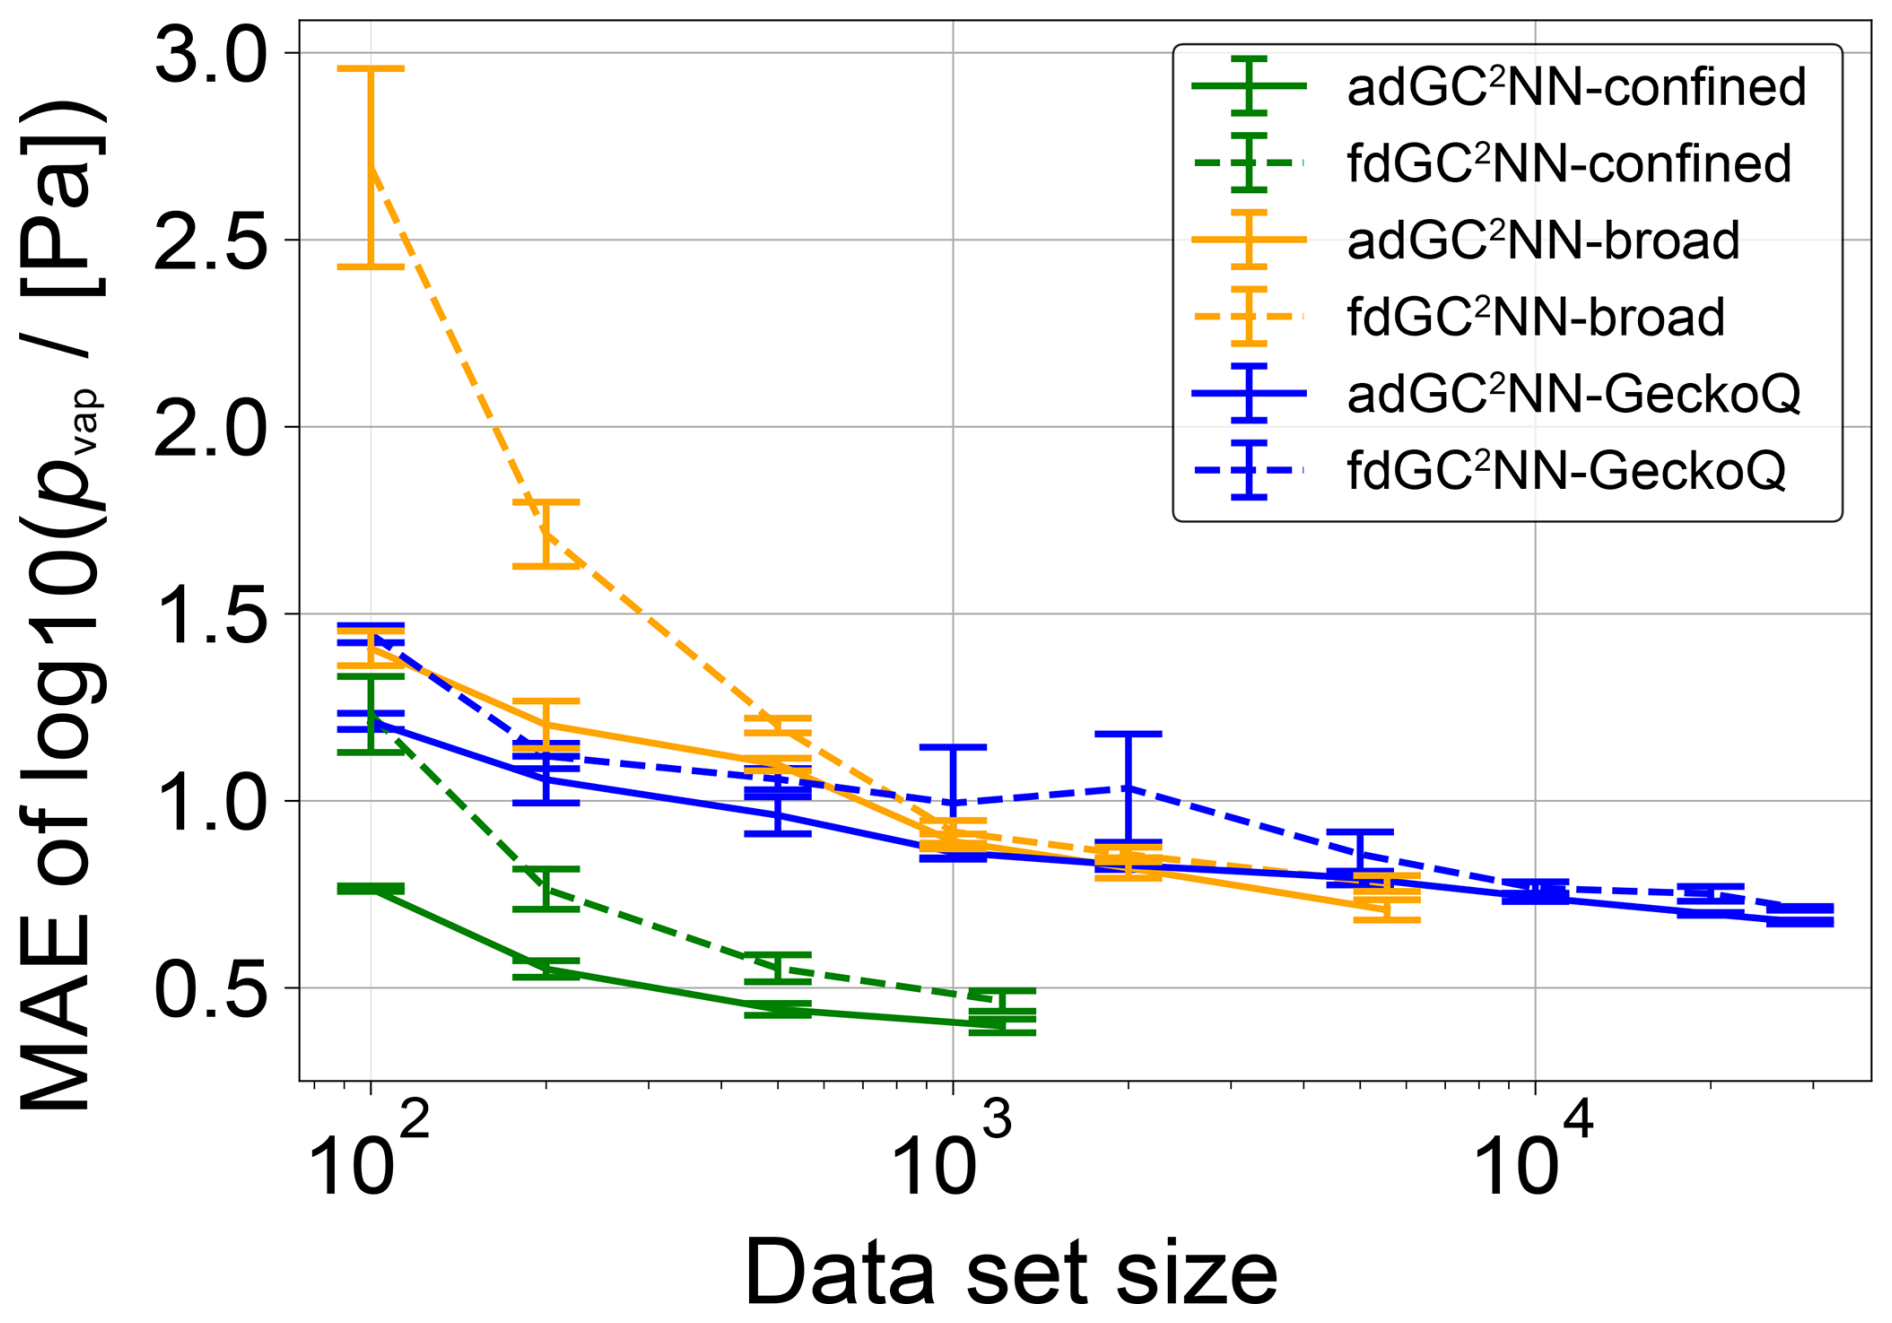
Figure 8Mean absolute error (MAE) for independent test sets (confined: n=134; broad: n=617; GeckoQ: n=3163), as a function of training data set size of adGC2NN and fdGC2NN models trained on subsets of the three data sets. The experiment is performed by sampling subsets of various size from each of the respective data sets and training adGC2NN and fdGC2NN models on these. Shown are the average test set log unit MAE of five cross-validation models in each subset. Error bars represent standard deviations across the cross-validation folds.
In addition to the adGC2NN and fdGC2NN models, we tested graph-only models without the additional input layer to obtain holistic molecular information (group-contribution component). These pure GCNN models are associated with significantly larger errors for nearly all data sets and sizes (Fig. S13), despite data set size-specific hyperparameter tuning. This can be attributed to graph convolutions which, in principle, are merely a succession of local operations on subgraphs. In other words, a pure graph convolutional neural network performs local operations on the input graph that are independent and unaware of operations and interpretations that occur in distant areas of the molecular graph. Deducting and learning holistic molecular information only from local convolutions on the graph structure is difficult, especially for the larger molecules. As each additional convolution layer increases the distance allowed for two nodes (and hence atoms) to influence each other, setting the number of graph convolution layers to the largest distance between two nodes in the data set would enable the model to derive information from each molecule as a whole. However, intramolecular interactions are usually not long ranged. Furthermore, this is detrimental for most model training because it would result in very deep neural networks which would likely over-fit on most data sets. Therefore, since the graph neural network training might not effectively capture whole-molecule properties, the lack of information on general molecular properties, like molar mass, inhibits the graph-only models to generalize between molecules of different size. We observe that the addition of molar mass as an input is crucial for the performance of GC2NN, while additional descriptors like element and functional group counts lead to further, but minor improvements.
Our findings suggest that group contribution-assisted graph convolutional neural networks (GC2NN) and graph representations of molecules are a promising approach for quantitative structure-activity relationship (QSAR) models. Despite the challenging scarcity of experimental data available for atmospherically relevant compounds, the GC2NN models surpass established methods, including parameterizations, group contribution methods, and machine learning (ML) approaches. Graph representations are a natural and unambiguous representation of molecular structures, encoding additional information related to individual atoms (graph nodes) or bonds (graph edges), and making spatial relations between molecular substructures directly interpretable by ML models suitable for graph processing. With that, graph representations are advantageous over molecular representations in which spatial information are lost or not easily retrievable, such as one-hot encoded (OHE) SMILES strings, which we used previously in conjunction with convolutional neural networks (CNN) for the determination of quinone redox potentials Krüger et al. (2022). In this study, OHE-CNN models performed worse than GC2NN models for every tested data set. Note, however, that we only performed a very basic tuning of the hyperparameters from the original study and correlation of the OHE-CNN model may improve with more extensive optimization.
We find that models that combine graph convolution with the direct interpretation of molecular properties like molar mass, element, and functional group occurrences outperform models that only process one of the two. The accuracy of graph-only GCNN models, without the additional input layer, falls behind pure group contribution models that process information on functional groups under consideration of known principles governing their effect on molecular properties. The provision of holistic information on the molecular structure, especially molar mass, is crucial for the performance of GC2NN models, as graph convolutions only process structural information locally. The difficulty in the application of graph convolutional neural networks is their dependence on the size of the input graphs. Therefore, specialized fdGC2NN models for narrow vapor pressure ranges achieved excellent results, given sufficient training data, in this study. Our adaptive-depth approach, however, enables the GC2NN to make use of the full training data, while matching the individual nodes' receptive fields with the compound size dynamically.
In general, the application of machine learning with few data is challenging, and learning curves suggest that additional data would significantly improve model accuracy for all compound ranges. We hypothesize that ML QSAR models may furthermore improve through prediction of multiple related molecular properties at a time. For instance, vapor pressure-predicting models may benefit from the simultaneous prediction of melting points or glass transition temperature, as the addition of such properties in the training data possibly makes physical principles more accessible by the model. Additional molecular parameters that are known to affect vapor pressure, such as polarity and representations of secondary intermolecular bonding, might also increase prediction performances with a similar architecture in the future. However, this may pose further restrictions on the training data available while highlighting how the application of machine learning methods in atmospheric chemistry is currently limited by the scarcity of comprehensive experimental data sets involving atmospheric compounds. The problem of data scarcity is very evident for compounds in the ELVOC range, which are comparably rare and underrepresented in our data set. This may be due to greater difficulties in the experimental determination of saturation vapor pressures of ELVOCs. To accurately extend QSAR models to the ELVOC range, possible strategies may include the utilization of quantum mechanical-derived data instead of experimental data, or potentially the application of more advanced machine learning models that include heuristic rules or physics-informed modules (Bilde et al., 2015), transfer learning to enable extrapolation outside of the training domain (Lansford et al., 2023) or pre-trained models that can be fine-tuned using small data sets (Burns et al., 2025). Our adaptive-depth model, however, achieved overall good results given relatively few training data, making the architecture a promising candidate for QSAR models addressing other molecular properties with relevance for atmospheric chemistry and physics, such as Henry's law solubility coefficients or reaction rate coefficients. Furthermore, the multiple component approach to QSAR modelling permits the utilization of far more advanced group contribution components alongside the graph convolution component. While the shallow neural networks in our study can indiscriminately be applied to various molecular descriptors and data sets, the utilization of advanced group contribution methods like SIMPOL or EVAPORATION alongside the graph convolution component, or the utilization of additional molecular descriptors may significantly increase model accuracy. In a similar fashion, QSAR models can likely be improved through integration of physics-informed models or hybrid quantum-mechanical/machine learning models (Zhang et al., 2018).
By using data sets of differing molecular complexity, a broad data set using most web-crawled data and a data set confined for atmospherically-relevant compounds, we find that the more specialized model can achieve a higher test set accuracy. In turn, while the models training on the broad data set have the largest error of all GC2NN models in this study, they are applicable to a large population of compounds with a diverse elemental composition and variety of functional groups, encompassing both organic and inorganic species. It is therefore recommended to train QSAR models that are specific to certain molecule scopes and applications. We also find that model accuracy significantly differs between models that are trained on subsets of the pvap range, and that models that are trained on smaller ranges can outperform more general models despite training data scarcity. In practice, an ensemble approach with multiple models, e.g., specifically for the low and high volatility range may be a viable approach for ML methods, similarly to the ensemble utilization of the Modified Grain, Antoine and Mackay methods (EPI, 2024; Li et al., 2016). Further improvements may be achievable through data curation techniques, as common outliers between various methods indicate data points with large experimental uncertainty.
The data sets (broad and confined) as well as the associated trained models are published along with this study. The compiled experimental vapor pressure data can be used for future benchmarking or training of vapor pressure estimation methods. Furthermore, our trained adGC2NN models can be downloaded as easy-to-use executables, enabling researchers in various fields to obtain accurate vapor pressure predictions for their research, e.g., in the fields of SOA modeling or climate simulations. To run the models, no knowledge on machine learning or programming is required.
The data and source code, as well as a model executable, are openly available at https://doi.org/10.17617/3.GIKHJL (Krüger and Berkemeier, 2025).
The supplement related to this article is available online at https://doi.org/10.5194/gmd-18-7357-2025-supplement.
MS and TG conceived the study. All authors designed research. MK and TG wrote the code and performed model simulations. All authors discussed and interpreted calculation results. MK and TB wrote the manuscript with contributions from all authors.
The contact author has declared that none of the authors has any competing interests.
Publisher’s note: Copernicus Publications remains neutral with regard to jurisdictional claims made in the text, published maps, institutional affiliations, or any other geographical representation in this paper. While Copernicus Publications makes every effort to include appropriate place names, the final responsibility lies with the authors. Also, please note that this paper has not received English language copy-editing. Views expressed in the text are those of the authors and do not necessarily reflect the views of the publisher.
We thank Steven Compernolle for providing the list of molecules contained in EVAPORATION training data in machine-readable format. We thank Nadin Ulrich for helpful discussions.
This work was funded by the U.S. Department of Energy (grant no. DE-SC0022139), the U.S. National Science Foundation (grant no. AGS-2246502) and the Max Planck Society (MPG). Matteo Krüger is supported by the Max Planck Graduate Center with the Johannes Gutenberg University Mainz (MPGC).
The article processing charges for this open-access publication were covered by the Max Planck Society.
This paper was edited by Jason Williams and reviewed by Patrick Rinke and one anonymous referee.
Akiba, T., Sano, S., Yanase, T., Ohta, T., and Koyama, M.: Optuna: A Next-generation Hyperparameter Optimization Framework, in: Proceedings of the 25th ACM SIGKDD International Conference on Knowledge Discovery & Data Mining, ACM, Anchorage AK USA, 2623–2631, ISBN 978-1-4503-6201-6, https://doi.org/10.1145/3292500.3330701, 2019. a
Armeli, G., Peters, J.-H., and Koop, T.: Machine-Learning-Based Prediction of the Glass Transition Temperature of Organic Compounds Using Experimental Data, ACS Omega, 8, 12298–12309, https://doi.org/10.1021/acsomega.2c08146, 2023. a, b
Atz, K., Grisoni, F., and Schneider, G.: Geometric deep learning on molecular representations, Nat. Mach. Intell., 3, 1023–1032, https://doi.org/10.1038/s42256-021-00418-8, 2021. a
Aumont, B., Szopa, S., and Madronich, S.: Modelling the evolution of organic carbon during its gas-phase tropospheric oxidation: development of an explicit model based on a self generating approach, Atmos. Chem. Phys., 5, 2497–2517, https://doi.org/10.5194/acp-5-2497-2005, 2005. a
Battaglia, P. W., Hamrick, J. B., Bapst, V., Sanchez-Gonzalez, A., Zambaldi, V., Malinowski, M., Tacchetti, A., Raposo, D., Santoro, A., Faulkner, R., Gulcehre, C., Song, F., Ballard, A., Gilmer, J., Dahl, G., Vaswani, A., Allen, K., Nash, C., Langston, V., Dyer, C., Heess, N., Wierstra, D., Kohli, P., Botvinick, M., Vinyals, O., Li, Y., and Pascanu, R.: Relational inductive biases, deep learning, and graph networks, arXiv [preprint], https://doi.org/10.48550/ARXIV.1806.01261, 2018. a
Besel, V., Todorović, M., Kurtén, T., Rinke, P., and Vehkamäki, H.: Atomic structures, conformers and thermodynamic properties of 32k atmospheric molecules, Sci. Data, 10, 450, https://doi.org/10.1038/s41597-023-02366-x, 2023. a, b, c, d, e, f
Besel, V., Todorović, M., Kurtén, T., Vehkamäki, H., and Rinke, P.: The search for sparse data in molecular datasets: Application of active learning to identify extremely low volatile organic compounds, J. Aerosol Sci., 179, 106375, https://doi.org/10.1016/j.jaerosci.2024.106375, 2024. a, b
Bilde, M., Barsanti, K., Booth, M., Cappa, C. D., Donahue, N. M., Emanuelsson, E. U., McFiggans, G., Krieger, U. K., Marcolli, C., Topping, D., Ziemann, P., Barley, M., Clegg, S., Dennis-Smither, B., Hallquist, M., Hallquist, A. M., Khlystov, A., Kulmala, M., Mogensen, D., Percival, C. J., Pope, F., Reid, J. P., Ribeiro da Silva, M. A. V., Rosenoern, T., Salo, K., Soonsin, V. P., Yli-Juuti, T., Prisle, N. L., Pagels, J., Rarey, J., Zardini, A. A., and Riipinen, I.: Saturation Vapor Pressures and Transition Enthalpies of Low-Volatility Organic Molecules of Atmospheric Relevance: From Dicarboxylic Acids to Complex Mixtures, Chem. Rev., 115, 4115–4156, https://doi.org/10.1021/cr5005502, 2015. a, b, c
Bronstein, M. M., Bruna, J., LeCun, Y., Szlam, A., and Vandergheynst, P.: Geometric Deep Learning: Going beyond Euclidean data, IEEE Signal Process. Mag., 34, 18–42, https://doi.org/10.1109/MSP.2017.2693418, 2017. a
Burns, J., Zalte, A., and Green, W.: Descriptor-based Foundation Models for Molecular Property Prediction, arXiv [preprint], https://doi.org/10.48550/ARXIV.2506.15792, 2025. a, b
Compernolle, S., Ceulemans, K., and Müller, J.-F.: EVAPORATION: a new vapour pressure estimation methodfor organic molecules including non-additivity and intramolecular interactions, Atmos. Chem. Phys., 11, 9431–9450, https://doi.org/10.5194/acp-11-9431-2011, 2011. a, b, c, d, e
Donahue, N. M., Robinson, A. L., and Pandis, S. N.: Atmospheric organic particulate matter: From smoke to secondary organic aerosol, Atmos. Environ., 43, 94–106, https://doi.org/10.1016/j.atmosenv.2008.09.055, 2009. a, b, c
Donahue, N. M., Epstein, S. A., Pandis, S. N., and Robinson, A. L.: A two-dimensional volatility basis set: 1. organic-aerosol mixing thermodynamics, Atmos. Chem. Phys., 11, 3303–3318, https://doi.org/10.5194/acp-11-3303-2011, 2011. a, b, c, d, e, f, g
Duvenaud, D., Maclaurin, D., Aguilera-Iparraguirre, J., Gómez-Bombarelli, R., Hirzel, T., Aspuru-Guzik, A., and Adams, R. P.: Convolutional Networks on Graphs for Learning Molecular Fingerprints, arXiv [preprint], https://doi.org/10.48550/arXiv.1509.09292, 2015. a
EPI: EPI Suite™-Estimation Program Interface, https://www.epa.gov/tsca-screening-tools/epi-suitetm-estimation-program-interface, last access: 13 October 2024. a, b, c, d, e
Gadaleta, D., Lombardo, A., Toma, C., and Benfenati, E.: A new semi-automated workflow for chemical data retrieval and quality checking for modeling applications, J. Cheminform., 10, 60, https://doi.org/10.1186/s13321-018-0315-6, 2018. a
Galeazzo, T. and Shiraiwa, M.: Predicting glass transition temperature and melting point of organic compounds via machine learning and molecular embeddings, Environ. Sci. Atmos., 2, 362–374, https://doi.org/10.1039/D1EA00090J, 2022. a, b
Gani, R.: Group contribution-based property estimation methods: advances and perspectives, Curr. Opin. Chem. Eng., 23, 184–196, https://doi.org/10.1016/j.coche.2019.04.007, 2019. a
Geerlings, P., De Proft, F., and Langenaeker, W.: Conceptual Density Functional Theory, Chem. Rev., 103, 1793–1874, https://doi.org/10.1021/cr990029p, 2003. a
Goldstein, A. H. and Galbally, I. E.: Known and unexplored organic constituents in the earth's atmosphere, Environ. Sci. Technol., 41, 1514–1521, 2007. a
Huisman, A. J., Krieger, U. K., Zuend, A., Marcolli, C., and Peter, T.: Vapor pressures of substituted polycarboxylic acids are much lower than previously reported, Atmos. Chem. Phys., 13, 6647–6662, https://doi.org/10.5194/acp-13-6647-2013, 2013. a
Hyttinen, N., Pullinen, I., Nissinen, A., Schobesberger, S., Virtanen, A., and Yli-Juuti, T.: Comparison of saturation vapor pressures of α-pinene + O3 oxidation products derived from COSMO-RS computations and thermal desorption experiments, Atmos. Chem. Phys., 22, 1195–1208, https://doi.org/10.5194/acp-22-1195-2022, 2022. a
Intergovernmental Panel on Climate Change: Climate Change 2021 – The Physical Science Basis: Working Group I Contribution to the Sixth Assessment Report of the Intergovernmental Panel on Climate Change, 1 edn., Cambridge University Press, ISBN 978-1-00-915789-6, https://doi.org/10.1017/9781009157896, 2023. a
Isaacman-VanWertz, G. and Aumont, B.: Impact of organic molecular structure on the estimation of atmospherically relevant physicochemical parameters, Atmos. Chem. Phys., 21, 6541–6563, https://doi.org/10.5194/acp-21-6541-2021, 2021. a, b
Jimenez, J. L., Canagaratna, M. R., Donahue, N. M., Prevot, A. S. H., Zhang, Q., Kroll, J. H., DeCarlo, P. F., Allan, J. D., Coe, H., Ng, N. L., Aiken, A. C., Docherty, K. S., Ulbrich, I. M., Grieshop, A. P., Robinson, A. L., Duplissy, J., Smith, J. D., Wilson, K. R., Lanz, V. A., Hueglin, C., Sun, Y. L., Tian, J., Laaksonen, A., Raatikainen, T., Rautiainen, J., Vaattovaara, P., Ehn, M., Kulmala, M., Tomlinson, J. M., Collins, D. R., Cubison, M. J., E., Dunlea, J., Huffman, J. A., Onasch, T. B., Alfarra, M. R., Williams, P. I., Bower, K., Kondo, Y., Schneider, J., Drewnick, F., Borrmann, S., Weimer, S., Demerjian, K., Salcedo, D., Cottrell, L., Griffin, R., Takami, A., Miyoshi, T., Hatakeyama, S., Shimono, A., Sun, J. Y., Zhang, Y. M., Dzepina, K., Kimmel, J. R., Sueper, D., Jayne, J. T., Herndon, S. C., Trimborn, A. M., Williams, L. R., Wood, E. C., Middlebrook, A. M., Kolb, C. E., Baltensperger, U., and Worsnop, D. R.: Evolution of Organic Aerosols in the Atmosphere, Science, 326, 1525–1529, https://doi.org/10.1126/science.1180353, 2009. a
Kanakidou, M., Seinfeld, J. H., Pandis, S. N., Barnes, I., Dentener, F. J., Facchini, M. C., Van Dingenen, R., Ervens, B., Nenes, A., Nielsen, C. J., Swietlicki, E., Putaud, J. P., Balkanski, Y., Fuzzi, S., Horth, J., Moortgat, G. K., Winterhalter, R., Myhre, C. E. L., Tsigaridis, K., Vignati, E., Stephanou, E. G., and Wilson, J.: Organic aerosol and global climate modelling: a review, Atmos. Chem. Phys., 5, 1053–1123, https://doi.org/10.5194/acp-5-1053-2005, 2005. a
Kim, S., Thiessen, P. A., Bolton, E. E., Chen, J., Fu, G., Gindulyte, A., Han, L., He, J., He, S., Shoemaker, B. A., Wang, J., Yu, B., Zhang, J., and Bryant, S. H.: PubChem substance and compound databases, Nucleic Acids Research, 44, D1202–D1213, https://doi.org/10.1093/nar/gkv951, 2016. a
Kipf, T. N. and Welling, M.: Semi-Supervised Classification with Graph Convolutional Networks, arXiv [preprint], https://doi.org/10.48550/arXiv.1609.02907, 2017. a, b
Kirkby, J., Amorim, A., Baltensperger, U., Carslaw, K. S., Christoudias, T., Curtius, J., Donahue, N. M., Haddad, I. E., Flagan, R. C., Gordon, H., Hansel, A., Harder, H., Junninen, H., Kulmala, M., Kürten, A., Laaksonen, A., Lehtipalo, K., Lelieveld, J., Möhler, O., Riipinen, I., Stratmann, F., Tomé, A., Virtanen, A., Volkamer, R., Winkler, P. M., and Worsnop, D. R.: Atmospheric new particle formation from the CERN CLOUD experiment, Nat. Geosci., 16, 948–957, https://doi.org/10.1038/s41561-023-01305-0, 2023. a
Krüger, M. and Berkemeier T.: Code and data for `Improved vapor pressure predictions using group contribution-assisted graph convolutional neural networks (GC2NN)', Edmond, V2 [code and data], https://doi.org/10.17617/3.GIKHJL, 2025. a
Krüger, M., Wilson, J., Wietzoreck, M., Bandowe, B. A. M., Lammel, G., Schmidt, B., Pöschl, U., and Berkemeier, T.: Convolutional neural network prediction of molecular properties for aerosol chemistry and health effects, Nat. Sci., 2, e20220016, https://doi.org/10.1002/ntls.20220016, 2022. a, b, c, d, e, f, g, h, i, j
Kulmala, M. and Kerminen, V.-M.: On the formation and growth of atmospheric nanoparticles, Atmos. Res., 90, 132–150, https://doi.org/10.1016/j.atmosres.2008.01.005, 2008. a
Kurtén, T., Hyttinen, N., D'Ambro, E. L., Thornton, J., and Prisle, N. L.: Estimating the saturation vapor pressures of isoprene oxidation products C5H12O6 and C5H10O6 using COSMO-RS, Atmos. Chem. Phys., 18, 17589–17600, https://doi.org/10.5194/acp-18-17589-2018, 2018. a
Landrum, G.: RDKit: Open-source cheminformatics, Release, 1, 4, https://www.rdkit.org (last access: 1 October 2025), 2013. a
Lansford, J. L., Jensen, K. F., and Barnes, B. C.: Physics‐informed Transfer Learning for Out‐of‐sample Vapor Pressure Predictions, Propellants Explos. Pyrotech., 48, e202200265, https://doi.org/10.1002/prep.202200265, 2023. a
Li, Y., Pöschl, U., and Shiraiwa, M.: Molecular corridors and parameterizations of volatility in the chemical evolution of organic aerosols, Atmos. Chem. Phys., 16, 3327–3344, https://doi.org/10.5194/acp-16-3327-2016, 2016. a, b, c, d, e, f, g, h
Longnecker, E. R., Bakker-Arkema, J. G., and Ziemann, P. J.: Comparison of Vapor Pressure Estimation Methods Used to Model Secondary Organic Aerosol Formation from Reactions of Linear and Branched Alkenes with OH/NOx, ACS Earth Space Chem., https://doi.org/10.1021/acsearthspacechem.4c00285, 2025. a
Lumiaro, E., Todorović, M., Kurten, T., Vehkamäki, H., and Rinke, P.: Predicting gas–particle partitioning coefficients of atmospheric molecules with machine learning, Atmos. Chem. Phys., 21, 13227–13246, https://doi.org/10.5194/acp-21-13227-2021, 2021. a, b, c
Moller, B., Rarey, J., and Ramjugernath, D.: Estimation of the vapour pressure of non-electrolyte organic compounds via group contributions and group interactions, J. Mol. Liq., 143, 52–63, https://doi.org/10.1016/j.molliq.2008.04.020, 2008. a
Naef, R. and Acree, W. E.: Calculation of the Vapour Pressure of Organic Molecules by Means of a Group-Additivity Method and Their Resultant Gibbs Free Energy and Entropy of Vaporization at 298.15 K, Molecules [data], 26, 1045, https://doi.org/10.3390/molecules26041045, 2021. a
Nannoolal, Y., Rarey, J., Ramjugernath, D., and Cordes, W.: Estimation of pure component properties, Fluid Phase Equilibria, 226, 45–63, https://doi.org/10.1016/j.fluid.2004.09.001, 2004. a
Pankow, J. F.: Review and comparative analysis of the theories on partitioning between the gas and aerosol particulate phases in the atmosphere, Atmos. Environ. (1967), 21, 2275–2283, https://doi.org/10.1016/0004-6981(87)90363-5, 1987. a
Pankow, J. F. and Asher, W. E.: SIMPOL.1: a simple group contribution method for predicting vapor pressures and enthalpies of vaporization of multifunctional organic compounds, Atmos. Chem. Phys., 8, 2773–2796, https://doi.org/10.5194/acp-8-2773-2008, 2008. a, b, c, d
Paszke, A., Gross, S., Massa, F., Lerer, A., Bradbury, J., Chanan, G., Killeen, T., Lin, Z., Gimelshein, N., Antiga, L., Desmaison, A., Kopf, A., Yang, E., DeVito, Z., Raison, M., Tejani, A., Chilamkurthy, S., Steiner, B., Fang, L., Bai, J., Chintala, S.: Pytorch: An imperative style, high-performance deep learning library, Adv. Neural Inf. Process. Syst., 32, https://doi.org/10.48550/arXiv.1912.01703, 2019. a
Pöschl, U. and Shiraiwa, M.: Multiphase Chemistry at the Atmosphere–Biosphere Interface Influencing Climate and Public Health in the Anthropocene, Chem. Rev., 115, 4440–4475, https://doi.org/10.1021/cr500487s, 2015. a
Ratcliff, L. E., Mohr, S., Huhs, G., Deutsch, T., Masella, M., and Genovese, L.: Challenges in large scale quantum mechanical calculations, WIREs Comput. Mol. Sci., 7, e1290, https://doi.org/10.1002/wcms.1290, 2017. a
Reiser, P., Neubert, M., Eberhard, A., Torresi, L., Zhou, C., Shao, C., Metni, H., van Hoesel, C., Schopmans, H., Sommer, T., and Friederich, P.: Graph neural networks for materials science and chemistry, Commun. Mater., 3, 241722, https://doi.org/10.1038/s43246-022-00315-6, 2022. a
Sanchez-Lengeling, B., Wei, J., Lee, B., Reif, E., Wang, P., Qian, W., McCloskey, K., Colwell, L., and Wiltschko, A.: Evaluating Attribution for Graph Neural Networks, in: Adv. Neural Inf. Process. Syst., edited by: Larochelle, H., Ranzato, M., Hadsell, R., Balcan, M. F., and Lin, H., vol. 33, Curran Associates, Inc., 5898–5910, https://proceedings.neurips.cc/paper_files/paper/2020/file/417fbbf2e9d5a28a855a11894b2e795a-Paper.pdf (last access: 1 October 2025), 2020. a
Shiraiwa, M., Berkemeier, T., Schilling-Fahnestock, K. A., Seinfeld, J. H., and Pöschl, U.: Molecular corridors and kinetic regimes in the multiphase chemical evolution of secondary organic aerosol, Atmos. Chem. Phys., 14, 8323–8341, https://doi.org/10.5194/acp-14-8323-2014, 2014. a, b, c, d, e, f, g
Shrivastava, M., Cappa, C. D., Fan, J., Goldstein, A. H., Guenther, A. B., Jimenez, J. L., Kuang, C., Laskin, A., Martin, S. T., Ng, N. L., Petaja, T., Pierce, J. R., Rasch, P. J., Roldin, P., Seinfeld, J. H., Shilling, J., Smith, J. N., Thornton, J. A., Volkamer, R., Wang, J., Worsnop, D. R., Zaveri, R. A., Zelenyuk, A., and Zhang, Q.: Recent advances in understanding secondary organic aerosol: Implications for global climate forcing, Rev. Geophys., 55, 509–559, https://doi.org/10.1002/2016RG000540, 2017. a
Tabor, D. P., Gómez-Bombarelli, R., Tong, L., Gordon, R. G., Aziz, M. J., and Aspuru-Guzik, A.: Mapping the frontiers of quinone stability in aqueous media: implications for organic aqueous redox flow batteries, J. Mater. Chem. A, 7, 12833–12841, https://doi.org/10.1039/C9TA03219C, 2019. a
Tahami, S., Movagharnejad, K., and Ghasemitabar, H.: Estimation of the critical constants of organic compounds via a new group contribution method, Fluid Ph. Equilibria, 494, 45–60, https://doi.org/10.1016/j.fluid.2019.04.022, 2019. a
Tang, B., Kramer, S. T., Fang, M., Qiu, Y., Wu, Z., and Xu, D.: A self-attention based message passing neural network for predicting molecular lipophilicity and aqueous solubility, J. Cheminformatics, 12, 1–9, 2020. a
Ulrich, N., Goss, K.-U., and Ebert, A.: Exploring the octanol–water partition coefficient dataset using deep learning techniques and data augmentation, Commun. Chem., 4, 90, https://doi.org/10.1038/s42004-021-00528-9, 2021. a
Veličković, P., Cucurull, G., Casanova, A., Romero, A., Liò, P., and Bengio, Y.: Graph Attention Networks, arXiv [preprint], https://doi.org/10.48550/arxiv.1710.10903, 2017. a
von Lilienfeld, O. A. and Burke, K.: Retrospective on a decade of machine learning for chemical discovery, Nat. Commun., 11, https://doi.org/10.1038/s41467-020-18556-9, 2020. a, b
Wang, C., Yuan, T., Wood, S. A., Goss, K.-U., Li, J., Ying, Q., and Wania, F.: Uncertain Henry's law constants compromise equilibrium partitioning calculations of atmospheric oxidation products, Atmos. Chem. Phys., 17, 7529–7540, https://doi.org/10.5194/acp-17-7529-2017, 2017. a, b
Withnall, M., Lindelöf, E., Engkvist, O., and Chen, H.: Building attention and edge message passing neural networks for bioactivity and physical–chemical property prediction, J. Cheminformatics, 12, https://doi.org/10.1186/s13321-019-0407-y, 2020. a
Xiong, G., Wu, Z., Yi, J., Fu, L., Yang, Z., Hsieh, C., Yin, M., Zeng, X., Wu, C., Lu, A., Chen, X., Hou, T., and Cao, D.: ADMETlab 2.0: an integrated online platform for accurate and comprehensive predictions of ADMET properties, Nucleic Acids Research, 49, W5–W14, https://doi.org/10.1093/nar/gkab255, 2021. a
Zhang, S., Tong, H., Xu, J., and Maciejewski, R.: Graph convolutional networks: a comprehensive review, Comput. Soc. Netw., 6, 11, https://doi.org/10.1186/s40649-019-0069-y, 2019. a
Zhang, Y.-J., Khorshidi, A., Kastlunger, G., and Peterson, A. A.: The potential for machine learning in hybrid QM/MM calculations, J. Chem. Phys., 148, 241740, https://doi.org/10.1063/1.5029879, 2018. a