the Creative Commons Attribution 4.0 License.
the Creative Commons Attribution 4.0 License.
 | 15 Oct 2025
A first calibration of JULES-crop version 7.4 for rice using the novel O3-FACE experiment in China
Beiyao Xu
Steven Dobbie
Huiyi Yang
Lianxin Yang
Yu Jiang
Andrew Challinor
Karina Williams
Yunxia Wang
Tijian Wang
Ozone (O3) pollution poses an escalating threat to rice production and food security in China, with concentrations projected to rise under future climate scenarios. Accurately quantifying O3 impacts on rice is thus crucial for informed agricultural planning. This study is the first to utilise free-air concentration enrichment (FACE) observations specific to rice for calibrating a crop model (Joint UK Land Environment Simulator with crops, JULES-crop) and assessing the impacts of O3. FACE experiments, which involve growing crops under natural field conditions while exposing them to elevated O3 levels, provide an ideal approach for studying the effects of O3 on crops. Utilising data from the only O3-FACE facility dedicated to rice, we calibrated physiological and O3-response parameters in JULES-crop and evaluated the model against additional independent FACE observations. The calibration establishes this as the first crop model refined with ideal open-air field observations, significantly enhancing its capability to simulate rice growth processes and O3-induced yield losses and surpassing the performance of simulations based on the default parameters in JULES-crop. With this newly calibrated model, JULES-crop is now equipped to assess the impacts of O3 on agriculture, offering a valuable tool to inform mitigation strategies.
- Article
(3839 KB) - Full-text XML
-
Supplement
(516 KB) - BibTeX
- EndNote


Rice is a staple food for over half of the world's population and plays a crucial role in global food security. The rising concentration of ozone (O3) is a major concern, contributing to significant losses in crop production worldwide (Van Dingenen et al., 2009). Mills et al. (2018) estimated that the average global yield loss of rice due to O3 was 4.4 % between 2010 and 2012. In China, O3 caused relative rice yield losses of 6.2 %–52.9 % between 2014 and 2018 and of 23 % between 2017 and 2019 (Feng et al., 2022; Xu et al., 2021). Consequently, assessing the impact of O3 on rice growth is essential, especially as O3-polluted areas overlap with crop-growing regions and pose a long-term threat to food security (Emberson et al., 2018).
The main O3 dose-response functions used to assess rice yield loss include concentration-based methods, such as the accumulated dose of O3 over 40 ppb (AOT40) and the daily mean 7 h concentrations (M7), and flux-based methods, such as the phytotoxic O3 dose (POD) (Tai et al., 2021). Both concentration-based and flux-based methods can establish a relationship with relative yield loss based on field experiments. The relationship between relative yield loss and O3 level, known as the O3 response function, is a valuable tool that underpins extensive research into crop yield losses caused by O3 exposure (Ramya et al., 2023).
Some crop models have incorporated O3 parameters to better understand O3's impacts (Guarin et al., 2024; Leung et al., 2020; Ewert and Porter, 2000). For instance, the Decision Support System for Agrotechnology Transfer (DSSAT) crop model established an O3 stress factor using the M7 metric (Guarin et al., 2024). GLAM-ROC simulated O3 effects by reducing evapotranspiration, transpiration efficiency, and the harvest index based on AOT40 metric (Droutsas et al., 2020). The Joint UK Land Environment Simulator with crops (JULES-crop) integrated a flux-based O3 damage scheme developed by Sitch et al. (2007) to assess reductions in net photosynthesis. Flux-based methods account for stomatal conductance and environmental conditions, such as temperature and the vapour pressure deficit, to modify O3 uptake and thus directly link the absorbed O3 dose to physiological damage. Compared with concentration-based methods, flux-based methods exhibit enhanced performance in correlating O3 levels with relative yield loss, enabling more precise assessments (Pleijel et al., 2004, 2022; Mills et al., 2011; Ronan et al., 2020). Nonetheless, O3-related parameters in crop models require calibration to ensure reliable performance, even when using a flux-based O3 scheme.
Open-top chambers (OTCs) and free-air concentration enrichment (FACE) experiments are two major methods used to help calibrate parameters in crop models. State-of-the-art FACE experiments, which provide more natural environments for crops, are ideal for establishing O3 exposure metrics and investigating the impacts of O3 on crops (Montes et al., 2022; Feng et al., 2018). To date, only four O3-FACE facilities have been established for crops worldwide (Montes et al., 2022): wheat and rice experiments in China (Tang et al., 2011), wheat experiments in India (Yadav et al., 2019), grape experiments in Italy (Moura et al., 2023), and soybean experiments in the United States (Aspray et al., 2023). However, the rice-specific O3-FACE experiment has not yet been used to calibrate any crop models.
The parameterisation of crops in JULES was developed by Osborne et al. (2015). JULES-crop incorporates flux-based O3 exposure metrics to analyse the loss of accumulated carbon based on the exact O3 flux entering the crop stomata, which is influenced by environmental conditions (Sitch et al., 2007). The impact of O3 on crops is also reflected in reductions in crop height, leaf area index (LAI), and crop yields. Additionally, Tai et al. (2021) highlighted that mechanistic crop models such as JULES-crop can combine the fertilisation effects of atmospheric carbon dioxide (CO2) with O3 influence. Thus, JULES-crop is a suitable tool for investigating the effects of O3 on crops, accounting for environmental factors that modify the mechanisms of O3 effects (Leung et al., 2022). However, the crop growth and development parameters for rice, as well as the O3 impact parameters within JULES-crop, have not yet been calibrated. Calibrating JULES-crop would enhance its performance in simulating rice production under O3 influence.
In this research, we calibrated the rice parameters in JULES-crop using novel O3-FACE data, enabling leading-edge future assessments of O3 damage to rice. The study has three key objectives: (1) to calibrate JULES-crop using novel O3-FACE field data; (2) to evaluate the model's performance in capturing crop growth characteristics using independent observations; and (3) to assess the impact of O3 on rice physiology, phenology, and yields. This research enhances understanding of the mechanisms through which O3 affects rice growth and development, providing a stronger basis for characterising the future impact of O3 on rice production.
2.1 Description of JULES-crop
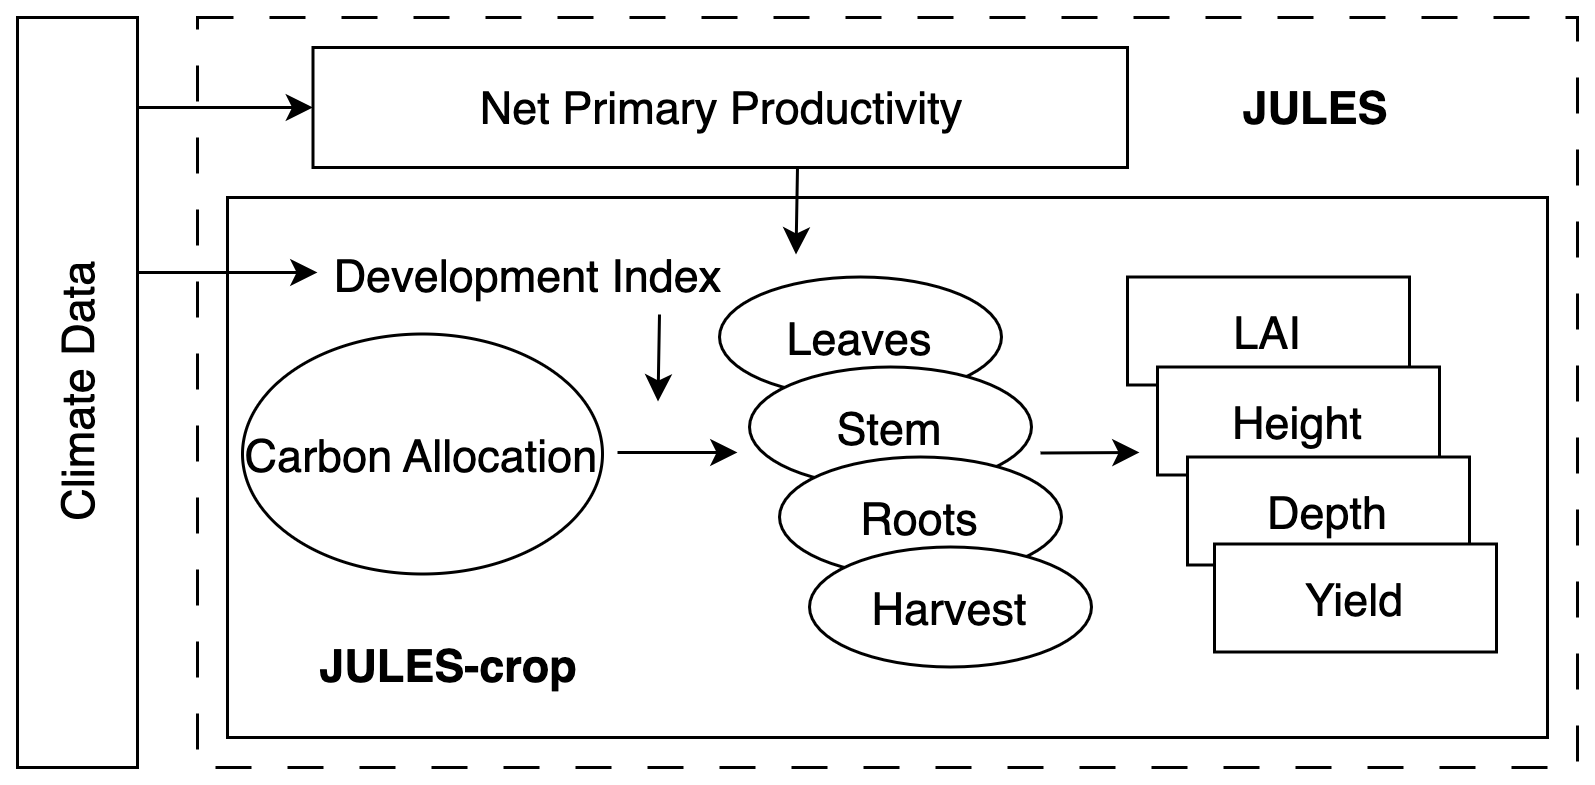
JULES-crop is an extension of JULES, a land surface model designed to simulate the fluxes of carbon, water, energy, and momentum between the land surface and the atmosphere (Best et al., 2011; Clark et al., 2011). JULES-crop was developed to simulate the growth and development of major crops, including wheat, soybean, maize, and rice, under a range of environmental influences such as temperature, precipitation, radiation, and soil moisture (Osborne et al., 2015). Its structure, illustrated in Fig. 1, incorporates the physiological processes of crops, including photosynthesis, respiration, and biomass accumulation.
JULES-crop simulates the physiological and phenological processes of crops, predicting yields at both field and global scales. This capability makes it a valuable tool for understanding the impacts of climate change and air pollution on agriculture (Leung et al., 2022; Wolffe et al., 2021; Vianna et al., 2022). To date, winter wheat (in preparation), maize (Williams et al., 2017), and soybean (Leung et al., 2020) within JULES-crop have been calibrated using observational data. Mathison et al. (2021) updated several rice and wheat parameters in JULES-crop, relying primarily on the literature, but did not account for O3 effects. In this study, novel O3-FACE experimental data were utilised to calibrate rice parameters in JULES-crop for the first time, improving its ability to assess O3 impacts on rice growth.
JULES-crop utilises a flux-based approach to simulate the O3 damage following Sitch et al. (2007). It assumes that the potential net photosynthesis Ap is suppressed by O3:
Here A is leaf-level net photosynthesis with the O3 effects and F is the reduction factor:
where represents instantaneous leaf uptake of O3. and a are the plant-functional-type-specific threshold and sensitivity factor, respectively.
The O3 flux () is calculated as
Here [O3] (nmol m−3) is the molar O3 concentration at the reference level, ra (s m−1) is the aerodynamic resistance and the boundary layer resistance between the leaf surface and reference level (Monin and Obukhov, 1954), is the ratio of leaf conductance for O3 to leaf conductance for water vapour (1.67), and gl represents the leaf conductance for H2O as a linear function of the photosynthetic rate (Cox et al., 1999):
where is the leaf conductance in the absence of O3 effects.
2.2 O3-FACE experiments
The O3-FACE experiment was conducted in Xiaoji, China ( N, E), in 2012. It features four regular octagonal O3-FACE fields (14 m in diameter) and four control fields, each covering an area of approximately 120 m2. The experimental fields are spaced over 70 m apart to minimise the influence of O3 release on neighbouring fields. Pipes positioned 50–60 cm above the crops released pure O3 gas into each O3-FACE field between 09:00 and 16:00 LT during the rice growing period. The mean daytime O3 concentration during the experimental period was approximately 46 ppb under the elevated O3 treatment, compared to 37 ppb in the ambient environment – an increase of around 25 %. The environmental conditions in the O3-FACE and control fields were identical, except for the presence of O3 pipes in the O3-FACE fields. Samples from the O3-FACE fields were collected from the field centre, at least 1.5 m away from the O3 pipes, to ensure that the sampled rice had grown under stable O3 conditions. Further details of the O3-FACE system can be found in Wang et al. (2012).
The rice cultivar used was II You 084. The rice was planted on 30 May 2012 and reached maturity on 19 October 2012 in the ambient O3 environment and 12 October 2012 in the elevated O3 environment. During the growth period, key developmental stages, such as jointing and flowering, were recorded, and crop growth characteristics – including the dry biomass of leaves, stems, and panicles; LAI; and plant height – were measured at these stages to calibrate the model.
Three planting densities were employed during transplantation: low density (16 plants m−2), medium density (24 plants m−2), and high density (32 plants m−2). In addition to standard growth measurements, photosynthesis-related variables – including leaf temperature, internal leaf CO2 concentration, stomatal conductance, and the photosynthesis rate (CO2 assimilation rate) – were assessed using a LI-6400 portable photosynthesis system. After the rice reached maturity, 64 plants from each experimental field were harvested and dried to calculate the average rice yields.
2.3 FACE experiment for JULES-crop evaluation
Following calibration, observations of rice yields; height; and the dry weight of leaves, stems, and panicles from an independent FACE experiment were then used to evaluate the performance of JULES-crop. These additional field experiments were conducted in Danyang, China ( N, E), and provided rice data for the 2022 and 2023 growing seasons. Two cultivars, Yangdao 6 and Wuyungeng 23, were transplanted on 20 July 2022 and 21 July 2023, respectively, and harvested between late October and early November. Yangdao 6 is an Indica rice cultivar, while Wuyungeng 23 belongs to the Japonica subspecies group, both of which represent the two major rice subspecies cultivated in China.
2.4 Data preparation
JULES-crop requires driving data, ancillary data, and control files to configure the model. Observations of hourly air pressure, specific humidity, air temperature, precipitation, wind speed, and shortwave radiation (SW) recorded during the O3-FACE experiments were used as driving data. Diffuse radiation was calculated using a constant diffuse fraction in the model, with the default value of 0.4 applied in this study due to the absence of observational data. Surface downward longwave radiation (LW) was not measured in the O3-FACE experiment and was instead estimated using an empirical model based on local observations (Chang and Zhang, 2019):
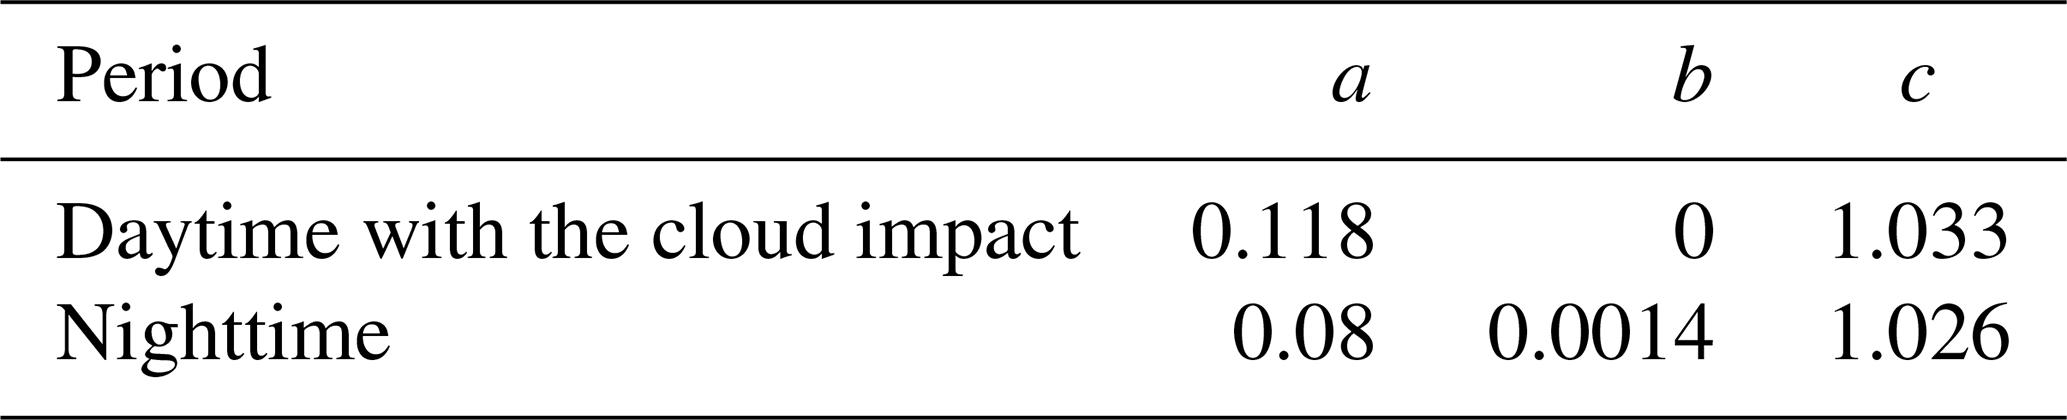
Here R↓ is the downward LW under all kinds of sky conditions (clear and cloudy), Ta is the air temperature; ea is the water vapour pressure; φ is the relative humidity; σ is the Stefan–Boltzmann constant; a, b, and c are the empirical coefficients (Table 1); and clf is the cloud modification factor, set to 0 under clear-sky conditions:
Here Kt is the clearness index, which was calculated as follows:
where Hm represents the hourly measured solar radiation and H0 denotes the hourly extraterrestrial solar radiation. Detailed calculation for H0 can be found in Kumar and Umanand (2005).
Table 1Empirical coefficients used in the longwave radiation model.
For the ancillary data, soil property values were extracted from the ancillary dataset used in the HadGEM2-ES model, which also underpins global simulations (Osborne et al., 2015). Another crucial factor influencing crop growth, the annual average CO2 concentration, was set based on data provided by the Global Monitoring Laboratory (GML) of the National Oceanic and Atmospheric Administration (NOAA).
The weather station for the evaluation experiments provided only daily temperature and precipitation data. Consequently, additional meteorological variables, including wind, humidity, and LW, were sourced from the ECMWF Reanalysis v5 (ERA5) dataset. However, the ERA5-generated SW for 2022 and 2023 disrupted the JULES-crop simulations leading to unrealistically high leaf area index (LAI) values (exceeding 15). The overestimation of SW in ERA5 has been widely reported, with studies attributing it to the omission of aerosol variations and a limited capacity to simulate clouds and water vapour, resulting in an overestimation of hourly SW in China by approximately 73.95 W m−2 (He et al., 2021; Jiang et al., 2020; Tong et al., 2023; Li et al., 2023). To address this, SW was bias-corrected using observations from the O3-FACE experiment conducted in 2012.
Additionally, O3 concentration observations were unavailable for the evaluation experiments. Hourly O3 data from the nearest station of the China National Environmental Monitoring Centre (https://www.cnemc.cn/, last access: 20 December 2024) were used instead. Aside from these driving data, e.g. weather variables, O3 concentrations, CO2 concentrations, and crop stage dates, the evaluation simulations applied the same settings and parameters as those used in the calibration.
3.1 Calibration
All parameters calibrated using the O3-FACE experiment are listed in Tables 2 and 3. The calibration process for rice involved four main steps. First, leaf-level simulations were calibrated by fitting simulated photosynthesis rates with observed values. The nitrogen content in leaves, stems, and roots was obtained from observations and the literature. Observed leaf temperature, internal CO2 concentration, and stomatal conductance were used as model inputs. Photosynthesis-related parameters were adjusted based on discrepancies between observed and simulated photosynthesis rates. Notably, O3 damage was not considered during this step.
Table 2Calibrated plant functional type (PFT) parameters representing rice.
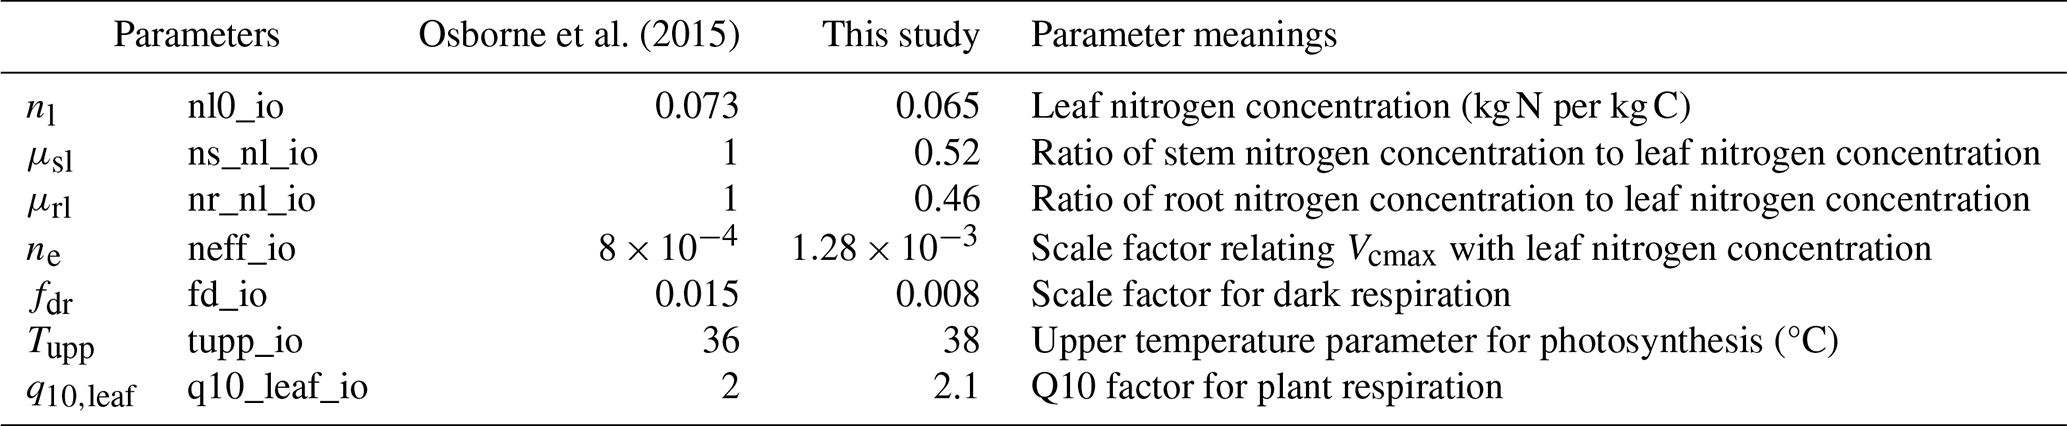
Table 3Calibrated crop-related parameters representing rice.
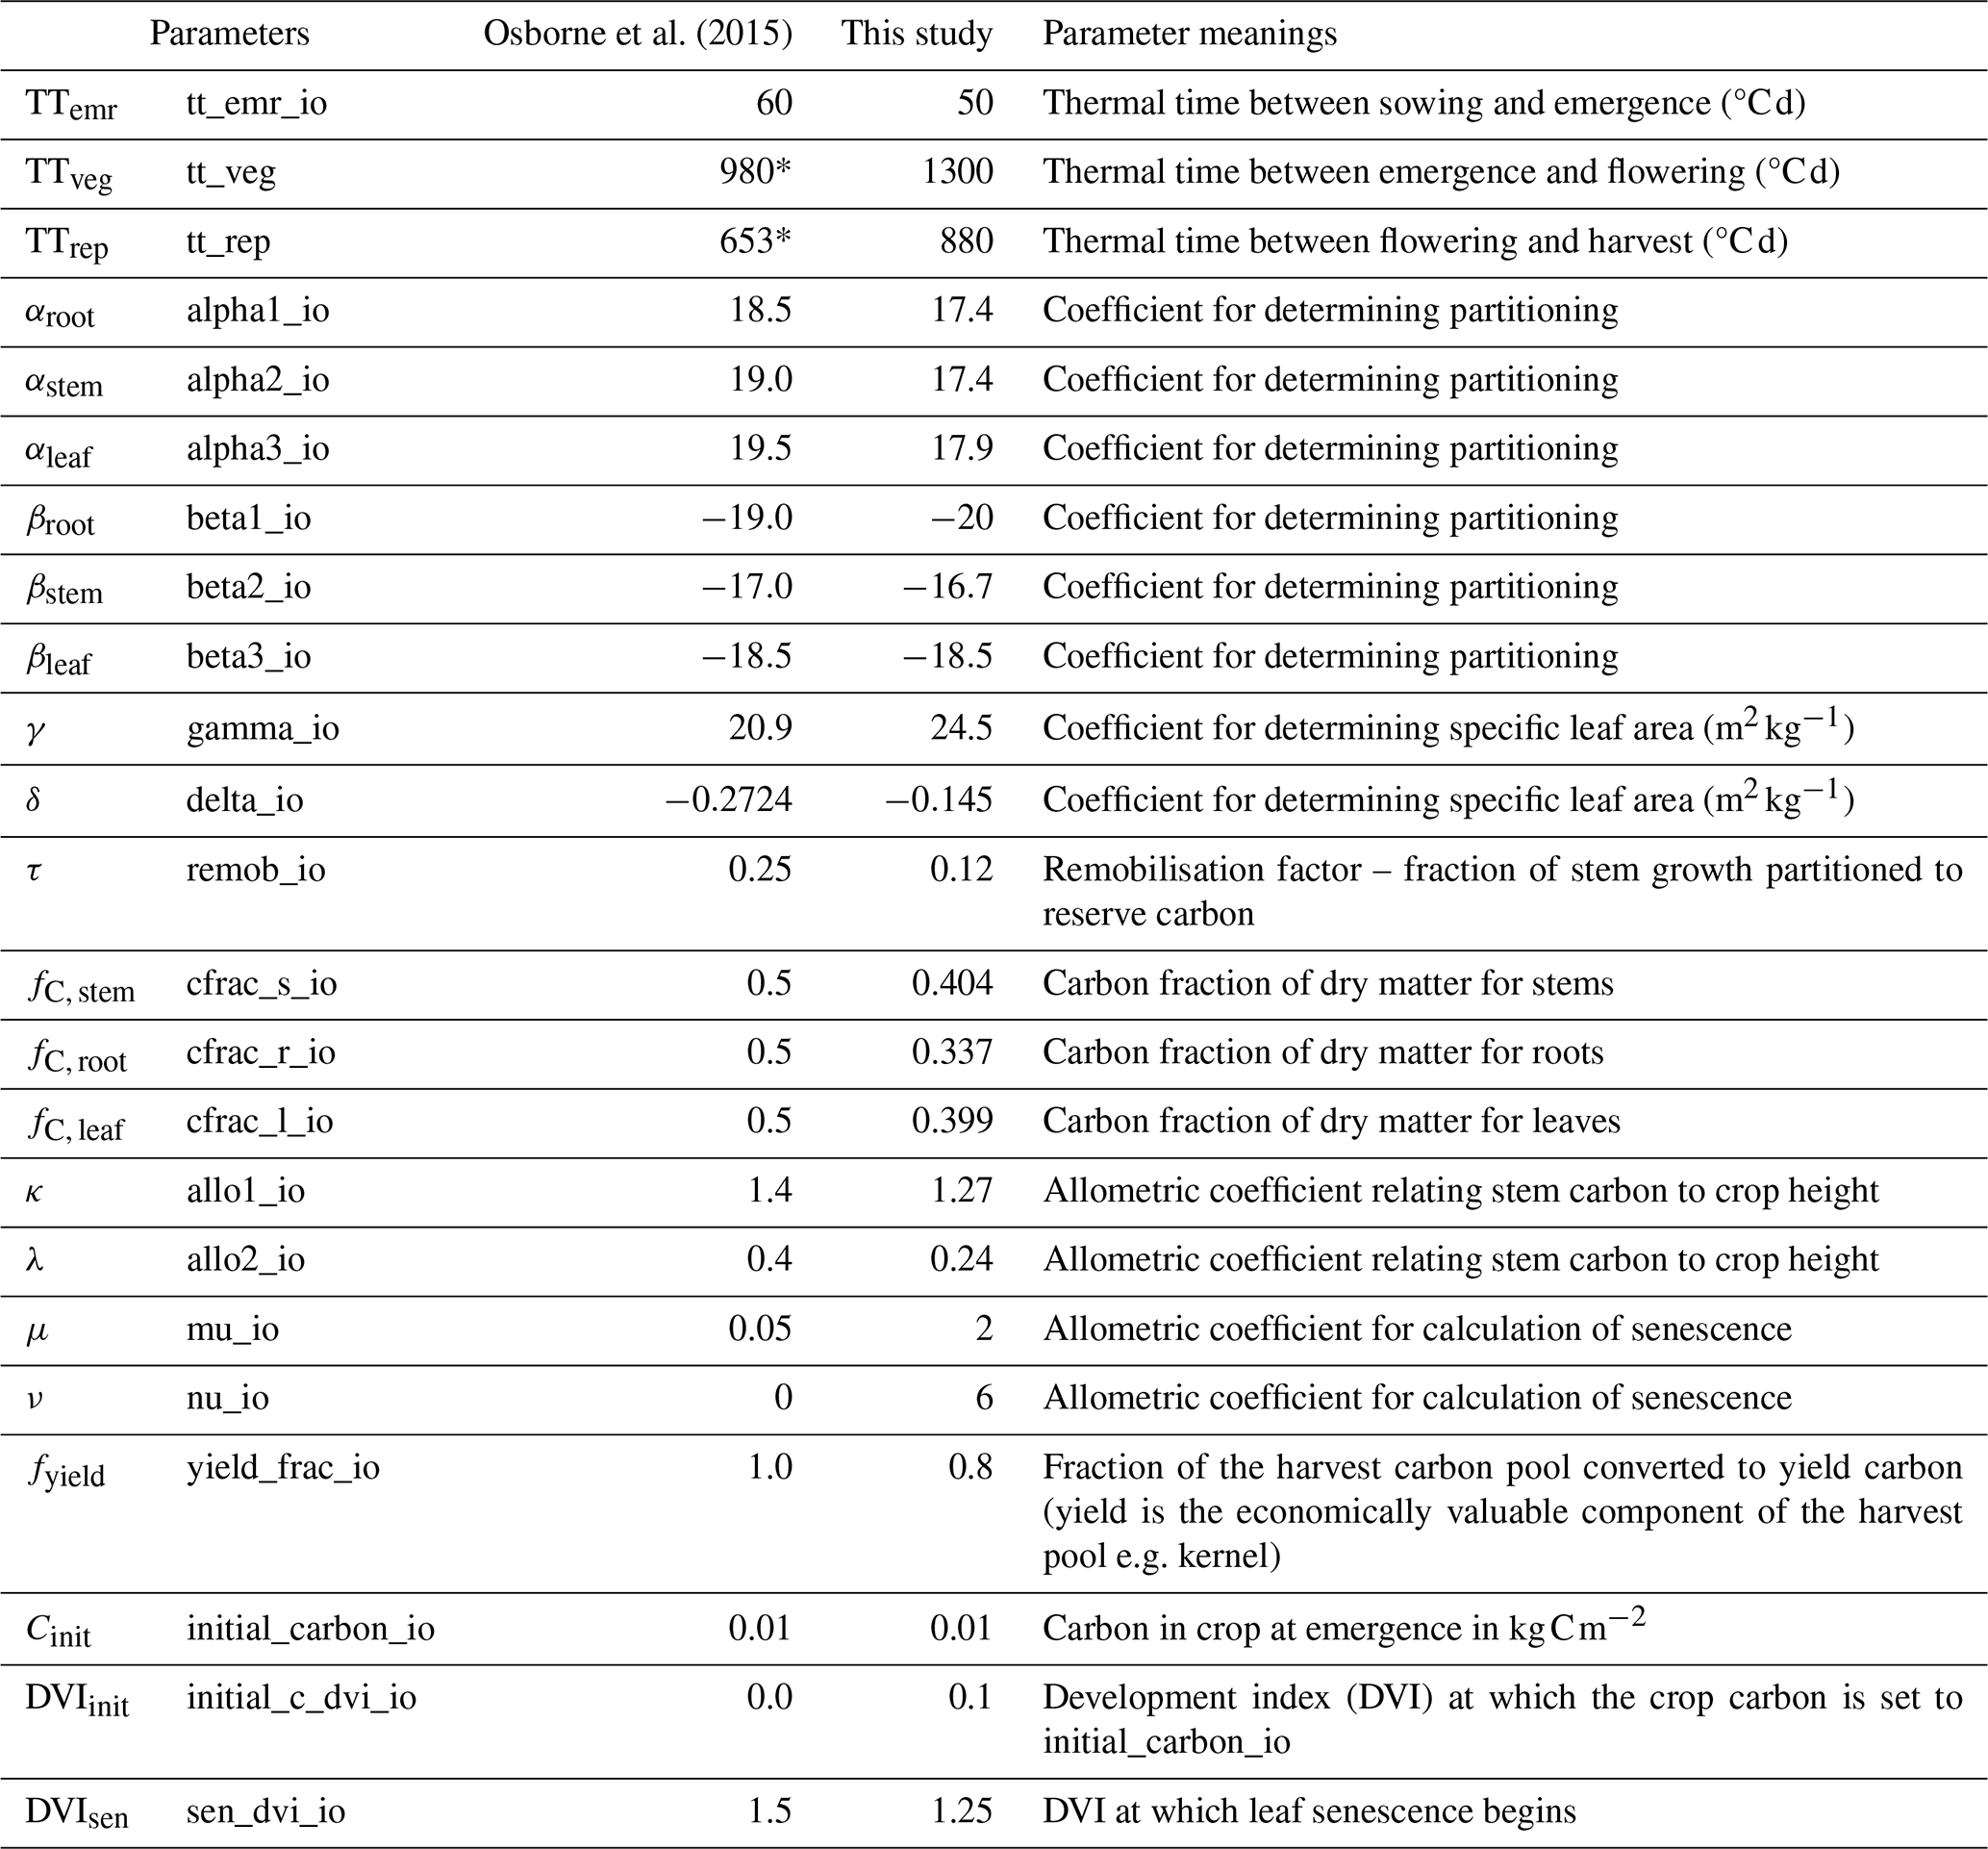
* These parameters were spatially varying in Osborne et al. (2015).
Second, canopy-level simulations were calibrated by determining the rice growth rate and partitioning of assimilated carbon. Air temperature data were used to calculate the accumulated temperature required for rice growth stages, and the allocation of carbon to various carbon pools was also defined during this phase.
Third, model simulations were evaluated against observed LAI and crop height following the calibration of crop physiology parameters. Lastly, rice yields were compared with observations under both ambient and elevated O3 concentrations.
The calibration process involved iteratively adjusting parameters manually until the model simulations fell within the range of observed values. Additional adjustments were made to refine results, aiming to align them more closely with the central tendency of the observations. Although the number of simulations was constrained by computational limitations, the process successfully achieved agreement with all available observations, ensuring no discrepancies remained. While finer and finer incremental adjustments were not feasible due to computational limitations, the approach effectively balanced precision and generalisation, capturing the essential crop observations without overfitting.
3.1.1 Photosynthesis
The potential leaf-level photosynthesis, unaffected by water stress and O3 effects, is calculated based on three potentially limiting rates: the Rubisco-limited rate (Wc), the light-limited rate (Wl), and the rate of transport of photosynthetic products (We) for C3 plants, as detailed in Clark et al. (2011).
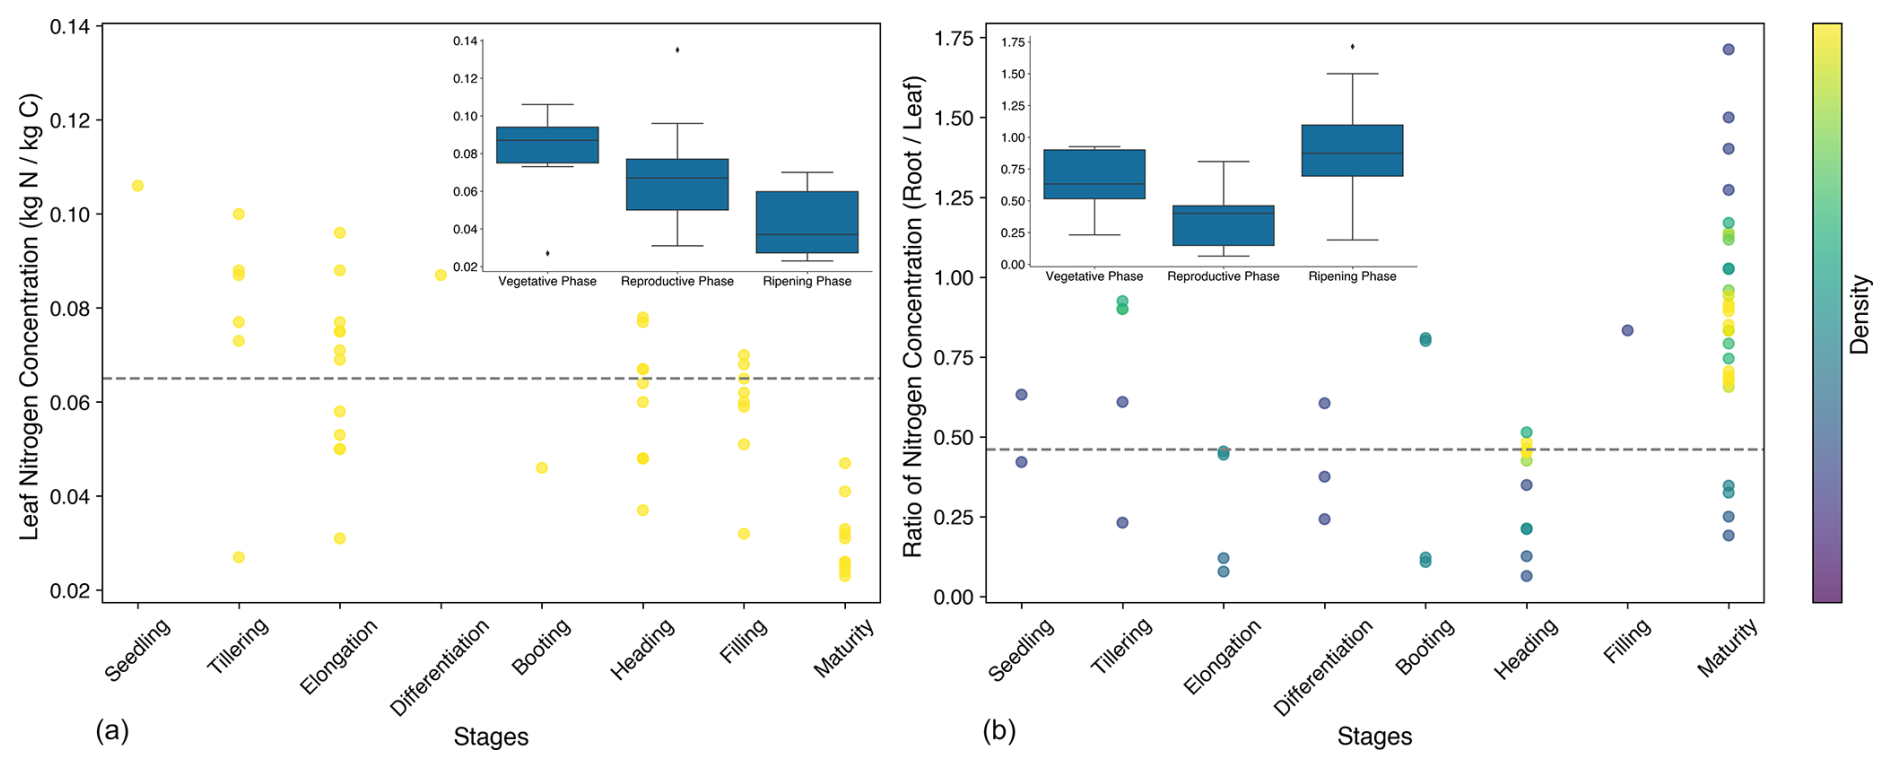
Figure 2Leaf nitrogen concentration (kg N per kg C) (a) and the ratio of root nitrogen concentration to leaf nitrogen concentration (b). The dashed grey line represents the values selected for the simulation, while the dots indicate the observed values.
Following Farquhar et al. (1980) and Collatz et al. (1991), several parameters in the photosynthesis scheme are temperature-dependent, including the maximum rate of Rubisco carboxylation, Vm (), which is critical for calculating both Wc and We. Vcmax is calculated assuming an optimal temperature range defined by Tupp and Tlow.
where Vcmax25 represents the maximum rate of carboxylation of the enzyme Rubisco at 25 °C and is assumed to be linearly dependent on the leaf nitrogen concentration. For the C3 crop, Vcmax25=nenl, where ne is the scale factor and nl is the leaf nitrogen concentration (kg N per kg C). Tc is the leaf temperature in °C, Tupp and Tlow are PFT-dependent parameters, and fT depends on the parameter q10,leaf, the factor by which plant respiration increases by a 10 °C increase in temperature:
Changes in PFT parameters primarily influence the simulations of the photosynthesis rate, which in turn affects the accumulation of carbon in rice. In JULES-crop, the photosynthesis process is closely linked to the nitrogen content of the crop. Leaf nitrogen concentration (nl) is a key factor impacting the photosynthesis rate and was estimated based on literature sources (Fig. 2a). As leaf nitrogen concentration declines from the vegetative to the ripening stage, the rice plant's capacity for carbon accumulation diminishes.
The ratio of the nitrogen content of roots relative to leaves (μrl) was also derived from the literature (Fig. 2b). This ratio determines the nitrogen content in the roots, which further influences the respiration rate. The maturity stage was excluded when calculating the average values for each stage. The values presented in Fig. 2 were collected from peer-reviewed studies conducted across China over the past 20 years (listed in the Supplement), encompassing several rice cultivars grown in major rice-producing regions.
The ratio of the nitrogen content of stems to that of leaves (μsl) was determined from the O3-FACE observations. The ratio varied across growth stages, reaching its highest value during the maturity stage (Fig. 3). This is because at maturity the leaves consist solely of yellow leaves, which have lower nitrogen content compared to the green leaves present during earlier stages. The calibrated μsl is the average value during the tillering, jointing, and heading stages.
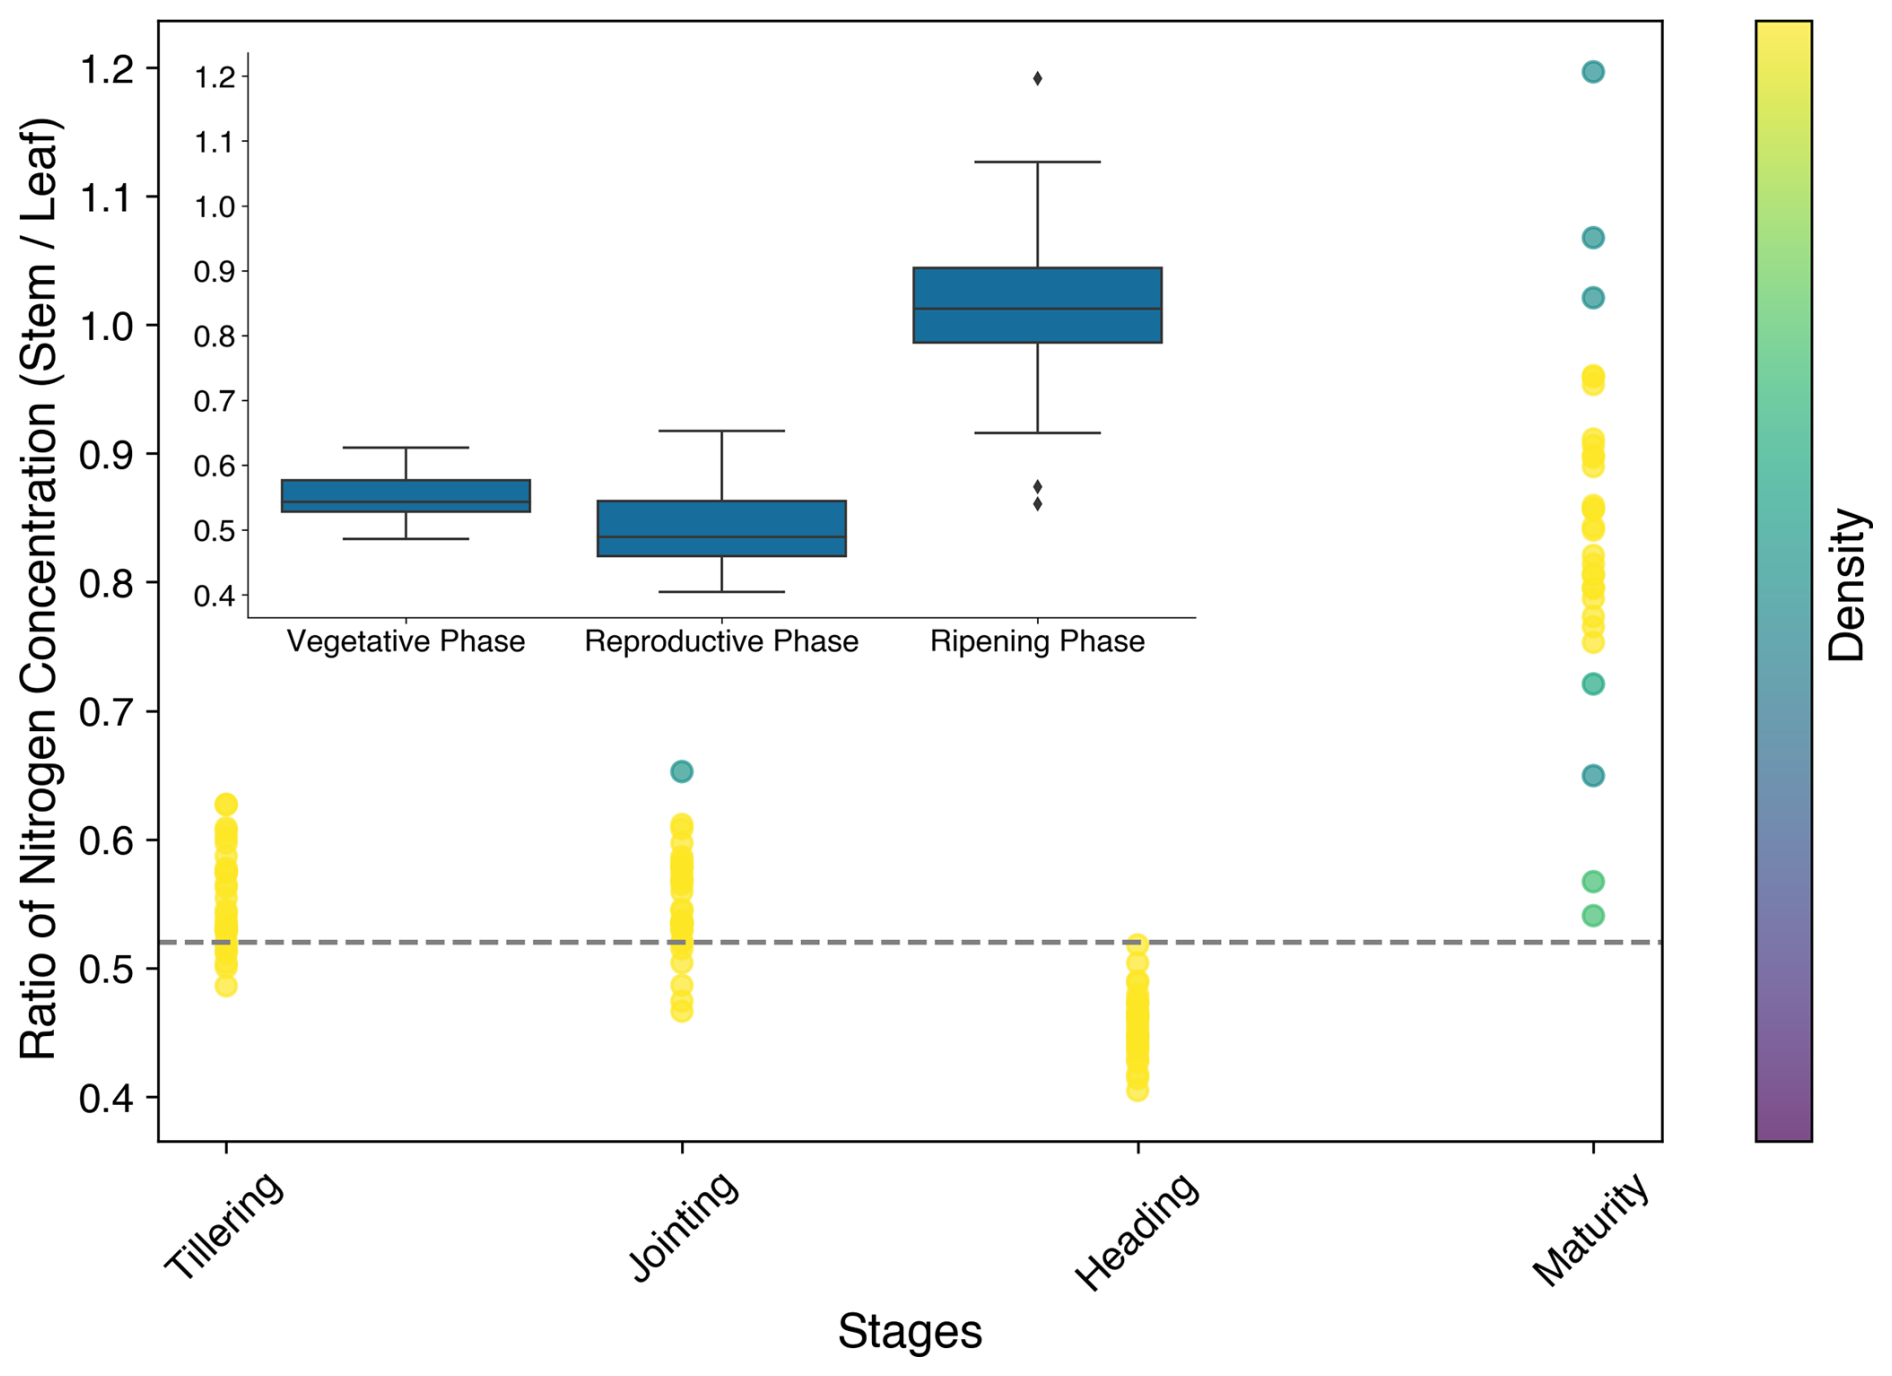
Figure 3Ratio of the stem nitrogen concentration to the leaf nitrogen concentration. The dashed grey line and the dots show the values for the simulation and observations, respectively.
The simulations of the net leaf photosynthesis rate, using the default parameters from Osborne et al. (2015), underestimated the observed values (Fig. 4a). Several parameters, including nl, ne, fdr, Tupp, and q10,leaf, were calibrated to make the simulation results agree better with observations. The standard photosynthesis model assumes that the upper temperature limit for C3 crops is 36 °C. However, when the temperature exceeded 36 °C, the simulated photosynthesis rates were still underestimated (Fig. 4b). This suggests that temperatures above 36 °C should be increased to 38 °C to obtain improved agreement with observations, as shown in Figs. 4c and 5.
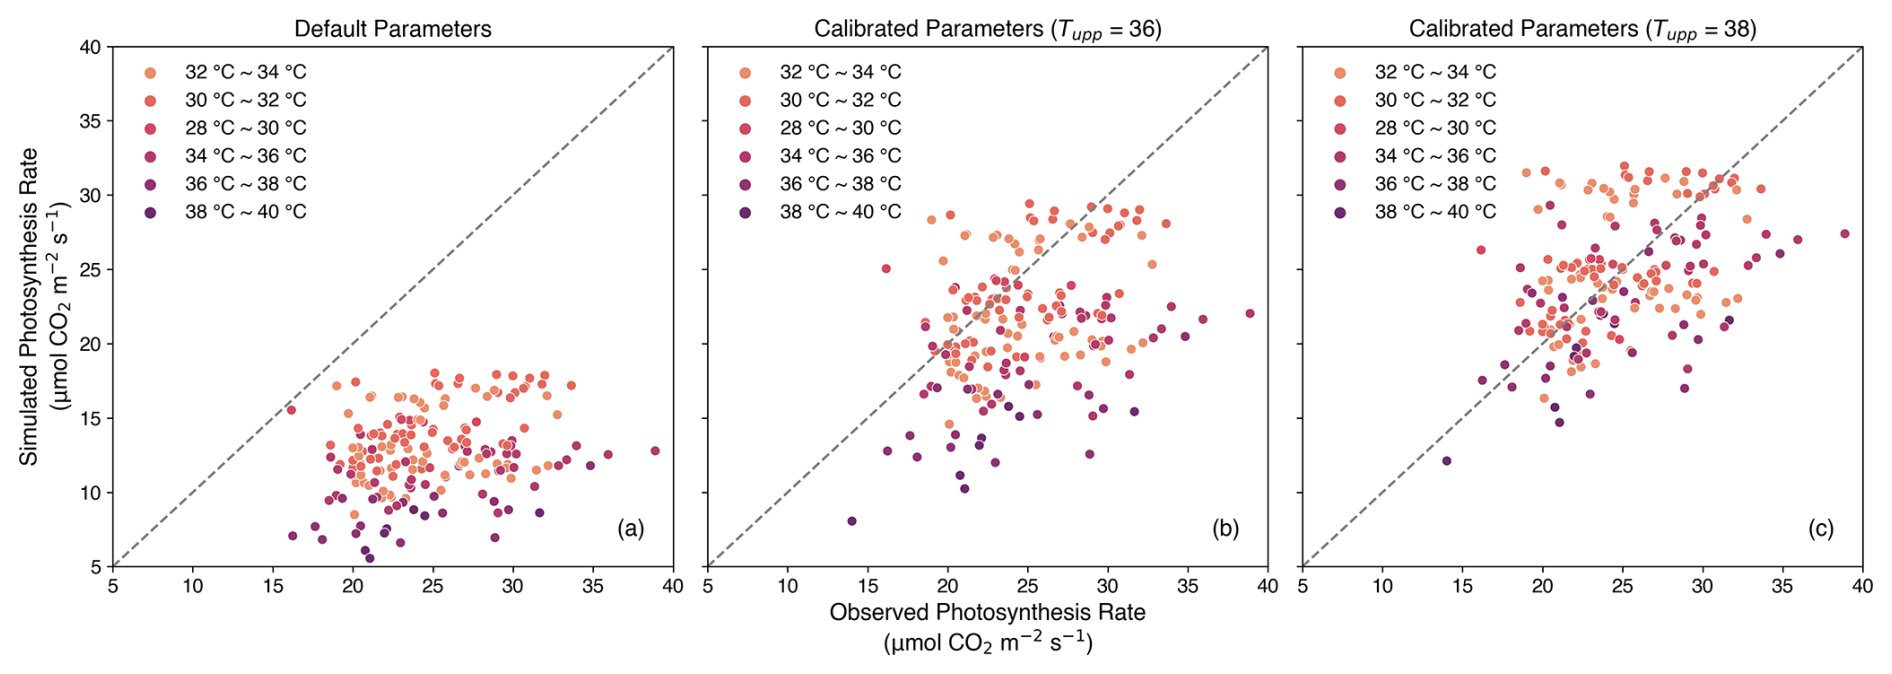
Figure 4Simulated photosynthesis rate () using parameters before calibration (a) and after calibration without (b) or with (c) changing the upper temperature limitation parameter (Tupp). The dashed line is the 1:1 line.
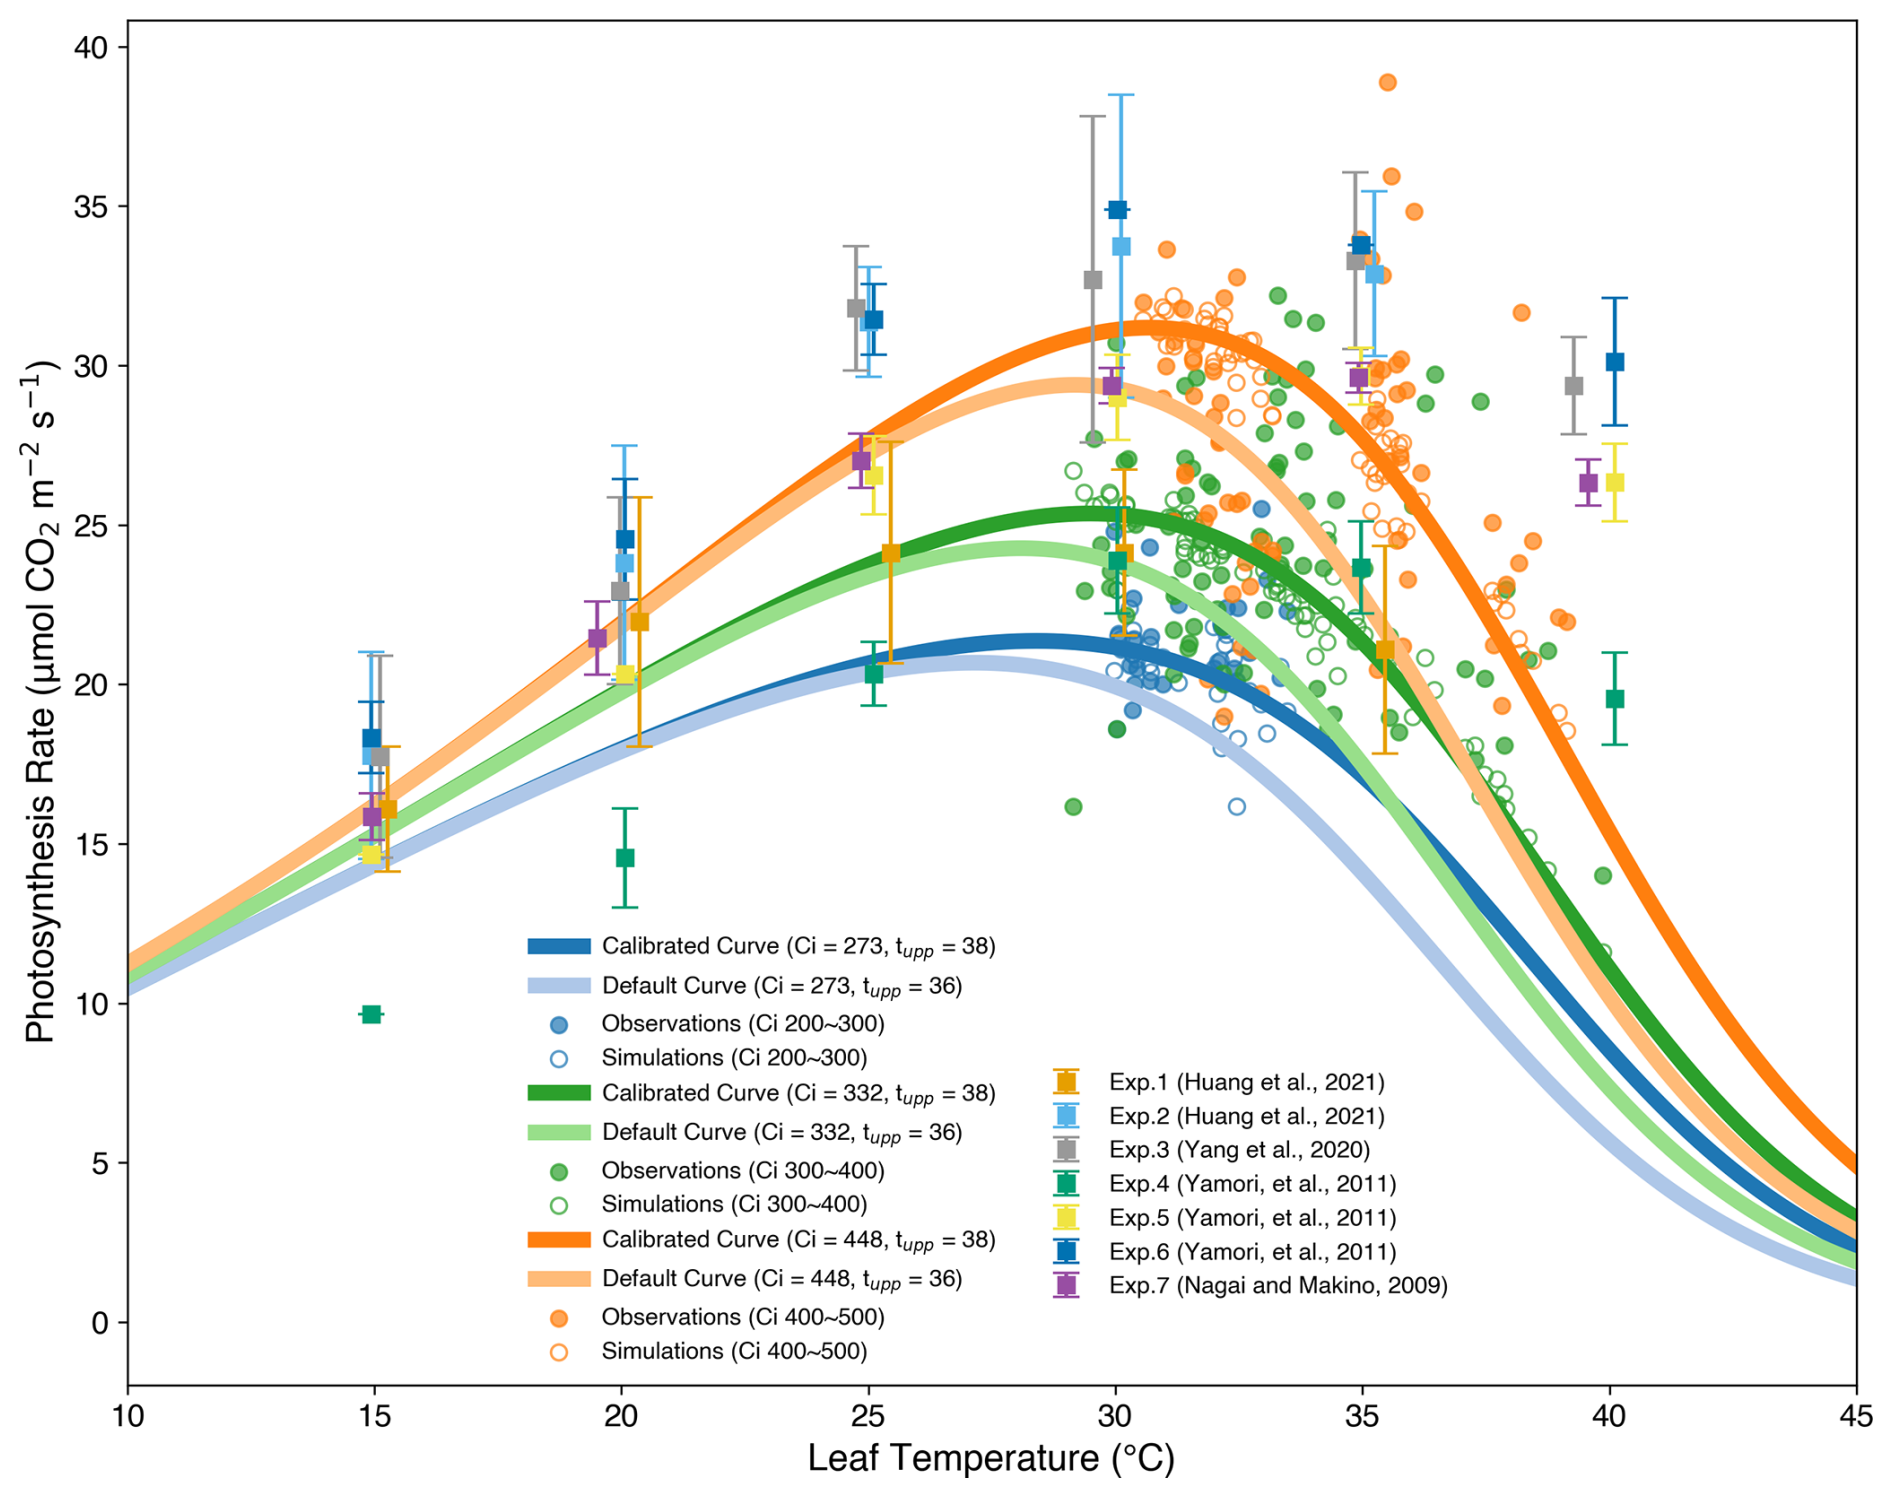
Figure 5The coloured lines are simulated temperature responses of the photosynthesis rate using the mean value of the observed intercellular CO2 concentration of leaves (Ci) and calibrated (38 °C) or default (36 °C) Tupp. The filled dots and open circles represent the observations used in this study and simulations generated by calibrated parameters, respectively. The error bars are taken from five independent studies (Table S1 in the Supplement) that span multiple rice cultivars, nitrogen regimes, CO2 levels, and light intensity levels.
Figure 5 shows that the simulated leaf photosynthetic rate starts to decrease at approximately 30 °C using the calibrated temperature parameters, while the simulated curves using the default Tupp from Osborne et al. (2015) reached the optimum temperature at about 29 °C. The exact optimum temperature for simulations varied with the intercellular CO2 concentration of leaves (Ci). According to the experimental data collected from the literature, the optimum temperature should be around 30 °C, depending on the environmental conditions such as the nitrogen content of leaves, light intensity, and CO2 concentration as well as growth stages. After calibration, the response of the leaf photosynthetic rate to leaf temperature was closer to observations from both this study and the literature.
3.1.2 Rice development and assimilate partitioning
The development status of rice is closely linked to its phenological progression and is represented by the development index (DVI). The DVI increases as the ratio of accumulated thermal time to the prescribed thermal time for each developmental phase rises. Initially, the DVI is set to −1 at sowing, increases to 0 at emergence, completes accumulation before flowering at a value of 1, and reaches a value of 2 at maturity.
Once rice is sown, its developmental rate, defined by the DVI, depends on the prescribed thermal time, which includes the thermal time between sowing, emergence, flowering, and maturity stages (Osborne et al., 2015). The thermal time (Teff) can be calculated as follows:
where T, Tb, To, and Tm are air temperature, base temperature (8 °C), optimum temperature (30 °C), and maximum temperature (42 °C), respectively, which are the values from Osborne et al. (2015).
The changes in the value of DVI during the simulation are determined by
where Temr, Tveg, and Trep represent the thermal time intervals between sowing and emergence, emergence and flowering, and flowering and maturity, respectively.
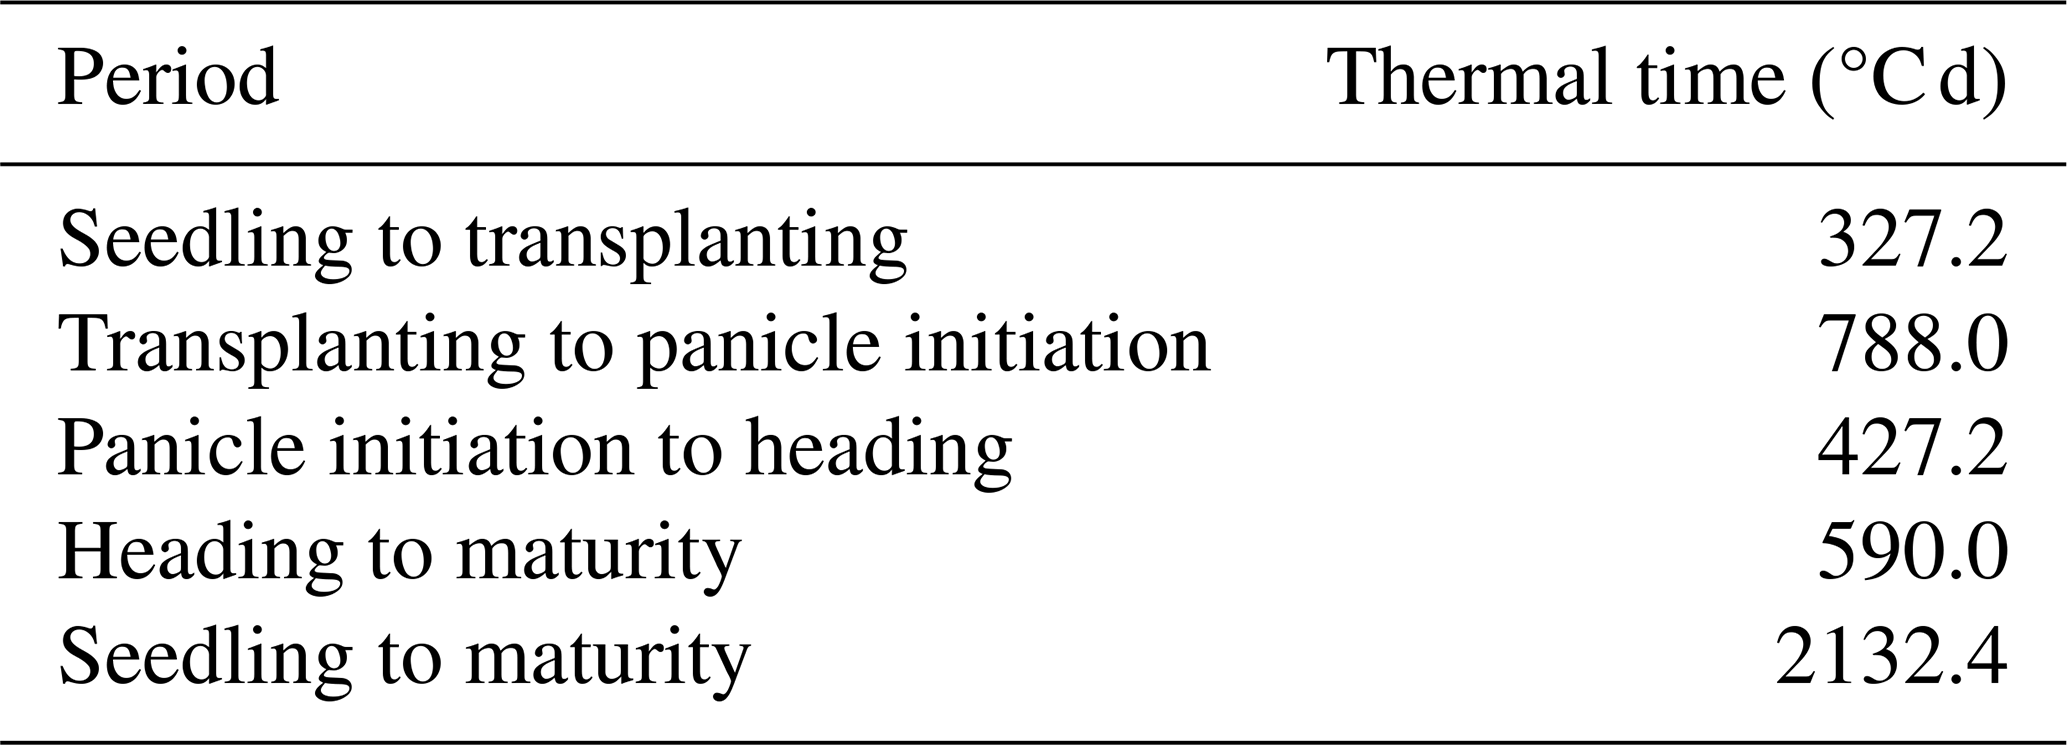
The field experiment recorded the dates for sowing, transplanting, panicle initiation, heading, and maturity when collecting samples. In China, most rice is grown in puddled fields after transplanting (Wang et al., 2017). Before transplanting, rice is cultivated in nurseries and is not moved to the field until it has developed five or six leaves. The prescribed thermal time was estimated based on the calculated thermal time from the observations (Table 4). The observed development stages and crop characteristics are used to determine the thermal time required for the model, ensuring that the following conditions are met: the model's predicted maturity stage coincides with the actual timing observed in the experiment and the DVI of crop characteristics from simulations agrees with the observations. For example, the transplanting stage falls within the vegetative phase, so the DVI of observations should fall within the range of 0 to 1.
Table 4Thermal time of rice between transplanting and maturity.
Once the development rate was determined, the accumulated net primary productivity (NPP) of each time step was partitioned into four main carbon pools: root, stem (including structural stem and stem reserves), leaves, and the harvest pool (including yellow leaves and harvested organs, which are panicles for rice).
The partition coefficients (p) are calculated as follows (Osborne et al., 2015):
Six parameters, αroot, αstem, αleaf, βroot, βstem, and βleaf, determine the partitioning process during the whole growth period. And the NPP accumulated through photosynthesis for each time step is distributed to the four carbon pools according to the partition coefficients.
The parameters for carbon distribution were calibrated based on the dry weights of the stem, leaves, and panicles from field experiments. Since root carbon is not included in the observations, its partitioning value is estimated as a fraction of rice yield. Liu et al. (2023) suggested that the ratio of root dry weight to grain yield is approximately 0.13, although it can vary depending on the cultivar and nitrogen application rate. Figure 6 shows the fraction of accumulated NPP partitioned into the different carbon pools using the calibrated parameters.
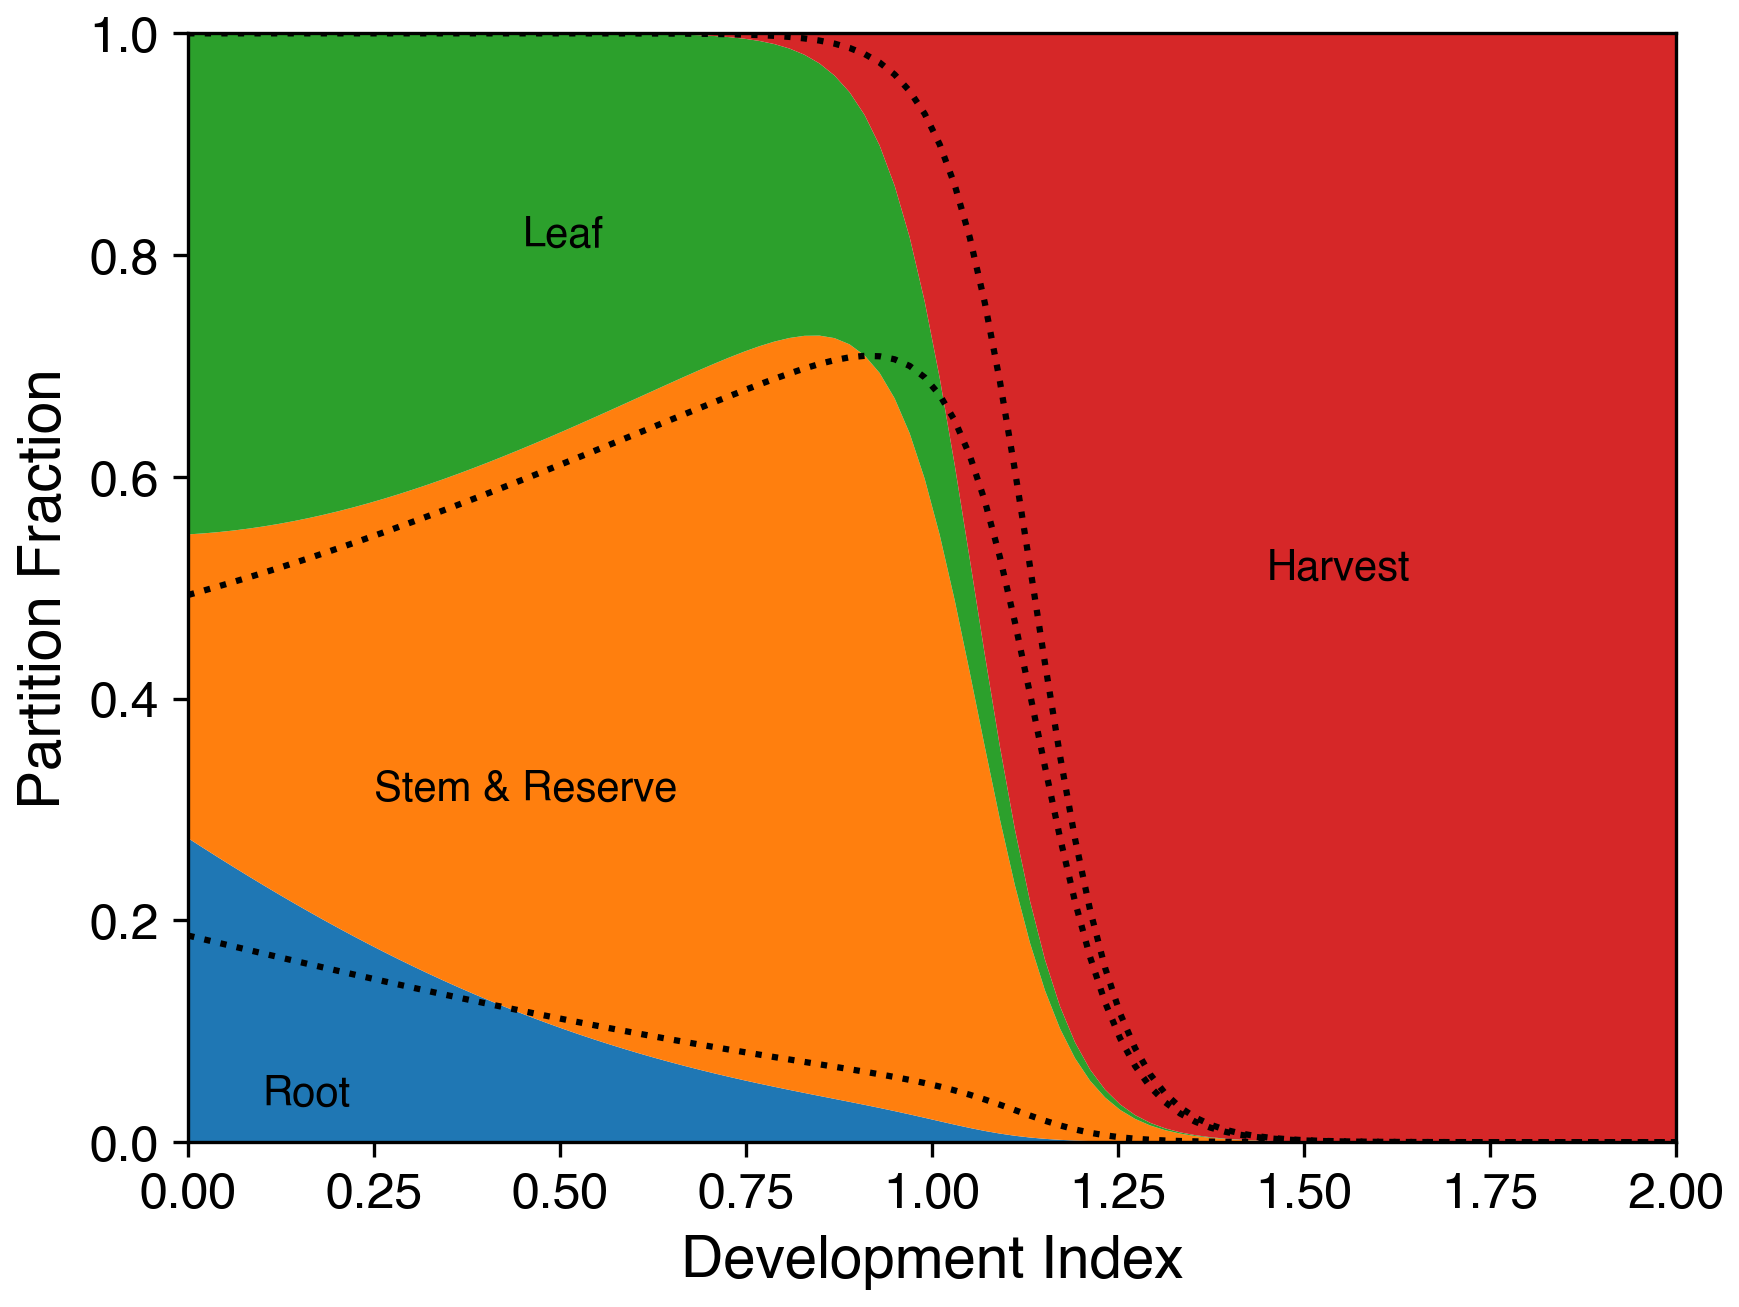
Figure 6Fraction of daily accumulated net primary productivity partitioned into roots (blue), stems (orange), leaves (green), and harvested parts (red) of the crop as a function of the development index (DVI; 0 = emergence, 1 = flowering, 2 = maturity) for rice. The dotted black line is the fraction based on parameters used in Osborne et al. (2015).
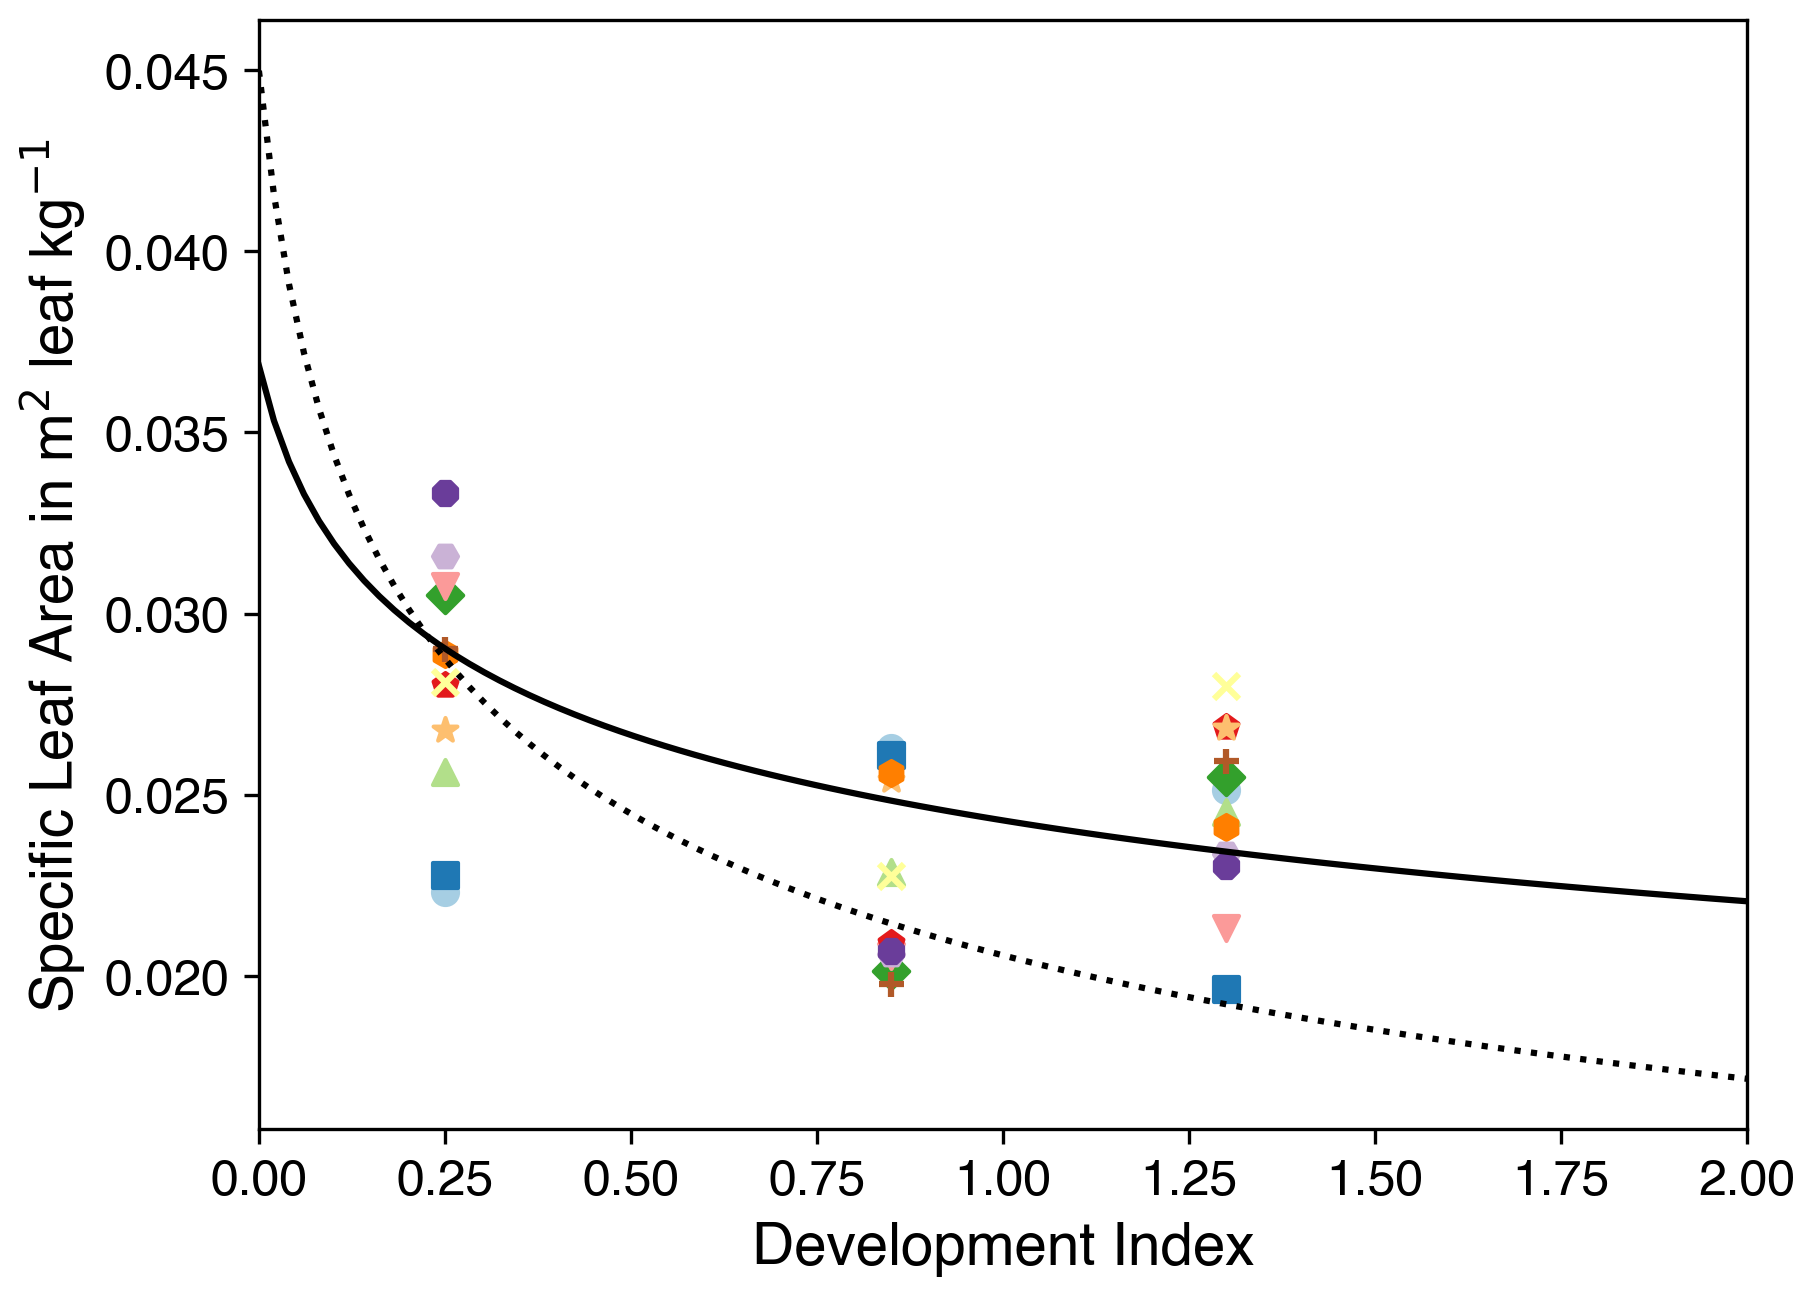
Figure 7Specific leaf area against the development index. Coloured symbols indicate observations, and the colour shows the data from different experiment fields. The dotted black line and the solid black line show the fit using parameters from Osborne et al. (2015) and our calibrated parameters, respectively. Note that various symbols correspond to successive sampling dates from the same experimental field, thereby illustrating the temporal progression of the observations.
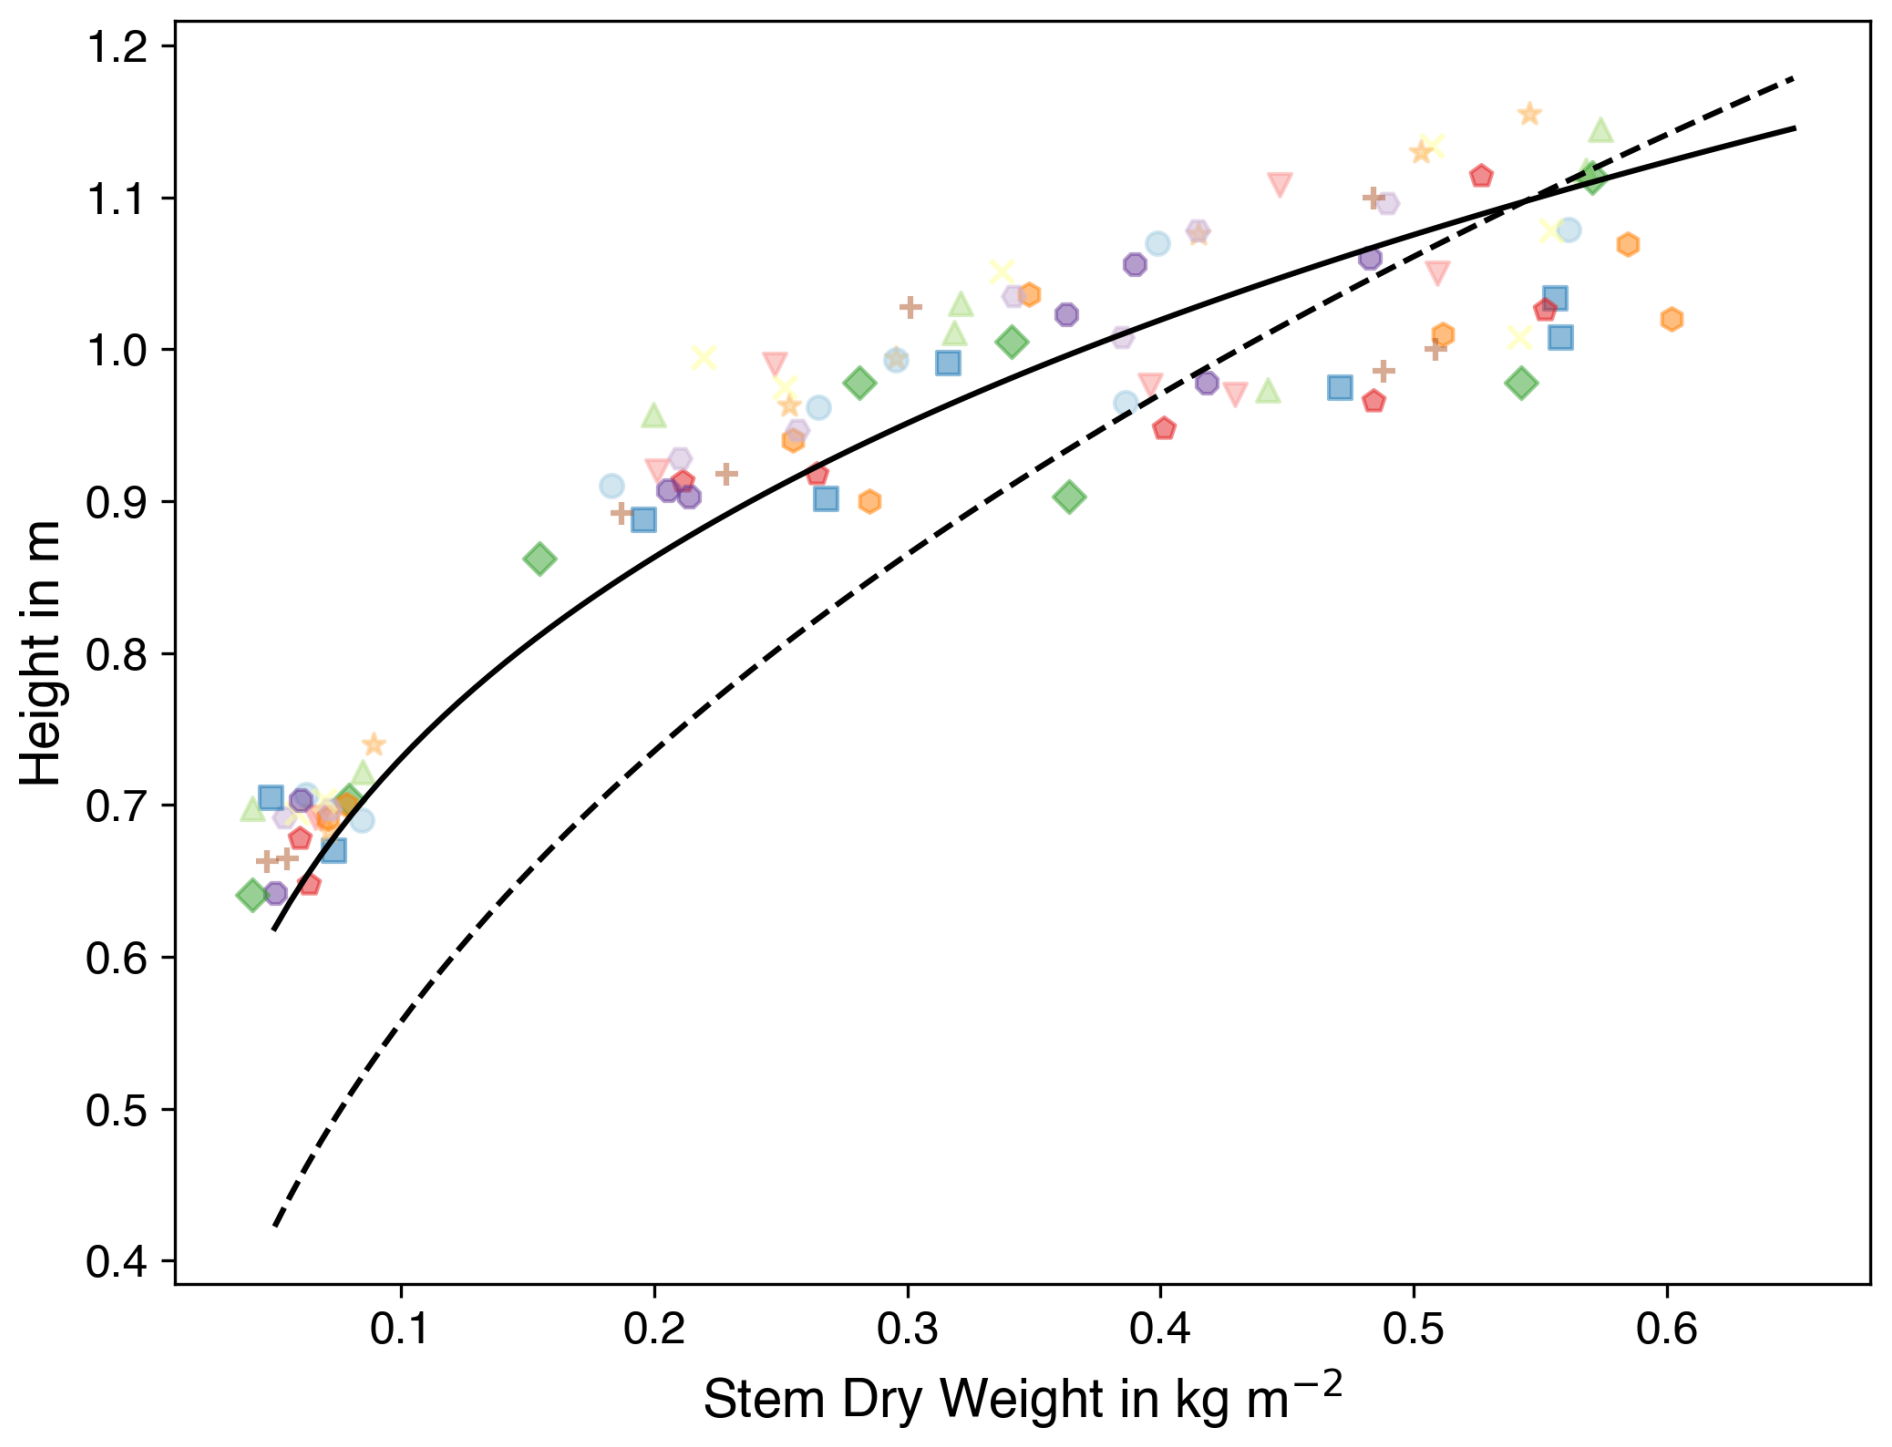
Figure 8Stem dry weight against crop height. Coloured symbols are observations, and the colour shows the data from O3-FACE experiment. The dashed black line and the solid black line show the fit using parameters from Osborne et al. (2015) and the calibrated parameters, respectively. Note that various symbols correspond to successive sampling dates from the same experimental field, thereby illustrating the temporal progression of the observations.
The accumulated carbon in different carbon pools directly affects the biomass of various rice organs. The model calculates carbon accumulation and distribution, so the fractions of carbon to dry matter in the root, stem, and leaf (fC, root, fC, stem, and fC, leaf) must be defined prior to running the model. The values used in our calibrated simulations were taken from the observations and are listed in Table 2, along with the default values from Osborne et al. (2015). The value of the carbon fraction impacts the root growth, crop height, and LAI.
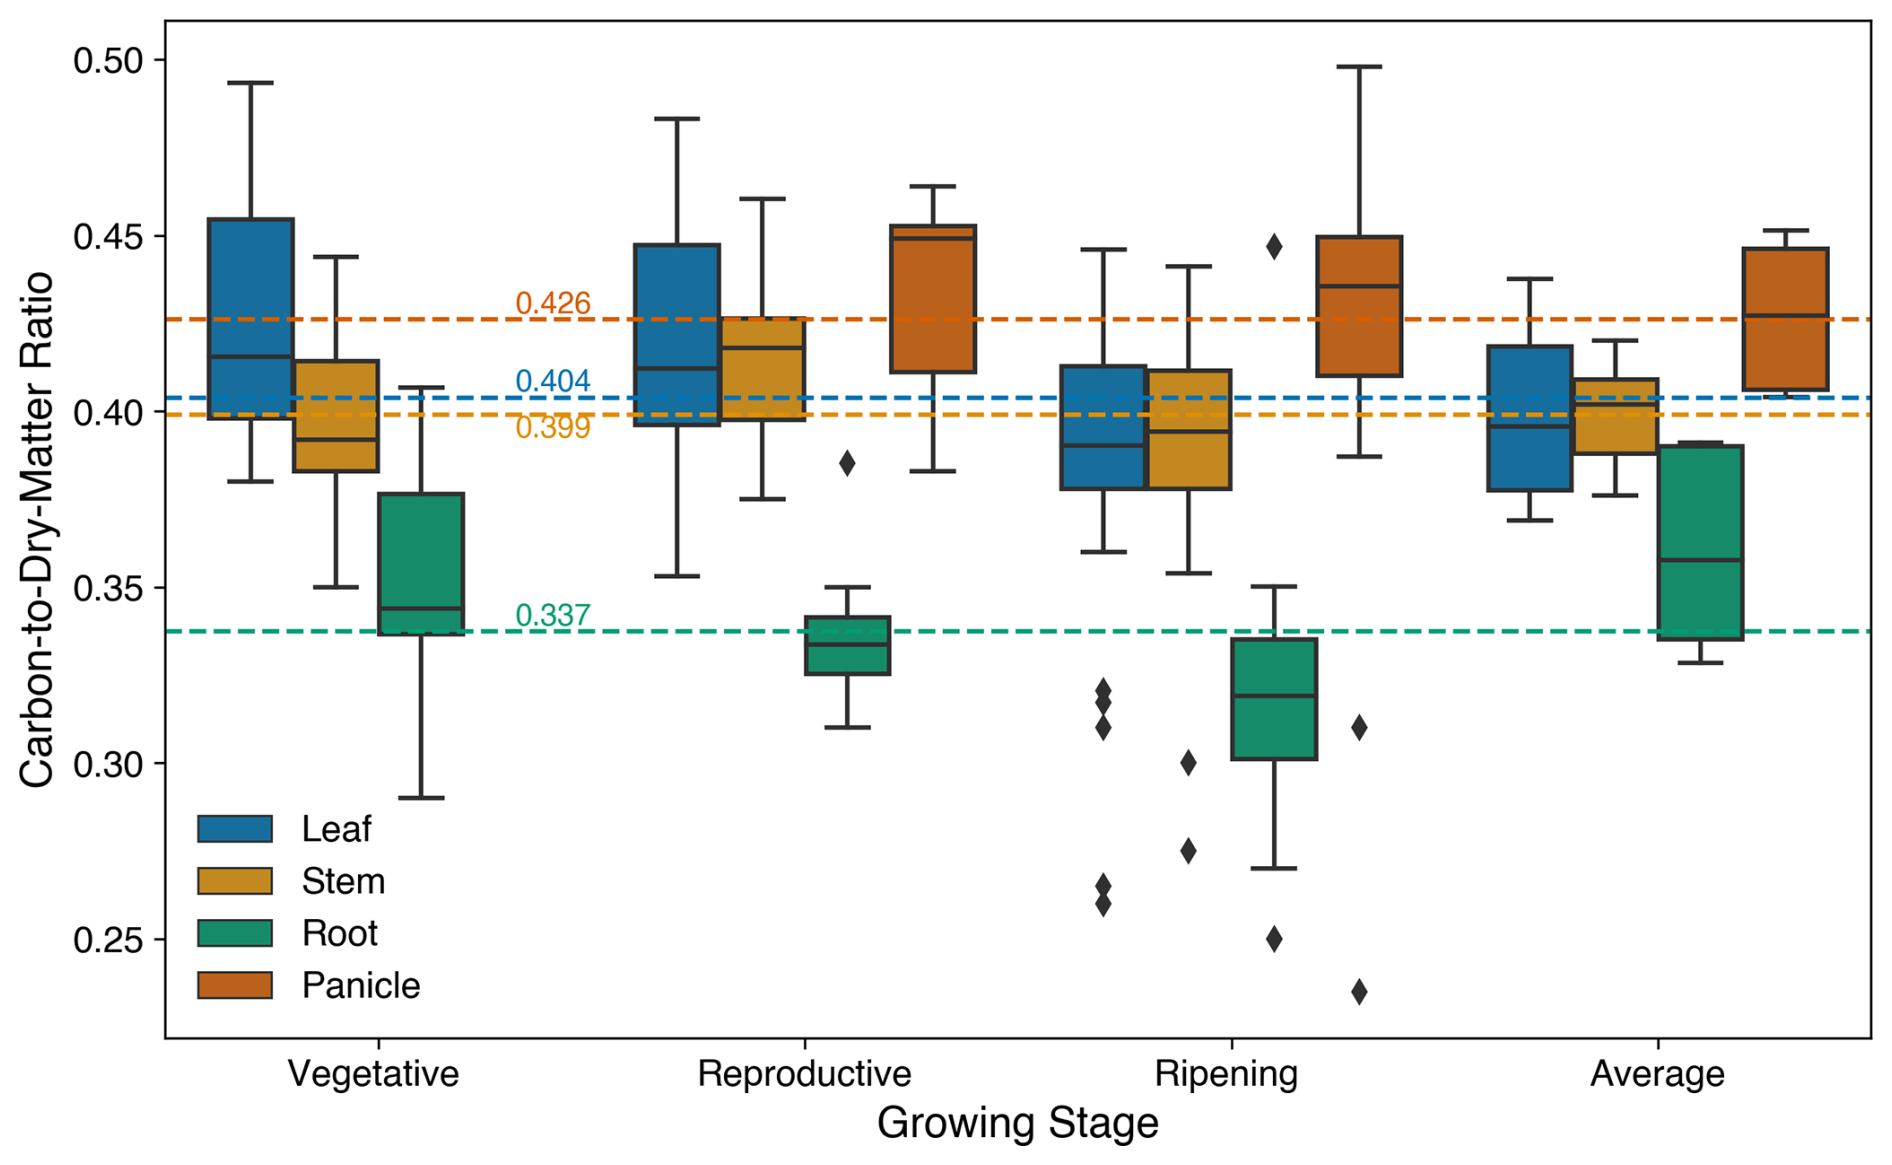
Figure 9Carbon-to-dry-matter ratio of the leaf, stem, root, and panicle during different crop development stages, where the average means the value collected from the literature, which only provided an average value for all stages during the rice growth. The dashed green, yellow, and blue lines represent the value prescribed in the model for the fraction of carbon to dry matter in the root, stem, and leaf, respectively.
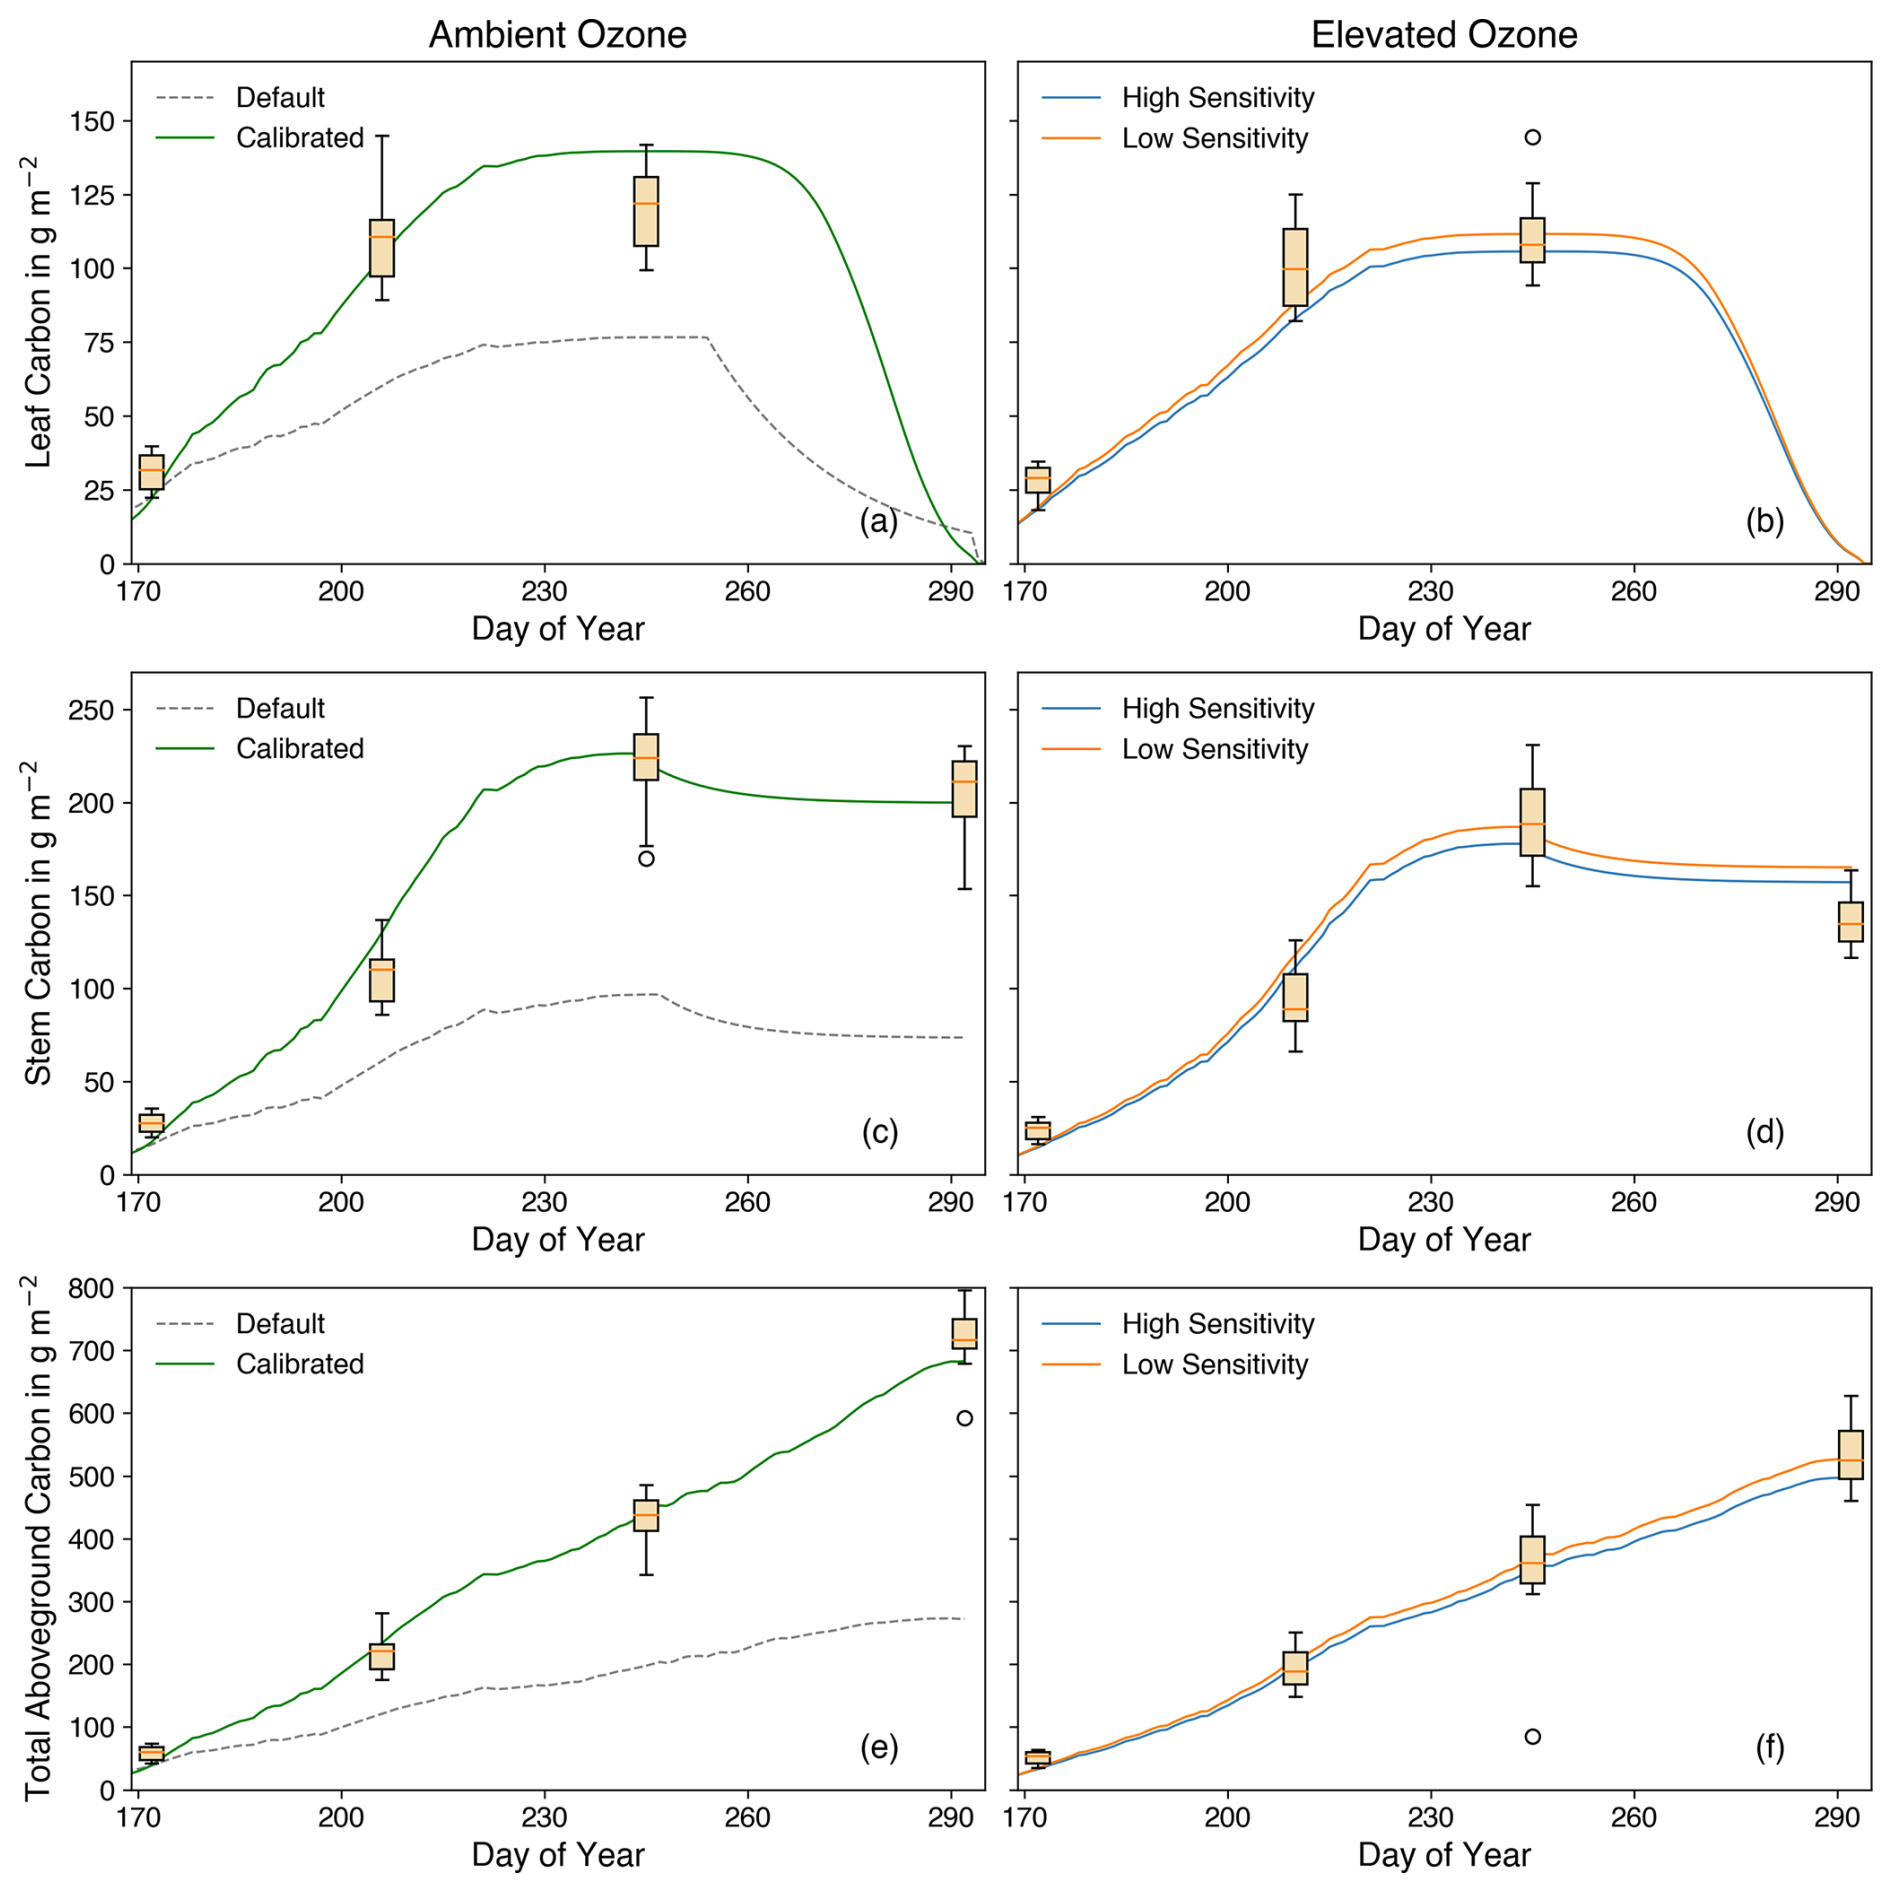
Figure 10Leaf, stem, and total aboveground carbon against the day of year under ambient and elevated O3 conditions. Box plots are observations, whereas lines show the simulation results using parameters from Osborne et al. (2015) (grey) and calibrated (green) parameters under ambient O3 conditions, including high (blue) and low (orange) O3 sensitivity under elevated O3 conditions, with units of g m−2.
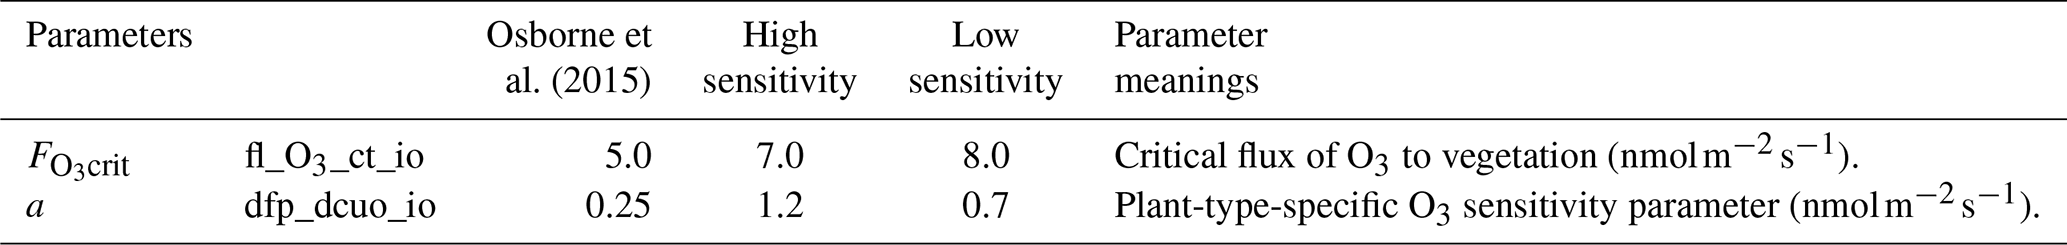
Table 5O3 parameters calibrated for high and low sensitivity to O3 damage.
3.1.3 LAI and crop height
LAI is an important attribute of crops, reflecting their capacity for carbon accumulation. In JULES-crop, LAI is linked to the leaf carbon pool (Osborne et al., 2015):
Here Cleaf indicates the amount of carbon in leaves, fC, leaf represents the carbon fraction of dry matter in leaves, and SLA is the specific leaf area (m−2 leaf kg−1):
where γ and δ are determined by fitting the curve between DVI and SLA (De Vries et al., 1989) from observations (Fig. 7).
As green leaves begin to turn yellow, leaf senescence starts and is represented by the parameter DVIsen. The change from green to yellow signals the transition of carbon from the leaf carbon pool to the harvest carbon pool. The transition rate is simulated by reducing Cleaf by a specific fraction (De Vries et al., 1989):
where μ and ν were determined by fitting the declining trend of carbon in green leaves following leaf senescence. The simulation results are presented in Sect. 3.1.4.
The calculation of crop height (h) depends on the amount of carbon in the stem (Cstem) (Hunt, 2012):
where fC, stem represents the carbon fraction of dry matter in the stem and κ and λ are determined by fitting the relationship between h and the stem dry matter of stems, which is equal to (Fig. 8).
Similarly to leaf senescence, the carbon stored in the stem reserves is mobilised into the harvest carbon pool at a rate of 10 % d−1 once the partition coefficient for stems drops below 0.01 (De Vries et al., 1989).
where τ represents the fraction of stem growth partitioned to reserve carbon.
The observations did not include components of the carbon fraction, such as Cleaf and Cstem, required for the model simulation; therefore, these values were sourced from peer-reviewed rice field studies (listed in the Supplement). Some studies evaluated varied stressors or environmental treatments. Thus, to ensure consistency with calibration, only the control-plot values under default (unstressed) conditions were used. All the literature data were derived from rice field experiments conducted in China, involving several rice cultivars to enhance representativeness (Fig. 9). The carbon content of panicles was also obtained from the literature and combined with the carbon in yellow leaves during the ripening phase to calculate the total carbon in the harvest pool. Additionally, the fractions of carbon to dry matter were used to compare the simulation results with the observations, which only provided dry biomass data for rice.
3.1.4 Comparison with O3-FACE experiments
Figure 10 illustrates the changes in the main carbon pools throughout the entire growing period. The accumulated carbon was reduced under elevated O3 conditions, highlighting the detrimental impact of O3 on crop growth. At the maturity stage, total aboveground carbon under elevated O3 was 22 %–29 % lower compared to ambient O3 conditions, as shown in the observations (Fig. 10e and f). Carbon levels in both the leaf and stem exhibited a similar decreasing trend due to the O3-induced damage to the photosynthesis process and carbon accumulation. The simulations closely matched the observations, using the average carbon-to-dry-matter fraction for different growth stages to convert observed data into carbon weights (Fig. 9). It is important to note that the carbon fraction varies with cultivar and growing environment. To align the model results, which are based on carbon weight instead of dry weight, with the observed data, the average carbon-to-dry-matter ratio across all stages was applied.
There are two parameters in the simulations that directly relate to the impact of O3 on the rice (Clark et al., 2011; Sitch et al., 2007) (Table 5). The reduction in the net photosynthesis rate was determined by the value of the instantaneous leaf uptake of O3 above the threshold , multiplied by a sensitivity parameter a (Pleijel et al., 2004). Observations using three planting densities of rice observations were used to calibrate the model. As can be seen from Fig. 11, the high sensitivity and low sensitivities coincided with the upper and lower boundaries of relative yield (RY), which is calculated as follows:
where represents the crop yield including O3 damage and Y0 represents the crop yield with no effects of O3.
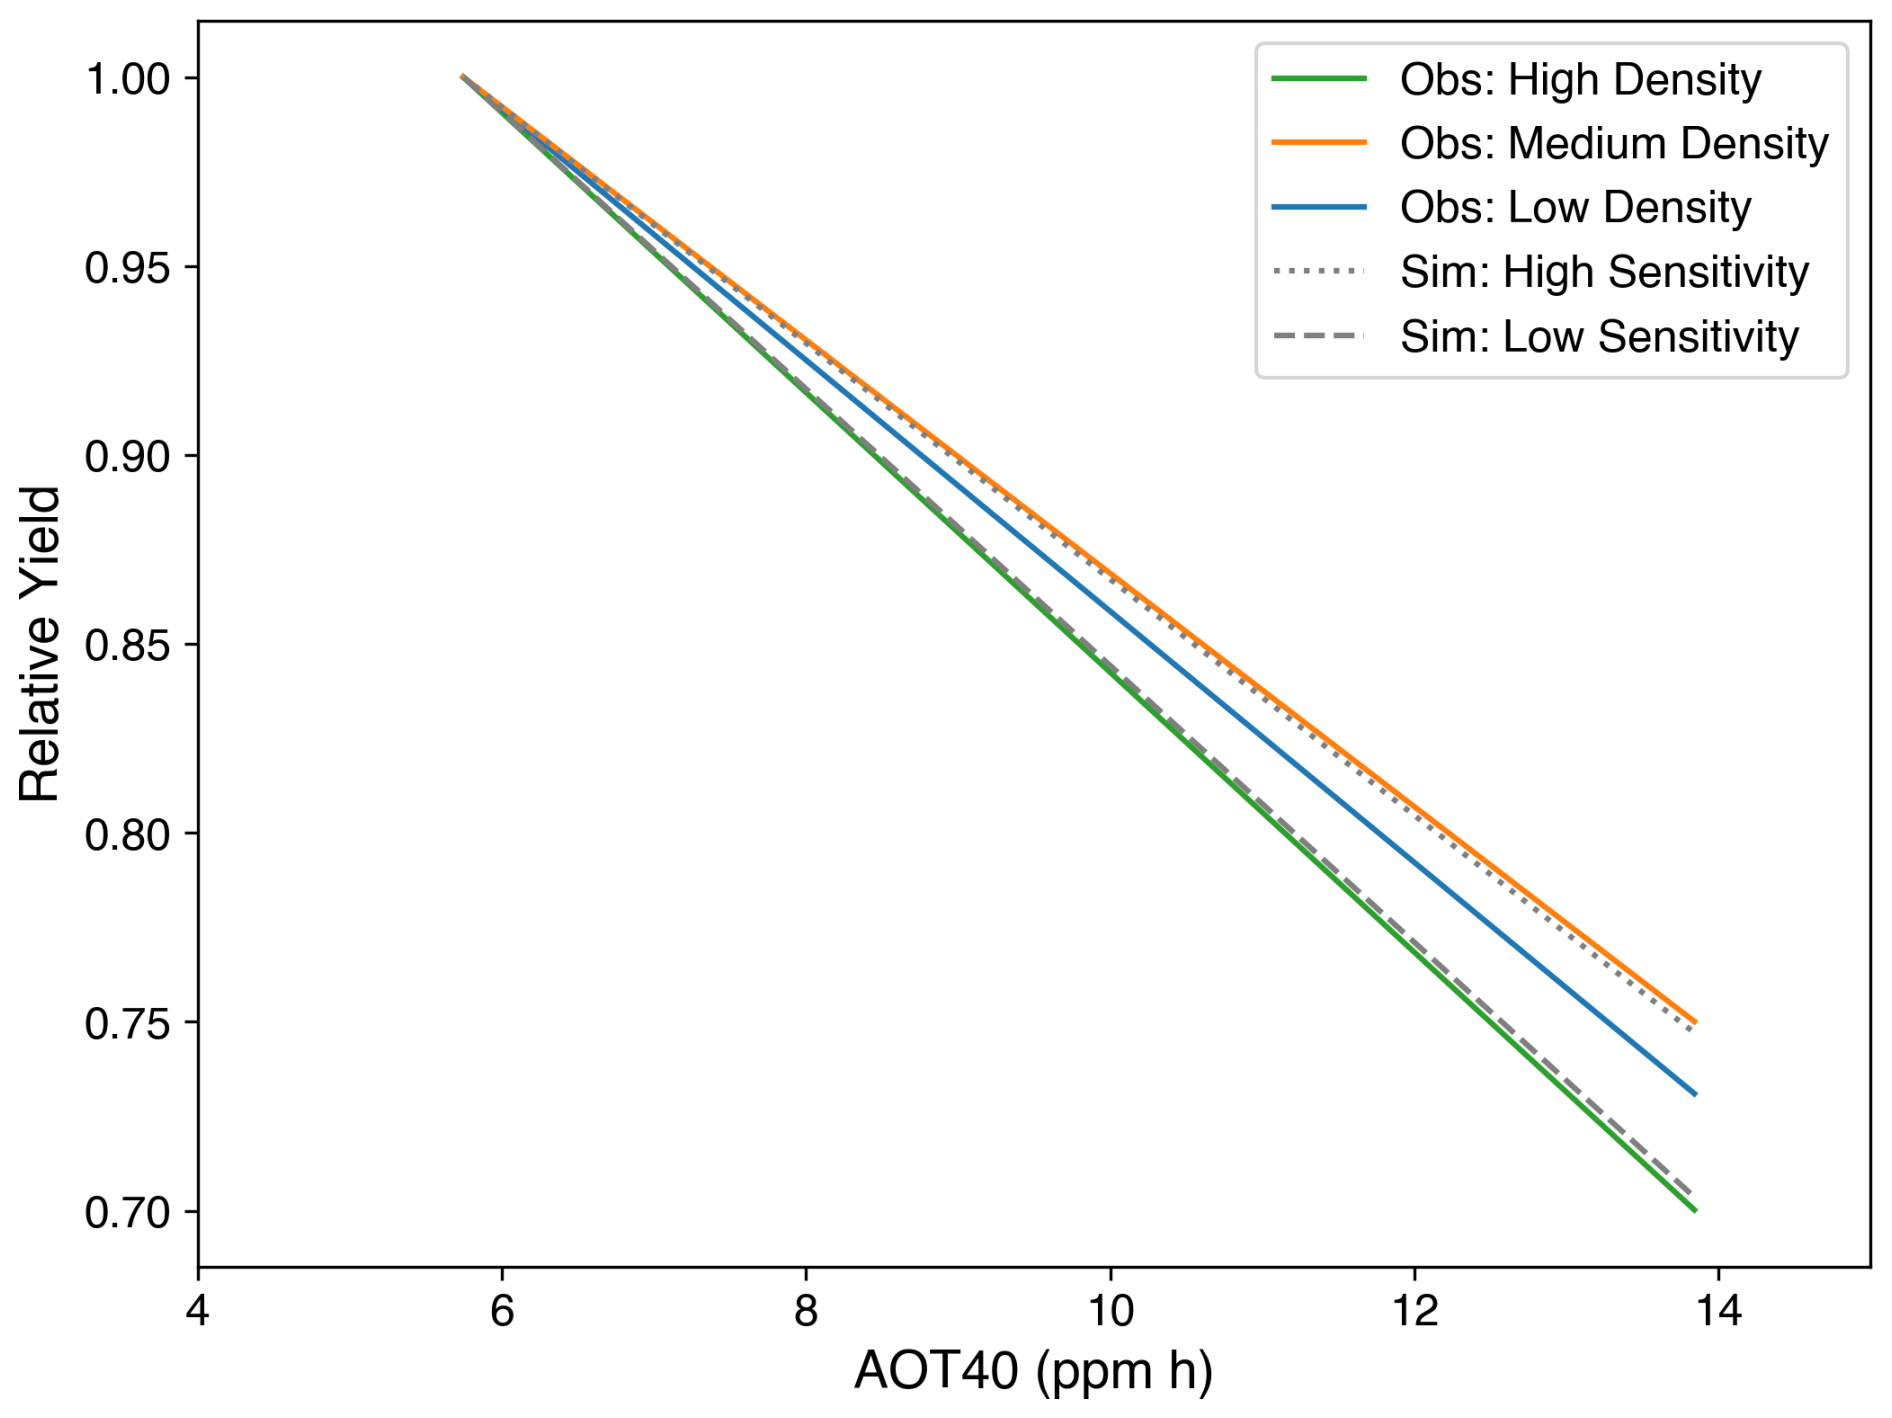
Figure 11Relative yield against AOT40 (ppm h). Coloured lines show the relative yield of rice planted in high (green), medium (orange), and low (blue) density. The grey lines show the simulations of relative yield with high (dotted) and low (dashed) sensitivity to O3 damage.
In Fig. 11, AOT40 was used to represent the O3 concentrations in the environment:
where [O3]i stands for the hourly O3 concentration level (unit: ppm h) during daylight hours (08:00–19:59) and n represents the total hours of the growing season.
Figure 12 illustrates the height and LAI of rice under both elevated and ambient O3 conditions. The difference in LAI and height between these two environments underscores the negative impact of O3 on rice carbon accumulation. Post-calibration, the simulations for both LAI and height align well with observational data (Fig. 11a and c). Prior to the new calibration, simulations with default parameters from Osborne et al. (2015) significantly underestimated both LAI and height largely due to the underestimated photosynthesis rate (Fig. 4). This underestimation led to reduced carbon assimilation and storage, resulting in insufficient carbon allocation to stems and leaves, which directly impacted LAI and height. It is worth noting that all plots comparing simulation and observation begin after the model's initialisation phase.
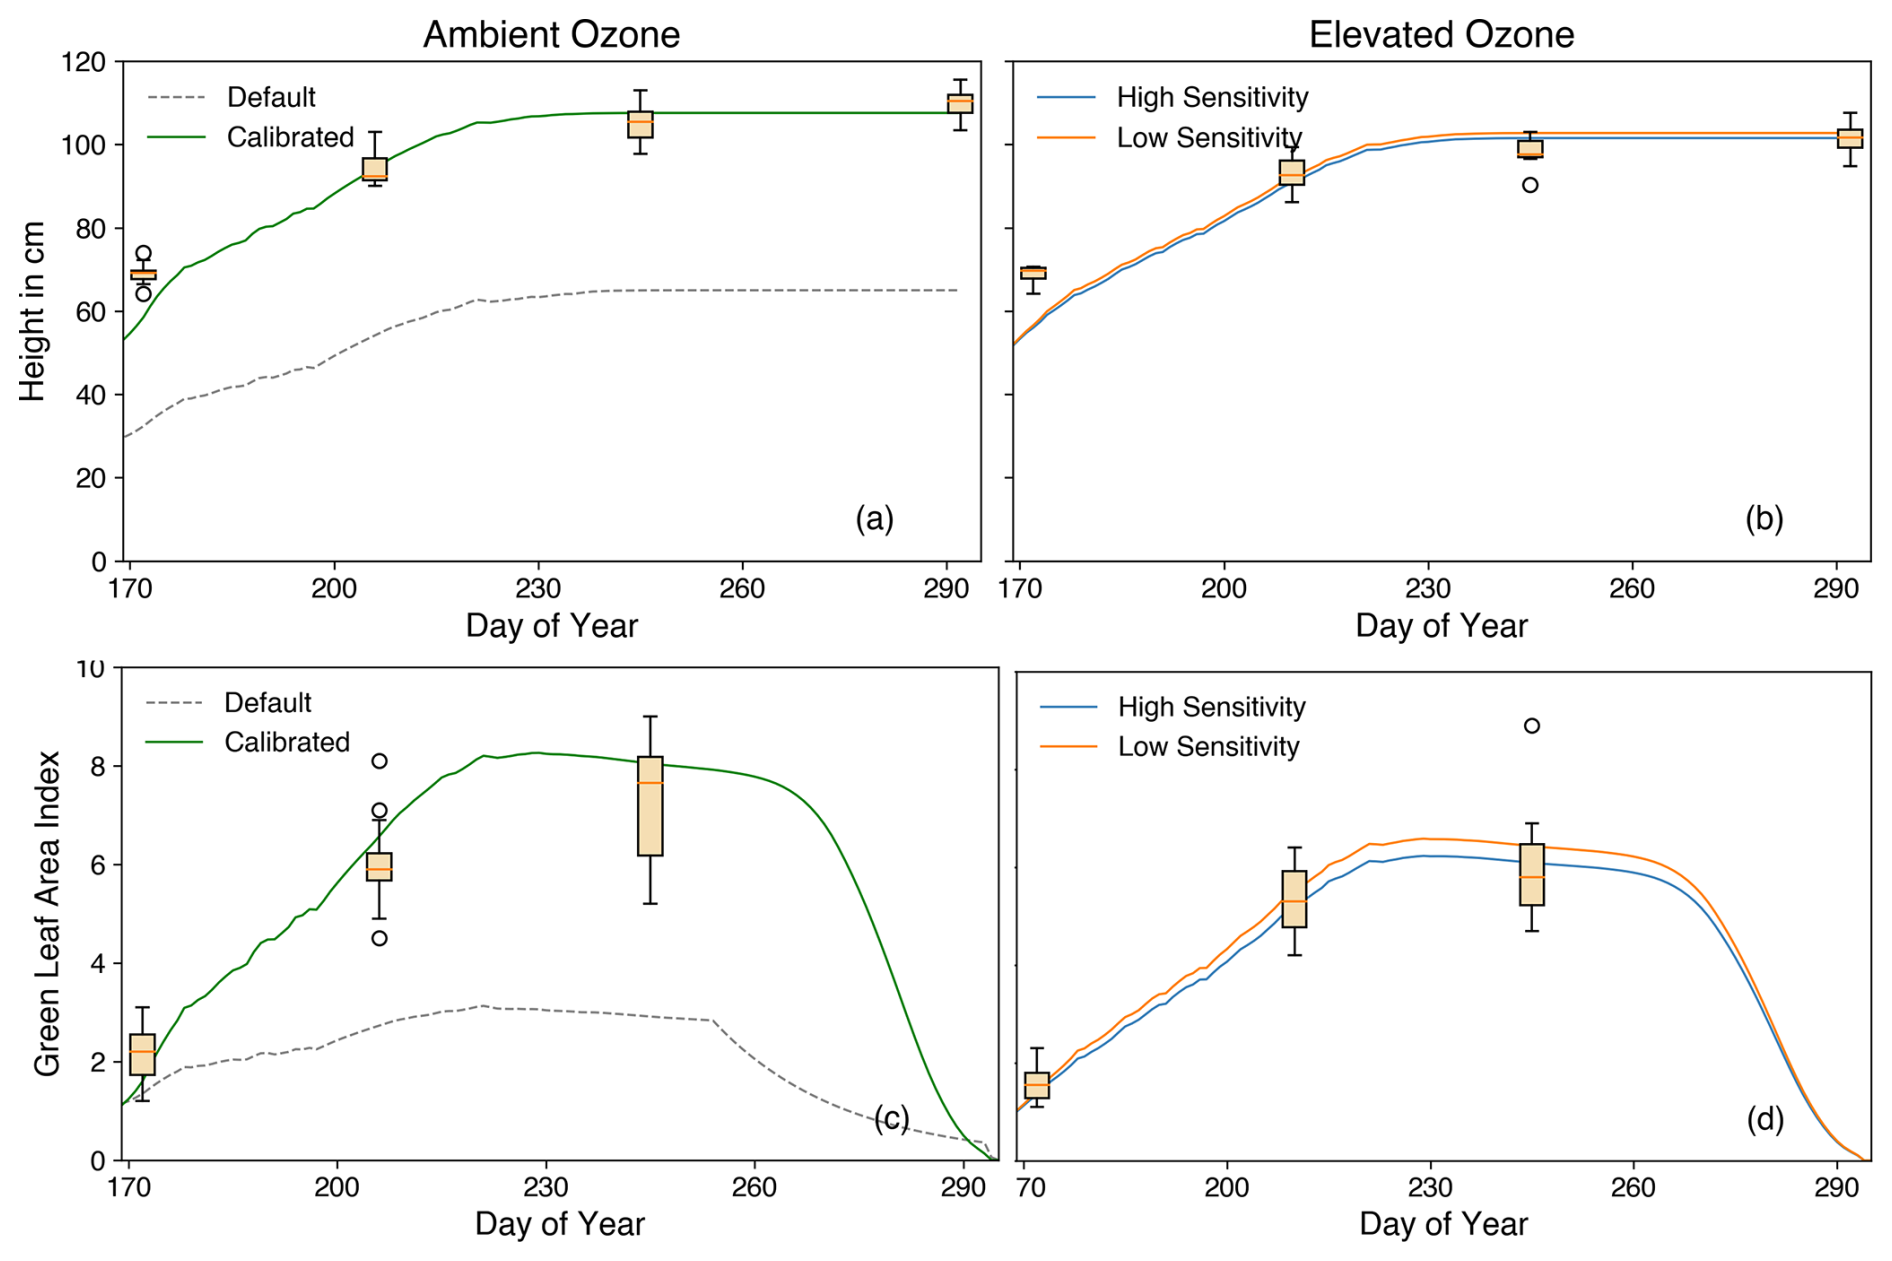
Figure 12Crop height (cm) and green leaf area index (LAI) are shown versus the day of year under ambient and elevated O3 conditions. Box plots show observations, whereas lines show the simulation results using parameters from Osborne et al. (2015) (grey) and calibrated (green) parameters under ambient O3 conditions, including high (blue) and low (orange) O3 sensitivity under elevated O3 conditions.
3.2 Evaluation
Figure 13 compares simulated and observed values of leaf carbon, stem carbon, total aboveground biomass, and rice height for the years 2022 and 2023, based on data from an independent FACE experiment (see Sect. 2.2). The observations were limited to heading and maturity stages. These observations were compared to our newly calibrated JULES-crop model simulations using these FACE observations. The calibrated O3-damage parameters were applied to model the impact of O3 on rice biomass and carbon content.
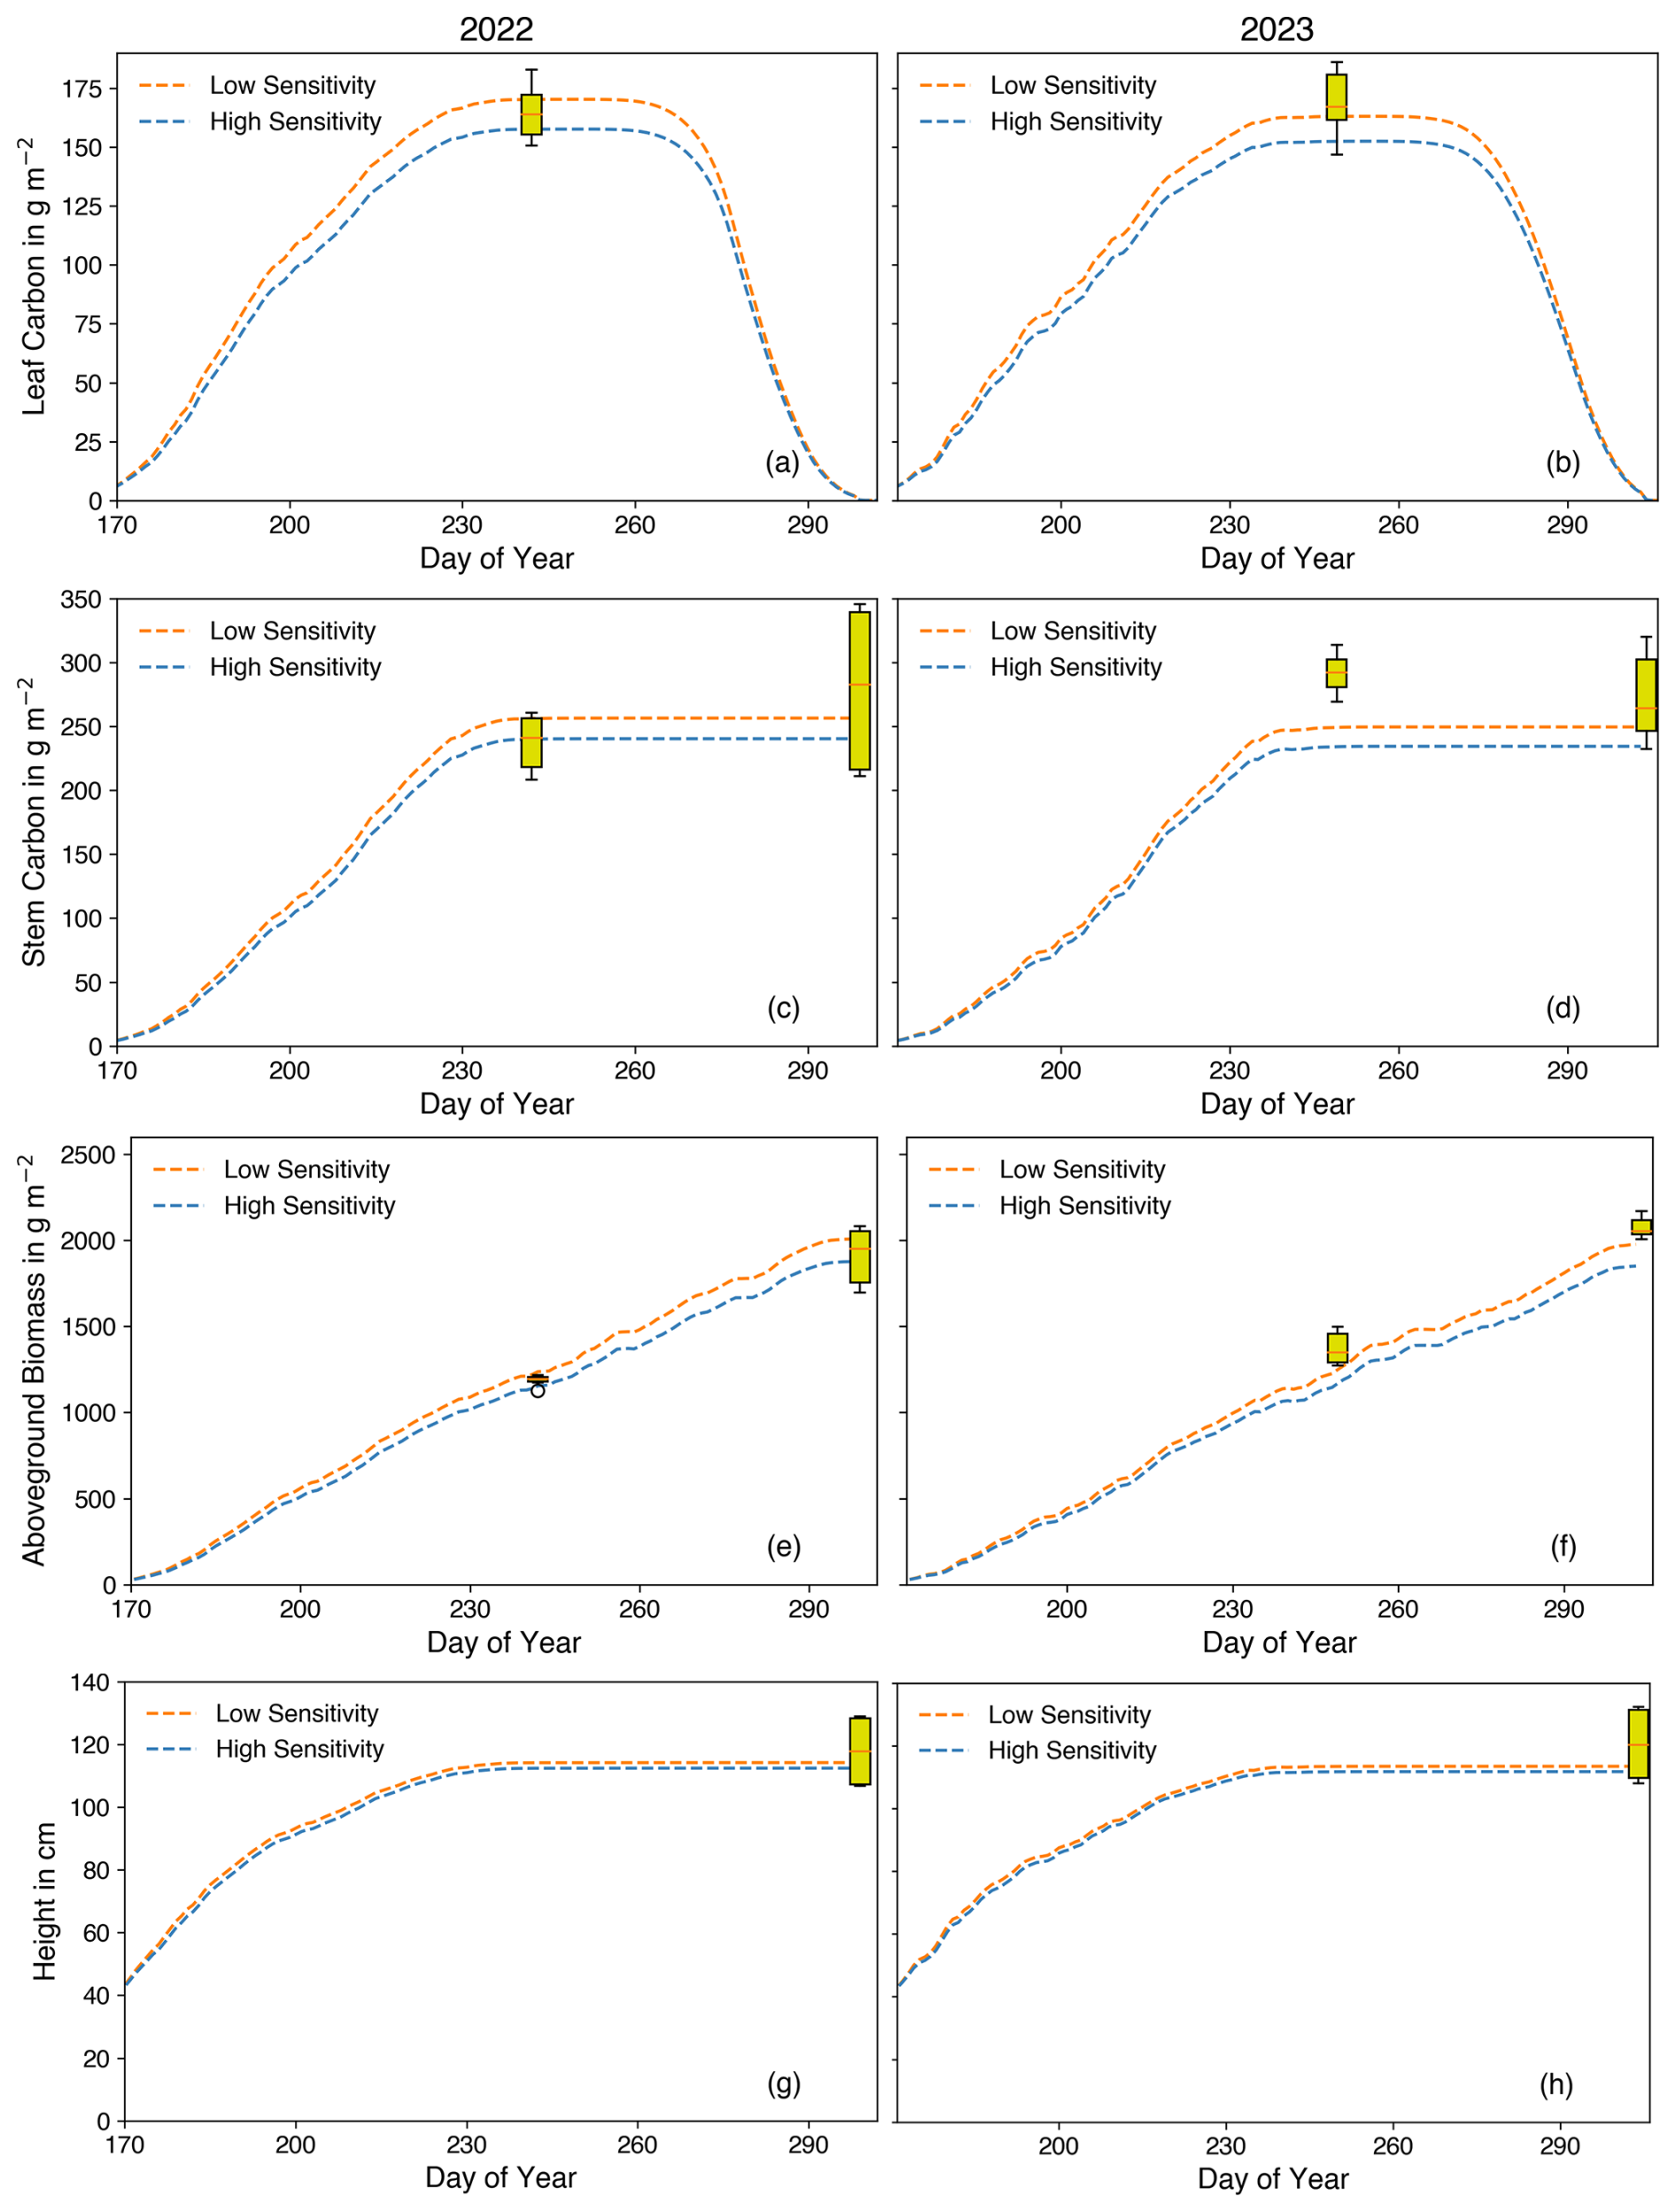
Figure 13Leaf, stem, total aboveground biomass, and crop height against the day of year for 2022 and 2023. Box plots are observations, and coloured lines show the simulation results using low (orange) and high (blue) O3 sensitivity, respectively.
The simulated stem carbon was marginally lower than the average observed values (Fig. 13c and d), while total aboveground biomass was overestimated when using low O3 sensitivity parameters (Fig. 13e and f). These variations can be attributed to differences in the carbon allocation between the calibration and evaluation experiments. The seeding depth notably influenced stem weight since stems thickened nearer the root, and only aboveground stems were harvested and measured. Consequently, deeper seeding resulted in a smaller fraction of stem biomass relative to total aboveground biomass (Gong et al., 2023). This slight underestimation of stem carbon was also evident in the simulation of crop height, which was similarly affected by seeding depth.
The total biomass observed in the evaluation experiment surpassed that measured in the O3-FACE experiment, particularly with a notably larger stem weight. Crop parameters were calibrated using data from the O3-FACE experiment, but differences in agronomic practices across experiments may have introduced uncertainties.
While the simulated crop height fell within the range of observed values, it was marginally lower than the average measured height (Fig. 13g and h). Despite variations in seeding practices between the calibration and evaluation field experiments, the carbon distribution and levels aligned well with the observations. Overall, JULES-crop demonstrated the ability to accurately predict rice growth and carbon allocation across various carbon pools.
3.3 Limitations
While this study provides a rice model calibration based on the novel O3-FACE experiments, several limitations must be acknowledged. The calibrated O3 parameters influence modelled net photosynthesis, biomass, and yield through the control on stomatal uptake and instantaneous photosynthesis. Due to limited O3-FACE observations, our calibration did not represent differences in O3 sensitivity due to rice cultivar.
Additionally, the calibrated thermal time was specific to a particular location and should be recalculated using local air temperature and rice phenology data if simulations are performed for other regions. For example, the evaluation experiment conducted in 2023 in a nearby county exhibited a relatively high thermal time compared to the calibration experiment, primarily due to the longer growth duration. Rice growth in the 2022 and 2023 evaluation experiments was severely affected by crop pests and diseases at the maturity stage, leading to significant yield loss. As a result, only crop growth characteristics were used to validate the model.
Furthermore, although the model was calibrated and evaluated using independent experimental data, directly applying the parameters to global simulations may introduce significant uncertainties. As such, global simulations using the parameters derived in this study should incorporate further evaluations to verify model performance (Müller et al., 2017).
This study marks a significant advancement in modelling rice growth and O3 effects by providing the first calibration of the JULES-crop model using rice-specific data from O3-FACE experiments. These experiments offer a realistic field setting to assess the impacts of O3 on crops, addressing the limitations of alternative setups such as OTCs by simulating more natural environmental conditions. Initial simulations with the default rice parameters in JULES-crop revealed substantial underestimation of carbon accumulation throughout the growth cycle. Calibration using the most recent O3-FACE data significantly improved the model's ability to replicate rice physiology, phenology, yield, and O3 sensitivity.
The calibration process involved adjusting key parameters to align simulations with observed data, including leaf area indices; crop height; yield; and the biomass of leaves, stems, and panicles. The model was refined to accurately represent yield reductions caused by elevated O3 levels. Evaluation against independent field experiments demonstrated good agreement between simulated outcomes and observed results, affirming the model's robustness.
This study deepens our understanding of O3's impact on rice production and delivers a newly calibrated model suitable for assessing future climate scenarios and O3 effects. The study lays the groundwork for future agricultural research aimed at mitigating O3-induced yield losses, providing a valuable framework for enhancing food security as O3 levels continue to rise.
This study used JULES (Joint UK Land Environment Simulator) version 7.4, which was released in November 2023. The model is available for download from the UK Met Office Science Repository Service (MOSRS) (https://code.metoffice.gov.uk/trac/jules, last access: 1 November 2023), with registration required. For simulating photosynthesis rates, we used the Leaf Simulator (Williams et al., 2019), which is accessible at https://code.metoffice.gov.uk/trac/utils (last access: 23 June 2025).
The calibrated driving data in this study are openly available in Zenodo at https://doi.org/10.5281/zenodo.14008269 (Xu et al., 2025). The O3-FACE data that support the calibration of this study are available on request from the corresponding author Lianxin Yang (lxyang@yzu.edu.cn). The FACE data for evaluation are available on request from the author Yu Jiang (yujiang@njau.edu.cn).
The supplement related to this article is available online at https://doi.org/10.5194/gmd-18-7257-2025-supplement.
BX: methodology, formal analysis, investigation, visualisation, writing – original draft preparation, revised drafts, review and editing. SD: conceptualisation, research discussions and guidance, review and editing. HY: conceptualisation, research discussions and guidance, review and editing. LY: provision of FACE data and advice. YJ: provision of FACE data and advice. AC: research discussions and guidance, review and editing. KW: research discussions, review and editing. YW: provision of FACE data and advice. TW: provision of FACE data and advice.
The contact author has declared that none of the authors has any competing interests.
Publisher's note: Copernicus Publications remains neutral with regard to jurisdictional claims made in the text, published maps, institutional affiliations, or any other geographical representation in this paper. While Copernicus Publications makes every effort to include appropriate place names, the final responsibility lies with the authors.
Beiyao Xu gratefully acknowledges financial support from the Dual Award – Nanjing University/University of Leeds Studentship. This work used JASMIN, the UK's collaborative data analysis environment (https://www.jasmin.ac.uk, last access: 1 October 2025).
This work was supported by the National Key Basic Research Development Program of China (grant no. 2024YFC3711905). The authors are grateful for the support of the National Natural Science Foundation of China (grant no. 42477103). This work was supported by the Dual Award – Nanjing University/University of Leeds Studentship.
This paper was edited by Roslyn Henry and reviewed by two anonymous referees.
Aspray, E. K., Mies, T. A., McGrath, J. A., Montes, C. M., Dalsing, B., Puthuval, K. K., Whetten, A., Herriott, J., Li, S., Bernacchi, C. J., DeLucia, E. H., Leakey, A. D. B., Long, S. P., McGrath, J. M., Miglietta, F., Ort, D. R., and Ainsworth, E. A.: Two decades of fumigation data from the Soybean Free Air Concentration Enrichment facility, Sci. Data, 10, 226, https://doi.org/10.1038/s41597-023-02118-x, 2023.
Best, M. J., Pryor, M., Clark, D. B., Rooney, G. G., Essery, R. L. H., Ménard, C. B., Edwards, J. M., Hendry, M. A., Porson, A., Gedney, N., Mercado, L. M., Sitch, S., Blyth, E., Boucher, O., Cox, P. M., Grimmond, C. S. B., and Harding, R. J.: The Joint UK Land Environment Simulator (JULES), model description – Part 1: Energy and water fluxes, Geosci. Model Dev., 4, 677–699, https://doi.org/10.5194/gmd-4-677-2011, 2011.
Chang, K. and Zhang, Q.: Modeling of downward longwave radiation and radiative cooling potential in China, J. Renew. Sustain. Energy, 11, https://doi.org/10.1063/1.5117319, 2019.
Clark, D. B., Mercado, L. M., Sitch, S., Jones, C. D., Gedney, N., Best, M. J., Pryor, M., Rooney, G. G., Essery, R. L. H., Blyth, E., Boucher, O., Harding, R. J., Huntingford, C., and Cox, P. M.: The Joint UK Land Environment Simulator (JULES), model description – Part 2: Carbon fluxes and vegetation dynamics, Geosci. Model Dev., 4, 701–722, https://doi.org/10.5194/gmd-4-701-2011, 2011.
Collatz, G. J., Ball, J. T., Grivet, C., and Berry, J. A.: Physiological and environmental regulation of stomatal conductance, photosynthesis and transpiration: a model that includes a laminar boundary layer, Agric. For. Meteorol., 54, 107–136, 1991.
Cox, P., Betts, R., Bunton, C., Essery, R., Rowntree, P., and Smith, J.: The impact of new land surface physics on the GCM simulation of climate and climate sensitivity, Clim. Dynam., 15, 183–203, https://doi.org/10.1007/s003820050276, 1999.
De Vries, F. P., Jansen, D., Ten Berge, H., and Bakema, A.: Simulation of ecophysiological processes of growth in several annual crops, Int. Rice Res. Inst., ISBN 9022009378, https://books.google.co.uk/books?id=tf86jwZLxzEC&lpg=PR2&ots=pZfJroDOCk&dq=De Vries, F. P., D. Jansen, H. Ten Berge and A. Bakema (1989). Simulation of ecophysiological processes of growth in several annual crops, Int. Rice Res. Inst.&lr&pg=PR1#v=onepage&q&f=false (last access: 1 October 2025), 1989.
Droutsas, I., Challinor, A. J., Arnold, S. R., Mikkelsen, T. N., and Hansen, E. M. Ø.: A new model of ozone stress in wheat including grain yield loss and plant acclimation to the pollutant, Eur. J. Agron., 120, 126125, https://doi.org/10.1016/j.eja.2020.126125, 2020.
Emberson, L. D., Pleijel, H., Ainsworth, E. A., van den Berg, M., Ren, W., Osborne, S., Mills, G., Pandey, D., Dentener, F., Büker, P., Ewert, F., Koeble, R., and Van Dingenen, R.: Ozone effects on crops and consideration in crop models, Eur. J. Agron., 100, 19–34, https://doi.org/10.1016/j.eja.2018.06.002, 2018.
Ewert, F. and Porter, J. R.: Ozone effects on wheat in relation to CO2: modelling short-term and long-term responses of leaf photosynthesis and leaf duration, Glob. Chang. Biol., 6, 735–750, https://doi.org/10.1046/j.1365-2486.2000.00351.x, 2000.
Farquhar, G. D., von Caemmerer, S., and Berry, J. A.: A biochemical model of photosynthetic CO2 assimilation in leaves of C3 species, Planta, 149, 78–90, https://doi.org/10.1007/BF00386231, 1980.
Feng, Z., Uddling, J., Tang, H., Zhu, J., and Kobayashi, K.: Comparison of crop yield sensitivity to ozone between open-top chamber and free-air experiments, Glob. Chang. Biol., 24, 2231–2238, https://doi.org/10.1111/gcb.14077, 2018.
Feng, Z., Xu, Y., Kobayashi, K., Dai, L., Zhang, T., Agathokleous, E., Calatayud, V., Paoletti, E., Mukherjee, A., Agrawal, M., Park, R. J., Oak, Y. J., and Yue, X.: Ozone pollution threatens the production of major staple crops in East Asia, Nat. Food, 3, 47–56, https://doi.org/10.1038/s43016-021-00422-6, 2022.
Gong, D., Dai, G., Chen, Y., and Yu, G.: Optimal tillage depths for enhancing rice yield, quality and lodging resistance in the rice production systems of northeast China, PeerJ, 11, e15739, https://doi.org/10.7717/peerj.15739, 2023.
Guarin, J. R., Jägermeyr, J., Ainsworth, E. A., Oliveira, F. A. A., Asseng, S., Boote, K., Elliott, J., Emberson, L., Foster, I., Hoogenboom, G., Kelly, D., Ruane, A. C., and Sharps, K.: Modeling the effects of tropospheric ozone on the growth and yield of global staple crops with DSSAT v4.8.0, Geosci. Model Dev., 17, 2547–2567, https://doi.org/10.5194/gmd-17-2547-2024, 2024.
He, Y., Wang, K., and Feng, F.: Improvement of ERA5 over ERA-Interim in Simulating Surface Incident Solar Radiation throughout China, J. Clim., 34, 3853–3867, https://doi.org/10.1175/JCLI-D-20-0300.1, 2021.
Hunt, R.: Basic growth analysis: plant growth analysis for beginners, Springer Science & Business Media, https://doi.org/10.1007/978-94-010-9117-6, 2012.
Jiang, H., Yang, Y., Bai, Y., and Wang, H.: Evaluation of the Total, Direct, and Diffuse Solar Radiations From the ERA5 Reanalysis Data in China, IEEE Geosci. Remote Sens. Lett., 17, 47–51, https://doi.org/10.1109/LGRS.2019.2916410, 2020.
Kumar, R. and Umanand, L.: Estimation of global radiation using clearness index model for sizing photovoltaic system, Renew. Energy, 30, 2221–2233, https://doi.org/10.1016/j.renene.2005.02.009, 2005.
Leung, F., Williams, K., Sitch, S., Tai, A. P. K., Wiltshire, A., Gornall, J., Ainsworth, E. A., Arkebauer, T., and Scoby, D.: Calibrating soybean parameters in JULES 5.0 from the US-Ne2/3 FLUXNET sites and the SoyFACE−O3 experiment, Geosci. Model Dev., 13, 6201–6213, https://doi.org/10.5194/gmd-13-6201-2020, 2020.
Leung, F., Sitch, S., Tai, A. P. K., Wiltshire, A. J., Gornall, J. L., Folberth, G. A., and Unger, N.: CO2 fertilization of crops offsets yield losses due to future surface ozone damage and climate change, Environ. Res. Lett., 17, https://doi.org/10.1088/1748-9326/ac7246, 2022.
Li, Z., Yang, X., and Tang, H.: Evaluation of the hourly ERA5 radiation product and its relationship with aerosols over China, Atmos. Res., 294, 106941, https://doi.org/10.1016/j.atmosres.2023.106941, 2023.
Liu, K., Chen, Y., Li, S., Wang, W., Zhang, W., Zhang, H., Gu, J., Yang, J., and Liu, L.: Differing responses of root morphology and physiology to nitrogen application rates and their relationships with grain yield in rice, Crop J., 11, 618–627, https://doi.org/10.1016/j.cj.2022.07.019, 2023.
Mathison, C., Challinor, A. J., Deva, C., Falloon, P., Garrigues, S., Moulin, S., Williams, K., and Wiltshire, A.: Implementation of sequential cropping into JULESvn5.2 land-surface model, Geosci. Model Dev., 14, 437–471, https://doi.org/10.5194/gmd-14-437-2021, 2021.
Mills, G., Hayes, F., Simpson, D., Emberson, L., Norris, D., Harmens, H., and Bueker, P.: Evidence of widespread effects of ozone on crops and (semi-)natural vegetation in Europe (1990–2006) in relation to AOT40- and flux-based risk maps, Glob. Chang. Biol., 17, 592–613, https://doi.org/10.1111/j.1365-2486.2010.02217.x, 2011.
Mills, G., Sharps, K., Simpson, D., Pleijel, H., Frei, M., Burkey, K., Emberson, L., Uddling, J., Broberg, M., Feng, Z., Kobayashi, K., and Agrawal, M.: Closing the global ozone yield gap: Quantification and cobenefits for multistress tolerance, Glob. Chang. Biol., 24, 4869–4893, https://doi.org/10.1111/gcb.14381, 2018.
Monin, A. and Obukhov, A.: Osnovnye zakonomernosti turbulentnogo peremeshivanija v prizemnom sloe atmosfery (Basic laws of turbulent mixing in the atmosphere near the ground), Trudy Geofiz. Inst. AN SSSR, 24, 163–187, 1954.
Montes, C. M., Demler, H. J., Li, S., Martin, D. G., and Ainsworth, E. A.: Approaches to investigate crop responses to ozone pollution: from O3-FACE to satellite-enabled modeling, Plant J., 109, 432–446, https://doi.org/10.1111/tpj.15501, 2022.
Moura, B. B., Manzini, J., Paoletti, E., and Hoshika, Y.: A three-year free-air experimental assessment of ozone risk on the perennial Vitis vinifera crop species, Environmental Pollution, 338, 122626, https://doi.org/10.1016/j.envpol.2023.122626, 2023.
Müller, C., Elliott, J., Chryssanthacopoulos, J., Arneth, A., Balkovic, J., Ciais, P., Deryng, D., Folberth, C., Glotter, M., Hoek, S., Iizumi, T., Izaurralde, R. C., Jones, C., Khabarov, N., Lawrence, P., Liu, W., Olin, S., Pugh, T. A. M., Ray, D. K., Reddy, A., Rosenzweig, C., Ruane, A. C., Sakurai, G., Schmid, E., Skalsky, R., Song, C. X., Wang, X., de Wit, A., and Yang, H.: Global gridded crop model evaluation: benchmarking, skills, deficiencies and implications, Geosci. Model Dev., 10, 1403–1422, https://doi.org/10.5194/gmd-10-1403-2017, 2017.
Osborne, T., Gornall, J., Hooker, J., Williams, K., Wiltshire, A., Betts, R., and Wheeler, T.: JULES-crop: a parametrisation of crops in the Joint UK Land Environment Simulator, Geosci. Model Dev., 8, 1139–1155, https://doi.org/10.5194/gmd-8-1139-2015, 2015.
Pleijel, H., Danielsson, H., Ojanperä, K., De Temmerman, L., Högy, P., Badiani, M., and Karlsson, P.: Relationships between ozone exposure and yield loss in European wheat and potato – a comparison of concentration- and flux-based exposure indices, Atmos. Environ., 38, 2259–2269, 2004.
Pleijel, H., Danielsson, H., and Broberg, M. C.: Benefits of the Phytotoxic Ozone Dose (POD) index in dose-response functions for wheat yield loss, Atmos. Environ., 268, 118797, https://doi.org/10.1016/j.atmosenv.2021.118797, 2022.
Ramya, A., Dhevagi, P., Poornima, R., Avudainayagam, S., Watanabe, M., and Agathokleous, E.: Effect of ozone stress on crop productivity: A threat to food security, Environ. Res., 236, 116816, https://doi.org/10.1016/j.envres.2023.116816, 2023.
Ronan, A. C., Ducker, J. A., Schnell, J. L., and Holmes, C. D.: Have improvements in ozone air quality reduced ozone uptake into plants?, Elementa: Sci. Anthropocene, 8, https://doi.org/10.1525/elementa.399, 2020.
Sitch, S., Cox, P. M., Collins, W. J., and Huntingford, C.: Indirect radiative forcing of climate change through ozone effects on the land-carbon sink, Nature, 448, 791–794, https://doi.org/10.1038/nature06059, 2007.
Tai, A. P. K., Sadiq, M., Pang, J. Y. S., Yung, D. H. Y., and Feng, Z.: Impacts of Surface Ozone Pollution on Global Crop Yields: Comparing Different Ozone Exposure Metrics and Incorporating Co-effects of CO2, Front. Sustain. Food Syst., 5, https://doi.org/10.3389/fsufs.2021.534616, 2021.
Tang, H., Liu, G., Han, Y., Zhu, J., and Kobayashi, K.: A system for free-air ozone concentration elevation with rice and wheat: Control performance and ozone exposure regime, Atmos. Environ., 45, 6276–6282, https://doi.org/10.1016/j.atmosenv.2011.08.059, 2011.
Tong, L., He, T., Ma, Y., and Zhang, X.: Evaluation and intercomparison of multiple satellite-derived and reanalysis downward shortwave radiation products in China, Int. J. Digit. Earth, 16, 1853–1884, 2023.
Van Dingenen, R., Dentener, F. J., Raes, F., Krol, M. C., Emberson, L., and Cofala, J.: The global impact of ozone on agricultural crop yields under current and future air quality legislation, Atmos. Environ., 43, 604–618, 2009.
Vianna, M. S., Williams, K. W., Littleton, E. W., Cabral, O., Cerri, C. E. P., De Jong van Lier, Q., Marthews, T. R., Hayman, G., Zeri, M., Cuadra, S. V., Challinor, A. J., Marin, F. R., and Galdos, M. V.: Improving the representation of sugarcane crop in the Joint UK Land Environment Simulator (JULES) model for climate impact assessment, GCB Bioenergy, 14, 1097–1116, https://doi.org/10.1111/gcbb.12989, 2022.
Wang, W., Peng, S., Liu, H., Tao, Y., Huang, J., Cui, K., and Nie, L.: The possibility of replacing puddled transplanted flooded rice with dry seeded rice in central China: A review, Field Crops Research, 214, 310–320, 2017.
Wang, Y., Yang, L., Han, Y., Zhu, J., Kobayashi, K., Tang, H., and Wang, Y.: The impact of elevated tropospheric ozone on grain quality of hybrid rice: A free-air gas concentration enrichment (FACE) experiment, Field Crops Research, 129, 81–89, https://doi.org/10.1016/j.fcr.2012.01.019, 2012.
Williams, K., Gornall, J., Harper, A., Wiltshire, A., Hemming, D., Quaife, T., Arkebauer, T., and Scoby, D.: Evaluation of JULES-crop performance against site observations of irrigated maize from Mead, Nebraska, Geosci. Model Dev., 10, 1291–1320, https://doi.org/10.5194/gmd-10-1291-2017, 2017.
Williams, K. E., Harper, A. B., Huntingford, C., Mercado, L. M., Mathison, C. T., Falloon, P. D., Cox, P. M., and Kim, J.: How can the First ISLSCP Field Experiment contribute to present-day efforts to evaluate water stress in JULESv5.0?, Geosci. Model Dev., 12, 3207–3240, https://doi.org/10.5194/gmd-12-3207-2019, 2019.
Wolffe, M. C., Wild, O., Long, S. P., and Ashworth, K.: Temporal variability in the impacts of particulate matter on crop yields on the North China Plain, Science of The Total Environment, 776, 145135, https://doi.org/10.1016/j.scitotenv.2021.145135, 2021.
Xu, M. Q., Yao, Q., Chen, D. L., Li, M. C., Li, R. Y., Gao, B. B., Zhao, B., and Chen, Z. Y.: Estimating the impact of ground ozone concentrations on crop yields across China from 2014 to 2018: A multi-model comparison, Environmental Pollution, 283, https://doi.org/10.1016/j.envpol.2021.117099, 2021.
Xu, B., Dobbie, S., Yang, H., Yang, L., Jiang, Y., Challinor, A., Williams, K., Yunxia, W., and Wang, T.: A first calibration of JULES-crop version 7.4 for rice using the novel O3-FACE experiment in China, Zenodo [data set], https://doi.org/10.5281/zenodo.14008269, 2025.
Yadav, A., Bhatia, A., Yadav, S., Kumar, V., and Singh, B.: The effects of elevated CO2 and elevated O3 exposure on plant growth, yield and quality of grains of two wheat cultivars grown in north India, Heliyon, 5, https://doi.org/10.1016/j.heliyon.2019.e02317, 2019.