the Creative Commons Attribution 4.0 License.
the Creative Commons Attribution 4.0 License.
 | 02 Oct 2025
Improving annual fine mineral dust representation from the surface to the column in GEOS-Chem 14.4.1
Dandan Zhang
Randall V. Martin
Xuan Liu
Aaron van Donkelaar
Christopher R. Oxford
Yanshun Li
Danny M. Leung
Jasper F. Kok
Longlei Li
Haihui Zhu
Jay R. Turner
Yu Yan
Michael Brauer
Yinon Rudich
Eli Windwer
Accurate representation of mineral dust remains a challenge for global air quality or climate models due to inadequate parametrization of the emission scheme, removal mechanisms, and size distribution. While various studies have constrained aspects of dust emission fluxes and/or dust optical depth, annual mean surface dust concentrations still vary by factors of 5–10 among models. In this study, we focus on improving the annual simulation of fine dust in the GEOS-Chem chemical transport model, leveraging recent mechanistic understanding of dust source and removal, and reconciling the size differences between models and ground-based measurements. Specifically, we conduct sensitivity simulations using GEOS-Chem in its high performance configuration (GCHP) version 14.4.1 to investigate the effects of mechanism or parameter updates on annual mean concentrations. The results are evaluated by comparisons versus Deep Blue satellite-based aerosol optical depth (AOD) and AErosol RObotic NETwork (AERONET) ground-based AOD for total column abundance, and versus the Surface Particulate Matter Network (SPARTAN) for novel measurements of surface PM2.5 dust concentrations. Reconciling modelled geometric diameter versus measured aerodynamic diameter is important for consistent comparison. The two-fold overestimation of surface fine dust in the standard model is alleviated by 39 % without degradation of total column abundance by implementing a new physics-based dust emission scheme with better spatial distribution. Further reduction by 20 % of the overestimation of surface PM2.5 dust is achieved through reducing the mass fraction of emitted fine dust based on the brittle fragmentation theory, and explicit tracking of three additional fine mineral dust size bins with updated parametrization for below-cloud scavenging. Overall, these developments reduce the normalized mean difference against surface fine dust measurements from SPARTAN from 94 % to 35 %, while retaining comparable skill of total column abundance against satellite and ground-based AOD.
- Article
(24528 KB) - Full-text XML
- BibTeX
- EndNote


Mineral dust exerts significant impacts on air quality as the most abundant aerosol component by mass globally (Kok et al., 2021b), on ecosystem health through nutrient transport and deposition such as phosphorous (Bayon et al., 2024; Swap et al., 1992) and iron (Jickells et al., 2005), and on climate through its direct scattering and absorbing of radiation and indirect modifications of cloud properties (Kok et al., 2017; Liao and Seinfeld, 1998; Mahowald et al., 2014). Despite its importance, accurate representation of long-term concentrations of mineral dust remains a challenge for global air quality or climate models due to inadequate parametrization of the emission scheme (Darmenova et al., 2009; Kok, 2011; Leung et al., 2023), removal mechanisms (Jones et al., 2022; Petroff and Zhang, 2010; Ryu and Min, 2022; Wang et al., 2014b; Zhang and Shao, 2014; Zhang et al., 2001), and size distribution (Kok et al., 2017; Mahowald et al., 2014). Observational constraints from satellite have been applied to reduce the large uncertainty of simulated mineral dust and its emissions (Mytilinaios et al., 2023; Ridley et al., 2016). However, intercomparison projects with various models still suggest large variability within a factor of 2 for the annual mean total column abundance of mineral dust, with even larger variability in surface concentrations and deposition by factors of 5–10 (Huneeus et al., 2011; Uno et al., 2006; Wu et al., 2020).
In addition to total column observations, ground-level measurements of mineral dust offer another promising opportunity to understand mechanisms affecting the accuracy of the surface concentration simulation and the variable performance from the surface to the total column in intercomparison projects. The Surface PARTiculate mAtter Network (SPARTAN, https://www.spartan-network.org/, last access: 4 February 2025) is a globally distributed monitoring network that measures the chemical components of fine particulate matter (PM2.5), including in arid environments (Liu et al., 2024; Snider et al., 2015). These ground-based measurements of mineral dust in PM2.5 offer new data to evaluate, understand, and improve fine dust simulation in global models.
Dust emissions play a central role in controlling the surface and total column abundance of mineral dust (Kok et al., 2014; Leung et al., 2023; Tian et al., 2021). The predicted spatial distribution of dust emissions particularly affects the downwind dust concentrations through long-range transport and deposition (Prospero, 1999). A new physics-based dust emission scheme (Leung et al., 2023) includes recent developments in the parametrization of the threshold of friction velocity for dust mobilization (Martin and Kok, 2018), combined drag partitioning effects due to rocks (Marticorena and Bergametti, 1995) and vegetation (Pierre et al., 2014a) for a better representation of exerted surface friction velocity (Leung et al., 2023), and intermittent dust mobilization due to high-frequency turbulence (Comola et al., 2019). This dust emission scheme has achieved better spatial correlations of dust column abundance against ground-based and satellite-derived dust optical depth in the Community Earth System Model version 2 (CESM2) (Leung et al., 2023, 2024). However, the effects of these new developments of dust emission scheme on the bias against ground-based measurements of surface fine dust concentrations are less well known and require further investigation.
The source and removal of dust in the size bins used in dust parametrizations can vary by orders of magnitude across the broad size range of mineral dust (Kok, 2011; Wang et al., 2014b; Zhang et al., 2001). Accounting for this size heterogeneity among dust bins could enable better representation of the global dust cycle. Prior studies have found an underestimation of coarse dust emissions and an overestimation of fine dust (Cakmur et al., 2006; Kok, 2011; Kok et al., 2017). While various studies have focused on developing the representation of coarse or super coarse dust (Kok et al., 2017; Meng et al., 2022), investigation of the effects of different emission size distributions on ambient fine dust are needed through comparison with in situ fine dust measurements. In addition, the developments and improvements of parallel computing in air quality or climate models (Eastham et al., 2018; Harris et al., 2020; Hu et al., 2018; Martin et al., 2022) offer computational capabilities to extend dust size bins with explicit treatments that could enable better representation of dust, especially with rapid variation in processes across different sizes. While the parametrization of dry deposition has been revisited and evaluated against observations (Emerson et al., 2020), below-cloud or washout scavenging has been generally limited to lumped treatments for fine and coarse aerosols in the bulk models (Jones et al., 2022; Wang et al., 2011, 2014a). Developments of the size-resolved parametrization for below-cloud (washout) scavenging (Wang et al., 2014b) are promising to improve the wet deposition of fine dust, which is especially important in distant downwind regions due to long-range transport.
Many studies have examined daily dust variability for the purpose of short-term prediction (Amato et al., 2013; Tindan et al., 2023; Yu et al., 2021). Our study focuses on a different objective of accuracy of annual mean concentrations.
In this study, we implement recent developments of a new dust emission scheme with further refinements including the clay content and wetness in the topsoil layer; reducing the dust emissions over wet, snow and vegetation covered land surfaces; while constraining the global and regional source with satellite aerosol optical depth (AOD). We revisit the size distribution of emitted dust, explicitly track mineral dust with geometric diameter less than 2 µm in four size bins, and update the parametrization for size-resolved washout scavenging. We conduct sensitivity simulations using the GEOS-Chem chemical transport model in its high performance configuration (GCHP) to investigate the effects of these developments. We focus on improving the annual fine dust representation in GCHP from the surface to the column, by comparisons against ground-level fine dust measurements, and against the ground-based and satellite-retrieved AOD over dusty regions of the Sahara, the Middle East and Asia.
2.1 Data sources
Ground-based AOD measurements are obtained from the Aerosol Robotic Network (AERONET) Version 3 Level 2 database with improved cloud screening (Giles et al., 2019). The median number of days with AERONET measurements is 168 d for each site. We average daily AERONET AOD to an annual mean in the year of 2018. We use satellite retrievals of AOD from the Deep Blue algorithm (Hsu et al., 2019) based on Collection 6.1 of the Moderate Resolution Imaging Spectroradiometer (MODIS) instrument aboard the satellite platforms of Terra with local overpass around 10:30 and of Aqua around 13:30, and the Version 2.0 Deep Blue aerosol global product of the Visible Infrared Imaging Radiometer Suite (VIIRS) instruments aboard the joint NASA/NOAA Suomi National Polar-orbiting Partnership (Suomi NPP) and NOAA-20 satellites with local overpass around 13:30 (Cao et al., 2014). We choose the Deep Blue aerosol product due to its optimization for the retrieval of aerosol properties over bright surfaces, which is typical over arid regions. We average daily Deep Blue aerosol data for the year 2018. Simulated AOD is coincidently sampled with available daily Deep Blue AOD. We compare simulated AOD over mainly dusty regions (defined as from simulations) against satellite and AERONET AOD to reduce the effects of errors in other AOD components and focus on the performance of mineral dust.
We use the Version 4.2 Level 3 gridded cloud-free tropospheric aerosol extinction profile product during daytime and nighttime of the last 15 years (2007–2021) retrieved from the Cloud–Aerosol Lidar with Orthogonal Polarization (CALIOP) on board the Cloud–Aerosol Lidar Infrared Pathfinder Satellite Observations (CALIPSO) satellite for climatological aerosol profiles (Young et al., 2018).
We use global ground-based data from the Surface Particulate Matter Network (SPARTAN; https://www.spartan-network.org/, last access: 4 February 2025) with filter-based PM2.5 chemical composition data (Liu et al., 2024; Snider et al., 2015). Particles with aerodynamic diameter less than 2.5 µm are collected on Teflon filters using AirPhoton SS5 sampling stations with a sharp-cut cyclone (SCC) 1.829 that operates at a target flow rate of 5 L min−1. The sampling station follows either a standard sampling protocol or the National Aeronautics and Space Administration (NASA) – Italian Space Agency (ASI) Multi-Angle Imager for Aerosols (MAIA) sampling protocol. Under the standard sampling protocol, PM2.5 is collected at staggered 3-hour intervals over a 9 d period, generating a 24 h PM2.5 sample covering a full diel cycle. Under the MAIA sampling protocol, PM2.5 is collected continuously for 24 h from 09:00 a.m. to 09:00 a.m. at a mission-defined frequency, which has been typically every 3 d during the sampling periods used here. The starting dates for MAIA sites are listed in Table A1 in the Appendix. SPARTAN samples are analyzed for fine mineral dust concentrations using X-ray Fluorescence (XRF) and a global mineral dust equation (Eq. A1 in the Appendix; Liu et al., 2022) including correction of attenuation effects due to mass loading. The 5-year averaged surface fine dust concentrations from SPARTAN sites are listed in Table A1. We use data from sites with at least 10 samples for the 5-year (2019–2023) period after the network began using XRF with samples. A sensitivity analysis requiring at least 50 samples per site is also conducted. This study used 2296 filters from 25 SPARTAN sites for a total of 10 072 observational days.
Ground-based observations of PM2.5 dust over North America are constructed with a global dust (Eq. A1; Liu et al., 2022) and the elemental measurements from the Air Quality System (AQS) database for speciated PM2.5 observations in the United States (https://aqs.epa.gov/aqsweb/airdata/download_files.html#Daily, last access: 8 April 2025) and from the National Air Pollution Surveillance Program in Canada (https://data-donnees.az.ec.gc.ca/data/air/monitor/national-air-pollution-surveillance-naps-program/Data-Donnees/2018/?lang=en, last access: 8 April 2025). The AQS database includes measurements from both the Interagency Monitoring of Protected Visual Environments (IMPROVE) and Chemical Speciation Network (CSN) networks.
2.2 GEOS-Chem chemical transport model
We use the GEOS-Chem chemical transport model (http://www.geos-chem.org, last access: 4 February 2025) in its high-performance configuration (Eastham et al., 2018) version 14.4.1 (The International GEOS-Chem User Community, 2024) with improved performance and usability (Martin et al., 2022). The model is driven by meteorological inputs from GEOS Forward Processing (GEOS-FP; https://gmao.gsfc.nasa.gov/, last access: 4 February 2025) with a fine resolution 0.25° × 0.3125° (∼ 25 km) and 72 hybrid sigma-pressure vertical levels up to 0.01 hPa. GEOS-FP uses dynamic near-real-time assimilation algorithms compared to consistent static assimilation algorithms used in Modern-Era Retrospective analysis for Research and Applications Version 2 (MERRA-2; https://gmao.gsfc.nasa.gov/GMAO_products/, last access: 19 April 2025). We choose GEOS-FP over MERRA-2 for this study since GEOS-FP offers finer resolution for dust emission calculations.
GEOS-Chem simulates detailed oxidant-aerosol chemistry in the troposphere and stratosphere, with gas-phase mechanism of HOx-NOx-BrOx-VOC-O3 chemistry (Bey et al., 2001; Wang et al., 2021), coupled to aerosol chemistry for sulfate-nitrate-ammonium (SNA) aerosol (Park et al., 2004), black carbon (BC) (Wang et al., 2014a), and primary and secondary organic aerosol (Pai et al., 2020), sea salt (Jaeglé et al., 2011), and natural and anthropogenic dust (Fairlie et al., 2007; Meng et al., 2021; Philip et al., 2017; Zhang et al., 2013). The gas-aerosol partitioning for SNA is computed by the HETP v1.0 thermodynamic module (Miller et al., 2024). We use the simple, irreversible, direct yield scheme for secondary organic aerosol production (Pai et al., 2020). The effects of aerosol on photolysis rates are computed with relative humidity dependent aerosol size distributions and optical properties for hydrophilic aerosols with improved parametrization for the effective radii of inorganic and organic aerosols (Latimer and Martin, 2019; Ridley et al., 2012; Zhu et al., 2023) and updated optical properties for aspherical hydrophobic mineral dust (http://geoschemdata.wustl.edu/ExtData/CHEM_INPUTS/CLOUD_J/v2025-01/FJX_scat-aer.dat, last access: 7 April 2025) for different dust size bins as calculated by Singh et al. (2024) using the T-matrix method for an equiprobable mixture of prolate and oblate spheroids with varying aspect ratios using complex refractive indices from Sinyuk et al. (2003).
The standard dry deposition scheme in GEOS-Chem accounts for gravitational settling, aerodynamic resistance with respect to turbulent transport within the surface layer, and surface resistance to particle-surface contact due to Brownian diffusion, impaction, and interception with an observation constrained parametrization (Emerson et al., 2020; Zhang et al., 2001). Wet deposition includes separate algorithms for scavenging in convective updrafts, and in-cloud and below-cloud scavenging from precipitation (Liu et al., 2001; Wang et al., 2011, 2014a).
Emissions for GEOS-Chem are configured using the Harmonized Emissions Component (HEMCO) module v3.9.1 (Lin et al., 2021). Global anthropogenic emissions are from the Community Emissions Data System (CEDS) v2 at 0.5° × 0.5° resolution (Feng et al., 2020). Offline emissions of lightning NOx (Murray et al., 2012), biogenic VOCs, soil NOx, sea salt (Weng et al., 2020) and mineral dust (Sects. 2.3 and 4.2) at 0.25° × 0.3125° resolution are included to represent emission processes at the finest available resolution and to enable consistent emission fluxes across model resolutions. Open fire emissions are from the daily Global Fire Emissions Database (GFED) v4.1s (Giglio et al., 2013) at 0.25° × 0.25° resolution. Other default emission inventories in GCHP v14.4.1 include volcanic SO2 emissions (Fisher et al., 2011), marine emissions of dimethylsulfide (DMS) (Breider et al., 2017) at 1° × 1° resolution, and ammonia at 0.25° × 0.25° resolution (Bouwman et al., 1997; Croft et al., 2016). We conduct GCHP simulations at C48 (∼ 200 km) resolution for the full year of 2018 following a one-month spin-up.
2.3 Default dust emission scheme
The default dust emission scheme in GEOS-Chem (hereafter GC Dust) originally implemented by Fairlie et al. (2007) is based on the semi-empirical Mineral Dust Entrainment and Deposition (DEAD) emission scheme (Zender et al., 2003) and the GOCART topographical source function (Ginoux et al., 2001) updated to a fine resolution of 0.25° × 0.25° (Meng et al., 2021). The total dust emission flux in kg m−2 s−1 is calculated based on Zender et al. (2003) and Fairlie et al. (2007):
where Cg is a global scaling factor and CNA is a regional scaling factor in North America for total annual emissions of ∼ 2000 Tg yr−1 as optimized by Meng et al. (2021); fbare is the bare ground fraction as specified in Zender et al. (2003) to reduce dust emissions over wet, snow and vegetation covered surfaces:
where Al, Awl, and Asnow is the fraction of land covered by lakes, wetlands, and snow, respectively. LAI is the leaf area index, and LAIthr is the threshold LAI to reduce the bare soil fraction due to vegetation cover, which is set to 0.3 m2 m−2 by default.
S is a topographical source function (Ginoux et al., 2001) updated at fine resolution of 0.25° × 0.25° and multiplied by the fraction of bare surface within each grid cell (Meng et al., 2021); φ is the sandblasting efficiency to convert horizontal saltation flux to vertical dust flux (Marticorena and Bergametti, 1995):
where fclay is the clay content in the topsoil layer and is set to a global constant value of 0.2 to reduce excessive sensitivity of dust emission fluxes to fclay (Zender et al., 2003). Qs is the horizontal saltation flux as described in Sect. A2 in the Appendix.
2.4 Size distribution of emitted dust
The default size distribution of emitted dust in GEOS-Chem implemented by Zhang et al. (2013) is based on the Brittle Fragmentation Theory (Kok, 2011) with fitted parameter values for better agreement of dust observations from the Interagency Monitoring of Protected Visual Environments (IMPROVE) ground-based monitoring network in the United States:
where Vd is the normalized volume for emitted dust aerosols in diameter of Dd in µm; cV is the normalization constant to make the integration total of Vd of 1; µm is the median diameter of soil particles; σs=3.0 is the geometric standard deviation of soil particles; λ is the side crack propagation length, whose value is 8 µm in the default particle size distribution (PSD) used in the GEOS-Chem (GC PSD), and is 12 µm in the Kok PSD (Kok, 2011).
Table 1The binning of mineral dust in 4-bin and 7-bin simulations using GEOS-Chem. The geometric diameter range is listed in the bracket adjacent to each size bin in unit of µm.
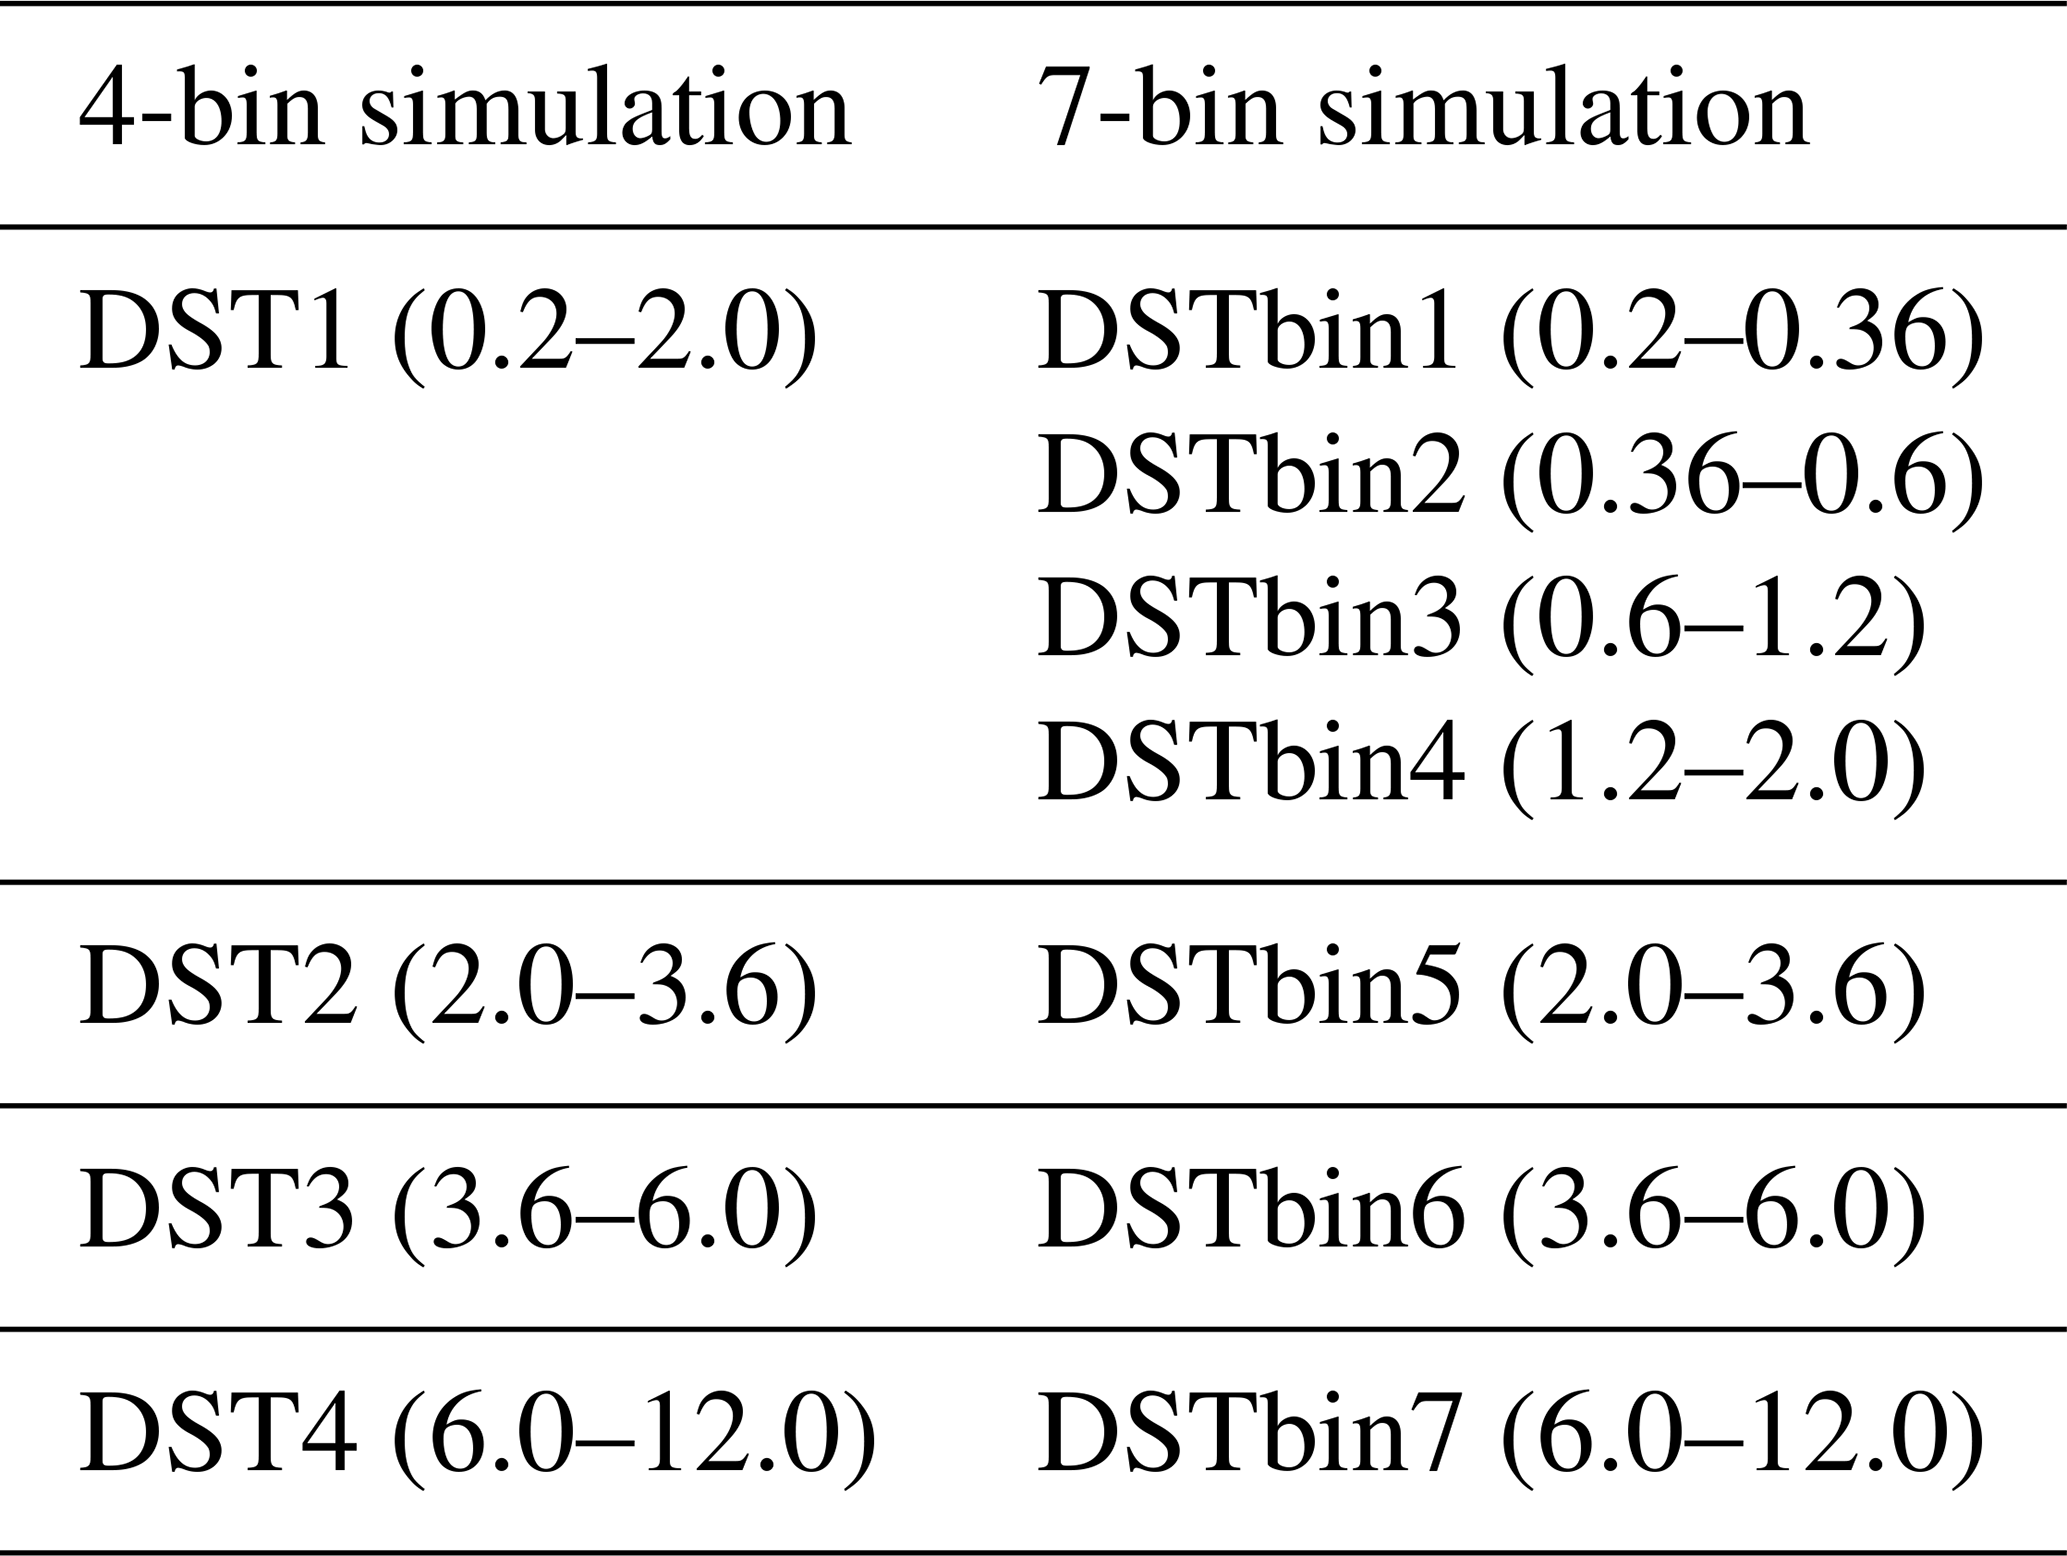
Dust aerosols are conventionally separated into several dust bins to compromise between accuracy and computational expense (Ginoux et al., 2001; Zender et al., 2003). Table 1 summarizes the binning of mineral dust in 4-bin and 7-bin simulations. In the GEOS-Chem standard bulk configuration used here, 4 dust size bins are used including DST1 to DST4 covering geometric diameter of 0.2–12.0 µm (Fairlie et al., 2007). For DST1, 4 sub-bins of 0.2–0.36, 0.36–0.6, 0.6–1.2, and 1.2–2.0 µm are further separated for heterogeneous chemistry and AOD calculations, with shared emission, transport and deposition altogether as DST1 (Fairlie et al., 2007). To improve submicron dust representation, we implement full separation of the 7 dust bins for coupled physical and chemical processes in GEOS-Chem, as discussed in Sect. 4.3.2.
2.5 Reconciling geometric and aerodynamic diameter
A recent study has emphasized the importance of reconciling the geometric diameter used in models and the aerodynamic diameter used in ground-based measurements, especially for mineral dust with higher particle density of ∼ 2500 kg m−3 than the standard density of 1000 kg m−3 and with aspherical shapes observed in the atmosphere (Huang et al., 2021). We harmonize the differences between geometric diameter and aerodynamic diameter based on Reid et al. (2003):
where Daer is the aerodynamic diameter; Dgeo is the geometric diameter; ρd=2500 kg m−3 is the dust density; ρ0=1000 kg m−3 is the standard spherical particle density; χ is the dynamic shape factor calculated by and Fs is Stokes form factor (Bagheri and Bonadonna, 2016; Huang et al., 2020) which can be calculated by where is the particle length to width ratio, and is the particle height to width ratio (Huang et al., 2021). With this conversion, the aerodynamic diameter of 2.5 µm corresponds to the geometric diameter of 1.7 µm. The mass fraction of each simulated dust size bin to the total fine dust mass concentrations can be calculated by the integration of the dust size distribution of Eq. (4) with the λ value of 8 µm of the default PSD used in the GEOS-Chem (GC PSD), which is 68 % of DST1 with diameter of 0.2–2.0 µm.
In addition to harmonizing different size types used in models and measurements, prior studies also suggested that the sharpness of size cut-off of different inlets used to collect PM2.5 samples can affect the measured concentrations (Kenny et al., 2000; Peters et al., 2001). To evaluate the effects, we obtain the dust size distributions of different inlets by multiplying their penetration efficiencies (Peters et al., 2001) and GC PSD (Eq. 4).
Figure 1 shows the effects of the sharpness of size cut on the size distribution of collected dust PM2.5 samples. All four inlets have a penetration efficiency of near unity for dust with geometric diameter less than 1.0 µm, which diminishes to 0.5 at a geometric diameter of 1.7 µm and further diminishes with increasing diameter. The Well Impactor Ninety-Six (WINS) referenced by the Federal Reference Method (FRM) exhibits the sharpest size cut. The corresponding dust PSD is sharply attenuated for geometric diameters greater than 1.7 µm. The resultant effects on the mass fractions of the dust size bin to be included in dust PM2.5 are small, with the mass fraction of DST1 ranging from 65 %–70 %. The mass fraction based on SCC 1.829 as used by SPARTAN differs by only −0.4 % from that based on the original GC PSD without inlet penetration correction. In our Base simulation using the standard version of GEOS-Chem, we calculate surface PM2.5 dust as 67.6 % of DST1 to account for both aerodynamic diameter and inlet collection efficiency. Neglect of these effects would have increased simulated PM2.5 dust concentrations by a factor of 2.
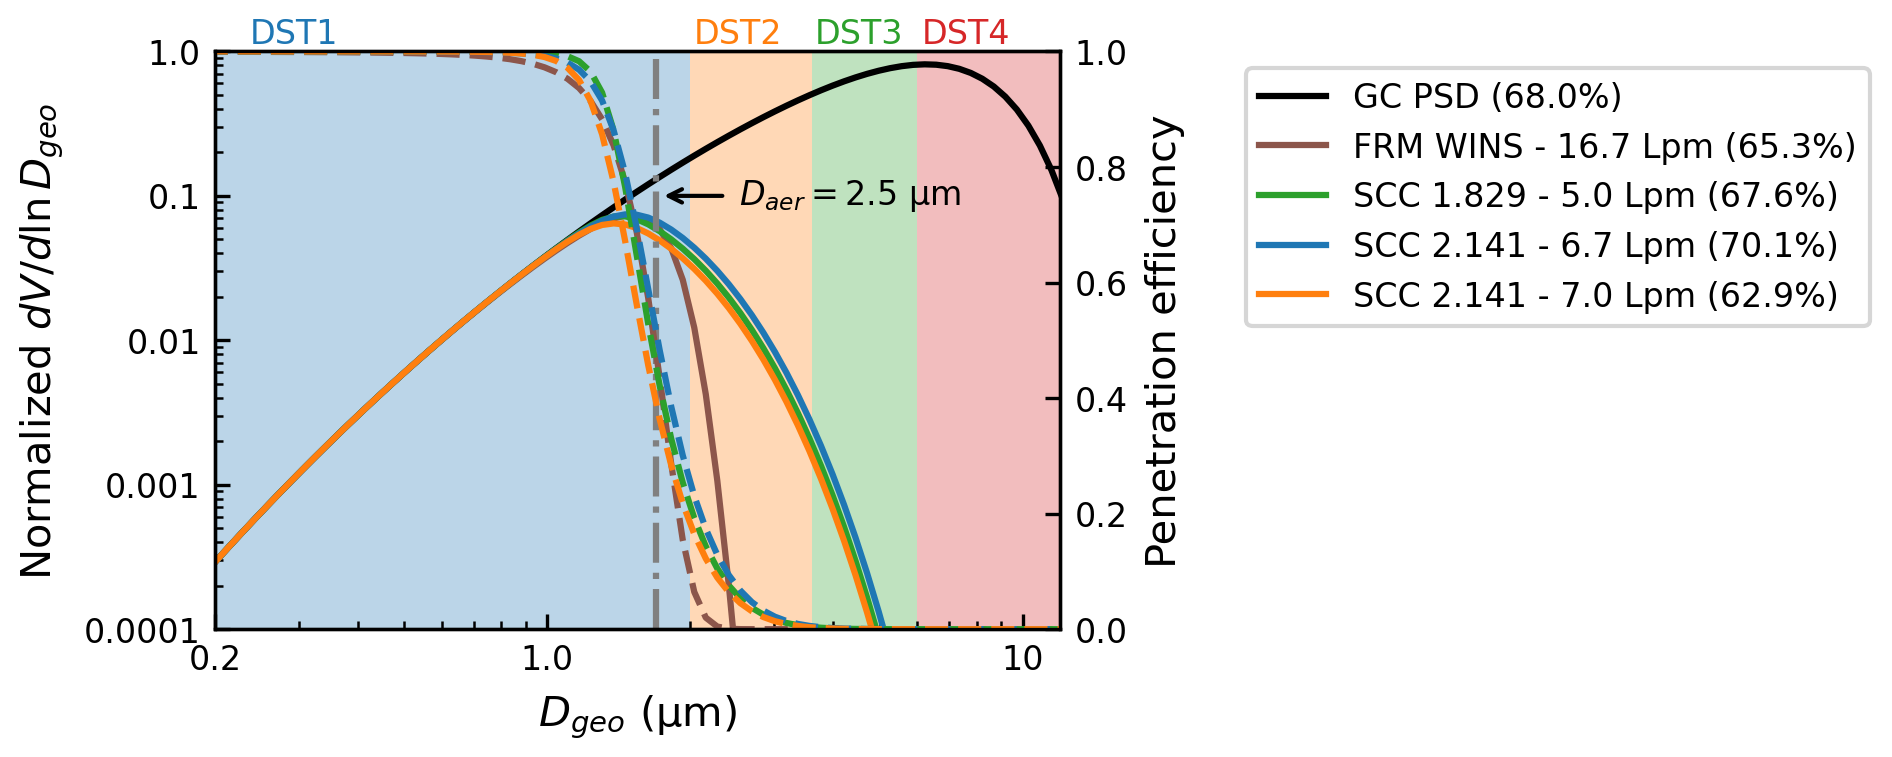
Figure 1Normalized particle size distribution (PSD) used by default in GEOS-Chem (GC PSD) in solid black with left axis; penetration efficiencies for different types of PM2.5 inlets shown in dashed colored lines with right axis, including the Well Impactor Ninety-Six (WINS), and three types of Sharp-Cut Cyclone (SCC) inlets; Solid colored lines show the adjusted GC PSD collected by different inlets. Grey dash-dotted line indicates the corresponding geometric diameter of 1.7 µm for the aerodynamic diameter of 2.5 µm. Filled rectangles indicate size ranges of 4 dust size bins. Percentages adjacent to GC PSD and different inlets are mass fractions of DST1 for the calculation of PM2.5 dust concentrations.
Figure 2 shows the spatial distributions of the annual total column AOD and surface PM2.5 dust from AERONET, SPARTAN, and the Base simulation using the standard version of GEOS-Chem in the year of 2018. Mineral dust largely determines the AOD in AERONET and GEOS-Chem over and downwind of the main dust source regions including the Sahara, Middle East, and the Taklamakan and Gobi deserts in Asia. The simulated AOD over dusty regions (simulated ) exhibits a high degree of consistency versus the ground-based observations of AERONET AOD with the regression slope near unity and R2 of 0.7. However, the simulated surface PM2.5 dust exhibits a pronounced overestimation by a factor of 2.4 compared to the ground-based measurements of SPARTAN. Simulated PM2.5 dust is overestimated at the dusty sites of Abu Dhabi in the United Arab Emirates by 163 %, Ilorin in Nigeria by 108 %, and Kanpur in India by 96 %.
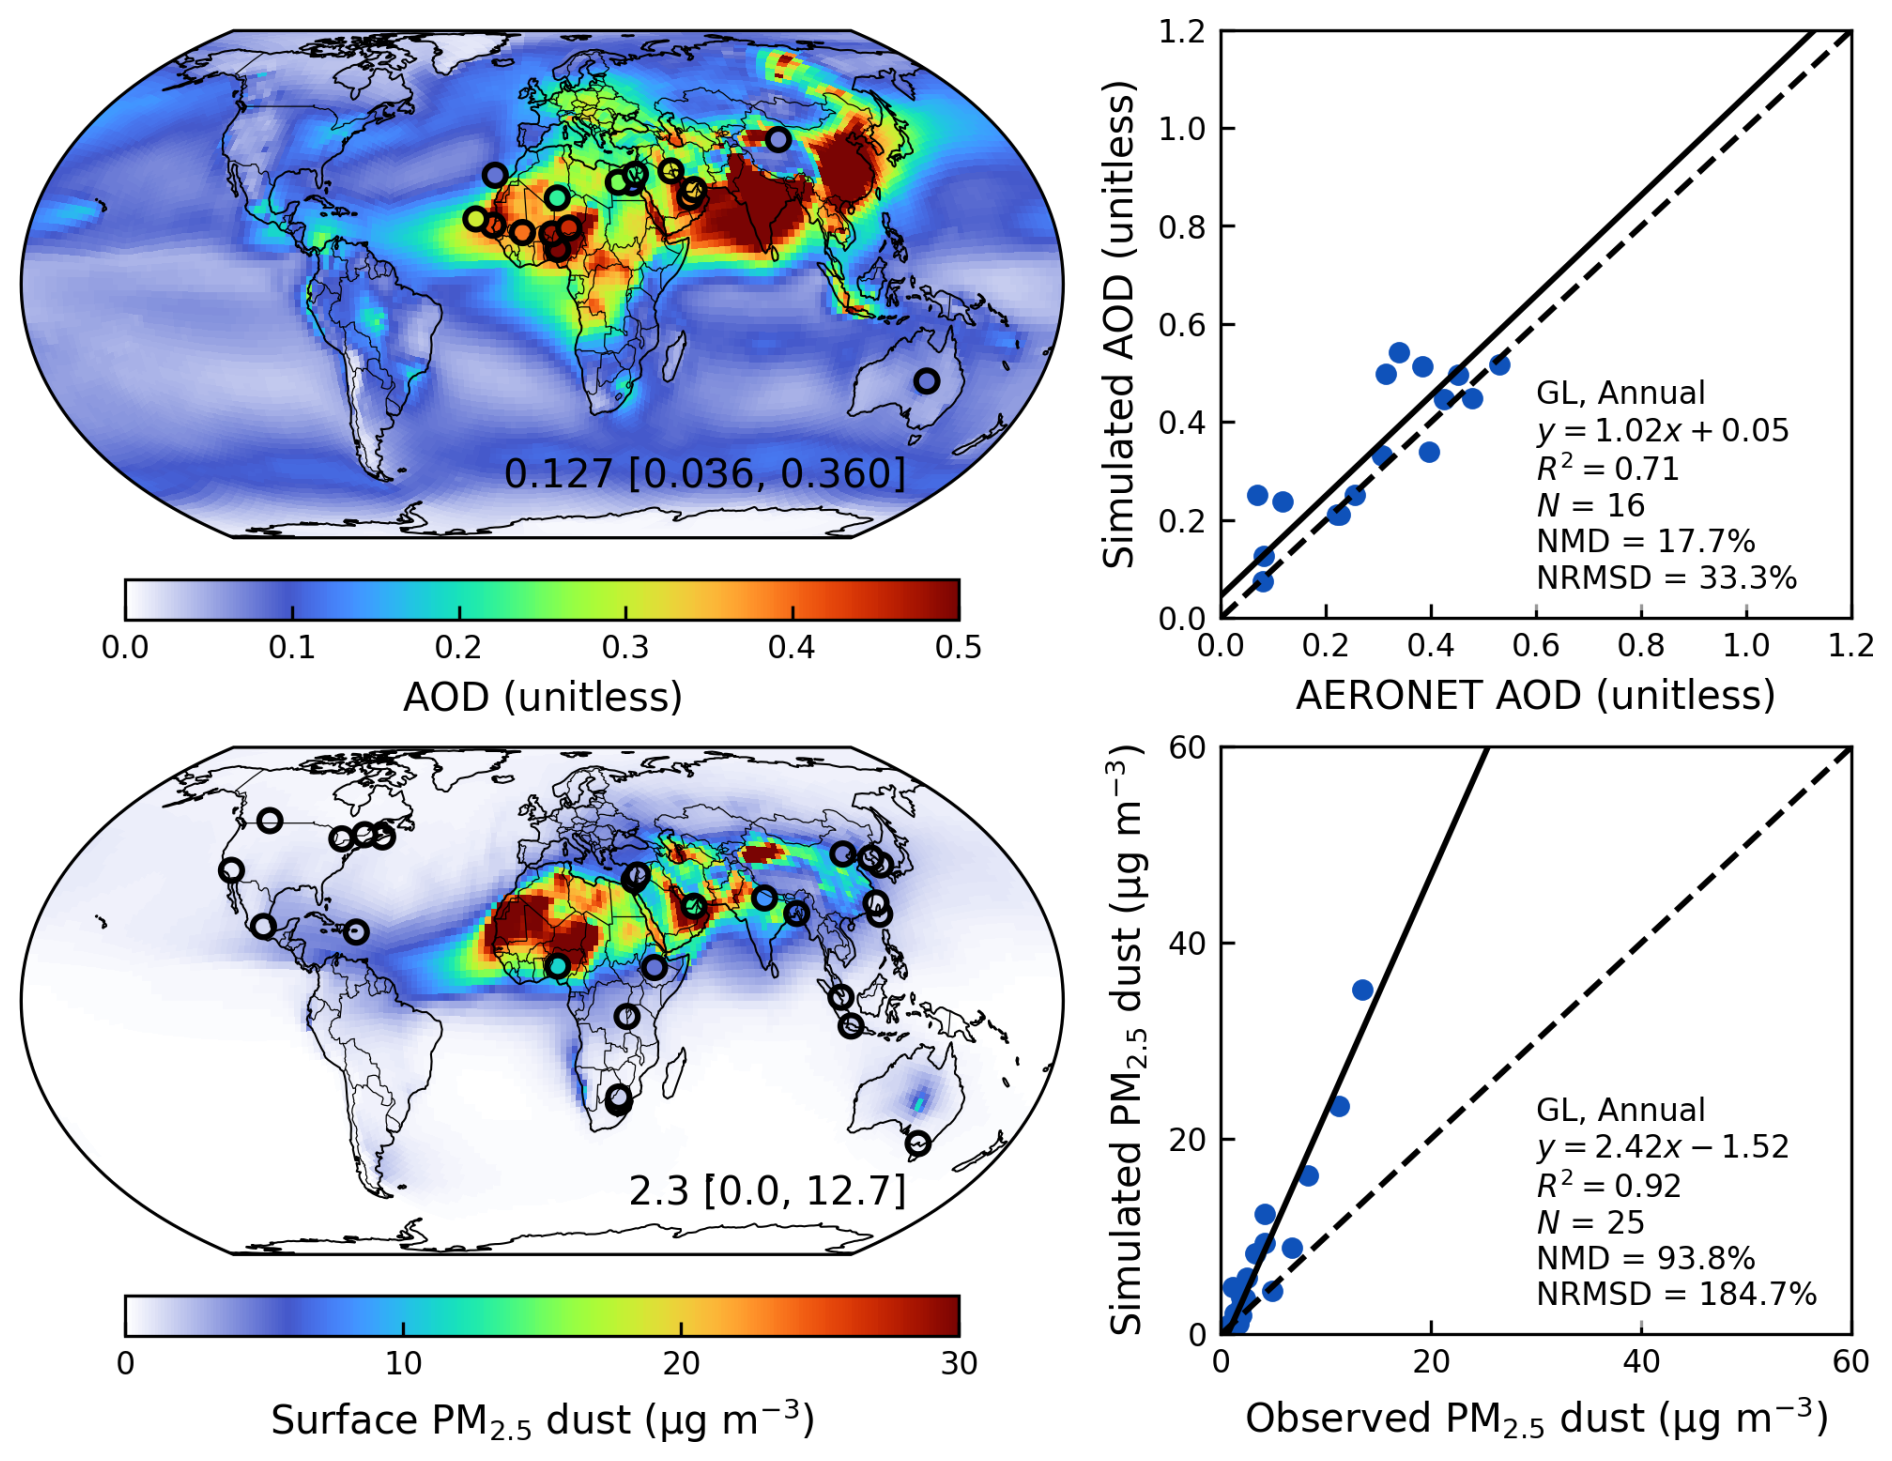
Figure 2Annual simulated aerosol optical depth (AOD) and comparison against ground-based observations from AERONET over dusty regions (simulated ) (top) in the year of 2018; Annual simulated surface PM2.5 dust and comparison against ground-based measurements from SPARTAN (bottom) from the Base simulation in the year of 2018. Filled circles on the maps represent ground-based observations from SPARTAN and AERONET. Inset values at the bottom right of the maps are arithmetical mean with 5th and 95th percentiles in the square brackets. Regression statistics including reduced-major-axis linear regression equation, coefficient of variation (R2), total number of points (N), normalized mean difference (NMD), and normalized root-mean-square difference (NRMSD) are listed at the bottom right of the scatter plots. Major source regions over land are outlined in red including: (1) the Sahara – SA, (2) Middle East – ME, and (3) Asia – AS. Major dust outflow regions over ocean are outlined in green including: (4) the Caribbean Sea – CRB, (5) the tropical Atlantic Ocean – TAT, (6) the Mediterranean Sea – MED, (7) the Arabian Sea – ARB, (8) the tropical Indian Ocean and the Bay of Bengal – IND, and (9) the northwestern Pacific Ocean – NWP.
Figure 3 shows the vertical profile of the aerosol extinction normalized by AOD over the main dust source regions and associated downwind regions, to understand the significant performance difference between the surface and the column, with the absolute extinction profile shown in Fig. A1 in the Appendix. The simulated vertical profile exhibits overall agreement against the 15-year (2007 to 2021) climatological mean extinction vertical profile from the CALIOP, with no evidence of a model overestimate in the lower mixed layer versus aloft, indicating the vertical distribution of mineral dust is not the main driver of the performance discrepancy between the surface and the column. However, further evaluations of the vertical profile near the surface are needed as CALIOP retrievals are challenging at lower altitudes especially below 100 m.
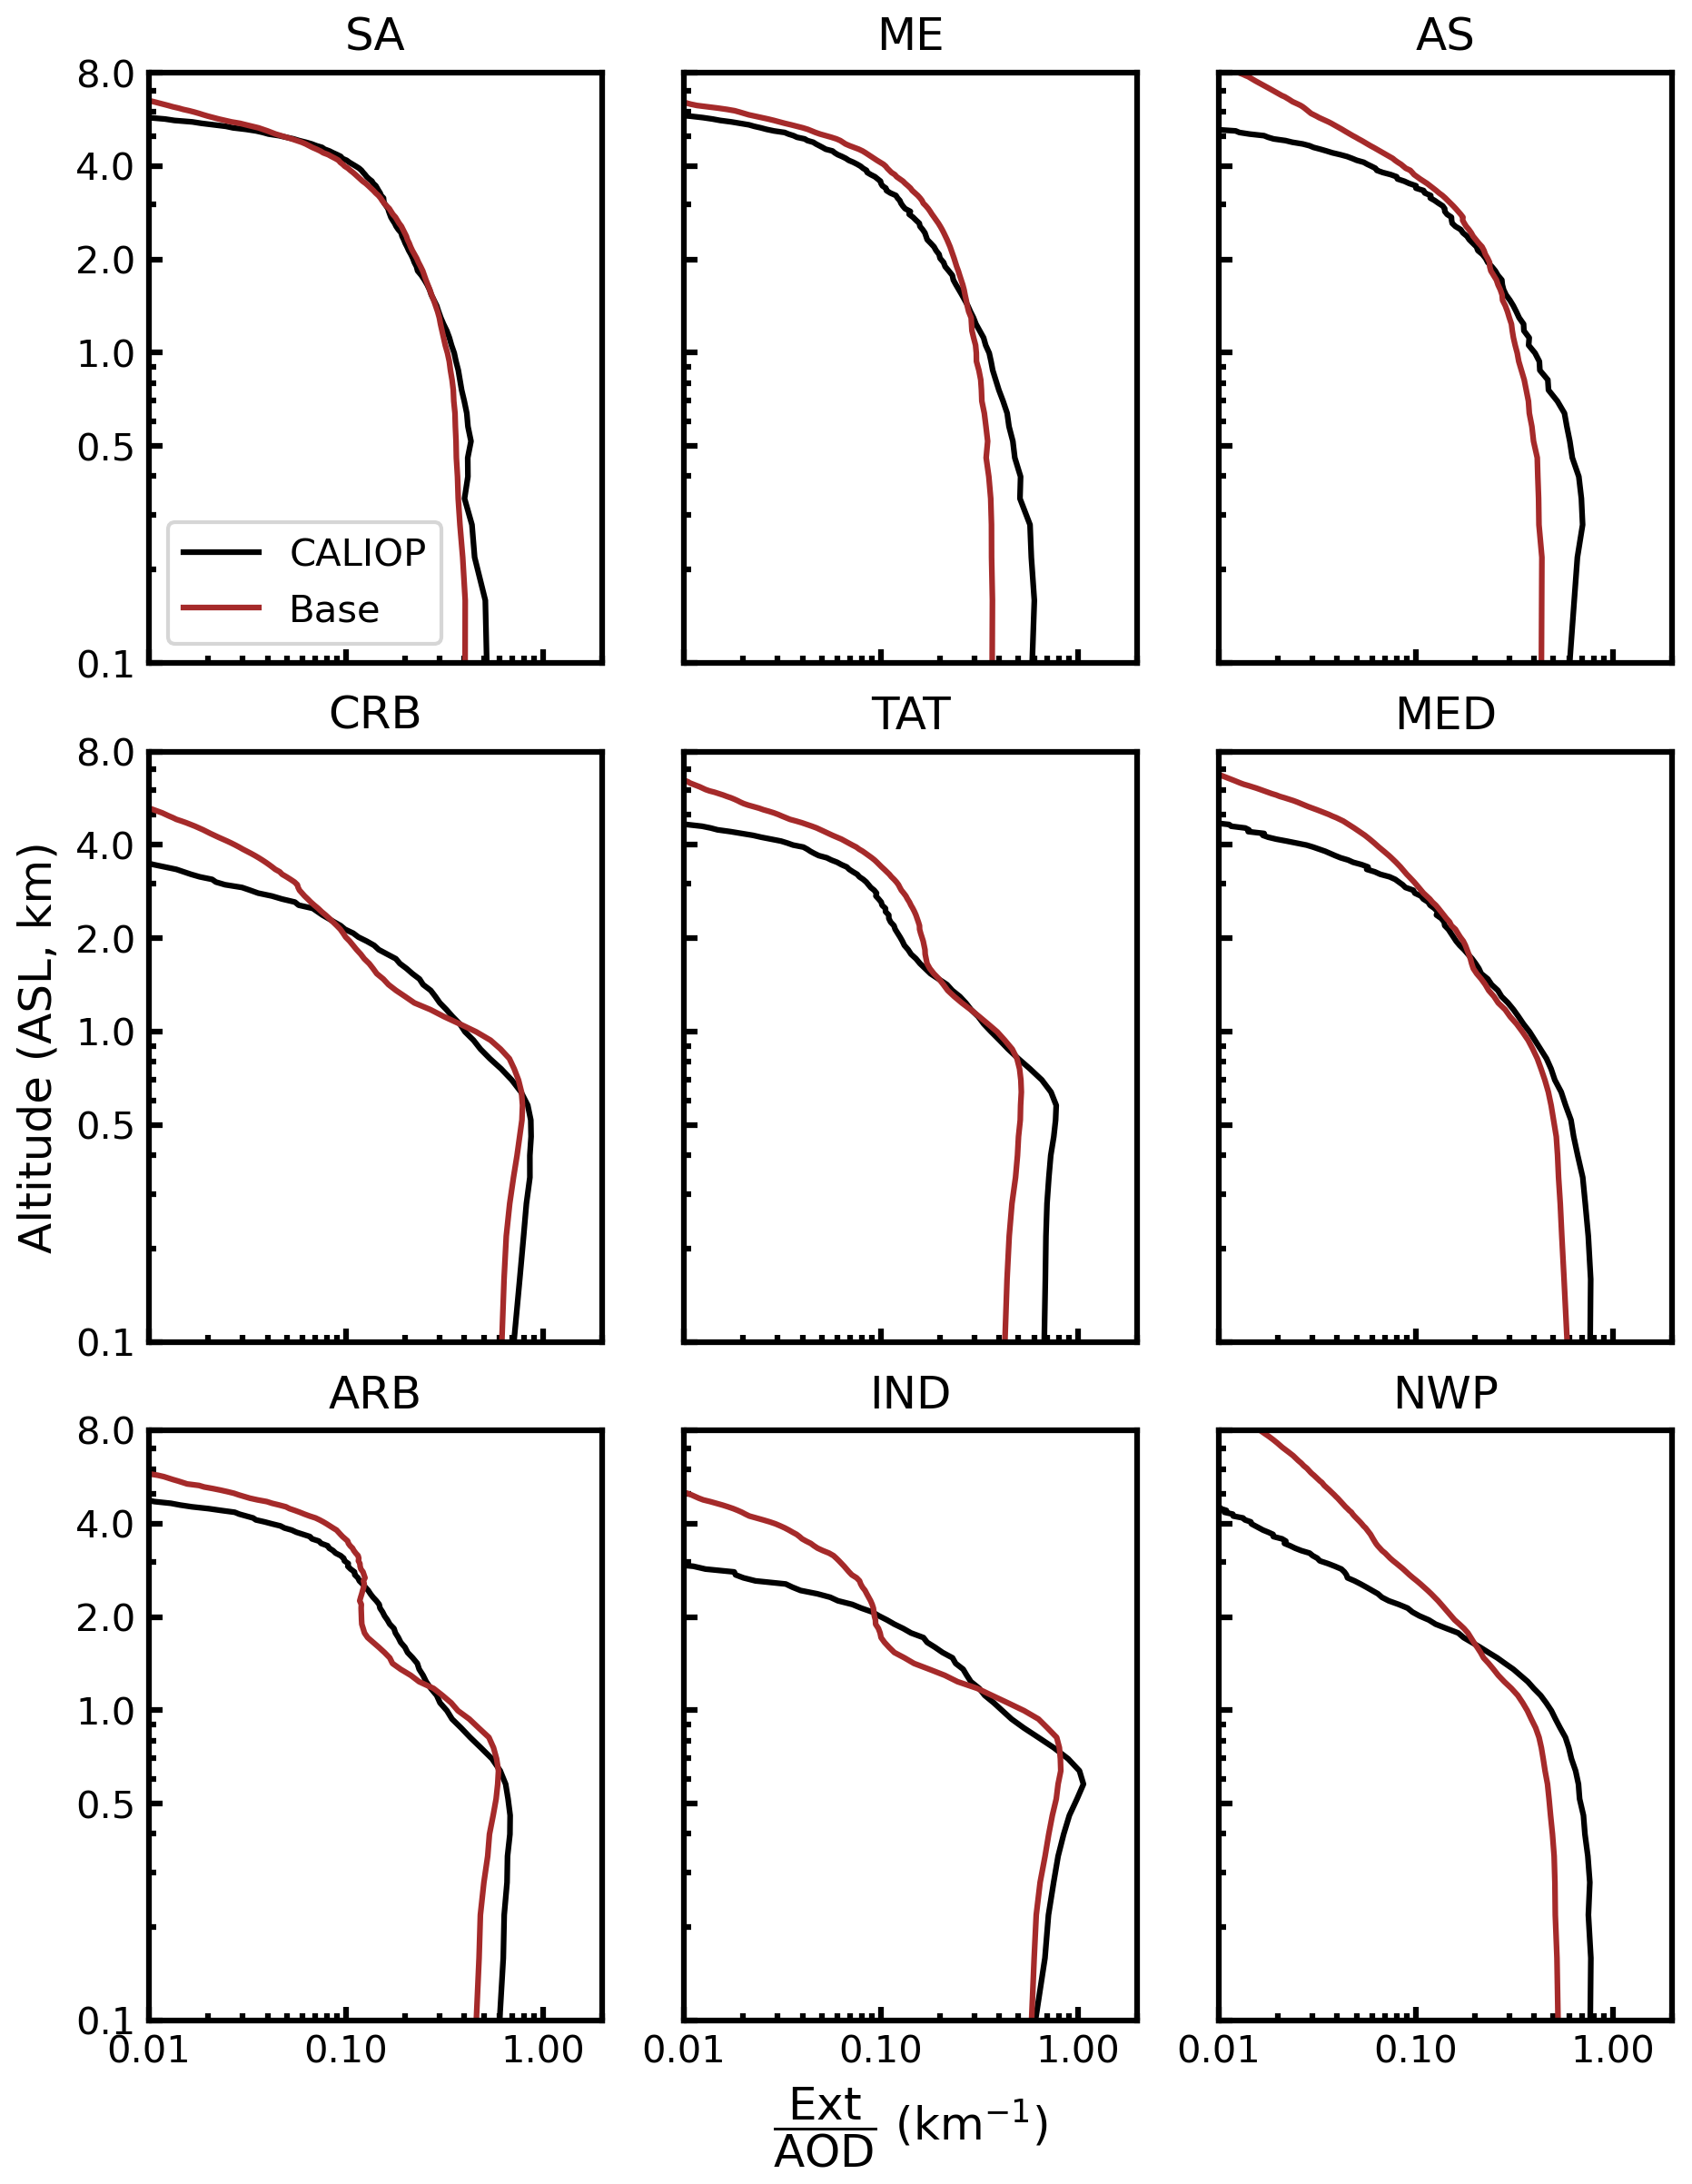
Figure 3Comparisons of the annual extinction vertical profile normalized by total column aerosol optical depth from the Base simulation in the year of 2018 against the 15-year (2007 to 2021) climatological mean extinction vertical profile from the CALIOP over different regions including the major dust source regions over land of the Sahara – SA, Middle East – ME, and Asia – AS, and the major dust outflow regions over ocean of the Caribbean Sea – CRB, the tropical Atlantic Ocean – TAT, the Mediterranean Sea – MED, the Arabian Sea – ARB, the tropical Indian Ocean and the Bay of Bengal – IND, and the northwestern Pacific Ocean – NWP.
To reduce the overestimation of surface PM2.5 dust, we (1) implement a new dust emission scheme with further refinements for soil properties including the clay content and soil wetness in the top soil layer and the threshold of leaf area index, (2) revisit the size distribution of emitted dust, (3) explicitly track dust with geometric diameter less than 2 µm in four size bins, and (4) update the parametrization for size-resolved below-cloud scavenging.
4.1 Sensitivity simulation setup
Figure 4 summarizes the setup of sensitivity simulations to evaluate the effects of algorithmic modifications and their performance versus satellite-retrieved AOD and surface dust measurements. The default dust simulation (Base) in GEOS-Chem as implemented by Fairlie et al. (2007) uses the DEAD emission scheme (Zender et al., 2003) with a topographical source function (Ginoux et al., 2001; Meng et al., 2021) for natural dust (GC Dust) with 4 dust sizebins for emission, transport and removal with 7 dust size bins for dust optical depth calculation and heterogeneous chemistry. To improve the spatial distributions of dust total column abundance, we implement a new dust emission scheme developed by Leung et al. (2023) (DustL23; Emis). Additional modifications on top of the original DustL23 emission scheme include (1) reducing the sensitivity of soil clay content by eliminating the multiplication of the factor of the capped soil clay content (EmisClay); (2) halving the topmost soil wetness in the layer of 0–5 cm to approximate the soil wetness in the top 1–2 cm layer which is most pertinent to dust emissions (Darmenova et al., 2009; Wu et al., 2022) (EmisClayWet); and (3) reducing the threshold of LAIthr from 1.0 to 0.5 m2 m−2 (EmisClayWetLAIthr or Emis*). To further improve the surface fine dust simulation, we update the GEOS-Chem particle size distribution (PSD) with the PSD developed by Kok (2011) (Emis*PSD) with a larger value for the side crack propagation length of λ (12 µm versus 8 µm) which reduced the mass fraction of emitted fine dust. The Kok PSD was shown to have excellent agreement versus various soil size measurements (Kok, 2011), especially for fine dust distributions (González-Flórez et al., 2023). Lastly, we allow for the four dust bins with geometric diameter less than 2 µm to have separate emission, transport, and dry and wet deposition while halving anthropogenic dust emissions from AFCID (Emis*PSD7Bins0.5AD), and with updated below-cloud or washout scavenging parametrization (Emis*PSD7Bins0.5ADWetDep). Each of these changes is examined below.
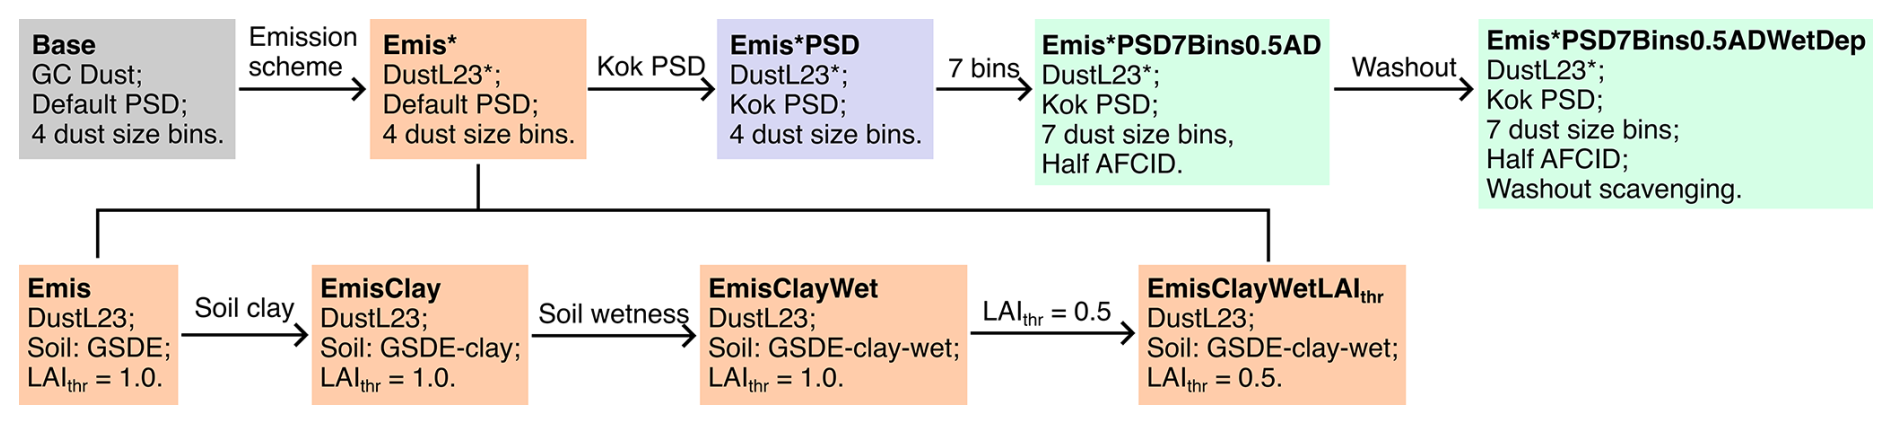
Figure 4Sensitivity simulation setup. The grey box indicates default settings with the default dust emission scheme used in GEOS-Chem (GC Dust) with 4 dust size bins (Base). The orange box indicates the implementation of a modified dust scheme based on DustL23 (Emis*). Modifications based on the original DustL23 scheme with the soil texture dataset from the Global Soil Dataset for use in Earth System Models (GSDE) (Emis) include the soil clay content (EmisClay), soil wetness (EmisClayWet), and threshold leaf area index (EmisClayWetLAIthr). The simulation setup for EmisClayWetLAIthr is the same as that for Emis*. The blue box indicates the modification of size distribution of emitted dust (Emis*PSD). The green boxes indicate the improvements for fine dust including explicit tracking of dust with diameter less than 2 µm with a total of 7 dust size bins with halved anthropogenic fugitive, combustion, and industrial dust (AFCID) emissions (Emis*PSD7Bins0.5AD), and updating below-cloud (washout) scavenging coefficients (Emis*PSD7Bins0.5ADWetDep).
The total global annual source strength for each sensitivity simulation is scaled to achieve unity slope versus Deep Blue AOD (Fig. A2) over major dust source regions. The surface PM2.5 dust concentrations are calculated by accounting for aerodynamic diameter and inlet penetration efficiency (Section 2.5) as 0.676 DST1 for 4-bin simulations, and DSTbin1 + DSTbin2 + DSTbin3 + 0.546 DSTbin4 for 7-bin simulations. We focus our evaluation on the skill in representing in situ PM2.5 dust concentrations measured by SPARTAN, and in representing the spatial variation in annual mean AOD. Regression equations are calculated using reduced-major-axis linear regression (Smith, 2009) to account for uncertainties in both simulations and measurements.
4.2 Improving the spatial distribution of mineral dust with updated emission scheme
We implement into GEOS-Chem a new physics-based dust emission scheme developed by Leung et al. (2023) (DustL23) to replace the default dust emission scheme (Sect. 2.3) used in GEOS-Chem (GC Dust). The spatial distributions of DustL23 in the Community Earth System Model version 2 (CESM2) exhibited better correlation against dust optical depth datasets and AERONET AOD than the DEAD scheme (Leung et al., 2024). We modify DustL23 for implementation into GEOS-Chem by (1) reducing dust emissions over wet, snow, and vegetation covered surfaces of semi-arid regions using Eq. (7) below, (2) eliminating the multiplication of the capped clay content of the topsoil in Eq. (8) below, (3) halving the soil wetness in the layer of 0–5 cm to represent the soil wetness in the top 1–2 cm layer which is most pertinent to dust emissions (Darmenova et al., 2009; Wu et al., 2022), (4) applying a regional scaling factor of 0.6 over the Sahara to reduce its emissions (Eq. 8), and (5) scaling the global total emission flux to achieve unity regression slope of simulated AOD versus Deep Blue AOD over dusty regions.
We begin with the formulation for total dust emission flux Fd in kg m−2 s−1 following Leung et al. (2024):
where η is an intermittency factor, Ctune is a global tuning factor for the emission strength, Cd is the time-varying soil erodibility coefficient, fbare is the bare ground fraction, is the clay content in the topmost soil layer of fclay capped at 0.2, ρa is the surface air density in kg m−3, u∗s is the soil surface friction velocity in m s−1 corrected from the surface friction velocity of u∗ by the drag partitioning effects of Feff, u∗it is the dynamic or impact threshold friction velocity in m s−1, u∗st is the standardized wet fluid threshold friction velocity in m s−1, and κ is the fragmentation exponent. We use u∗st in the denominator of Eq. (6) following Kok et al. (2014) instead of u∗it following Leung et al. (2023) for tuning purpose. The parametrization details for these factors following Leung et al. (2023) can be found in the Appendix, Sect. A3.
We modify the DustL23 scheme (Leung et al., 2023) by adopting the equation for the bare ground fraction in Zender et al. (2003) to reduce dust emissions over wet, snow and vegetation covered surfaces with the dry erodible land fraction taken from satellite-based land cover:
where Aerod is the area fraction of erodible surfaces including barren and sparsely vegetated land cover taken from the MODIS Land Cover Climate Modeling Grid (CMG) (MCD12C1) Version 6.1 data product; Asnow is the area fraction of snow cover, LAI is the leaf area index (Yuan et al., 2011), and LAIthr is the threshold LAI to reduce the bare soil fraction due to vegetation cover. We set an intermediate value of LAIthr=0.5 m2 m−2 instead of 1.0 m2 m−2 in Leung et al. (2023) to represent the reduction in dust emissions from sparse vegetation over semi-arid regions, which is more similar to the value of 0.3 used in prior work (Mahowald et al., 1999; Zender et al., 2003).
The enhancement factor fm≥1 for the wet fluid threshold friction velocity due to soil wetness is calculated using Eqs. (A8) and (A9), but with spatially varying clay content fclay in the topsoil layer. The gridded fclay dataset is taken from the Global Soil Dataset for use in Earth System Models (GSDE) with various inputs from global and regional soil database (Shangguan et al., 2014), rather than the machine-learning trained Soil Grids v2.0 dataset with very few observations over arid regions (Poggio et al., 2021) used in Leung et al. (2023). In addition, we reduce the effects of clay content on dust emissions by eliminating the multiplication of the capped clay content . Soil wetness is taken from the parent meteorological inputs of GEOS-FP (Koster et al., 2020) which targets the top 5 cm layer that desiccates more slowly following precipitation than the soil wetness in the top 1–2 cm layer (Swenson and Lawrence, 2014) that is most pertinent to dust emissions; we halve the soil wetness in an attempt to represent this process (Darmenova et al., 2009; Wu et al., 2022).
The global scaling factor Ctune is determined by the reduced-major-axis linear regression slope of simulated AOD versus satellite-retrieved AOD over dusty regions () in this study to constrain the intensity of dust emissions, whose values corresponding to different emission schemes are listed in Table A2. Additionally, a regional scaling factor of 0.6 over the Sahara (Csah) and unity elsewhere is applied to reduce regionally excessive dust emissions that may be influenced by the tendency for global models to overrepresent emissions from large source regions compared with smaller sources (Kok et al., 2021a; Zhao et al., 2022).
The final formulation for dust emission flux is:
The calculated offline hourly dust emissions at 0.25° × 0.3125° resolution using Eq. (8) are then used to drive GCHP simulations at C48 resolution. The spatial distributions predicted from different emission schemes are evaluated against satellite-based Deep Blue AOD, ground-based AERONET AOD, and SPARTAN surface PM2.5 dust measurements.
Figure 5 shows the spatial distributions of annual dust emission fluxes and dust optical depth predicted from different emission schemes, with Fig. 6 showing the comparisons against Deep Blue satellite AOD globally and over major dust source regions. Comparison of the Base and Emis schemes reveals that the latter captures more secondary dust emission spots, especially over the Sahara, and inland dust sources in Saudi Arabia. However, the comparison against Deep Blue AOD over the Sahara is degraded versus the default scheme (Fig. 6). As suggested by prior studies, soil clay content is an important factor affecting the threshold friction velocity (Fécan et al., 1999; Tian et al., 2021; Zender et al., 2003) and sandblasting efficiency (Zender et al., 2003), and is often tuned for the optimization of dust emissions (Leung et al., 2024; Tian et al., 2021). Eliminating the multiplication of the capped clay content of reduces the effects of the clay content, increasing emissions from the Bodélé Depression in Chad and El Djouf across the border of Mauritania and Mali over the Sahara, from the Rub' al Khali desert in the inland Saudi Arabi, and Taklamakan desert in the northwest China (Fig. 5, EmisClay). Correspondingly, the R2 from the linear regression against Deep Blue AOD is improved from 0.60 to 0.70 over the Sahara, from 0.68 to 0.77 over the Middle East, and from 0.35 to 0.56 over Asia (Fig. 6). The other two modifications of halving soil wetness (EmisClayWet) and setting LAIthr to 0.5 m2 m−2 (EmisClayWetLAIthr) slightly improve the spatial distribution of dust emissions by reducing the underestimation in Asia while retaining the agreements in the Sahara and Middle East (Fig. 6). Using the same dusty region of the Base (Fig. A3) or EmisClayWetLAIthr (Fig. A4) scheme for the comparisons of all dust emission schemes versus Deep Blue AOD confirms similarly slight improvements of regional dust emissions. Together these refinements exhibit comparable global performance as the Base simulation versus Deep Blue AOD with improvements to the relative regional magnitude of dust across the Sahara, Middle East and Asia as indicated by more comparable regression slopes (Fig. 6).
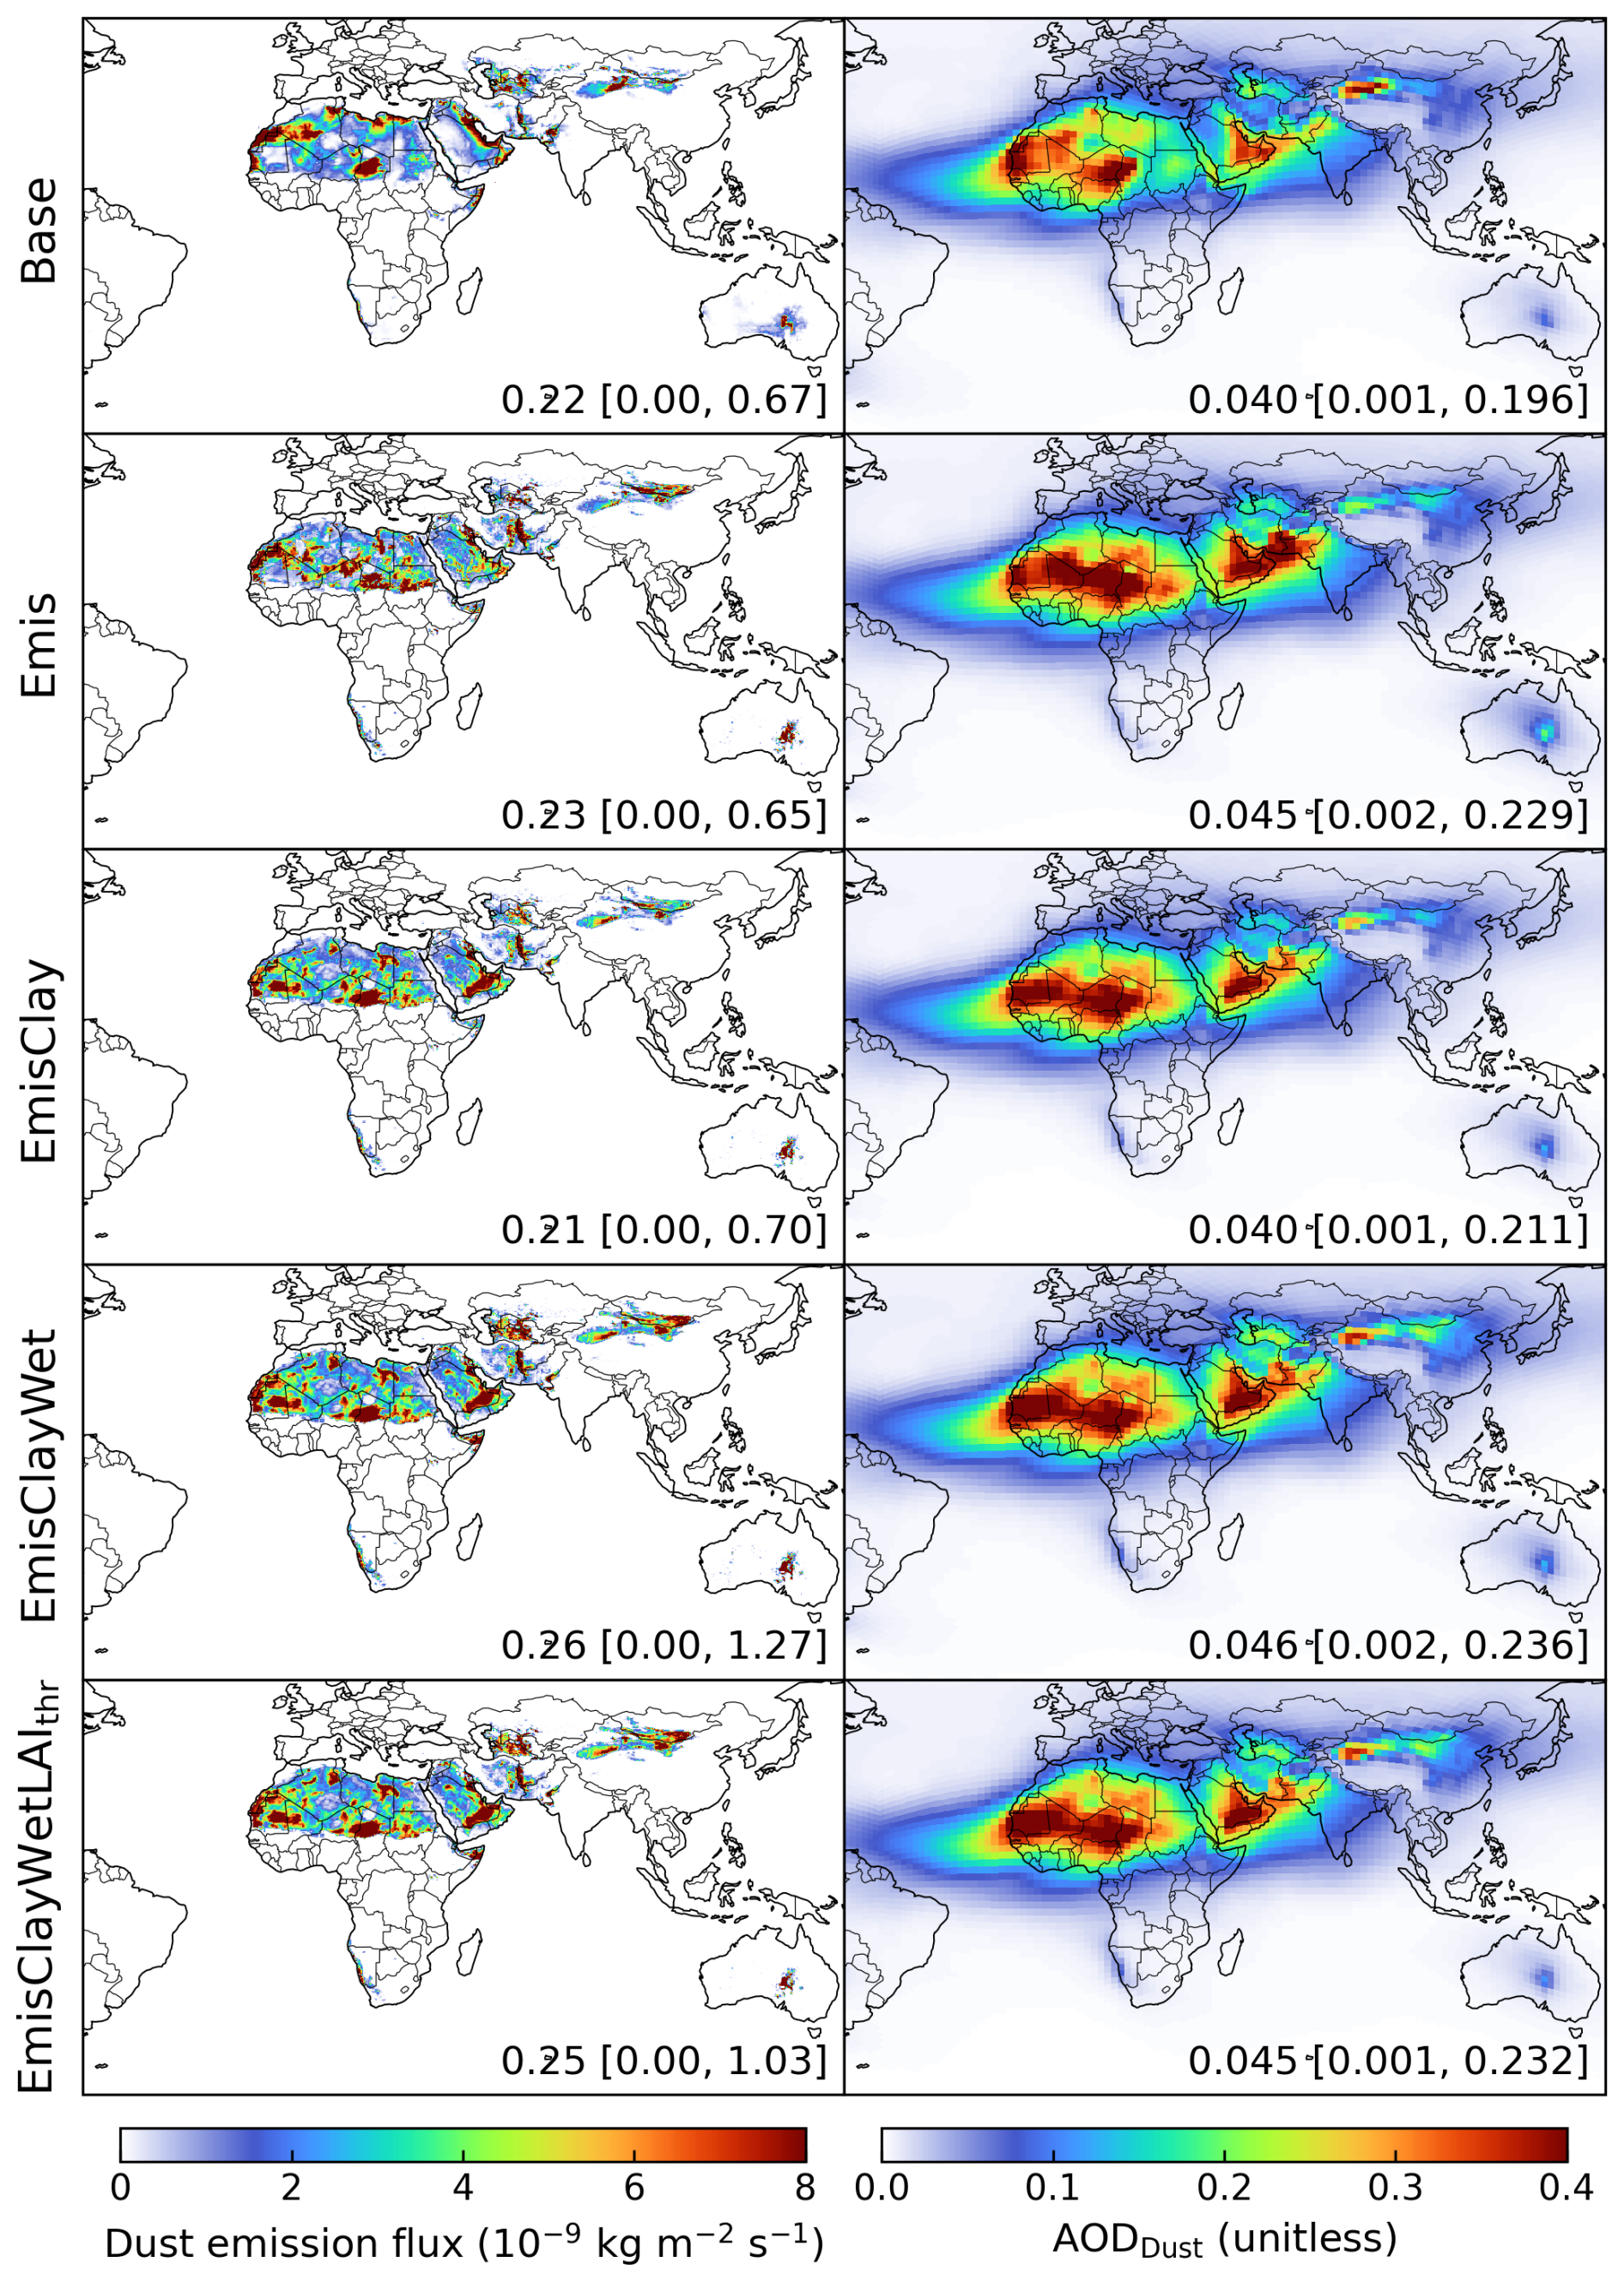
Figure 5Annual dust emission flux (left) and simulated dust optical depth (AODDust; right) in the year of 2018 zoomed in over dusty regions of the Sahara, Middle East, and Asia from different emission schemes as described in Fig. 4. Inset values are the regional arithmetical mean with 5th and 95th percentiles in the square brackets.
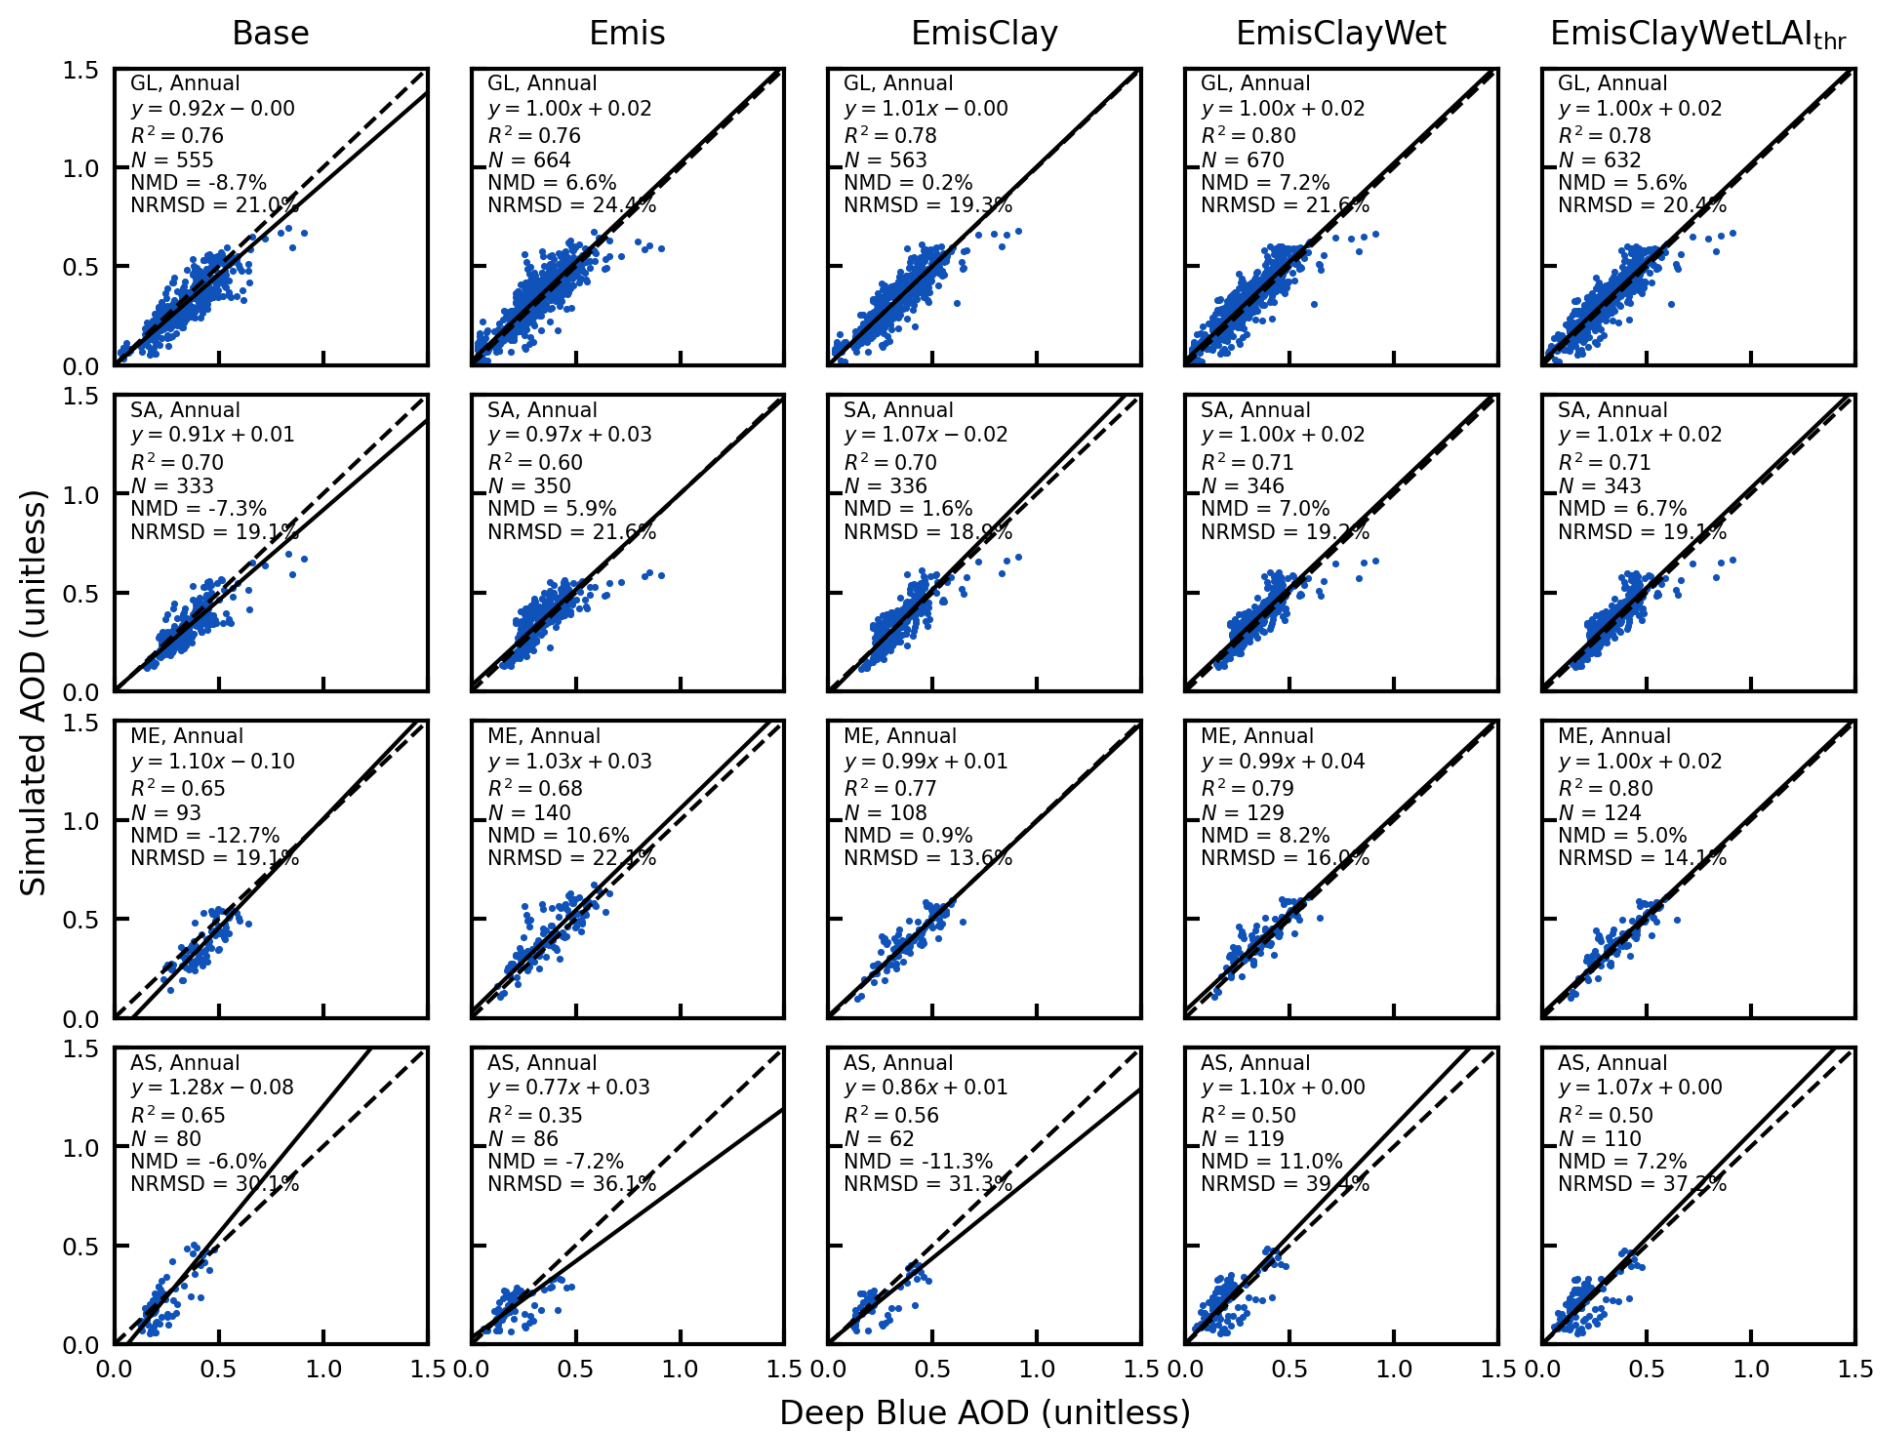
Figure 6Comparisons of annual simulated aerosol optical depth (AOD) versus the Deep Blue satellite AOD globally (GL) and over main dust source regions of the Sahara – SA, Middle East – ME, and Asia (AS) with different emission schemes. Regression statistics including reduced-major-axis linear regression equation, coefficient of variation (R2), total number of points (N), normalized mean difference (NMD), and normalized root-mean-square difference (NRMSD) are in the top left. Note the total number of points varies across different schemes.
Figure 7 shows the evaluation of the Emis* (or EmisClayWetLAIthr) simulation with ground-based observations from AERONET and SPARTAN. The overestimation of surface PM2.5 dust against the ground-based measurements of SPARTAN is reduced from 94 % (Fig. 2) to 55 % (Fig. 7), reflecting regional improvements of the spatial distributions especially over the Middle East (Fig. 6). The skill in representing AOD in the Emis* simulation remains comparable to that in the Base simulation shown in Fig. 2.
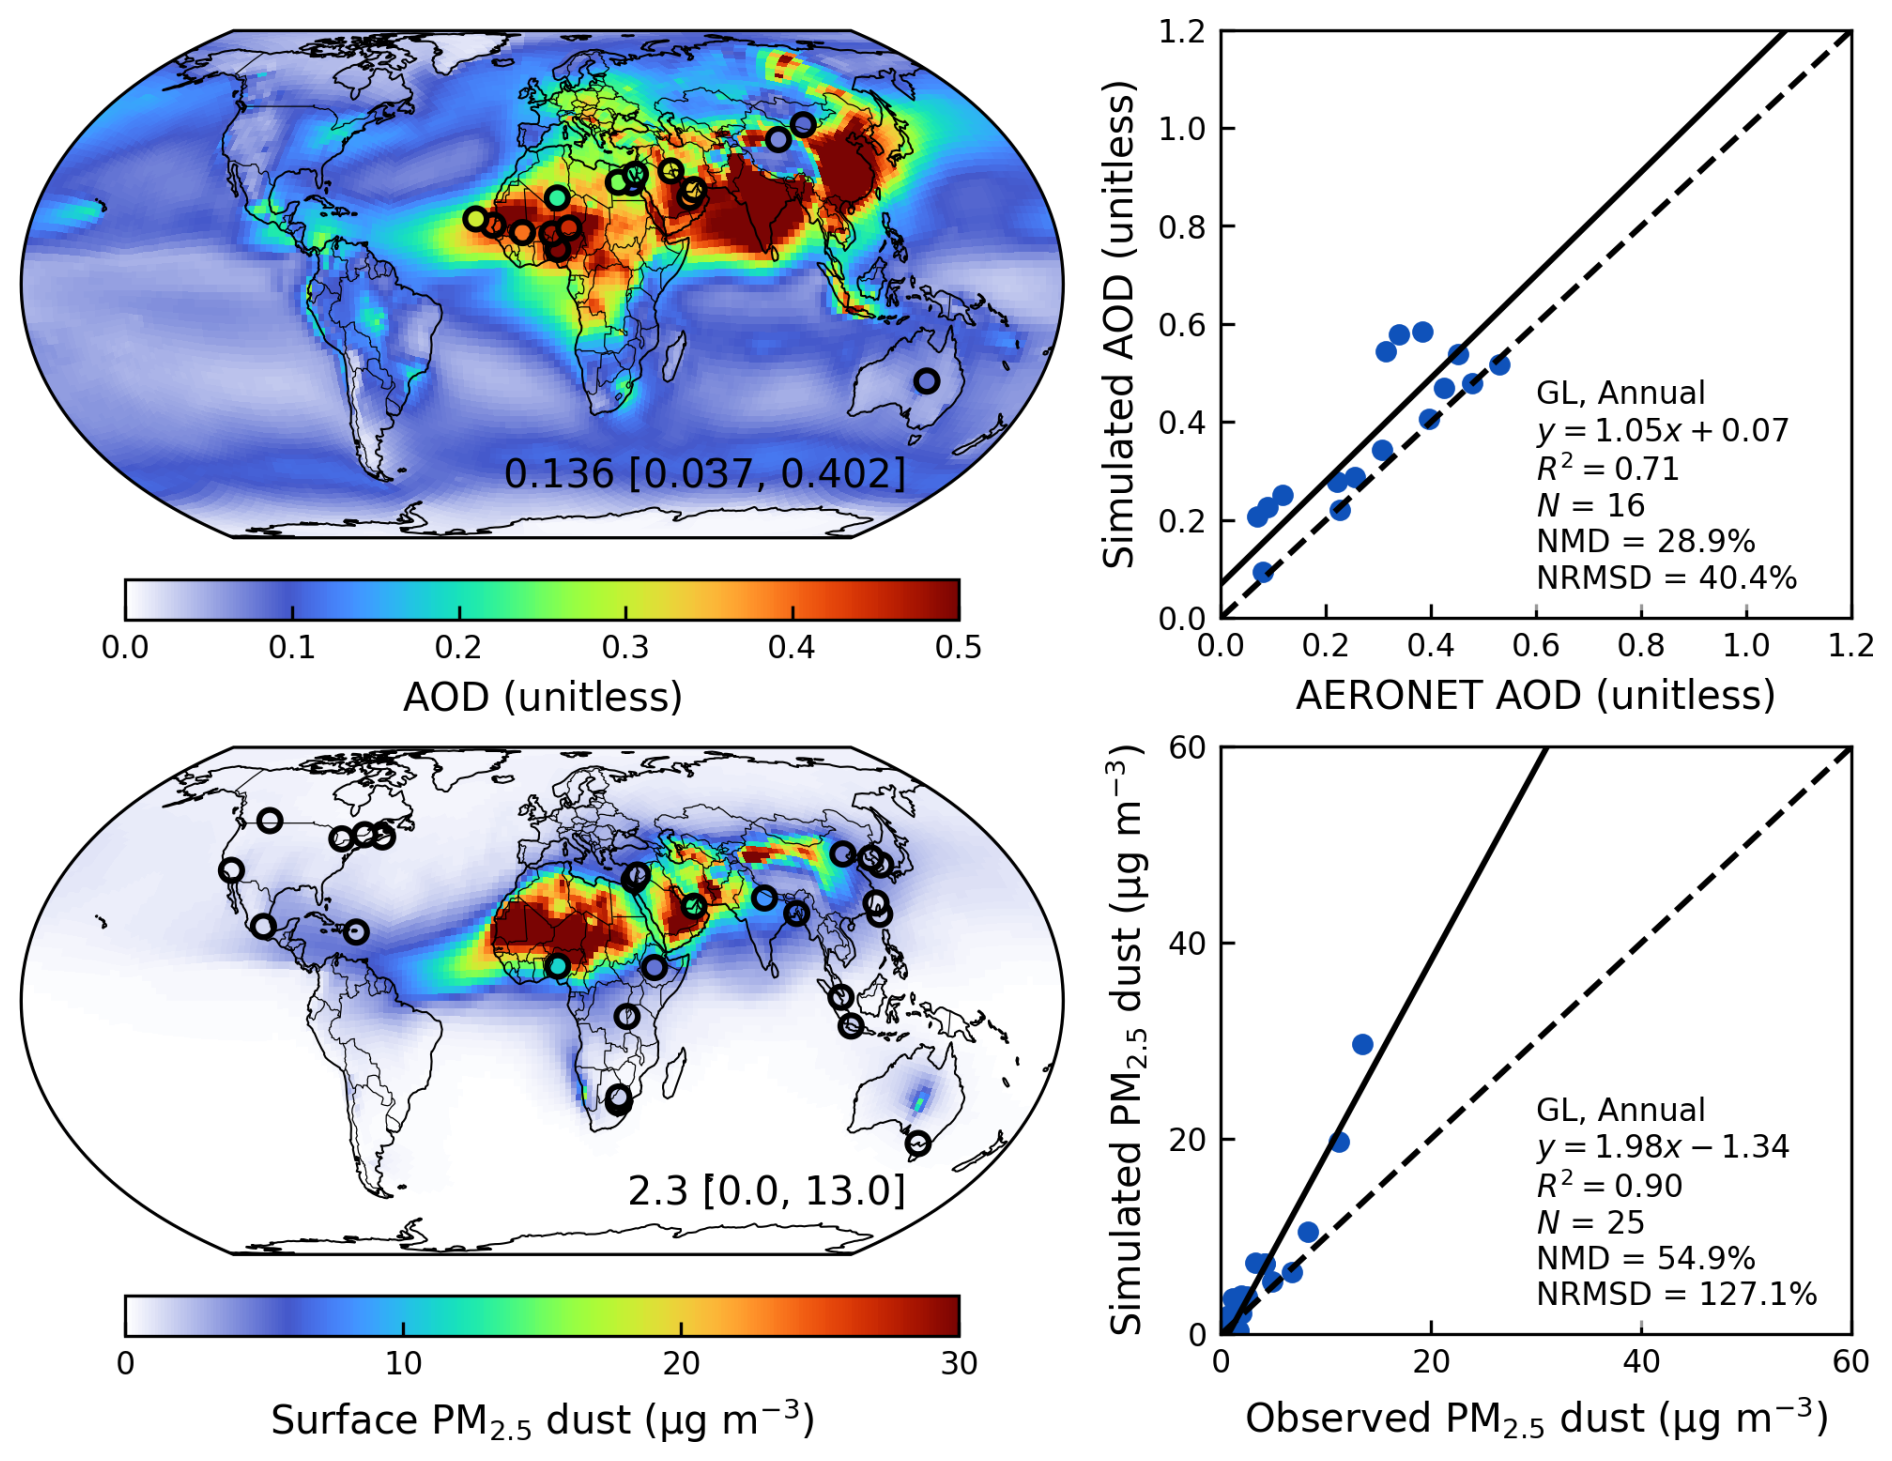
Figure 7Annual simulated aerosol optical depth (AOD) and comparison against ground-based observations from the AERONET over dusty regions () (top); Annual simulated surface PM2.5 dust and comparison against ground-based measurements from the SPARTAN from the Emis* simulation in the year of 2018 (bottom). Filled circles on the maps represent ground-based observations from SPARTAN and AERONET. Inset values at the bottom right of the maps are arithmetical mean with 5th and 95th percentiles in the square brackets. Regression statistics including the reduced-major-axis linear regression equation, coefficient of variation (R2), total number of points (N), normalized mean difference (NMD), and normalized root-mean-square difference (NRMSD) are listed at the bottom right of the scatter plots.
4.3 Improving the representation of fine mineral dust
As the size distribution of mineral dust is particularly important for the performance discrepancy between simulated AOD over dusty regions and surface PM2.5 dust, we focus on improving its size-resolved source and sink.
4.3.1 Revisiting the size distribution of emitted mineral dust
Figure 8a shows different PSDs including the default PSD used in the GEOS-Chem (GC PSD) based on the brittle fragmentation theory with the side crack propagation length λ of 8 µm (Zhang et al., 2013), the Kok PSD with λ of 12 µm (Kok, 2011), and the Meng PSD focusing on the optimization for coarse to super coarse dust (Meng et al., 2022), in comparison with the observed PSD from the 2011 Fennec campaign (Ryder et al., 2013). While all modelled PSDs are within the wide range of PSD from the Fennec campaign, the fraction of emitted DST1 from the Kok PSD exhibits greater consistency with the Fennec observations than the other two PSDs. The larger discrepancy for the size distribution with diameter less than ∼ 0.4 µm between the observed PSD from Fennec and parametrized PSDs is possibly due to anthropogenic aerosol influence (González-Flórez et al., 2023). In addition, a recent field study in the Moroccan Sahara (González-Flórez et al., 2023) indicated overall agreement of emitted dust size distributions against the Kok PSD especially at the fine diameter range. Therefore, we adopt the Kok PSD with λ of 12 µm for the size distribution of emitted mineral dust in GEOS-Chem. Figure 8b shows the spatial distribution from the Emis*PSD simulation which remains similar to that from the Emis* simulation in Fig. 7. Reduced emissions from DST1 by using the Kok PSD reduces the overestimation of surface PM2.5 dust from 55 % to 33 % compared to the ground-based measurements from SPARTAN (Fig. 8c).
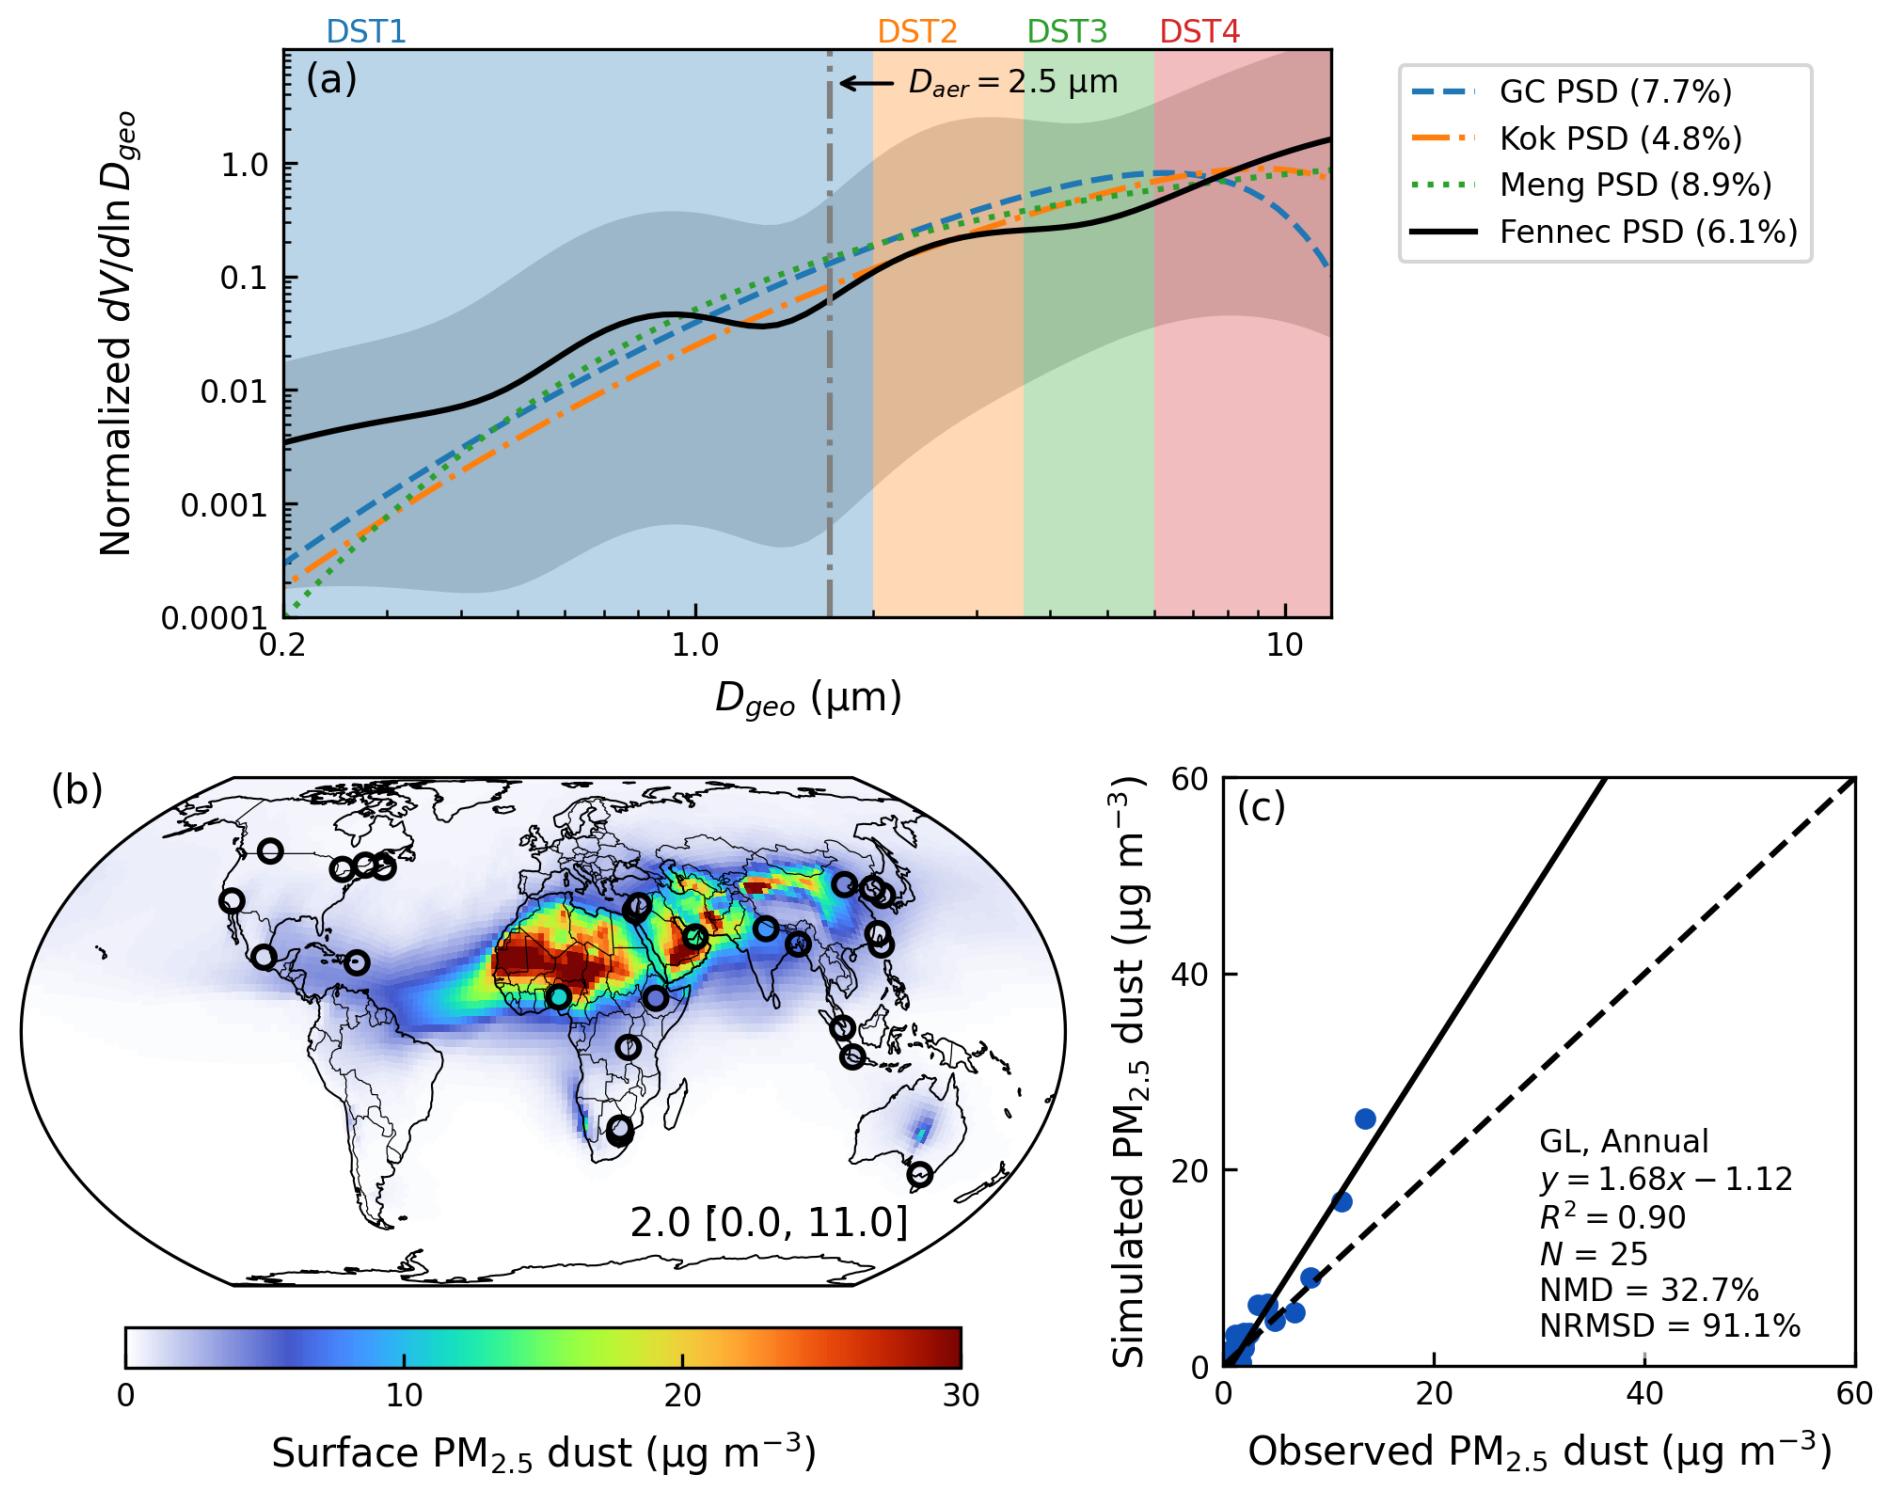
Figure 8(a) Normalized particle size distribution (PSD) of emitted dust based on default PSD used in GEOS-Chem (GC PSD) (Zhang et al., 2013), the Kok PSD (Kok, 2011), the Meng PSD (Meng et al., 2022), and the Fennec PSD (Ryder et al., 2013). All PSDs are normalized for a total volumetric integration of 1 within the diameter range of 0.2 to 12 µm used in GEOS-Chem. The grey shades show the minimum and maximum PSD curves from the Fennec 2011 campaign. The grey dash-dotted line indicates the corresponding geometric diameter of 1.7 µm for the aerodynamic diameter of 2.5 µm. Filled rectangles indicate size ranges of 4 dust size bins. Percentages adjacent to each PSD are mass fractions of emitted DST1 over total dust emission flux within diameter range of 0.2 to 12 µm. (b) Simulated annual surface PM2.5 dust from the Emis*PSD simulation in the year of 2018. Filled circles on the map represent ground-based observations from SPARTAN and AERONET. Inset values at the bottom right of the maps are arithmetical mean with 5th and 95th percentiles in the square brackets. (c) Comparison of simulated PM2.5 dust versus observed fine dust from SPARTAN. Regression statistics including the reduced-major-axis linear regression equation, coefficient of variation (R2), total number of points (N), normalized mean difference (NMD), and normalized root-mean-square difference (NRMSD) are listed at the bottom right.
4.3.2 Improving the size-resolved dry and wet deposition of mineral dust
The default below-cloud (washout) scavenging of dust by rain and snow in GEOS-Chem is separated for fine (DST1) and coarse dust (DST2 to DST4) (Wang et al., 2011). However, washout scavenging coefficients strongly depend on aerosol size (Wang et al., 2014b). To improve the size-dependent washout treatment of dust, we update washout rates by rain and snow for 7 dust size bins by (Wang et al., 2014b):
where Λ is the washout scavenging coefficient in s−1 by either rain or snow; Pd is the precipitation rate in mm h−1 falling form upper layers; fr is the area fraction of precipitation within each grid box; A and B are empirical constants dependent on dust size Dd. Using the same semi-empirical equations for A and B as Wang et al. (2014b), the updated values for different dust size bins with different effective spherical radii are summarized in Table 2.
Table 2Values of A and B for washout parametrizations by rain and snow for different dust size bins.
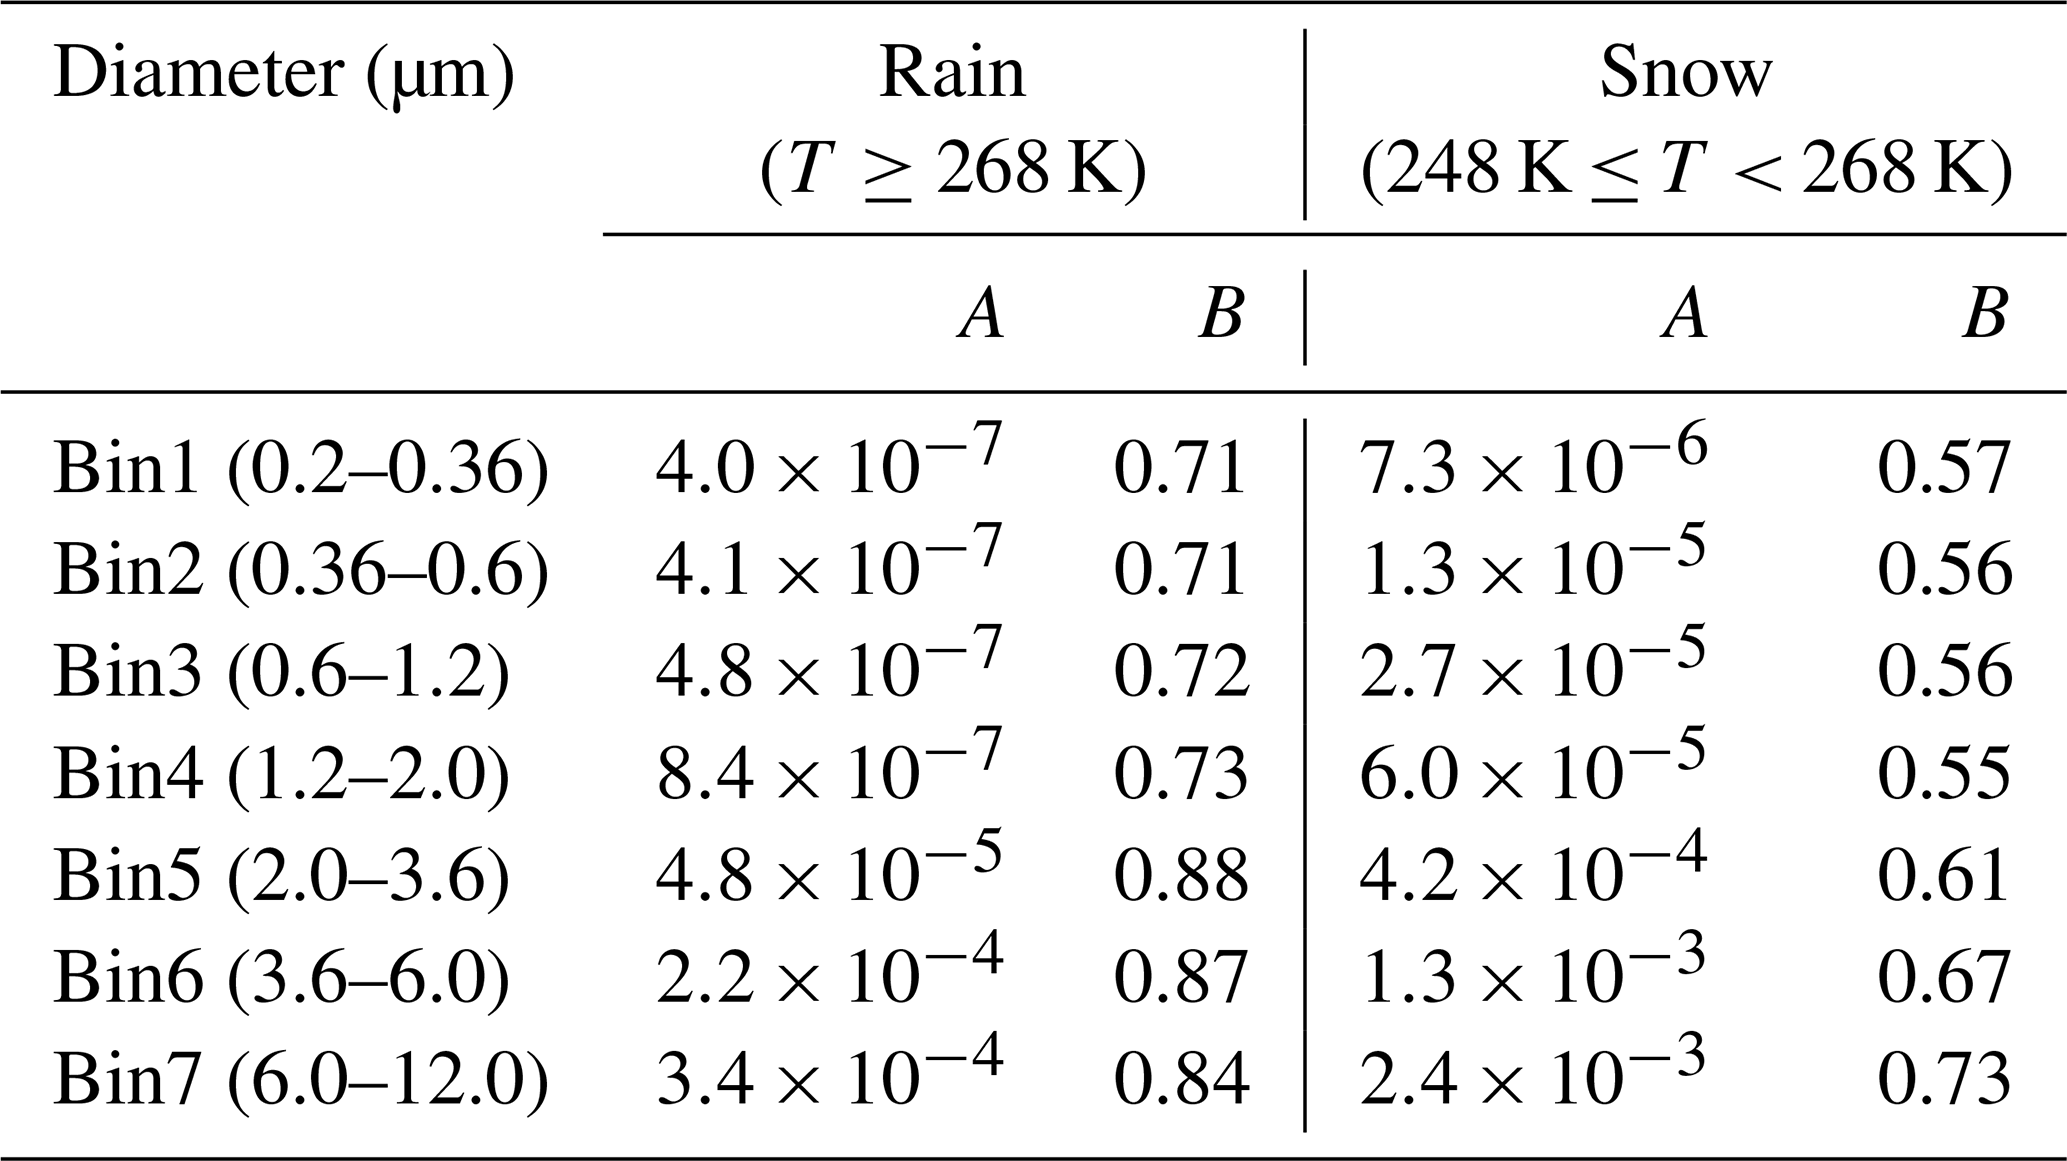
Figure 9 shows the size-dependent variations of mineral dust dry and wet deposition. We adopt the effective radii for 7 dust size bins for dry and wet deposition. The dry deposition velocity can vary by a factor of 4.9 among Bin1 to Bin4 with the minimum near the geometric diameter of 0.5 µm. The washout scavenging coefficient can vary by a factor of 2.6 among Bin1 to Bin4 with the minimum near the geometric diameter of 0.4 µm. Given the steep increasing strength of emitted dust from Bin1 to Bin4 (Fig. 8), there is need to explicitly track dust within DST1. We evaluate these developments by examining their effects on the fractional contributions of fine dust to total dust.
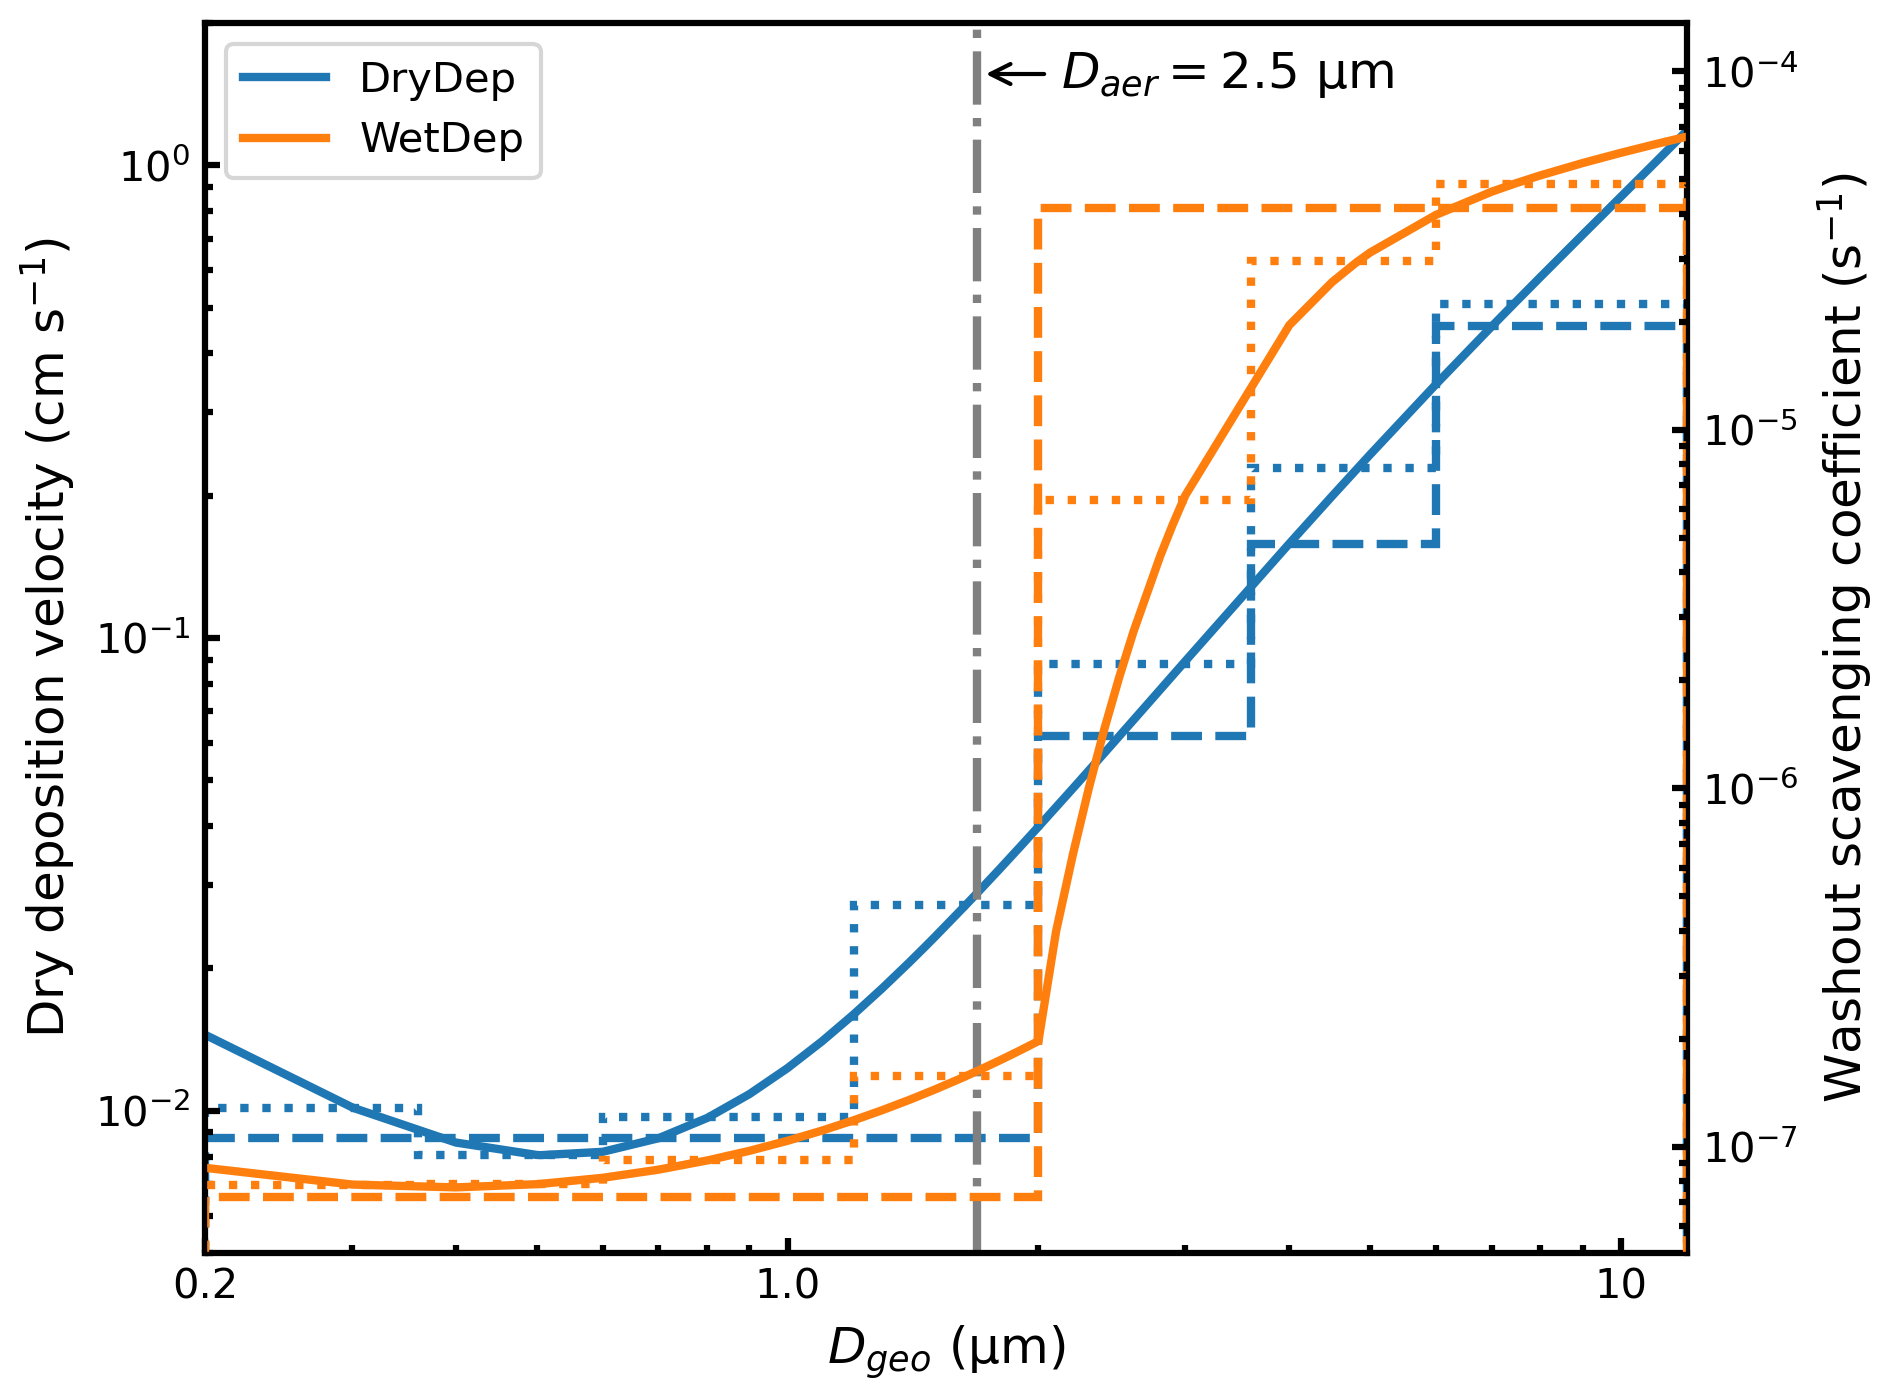
Figure 9Size-resolved dry deposition velocity over desert (left y-axis) and washout scavenging coefficient by rain (right y-axis). Dry deposition velocity is calculated with the friction velocity of 0.4 m s−1 and the particle density of 2500 kg m−3 with the default dry deposition scheme used in the GEOS-Chem. Washout scavenging coefficient is calculated with the precipitation rate of 0.1 mm h−1 with the updated washout parametrization. Solid lines indicate theoretical parametrization. Dashed lines indicate the default discrete treatment. Dotted lines indicate the updated discrete treatment. Grey dash-dotted line indicates the corresponding geometric diameter of 1.7 µm for the aerodynamic diameter of 2.5 µm.
Figure 10 shows the fractional contributions of fine dust with geometric diameter less than 2 µm to total dust () from the simulations with a total of 7 dust bins for dry deposition with updated washout scavenging parametrization and their differences. Due to the dominance of dry deposition over arid dusty regions, the explicit tracking of fine dust dry deposition slightly reduces over major dust source regions. However, the anthropogenic contributions to fine dust are correspondingly enhanced over urban and industrial regions, leading to degraded comparison against SPARTAN measurements (Fig. A5). We thus halve the AFCID emissions to reduce the excessive contributions from this uncertain source (Emis*PSD7Bins0.5AD). In addition, accounting for the steep washout scavenging efficiency across DSTbin5 to DSTbin7 (Fig. 9) with updated washout parametrization would induce enhanced fractional contributions especially for DSTbin5 (Fig. A6) and thus relatively reduce fractional contributions from fine dust with geometric diameter less than 2 µm to total dust (). Figure 11 shows the overall performance with all revisions from the simulation of Emis*PSD7Bins0.5ADWetDep. The reduced-major-axis linear regression slope is further reduced from 1.68 (Fig. 8) to 1.59 with comparable values of NMD against SPARTAN measurements.
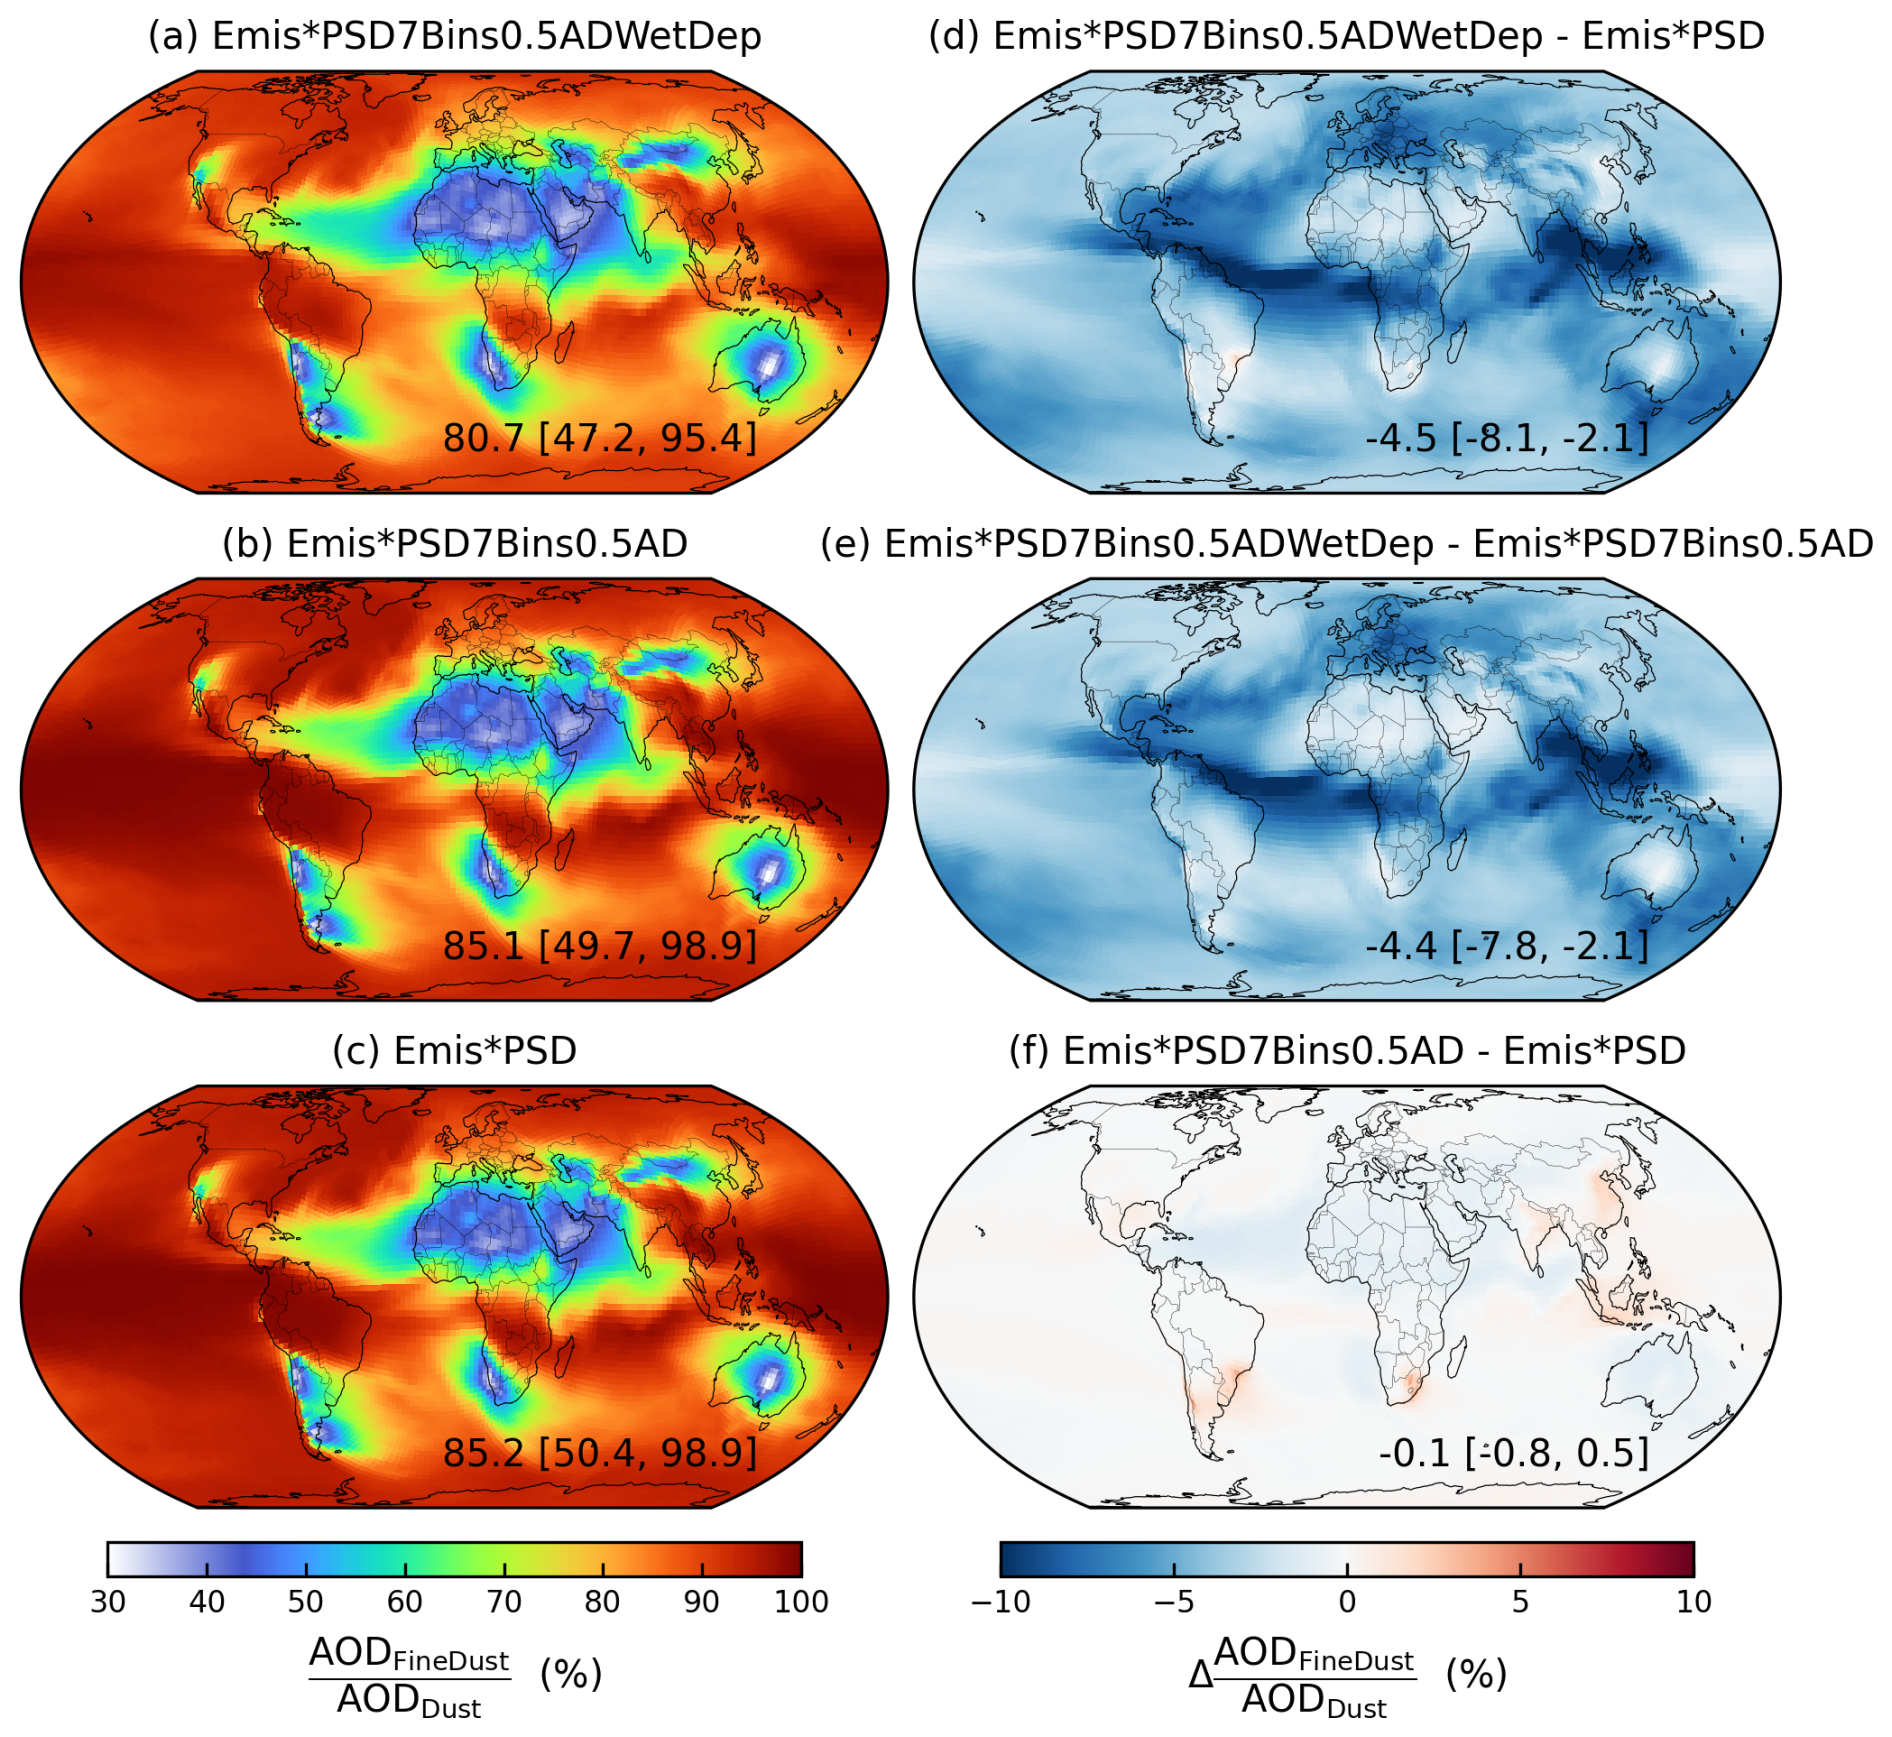
Figure 10Fractional contributions of fine dust with geometric diameter less than 2 µm to total dust column abundance ( from the (a) Emis*PSD7Bins0.5ADWetDep, (b) Emis*PSD7Bins0.5AD, (c) Emis*PSD and their absolute differences. Inset values at the bottom right are arithmetical mean with 5th and 95th percentiles in the square brackets.
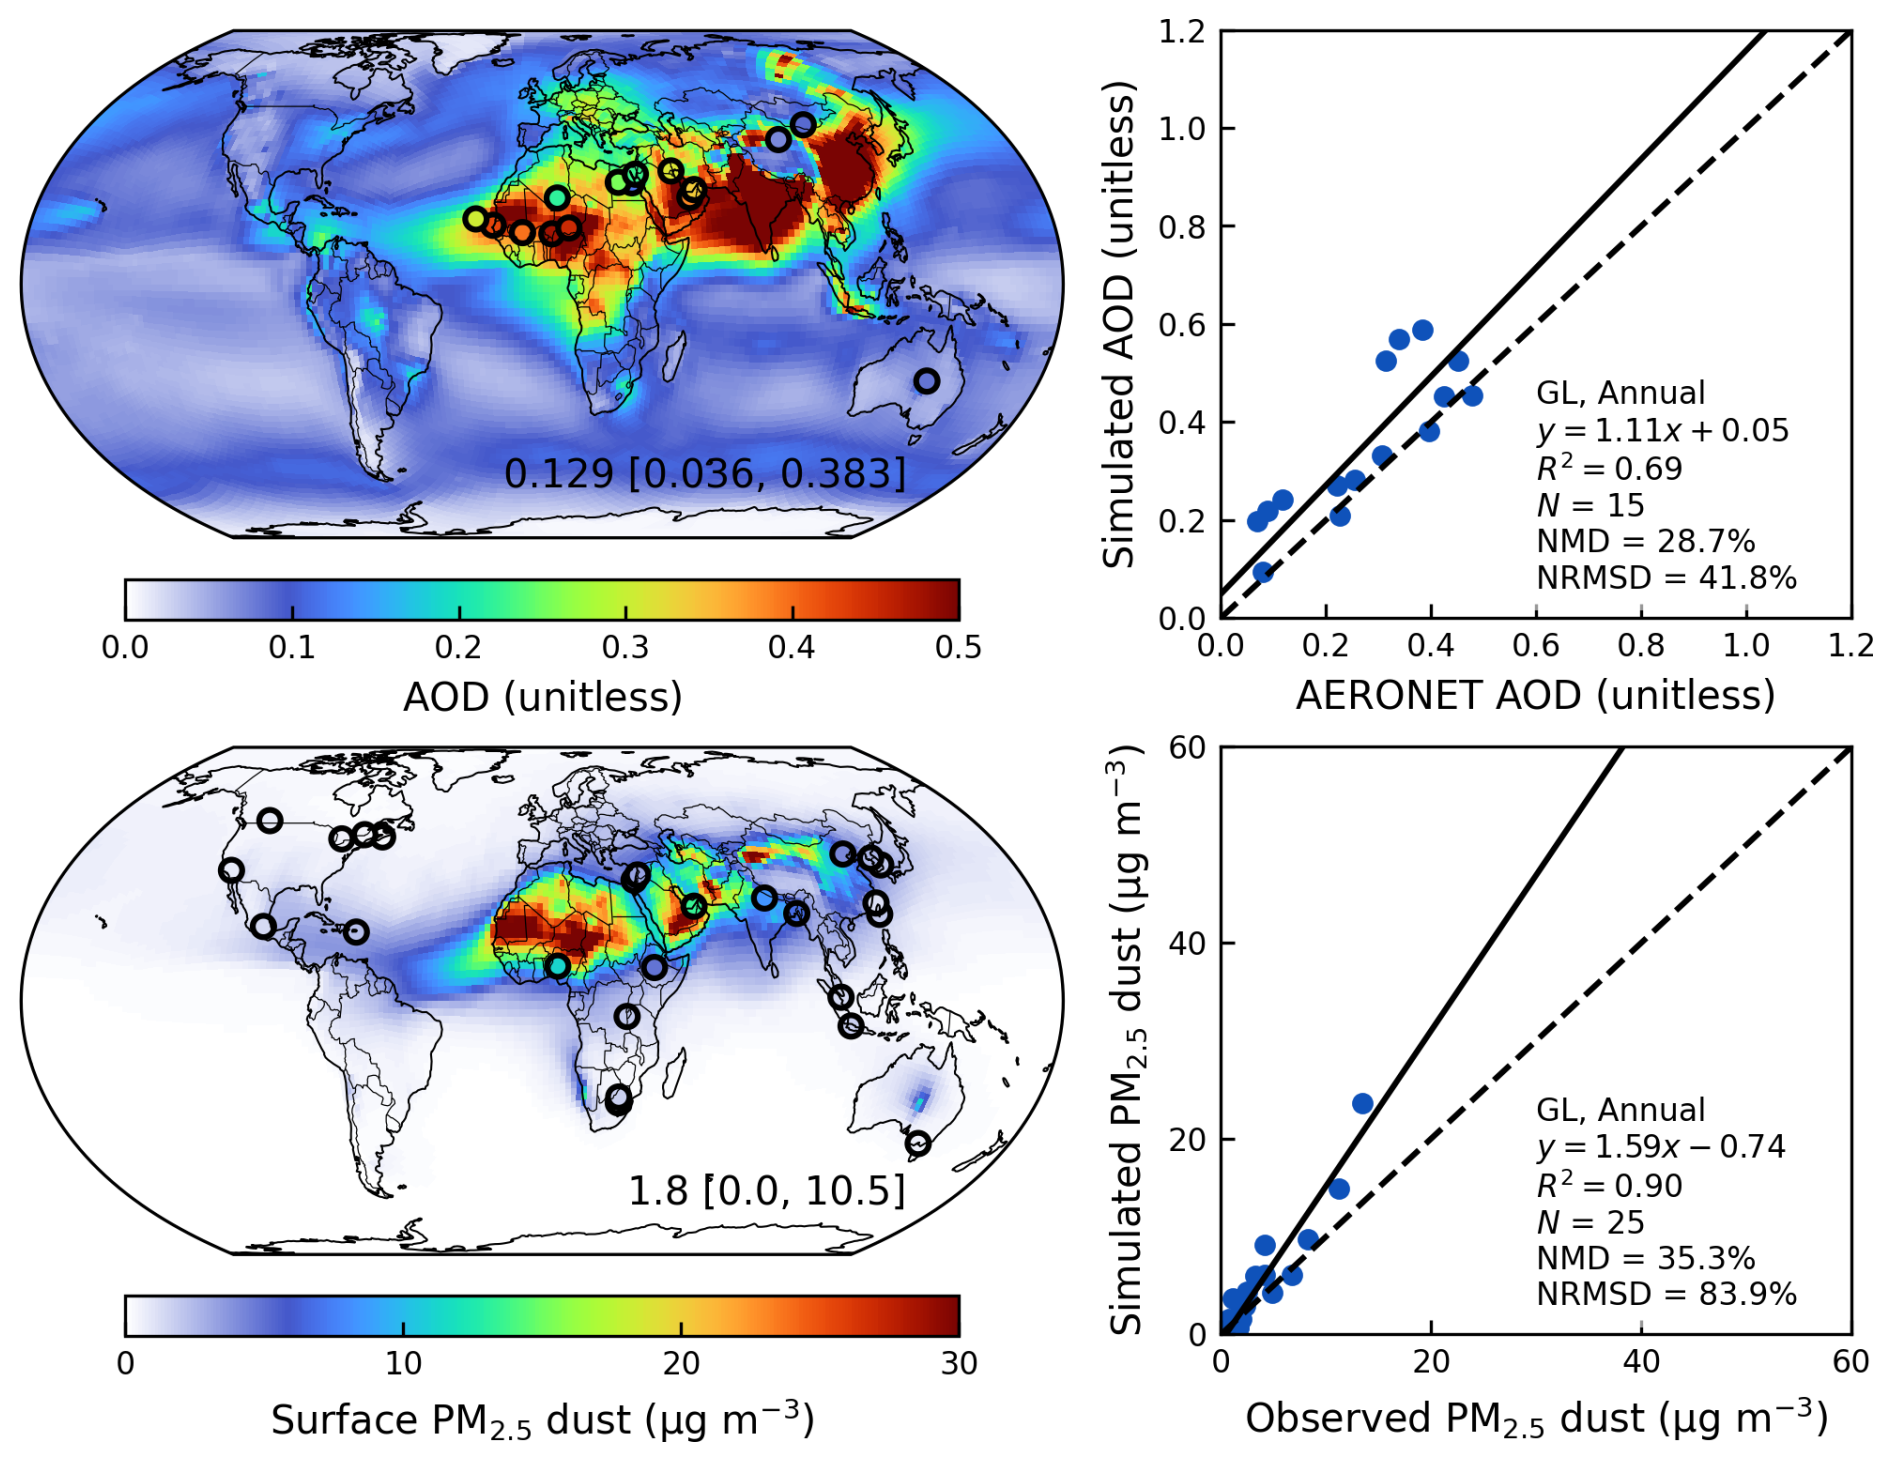
Figure 11Annual simulated aerosol optical depth (AOD) and comparison against ground-based observations from AERONET over dusty regions () (top); Annual simulated surface PM2.5 dust and comparison against ground-based measurements from SPARTAN from the Emis*PSD7Bins0.5ADWetDep simulation in the year of 2018 (bottom). Filled circles on the maps represent ground-based observations from SPARTAN and AERONET. Inset values at the bottom right of the maps are arithmetical mean with 5th and 95th percentiles in the square brackets. Regression statistics including the reduced-major-axis linear regression equation, R2, total number of points (N), normalized mean difference (NMD), and normalized root-mean-square difference (NRMSD) are listed at the bottom right of the scatter plots.
Comparisons against other surface dust datasets also show improved or comparable performance compared to the Base simulation. Figure A7 shows the comparison against ground observations over North America. Using the refined new dust emission scheme with the replacement of the size distribution from the Kok PSD, explicitly tracking submicron bins for dry deposition, and updating the washout scavenging parametrization contribute to a comparable extent to reduce the overestimation over North America from 43 % of the Base simulation to 15 % of the Emis*PSD7Bins0.5ADWetDep simulation. Comparisons against surface concentrations and total deposition of PM10 dust (Li et al., 2022b) for the Emis*PSD7Bins0.5ADWetDep simulation are also comparable with the Base simulation (Figs. A8 and A9). Consistent with prior studies about the spatial sensitivity of dust emissions (Leung et al., 2023; Meng et al., 2021), fine-resolution meteorological fields are needed to capture dust emission hotspots. If the dust emissions were calculated with C48 meteorological fields, the global dust distribution would become more concentrated in the major global source regions with the elimination of marginal dust sources, and the R2 versus SPARTAN surface PM2.5 dust would diminish to 0.83 (Fig. A10). Overall comparisons for the seasonal mean between the Base and the Emis*PSD7Bins0.5ADWetDep simulations confirm largely reduced overestimation for the surface fine dust against SPARTAN, while retaining comparable skill for the total column AOD against AERONET (Figs. A11 to A14). The reduction of surface overestimation is especially prominent over dusty seasons in Spring (from 73 % to 48 %) and Summer (from 138 % to 50 %), while further improvements are needed for surface overestimation in Fall (from 140 % to 95 %).
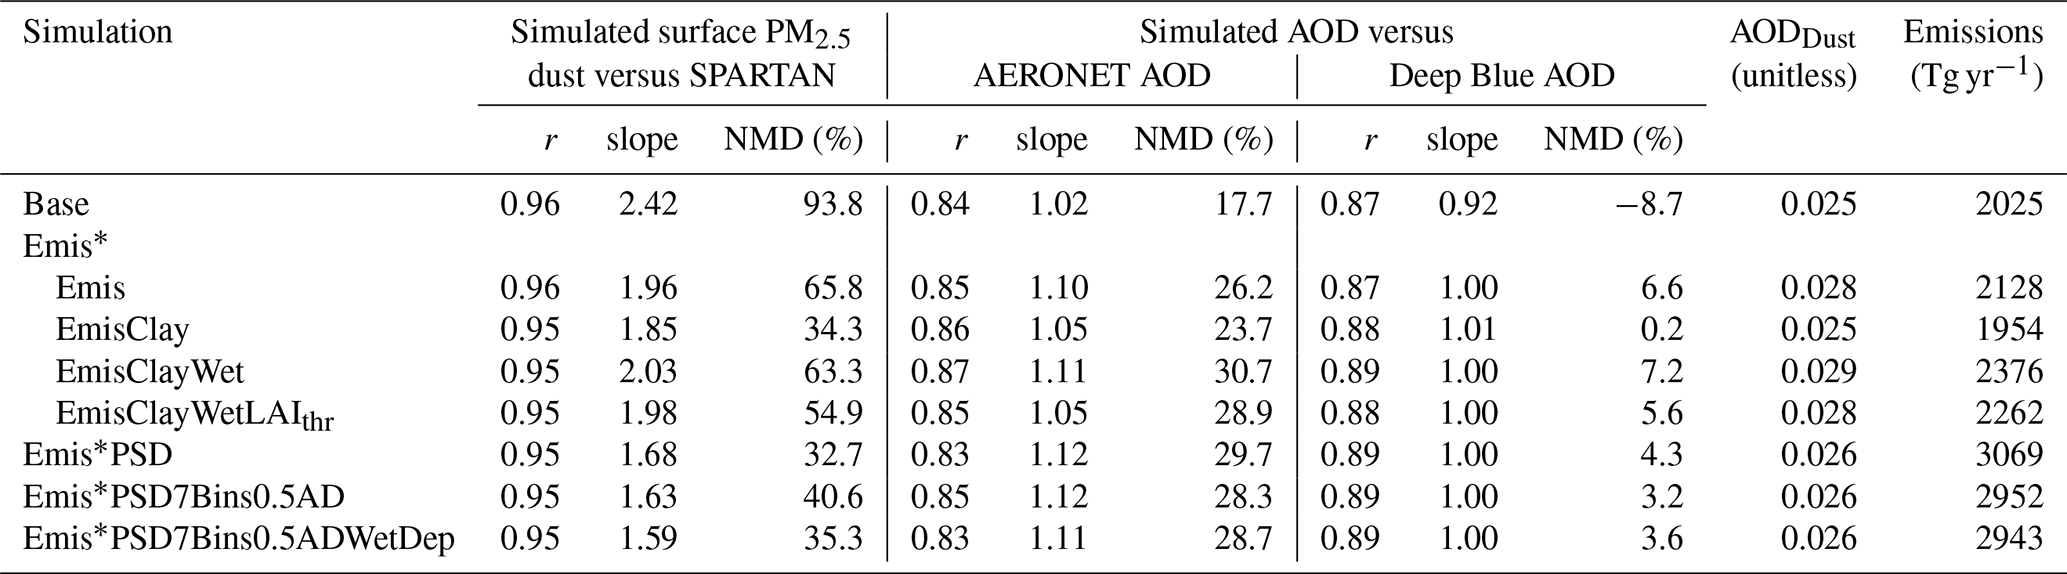
Table 3 summarizes the effects of different modifications on the model performance of total column AOD and surface fine mineral dust in this study. Strong overestimation of surface PM2.5 dust concentrations exist in the Base simulation by a factor of 2.4 versus SPARTAN measured dust. Updating the dust emission scheme with further refinements in the soil properties reduces the overestimation of surface PM2.5 dust by 39 %. The surface overestimation by 55 % is reduced to 35 % by updating the size distribution of emitted dust, explicitly tracking dust with diameter less than 2 µm in 4 bins, and updating the parametrization of below-cloud scavenging. The comparisons of simulated AOD versus AERONET and Deep Blue AOD are comparable for all simulations with the correlation coefficient of 0.8–0.9, and NMDs from −9 % to 31 %. The emissions between the Base and Emis* simulations are comparable with the global annual dust emission of ∼ 2000 Tg yr−1, which is within the range of 1000–5000 Tg yr−1 from intercomparison projects (Huneeus et al., 2011; Wu et al., 2020). As the Kok PSD reduces the mass fraction of fine dust, the total emitted mass is enhanced to ∼ 3000 Tg yr−1 with larger contributions from coarse dust. The reduction of surface PM2.5 dust overestimation with these revisions is confirmed if SPARTAN sites are restricted to those with at least 50 samples as well (Table A3).
Table 3Effects of different modifications on the model performance of simulated annual surface PM2.5 dust versus SPARTAN, and simulated annual aerosol optical depth (AOD) versus AERONET AOD and Deep Blue satellite AOD in terms of the correlation coefficient (r), the reduced-major-axis linear regression slope, and the normalized mean difference (NMD), with associated annual dust optical depth (AODDust) and total dust emissions in the year of 2018.
In summary, we evaluate and improve the annual mineral dust simulation in the GEOS-Chem model by building upon recent ground-based measurements from SPARTAN of mineral dust in PM2.5 over land, together with total column AOD from AERONET measurements and from the MODIS and VIIRS Deep Blue satellite products. We devote attention to the representation of aerodynamic diameter when comparing with ground-based PM2.5 measurements, since representation as geometric diameter in models would introduce a two-fold bias. We nonetheless find that the standard GEOS-Chem chemical transport model much better represents columnar AOD with a slope near unity than surface PM2.5 dust concentrations which are overestimated by a factor of two. Comparison of simulated extinction profiles versus the 15-year climatological CALIOP extinction profiles yields overall consistency in the vertical shape (Fig. 3), indicating the importance of other dominant factors.
We develop the mineral dust representation in GEOS-Chem with attention to its sources, size distribution, and sinks. We implement a new dust emission scheme based on Leung et al. (2023) with further refinements to the clay content and wetness in the topsoil layer, threshold leaf area index, and reducing dust emissions over snow and vegetation covered land surfaces. The NMD versus surface measurements is reduced by 39 % while the simulated AOD better represents the spatial distribution of Deep Blue AOD over dusty regions. To further improve the fine dust representation in GEOS-Chem, we revisit the size distribution of emitted dust and find that the Kok particle size distribution (PSD; Kok, 2011) better represents the mass fraction of fine dust measured during the Fennec field campaign over Northern Africa than does the default PSD despite the uncertainties from the Fennec observations. The implementation of the Kok PSD into GEOS-Chem reduces the surface overestimation of PM2.5 dust by 22 %. We also enable explicit tracking of mineral dust with geometric diameter less than 2 µm in 4 size bins for emission, transport, and deposition with updated parametrization for below-cloud scavenging, which further reduces the overestimation of surface PM2.5 dust concentrations to within 35 %.
Despite these advances, challenges remain in mineral dust development and evaluation. The performance of AOD against satellite and AERONET observations over dusty regions may still be affected by other aerosol components which may benefit from further evaluations and developments. Although the simulations are only for a single year, we average the multi-year observational data from the CALIOP extinction profile and SPARTAN measured surface dust concentrations for long-term representativeness. This approach benefits from the weak interannual variability of annual mean mineral dust concentrations (Li et al., 2017; Song et al., 2021). Nonetheless, additional observational data will enable further evaluation of the performance of mineral dust simulations. In addition, knowledge gaps remain for mechanistic representation of mineral dust emissions. We call for further developments on the parametrization of dust emissions, particularly for the uncertainties in global and regional dust emission strength and further constraints on the effects of soil wetness on the threshold friction velocity. Future examination of daily variability would also be valuable for short-term predictability.
These investigations indicate the importance of size type reconciliation in models versus measurements, the spatial distribution of dust emissions, the size distribution of emitted dust, and the explicit tracking of fine dust bins for more accurate simulation of fine dust abundance from the surface to the column.
A1 A global dust equation
We follow a global dust equation for the calculation of surface PM2.5 dust concentrations from SPARTAN (Liu et al., 2022):
where 1.89, 2.14, 1.40, 1.36, and 1.67 are the mass conversion ratios for corresponding mineral oxides; MAL is the mineral-to-aluminum mass ratio of ; CF is a correction factor (CF) to account for other missing compounds.
A2 Horizontal saltation flux in standard version of GEOS-Chem
The default horizontal saltation flux Qs in GEOS-Chem is based on the parametrization of White (1979):
where Cz=2.61 is the saltation constant; ρa is the air density in kg m−3; g=9.81 m s−2 is the gravitational acceleration; the drag partitioning effects are ignored by default and thus , where u∗ is calculated from the wind speed at 10 m u10 m based on the logarithmic wind profile within the boundary layer under adiabatic conditions (Marticorena and Bergametti, 1995):
where k=0.4 is the von Kármán constant; u10 m is the wind speed at 10 m; z0=10 m is the reference height; m is the surface roughness height. The wet fluid threshold friction velocity of u∗ft is the minimum surface friction velocity required to initiate the saltation from the bare soil (Fécan et al., 1999):
where u∗ft0 is the dry fluid threshold friction velocity following Iversen and White (1982):
where:
Where Dp=75 µm is the diameter of soil particle which corresponds to the minimum dry fluid threshold velocity of u∗ft0 (Iversen and White, 1982).
The enhancement factor fm≥1 is a function of soil wetness (Fécan et al., 1999):
where w is the gravimetric soil moisture (kg kg−1) in the shallowest soil layer; wt is the threshold gravimetric water content above which u∗ft increases with soil wetness (Fécan et al., 1999):
where a is a tuning factor which is taken as by default.
A3 Additional details about the new dust emission scheme
The variables used in the calculation for the total dust emission flux Fd (Eq. 6) can be categorized into meteorological fields including η, ρa, and u∗, land surface properties including fbare, , Feff, and u∗it, intrinsic soil erodibility properties including u∗st, Cd, and κ, and a global tuning factor of Ctune.
Intermittency effects due to the fluctuation of instantaneous soil friction velocity are reflected in the intermittency factor of η, which is denoted by the temporal fraction of active dust emission ranging from 0 to 1 within a transport time step. The parametrization of η is based on Comola et al. (2019):
where Pft and Pit are the cumulative probability of instantaneous friction velocity larger than a wet fluid threshold, and an impact threshold, respectively; α is the fraction of crossing a wet fluid threshold over the total fraction crossing a wet fluid threshold and an impact threshold.
The calculation of η is based on velocity at the saltation height of zsal=0.1 m. Thus the surface friction velocity of u∗s, and threshold velocities of u∗ft and u∗it are first calculated at the saltation height based on (Marticorena and Bergametti, 1995):
where the subscript X can be ft, it or s, m, and k=0.386 is the von Kármán constant.
Assuming a normal distribution of instantaneous soil friction velocity , a standard deviation of instantaneous friction velocity is a central parameter to calculate the fraction of active dust emissions within a time step for transportation. is calculated based on the similarity theory (Panofsky et al., 1977):
where zi is the planetary boundary layer height, and L is the Monin-bukhov length calculated by (Panofsky et al., 1977):
where cp=1005 J kg−1 K−1 is the specific hear capacity of air under constant pressure; T is surface air temperature; u∗ in m s−1 is the original surface friction velocity without the drag partitioning correction; g=9.81 m s−2 is the gravitational acceleration; H is the sensible heat flux from turbulence in W m−2.
Given that a normal distribution is assumed, cumulative probabilities of Pft and Pit can be calculated by , and . α is the number of crossing rate of across the wet fluid threshold Cft over the total number of crossing rate of across the wet fluid threshold Cft and the impact threshold Cit (Comola et al., 2019):
The crossing fraction of α is approximated by as suggested by Comola et al. (2019).
The soil surface friction velocity of u∗s is calculated by (Leung et al., 2023; Marticorena and Bergametti, 1995; Webb et al., 2020):
where u∗ is the surface friction velocity taken directly from the parent meteorological fields; Feff is the drag partitioning effects due to the presence of non-erodible elements including rocks and vegetation.
Drag partitioning effects are calculated following Leung et al. (2023):
where Ar is the fraction of barren and sparsely vegetated land cover approximated by Aerod; Av is the fraction of short vegetation land cover taken from the MCD12C1 Version 6.1 land cover product; feff,r is the drag partitioning effects due to rocks (Marticorena and Bergametti, 1995):
where z0a is the aeolian roughness length which the surface roughness of overlaying nonerodable elements and was taken as the minimum of monthly mean gridded aeolian roughness length (Prigent et al., 2005); is the smooth roughness length which quantifies the roughness of a bed of fine soil particles in the absence of roughness elements (Pierre et al., 2014b); b1=0.7, b2=0.8, and X=10 m are empirical constants (Leung et al., 2023). feff,v is the drag partitioning effects due to vegetation (Pierre et al., 2014a):
where f0=0.32 and c=4.8 are empirical constants (Okin, 2008); K is calculated by (Leung et al., 2023; Okin, 2008).
The wet fluid threshold velocity u∗ft is calculated using Eq. (A4), except the dry fluid threshold velocity u∗ft0 is calculated by (Shao and Lu, 2000):
where A=0.0123 and kg s−2 are empirical constants (Darmenova et al., 2009; Leung et al., 2023); µm is the median diameter of soil particle as evaluated from various field measurements in Leung et al. (2023).
Once the saltation is initialized, the threshold velocity required to maintain the saltation diminishes, which is defined as the dynamic or impact threshold friction velocity u∗it in m s−1 (Martin and Kok, 2018):
where Bit=0.82. A prior study suggested that the impact threshold primarily governed the saltation flux (Martin and Kok, 2018) and thus u∗it is adopted as the governing threshold in Eq. (14).
The standardized wet fluid threshold friction velocity u∗st was proposed and argued as a central factor to characterize soil aridity by a prior study (Kok et al., 2014):
where ρa0=1.225 kg m−3 is the standard surface air density.
The fragmentation exponent of κ quantifies the sensitivity of Fd to u∗s and is capped at 3 to prevent excessive sensitivity of the model to wind speeds according to (Kok et al., 2014; Leung et al., 2024):
where and m s−1 are constants.
The time-varying soil erodibility coefficient is a function of u∗st only (Kok et al., 2014):
where and are empirical constants.
Table A1The mean and standard deviation (σ) of surface PM2.5 dust measured from 25 SPARTAN sites with at least 10 samples in 5 years from 2019 to 2023 globally. Sites are sorted by the mean surface PM2.5 dust concentrations.
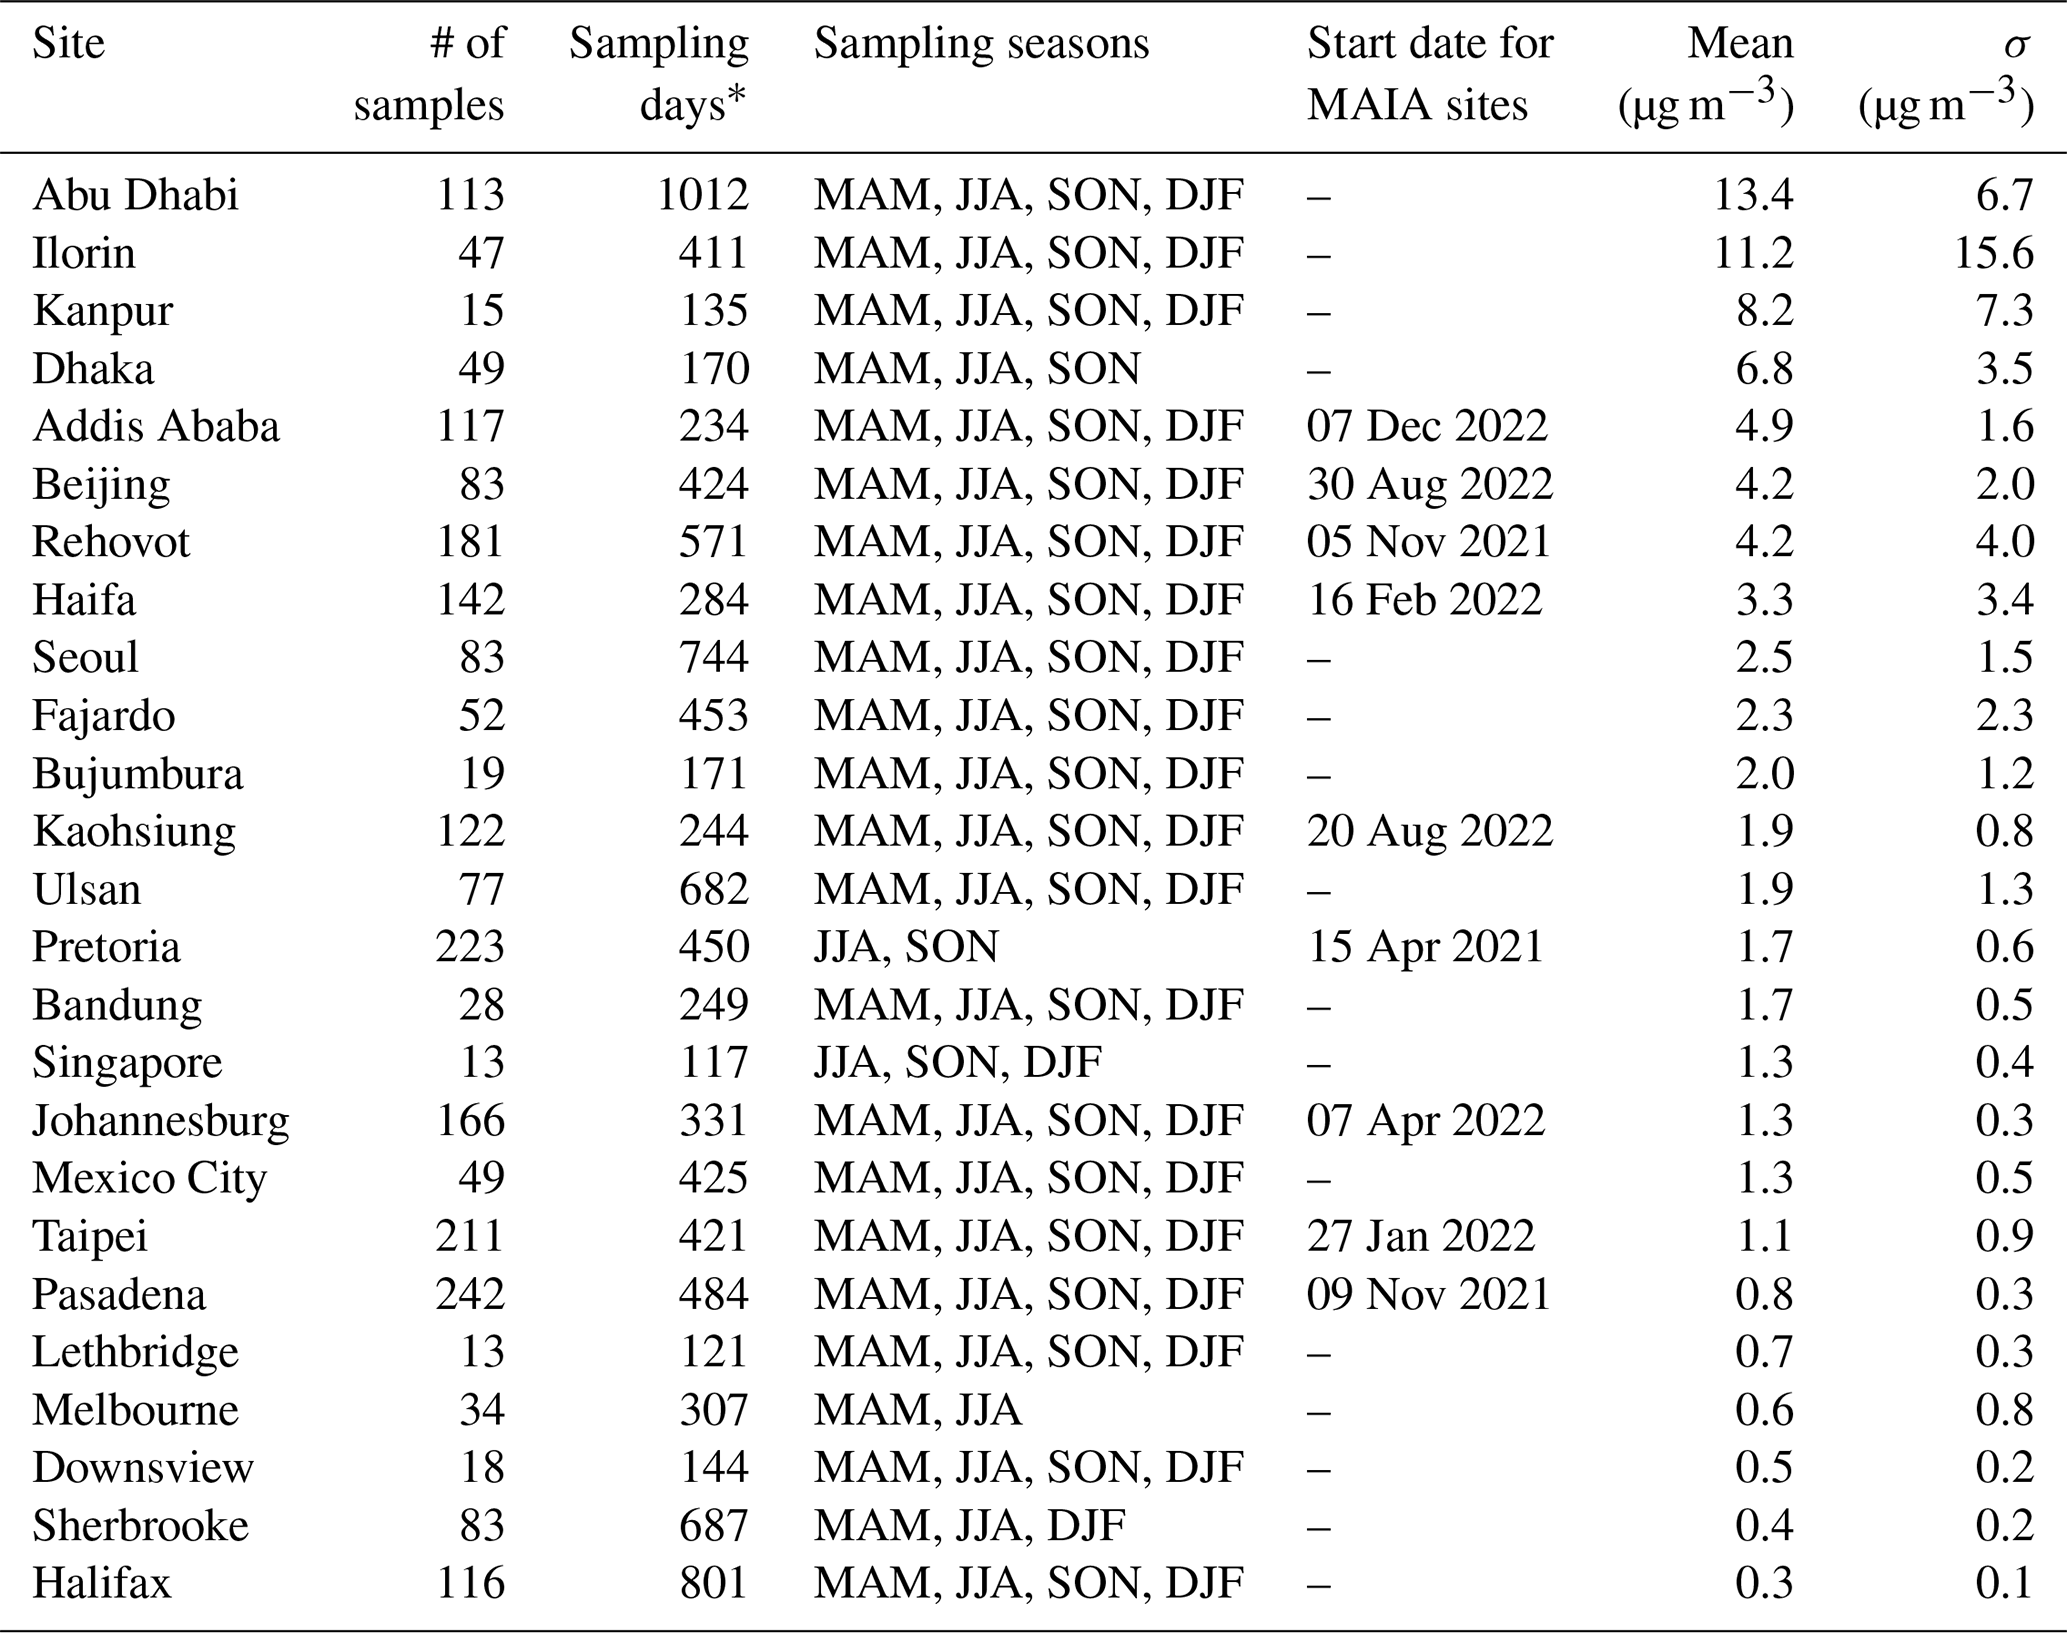
* The number of days when SPARTAN sampling occurred for a part of the day according to either the standard 9 d protocol or the MAIA protocol.
Table A2The values of a global tuning factor Ctune used for different simulations.
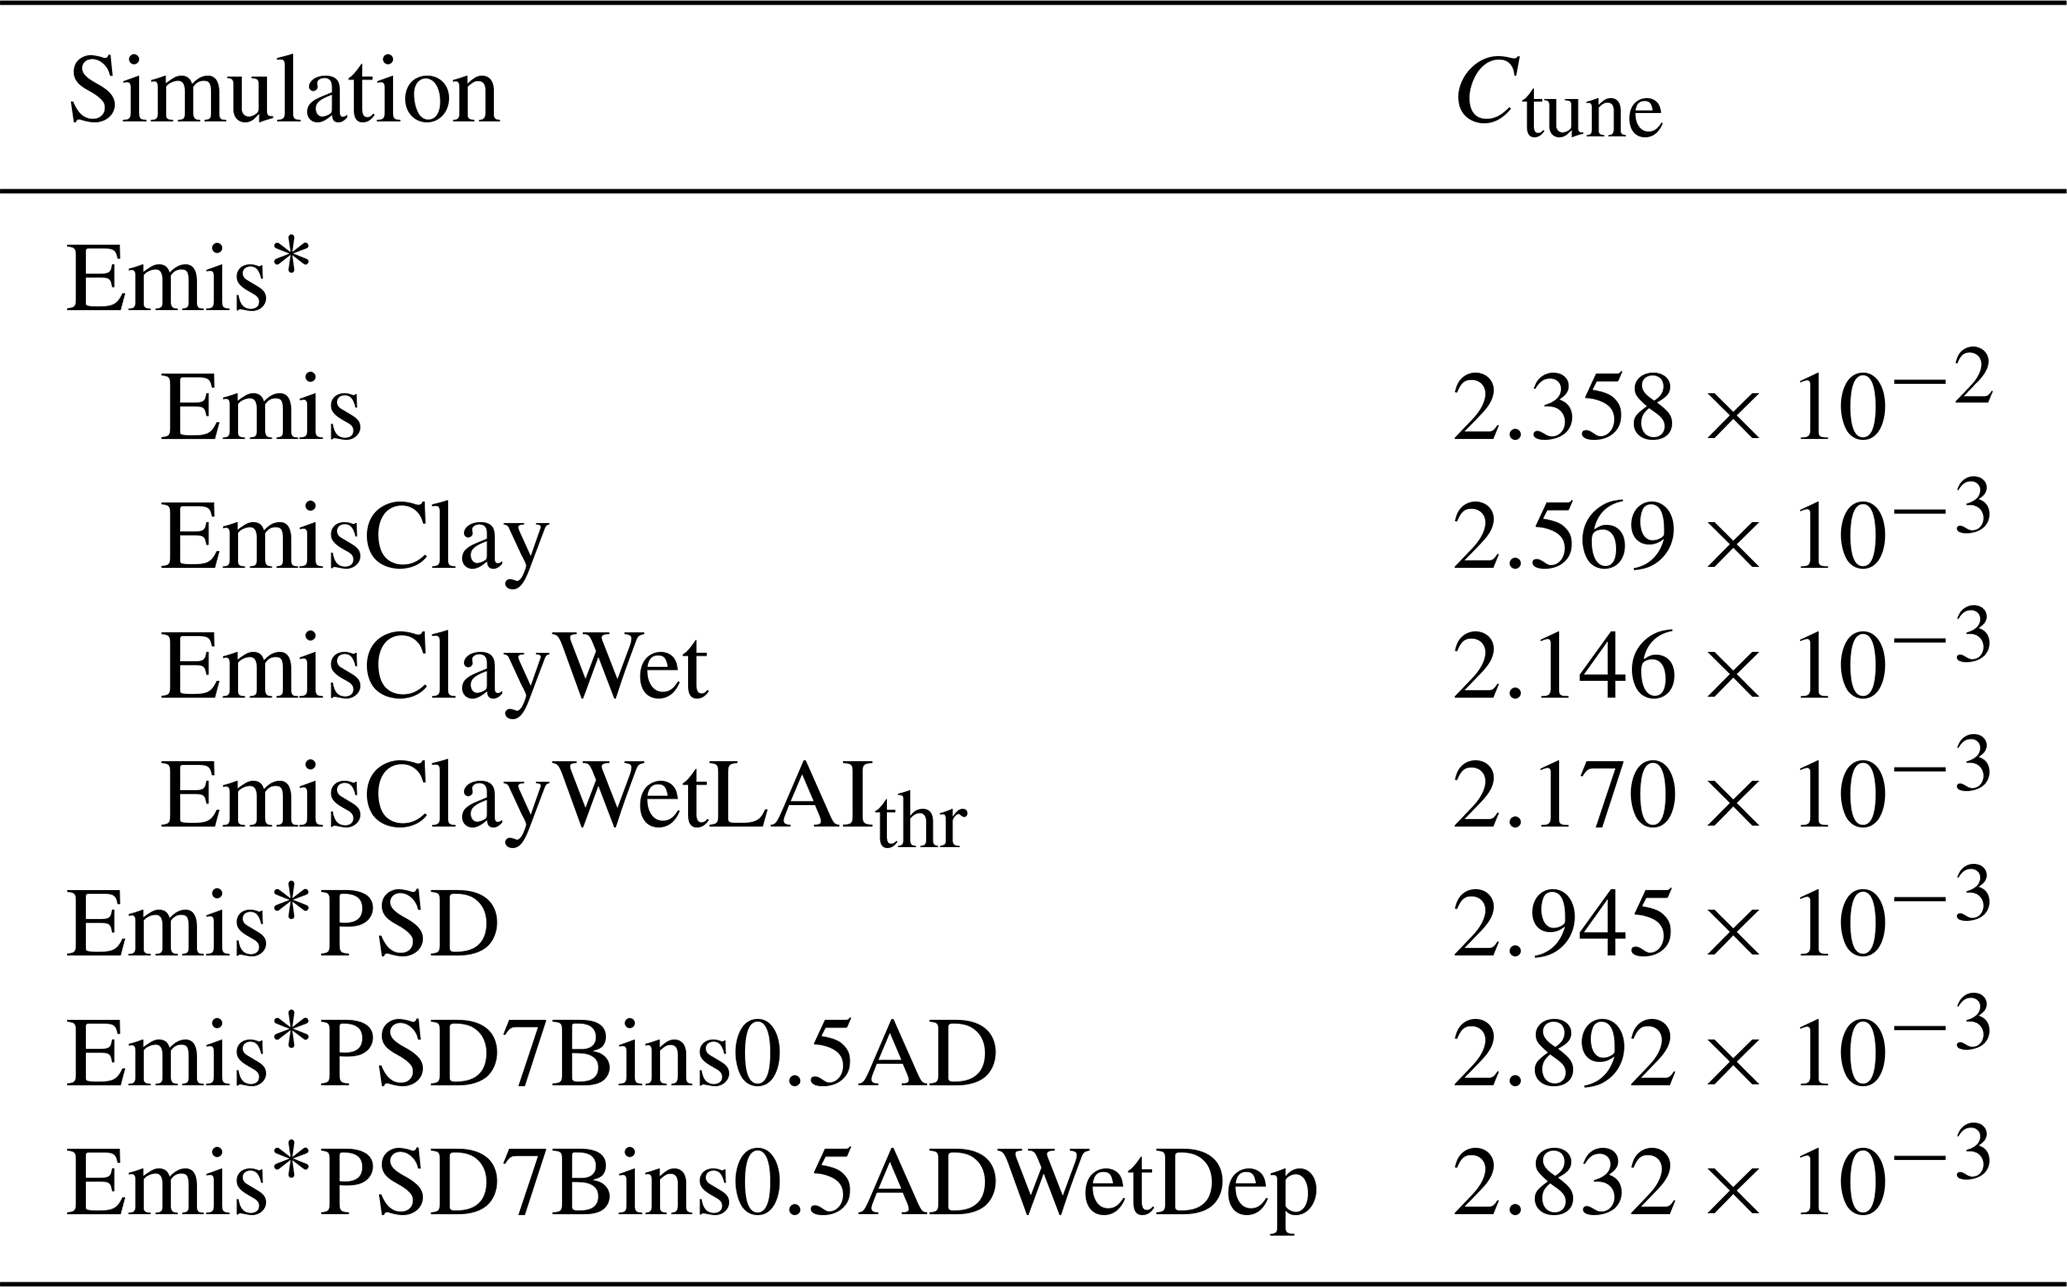
Table A3Effects of different modifications on the model performance of simulated annual surface PM2.5 dust versus SPARTAN over sites with >50 samples in terms of the correlation coefficient (r), the reduced-major-axis linear regression slope, and the normalized mean difference (NMD).
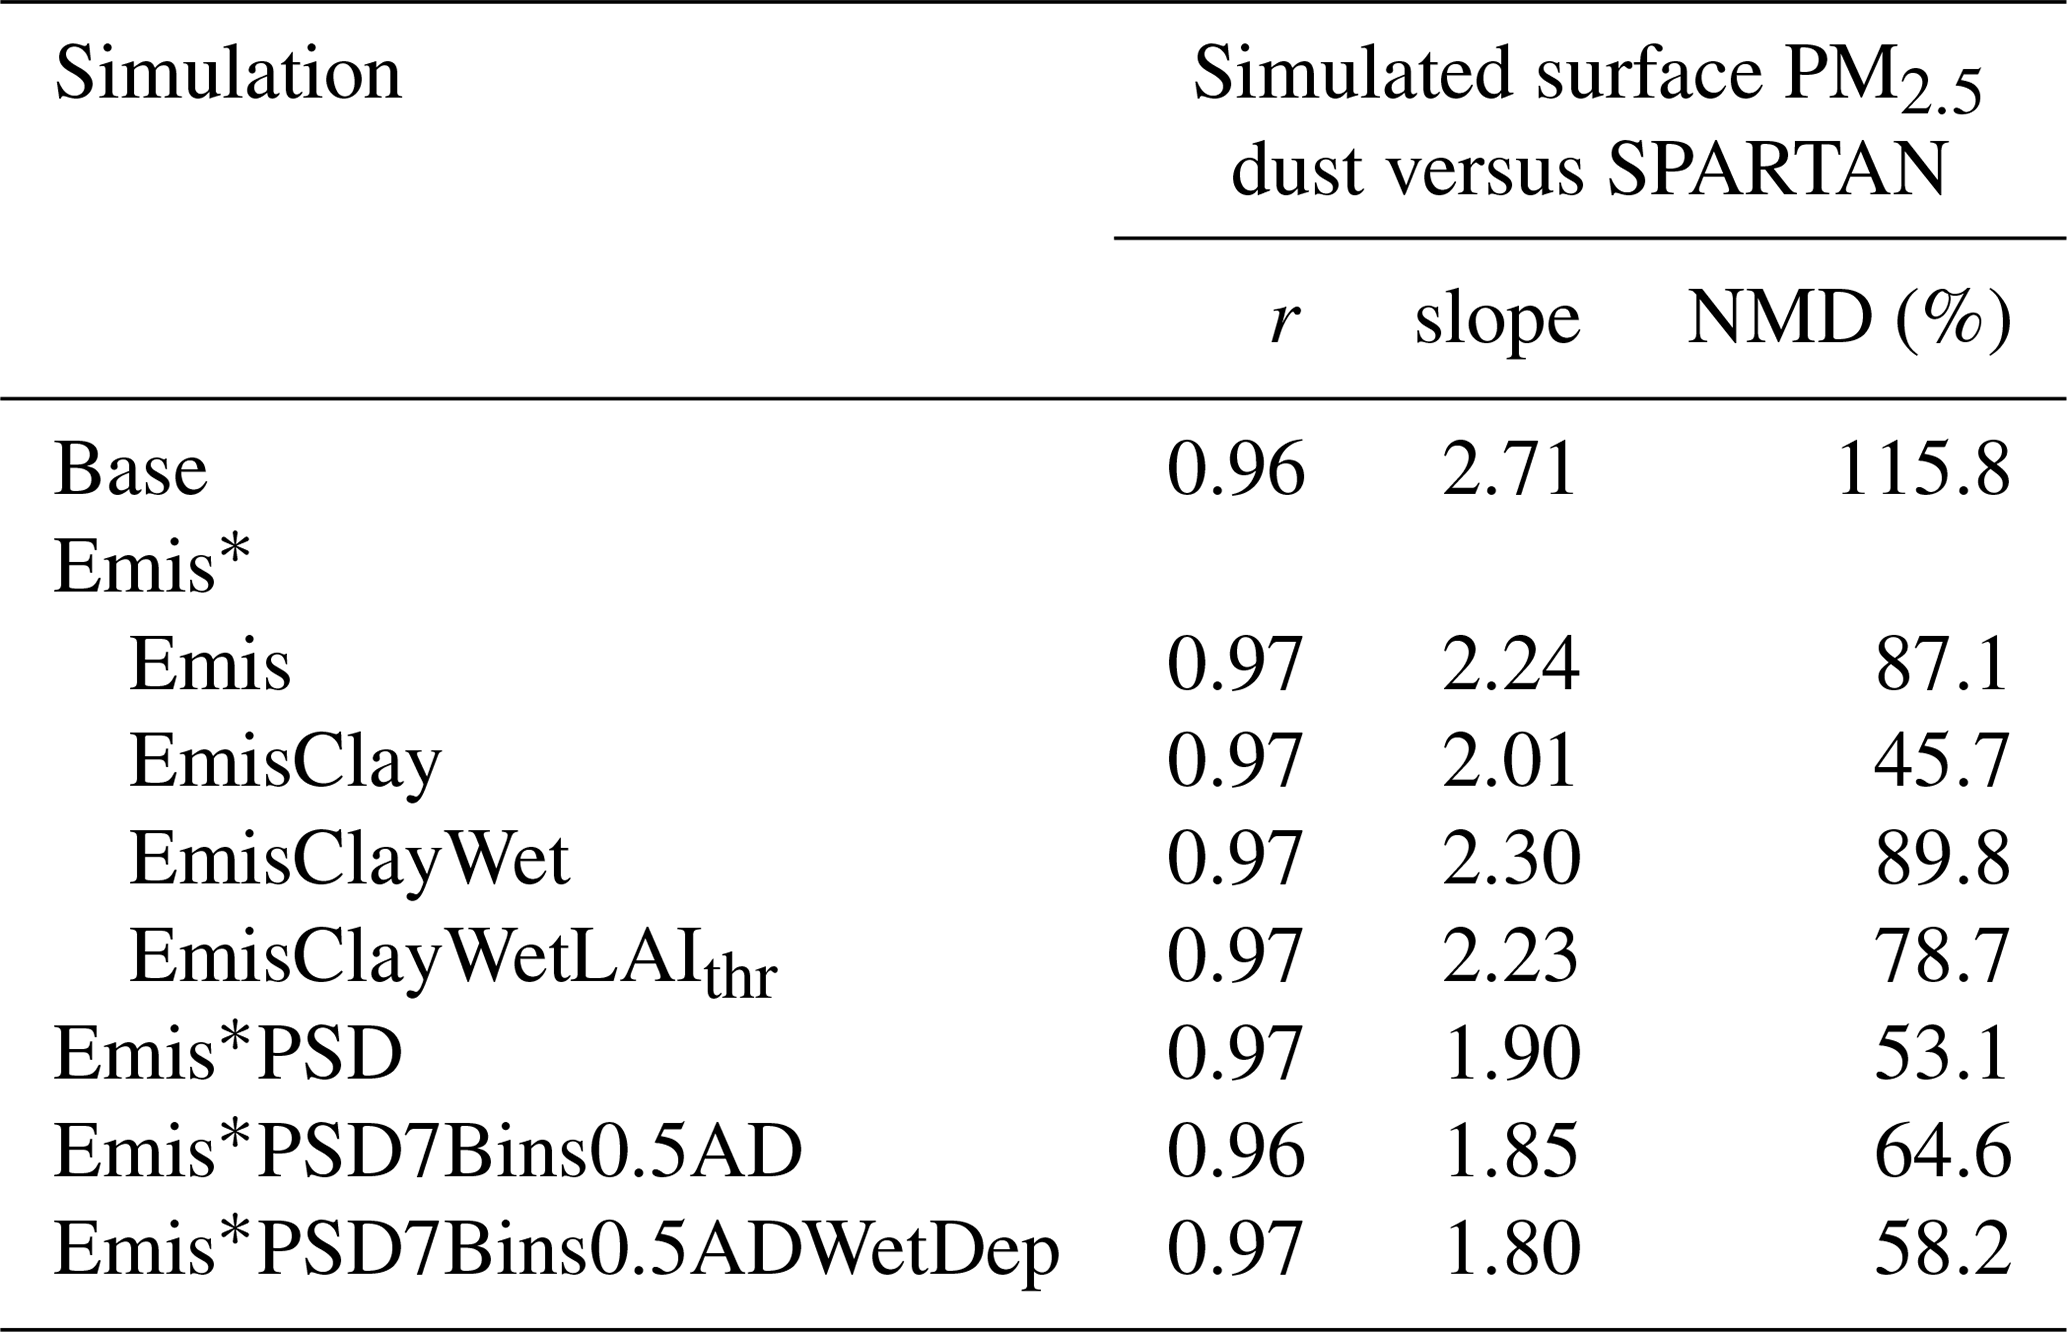
Table A4Computational demand of 4-bin and 7-bin dust simulations.
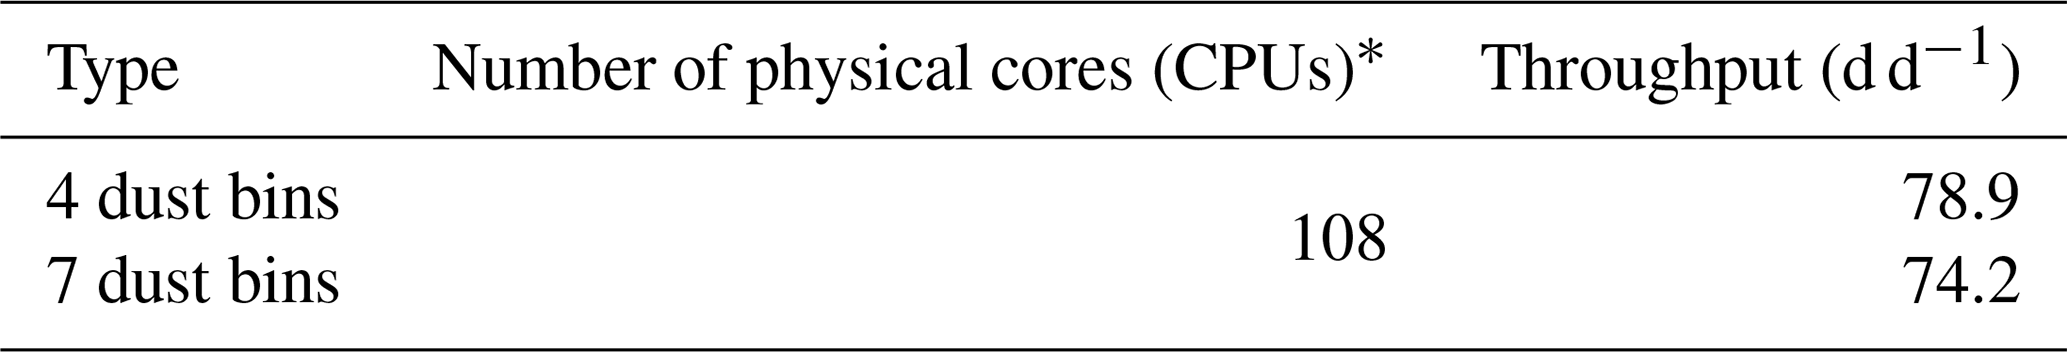
* Calculated on Intel® Xeon® Gold 6154 with the clock speed of 3.00 GHz.
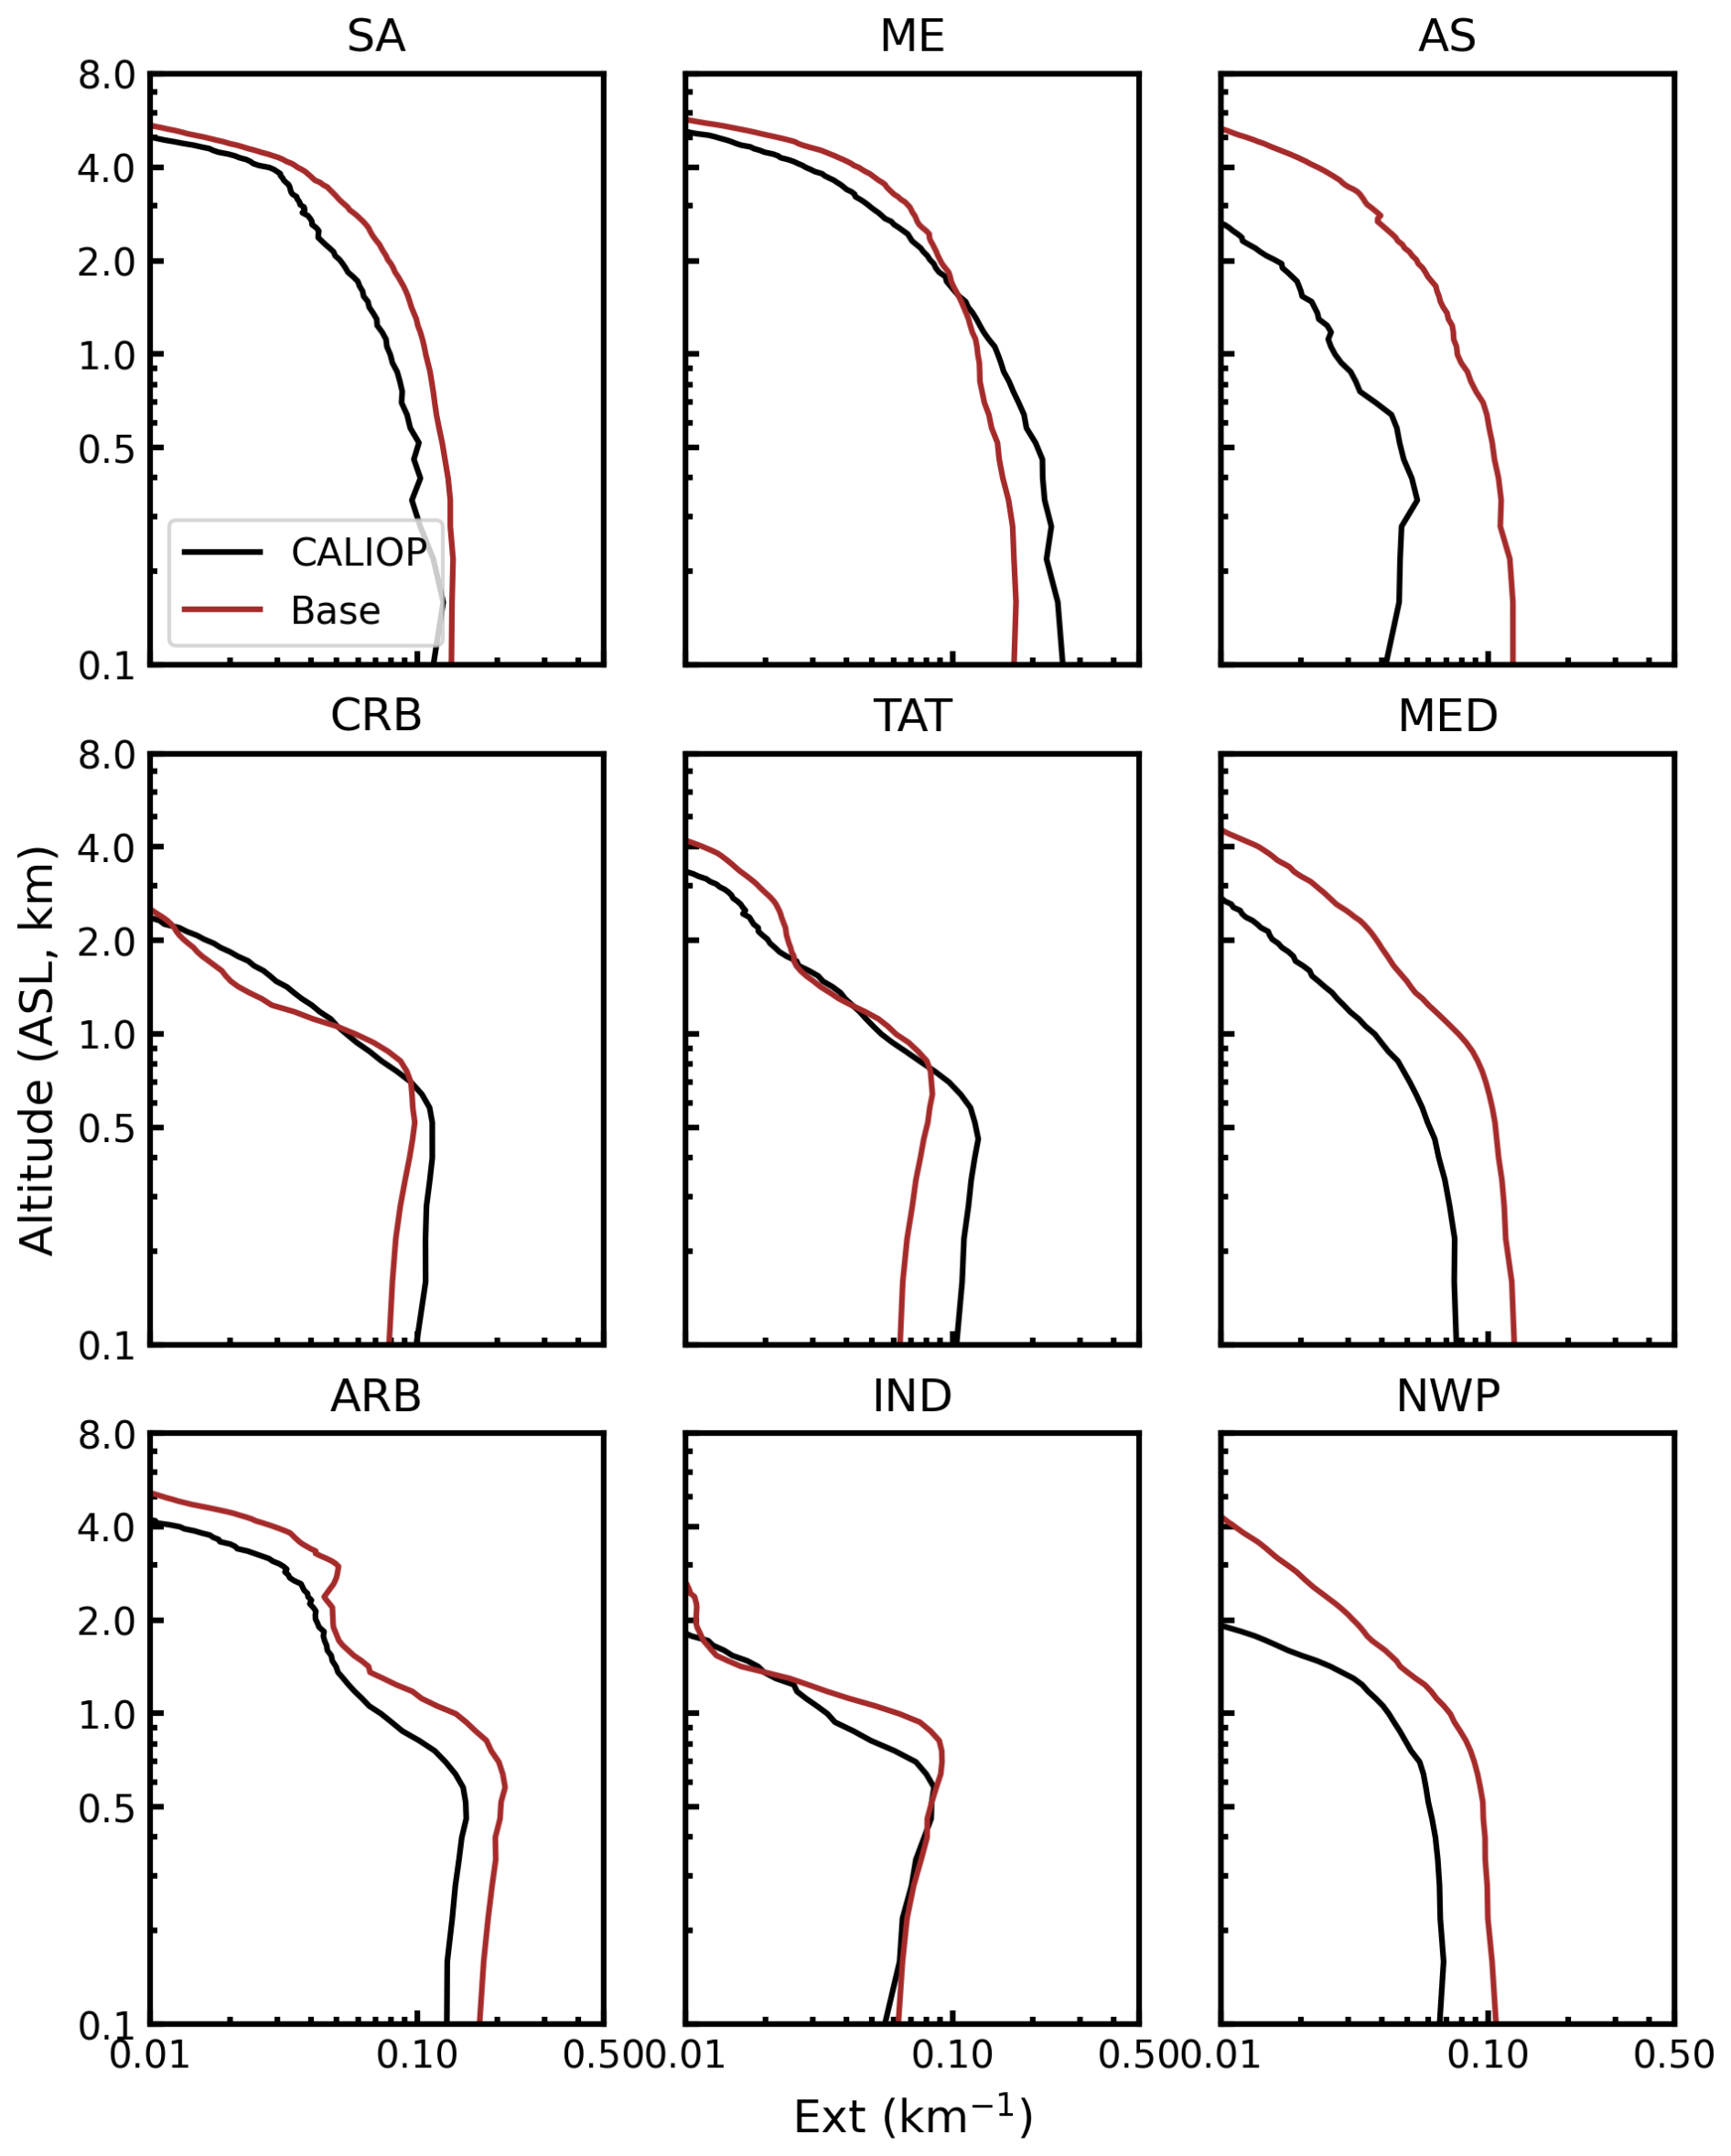
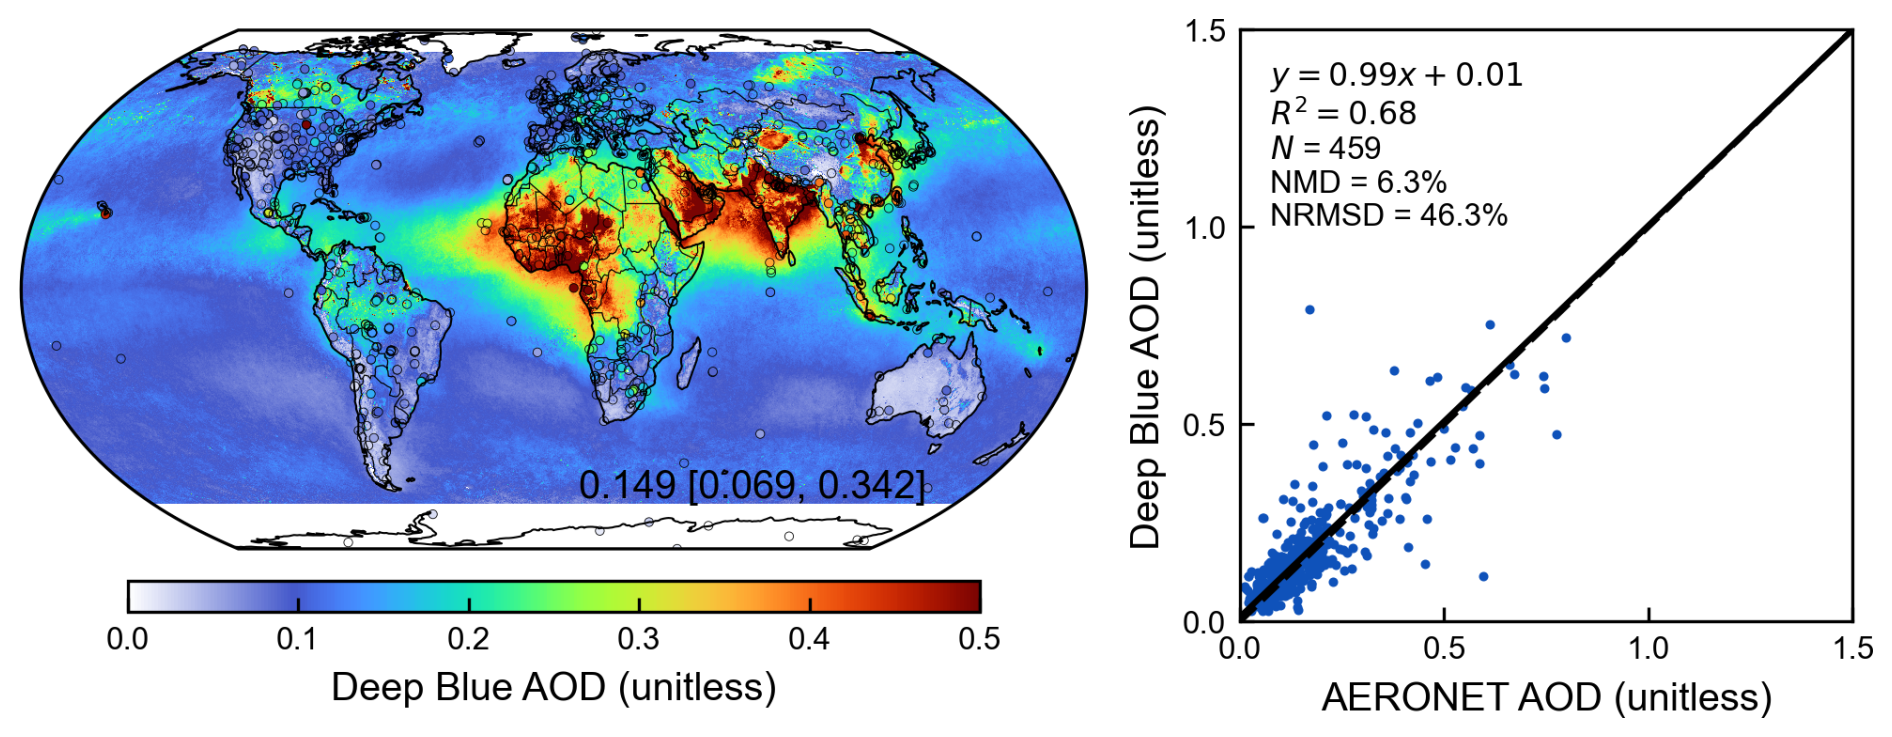
Figure A2Annual aerosol optical depth (AOD) from the Deep Blue satellite retrieval and comparison against ground-based observations from AERONET in the year of 2018. Filled circles on the map represent ground-based observations from AERONET. Inset values at the bottom right of the map are arithmetical mean with 5th and 95th percentiles in the square brackets. Regression statistics including the reduced-major-axis linear regression equation, coefficient of variation (R2), total number of points (N), normalized mean difference (NMD), and normalized root-mean-square difference (NRMSD) are listed at the top left of the scatter plot.
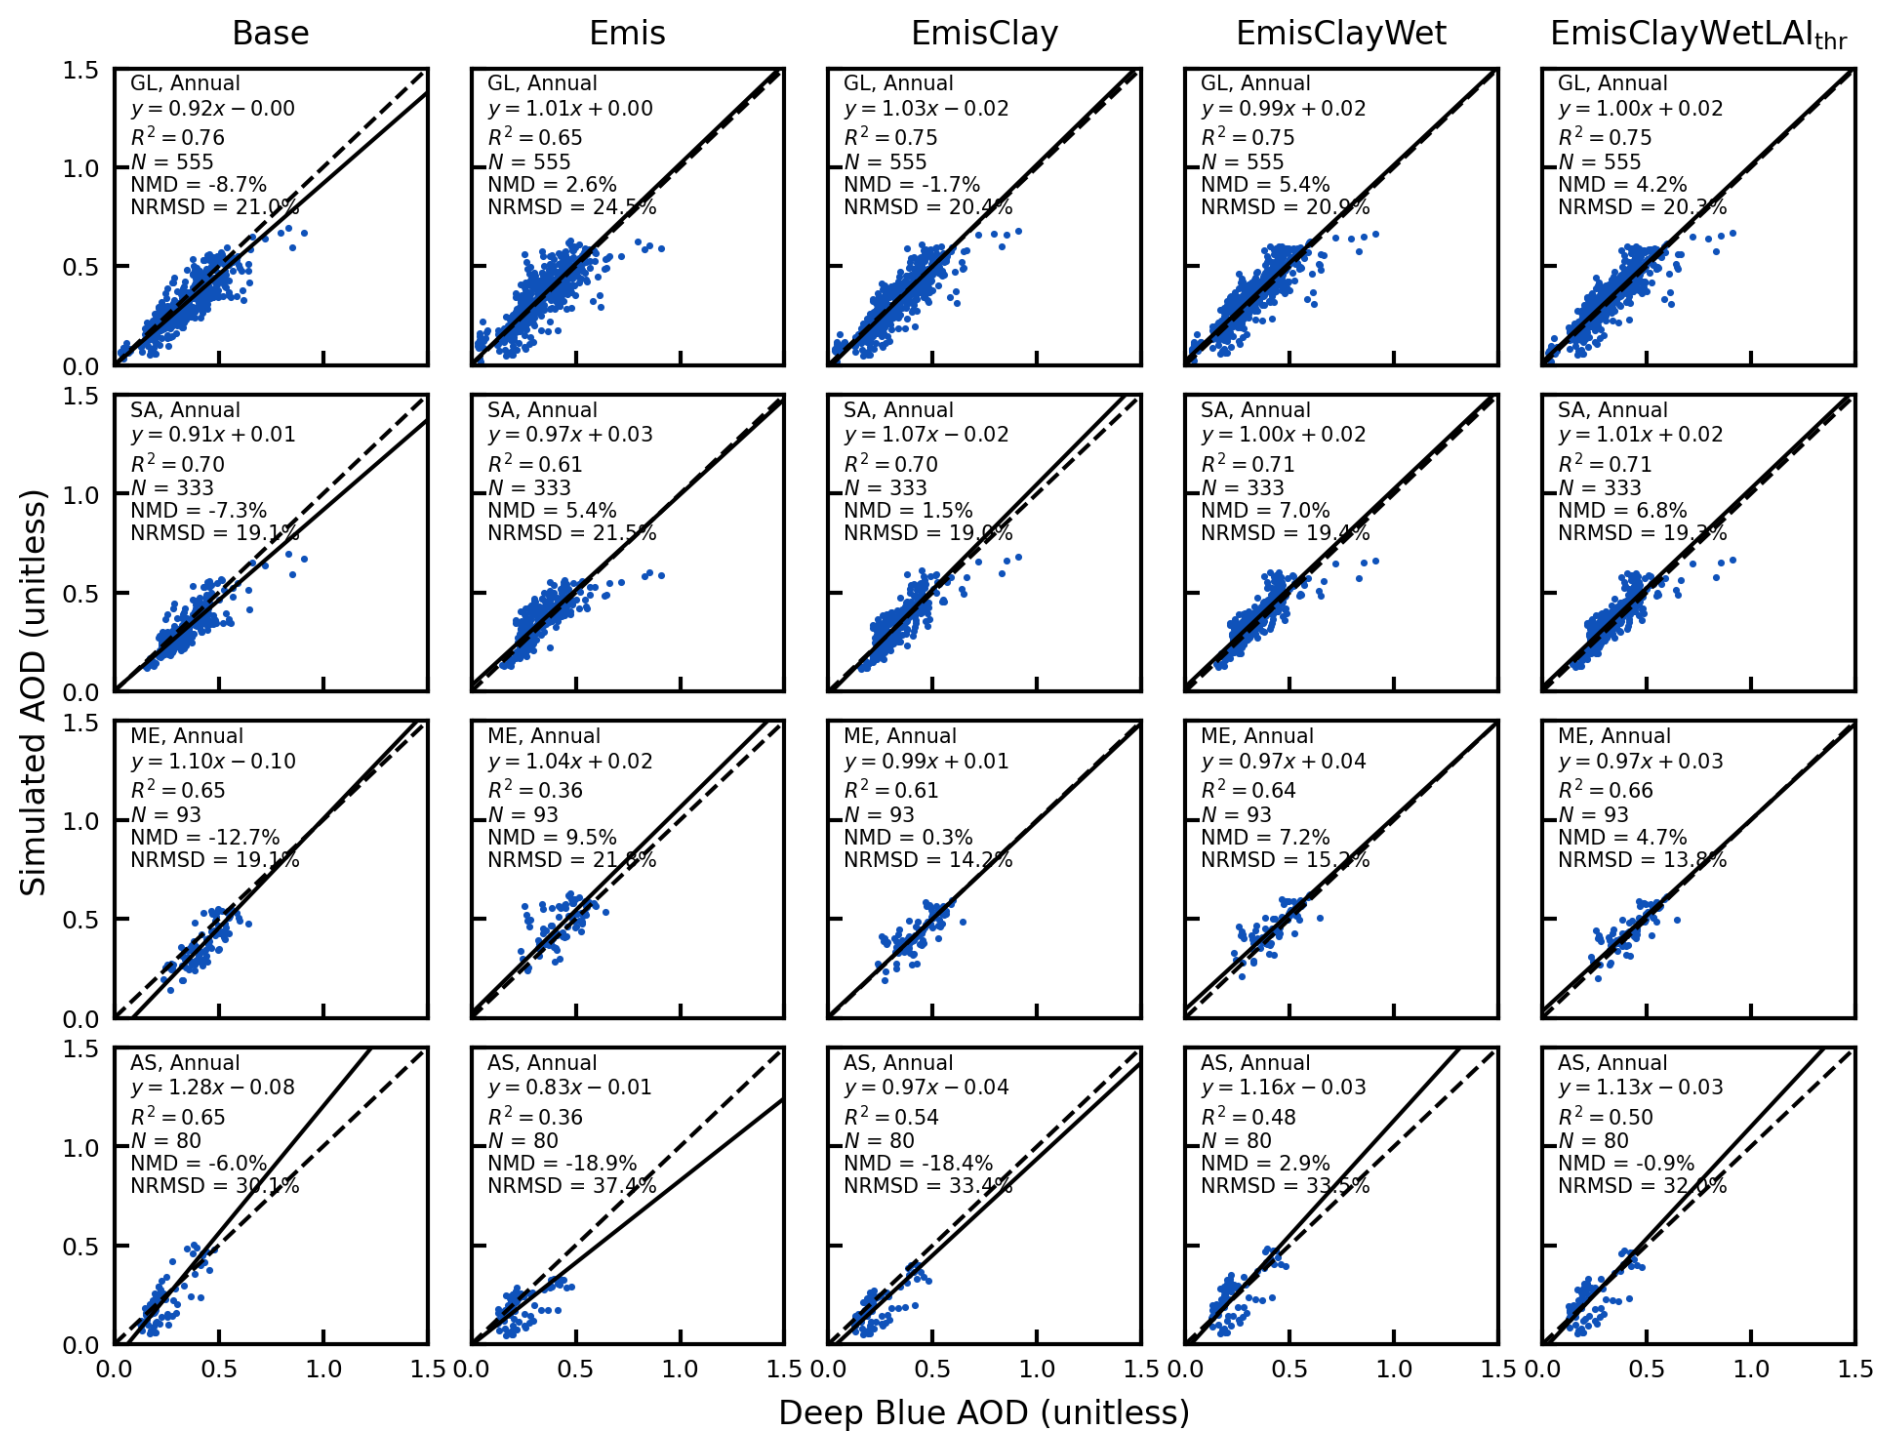
Figure A3Same as Fig. 6 but over the same dust source regions for the Base scheme for all dust emission scheme comparisons versus Deep Blue AOD.
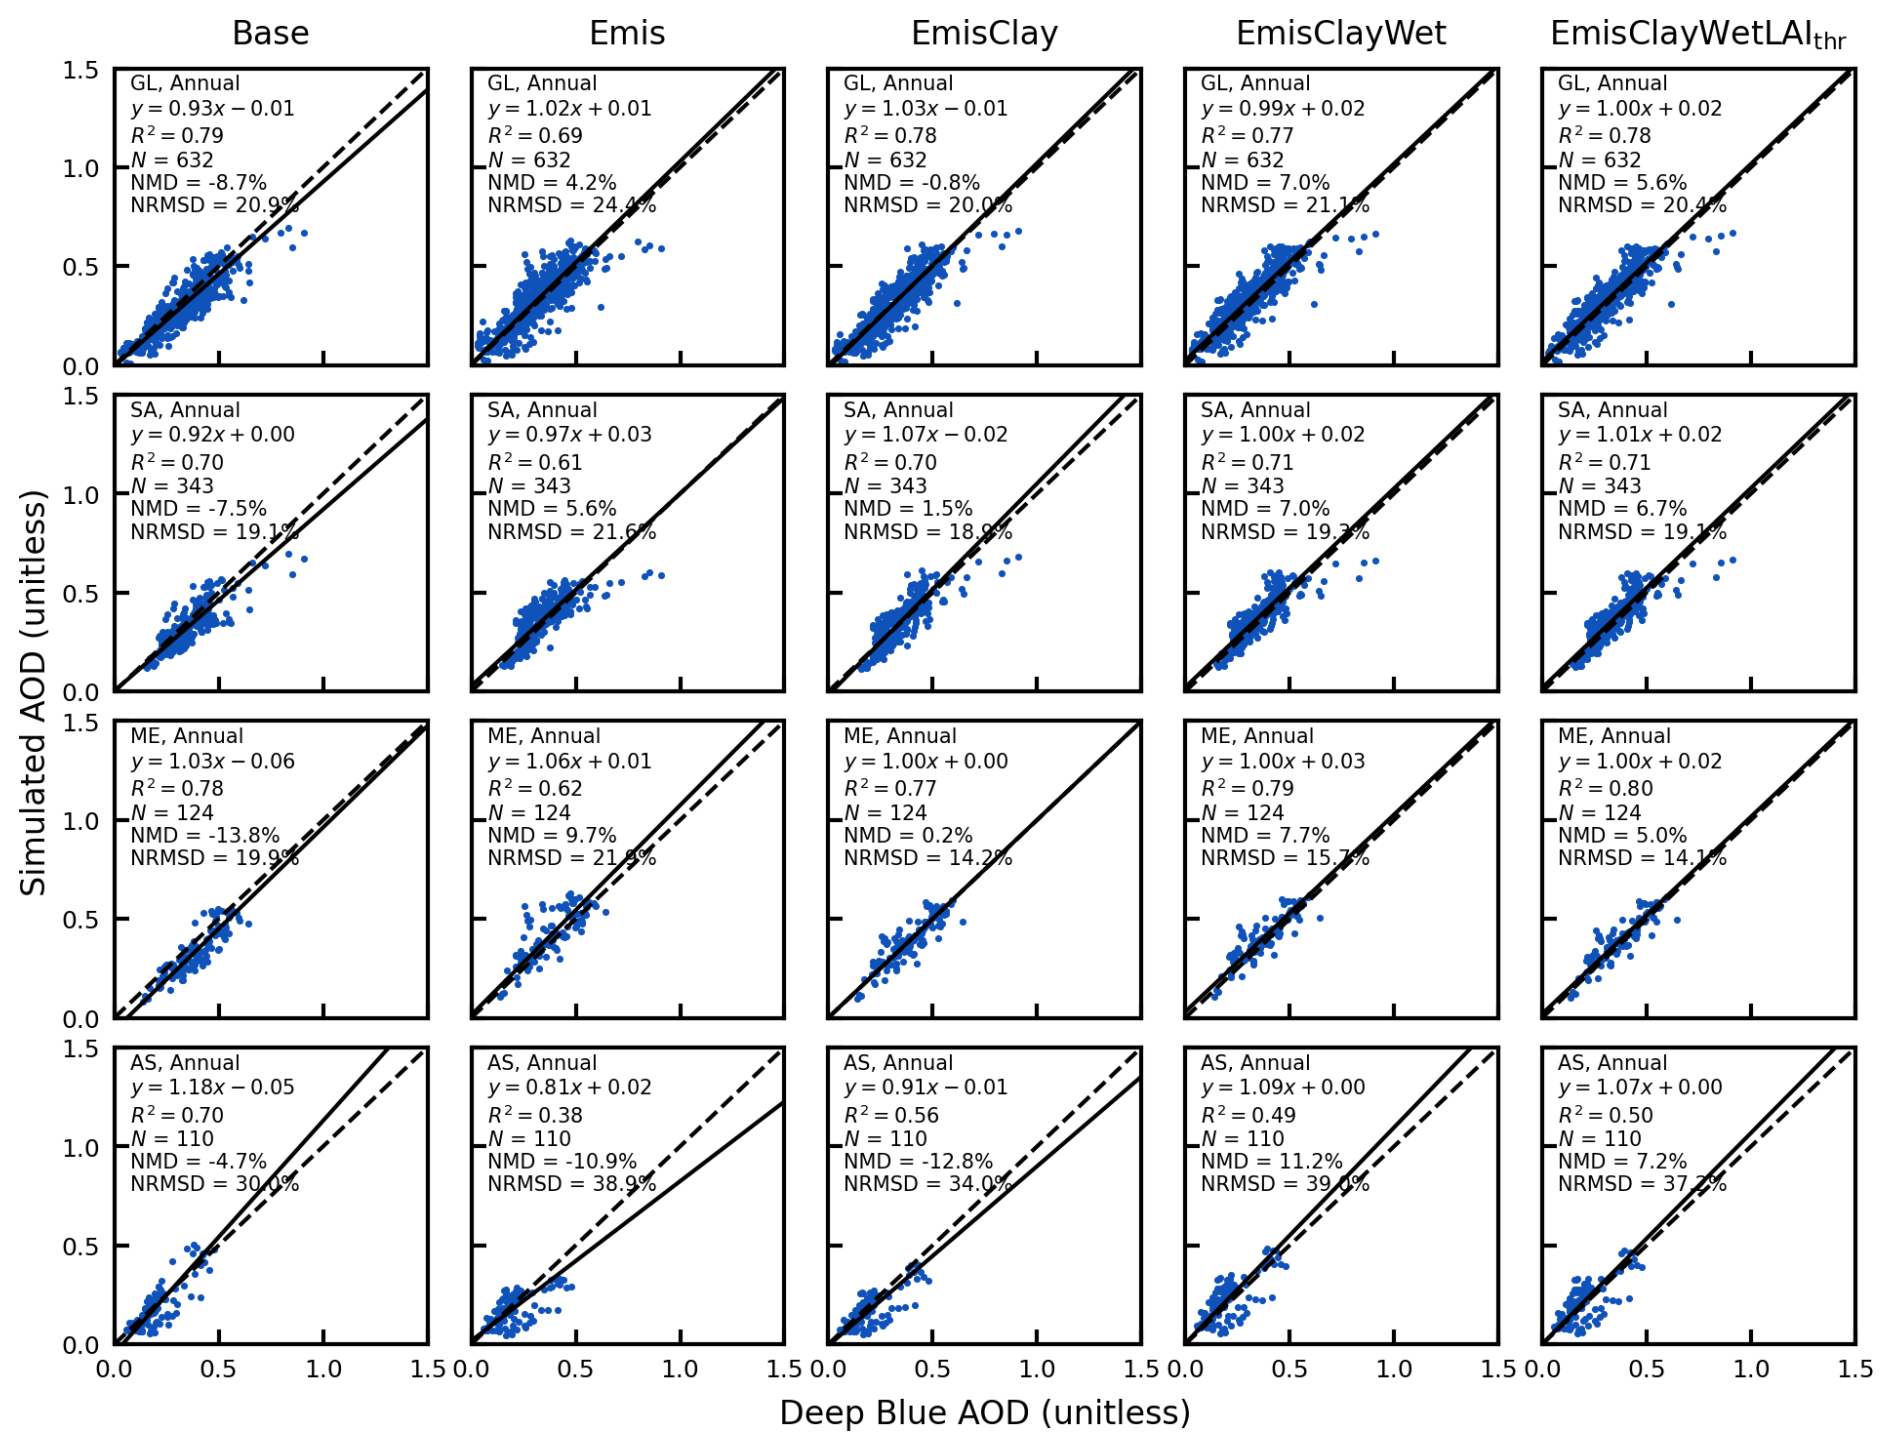
Figure A4Same as Fig. 6 but over the same dust source regions for the EmisClayWetLAIthr scheme for all dust emission scheme comparisons versus Deep Blue AOD.
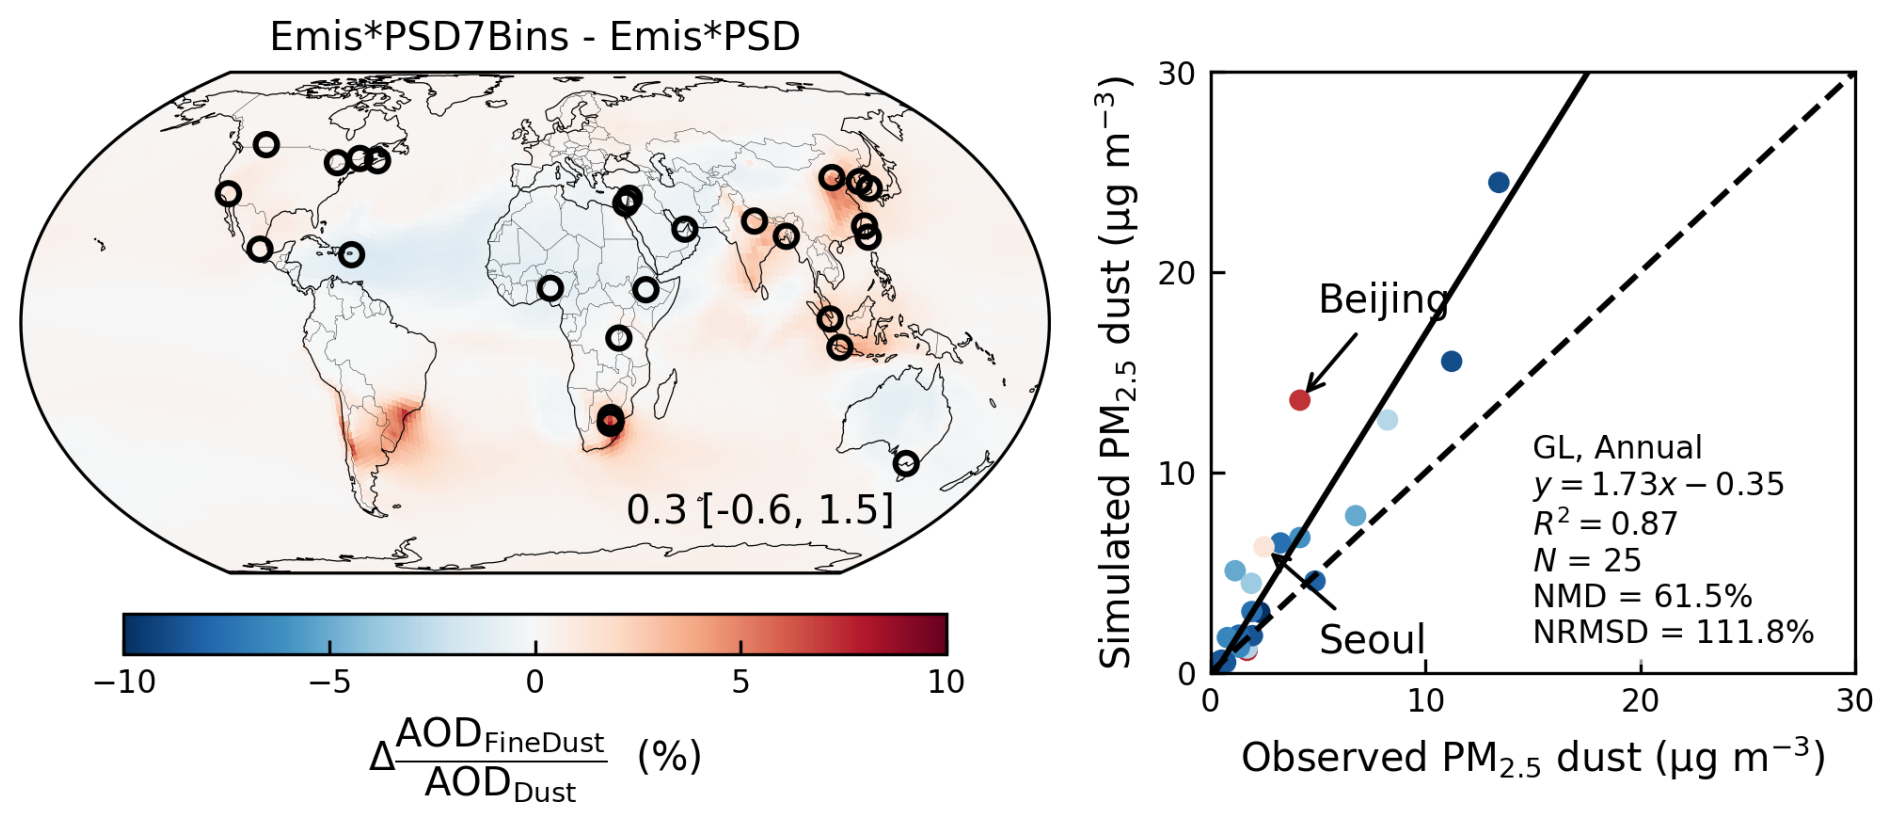
Figure A5Differences of the fractional contributions of fine dust with geometric diameter less than 2 µm to total dust column abundance ( between the Emis*PSD7Bins and Emis*PSD simulations (left); Comparison between simulated PM2.5 dust against SPARTAN measurements from the Emis*PSD7Bins simulation with color coded by the differences of between the Emis*PSD7Bins and Emis*PSD simulations over SPARTAN sites. Open circles in the map indicate SPARTAN sites. Inset values at the bottom right of the map are arithmetical mean with 5th and 95th percentiles in the square brackets. Regression statistics including the reduced-major-axis linear regression equation, coefficient of variation (R2), total number of points (N), normalized mean difference (NMD), and normalized root-mean-square difference (NRMSD) are listed at the bottom right of the scatter plot.
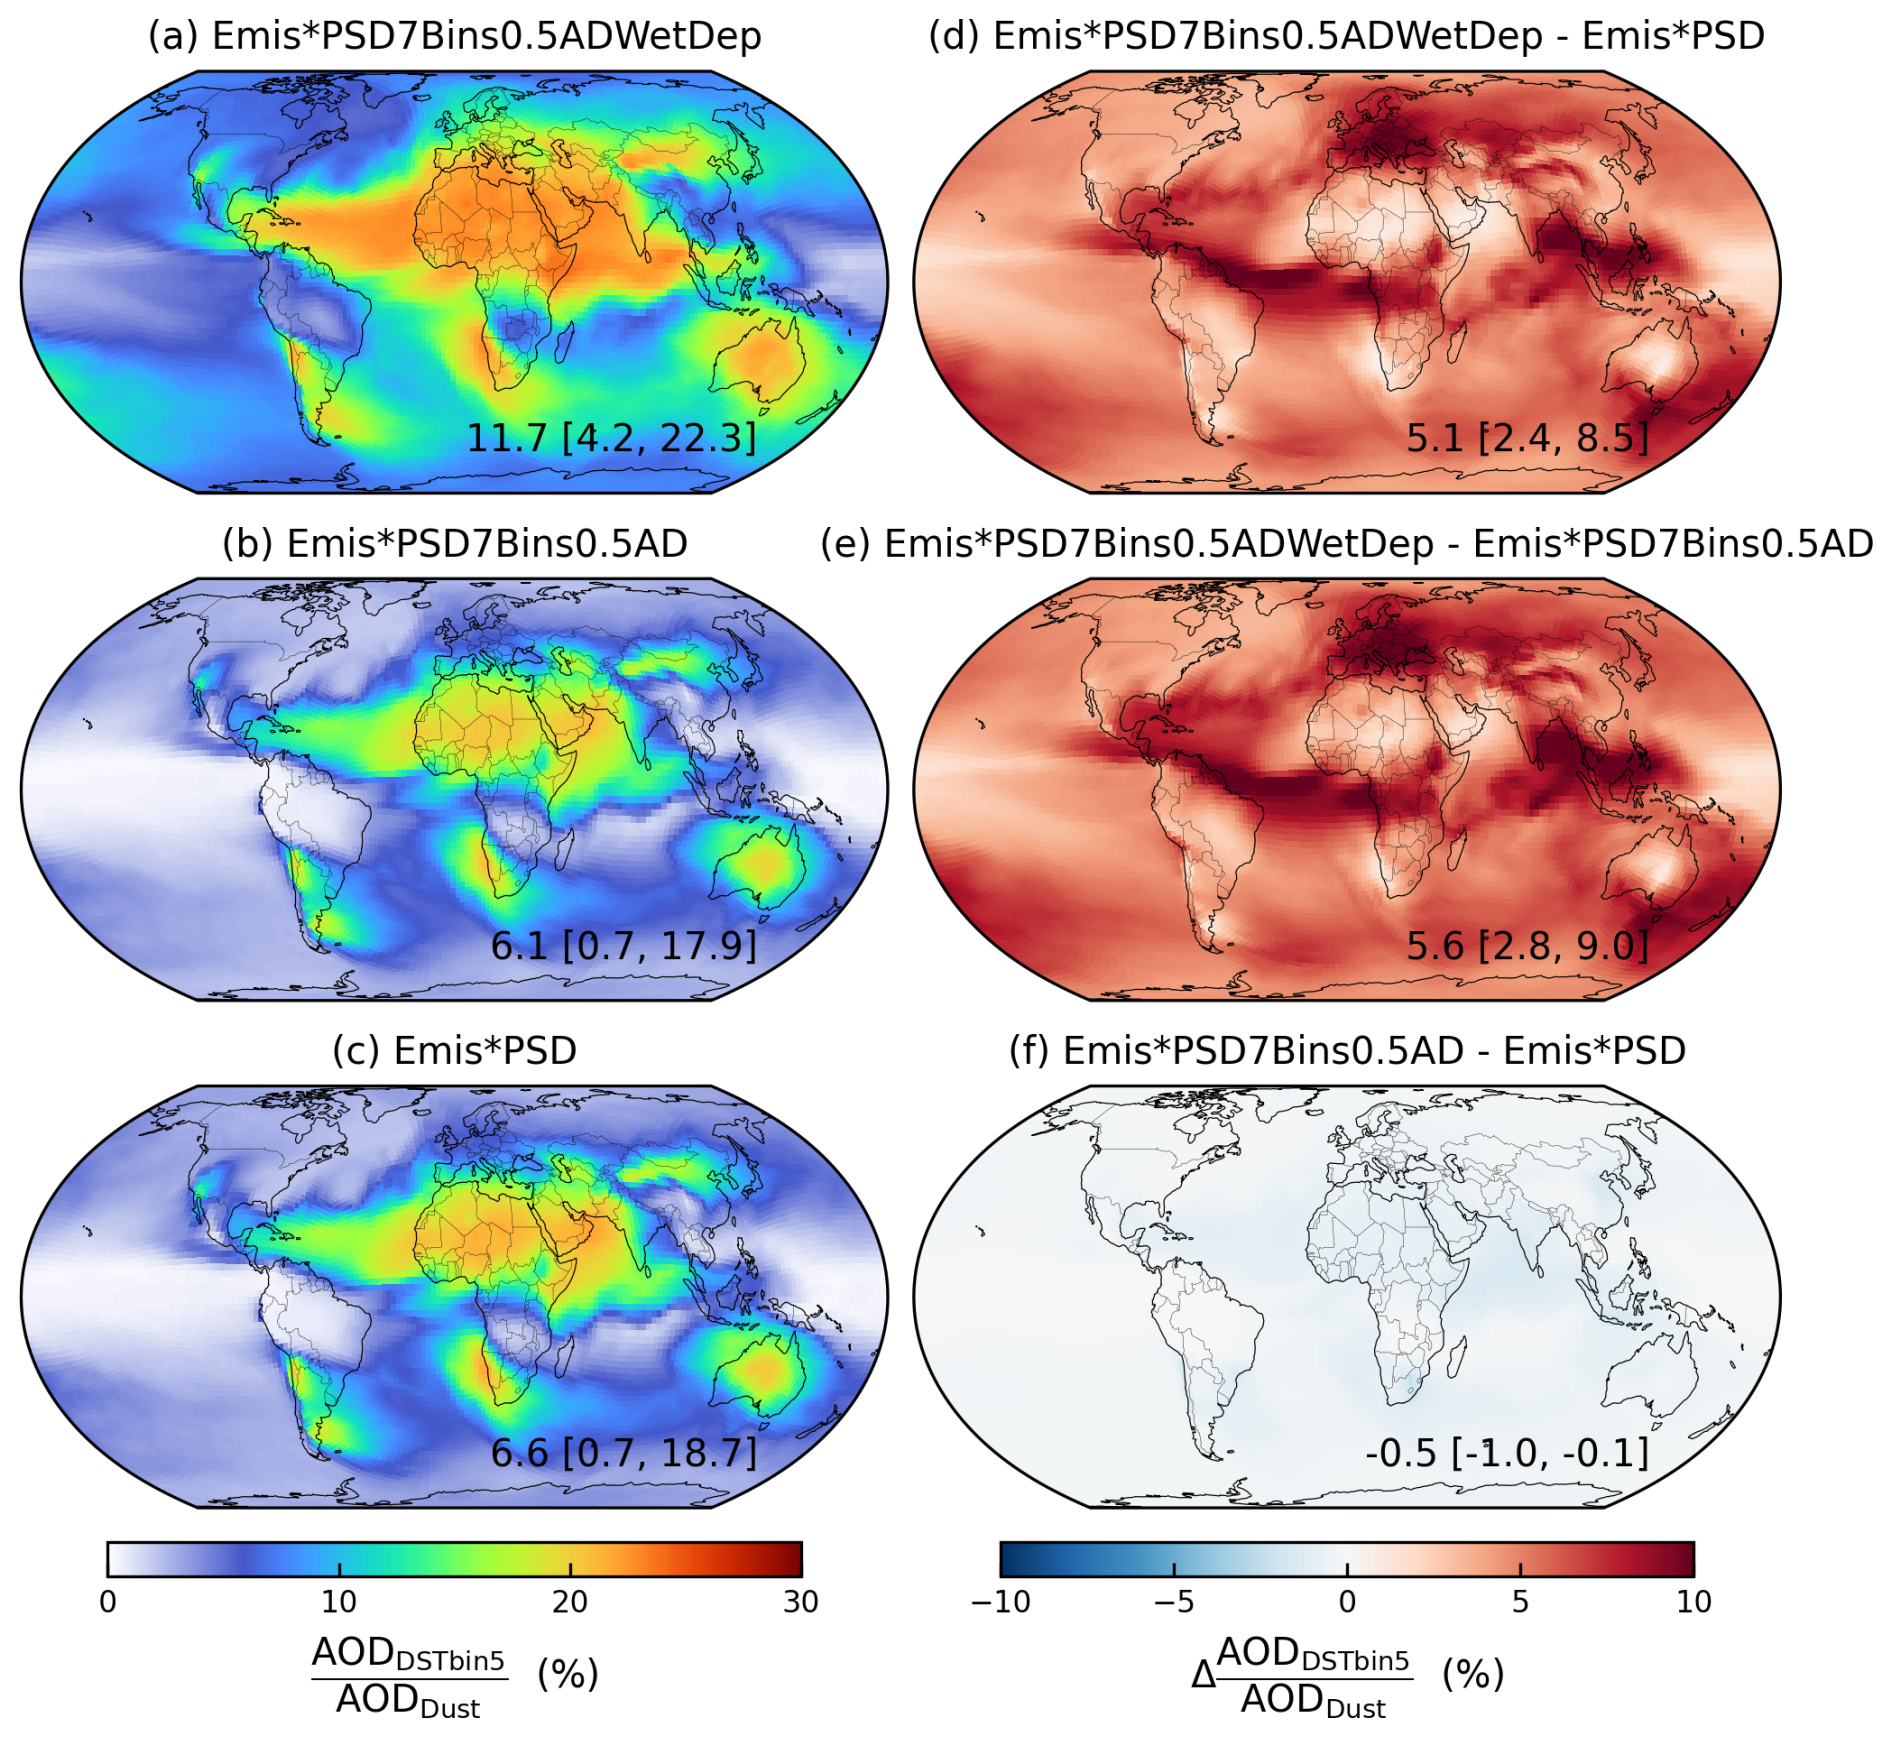
Figure A6Fractional contributions of DSTbin5 to total dust column abundance ( from the (a) Emis*PSD7Bins0.5ADWetDep, (b) Emis*PSD7Bins0.5AD, (c) Emis*PSD and their absolute differences. Inset values at the bottom right are arithmetical mean with 5th and 95th percentiles in the square brackets.
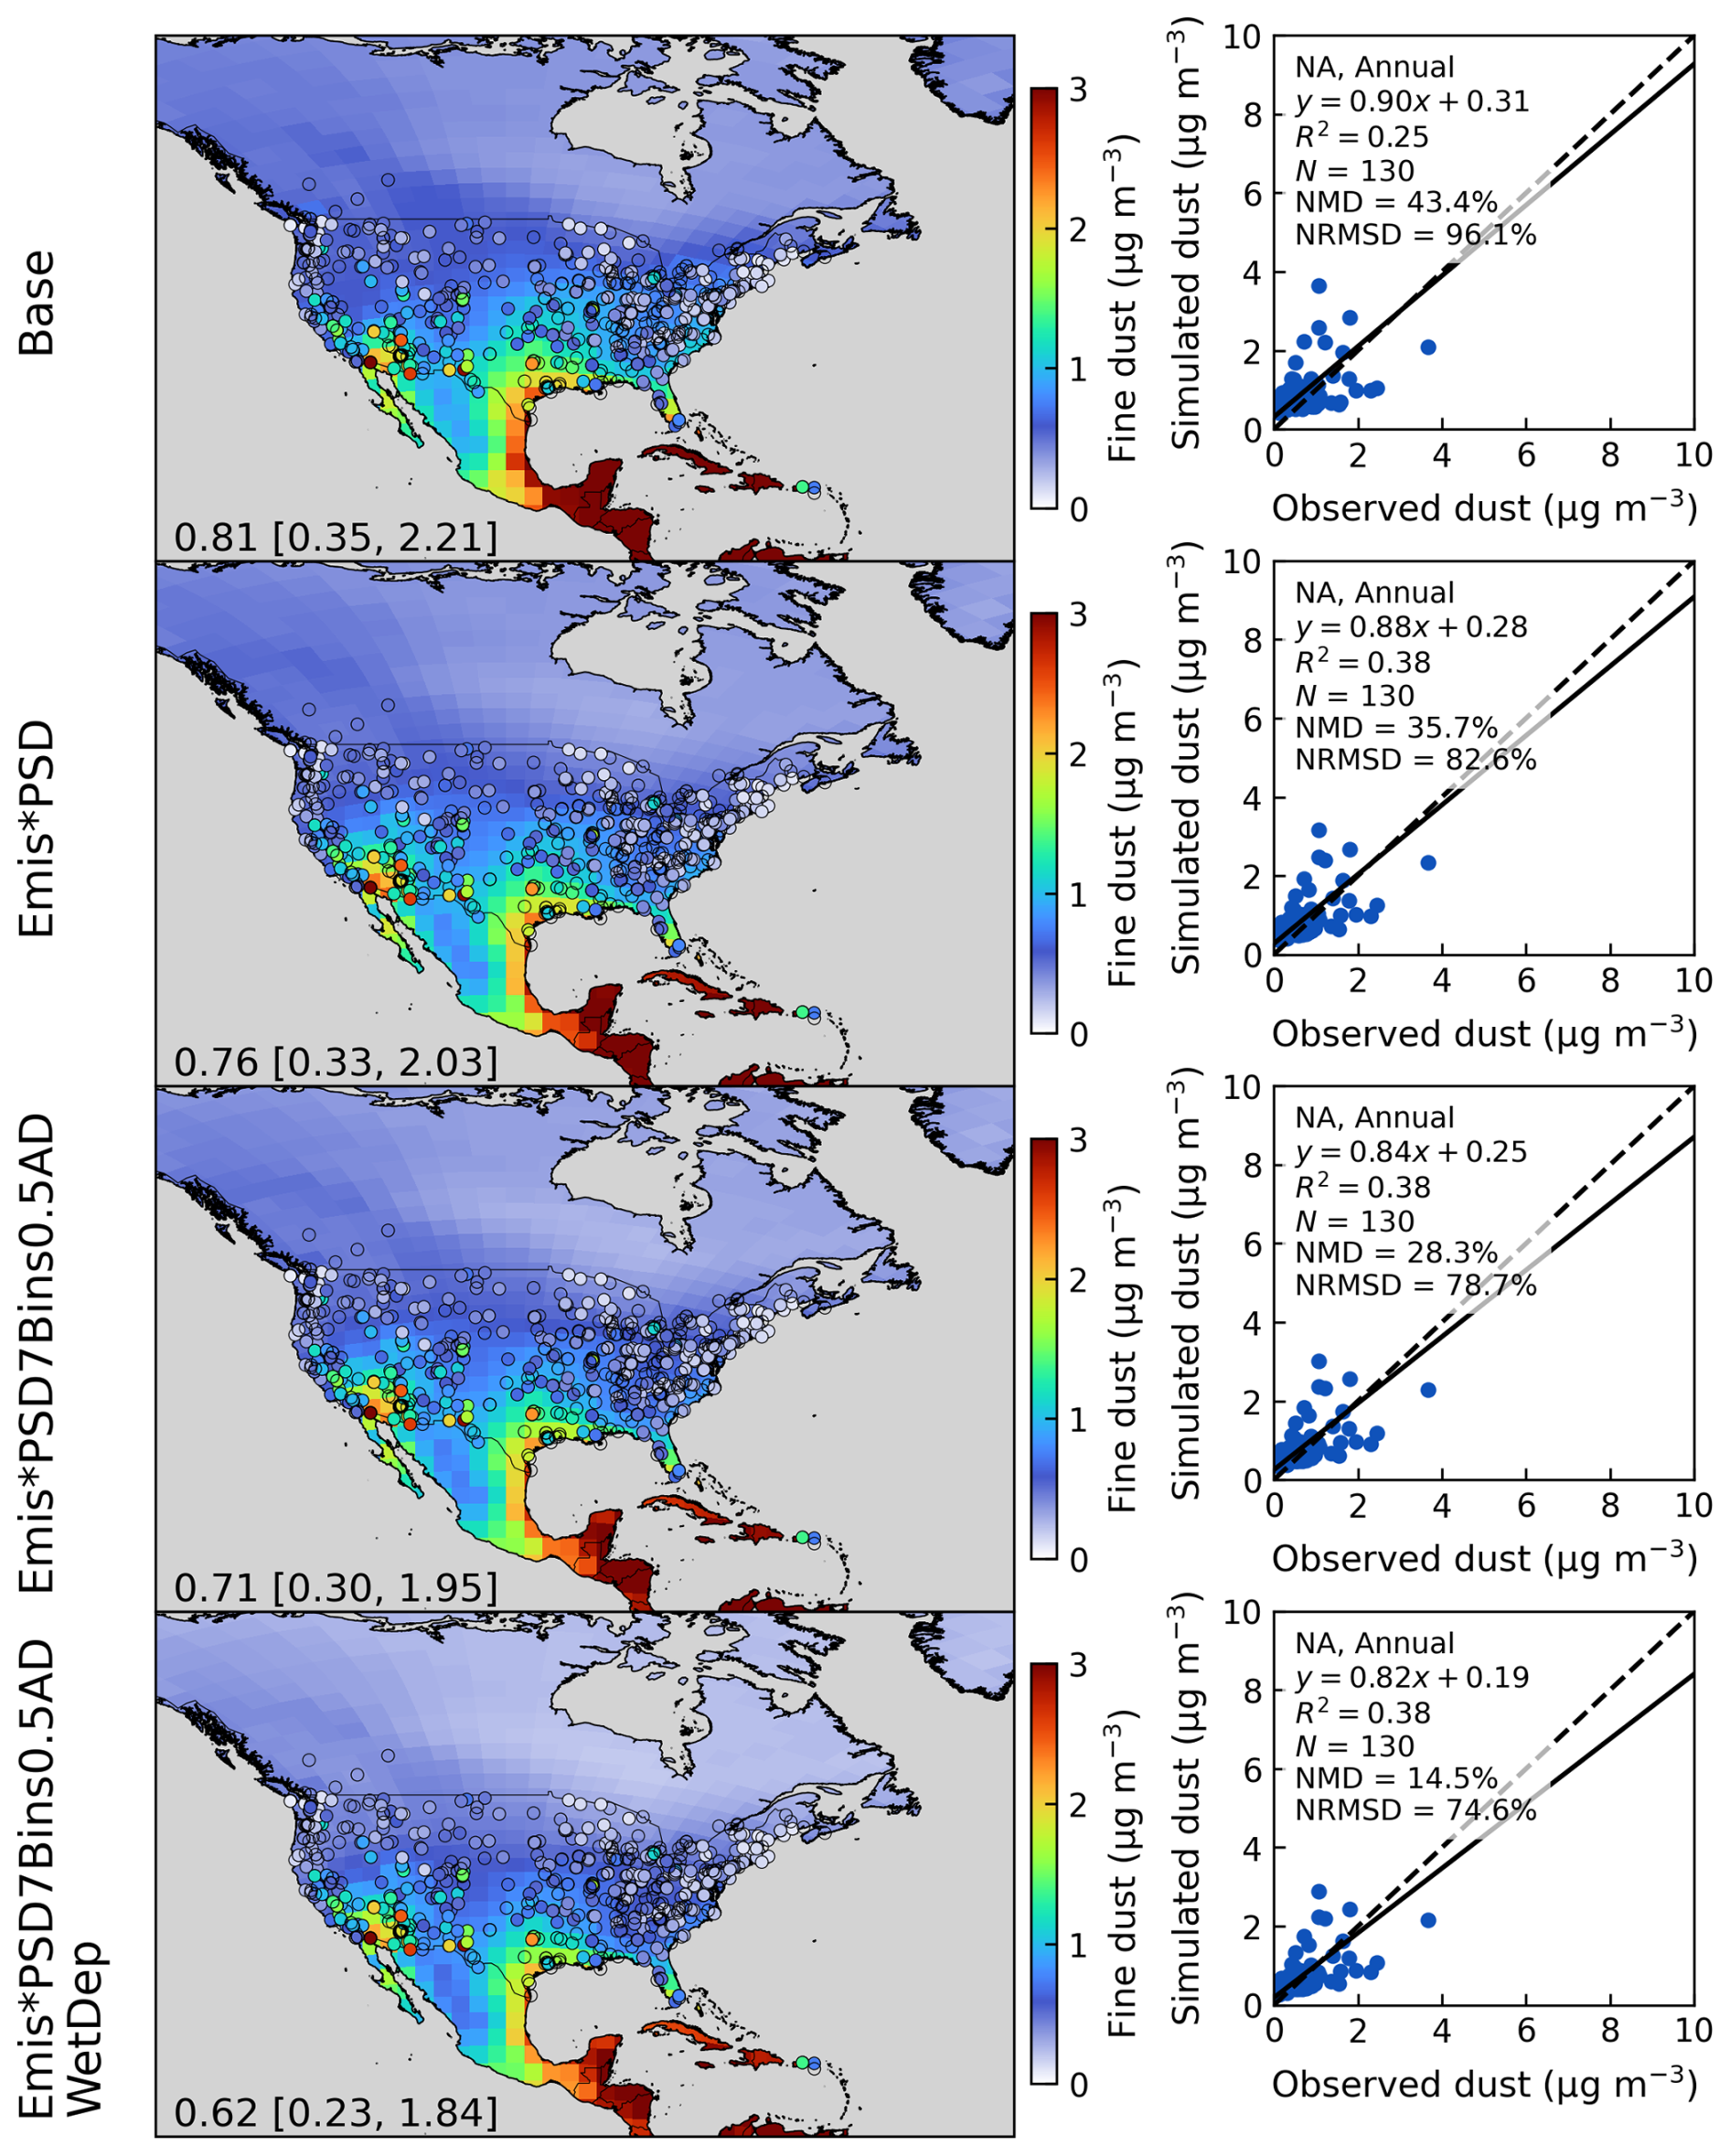
Figure A7Comparisons of simulated annual surface PM2.5 dust against ground-based observations in the year of 2018 over North America from the Base (top), Emis*PSD (second), Emis*PSD7Bins0.5AD (third), and Emis*PSD7Bins0.5ADWetDep (bottom) simulations. Filled circles represent ground-based observations of surface PM2.5 dust concentrations. Inset values at the bottom left are arithmetical mean with 5th and 95th percentiles in the square brackets. Regression statistics including the reduced-major axis linear regression equation, coefficient of variation (R2), total number of points (N), normalized mean difference (NMD), and normalized root-mean-square difference (NRMSD) are listed at the top left of right panels.
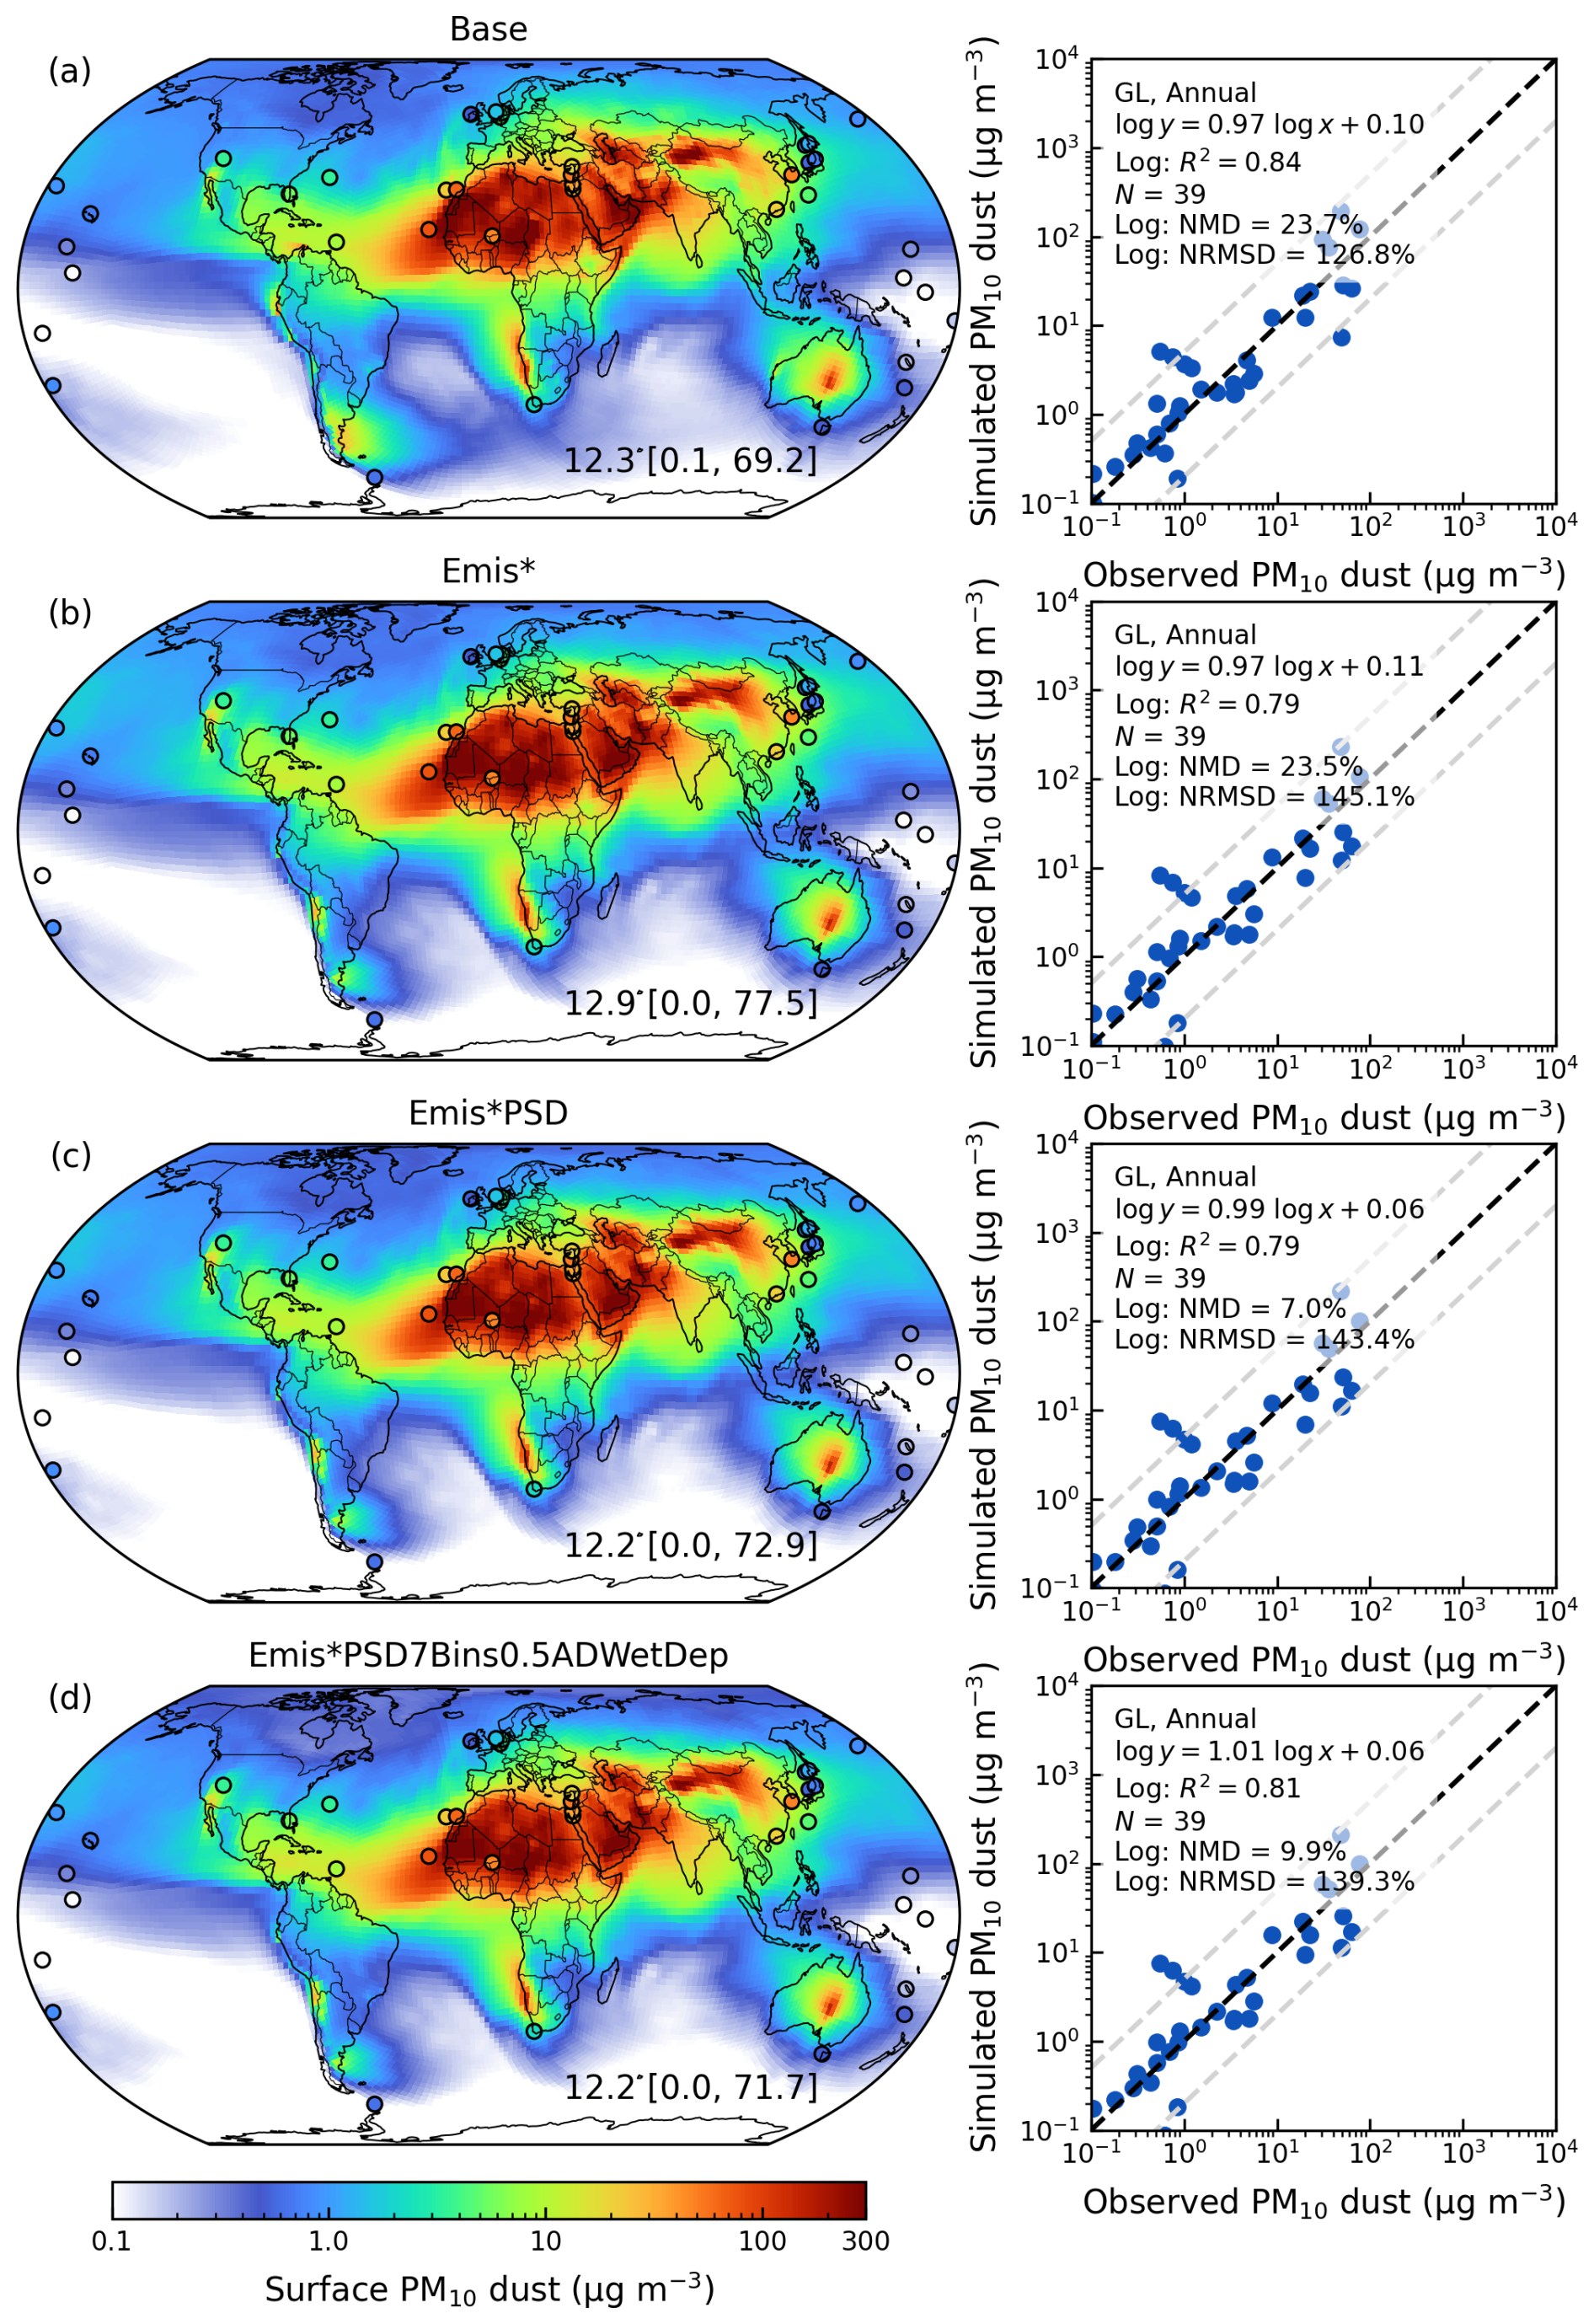
Figure A8Annual simulated surface PM10 dust concentrations in the year of 2018 from the simulations of (a) Base, (b) Emis*, (c) Emis*PSD, and (d) Emis*PSD7Bins0.5ADWetDep. Filled circles represent ground-based observations of surface PM10 dust concentrations. Inset values at the bottom right are arithmetical mean with 5th and 95th percentiles in the square brackets. Dash lines in the scatter plots indicate variations within a factor of 5. Regression statistics including the reduced-major-axis linear regression equation, coefficient of variation (R2), total number of points (N), normalized mean difference (NMD), and normalized root-mean-square difference (NRMSD) are listed at the top left of right panels.
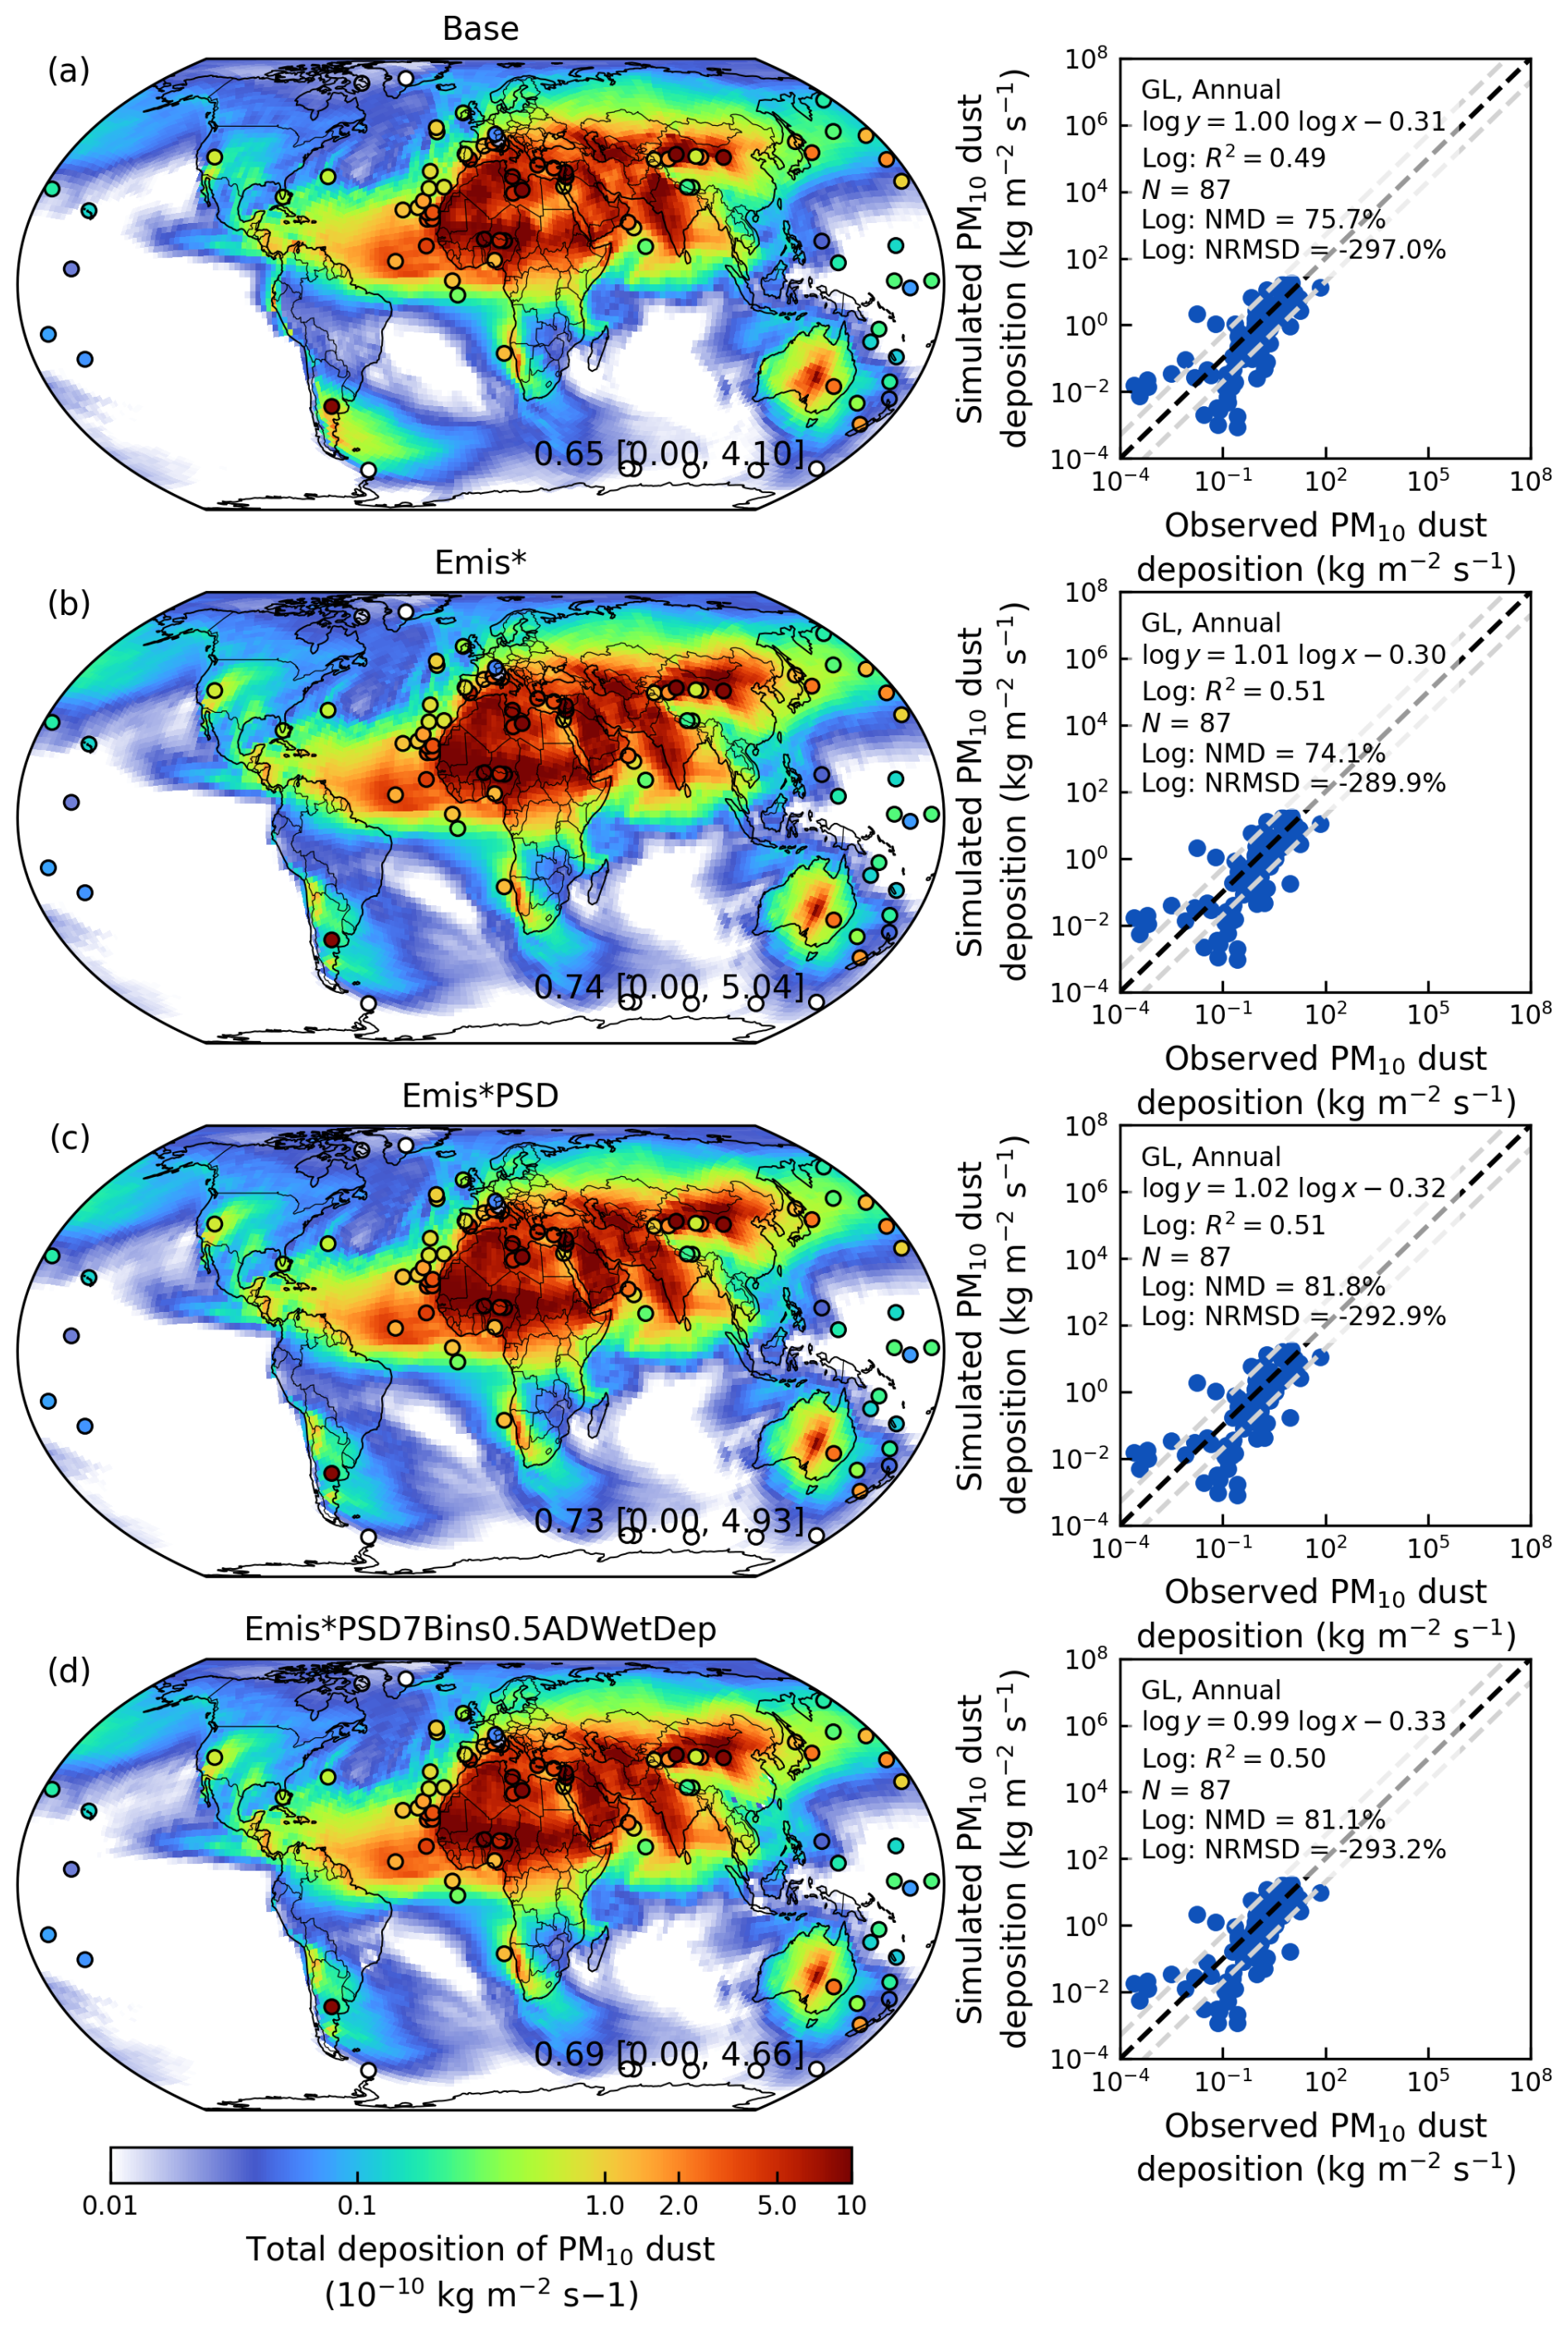
Figure A9Annual simulated total deposition of PM10 dust within the troposphere in the year of 2018 from the simulations of (a) Base, (b) Emis*, (c) Emis*PSD, and (d) Emis*PSD7Bins0.5ADWetDep. Filled circles represent ground-based observations of surface PM10 dust deposition. Inset values at the bottom right are arithmetical mean with 5th and 95th percentiles in the square brackets. Dash lines in the scatter plots indicate variations within a factor of 5. Regression statistics including the reduced-major-axis linear regression equation, coefficient of variation (R2), total number of points (N), normalized mean difference (NMD), and normalized root-mean-square difference (NRMSD) are listed at the top left of right panels.
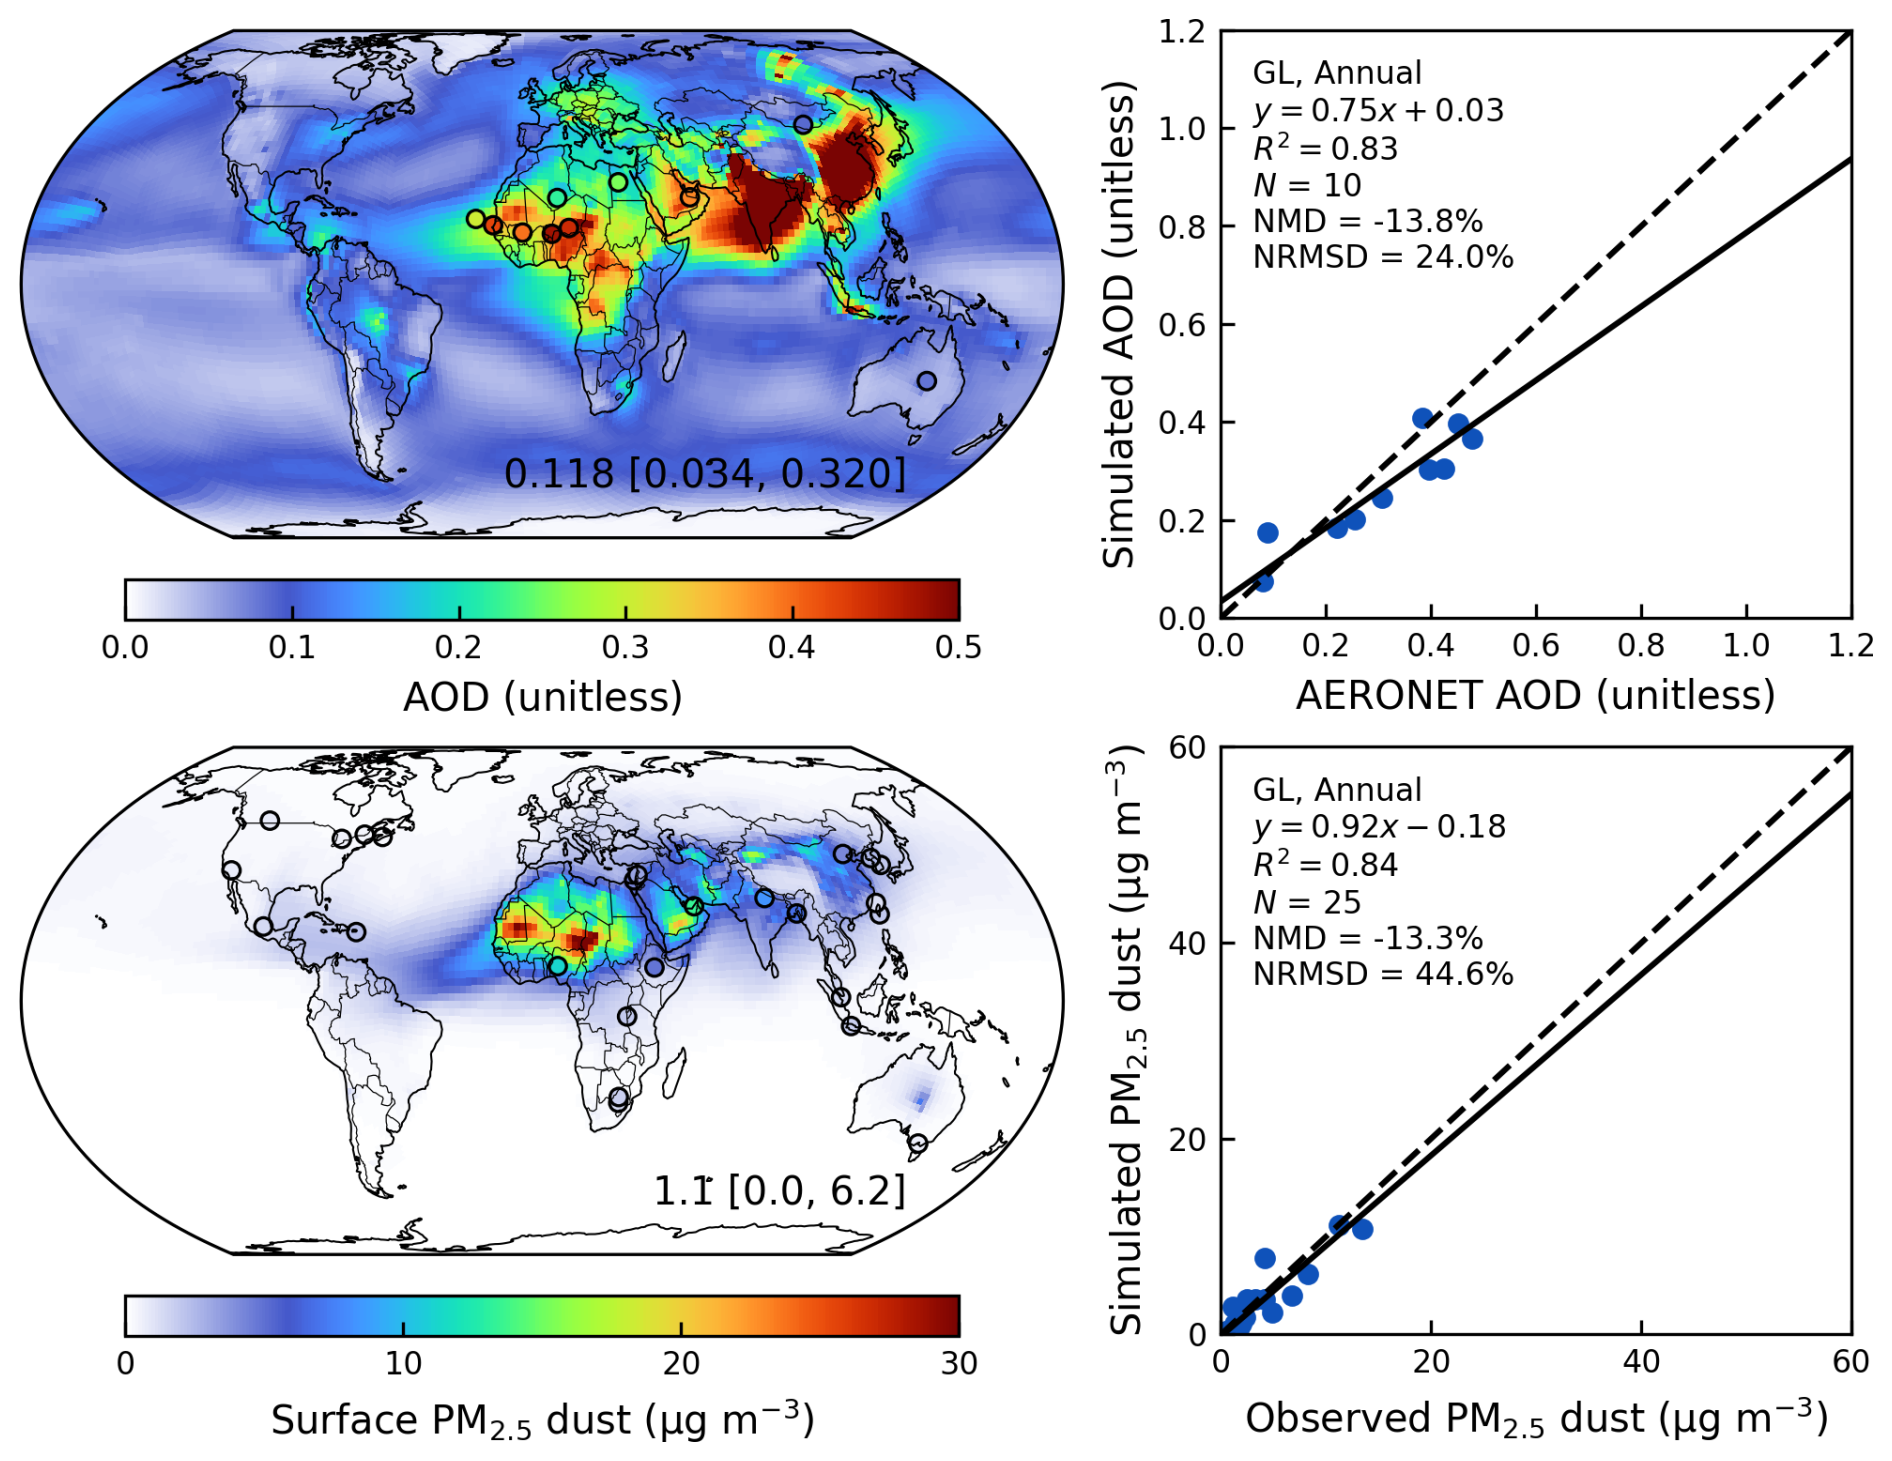
Figure A10Annual simulated aerosol optical depth (AOD) and comparison against ground-based observations from AERONET over dusty regions () (top); Annual simulated surface PM2.5 dust and comparison against ground-based measurements from SPARTAN from the Emis*PSD7Bins0.5ADWetDep simulation with the dust emissions calculated at C48 resolution in the year of 2018 (bottom). Filled circles on the maps represent ground-based observations from SPARTAN and AERONET. Inset values at the bottom right of the maps are arithmetical mean with 5th and 95th percentiles in the square brackets. Regression statistics including the reduced-major-axis linear regression equation, coefficient of variation (R2), total number of points (N), normalized mean difference (NMD), and normalized root-mean-square difference (NRMSD) are listed at the top left of the scatter plots.
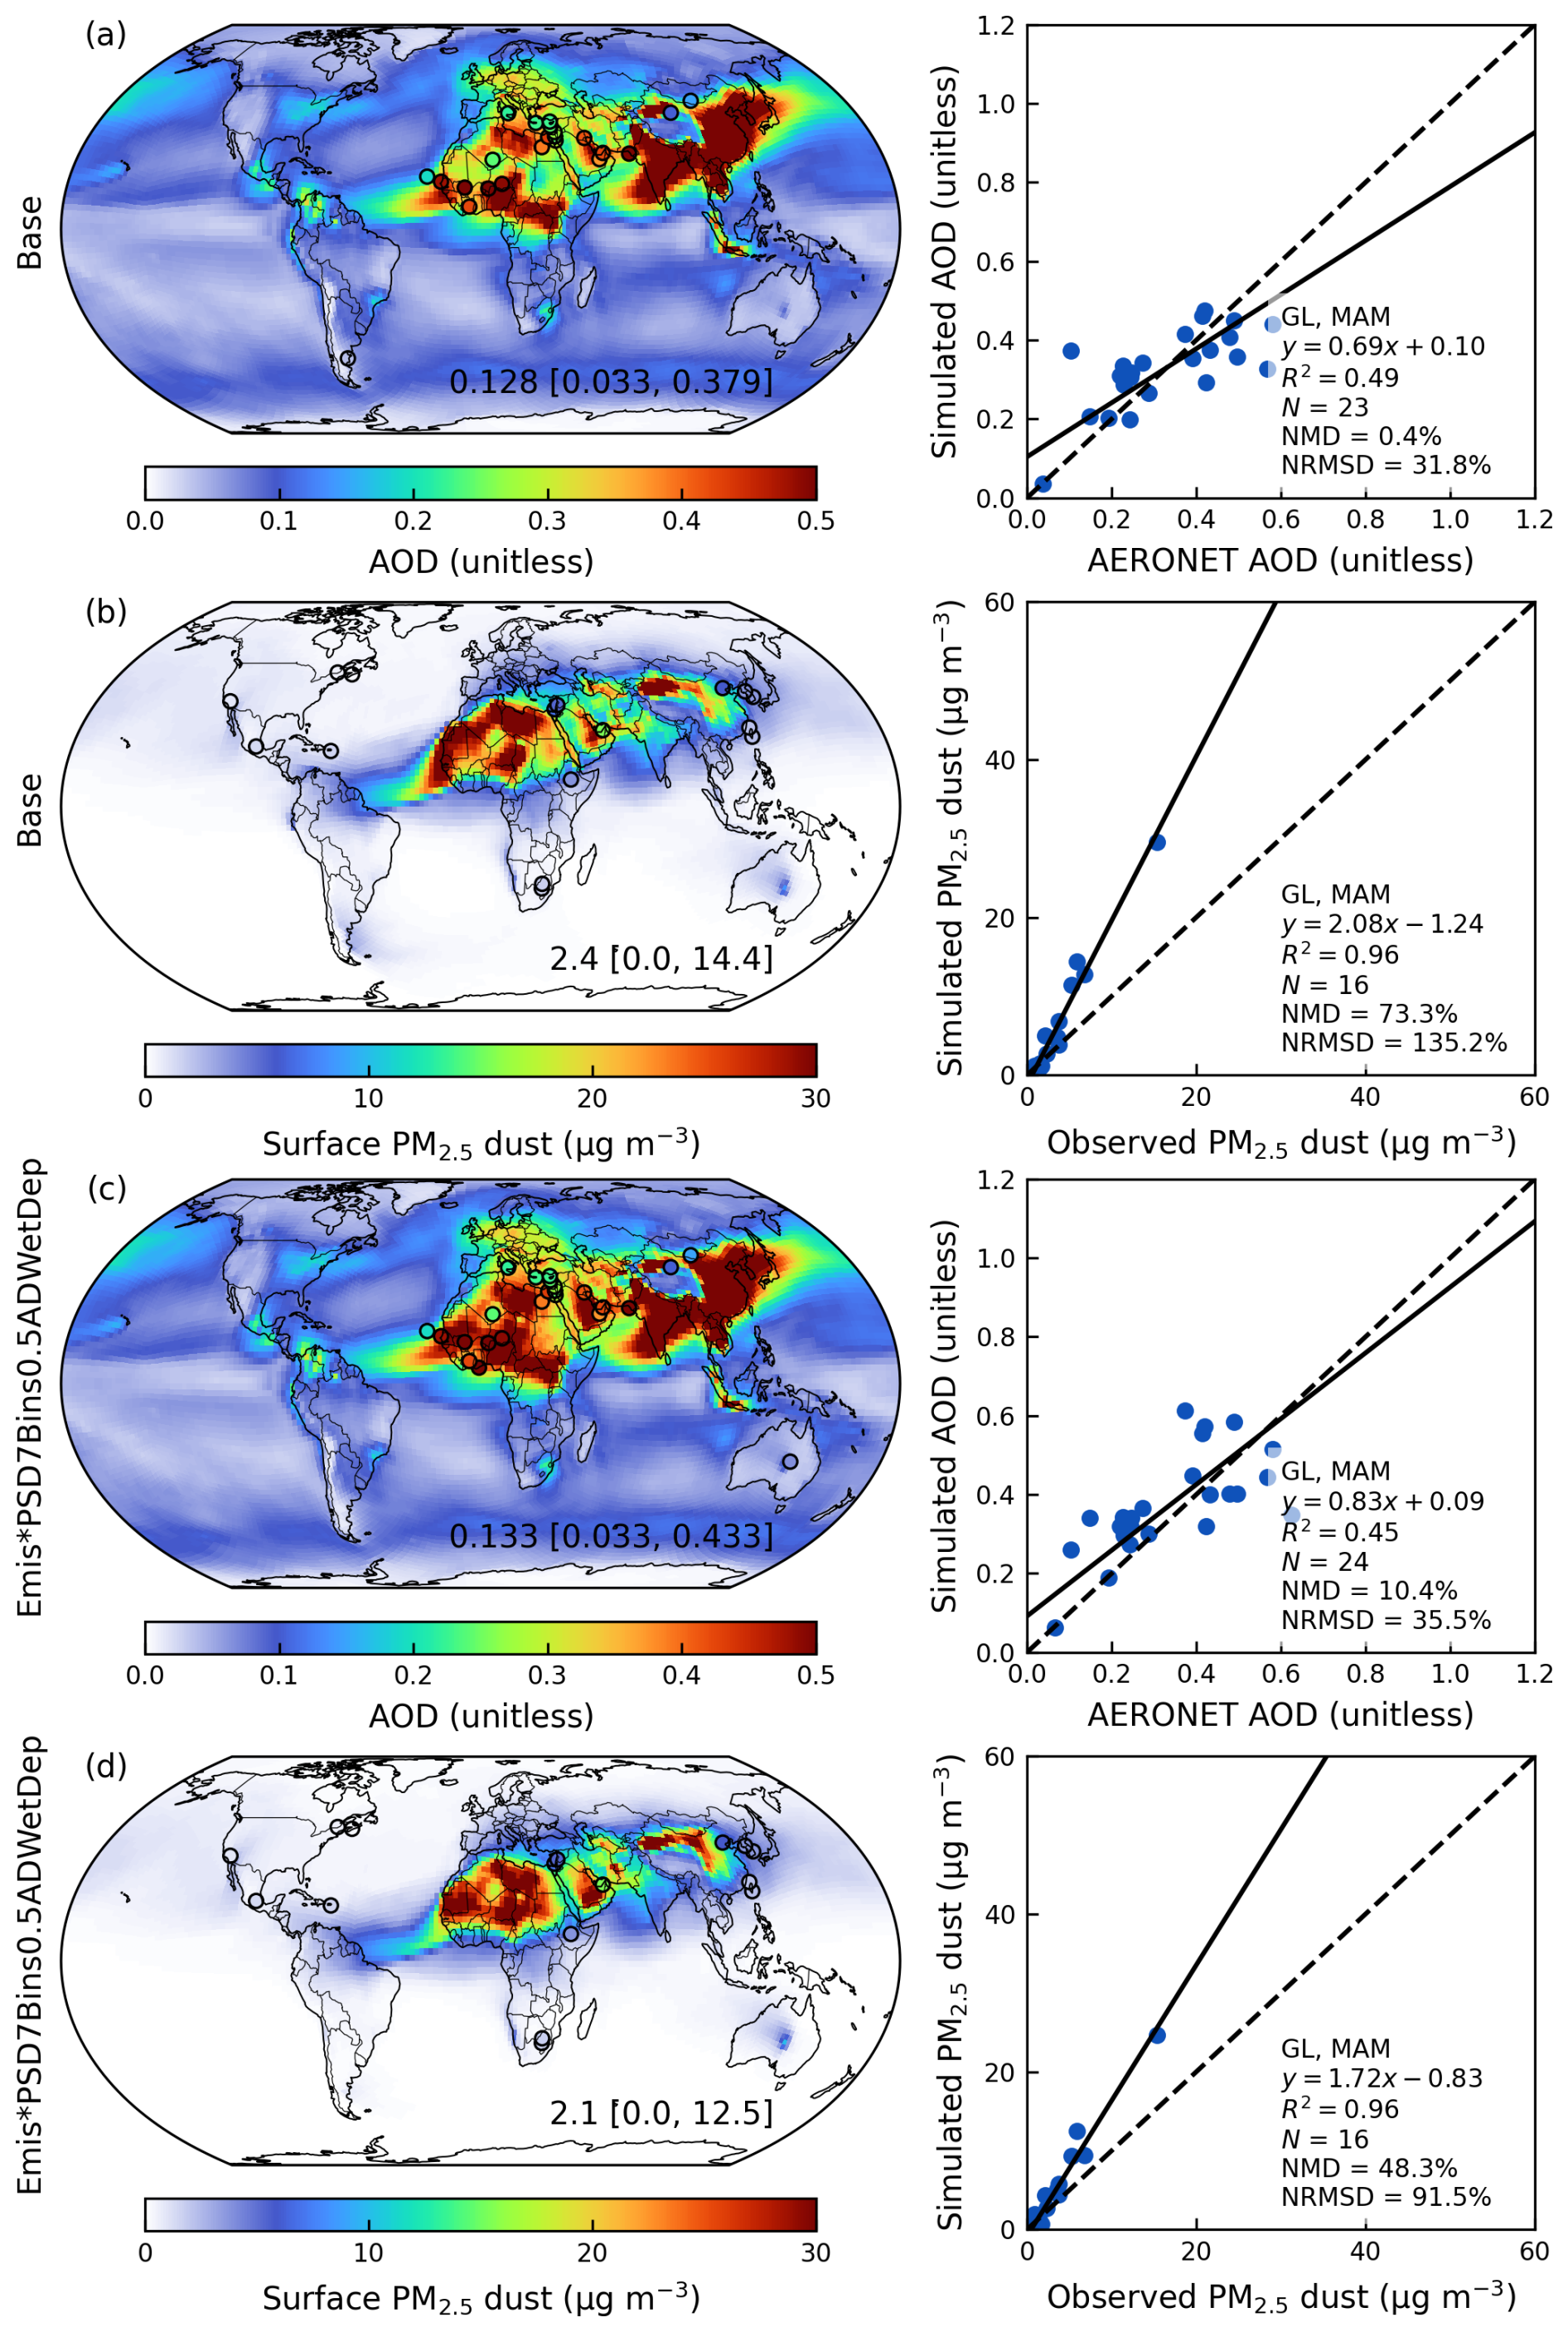
Figure A11Simulated seasonal mean (March, April, and May or MAM) aerosol optical depth (AOD; a, c) and surface PM2.5 dust (b, d) from the Base and Emis*PSD7Bins0.5ADWetDep simulations. Filled circles on the maps represent ground-based observations from SPARTAN and AERONET. Inset values at the bottom right of the maps are arithmetical mean with 5th and 95th percentiles in the square brackets. Comparisons of simulated AOD versus AERONET AOD over dusty sites (), and simulated surface PM2.5 dust versus SPARTAN observations are shown in the right panels. Regression statistics including the reduced-major-axis linear regression equation, coefficient of variation (R2), total number of points (N), normalized mean difference (NMD), and normalized root-mean-square difference (NRMSD) are listed at the bottom right of the scatter plots.
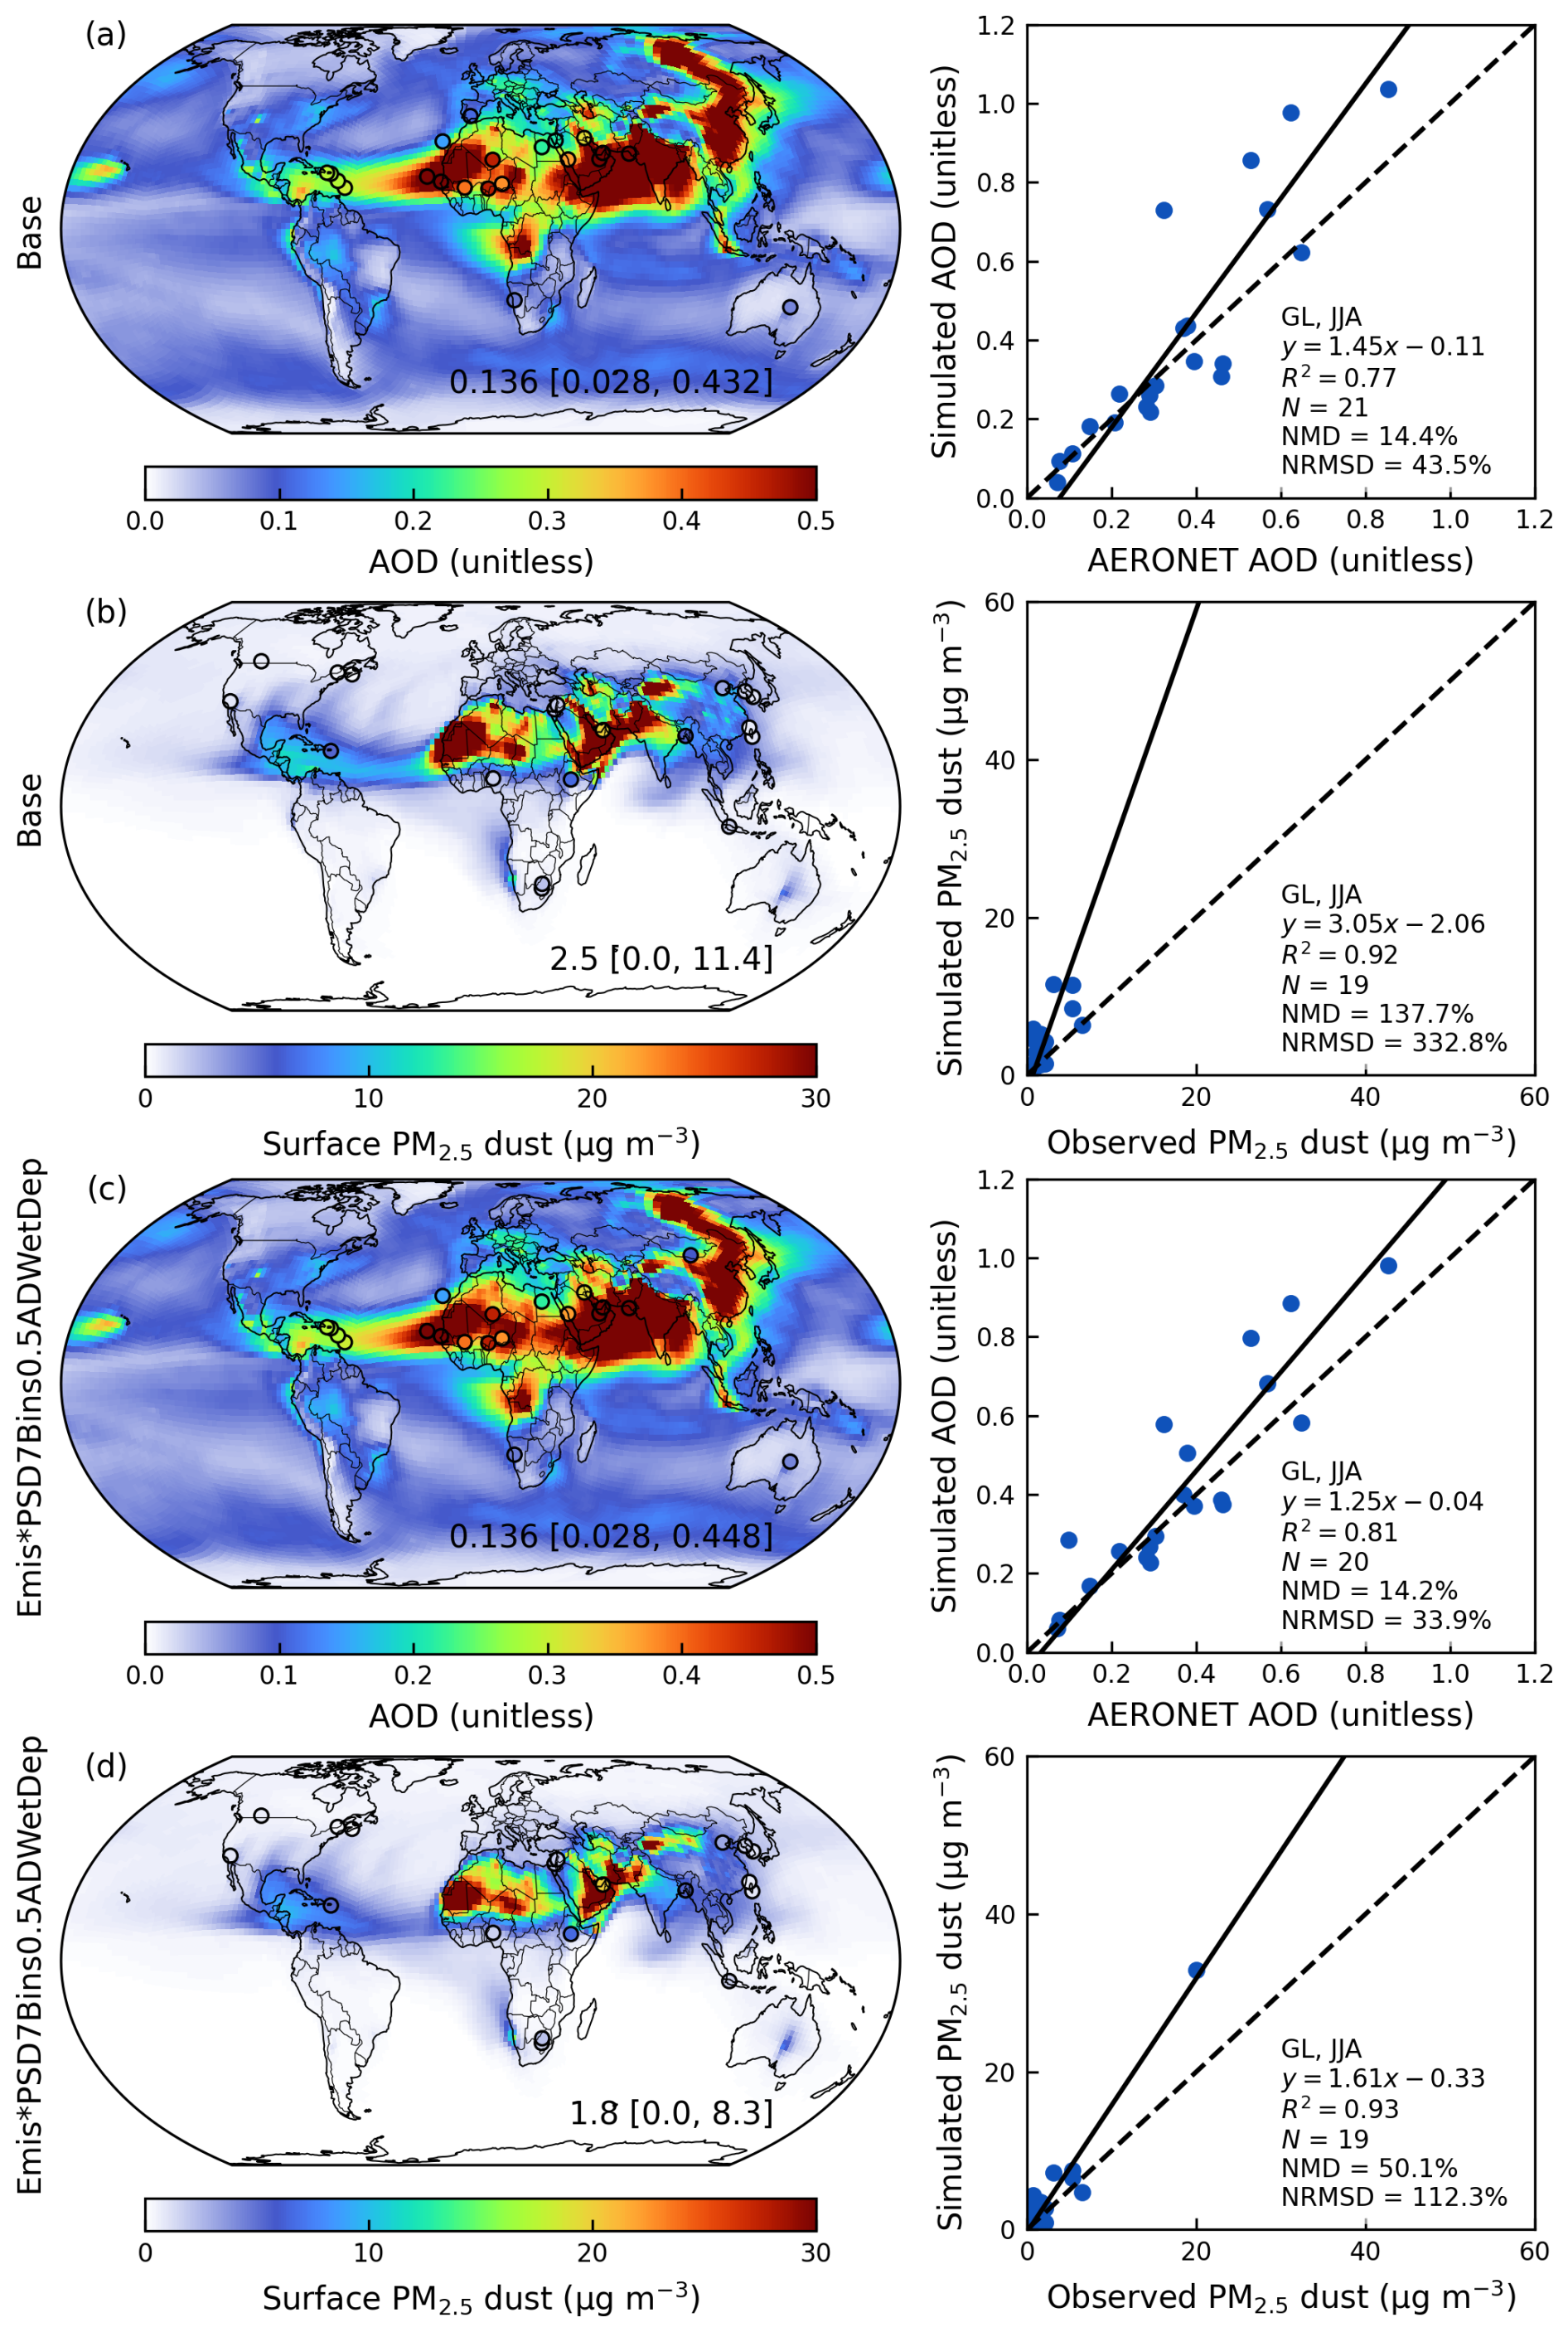
Figure A12Same as Fig. A11 but for the seasonal mean of June, July, and August (JJA).
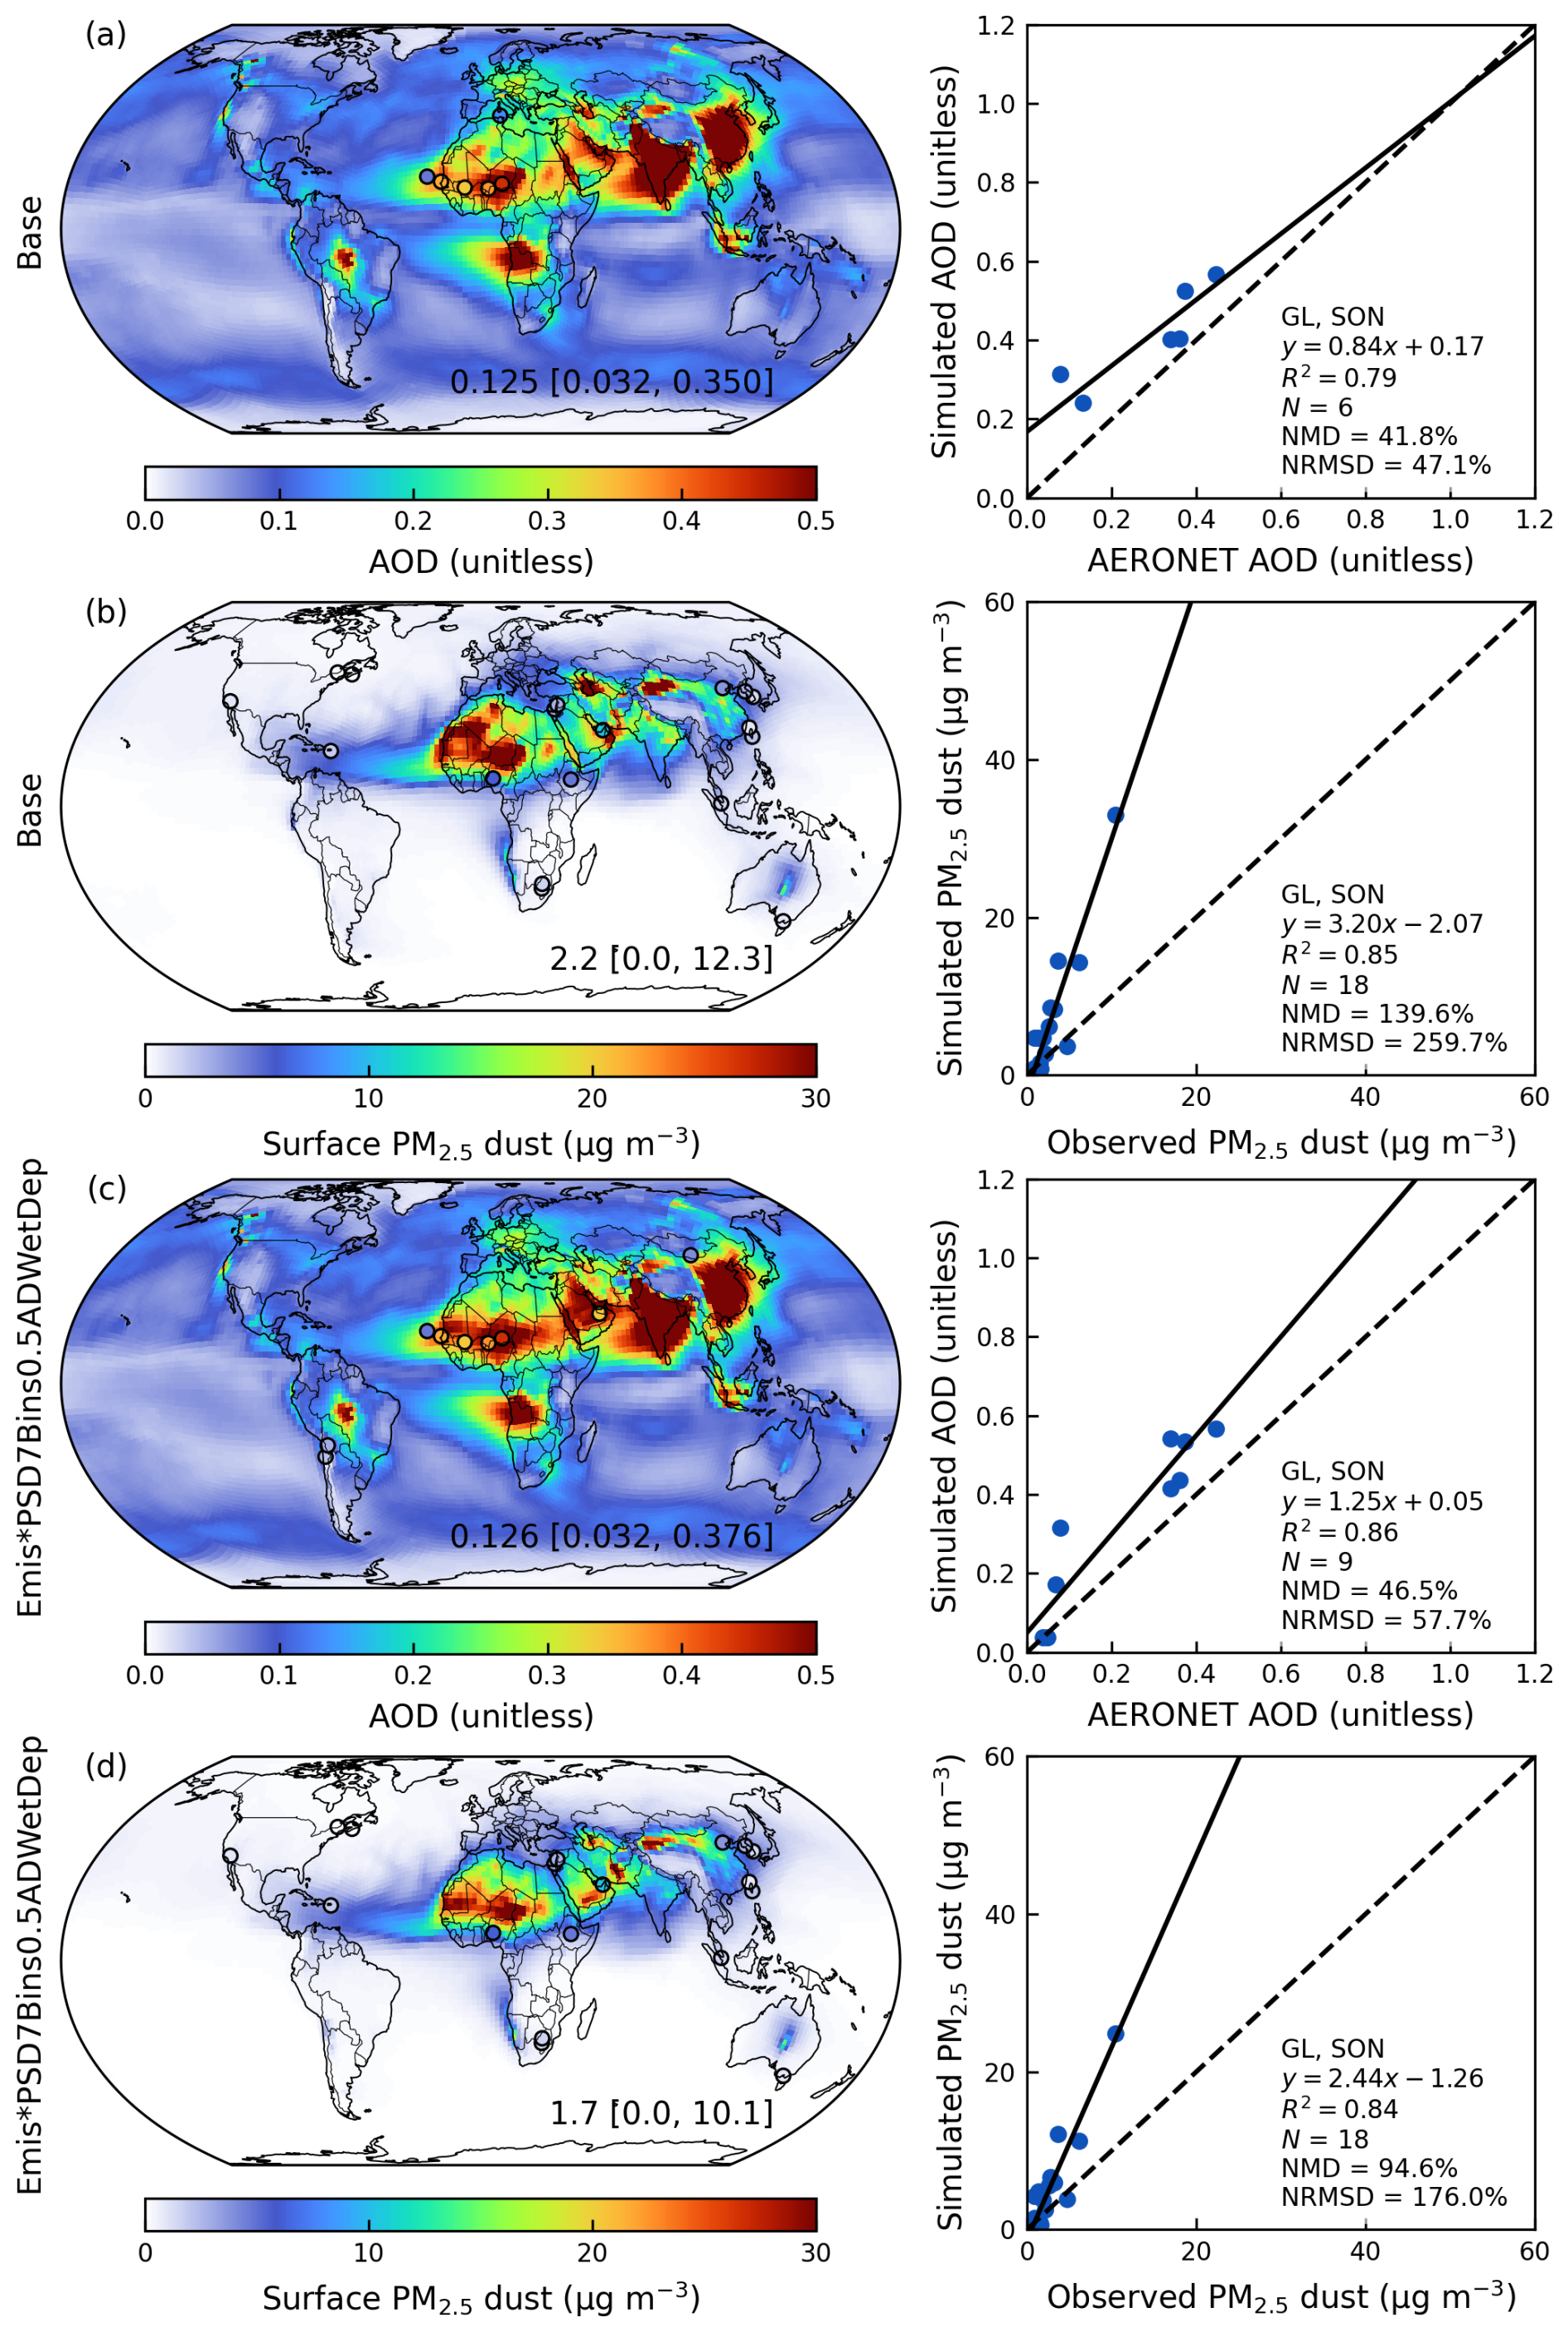
Figure A13Same as Fig. A11 but for the seasonal mean of September, October, and November (SON).
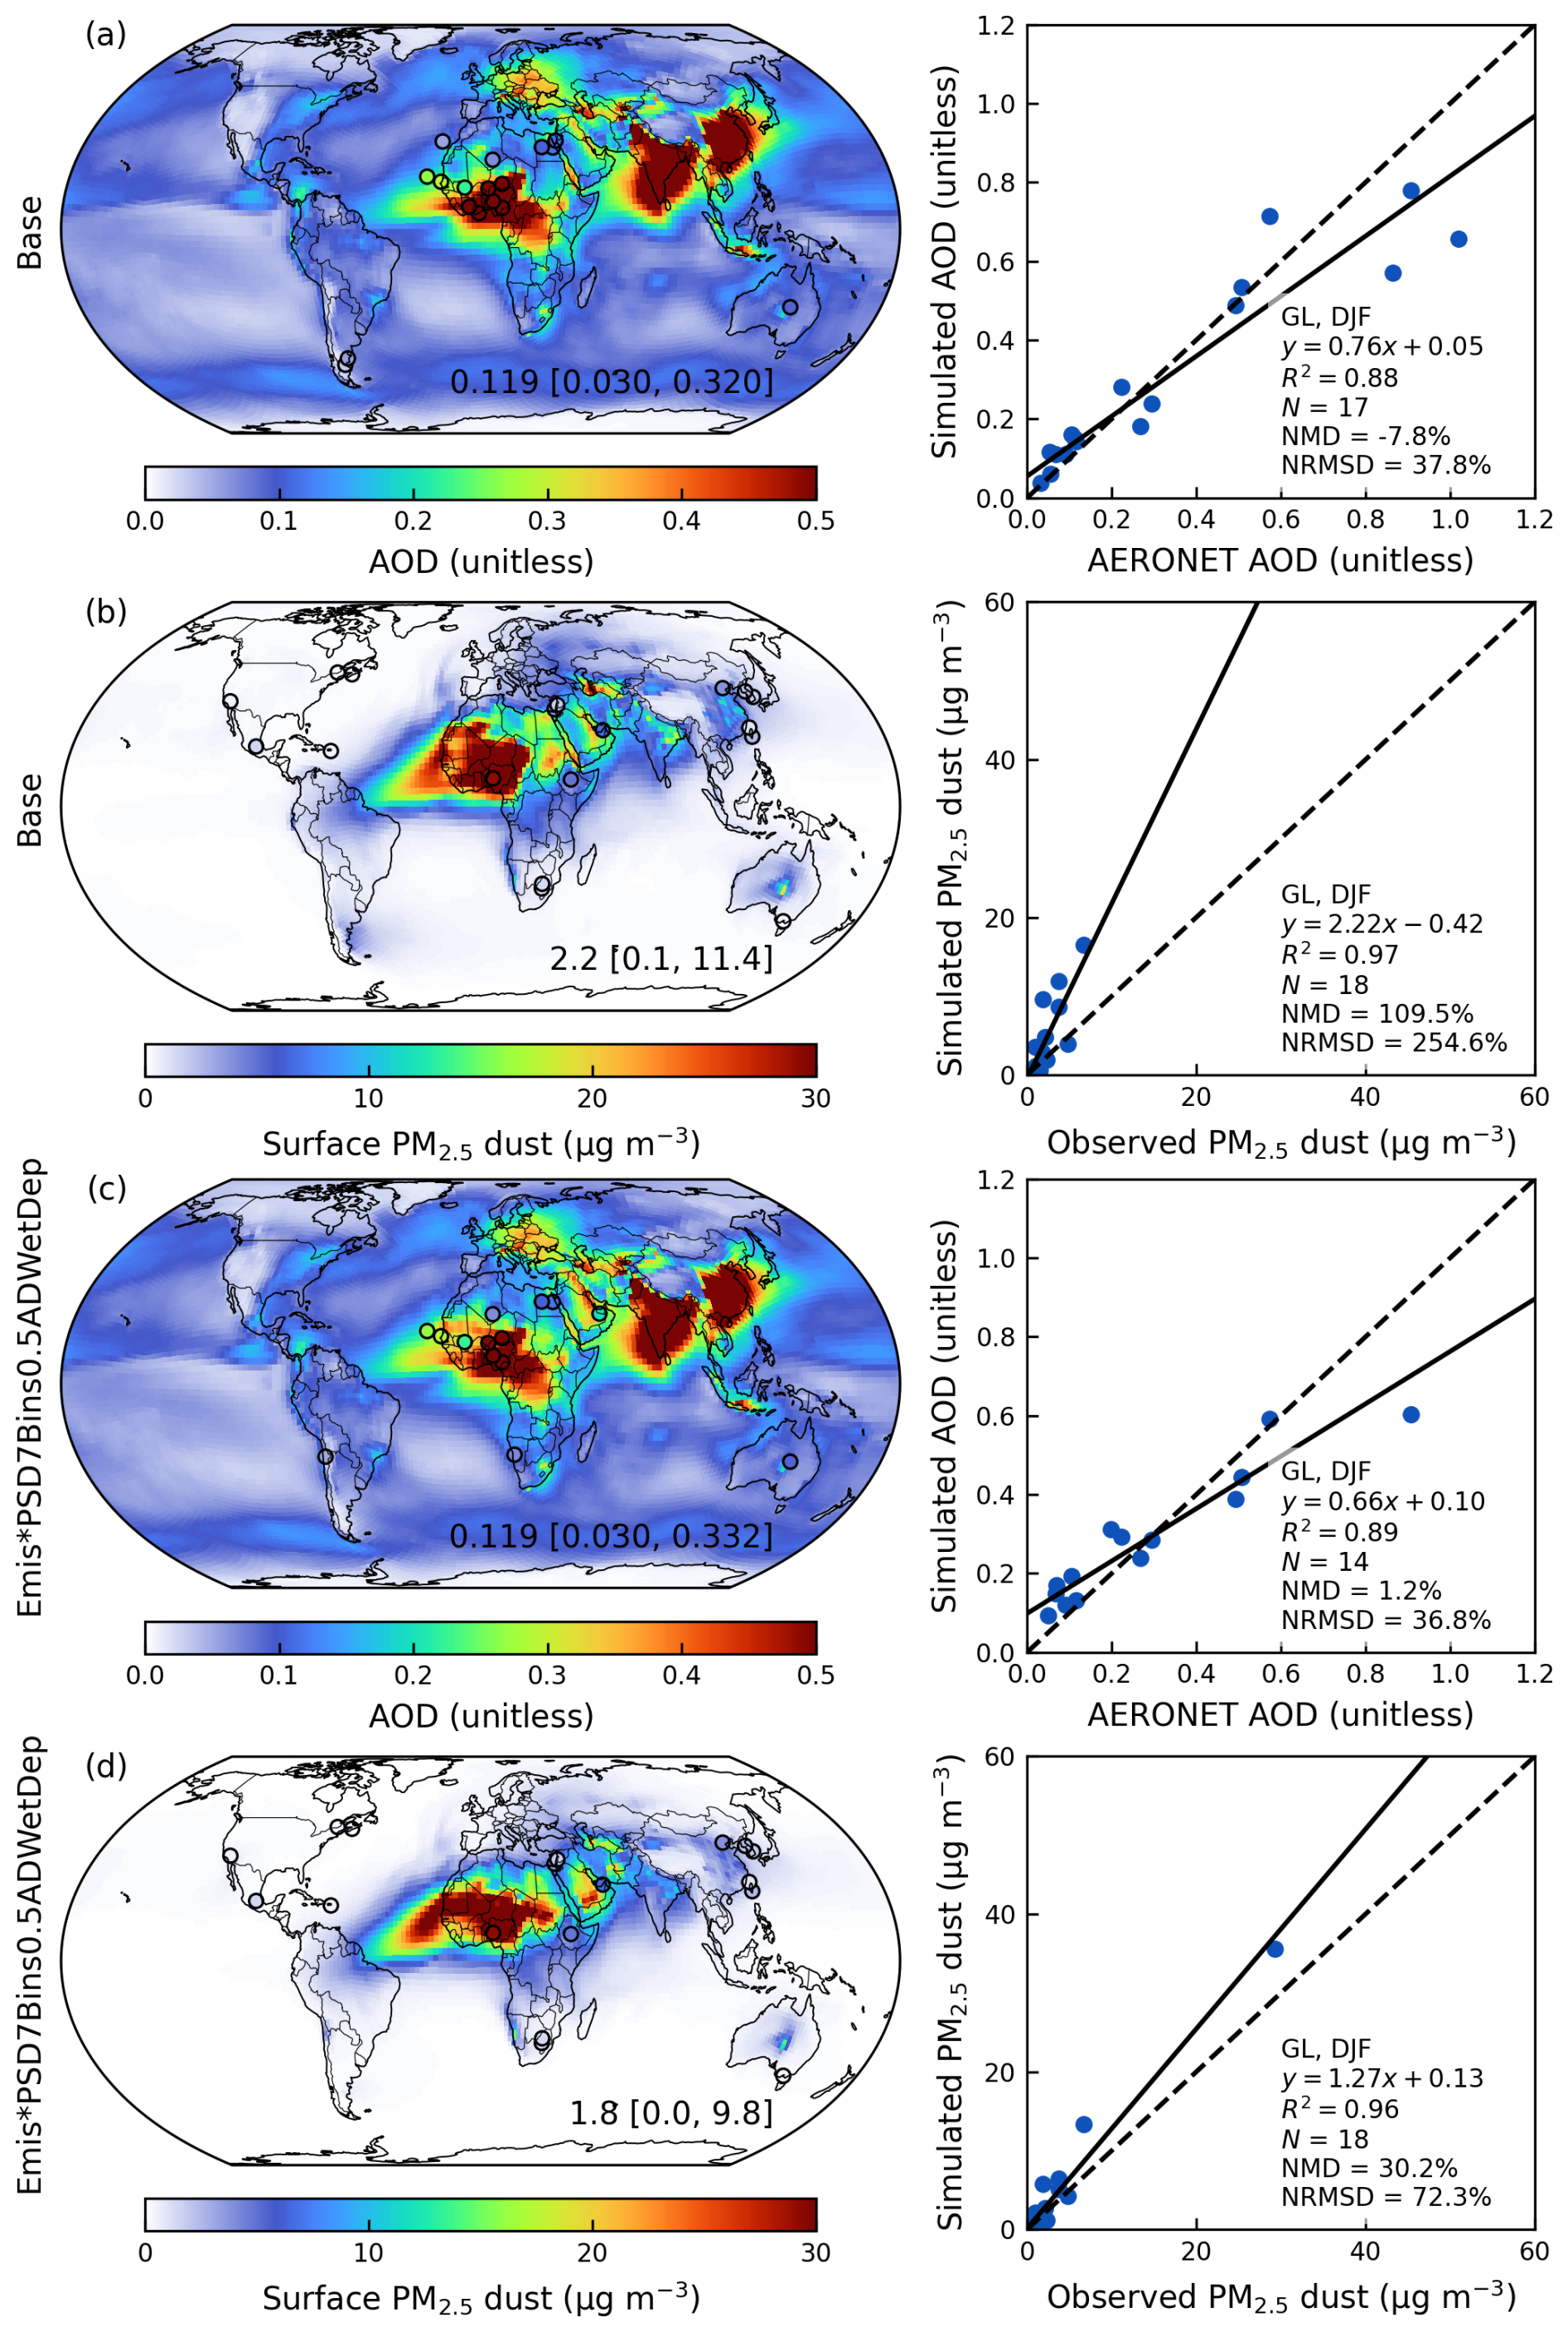
Figure A14Same as Fig. A11 but for the seasonal mean of December, January, and February (DJF).
The standard GEOS-Chem in its high-performance configuration version 14.4.1 can be downloaded at https://doi.org/10.5281/zenodo.12584305 (The International GEOS-Chem User Community, 2024). The model source code, an example run directory, and the calculation scripts for the hourly dust emission fluxes for the revised simulation can be downloaded at https://doi.org/10.5281/zenodo.14510793 (Zhang, 2024).
The surface PM2.5 dust measurements with the attenuation correction from SPARTAN used in this study are publicly available at https://www.spartan-network.org/data (last access: 18 March 2025). The PM10 dust and total deposition of dust are available at https://doi.org/10.5281/zenodo.6989502 (Li et al., 2022a). The processed meteorological fields from GEOS-FP are available at http://geoschemdata.wustl.edu/ExtData/GEOS_0.25x0.3125/GEOS_FP/ (last access: 4 February 2025) with the soil porosity downloaded from the constant land-surface parameter of MERRA2 M2C0NXLND collection (https://disc.gsfc.nasa.gov/datasets?project=MERRA-2, last access: 4 February 2025). The land cover dataset can be downloaded at https://lpdaac.usgs.gov/products/mcd12c1v061/ (last access: 4 February 2025). The monthly mean leaf area index at 0.5 degree can be downloaded at http://globalchange.bnu.edu.cn/research/laiv6 (last access: 4 February 2025). The satellite-derived aeolian roughness data are available upon contacting Catherine Prigent. The GSDE soil dataset can be downloaded at http://globalchange.bnu.edu.cn/research/soilw (last access: 4 February 2025).
The manuscript was written by DZ and RVM with contributions from all authors. DZ and RVM designed the study with developments of the methodology. DZ conducted simulations and analyzed the results. XL developed the methodology for the mineral dust concentration construction in SPARTAN. AvD compiled the Deep Blue AOD dataset and ground-based observation datasets of surface PM2.5 dust over NA and AERONET AOD for evaluation. XL, CRO and EW contributed to SPARTAN measurements. YL contributed to the dry deposition analysis. JM offered valuable discussion for the emission scheme refinements. DML and JFK contributed to the development of a new dust emission scheme. LL constructed the observational data for PM10 dust and deposition flux. HZ contributed to the generation of SPARTAN dust data. JRT and YY contributed to the discussion of the evaluation of simulated dust. MB and YR contributed to the establishment and maintenance of SPARTAN monitoring sites. All authors contributed to revising the manuscript.
The contact author has declared that none of the authors has any competing interests.
Publisher's note: Copernicus Publications remains neutral with regard to jurisdictional claims made in the text, published maps, institutional affiliations, or any other geographical representation in this paper. While Copernicus Publications makes every effort to include appropriate place names, the final responsibility lies with the authors. Also, please note that this paper has not received English language copy-editing. Views expressed in the text are those of the authors and do not necessarily reflect the views of the publisher.
The GEOS-FP data used in this study have been provided by the Global Modeling and Assimilation Office (GMAO) at the NASA Goddard Space Flight Center. We thank the AERONET, CALIOP, MODIS, and VIIRS teams for the creation and public release of their data products.
This research has been supported by the National Science Foundation (grant nos. 2244984 and 2151093) and the National Aeronautics and Space Administration (grant no. 80NSSC22K0200).
This paper was edited by Samuel Remy and reviewed by R. L. Miller and two anonymous referees.
Amato, F., Schaap, M., Denier van der Gon, H. A. C., Pandolfi, M., Alastuey, A., Keuken, M., and Querol, X.: Short-term variability of mineral dust, metals and carbon emission from road dust resuspension, Atmospheric Environment, 74, 134–140, https://doi.org/10.1016/j.atmosenv.2013.03.037, 2013.
Bagheri, G. and Bonadonna, C.: On the drag of freely falling non-spherical particles, Powder Technology, 301, 526–544, https://doi.org/10.1016/j.powtec.2016.06.015, 2016.
Bayon, G., Garzanti, E., Dinis, P., Beaufort, D., Barrat, J.-A., Germain, Y., Trinquier, A., Barbarano, M., Overare, B., Adeaga, O., and Braquet, N.: Contribution of Saharan dust to chemical weathering fluxes and associated phosphate release in West Africa, Earth and Planetary Science Letters, 641, 118845, https://doi.org/10.1016/j.epsl.2024.118845, 2024.
Bey, I., Jacob, D. J., Yantosca, R. M., Logan, J. A., Field, B. D., Fiore, A. M., Li, Q., Liu, H. Y., Mickley, L. J., and Schultz, M. G.: Global modeling of tropospheric chemistry with assimilated meteorology: Model description and evaluation, Journal of Geophysical Research: Atmospheres, 106, 23073–23095, https://doi.org/10.1029/2001JD000807, 2001.
Bouwman, A. F., Lee, D. S., Asman, W. A. H., Dentener, F. J., Van Der Hoek, K. W., and Olivier, J. G. J.: A global high-resolution emission inventory for ammonia, Global Biogeochemical Cycles, 11, 561–587, https://doi.org/10.1029/97GB02266, 1997.
Breider, T. J., Mickley, L. J., Jacob, D. J., Ge, C., Wang, J., Payer Sulprizio, M., Croft, B., Ridley, D. A., McConnell, J. R., Sharma, S., Husain, L., Dutkiewicz, V. A., Eleftheriadis, K., Skov, H., and Hopke, P. K.: Multidecadal trends in aerosol radiative forcing over the Arctic: Contribution of changes in anthropogenic aerosol to Arctic warming since 1980, Journal of Geophysical Research: Atmospheres, 122, 3573–3594, https://doi.org/10.1002/2016JD025321, 2017.
Cakmur, R. V., Miller, R. L., Perlwitz, J., Geogdzhayev, I. V., Ginoux, P., Koch, D., Kohfeld, K. E., Tegen, I., and Zender, C. S.: Constraining the magnitude of the global dust cycle by minimizing the difference between a model and observations, Journal of Geophysical Research: Atmospheres, 111, https://doi.org/10.1029/2005JD005791, 2006.
Cao, C., De Luccia, F. J., Xiong, X., Wolfe, R., and Weng, F.: Early On-Orbit Performance of the Visible Infrared Imaging Radiometer Suite Onboard the Suomi National Polar-Orbiting Partnership (S-NPP) Satellite, IEEE Transactions on Geoscience and Remote Sensing, 52, 1142–1156, https://doi.org/10.1109/TGRS.2013.2247768, 2014.
Comola, F., Kok, J. F., Chamecki, M., and Martin, R. L.: The Intermittency of Wind-Driven Sand Transport, Geophysical Research Letters, 46, 13430–13440, https://doi.org/10.1029/2019GL085739, 2019.
Croft, B., Wentworth, G. R., Martin, R. V., Leaitch, W. R., Murphy, J. G., Murphy, B. N., Kodros, J. K., Abbatt, J. P. D., and Pierce, J. R.: Contribution of Arctic seabird-colony ammonia to atmospheric particles and cloud-albedo radiative effect, Nature Communications, 7, 13444, https://doi.org/10.1038/ncomms13444, 2016.
Darmenova, K., Sokolik, I. N., Shao, Y., Marticorena, B., and Bergametti, G.: Development of a physically based dust emission module within the Weather Research and Forecasting (WRF) model: Assessment of dust emission parameterizations and input parameters for source regions in Central and East Asia, Journal of Geophysical Research: Atmospheres, 114, D14201, https://doi.org/10.1029/2008JD011236, 2009.
Eastham, S. D., Long, M. S., Keller, C. A., Lundgren, E., Yantosca, R. M., Zhuang, J. W., Li, C., Lee, C. J., Yannetti, M., Auer, B. M., Clune, T. L., Kouatchou, J., Putman, W. M., Thompson, M. A., Trayanov, A. L., Molod, A. M., Martin, R. V., and Jacob, D. J.: GEOS-Chem High Performance (GCHP v11-02c): a next-generation implementation of the GEOS-Chem chemical transport model for massively parallel applications, Geoscientific Model Development, 11, 2941–2953, https://doi.org/10.5194/gmd-11-2941-2018, 2018.
Emerson, E. W., Hodshire, A. L., DeBolt, H. M., Bilsback, K. R., Pierce, J. R., McMeeking, G. R., and Farmer, D. K.: Revisiting particle dry deposition and its role in radiative effect estimates, Proceedings of the National Academy of Sciences, 117, 26076–26082, https://doi.org/10.1073/pnas.2014761117, 2020.
Fairlie, T. D., Jacob, D. J., and Park, R. J.: The impact of transpacific transport of mineral dust in the United States, Atmospheric Environment, 41, 1251–1266, https://doi.org/10.1016/j.atmosenv.2006.09.048, 2007.
Fécan, F., Marticorena, B., and Bergametti, G.: Parametrization of the increase of the aeolian erosion threshold wind friction velocity due to soil moisture for arid and semi-arid areas, Annales Geophysicae, 17, 149–157, https://doi.org/10.1007/s00585-999-0149-7, 1999.
Feng, L., Smith, S. J., Braun, C., Crippa, M., Gidden, M. J., Hoesly, R., Klimont, Z., van Marle, M., van den Berg, M., and van der Werf, G. R.: The generation of gridded emissions data for CMIP6, Geosci. Model Dev., 13, 461–482, https://doi.org/10.5194/gmd-13-461-2020, 2020.
Fisher, J. A., Jacob, D. J., Wang, Q., Bahreini, R., Carouge, C. C., Cubison, M. J., Dibb, J. E., Diehl, T., Jimenez, J. L., Leibensperger, E. M., Lu, Z., Meinders, M. B. J., Pye, H. O. T., Quinn, P. K., Sharma, S., Streets, D. G., van Donkelaar, A., and Yantosca, R. M.: Sources, distribution, and acidity of sulfate–ammonium aerosol in the Arctic in winter–spring, Atmospheric Environment, 45, 7301–7318, https://doi.org/10.1016/j.atmosenv.2011.08.030, 2011.
Giglio, L., Randerson, J. T., and van der Werf, G. R.: Analysis of daily, monthly, and annual burned area using the fourth-generation global fire emissions database (GFED4), Journal of Geophysical Research: Biogeosciences, 118, 317–328, https://doi.org/10.1002/jgrg.20042, 2013.
Giles, D. M., Sinyuk, A., Sorokin, M. G., Schafer, J. S., Smirnov, A., Slutsker, I., Eck, T. F., Holben, B. N., Lewis, J. R., Campbell, J. R., Welton, E. J., Korkin, S. V., and Lyapustin, A. I.: Advancements in the Aerosol Robotic Network (AERONET) Version 3 database – automated near-real-time quality control algorithm with improved cloud screening for Sun photometer aerosol optical depth (AOD) measurements, Atmos. Meas. Tech., 12, 169–209, https://doi.org/10.5194/amt-12-169-2019, 2019.
Ginoux, P., Chin, M., Tegen, I., Prospero, J. M., Holben, B., Dubovik, O., and Lin, S.-J.: Sources and distributions of dust aerosols simulated with the GOCART model, Journal of Geophysical Research: Atmospheres, 106, 20255–20273, https://doi.org/10.1029/2000JD000053, 2001.
González-Flórez, C., Klose, M., Alastuey, A., Dupont, S., Escribano, J., Etyemezian, V., Gonzalez-Romero, A., Huang, Y., Kandler, K., Nikolich, G., Panta, A., Querol, X., Reche, C., Yus-Díez, J., and Pérez García-Pando, C.: Insights into the size-resolved dust emission from field measurements in the Moroccan Sahara, Atmos. Chem. Phys., 23, 7177–7212, https://doi.org/10.5194/acp-23-7177-2023, 2023.
Harris, L., Zhou, L., Lin, S.-J., Chen, J.-H., Chen, X., Gao, K., Morin, M., Rees, S., Sun, Y., Tong, M., Xiang, B., Bender, M., Benson, R., Cheng, K.-Y., Clark, S., Elbert, O. D., Hazelton, A., Huff, J. J., Kaltenbaugh, A., Liang, Z., Marchok, T., Shin, H. H., and Stern, W.: GFDL SHiELD: A Unified System for Weather-to-Seasonal Prediction, Journal of Advances in Modeling Earth Systems, 12, e2020MS002223, https://doi.org/10.1029/2020MS002223, 2020.
Hsu, N. C., Lee, J., Sayer, A. M., Kim, W., Bettenhausen, C., and Tsay, S.-C.: VIIRS Deep Blue Aerosol Products Over Land: Extending the EOS Long-Term Aerosol Data Records, Journal of Geophysical Research: Atmospheres, 124, 4026–4053, https://doi.org/10.1029/2018JD029688, 2019.
Hu, L., Keller, C. A., Long, M. S., Sherwen, T., Auer, B., Da Silva, A., Nielsen, J. E., Pawson, S., Thompson, M. A., Trayanov, A. L., Travis, K. R., Grange, S. K., Evans, M. J., and Jacob, D. J.: Global simulation of tropospheric chemistry at 12.5 km resolution: performance and evaluation of the GEOS-Chem chemical module (v10-1) within the NASA GEOS Earth system model (GEOS-5 ESM), Geosci. Model Dev., 11, 4603–4620, https://doi.org/10.5194/gmd-11-4603-2018, 2018.
Huang, Y., Kok, J. F., Kandler, K., Lindqvist, H., Nousiainen, T., Sakai, T., Adebiyi, A., and Jokinen, O.: Climate Models and Remote Sensing Retrievals Neglect Substantial Desert Dust Asphericity, Geophysical Research Letters, 47, e2019GL086592, https://doi.org/10.1029/2019GL086592, 2020.
Huang, Y., Adebiyi, A. A., Formenti, P., and Kok, J. F.: Linking the Different Diameter Types of Aspherical Desert Dust Indicates That Models Underestimate Coarse Dust Emission, Geophysical Research Letters, 48, e2020GL092054, https://doi.org/10.1029/2020GL092054, 2021.
Huneeus, N., Schulz, M., Balkanski, Y., Griesfeller, J., Prospero, J., Kinne, S., Bauer, S., Boucher, O., Chin, M., Dentener, F., Diehl, T., Easter, R., Fillmore, D., Ghan, S., Ginoux, P., Grini, A., Horowitz, L., Koch, D., Krol, M. C., Landing, W., Liu, X., Mahowald, N., Miller, R., Morcrette, J.-J., Myhre, G., Penner, J., Perlwitz, J., Stier, P., Takemura, T., and Zender, C. S.: Global dust model intercomparison in AeroCom phase I, Atmos. Chem. Phys., 11, 7781–7816, https://doi.org/10.5194/acp-11-7781-2011, 2011.
Iversen, J. D. and White, B. R.: Saltation threshold on Earth, Mars and Venus, Sedimentology, 29, 111–119, https://doi.org/10.1111/j.1365-3091.1982.tb01713.x, 1982.
Jaeglé, L., Quinn, P. K., Bates, T. S., Alexander, B., and Lin, J.-T.: Global distribution of sea salt aerosols: new constraints from in situ and remote sensing observations, Atmos. Chem. Phys., 11, 3137–3157, https://doi.org/10.5194/acp-11-3137-2011, 2011.
Jickells, T. D., An, Z. S., Andersen, K. K., Baker, A. R., Bergametti, G., Brooks, N., Cao, J. J., Boyd, P. W., Duce, R. A., Hunter, K. A., Kawahata, H., Kubilay, N., laRoche, J., Liss, P. S., Mahowald, N., Prospero, J. M., Ridgwell, A. J., Tegen, I., and Torres, R.: Global Iron Connections Between Desert Dust, Ocean Biogeochemistry, and Climate, Science, 308, 67–71, https://doi.org/10.1126/science.1105959, 2005.
Jones, A. C., Hill, A., Hemmings, J., Lemaitre, P., Quérel, A., Ryder, C. L., and Woodward, S.: Below-cloud scavenging of aerosol by rain: a review of numerical modelling approaches and sensitivity simulations with mineral dust in the Met Office's Unified Model, Atmos. Chem. Phys., 22, 11381–11407, https://doi.org/10.5194/acp-22-11381-2022, 2022.
Kenny, L. C., Gussman, R., and Meyer, M.: Development of a Sharp-Cut Cyclone for Ambient Aerosol Monitoring Applications, Aerosol Science and Technology, 32, 338–358, https://doi.org/10.1080/027868200303669, 2000.
Kok, J. F.: A scaling theory for the size distribution of emitted dust aerosols suggests climate models underestimate the size of the global dust cycle, Proceedings of the National Academy of Sciences, 108, 1016–1021, https://doi.org/10.1073/pnas.1014798108, 2011.
Kok, J. F., Mahowald, N. M., Fratini, G., Gillies, J. A., Ishizuka, M., Leys, J. F., Mikami, M., Park, M.-S., Park, S.-U., Van Pelt, R. S., and Zobeck, T. M.: An improved dust emission model – Part 1: Model description and comparison against measurements, Atmos. Chem. Phys., 14, 13023–13041, https://doi.org/10.5194/acp-14-13023-2014, 2014.
Kok, J. F., Ridley, D. A., Zhou, Q., Miller, R. L., Zhao, C., Heald, C. L., Ward, D. S., Albani, S., and Haustein, K.: Smaller desert dust cooling effect estimated from analysis of dust size and abundance, Nature Geoscience, 10, 274–278, https://doi.org/10.1038/ngeo2912, 2017.
Kok, J. F., Adebiyi, A. A., Albani, S., Balkanski, Y., Checa-Garcia, R., Chin, M., Colarco, P. R., Hamilton, D. S., Huang, Y., Ito, A., Klose, M., Li, L., Mahowald, N. M., Miller, R. L., Obiso, V., Pérez García-Pando, C., Rocha-Lima, A., and Wan, J. S.: Contribution of the world's main dust source regions to the global cycle of desert dust, Atmos. Chem. Phys., 21, 8169–8193, https://doi.org/10.5194/acp-21-8169-2021, 2021a.
Kok, J. F., Adebiyi, A. A., Albani, S., Balkanski, Y., Checa-Garcia, R., Chin, M., Colarco, P. R., Hamilton, D. S., Huang, Y., Ito, A., Klose, M., Leung, D. M., Li, L., Mahowald, N. M., Miller, R. L., Obiso, V., Pérez García-Pando, C., Rocha-Lima, A., Wan, J. S., and Whicker, C. A.: Improved representation of the global dust cycle using observational constraints on dust properties and abundance, Atmos. Chem. Phys., 21, 8127–8167, https://doi.org/10.5194/acp-21-8127-2021, 2021b.
Koster, R. D., Reichle, R. H., Mahanama, S. P., Perket, J., Liu, Q., and Partyka, G.: Land-focused changes in the updated GEOS FP system (Version 5.25), 2020.
Latimer, R. N. C. and Martin, R. V.: Interpretation of measured aerosol mass scattering efficiency over North America using a chemical transport model, Atmos. Chem. Phys., 19, 2635–2653, https://doi.org/10.5194/acp-19-2635-2019, 2019.
Leung, D. M., Kok, J. F., Li, L., Okin, G. S., Prigent, C., Klose, M., Pérez García-Pando, C., Menut, L., Mahowald, N. M., Lawrence, D. M., and Chamecki, M.: A new process-based and scale-aware desert dust emission scheme for global climate models – Part I: Description and evaluation against inverse modeling emissions, Atmos. Chem. Phys., 23, 6487–6523, https://doi.org/10.5194/acp-23-6487-2023, 2023.
Leung, D. M., Kok, J. F., Li, L., Mahowald, N. M., Lawrence, D. M., Tilmes, S., Kluzek, E., Klose, M., and Pérez García-Pando, C.: A new process-based and scale-aware desert dust emission scheme for global climate models – Part II: Evaluation in the Community Earth System Model version 2 (CESM2), Atmos. Chem. Phys., 24, 2287–2318, https://doi.org/10.5194/acp-24-2287-2024, 2024.
Li, C., Martin, R. V., van Donkelaar, A., Boys, B. L., Hammer, M. S., Xu, J.-W., Marais, E. A., Reff, A., Strum, M., Ridley, D. A., Crippa, M., Brauer, M., and Zhang, Q.: Trends in Chemical Composition of Global and Regional Population-Weighted Fine Particulate Matter Estimated for 25 Years, Environ. Sci. Technol., 51, 11185–11195, https://doi.org/10.1021/acs.est.7b02530, 2017.
Li, L., Mahowald, N. M., Kok, J. F., Liu, X., Wu, M., Leung, D. M., Hamilton, D. S., Emmons, L. K., Huang, Y., Sexton, N., Meng, J., and Wan, J.: Data and codes for “Importance of different parameterization changes for the updated dust cycle modelling in the Community Atmosphere Model (version 6.1)”, Zenodo [data set], https://doi.org/10.5281/zenodo.6989502, 2022a.
Li, L., Mahowald, N. M., Kok, J. F., Liu, X., Wu, M., Leung, D. M., Hamilton, D. S., Emmons, L. K., Huang, Y., Sexton, N., Meng, J., and Wan, J.: Importance of different parameterization changes for the updated dust cycle modeling in the Community Atmosphere Model (version 6.1), Geosci. Model Dev., 15, 8181–8219, https://doi.org/10.5194/gmd-15-8181-2022, 2022b.
Liao, H. and Seinfeld, J. H.: Radiative forcing by mineral dust aerosols: Sensitivity to key variables, Journal of Geophysical Research: Atmospheres, 103, 31637–31645, https://doi.org/10.1029/1998JD200036, 1998.
Lin, H., Jacob, D. J., Lundgren, E. W., Sulprizio, M. P., Keller, C. A., Fritz, T. M., Eastham, S. D., Emmons, L. K., Campbell, P. C., Baker, B., Saylor, R. D., and Montuoro, R.: Harmonized Emissions Component (HEMCO) 3.0 as a versatile emissions component for atmospheric models: application in the GEOS-Chem, NASA GEOS, WRF-GC, CESM2, NOAA GEFS-Aerosol, and NOAA UFS models, Geosci. Model Dev., 14, 5487–5506, https://doi.org/10.5194/gmd-14-5487-2021, 2021.
Liu, H., Jacob, D. J., Bey, I., and Yantosca, R. M.: Constraints from 210Pb and 7Be on wet deposition and transport in a global three-dimensional chemical tracer model driven by assimilated meteorological fields, Journal of Geophysical Research: Atmospheres, 106, 12109–12128, https://doi.org/10.1029/2000JD900839, 2001.
Liu, X., Turner, J. R., Hand, J. L., Schichtel, B. A., and Martin, R. V.: A Global-Scale Mineral Dust Equation, Journal of Geophysical Research: Atmospheres, 127, e2022JD036937, https://doi.org/10.1029/2022JD036937, 2022.
Liu, X., Turner, J. R., Oxford, C. R., McNeill, J., Walsh, B., Le Roy, E., Weagle, C. L., Stone, E., Zhu, H., Liu, W., Wei, Z., Hyslop, N. P., Giacomo, J., Dillner, A. M., Salam, A., Hossen, A., Islam, Z., Abboud, I., Akoshile, C., Amador-Muñoz, O., Anh, N. X., Asfaw, A., Balasubramanian, R., Chang, R. Y.-W., Coburn, C., Dey, S., Diner, D. J., Dong, J., Farrah, T., Gahungu, P., Garland, R. M., Grutter de la Mora, M., Hasheminassab, S., John, J., Kim, J., Kim, J. S., Langerman, K., Lee, P.-C., Lestari, P., Liu, Y., Mamo, T., Martins, M., Mayol-Bracero, O. L., Naidoo, M., Park, S. S., Schechner, Y., Schofield, R., Tripathi, S. N., Windwer, E., Wu, M.-T., Zhang, Q., Brauer, M., Rudich, Y., and Martin, R. V.: Elemental Characterization of Ambient Particulate Matter for a Globally Distributed Monitoring Network: Methodology and Implications, ACS EST Air, 1, 283–293, https://doi.org/10.1021/acsestair.3c00069, 2024.
Mahowald, N., Kohfeld, K., Hansson, M., Balkanski, Y., Harrison, S. P., Prentice, I. C., Schulz, M., and Rodhe, H.: Dust sources and deposition during the last glacial maximum and current climate: A comparison of model results with paleodata from ice cores and marine sediments, Journal of Geophysical Research: Atmospheres, 104, 15895–15916, https://doi.org/10.1029/1999JD900084, 1999.
Mahowald, N., Albani, S., Kok, J. F., Engelstaeder, S., Scanza, R., Ward, D. S., and Flanner, M. G.: The size distribution of desert dust aerosols and its impact on the Earth system, Aeolian Research, 15, 53–71, https://doi.org/10.1016/j.aeolia.2013.09.002, 2014.
Marticorena, B. and Bergametti, G.: Modeling the atmospheric dust cycle: 1. Design of a soil-derived dust emission scheme, Journal of Geophysical Research: Atmospheres, 100, 16415–16430, https://doi.org/10.1029/95JD00690, 1995.
Martin, R. L. and Kok, J. F.: Distinct Thresholds for the Initiation and Cessation of Aeolian Saltation From Field Measurements, Journal of Geophysical Research: Earth Surface, 123, 1546–1565, https://doi.org/10.1029/2017JF004416, 2018.
Martin, R. V., Eastham, S. D., Bindle, L., Lundgren, E. W., Clune, T. L., Keller, C. A., Downs, W., Zhang, D., Lucchesi, R. A., Sulprizio, M. P., Yantosca, R. M., Li, Y., Estrada, L., Putman, W. M., Auer, B. M., Trayanov, A. L., Pawson, S., and Jacob, D. J.: Improved advection, resolution, performance, and community access in the new generation (version 13) of the high-performance GEOS-Chem global atmospheric chemistry model (GCHP), Geosci. Model Dev., 15, 8731–8748, https://doi.org/10.5194/gmd-15-8731-2022, 2022.
Meng, J., Martin, R. V., Ginoux, P., Hammer, M., Sulprizio, M. P., Ridley, D. A., and van Donkelaar, A.: Grid-independent high-resolution dust emissions (v1.0) for chemical transport models: application to GEOS-Chem (12.5.0), Geosci. Model Dev., 14, 4249–4260, https://doi.org/10.5194/gmd-14-4249-2021, 2021.
Meng, J., Huang, Y., Leung, D. M., Li, L., Adebiyi, A. A., Ryder, C. L., Mahowald, N. M., and Kok, J. F.: Improved Parameterization for the Size Distribution of Emitted Dust Aerosols Reduces Model Underestimation of Super Coarse Dust, Geophysical Research Letters, 49, e2021GL097287, https://doi.org/10.1029/2021GL097287, 2022.
Miller, S. J., Makar, P. A., and Lee, C. J.: HETerogeneous vectorized or Parallel (HETPv1.0): an updated inorganic heterogeneous chemistry solver for the metastable-state NH–Na+–Ca2+–K+–Mg2+–SO–NO–Cl−–H2O system based on ISORROPIA II, Geosci. Model Dev., 17, 2197–2219, https://doi.org/10.5194/gmd-17-2197-2024, 2024.
Murray, L. T., Jacob, D. J., Logan, J. A., Hudman, R. C., and Koshak, W. J.: Optimized regional and interannual variability of lightning in a global chemical transport model constrained by LIS/OTD satellite data, Journal of Geophysical Research: Atmospheres, 117, D20307, https://doi.org/10.1029/2012JD017934, 2012.
Mytilinaios, M., Basart, S., Ciamprone, S., Cuesta, J., Dema, C., Di Tomaso, E., Formenti, P., Gkikas, A., Jorba, O., Kahn, R., Pérez García-Pando, C., Trippetta, S., and Mona, L.: Comparison of dust optical depth from multi-sensor products and MONARCH (Multiscale Online Non-hydrostatic AtmospheRe CHemistry) dust reanalysis over North Africa, the Middle East, and Europe, Atmos. Chem. Phys., 23, 5487–5516, https://doi.org/10.5194/acp-23-5487-2023, 2023.
Okin, G. S.: A new model of wind erosion in the presence of vegetation, Journal of Geophysical Research: Earth Surface, 113, https://doi.org/10.1029/2007JF000758, 2008.
Pai, S. J., Heald, C. L., Pierce, J. R., Farina, S. C., Marais, E. A., Jimenez, J. L., Campuzano-Jost, P., Nault, B. A., Middlebrook, A. M., Coe, H., Shilling, J. E., Bahreini, R., Dingle, J. H., and Vu, K.: An evaluation of global organic aerosol schemes using airborne observations, Atmos. Chem. Phys., 20, 2637–2665, https://doi.org/10.5194/acp-20-2637-2020, 2020.
Panofsky, H. A., Tennekes, H., Lenschow, D. H., and Wyngaard, J. C.: The characteristics of turbulent velocity components in the surface layer under convective conditions, Boundary-Layer Meteorology, 11, 355–361, https://doi.org/10.1007/BF02186086, 1977.
Park, R. J., Jacob, D. J., Field, B. D., Yantosca, R. M., and Chin, M.: Natural and transboundary pollution influences on sulfate-nitrate-ammonium aerosols in the United States: Implications for policy, Journal of Geophysical Research: Atmospheres, 109, D15204, https://doi.org/10.1029/2003jd004473, 2004.
Peters, T. M., Kenny, L. C., Gussman, R. A., and Vanderpool, R. W.: Evaluation of PM2.5 Size Selectors Used in Speciation Samplers, Aerosol Science and Technology, 34, 422–429, https://doi.org/10.1080/02786820119266, 2001.
Petroff, A. and Zhang, L.: Development and validation of a size-resolved particle dry deposition scheme for application in aerosol transport models, Geosci. Model Dev., 3, 753–769, https://doi.org/10.5194/gmd-3-753-2010, 2010.
Philip, S., Martin, R. V., Snider, G., Weagle, C. L., Donkelaar, A. van, Brauer, M., Henze, D. K., Klimont, Z., Venkataraman, C., Guttikunda, S. K., and Zhang, Q.: Anthropogenic fugitive, combustion and industrial dust is a significant, underrepresented fine particulate matter source in global atmospheric models, Environmental Research Letters, 12, 044018, https://doi.org/10.1088/1748-9326/aa65a4, 2017.
Pierre, C., Bergametti, G., Marticorena, B., Kergoat, L., Mougin, E., and Hiernaux, P.: Comparing drag partition schemes over a herbaceous Sahelian rangeland, Journal of Geophysical Research: Earth Surface, 119, 2291–2313, https://doi.org/10.1002/2014JF003177, 2014a.
Pierre, C., Bergametti, G., Marticorena, B., AbdourhamaneTouré, A., Rajot, J.-L., and Kergoat, L.: Modeling wind erosion flux and its seasonality from a cultivated sahelian surface: A case study in Niger, CATENA, 122, 61–71, https://doi.org/10.1016/j.catena.2014.06.006, 2014b.
Poggio, L., de Sousa, L. M., Batjes, N. H., Heuvelink, G. B. M., Kempen, B., Ribeiro, E., and Rossiter, D.: SoilGrids 2.0: producing soil information for the globe with quantified spatial uncertainty, SOIL, 7, 217–240, https://doi.org/10.5194/soil-7-217-2021, 2021.
Prigent, C., Tegen, I., Aires, F., Marticorena, B., and Zribi, M.: Estimation of the aerodynamic roughness length in arid and semi-arid regions over the globe with the ERS scatterometer, Journal of Geophysical Research: Atmospheres, 110, https://doi.org/10.1029/2004JD005370, 2005.
Prospero, J. M.: Long-range transport of mineral dust in the global atmosphere: Impact of African dust on the environment of the southeastern United States, Proceedings of the National Academy of Sciences, 96, 3396–3403, https://doi.org/10.1073/pnas.96.7.3396, 1999.
Reid, J. S., Jonsson, H. H., Maring, H. B., Smirnov, A., Savoie, D. L., Cliff, S. S., Reid, E. A., Livingston, J. M., Meier, M. M., Dubovik, O., and Tsay, S.-C.: Comparison of size and morphological measurements of coarse mode dust particles from Africa, Journal of Geophysical Research: Atmospheres, 108, https://doi.org/10.1029/2002JD002485, 2003.
Ridley, D. A., Heald, C. L., and Ford, B.: North African dust export and deposition: A satellite and model perspective, Journal of Geophysical Research: Atmospheres, 117, D02202, https://doi.org/10.1029/2011JD016794, 2012.
Ridley, D. A., Heald, C. L., Kok, J. F., and Zhao, C.: An observationally constrained estimate of global dust aerosol optical depth, Atmos. Chem. Phys., 16, 15097–15117, https://doi.org/10.5194/acp-16-15097-2016, 2016.
Ryder, C. L., Highwood, E. J., Rosenberg, P. D., Trembath, J., Brooke, J. K., Bart, M., Dean, A., Crosier, J., Dorsey, J., Brindley, H., Banks, J., Marsham, J. H., McQuaid, J. B., Sodemann, H., and Washington, R.: Optical properties of Saharan dust aerosol and contribution from the coarse mode as measured during the Fennec 2011 aircraft campaign, Atmos. Chem. Phys., 13, 303–325, https://doi.org/10.5194/acp-13-303-2013, 2013.
Ryu, Y.-H. and Min, S.-K.: Improving Wet and Dry Deposition of Aerosols in WRF-Chem: Updates to Below-Cloud Scavenging and Coarse-Particle Dry Deposition, Journal of Advances in Modeling Earth Systems, 14, e2021MS002792, https://doi.org/10.1029/2021MS002792, 2022.
Shangguan, W., Dai, Y., Duan, Q., Liu, B., and Yuan, H.: A global soil data set for earth system modeling, Journal of Advances in Modeling Earth Systems, 6, 249–263, https://doi.org/10.1002/2013MS000293, 2014.
Shao, Y. and Lu, H.: A simple expression for wind erosion threshold friction velocity, Journal of Geophysical Research: Atmospheres, 105, 22437–22443, https://doi.org/10.1029/2000JD900304, 2000.
Singh, I., Martin, R. V., Bindle, L., Chatterjee, D., Li, C., Oxford, C., Xu, X., and Wang, J.: Effect of Dust Morphology on Aerosol Optics in the GEOS-Chem Chemical Transport Model, on UV-Vis Trace Gas Retrievals, and on Surface Area Available for Reactive Uptake, Journal of Advances in Modeling Earth Systems, 16, e2023MS003746, https://doi.org/10.1029/2023MS003746, 2024.
Sinyuk, A., Torres, O., and Dubovik, O.: Combined use of satellite and surface observations to infer the imaginary part of refractive index of Saharan dust, Geophysical Research Letters, 30, https://doi.org/10.1029/2002GL016189, 2003.
Smith, R. J.: Use and misuse of the reduced major axis for line-fitting, American Journal of Physical Anthropology, 140, 476–486, https://doi.org/10.1002/ajpa.21090, 2009.
Snider, G., Weagle, C. L., Martin, R. V., van Donkelaar, A., Conrad, K., Cunningham, D., Gordon, C., Zwicker, M., Akoshile, C., Artaxo, P., Anh, N. X., Brook, J., Dong, J., Garland, R. M., Greenwald, R., Griffith, D., He, K., Holben, B. N., Kahn, R., Koren, I., Lagrosas, N., Lestari, P., Ma, Z., Vanderlei Martins, J., Quel, E. J., Rudich, Y., Salam, A., Tripathi, S. N., Yu, C., Zhang, Q., Zhang, Y., Brauer, M., Cohen, A., Gibson, M. D., and Liu, Y.: SPARTAN: a global network to evaluate and enhance satellite-based estimates of ground-level particulate matter for global health applications, Atmos. Meas. Tech., 8, 505–521, https://doi.org/10.5194/amt-8-505-2015, 2015.
Song, Q., Zhang, Z., Yu, H., Ginoux, P., and Shen, J.: Global dust optical depth climatology derived from CALIOP and MODIS aerosol retrievals on decadal timescales: regional and interannual variability, Atmos. Chem. Phys., 21, 13369–13395, https://doi.org/10.5194/acp-21-13369-2021, 2021.
Swap, R., Garstang, M., Greco, S., Talbot, R., and Kallberg, P.: Saharan dust in the Amazon Basin, Tellus B, 44, 133–149, https://doi.org/10.1034/j.1600-0889.1992.t01-1-00005.x, 1992.
Swenson, S. C. and Lawrence, D. M.: Assessing a dry surface layer-based soil resistance parameterization for the Community Land Model using GRACE and FLUXNET-MTE data, Journal of Geophysical Research: Atmospheres, 119, 10299–10312, https://doi.org/10.1002/2014JD022314, 2014.
The International GEOS-Chem User Community: geoschem/GCHP: GCHP 14.4.1, Zenodo [code], https://doi.org/10.5281/zenodo.12584305, 2024.
Tian, R., Ma, X., and Zhao, J.: A revised mineral dust emission scheme in GEOS-Chem: improvements in dust simulations over China, Atmos. Chem. Phys., 21, 4319–4337, https://doi.org/10.5194/acp-21-4319-2021, 2021.
Tindan, J. Z., Jin, Q., and Pu, B.: Understanding day–night differences in dust aerosols over the dust belt of North Africa, the Middle East, and Asia, Atmos. Chem. Phys., 23, 5435–5466, https://doi.org/10.5194/acp-23-5435-2023, 2023.
Uno, I., Wang, Z., Chiba, M., Chun, Y. S., Gong, S. L., Hara, Y., Jung, E., Lee, S.-S., Liu, M., Mikami, M., Music, S., Nickovic, S., Satake, S., Shao, Y., Song, Z., Sugimoto, N., Tanaka, T., and Westphal, D. L.: Dust model intercomparison (DMIP) study over Asia: Overview, Journal of Geophysical Research: Atmospheres, 111, https://doi.org/10.1029/2005JD006575, 2006.
Wang, Q., Jacob, D. J., Fisher, J. A., Mao, J., Leibensperger, E. M., Carouge, C. C., Le Sager, P., Kondo, Y., Jimenez, J. L., Cubison, M. J., and Doherty, S. J.: Sources of carbonaceous aerosols and deposited black carbon in the Arctic in winter-spring: implications for radiative forcing, Atmos. Chem. Phys., 11, 12453–12473, https://doi.org/10.5194/acp-11-12453-2011, 2011.
Wang, Q., Jacob, D. J., Spackman, J. R., Perring, A. E., Schwarz, J. P., Moteki, N., Marais, E. A., Ge, C., Wang, J., and Barrett, S. R. H.: Global budget and radiative forcing of black carbon aerosol: Constraints from pole-to-pole (HIPPO) observations across the Pacific, Journal of Geophysical Research: Atmospheres, 119, 195–206, https://doi.org/10.1002/2013jd020824, 2014a.
Wang, X., Zhang, L., and Moran, M. D.: Development of a new semi-empirical parameterization for below-cloud scavenging of size-resolved aerosol particles by both rain and snow, Geosci. Model Dev., 7, 799–819, https://doi.org/10.5194/gmd-7-799-2014, 2014b.
Wang, X., Jacob, D. J., Downs, W., Zhai, S., Zhu, L., Shah, V., Holmes, C. D., Sherwen, T., Alexander, B., Evans, M. J., Eastham, S. D., Neuman, J. A., Veres, P. R., Koenig, T. K., Volkamer, R., Huey, L. G., Bannan, T. J., Percival, C. J., Lee, B. H., and Thornton, J. A.: Global tropospheric halogen (Cl, Br, I) chemistry and its impact on oxidants, Atmos. Chem. Phys., 21, 13973–13996, https://doi.org/10.5194/acp-21-13973-2021, 2021.
Webb, N. P., Chappell, A., LeGrand, S. L., Ziegler, N. P., and Edwards, B. L.: A note on the use of drag partition in aeolian transport models, Aeolian Research, 42, 100560, https://doi.org/10.1016/j.aeolia.2019.100560, 2020.
Weng, H., Lin, J., Martin, R. V., Millet, D. B., Jaeglé, L., Ridley, D., Keller, C., Li, C., Du, M., and Meng, J.: Global high-resolution emissions of soil NOx, sea salt aerosols, and biogenic volatile organic compounds, Scientific Data, 7, 148, https://doi.org/10.1038/s41597-020-0488-5, 2020.
White, B. R.: Soil transport by winds on Mars, Journal of Geophysical Research: Solid Earth, 84, 4643–4651, https://doi.org/10.1029/JB084iB09p04643, 1979.
Wu, C., Lin, Z., and Liu, X.: The global dust cycle and uncertainty in CMIP5 (Coupled Model Intercomparison Project phase 5) models, Atmos. Chem. Phys., 20, 10401–10425, https://doi.org/10.5194/acp-20-10401-2020, 2020.
Wu, C., Lin, Z., Shao, Y., Liu, X., and Li, Y.: Drivers of recent decline in dust activity over East Asia, Nature Communications, 13, 7105, https://doi.org/10.1038/s41467-022-34823-3, 2022.
Young, S. A., Vaughan, M. A., Garnier, A., Tackett, J. L., Lambeth, J. D., and Powell, K. A.: Extinction and optical depth retrievals for CALIPSO's Version 4 data release, Atmos. Meas. Tech., 11, 5701–5727, https://doi.org/10.5194/amt-11-5701-2018, 2018.
Yu, Y., Kalashnikova, O. V., Garay, M. J., Lee, H., Choi, M., Okin, G. S., Yorks, J. E., Campbell, J. R., and Marquis, J.: A global analysis of diurnal variability in dust and dust mixture using CATS observations, Atmos. Chem. Phys., 21, 1427–1447, https://doi.org/10.5194/acp-21-1427-2021, 2021.
Yuan, H., Dai, Y., Xiao, Z., Ji, D., and Shangguan, W.: Reprocessing the MODIS Leaf Area Index products for land surface and climate modelling, Remote Sensing of Environment, 115, 1171–1187, https://doi.org/10.1016/j.rse.2011.01.001, 2011.
Zender, C. S., Bian, H., and Newman, D.: Mineral Dust Entrainment and Deposition (DEAD) model: Description and 1990s dust climatology, Journal of Geophysical Research: Atmospheres, 108, https://doi.org/10.1029/2002JD002775, 2003.
Zhang, D.: Improving Fine Mineral Dust Representation from the Surface to the Column in GEOS-Chem version 14.4.1, Zenodo [code], https://doi.org/10.5281/zenodo.14510793, 2024.
Zhang, J. and Shao, Y.: A new parameterization of particle dry deposition over rough surfaces, Atmos. Chem. Phys., 14, 12429–12440, https://doi.org/10.5194/acp-14-12429-2014, 2014.
Zhang, L., Gong, S., Padro, J., and Barrie, L.: A size-segregated particle dry deposition scheme for an atmospheric aerosol module, Atmospheric Environment, 35, 549–560, https://doi.org/10.1016/S1352-2310(00)00326-5, 2001.
Zhang, L., Kok, J. F., Henze, D. K., Li, Q., and Zhao, C.: Improving simulations of fine dust surface concentrations over the western United States by optimizing the particle size distribution, Geophysical Research Letters, 40, 3270–3275, https://doi.org/10.1002/grl.50591, 2013.
Zhao, A., Ryder, C. L., and Wilcox, L. J.: How well do the CMIP6 models simulate dust aerosols?, Atmos. Chem. Phys., 22, 2095–2119, https://doi.org/10.5194/acp-22-2095-2022, 2022.
Zhu, H., Martin, R. V., Croft, B., Zhai, S., Li, C., Bindle, L., Pierce, J. R., Chang, R. Y.-W., Anderson, B. E., Ziemba, L. D., Hair, J. W., Ferrare, R. A., Hostetler, C. A., Singh, I., Chatterjee, D., Jimenez, J. L., Campuzano-Jost, P., Nault, B. A., Dibb, J. E., Schwarz, J. S., and Weinheimer, A.: Parameterization of size of organic and secondary inorganic aerosol for efficient representation of global aerosol optical properties, Atmos. Chem. Phys., 23, 5023–5042, https://doi.org/10.5194/acp-23-5023-2023, 2023.
- Abstract
- Introduction
- Data sources and model description
- Strong overestimation of surface fine dust
- Model revisions to reduce the overestimation of surface fine mineral dust
- Conclusions
- Appendix A: Additional details about dust emission parametrizations, SPARTAN dust, and complementary figures
- Code availability
- Data availability
- Author contributions
- Competing interests
- Disclaimer
- Acknowledgements
- Financial support
- Review statement
- References