the Creative Commons Attribution 4.0 License.
the Creative Commons Attribution 4.0 License.
 | 25 Aug 2025
TROLL 4.0: representing water and carbon fluxes, leaf phenology, and intraspecific trait variation in a mixed-species individual-based forest dynamics model – Part 2: Model evaluation for two Amazonian sites
Fabian J. Fischer
James G. C. Ball
Nicolas Barbier
Marion Boisseaux
Damien Bonal
Benoit Burban
Xiuzhi Chen
Géraldine Derroire
Jeremy W. Lichstein
Daniela Nemetschek
Natalia Restrepo-Coupe
Scott Saleska
Giacomo Sellan
Philippe Verley
Grégoire Vincent
Camille Ziegler
Jérôme Chave
Isabelle Maréchaux
TROLL 4.0 is an individual-based forest dynamics model that jointly simulates the structure, diversity, and functioning of tropical forests, including their water balance, carbon fluxes, and leaf phenology, while accounting for intraspecific trait variation for a large number of species. In a companion paper, we describe how the model represents the physiological and demographic processes that control the tree life cycle in a 1 m resolution spatially explicit scene and uses plant functional traits measurable in the field to parameterize such processes across species and individuals (Maréchaux et al., 2025). Here we evaluate the performance of TROLL 4.0 for two Amazonian sites with contrasting soil and climate properties. We assessed the model's ability to represent forest structure, composition, and dynamics using lidar-derived spatial distribution of top canopy height and forest inventories combined with information on plant functional traits. We also evaluated the model's ability to represent carbon and water fluxes, as well as leaf area variation, at daily and fortnightly resolution over a decade, using detailed information from on-site eddy covariance towers, satellite data, and ground-based or airborne lidar data. We finally compared the responses of carbon and water fluxes to environmental drivers between simulated and observed data. Overall, TROLL 4.0 provided a realistic representation of forests at both sites. The simulated canopy height distribution showed a high correlation coefficient (CC) with observed aerial and satellite data (CC > 0.92), while the species and functional composition were well represented (CC > 0.75). TROLL 4.0 also realistically simulated the seasonal variability of carbon and water fluxes (CC > 0.46) and their responses to environmental drivers, while capturing temporal variations in leaf area (CC > 0.76) and its partitioning into leaf age cohorts. However, TROLL 4.0 overestimated annual gross primary productivity at both sites (mean RMSEP = 0.94 ± 0.67 kgC m−2 yr−1) and evapotranspiration at one site (mean RMSEP = 0.75 ± 0.63 mm d−1), likely due to an underestimation of the soil water depletion and stomatal control during the dry season. This evaluation highlights the potential of TROLL 4.0 to represent ecosystem fluxes and the structure, diversity, and dynamics of plant communities at a fine resolution, paving the way for model predictions of the effects of climate change, fragmentation, and forest management on forest structure and dynamics.
- Article
(14689 KB) - Full-text XML
- Companion paper
- BibTeX
- EndNote


Tropical forests cover just 7 % of the Earth's land surface, yet they play a disproportionately large role in the biosphere, store around 25 % of terrestrial carbon, and contribute to more than a third of global terrestrial productivity (Bonan, 2008). Regionally, tropical forests recycle around a third of precipitation through evapotranspiration, contributing to the generation and maintenance of a humid climate (Harper et al., 2014), effects that extend well beyond the tropics (Lawrence and Vandecar, 2014). However, tropical forests remain a major source of uncertainty in simulations of global biogeochemical cycles (Fisher et al., 2014; Koch et al., 2021).
As an illustration, for light-limited tropical forests, dynamic global vegetation models (DGVMs; Prentice et al., 2015) typically simulate a decrease in productivity with a seasonal decline in precipitation (Restrepo-Coupe et al., 2016; Chen et al., 2020), while observations from eddy covariance data point to an increase in gross primary productivity during the dry season (Guan et al., 2015; Aguilos et al., 2018). Similarly, simulated forest responses to experimental and natural droughts have highlighted large model–data discrepancies and variation across models (Powell et al., 2013; Joetzjer et al., 2022; Yao et al., 2022; Paschalis et al., 2023). Improving the representation of tropical forest functioning in models is needed to enhance our understanding and ability to predict biogeochemical cycles.
One challenge is to better integrate the structure, diversity, and functioning of forests into vegetation models (Purves and Pacala, 2008; McMahon et al., 2011; Evans, 2012; Mokany et al., 2015). In spite of progress (Fisher et al., 2017), most models still adopt a coarse-grained representation of vegetation, which makes it difficult to use field data to parameterize and evaluate the models. Also, several processes driving the variation of tropical forest productivity and water fluxes remain incompletely represented in vegetation models. These include water uptake by the root system and seasonal variation of leaf quantity and quality at the ecosystem level, which are driven by leaf phenology and allocation processes at the individual level (Chen et al., 2020; Wu et al., 2021; Restrepo-Coupe et al., 2016; Cusack et al., 2024).
In a companion paper, we described the individual-based forest dynamics model TROLL 4.0 (Maréchaux et al., 2025). This model jointly simulates tropical forest structure, diversity, and functioning, including forest water balance, carbon fluxes, and leaf phenology, and accounts for intraspecific trait variation for a large number of species. TROLL 4.0 represents the processes underlying ecosystem fluxes, such as leaf gas exchanges and their responses to environmental variation, and is thus similar to DVGMs in that respect, with its outputs comparable with data from eddy covariance towers. However, unlike DGVMs that are designed for global applications and typically represent plant diversity with a few functional types, TROLL 4.0 represents diversity at the species level (e.g. tens to hundreds of tropical tree species). TROLL 4.0 is spatially explicit and represents plant community structure and diversity at a spatial resolution of 1 m, which is consistent with that used by field ecologists. Physiological and demographic processes are integrated using a parameterization based on plant traits measurable in the field, relying on recent knowledge in plant physiology and functional ecology. The individual-based, species-specific, and spatially explicit representation of forest structure and composition enables TROLL 4.0 outputs to be directly compared with spatially explicit forest inventories, trait distributions, or fine-scale remote sensing products.
In this paper, we evaluate TROLL 4.0 for two Amazonian sites with contrasting soil and climate properties. We parameterized the model using functional trait and soil data at both sites. We first calibrated three major forest structure parameters using inventory data and then the three parameters of the phenological module that control leaf shedding as a function of soil water availability using litterfall data. We then ran simulations and evaluated the model's representation of forest structure, composition, and dynamics against independent data, including lidar-derived canopy height distribution, understorey inventories, and functional trait distribution. We also assessed the model ability to represent carbon and water fluxes at daily resolution, as well as leaf area variation at fortnightly resolution, against eddy covariance, satellite and terrestrial, or drone lidar data. We finally compared the response of simulated and observed fluxes to incoming radiation, vapour pressure deficit, temperature, and wind speed. Finally, we discuss the potential model–data discrepancies and identify priorities for future developments.
TROLL represents individual trees explicitly in an aboveground voxelized space (1 m3), in which light diffusion is modelled, and in a belowground space, which consists of several layers with user-defined thickness and horizontal resolution (here 25 m2). Belowground water flow is simulated using a bucket model. We assign a species label to each simulated tree and provide as input species-specific mean plant trait values and intraspecific trait variances and covariances. New trees appear in the community through the process of tree recruitment, which is only possible in empty cells and with favourable light and water availability. Trees of a given species are recruited if there is at least one seed of that species in the local seed bank. Individual trait values of each recruited tree are randomly drawn from the intraspecific trait distribution. These traits parameterize the physiological and demographic processes that govern the life cycle of trees, from recruitment to growth, seed dispersal, and finally death. Carbon assimilation by trees is computed using the photosynthesis model of Farquhar et al. (1980), coupled to the stomatal conductance model of Medlyn et al. (2013), as a function of leaf micro-environmental conditions, tree access to water, and leaf photosynthetic capacity and leaf respiration rate. Sugars produced during photosynthesis are used for tree respiration and allocation to plant tissues, including foliar production, carbon storage, and woody growth.
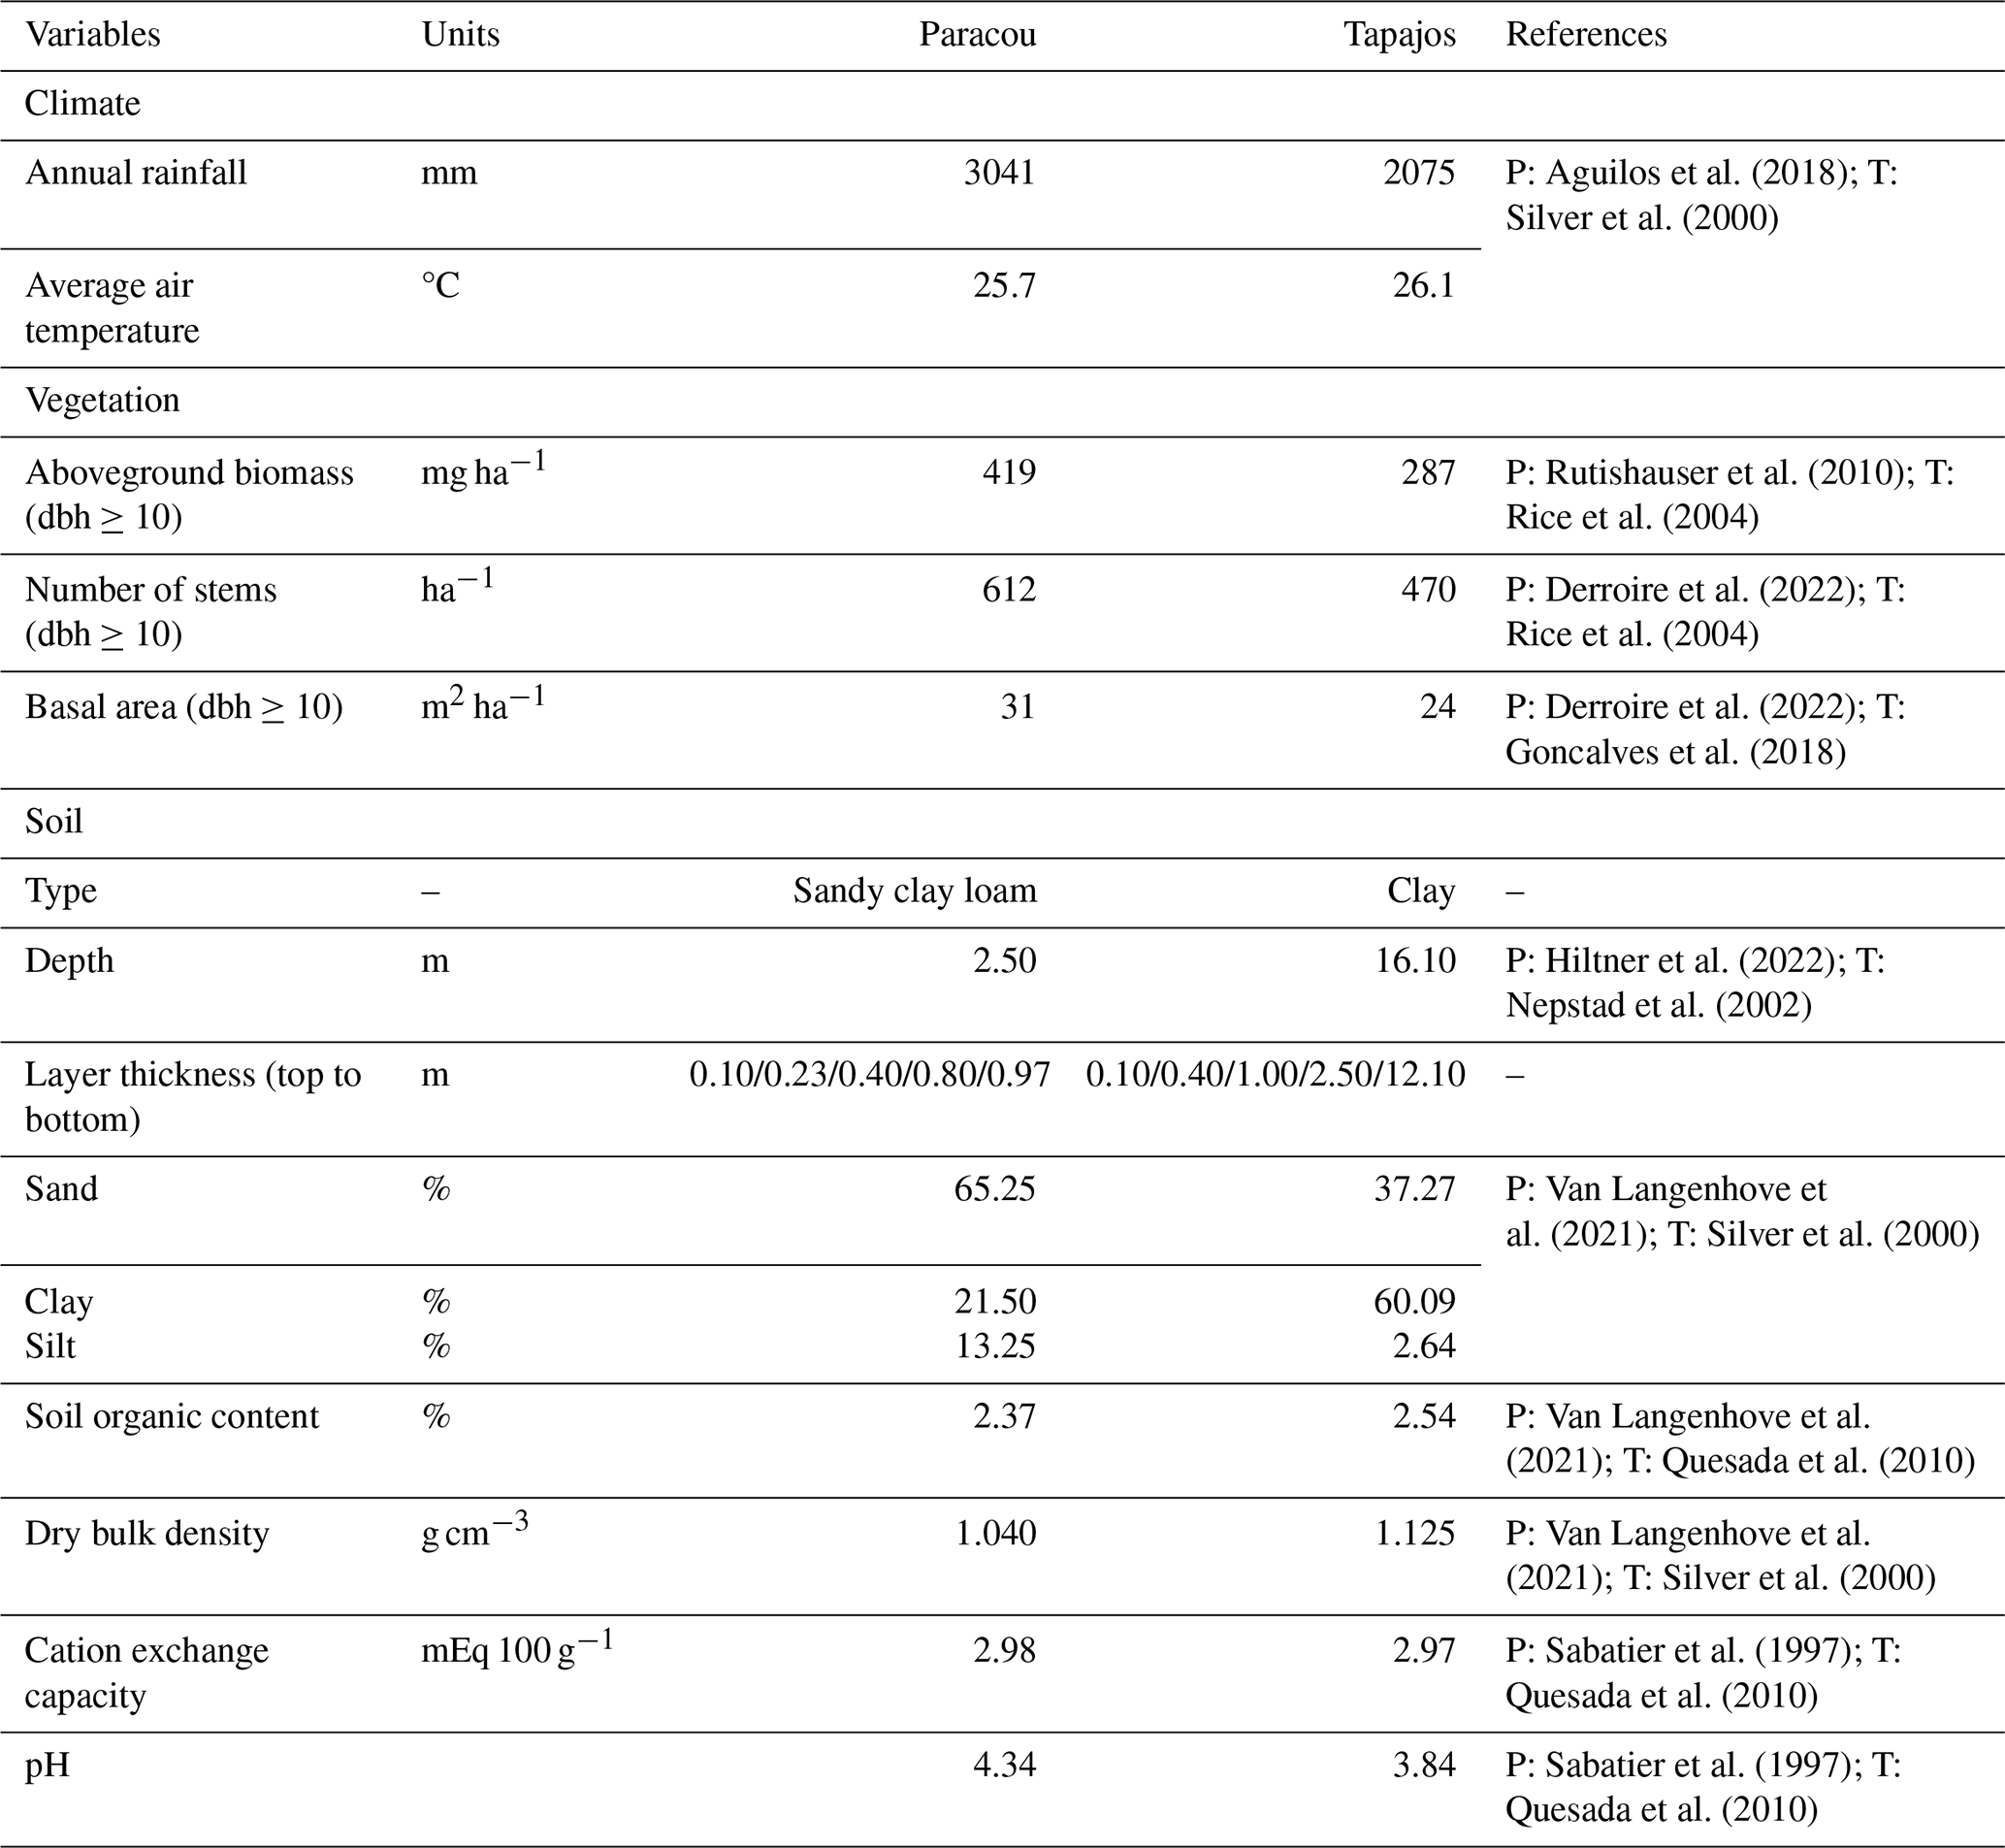
We conducted model calibration and evaluation at two lowland Amazon forest sites: the Paracou research station in French Guiana (5°28′ N, 52°92′ W), hereafter Paracou (Gourlet-Fleury et al., 2004; Bonal et al., 2008), and the Tapajos National Forest in Brazil at the K67 site also named BR-Sa1 (2°86′ S, 54°96′ W), hereafter Tapajos (Silver et al., 2000; Saleska et al., 2003). Both sites are covered by a high biomass and species-rich lowland moist tropical forest, and they present contrasting soil characteristics and climate (Table 1), with a longer dry season in Tapajos than in Paracou resulting, in 2075 mm per year against 3041 mm in Paracou. They thus differ in water regimes and resulting plant water stress and phenology. In addition, the two sites have been intensively monitored for several decades, mainly through repeated forest inventories and eddy flux tower measurements, fulfilling the requirement for in-depth model evaluation as previously used for such applications (Longo et al., 2019b). Additionally, we assumed forest dynamics to be at equilibrium, as both sites are characterized by old-growth forests.
Table 1Site overview with climate, vegetation, and soil properties. Soil properties are those used as input from the pedotransfer functions implemented in TROLL 4.0.
To provide a conservative assessment of the model's performance and its transferability to multiple sites, we restricted the number of site-specific calibrated parameters to the ones that are currently poorly informed by available data or to which the model is known to be sensitive based on sensitivity analyses performed on previous versions of the model (Maréchaux and Chave, 2017; Fischer et al., 2019). At each site, we calibrated six parameters. These include three parameters related to forest structure: the reference background mortality rate m and the intercept aCR and slope bCR of the crown radius scaling relationship (Table A1; Maréchaux and Chave, 2017; Fischer et al., 2019). m can be site-specific as it is used to simulate tree mortality events that are triggered by processes not explicitly represented in the model, such as site-specific disturbance regimes (e.g. Rau et al., 2022). Novel developments in TROLL 4.0 were based on known or measurable ecological parameters and physical constants, but the three parameters of the new leaf phenology module, aT,o, bT,o, and δo (Table A1), are more empirical and not ecologically measurable. In TROLL 4.0, the shedding of old leaves is accelerated as soil water availability decreases (Maréchaux et al., 2025). When the leaf pre-dawn water potential (ψpd, MPa) falls below a threshold ψT,o (MPa), the residence time of old leaves is decreased using a multiplicative factor f0 < 1. The parameter ψT,o varies with the tree leaf drought tolerance and its size as follows:
where πtlp is the leaf water potential at turgor loss point (MPa) and h is the tree height (m). f0 is decreased (increased) by δo when (ψpd > ψT,o). The first term accounts for a decline in leaf drought tolerance with age, i.e. a reduced ability of old leaves to maintain turgor when the soil dries, where aT,o controls the ratio of the turgor loss point of old to mature leaves. The second term accounts for the height dependence of this susceptibility to decreasing water availability: it makes large trees susceptible to a (small) decrease in soil water availability bT,o, while preventing them from constantly shedding their old leaves at a fast rate. Finally, δo controls the rate of leaf shedding in old leaves as they begin to lose turgor, but in the absence of water depletion. Overall, the parameters aT,o, bT,o, and δo control the intensity and timing of the peak of litterfall under drying soil conditions. This scheme is consistent with field observations (Maréchaux et al., 2025); uncertainties remain in the values of aT,o, bT,o, and δo, however, and they need to be calibrated. After calibration, we compared model outputs with site-specific data for evaluation at each site.
2.1 Simulation inputs and climatic drivers
TROLL 4.0 uses 35 global parameters defined by the user and provided as inputs. These parameters relate to atmospheric constants, light transmission, leaf carbon acquisition, leaf shedding, tree carbon allocation, and tree shape, reproduction, and death, as well as intraspecific trait variability (Table S1). Except for the three parameters of forest structure mentioned above and the three parameters of the leaf shedding module that have been calibrated at each site, all values are assumed to be site-independent.
TROLL 4.0 requires trait parameters for each species: values need to be provided as input for six functional traits and three scaling parameters. The scaling parameters are species maximum diameter at breast height (dbhthres, cm) and parameters defining the relationship between height and diameter at breast height (dbh), which are the asymptotic height (hlim, m) and the parameter ah (see Maréchaux et al., 2025, Eqs. 16 and 62). We used forest inventories from Paracou (Derroire et al., 2022) and Tapajos (Goncalves et al., 2018) to create a species list for each site and computed dbhthres as the 95th quantile of species diameter at breast height for species including more than 10 individuals. We used the TALLO global database of height and diameter measurements (Jucker et al., 2022) to infer species-specific values of hlim and ah for the 496 species of the database that are present in Amazonia (latitude between 10° N and 18° S and longitude between 39 and 78° W; n= 24 609 trees with a mean of 49.62 ± 730 trees per species). Parameters ah and hlim were inferred using Bayesian inference as follows:
with the logarithm of height (h, m) following a normal distribution centred on the log of a Michaelis–Menten model with asymptotic height hlim, height–dbh scaling parameter ah, and variance σ2. We used a Michaelis–Menten model form for tree height h, which grows with diameter (dbh) towards a plateau value hlim at a rate ah (Molto et al., 2014). The two species-specific parameters hlim and ah are random parameters following a normal distribution respectively centred on hlim,0 and ah,0 with variances and .
The functional traits used in the parameterization include leaf area (LA, in cm2), leaf mass per area (LMA, g m−2), leaf nitrogen content per dry mass (N, g g−1), leaf phosphorus content per dry mass (P, g g−1), leaf water potential at turgor loss point (πtlp, MPa), and wood specific gravity (wsg, g cm−3). We used several datasets to retrieve species-specific mean values for these traits (Vleminckx et al., 2021; Boisseaux et al., 2025; Kattge et al., 2020; Maréchaux et al., 2015, 2019; Ziegler et al., 2019). Finally, we used predictive mean matching (van Buuren and Groothuis-Oudshoorn, 2011) to impute missing trait values for ah, hlim, dbhthres, and πtlp. Overall, this procedure leads to a parameterization of 114 species for Paracou and 113 species for Tapajos, with imputed values for 4 to 34 species for ah, hlim, dbhthres, and πtlp (Fig. A1).
TROLL 4.0 requires nine soil parameters to describe the texture, depth, and chemistry. These were gathered from the literature, assuming a single soil type and depth per site for simplicity and setting the number of soil layers to five (Table 1). Testing the influence of horizontal and vertical soil heterogeneity on model outputs is left for future work.
TROLL 4.0 simulations are forced with six climatic drivers. Two of them are daily: cumulative rainfall (mm) and average nighttime temperature (°C). The remaining four drivers are provided every half-hour during the daytime (defined below): incoming shortwave radiation (SW, W m−2), temperature (T, °C), vapour pressure deficit (VPD, kPa), and wind speed (WS, m s−1). Historical time series for these climatic variables have been retrieved from the FLUXNET 2015 dataset (Pastorello et al., 2020a), which provides standardized data from eddy flux towers located at each site (2004–2014 for Paracou and 2002–2011 for Tapajos). However, at Tapajos, rainfall data from FLUXNET 2015 are not reliable due to issues with rain gauges (Restrepo-Coupe et al., 2016). Instead, we used rainfall data from the ERA5-Land reanalysis dataset (Muñoz-Sabater et al., 2021) available at hourly resolution between 2002 and 2011. For other climatic variables, data from ERA5-Land showed high correlation with FLUXNET 2015 data and ERA5-Land showed better agreement with on-site precipitation data from FLUXNET 2015 at Paracou when compared to other products, like CHIRPS (Funk et al., 2015; Fig. A2). We used spline interpolation to derive half-hourly time series from the hourly FLUXNET 2015 data in Tapajos. The half-hourly net radiation time series was used to define daytime hours (i.e. with Snet > 0), which were set from 06:00 to 18:00 UTC−3 in Paracou and from 07:00 to 19:00 UTC−3 in Tapajos. The dry season was defined as a period with fortnightly rainfall below 50 mm on average across years, consistent with the 100 mm per month used by Bonal et al. (2008). This leads to a 4-month dry season in Paracou (1 August to 1 December) and a 4.5-month dry season in Tapajos (15 June to 1 November). Dry seasons were defined for illustration purposes only and have no effect on the model behaviour, which is driven by the meteorological inputs described above.
2.2 Calibration and simulation set-up
As opposed to fine-tuning the model, we opted for minimum calibration to assess the model's behaviour with a minimum of information per site and tuning to assess its transferability, at least across Amazonian sites. We calibrated the three forest structure parameters (m, aCR, and bCR) for each site. aCR and bCR are not independent, and we used the TALLO global database of crown radius (CR) and diameter (dbh) measurements (Jucker et al., 2022) to infer their relationship. To do so, we restricted the TALLO database to observations located within 10 km around sites from which we generated 1000 pairs of (aCR, bCR) values. Each pair of values was determined by randomly drawing 10 individuals per 10 cm diameter class to generate a size-balanced dataset to which the following model was fitted: log(CR) . This resulted in the following linear relationship between the two parameters: , with the error around the relation. This relationship constrained the exploration of the three-dimensional parameter space, so we only had to calibrate aCR, , and m. Based on preliminary exploratory analyses with the previous version of TROLL, we defined the range of calibration for each parameter and site as follows: aCR varied from 1.60 to 2.00 in Paracou and from 2.3 to 2.7 in Tapajos with a step of 0.05, from −0.30 to 0.10 in both sites with a step of 0.05, and m from 0.030 to 0.050 in both sites with a step of 0.0025. This resulted in site = 810 triplets of parameter values.
For each set of three parameter values, we performed a 600-year simulation from bare ground over a 4 ha area. Simulations were run with an external seed rain uniformly distributed across species so that the simulated community structure is an emergent property resulting from the community assembly mechanisms embedded in the model. As succession unfolds and the number of mature trees increases in the simulation, internal seed production increases according to the assumed relationships between individual size and fecundity. An alternative to uniform seed rain across species would be to prescribe nonuniform seed rain based on species' regional abundances. This approach would tend to make the simulated species abundances more closely resemble the observed regional abundances. In contrast, uniform seed rain as simulated here biases the simulated abundances towards evenness across species, and differences in simulated abundances reflect differences in demographic performance controlled by the model trait-based parameterization rather than prescribed differences in the seed rain. Each simulation was forced each year by randomly drawing a year among the 10 years of climatic data. In doing so, we avoided applying a periodic climatic forcing or any potential trend linked to global warming.
To evaluate the forest structure simulated with each triplet of parameter values, we compared simulated to observed total aboveground biomass (AGBtot, mg ha−1), total number of stems (Ntot, ha−1), and number of stems per 5 cm diameter class (Ni, ha−1 for dbh class i) at the end of the 600-year regeneration. The Paracou reference dataset was a 2015 inventory of trees with dbh > 10 cm in six 6 ha plots (Derroire et al., 2022). The Tapajos reference dataset was a 1999 inventory of trees with dbh > 10 cm in 19.75 ha along four 1 km transects (Rice et al., 2004). At both sites, we calculated the relative root mean squared error defined as
where AGB, , and are observed values, and AGB, , and are the simulated values. n is the number of dbh classes and is the mean number of stems among dbh classes. We extracted the simulation with the lowest RRMSEP at each site and used the corresponding values for m, aCR, and bCR in all subsequent simulations.
After 600 simulated years of forest dynamics the system reached a mature forest stage with stable forest structure (Fig. A3), composition, and functioning at both sites. This is referred to as the “spin-up phase”. We then used this mature forest stage to calibrate the three parameters of the phenological module. We performed an exhaustive search in the parameter space for combinations of aT,o in [0.01, 0.025, 0.05, 0.075, 0.1, 0.2, 0.3, 0.4, 0.5], bT,o in [0.01, 0.015, 0.02, 0.05, 0.04, 0.06, 0.08, 0.10], and δo in [0.1, 0.2, 0.3, 0.4, 0.5], resulting in sites =720 simulations. For each triplet, we ran a 20-year simulation with historical weather repeating the 10 years of data twice with the mature forest as an initial condition. Only the last 10 years were used for the calibration to allow the leaf dynamics to adjust to new parameter values.
To evaluate each simulation, we used leaf litter data from litter traps at both sites (Damien Bonal, personal communication, 2023 at Paracou, Rice et al., 2008 at Tapajos). Litter traps were typically collected fortnightly (although time intervals between consecutive litter trap collections were sometimes higher and up to 80 d in Paracou) between 2004 and 2023 in Paracou and between 2000 and 2005 in Tapajos. The litter collected from the traps was oven-dried until the mass stabilized and partitioned between leaves, fruits, and woody debris, and then the fractions were weighed. We computed observed leaf litterfall flux in mg ha−1 yr−1 as the mean across traps converted from trap surface to hectare and time interval in days to years. We also recorded the time interval between consecutive trap collections to account for the smoothing effect of the longer time intervals in simulated data. Simulated leaf litterfall fluxes over the last 10 years of simulation for each triplet of parameter values were compared to the observed fluxes using the same observation dates and corresponding time intervals.
To compare simulations against observations, we defined two yearly indices that quantify the timing and intensity of the litterfall peak. The two indices are (i) the day of the litterfall peak as the Julian day of the maximum annual litterfall flux value (day) and (ii) the ratio between the maximum value (computed as the average of litterfall flux over the two consecutive time intervals before and after the peak day) and the basal flux (computed as the yearly average between January and April). Both indices are key features of litterfall patterns in tropical rainforests (Chave et al., 2010; Yang et al., 2021). For each simulation we calculated the root mean squared error defined as
where dayy,o and ratioy,o are observed z scores (i.e. standard deviations from the mean) for year y, and dayy,s and ratioy,s are simulated z scores for year y. Thus a unit RMSEP corresponds to a ratio error of 1 standard deviation, i.e. 7.6 folds, or to a day error of 1 standard deviation, i.e. 45.5 d. The best-fit parameters were those corresponding to the lowest RMSEP at each site.
To assess the model sensitivity to the chosen parameters, we used the calibration parameter spaces and measured response variable sensitivity to each parameter with partial correlation coefficients (PCCs). Moreover, we used a sequential calibration scheme to reduce computation load based on the hypothesis that the second calibration of litterfall parameters does not interfere with the first of forest structure parameters. To assess this assumption, we explored the sensitivity of forest structure variables to forest litterfall parameters.
Finally, to quantify the envelopes of stochastic simulation outputs, we ran 10 replicates of 600-year simulations starting from bare ground with the six calibrated parameter values.
2.3 Evaluation of forest structure, composition, and dynamics
To assess the model's ability to simulate forest structure and dynamics, as well as species and functional composition, we used airborne lidar scanning (ALS) and satellite data, as well as forest inventories combined with functional traits. Independently from the calibration, we evaluated the diameter distribution of the forest understorey at Paracou using an independent 9 ha inventory of trees with dbh between 1 and 10 cm from 2020–2023 (unpublished data). We evaluated the structure of the simulated forest at the end of the 600-year replicates against observed basal area (BA, m2 ha−1) and the logarithm of the number of stems (ha−1) per 1 cm diameter class below 10 cm. We evaluated tree height distributions using ALS data from 2015 at Paracou (unpublished data) and from 2012 at Tapajos (dos-Santos et al., 2019), which were processed into canopy height models with a standardized pipeline (Fischer et al., 2024). From both simulated and ALS-derived canopy height models, we derived the distribution of top canopy height, expressed as a proportion of 1 m2 pixels per 1 m height class. We evaluated the species composition after the 600-year replicates against the observed rank abundance curve of the 114 most abundant species at both sites and the functional composition against the observed density distribution of each trait for each site and each plot. Due to a lower taxonomic resolution of botanical identification at the Tapajos site, we used genus-level functional trait data at Tapajos and species-level functional trait data at Paracou. Finally, we evaluated forest dynamics by retrieving the simulated individual tree growth rates (cm yr−1) and death rates (% yr−1) over 10 years per 5 cm diameter class and comparing them to the ones estimated from field inventories of six 6.25 ha plots in Paracou from 2003 to 2013.
2.4 Evaluation of total leaf area dynamics
We assessed the model's ability to represent the dynamics of total leaf area and its partitioning into three leaf age cohorts (Maréchaux et al., 2025). For evaluation, we gathered leaf area index (LAI) datasets as follows: LAI from MODIS satellites at both sites, LAI from terrestrial lidar at Tapajos (Smith et al., 2019), and LAI from UAV-borne lidar at Paracou (unpublished data; Vincent et al., 2017). The MODIS LAI product was at 8 d and 500 m resolution and pre-processed in PLUMBER2 (Ukkoloa, 2020). At Tapajos, plant area index (PAI) was derived from terrestrial lidar scanning (TLS) performed every 1–2 months in 2010, 2012, 2015, and 2017 along four 1 km long transects representing 0.4 ha with a spatial resolution of about 3 m to characterize canopy porosity (Smith et al., 2019). PAI was derived from lidar hits following Stark et al. (2012) and based on the MacArthur–Horn transformation (MacArthur and Horn, 1969). This PAI was then converted to LAI using an annual mean LAI of 5.7 (Stark et al., 2012). In Paracou, the PAI was derived from repeated UAV-borne lidar surveys, resulting in PAI mapping at 21 d and 1 m resolution between 2020 and 2022 over a 2.5 ha forest area. This PAI derived from UAV lidar was obtained by vertical integration of plant area density (PAD) profiles previously recalibrated to match a TLS-derived PAD profile of a common 1 ha plot scanned in October 2019. This was required because the limited penetration of the UAV lidar yielded overestimation of raw PAD values (Vincent et al., 2023). This PAI was converted to LAI variation with a factor of 0.68, where the conversion factor is derived from other products.
Simulated LAI variations per leaf age cohort (Eqs. 56–57, Maréchaux et al., 2025) were compared qualitatively against the one derived from phenological cameras by Wu et al. (2016) at Tapajos and from the reanalysis of Yang et al. (2023) at both sites. Wu et al. (2016) analysed 478 images collected over 24 months from 65 tree crowns and fitted the transition from young to mature and from mature to old leaf pools, assumed to occur at 1 and 3 months, respectively. Yang et al. (2023) used global satellite observations of the TROPOMI satellite solar-induced fluorescence (SIF) sensor as an indicator of leaf photosynthesis variation, validated by in situ measurements, and set the transition from young to mature and from mature to old leaf pools, occurring at 1.71 and 5.14 months, respectively. By comparison, simulated leaf age per cohort depends on the individual leaf lifespan in TROLL 4.0 (see Maréchaux et al., 2025).
2.5 Evaluation of carbon and water fluxes
To assess the model's ability to simulate carbon and water fluxes, we evaluated gross primary productivity (GPP, kgC m−2 yr−1) and evapotranspiration (ET, mm d−1). We extracted GPP and latent heat flux (LE, W m−2 half-hour−1) from the FLUXNET 2015 dataset (Pastorello et al., 2020a). ET was derived from LE and temperature (T, in °C) using ET with (Allen et al., 1998). GPP was obtained from net ecosystem exchange with the nighttime partitioning method (Reichstein et al., 2005). We summarized half-hourly GPP and ET into daily values by calculating the daily mean and sum. TROLL 4.0 carbon fluxes were also compared with a remotely sensed product of GPP derived from TROPOMI SIF using the formula GPP SIF (Chen et al., 2022). We additionally computed the light use efficiency (LUE in molC mol) by normalizing GPP by photosynthetic photon flux density (PPFD) and the fraction of absorbed photosynthetically active radiation (fAPAR) derived from leaf area index (LAI) to explore carbon flux environmental drivers independently of the overriding effect of light as in Bloomfield et al. (2023). We compared how the fluxes depended on environmental drivers in both simulated and observed data. Using the FLUXNET 2015 dataset (Pastorello et al., 2020a), daily values of cumulative photosynthetically active radiation (PAR, mol m−2), maximum vapour pressure deficit (VPD, kPa), mean temperature (T, °C), and mean wind speed (WS, m s−1) were calculated, and simulated and observed responses of GPP, LUE, and ET to PAR, VPD, T, and WS were compared. TROLL 4.0 water fluxes were assessed using the relative variation of soil water content (RSWC, %) of the top horizon from the Paracou eddy flux tower (Bonal et al., 2008) and the relative variation of soil water content of the top horizon reanalysed against the climatic water deficit at Tapajos (Restrepo-Coupe et al., 2024). RSWC is defined as the daily mean of soil water content (m3 m−3) divided by the annual 95th quantile of the daily mean.
All simulations were run using TROLL 4.0 (Maréchaux et al., 2025) wrapped in the R package rcontroll (Schmitt et al., 2023a) and encapsulated in a Singularity image (Kurtzer et al., 2017) by leveraging a Python Snakemake workflow (Köster and Rahmann, 2012) on a high-performance computing platform using 100 cores. To compare simulations and observations, we used the same metrics for all variables, regardless of their type, origin, and spatial or temporal resolution: the goodness of fit R2 from linear regression with null intercept, the Pearson's correlation coefficient (CC), the root mean square error of prediction (RMSEP), the standard deviation (SD) of the error of prediction.
3.1 Forest structure, composition, and dynamics
We calibrated the background mortality rate (m) and crown radius scaling parameters (aCR and bCR) at Paracou and Tapajos against observed aboveground biomass, total number of stems, and number of stems per 5 cm dbh classes and found m= 0.035, aCR= 1.80, and bCR= 0.3860 at Paracou and m= 0.040, aCR= 2.45, and bCR= 0.7565 at Tapajos. For trees with 10 cm dbh, the calibrated crown radius–dbh allometry (Eq. 17 in Maréchaux et al., 2025) predicts a crown radius of 2.49 m at Paracou and 2.03 m at Tapajos, a variation that falls well within the one reported globally (Jucker et al., 2025). The modelled aboveground biomass, total number of stems, and number of stems per 5 cm dbh classes were in good agreement with observations (correlation coefficient CC > 0.99 at both sites, Fig. 1). The three parameter values were very similar across the five best simulations, i.e. the ones minimizing RRMSEP (m ± 0.0025, aCR ± 0.1, and bCR ± 0.057 at Paracou and m ± 0.01, aCR ± 0.1, and bCR ± 0.0285 at Tapajos, Tables A3 and A4), and we used the values of the best simulation in all subsequent simulations. Finally, in agreement with results on previous versions of the model, forest structure showed high sensitivity to the explored parameters. Partial correlation coefficients (PCCs) were around −0.4 for aCR and around 0.4 for bCR with the number of stems, aboveground biomass, and basal area. The background mortality rate m also had a strong effect on aboveground biomass and basal area, with a PCC around −0.2, but little to no effect on the number of stems (Fig. A4). The sensitivity of forest structure to aCR, bCR, and m was illustrated by a high variation of simulated forest structure when varying these parameters, for instance a basal area variation of 3.9, 2.9, and 1.7 m2 m−2 per standard unit of aCR, bCR, and m, respectively (Fig. A13).
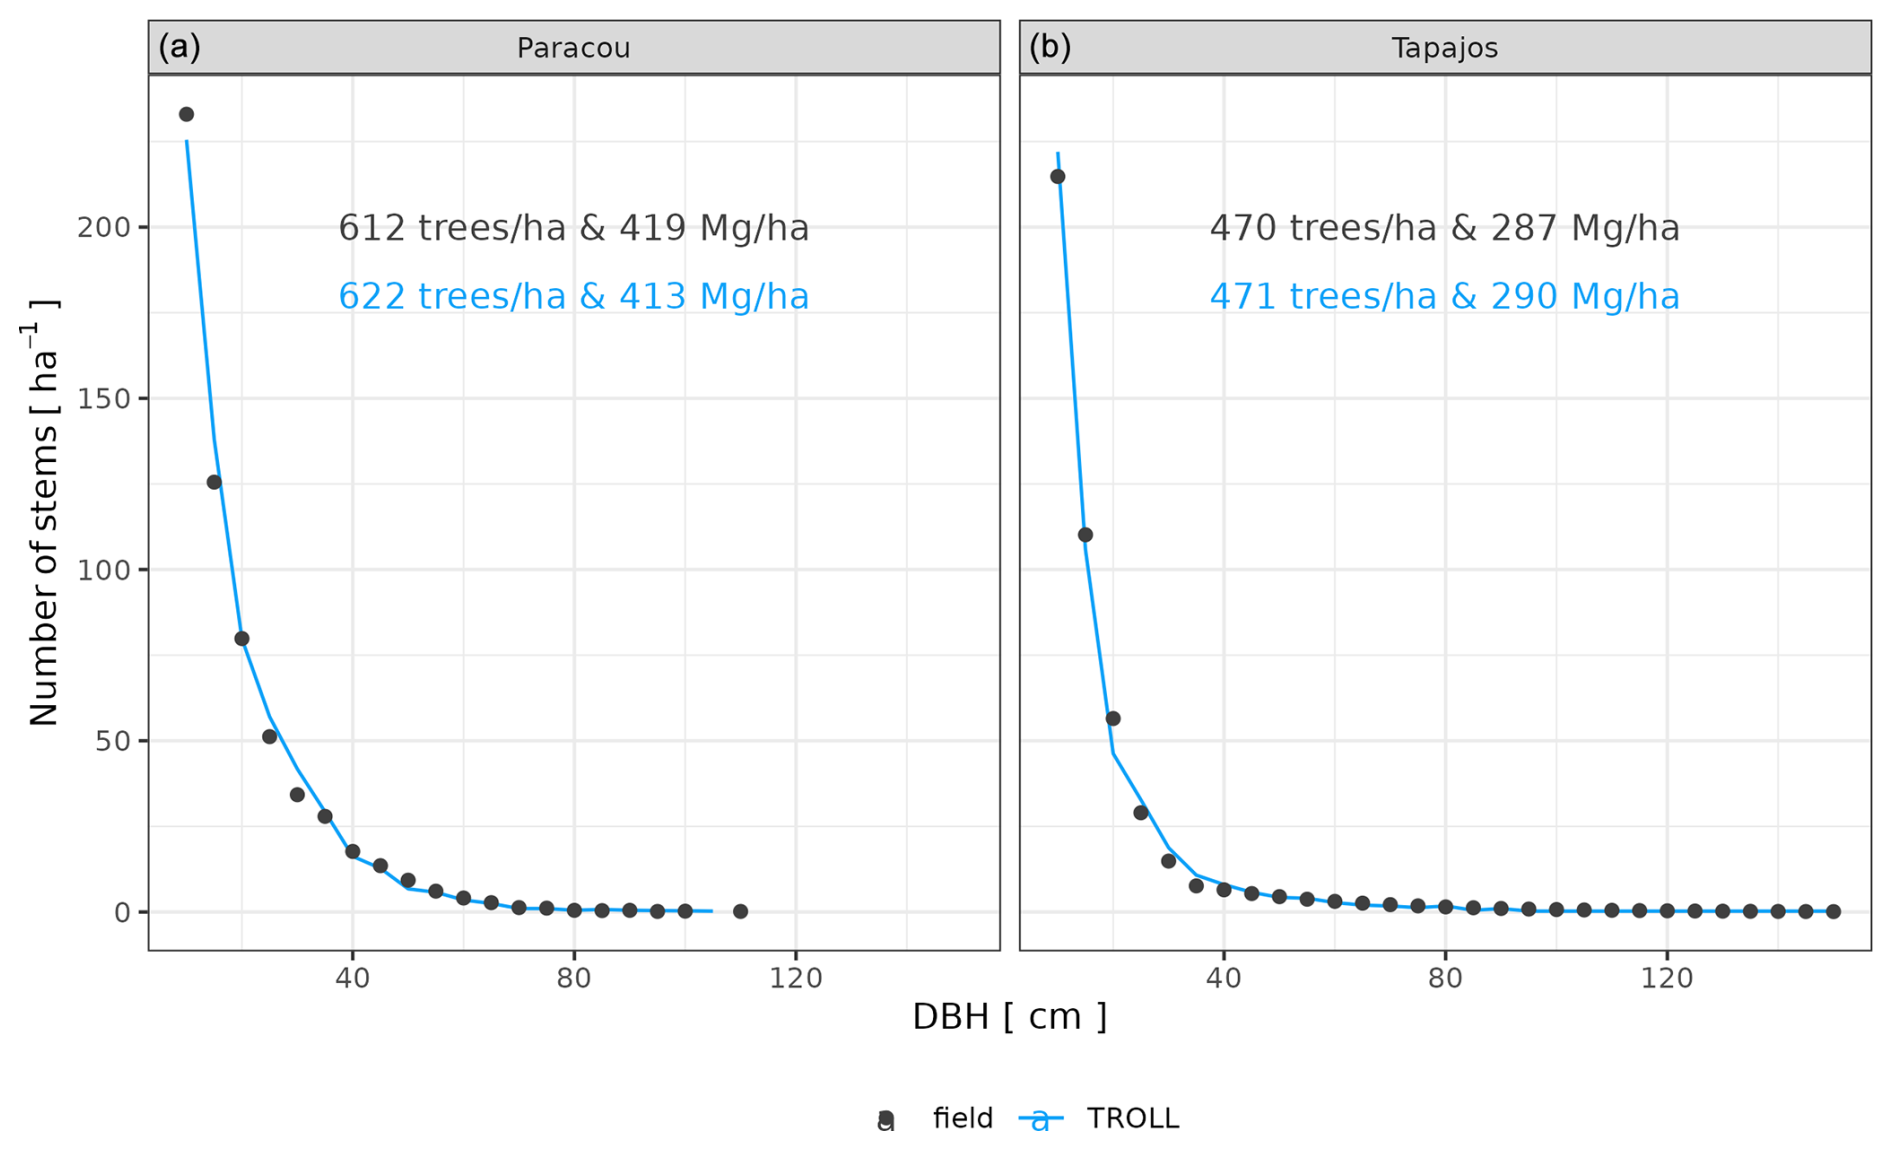
Figure 1Tree size structure at Paracou and Tapajos, expressed in terms of the number of stems per 5 cm dbh class. Comparison between distributions simulated by TROLL 4.0 after calibration of m, aCR, and bCR in blue and the ones derived from field inventories of trees with dbh > 10 cm in black at Paracou (a) and Tapajos (b). Observed (black) and simulated (blue) densities of trees with dbh > 10 cm, and aboveground biomass are also provided. All simulated values correspond to the end state of a 600-year regeneration from bare ground with calibrated values for m, aCR, and bCR at each site.
After calibration, the top canopy height distribution simulated by TROLL 4.0 matched that measured by lidar aerial scanning (ALS), with a root mean square error of prediction (RMSEP) of the proportion of 1 m2 pixels per 1 m height class below 0.8 % and a correlation coefficient (CC) above 0.91, despite a slight overestimation of low-canopy areas in Paracou, at heights below 20 m, and a slight underestimation of high-canopy areas, above 40 m in Tapajos (Fig. 2). For example, in Paracou, 4 % of the 1 m2 pixels scanned by ALS had a canopy height around 25 m. An RMSEP of 0.8 % means that TROLL simulations could lead to 3.2 or 4.8 % of pixels with a canopy height of 25 m. TROLL 4.0 simulations also reproduced the forest understorey structure characterized by basal area (BA) and the distribution of the number of stems per 1 cm diameter class for trees < 10 cm dbh at Paracou (Fig. 3). However, TROLL 4.0 underestimated the number of small trees (2139 vs. 3787 trees ha−1), resulting in an underestimation of basal area (BA = 2.9 vs. 3.7 m2 ha−1).
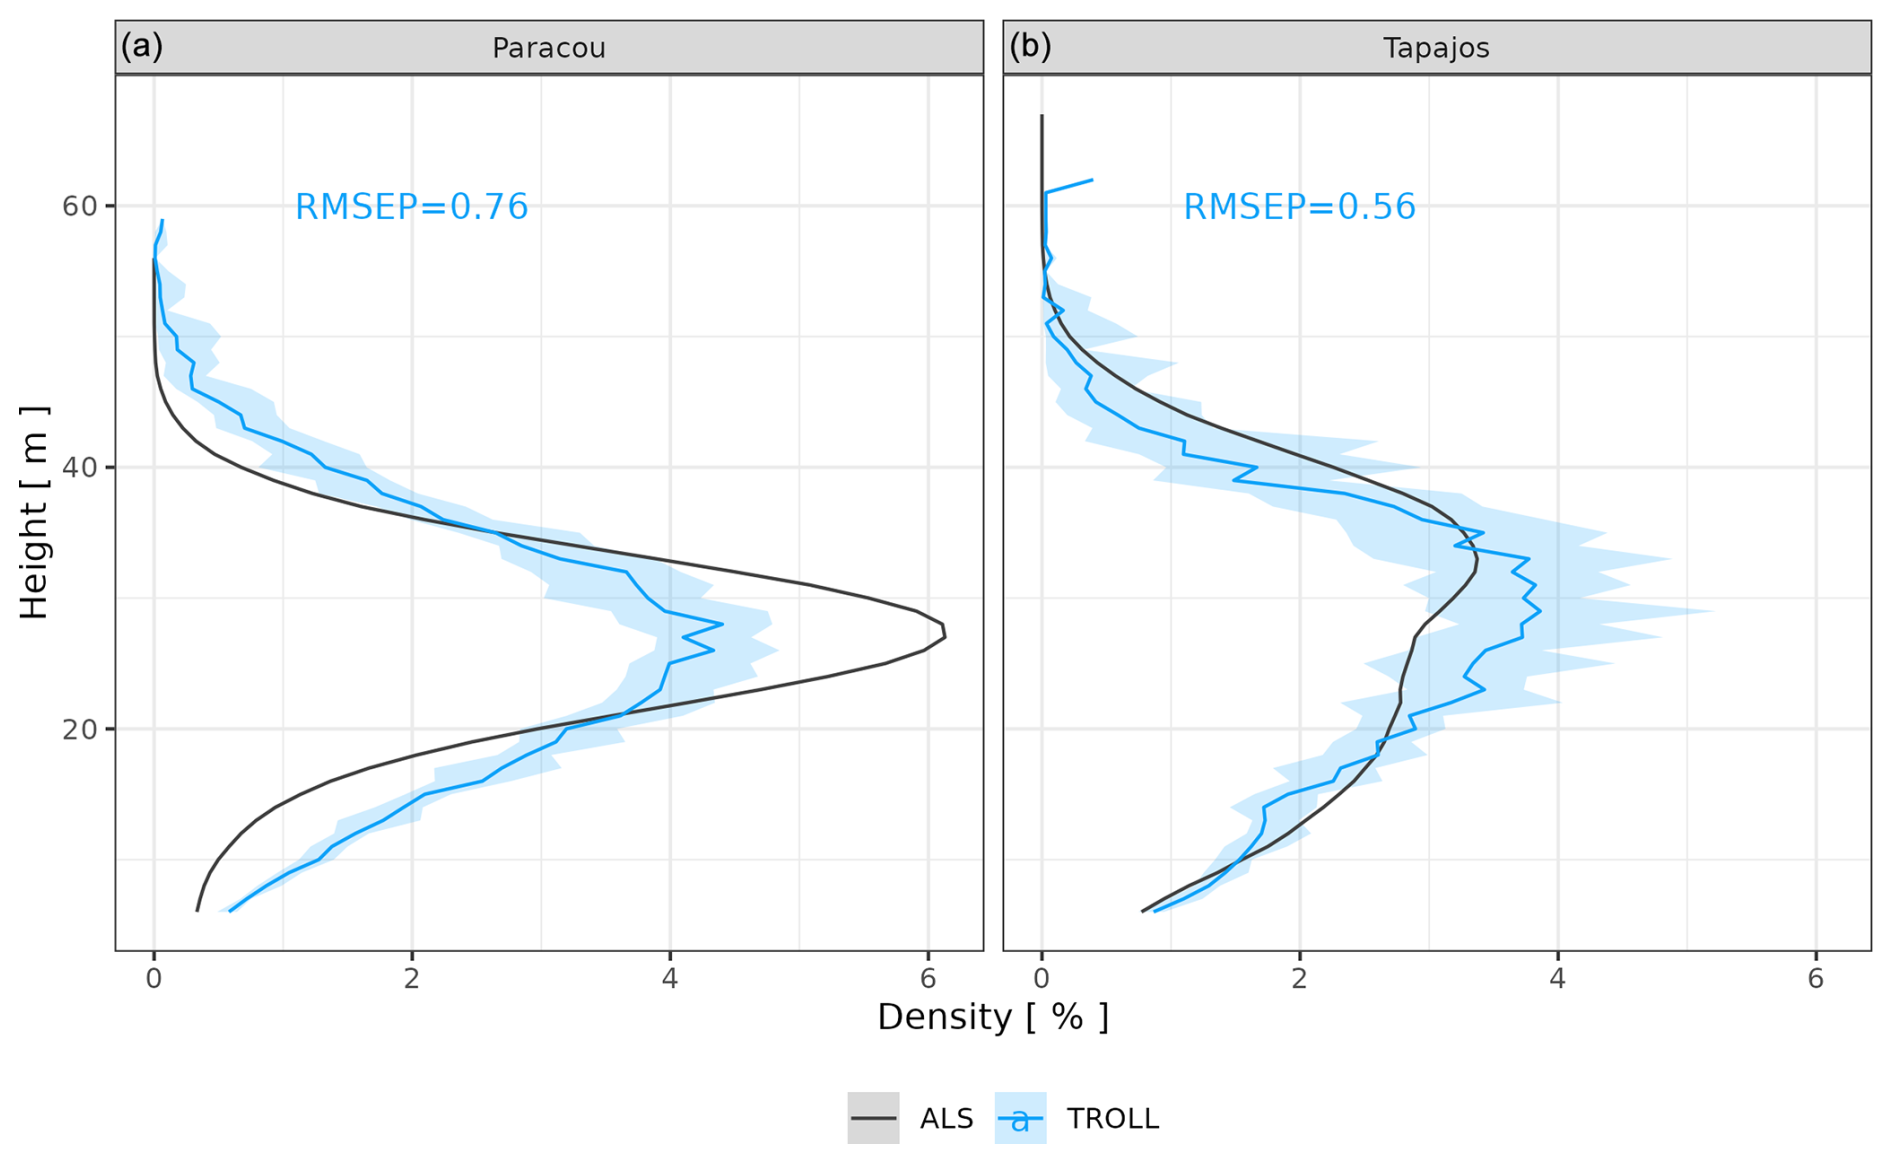
Figure 2Canopy height distribution at Paracou and Tapajos. For each 1 m2 pixel of the ground, the top canopy height in that pixel (i.e. the height of the highest voxel with positive plant area density, or PAD, and located above this ground pixel) was determined, and its distribution across 1 m2 pixels was plotted as the proportion of 1 m2 ground pixels (%, x axis) with a given canopy height (m, y axis, at 1 m resolution). The figure shows a comparison between distributions derived from PAD fields simulated by TROLL 4.0 (blue lines) and the ones derived from airborne laser scanning point clouds (black lines). Simulated values and their confidence intervals correspond to the end state of simulations of 10 4 ha 600-year regenerations from bare ground for each site.
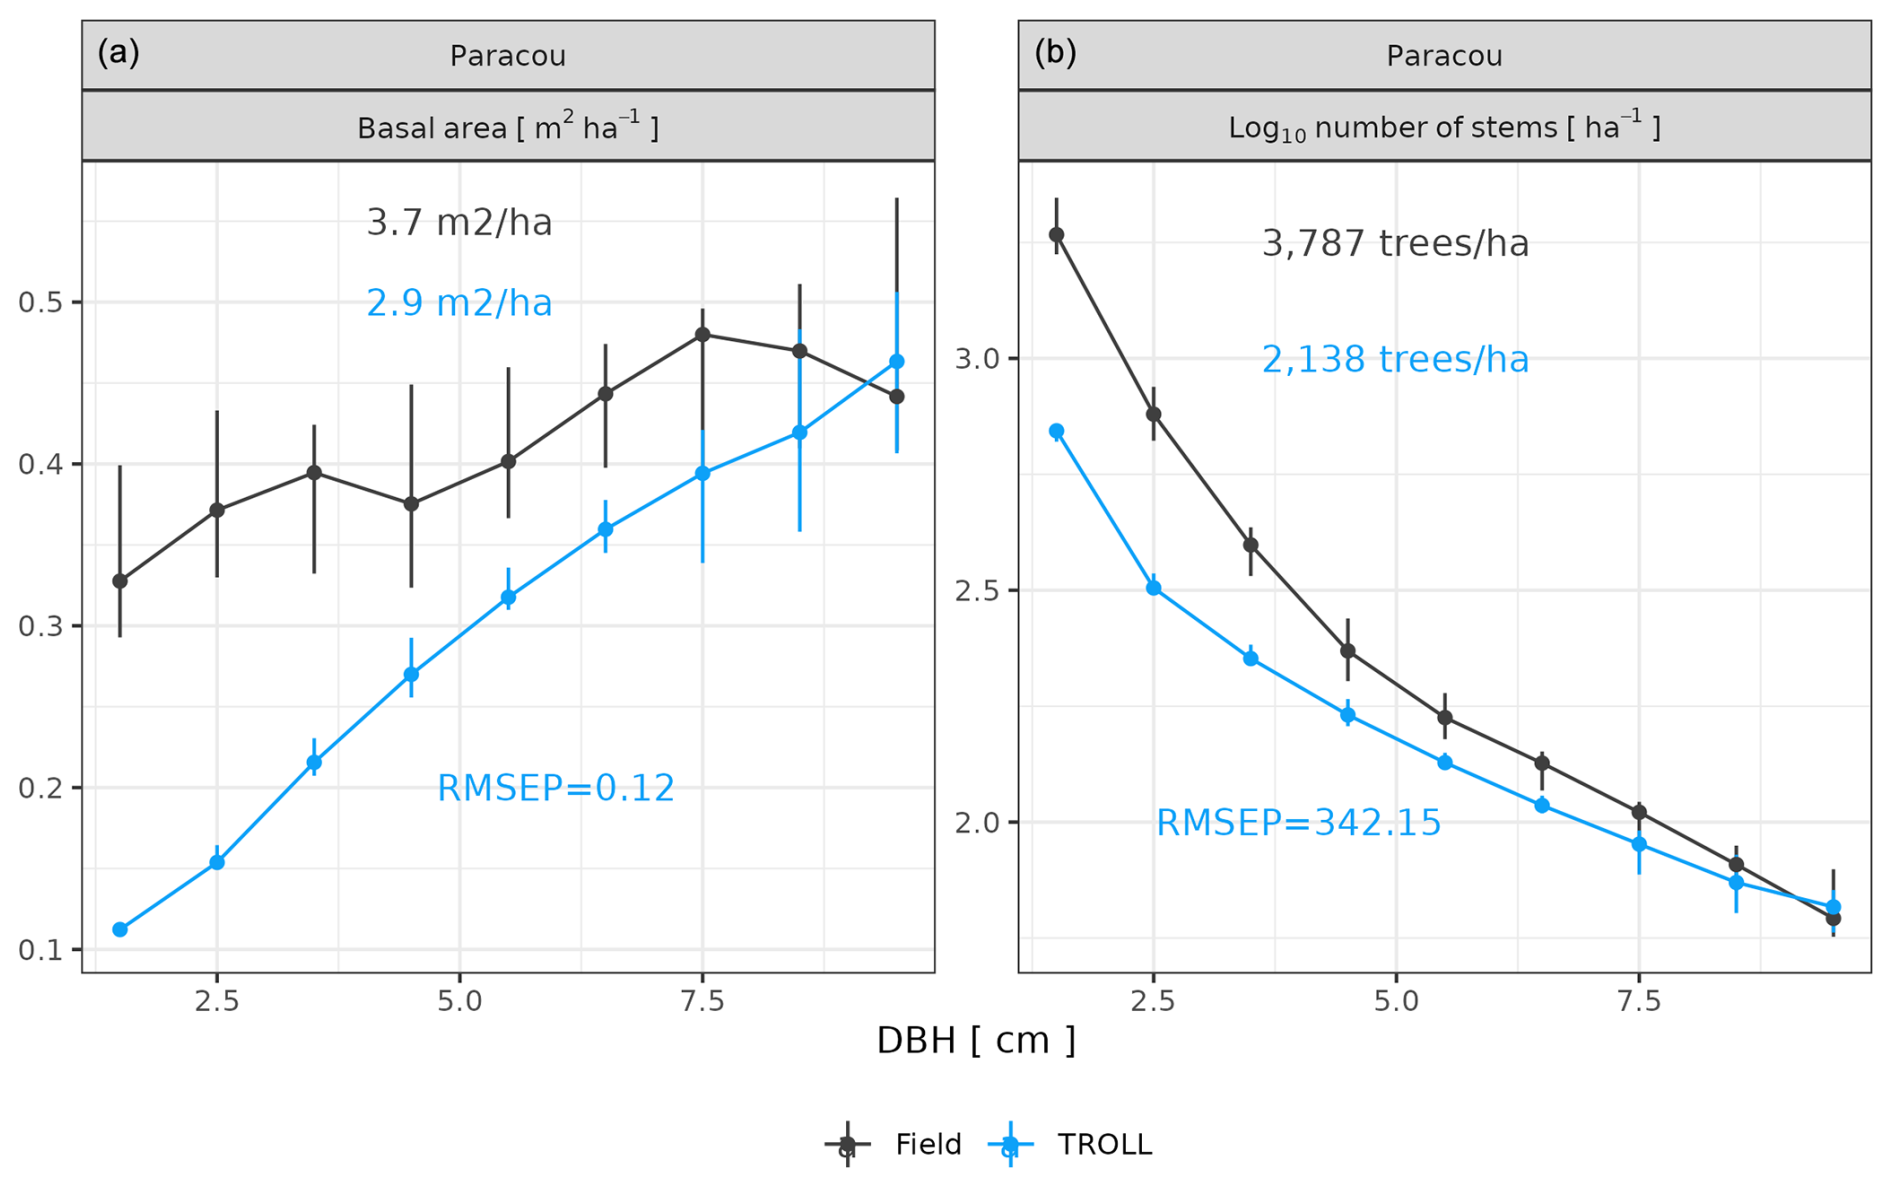
Figure 3Understorey tree size structure at Paracou, expressed in terms of basal area distributions (a) and number of stems (b) per 1 cm dbh class. The figure compares distributions simulated by TROLL 4.0 in blue and field inventory observations in black. Simulated values and their confidence intervals correspond to the end state of simulations of 10 4 ha 600-year regenerations from bare ground. Confidence intervals at 95 % are shown with error bars and are based on variations among plots (nine plots of 1 ha) for the observations. Simulated (blue) and observed (black) total basal area (a) and densities (b) for trees with dbh > 1 cm and < 10 cm are also provided. To the best of our knowledge, similar data were not available for Tapajos.
At Paracou, the simulated and observed species rank abundance curves were similar (Fig. 4), with an RMSEP of 3.67 trees ha−1 and a CC of 0.93, but with an underestimation of the abundance of dominant species and an overestimation of the abundance of rare species, resulting in a higher evenness overall. At Tapajos, the simulated and observed rank abundance curves displayed similar patterns as at Paracou (RMSEP = 3.62 trees ha−1 and CC = 0.94) but amplified, with a strong underestimation of the abundance of dominant species and an overestimation of the abundance of rare species.
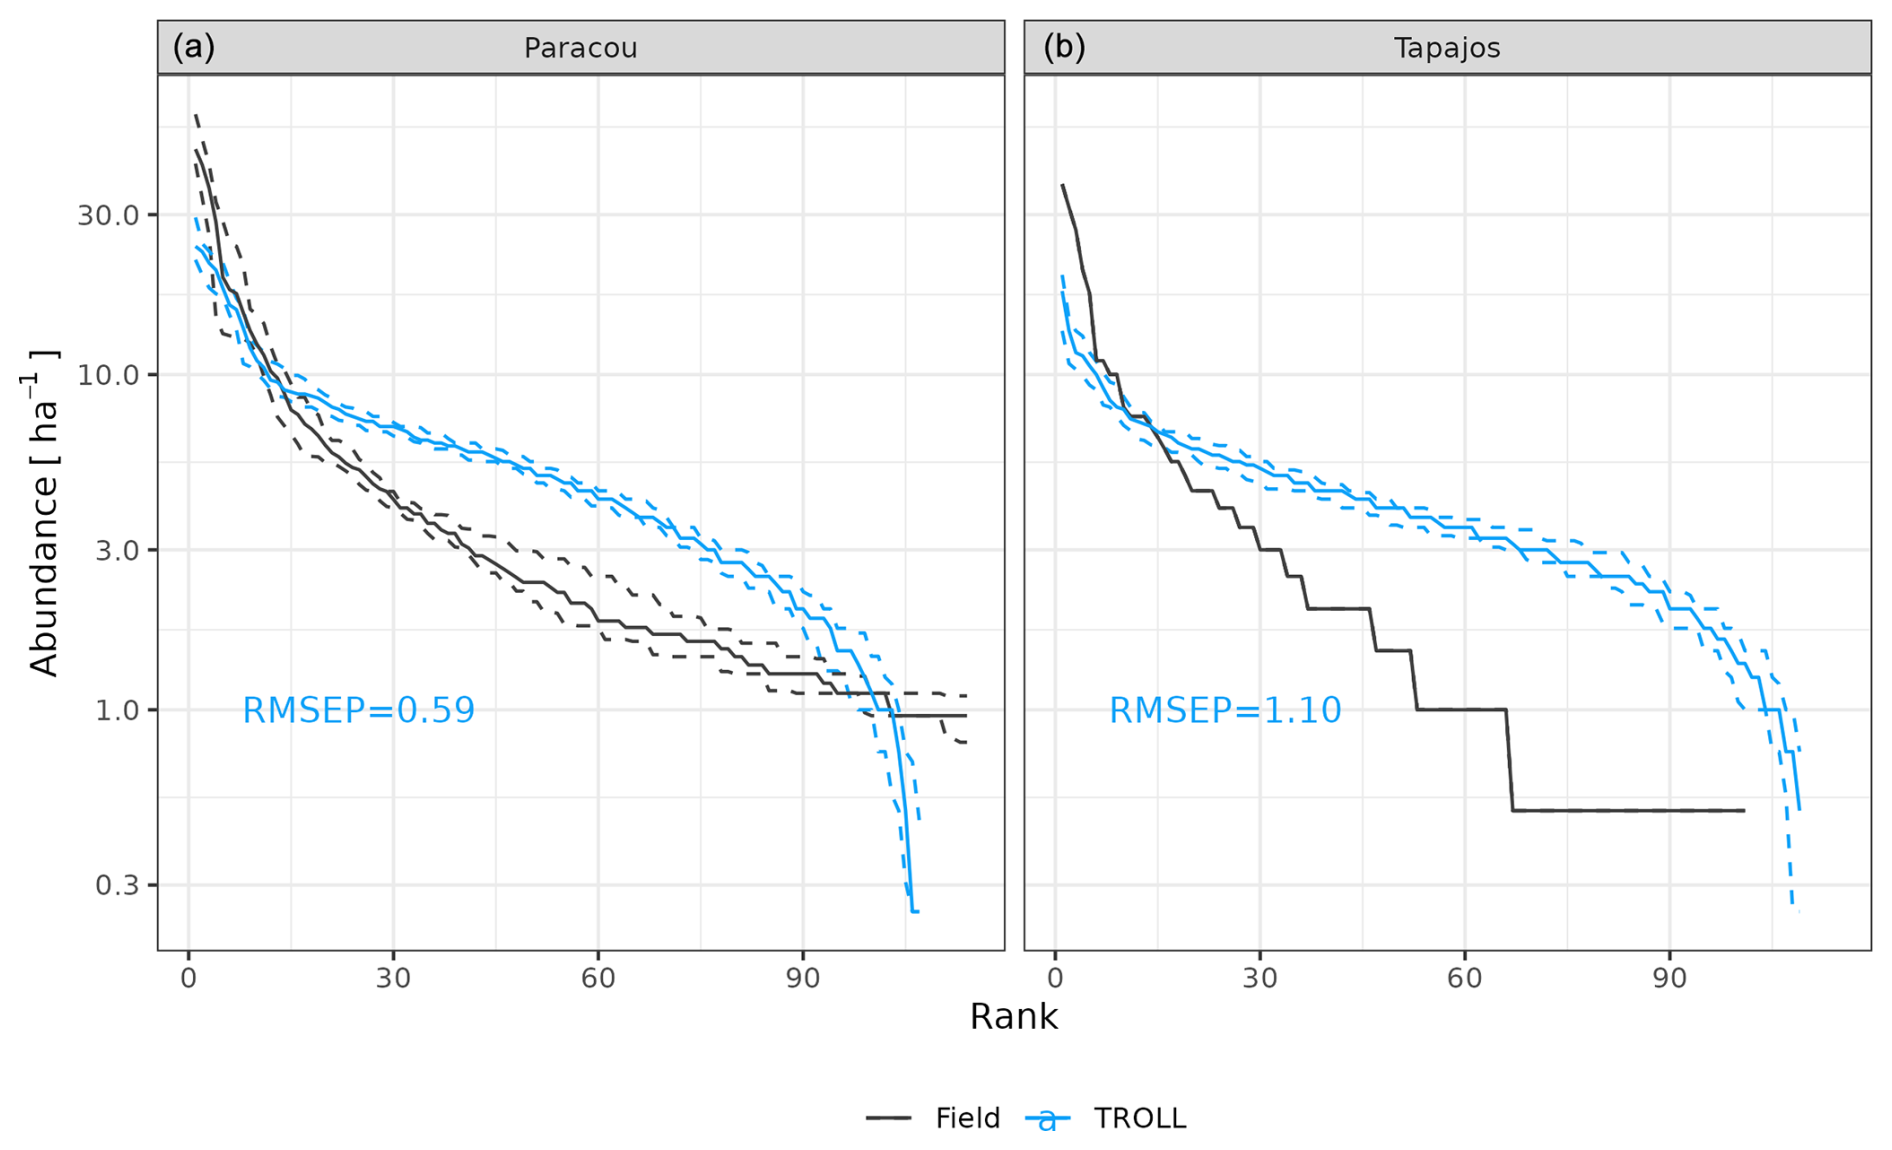
Figure 4Species rank abundance curves at Paracou and Tapajos. Comparisons between curves simulated by TROLL 4.0 (blue) and derived from field inventories at both sites. Simulations included 114 and 113 species at Paracou and Tapajos, respectively. Curves derived from inventories were cut at the 114th species. Simulated values and their confidence intervals correspond to the end state of 10 4 ha 600-year regenerations from bare ground. Confidence intervals at 95 % are shown with error bars and are based on variations among plots for observations.
Functional trait distributions simulated by TROLL 4.0 were consistent with empirical ones at Paracou and Tapajos (Fig. 5), with a CC from 0.91 to 1.00 for all traits at both sites, except for leaf area at Paracou (CC = 0.74) and Tapajos (CC = 0.87). However, abundances of low-wood-density trees, high-LA trees, and high-LMA trees were underestimated in simulations when compared to observations at Paracou.
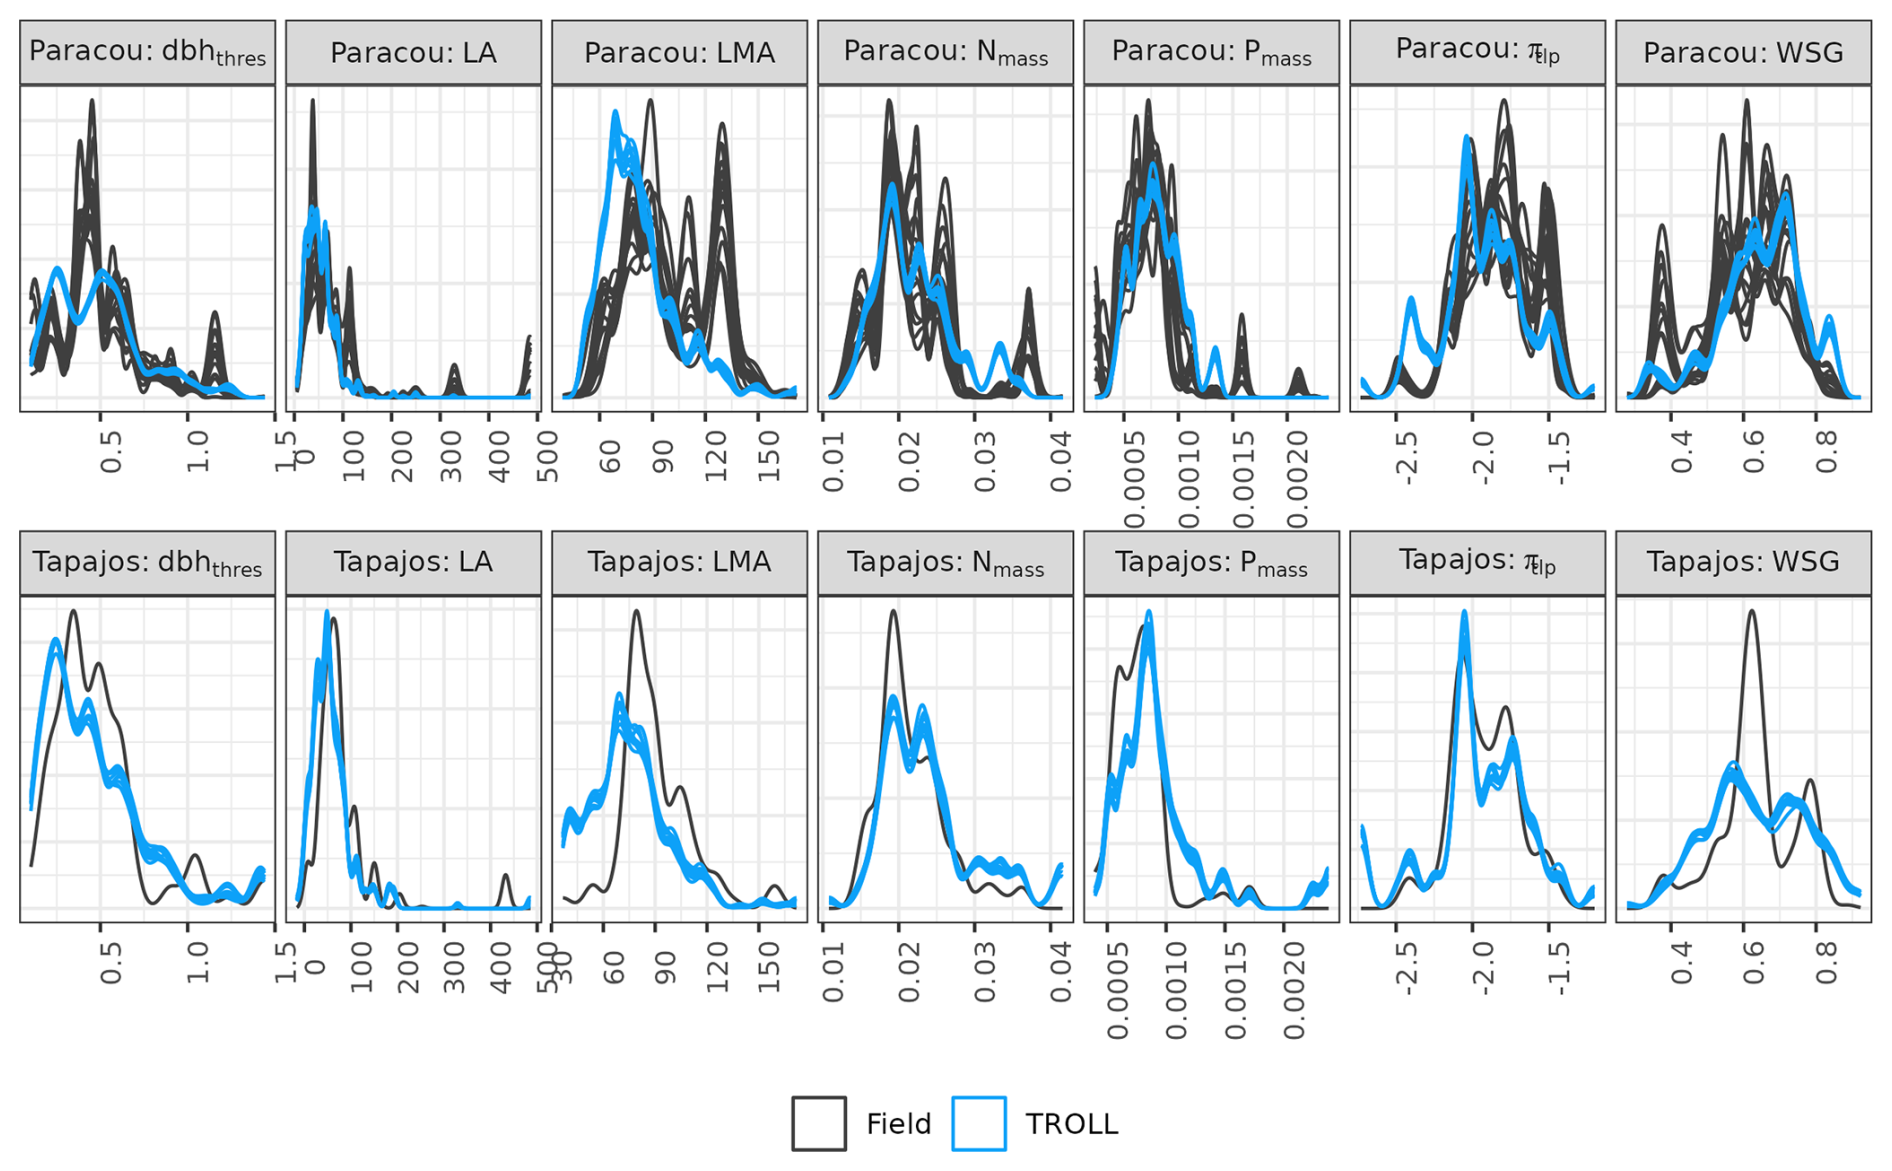
Figure 5Functional trait distributions at Paracou and Tapajos. Distributions derived from field inventories (black) were based on botanical identification at the species level in Paracou and the genus level in Tapajos. Simulated distributions (blue) were based on the final stage of 10 4 ha 600-year regenerations from bare ground. Confidence intervals are shown with repeated lines and are based on variations among plots for observations and among repetitions for simulations. dbhthres: maximum diameter in metres, LA: leaf area in cm2, LMA: leaf mass per area in g cm−3, Nmass: leaf nitrogen content per dry mass in g g−1, Pmass: leaf phosphorus content per dry mass in g g−1, πtlp: leaf water potential at turgor loss point (MPa), WSG: wood specific gravity in g cm−3.
Forest dynamics simulated by TROLL 4.0 were consistent with the ones estimated from field inventories at Paracou (Fig. 6). Simulated individual tree growth–size relationship were comparable to the ones retrieved from inventories (simulated mean of 0.18 cm yr−1 against 0.13 cm yr−1) with an expected bell-shaped relationship (Hérault et al., 2011) and similar high variation (Schmitt et al., 2023b). Simulated death rates also showed a magnitude and variation similar to observed ones (simulated mean of 1.73 % yr−1 against 2.60 % yr−1 observed at Paracou but with consistent and overlapping ranges). Despite overlapping confidence intervals between simulated and observed death rate variation across size, simulated mean death rates tended to be lower for medium to large trees, especially between 30 and 75 cm dbh, than observed.
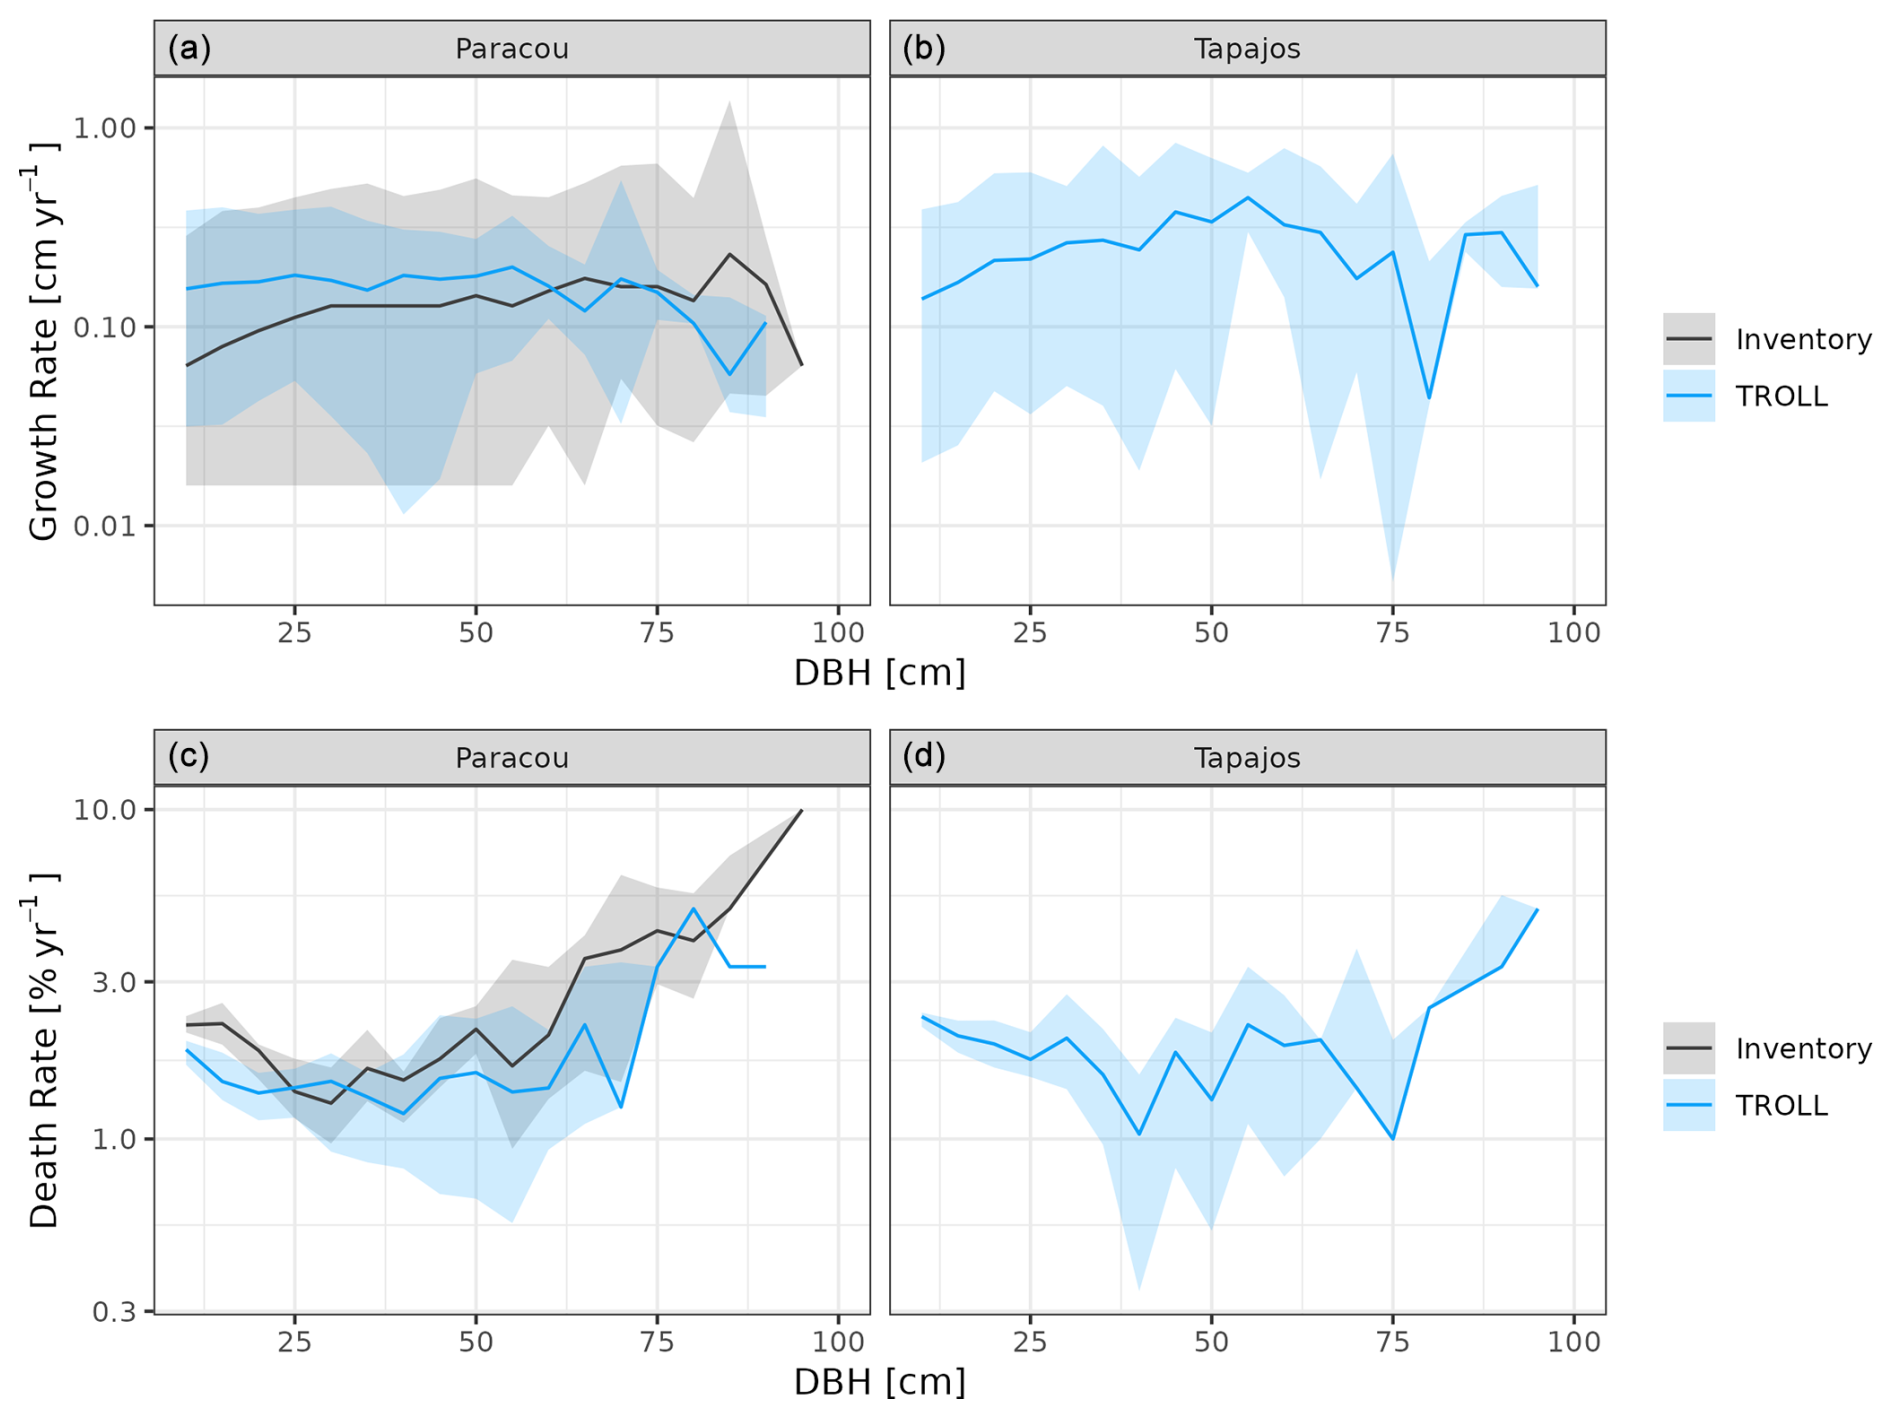
Figure 6Forest dynamics at Paracou and Tapajos, expressed in terms of individual tree growth rate (a, b) and death rate (c, d) both per 5 cm dbh classes across 10 years. The figures compare distributions simulated by TROLL 4.0 in blue and multiple field inventory observations from six 6.25 ha plots in Paracou from 2003 to 2013 in black. Simulated values and their confidence intervals correspond to 10 repetitions of 10-year simulations starting from the end state of 600-year regeneration from bare ground with calibrated parameters at each site. Confidence intervals at 95 % are shown with shaded areas and are based on variations among plots (six plots of 6.25 ha) for the observations.
3.2 Leaf phenology
The calibration of the three parameters of the leaf shedding module against observed litterfall illustrated how each parameter affects the simulated timing and intensity of the litterfall peak during the dry season, with no or little effect on the background litterfall rate (Fig. A5) but revealing a strong positive effect of aT,o and bT,o on the peak day of litterfall and a negative effect on the ratio of the peak of litterfall, as well as a weak effect of δo on the peak of litterfall. As anticipated, litterfall calibration was independent of the forest structure calibration (Fig. A4). Calibration resulted in a best-fit aT,o value of 0.2, and a bT,o value of 0.015 at both sites. The calibrated δo differed across sites (δo= 0.1 at Paracou and δo= 0.2 at Tapajos). The simulated seasonal variation of litterfall at Paracou and Tapajos shows qualitative agreement with the observed data (Fig. 7). Both empirical and simulated data showed a marked peak in litterfall during the dry season, despite a clear underestimation of simulated litterfall flux during both wet and dry seasons, particularly at Tapajos, and a delayed peak during the dry season, particularly at Paracou, in comparison to observations.
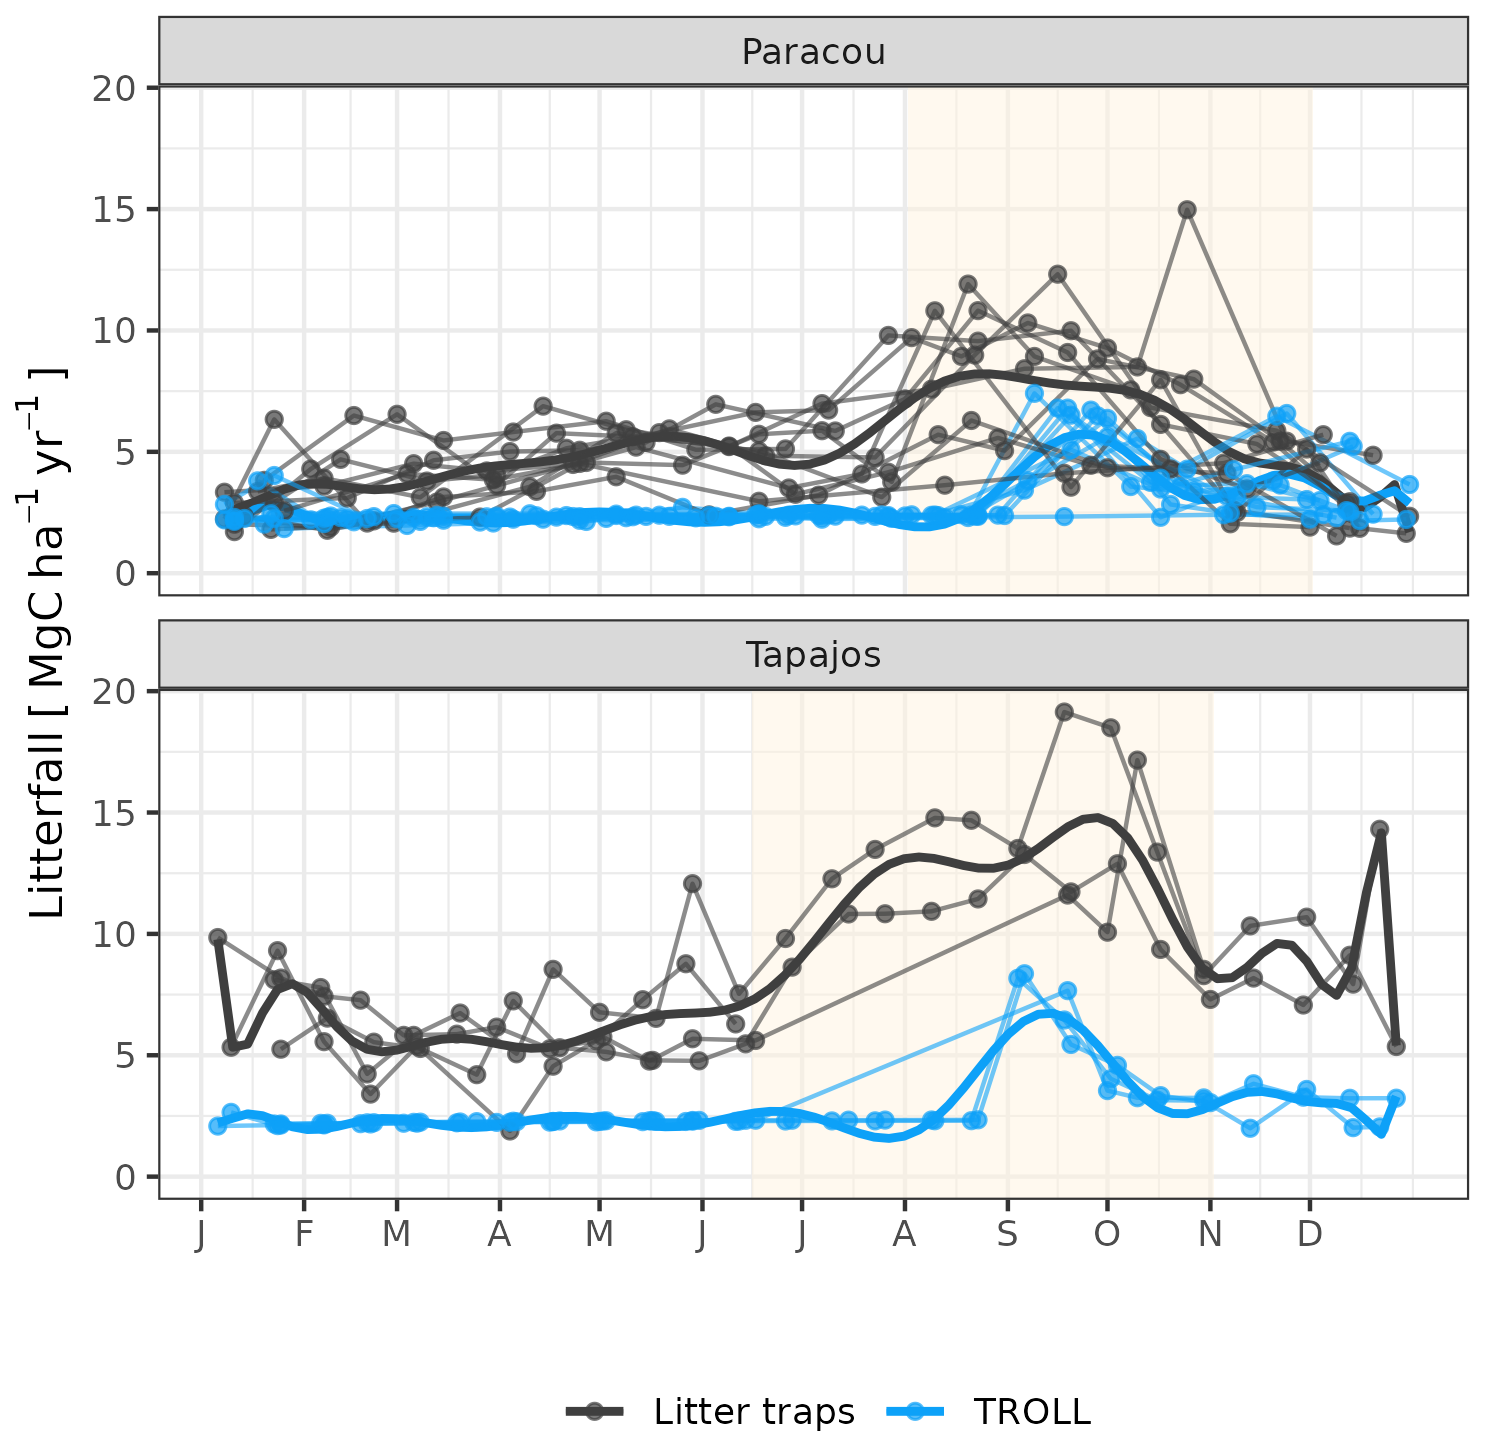
Figure 7Litterfall annual cycle from fortnightly litterfall fluxes at Paracou and Tapajos. Each thin line represents 1 year, with points showing values at sampling dates. The thick lines represent polynomial smoothing among years, and the vertical yellow bands in the background correspond to the site's climatological dry season. Simulated values correspond to the last 10 years of 20-year simulations starting from the end state of 600-year regeneration from bare ground with calibrated parameters at each site.
The empirical LAI datasets displayed strikingly different results, illustrating the challenge of estimating LAI with confidence in dense tropical forests (Fig. 8, Table S2). MODIS-derived LAI displayed almost no seasonality, with mean LAI values around 6.0 m2 m−2 at both sites. At Paracou, LAI derived from UAV-borne lidar showed a clear seasonality, with the lowest values around 5.5 m2 m−2 from April to June and the highest values of almost 6.0 m2 m−2 in December, at the end of the dry season. At Tapajos, LAI derived from terrestrial lidar showed no seasonality and was around 5.8 m2 m−2 throughout the year, but LAI derived from phenological cameras (PhenoCams) did display some seasonality, with the lowest values at 5.5 m2 m−2 in June and the highest values above 6.0 m2 m−2 in December, at the end of the dry season. These observations were compared with simulations. At Paracou, simulated LAI matched the one derived from UAV-borne lidar, with both showing an increase during the dry season (CC = 0.84, RMSEP = 0.11 m2 m−2). At Tapajos, simulated LAI matched the empirical LAI derived from PhenoCams (CC = 0.91, RMSEP = 0.15 m2 m−2; Table S2).
The different datasets gathered to estimate LAI dynamics per cohort also showed contrasting patterns (Figs. 9 and A6). At Tapajos, PhenoCams indicate a maximum young-leaf LAI reached during the dry season and a minimum during the wet season, with inverse patterns for old-leaf LAI. TROLL 4.0 simulations yielded patterns consistent with these observations (Fig. 9). However, Yang et al. (2023)'s reanalysis predicts the exact opposite trends for young and old leaves, with a maximum young-leaf LAI during the wet season and a minimum during the dry season. At Paracou, we could only compare simulated trends against Yang et al. (2023)'s reanalysis and the match was relatively poor (Fig. 8).
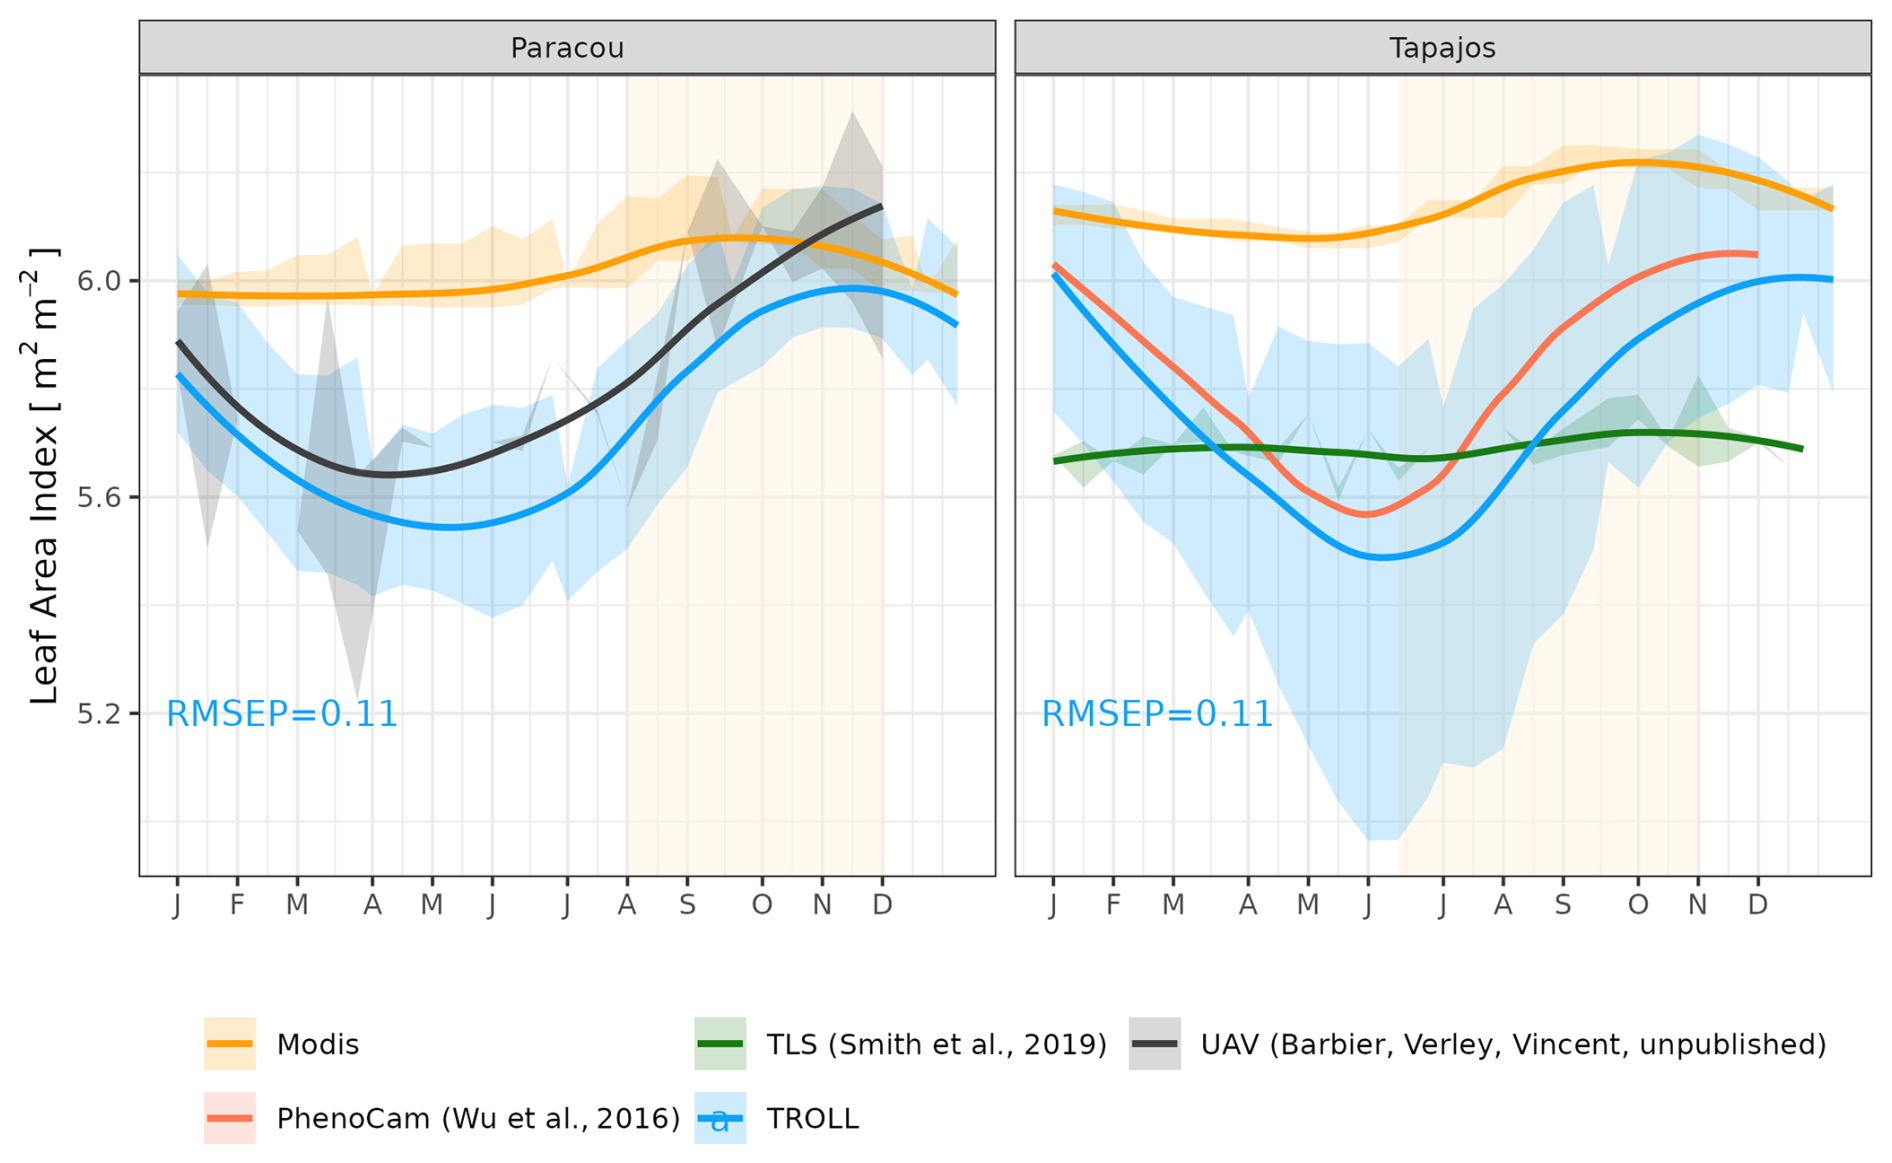
Figure 8Mean annual cycle of leaf area index (LAI) at Paracou and Tapajos, derived from fortnightly means, from different sources (see the Methods section). Bands are the intervals of means across years, and the vertical yellow bands in the background correspond to the site's climatological dry season. Simulated values correspond to 10 years of simulations starting from the end state of 600-year regeneration from bare ground with calibrated parameters at each site.
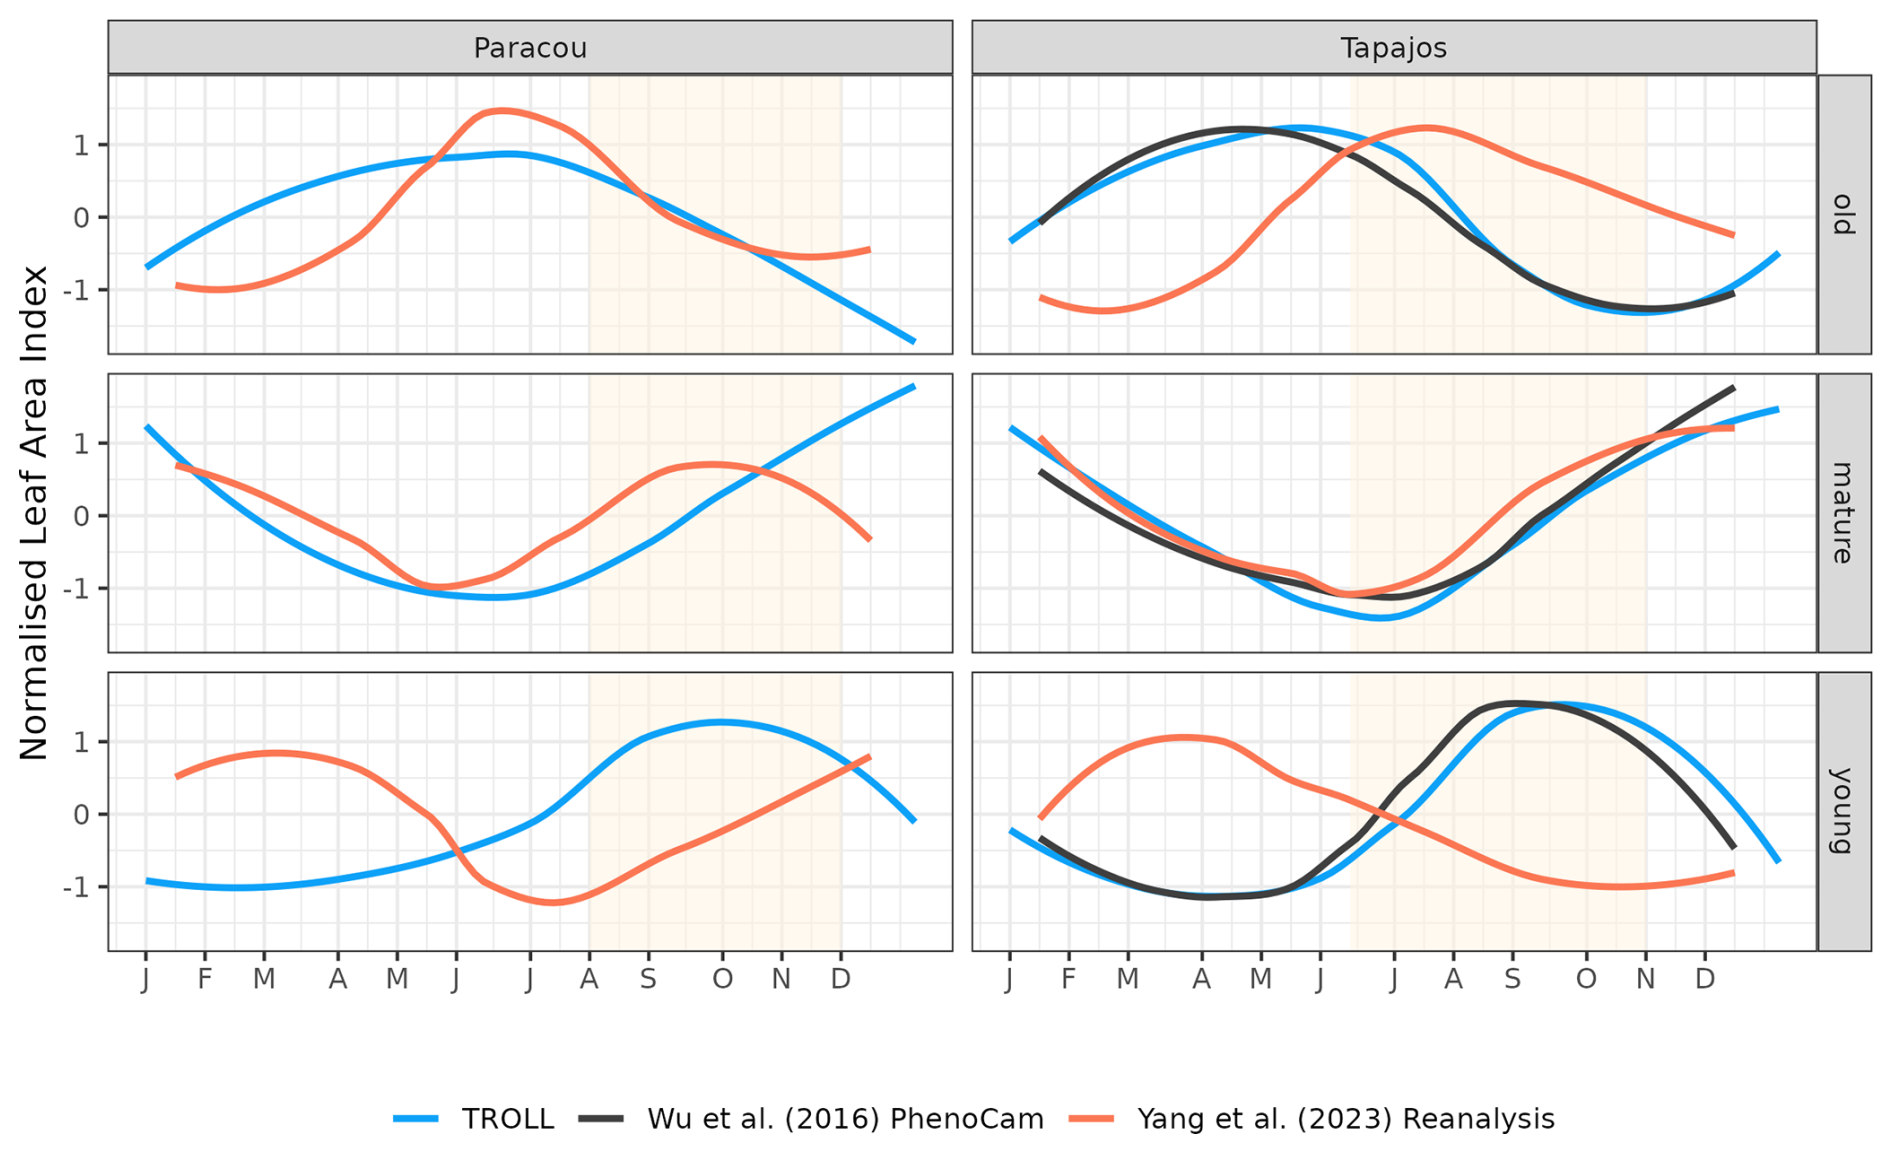
Figure 9Mean annual cycle of normalized leaf area index per leaf age cohort, derived from fortnightly means, at Paracou and Tapajos. Note that the three leaf age cohorts (young, mature, and old leaves) are not defined the same way in the three independent sources. Leaf age per cohort depends on the individual leaf lifespan in TROLL 4.0 (see Maréchaux et al., 2025), while the transitions from young to mature and mature to old are respectively fixed to 1.71 and 5.14 months in Yang et al. (2023) and fitted to 1 and 3 months in Wu et al. (2016). The vertical yellow bands in the background correspond to the site's climatological dry season. See Fig. A6 for absolute variation per cohort, site, and dataset. Simulated values correspond to 10 years of simulations starting from the end state of 600-year regeneration from bare ground with calibrated parameters at each site.
3.3 Water and carbon fluxes
TROLL 4.0 captured the seasonality of gross primary productivity (GPP) observed at the two sites, with an increase before the onset of the dry season, reaching its maximum during the dry season, and a decrease starting before or at the onset of the wet season (Fig. 10 and see Fig. A7 for interannual variations, Table S2). Comparisons of eddy flux estimates with simulations showed high correlation at both Paracou (CC = 0.60) and Tapajos (CC = 0.46). TROLL 4.0 overestimated GPP at both sites, particularly during the dry season, with an RMSEP of 0.75 and 1.12 kgC m−2 yr−1 when compared with both eddy flux and TROPOMI SIF estimates at Paracou and Tapajos, respectively.
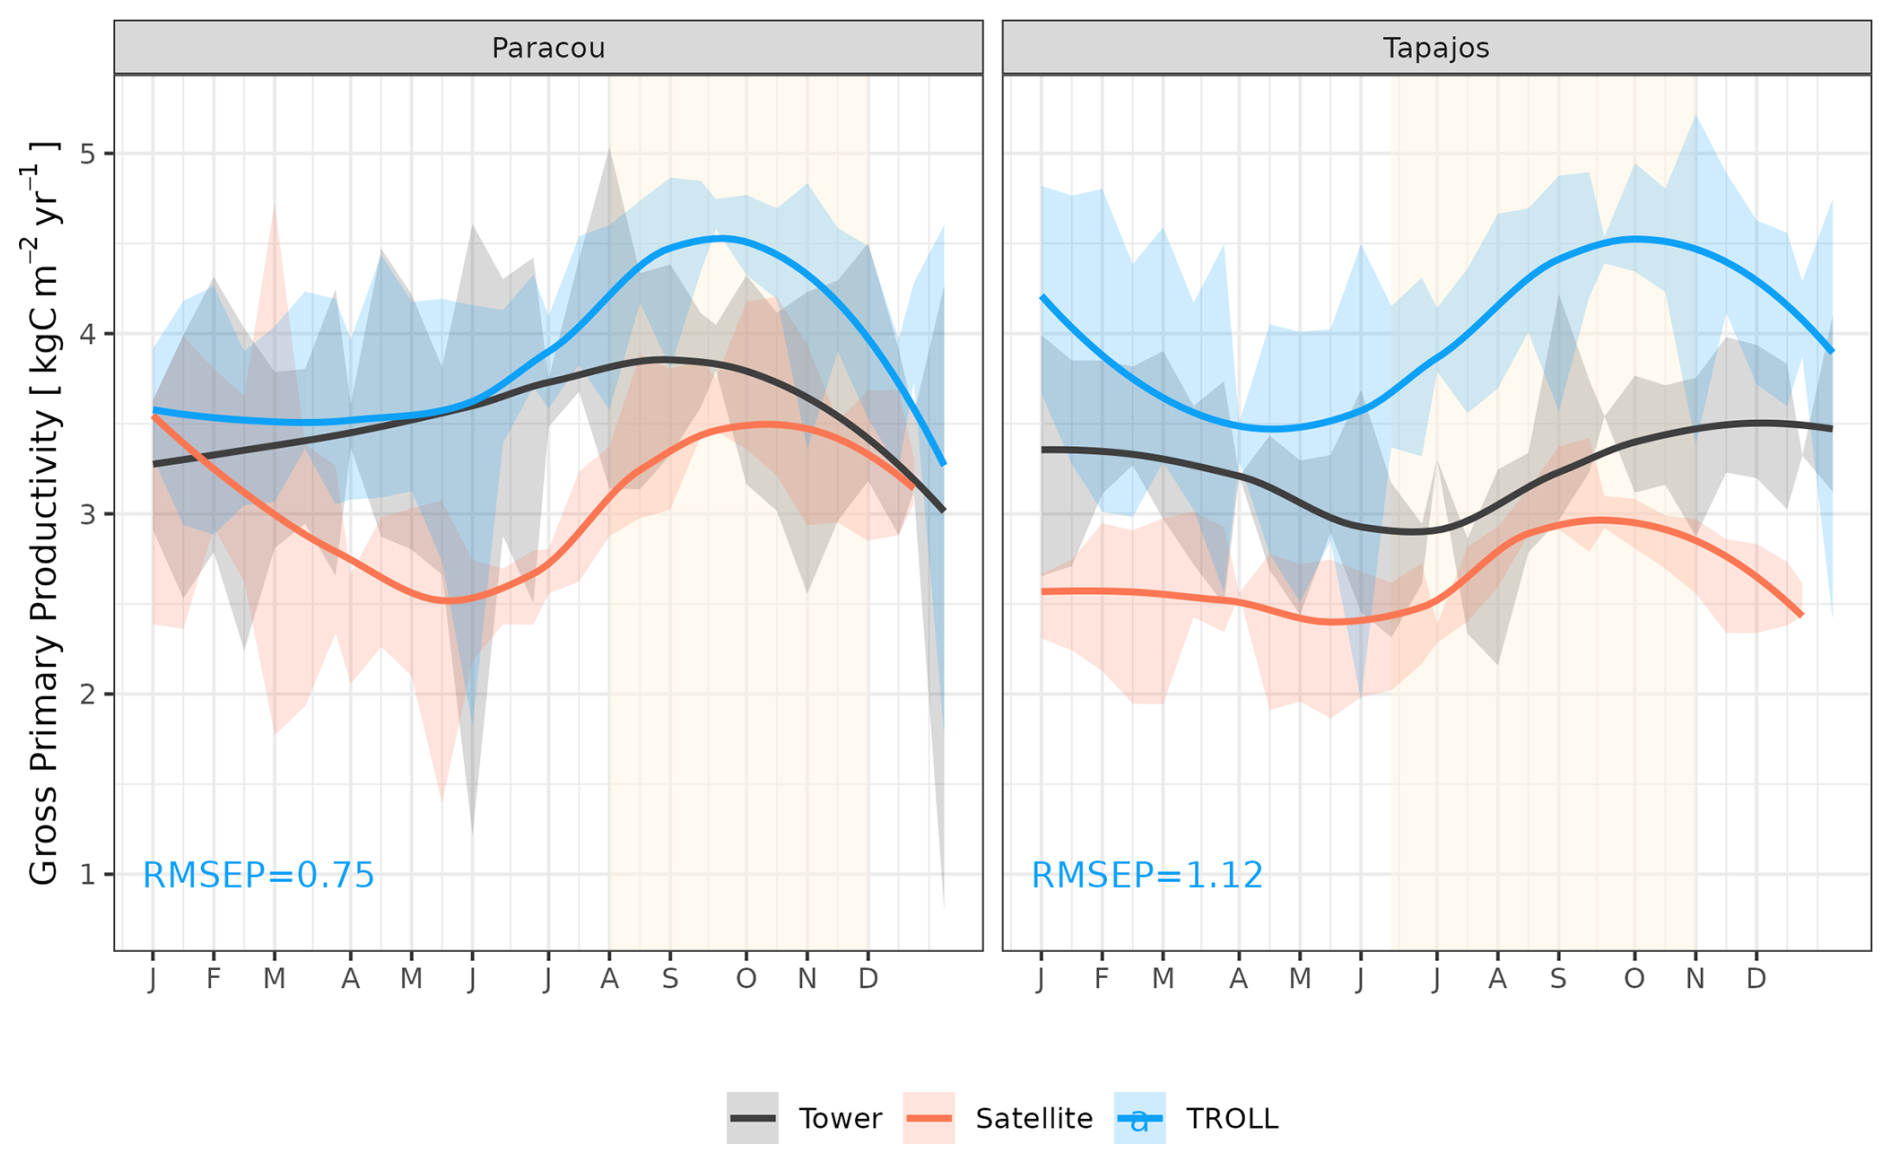
Figure 10Mean annual cycle of gross primary productivity for Paracou and Tapajos, derived from fortnightly means. The red lines represent the gross primary productivity estimated from TROPOMI SIF, while the black lines represent the one derived from eddy flux measurements, and the blue lines the simulated gross primary productivity with TROLL 4.0. Bands are the intervals of means across 10 years, and the vertical yellow bands in the background correspond to the site's climatological dry season. Simulated values correspond to 10 years of simulations starting from the end state of 600-year regeneration from bare ground with calibrated parameters at each site. Interannual variations are shown in Fig. A7.
The seasonality of water flux was captured by TROLL 4.0 (Fig. 11 and see Fig. A8 for interannual variations, Table S2), with a pronounced increase in evapotranspiration (ET) during the dry season at both sites, leading to CC of 0.66 and 0.70 when compared with eddy flux estimates at Tapajos and Paracou, respectively. Although intra-annual variations of simulated and observed values overlapped, TROLL 4.0 tended to overestimate ET in Tapajos during the dry season, leading to RMSEP values of 0.60 and 0.75 mm d−1 when compared with eddy flux estimates at Paracou and Tapajos, respectively. The partitioning of evapotranspiration between canopy evaporation, soil evaporation, and tree transpiration (Fig. A9) showed that most of the evapotranspiration is due to tree transpiration in the dry season, while canopy evaporation is an important part of the total evapotranspiration in the wet season (Kunert et al., 2017). TROLL 4.0 also captured the seasonality in RSWC of the topsoil layer at Paracou and Tapajos (Fig. A10, Table A2; see Fig. A11 for absolute variation with varying depth), with a high RSWC in the wet season close to 100 % and a sharp decrease in RSWC in the dry season, although it is overall smoother in simulations than field estimates.
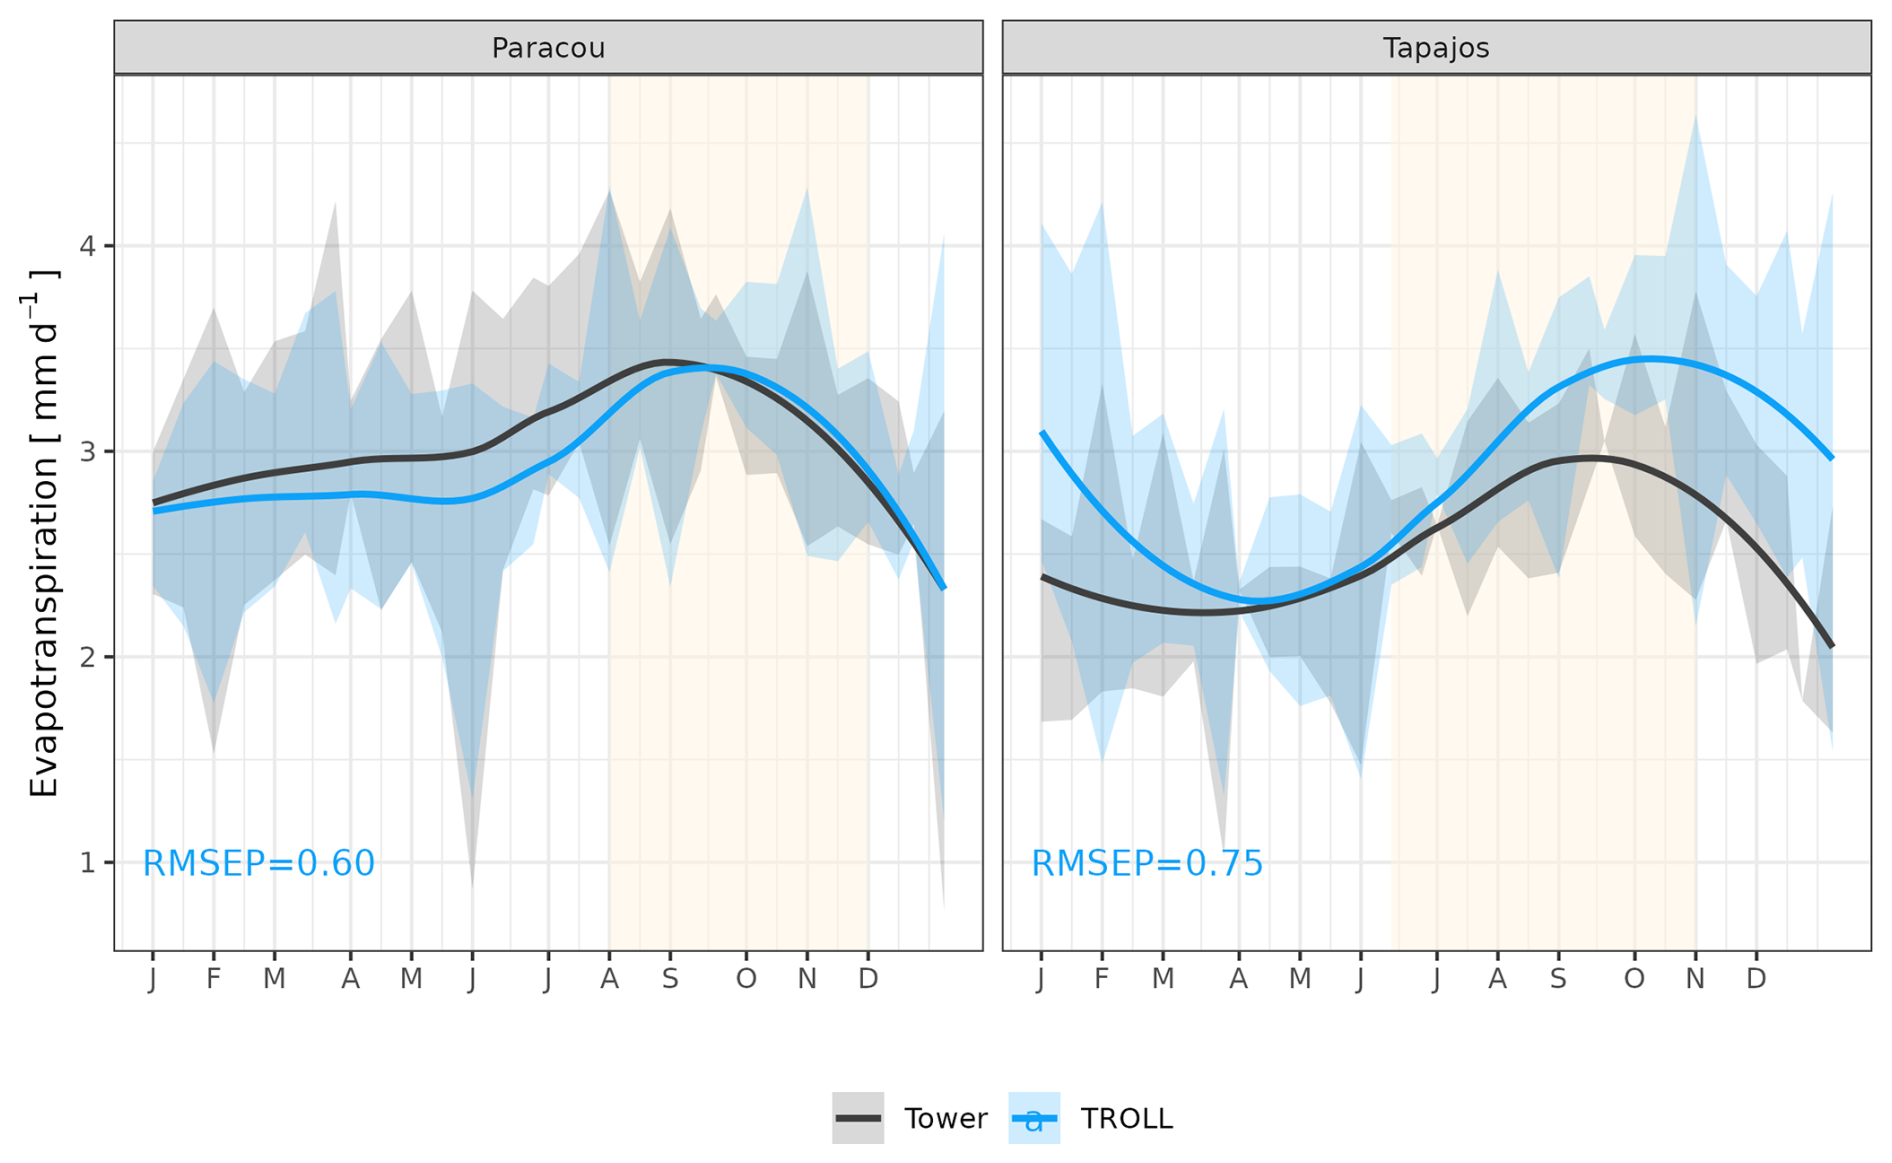
Figure 11Mean annual cycle of evapotranspiration for Paracou and Tapajos, derived from fortnightly means. The black lines represent the evapotranspiration derived from eddy flux measurements and the blue lines the evapotranspiration simulated with TROLL 4.0. Bands are the intervals of means across years, and the yellow vertical bands in the background correspond to the site's climatological dry season. Simulated values correspond to 10 years of simulations starting from the end state of 600-year regeneration from bare ground with calibrated parameters at each site. Interannual variations are shown in Fig. A8.
Both eddy-flux-derived and simulated GPP showed a positive logarithmic relationship with cumulative incoming PAR and maximum VPD, as well as a positive linear relationship with mean temperature at daily scale (Fig. 12). Similarly, controlling for absorbed light, both eddy-flux-derived and simulated LUE showed a negative logarithmic relationship with maximum VPD and a negative linear relationship with mean temperature at daily scale (Fig. A12). Limitations of LUE at high VPD and T values were, however, lower in simulations than in eddy-flux- or SIF-derived estimates. TROLL 4.0 predicted a higher PAR conversion to carbon under high-irradiance, high-VPD, and high-temperature conditions when compared to eddy flux estimates, consistent with the higher dry-season GPP in simulations (Fig. 10). Responses of SIF-derived GPP to climatic variables were weak in comparison to simulated and eddy-flux-derived GPP. Simulated ET was positively correlated with maximum VPD, cumulative PAR, and mean temperature, similarly to eddy-flux-derived ET (Fig. 13). At Paracou, the relationships between environmental drivers and simulated ET closely aligned with the ones obtained from eddy flux estimates. However, at Tapajos, simulated ET was overestimated under high-irradiance, high-VPD, high-temperature, and windy conditions in comparison to eddy flux estimates. Simulated GPP and ET at both sites were more strongly controlled by environmental variables (higher R2 in Figs. 12–13) than eddy-flux-derived GPP and ET.
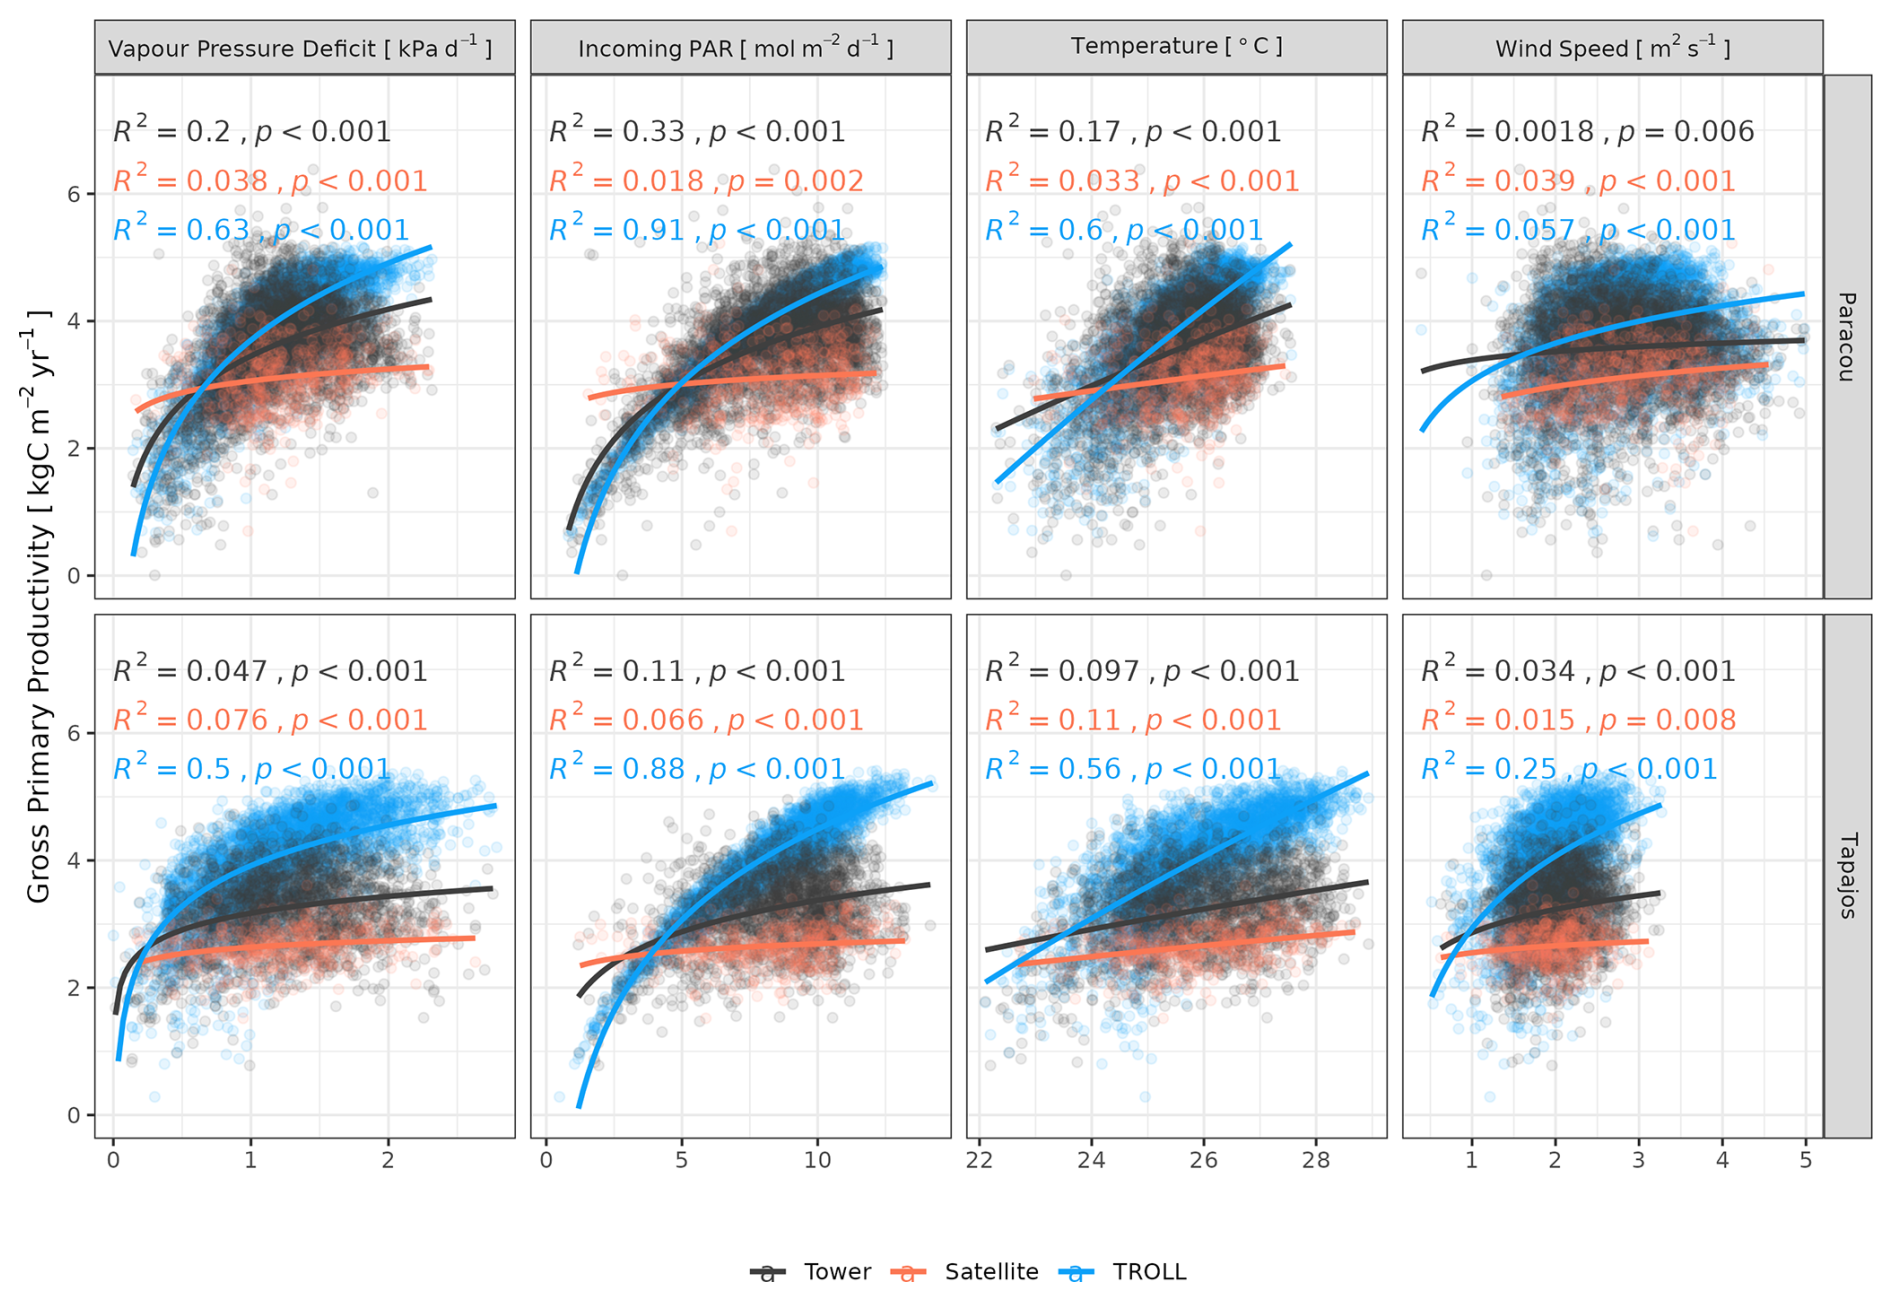
Figure 12Daily averages of gross primary productivity as a function of daily maximum vapour pressure deficit, total incoming photosynthetically active radiation, average temperature, and average wind speed for model-, satellite-, and eddy-flux-based estimates at Paracou (top) and Tapajos (bottom). Lines illustrate the linear regression of the form y ∼ log(x) and text the squared Pearson's correlation coefficient R.
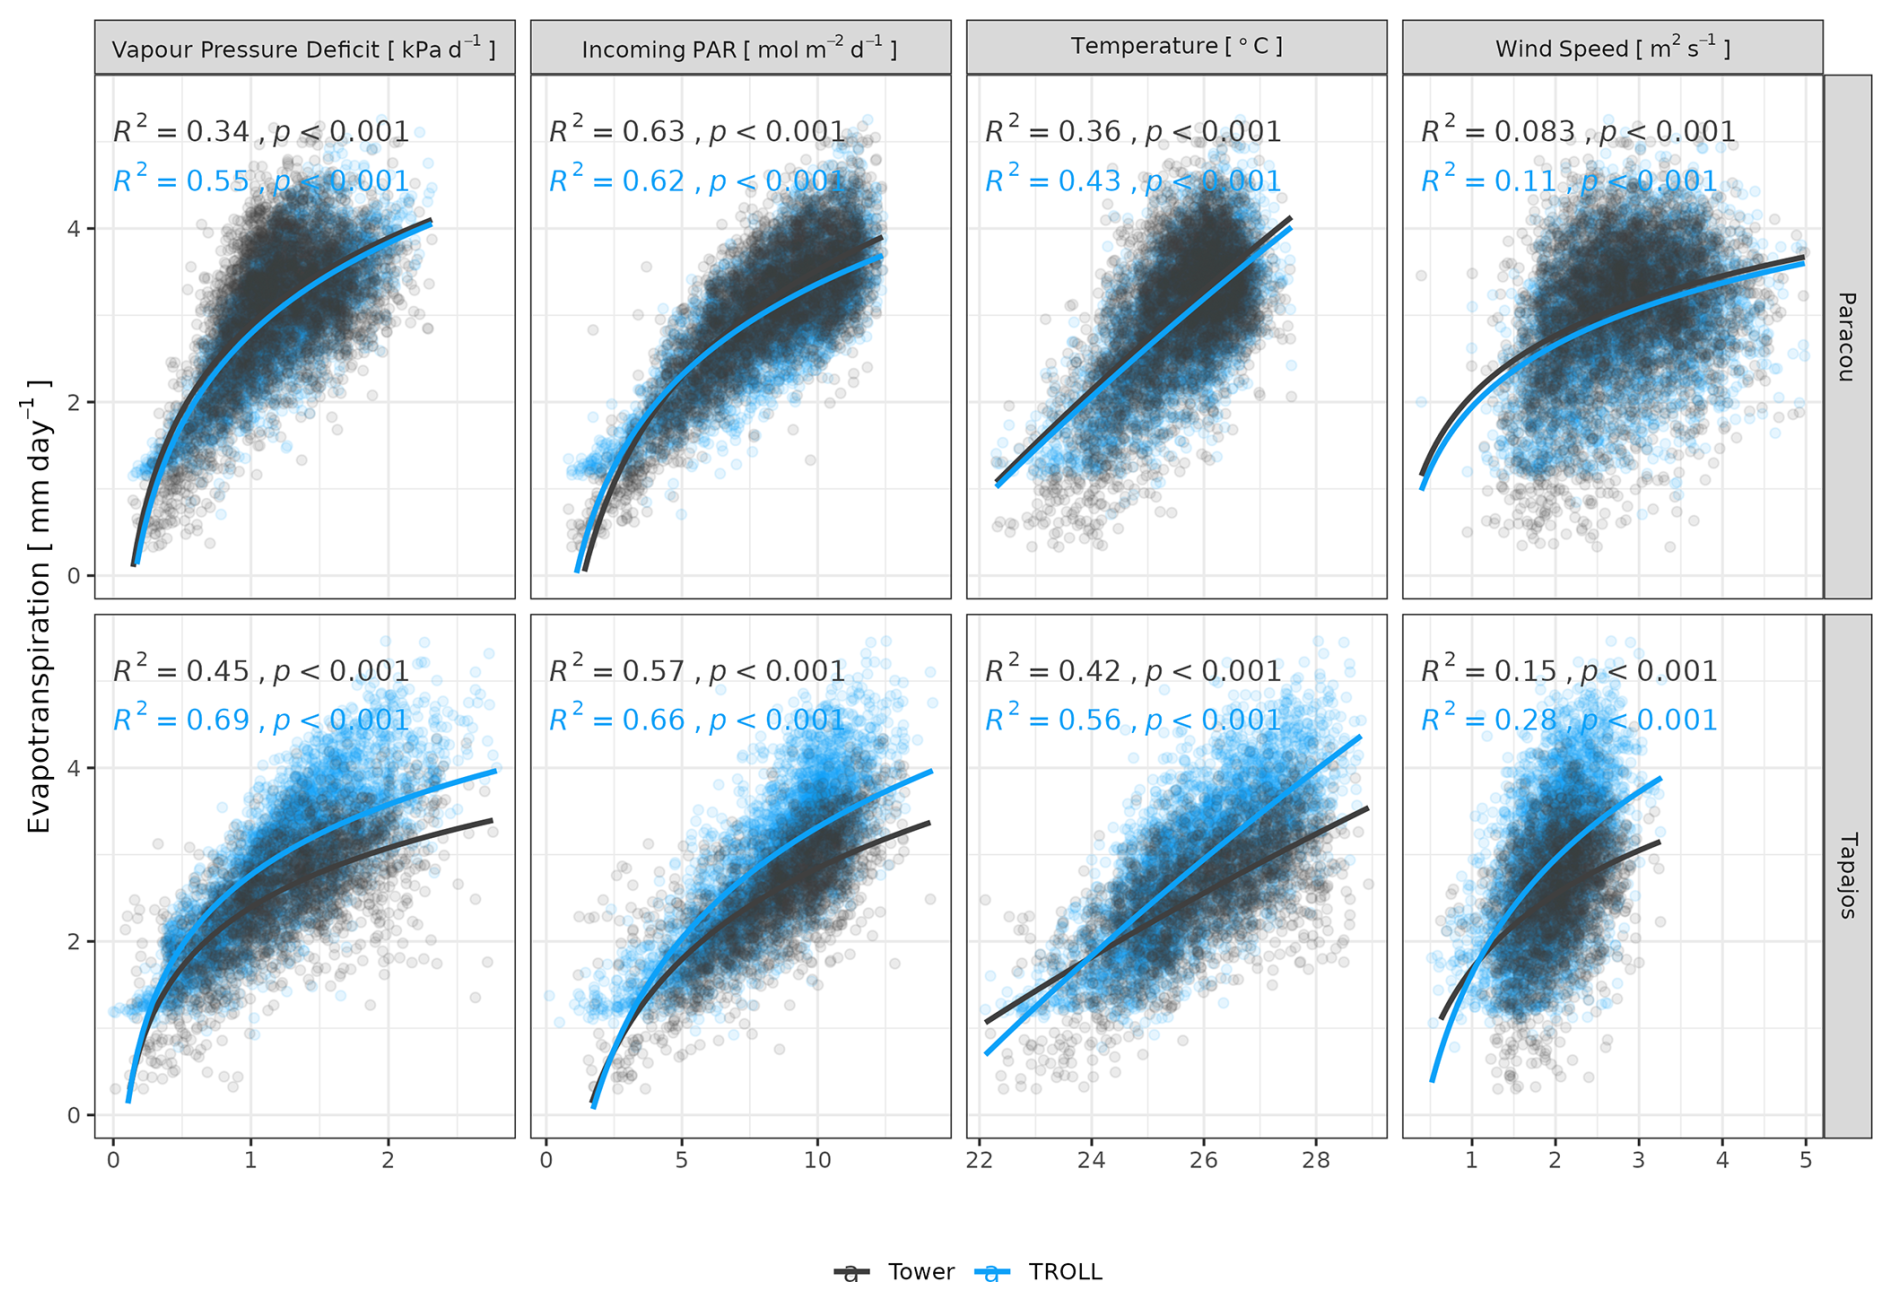
Figure 13Daily total evapotranspiration as a function of daily maximum vapour pressure deficit, total incoming photosynthetically active radiation, average temperature, and average wind speed for model and eddy flux estimates at Paracou and Tapajos. Lines illustrate the linear regression of the form y ∼ log(x) and text the squared Pearson's correlation coefficient R.
Here we tested the performance of TROLL 4.0 in reproducing observed forest structure and diversity, water and carbon fluxes, and leaf dynamics. We conducted a detailed model evaluation for two Amazonian rainforest sites, Paracou and Tapajos, presenting contrasting climate and soil properties. Both sites have been intensively monitored over the past decades, and we compared the model outputs with available data. We now discuss the consistencies and discrepancies between simulated and observed patterns, potential uncertainties in our results, and the advantages and possible improvements of TROLL 4.0.
4.1 Forest structure, composition, and dynamics
TROLL 4.0 was found to jointly simulate realistic forest structure and species composition (Maréchaux and Chave, 2017). The calibration of three global parameters led to a simulated number of stems across size classes and basal area or aboveground biomass in good agreement with observations from forest inventories above 10 cm dbh. Also, aerial lidar data allowed forest structure to be assessed independently of calibration data. This revealed a good ability of TROLL 4.0 to simulate the horizontal and vertical structure of both forests, which is promising for various applications, including biomass estimation (Knapp et al., 2018). Similarly, the multiple inventories at Paracou from 2003 to 2013 revealed a good ability of TROLL 4.0 to simulate forest dynamics with both a bell-shaped growth–size relationship and tree mortality. Comparing the different sources of mortality with tree size between observations and simulations would be useful to assess the representation of mortality processes, although documenting mortality sources is often challenging (McDowell et al., 2018). Understorey inventories at Paracou also allowed us to independently evaluate TROLL 4.0's ability to simulate tree community structure in the 1 to 10 cm tree diameter range. TROLL 4.0 simulated the distribution of smaller trees reasonably well, although it underestimated individuals from the smallest cohorts. This underestimation of the density of small trees may be partly explained by the fact that the 1 m resolution of the voxel grid used in TROLL 4.0 only allows for one tree per square metre of ground, whereas smaller trees may be squeezed into certain areas of the understorey. However the number of simulated small stems remains lower than the maximum potential number in simulations. Another explanation could be a lack of light heterogeneity and associated trait variation in the understorey in simulations in comparison with observations (Montgomery and Chazdon, 2001), thus limiting the opportunities for recruitment and survival of small stems. Explorations of simulated micro-environmental variations within the canopy (de Frenne et al., 2019) and inclusion of trait ontogenetic shifts (Fortunel et al., 2020) and trait plasticity (Xu et al., 2017; Lamour et al., 2023) could further help us understand and improve TROLL's ability to simulate forest structure and composition in the understorey.
TROLL 4.0 attributes individual trees to botanical species, and it permits tree functional traits to vary within species. It thus provides a finer-grained description of biodiversity compared to models based on plant functional types (e.g. Longo et al., 2018) and uses a description matching the one of ecologists, in contrast with taxonomy-free continuous trait spectrum approaches (e.g. Sakschewski et al., 2015). The simulated species composition presented the classically observed L-shaped profile of species rank abundance distribution in the two sites, but with an overestimated species evenness, resulting in under-abundant dominant species and over-abundant rare species, as already observed in previous versions of the model (Maréchaux and Chave, 2017). Several simulation factors could have resulted in the overestimation of species evenness. The species trait values were extracted from global databases and partially imputed and may therefore not represent the true trait values for the region concerned, which could affect the behaviour of individual species in the model. However, as this noise is random, it seems unlikely that the global values and imputation led to the skewed species abundance. More likely, the simulations used an external seed rain representing immigration from a continuous forest matrix. We implemented a homogeneous seed rain, in which all species are equally abundant, as a conservative test of the model's ability to represent community assembly. Here, the simulated composition after regeneration from bare ground is determined by species traits and their simulated effect on demographic processes and species fitness rather than prescribed differences in seed rain. However, this homogeneous, and therefore unrealistic, seed rain maintains diversity in the simulated forest with a rescue effect and can dampen species dominance by promoting less dominant species through high immigration. The effects of the representation of seed production, dispersal, and recruitment on simulated communities should be further explored in the future, especially for projections under disturbance scenarios where forest regeneration is key (Díaz-Yáñez et al., 2024; Hanbury-Brown et al., 2022).
TROLL 4.0 also explicitly simulates forest functional diversity in the community. Simulated functional trait distributions matched the observed distributions well at both sites, as already observed in previous versions of the model (Maréchaux and Chave, 2017). In Paracou, the main discrepancies were the lack of individuals with high LMA (between 120 and 150 g m−2), low wood specific gravity (below 0.4 g cm−3), and/or high leaf area (above 100 cm2). In contrast, in Tapajos, the model tended to simulate lower LMA and less negative turgor loss points on average. Since trait combinations are structured at the species level, and trait integration is high-dimensional in tropical forests, with decoupled leaf and wood economic spectra (Baraloto et al., 2010a) and weak associations between leaf turgor loss point and other leaf traits (Maréchaux et al., 2019), these discrepancies can be more easily interpreted at Paracou where the trait distributions are built on species-level (and not genus-level) information. Regarding the lack of high-LMA individuals, TROLL 4.0 underestimated the abundance of common species such as Lecythis persistens and Licania alba, which present high LMA. These species come from genera that are hyperdominant across the Amazon basin (ter Steege et al., 2013) but may be underrepresented in the simulations due to the overestimation of species evenness in TROLL 4.0 as discussed above. The lack of light-wood and high-leaf-area individuals can be related to the underestimated abundances of light-demanding and pioneer species with fast growth (Chave et al., 2010), such as the ones of the genus Cecropia. These species are known to quickly colonize forest gaps under high-light conditions, thanks to fast carbon assimilation and growth and the dispersal of a high number of small, potentially dormant, seeds, leading to an omnipresence of these species in the forest seed bank (Holthuijzen and Boerboom, 1982; Alvarez-Buylla and Martínez-Ramos, 1990). In TROLL 4.0, the seed-size-mediated tolerance–fecundity trade-off (Muller-Landau et al., 2010) is assumed to be perfectly equalizing, and all species present in the local seed bank and able to thrive under the local light availability have the same probability of being recruited per seed. However, this assumption likely disadvantages gap-affiliated species with a colonization strategy and could easily be revisited in future model developments.
4.2 Leaf phenology
We calibrated and evaluated the new phenology module of TROLL 4.0. The calibration of the three module parameters (aT,o, bT,o, and δo), which together control the variation of old-leaf fall under drying conditions, was conducted using litterfall trap data. This resulted in a realistic litterfall seasonality with a peak during the dry season as already documented (Manoli et al., 2018; Chave et al., 2010; Van Langenhove et al., 2020). Interestingly, the calibration resulted in the same values for two parameters at the two sites (aT,o, bT,o) and close values for the third one (δo) to which the simulated litterfall pattern is less sensitive (Fig. A5). At both sites, simulations with the mean value of the third parameter resulted in similar evaluations (not shown). This suggests a good transferability of the phenology module across sites without the need for site-specific calibration, although this remains to be further tested at additional sites and in contrasting conditions (e.g. Restrepo-Coupe et al., 2016). A faster shedding of old leaves was assumed to depend on soil water potential in the root zone rather than soil water content, on individual leaf water potential at turgor loss point, and on tree size. These are biologically reasonable hypotheses and this supports a good generality of the module. However, the current implementation of leaf dynamics in TROLL 4.0 leads to an underestimation of the flux of litterfall in wet and dry seasons and, as a result, of total annual litterfall at both sites. In TROLL 4.0, leaf lifespan was parameterized based on an empirical relationships with leaf structure (leaf mass per area; Maréchaux et al., 2025). Previous relationships provided in the literature (Reich et al., 1991, 1998; Wright et al., 2004) provided contrasting leaf lifespan estimates, with the one implemented in TROLL 4.0 providing estimates among the highest values, calling for a more in-depth exploration of the reliability and transferability of these empirical relationships. Alternative representations, such as the ones based on optimality principles (Kikuzawa 1991; Franklin et al., 2020; Manzoni et al., 2015), and their combination with the environmentally driven old-leaf shedding acceleration implemented in the new module could be explored in the future.
The evaluation of leaf area index (LAI) and its dynamics was difficult due to the number of products that yield inconsistent time series. Remotely sensed MODIS LAI showed a very small seasonal variation with a slight increase in LAI starting at the beginning of the dry season at both sites. However, MODIS LAI data products are known to be susceptible to the uncertainty affecting the bidirectional reflectance and to saturate at high LAI values (Petri and Galvão, 2019). Local measurements of LAI through UAV-borne lidar in Paracou showed a stronger increase in total LAI of 0.5 m2 m−2 starting at the beginning of the dry season, leading to a maximum in the dry season. This pattern of variation was in strong agreement with that simulated for LAI by TROLL 4.0. Similarly, local measurements of top canopy LAI derived from phenological cameras in Tapajos (Wu et al., 2016) also showed a high increase in total LAI in the dry season, above 0.5 m2 m−2, also in good agreement with the seasonal LAI variation simulated by TROLL 4.0 at that site. By contrast, the LAI derived from terrestrial vertical lidar in Tapajos showed almost no variations (Smith et al., 2019), and such differences with both the patterns derived from phenological cameras and simulations need to be further scrutinized. Among potential explanations, LAI from TLS in Tapajos was adjusted to the annual mean of 5.7 (Stark et al., 2012), leading to lower absolute variations than what was obtained elsewhere, and used coarse spatial and temporal resolutions over small spatial and temporal extents (see the Methods section). The discrepancy with simulated patterns could also be linked to uncertainties in LAI variations in the understorey in our simulations. Recent studies have suggested opposite variations in LAI between the canopy and the understorey (Nunes et al., 2022), which should be further explored with TROLL 4.0. Overall, while obtaining a robust estimate of LAI temporal variation in tropical forests remains a challenge (Vincent et al., 2023; Bai et al., 2024), the relative variation of LAI simulated by TROLL 4.0 matched the most reliable products at each site, providing an encouraging assessment of this model's ability. Importantly, while total LAI variation remains limited on average within a year in tropical rainforests, this hides important turnover across leaf ages and species, and to ensure robust predictions models should endeavour to represent such turnover and its underlying processes (Wu et al., 2017a).
The dry-season increase in total LAI simulated in TROLL 4.0 corresponds to a rejuvenation of the canopy leaf cover associated with a decrease in the LAI of old leaves at the beginning of the dry season, directly followed by an increase in the LAI of young leaves during the dry season. This turnover is in very good agreement with the one captured by phenological cameras at Tapajos (Wu et al., 2016) and documented in other studies (Yang et al., 2021; Doughty and Goulden, 2008), while the SIF-derived young-LAI pattern (Yang et al., 2023) showed an opposite pattern at this site. The main difference in simulated cohorts between the two sites is the continuous dominance of old LAI in Tapajos, while mature leaves dominated at the end of the dry season in Paracou. This dominance of older (and less efficient) leaves in Tapajos simulations may be linked to the underestimated litterfall flux and soil water depletion during the dry season at this site. However, the relative proportion of leaf area across the different leaf age pools within and across datasets strongly depends on the definition of the leaf age pools themselves. These pools depend on the individual leaf lifespan in TROLL 4.0 (see Sect. 2.6.2 in Maréchaux et al., 2025), while the transitions from young to mature and mature to old are respectively fixed to 1.71 and 5.14 months in Yang et al. (2023) and fitted to 1 and 3 months in Wu et al. (2016). These contrasting approaches may explain the higher relative importance of old leaves in Wu et al. (2016) compared to Yang et al. (2023) and the intermediate values of TROLL 4.0 (Fig. 9). The seasonal dynamics of leaf cohorts remain poorly known in tropical forests and additional high-resolution optical imagery, e.g. by drones or phenological cameras, would be extremely useful to better document these patterns.
4.3 Water and carbon fluxes
At Tapajos, DGVMs simulated opposite seasonal trends in carbon and water fluxes compared to the observed ones (e.g. Fig. 1 in Chen et al., 2020; Fig. 5 in Longo et al., 2019b; Fig. 3 in Restrepo-Coupe et al., 2016). In contrast, TROLL 4.0 showed a good ability to represent the dynamics of both carbon and water fluxes estimated with eddy covariance data. In particular, TROLL 4.0 captures the dry-season increase in gross primary productivity (GPP) and evapotranspiration (ET) documented for light-limited forests (Guan et al., 2017; Wagner et al., 2016; Aguilos et al., 2018). Simulated GPP and ET also presented realistic daily responses to environmental drivers, namely vapour pressure deficit (VPD), temperature, incident radiation, and wind speed in both direction and relative magnitude.
However, at Tapajos, we found that TROLL 4.0 overestimated ET during the dry season in comparison to eddy-flux-derived ET values under high irradiance, high VPD, and high temperature. Simulated ET consists of tree transpiration summed over simulated individuals, water evaporation from the topsoil layer, and the direct evaporation of the rainfall intercepted by the canopy (Kunert et al., 2017). TROLL 4.0 may underestimate the stomatal control of transpiration during the dry season at Tapajos. Accordingly, the control of ET by atmospheric conditions in Tapajos was overestimated in simulated data in comparison to observations, suggesting a stronger coupling of vegetation and the atmosphere at that site than simulated (De Kauwe et al., 2017). Underestimation of stomatal control can result from the representation of stomatal conductance and its responses to atmospheric dryness and soil water availability. In particular, the use of daily leaf pre-dawn water potential to control leaf-level gas exchange, and not hourly variation of leaf water water potential (see Eqs. 39 and 40 in Maréchaux et al., 2025), can explain the overestimated ecosystem-level fluxes during the dry season. More generally, leaf- to ecosystem-level fluxes are active areas of research and alternative representations could be considered in the future as availability of data increases (Wolf et al., 2016; Anderegg et al., 2018; Sabot et al., 2019; Lamour et al., 2022; see Sects. 2.5.2 and 2.5.3 and 4.1, and Appendix B in Maréchaux et al., 2025). Alternatively and/or concurrently, during the dry season, a lack of stomatal control can be due to an overestimation of soil water availability in the model. Soil water content dynamics depend on both the soil depth (Fig. A11) and the soil hydraulic properties. The two sites are known to present heterogeneity in soil properties, but here we performed simulations with homogenous soil properties, both horizontally and vertically. For instance, in Paracou, the topsoil layer is sandier than the 15–30 cm layer (Van Langenhove et al., 2021). Although TROLL 4.0 quantitatively captures the soil water depletion observed during the dry season, it appears to underestimate this depletion compared to empirical estimates at both sites (Fig. A10). This underestimation occurs in spite of the agreement between simulated and eddy-covariance-derived ET during the dry season in Paracou and of the higher simulated than eddy-covariance-derived ET during the dry season at Tapajos. Testing the model's sensitivity to soil layer thickness and properties will be important to perform prior to forest projections under drier future conditions and model spatial up-scaling (Meunier et al., 2022). For example, simulations with the ED2 model suggested that forest responses to drier conditions at Tapajos strongly depended on soil texture (Longo et al., 2018). Overall, it would be valuable to evaluate the model under drier conditions than the natural climate variation at the two sites we focused on in this study, such as under a throughfall exclusion experiment (Powell et al., 2013; Yao et al., 2022). This would allow us to tease out potential model limitations and further test its forecasting capacity, and we hope to address this in a future contribution. Finally, the greater disagreement between simulated and eddy-covariance-derived ET at Tapajos than Paracou also calls for an in-depth evaluation of the global reanalysis precipitation data at this site. More generally, the climate of the Amazon is notoriously challenging for models and it is important to further explore climate forcings in vegetation models.
TROLL 4.0 tended to overestimate empirical GPP estimates, particularly during the dry season, in comparison to both eddy-covariance- and SIF-derived GPP. GPP is driven by the photosynthetic activity of the canopy, which depends on multiple processes (Diao et al., 2024; Slot et al., 2024) and further work would be needed to discriminate among them, while accounting for eddy covariance uncertainties (Cui and Chui, 2019). Absorbed light typically has an overriding effect on the variation of GPP across seasons in these light-limited rainforests (Yang et al., 2023; Guan et al., 2015), and simulated GPP is sensitive to the parameters that control light transmission and absorbance (light extinction coefficient, apparent quantum yield; Maréchaux and Chave, 2017). Both are assumed to be fixed and constant in simulations but are known to vary with leaf angle distribution and leaf optical properties, depending on micro-environmental conditions and species (Long et al., 1993; Poorter et al., 1995; Meir et al., 2000; Kitajima et al., 2012). In addition, after removing the effect of absorbed light, simulated GPP showed less limitation to high values of VPD and temperature compared to eddy-flux- or SIF-derived estimates. The response of leaf-level gas exchanges to the joint effect of atmospheric dryness and soil water availability shows no clear consensus across models (Powell et al., 2013; Trugman et al., 2018) and could be underestimated during the dry season in TROLL 4.0 simulations as discussed above for transpiration. Simulated GPP was higher than inferred from eddy covariance data, which was itself higher than GPP inferred from SIF satellite data (Chen et al., 2022). The eddy-covariance-derived GPP was obtained from the net ecosystem exchanges using the nighttime partitioning method (Reichstein et al., 2005). This method was developed for temperate forests with greater temperature variations than tropical forests, which could therefore bias the empirical estimates. In addition, the eddy flux method has long been reported to underestimate CO2 fluxes (Baldocchi, 2003; Gao et al., 2019). Similarly, even though solar-induced fluorescence offers great potential for the evaluation or the calibration of seasonal carbon fluxes in vegetation models, especially as the tropics are underrepresented by eddy flux tower networks (Villarreal et Vargas, 2021), current SIF products should be used with care (Marrs et al., 2020).
Here we evaluated the TROLL 4.0 individual-based forest dynamics model, which is capable of jointly simulating forest structure, diversity, dynamics, and functioning. To this end, we assembled data from forest inventories, eddy flux towers, litterfall traps, UAV-borne and terrestrial lidar, phenological cameras, and satellite products at two Amazonian forest sites and found that TROLL 4.0 was able to realistically simulate the forest structure, composition, and dynamics, water and carbon fluxes, and leaf area dynamics. In using data of different nature and under the control of different processes, we limited the emergence of equifinality issues (Medlyn et al., 2005), suggesting a good transferability and robustness of TROLL 4.0.
Comparison with field inventories and aerial and satellite data confirms TROLL 4.0's ability to realistically simulate the structure, composition, and dynamics of tropical forests, without imposing constraints beyond the species pool and calibrating more than three parameters. Discrepancies between the observed and simulated number of stems in small size classes and the abundance of trait values specific to colonizing species suggest that further developments of regeneration processes are needed, a worthy endeavour in the context of increased disturbance regimes. TROLL 4.0 was further able to simultaneously simulate the seasonality of productivity, evapotranspiration, and leaf area in these two light-limited forests, as opposed to many current DGVMs (Chen et al., 2020; Restrepo-Coupe et al., 2016; Longo et al., 2019b). The model's ability to simulate ecosystem fluxes is further shown by the responses of carbon and water fluxes to environmental drivers, whose direction and relative importance were well aligned with observations at both sites despite contrasting climate and soil properties. Additionally, the dynamics of total leaf area appeared to be realistically partitioned into different leaf pools, as shown by the leaf rejuvenation during the dry season in these systems (Wu et al., 2016; Yang et al., 2021). However, further inspection of the leaf area dynamics across the canopy vertical profile would be useful. Also, the model overestimation of productivity and evapotranspiration during the dry season calls for a more in-depth exploration of the model representation of respiration, plant hydraulics (e.g. stomatal control), and soil hydrology.
Overall, our analyses establish the suitability of TROLL 4.0 for simulating forest structure, diversity, dynamics, and ecosystem functioning in short- and long-term studies of tropical forest dynamics, paving the way for multiple applications (Maréchaux et al., 2021). TROLL 4.0 could thus be used for projections of the effects of climate change on tropical forests and exploration of the effect of biodiversity on forest resilience to these changes (Sakschewski et al., 2015). Similarly, as TROLL 4.0 retains the species-level taxonomic description, it can also help explore the effects of management practices such as timber production, for which half of tropical forests are designated (Blaser and Küchli, 2011). While the development of TROLL 4.0 will continue, in light of knowledge improvement, novel data collection, and identification of uncertainties and discrepancies, we believe it represents a valuable tool for addressing the major challenges tropical forests are currently facing.
Table A1TROLL 4.0 global parameters.
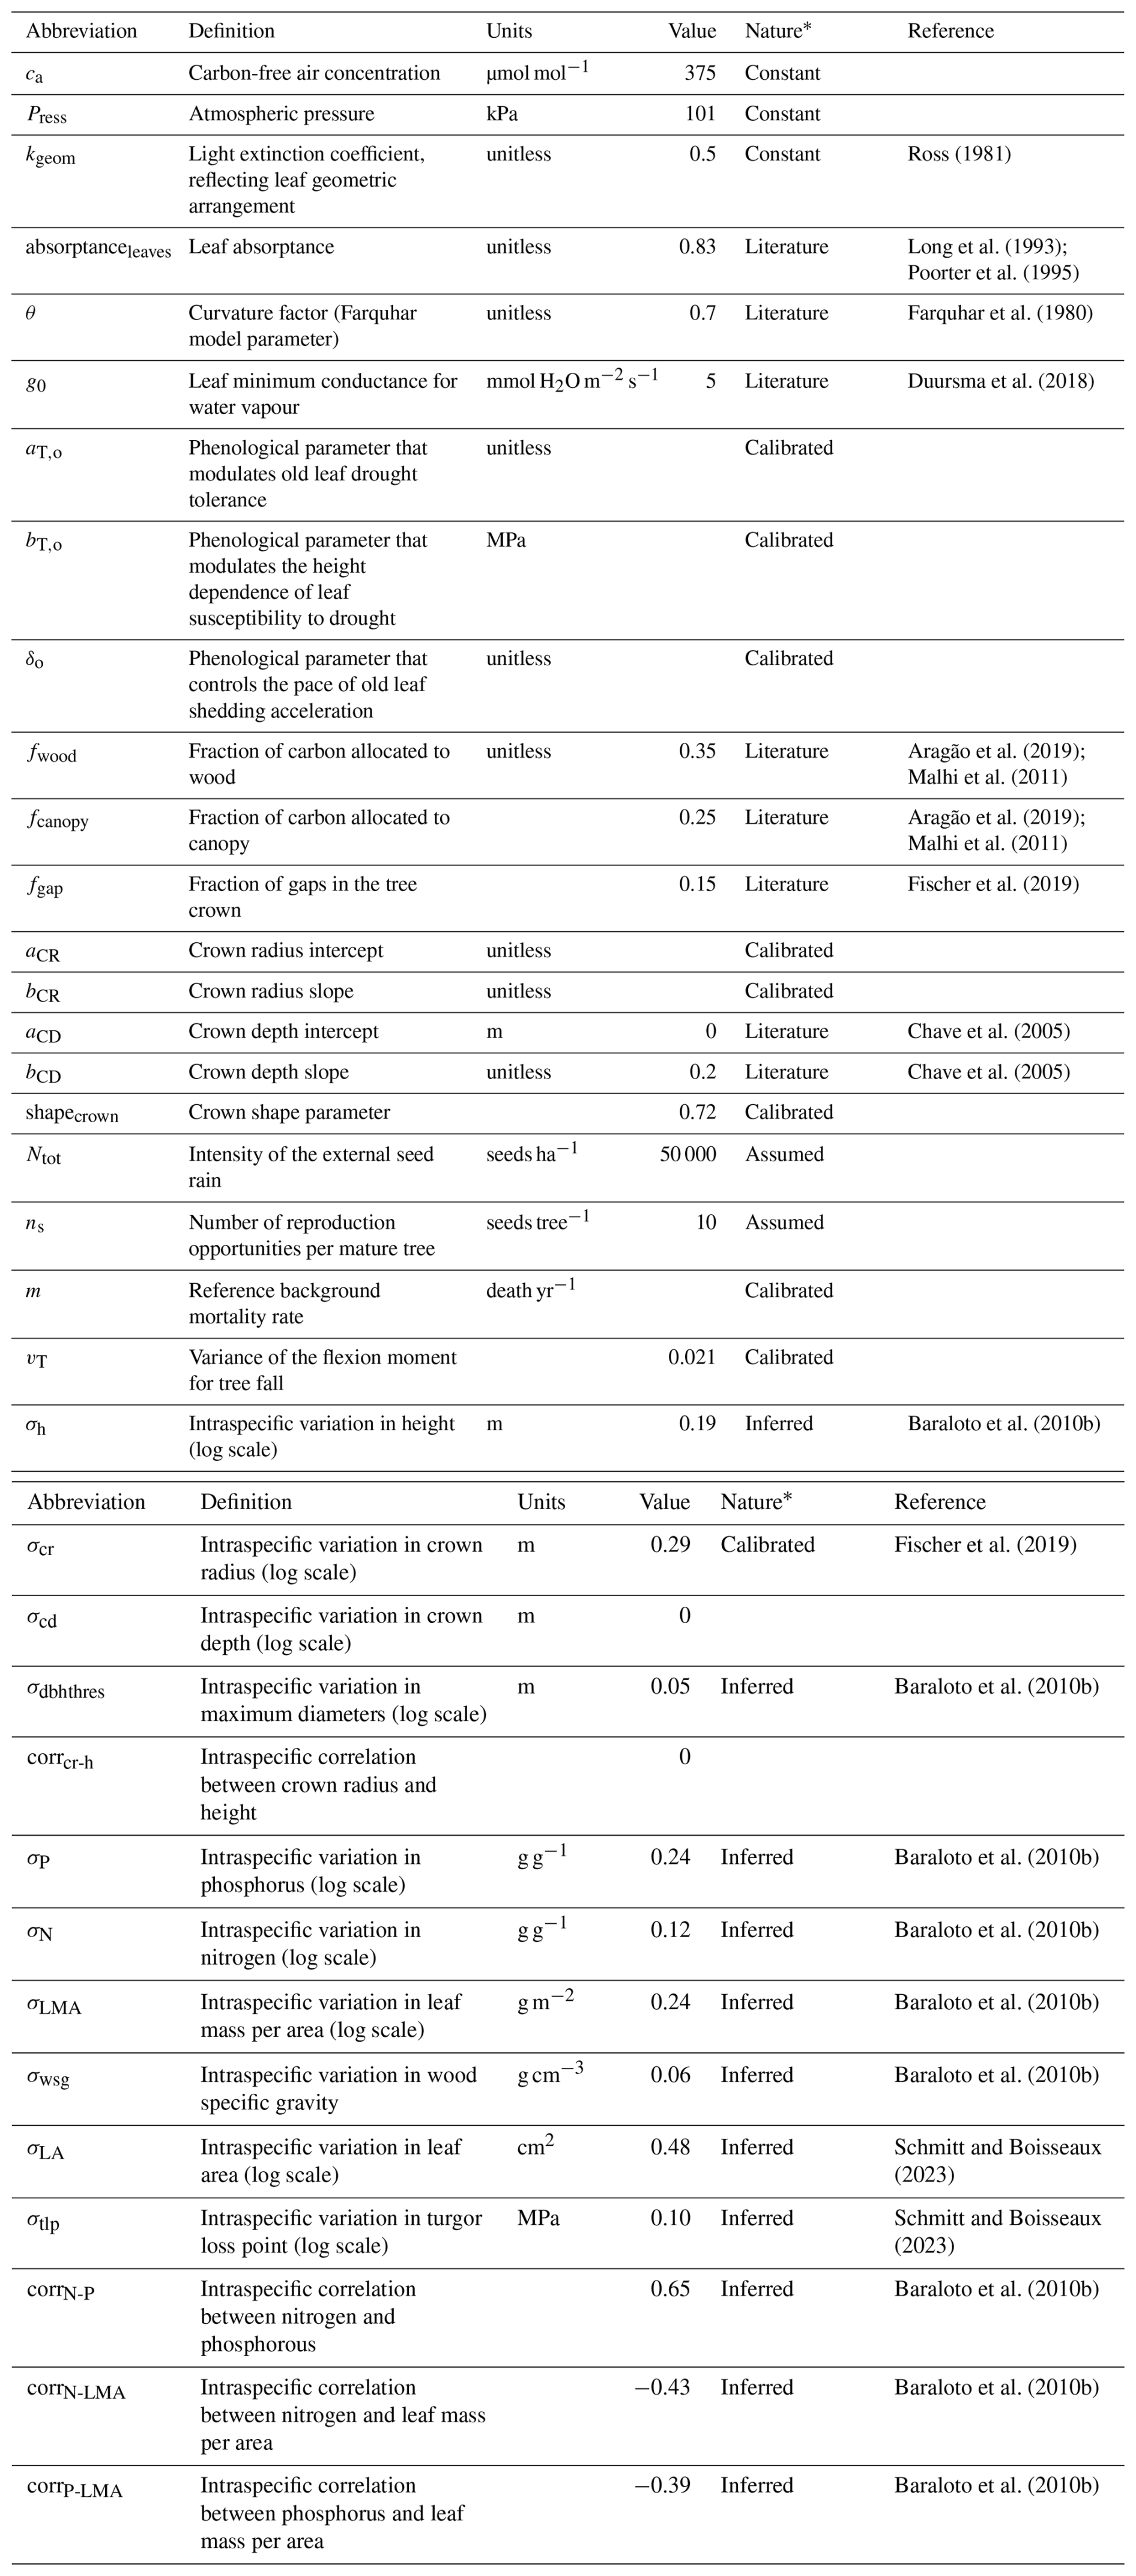
* “Assumed” indicates a value that is supposed; “calibrated” indicates a value that was previously calibrated; “constant” indicates a physical constant; “inferred” indicates a value that has been derived from an existing dataset; “literature” indicates a value prescribed from the literature.
Table A2Evaluation of forest structure, composition, and fluxes explored at Paracou and Tapajos. Evaluations include the goodness of fit R2 from the linear regression with a null intercept, the Pearson's r correlation coefficient (CC), the root mean square error of prediction (RMSEP), and the standard deviation of the error of prediction (SD).
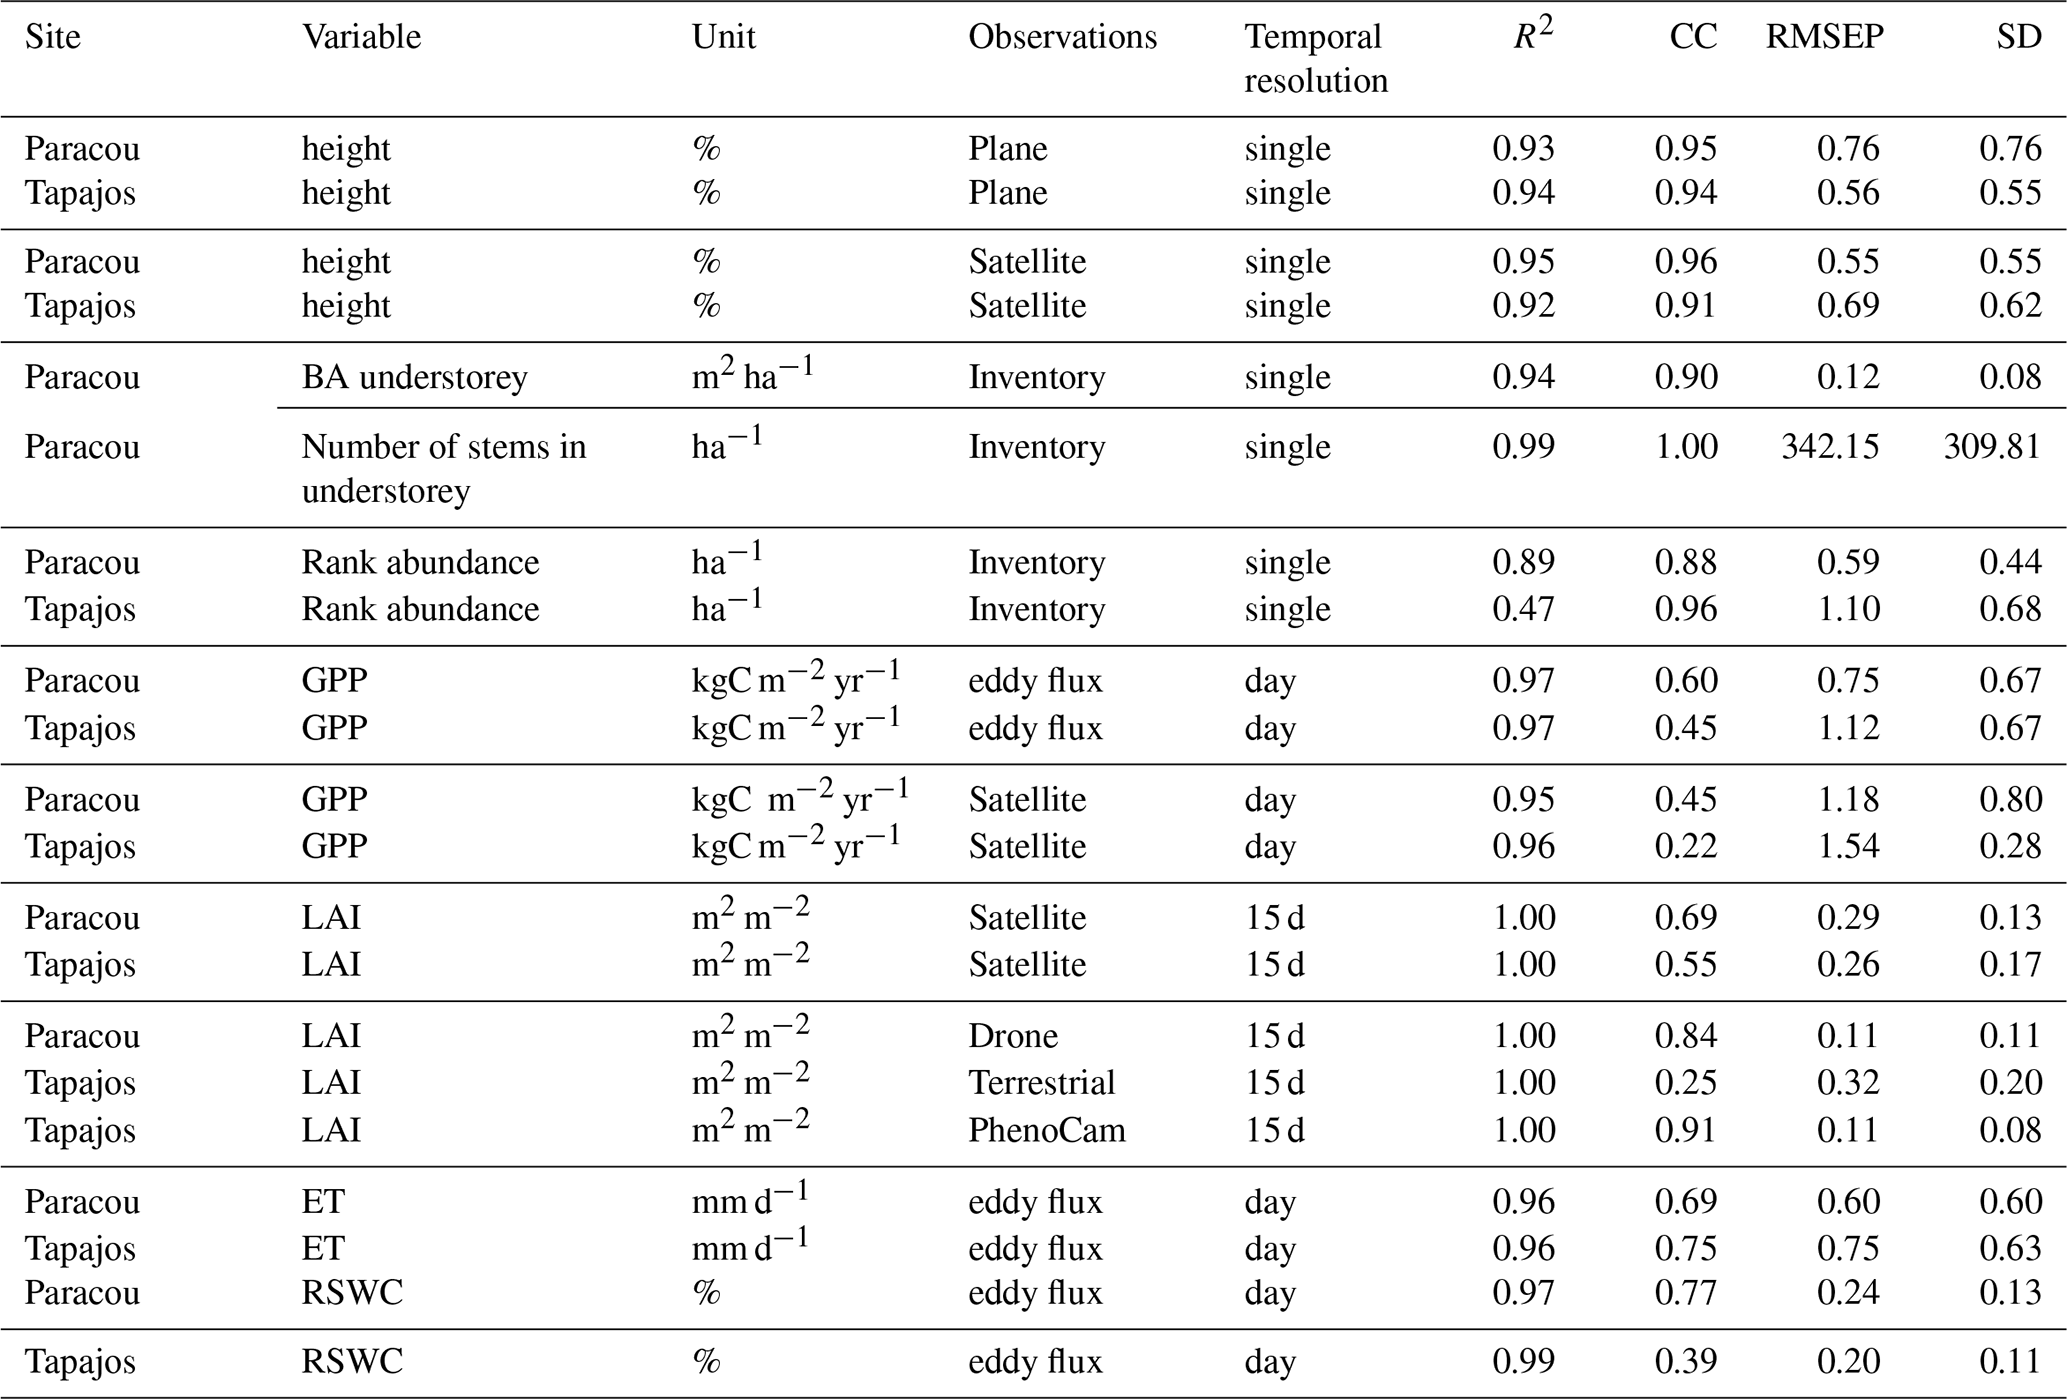
Table A3Comparisons of forest structure and phenology parameter values from the five best fits, including minimum, maximum, and median values, as well as the one of the best fit. Note that the median of the parameter values of the five best fits always equal the value of the best fit, except for m at Paracou with a small difference of 0.0025 and δ0 in both sites.
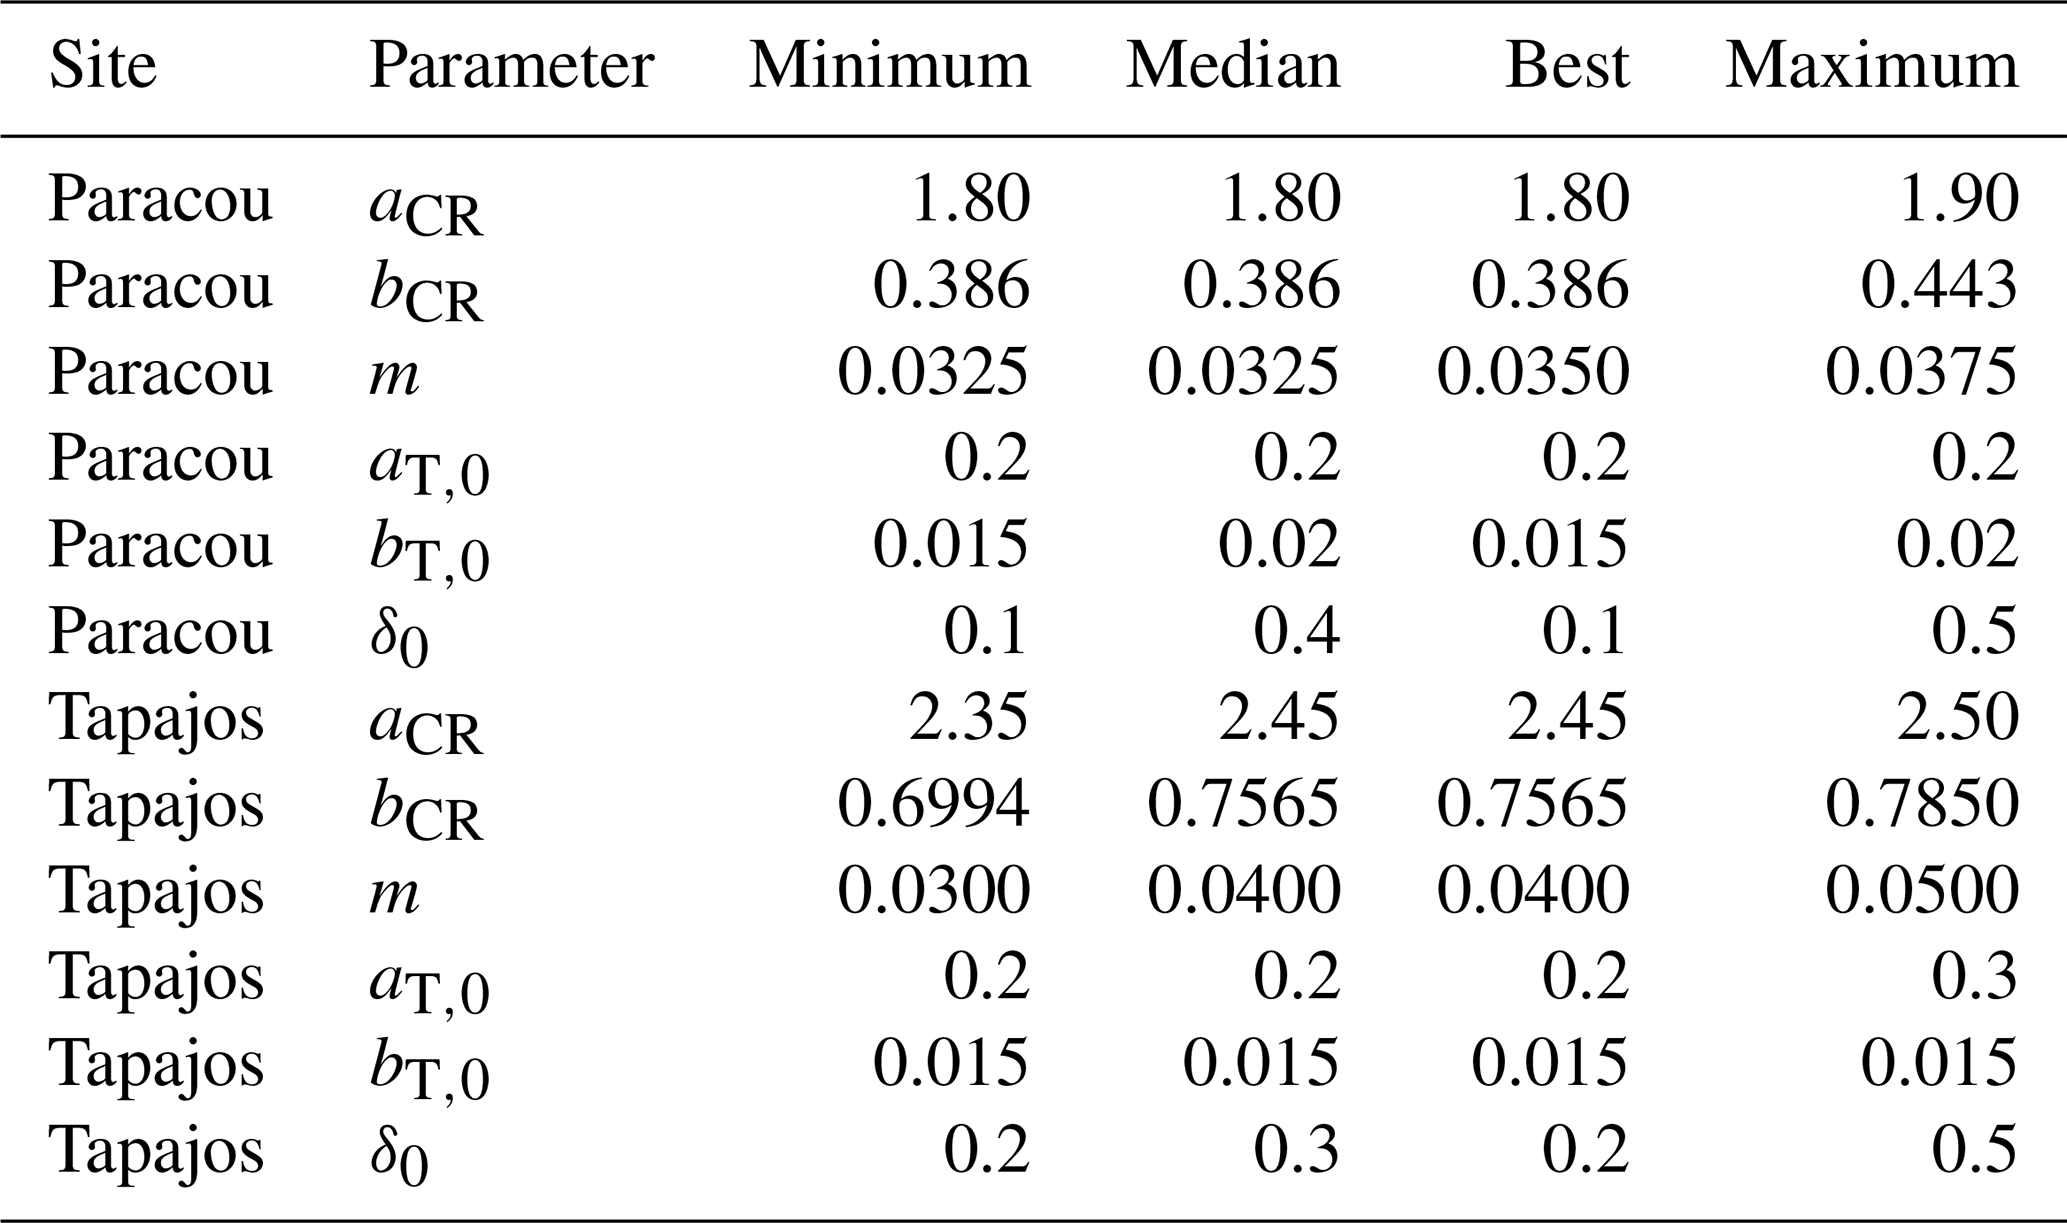
Table A4Calibrated parameter intervals for the five best simulations for stem distribution, number of stems, basal area, and aboveground biomass, as well as the one with equal weighing among them. Values show the median first followed by minimum and maximum values in brackets.
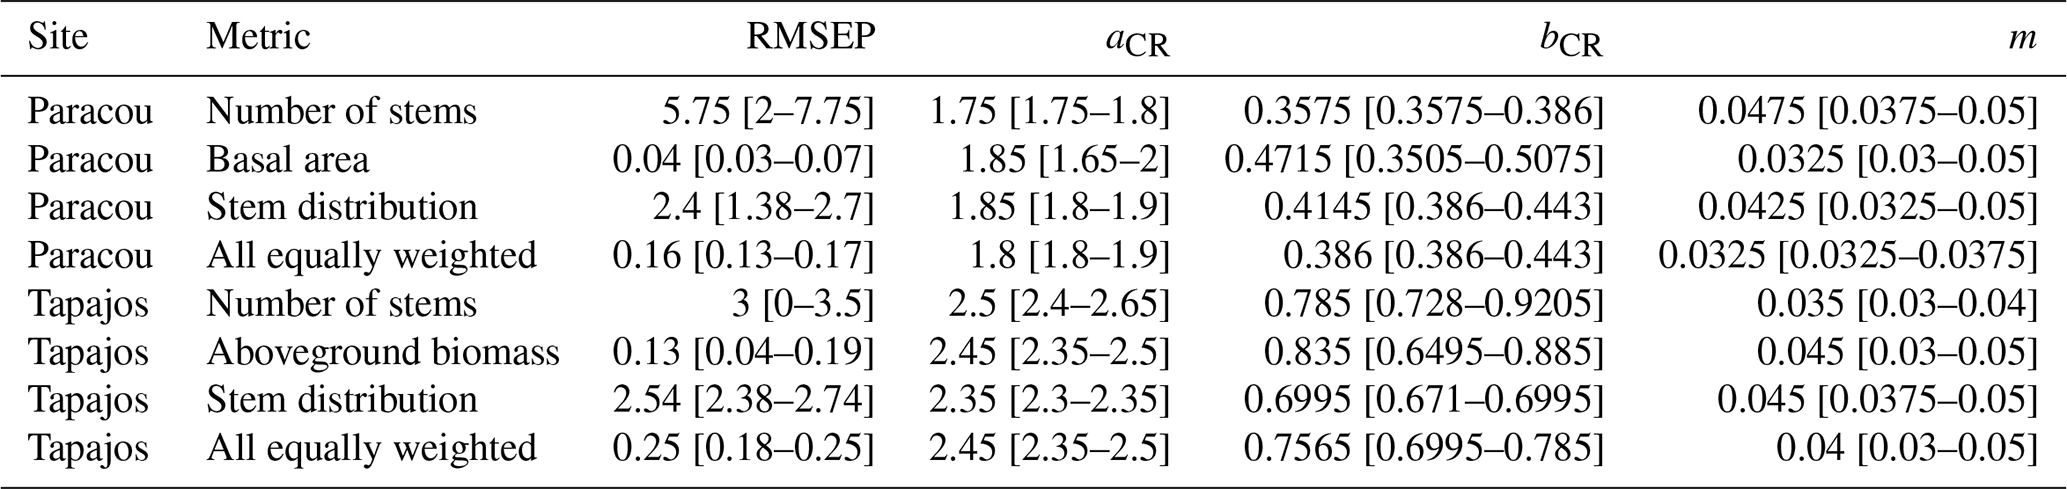
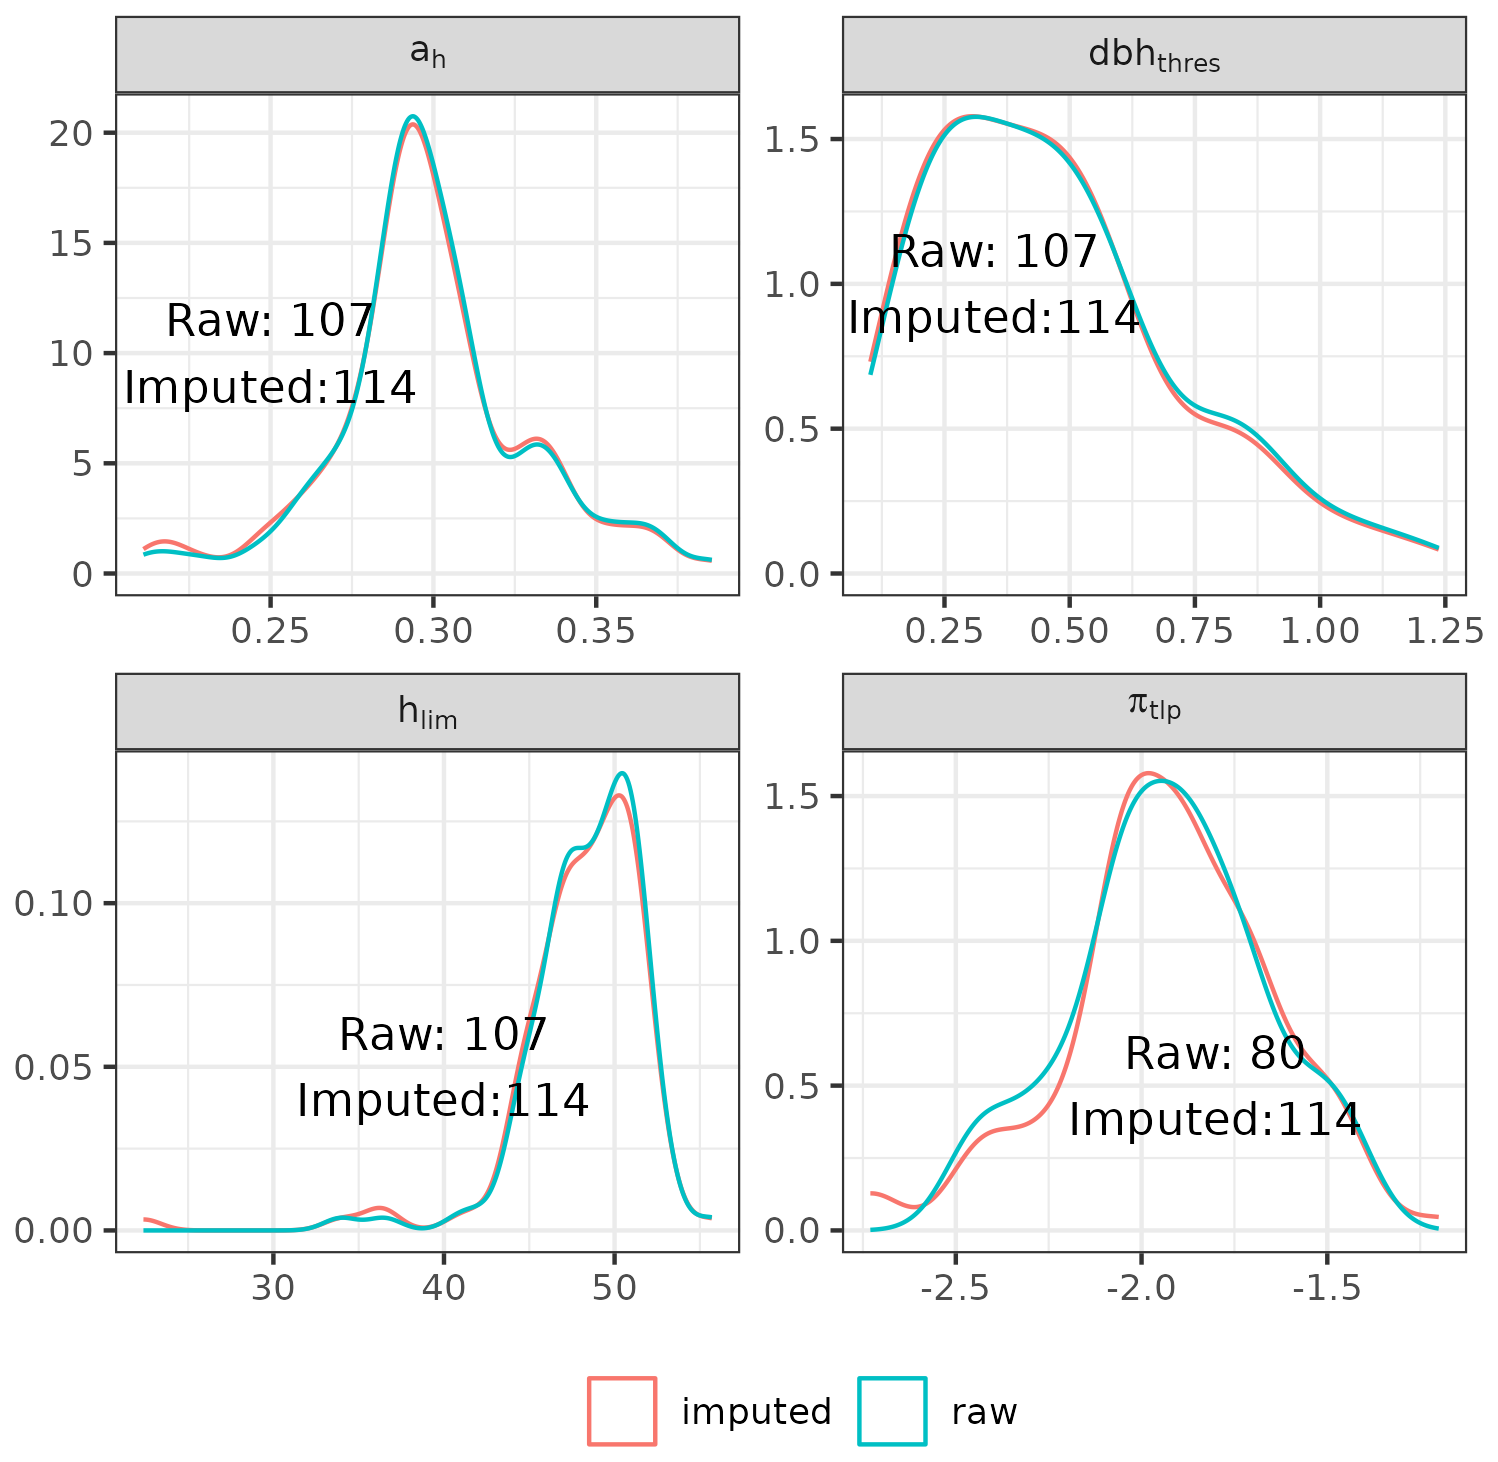
Figure A1Representativity of imputed functional trait values (red) against raw functional trait values (blue) from various datasets (see the Methods section). Traits were imputed using predictive mean matching for ah, dbhthres, hlim, and πtlp only. The number in each panel represents the number of species with a trait value in the raw data and after imputation, respectively, composing the blue and red curves.
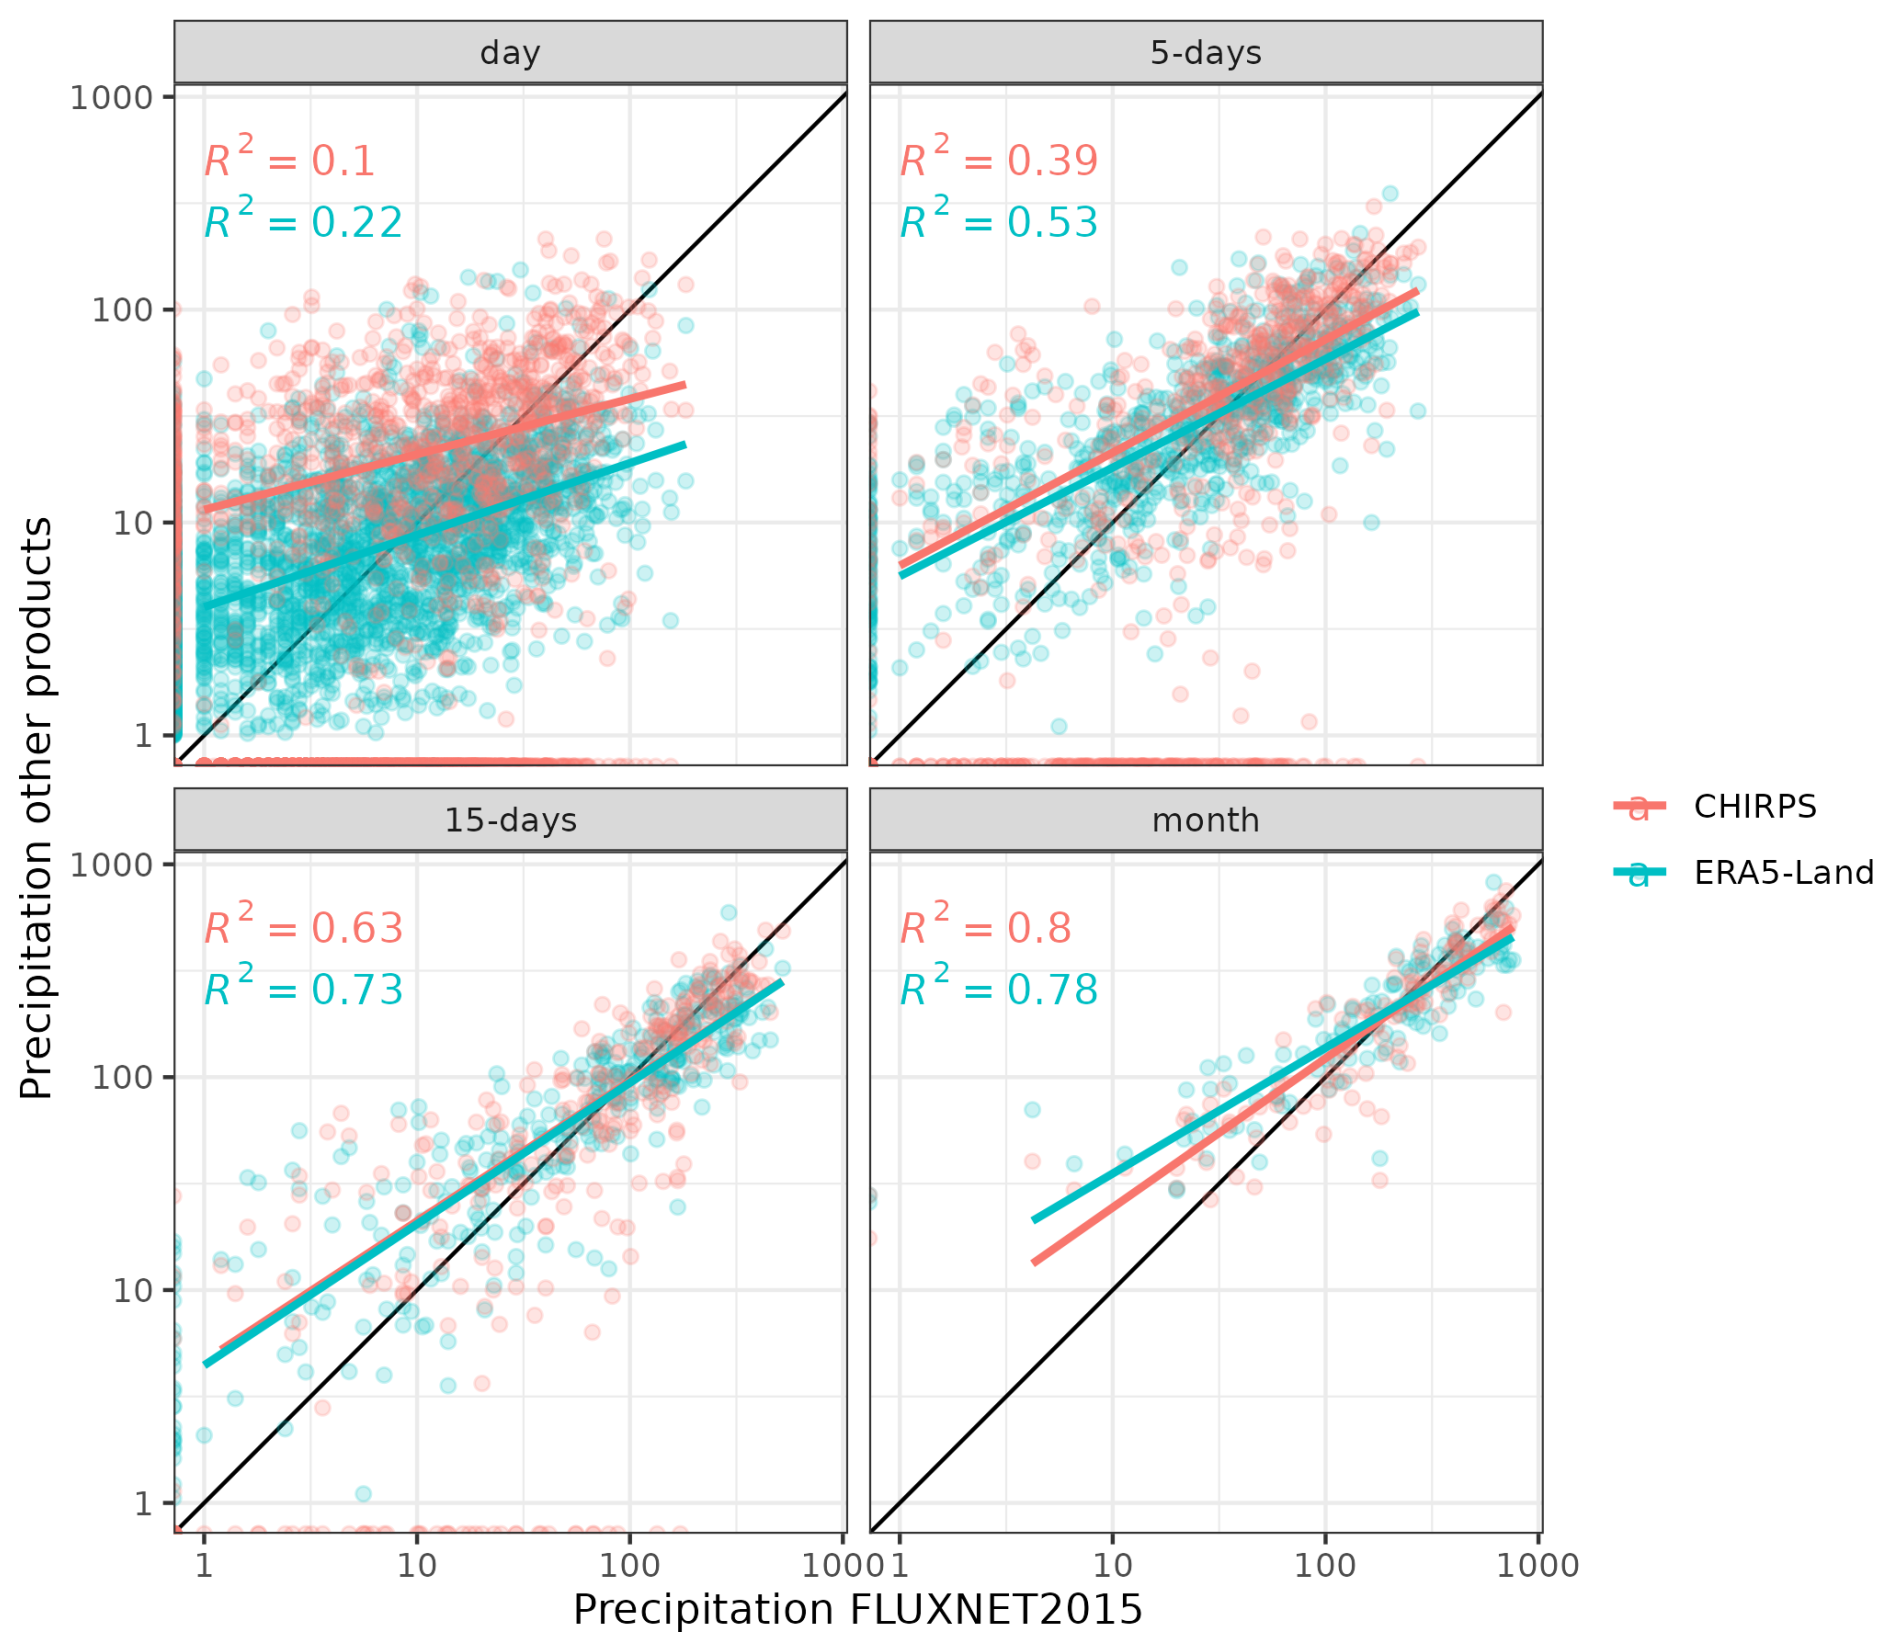
Figure A2Comparisons of CHIRPS (red) and ERA5-Land (blue) precipitation products against local eddy flux tower measurements retrieved from FLUXNET 2015 in Paracou at daily, 5 d, 15 d, and monthly resolutions. CHIRPS and ERA5-Land had similar agreement to locally measured precipitations, with even higher correlations for ERA5-Land than CHIRPS. However, they both overestimated low-precipitation events and underestimated high-precipitation events, resulting in low agreement for daily variations (R2 of 0.10 and 0.22), which quickly increases for 5 d (R2 of 0.39 and 0.53) and 15 d variations (R2 of 0.63 and 0.73). Although a similar assessment was not possible in Tapajos due to a lack of local reliable rainfall data, we decided to keep ERA5-Land for filling the precipitation data gaps in Tapajos.
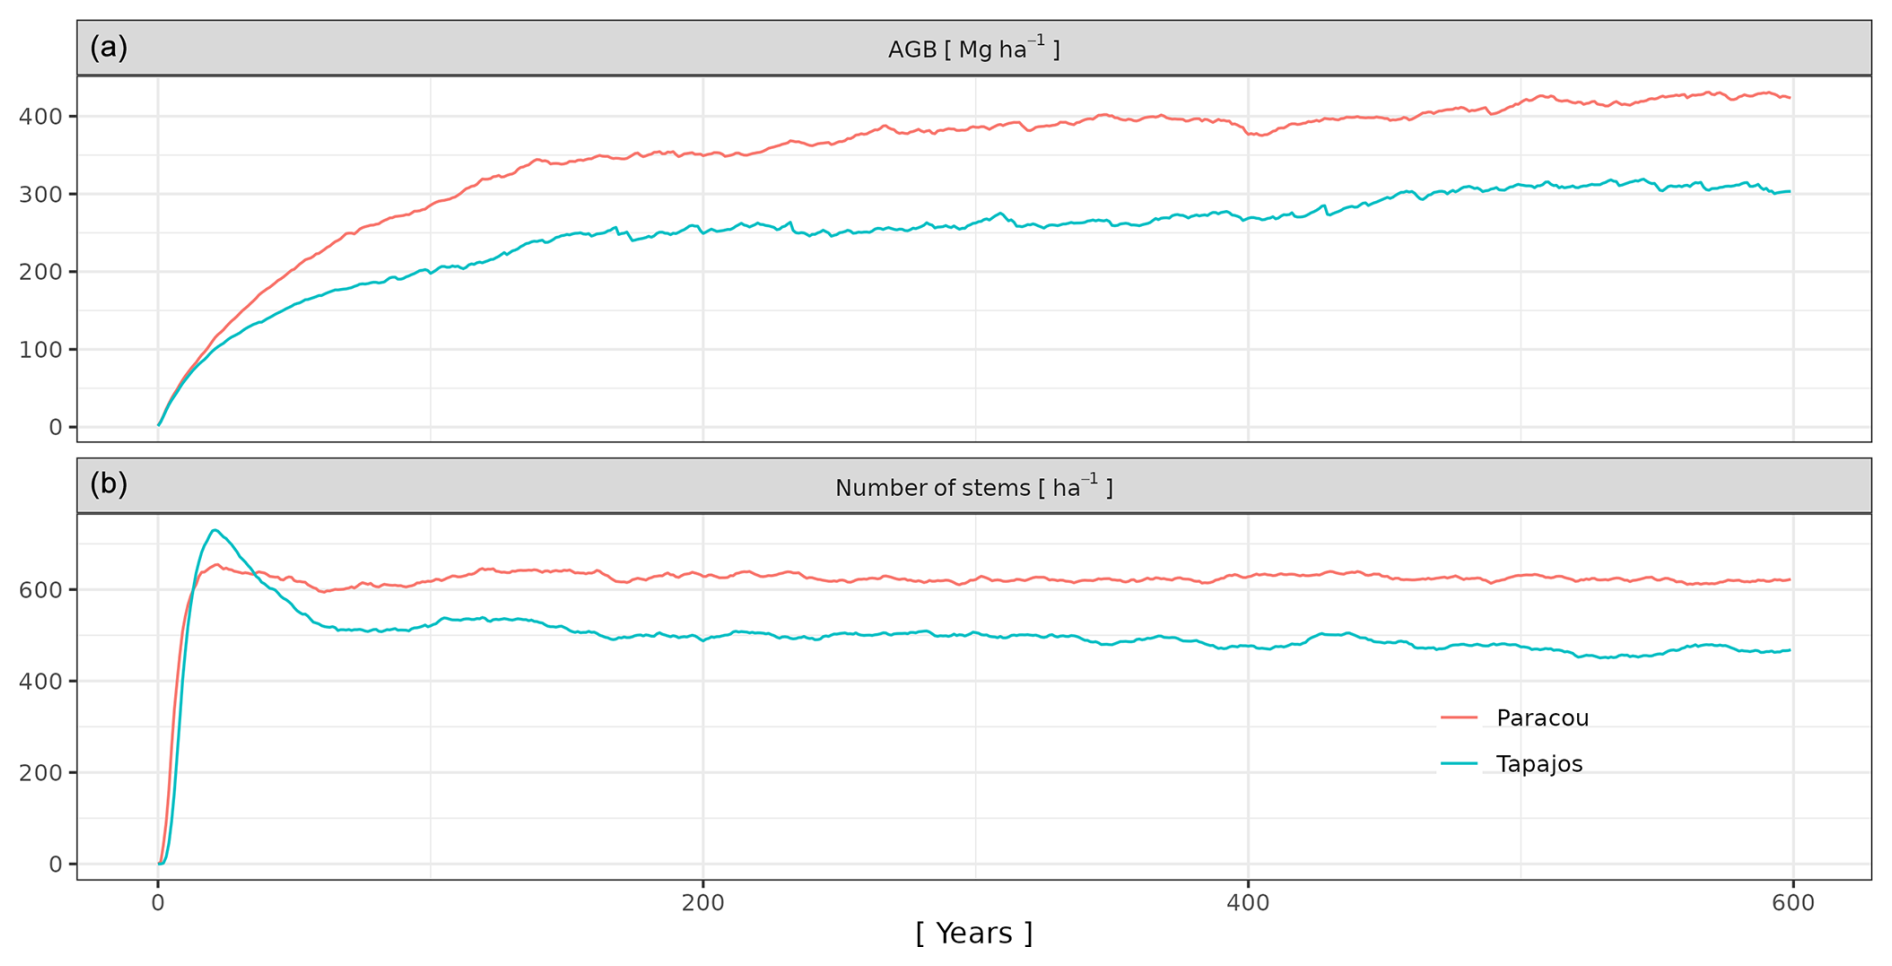
Figure A3600-year spin-up simulations from bare ground with calibrated parameters showing equilibrium reached by the number of stems (b) and aboveground biomass (AGB) (a) at Paracou (red) and Tapajos (blue).
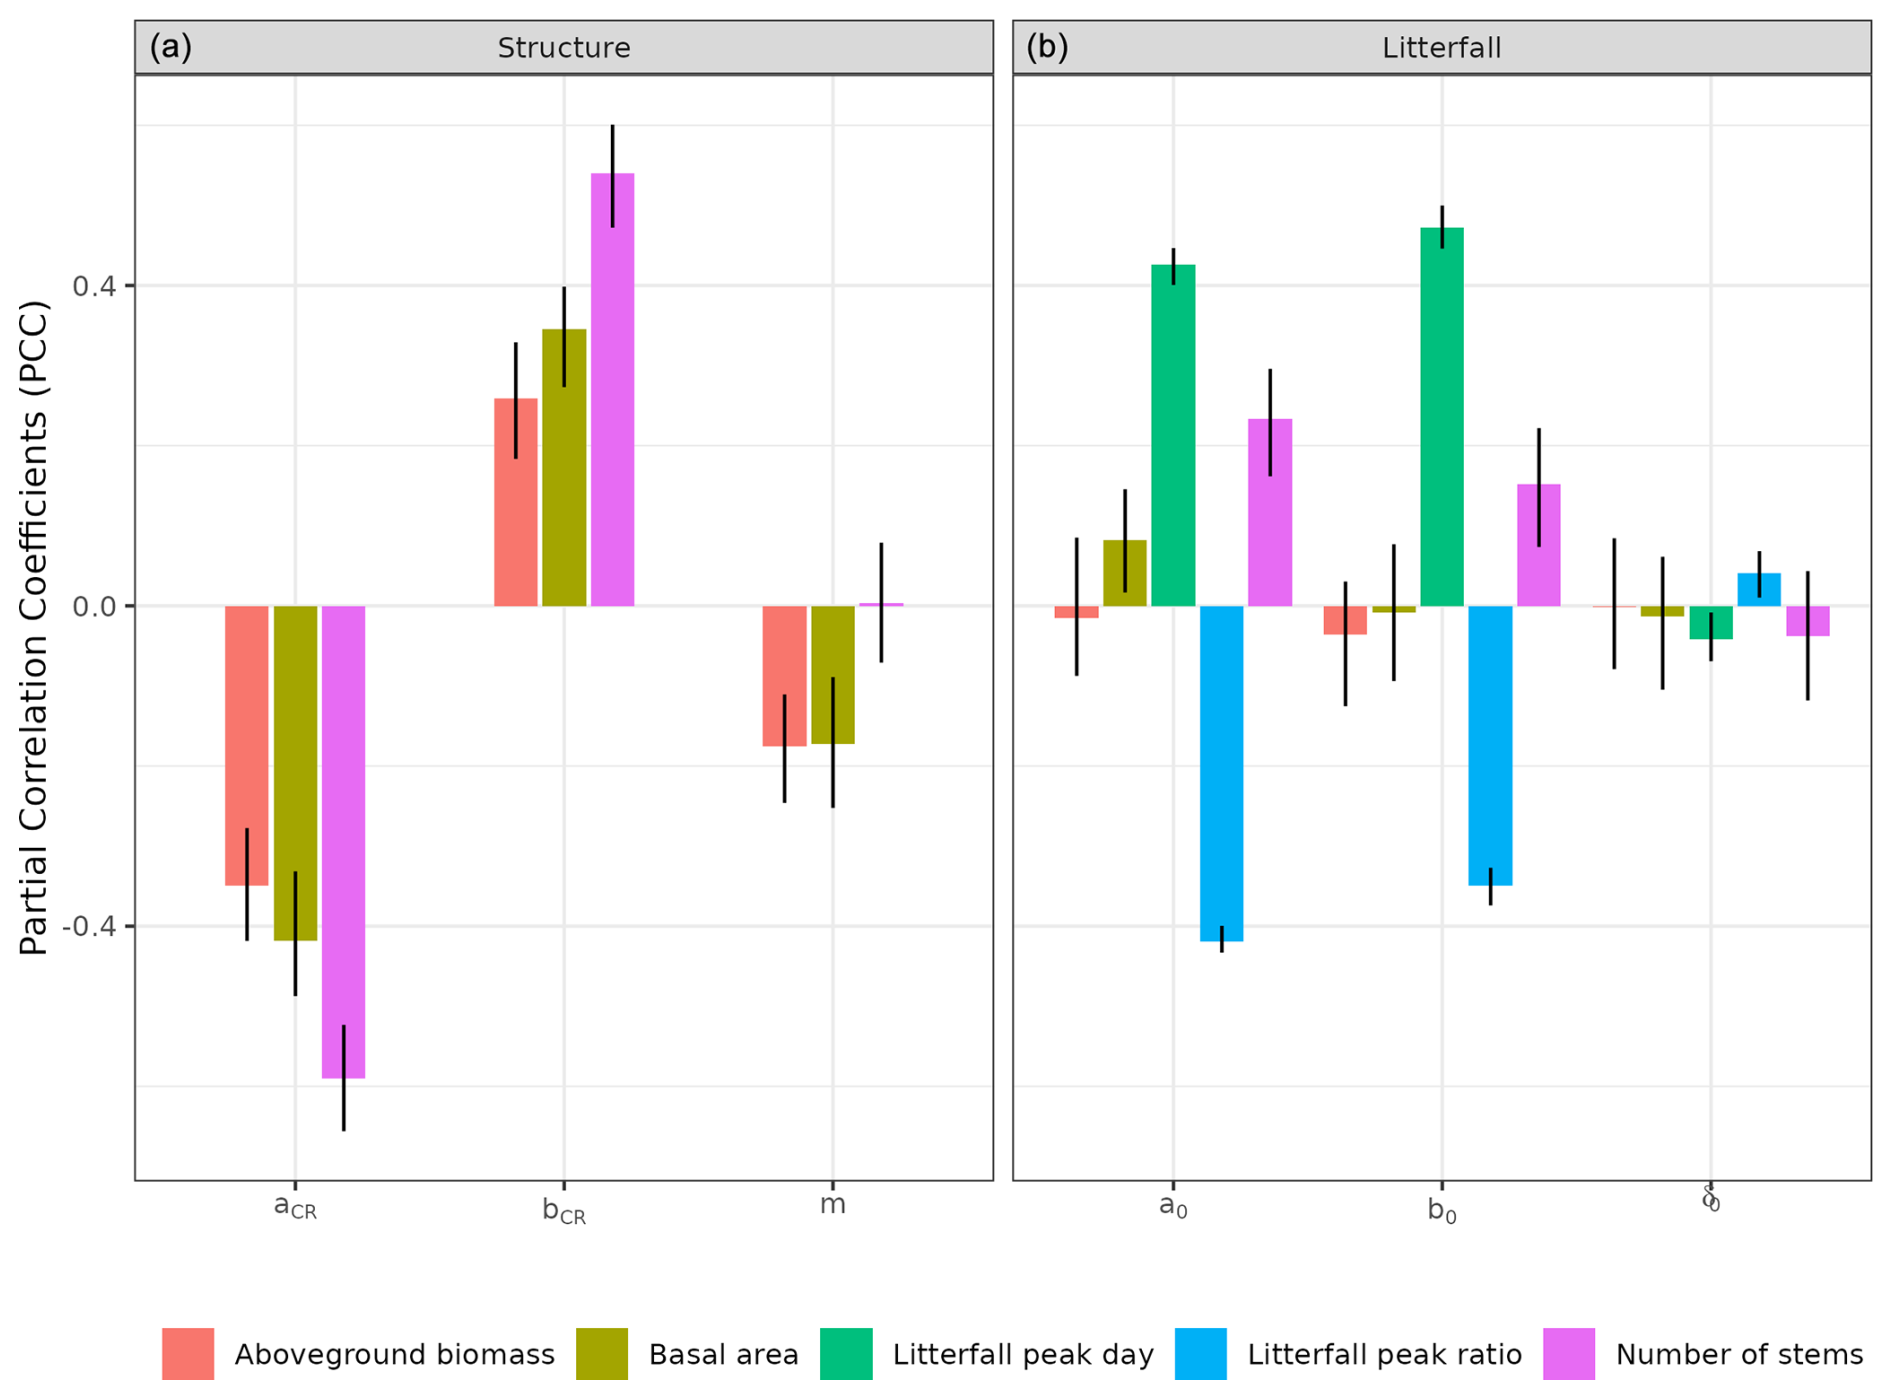
Figure A4Sensitivity of forest structure (a) and forest litterfall (b) to calibrated parameters. Forest structure and forest litterfall sensitivity to each parameter was assessed with partial correlation coefficients (PCCs) using the function pcc of the R package sensitivity with 1000 bootstrap draws to assess confidence intervals. The intercept and slope of the crown radius allometry aCR and bCR had a strong effect on forest structure, i.e. number of stems (red), aboveground biomass (AGB, light green), and basal area (BA, green). Basal mortality m also had a strong effect on aboveground biomass (AGB) and basal area (BA) but little to no effect on the number of stems. aT,0 and bT,0 had a strong positive effect on the peak day of litterfall (blue) and a negative effect on the ratio of the peak of litterfall (purple), but delta0 had only a weak effect on the peak of litterfall. The forest structure variables, namely number of stems, aboveground biomass (AGB), and basal area (BA), showed little to no partial correlations with aT,0, bT,0, and delta0.
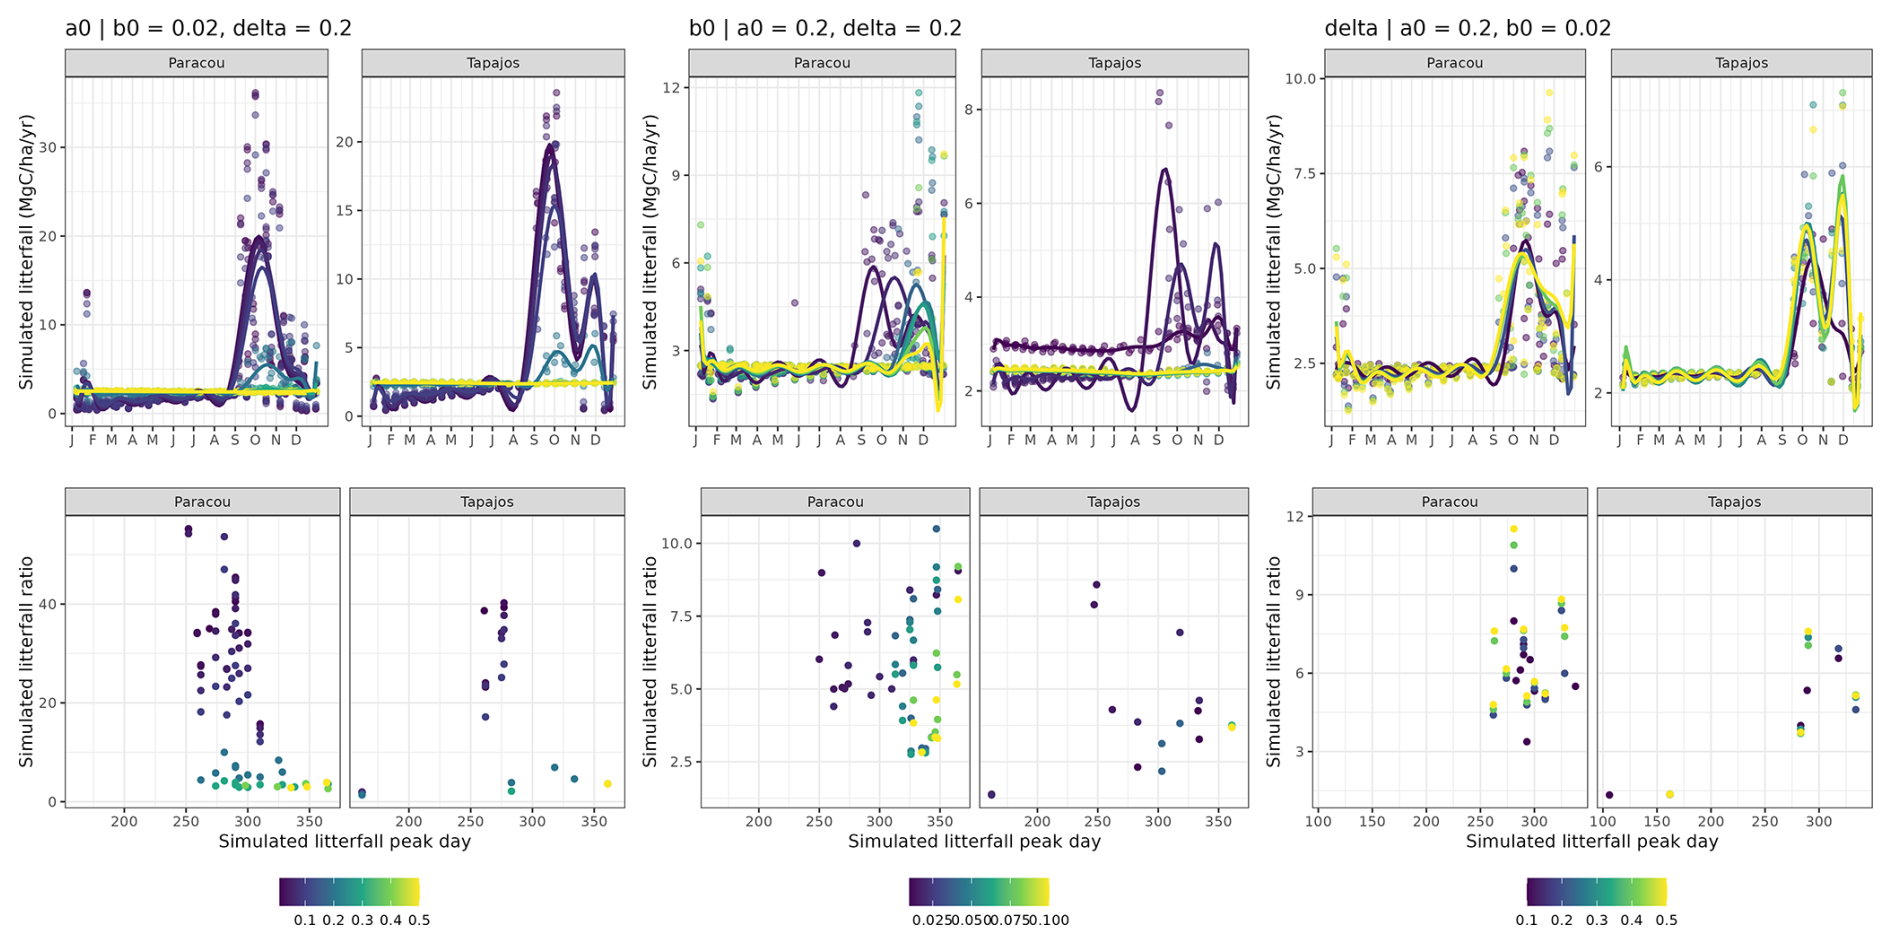
Figure A5Effect of each parameter of the new leaf shedding module on the simulated timing and intensity of the litterfall peak during the dry season. Top panels illustrate simulated variations of litterfall at both sites for varying aT,0, bT,0, and δ0 with the other parameters fixed to a calibrated value. Bottom panels illustrate the corresponding timing and intensity of the dry-season litterfall peak: (i) the day of the litterfall peak as the Julian day of the maximum annual value (day) and (ii) the ratio between the peak value (computed as the average of litterfall flux over the two consecutive time intervals before and after the peak day) and the basal flux (computed as the average between January and April). aT,0 mainly limited the intensity of the peak, with a peak up to 60 times the wet-season base litter flux with small parameter values close to 0.01 and no peak with values greater than 0.3 when 0.02 and δ0= 0.2. Values of aT,0 greater than 0.1 also resulted in a later peak during the dry season. bT,0 mainly influenced the date of the simulated peak during the dry season, as well as the intensity of the simulated peak for values greater than 0.1. Indeed, low values of bT,0, close to 0.01, resulted in a peak starting in September, while high values showed a peak starting in December when 0.2 and δ0= 0.2. Finally, δ0 appeared to have a smaller influence on the intensity and timing of the simulated litter peaks. Higher values of δ0 increased the duration of the simulated peaks or the litter flux between two peaks during the same dry season.
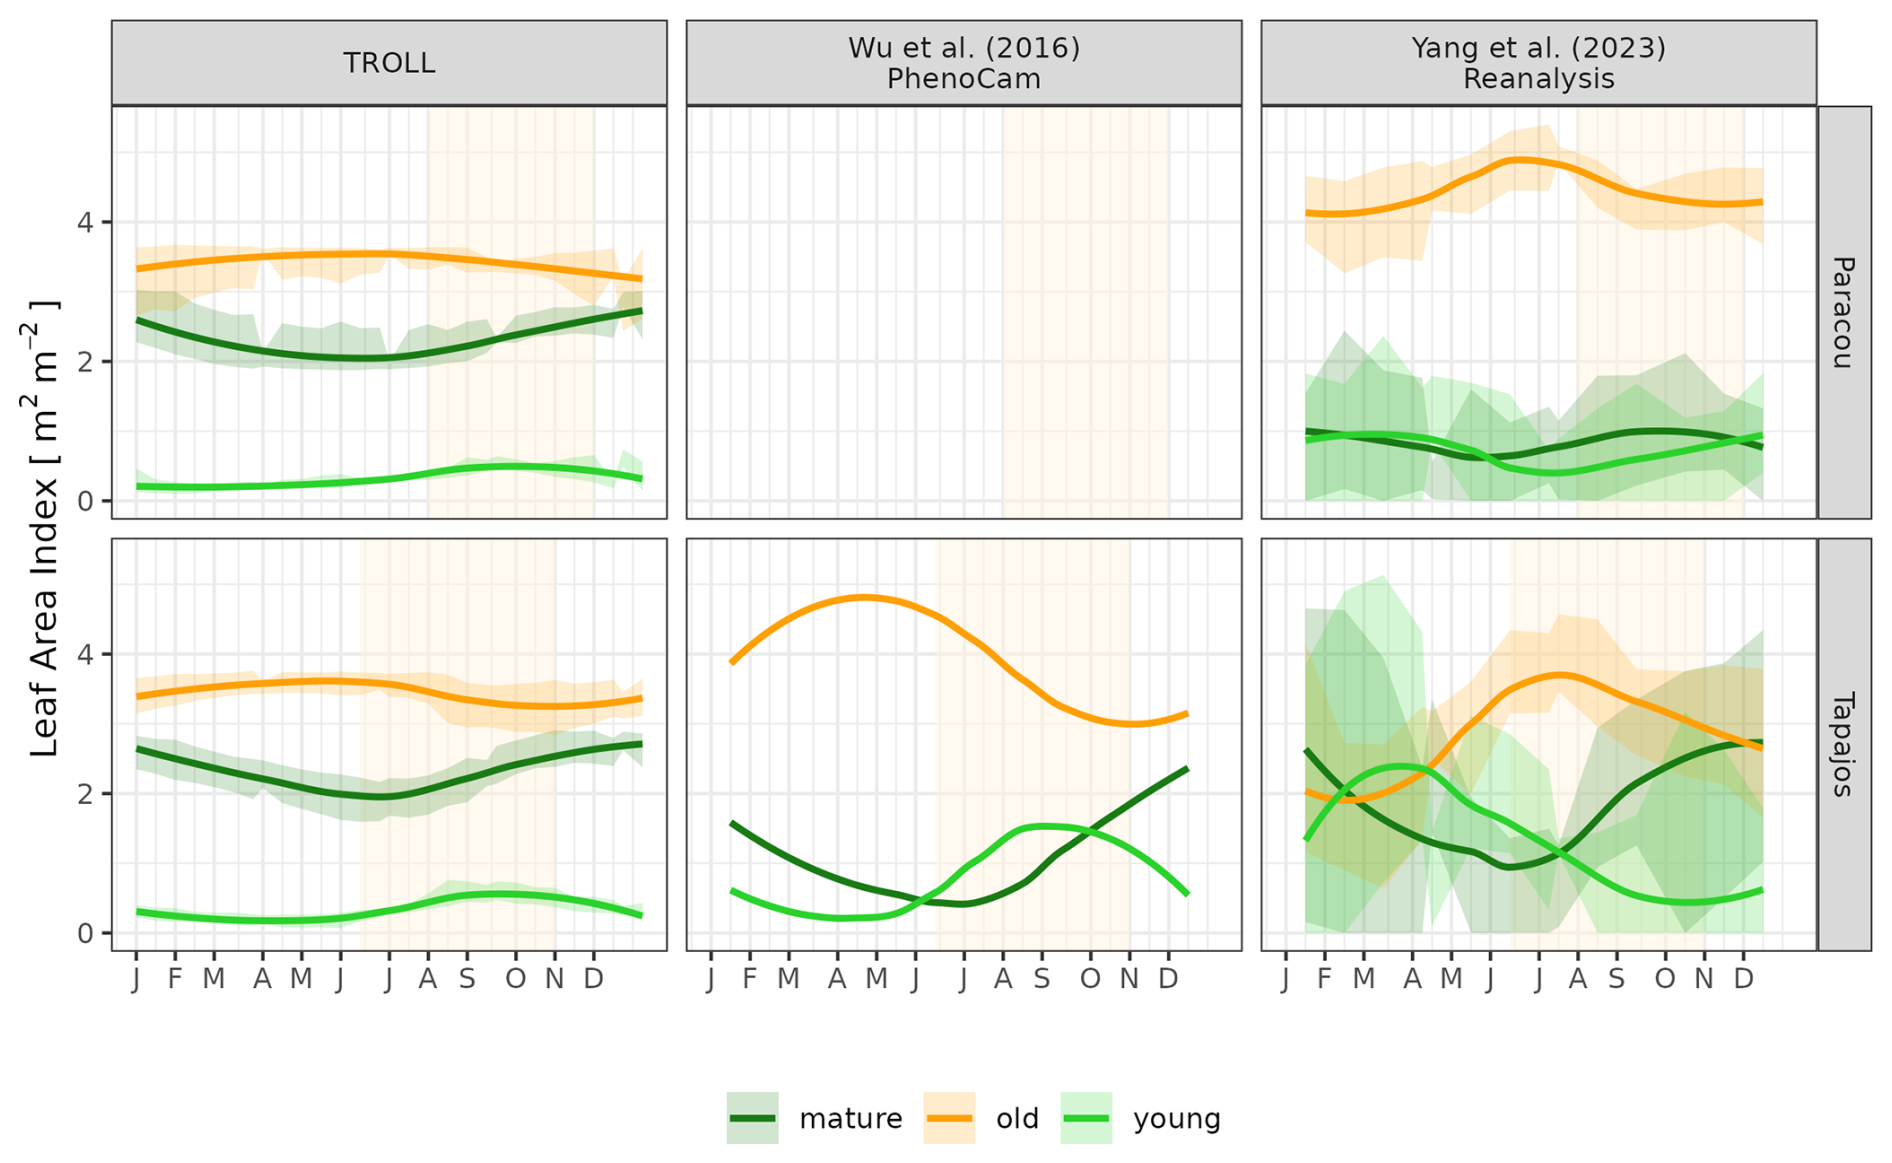
Figure A6Mean annual cycle of leaf area index per leaf age cohort, derived from fortnightly means, at Paracou and Tapajos. Note that the three leaf age cohorts (young, mature, and old leaves) are not defined the same way in the three sources. Leaf age per cohort depends on the individual leaf lifespan in TROLL 4.0 (see Maréchaux et al., 2025), while the transitions from young to mature and mature to old are respectively fixed to 1.71 and 5.14 months in Yang et al. (2023) and fitted to 1 and 3 months in Wu et al. (2016). Bands are the intervals of means across years, and the vertical yellow bands in the background correspond to the site's climatological dry season.
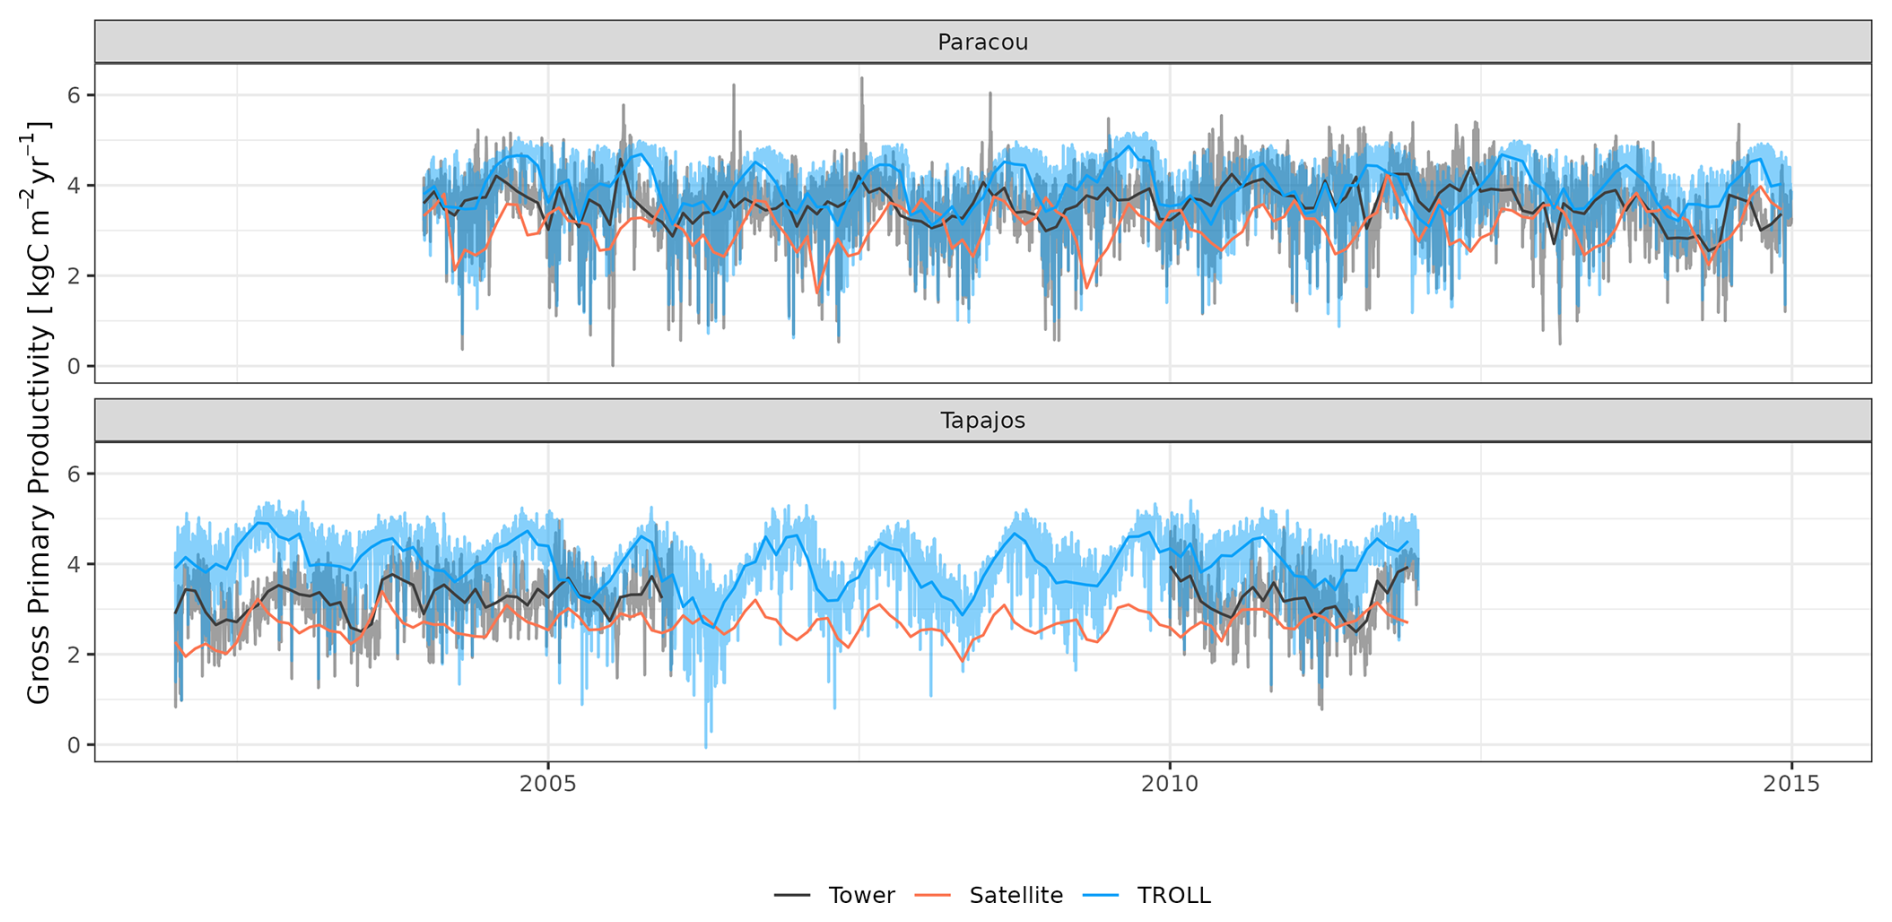
Figure A7Daily and monthly means of gross primary productivity for Paracou and Tapajos. Dark lines are the monthly means, and semi-transparent lines are the daily mean variations with the exception of satellite data, for which data are available only every 8 d.
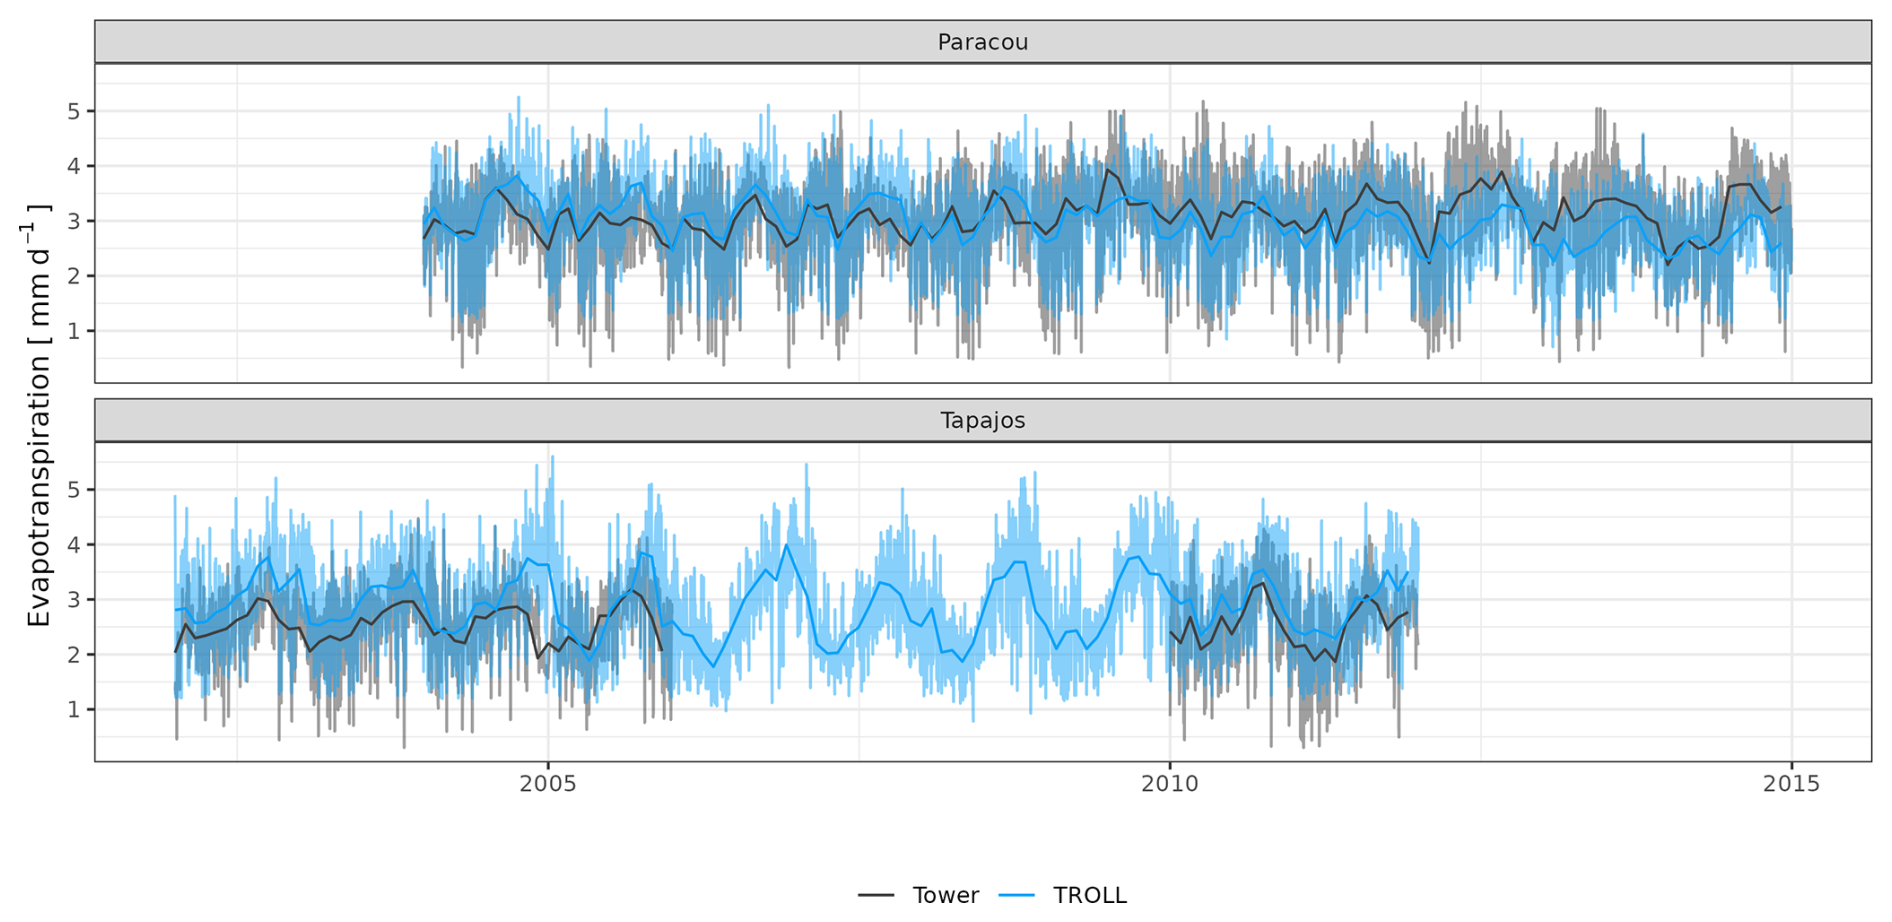
Figure A8Daily and monthly total of evapotranspiration for Paracou and Tapajos. Dark lines are the monthly means, and semi-transparent lines are the daily mean variations.
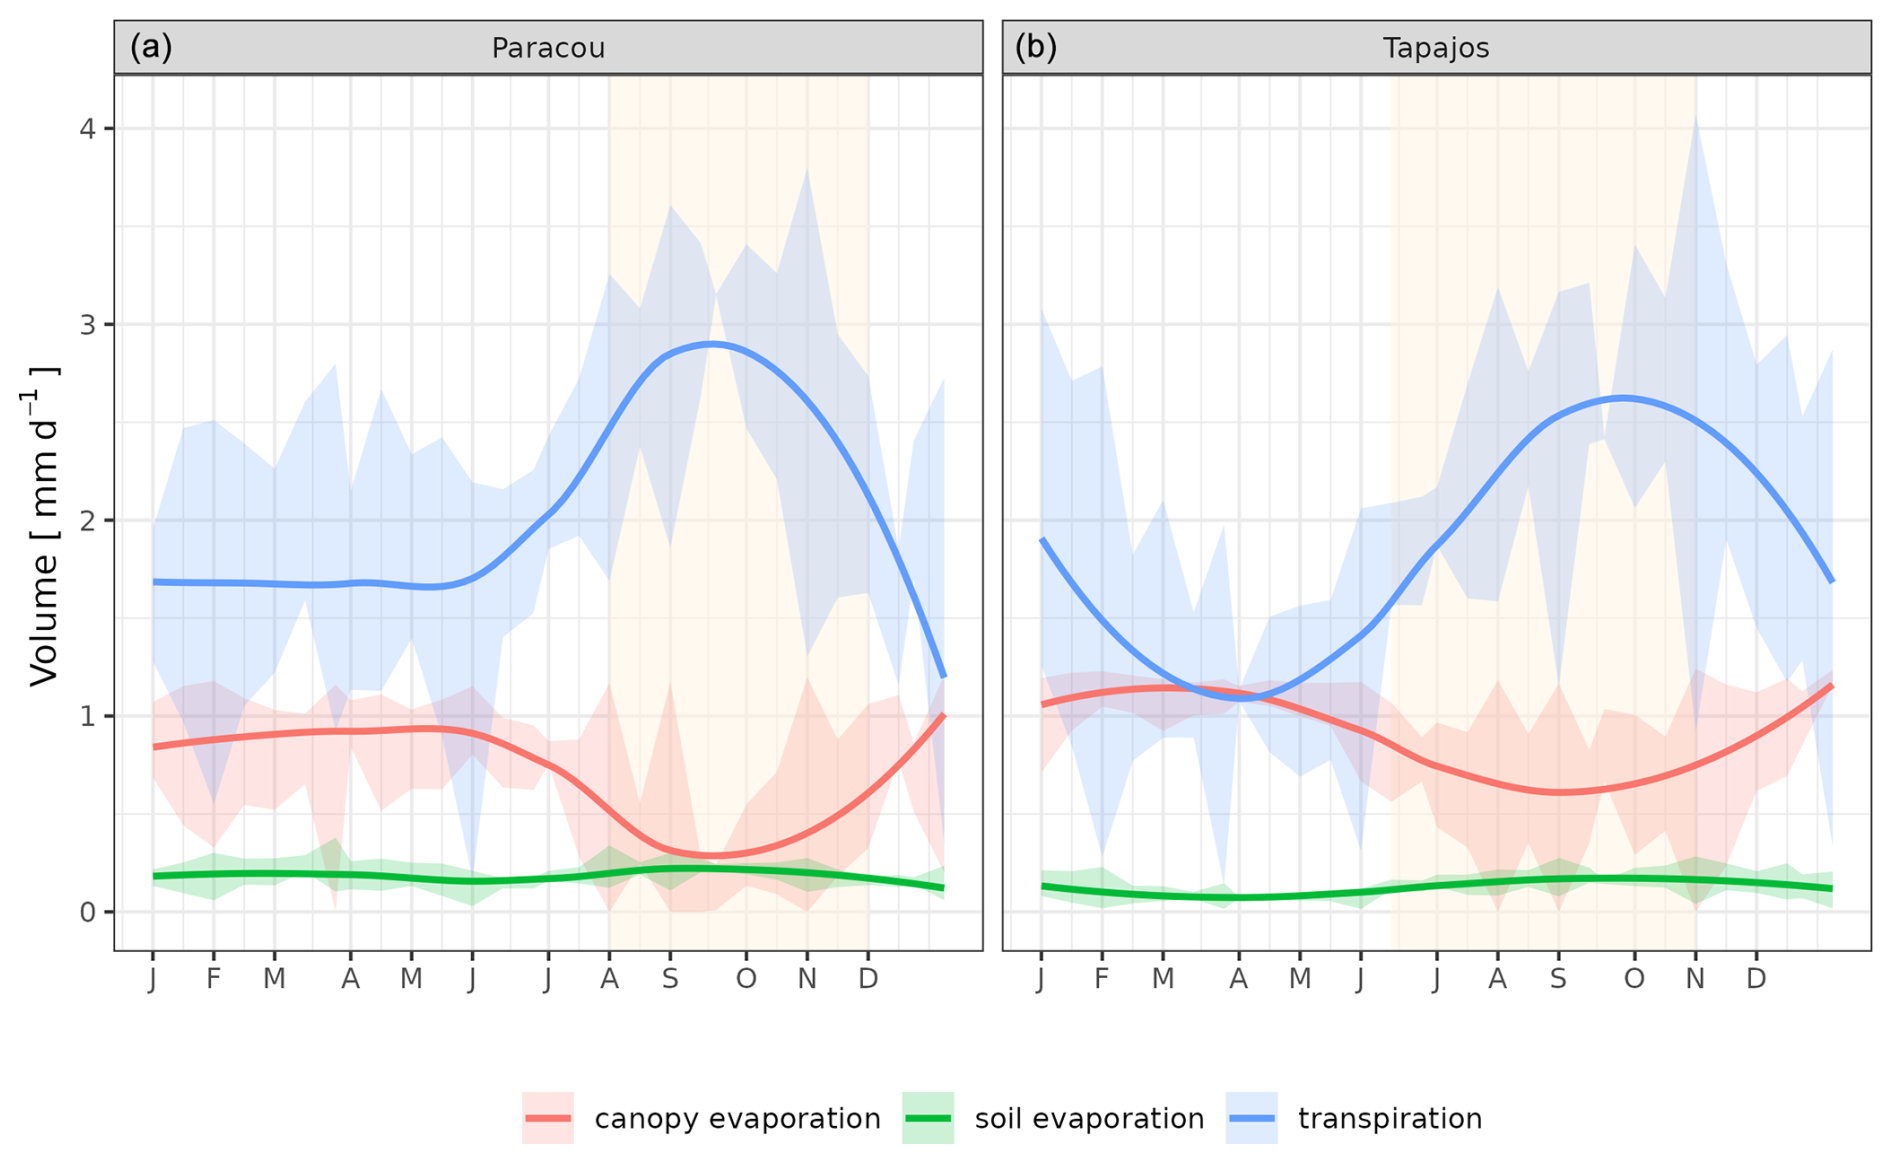
Figure A9Mean annual cycle of evapotranspiration partitioning between canopy evaporation (red), soil evaporation (green), and tree transpiration (blue) for Paracou (a) and Tapajos (b), derived from fortnightly means simulated with TROLL 4.0. Bands are the intervals of means across years, and the yellow vertical bands in the background correspond to the site's climatological dry season. Simulated values correspond to 10 years of simulations starting from the end state of 600-year regeneration from bare ground with calibrated parameters at each site.
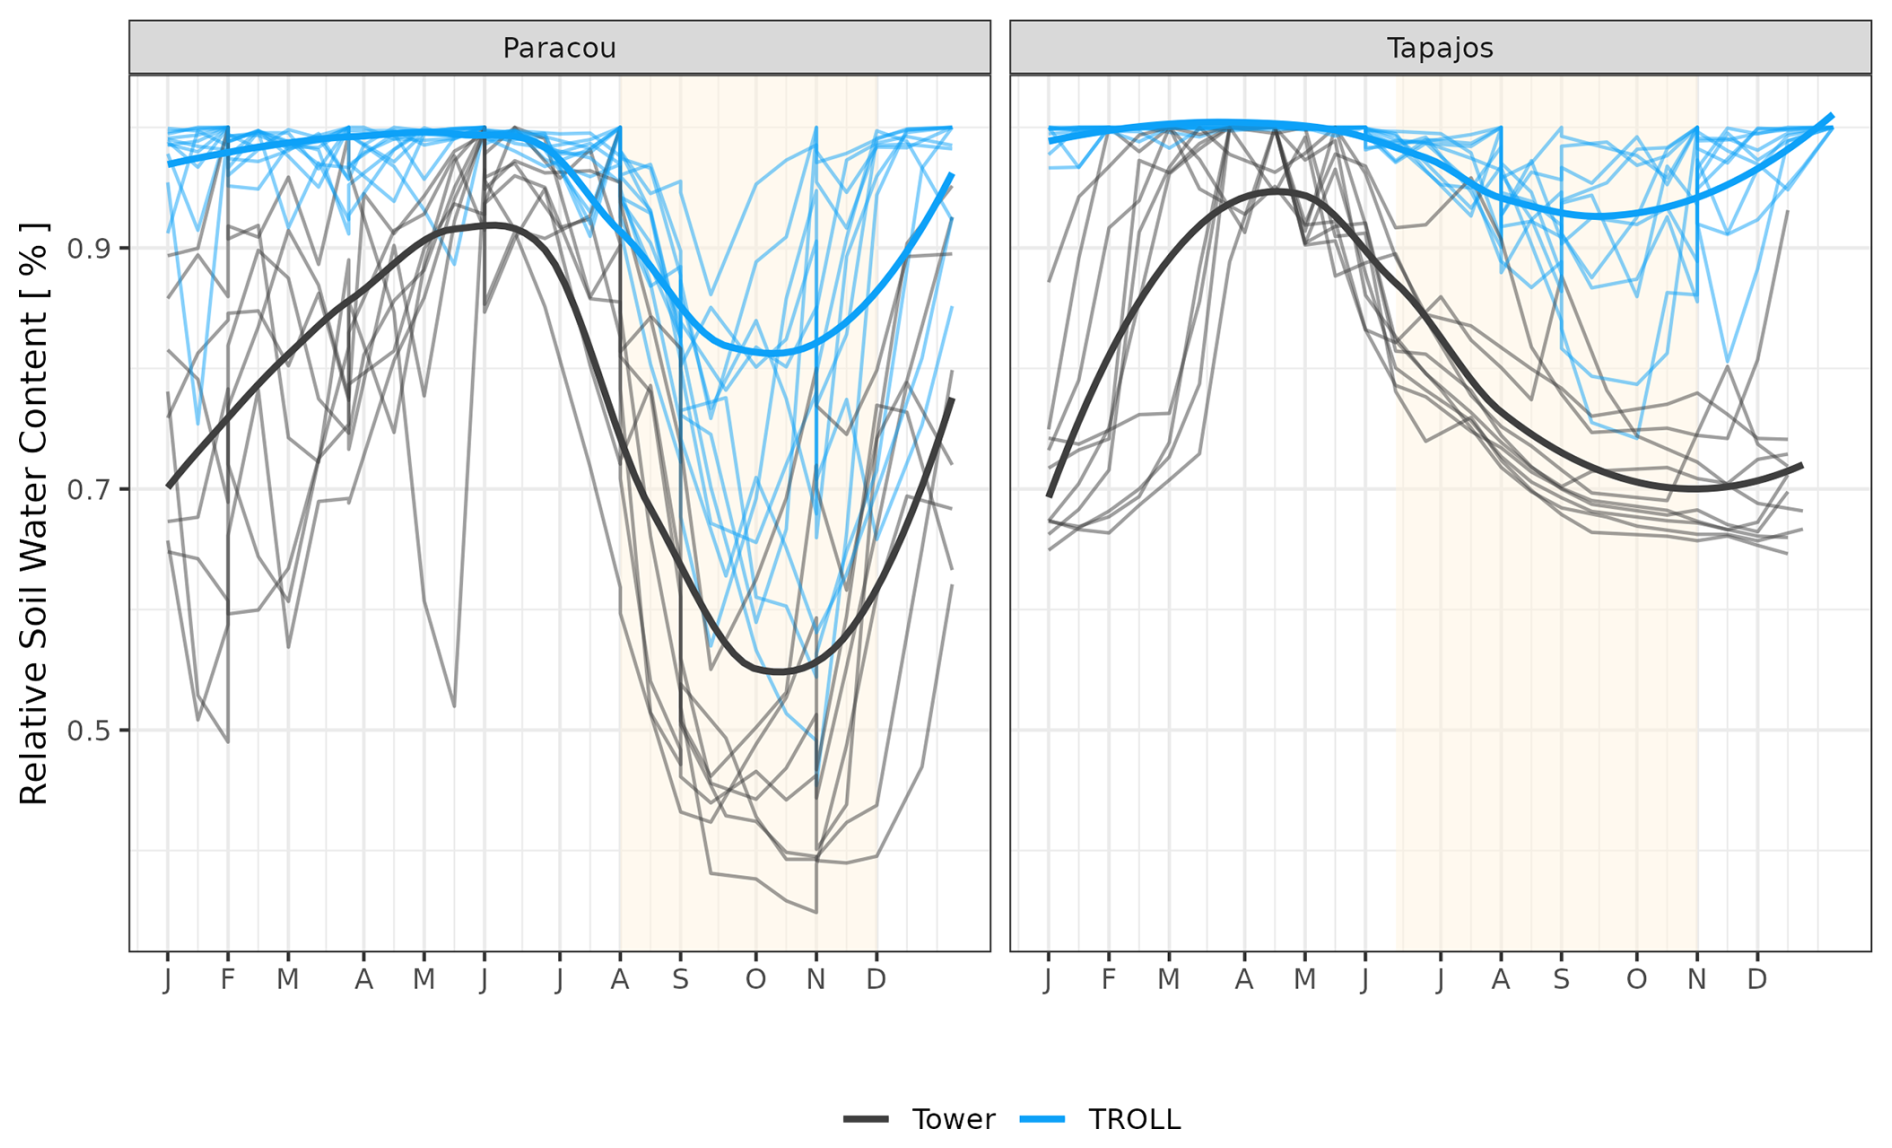
Figure A10Mean annual cycle from daily means of relative soil water content for Paracou and Tapajos for the topsoil layer up to 10 cm. Dark lines are the daily mean across years, and semi-transparent lines are the daily means per year. The vertical yellow bands in the background correspond to the site's climatological dry season.
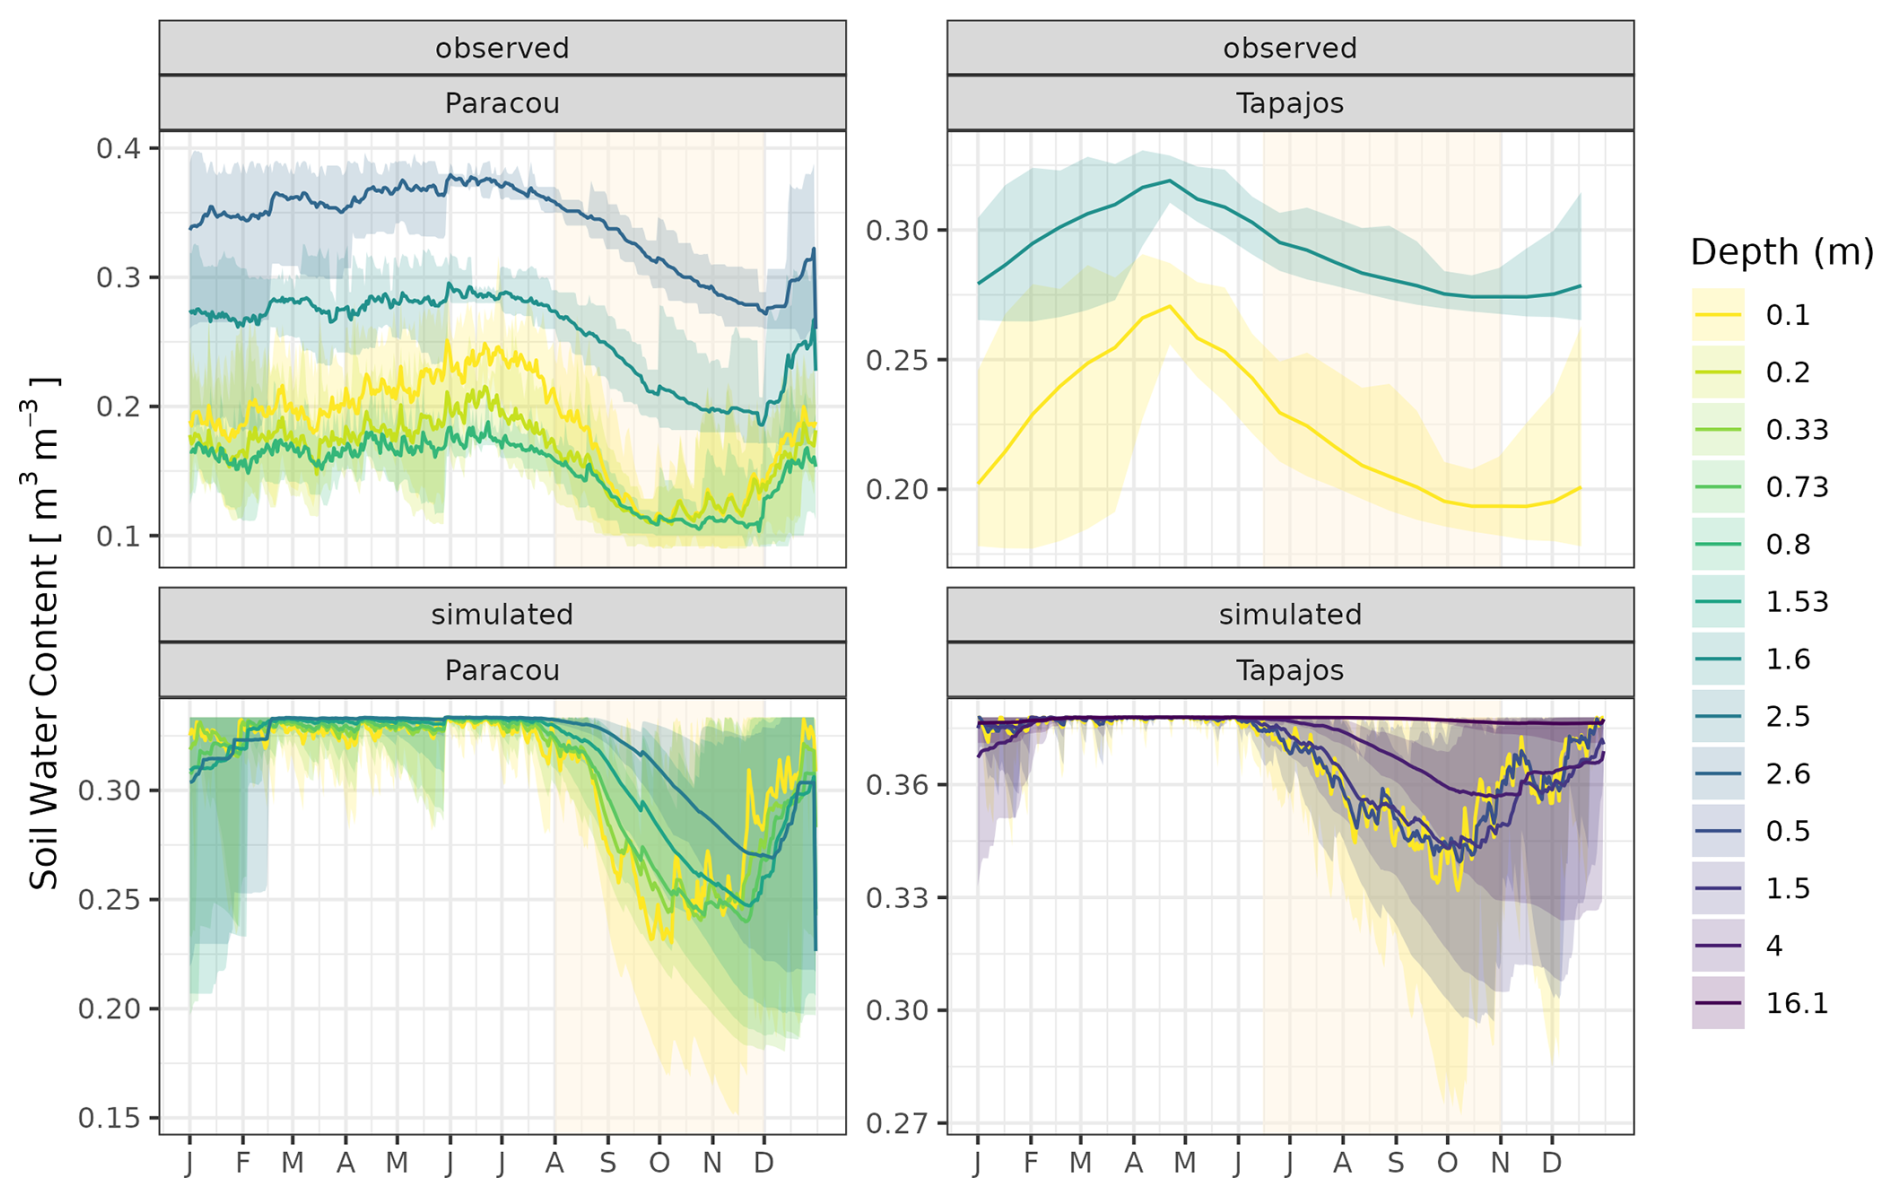
Figure A11Mean annual cycle from daily means of soil water content for Paracou and Tapajos at different depths. The depth value indicates the maximum depth of the layer. Dark lines are the daily means across years, and bands are the intervals of means across 10 years; the vertical yellow bands in the background correspond to the site's climatological dry season.
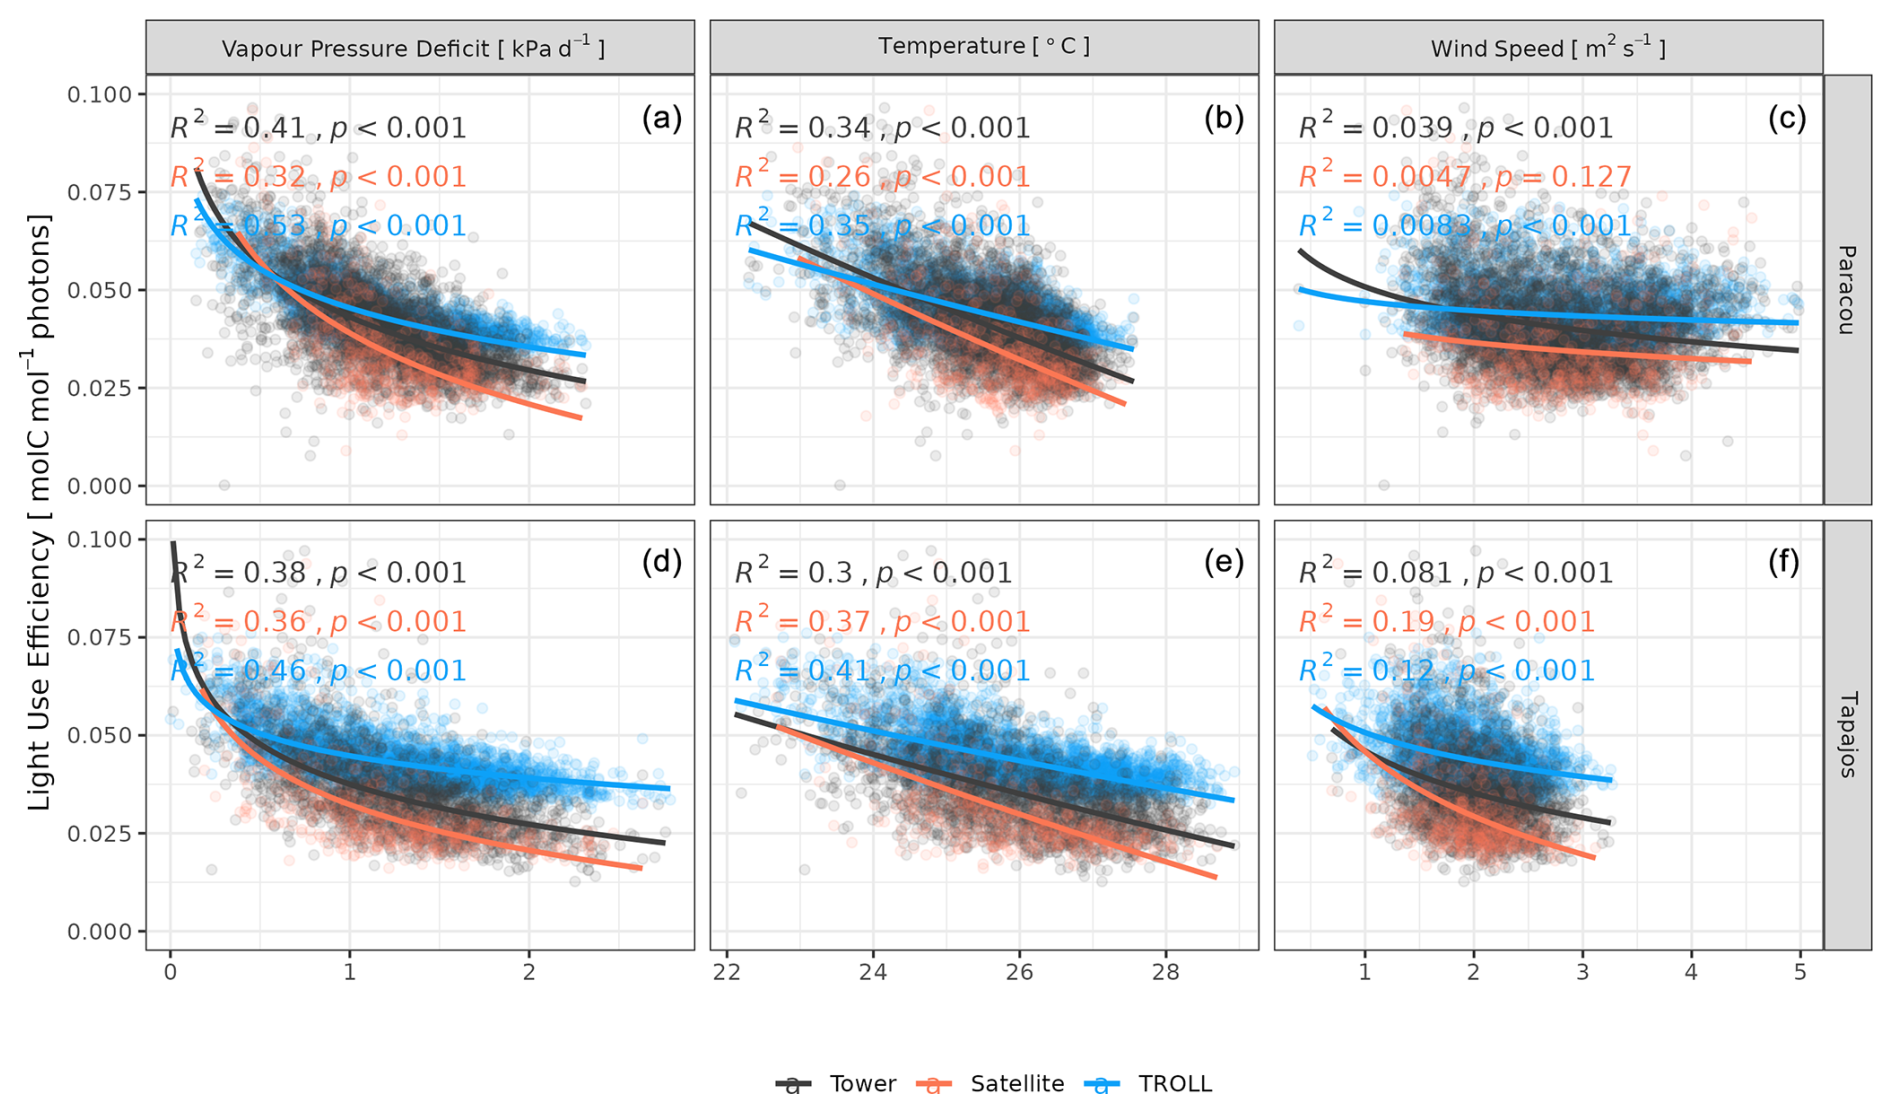
Figure A12Daily averages of light use efficiency as a function of daily maximum vapour pressure deficit, average temperature, and average wind speed for model-, satellite-, and eddy-flux-based estimates at Paracou (a, b, c) and Tapajos (d, e, f). Lines illustrate the linear regression of the form y ∼ log(x), and text indicates the squared Pearson's correlation coefficient R. The light use efficiency (LUE) was obtained by normalizing gross primary productivity (GPP) by photosynthetic photon flux density (PPFD) and the fraction of absorbed photosynthetically active radiation (fAPAR), itself derived from leaf area index (LAI).
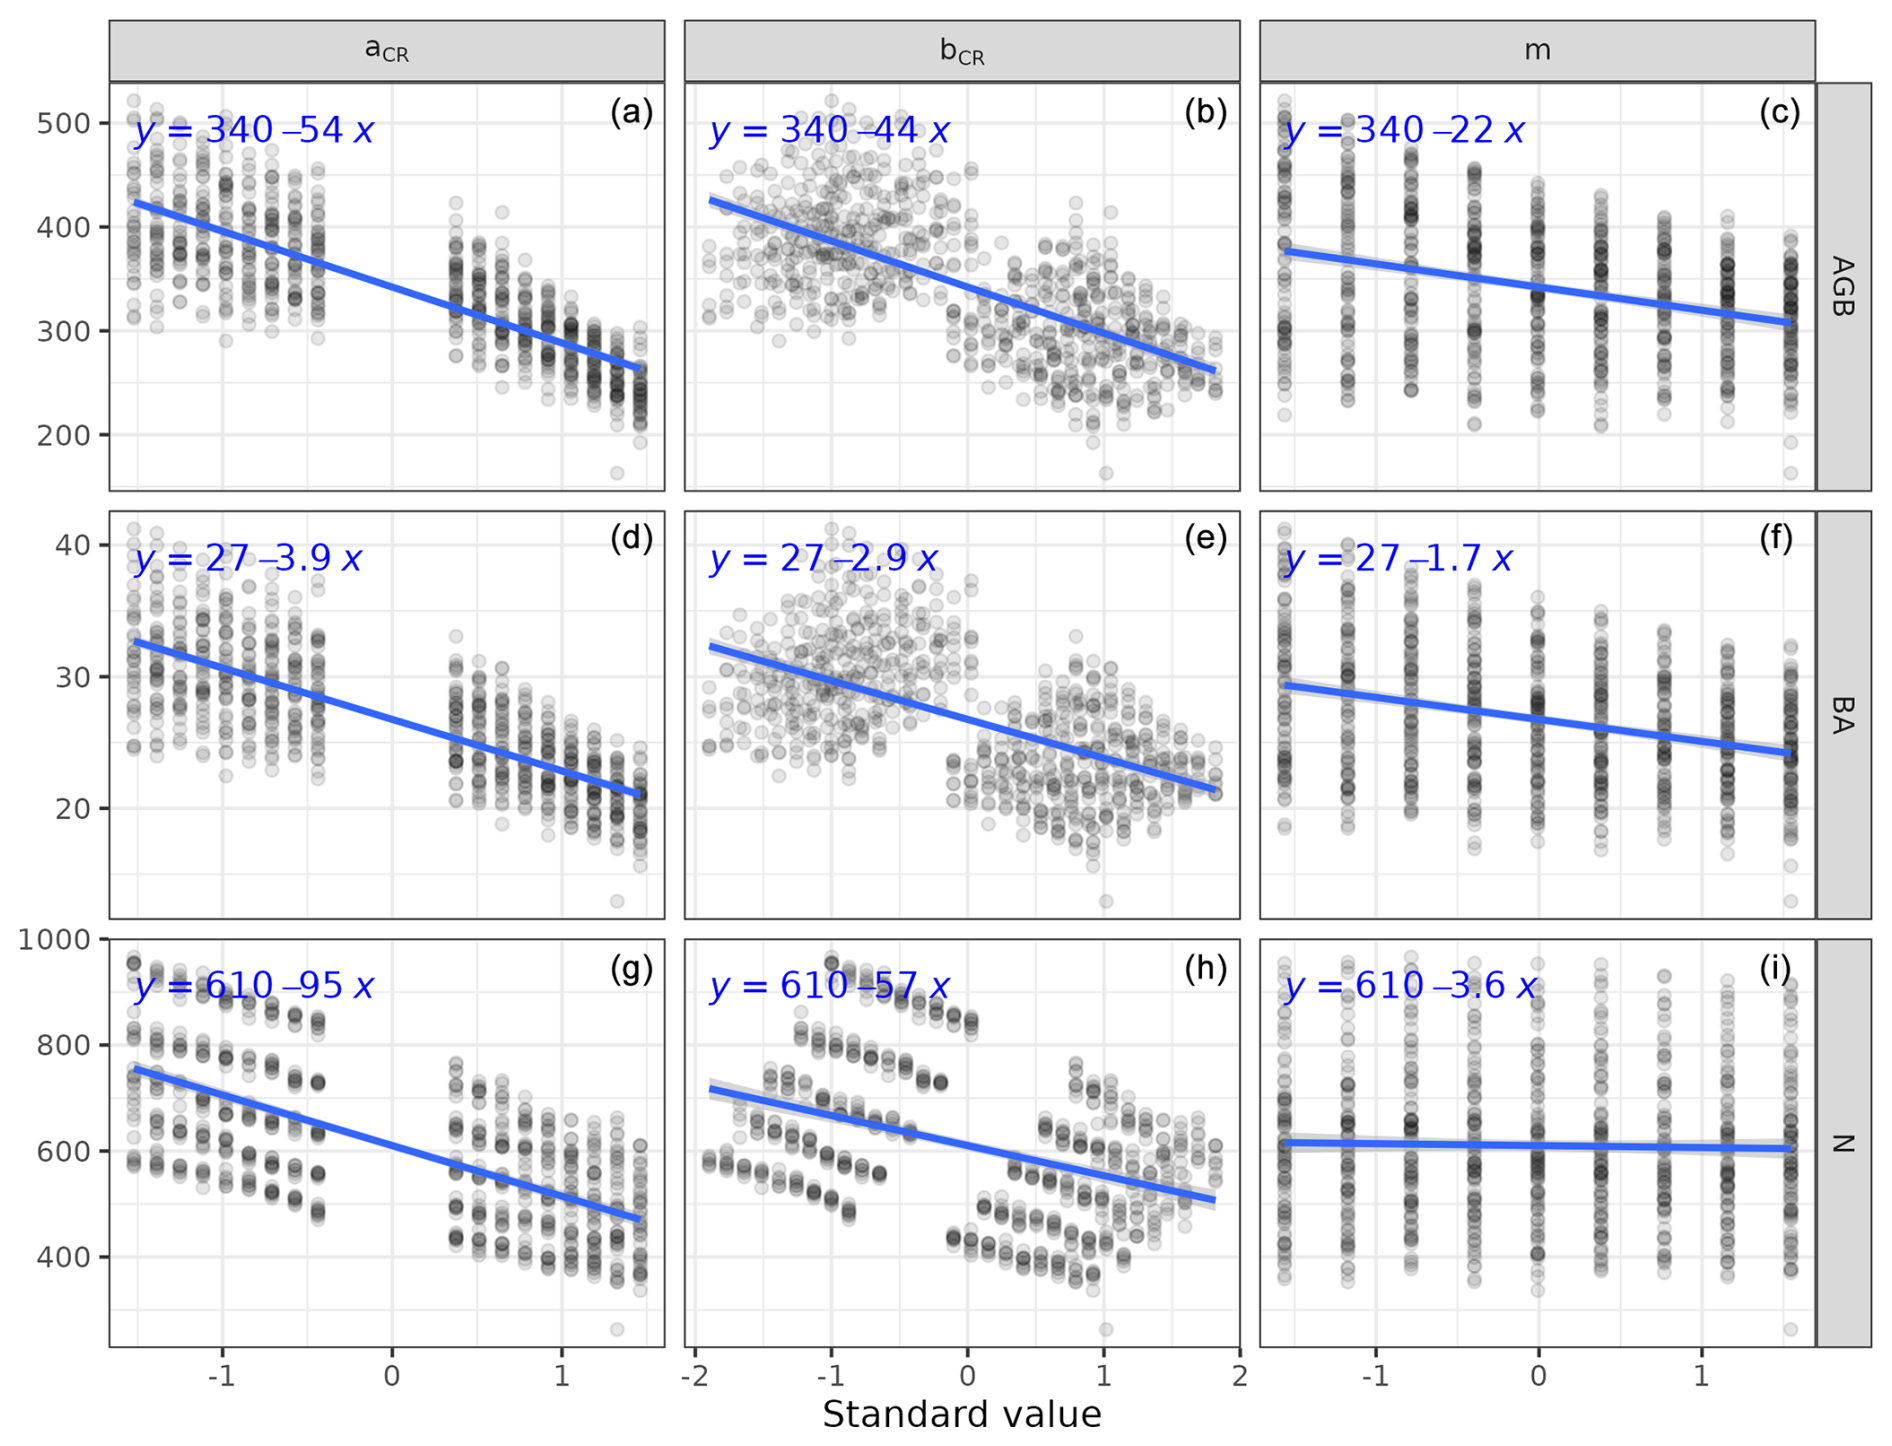
Figure A13Magnitude of the sensitivity of forest structure to calibrated parameters. For each forest structure variable, the magnitude of the sensitivity to each parameter was assessed with regression assuming linear and monotonic relationships. The intercept (aCR, a, d, g) and slope (bCR, b, e, h) of the crown radius allometry as well as the basal mortality rate (m, c, f, i) had a strong effect on aboveground biomass (AGB, mg ha−1, top line), basal area (BA, m2 ha−1, middle line), and number of stems (N, trees ha−1, bottom line). Parameters on the x axis are expressed in standard values to ease their comparisons. The blue line and equation represent the linear regression independently relating each variable to each parameter.
TROLL version 4.0 and further developments are publicly available on GitHub as a C standalone at https://doi.org/10.5281/zenodo.14013147 (Maréchaux et al., 2024) or wrapped into an R package at https://doi.org/10.5281/zenodo.14012116 (Schmitt et al., 2024). All the codes associated with the analyses described in this paper are available at https://doi.org/10.5281/zenodo.14012085 (Schmitt, 2024), with a corresponding analysis notebook at https://sylvainschmitt.github.io/troll_eval/ (last access: 21 July 2025). Inventory data for Paracou trees over 10 cm are available by request on the CIRAD data verse: https://dataverse.cirad.fr/dataverse/paracou (Derroire et al., 2022). Paracou understorey trees are available by request from PIs GS, GD, and JC. Aerial lidar scanning data from Paracou are available by request (PI: GV) from dos-Santos et al. (2019) for Tapajos. Species data are available from Jucker et al. (2022), Maréchaux et al. (2015), Guillemot et al. (2022), Vleminckx et al. (2021), Maréchaux et al. (2019), Schmitt and Boisseaux (2023), Boisseaux et al. (2025), Ziegler et al. (2019), Baraloto et al. (2010), and TRY (Kattge et al., 2020). Soil data have been collected from Van Langenhove et al. (2021), Silver et al. (2000), Quesada et al. (2010), Sabatier et al. (1997), and Nepstad et al. (2002). Eddy covariance data from the Paracou and Tapajos sites are available on FLUXNET at https://fluxnet.fluxdata.org (Pastorello et al., 2020b). ERA5-Land data are available on the Climate Data Store: https://doi.org/10.24381/cds.e2161bac (Muñoz Sabater, 2019) TROPOMI SIF satellite data are available in Chen et al. (2022). Litterfall data at Tapajos are available online through the Oak Ridge National Laboratory (ORNL) Distributed Active Archive Center (DAAC) at https://doi.org/10.3334/ORNLDAAC/862 (Rice et al., 2008) and upon request at Paracou from PI DB. MODIS LAI data are available online and were extracted from PLUMBER2 on Research Data Australia: https://doi.org/10.25914/5FDB0902607E1 (Ukkola, 2020). Terrestrial LAD data from Tapajos are available in Smith et al. (2019). Lidar PAD data from Paracou are available upon request from PIs NB and GV. LAI variations among young, mature, and leaf cohorts are available from the reanalysis of Yang et al. (2023) at https://doi.org/10.6084/m9.figshare.21700955.v4 (Yang et al., 2022) and from the phenological camera of Wu et al. (2016) at https://doi.org/10.5061/dryad.8fb47 (Wu et al., 2017b). Tapajos soil moisture data from Restrepo-Coupe et al. (2024) are available at https://doi.org/10.5061/dryad.d51c5b08g (Restrepo-Coupe et al., 2023).
SyS and IM designed the model assessment and carried out the TROLL 4.0 simulations. SyS, FJF, JC, and IM developed TROLL 4.0. SyS, FJF, NB, MB, DB, BB, XC, GD, JL, NRC, ScS, GS, PV, GV, CZ, JC, and IM contributed to the data collection and compilation. SyS and IM wrote the paper. All authors contributed to the writing.
The contact author has declared that none of the authors has any competing interests.
Publisher’s note: Copernicus Publications remains neutral with regard to jurisdictional claims made in the text, published maps, institutional affiliations, or any other geographical representation in this paper. While Copernicus Publications makes every effort to include appropriate place names, the final responsibility lies with the authors.
We are particularly grateful to all the ground workers and data collectors (forest inventories, eddy flux measurements, litter traps, lidar acquisition, sampling and measurement of functional traits, and more) who are not named here but who contributed to the vast knowledge base without which the evaluation of TROLL 4.0 would not have been impossible. We are grateful to the GenoToul bioinformatics facility (Castanet-Tolosan, Toulouse, Occitanie, France, https://doi.org/10.15454/1.5572369328961167E12, GenoToul, 2025) for providing computing resources.
This research has been supported by funding from the ANR (the French National Research Agency) under the “Investissements d'avenir” programme with the references ANR-16-IDEX-0006, ANR-10-LABX-25-01, and ANR-10-LABX-0041; the Amazonian Landscapes in Transition ANR project (ALT); the CNES Biomass-Valo project; and ESA CCI-BIOMASS.
This paper was edited by Dalei Hao and reviewed by Xiangtao Xu and three anonymous referees.
Aguilos, M., Hérault, B., Burban, B., Wagner, F., and Bonal, D.: What drives long-term variations in carbon flux and balance in a tropical rainforest in French Guiana?, Agr. Forest Meteorol., 253–254, 114–123, https://doi.org/10.1016/j.agrformet.2018.02.009, 2018.
Allen, R. G., Pereira, L. S., Raes, D., and Smith, M.: Crop evapotranspiration-Guidelines for computing crop water requirements-FAO Irrigation and drainage paper 56, Fao, Rome, 300, D05109, https://www.avwatermaster.org/filingdocs/195/70653/172618e_5xAGWAx8.pdf (last access: 23 July 2025), 1998.
Alvarez-Buylla, E. R. and Martinez-Ramos, M.: Seed bank versus seed rain in the regeneration of a tropical pioneer tree, Oecologia, 84, 314–325, 1990.
Anderegg, W., Konings, A., Trugman, A., Yu, K., Bowling, D., Gabbitas, R., Karp, D., Pacala, S., Sperry, J., Sulman, B., and Zenes, N.: Hydraulic diversity of forests regulates ecosystem resilience during drought, Nature, 561, 538–541, 2018.
Aragão, L. E. O. C., Malhi, Y., Metcalfe, D. B., Silva-Espejo, J. E., Jiménez, E., Navarrete, D., Almeida, S., Costa, A. C. L., Salinas, N., Phillips, O. L., Anderson, L. O., Alvarez, E., Baker, T. R., Goncalvez, P. H., Huamán-Ovalle, J., Mamani-Solórzano, M., Meir, P., Monteagudo, A., Patiño, S., Peñuela, M. C., Prieto, A., Quesada, C. A., Rozas-Dávila, A., Rudas, A., Silva Jr., J. A., and Vásquez, R.: Above- and below-ground net primary productivity across ten Amazonian forests on contrasting soils, Biogeosciences, 6, 2759–2778, https://doi.org/10.5194/bg-6-2759-2009, 2009.
Bai, J., Ren, C., Shi, X., Xiang, H., Zhang, W., Jiang, H., Ren, Y., Xi, Y., Wang, Z., and Mao, D.: Tree species diversity impacts on ecosystem services of temperate forests, Ecol. Indic., 167, 112639, https://doi.org/10.1016/j.ecolind.2024.112639, 2024.
Baldocchi, D. D.: Assessing the eddy covariance technique for evaluating carbon dioxide exchange rates of ecosystems: past, present and future, Glob. Change Biol., 9, 479–492, https://doi.org/10.1046/j.1365-2486.2003.00629.x, 2003.
Baraloto, C., Timothy Paine, C. E., Poorter, L., Beauchene, J., Bonal, D., Domenach, A.-M., Hérault, B., Patiño, S., Roggy, J.-C., and Chave, J.: Decoupled leaf and stem economics in rain forest trees, Ecol. Lett., 13, 1338–1347, https://doi.org/10.1111/j.1461-0248.2010.01517.x, 2010a.
Baraloto, C., Timothy Paine, C. E., Patiño, S., Bonal, D., Hérault, B., and Chave, J.: Functional trait variation and sampling strategies in species-rich plant communities, Funct. Ecol., 24, 208–216, https://doi.org/10.1111/j.1365-2435.2009.01600.x, 2010b.
Blaser, J. and Küchli, C.: Globale Walderhaltung und-bewirtschaftung und ihre Finanzierung: eine Bestandesaufnahme | Global forest conservation and management and its financing: an appraisal, Schweizerische Zeitschrift für Forstwesen, 162, 107–116, 2011.
Bloomfield, K. J., Van Hoolst, R., Balzarolo, M., Janssens, I. A., Vicca, S., Ghent, D., and Prentice, I. C.: Towards a general monitoring system for terrestrial primary production: A test spanning the european drought of 2018, Remote Sens., 15, 1693, https://doi.org/10.3390/rs15061693, 2023.
Boisseaux, M., Nemetschek, D., Baraloto, C., Burban, B., Casado-Garcia, A., Cazal, J., Clément, J., Derroire, G., Fortunel, C., Goret, J.-Y., Heras, J., Jaouen, G., Maréchaux, I., Scoffoni, C., Vieilledent, G., Vleminckx, J., Coste, S., Schimann, H., and Stahl, C.: Shifting trait coordination along a soil‐moisture‐nutrient gradient in tropical forests, Funct. Ecol., 39, 21–37, 2025.
Bonal, D., Bosc, A., Ponton, S., Goret, J.-Y., Burban, B., Gross, P., Bonnefond, J.-M., Elbers, J., Longdoz, B., Epron, D., Guehl, J.-M., and Granier, A.: Impact of severe dry season on net ecosystem exchange in the Neotropical rainforest of French Guiana, Glob. Change Biol., 14, 1917–1933, https://doi.org/10.1111/j.1365-2486.2008.01610.x, 2008.
Bonan, G. B.: Forests and Climate Change: Forcings, Feedbacks, and the Climate Benefits of Forests, Science, 320, 1444–1449, https://doi.org/10.1126/science.1155121, 2008.
Chave, J., Andalo, C., Brown, S., Cairns, M. A., Chambers, J. Q., Eamus, D., Fölster, H., Fromard, F., Higuchi, N., Kira, T., Lescure, J.-P., Nelson, B. W., Ogawa, H., Puig, H., Riéra, B., and Yamakura, T.: Tree allometry and improved estimation of carbon stocks and balance in tropical forests, Oecologia, 145, 87–99, https://doi.org/10.1007/s00442-005-0100-x, 2005.
Chave, J., Navarrete, D., Almeida, S., Álvarez, E., Aragão, L. E. O. C., Bonal, D., Châtelet, P., Silva-Espejo, J. E., Goret, J.-Y., von Hildebrand, P., Jiménez, E., Patiño, S., Peñuela, M. C., Phillips, O. L., Stevenson, P., and Malhi, Y.: Regional and seasonal patterns of litterfall in tropical South America, Biogeosciences, 7, 43–55, https://doi.org/10.5194/bg-7-43-2010, 2010.
Chen, X., Maignan, F., Viovy, N., Bastos, A., Goll, D., Wu, J., Liu, L., Yue, C., Peng, S., Yuan, W., da Conceição, A. C., O'Sullivan, M., and Ciais, P.: Novel Representation of Leaf Phenology Improves Simulation of Amazonian Evergreen Forest Photosynthesis in a Land Surface Model, J. Adv. Model. Earth Sy., 12, e2018MS001565, https://doi.org/10.1029/2018ms001565, 2020.
Chen, X., Huang, Y., Nie, C., Zhang, S., Wang, G., Chen, S., and Chen, Z.: A long-term reconstructed TROPOMI solar-induced fluorescence dataset using machine learning algorithms, Scientific Data, 9, 427, https://doi.org/10.1038/s41597-022-01520-1, 2022.
Cui, W. and Chui, T. F. M.: Temporal and spatial variations of energy balance closure across FLUXNET research sites, Agr. Forest Meteorol., 271, 12–21, https://doi.org/10.1016/j.agrformet.2019.02.026, 2019.
Cusack, D. F., Christoffersen, B., Smith-Martin, C. M., Andersen, K. M., Cordeiro, A. L., Fleischer, K., Wright, S. J., Guerrero-Ramírez, N. R., Lugli, L. F., McCulloch, L. A., Sanchez-Julia, M., Batterman, S. A., Dallstream, C., Fortunel, C., Toro, L., Fuchslueger, L., Wong, M. Y., Yaffar, D., Fisher, J. B., Arnaud, M., Dietterich, L. H., Addo-Danso, S. D., Valverde-Barrantes, O. J., Weemstra, M., Ng, J. C., and Norby, R. J.: Toward a coordinated understanding of hydro-biogeochemical root functions in tropical forests for application in vegetation models, New Phytol., 242, 351–371, https://doi.org/10.1111/nph.19561, 2024.
De Frenne, P., Zellweger, F., Rodríguez-Sánchez, F., Scheffers, B. R., Hylander, K., Luoto, M., Vellend, M., Verheyen, K., and Lenoir, J.: Global buffering of temperatures under forest canopies, Nature Ecology & Evolution, 3, 744–749, https://doi.org/10.1038/s41559-019-0842-1, 2019.
De Kauwe, M. G., Medlyn, B. E., Knauer, J., and Williams, C. A.: Ideas and perspectives: how coupled is the vegetation to the boundary layer?, Biogeosciences, 14, 4435–4453, https://doi.org/10.5194/bg-14-4435-2017, 2017.
Derroire, G., Hérault, B., Rossi, V., Blanc, L., Gourlet-Fleury, S., and Schmitt, L.: Paracou Biodiversity Plots, CIRAD Dataverse [data set], https://doi.org/10.18167/DVN1/NSCWF0, 2022.
Diao, H., Cernusak, L. A., Saurer, M., Gessler, A., Siegwolf, R. T. W., and Lehmann, M. M.: Uncoupling of stomatal conductance and photosynthesis at high temperatures: mechanistic insights from online stable isotope techniques, New Phytol., 241, 2366–2378, https://doi.org/10.1111/nph.19558, 2024.
Díaz-Yáñez, O., Käber, Y., Anders, T., Bohn, F., Braziunas, K. H., Brůna, J., Fischer, R., Fischer, S. M., Hetzer, J., Hickler, T., Hochauer, C., Lexer, M. J., Lischke, H., Mairota, P., Merganič, J., Merganičová, K., Mette, T., Mina, M., Morin, X., Nieberg, M., Rammer, W., Reyer, C. P. O., Scheiter, S., Scherrer, D., and Bugmann, H.: Tree regeneration in models of forest dynamics: A key priority for further research, Ecosphere, 15, e4807, https://doi.org/10.1002/ecs2.4807, 2024.
dos-Santos, M. N., Keller, M. M., and Morton, D. C.: LiDAR Surveys over Selected Forest Research Sites, Brazilian Amazon, 2008–2018, ORNL DAAC [data set], https://doi.org/10.3334/ORNLDAAC/1644, 2019.
Doughty, C. E. and Goulden, M. L.: Seasonal patterns of tropical forest leaf area index and CO2 exchange, J. Geophys. Res.-Biogeo., 113, G00B06, https://doi.org/10.1029/2007jg000590, 2008.
Duursma, R. A., Blackman, C. J., Lopéz, R., Martin-StPaul, N. K., Cochard, H., and Medlyn, B. E.: On the minimum leaf conductance: its role in models of plant water use, and ecological and environmental controls, New Phytol., 221, 693–705, https://doi.org/10.1111/nph.15395, 2018.
Evans, M. R.: Modelling ecological systems in a changing world, Philos. T. R. Soc. B, 367, 181–190, https://doi.org/10.1098/rstb.2011.0172, 2012.
Farquhar, G. D., von Caemmerer, S., and Berry, J. A.: A biochemical model of photosynthetic CO2 assimilation in leaves of C3 species, Planta, 149, 78–90, https://doi.org/10.1007/bf00386231, 1980.
Fischer, F. J., Maréchaux, I., and Chave, J.: Improving plant allometry by fusing forest models and remote sensing, New Phytol., 223, 1159–1165, https://doi.org/10.1111/nph.15810, 2019.
Fischer, F. J., Jackson, T., Vincent, G., and Jucker, T.: Robust characterisation of forest structure from airborne laser scanning – A systematic assessment and sample workflow for ecologists, Methods Ecol. Evol., 15, 1873–1888, https://doi.org/10.1111/2041-210x.14416, 2024.
Fisher, J. B., Huntzinger, D. N., Schwalm, C. R., and Sitch, S.: Modeling the Terrestrial Biosphere, Annu. Rev. Env. Resour., 39, 91–123, https://doi.org/10.1146/annurev-environ-012913-093456, 2014.
Fisher, R. A., Koven, C. D., Anderegg, W. R. L., Christoffersen, B. O., Dietze, M. C., Farrior, C. E., Holm, J. A., Hurtt, G. C., Knox, R. G., Lawrence, P. J., Lichstein, J. W., Longo, M., Matheny, A. M., Medvigy, D., Muller-Landau, H. C., Powell, T. L., Serbin, S. P., Sato, H., Shuman, J. K., Smith, B., Trugman, A. T., Viskari, T., Verbeeck, H., Weng, E., Xu, C., Xu, X., Zhang, T., and Moorcroft, P. R.: Vegetation demographics in Earth System Models: A review of progress and priorities, Glob. Change Biol., 24, 35–54, https://doi.org/10.1111/gcb.13910, 2017.
Fortunel, C., Stahl, C., Heuret, P., Nicolini, E., and Baraloto, C.: Disentangling the effects of environment and ontogeny on tree functional dimensions for congeneric species in tropical forests, New Phytol., 226, 385–395, https://doi.org/10.1111/nph.16393, 2020.
Franklin, O., Harrison, S. P., Dewar, R., Farrior, C. E., Brännström, Å., Dieckmann, U., Pietsch, S., Falster, D., Cramer, W., Loreau, M., Wang, H., Mäkelä, A., Rebel, K. T., Meron, E., Schymanski, S. J., Rovenskaya, E., Stocker, B. D., Zaehle, S., Manzoni, S., Oijen, M. van, Wright, I. J., Ciais, P., van Bodegom, P. M., Peñuelas, J., Hofhansl, F., Terrer, C., Soudzilovskaia, N. A., Midgley, G., and Prentice, I. C.: Organizing principles for vegetation dynamics, Nat. Plants, 6, 444–453, https://doi.org/10.1038/s41477-020-0655-x, 2020.
Funk, C., Peterson, P., Landsfeld, M., Pedreros, D., Verdin, J., Shukla, S., Husak, G., Rowland, J., Harrison, L., Hoell, A., and Michaelsen, J.: The climate hazards infrared precipitation with stations – a new environmental record for monitoring extremes, Scientific Data, 2, 1–21, https://doi.org/10.1038/sdata.2015.66, 2015.
Gao, Z., Liu, H., Missik, J. E. C., Yao, J., Huang, M., Chen, X., Arntzen, E., and Mcfarland, D. P.: Mechanistic links between underestimated CO2 fluxes and non-closure of the surface energy balance in a semi-arid sagebrush ecosystem, Environ. Res. Lett., 14, 044016, https://doi.org/10.1088/1748-9326/ab082d, 2019.
GenoToul: GenoToul bioinformatics Home, https://doi.org/10.15454/1.5572369328961167E12, 2025.
Goncalves, F. G., Treuhaft, R. N., Dos Santos, J. R., Graca, P., Almeida, A., and Law, B. E.: Tree Inventory and Biometry Measurements, Tapajos National Forest, Para, Brazil, 2010, ORNL DAAC [data set], https://doi.org/10.3334/ORNLDAAC/1552, 2018.
Gourlet-Fleury, S., Guehl, J. M. J. M., and Laroussinie, O.: Ecology and management of a neotropical rainforest. Lessons drawn from Paracou, a long-term experimental research site in French Guiana, Elsevier, 350 pp., ISBN 2-84299-455-8, 2004.
Guan, K., Pan, M., Li, H., Wolf, A., Wu, J., Medvigy, D., Caylor, K. K., Sheffield, J., Wood, E. F., Malhi, Y., Liang, M., Kimball, J. S., Saleska, Scott R., Berry, J., Joiner, J., and Lyapustin, A. I.: Photosynthetic seasonality of global tropical forests constrained by hydroclimate, Nat. Geosci., 8, 284–289, https://doi.org/10.1038/ngeo2382, 2015.
Guillemot, J., Martin-StPaul, N. K., Bulascoschi, L., Poorter, L., Morin, X., Pinho, B. X., Maire, G. le, R. L. Bittencourt, P., Oliveira, R. S., Bongers, F., Brouwer, R., Pereira, L., Gonzalez Melo, G. A., Boonman, C. C. F., Brown, K. A., Cerabolini, B. E. L., Niinemets, Ü., Onoda, Y., Schneider, J. V., Sheremetiev, S., and Brancalion, P. H. S.: Small and slow is safe: On the drought tolerance of tropical tree species, Glob. Change Biol., 28, 2622–2638, https://doi.org/10.1111/gcb.16082, 2022.
Hanbury-Brown, A. R., Ward, R. E., and Kueppers, L. M.: Forest regeneration within Earth system models: current process representations and ways forward, New Phytol., 235, 20–40, https://doi.org/10.1111/nph.18131, 2022.
Harper, A., Baker, I. T., Denning, A. S., Randall, D. A., Dazlich, D., and Branson, M.: Impact of Evapotranspiration on Dry Season Climate in the Amazon Forest, J. Climate, 27, 574–591, https://doi.org/10.1175/jcli-d-13-00074.1, 2014.
Hérault, B., Bachelot, B., Poorter, L., Rossi, V., Bongers, F., Chave, J., Paine, C. E. T., Wagner, F., and Baraloto, C.: Functional traits shape ontogenetic growth trajectories of rain forest tree species, J. Ecol., 99, 1431–1440, 2011.
Hiltner, U., Huth, A., and Fischer, R.: Importance of the forest state in estimating biomass losses from tropical forests: combining dynamic forest models and remote sensing, Biogeosciences, 19, 1891–1911, https://doi.org/10.5194/bg-19-1891-2022, 2022.
Holthuijzen, A. M. A. and Boerboom, J. H. A.: The cecropia seedbank in the surinam lowland rain forest, Biotropica, 14, 62, https://doi.org/10.2307/2387761, 1982.
Joetzjer, E., Maignan, F., Chave, J., Goll, D., Poulter, B., Barichivich, J., Maréchaux, I., Luyssaert, S., Guimberteau, M., Naudts, K., Bonal, D., and Ciais, P.: Effect of tree demography and flexible root water uptake for modeling the carbon and water cycles of Amazonia, Ecol. Model., 469, 109969, https://doi.org/10.1016/j.ecolmodel.2022.109969, 2022.
Jucker, T., Fischer, F. J., Chave, J., Coomes, D. A., Caspersen, J., Ali, A., Panzou, G. J. L., Feldpausch, T. R., Falster, D., Usoltsev, V. A., Adu-Bredu, S., Alves, L. F., Aminpour, M., Angoboy, I. B., Anten, N. P. R., Antin, C., Askari, Y., Muñoz, R., Ayyappan, N., Balvanera, P., Banin, L., Barbier, N., Battles, J. J., Beeckman, H., Bocko, Y. E., Bond-Lamberty, B., Bongers, F., Bowers, S., Brade, T., van Breugel, M., Chantrain, A., Chaudhary, R., Dai, J., Dalponte, M., Dimobe, K., Domec, J. C., Doucet, J. L., Duursma, R. A., Enríquez, M., van Ewijk, K. Y., Farfán-Rios, W., Fayolle, A., Forni, E., Forrester, D. I., Gilani, H., Godlee, J. L., Gourlet-Fleury, S., Haeni, M., Hall, J. S., He, J.K., Hemp, A., Hernández-Stefanoni, J. L., Higgins, S. I., Holdaway, R. J., Hussain, K., Hutley, L. B., Ichie, T., Iida, Y., Jiang, H. S., Joshi, P. R., Kaboli, H., Larsary, M. K., Kenzo, T., Kloeppel, B. D., Kohyama, T., Kunwar, S., Kuyah, S., Kvasnica, J., Lin, S., Lines, E. R., Liu, H., Lorimer, C., Loumeto, J. J., Malhi, Y., Marshall, P. L., Mattsson, E., Matula, R., Meave, J. A., Mensah, S., Mi, X., Momo, S., Moncrieff, G. R., Mora, F., Nissanka, S. P., O'Hara, K. L., Pearce, S., Pelissier, R., Peri, P. L., Ploton, P., Poorter, L., Pour, M. J., Pourbabaei, H., Dupuy-Rada, J. M., Ribeiro, S. C., Ryan, C., Sanaei, A., Sanger, J., Schlund, M., Sellan, G., Shenkin, A., Sonké, B., Sterck, F. J., Svátek, M., Takagi, K., Trugman, A. T., Ullah, F., Vadeboncoeur, M. A., Valipour, A., Vanderwel, M. C., Vovides, A. G., Wang, W., Wang, L. Q., Wirth, C., Woods, M., Xiang, W., Ximenes, F. A., Xu, Y., Yamada, T., and Zavala, M. A.: Tallo: A global tree allometry and crown architecture database, Glob. Change Biol., 28, 5254–5268, https://doi.org/10.1111/gcb.16302, 2022.
Jucker, T., Fischer, F. J., Chave, J., Coomes, D. A., Caspersen, J., Ali, A., Panzou, G. J. L., Feldpausch, T. R., Falster, D., Usoltsev, V. A., Jackson, T. D., Adu-Bredu, S., Alves, L. F., Aminpour, M., Ilondea, B. A., Anten, N. P. R., Antin, C., Askari, Y., Ayyappan, N., Banin, L. F., Barbier, N., Battles, J. J., Beeckman, H., Bocko, Y. E., Bond-Lamberty, B., Bongers, F., Bowers, S., van Breugel, M., Chantrain, A., Chaudhary, R., Dai, J., Dalponte, M., Dimobe, K., Domec, J.-C., Doucet, J.-L., Dupuy Rada, J. M., Duursma, R. A., Enríquez, M., van Ewijk, K. Y., Farfán-Rios, W., Fayolle, A., Ferretti, M., Forni, E., Forrester, D. I., Gilani, H., Godlee, J. L., Haeni, M., Hall, J. S., He, J.-K., Hemp, A., Hernández-Stefanoni, J. L., Higgins, S. I., Holdaway, R. J., Hussain, K., Hutley, L. B., Ichie, T., Iida, Y., Jiang, H.-S., Joshi, P. R., Kaboli, H., Larsary, M. K., Kenzo, T., Kloeppel, B. D., Kohyama, T. S., Kunwar, S., Kuyah, S., Kvasnica, J., Lin, S., Lines, E. R., Liu, H., Lorimer, C., Loumeto, J.-J., Malhi, Y., Marshall, P. L., Mattsson, E., Matula, R., Meave, J. A., Mensah, S., Mi, X., Momo, S. T., Moncrieff, G. R., Mora, F., Muñoz, R., Nissanka, S. P., Hajar, Z. S. N., O’Hara, K. L., Pearce, S., Pelissier, R., Peri, P. L., Ploton, P., Poorter, L., Pour, M. J., Pourbabaei, H., Ribeiro, S. C., Ryan, C., Sanaei, A., Sanger, J., Schlund, M., Sellan, G., Shenkin, A., Sonké, B., Sterck, F. J., Svátek, M., Takagi, K., Trugman, A. T., Vadeboncoeur, M. A., Valipour, A., Vanderwel, M. C., Vovides, A. G., Waldner, P., Wang, W., Wang, L.-Q., Wirth, C., Woods, M., Xiang, W., Ximenes, F. d. A., Xu, Y., Yamada, T., Zavala, M. A., and Zimmermann, N. E.: The global spectrum of tree crown architecture, Nat. Commun., 16, 4876, https://doi.org/10.1038/s41467-025-60262-x, 2025.
Kattge, J., Bönisch, G., Díaz, S. et al.: TRY plant trait database – enhanced coverage and open access, Glob. Change Biol., 26, 119–188, https://doi.org/10.1111/gcb.14904, 2020.
Kikuzawa, K.: A Cost-Benefit Analysis of Leaf Habit and Leaf Longevity of Trees and Their Geographical Pattern, The American Naturalist, 138, 1250–1263, https://doi.org/10.1086/285281, 1991.
Kitajima, K., Llorens, A. M., Stefanescu, C., Timchenko, M. V., Lucas, P. W., and Wright, S. J.: How cellulose‐based leaf toughness and lamina density contribute to long leaf lifespans of shade‐tolerant species, New Phytol., 195, 640-652, 2012.
Knapp, N., Fischer, R., and Huth, A.: Linking lidar and forest modeling to assess biomass estimation across scales and disturbance states, Remote Sens. Environ., 205, 199–209, https://doi.org/10.1016/j.rse.2017.11.018, 2018.
Koch, A., Hubau, W., and Lewis, S. L.: Earth System Models Are Not Capturing Present-Day Tropical Forest Carbon Dynamics, Earth's Future, 9, e2020EF001874, https://doi.org/10.1029/2020ef001874, 2021.
Köster, J. and Rahmann, S.: Snakemakea scalable bioinformatics workflow engine, Bioinformatics, 28, 2520–2522, https://doi.org/10.1093/bioinformatics/bts480, 2012.
Kunert, N., Aparecido, L. M. T., Wolff, S., Higuchi, N., dos Santos, J., de Araujo, A. C., and Trumbore, S.: A revised hydrological model for the Central Amazon: The importance of emergent canopy trees in the forest water budget, Agr. Forest Meteorol., 239, 47–57, https://doi.org/10.1016/j.agrformet.2017.03.002, 2017.
Kurtzer, G. M., Sochat, V., and Bauer, M. W.: Singularity: Scientific containers for mobility of compute, PLOS ONE, 12, e0177459, https://doi.org/10.1371/journal.pone.0177459, 2017.
Lamour, J., Davidson, K. J., Ely, K. S., Le Moguédec, G., Leakey, A. D. B., Li, Q., Serbin, S. P., and Rogers, A.: An improved representation of the relationship between photosynthesis and stomatal conductance leads to more stable estimation of conductance parameters and improves the goodness-of-fit across diverse data sets, Glob. Change Biol., 28, 3537–3556, https://doi.org/10.1111/gcb.16103, 2022.
Lamour, J., Davidson, K. J., Ely, K. S., Le Moguédec, G., Anderson, J. A., Li, Q., Calderón, O., Koven, C. D., Wright, S. J., Walker, A. P., Serbin, S. P., and Rogers, A.: The effect of the vertical gradients of photosynthetic parameters on the CO2 assimilation and transpiration of a Panamanian tropical forest, New Phytol., 238, 2345–2362, https://doi.org/10.1111/nph.18901, 2023.
Lawrence, D. and Vandecar, K.: Effects of tropical deforestation on climate and agriculture, Nat. Clim. Change, 5, 27–36, https://doi.org/10.1038/nclimate2430, 2014.
Long, S. P., Postl, W. F., and Bolher-Nordenkampf, H. R.: Quantum yields for uptake of carbon dioxide in C3 vascular plants of contrasting habitats and taxonomic groupings, Planta, 189, 226–234, https://doi.org/10.1007/bf00195081, 1993.
Longo, M., Knox, R. G., Levine, N. M., Alves, L. F., Bonal, D., Camargo, P. B., Fitzjarrald, D. R., Hayek, M. N., Restrepo-Coupe, N., Saleska, S. R., da Silva, R., Stark, S. C., Tapajós, R. P., Wiedemann, K. T., Zhang, K., Wofsy, S. C., and Moorcroft, P. R.: Ecosystem heterogeneity and diversity mitigate Amazon forest resilience to frequent extreme droughts, New Phytol., 219, 914–931, https://doi.org/10.1111/nph.15185, 2018.
Longo, M., Knox, R. G., Levine, N. M., Swann, A. L. S., Medvigy, D. M., Dietze, M. C., Kim, Y., Zhang, K., Bonal, D., Burban, B., Camargo, P. B., Hayek, M. N., Saleska, S. R., da Silva, R., Bras, R. L., Wofsy, S. C., and Moorcroft, P. R.: The biophysics, ecology, and biogeochemistry of functionally diverse, vertically and horizontally heterogeneous ecosystems: the Ecosystem Demography model, version 2.2 – Part 2: Model evaluation for tropical South America, Geosci. Model Dev., 12, 4347–4374, https://doi.org/10.5194/gmd-12-4347-2019, 2019b.
MacArthur, R. H. Horn, H. S.: Foliage profile by vertical measurements, Ecology, 50, 802–804, 1969.
Malhi, Y., Doughty, C., and Galbraith, D.: The allocation of ecosystem net primary productivity in tropical forests, Philos. T. R. Soc. B, 366, 3225–3245, https://doi.org/10.1098/rstb.2011.0062, 2011.
Manoli, G., Ivanov, V. Y., and Fatichi, S.: Dry-season greening and water stress in Amazonia: The role of modeling leaf phenology, J. Geophys. Res.-Biogeo., 123, 1909–1926, https://doi.org/10.1029/2017JG004282, 2018.
Manzoni, S., Vico, G., Thompson, S., Beyer, F., and Weih, M.: Contrasting leaf phenological strategies optimize carbon gain under droughts of different duration, Adv. Water Resour., 84, 37–51, 2015.
Maréchaux, I. and Chave, J.: An individual‐based forest model to jointly simulate carbon and tree diversity in Amazonia: description and applications, Ecol. Monogr., 87, 632–664, 2017.
Maréchaux, I., Bartlett, M. K., Sack, L., Baraloto, C., Engel, J., Joetzjer, E., and Chave, J.: Drought tolerance as predicted by leaf water potential at turgor loss point varies strongly across species within an Amazonian forest, Funct. Ecol., 29, 1268–1277, https://doi.org/10.1111/1365-2435.12452, 2015.
Maréchaux, I., Saint-André, L., Bartlett, M. K., Sack, L., and Chave, J.: Leaf drought tolerance cannot be inferred from classic leaf traits in a tropical rainforest, J. Ecol., 108, 1030–1045, https://doi.org/10.1111/1365-2745.13321, 2019.
Maréchaux, I., Langerwisch, F., Huth, A., Bugmann, H., Morin, X., Reyer, C. P. O., Seidl, R., Collalti, A., Dantas de Paula, M., Fischer, R., Gutsch, M., Lexer, M. J., Lischke, H., Rammig, A., Rödig, E., Sakschewski, B., Taubert, F., Thonicke, K., Vacchiano, G., and Bohn, F. J.: Tackling unresolved questions in forest ecology: The past and future role of simulation models, Ecol. Evol., 11, 3746–3770, https://doi.org/10.1002/ece3.7391, 2021.
Maréchaux, I., Fischer, F. J., Schmitt, S., and Chave, J.: TROLL-code/TROLL: GMD preprint (4.0.0-GMD), Zenodo [code], https://doi.org/10.5281/zenodo.14013147, 2024.
Maréchaux, I., Fischer, F. J., Schmitt, S., and Chave, J.: TROLL 4.0: representing water and carbon fluxes, leaf phenology, and intraspecific trait variation in a mixed-species individual-based forest dynamics model – Part 1: Model description, Geosci. Model Dev., 18, 5143–5204, https://doi.org/10.5194/gmd-18-5143-2025, 2025.
Marrs, J. K., Reblin, J. S., Logan, B. A., Allen, D. W., Reinmann, A. B., Bombard, D. M., Tabachnik, D., and Hutyra, L. R.: Solar-Induced Fluorescence Does Not Track Photosynthetic Carbon Assimilation Following Induced Stomatal Closure, Geophys. Res. Lett., 47, e2020GL087956, https://doi.org/10.1029/2020gl087956, 2020.
McDowell, N., Allen, C. D., Anderson-Teixeira, K., Brando, P., Brienen, R., Chambers, J., Christoffersen, B., Davies, S., Doughty, C., Duque, A., Espirito-Santo, F., Fisher, R., Fontes, C. G., Galbraith, D., Goodsman, D., Grossiord, C., Hartmann, H., Holm, J., Johnson, D. J., Kassim, A. R., Keller, M., Koven, C., Kueppers, L., Kumagai, T., Malhi, Y., McMahon, S. M., Mencuccini, M., Meir, P., Moorcroft, P., Muller-Landau, H. C., Phillips, O. L., Powell, T., Sierra, C. A., Sperry, J., Warren, J., Xu, C., and Xu, X.: Drivers and mechanisms of tree mortality in moist tropical forests, New Phytol., 219, 851–869, https://doi.org/10.1111/nph.15027, 2018.
McMahon, S. M., Harrison, S. P., Armbruster, W. S., Bartlein, P. J., Beale, C. M., Edwards, M. E., Kattge, J., Midgley, G., Morin, X., and Prentice, I. C.: Improving assessment and modelling of climate change impacts on global terrestrial biodiversity, Trends Ecol. Evol., 26, 249–259, https://doi.org/10.1016/j.tree.2011.02.012, 2011.
Medlyn, B. E., Robinson, A. P., Clement, R., and McMurtrie, R. E.: On the validation of models of forest CO2 exchange using eddy covariance data: some perils and pitfalls, Tree Physiol., 25, 839–857, https://doi.org/10.1093/treephys/25.7.839, 2005.
Medlyn, B. E., Duursma, R. A., De Kauwe, M. G., and Prentice, I. C.: The optimal stomatal response to atmospheric CO2 concentration: Alternative solutions, alternative interpretations, Agr. Forest Meteorol., 182–183, 200–203, https://doi.org/10.1016/j.agrformet.2013.04.019, 2013.
Meir, P., Grace, J., and Miranda, A. C.: Photographic method to measure the vertical distribution of leaf area density in forests, Agr. Forest Meteorol., 102, 105–111, https://doi.org/10.1016/s0168-1923(00)00122-2, 2000.
Meunier, F., Verbruggen, W., Verbeeck, H., and Peaucelle, M.: Low sensitivity of three terrestrial biosphere models to soil texture over the South American tropics, Geosci. Model Dev., 15, 7573–7591, https://doi.org/10.5194/gmd-15-7573-2022, 2022.
Mokany, K., Ferrier, S., Connolly, S. R., Dunstan, P. K., Fulton, E. A., Harfoot, M. B., Harwood, T. D., Richardson, A. J., Roxburgh, S. H., Scharlemann, J. P. W., Tittensor, D. P., Westcott, D. A., and Wintle, B. A.: Integrating modelling of biodiversity composition and ecosystem function, Oikos, 125, 10–19, https://doi.org/10.1111/oik.02792, 2015.
Molto, Q., Hérault, B., Boreux, J.-J., Daullet, M., Rousteau, A., and Rossi, V.: Predicting tree heights for biomass estimates in tropical forests – a test from French Guiana, Biogeosciences, 11, 3121–3130, https://doi.org/10.5194/bg-11-3121-2014, 2014.
Montgomery, R. A. and Chazdon, R. L.: Forest structure, canopy architecture, and light transmittance in tropical wet forests, Ecology, 82, 2707–2718, https://doi.org/10.1890/0012-9658(2001)082[2707:fscaal]2.0.co;2, 2001.
Muller-Landau, H. C.: The tolerancefecundity trade-off and the maintenance of diversity in seed size, P. Natl. Acad. Sci. USA, 107, 4242–4247, https://doi.org/10.1073/pnas.0911637107, 2010.
Muñoz Sabater, J.: ERA5-Land hourly data from 1950 to present, Copernicus Climate Change Service (C3S) Climate Data Store (CDS) [data set], https://doi.org/10.24381/cds.e2161bac, 2019.
Muñoz-Sabater, J., Dutra, E., Agustí-Panareda, A., Albergel, C., Arduini, G., Balsamo, G., Boussetta, S., Choulga, M., Harrigan, S., Hersbach, H., Martens, B., Miralles, D. G., Piles, M., Rodríguez-Fernández, N. J., Zsoter, E., Buontempo, C., and Thépaut, J.-N.: ERA5-Land: a state-of-the-art global reanalysis dataset for land applications, Earth Syst. Sci. Data, 13, 4349–4383, https://doi.org/10.5194/essd-13-4349-2021, 2021.
Nepstad, D. C., Moutinho, P., Dias-Filho, M. B., Davidson, E., Cardinot, G., Markewitz, D., Figueiredo, R., Vianna, N., Chambers, J., Ray, D., Guerreiros, J. B., Lefebvre, P., Sternberg, L., Moreira, M., Barros, L., Ishida, F. Y., Tohlver, I., Belk, E., Kalif, K., and Schwalbe, K.: The effects of partial throughfall exclusion on canopy processes, aboveground production, and biogeochemistry of an Amazon forest, J. Geophys. Res.-Atmos., 107, 8085, https://doi.org/10.1029/2001jd000360, 2002.
Nunes, M. H., Camargo, J. L. C., Vincent, G., Calders, K., Oliveira, R. S., Huete, A., Mendes de Moura, Y., Nelson, B., Smith, M. N., Stark, S. C., and Maeda, E. E.: Forest fragmentation impacts the seasonality of Amazonian evergreen canopies, Nat. Commun., 13, 917, https://doi.org/10.1038/s41467-022-28490-7, 2022.
Paschalis, A., De Kauwe, M. G., Sabot, M., and Fatichi, S.: When do plant hydraulics matter in terrestrial biosphere modelling?, Glob. Change Biol., 30, e17022, https://doi.org/10.1111/gcb.17022, 2023.
Pastorello, G., Trotta, C., Canfora, E. et al.: The FLUXNET2015 dataset and the ONEFlux processing pipeline for eddy covariance data, Nature Publishing Group [data set], https://doi.org/10.5167/UZH-190509, 2020a.
Pastorello, G., Trotta, C., Canfora, E. et al.: The FLUXNET2015 dataset and the ONEFlux processing pipeline for eddy covariance data, Sci. Data 7, 225, https://doi.org/10.1038/s41597-020-0534-3, 2020b (data available at: https://fluxnet.fluxdata.org, last access: 6 September 2023)
Petri, C. A. and Galvão, L. S.: Sensitivity of seven MODIS vegetation indices to BRDF effects during the Amazonian dry season, Remote Sensing, 11, 1650, https://doi.org/10.3390/rs11141650, 2019.
Poorter, L., Oberbauer, S. F., and Clark, D. B.: Leaf optical properties along a vertical gradient in a tropical rain forest canopy in Costa Rica, Am. J. Bot., 82, 1257–1263, https://doi.org/10.1002/j.1537-2197.1995.tb12659.x, 1995.
Powell, T. L., Galbraith, D. R., Christoffersen, B. O., Harper, A., Imbuzeiro, H. M. A., Rowland, L., Almeida, S., Brando, P. M., Costa, A. C. L. da, Costa, M. H., Levine, N. M., Malhi, Y., Saleska, S. R., Sotta, E., Williams, M., Meir, P., and Moorcroft, P. R.: Confronting model predictions of carbon fluxes with measurements of Amazon forests subjected to experimental drought, New Phytol., 200, 350–365, https://doi.org/10.1111/nph.12390, 2013.
Prentice, I. C., Liang, X., Medlyn, B. E., and Wang, Y.-P.: Reliable, robust and realistic: the three R's of next-generation land-surface modelling, Atmos. Chem. Phys., 15, 5987–6005, https://doi.org/10.5194/acp-15-5987-2015, 2015.
Purves, D. and Pacala, S.: Predictive Models of Forest Dynamics, Science, 320, 1452–1453, https://doi.org/10.1126/science.1155359, 2008.
Quesada, C. A., Lloyd, J., Schwarz, M., Patiño, S., Baker, T. R., Czimczik, C., Fyllas, N. M., Martinelli, L., Nardoto, G. B., Schmerler, J., Santos, A. J. B., Hodnett, M. G., Herrera, R., Luizão, F. J., Arneth, A., Lloyd, G., Dezzeo, N., Hilke, I., Kuhlmann, I., Raessler, M., Brand, W. A., Geilmann, H., Moraes Filho, J. O., Carvalho, F. P., Araujo Filho, R. N., Chaves, J. E., Cruz Junior, O. F., Pimentel, T. P., and Paiva, R.: Variations in chemical and physical properties of Amazon forest soils in relation to their genesis, Biogeosciences, 7, 1515–1541, https://doi.org/10.5194/bg-7-1515-2010, 2010.
Rau, E. P., Fischer, F., Joetzjer, É., Maréchaux, I., Sun, I. F., and Chave, J.: Transferability of an individual-and trait-based forest dynamics model: A test case across the tropics, Ecol. Model., 463, 109801, https://doi.org/10.1016/j.ecolmodel.2021.109801, 2022.
Reich, P. B., Uhl, C., Walters, M. B., and Ellsworth, D. S.: Leaf lifespan as a determinant of leaf structure and function among 23 Amazonian tree species, Oecologia, 86, 16–24, 1991.
Reich, P. B., Walters, M. B., Ellsworth, D. S., Vose, J. M., Volin, J. C., Gresham, C., and Bowman, W. D.: Relationships of leaf dark respiration to leaf nitrogen, specific leaf area and leaf life-span: a test across biomes and functional groups, Oecologia, 114, 471–482, 1998.
Reichstein, M., Falge, E., Baldocchi, D., Papale, D., Aubinet, M., Berbigier, P., Bernhofer, C., Buchmann, N., Gilmanov, T., Granier, A., Grünwald, T., Havránková, K., Ilvesniemi, H., Janous, D., Knohl, A., Laurila, T., Lohila, A., Loustau, D., Matteucci, G., Meyers, T., Miglietta, F., Ourcival, J.-M., Pumpanen, J., Rambal, S., Rotenberg, E., Sanz, M., Tenhunen, J., Seufert, G., Vaccari, F., Vesala, T., Yakir, D., and Valentini, R.: On the separation of net ecosystem exchange into assimilation and ecosystem respiration: review and improved algorithm, Glob. Change Biol., 11, 1424–1439, https://doi.org/10.1111/j.1365-2486.2005.001002.x, 2005.
Restrepo-Coupe, N., Levine, N. M., Christoffersen, B. O., Albert, L. P., Wu, J., Costa, M. H., Galbraith, D., Imbuzeiro, H., Martins, G., Araujo, A. C. da, Malhi, Y. S., Zeng, X., Moorcroft, P., and Saleska, S. R.: Do dynamic global vegetation models capture the seasonality of carbon fluxes in the Amazon basin? A data-model intercomparison, Glob. Change Biol., 23, 191–208, https://doi.org/10.1111/gcb.13442, 2016.
Restrepo-Coupe, N., Saleska, S. R., and Wofsy, S. C.: Tapajos K67 tropical forest seasonal flux tower data, Dryad [data set], https://doi.org/10.5061/dryad.d51c5b08g, 2023.
Restrepo-Coupe, N., Campos, K. S., Alves, L. F., Longo, M., Wiedemann, K. T., Oliveira, R. C. de, Aragao, L. E. O. C., Christoffersen, B. O., Camargo, P. B., Figueira, A. M. e. S., Ferreira, M. L., Oliveira, R. S., Penha, D., Prohaska, N., Araujo, A. C. da, Daube, B. C., Wofsy, S. C., and Saleska, S. R.: Contrasting carbon cycle responses to dry (2015 El Niño) and wet (2008 La Niña) extreme events at an Amazon tropical forest, Agr. Forest Meteorol., 353, 110037, https://doi.org/10.1016/j.agrformet.2024.110037, 2024.
Rice, A. H., Pyle, E. H. P., Saleska, S. R., Hutyra, L., Palace, M., Keller, M., de Camargo, P. B., Portilho, K., Marques, D. F., and Wofsy, S. C.: Carbon balance and vegetation dynamics in an old‐growth Amazonian forest, Ecol. Appl., 14, 55–71, 2004.
Rice, A. H., Hammond, E. P., Saleska, S. R., Hutyra, L. R., Palace, M. W., Keller, M. M., De Camargo, P. B., Portilho, K., Marques, D., and Wofsy, S. C.: LBA-ECO CD-10 Forest Litter Data for km 67 Tower Site, Tapajos National Forest, ORNL DAAC [data set], https://doi.org/10.3334/ORNLDAAC/862, 2008.
Ross, J.: Net radiation in plant stands, Springer Netherlands, 344–353, https://doi.org/10.1007/978-94-009-8647-3_19, 1981.
Rutishauser, E., Wagner, F., Herault, B., Nicolini, E.-A., and Blanc, L.: Contrasting above-ground biomass balance in a Neotropical rain forest, J. Veg. Sci., 21, 672–682, https://doi.org/10.1111/j.1654-1103.2010.01175.x, 2010.
Sabatier, D., Grimaldi, M., Prévost, M.-F., Guillaume, J., Godron, M., Dosso, M., and Sabatier, D.: The influence of soil cover organization on the floristic and structural heterogeneity of a Guianan rain forest, Plant Ecol., 131, 81–108, https://doi.org/10.1023/a:1009775025850, 1997.
Sabot, M., De Kauwe, M., Medlyn, B., and Pitman, A.: One stomatal model to rule them all? Evaluating competing hypotheses to regulate the exchange of carbon and water against experimental data, EGU General Assembly 2020, Online, 4–8 May 2020, EGU2020-678, https://doi.org/10.5194/egusphere-egu2020-678, 2019.
Sakschewski, B., Bloh, W. von, Boit, A., Rammig, A., Kattge, J., Poorter, L., Peñuelas, J., and Thonicke, K.: Leaf and stem economics spectra drive diversity of functional plant traits in a dynamic global vegetation model, Glob. Change Biol., 21, 2711–2725, https://doi.org/10.1111/gcb.12870, 2015.
Saleska, S. R., Miller, S. D., Matross, D. M., Goulden, M. L., Wofsy, S. C., da Rocha, H. R., de Camargo, P. B., Crill, P., Daube, B. C., de Freitas, H. C., Hutyra, L., Keller, M., Kirchhoff, V., Menton, M., Munger, J. W., Pyle, E. H., Rice, A. H., and Silva, H.: Carbon in Amazon Forests: Unexpected Seasonal Fluxes and Disturbance-Induced Losses, Science, 302, 1554–1557, https://doi.org/10.1126/science.1091165, 2003.
Schmitt, S.: sylvainschmitt/troll_eval: GMD preprint (0.1.0), Zenodo [code], https://doi.org/10.5281/zenodo.14012085, 2024.
Schmitt, S. and Boisseaux, M.: Higher local intra- than interspecific variability in water- and carbon-related leaf traits among Neotropical tree species, Ann. Bot., 131, 801–811, https://doi.org/10.1093/aob/mcad042, 2023.
Schmitt, S., Salzet, G., Fischer, F. J., Maréchaux, I., and Chave, J.: rcontroll: An R interface for the individual-based forest dynamics simulator TROLL, Methods Ecol. Evol., 14, 2749–2757, https://doi.org/10.1111/2041-210x.14215, 2023a.
Schmitt, S., Hérault, B., and Derroire, G.: High intraspecific growth variability despite strong evolutionary legacy in an Amazonian forest, Ecol. Lett., 26, 2135–2146, 2023b.
Schmitt, S., Salzet, G., Fischer, F. J., Maréchaux, I., and Chave, J.: sylvainschmitt/rcontroll: GMD preprint (v0.2.0), Zenodo [code], https://doi.org/10.5281/zenodo.14012116, 2024.
Silver, W. L., Neff, J., McGroddy, M., Veldkamp, E., Keller, M., and Cosme, R.: Effects of soil texture on belowground carbon and nutrient storage in a lowland amazonian forest ecosystem, Ecosystems, 3, 193–209, https://doi.org/10.1007/s100210000019, 2000.
Slot, M., Rifai, S. W., Eze, C. E., and Winter, K.: The stomatal response to vapor pressure deficit drives the apparent temperature response of photosynthesis in tropical forests, New Phytol., 244, 1238–1249, https://doi.org/10.1111/nph.19806, 2024.
Smith, M. N., Stark, S. C., Taylor, T. C., Ferreira, M. L., de Oliveira, E., Restrepo-Coupe, N., Chen, S., Woodcock, T., dos Santos, D. B., Alves, L. F., Figueira, M., de Camargo, P. B., de Oliveira, R. C., Aragão, L. E. O. C., Falk, D. A., McMahon, S. M., Huxman, T. E., and Saleska, S. R.: Seasonal and drought-related changes in leaf area profiles depend on height and light environment in an Amazon forest, New Phytol., 222, 1284–1297, https://doi.org/10.1111/nph.15726, 2019.
Stark, S. C., Leitold, V., Wu, J. L., Hunter, M. O., de Castilho, C. V., Costa, F. R. C., McMahon, S. M., Parker, G. G., Shimabukuro, M. T., Lefsky, M. A., Keller, M., Alves, L. F., Schietti, J., Shimabukuro, Y. E., Brandão, D. O., Woodcock, T. K., Higuchi, N., de Camargo, P. B., de Oliveira, R. C., and Saleska, S. R: Amazon forest carbon dynamics predicted by profiles of canopy leaf area and light environment, Ecol. Lett., 15, 1406–1414, 2012.
ter Steege, H., Pitman, N. C. A., Sabatier, D. et al.: Hyperdominance in the Amazonian tree flora, Science, 342, 1243092, https://doi.org/10.1126/science.1243092, 2013.
Trugman, A. T., Medvigy, D., Mankin, J. S., and Anderegg, W. R. L.: Soil Moisture Stress as a Major Driver of Carbon Cycle Uncertainty, Geophys. Res. Lett., 45, 6495–6503, https://doi.org/10.1029/2018gl078131, 2018.
Ukkola, A.: PLUMBER2: forcing and evaluation datasets for a model intercomparison project for land surface models v1.0, NCI Data Catalogue [data set], https://doi.org/10.25914/5FDB0902607E1, 2020.
van Buuren, S. and Groothuis-Oudshoorn, K.: mice: Multivariate Imputation by Chained Equations inR, J. Stat. Softw., 45, 1–67, https://doi.org/10.18637/jss.v045.i03, 2011.
Van Langenhove, L., Verryckt, L. T., Bréchet, L., Courtois, E. A., Stahl, C., Hofhansl, F., Bauters, M., Sardans, J., Boeckx, P., Fransen, E., Peñuelas, J., and Janssens, I. A.: Atmospheric deposition of elements and its relevance for nutrient budgets of tropical forests, Biogeochemistry, 149, 175–193, https://doi.org/10.1007/s10533-020-00673-8, 2020.
Van Langenhove, L., Depaepe, T., Verryckt, L. T., Vallicrosa, H., Fuchslueger, L., Lugli, L. F., Bréchet, L., Ogaya, R., Llusia, J., Urbina, I., Gargallo-Garriga, A., Grau, O., Richter, A., Penuelas, J., Van Der Straeten, D., and Janssens, I. A.: Impact of Nutrient Additions on Free-Living Nitrogen Fixation in Litter and Soil of Two French-Guianese Lowland Tropical Forests, J. Geophys. Res.-Biogeo., 126, e2020JG006023, https://doi.org/10.1029/2020jg006023, 2021.
Villarreal, S. and Vargas, R.: Representativeness of FLUXNET Sites Across Latin America, J. Geophys. Res.-Biogeo., 126, e2020JG006090, https://doi.org/10.1029/2020jg006090, 2021.
Vincent, G., Antin, C., Laurans, M., Heurtebize, J., Durrieu, S., Lavalley, C., and Dauzat, J.: Mapping plant area index of tropical evergreen forest by airborne laser scanning. A cross-validation study using LAI2200 optical sensor, Remote Sens. Environ., 198, 254–266, https://doi.org/10.1016/j.rse.2017.05.034, 2017.
Vincent, G., Verley, P., Brede, B., Delaitre, G., Maurent, E., Ball, J., Clocher, I., and Barbier, N.: Multi-sensor airborne lidar requires intercalibration for consistent estimation of light attenuation and plant area density, Remote Sens. Environ., 286, 113442, https://doi.org/10.1016/j.rse.2022.113442, 2023.
Vleminckx, J., Fortunel, C., Valverde-Barrantes, O., Timothy Paine, C. E., Engel, J., Petronelli, P., Dourdain, A. K., Guevara, J., Béroujon, S., and Baraloto, C.: Resolving whole-plant economics from leaf, stem and root traits of 1467 Amazonian tree species, Oikos, 130, 1193–1208, https://doi.org/10.1111/oik.08284, 2021.
Wagner, F. H., Hérault, B., Bonal, D., Stahl, C., Anderson, L. O., Baker, T. R., Becker, G. S., Beeckman, H., Boanerges Souza, D., Botosso, P. C., Bowman, D. M. J. S., Bräuning, A., Brede, B., Brown, F. I., Camarero, J. J., Camargo, P. B., Cardoso, F. C. G., Carvalho, F. A., Castro, W., Chagas, R. K., Chave, J., Chidumayo, E. N., Clark, D. A., Costa, F. R. C., Couralet, C., da Silva Mauricio, P. H., Dalitz, H., de Castro, V. R., de Freitas Milani, J. E., de Oliveira, E. C., de Souza Arruda, L., Devineau, J.-L., Drew, D. M., Dünisch, O., Durigan, G., Elifuraha, E., Fedele, M., Ferreira Fedele, L., Figueiredo Filho, A., Finger, C. A. G., Franco, A. C., Freitas Júnior, J. L., Galvão, F., Gebrekirstos, A., Gliniars, R., Graça, P. M. L. D. A., Griffiths, A. D., Grogan, J., Guan, K., Homeier, J., Kanieski, M. R., Kho, L. K., Koenig, J., Kohler, S. V., Krepkowski, J., Lemos-Filho, J. P., Lieberman, D., Lieberman, M. E., Lisi, C. S., Longhi Santos, T., López Ayala, J. L., Maeda, E. E., Malhi, Y., Maria, V. R. B., Marques, M. C. M., Marques, R., Maza Chamba, H., Mbwambo, L., Melgaço, K. L. L., Mendivelso, H. A., Murphy, B. P., O'Brien, J. J., Oberbauer, S. F., Okada, N., Pélissier, R., Prior, L. D., Roig, F. A., Ross, M., Rossatto, D. R., Rossi, V., Rowland, L., Rutishauser, E., Santana, H., Schulze, M., Selhorst, D., Silva, W. R., Silveira, M., Spannl, S., Swaine, M. D., Toledo, J. J., Toledo, M. M., Toledo, M., Toma, T., Tomazello Filho, M., Valdez Hernández, J. I., Verbesselt, J., Vieira, S. A., Vincent, G., Volkmer de Castilho, C., Volland, F., Worbes, M., Zanon, M. L. B., and Aragão, L. E. O. C.: Climate seasonality limits leaf carbon assimilation and wood productivity in tropical forests, Biogeosciences, 13, 2537–2562, https://doi.org/10.5194/bg-13-2537-2016, 2016.
Wolf, J., Brocard, G., Willenbring, J., Porder, S., and Uriarte, M.: Abrupt change in forest height along a tropical elevation gradient detected using airborne lidar, Remote Sensing, 8, 864, https://doi.org/10.3390/rs8100864, 2016.
Wright, I. J., Reich, P. B., Westoby, M., Ackerly, D. D., Baruch, Z., Bongers, F., Cavender-Bares, J., Chapin, T., Cornelissen, J. H. C., Diemer, M., Flexas, J., Garnier, E., Groom, P. K., Gulias, J., Hikosaka, K., Lamont, B. B., Lee, T., Lee, W., Lusk, C., Midgley, J. J., Navas, M.-L., Niinemets, Ü., Oleksyn, J., Osada, N., Poorter, H., Poot, P., Prior, L., Pyankov, V. I., Roumet, C., Thomas, S. C., Tjoelker, M. G., Veneklaas, E. J., and Villar, R.: The worldwide leaf economics spectrum, Nature, 428, 821–827, 2004.
Wu, J., Albert, L. P., Lopes, A. P., Restrepo-Coupe, N., Hayek, M., Wiedemann, K. T., Guan, K., Stark, S. C., Christoffersen, B., Prohaska, N., Tavares, J. V., Marostica, S., Kobayashi, H., Ferreira, M. L., Campos, K. S., da Silva, R., Brando, P. M., Dye, D. G., Huxman, T. E., Huete, A. R., Nelson, B. W., and Saleska, S. R.: Leaf development and demography explain photosynthetic seasonality in Amazon evergreen forests, Science, 351, 972–976, https://doi.org/10.1126/science.aad5068, 2016.
Wu, J., Serbin, S. P., Xu, X., Albert, L. P., Chen, M., Meng, R., Saleska, S. R., and Rogers, A.: The phenology of leaf quality and its within-canopy variation is essential for accurate modeling of photosynthesis in tropical evergreen forests, Glob. Change Biol., 23, 4814–4827, https://doi.org/10.1111/gcb.13725, 2017a.
Wu, J., Albert, L. P., Lopes, A. P., Restrepo-Coupe, N., Hayek, M., Wiedemann, K. T., Guan, K., Stark, S. C., Christoffersen, B., Prohaska, N., Tavares, J. V., Marostica, S., Kobayashi, H., Ferreira, M. L., Campos, K. S., da Silva, R., Brando, P. M., Dye, D. G., Huxman, T.E., Huete, A. R., Nelson, B. W., and Saleska, S. R.: Data from: Leaf development and demography explain photosynthetic seasonality in Amazon evergreen forests, Dryad [data set], https://doi.org/10.5061/dryad.8fb47, 2017b.
Wu, W., Sun, Y., Xiao, K., and Xin, Q.: Development of a global annual land surface phenology dataset for 19822018 from the AVHRR data by implementing multiple phenology retrieving methods, Int. J. Appl. Earth Obs., 103, 102487, https://doi.org/10.1016/j.jag.2021.102487, 2021.
Xu, X., Medvigy, D., Joseph Wright, S., Kitajima, K., Wu, J., Albert, L. P., Martins, G. A., Saleska, S. R., and Pacala, S. W.: Variations of leaf longevity in tropical moist forests predicted by a trait-driven carbon optimality model, Ecol. Lett., 20, 1097–1106. https://doi.org/10.1111/ele.12804, 2017.
Yang, X., Wu, J., Chen, X., Ciais, P., Maignan, F., Yuan, W., Piao, S., Yang, S., Gong, F., Su, Y., Dai, Y., Liu, L., Zhang, H., Bonal, D., Liu, H., Chen, G., Lu, H., Wu, S., Fan, L., Gentine, P., and Wright?, S. J.: A comprehensive framework for seasonal controls of leaf abscission and productivity in evergreen broadleaved tropical and subtropical forests, The Innovation, 2, 100154, https://doi.org/10.1016/j.xinn.2021.100154, 2021.
Yang, X., Chen, X., Ren, J., Yuan, W., Liu, L., Liu, J., Chen, D., Xiao, Y., Song, Q., Du, Y., Wu, S., Fan, L., Dai, X., Wang, Y., and Su, Y.: Leaf age-dependent LAI seasonality products (Lad-LAI) over tropical and subtropical evergreen broadleaved forests, figshare [data set], https://doi.org/10.6084/m9.figshare.21700955.v4, 2022.
Yang, X., Chen, X., Ren, J., Yuan, W., Liu, L., Liu, J., Chen, D., Xiao, Y., Song, Q., Du, Y., Wu, S., Fan, L., Dai, X., Wang, Y., and Su, Y.: A gridded dataset of a leaf-age-dependent leaf area index seasonality product over tropical and subtropical evergreen broadleaved forests, Earth Syst. Sci. Data, 15, 2601–2622, https://doi.org/10.5194/essd-15-2601-2023, 2023.
Yao, Y., Ciais, P., Viovy, N., Joetzjer, E., and Chave, J.: How drought events during the last century have impacted biomass carbon in Amazonian rainforests, Glob. Change Biol., 29, 747–762, https://doi.org/10.1111/gcb.16504, 2022.
Ziegler, C., Coste, S., Stahl, C., Delzon, S., Levionnois, S., Cazal, J., Cochard, H., Esquivel-Muelbert, A., Goret, J.-Y., Heuret, P., Jaouen, G., Santiago, L. S., and Bonal, D.: Large hydraulic safety margins protect Neotropical canopy rainforest tree species against hydraulic failure during drought, Ann. For. Sci., 76, 115, https://doi.org/10.1007/s13595-019-0905-0, 2019.