the Creative Commons Attribution 4.0 License.
the Creative Commons Attribution 4.0 License.
 | 08 Jul 2025
An effective communication topology for performance optimization: a case study of the finite-volume wave modeling (FVWAM)
Renbo Pang
Fujiang Yu
Yuanyong Gao
Liang Yuan
Zhiyi Gao
High-resolution models are essential for simulating small-scale processes and topographical features, which play a crucial role in understanding meteorological and oceanic events, as well as climatic patterns. High-resolution modeling requires substantial improvement to the parallel scalability of the model to reduce runtime, while massive parallelism is associated with intensive communications. Point-to-point communication is extensively utilized for neighborhood communication in Earth models due to its flexibility. The distributed graph topology, first introduced in the message-passing interface (MPI) version 2.2, provides a scalable and informative communication method. It has demonstrated significant speedups over the point-to-point communication method based on a variety of synthetic and real-world communication graph datasets. But its application to Earth models for neighborhood communication is rarely studied. In this study, we implemented neighborhood communication using both the traditional point-to-point communication method and the distributed graph communication topology. We then compare their performance in a case study using the finite-volume wave modeling (FVWAM), including both small-scale regional and large-scale global experiments. Based on the Intel MPI library, the distributed graph topology outperforms the point-to-point communication method for inter-node communication with 32 to 32 768 processes. For small-scale regional experiments with 32 to 512 processes, compared to the point-to-point method, the distributed graph topology achieved an average communication time speedup ranging from 4.78 to 11.67. For operational global wave forecasts with 1024 processes, the runtime of the FVWAM was reduced by 40.2 % when the point-to-point communication method was replaced by the distributed graph communication topology.
- Article
(8744 KB) - Full-text XML
- BibTeX
- EndNote


Numerical Earth models with higher resolutions are capable of more accurately representing small-scale processes and topographical features, which are essential for phenomena of weather and sea and finer details of the climate (Palmer, 2019). For instance, fine meshes with ° resolution or finer are needed to simulate emerging eddy dynamics (Koldunov et al., 2019). Submesoscale eddies are believed to affect mixed layer re-stratification and vertical heat transport (Su et al., 2018). These eddies may also contribute to shaping the circulation in major current systems (Chassignet and Xu, 2017). Additionally, a high-resolution spectral wave model can deal with shallow-water conditions and incorporate the interactions due to tide and surge (Monbaliu et al., 2000).
The performance of top computing clusters has been increasingly improved with the development of semiconductors and the emergence of hybrid computing systems accelerated by general-purpose graphics processing units (GPGPUs). For instance, the first high-performance computer (HPC) with over 1 exaflop s−1 computing performance was established at the Oak Ridge National Laboratory in the United States in 2022 (Atchley et al., 2023). These HPCs provide the necessary resources to run models with higher resolutions. Gu et al. (2022) developed the integrated Atmospheric Model Across Scales (iAMAS) with a global 3 km spatial resolution. Wedi et al. (2020) evaluated a 4-month global atmospheric simulation with the ECMWF (European Centre for Medium-Range Weather Forecasts) hydrostatic Integrated Forecasting System (IFS) at an average grid spacing of 1.4 km. Zhang et al. (2023) used the coupled Earth system model (ESM) to simulate sea and ice with a global 3 km resolution.
However, there are many challenges associated with implementing and applying these models at higher resolutions (Alizadeh, 2022). One critical factor hampering the performance of these high-resolution models is their limited parallel scalability (Koldunov et al., 2019). For instance, the barotropic solver is a major bottleneck in the Parallel Ocean Model (POP) within the high-resolution Community Earth System Model (CESM), which scales poorly at high process counts due to inherent communication limitations in the algorithm (Huang et al., 2016). Existing models struggle to make full use of the new generation of massively parallel HPC systems (Koldunov et al., 2019). In parallel computing, data exchange introduces additional costs compared to serial computing. As the number of parallel processes increases, the time of computation for each process theoretically decreases proportionally. However, the time of communication for each process is reduced at a slower rate compared to computation or even increases with more processes. The most common communication in atmospheric and oceanic models is neighborhood communication to exchange data of local grids in each process with data of neighboring grids in other processes (Wolters, 1992). Reducing the neighborhood communication cost is a key factor in improving the parallel scalability of models (Ovcharenko et al., 2012).
The point-to-point communication interfaces implemented by send/receive routines in the message-passing interface (MPI) standard version 1.0 are basic and flexible methods for data exchange (Walker and Dongarra, 1996). They are extensively utilized for neighborhood communication in atmospheric and oceanic models, including the Weather Research and Forecasting model (WRF) (Biswas et al., 2018), the Model for Prediction Across Scales (MPAS) (Sinkovits and Duda, 2016), Nucleus for European Modelling of the Ocean (NEMO) (Irrmann et al., 2021), IFS (Mozdzynski et al., 2015), WAve Modeling (WAM) (Katsafados et al., 2016), and atmospheric general circulation models (AGCMs) (Wang et al., 2017). A newly scalable and informative communication method of the distributed graph topology was provided in the MPI standard version 2.2 (Hoefler et al., 2011). This topology is capable of generating a new communicator that reorders processes to better match the capabilities of the underlying hardware (Mirsadeghi et al., 2017). Ghosh et al. (2019) demonstrated speedups of 1.4 to 6 times using the distributed graph topology (employing up to 16 000 processes) compared to the point-to-point communication method. They evaluated this approach using a variety of synthetic and real-world communication graph datasets, including random geometric graphs, graph500 R-MAT, stochastic block partitioned graphs, protein k-mer, DNA, computational fluid dynamics (CFD), and social networks. To date, the application of this topology in Earth models for communication optimization has been infrequent.
Ocean wave modeling holds significant importance within numerical weather prediction systems, not only for its crucial role in ship routing and offshore engineering but also due to its climate implications (Yuan et al., 2024). Recently, the National Marine Environmental Forecasting Center of China (NMEFC) developed the finite-volume wave modeling (FVWAM) based on the WAM for national operational wave forecasting services. The FVWAM employs a neighboring communication pattern based on spatially decomposed cell results among multiple processes, a common approach in oceanic and atmospheric models.
Consequently, we implemented neighborhood communication using both the point-to-point communication method and the distributed graph communication topology in a case study of the FVWAM based on spherical centroidal Voronoi tessellation (SCVT) cells. The contributions of this paper include the following: (1) to the best of the authors' knowledge, this is the first application of the distributed graph communication topology to a regional or global wave model for neighborhood communication; (2) we verify that the distributed graph topology achieves superior communication performance vs. the point-to-point communication method using the Intel MPI library in the case study of the FVWAM; and (3) we provide a method to optimize neighborhood communication in Earth models based on spatial decomposition, including both unstructured cells and structured cells.
The remainder of this paper is organized as follows: Sect. 2 summarizes the related work, including descriptions of the FVWAM and the distributed graph communication topology. Section 3 introduces the design of the distributed graph communication topology and the point-to-point communication method. Section 4 presents experimental results, evaluations of two communication methods, and products of the FVWAM. Finally, the paper concludes in Sect. 5.
2.1 Description of the FVWAM
Ocean waves can be considered a combination of wave components across a frequency and direction spectrum in geographic space and time. Their generation, propagation, dissipation, and nonlinear interaction processes are described by a wave action transport equation, with wave propagation and source terms placed on both sides of the equation. A series of spectral wave models have been developed by numerically solving this wave action transport equation, including the WAM (Group, 1988), WaveWatchIII (Tolman, 2009), and the SWAN (Booij et al., 1999).
Based on the WAM model, the FVWAM developed by the NMEFC is a third-generation spectral wave model based on the wave action Eq. (1). In this equation, N stands for wave action, t denotes time, X stands for the spatial coordinates, θ represents the direction, and σ denotes angular frequency. The left-hand side of Eq. (1) accounts for the spatial and intra-spectral propagation of spectral energy, representing the change in wave action in time, the propagation of wave action across spatial coordinates, and the propagation velocities in spectral space. The source term (Stot) on the right-hand side of Eq. (1) includes wind input, dissipation due to whitecapping, bottom friction, depth-induced wave breaking, and the exchange of wave action between spectral components due to nonlinear effects.
Compared to the WAM, the FVWAM replaces spherical latitude–longitude cells with SCVT cells to better accommodate coastal topographic features. For advection in spectral and directional space, the FVWAM employs the same second-order central differencing method as the WAM. Regarding the integration of source terms, the FVWAM implements the same semi-implicit integration scheme as is adopted in the WAM. The detailed description of the advection and source terms in the WAM can be found in the WAMDI GROUP publication (Group, 1988).
Spatial decomposition is employed to partition data in the FVWAM for parallelization. This approach involves dividing computational tasks across multiple processors or nodes. Data exchange is necessary among neighboring processes for wave action (N), water depth, and the bathymetric gradient in the FVWAM. The most time-consuming communication in the FVWAM occurs during the exchange of wave action for the integration of advection. N is the only 3D variable in the FVWAM, whose dimension size is the total cell count and the number of angular frequencies and directions. It is exchanged once in each integration time step. Therefore, the exchange of N is utilized as a benchmark to evaluate the performance of neighboring communication in the case study of FVWAM.
2.2 Description of the distributed graph communication topology
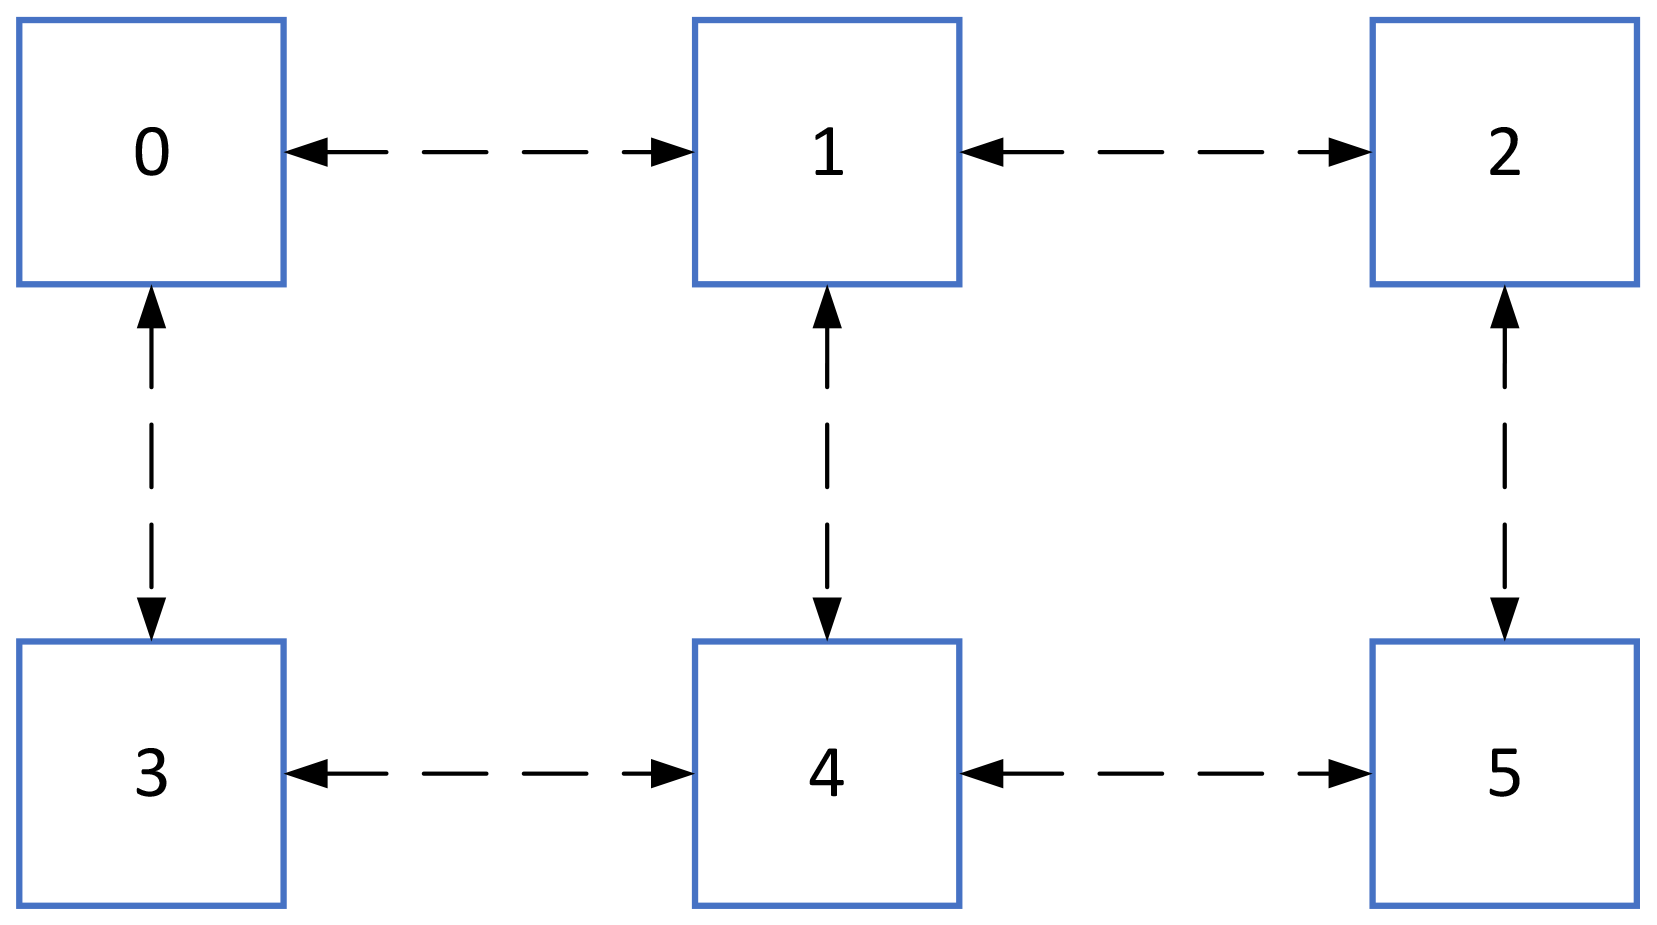
The distributed graph communication topology in MPI supports optimizing communication by minimizing communication costs and enhancing load balance (Mozdzynski et al., 2015; Traff, 2002). This topology mechanism leverages user-provided topology information to reorder processes within a new communicator, aligning them more effectively with the underlying network to achieve higher communication performance (Mirsadeghi et al., 2017). The impact of process ordering on communication performance is illustrated in Figs. 1 and 2. Figure 1 depicts a simple neighborhood communication pattern among computing processes. The squares represent the processes, the numerals within the squares indicate process IDs (ranging from 0 to 5), and the dashed arrows signify the communication links between pairs of processes. For instance, process 0 is engaged in data exchange with neighboring process 1 and process 3.
Based on the neighborhood communication pattern in Fig. 1, assigning two processes to each node can lead to several process mapping results among computing nodes, as shown in Fig. 2. The squares represent computing nodes, and the numerals within the squares denote the process IDs. There are four bi-directional communication links among three computing nodes in Fig. 2a and b and seven bi-directional communication links among three computing nodes in Fig. 2c. The process mapping topology in Fig. 2c is the least efficient and most time-consuming among the mapping results presented. It has a communication hotspot, with four communication links in the node housing process 1 and process 4 in Fig. 2b. The node containing process 3 and process 4 in Fig. 2a has a maximum of three communication links; thus the process mapping result in Fig. 2a is the most effective. These differing process mapping results can influence communication performance and the parallel scalability of applications. The distributed graph communication topology in MPI is capable of optimizing the mapping of computing processes in accordance with the underlying network and the communication pattern specified by users. This is the advantage that allows the distributed graph communication topology to achieve high performance.
Additionally, multiple calls to the point-to-point interface for exchanging data between different processes can result in undesirable side effects, such as load imbalance and unpredictable wait times during the connection setup (Hoefler et al., 2011). In contrast, the MPI distributed graph topology optimizes connection management (Hoefler et al., 2011), regardless of whether the reorder flag is set to true or false.
However, the trade-off associated with the distributed graph communication topology is the necessity of creating the graph communication topology and allocating all communication data buffers before commencing communication. In contrast to the point-to-point communication method, users can neither specify the order of neighboring processes to send/receive data nor reuse the same data buffer for multiple send/receive data operations with different neighboring processes in the distributed graph communication topology.
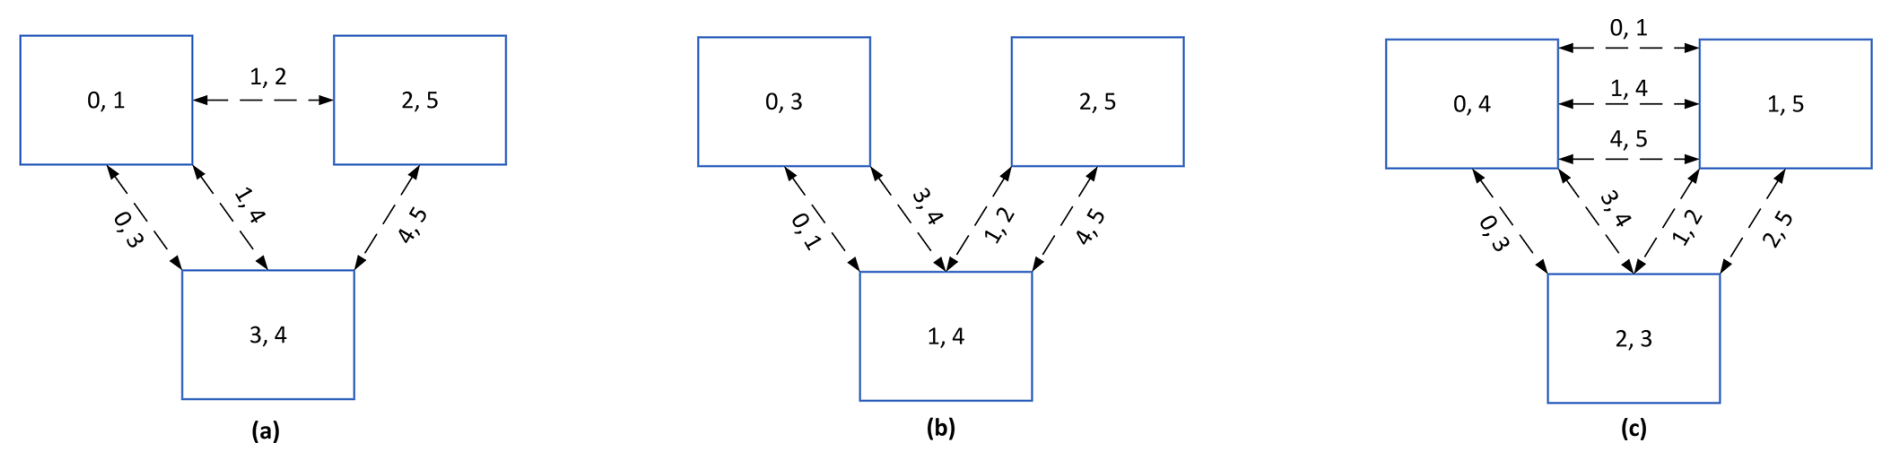
Figure 2(a) The best mapping result. (b) The second-best mapping result. (c) The worst mapping result.
3.1 Distributed graph communication topology
The workflow to create a distributed graph communication topology based on SCVT cells is shown in Fig. 3. Initially, the global SCVT cells are partitioned according to the number of computing processes. A simple partitioning result of the global SCVT sea cells into three partitions is illustrated in Fig. 3a, with the partitions colored green, blue, and purple.
Next, each process determines its receiving processes and cells based on the partitioning result in Fig. 3a and on the neighboring cell and process information in Fig. 3b. The red line denotes the boundary separating the cells allocated to processes P0 and P1, while the orange line delineates the communication boundary for process P0. The cells situated between the red line and the orange line comprise the receiving cells for process P0.
Finally, a distributed graph communication topology is created by calling the MPI interface with the sending and receiving process IDs and their respective degrees, as shown in Fig. 3c. The sending degree corresponds to the total number of sending processes, and the receiving degree represents the total number of receiving processes.
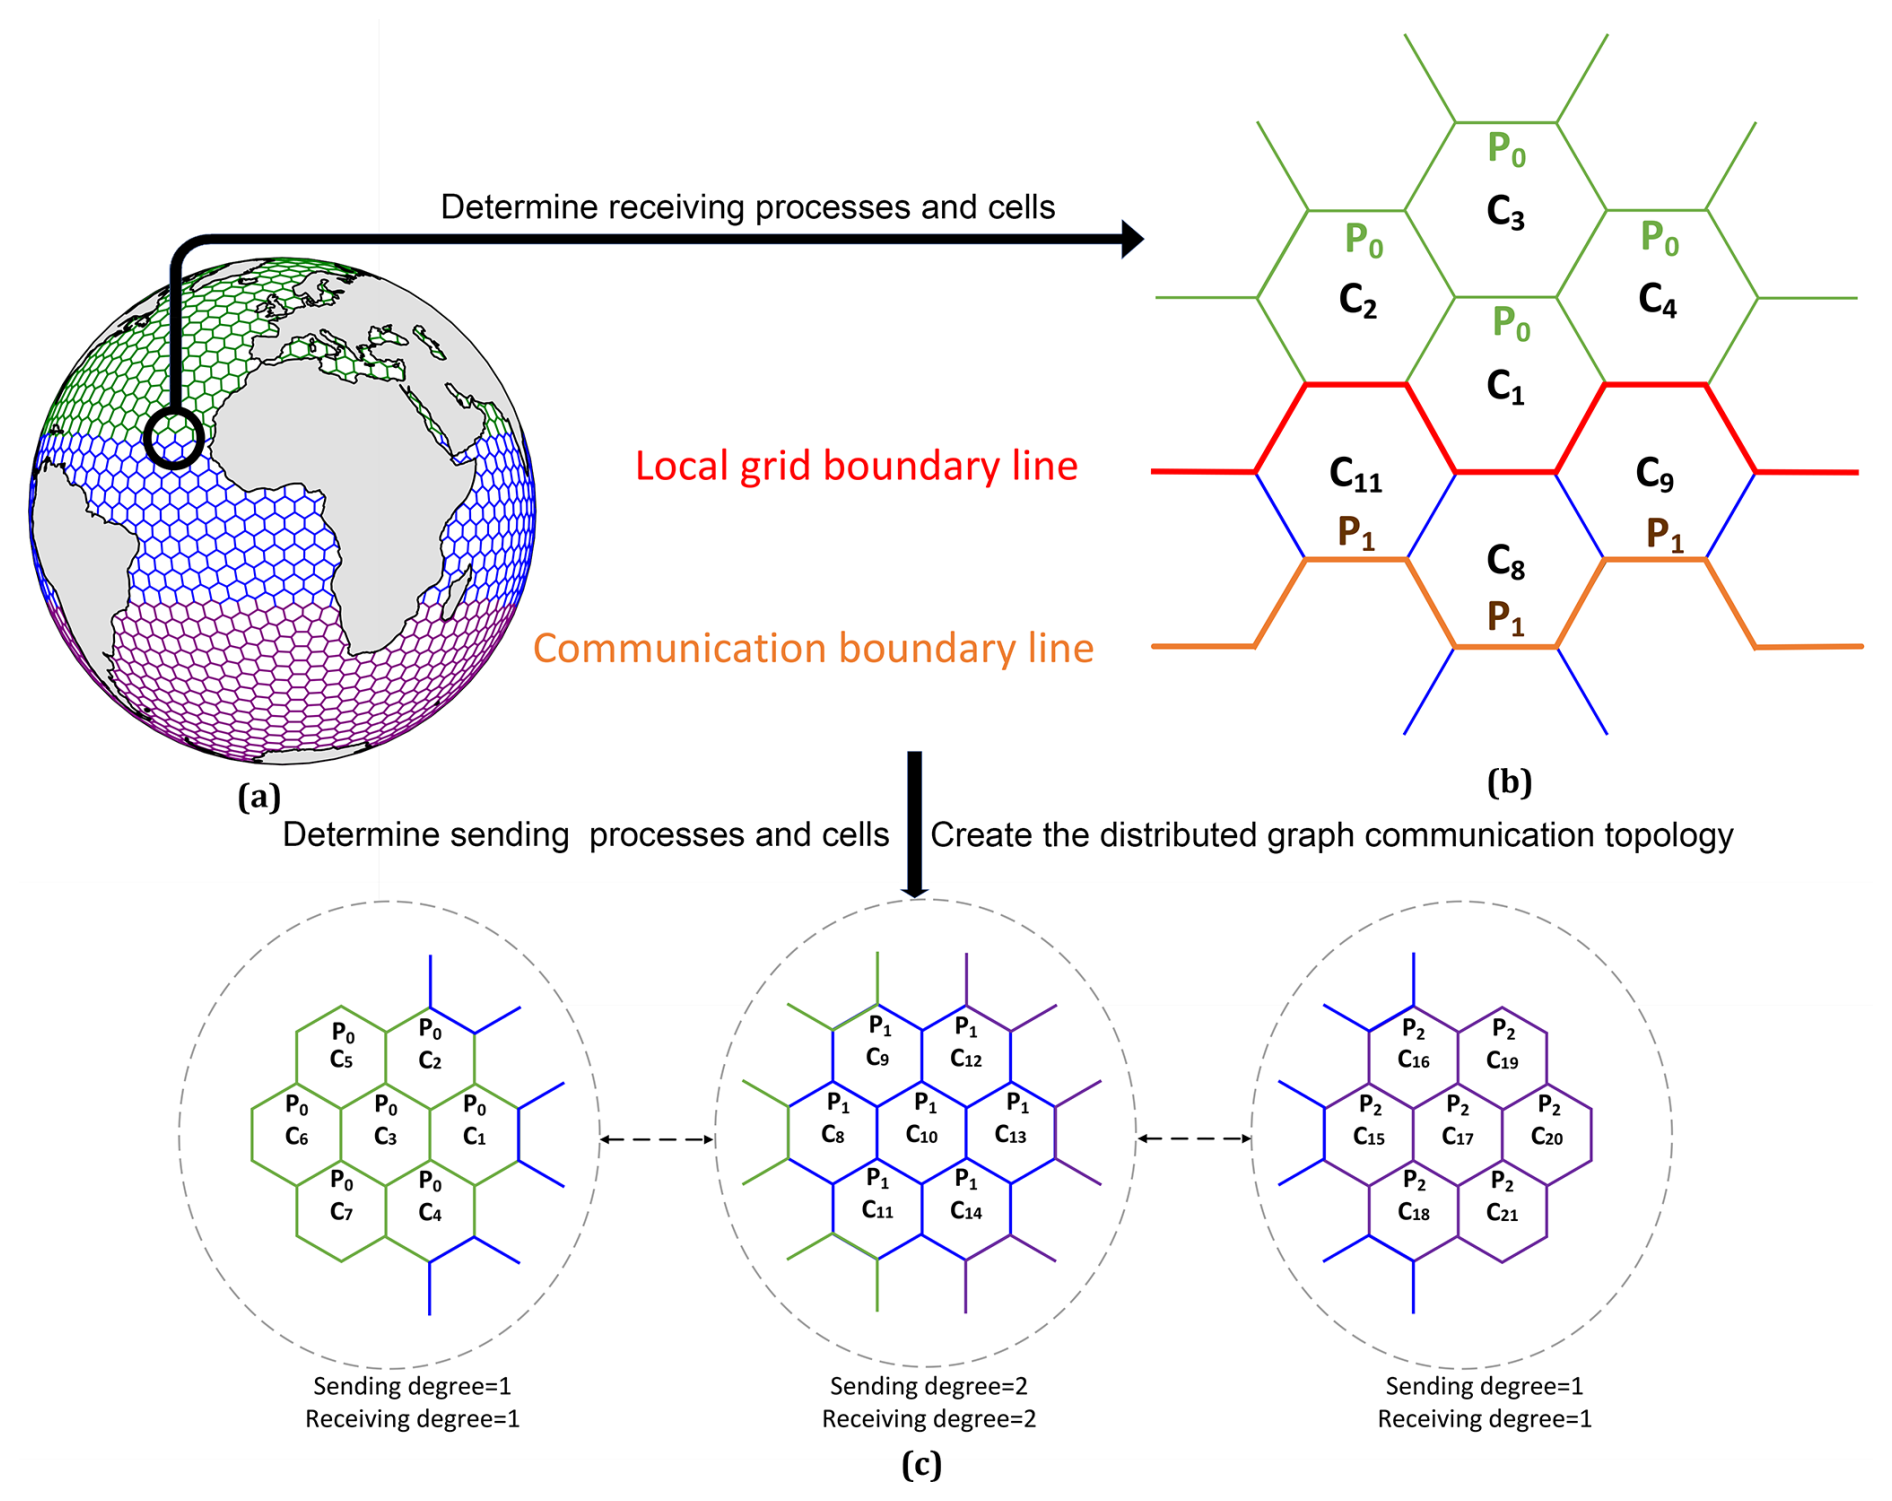
Figure 3The workflow to create a distributed graph communication topology: (a) sea cell partitioning result, (b) neighboring cell and process information, and (c) a schematic diagram of the distributed graph communication topology.
The method to create a distributed graph communication topology and implement data exchange is delineated in Fig. 4. In step 1, a multilevel partitioning scheme provided by METIS (Karypis and Kumar, 1997) is employed for the partitioning of the global SCVT cells. The METIS tool is compatible with both structured and unstructured cells and has been extensively utilized in various models, including MPAS (Heinzeller et al., 2016), WAVE WATCH III (WW3) (Abdolali et al., 2020), and the Finite Volume Coastal Ocean Model (FVCOM) (Cowles, 2008). To use METIS, one must provide the total number of cells, the total number of edges between two neighboring cells, and neighboring cell IDs for each cell as inputs. The total number of cells is represented by the scalar variable nCells, the total number of edges is represented by the scalar variable nEdges, and the neighboring cell IDs are denoted by the 2D variable cellsOnCell, excluding the invalid edges present in the SCVT cell file.
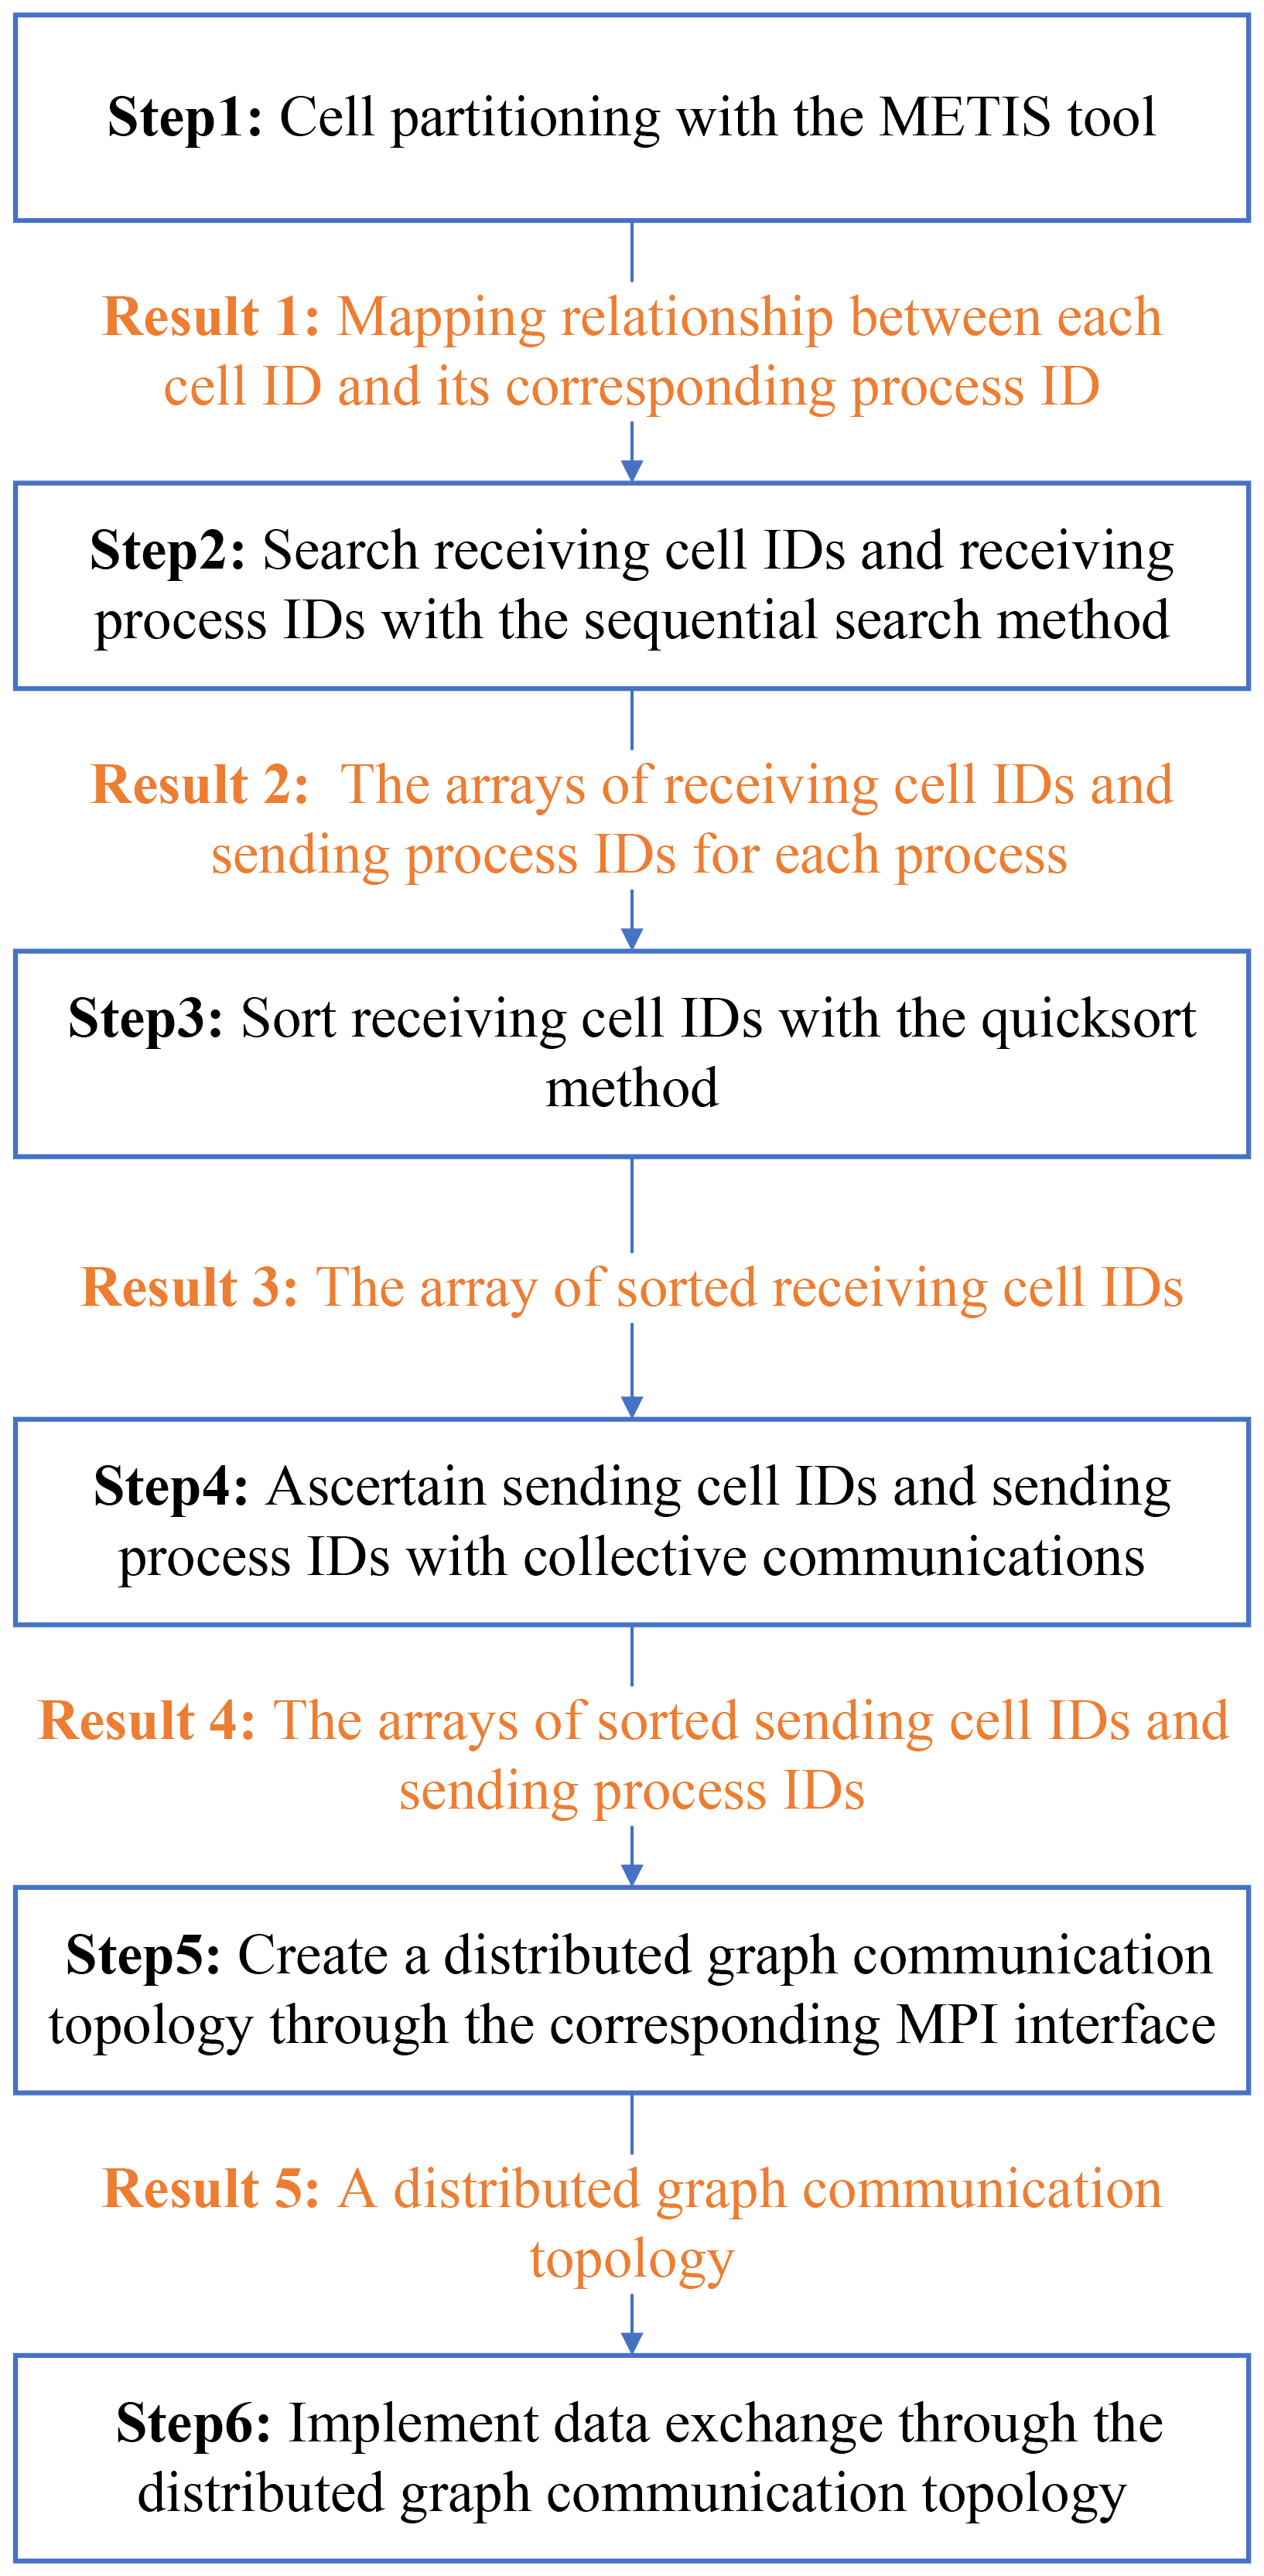
In step 2, the method to search receiving cell IDs is executed within a nested two-level loop structure. The external loop is sequential, traversing all local cell IDs from the lowest to the highest value. The internal loop executes a sequential search for all neighboring cell IDs of each local cell ID using cellsOnCell(c,i). c represents the current cell ID, i indicates the index of edges for the cell ID c, and cellsOnCell(c,i) denotes the neighboring cell IDs of the cell ID c. If the neighboring process ID differs from the current process ID, then cellsOnCell(c,i) is identified as one of receiving cell IDs for the current process ID. Based on all receiving cell IDs, the receiving process IDs can be ascertained through the mapping relationship between each cell ID and its corresponding process ID, which is determined in step 1.
The order of receiving cells becomes disordered after step 2. These cells are sorted in step 3 to ensure the continuity of data exchange with neighboring processes and to enhance the cache hit rate to improve the performance. The sorting procedure must fulfill two criteria. First, the receiving cell IDs from the same receiving process ID should be arranged continuously and sorted in ascending order based on the receiving process IDs. Second, the receiving cell IDs from the same process ID need to be sequenced from the lowest to the highest value. The quicksort method is employed to sort the receiving cell IDs that are located in the same receiving process ID.
In step 4, sending cell IDs and sending process IDs are ascertained by the primary process P0. This is achieved by collecting the receiving cell IDs and receiving process IDs from the other processes, and subsequently disseminating the results to all processes. Initially, each process sends its receiving process IDs and receiving cell IDs to the process P0. Subsequently, the process P0 determines the sending process IDs using the rationale that the process that sends the receiving process ID to the process P0 is the sending process ID for this process. Because the receiving process IDs have been sorted in step 3 and the searching process is sequential, we only need to store the identified process IDs in sequence without the requirement for further sorting. Third, the process P0 disperses these sending process IDs to the corresponding processes. Finally, the sending cell IDs within the sending process are identical to the receiving cell IDs in the receiving process. The procedure to collect and scatter sending cell IDs is analogous to that used for sending process IDs.
In step 5, based on the receiving process IDs in step 2 and the sending process IDs in step 4, the distributed graph communication topology is created by calling the MPI interface of MPI_Dist_graph_create_adjacent (sources, destinations, reorder, comm_dist_graph, etc.). sources represents the array of receiving process IDs; destinations denotes the array of sending process IDs. The parameter comm_dist_graph represents the new communicator endowed with the distributed graph topology, which is subsequently used for neighboring communication. The parameter reorder is of the Boolean type. When it is true, this interface reorders the process IDs within comm_dist_graph to optimize communication based on receiving process IDs, sending process IDs, and network hardware structure. When it is false, the process IDs in comm_dist_graph preserve the same process order before creating the distributed graph communication topology.
In step 6, neighboring data exchange is executed by calling the MPI distributed graph communication interface MPI_Neighbor_alltoallv (sendbuf, recvbuf, comm_dist_graph, etc.). The parameter sendbuf denotes the data buffer corresponding to the sending cell IDs in step 4, and recvbuf represents the data buffer corresponding to the receiving cell IDs in step 3. The parameter comm_dist_graph is the communicator created in step 5. This interface completes all the sending and receiving operations in a single function call. Data sent to different processes are stored contiguously in sendbuf following the order of the sending processes as listed in destinations in step 5. Similarly, data received from different processes are stored contiguously in recvbuf according to the order of the receiving processes as specified in sources in step 5. Compared to sending and receiving operations implemented by users through calling multiple send/receive MPI interfaces, the MPI distributed graph communication topology is more user-friendly, reducing the risk of deadlocks that could arise from improper use of multiple send/receive operations.
3.2 Point-to-point communication method
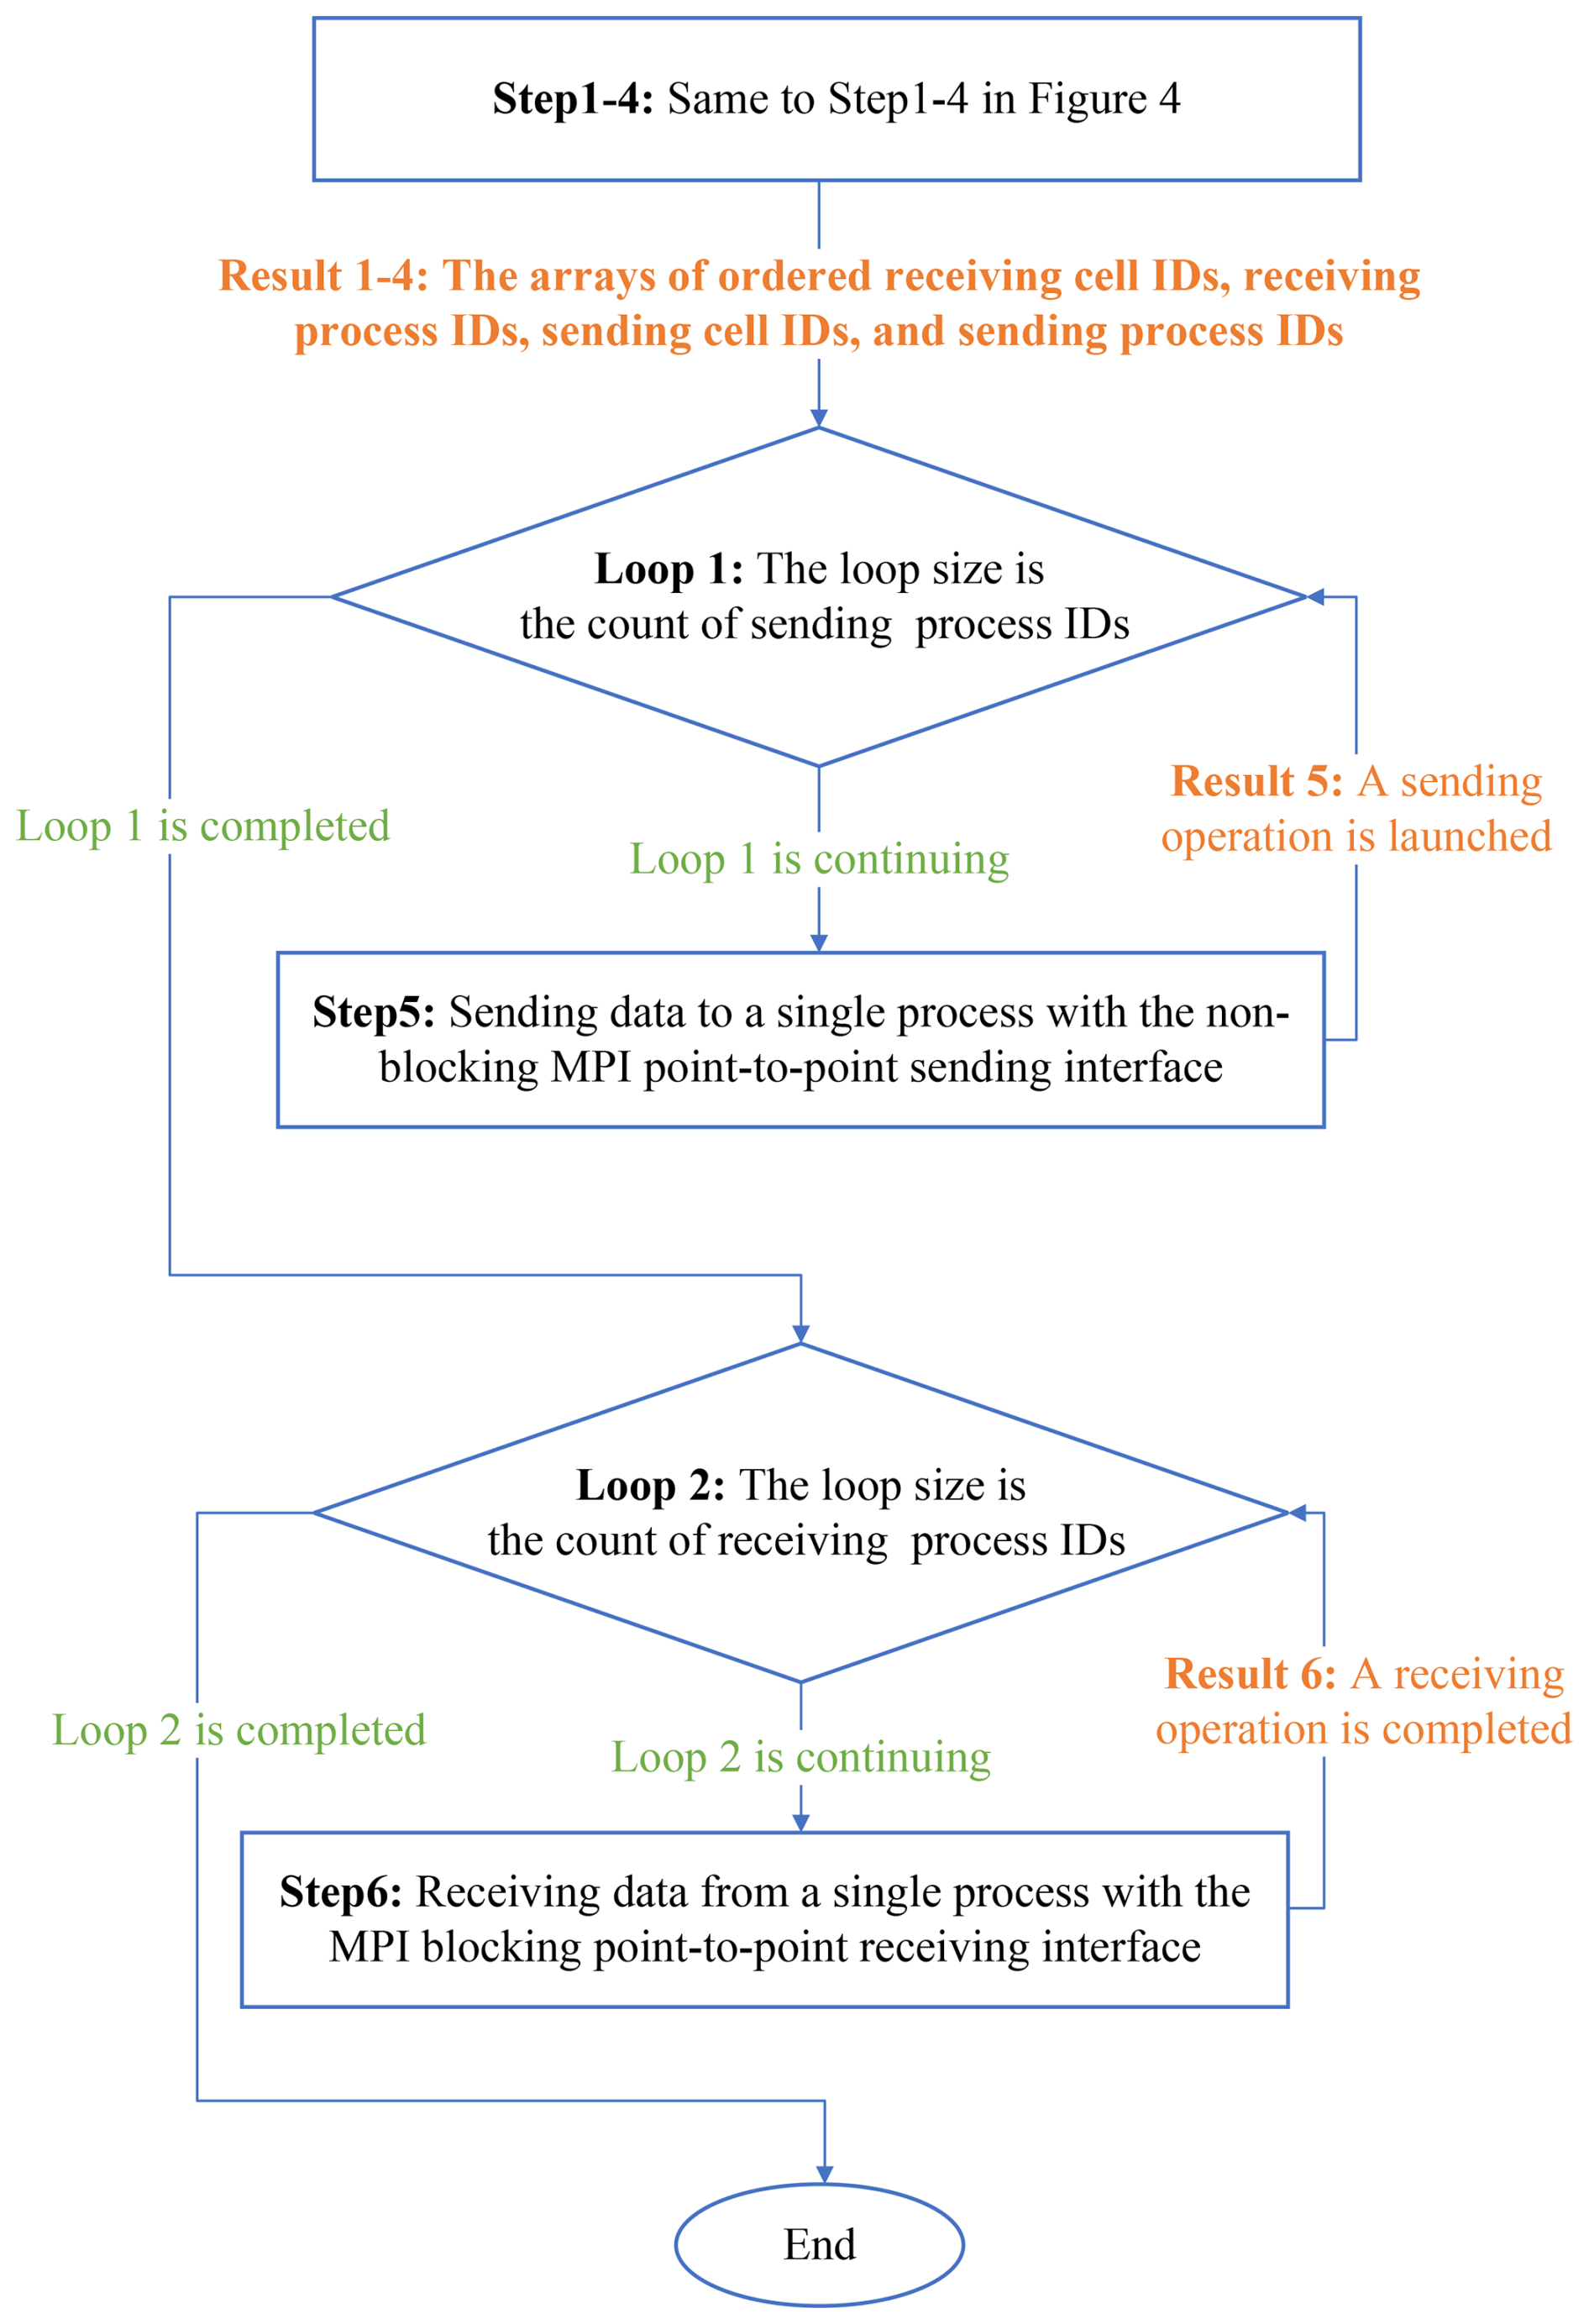
The implementation of the point-to-point communication method for neighborhood communication is illustrated in Fig. 5. The procedure to determine ordered arrays of receiving cell IDs, receiving process IDs, sending cell IDs, and sending process IDs follows the same steps (1–4) as that of the distributed graph communication topology described in Fig. 4.
To prevent communication deadlocks, the FVWAM initiates nonblocking send operations before starting the receiving operations in step 5. Each process performs sending operations to transfer data to the corresponding receiving processes. These send operations are executed by repeatedly calling the MPI_Isend interface (sendbuf, destination, etc.). The parameter sendbuf refers to the data buffer associated with the sending cell IDs of a single process, while the parameter destination corresponds to the receiving process ID. The number of calls to the MPI_Isend interface depends on the number of sending process IDs for each process. Since MPI_Isend is nonblocking, it returns immediately without waiting for the completion of the send operation.
In step 6, each process calls the MPI_Recv interface (recvbuf, source, etc.) to receive data from the sending processes. The parameter recvbuf is used to store data corresponding to the receiving cell IDs, and the parameter source indicates the sending process ID. MPI_Recv is a blocking communication interface, which only completes when the receiving operation has finished.
4.1 Small-scale parallel experiments with a regional case
4.1.1 Experiment environment and configuration
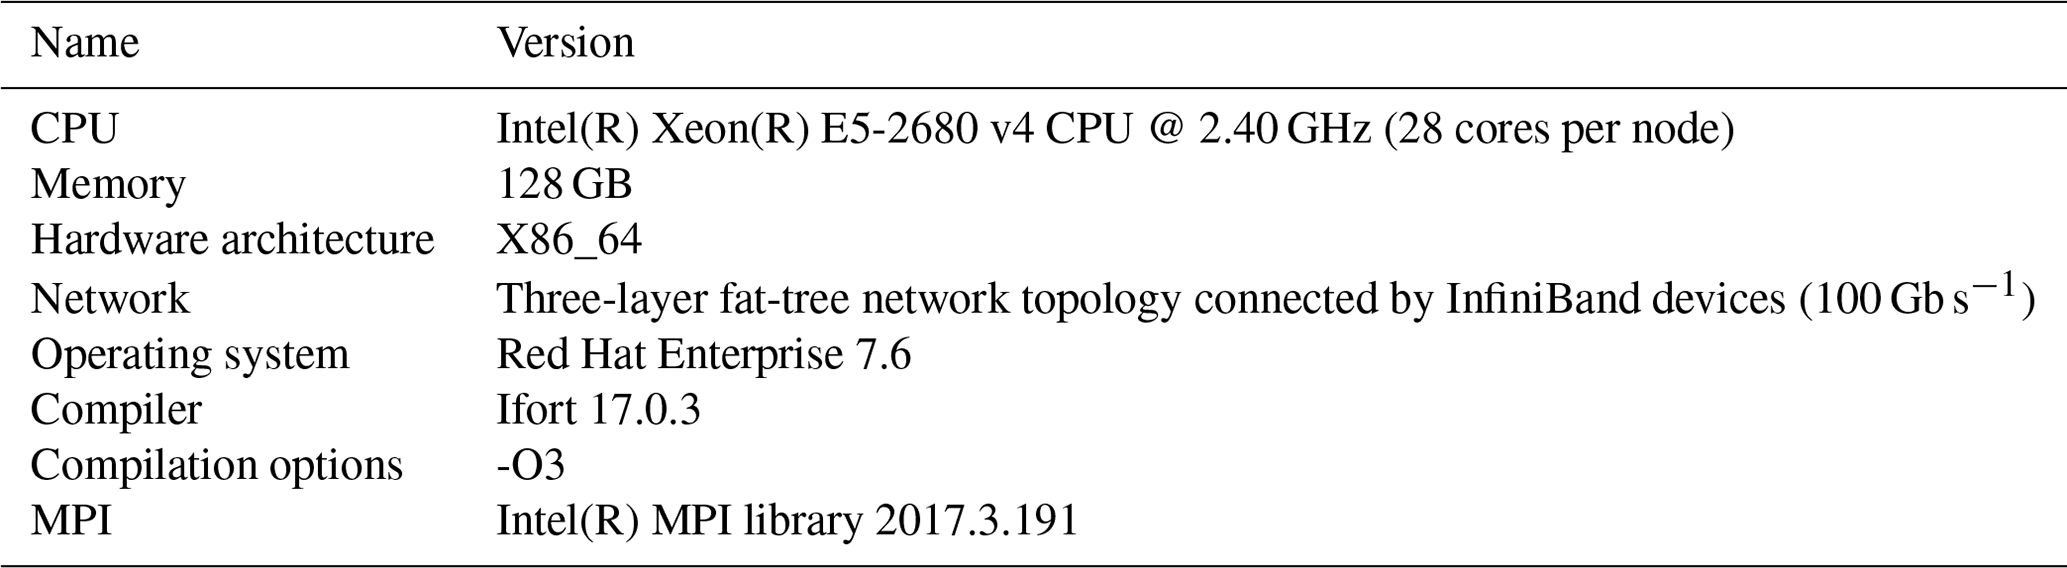
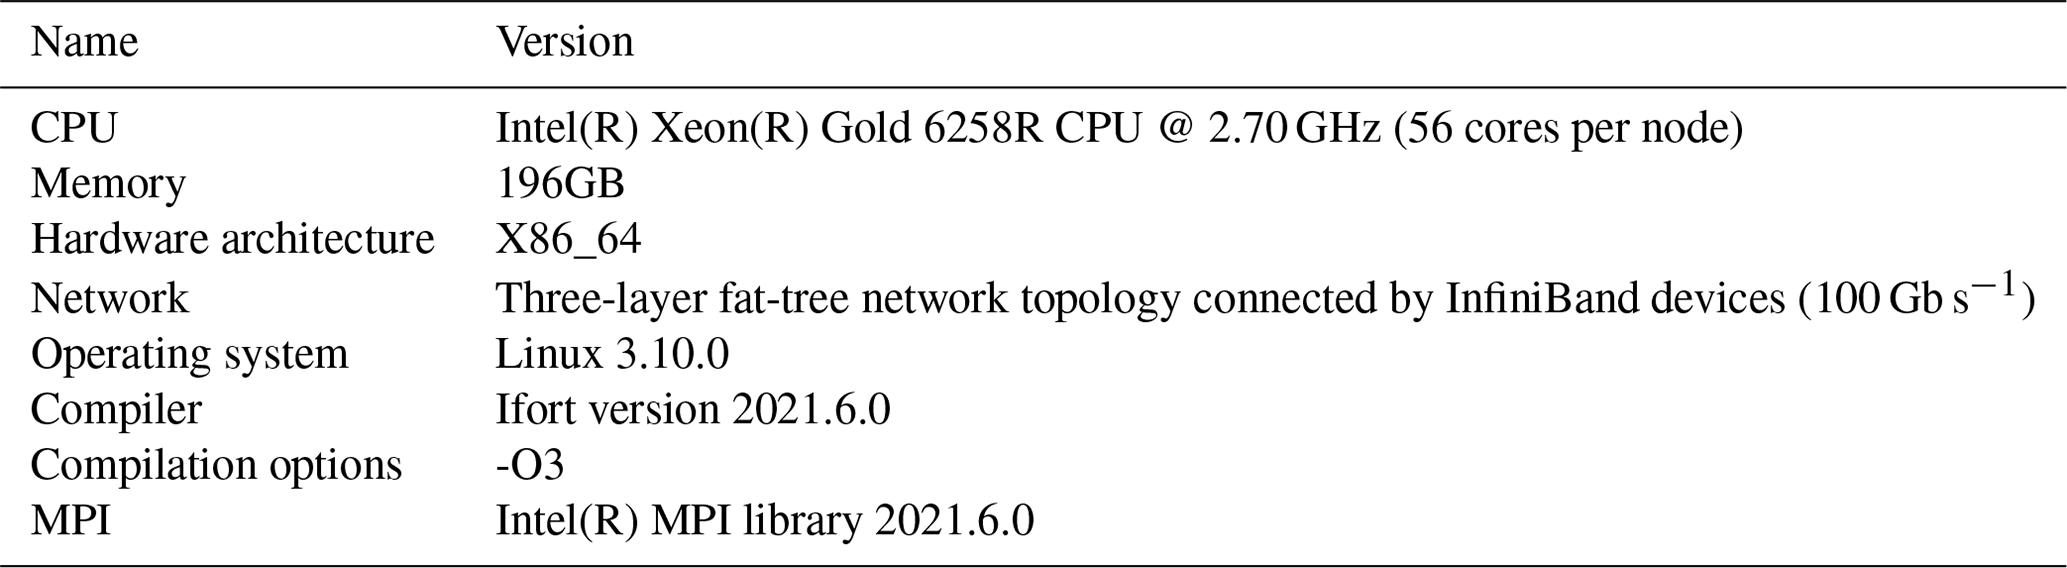
The experiments were conducted on the HPC of the NMEFC in Beijing. To evaluate the performance of the point-to-point communication method and the distributed graph communication topology across different MPI implementations, we compared the two methods using both the Intel MPI library and the Open MPI library. These libraries are widely used in Earth modeling applications. The software and hardware environment for the experiments using the Intel MPI library is presented in Table 1.
Table 1Software and hardware environment based on the Intel MPI library.
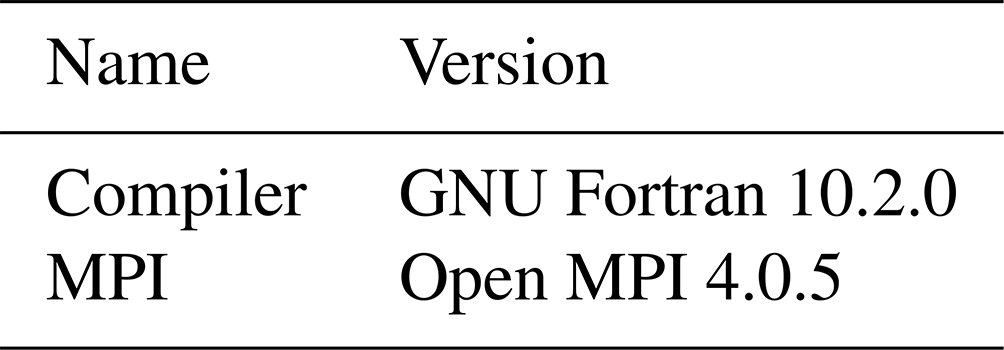
Experiments using the Open MPI library were performed on the same HPC as those conducted with the Intel MPI library. The hardware configuration remained identical to that described in Table 1, while the different software configuration is provided in Table 2.
The model configuration for the experiments conducted with both the Intel MPI library and Open MPI library was identical. The cell resolution was set to 6–12 km, covering the region from 90 to 150° E and 5° S to 45° N, with a total of 283 517 horizontal cells. The execution time was calculated by calling the Fortran intrinsic function system_clock. The parameter system_clock is defined as a double-precision integer, and its time-counting frequency is 106 s−1.
We performed a series of experiments on the FVWAM using different numbers of computing processes ranging from 8 to 512 (28 processes per node) to assess the efficiency of the point-to-point communication method and the distributed graph communication topology. For the distributed graph communication topology, two distinct modes were evaluated: one with reordered processes and another without reordered processes. For each communication method at the same number of processes, the experiments were repeated twice, and the better result was selected to mitigate the impact of fluctuations in computing resources and shared network.
4.1.2 Communication performance results
The data volume for each process is computed using Eq. (2). Vi represents the data volume received by process i, n denotes the number of processes sending data to process i, num_recvj indicates the number of cells received from process j, num_fre is the frequency of the wave spectrum (set to 35 in the experiments), num_dir is the number of directions in the wave spectrum (set to 36 in the experiments), len_data is the size of a single floating-point element (4 bytes), and steps represents the number of iteration time steps (set to 60 in the experiments). To simplify the representation of Vi, its unit is expressed in megabytes (MB), calculated by dividing by 1024 × 1024.
The forecasting period for the experiments was 1 h. Each iteration involved a single neighboring communication for a 3D variable of wave action (N). During the experiments, a total of 60 neighboring communications for N were performed. We calculated the minimum, average, and maximum data volumes received by each process, as shown in Fig. 6a, for a range of process counts from 8 to 512. The color bar represents the average received data volumes across all processes. The upper line of the error bar (I) indicates the maximum data volume received by each process, and the lower line (I) represents the minimum data volume. As the number of processes increases, the average data volume received by each process decreases.
The data volumes received by each process are presented in Fig. 6b–d. In these figures, the x axis represents the receiving process IDs, the y axis represents the sending process IDs, and the color intensity indicates the volume of data received by each process from others. The diagonal line in Fig. 6b–d represents the self-process, so the data volume received from itself is always zero. The job scheduling system allocates computing processes according to the order of process IDs. Processes located near the diagonal line are positioned close to the corresponding process in the network, where they can benefit from maximum network bandwidth. The process ordering is determined by the METIS partitioning scheme. The results show that METIS can effectively arrange intensively communicating processes as neighbors, thereby improving communication bandwidth.
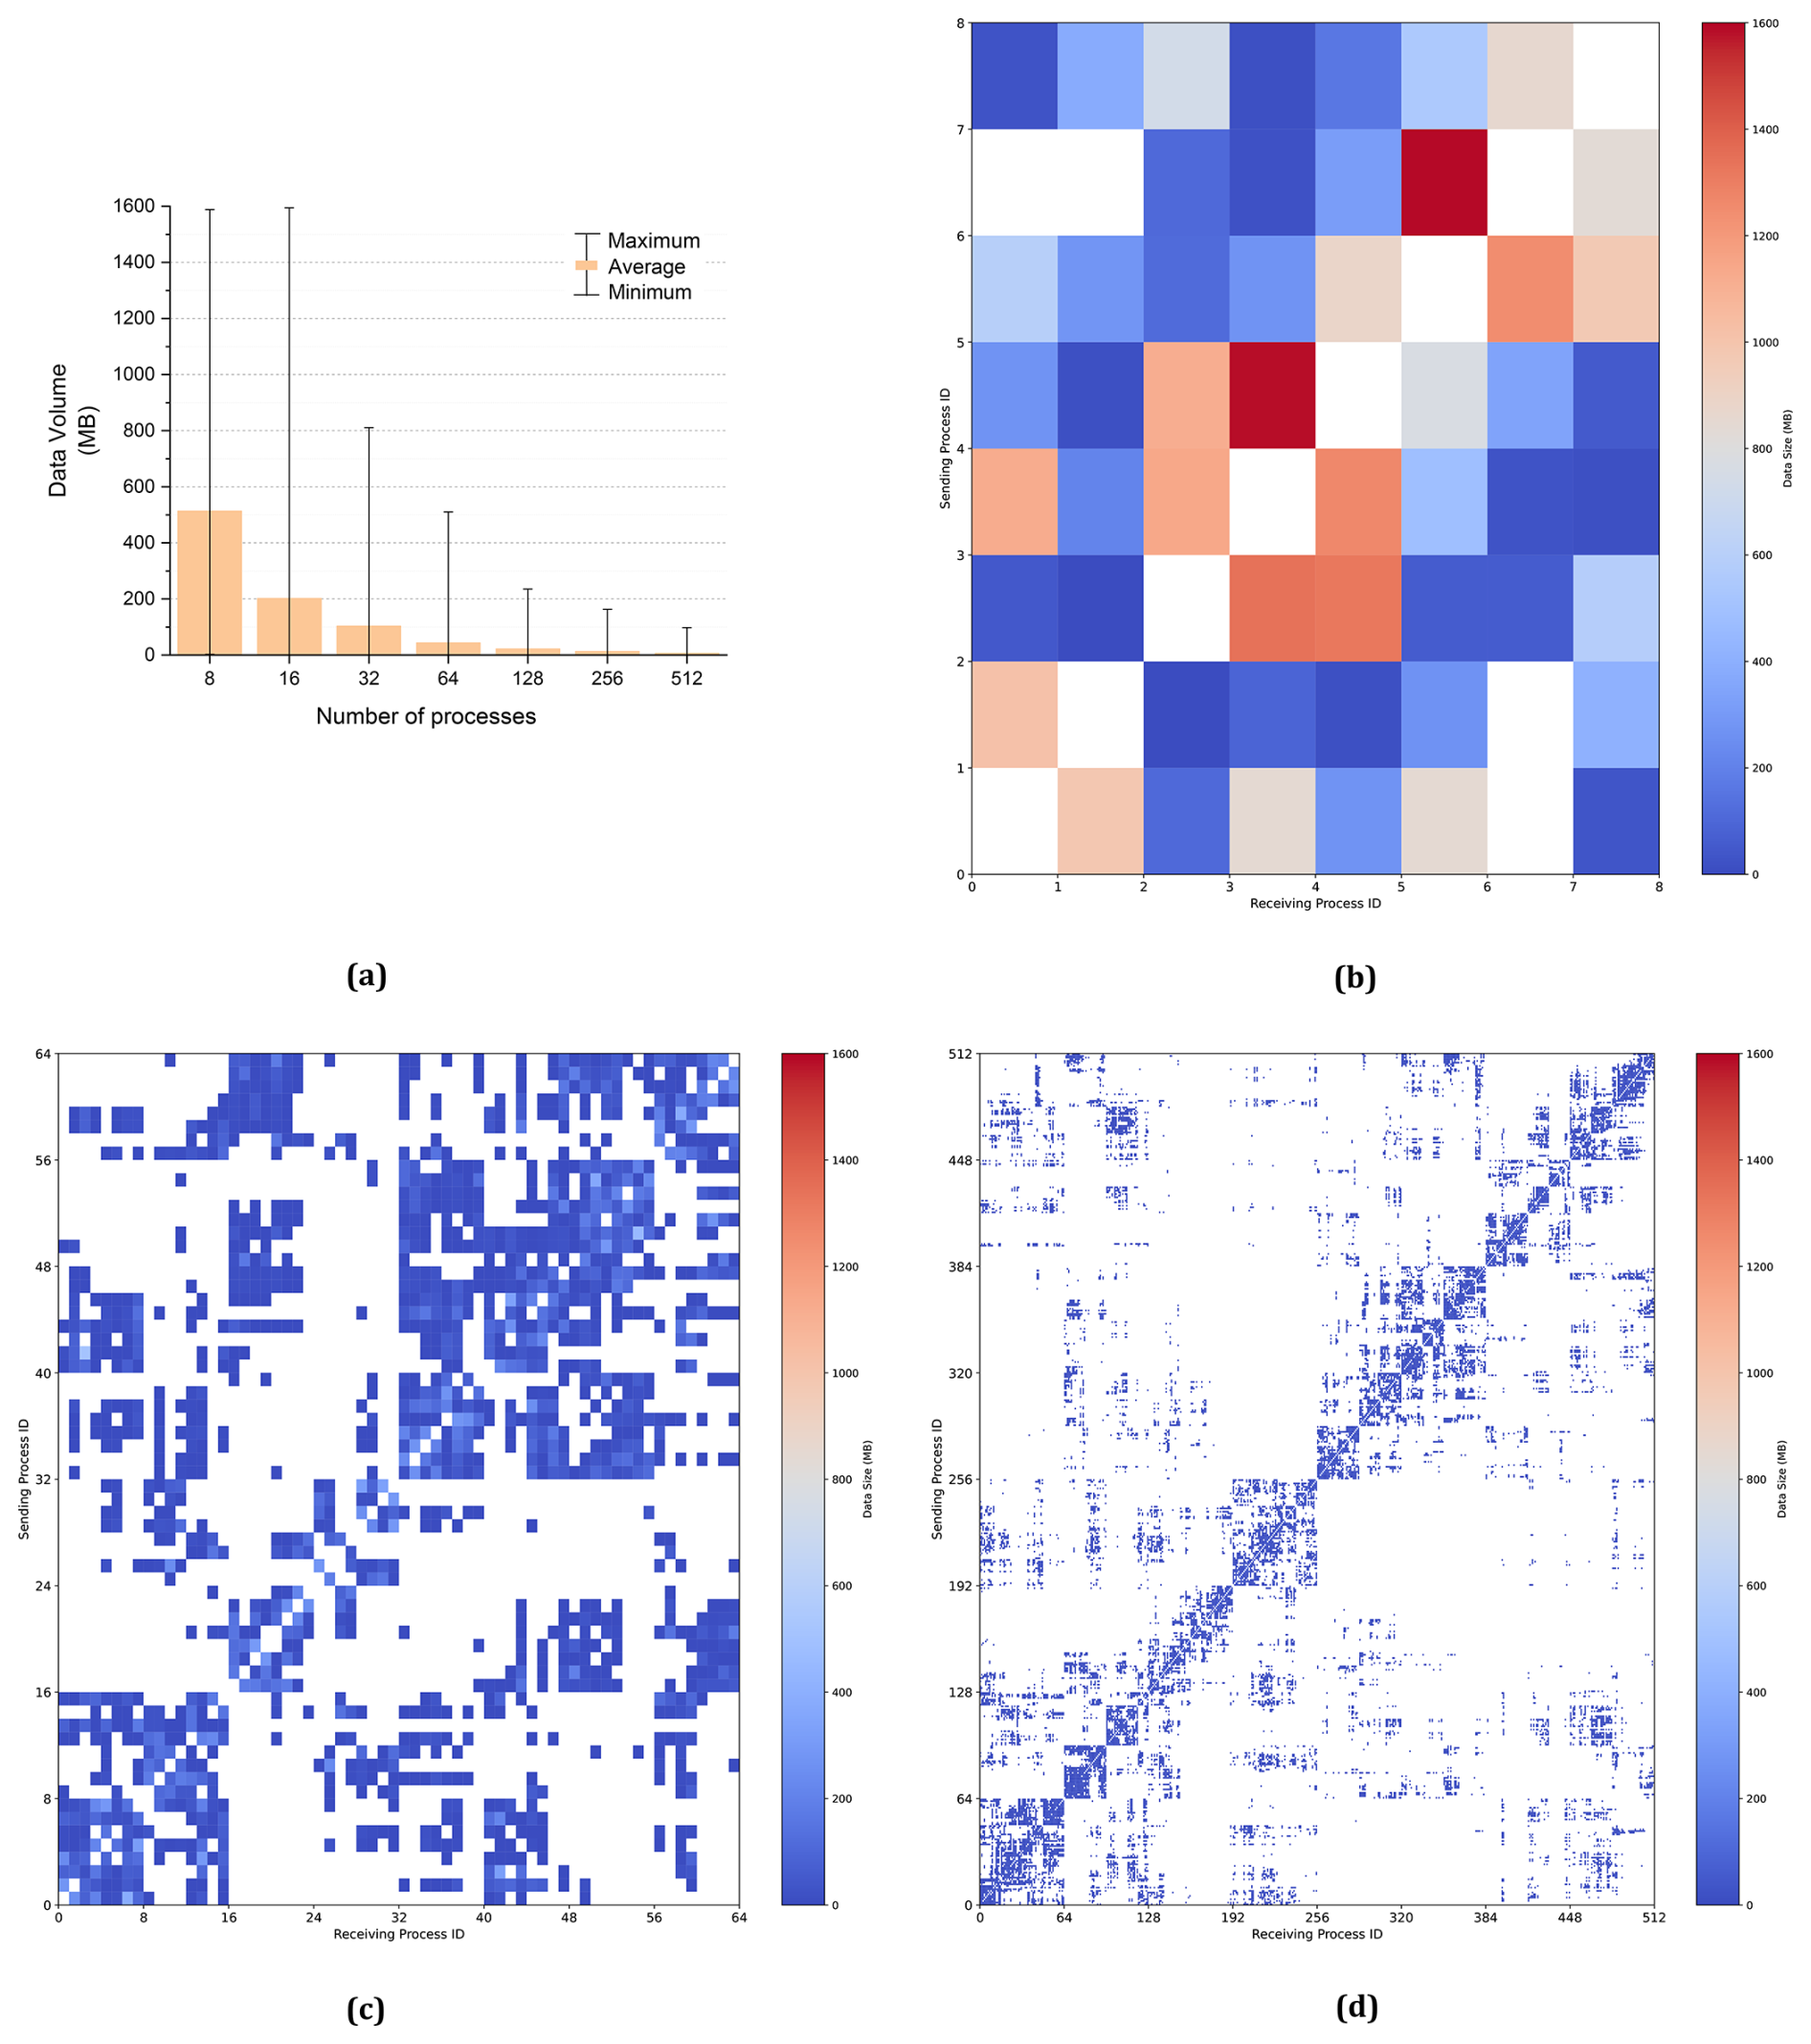
Figure 6(a) Average received data volume from 8 to 512 processes. The received data volume per process in 8 (b), 64 (c), and 512 (d) processes.
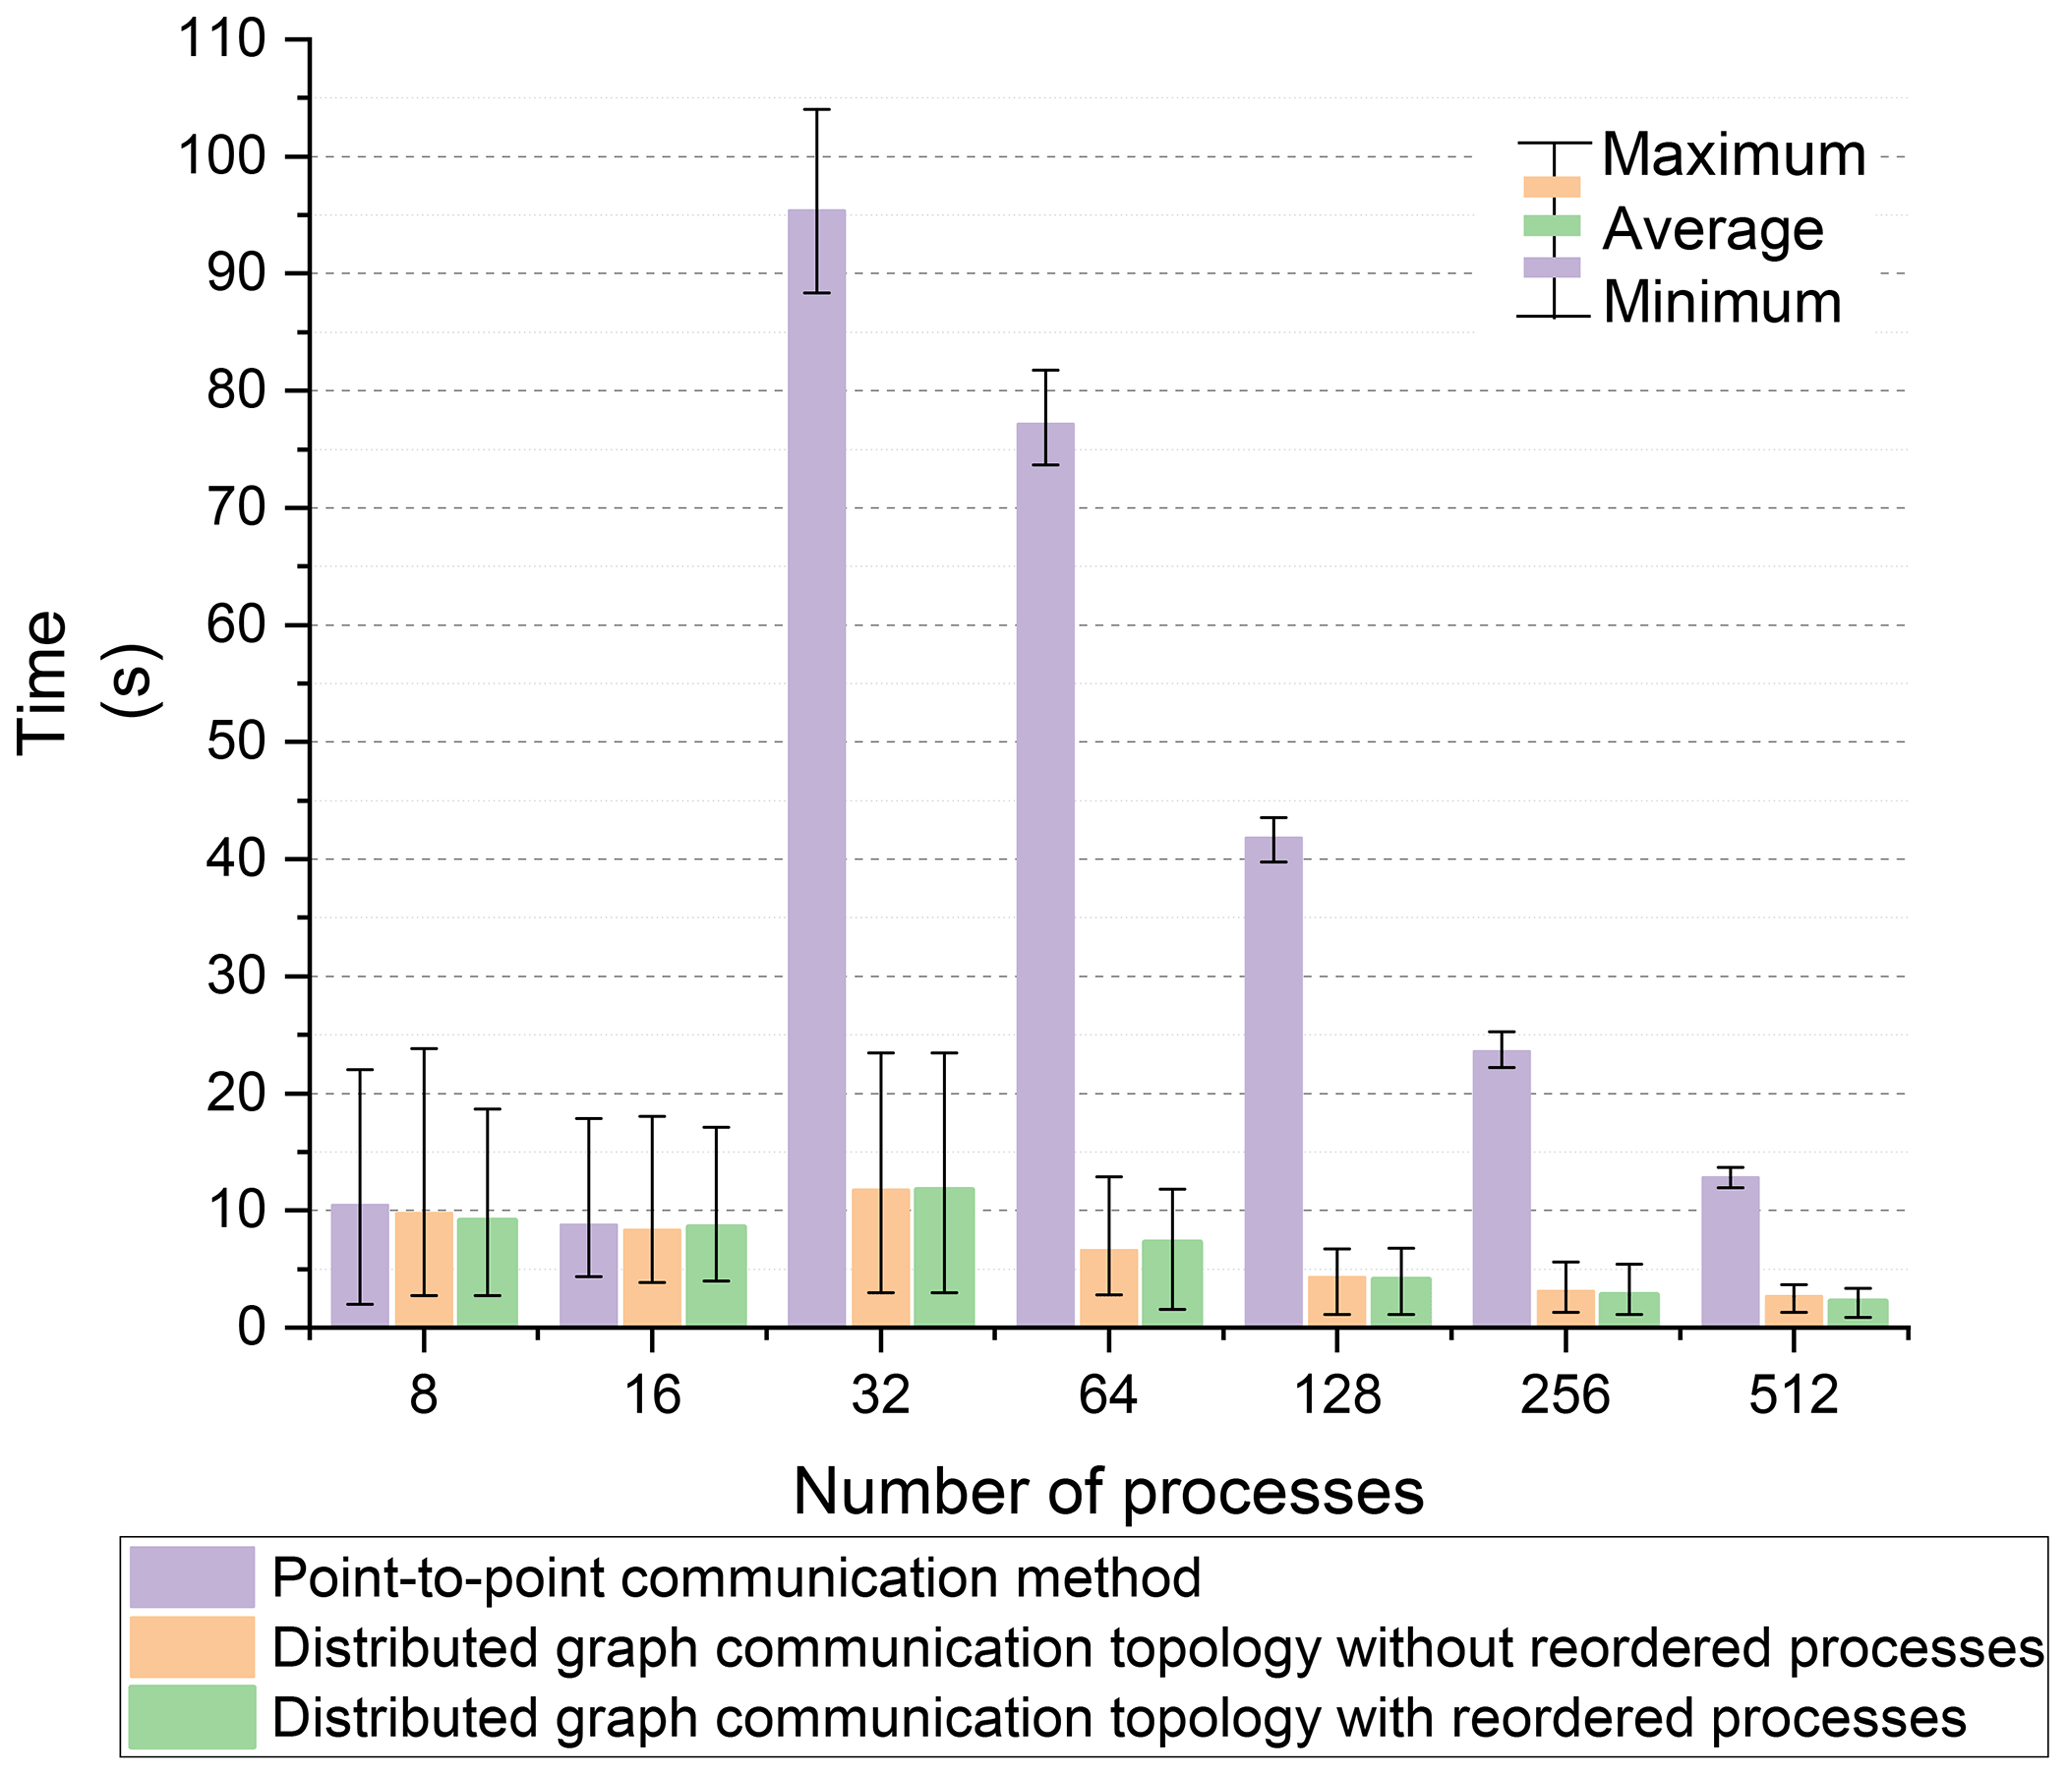
For an equivalent number of processes, the exchanged data and the number of neighboring processes for each process were consistent between the point-to-point communication method and the distributed graph communication topology. The time taken for neighboring communication using the two methods with the Intel MPI library is shown in Fig. 7. The color bar represents the average communication time across all processes. The upper line of the error bar (I) indicates the maximum communication time, and the lower line (I) represents the minimum communication time. For intra-node communication with 8 and 16 processes, the performance of both communication methods was similar. However, for inter-node communication, the distributed graph communication topology significantly outperformed the point-to-point communication method. Since the order of processes has been optimized by the METIS partitioning scheme, the performance gap between the distributed graph communication topology with and without reordered processes was minimal.
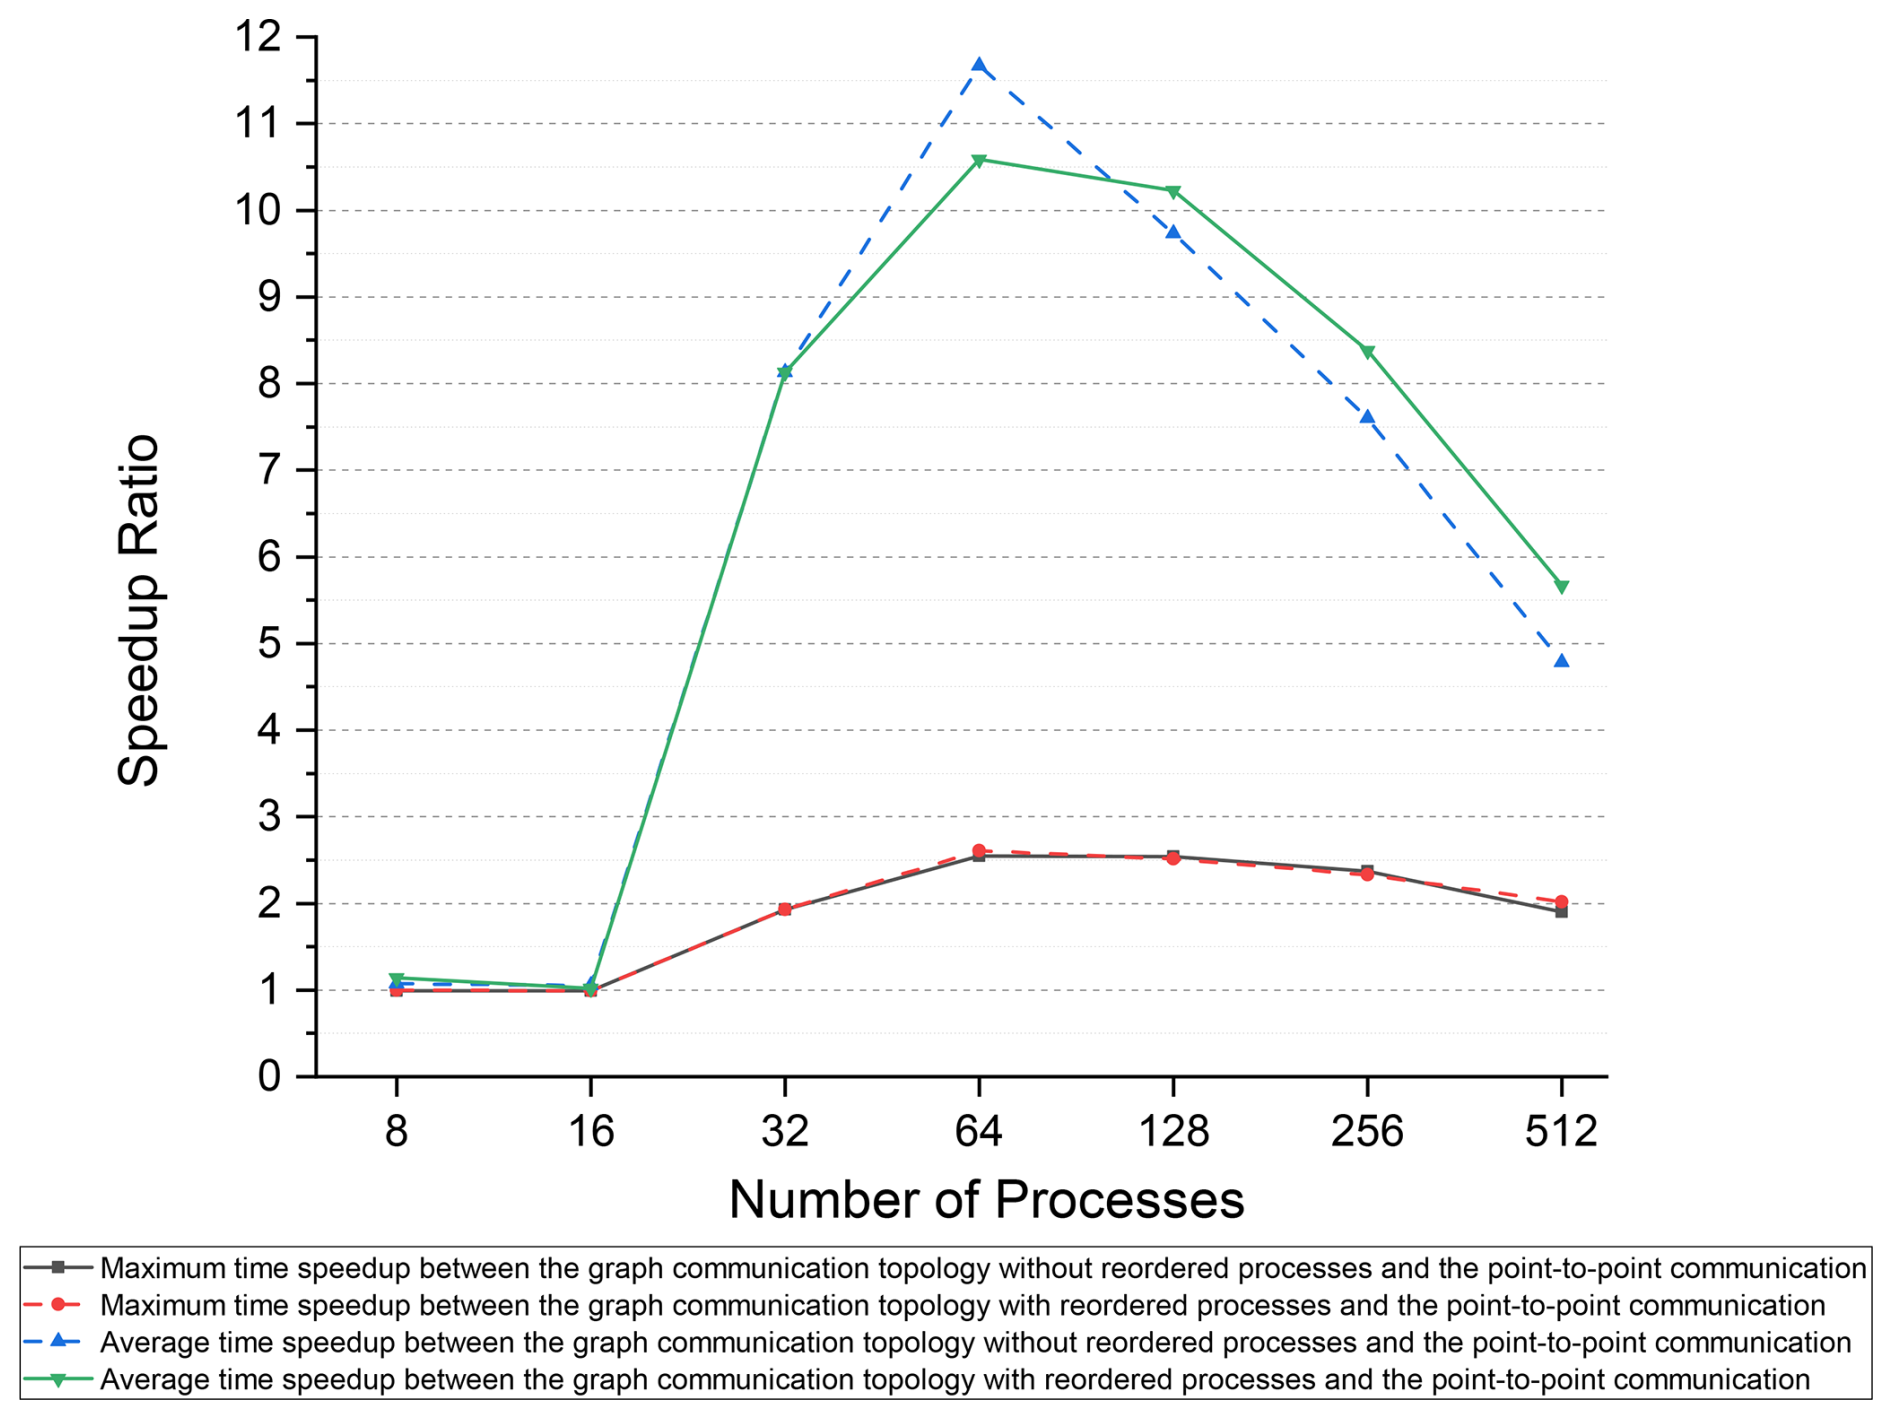
The maximum and average communication times are more critical for the assessment of the performance of various communication methods than the minimum communication time is. Based on the maximum and average communication times of the point-to-point communication method with the Intel MPI library, we calculated the speedup ratio for the distributed graph communication topology, as shown in Fig. 8. For intra-node communication with 8 to 16 processes, the performance of the two communication methods was similar. However, for inter-node communication, the performance of the distributed graph communication topology surpasses that of the point-to-point communication method, leading to an increase in the speedup ratio from 32 to 64 processes (28 processes per node). Compared to the point-to-point method, the distributed graph communication topology with reordered processes achieves a maximum average time speedup of 11.67 at 64 processes. Furthermore, the exchanged data volume continues to decrease as the number of processes increases. For processes beyond 64, the benefits of intra-node communication become less significant, which narrows the speedup ratio gap between the two methods.
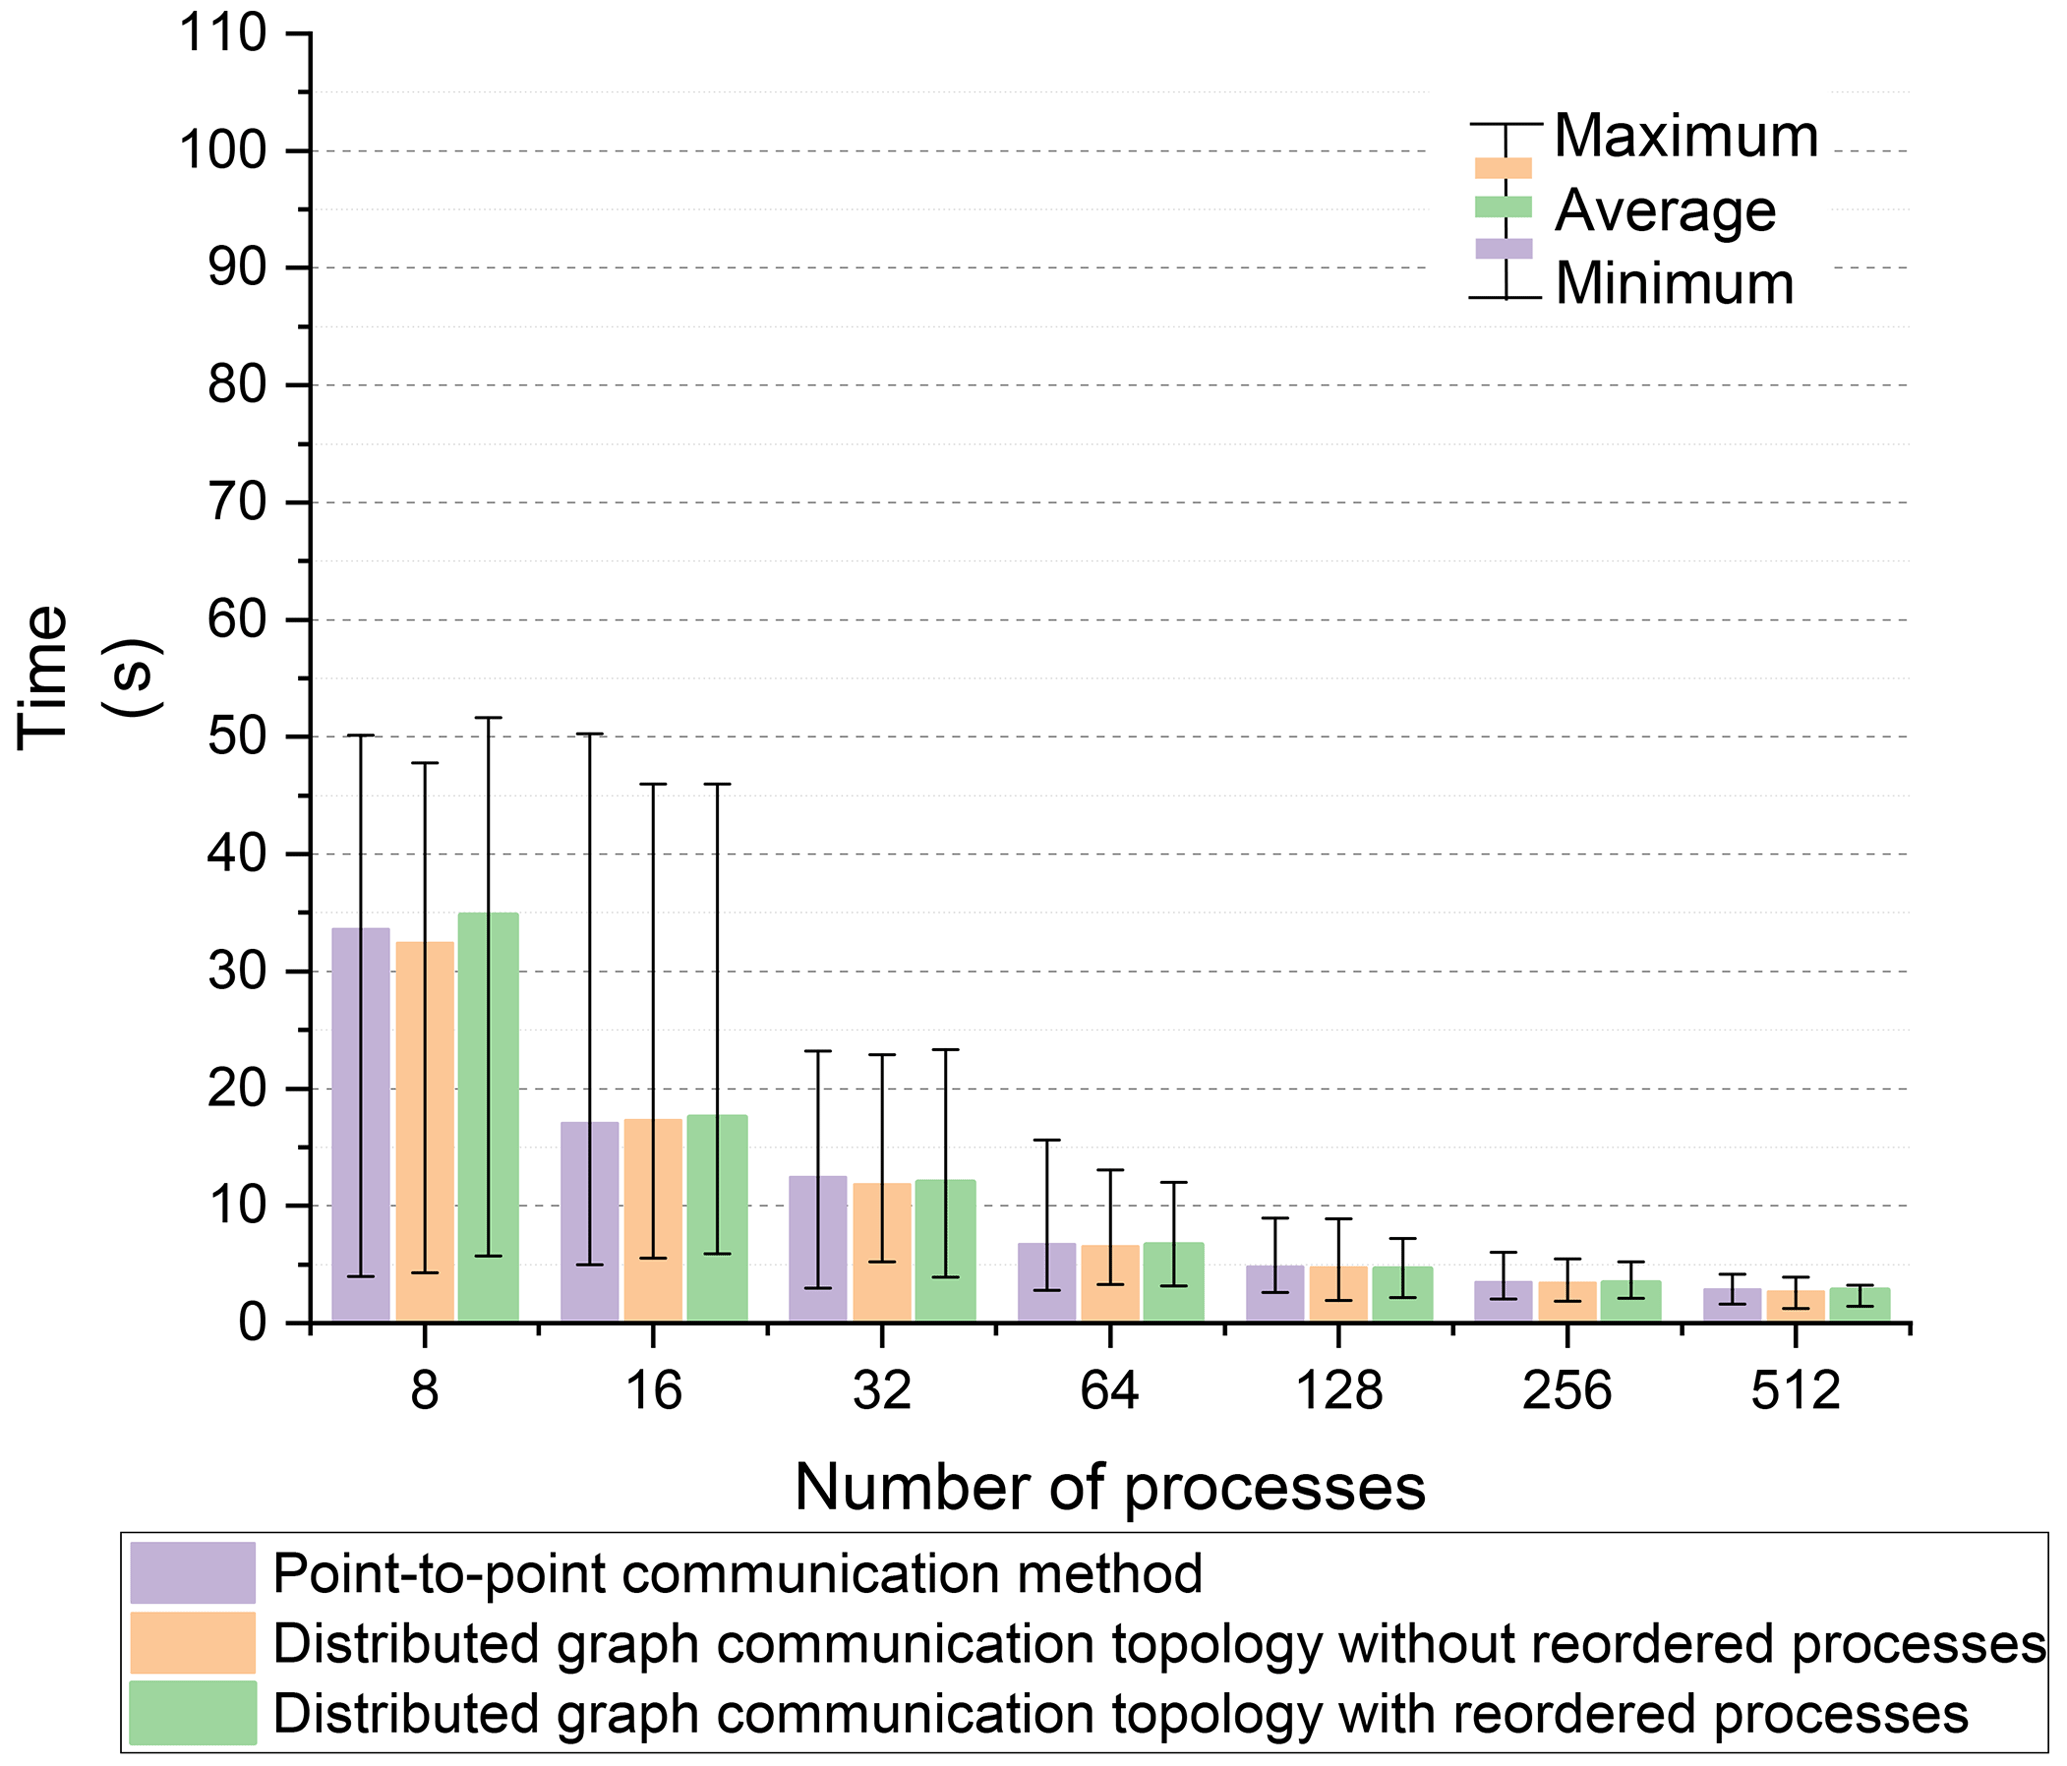
The model configuration with the Open MPI library is identical to that used with the Intel MPI library, as described in Sect. 4.1. The times of neighboring communication using both the distributed graph communication topology and the point-to-point communication method are shown in Fig. 9. The performance gap between the two methods is minimal. Additionally, no significant performance improvement was observed for intra-node communication with 8 or 16 processes when using the Open MPI library, as compared to the Intel MPI library. This indicates that the substantial performance improvement achieved by the distributed graph communication topology, in comparison to the point-to-point method, depends on the specific MPI library implementation.
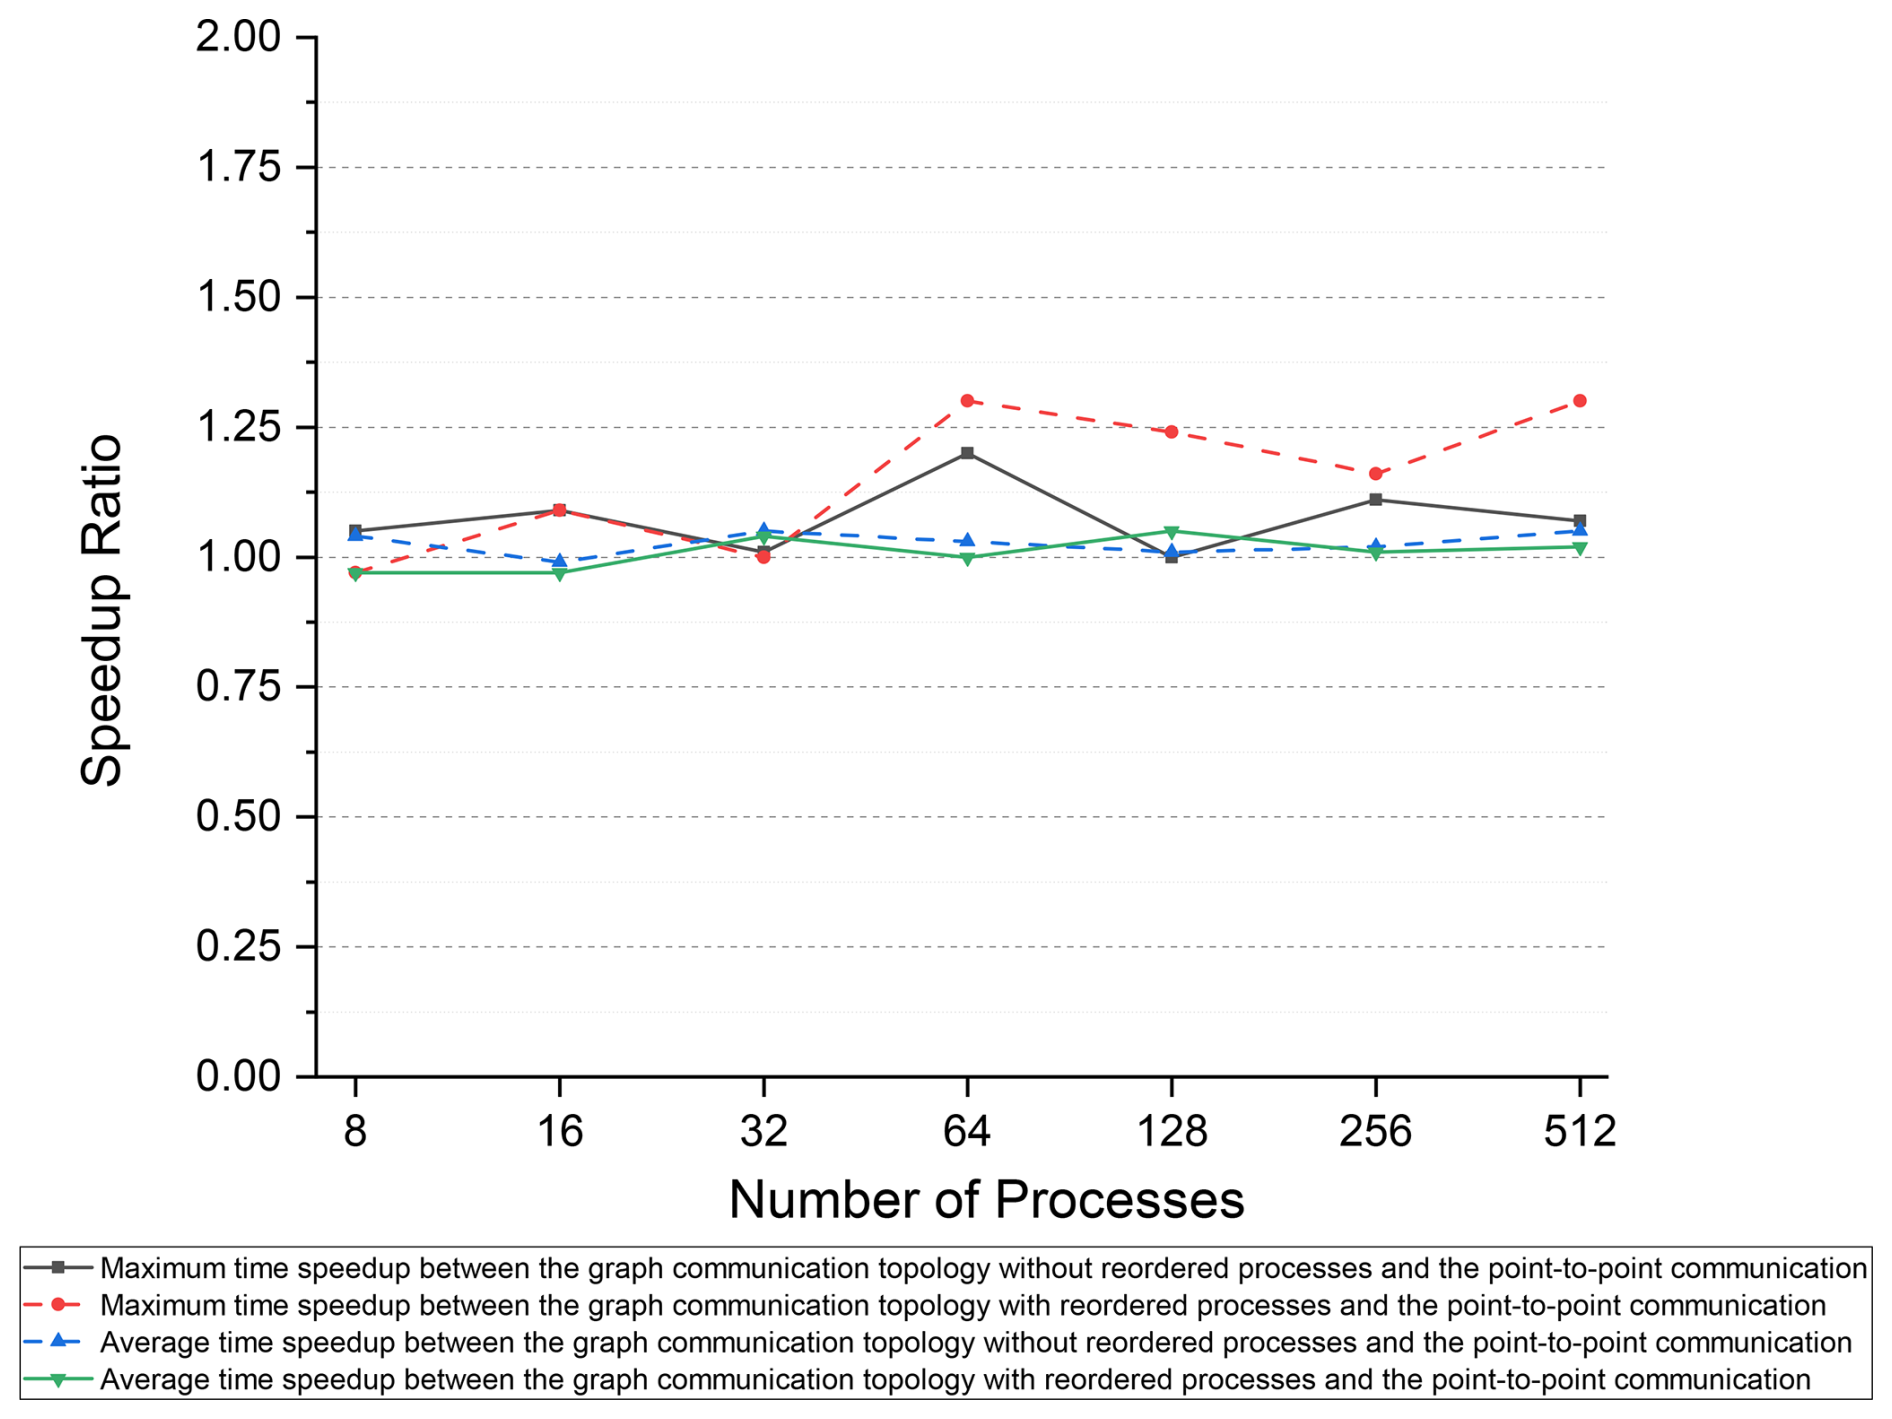
Based on the maximum and average communication times of the point-to-point communication method with the Open MPI library, the speedup ratio for the distributed graph communication topology is shown in Fig. 10. Even when using the Open MPI library, for inter-node communication, the distributed graph communication topology offers a slight advantage over the point-to-point communication method.
Different MPI implementations may utilize varying communication patterns, process binding and scheduling strategies, buffer management techniques, and support for remote direct memory access (RDMA). These differences can lead to performance disparities among MPI implementations. For intra-node communication, both the distributed graph communication topology and the point-to-point communication method using the Intel MPI library significantly outperformed their counterparts implemented with the Open MPI library. Liu et al. (2003) stated that the Intel MPI library enhances performance by leveraging shared memory mechanisms for intra-node communication. For inter-node communication, the distributed graph communication topology exhibited similar performance with both the Intel MPI and Open MPI libraries. However, the point-to-point communication method with the Open MPI library demonstrated significantly superior performance compared to the Intel MPI library. Rashti (2010) identified high overhead for small messages with the Intel MPI library, which was attributed to semantics miscorrelation between MPI and the user-level library. A further potential cause could be the lack of RDMA support or poor buffer management performance for small messages in the point-to-point communication method using the Intel MPI library.
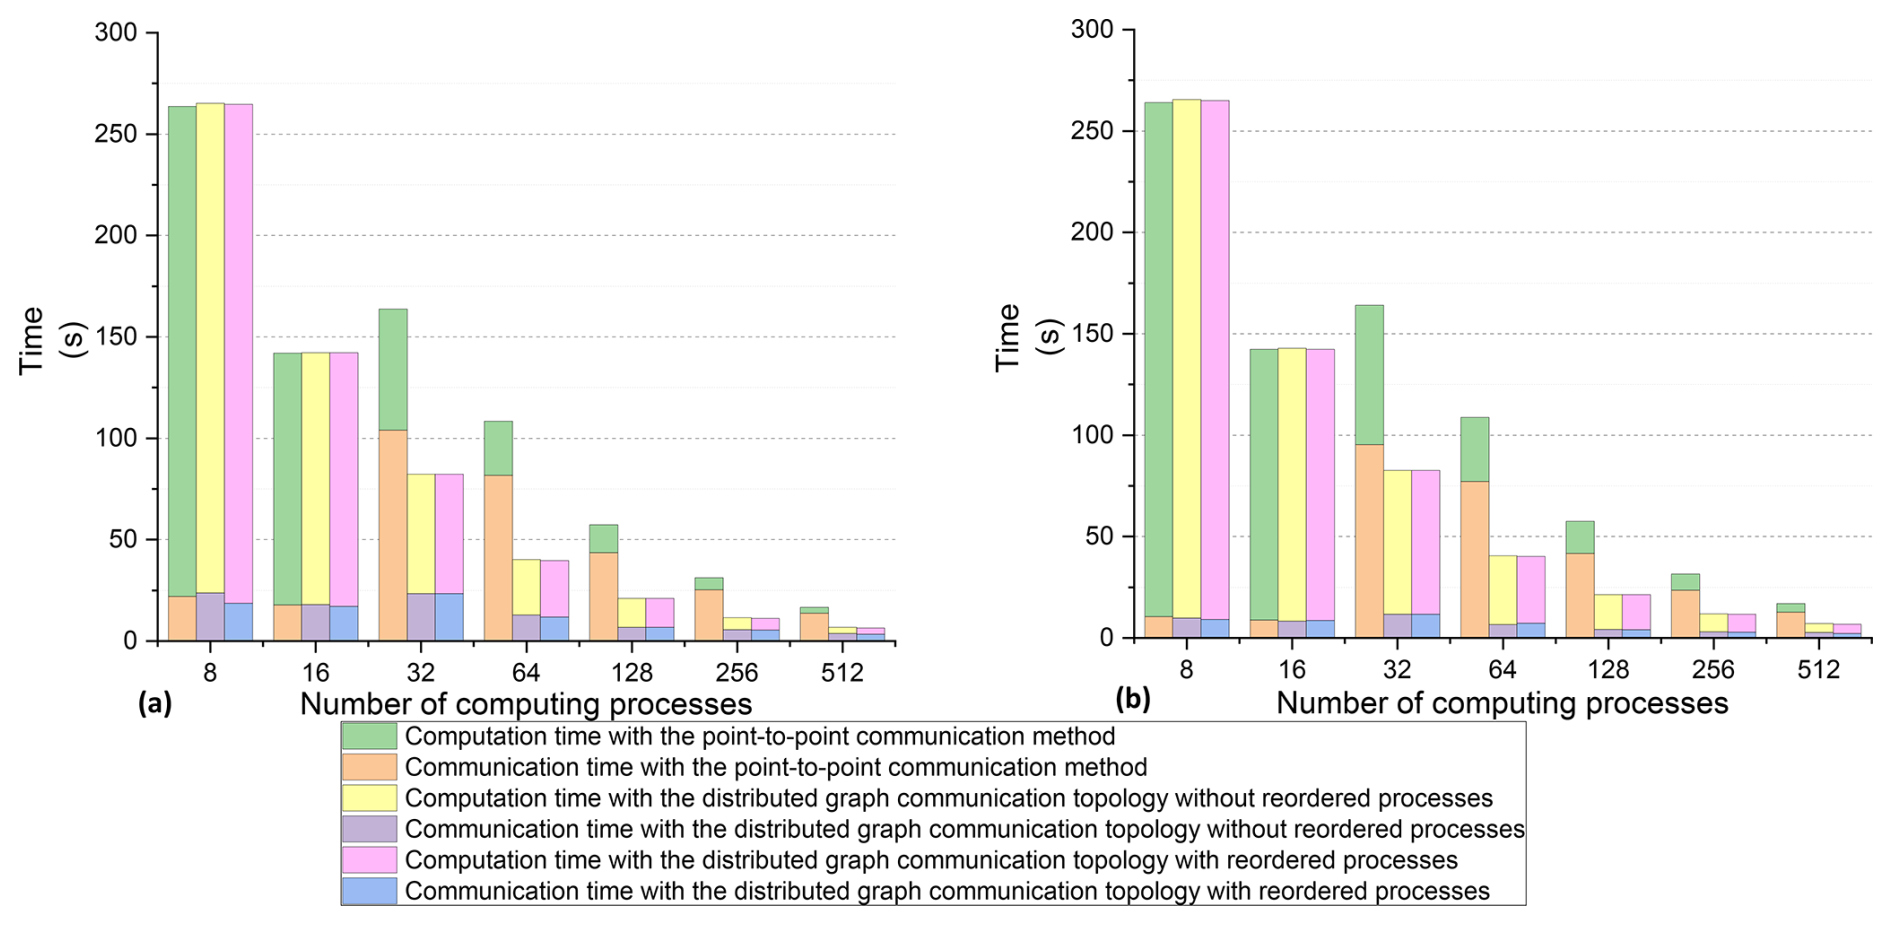
Figure 11(a) Maximum communication and computation time. (b) Average communication and computation time.
4.1.3 Performance evaluation of the FVWAM
The FVWAM was evaluated over a 1 h forecasting period, during which we measured both communication and computation times, excluding initialization operations and I/O costs. The maximum communication and computation times across all processes based on the Intel MPI library are shown in Fig. 11a, while the average communication and computation times are depicted in Fig. 11b. A proportional reduction in computation time was observed as the number of processes increased. The computation times using both the distributed graph communication topology and the point-to-point communication method were nearly identical for the same number of computing processes, indicating stable utilization of computing resources during the experiments. The runtime of the FVWAM with the distributed graph communication topology decreased as the number of processes increased from 8 to 512. However, due to the rising cost of inter-node communication with the point-to-point communication method, the runtime with 32 processes was higher than that with 16 processes.
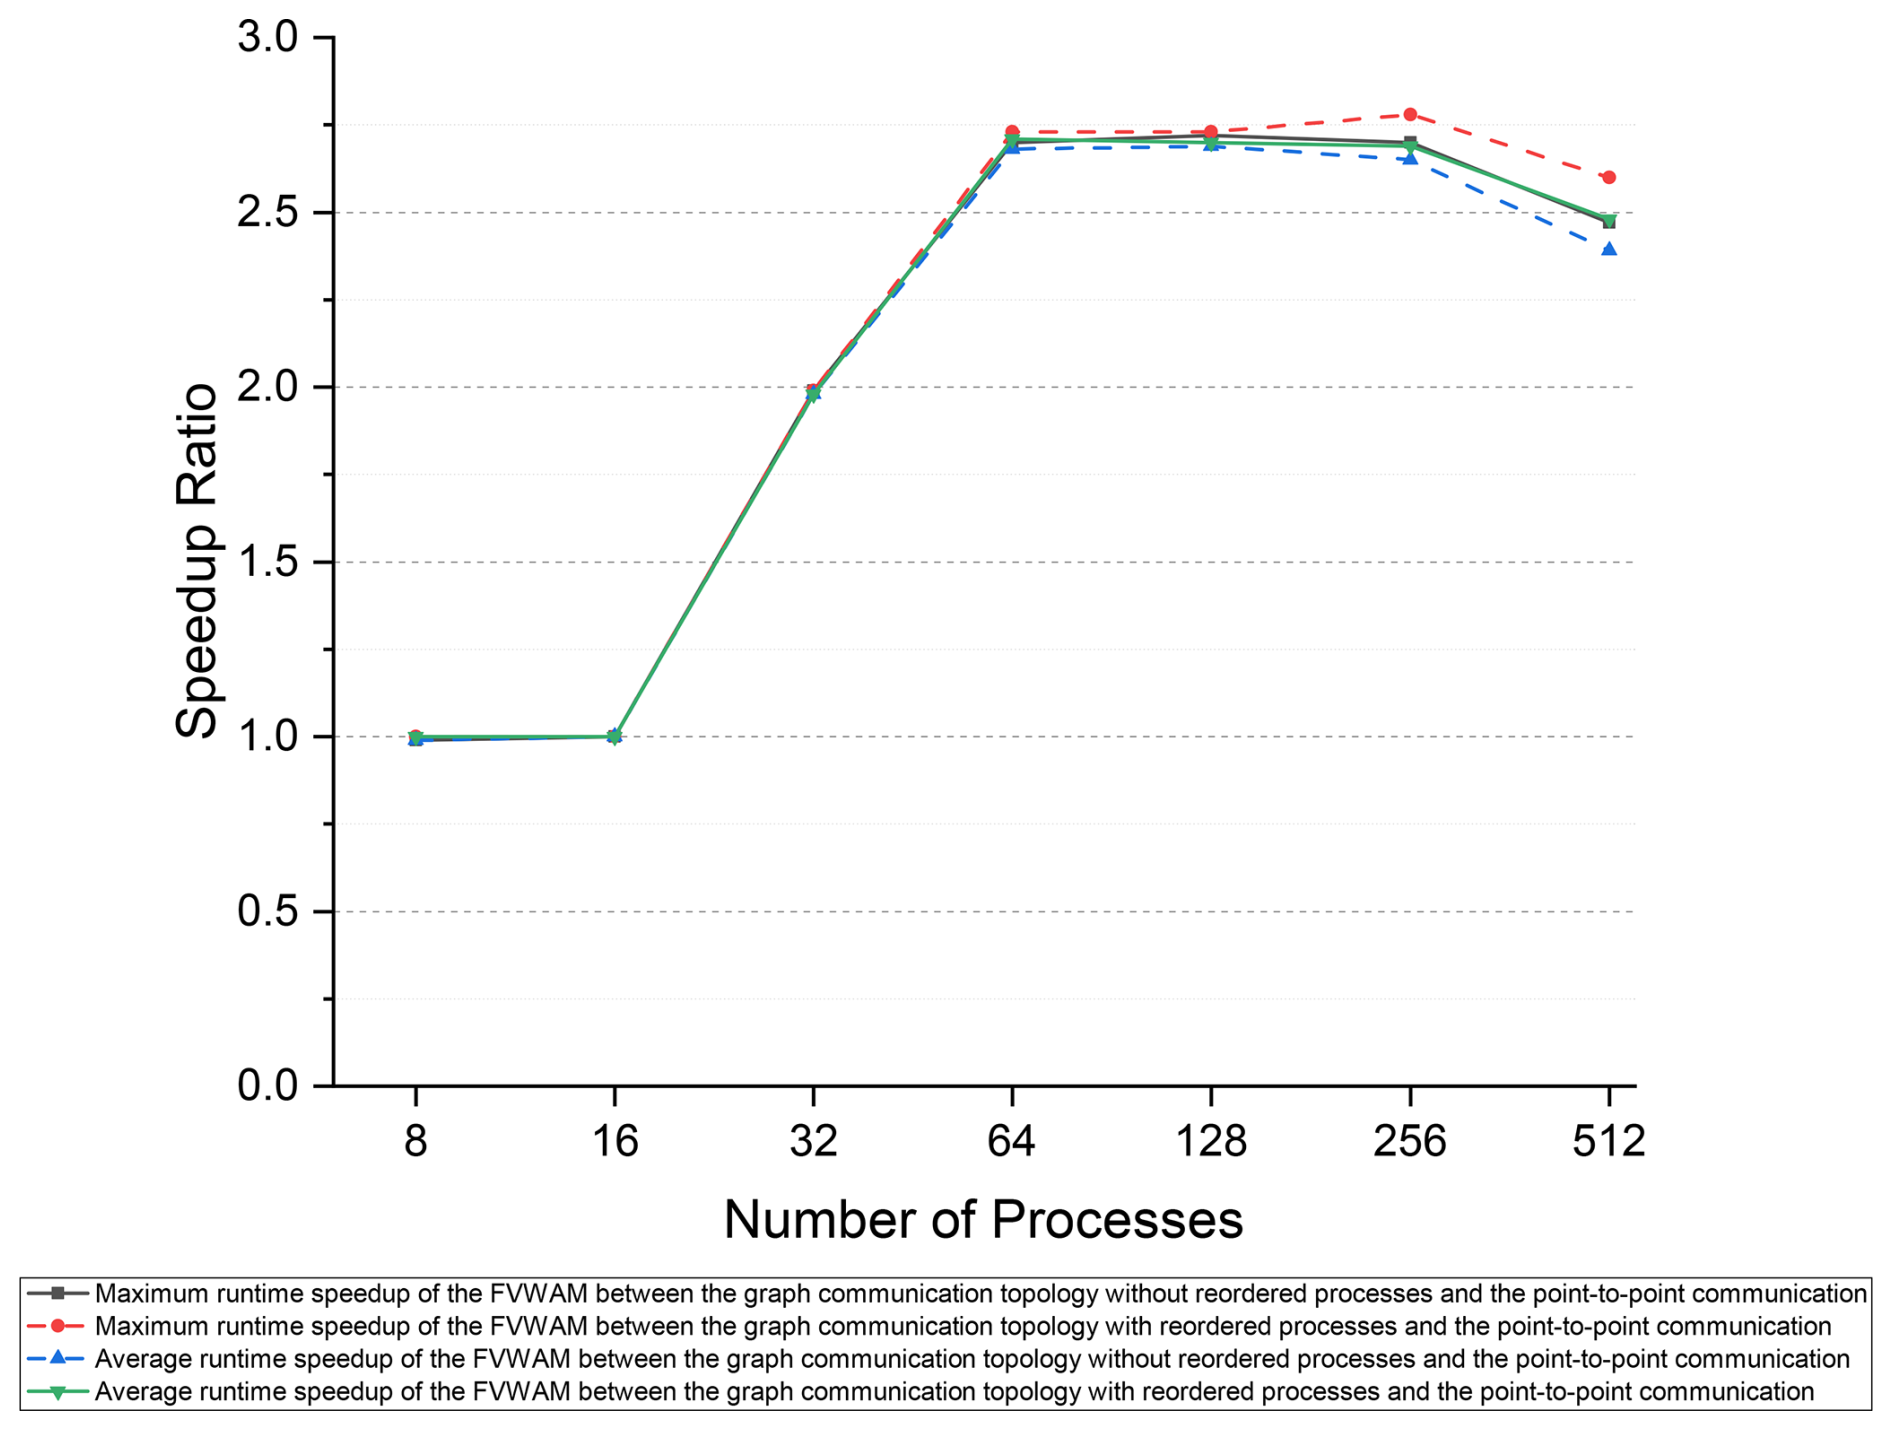
Based on the Intel MPI library, we employed the runtime of the FVWAM with the point-to-point communication method as the baseline to calculate the speedup of the model with the distributed graph communication topology, as shown in Fig. 12. The maximum runtime refers to the actual runtime of the FVWAM, excluding I/O and initialization operations. The maximum speedup ratio between the distributed graph communication topology with ordered processes and the point-to-point communication method is 2.78 at 256 processes. This demonstrates that reducing communication costs with the distributed graph communication topology based on the Intel MPI library can significantly improve model performance.
4.1.4 Operational products of the FVWAM
The FVWAM, with a regional resolution of 6–12 km for the northwest Pacific, is utilized to produce the daily 7 d forecasts for significant wave height, wave period, and wave direction at the NMEFC. Among these variables, significant wave height is considered the critical variable for mitigating wave-related disasters. Figure 13 shows the operational forecast products for significant wave height at 00:00 UTC+8 h from 3 to 8 September 2024. The unit of measurement for significant wave height is meters. We compared key variables, including significant wave height, wave period, and wave direction, across the output files generated by the point-to-point communication method and the distributed graph communication topology based on both the Intel MPI library and the Open MPI library. No differences were observed, confirming the correctness of both communication methods within the same MPI implementation.
The wind field is driven by the typhoon path and intensity forecast provided by the China Meteorological Administration. The typhoon used in Fig. 13 is Typhoon Yagi (no. 2411). The FVWAM's wave forecasting products have provided valuable decision support to both the government and the public, helping to mitigate casualties and economic losses in China.
In the routine operations of the FVWAM for this regional case, the NMEFC typically uses 256 processes as the standard computational scale. When implementing the distributed graph communication topology with reordered processes at this scale, the iterative runtime of the FVWAM can be reduced by up to 64 % compared to the point-to-point communication method. This represents a significant improvement in the operational efficiency of the regional wave forecasting service provided by the FVWAM at the NMEFC.
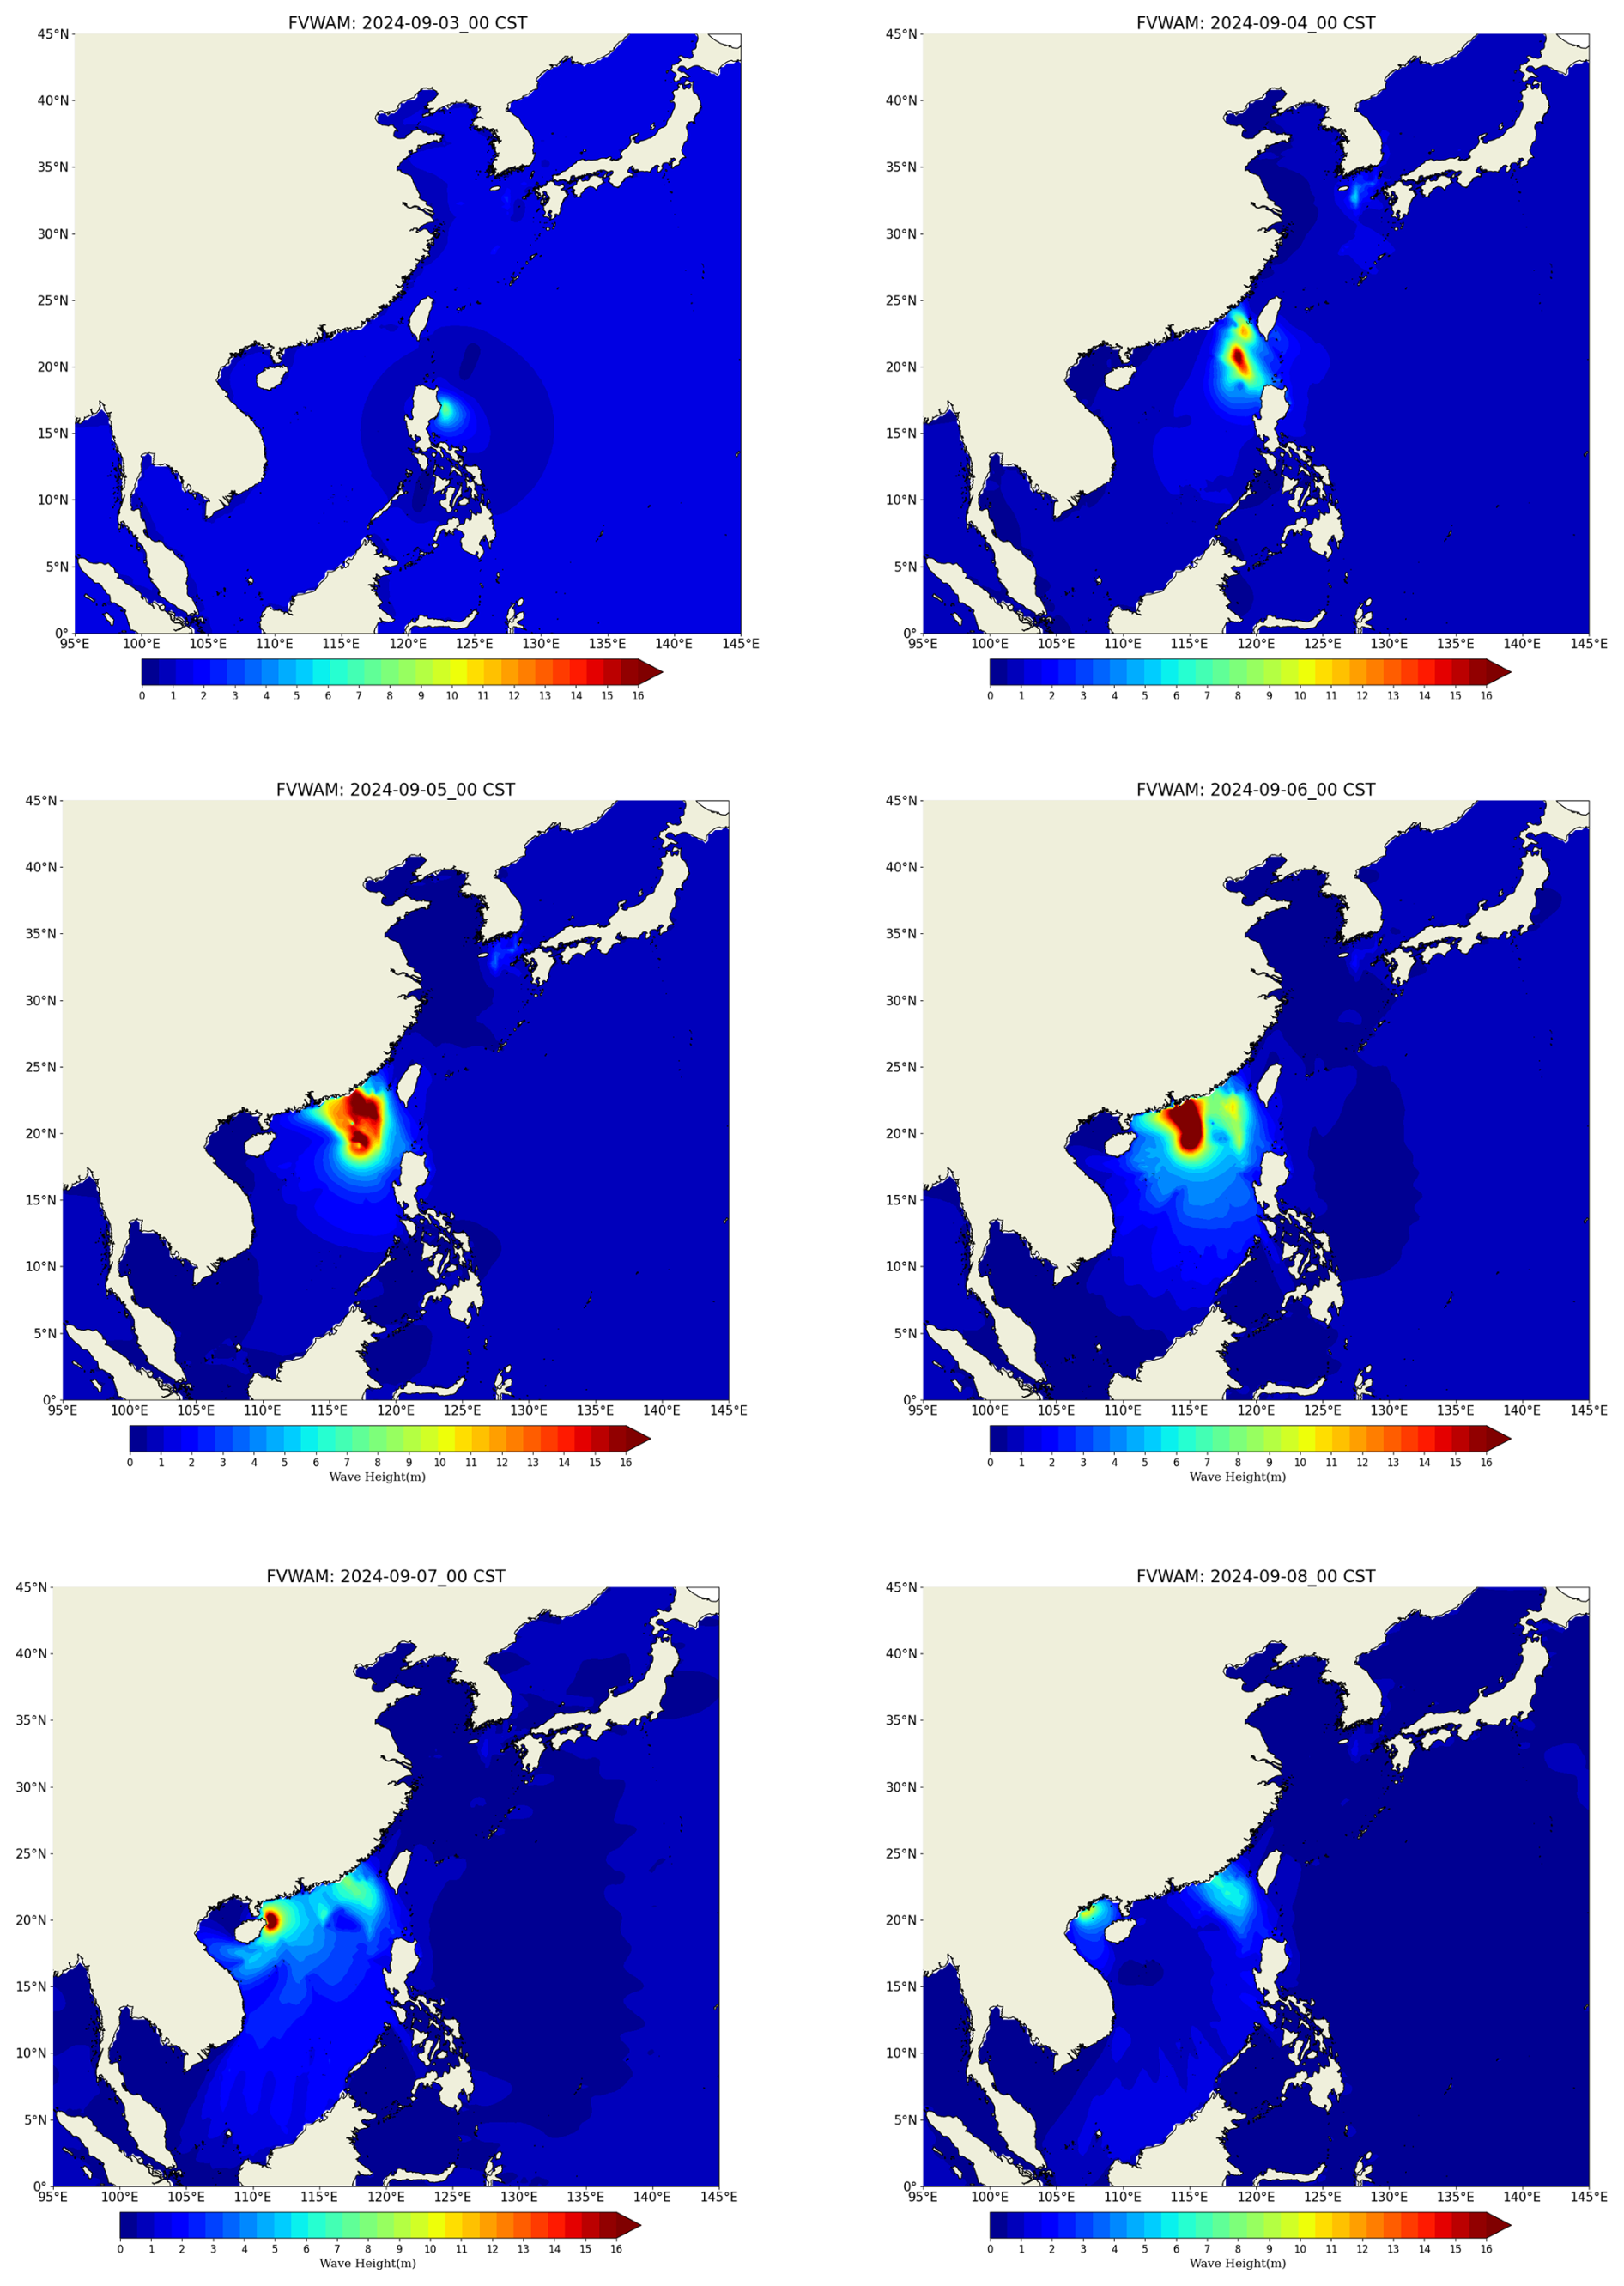
Figure 13Regional significant-wave-height products of the FVWAM.
4.2 Large-scale parallel experiments with a global case
4.2.1 Experiment environment and configuration
To evaluate whether the distributed graph communication topology outperforms the point-to-point communication method based on the Intel MPI library on a different platform at a large parallel scale, additional experiments were conducted on the cluster at the National Supercomputing Center of China in Jinan. The software and hardware environment in the experiments is outlined in Table 3.
In the FVWAM configuration, the global cell resolution is °, the count of horizontal cells is 6 160 386, the count of the directional spectrum is 36, and the count of the frequency spectrum is 35. For each communication method, experiments were repeated twice with the same number of processes, and the better result was selected to mitigate the impact of fluctuations in computing resources, the shared network, and the global file system.
4.2.2 Communication performance results
Based on Eq. (2), the minimum, average, and maximum data volumes received by each process are shown in Fig. 14a, with the number of processes ranging from 512 to 32 768. The data volume received by each process is depicted in Fig. 14b–d. In these figures, the x axis represents the receiving process IDs, the y axis represents the sending process IDs, and the color indicates the volume of data received by each process from others.
As observed in the regional experiments described in Sect. 4.1.2, an increase in the number of processes leads to a decrease in the average data volume received by each process. The results further demonstrate that the majority of data exchanges occur between neighboring process IDs, which explains why enabling the reordered option in the distributed graph communication topology results in only a marginal performance improvement.
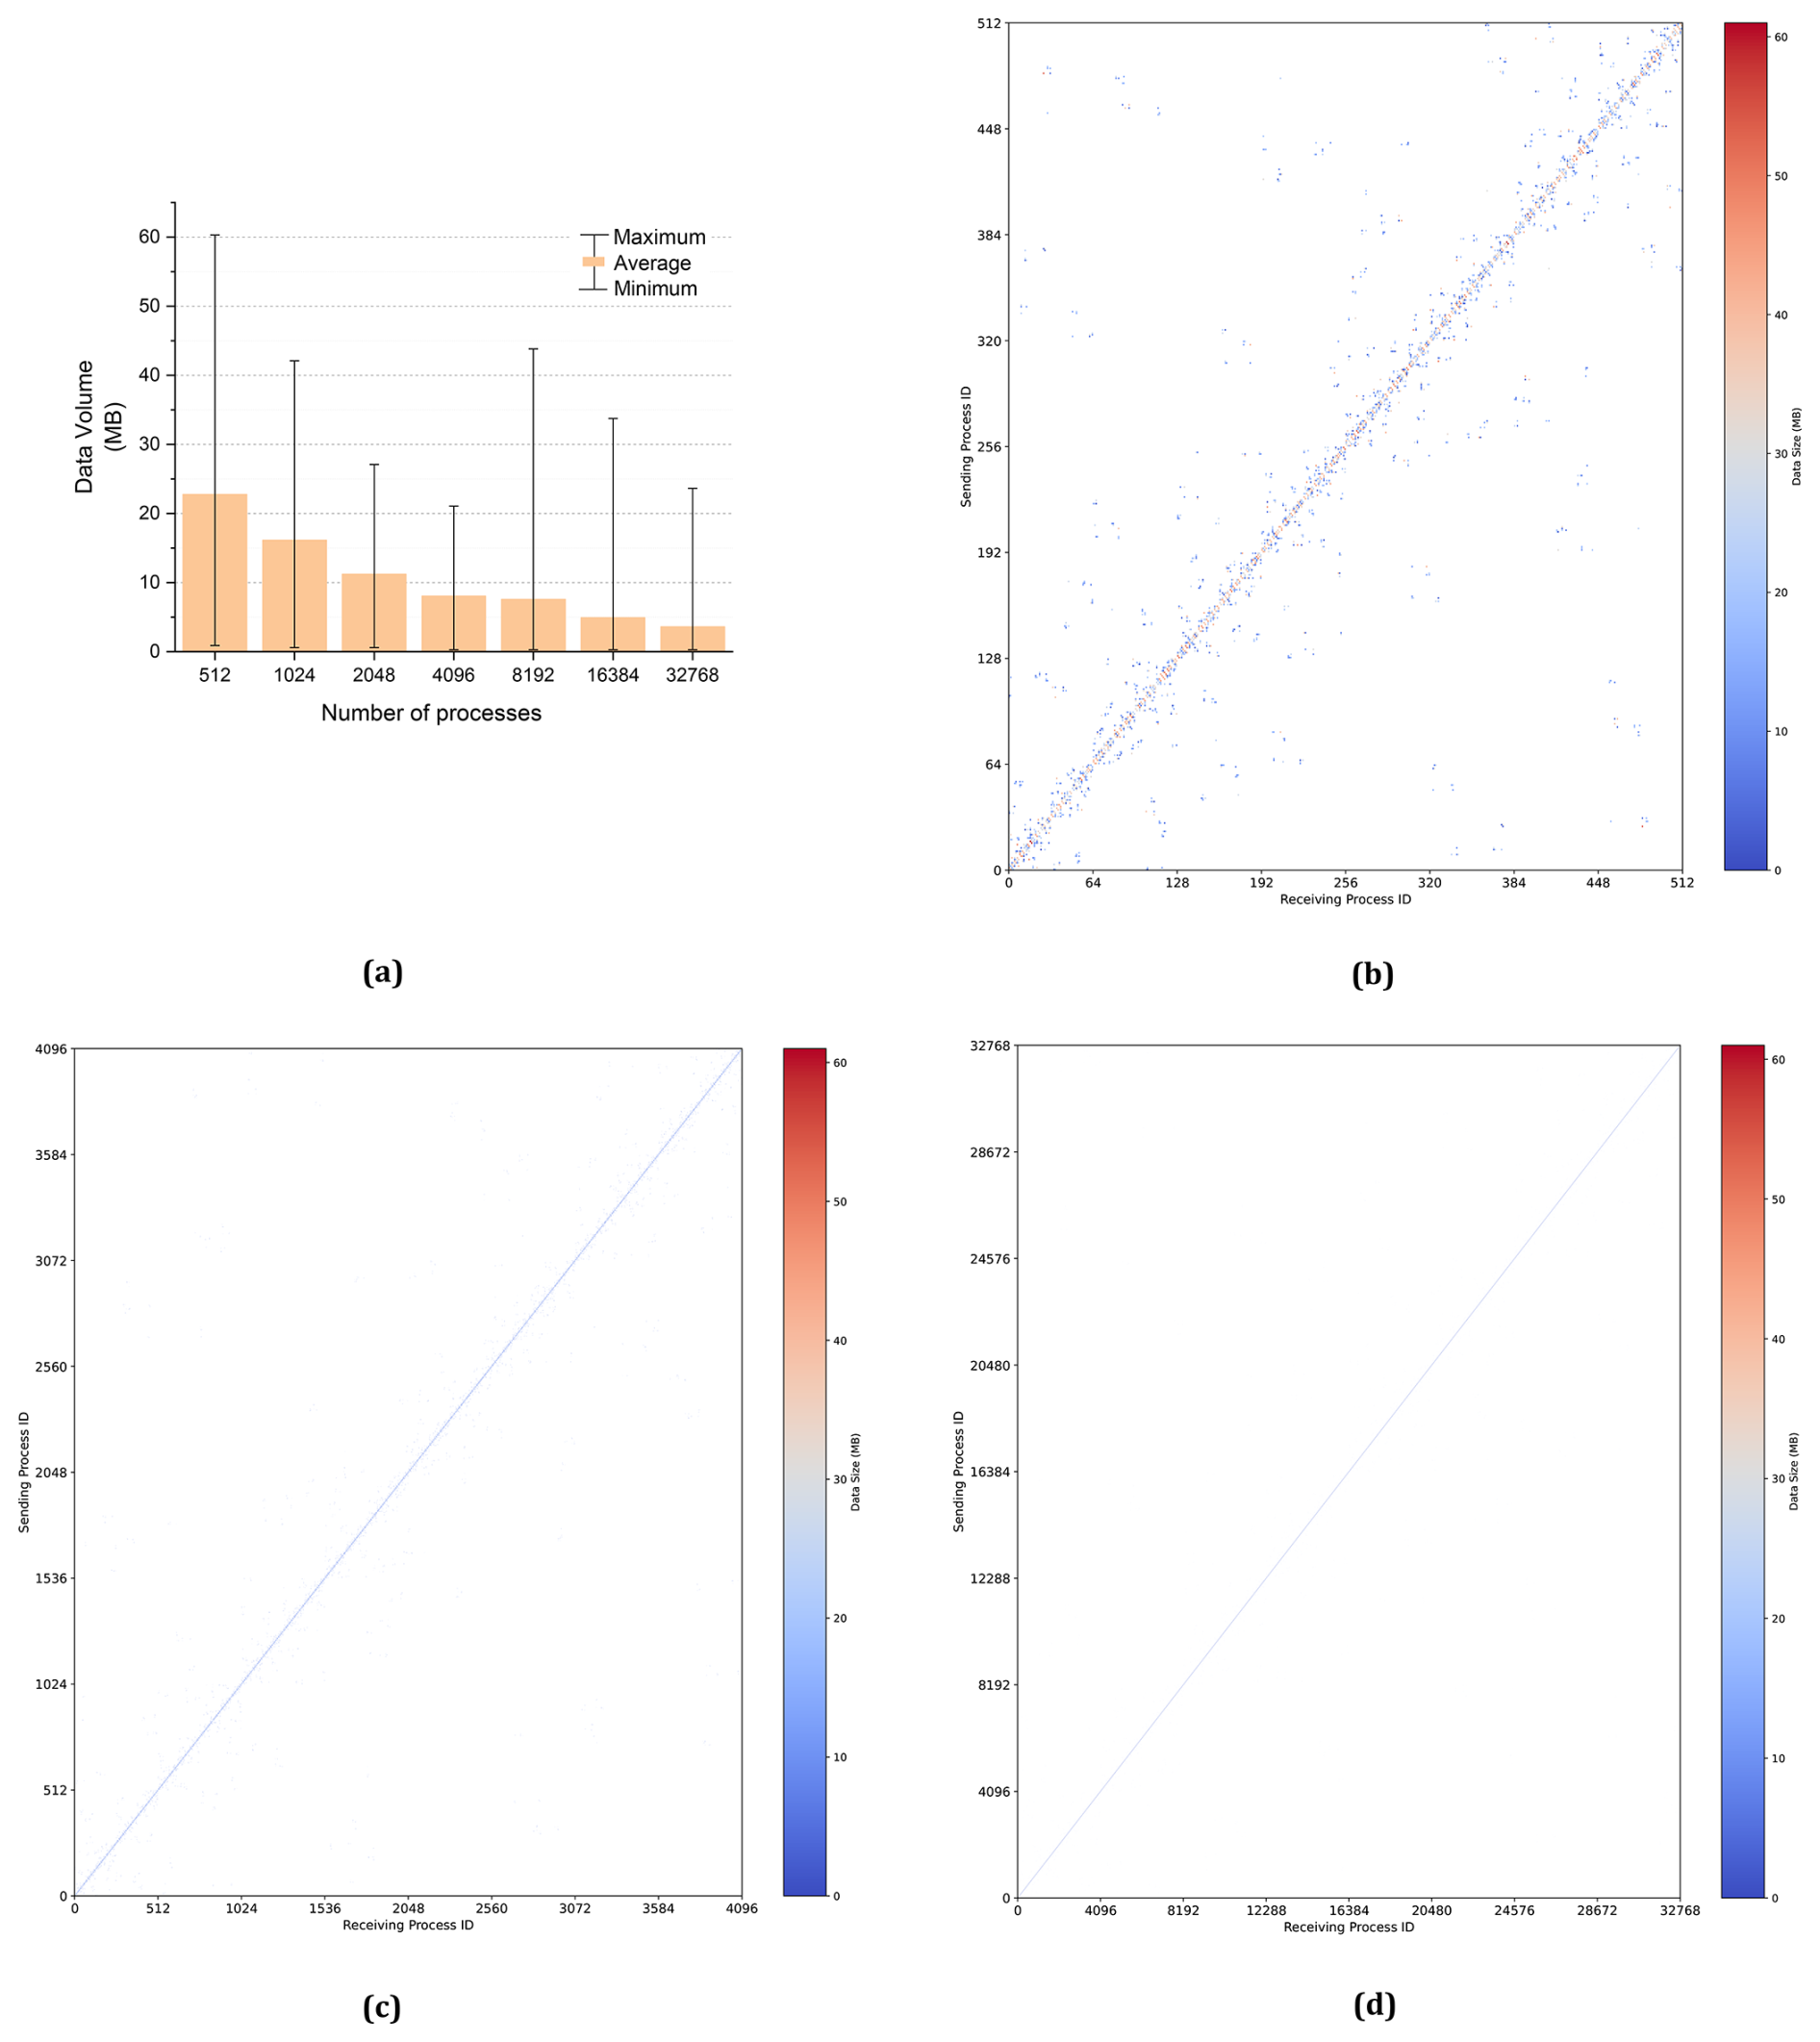
Figure 14(a) Average received data volume from 512 to 32 768 processes. The received data volume per process in 512 (b), 4096 (c), and 32 768 (d) processes.
The time step of iterative computation in the experiment was 60 s, and the forecasting period was 1 h. The total number of iterations of neighboring communication for wave action N during the experiments was 60. Based on the Intel MPI library, the time of neighboring communication using these two methods is illustrated in Fig. 15.
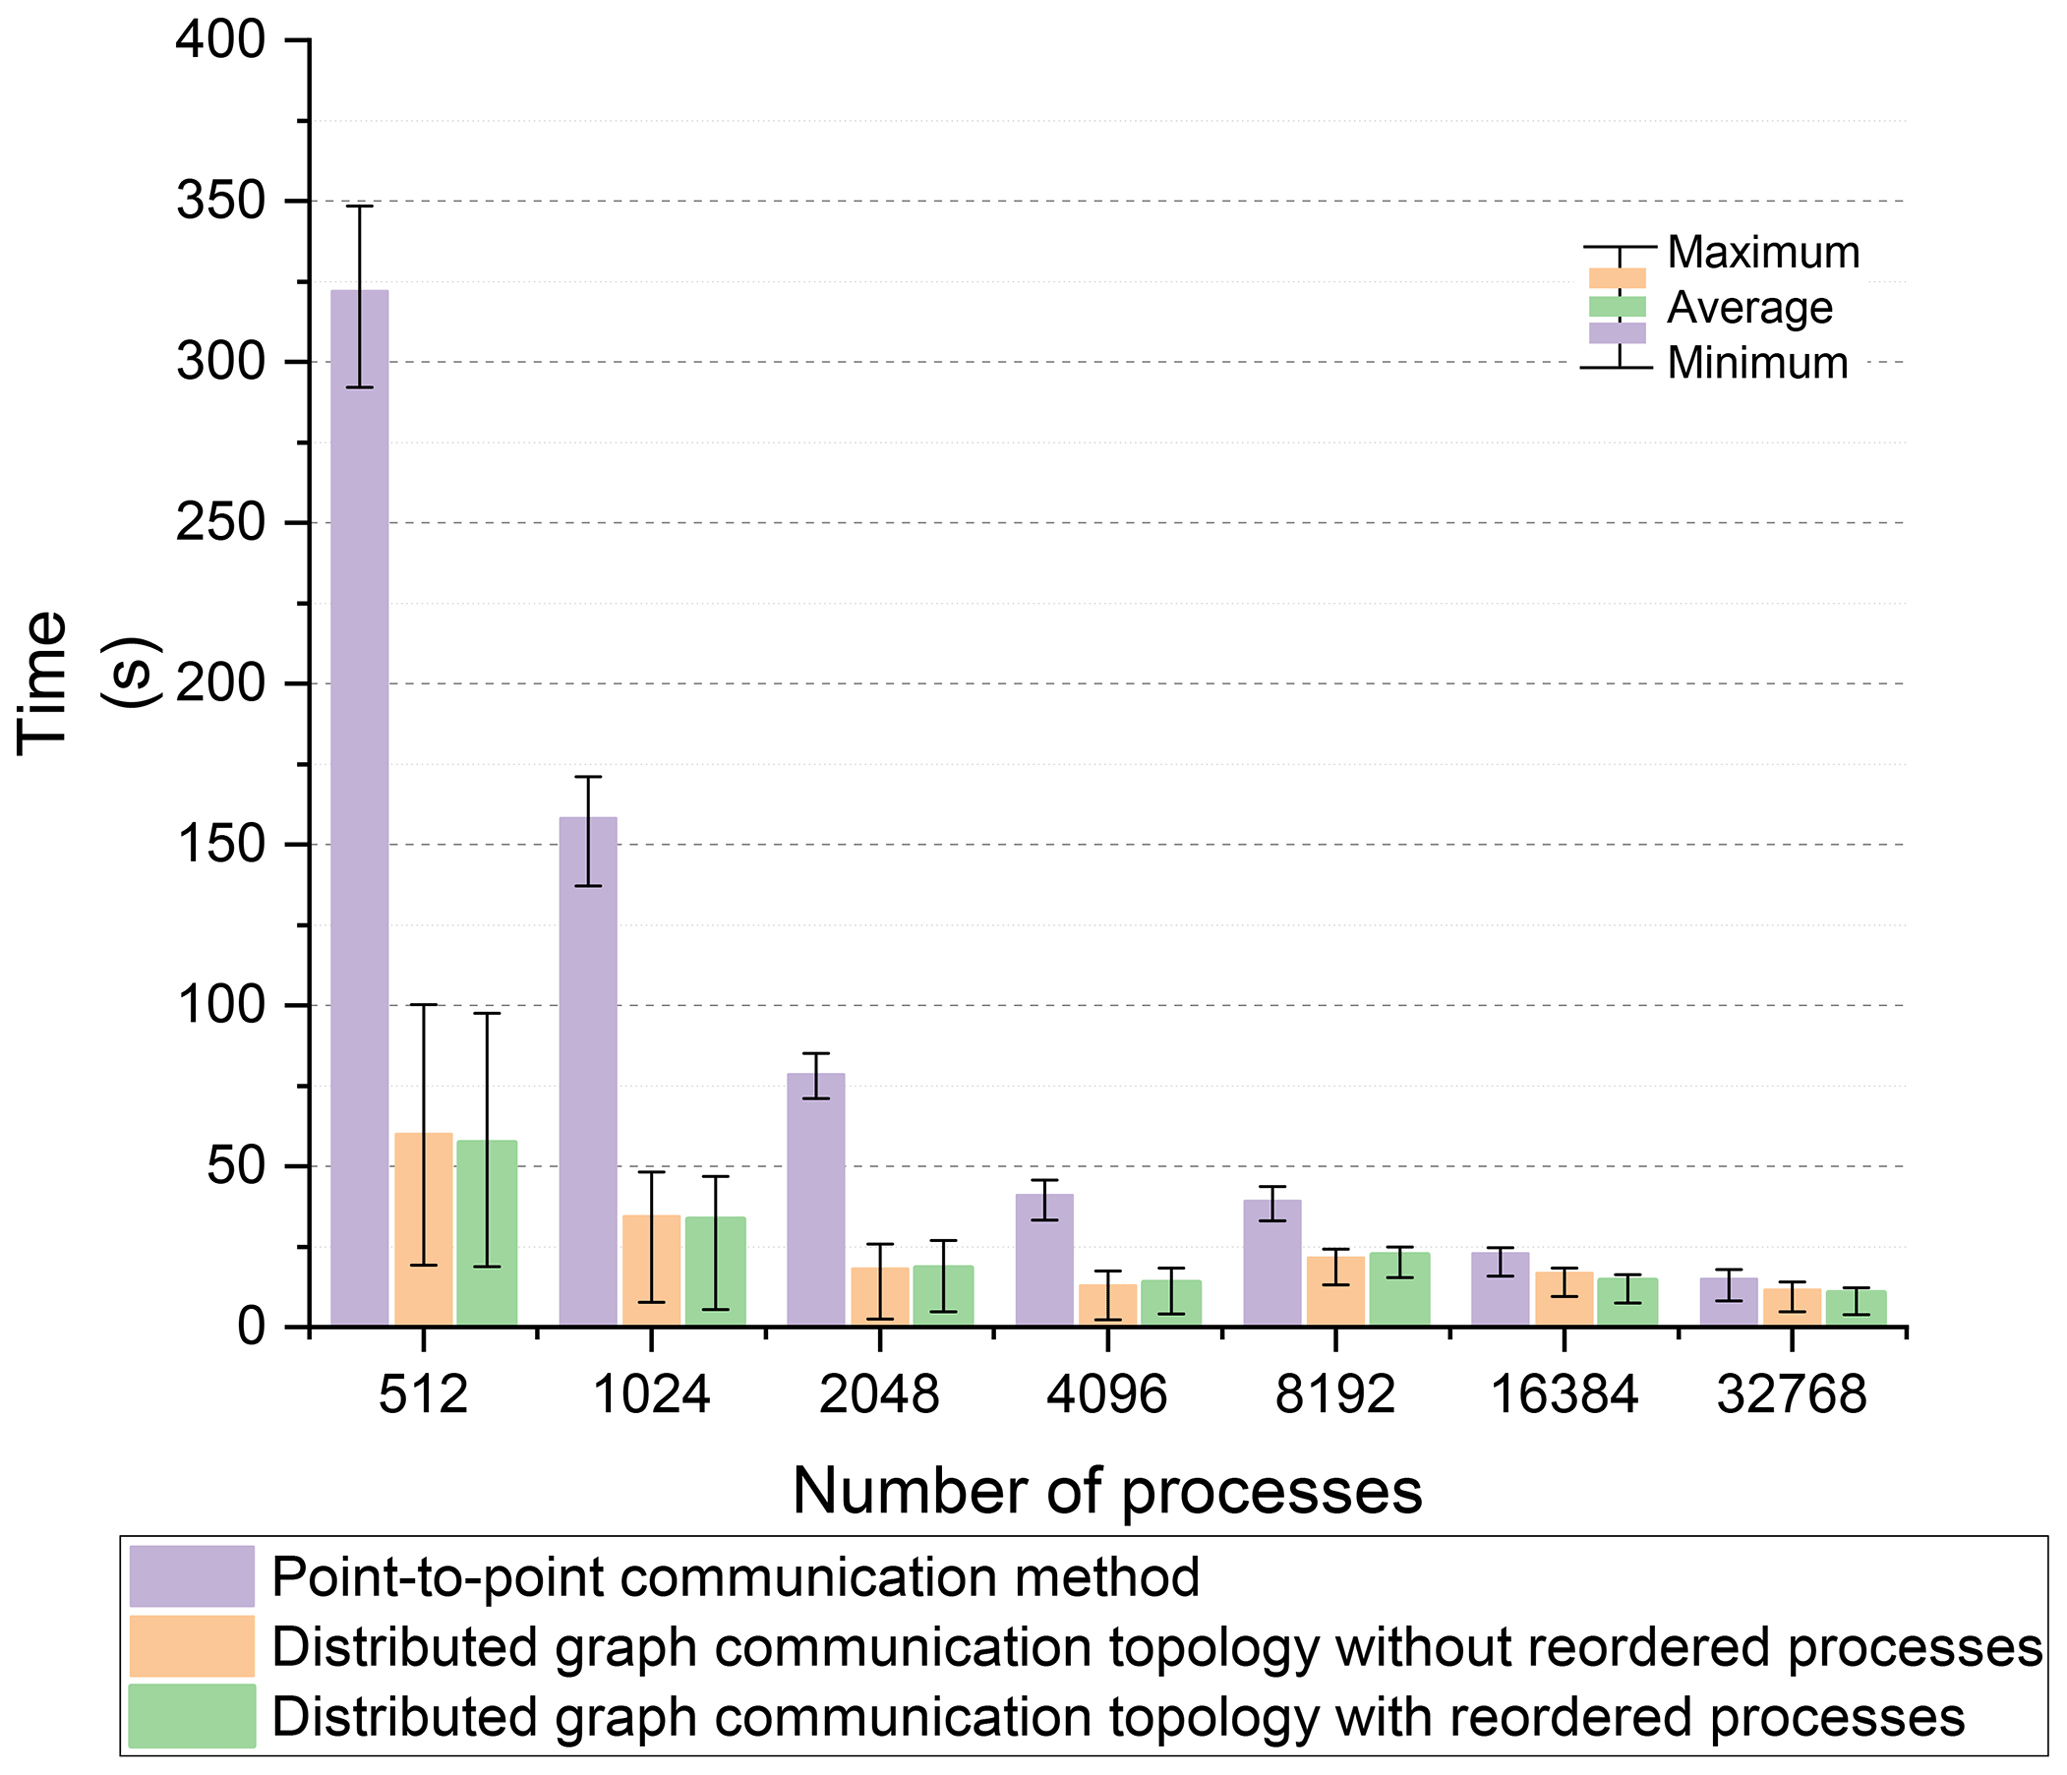
The maximum communication time is a critical factor influencing the performance of the FVWAM model. In comparison to the maximum communication time, the distributed graph communication topology with reordered processes and without reordered processes achieved better performance than the point-to-point communication method, particularly when the count of processes is low. It suggests that the distributed graph communication topology has higher performance than the point-to-point communication method as the communication data volume increases.
Regarding both the average and minimum communication times, the distributed graph communication topology with reordered processes and without reordered processes also demonstrated higher communication bandwidth than the point-to-point communication method.
As described in the regional experiments in Sect. 4.1.2, when comparing the distributed graph communication topology with and without reordered processes, both modes exhibited similar performance levels. This similarity is due to the process order being optimized by the partitioning scheme.
Based on the maximum and average communication times of the point-to-point communication method using the Intel MPI library, we calculated the speedup ratio for the distributed graph communication topology in Fig. 16. Regarding the average time speedup ratio, the performance gap between the distributed graph communication topology and the point-to-point communication method narrows with an increasing number of processes. Two main factors contribute to this result: first, as the number of processes increases, the volume of exchanged data decreases, which reduces the speedup ratio achieved by the distributed graph communication topology. Second, received data are continuously searched and inserted into wave action (N) at once in the distributed graph communication topology, which can improve cache hit rates. In contrast, received data are processed separately at the times of the point-to-point receiving operations in the point-to-point communication method. The first factor is the primary driver of this result, as we observed similar outcomes from 64 to 512 processes in the regional case, where the time spent inserting received data was excluded. Furthermore, the time spent inserting received data accounts for only a small percentage of the total communication time.
The trend of the maximum time speedup ratio is similar to that of the average time speedup ratio, except at 1024 processes, where the maximum time speedup ratio is marginally higher than at 512 processes. The count of neighboring communication processes on one process may expand as the number of processes rises. This potential increase in communication overhead could explain the improved speedup ratio at 1024 processes compared to 512 processes.
Throughout all experiments with 512 to 32 768 processes compared to the point-to-point communication method, the time speedup observed with ordered processes and without ordered processes ranged from 1.28 to 5.63. The results substantiate the hypothesis that the distributed graph communication topology can significantly enhance communication efficiency. This improvement is particularly notable when the volume of communication data is high.
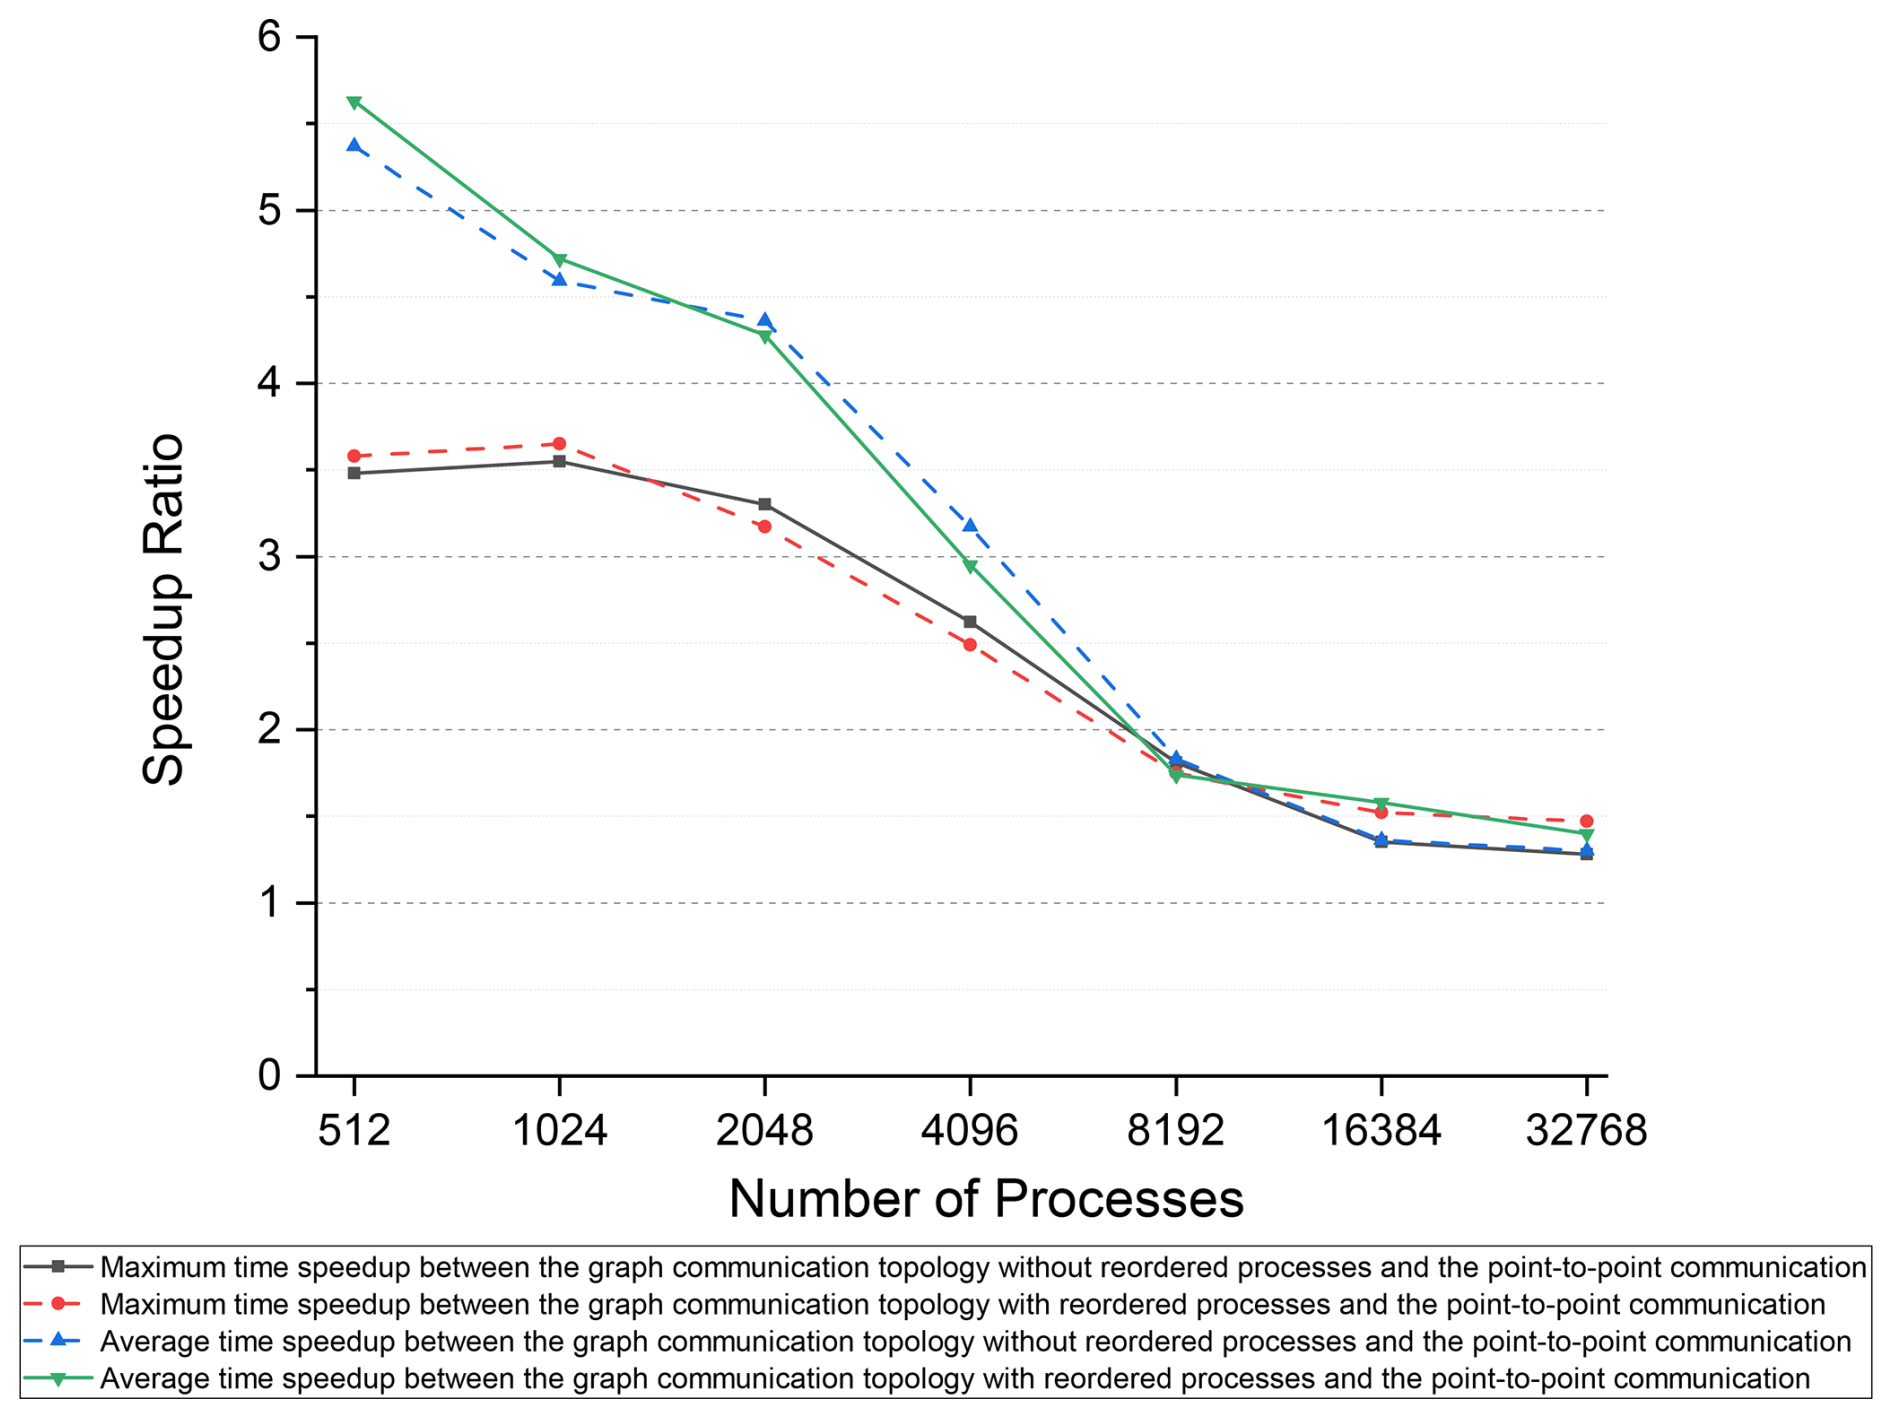
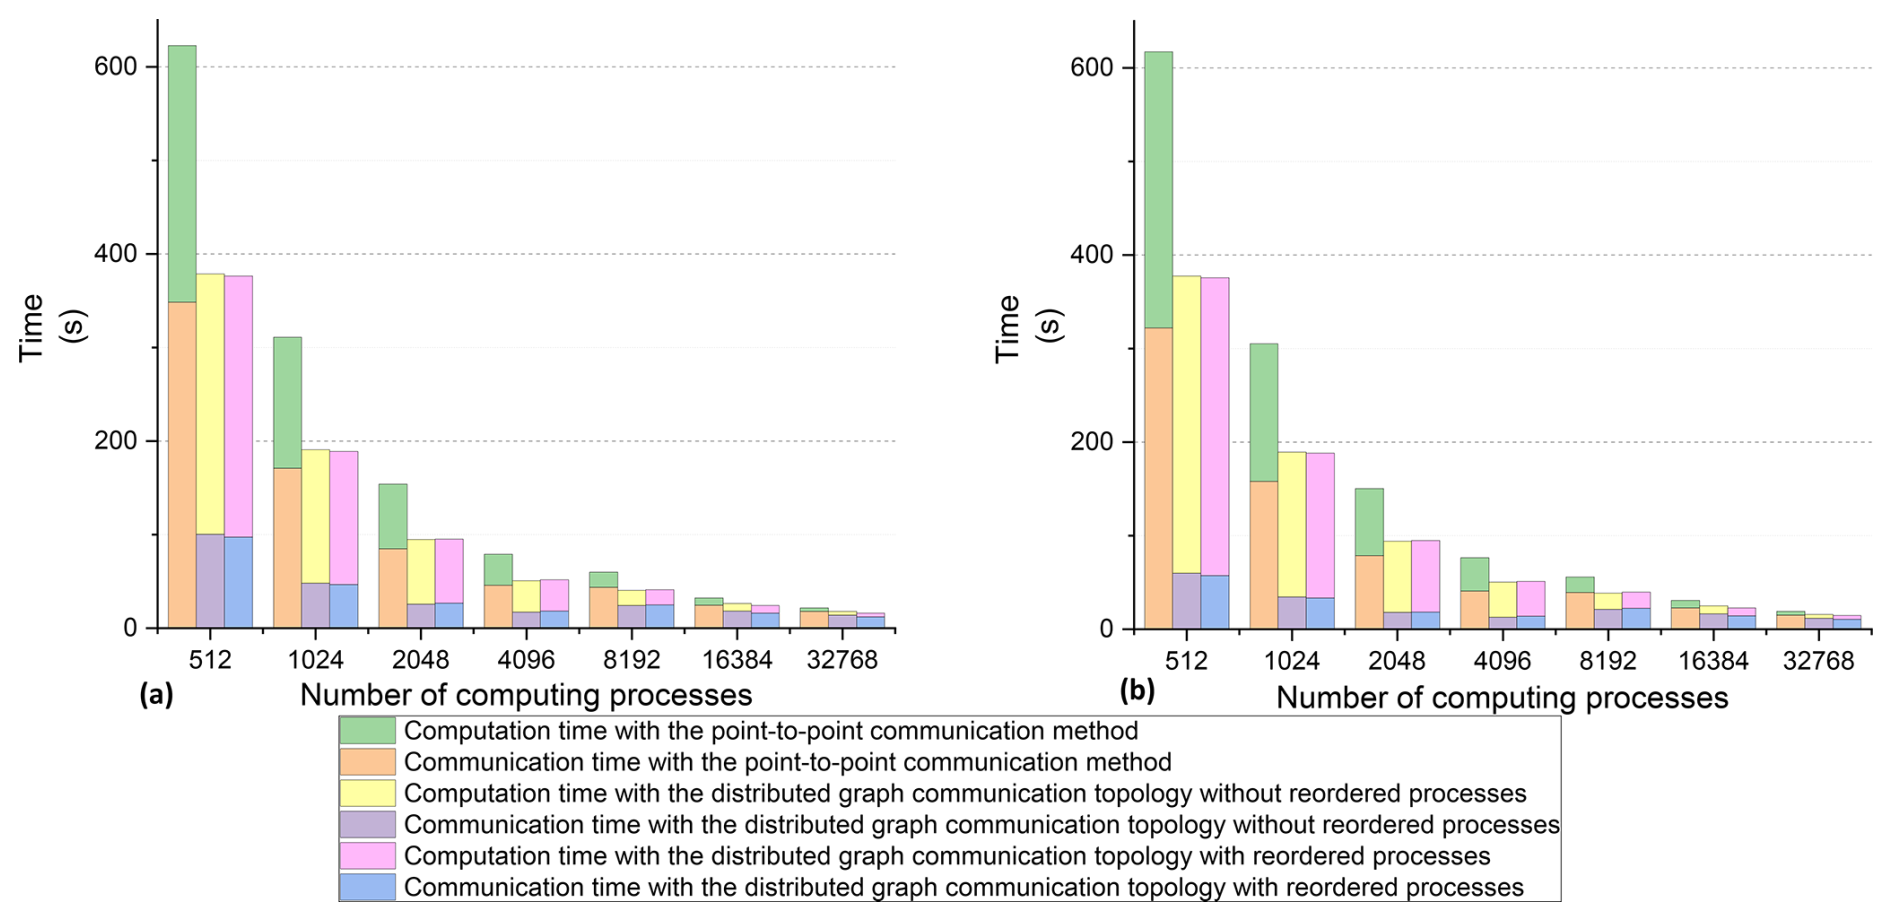
Figure 17(a) Maximum communication and computation time. (b) Average communication and computation time.
4.2.3 Performance evaluation of the FVWAM
The FVWAM was evaluated over a 1 h forecasting period, during which we measured the communication and computation time excluding the initialization operations and I/O costs. The maximum communication and computation time across all processes is shown in Fig. 17a, and the average communication and computation time is depicted in Fig. 17b. The computation times using both the distributed graph communication topology and the point-to-point communication method were nearly identical at the same number of computing processes, indicating that the computing resources utilized in the experiments remained stable.
The communication time with the point-to-point communication method decreased as the process count rose from 512 to 32 768, but it declined more slowly than the computation time. The communication time with the distributed graph communication topology reduced from 512 to 4096 processes but exhibited fluctuations from 4096 to 32 768 processes. These fluctuations may be attributed to an imbalance in computing load, resulting in a fluctuating waiting time during communication.
The average communication of the point-to-point communication method accounted for 52.17 % to 79.3 % of the runtime, with the number of computing processes increasing from 512 to 32 768. In contrast, the distributed graph communication topology with reordered processes consumed 15.23 % to 72.47 % of the runtime over the same range of computing processes. These results underscore the fact that minimizing communication costs is critical to enhancing the scalability of parallel computing models.
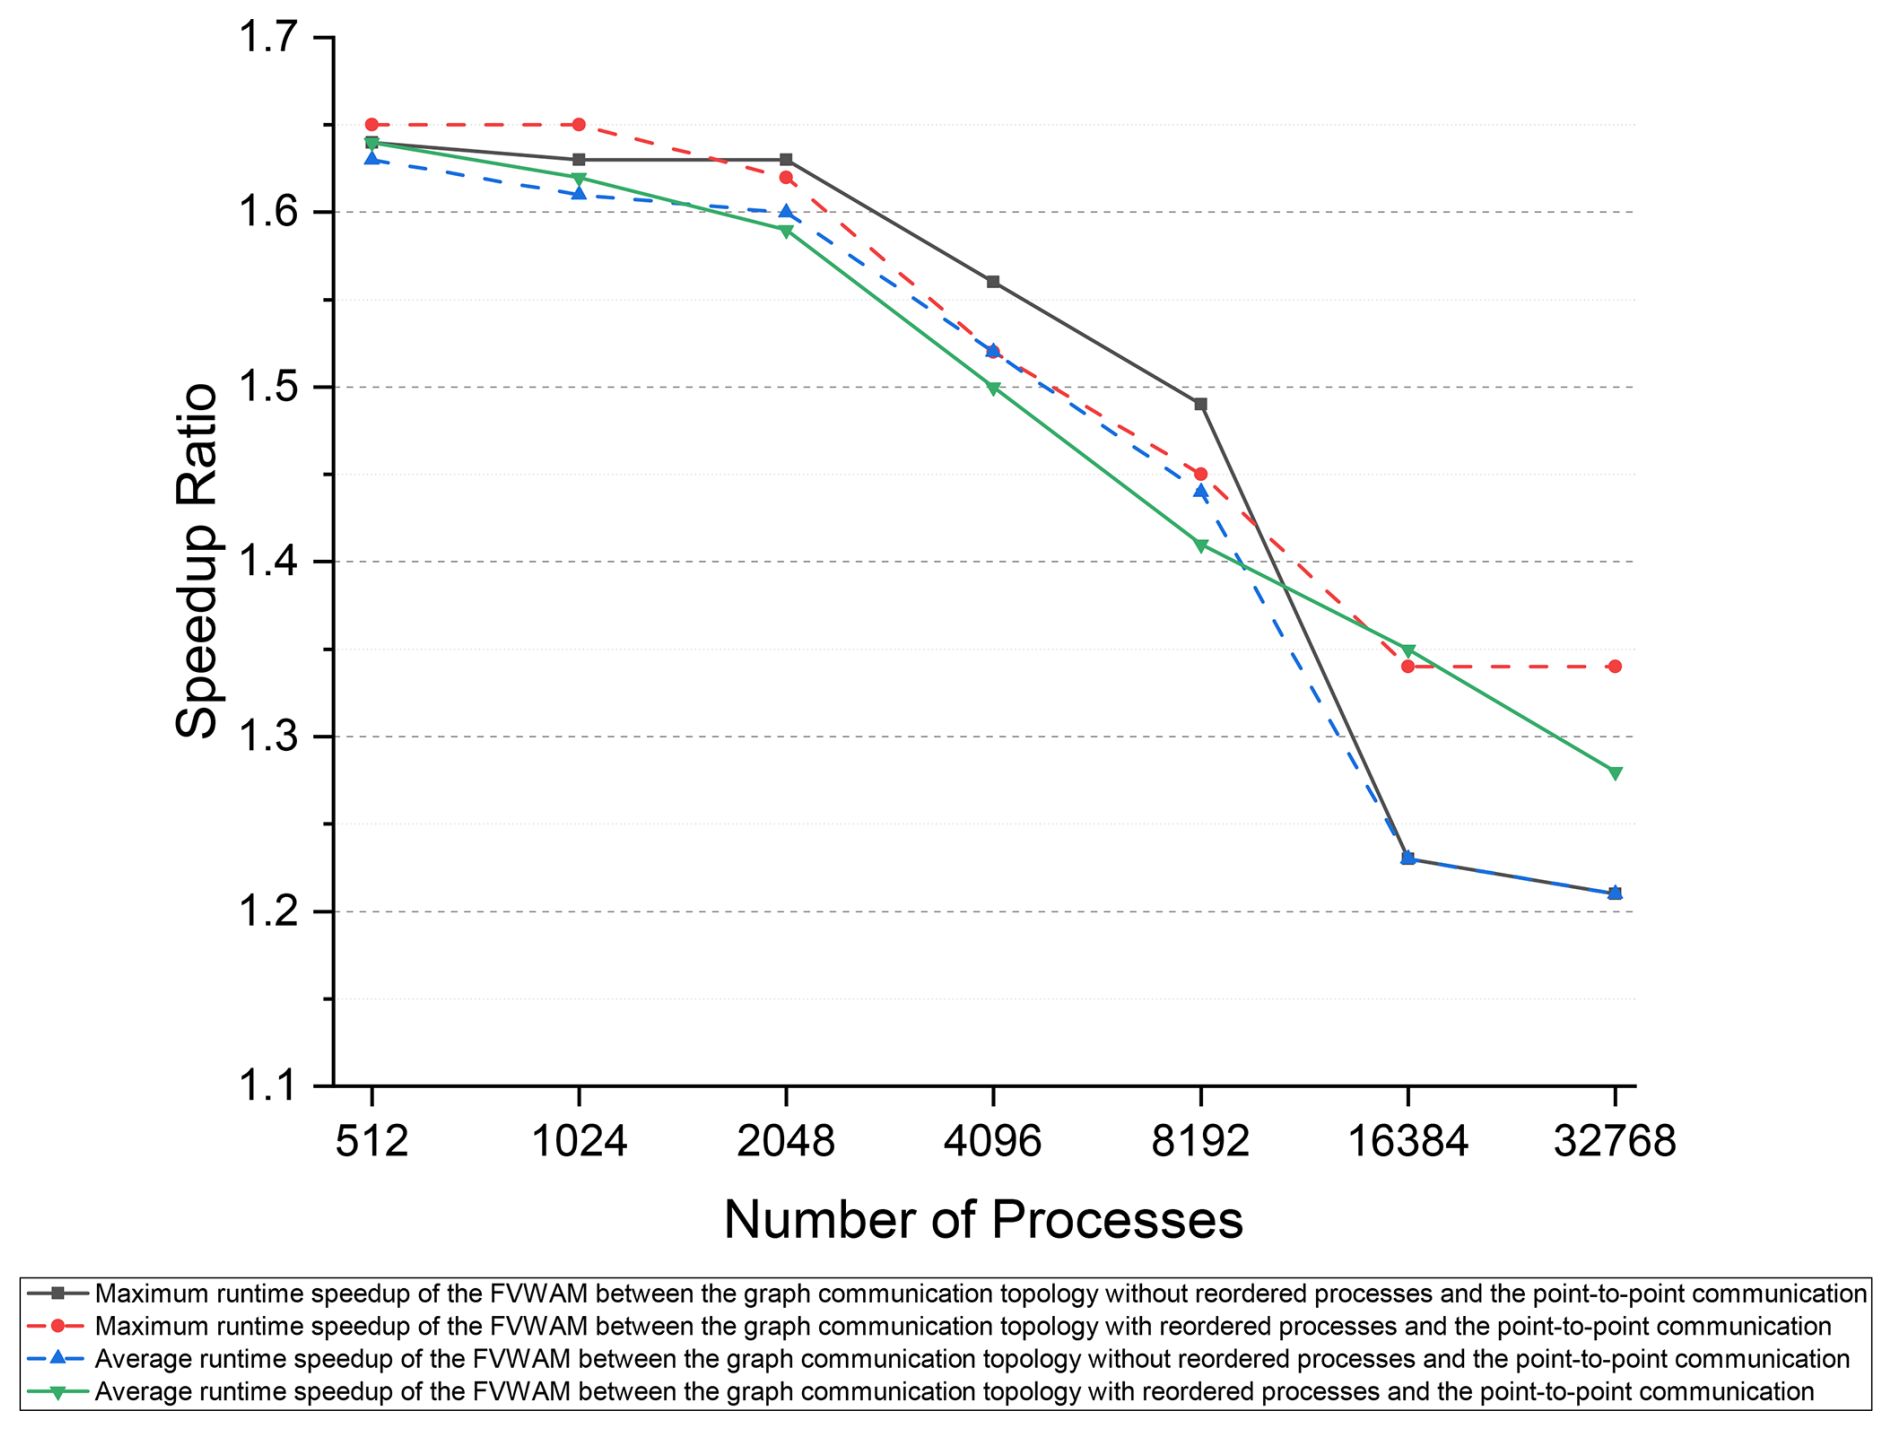
We employed the runtime of the FVWAM with the point-to-point communication method as the baseline to calculate the speedup of the model with the distributed graph communication topology, as illustrated in Fig. 18. The maximum runtime refers to the actual runtime of the FVWAM excluding I/O and initialization operations. Compared to the point-to-point communication method, the speedup ratios for both the maximum and average runtimes of the FVWAM with the distributed graph communication topology demonstrate a decreasing trend from 1.65 to 1.21. This indicates that the distributed graph communication topology both with reordered processes and without reordered processes can improve the performance of the model compared to the point-to-point communication method.
In the daily operational context of the FVWAM in the global case, 1024 processes are utilized as the standard computational scale by the NMEFC. By adopting the distributed graph communication topology with reordered processes at this operational computing scale, there is a potential reduction in the iterative runtime of the FVWAM by 40.2 % compared to the point-to-point communication method. This constitutes a substantial enhancement in the operational global wave forecasting service provided by the FVWAM at the NMEFC.
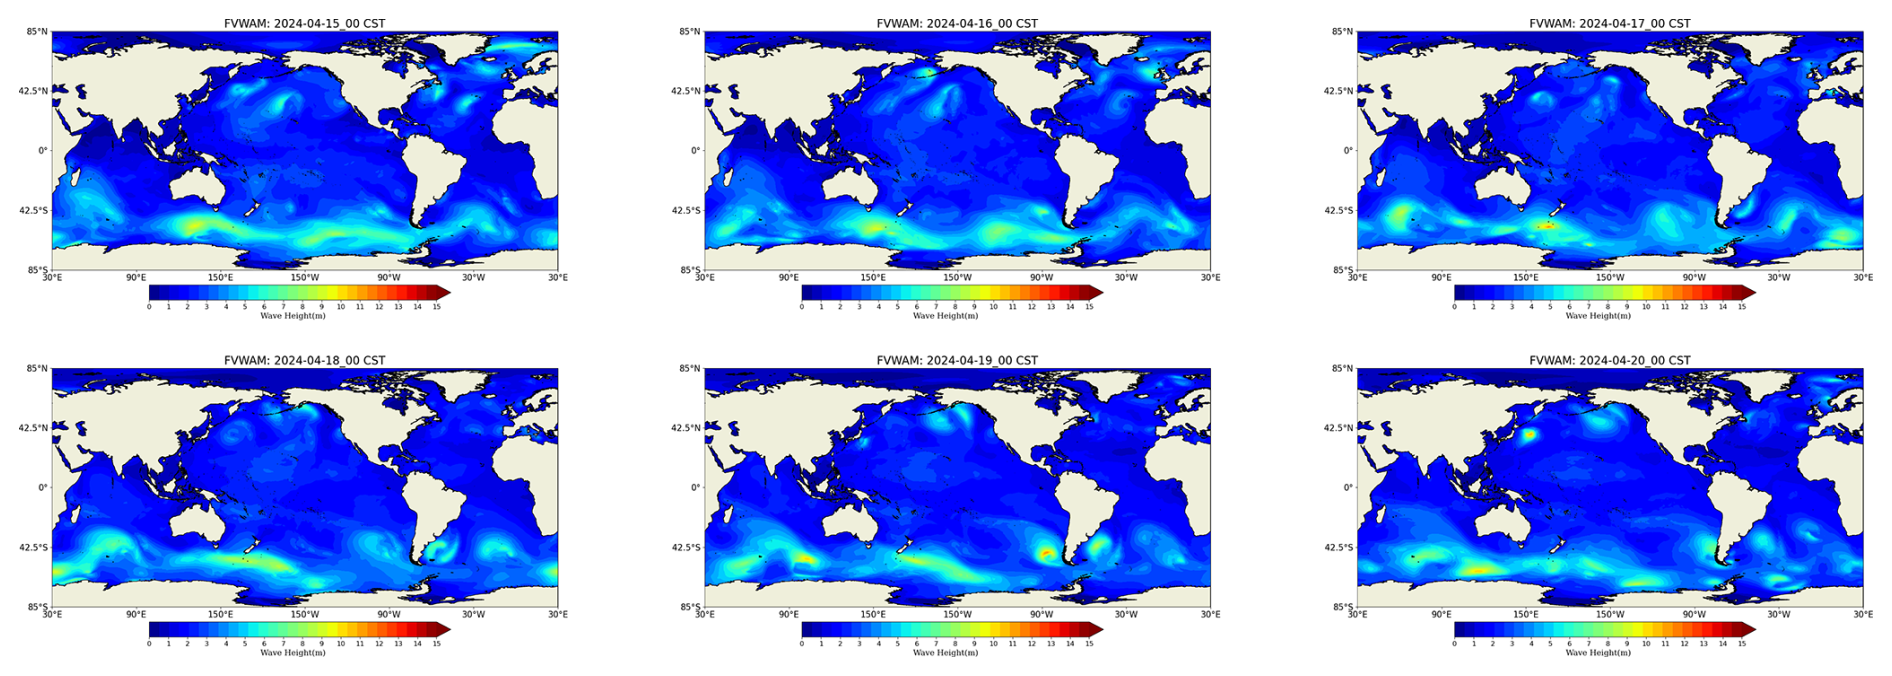
Figure 19Global significant-wave-height products of the FVWAM.
4.2.4 Operational products of the FVWAM
Figure 19 illustrates the actual operational global forecast products for significant wave height at 00:00 UTC+8 from 15 to 20 April 2024. We compared the key parameters of significant wave height, wave period, and wave direction between the output files generated using the point-to-point communication method and the distributed graph communication topology. No differences were found, validating the accuracy of the different communication methods. Forecasters disseminate these FVWAM products along with recommendations for wave disaster mitigation to the public, maritime transporters, and personnel on ocean platforms to enhance their safety and preparedness.
In this study, we implemented and compared the point-to-point communication method and the distributed graph communication topology using the FVWAM as a case study. The experimental results led us to the following conclusions: (1) the performance of the two communication methods is influenced by the specific MPI implementation. The distributed graph communication topology significantly outperforms the point-to-point communication method for inter-node communication when using the Intel MPI library at both small and large parallel scales. However, with the Open MPI library, the advantage of the distributed graph communication topology over the point-to-point method is minimal. (2) The distributed graph communication topology with reordered processes does not provide significant benefits compared to the method without reordered processes after the process order has been optimized by the METIS partitioning scheme. (3) Communication cost is a critical factor influencing the scalability of parallel computing models. The application of the distributed graph communication topology can significantly enhance the overall performance of the FVWAM using the Intel MPI library, which is essential for operational early-wave-warning systems. This approach can also be applied to optimize communication in other Earth models.
The source code of three versions of the FVWAM used in the case study of this paper is available at https://doi.org/10.5281/zenodo.15800790 (Pang et al., 2024a). The datasets and source code related to this paper are available via Zenodo at https://doi.org/10.5281/zenodo.14869025 (Pang et al., 2024b).
FY and YY planned the project. RP, FY, YG, and ZG developed the software design. RP, YG, YY, and ZG implemented the code. RP conducted all performance measurements. RP, YG, and LY analyzed the performance measurements. RP and YG wrote the paper; FY, YY LY, and ZG reviewed and revised the paper.
The contact author has declared that none of the authors has any competing interests.
Publisher's note: Copernicus Publications remains neutral with regard to jurisdictional claims made in the text, published maps, institutional affiliations, or any other geographical representation in this paper. While Copernicus Publications makes every effort to include appropriate place names, the final responsibility lies with the authors.
This research has been supported by the National Key Research and Development Program of China (grant no. 2023YFC3107801).
This paper was edited by Qiang Wang and reviewed by Sarat Sreepathi and one anonymous referee.
Abdolali, A., Roland, A., Van Der Westhuysen, A., Meixner, J., Chawla, A., Hesser, T. J., Smith, J. M., and Sikiric, M. D.: Large-scale hurricane modeling using domain decomposition parallelization and implicit scheme implemented in WAVEWATCH III wave model, Coast. Eng., 157, 1–23, https://doi.org/10.1016/j.coastaleng.2020.103656, 2020. a
Alizadeh, O.: Advances and challenges in climate modeling, Climatic Change, 170, 1–26, https://doi.org/10.1007/s10584-021-03298-4, 2022. a
Atchley, S., Zimmer, C., Lange, J., Bernholdt, D., Melesse Vergara, V., Beck, T., Brim, M., Budiardja, R., Chandrasekaran, S., Eisenbach, M., Evans, T., Ezell, M., Frontiere, N., Georgiadou, A., Glenski, J., Grete, P., Hamilton, S., Holmen, J., Huebl, A., Jacobson, D., Joubert, W., McMahon, K., Merzari, E., Moore, S. G., Myers, A., Nichols, S., Oral, S., Papatheodore, T., Perez, D., Rogers, D. M., Schneider, E., Vay, J.-L., and Yeung, P.: Frontier: exploring exascale, in: Proceedings of the International Conference for High Performance Computing, Networking, Storage and Analysis, 52, 1–16, https://doi.org/10.1145/3581784.3607089, 2023. a
Biswas, M. K., Carson, L., Newman, K., Stark, D., Kalina, E., Grell, E., and Frimel, J.: Community HWRF users' guide v4.0a, NCAR: Boulder, CO, USA, pp. 1–163, 2018. a
Booij, N., Ris, R. C., and Holthuijsen, L. H.: A third-generation wave model for coastal regions: 1. Model description and validation, J. Geophys. Res.-Oceans, 104, 7649–7666, https://doi.org/10.1029/98JC02622, 1999. a
Chassignet, E. P. and Xu, X.: Impact of horizontal resolution (1/12 to 1/50) on Gulf Stream separation, penetration, and variability, J. Phys. Oceanogr., 47, 1999–2021, https://doi.org/10.1175/JPO-D-17-0031.1, 2017. a
Cowles, G. W.: Parallelization of the FVCOM coastal ocean model, The International Journal of High Performance Computing Applications, 22, 177–193, https://doi.org/10.1177/1094342007083804, 2008. a
Ghosh, S., Halappanavar, M., Kalyanaraman, A., Khan, A., and Gebremedhin, A. H.: Exploring MPI communication models for graph applications using graph matching as a case study, in: 2019 IEEE International Parallel and Distributed Processing Symposium (IPDPS), 761–770, IEEE, https://doi.org/10.1109/IPDPS.2019.00085, 2019. a
Group, T. W.: The WAM model – A third generation ocean wave prediction model, J. Phys. Oceanogr., 18, 1775–1810, https://doi.org/10.1175/1520-0485(1988)018<1775:TWMTGO>2.0.CO;2, 1988. a, b
Gu, J., Feng, J., Hao, X., Fang, T., Zhao, C., An, H., Chen, J., Xu, M., Li, J., Han, W., Yang, C., Li, F., and Chen, D.: Establishing a non-hydrostatic global atmospheric modeling system at 3-km horizontal resolution with aerosol feedbacks on the Sunway supercomputer of China, Sci. Bull., 67, 1170–1181, https://doi.org/10.1016/j.scib.2022.03.009, 2022. a
Heinzeller, D., Duda, M. G., and Kunstmann, H.: Towards convection-resolving, global atmospheric simulations with the Model for Prediction Across Scales (MPAS) v3.1: an extreme scaling experiment, Geosci. Model Dev., 9, 77–110, https://doi.org/10.5194/gmd-9-77-2016, 2016. a
Hoefler, T., Rabenseifner, R., Ritzdorf, H., de Supinski, B. R., Thakur, R., and Träff, J. L.: The scalable process topology interface of MPI 2.2, Concurr. Comp.-Pract. E., 23, 293–310, https://doi.org/10.1002/cpe.1643, 2011. a, b, c
Huang, X., Tang, Q., Tseng, Y., Hu, Y., Baker, A. H., Bryan, F. O., Dennis, J., Fu, H., and Yang, G.: P-CSI v1.0, an accelerated barotropic solver for the high-resolution ocean model component in the Community Earth System Model v2.0, Geosci. Model Dev., 9, 4209–4225, https://doi.org/10.5194/gmd-9-4209-2016, 2016. a
Irrmann, G., Masson, S., Maisonnave, É., Guibert, D., and Raffin, E.: Improving ocean modeling software NEMO 4.0 benchmarking and communication efficiency, Geosci. Model Dev., 15, 1567–1582, https://doi.org/10.5194/gmd-15-1567-2022, 2022. a
Karypis, G. and Kumar, V.: METIS: A software package for partitioning unstructured graphs, partitioning meshes, and computing fill-reducing orderings of sparse matrices, 1–33, Computer Science & Engineering (CS&E), Technical Reports, University of Minnesota, https://hdl.handle.net/11299/215346 (last access: 4 July 2025), 1997. a
Katsafados, P., Papadopoulos, A., Korres, G., and Varlas, G.: A fully coupled atmosphere–ocean wave modeling system for the Mediterranean Sea: interactions and sensitivity to the resolved scales and mechanisms, Geosci. Model Dev., 9, 161–173, https://doi.org/10.5194/gmd-9-161-2016, 2016. a
Koldunov, N. V., Aizinger, V., Rakowsky, N., Scholz, P., Sidorenko, D., Danilov, S., and Jung, T.: Scalability and some optimization of the Finite-volumE Sea ice–Ocean Model, Version 2.0 (FESOM2), Geosci. Model Dev., 12, 3991–4012, https://doi.org/10.5194/gmd-12-3991-2019, 2019. a, b, c
Liu, J., Chandrasekaran, B., Wu, J., Jiang, W., Kini, S., Yu, W., Buntinas, D., Wyckoff, P., and Panda, D. K.: Performance comparison of MPI implementations over InfiniBand, Myrinet and Quadrics, in: Proceedings of the 2003 ACM/IEEE conference on Supercomputing, 58–72, https://doi.org/10.1145/1048935.1050208, 2003. a
Mirsadeghi, S. H., Traff, J. L., Balaji, P., and Afsahi, A.: Exploiting common neighborhoods to optimize MPI neighborhood collectives, in: 2017 IEEE 24th international conference on high performance computing (HiPC), 348–357, IEEE, https://doi.org/10.1109/HiPC.2017.00047, 2017. a, b
Monbaliu, J., Padilla-Hernandez, R., Hargreaves, J. C., Albiach, J. C. C., Luo, W., Sclavo, M., and Guenther, H.: The spectral wave model, WAM, adapted for applications with high spatial resolution, Coast. Eng., 41, 41–62, https://doi.org/10.1016/S0378-3839(00)00026-0, 2000. a
Mozdzynski, G., Hamrud, M., and Wedi, N.: A partitioned global address space implementation of the European centre for medium range weather forecasts integrated forecasting system, Int. J. High Perform. C., 29, 261–273, https://doi.org/10.1177/1094342015576773, 2015. a, b
Ovcharenko, A., Ibanez, D., Delalondre, F., Sahni, O., Jansen, K. E., Carothers, C. D., and Shephard, M. S.: Neighborhood communication paradigm to increase scalability in large-scale dynamic scientific applications, Parallel Comput., 38, 140–156, https://doi.org/10.1016/j.parco.2011.10.013, 2012. a
Palmer, T.: Stochastic weather and climate models, Nat. Rev. Phys., 1, 463–471, https://doi.org/10.1038/s42254-019-0062-2, 2019. a
Pang, R., Yu, F., Gao, Y., Yuan, Y., Yuan, L., and Gao, Z.: The Finite Volume WAve Model, Zenodo [code], https://doi.org/10.5281/zenodo.15800790, 2024a. a
Pang, R., Yu, F., Gao, Y., Yuan, Y., Yuan, L., and Gao, Z.: The Finite Volume WAve Model, Zenodo [data set], https://doi.org/10.5281/zenodo.13325957, 2024b. a
Rashti, M. J.: Improving Message-Passing Performance and Scalability in High-Performance Clusters, PhD thesis, Queen's University, https://library-archives.canada.ca/eng/services/services-libraries/theses/Pages/item.aspx?idNumber=1019466946 (last access: 4 July 2025), 2010. a
Sinkovits, R. S. and Duda, M. G.: Optimization and parallel load balancing of the MPAS Atmosphere Weather and Climate Code, in: Proceedings of the XSEDE16 Conference on Diversity, Big Data, and Science at Scale, 5, 1–6, https://doi.org/10.1145/2949550.2949575, 2016. a
Su, Z., Wang, J., Klein, P., Thompson, A. F., and Menemenlis, D.: Ocean submesoscales as a key component of the global heat budget, Nat. Commun., 9, 775–782, https://doi.org/10.1038/s41467-018-02983-w, 2018. a
Tolman, H. L.: User manual and system documentation of WAVEWATCH III TM version 3.14, Technical note, MMAB contribution, 276, 1–220, https://doi.org/10.1016/j.future.2017.02.008, 2009. a
Traff, J. L.: Implementing the MPI process topology mechanism, in: SC'02: Proceedings of the 2002 ACM/IEEE Conference on Supercomputing, 28–28, IEEE, https://doi.org/10.1109/SC.2002.10045, 2002. a
Walker, D. W. and Dongarra, J. J.: MPI: a standard message passing interface, Supercomputer, 12, 56–68, 1996. a
Wang, Y., Jiang, J., Zhang, H., Dong, X., Wang, L., Ranjan, R., and Zomaya, A. Y.: A scalable parallel algorithm for atmospheric general circulation models on a multi-core cluster, Future Gener. Comp. Sy., 72, 1–10, https://doi.org/10.1016/j.future.2017.02.008, 2017. a
Wedi, N. P., Polichtchouk, I., Dueben, P., Anantharaj, V. G., Bauer, P., Boussetta, S., Browne, P., Deconinck, W., Gaudin, W., Hadade, I., Hatfield, S., Iffrig, O., Lopez, P., Maciel, P., Mueller, A., Saarinen, S., Sandu, I., Quintino, T., and Vitart, F.: A baseline for global weather and climate simulations at 1 km resolution, J. Adv. Model. Earth Sy., 12, 1–17, https://doi.org/10.1029/2020MS002192, 2020. a
Wolters, L.: Atmosphere and Ocean Circulation Simulation on Massively Parallel Computers, in: Proc of the Seventh International Workshop on the Use of Supercomputers in Theoretical Science, 1–14, http://liacs.leidenuniv.nl/assets/PDF/TechRep/tr92-15.pdf (last access: 4 July 2025), 1992. a
Yuan, Y., Yu, F., Chen, Z., Li, X., Hou, F., Gao, Y., Gao, Z., and Pang, R.: Towards a real-time modeling of global ocean waves by the fully GPU-accelerated spectral wave model WAM6-GPU v1.0, Geosci. Model Dev., 17, 6123–6136, https://doi.org/10.5194/gmd-17-6123-2024, 2024. a
Zhang, S., Xu, S., Fu, H., Wu, L., Liu, Z., Gao, Y., Zhao, C., Wan, W., Wan, L., Lu, H., Li, C., Liu, Y., Lv, X., Xie, J., Yu, Y., Gu, J., Wang, X., Zhang, Y., Ning, C., Fei, Y., Guo, X., Wang, Z., Wang, X., Wang, Z., Qu, B., Li, M., Zhao, H., Jiang, Y., Yang, G., Lu, L., Wang, H., An, H., Zhang, X., Zhang, Y., Ma, W., Yu, F., Xu, J., Lin, X., and Shen, X.: Toward Earth system modeling with resolved clouds and ocean submesoscales on heterogeneous many-core HPCs, Natl. Sci. Rev. 10, 1–15, https://doi.org/10.1093/nsr/nwad069, 2023. a