the Creative Commons Attribution 4.0 License.
the Creative Commons Attribution 4.0 License.
 | 17 Jun 2025
FLAME 1.0: a novel approach for modelling burned area in the Brazilian biomes using the maximum entropy concept
Maria Lucia Ferreira Barbosa
Douglas I. Kelley
Chantelle A. Burton
Igor J. M. Ferreira
Renata Moura da Veiga
Anna Bradley
Paulo Guilherme Molin
Liana O. Anderson
As fire seasons in Brazil lengthen and intensify, the need to enhance fire simulations and to comprehend fire drivers becomes crucial. Yet determining what drives burning in different Brazilian biomes is a major challenge, with a highly uncertain relationship between drivers and fire. Finding ways to acknowledge and quantify that uncertainty is critical in ascertaining the causes of Brazil's changing fire regimes. We propose FLAME (Fire Landscape Analysis using Maximum Entropy), a new fire model that integrates Bayesian inference with the maximum entropy concept, enabling probabilistic reasoning and uncertainty quantification. FLAME utilises bioclimatic, land cover, and human driving variables to model fires. We apply FLAME to Brazilian biomes, evaluating its performance against observed data for three categories of fires: all fires (ALL), fires reaching natural vegetation (NAT), and fires in non-natural vegetation (NON). We assessed burned-area responses to different explanatory variable groups. The model showed adequate performance for all biomes and fire categories. Together, maximum temperature and precipitation are important factors influencing burned area in all biomes. The number of roads and forest boundaries (edge densities), forests and pastures, and carbon in dead vegetation showed higher uncertainties among the responses. Overall, the uncertainties were larger for the NON category, particularly for the Pampas and Pantanal regions. Customising explanatory variable selection and fire categories based on biome characteristics could contribute to a more biome-focused and contextually relevant analysis. Moreover, prioritising regional-scale analysis is essential for decision-makers and fire management strategies. FLAME is easily adaptable and can be used in various locations and periods, serving as a valuable tool for more informed and effective fire prevention measures.
- Article
(9641 KB) - Full-text XML
-
Supplement
(802 KB) - BibTeX
- EndNote


The complexity of the interactions and feedbacks between fire, climate, people, and other Earth system components makes it challenging for us to be highly confident about what drives fires in specific locations. Various methods assess the drivers of historical fire events. Some studies correlate individual drivers with burned area but overlook the interaction of multiple factors (Andela et al., 2017; Barbosa et al., 2019). Fire danger indices capture simultaneous drivers to gauge fire risk. However, they overlook human-driven ignition causes (Zacharakis and Tsihrintzis, 2023) and typically fail to capture the impact of fuel availability on burning (Kelley and Harrison, 2014). Fire-enabled terrestrial biosphere models account for these drivers, simulating observable fire regime measures. However, they often lack accuracy for year-to-year fire patterns, as well as the required accuracy to determine fire drivers (Forkel et al., 2019) and the causes of individual fire seasons (Hantson et al., 2020). Quantifying uncertainty is critical for assigning fire drivers because it allows for a more accurate assessment of the confidence in our predictions and helps identify the most influential factors under varying conditions. In this sense, research applying the maximum entropy framework combined with Bayesian inference can address these gaps.
The principle of maximum entropy states that, when trying to estimate the probability of an event while the information is limited, you should opt for the distribution that preserves the greatest amount of uncertainty (i.e. maximises entropy) while still adhering to your given constraints (Penfield, 2003). These constraints reflect prior knowledge about the probability distribution of a phenomenon of interest (i.e. burned area) based on its relationship with explanatory variables. This approach ensures that you do not introduce extra assumptions or biases into your calculations. The maximum entropy method has its roots in statistical mechanics (Jaynes, 1957). However, the use of this concept in a species distribution model, called MaxEnt (Phillips et al., 2006), popularised the approach in several other study areas, including ecology, geophysics, and fires (Wan et al., 2020; Li et al., 2019; Fonseca et al., 2017).
The MaxEnt species distribution model estimates the probability of target presence for given local conditions (Phillips et al., 2006). Unlike many traditional models, MaxEnt makes minimal assumptions about the relationships between explanatory variables, making it more flexible and adaptable to complex ecological interactions. Rather than estimating a single value, MaxEnt models a full probability distribution (Elith et al., 2011), providing a comprehensive view of potential outcomes. This probabilistic nature enables the incorporation of prior information into the modelling process, enhancing its accuracy. Additionally, MaxEnt enables the quantification of uncertainties (Chen et al., 2019), providing valuable insights into the reliability and confidence of model predictions.
Recognising that fires can be treated as a species due to their strong dependence on environmental factors, utilising the MaxEnt species model has yielded valuable insights into the field (Ferreira et al., 2023; Fonseca et al., 2019). However, the MaxEnt model relies on presence-only or presence–absence data, which means it primarily considers locations where the target (in this case, fires) has occurred. This limits fire research using maximum entropy as it does not allow for continuous data, such as burned-area fraction over a larger region. Moreover, the constraints and structure of the underlying model are fundamentally related to species distributions (Phillips et al., 2006) rather than to fires, which may not capture the nuances of fire behaviour.
Incorporating Bayesian inference alongside the maximum entropy framework provides a powerful approach. Bayesian techniques integrate prior knowledge and observed data to continuously refine the estimation of uncertainty with regard to the influence of drivers on fire, thereby improving the confidence in any relationship we find (Kelley et al., 2019). By leveraging both maximum entropy and Bayesian inference, we can develop more robust models that account for the complex and dynamic nature of fire regimes.
The simulation of fires in heterogeneous territories such as Brazil is incredibly challenging. Wildfires have become a pressing concern in the country, causing significant socioeconomic and environmental losses (Campanharo et al., 2019; Barbosa et al., 2022; Wu et al., 2023). Between 1985 and 2022, more than 1 857 025 km2 of Brazil's terrain burned at least once (MapBiomas Fogo, 2023). While some ecosystems, such as grasslands and savannas, depend on periodic fires to sustain their biodiversity and ecological processes, the increasing fire frequency driven by agricultural and ranching activities has impacted all Brazilian ecosystems, making them significant terrestrial carbon sources (Cano-Crespo et al., 2023). In fire-adapted ecosystems like savannas, disruptions to fire regimes – whether through suppression or excessive frequency – can alter the ecological balance, severely damaging fauna, hindering seedling development, and increasing tree mortality. High-intensity and long-duration fires further exacerbate these effects, demonstrating the fine balance required to maintain ecosystem structure and composition (Alvarado et al., 2020). Quantifying the influence of these drivers, however, remains difficult as many interactions between fire and its drivers are non-linear and heavily interdependent. This complexity makes confidently identifying drivers of fire regimes in such diverse landscapes from observations alone challenging (Krawchuk and Moritz, 2014). While traditional fire models provide useful broad-scale information on fire, land, and climate interactions, they often lack the ability to quantify the uncertainty in these relationships and rely on other studies to infer relationships between drivers and burning (Hantson et al., 2016).
Improving fire simulations and understanding the underlying drivers of fires in Brazil are essential to address the challenges associated with preventing fires, firefighting, and managing their aftermath. Here, we present and evaluate a novel fire model, FLAME (Fire Landscape Analysis using Maximum Entropy), based on a Bayesian inference implementation of the maximum entropy concept. This combination allows us to incorporate uncertainty and probabilistic reasoning into fire modelling. In this sense, the model aims to precisely measure the uncertainties of the simulations. The model optimises key driving variables' relationships with fires. Here, we apply FLAME to the biomes in Brazil and assess the performance against observations.
2.1 Brazilian biomes
Our study focuses on Brazil, with the Brazilian biomes serving as the primary units of analysis. Brazil comprises six official major biomes, whose boundaries are defined by the National Institute of Geography and Statistics (IBGE; https://www.ibge.gov.br/apps/biomas/#/home, last access: 18 October 2024); these are Amazonia, the Atlantic Forest, Cerrado, Pampa, and Pantanal. This categorisation follows that of Hardesty et al. (2005), which defines biomes based on the predominant vegetation type. However, the six biomes contain vegetation types with different sensitivities to fire. In general, Amazonia and the Atlantic Forest are fire-sensitive biomes (Fig. 1) that are highly susceptible to damage or destruction by fire. Conversely, Cerrado, Pampa, and Pantanal have evolved to depend on fire as part of their life cycle and are considered to be fire-dependent biomes. Finally, Caatinga is a fire-independent biome that is generally not significantly affected by fire or does not require fire as part of its vegetation dynamics.
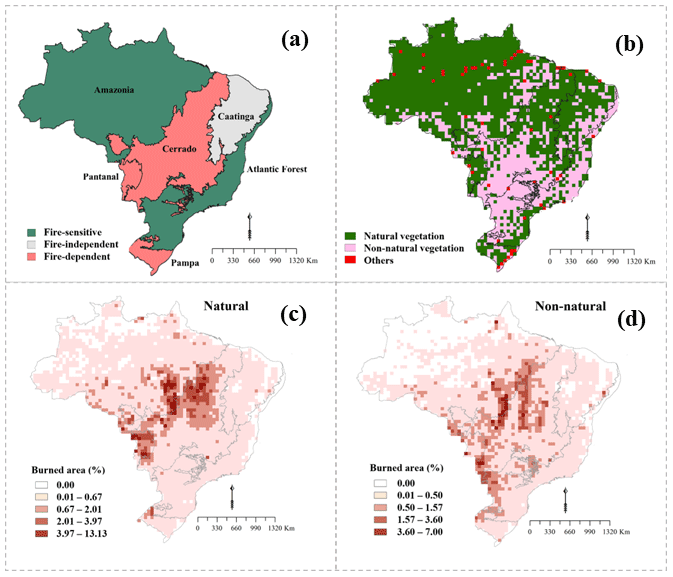
Figure 1(a) Brazilian biomes classified as fire-sensitive, fire-independent, and fire-dependent (Hardesty et al., 2005). (b) Natural vegetation (forests, grasslands, and savannas) and non-natural vegetation (pasture, cropland, and forest plantations) in 2019 in Brazil. (c) NAT's mean burned-area percentage per pixel. (d) NON's mean burned-area percentage per pixel. The maps in (c) and (d) show the mean for August, September, and October from 2002 to 2019.
2.2 Datasets and preprocessing
We used the MCD64A1 burned-area product from MODIS collection 6 as our target variable (Giglio et al., 2018). These data were regridded from 500 m to 0.5° spatial resolution by dividing the total burned area within each coarse cell by its total area. The burned-area data were used in their totality (ALL) and divided into two other categories based on the land use and land cover (LULC) data from the MapBiomas project (https://brasil.mapbiomas.org/en/, last access: 10 May 2024), namely burned areas in natural vegetation (NAT) and burned areas in non-natural vegetation (NON) (Fig. 1). We computed all burned areas within forests, grasslands, and savannas for the NAT category and within pasture, cropland, and forest plantations (aggregated with croplands) for the NON category. We considered it to be that forest plantations and mechanised agriculture share a key similarity in that both typically avoid the use of fire in their management practices. In this sense, they can be considered to be analogous, particularly as the cropland class in our model does not distinguish between small-scale and large-scale mechanised farming systems. The categorisation of fires aims to assess whether there are distinct drivers for NAT and NON and to exemplify the potentialities of the model for assessing more than one fire category across different vegetation types. We adopt a broad approach to encompass the various biomes in Brazil; however, any type of categorisation is permissible, and further studies could focus on even finer stratification, e.g. fires affecting fire-sensitive vegetation and fire-dependent vegetation within each biome.
Table 1List of explanatory variables prior to the removal process as described in Sect. 2.2.
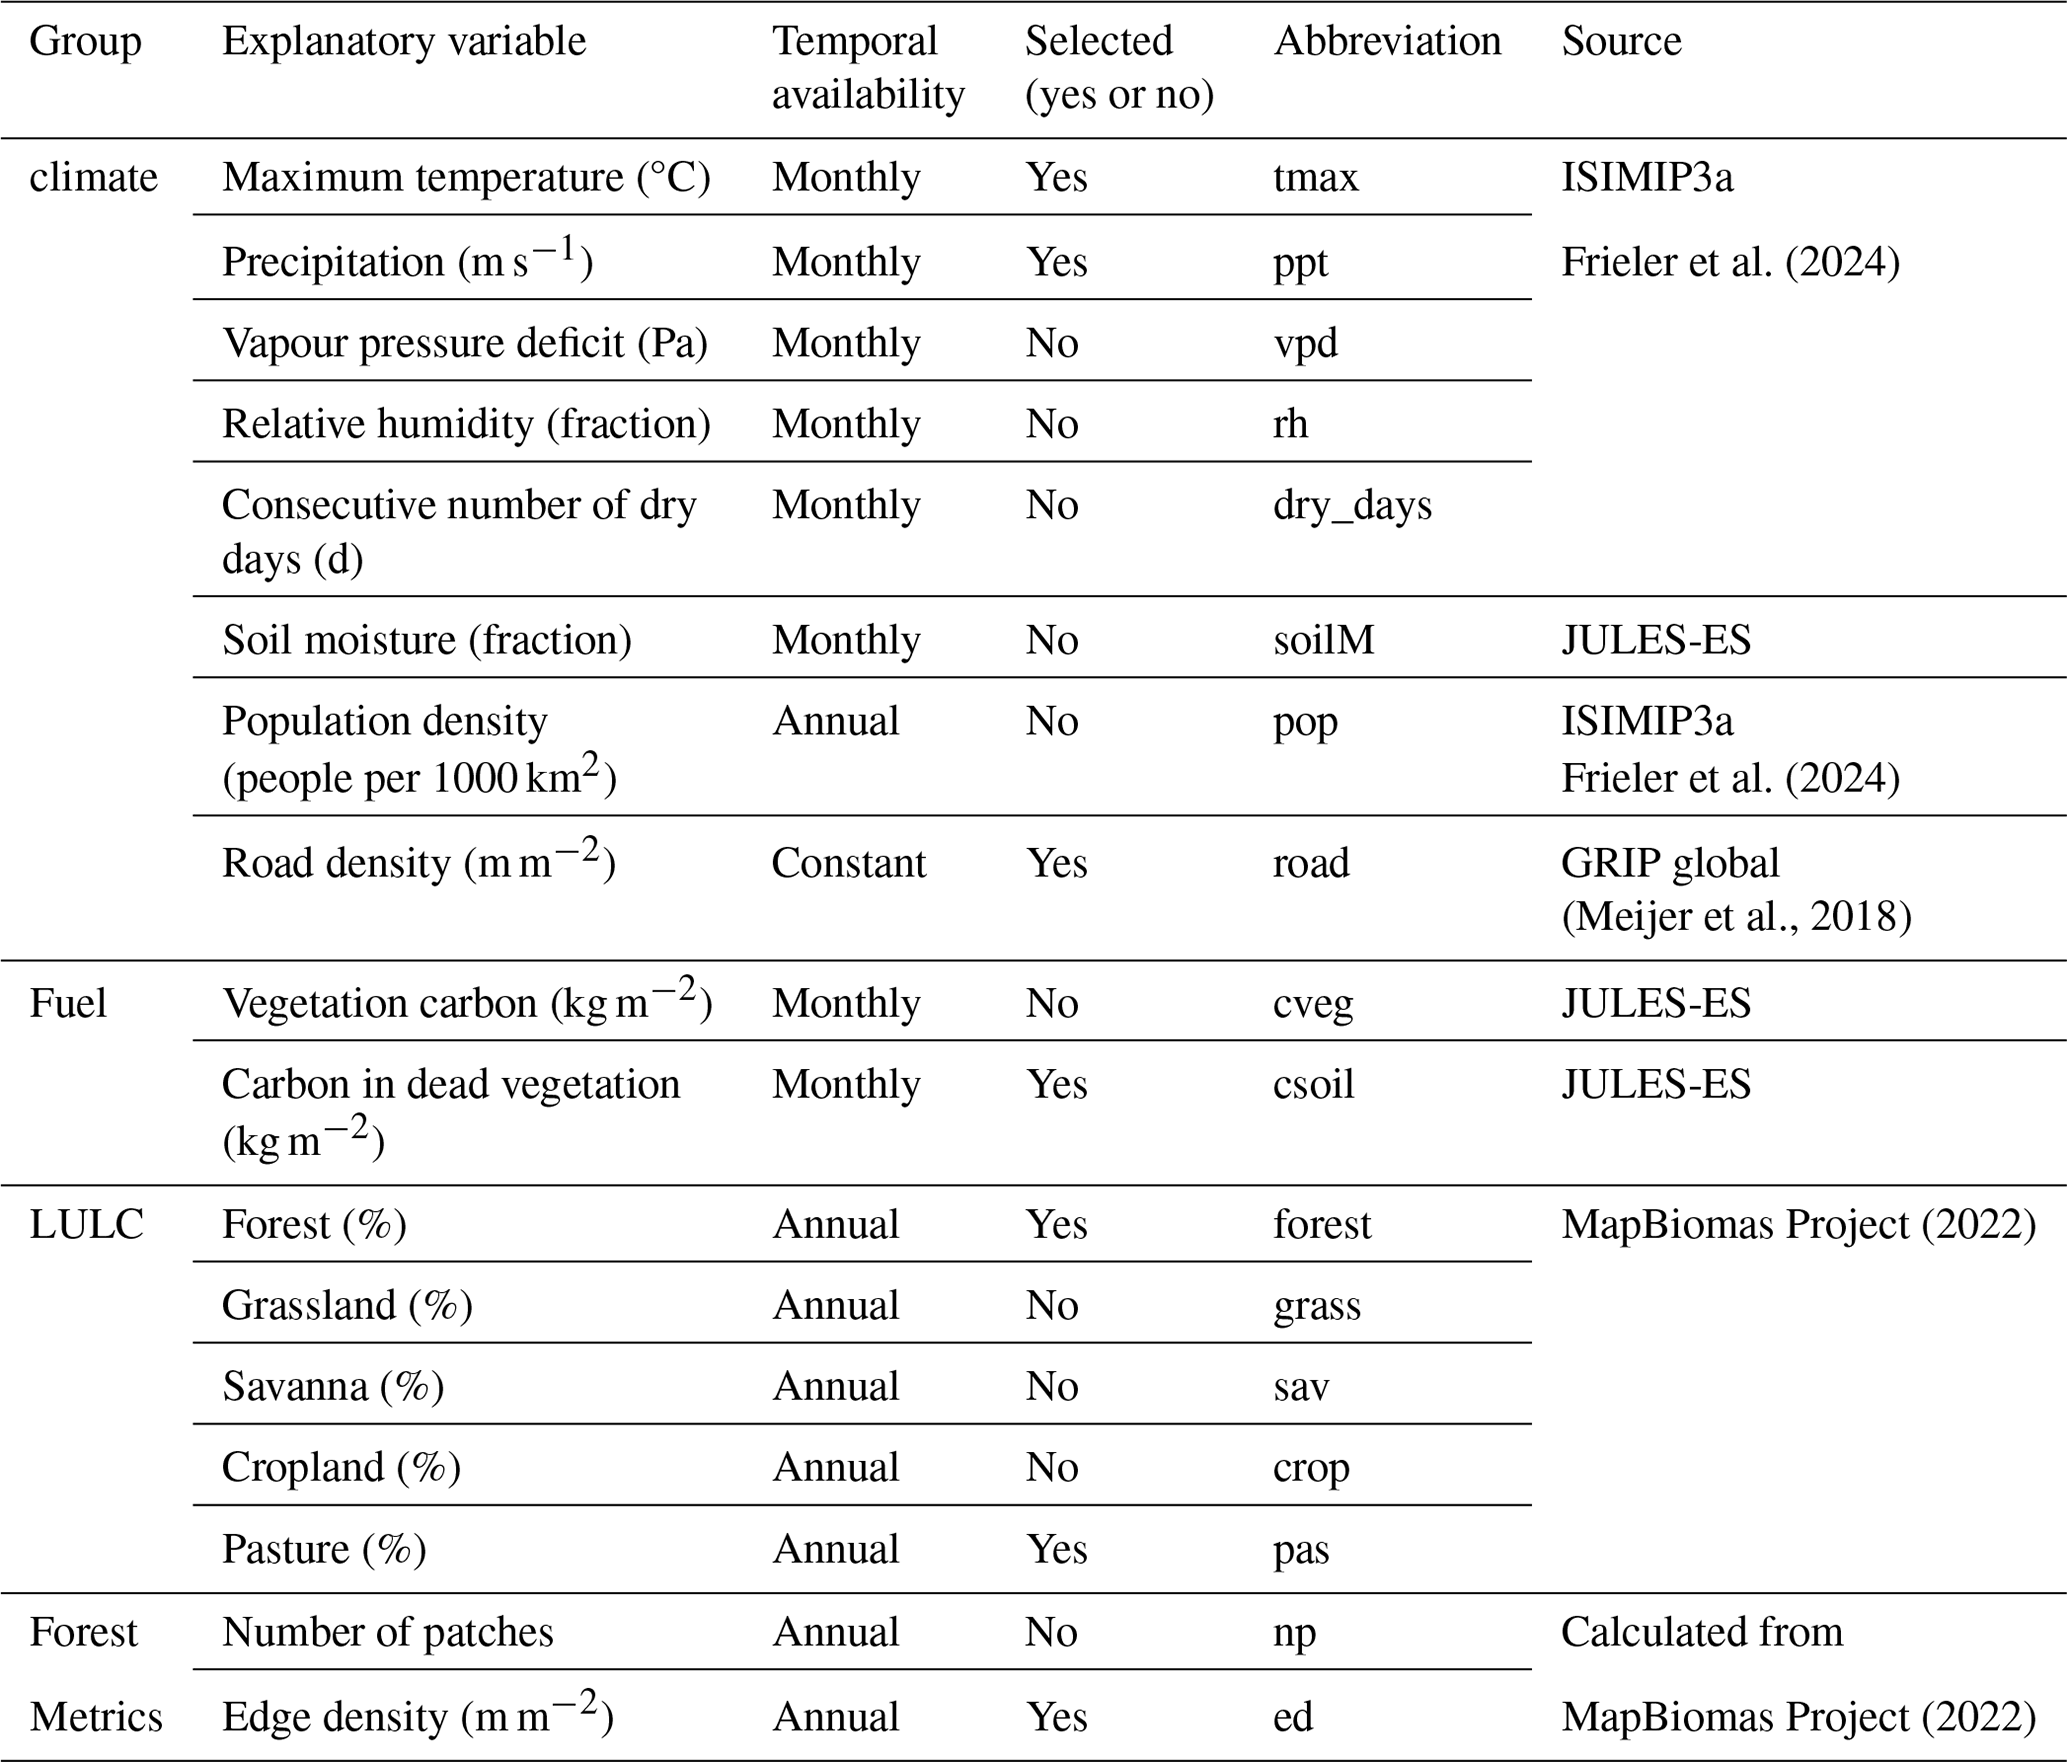
The target and explanatory variables were extracted for August, September, and October from 2002 to 2019, representing the general peak of the fire season in Brazil. This time frame is the most extended overlapping period between the datasets, which we further divided into a training phase from 2002 to 2009 and a validation phase from 2010 to 2019. The explanatory variables were divided into five groups (climate, anthropogenic and natural ignition, fuel, LULC, and forest metrics) and are described in Table 1.
We acquired monthly climate explanatory variables from the first component of the third simulation round of the Inter-Sectoral Impact Model Intercomparison Project (ISIMIP3a, https://www.isimip.org/, last access: 18 April 2024). ISIMIP is a collaborative effort to compare and evaluate the outputs of various climate and impact models (Frieler et al., 2024). These data represent the historical simulations using climate forcings from GSWP3-W5E5, available from 1901 to 2019 at a 0.5° spatial resolution. The explanatory variable of consecutive dry days tracks the continuous count of dry days since the last recorded rainfall, beginning in the 1900s. The monthly maximum of this ongoing value is then calculated.
We obtained carbon in dead vegetation, vegetation carbon, and soil moisture from the Joint UK Land Environment Simulator Earth System impacts model, version 5.5 (JULES-ES; Mathison et al., 2023), driven by ISIMIP3a GSWP3-W5E5, as per Frieler et al. (2024), which is freely available at https://www.isimip.org/impactmodels/details/292/ (last access: 18 April 2024). JULES-ES has previously been used as input for Bayesian-based fire models (e.g. UNEP, 2022). JULES dynamically models vegetation, carbon fluxes, and stores in response to meteorology, hydrology, nitrogen availability, and land use change. JULES-ES has been extensively evaluated against snapshots and site-based measurements of vegetation cover and carbon (Mathison et al., 2023; Wiltshire et al., 2021; Burton et al., 2019, 2022). As per UNEP (2022), vegetation responses to JULES-ES's internal fire model were turned off so as to not double-count the effects of burning. The maps, therefore, represent environmental carbon potential and are applicable to FLAME as the model only assumes that explanatory variable ranges are correctly ranked – i.e. areas of low or high carbon content correspond with real-world areas of low or high carbon – and not that the absolute magnitude is correct.
Regarding ignition explanatory variables, population density data were also obtained from the ISIMIP3a protocol and were based on data from the History Database of the Global Environment (HYDE) v3.3 (Volkholz et al., 2022). Lightning was prescribed as a monthly climatology from LIS–OTD (lightning imaging sensor–optical transient detector) data (Cecil, 2006). The LIS–OTD climatology datasets comprise gridded climatologies that document the lightning flash rates detected by the optical transient detector (OTD) and the lightning imaging sensor (LIS) aboard the Tropical Rainfall Measuring Mission (TRMM). Total road density (in m km−2) data were calculated for each grid cell of 0.5° spatial resolution using linear interpolation in the Iris Python package (Met Office, 2023) based on road density data from the Global Roads Inventory Project (GRIP) (Meijer et al., 2018).
We used the collection-7 LULC data from the MapBiomas project, which produces annual LULC mapping for the Brazilian territory. These were regridded from 30 m to 0.5° to match the coarser resolution and were linearly interpolated from an annual to a monthly time step.
We incorporated forest metrics to integrate fragmentation explanatory variables. Studies suggest that these are linked to fire occurrence in Amazonia and Cerrado (Silva Junior et al., 2022; Rosan et al., 2022) but remain unexplored in the other biomes. The forest metric variables were also calculated in relation to the 0.5° grid based on the annual forest data from the MapBiomas at 30 m resolution using the package landscapemetrics available in R (Hesselbarth et al., 2024). The metrics were the number of forest patches (NP) and the forest edge density (ED), described below:
where e is the total forest edge length in metres, and A is the total landscape area in square metres. This quantifies the edge density per pixel by summing up all forest edges in relation to the overall landscape area.
2.3 Explanatory variable selection
In constructing our predictive model, we considered the interrelationships among different explanatory variables to ensure a robust and coherent analysis. The selection of these variables was guided by their correlation, aiming for a set of features that provided information without redundancy. For this, we calculated the Spearman correlation coefficient (Spearman, 1961), as presented in Fig. 2. We chose the Spearman rank over other correlation metrics as non-linear relationships between the drivers are expected (Sect. 2.4), making it a better assessment than parametric comparisons. We identified explanatory variables with strong relationships by using the Spearman's correlation matrix and removed one variable from each highly correlated pair (threshold higher than 0.6). The choice of which variable to remove was informed by previous knowledge of their relationship with burned areas and their relevance to our study.
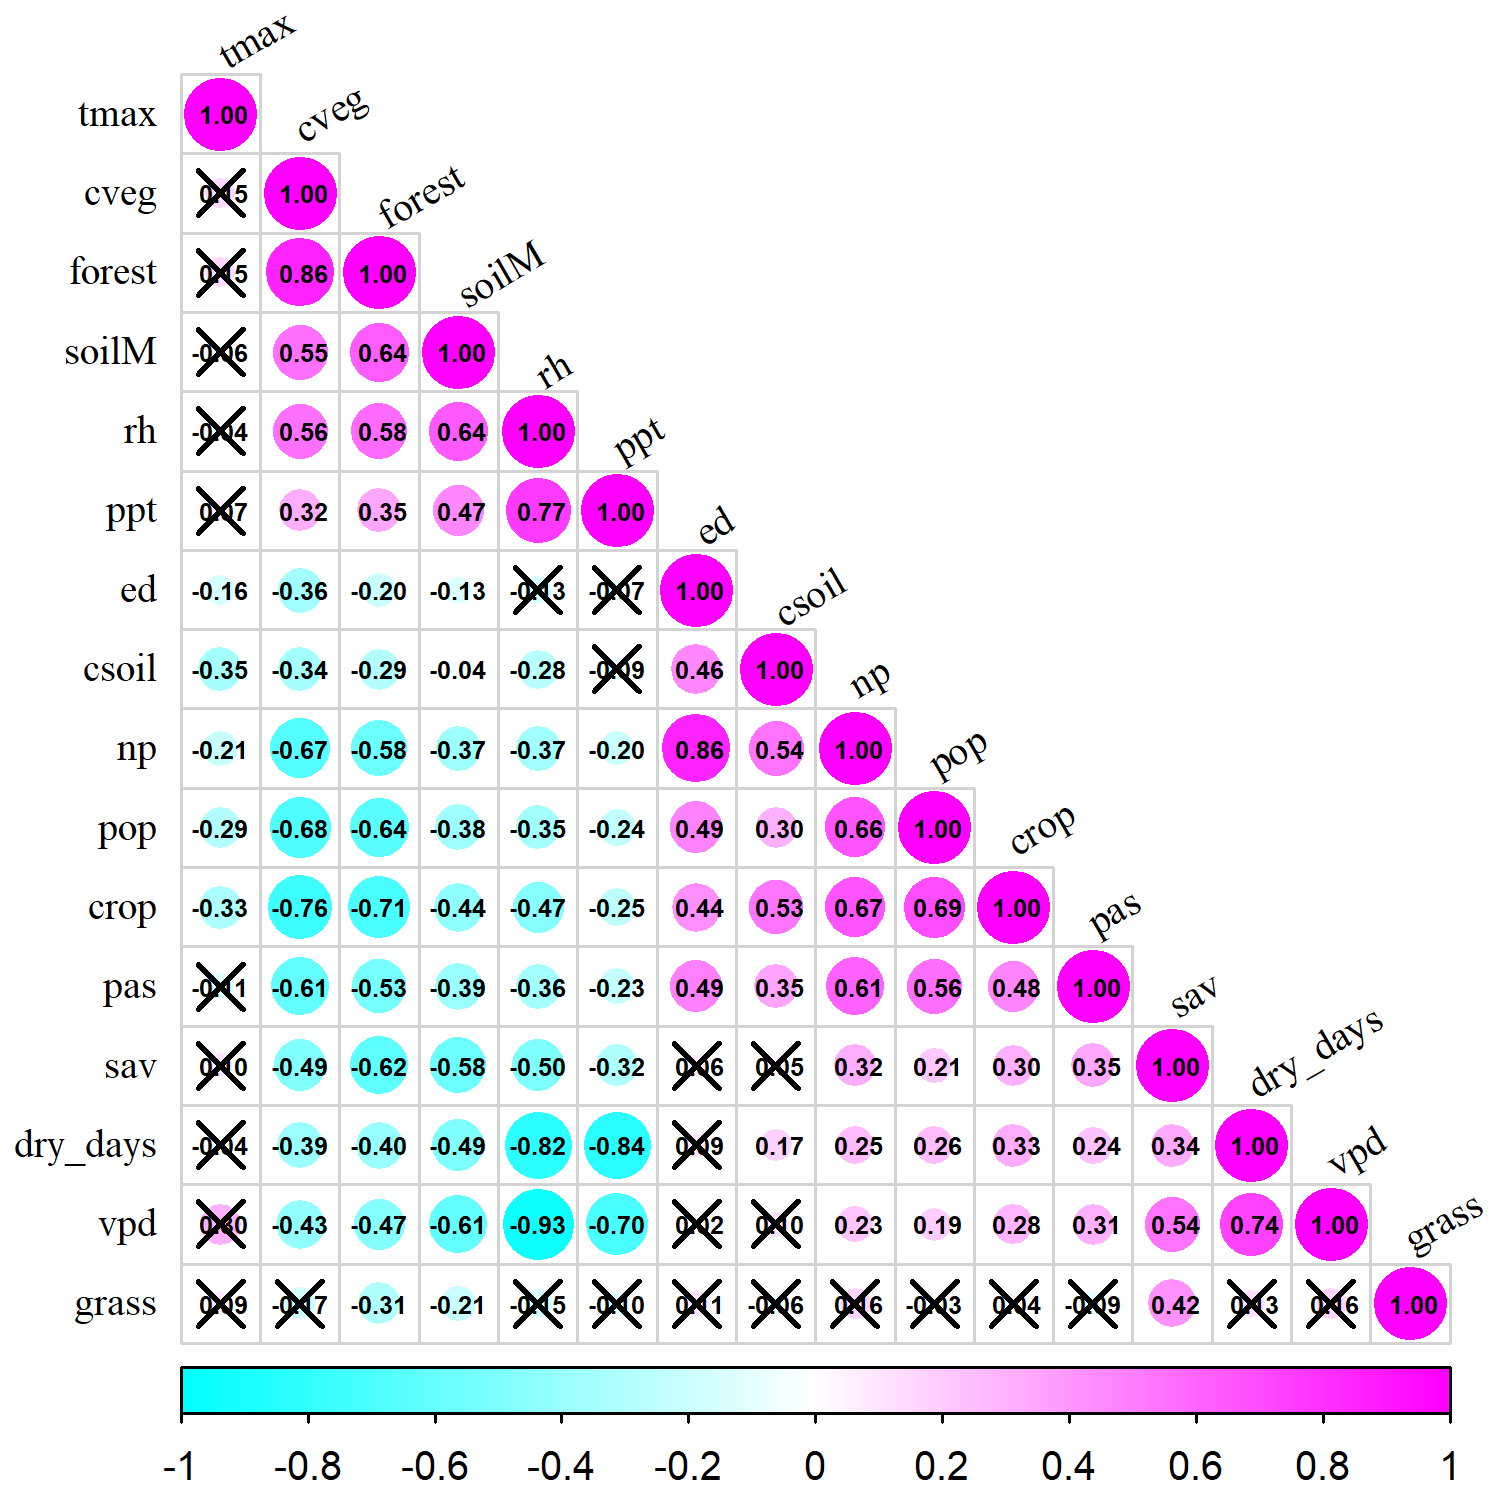
Figure 2Spearman correlation of the explanatory variables (also see Table 1). Crossed values indicate no correlation, values near 1 (magenta) indicate a strong positive correlation, and values near −1 (cyan) indicate a strong negative correlation.
We adopted a more streamlined approach by opting for a shorter list of explanatory variables and by grouping them in the variable analysis to capture their compound effect. At this stage, we selected 7 explanatory variables as input for the final model (Fig. 3) from the 18 initial explanatory variables. These variables were chosen based on their correlation, ensuring that at least one explanatory variable from each group was selected (climate, fuel, LULC, ignition, and forest metrics). The explanatory variables were then divided into three groups: group 1 is composed of maximum temperature and precipitation, which are related to fire weather; group 2 includes edge density and road density, which are related to landscape fragmentation; and group 3 encompasses forest cover, pasture cover, and carbon in dead vegetation, which are associated with fuel availability.
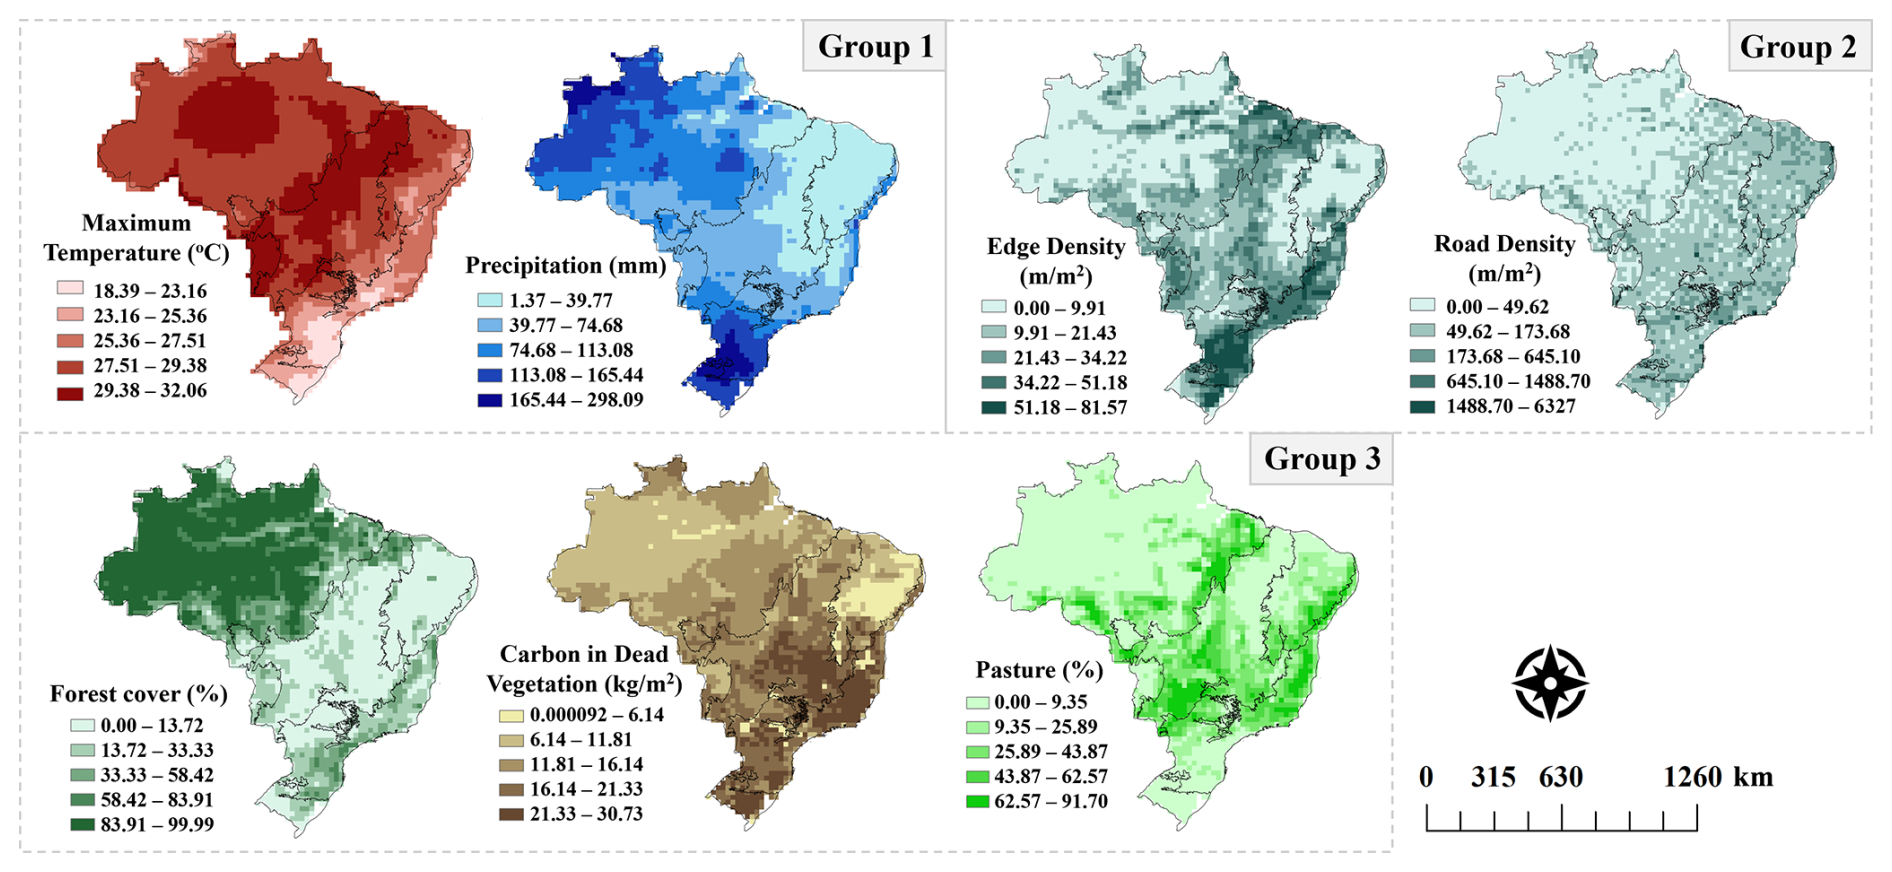
Figure 3Mean of the selected explanatory variables for August, September, and October from 2002 to 2019.
2.4 Relationship curves
The constraints or priors of the model were added as parameters of different functions, which we refer to as relationship curves. We included the linear and power functions (Fig. 4) according to known relationships between fires and environmental variables. This means that some environmental explanatory variables, when presenting higher values, are likely to increase fires. In comparison, others have an inverse relationship where lower values of the explanatory variable coincide with an increase in burned area. In addition, we added the linear and power functions without imposing a priori constraints on parameters to enforce positive or negative relationships. We expect our selected explanatory variables to have the following relationship with fires:
-
Maximum temperature, carbon in dead vegetation, and pastures are expected to increase fire activity as their values increase (Cano-Crespo et al., 2015; Dos Santos et al., 2021; Libonati et al., 2022a).
-
Precipitation and forests are expect to increase fire activity as their values decrease (Aragão et al., 2008; Barbosa et al., 2022).
-
Edge density and roads are expected to have more uncertain responses across the biomes. A high density of edges can lead to more fires in forest ecosystems (Armenteras et al., 2013; Silva Junior et al., 2022), but fragmentation can also reduce fires by impeding fire spread (Driscoll et al., 2021). Regarding road density, while more fires are expected surrounding roads (Armenteras et al., 2017), fewer fires are expected with increased density due to urbanisation.
The model then estimates the contribution of each curve to the final model. Even though it is possible to include more relationship curves, we decided to keep this count at a minimum to avoid making too many assumptions and obtaining unstable results due to computational efficiency.
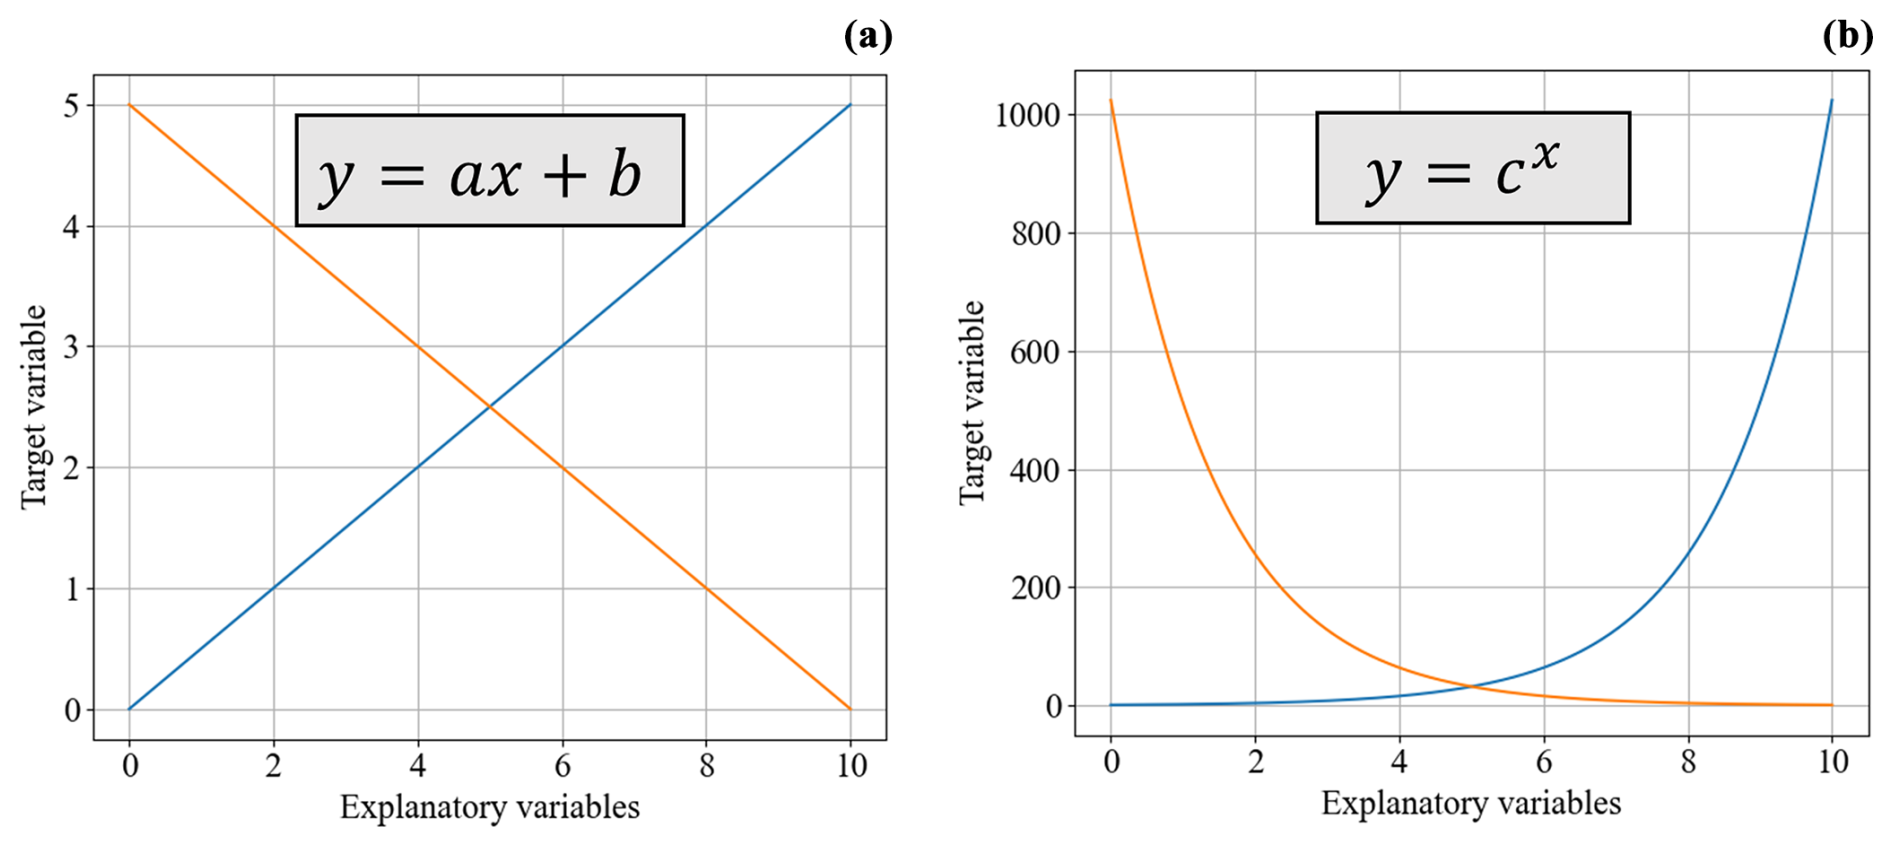
Figure 4Graphical representation of the relationship functions implemented in the model. Panel (a) is a linear function, and panel (b) is a power function.
2.5 Model optimisation
The model was optimised for each Brazilian biome separately using the MCD64A1 product from 2002 to 2009. This process used the PyMC5 Python package (Abril-Pla et al., 2023), employing five chains each over 1000 iterations using the No-U-Turns Hamiltonian Monte Carlo sampler (Hoffman and Gelman, 2014) while utilising 20 % of the data or a minimum of 6000 grid cells. While the runs were conducted individually for each biome, the results were aggregated to facilitate visualisation. The full code used to develop this model is available on Zenodo (Barbosa et al., 2024a).
In Bayesian inference, we update our beliefs or knowledge about a system or event by incorporating new evidence or data (Laplace, 1820; Gelman et al., 2013). This allows us to quantify and update our uncertainty using probability distributions. By maximising entropy, we aim to achieve the most unbiased, information-rich distribution that satisfies this prior knowledge. In this sense, the likelihood (or posterior probability) of the values of the set of parameters β given a series of observations Obsi and explanatory variables Xi v (from Sect. 2.3) is proportional (∝) to the prior probability distribution of P(β) multiplied by the probability of the observations given the parameters tested.
In the above, Obsi is a set of our target observations, i is the individual data point, and {Xi v} is the set of explanatory variables v for data point i. The pi notation (Π) indicates repeated multiplication. Maximum entropy in species distribution modelling assumes that individual observations (Obsi) show a value of 1 when there is a fire or a value of 0 when there is not and that
and
where is the probability that a fire will occur, and is the probability of no fire. The term f(X,β) is defined below:
where y({Xv},β) = linear function + power function (Sect. 2.4).
This works for single land points, where a location burns or does not burn. We extend this concept to derive the maximum entropy solution for fractional burned area by integrating over a larger grid cell area. Here, we consider it to be that, when dividing a grid cell indefinitely, the subcell sizes approach infinitesimally small values, and the data within each subcell start to behave like continuous data. We adapted Eqs. (2) and (3) to work with continuous data:
where n is the observation sample size, j is the individual subgrid, and s is the subgrid sample size. If, for a given Obsi, m of the s subgrid cells burn then we can adapt Eq. (3) to get
and, therefore,
when s→∞, becomes burned-area fraction (BF). Then,
This solution assumes that burning conditions at a specific location solely explain the likelihood of burning. In reality, fires spread, and, particularly at higher burned areas, they may overlap. We, therefore, modify Obsi so that it represents what the burned fraction of a grid cell would look like if it was made up of one large fire with no overlapping burning:
where Obsi, 0 is the true observation, and Q is a modifier parameter to remove the effects of fire overlap.
Lastly, to account for variations in land cover to assign to either natural or non-natural vegetation, which can be very small in some cells, we introduced a weighting factor w when assessing fire categories. This weighting factor considers the individual area of each grid cell, ensuring that cells with smaller vegetation cover contribute proportionally to the analysis, as in Eq. (11) below:
We use weak, uninformed prior distributions for our Eq. (5) parameters. β0, b0,i, and b1,i priors were set as a normal distribution, with a mean of 0 and a standard deviation of 100, and c was set to be log-normal, with a μ of 0 and a σ of 1. The parameter Q in Eq. (10) was set as a log-normal distribution, with a μ of 2 and a σ of 1.
2.6 Model evaluation
The model's main goal is to accurately quantify uncertainties, which we tested by analysing where the observations fell in the model's posterior probability distribution (Eq. 9). The uncertainties refer to the difference between the 10th and 90th percentiles of the simulated burned-area distribution and provide an estimate of the variability within the model outputs (Fig. 5). If more than 20 % of the observations fall outside the 10th–90th percentile range, the uncertainty range is too narrow because it fails to encompass the 10th–90th percentile range. Conversely, if observations cluster around the middle of the distribution (50th percentile), the uncertainty range is too wide as it overestimates the spread of the data. We aim to minimise uncertainty constraints without compromising accuracy. When evaluating the model against 2010–2019 observations, we also investigated how likely the observations are given the optimised model (P(observed | simulated)), as per Kelley et al. (2021). Using a different time period compared to the optimisation (from 2002 to 2009), we ensure an independent model evaluation. If the out-of-sample observations are more likely given the model then the model performs well. We use a likelihood of 50 % to indicate adequate performance.
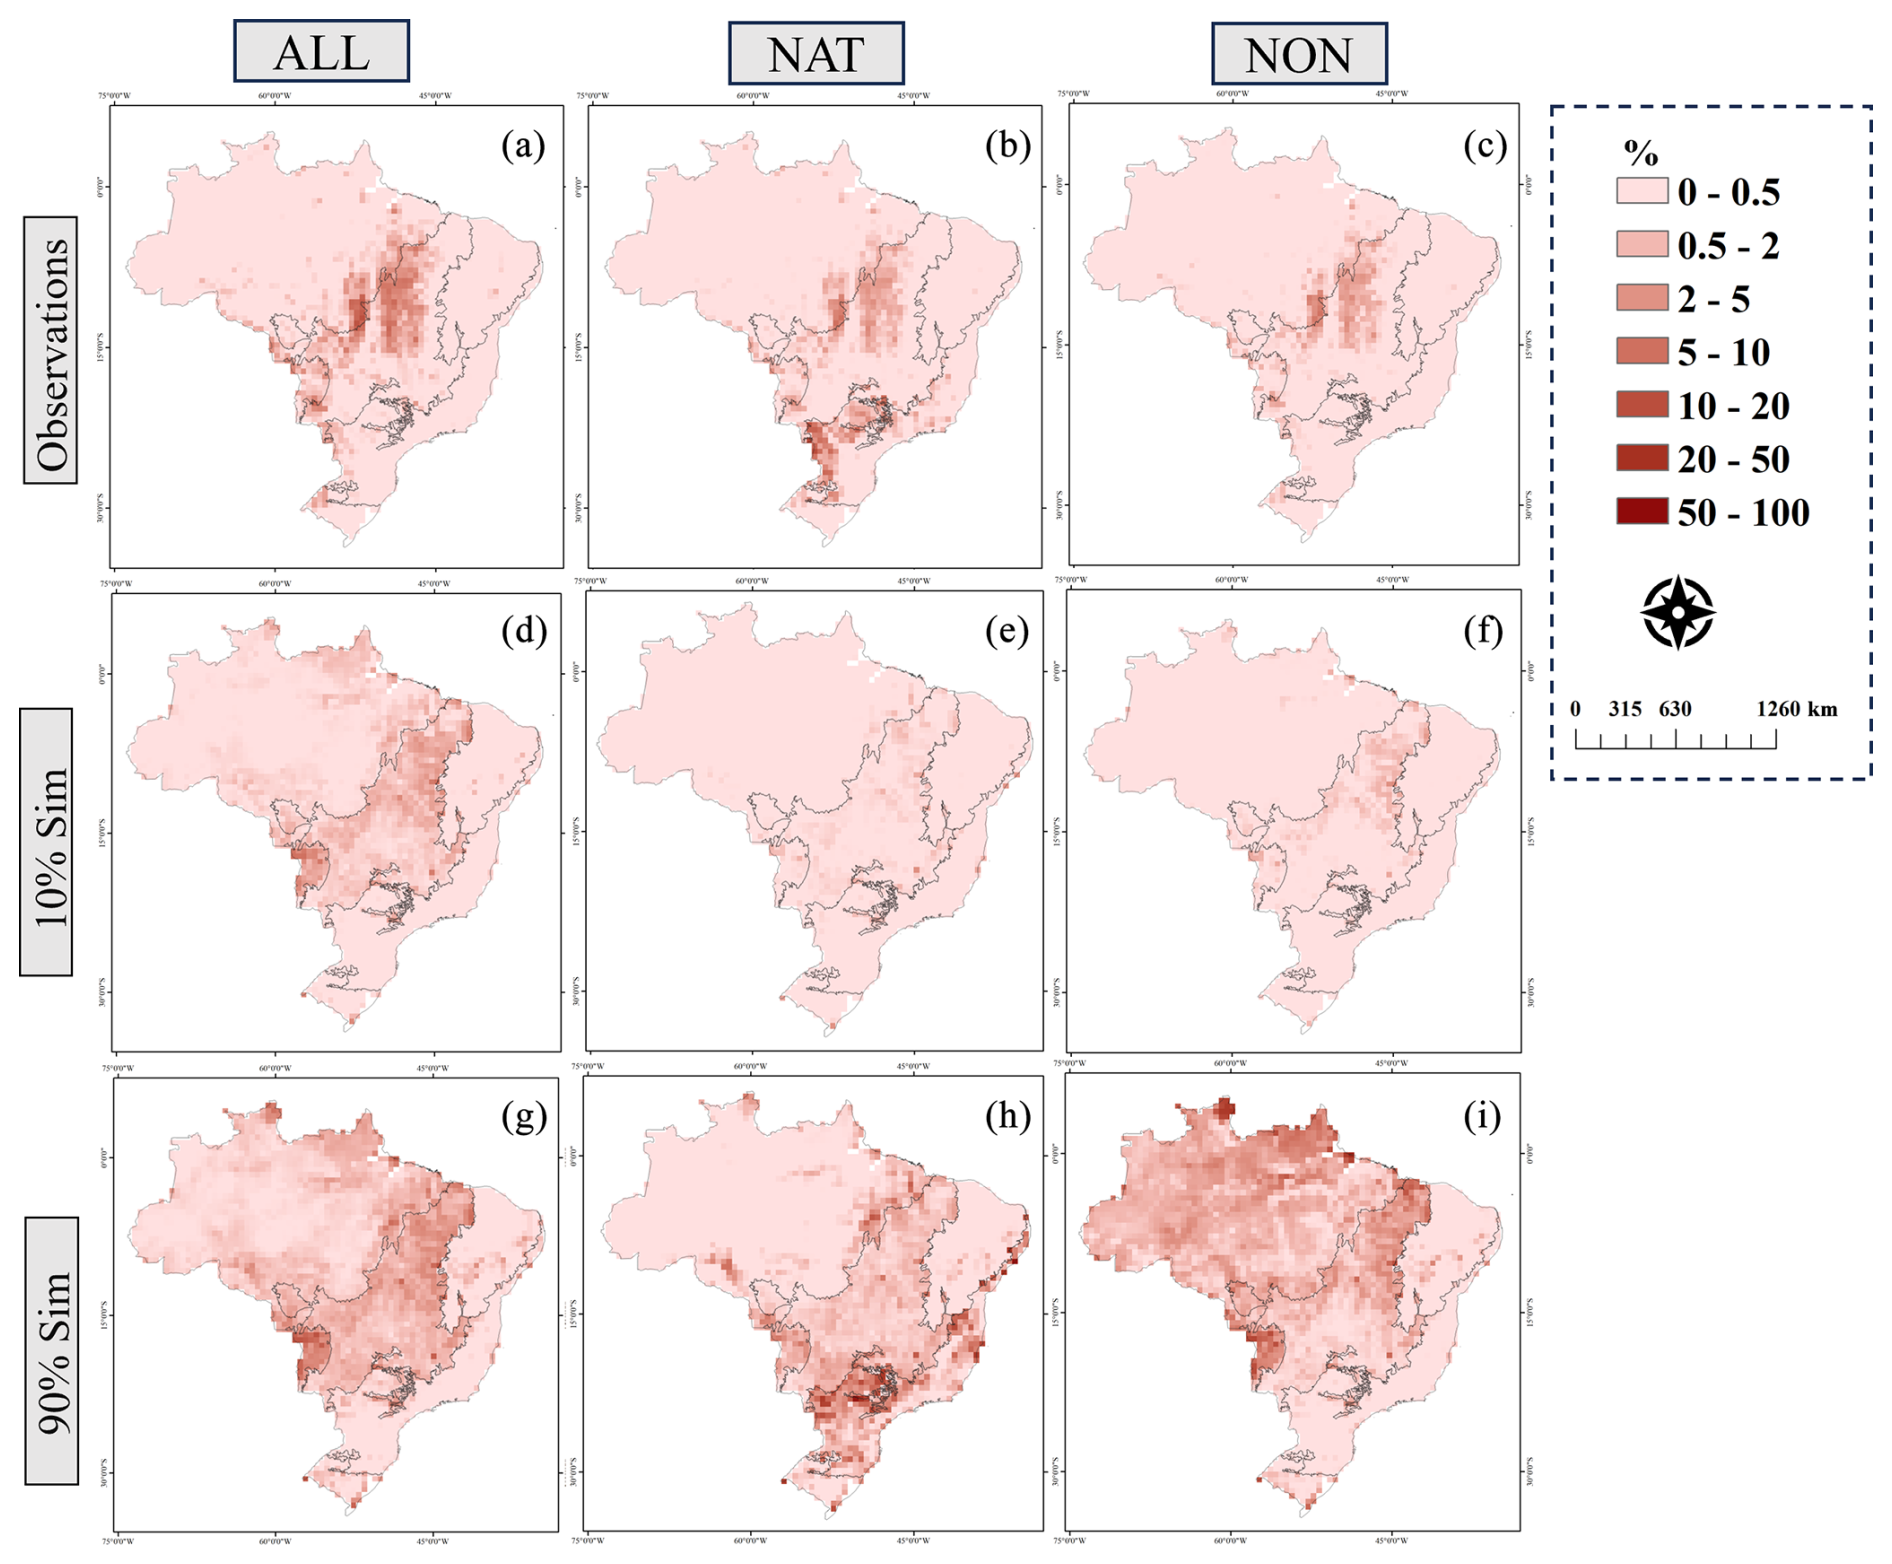
Figure 5Maps of modelled and observed percentage (%) of burned area. First row shows the observed burned area for the July–September 2002–2009 annual averages, categorised into total burned area (ALL – a, d, g), burned area in natural vegetation (NAT – b, e, h), and burned area in non-vegetation (NON – c, f, i). Second and third rows show the modelled burned areas at the 10th and 90th percentiles, respectively. Histograms of the modelled percentage (%) of burned area are shown in Figs. S1 and S2 in the Supplement.
We calculate the probability of an observation given our model (Fig. 6) by integrating the observation's likelihood across the parameter space, weighted by the parameter likelihood given our training in Sect. 2.5:
which, combined with Eq. (9), gives us
where Y is an observation, and X corresponds to the model inputs at the time and location of Y. We approximate this by sampling 200 parameter ensemble members from each of our five chains, providing us with 1000 ensemble members. The frequency of these 1000 members in a parameter gives us P(β|{BFi}) in Eq. (13). We then drive the model with each parameter combination to obtain f(X,β). We used the Iris package (Met Office, 2023) for Python version 3 (Python Software Foundation, https://www.python.org/, last access: 12 July 2023) for sampling.
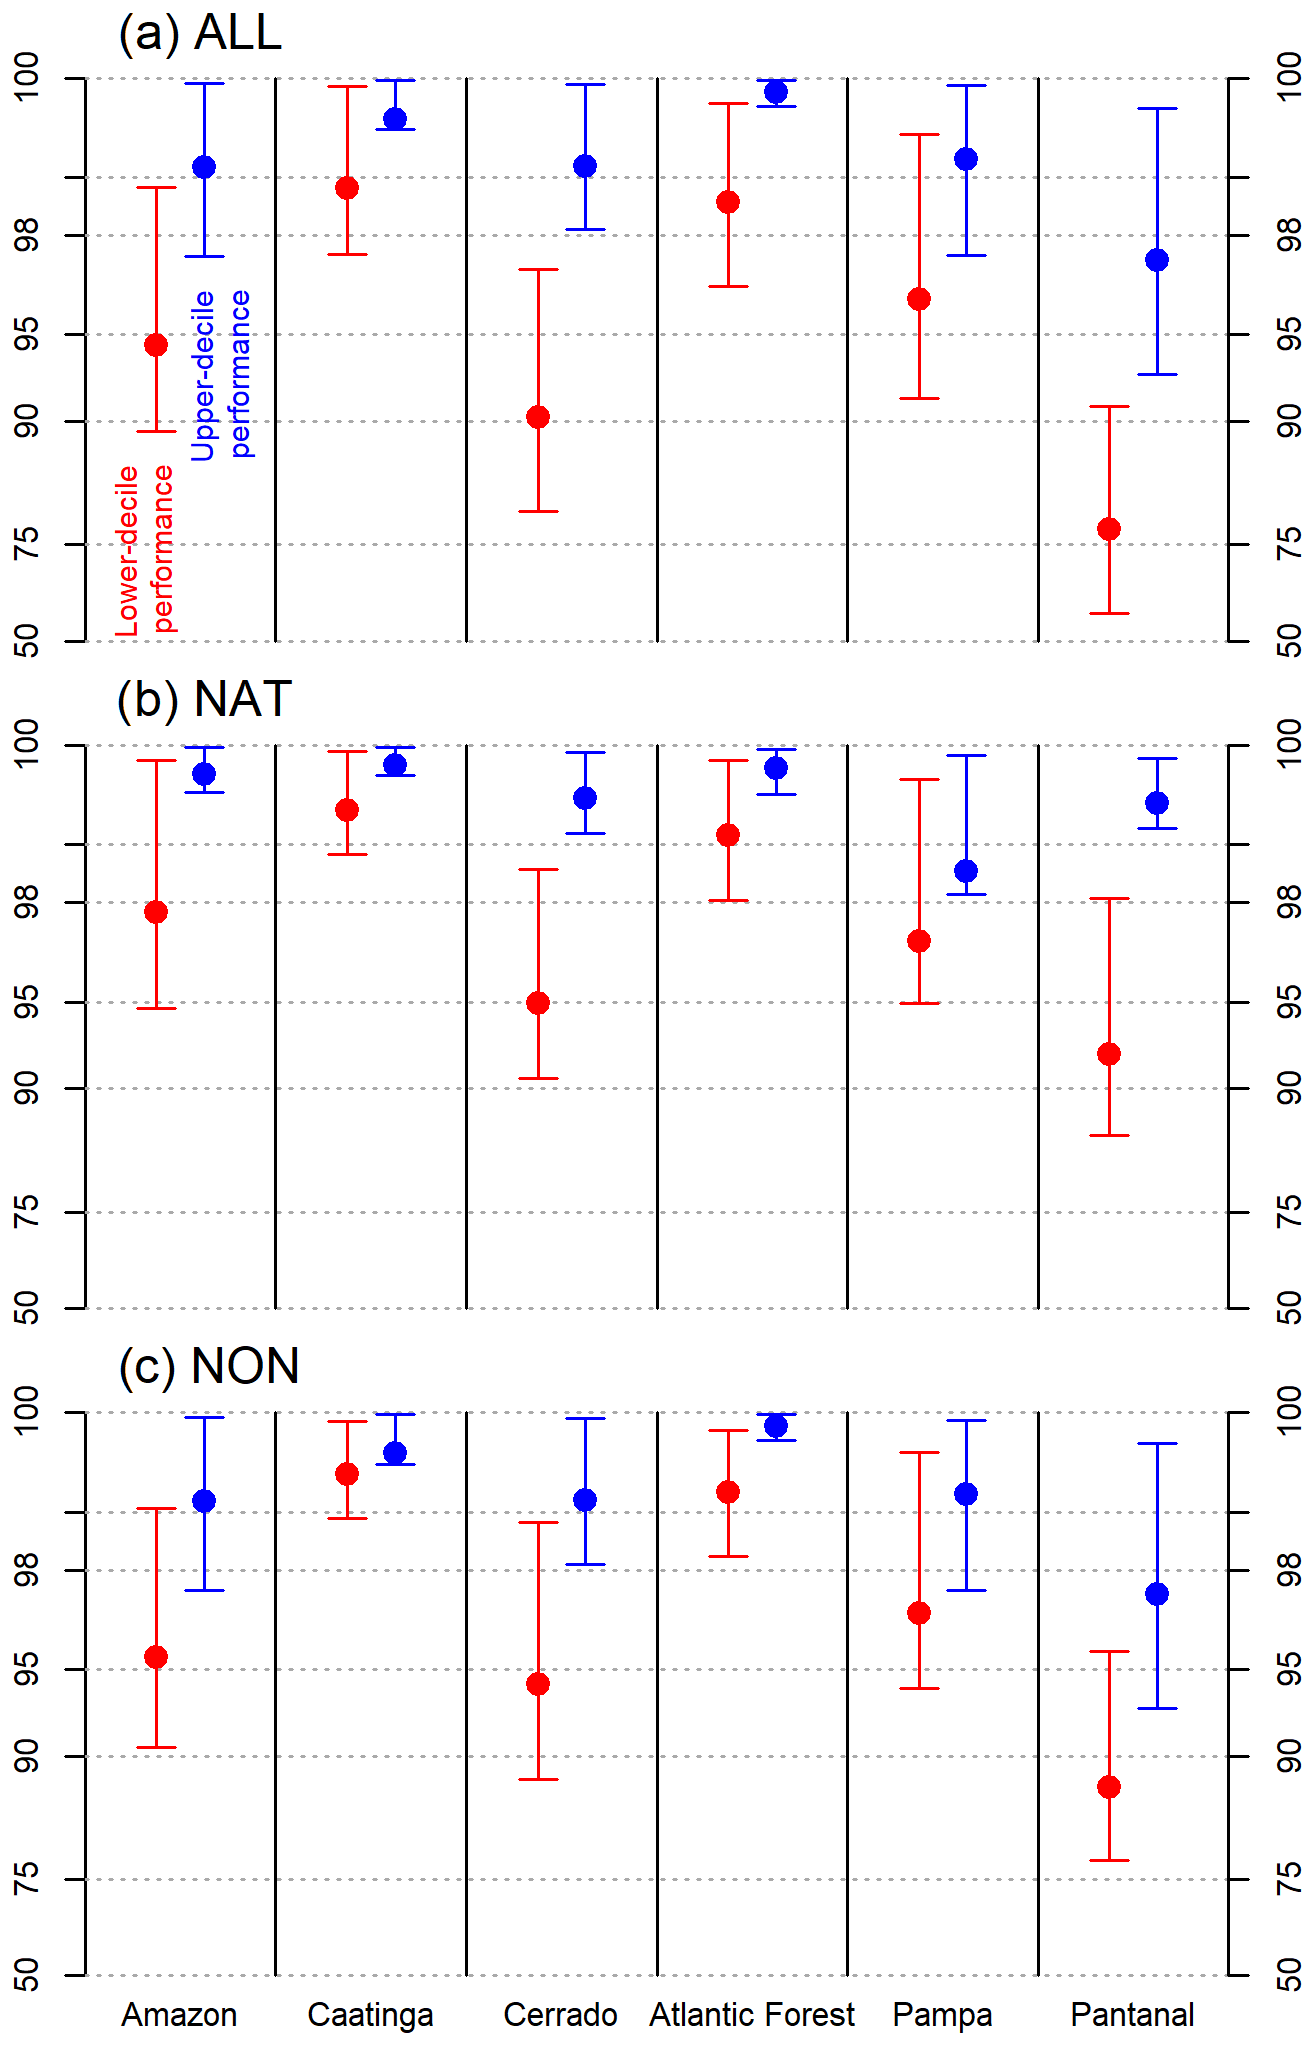
Figure 6Likelihood of the observations (%) per biome given the model parameters over all cells and time steps. The lower decile (worst performance) is represented in red, and the upper decile (best performance) is represented in blue for ALL (a), NAT (b), and NON (c). The dot represents the mean likelihood.
We also determined the percentile of our observations within the model's posterior probability distribution. In an unbiased model, we expect the observation position to be essentially random, with the mean over many samples tending towards the middle of the distribution (i.e. a percentile of 50 %). We mapped out the mean bias position of the observations for the 30 time steps (3 months – August, September, and October – for 10 years) tested (Fig. 7). The p value in Fig. 8 uses Student's t test to ascertain if the mean of the posterior position of the monthly observations for a given grid cell (mean bias) is significantly different from 50 % (i.e, the model is biased). A mean bias near 0 indicates that observations are consistently smaller than the simulations, and a mean bias near 1 indicates that the observations are greater than the simulations. Low p numbers indicate where the model is biased towards a probability distribution, which tends to suggest too-low or too-high burning.
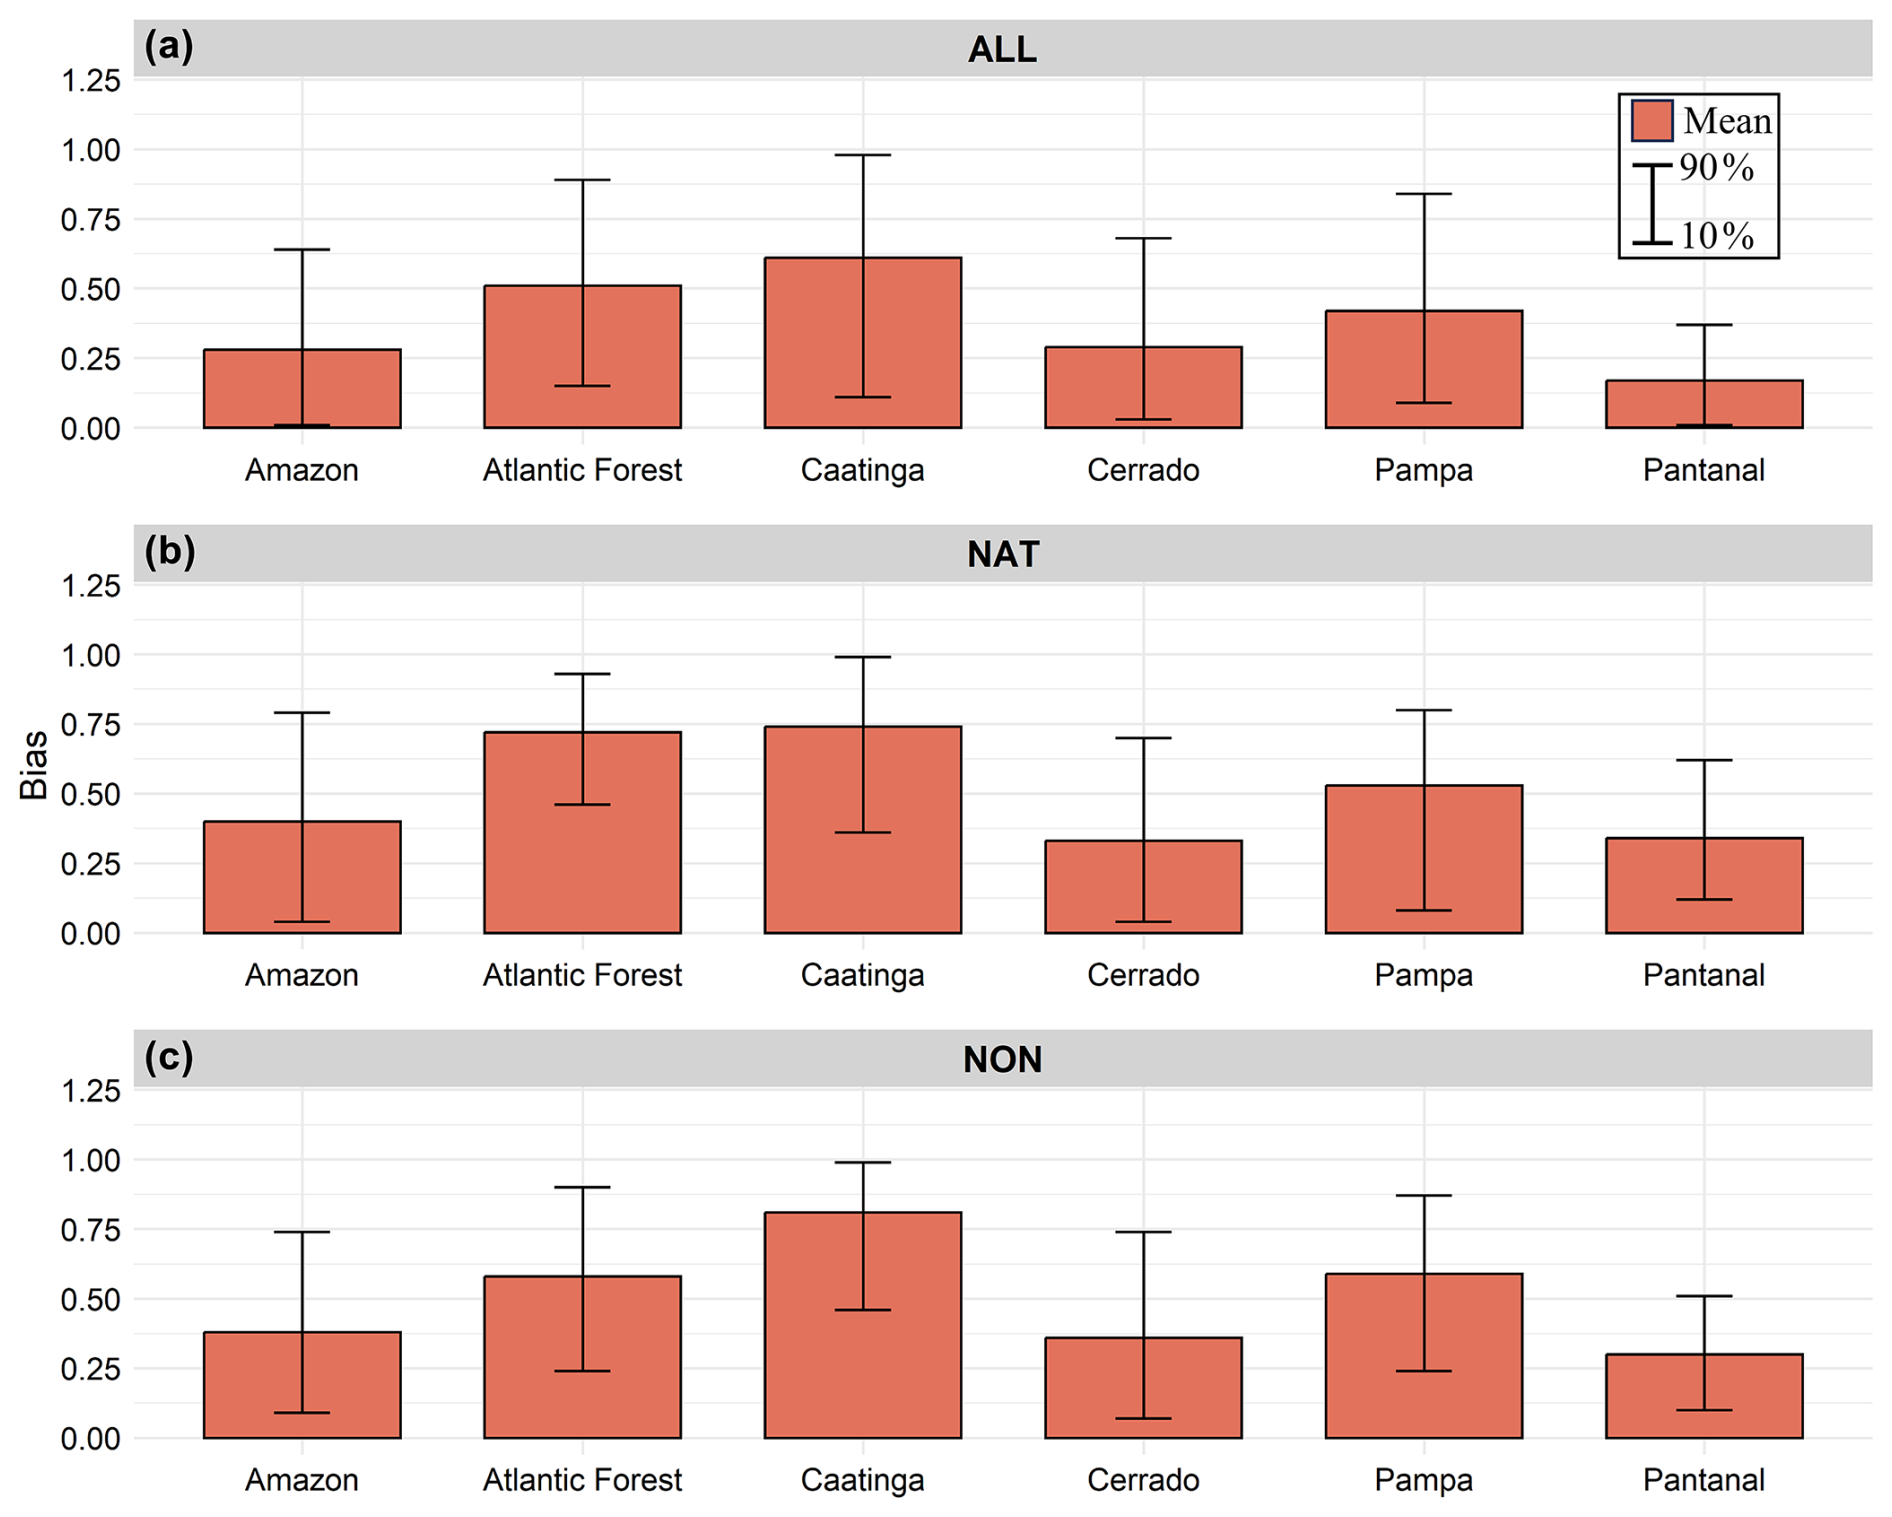
Figure 7Mean bias and 10th and 90th percentiles of the modelled burned area to total area (ALL, a), natural-vegetation area (NAT, b), and non-vegetation area (NON, c).
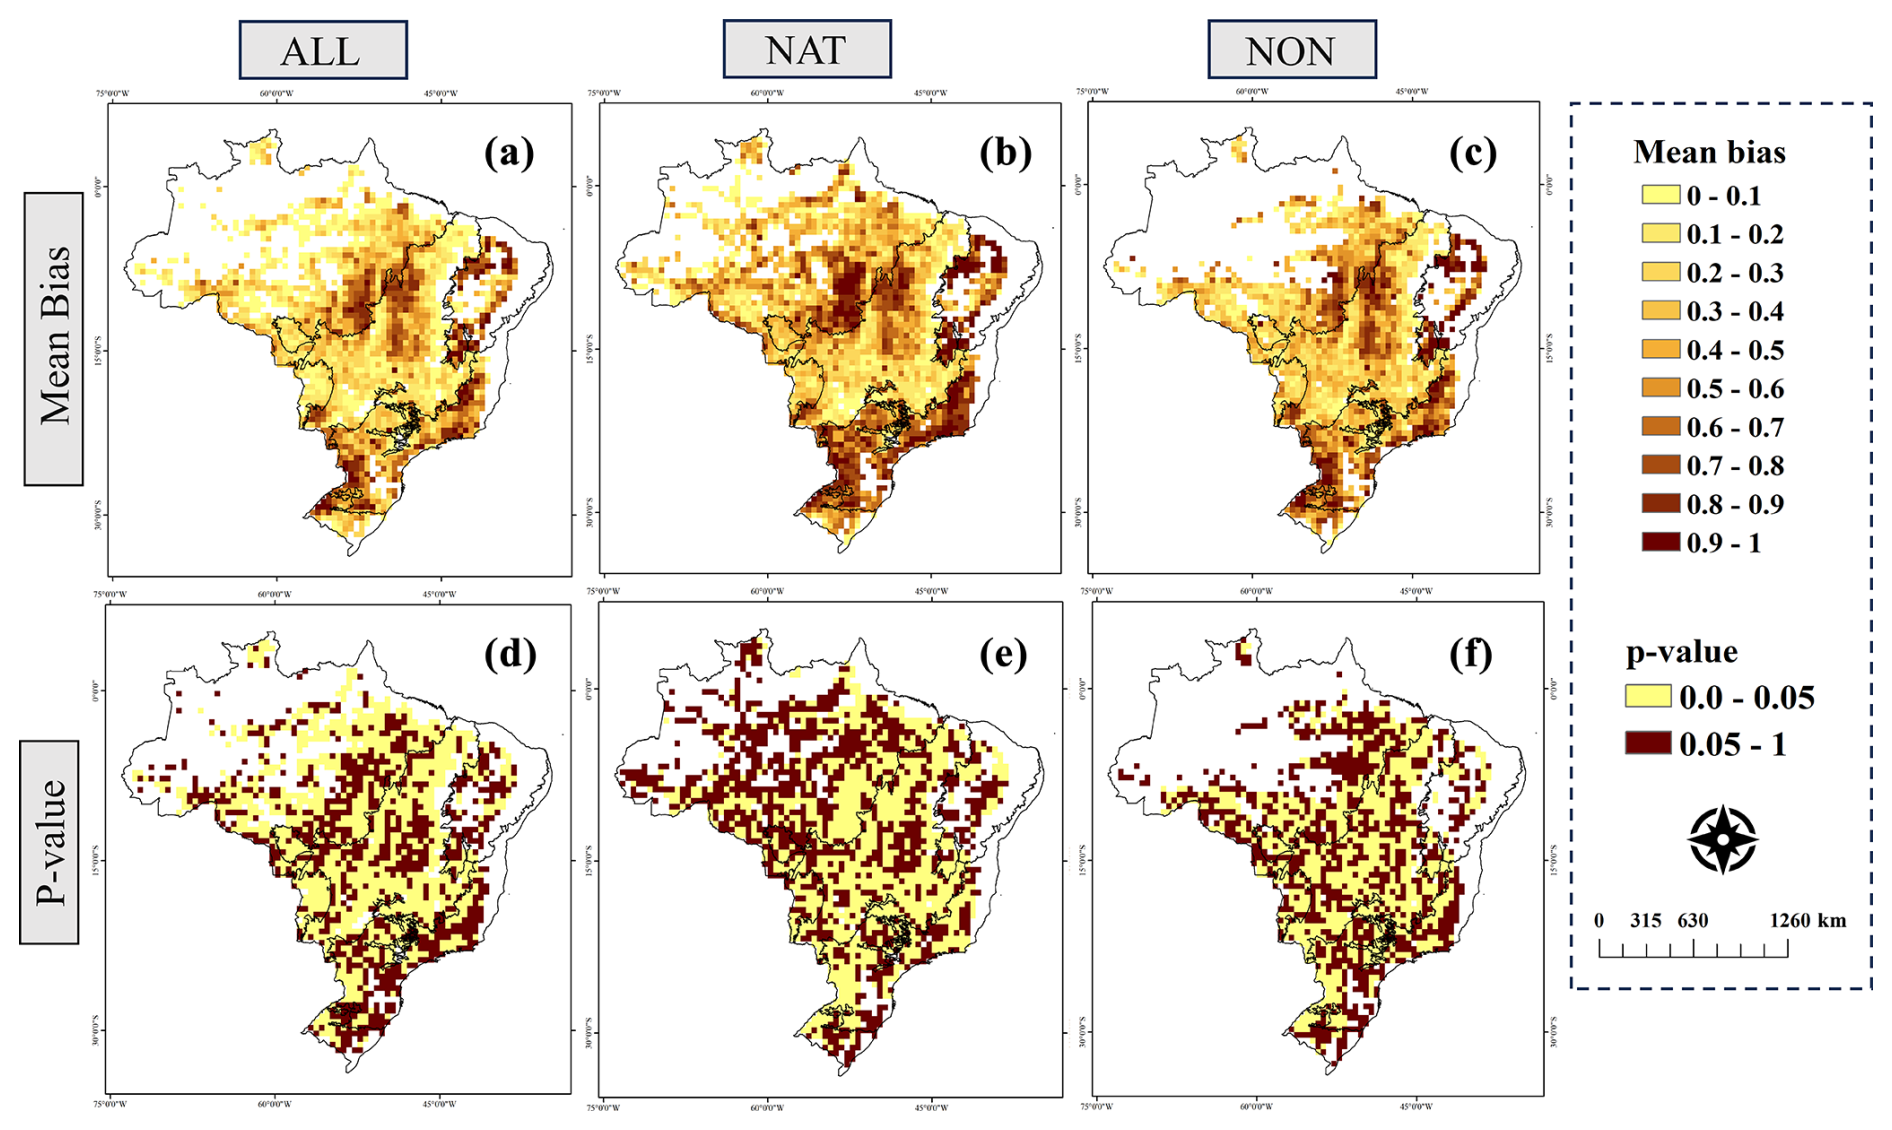
Figure 8(a–c) Spatial mean bias of the modelled burned area to total area (ALL, a), natural-vegetation area (NAT, b), and non-vegetation area (NON, c). (d–f) Significance of the mean bias considering a 95 % confidence level (p value < 0.05). Pixels with p value > 0.05 (brown colour) are not significantly different from the 0.5 mean bias, meaning that they are unbiased.
2.7 Explanatory variable analysis
We assessed the behaviour of the explanatory variables against the burned-area simulations by generating response maps for our explanatory variable groups in a similar way to Kelley et al. (2019). In the potential maps, we set each explanatory variable in the group to their median and kept the others at their original values. The median, representing the middle value in a dataset, was chosen because it is less affected by extreme values compared to the mean. The maps were subtracted from the original simulations (control − potential response to quantify the influence of the target group on the model's response. This approach enables the assessment of burned-area response when the explanatory variable deviates from the median and assumes its original value, which could be below or above the median. The likelihood maps for the potential response then represent the percentage of the modelled distribution that shows an increase in burning in each biome or, in other words, how likely it is that the potential response is greater than zero. Values near 100 % indicate that the group of variables is confidently associated with an increase in burning at a specific location. Conversely, values near 0 % suggest that the variables lead to a decrease in burning. For values in the middle range (40 % to 60 %), the response remains uncertain as it is not possible to confidently determine whether the variables contribute to an increase or decrease in burning.
We evaluate the sensitivity for each group by measuring the gradient's magnitude across its variables: U={Xu}, where Xu represents the exploratory variables within group U. The conventional approach to describe a gradient in multidimensional space involves computing the partial derivative for every dimension. In this case, we perform this calculation for each parameter sample β across all variables in the group:
The magnitude of this gradient is the root sum square of these partial derivatives:
We approximate this by perturbing the exploratory variables in the group by ±0.05:
where
We present the results in two sections. The first section focuses on the model's performance in simulating the observations, while the second section delves into the simulation's response to the explanatory variables.
3.1 Model simulations and performance
We performed simulations of burned area across each Brazilian biome and fire category, and the resulting maps are shown in Fig. 5. The three simulation runs (ALL, NAT, and NON) successfully captured uncertainties in all biomes, with most observations falling within the 10th to 90th percentiles of the model (see Figs. S1 and S2 in the Supplement). However, the model exhibits variations in uncertainties based on the simulation category. For instance, in Amazonia, a biome characterised by a vast expanse of natural vegetation, uncertainties were smaller in NAT simulations, contrasting with larger uncertainties observed in NON simulations, especially in areas where observed burned areas are small or zero (Fig. 5). Similarly, Pantanal displayed lower uncertainties in NAT simulations, with values reaching up to 10 %, while NON simulations registered uncertainties of up to 20 % in terms of burned area. The Atlantic Forest, a biome distinguished by non-natural vegetation, exhibited smaller uncertainties in NON simulations. These findings indicate that the segregation of fire categories (ALL–NAT–NON) substantially impacts the model's response. Conversely, the model struggles to accurately capture large burned areas (> 10 %) in central regions of Brazil across all three simulations, mostly where the Cerrado biome is located.
In Bayesian inference, the likelihood expresses the probability of observing a particular event given the model's parameters. Our results imply a strong agreement between the parameters of the model and the observations (Fig. 6), even during the months when the observations were less likely. The mean likelihood during these months was above 90 % across all biomes in all simulations, except for Pantanal, where the likelihood was lower (78 % for ALL and 87 % for NON) but still satisfactory. The percentiles indicated that, in Pantanal, the likelihood of the observations for ALL varied between 59 % to 91 %. In contrast, other biomes presented a minimum likelihood of 80 %. During the months demonstrating the best performance, most biomes aligned with the observations, achieving maximum likelihood (100 %) on average. Pantanal, however, presented the lowest values, with 97 % for both the ALL and NON simulations.
The spatial likelihood analysis (see Fig. S3) provides additional insights into the model's robustness across different biomes and fire categories. The results underscore the model's effective performance across the biomes. Notably, the likelihood remained very high for the Atlantic Forest, Caatinga, and Pampa biomes even in the months and locations where observations were less likely. A high likelihood is also observed for NAT in Amazonia, except in the south and east, which contain most of the non-natural vegetation. Lower performance is evident in the simulations for both ALL and NON in this biome, indicating that stratifying fire categories by vegetation type is a good strategy to enhance model performance in Amazonia. Similarly, Pantanal showed the best performance for NAT but lower performance for ALL and NON across the majority of the biome. In contrast, Cerrado performed better than most biomes for NON during the months of worst performance.
Despite the high likelihood associated with the observations, the model simulations exhibit a certain degree of bias across the three categories (Fig. 7). A mean bias near 0.5 indicates no bias as the observations fall in the middle of the model's distribution. Amazonia and Cerrado showed mean biases of 0.28 and 0.29, respectively, for ALL, indicating an overestimation by the simulations at lower burned areas. The Atlantic Forest presented a mean bias of 0.51, suggesting that, overall, the model is unbiased, although some pixels may still be biased. Similarly, Pampa (0.42) and Caatinga (0.61) showed values near 0.5, indicating a lower degree of bias. In contrast, a mean bias of 0.17 in Pantanal suggests an overestimation of burned area by the model, especially at lower levels. However, the model can distinguish between lower and high burned areas in Pantanal (Fig. 5), indicating its ability to identify periods and locations of more extreme burning, even if it does not exactly capture the correct magnitude.
Generally, higher uncertainties are observed for NAT and NON simulations, but a notable improvement in bias is evident when compared to the ALL simulations. In the NAT simulations, the model achieved its most favourable outcomes in Pampa (0.53) and Amazonia (0.40), with Pantanal also showing a noticeable improvement (0.34). The biases of 0.74 in Caatinga and 0.72 in the Atlantic Forest indicate a trend towards underestimation in this fire category. In Cerrado, a bias value of 0.33 was observed for NAT, aligning with the pattern seen in the ALL simulations and suggesting a consistent overestimation, particularly for lower burned areas.
In the NON simulations, Amazonia exhibited a bias of 0.38 but overestimated lower burned areas. Cerrado and Pantanal showed similar patterns compared to those in the NAT simulations, with respective mean biases of 0.36 and 0.31. The model tended to underestimate burned areas in Caatinga (0.81), particularly at higher burned areas. While the Atlantic Forest (0.58) and Pampa (0.59) showcased the most unbiased simulations for the NAT fire category, slight underestimations of burned areas were noted in some instances (Fig. 8).
The spatial distribution of the mean bias, as depicted in Fig. 8, exhibits considerable variation. Pixels without values indicate zero burned area in the observations, where, by definition, the observation will always fall into the 0th percentile of the model posterior distribution. Consequently, the bias metric does not provide meaningful information for these pixels. The p values reveal that, in numerous areas, the bias is not statistically different from 0.5 (p value > 0.05, indicated by brown colour), suggesting unbiased simulations in these regions. For example, lower fires in Amazonia tend to occur in areas of natural vegetation, where NAT simulations exhibit a non-significant bias. In these regions, ALL simulations tend to overestimate burned area. In southeastern Amazonia, fires were underestimated across all three fire categories, especially for NAT.
In Caatinga, all three simulations exhibited similar performance, significantly underestimating fires, particularly in the northern part of the biome. The Atlantic Forest displayed better results for both ALL and NON, with a substantial area exhibiting non-significant bias. The fragmented landscape of this biome likely limits data availability for NAT, possibly explaining the lower performance in this fire category. In contrast, Cerrado demonstrated a consistent pattern across all three fire categories, predominantly overestimating fires, especially in the south and northeast. While some underestimation occurred in the central biome, it was mostly non-significant. In Pantanal, the simulation consistently overestimated burned area across all three categories, with ALL simulations showing significant overestimation throughout the biome. Finally, Pampa displayed a non-significant bias across most of the region, except in the northwest, where the model underestimated burning in all three simulations.
3.2 Response of the modelled burned area to the explanatory variables
We assessed the potential and sensitivity responses of the explanatory variables (Figs. 9–12). The potential response offers insights into changes in burned area when the explanatory variables deviate from the median, identifying areas where responses tend to drive or suppress burning. In contrast, the sensitivity response provides information on how marginal changes in explanatory variables affect burned area (Kelley et al., 2019). Together, these analyses highlight areas susceptible to more extreme burning (i.e. where the burned area is sensitive to explanatory variables that tend to cause higher potential burning).
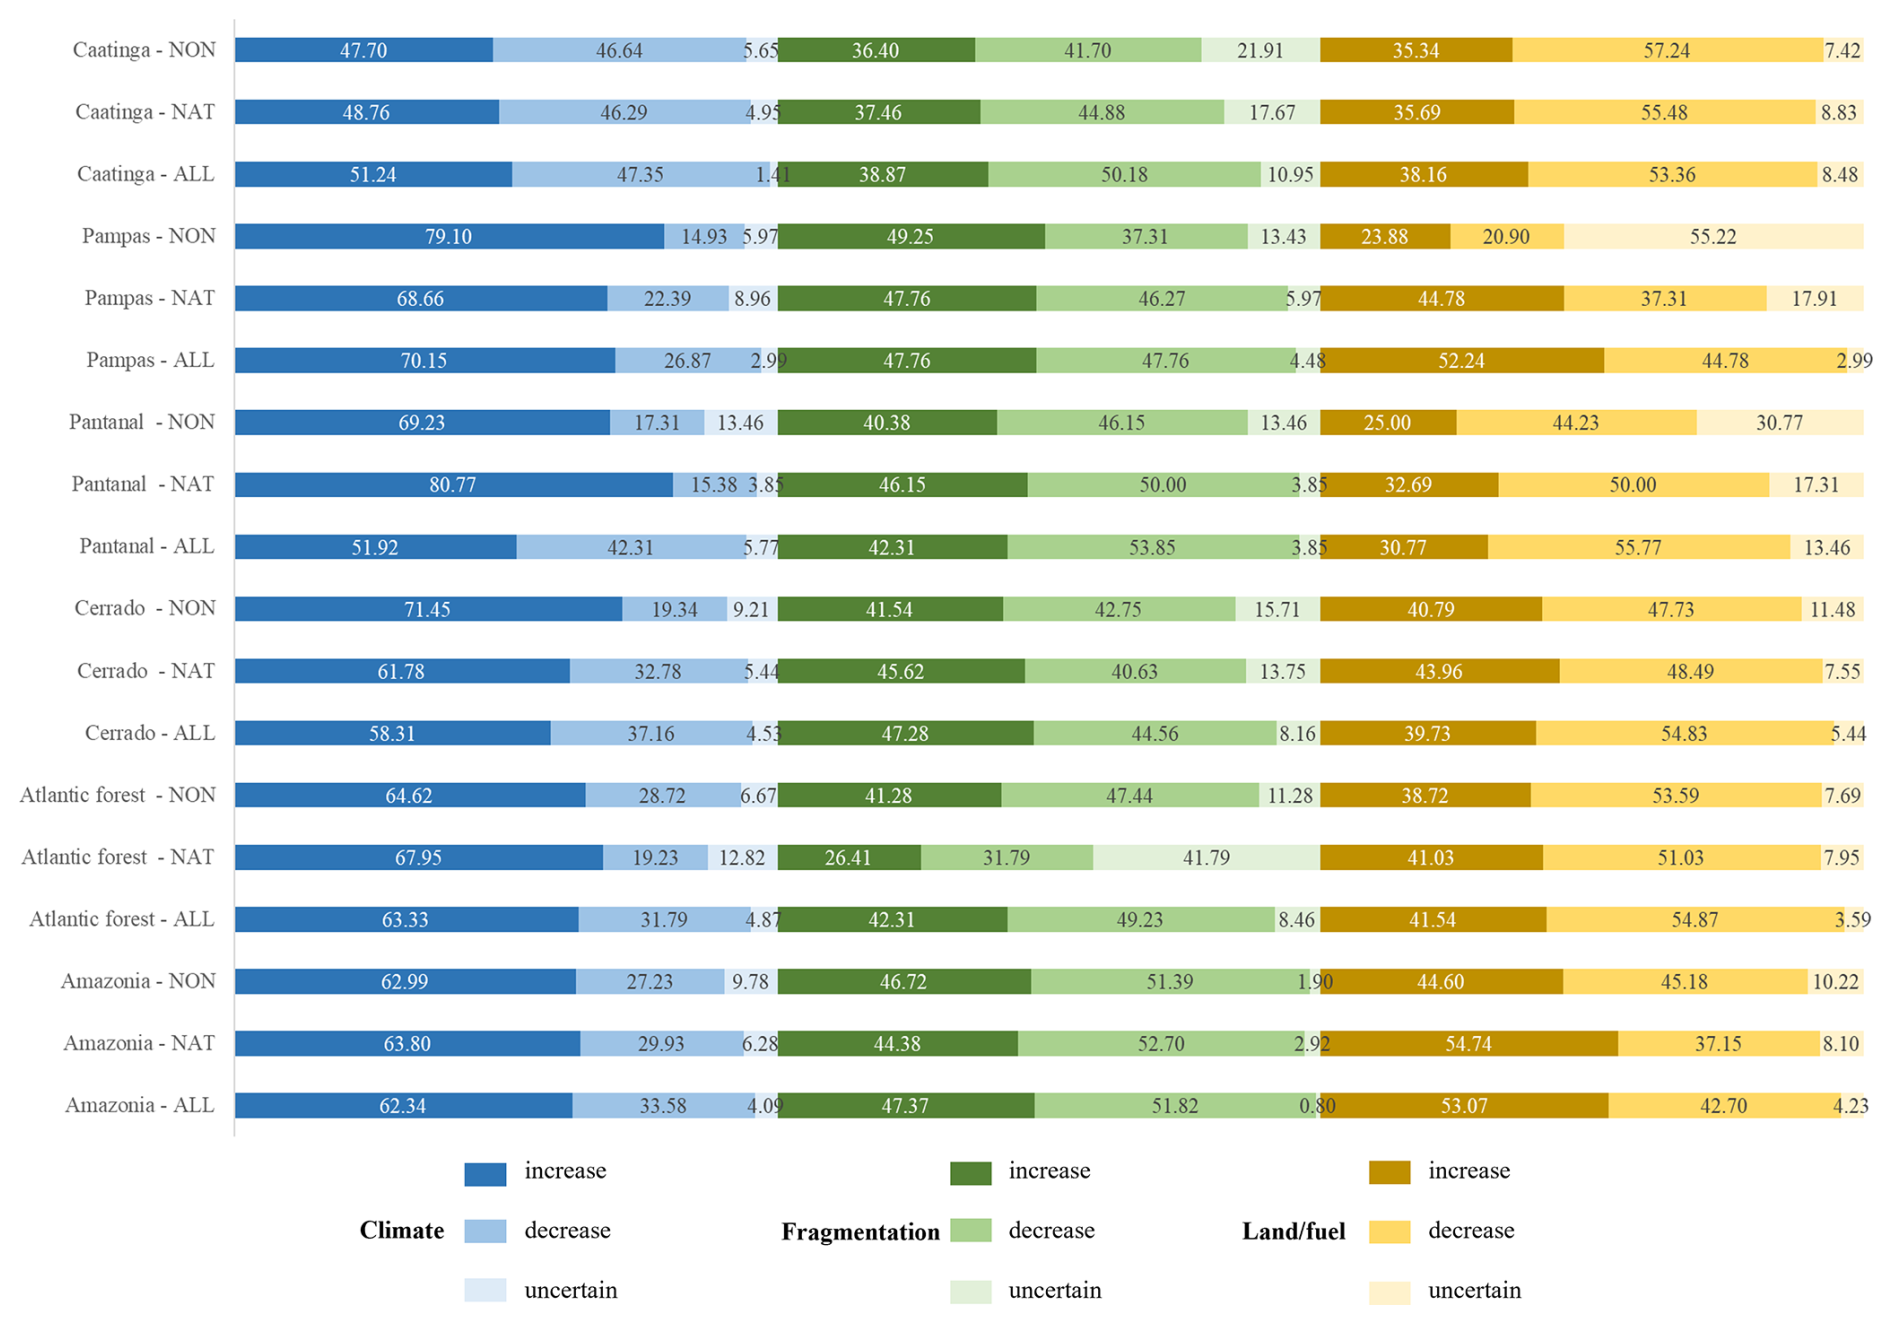
Figure 9Percentage of burned-area increase, decrease, and uncertainty driven by climate (group 1: maximum temperature and precipitation), fragmentation (group 2: road and edge densities), and land or fuel (group 3: forest, pasture, and carbon in dead vegetation) for each biome (Amazonia, Atlantic Forest, Cerrado, Pantanal, Pampa, and Caatinga) and fire category (ALL, NAT, and NON).
For ALL, group 1 (maximum temperature and precipitation) is very likely to lead to an increase in the burned area in 62.33 % (Fig. 9) of Amazonia (likelihood > 80 %). This means that, when these explanatory variables assume their actual values in this biome, the burned area tends to be higher, especially in the northeastern and southern portions (Fig. 10). Conversely, these variations contributed to a reduced burned area in 33.57 % of Amazonia, predominantly observed in the western and central areas, suggesting that maximum temperature and precipitation tend to suppress burned area in these regions. In 4.08 % of the biome, the influence of group-1 explanatory variables on burned areas is not confidently predictable in terms of whether these will lead to an increase or decrease (likelihood between 40 % and 60 %). Our results indicate that the entirety of Amazonia is highly sensitive to minor variations in group-1 variables for ALL (Fig. 10). Nonetheless, the middle and western regions tended to be up to 3 times less sensitive than the rest of the biome. In the Atlantic Forest, approximately 63.33 % of the biome is likely to experience an increase in burned area due to group 1, mostly limited to 1 % extra burning. This small increase highlights that these drivers do not have a major influence with regard to driving high levels of total burned area. A reduction in burned area is observed in the western portion, encompassing 31.79 % of the biome. This biome showed an overall lower sensitivity to climate.
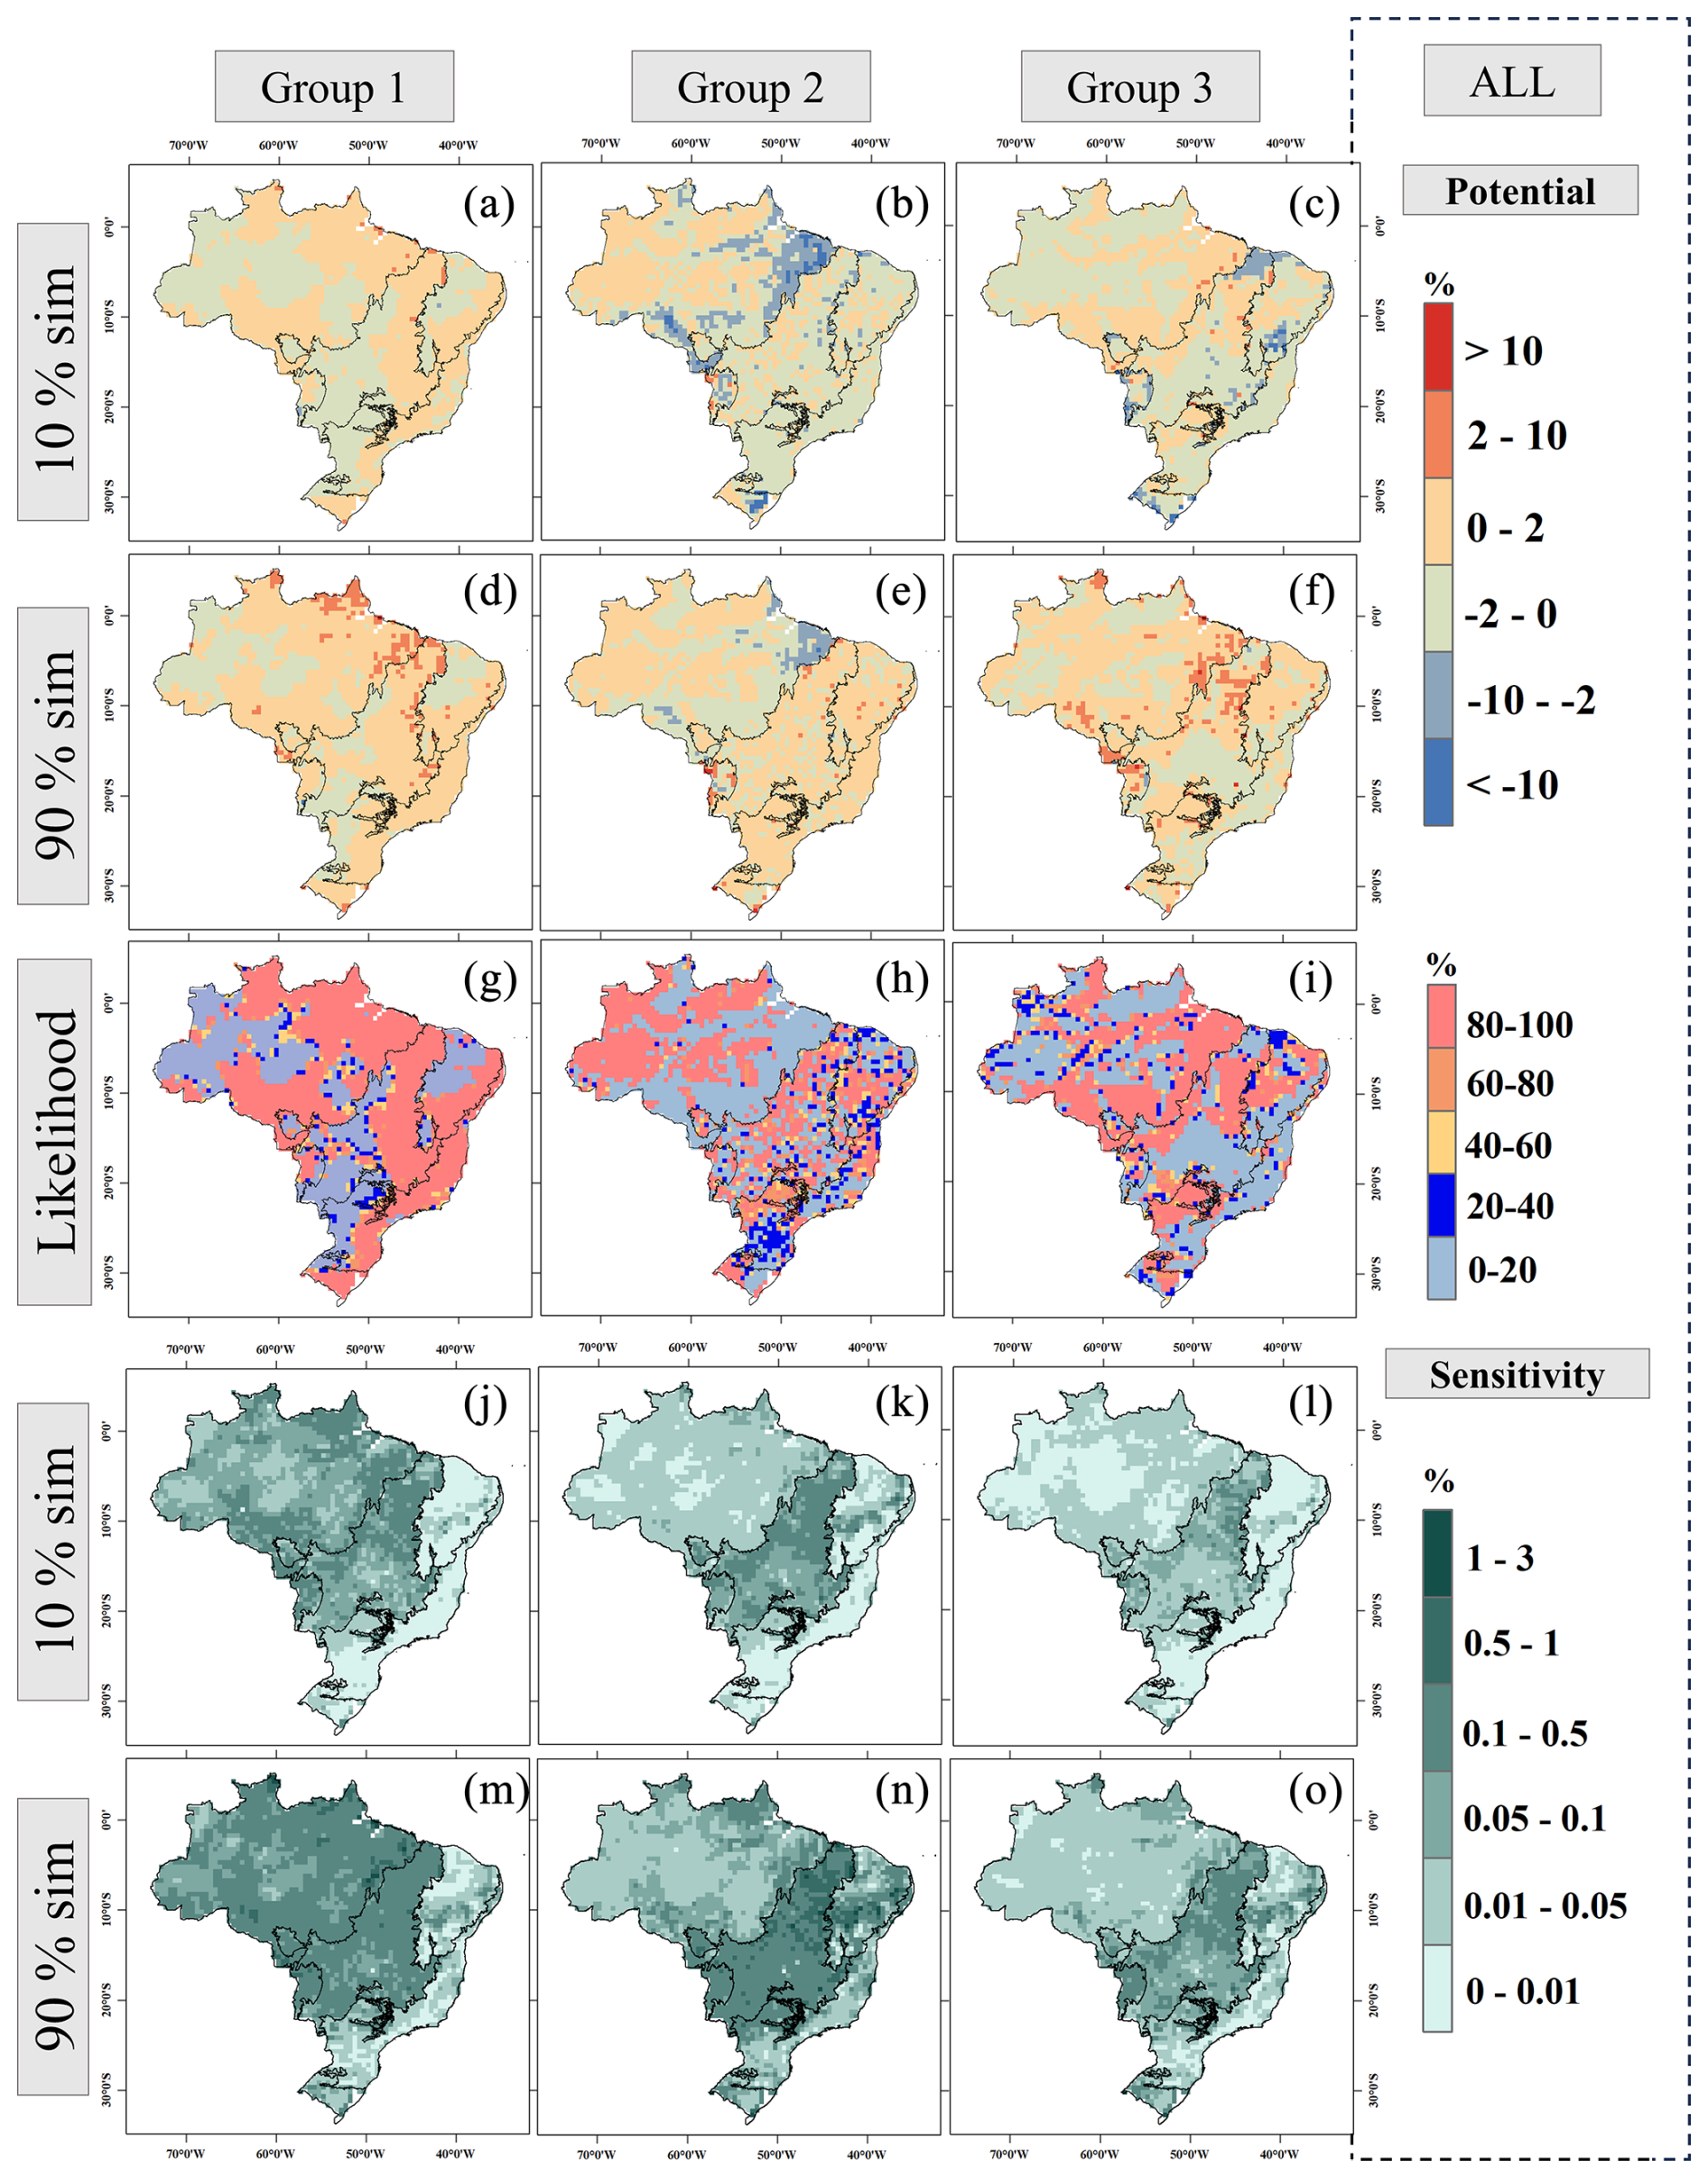
Figure 10Response maps to ALL, displaying the potential's 10th percentile (a–c) and 90th percentile (d–f), the likelihood (g–i), and the sensitivity's 10th percentile (j–l) and 90th percentile (m–o). Each column presents the results for group 1 (maximum temperature and precipitation), group 2 (edge density and road density), and group 3 (forest, pasture, and carbon in dead vegetation) of explanatory variables.
In Cerrado, group 1 is likely to drive burned area in 58.30 % of the biome, primarily in the eastern part. Conversely, 37.16 % of Cerrado is expected to experience a reduced burned area.
For the remaining 4.53 % of the area, the influence of group 1 is less clear as no consistent pattern in terms of increases or decreases in burned area could be detected. Cerrado exhibited high sensitivity to changes in group 1, except in the central region of the biome, which showed comparatively lower sensitivity. In Pantanal, the central and northern areas, accounting for 51.92 % of the total area, are likely to experience an increase in burned area due to variations in group 1. Conversely, the borders of Pantanal, particularly in the south, exhibited a reduction in burned area (42.30 % of Pantanal). The entire biome presented considerable sensitivity to small variations in group 1. Pampa exhibited a high likelihood of increased burned area in 70.14 % of the region, with the western and southeastern edges more sensitive to group 1. The southern and eastern portions of Caatinga are likely to face an increase in burned area in 51.23 % of the biome and a reduction in 47.34 %. In general, the biome showed less sensitivity to group 1, with slightly higher sensitivities being observed in the central and northeastern parts of the biome.
Group 2 (edge density and road density) is likely to drive increased burned area in 47.37 % of Amazonia, mainly in the western, central, and northeastern regions. Conversely, areas with higher edge and road densities show a reduced burned area, covering 51.82 % of Amazonia. Overall, the biome displays moderate sensitivity to minor variations in group 2, with a higher sensitivity being observed along its borders. The response in the Atlantic Forest exhibited more uncertainty in the 10th and 90th percentiles. Still, the likelihood indicates that 42.30 % of the biome is likely to experience increased burned areas of up to 2 %, primarily located along the northern and eastern edges. Regions where increases are more likely also demonstrate greater sensitivity to group 2, showing the potential for these drivers to have a disproportionate influence on extreme levels of burning.
Cerrado exhibited high spatial variability in response to group 2, with a nearly equal mix of pixels where increases (47.28 %) and decreases (44.56 %) in burned area are more likely to occur. The northeast of the biome displayed higher sensitivity to group 2. In Pantanal, the central and southern regions are more likely to experience a decreased burned area, encompassing 53.84 % of the biome. However, an increase is found in 42.30 % of Pantanal. Pantanal demonstrated sensitivity to group 2, especially in the north. In Pampa, 47.76 % of the region exhibit increased burned areas, while reductions occur in 47 % of it. These regions where an increase is likely also showed higher sensitivities. In Caatinga, a reduction in burned area is likely to occur in 50.17 % of the biome, while an increase is expected in 38.86 % of it.
In the context of group-3 explanatory variables (forest, pasture, and carbon in dead vegetation), approximately 53 % of Amazonia is likely to experience larger burned areas, primarily concentrated in the arc of deforestation (along the southern and eastern edges of Amazonia). While displaying less sensitivity to minor changes compared to other groups, certain areas such as the cross-borders with Cerrado and the north exhibit higher sensitivity within the biome. In the Atlantic Forest, increased burned areas are observed in 41.53 % of the region. Decreases are primarily observed in the central southern and eastern areas. Overall, the sensitivity in this biome is lower, although the spatial variation shows heightened sensitivity in the 90th percentile for some pixels across the biome.
In Cerrado, the north and northeast and parts of the south (39.72 % of Cerrado) may experience increased burned areas. Regions with a higher likelihood of increase also demonstrate greater sensitivity to group 3. Pantanal shows an area of approximately 30.77 % that is likely to experience an increase in burned area, mainly in the northern and southeastern regions. The biome demonstrates high sensitivity overall to group 3. In Pampas, 52.23 % of the region is likely to see increased burned areas, with the western part and eastern edges showing greater sensitivity to group 3. In Caatinga, approximately 38.16 % of the biome is likely to see increased burned area. The central and northeastern regions, where increases are expected, also exhibit higher sensitivity to minor shifts in group 3.
Similar spatial patterns compared to ALL were observed for NAT when considering group 1 across all biomes (Fig. 11). In Amazonia, group 1 is likely to result in increased burned area in 63.79 % of the biome. Areas with uncertain responses increased by 2 %, particularly in the southeastern region of Amazonia. Sensitivity analysis reveals that the borders of Amazonia are more sensitive to group 1, whereas areas with forest cover < 83 % (Fig. 3) exhibit lower sensitivity. In the Atlantic Forest, group 1 is likely to drive burned-area increases in 67.95 % of the biome. Conversely, 12.82 % remained unclear, representing an 8 % increase compared to ALL. The sensitivity to group 1 was similar to that in ALL, generally being lower for this biome.
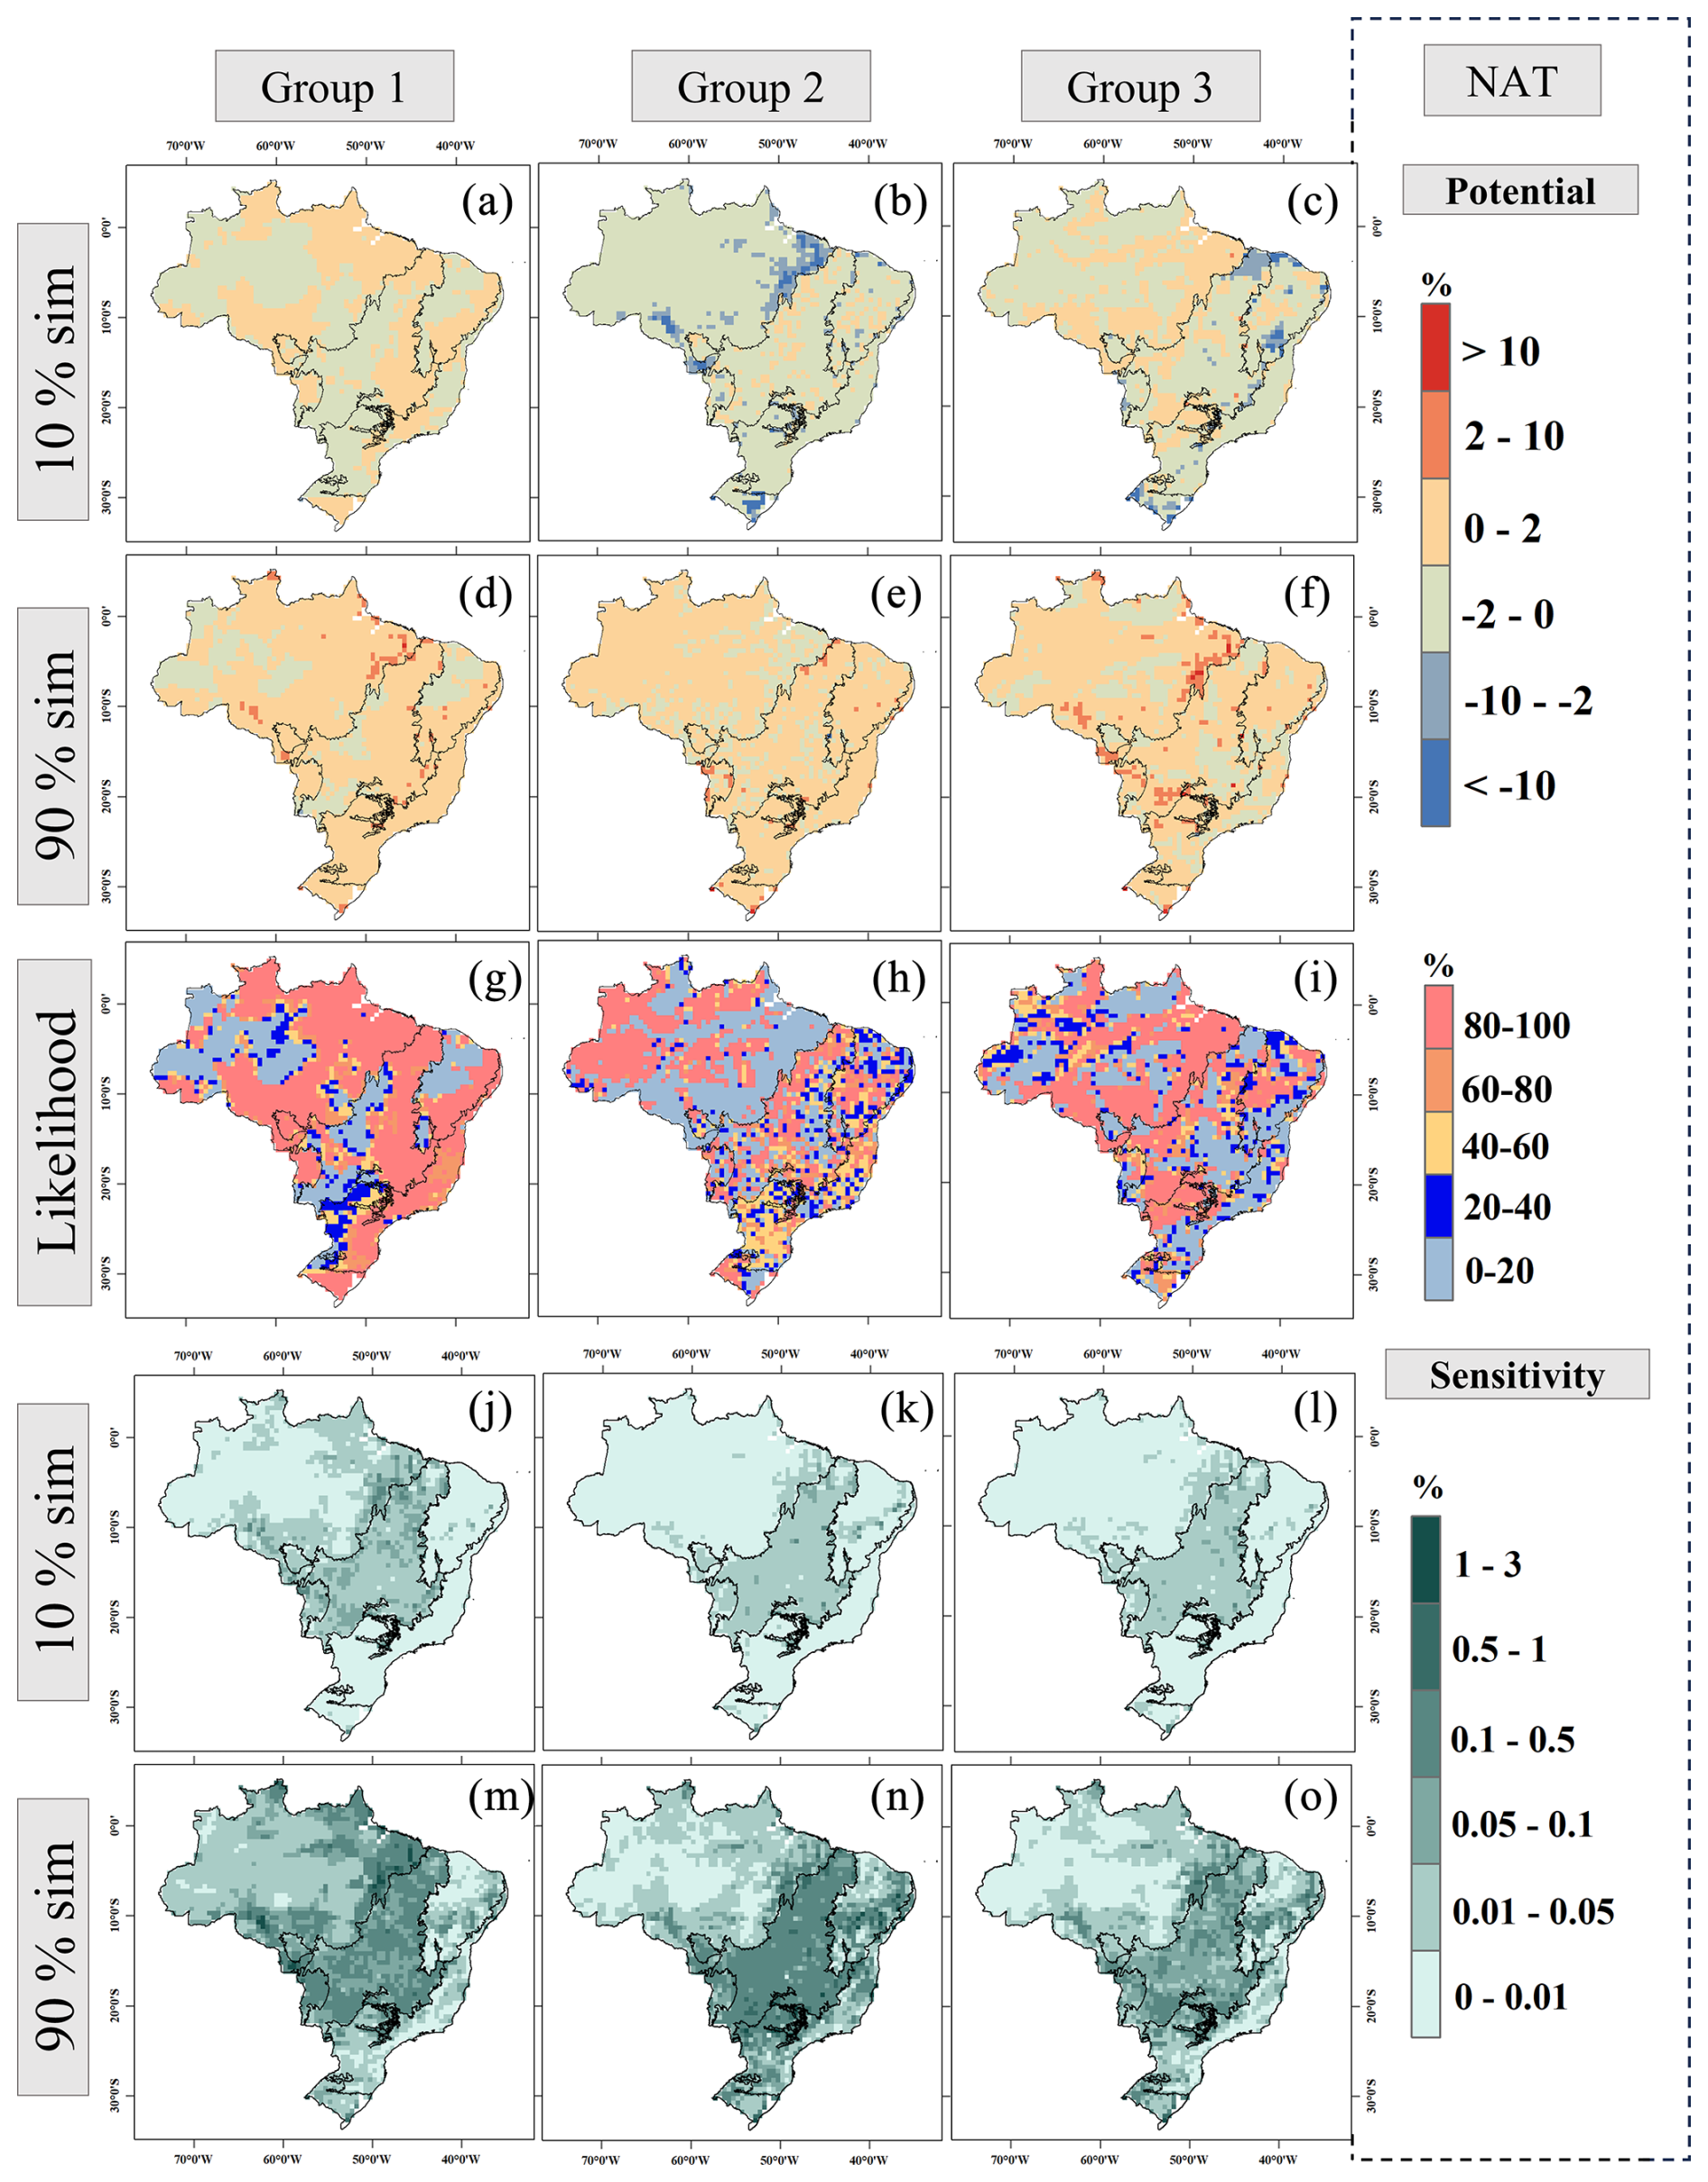
Figure 11Same as Fig. 10 but for NAT.
In Cerrado, group 1 increase burned area in 61.78 % of the biome. The biome also exhibits sensitivity to minor variations in group 1 for NAT, albeit being slightly lower in some areas than in ALL. In Pantanal, 80.76 % of the area is likely to have group-1 variables as drivers of burned area in NAT, representing an increase of almost 30 % compared to ALL. The sensitivity analysis closely resembled ALL, with the entire biome responding significantly to variations in group 1. In Pampas, it is likely that variations from the median lead to increased burning in 70.14 % of the biome. Sensitivity is similar to that in ALL, primarily in the west, but is generally lower. Caatinga follows a similar pattern to ALL, with group 1 influencing burning in 48.76 % of the biome. Uncertainty increased in 4.94 % of the biome, and the sensitivity remained similar, affecting mainly the middle and northeastern regions.
For group 2, Amazonia presented a more uncertain response between the 10th and 90th percentiles. However, the likelihood showed a marked pattern very similar to ALL, where 47.37 % of the biome has group-2 variables as a driver of burning. Similarly to group 1, the sensitivity was lower in highly forested areas. For NAT, the Atlantic Forest showed large areas with an unclear response, covering 41.79 % of the biome. The areas where burning is likely to be driven by group 2 encompasses 26.41 % of the total area, a reduction of 15 % when compared to ALL. The sensitivity was similar to ALL, with slightly higher values in some pixels. Cerrado showed variation within the biome, with 45.61 % of its area identified as potentially being driven by group 2 in NAT. While the sensitivity was lower than in ALL, it remained significant within Cerrado. Pantanal exhibited group-2 variables as a driver of burning in 46.15 % of the biome, displaying a spatial pattern in terms of the likelihood that was very similar to ALL. However, sensitivity was lower in the middle of Pantanal compared to in the north and at the edges. Similarly, Pampa presented a response for potential and sensitivity that was similar to that in ALL, with 47.76 % of the area being likely to experience increased burning driven by group 2. In Caatinga, areas likely to experience increased burning accounted for 37.45 % of the biome, and the regions with unclear responses were 6.72 % higher than in ALL (17.67 %). Sensitivity showed the same pattern as in ALL.
In Amazonia, the areas with unclear responses to group 3 increased from 4 % to 8.10 % in the ALL category. Meanwhile, regions where group 3 is likely to drive an increase in burned area accounted for 54.74 % of the biome. Densely forested areas also exhibited lower sensitivity to minor shifts in group 3. In the Atlantic Forest, group-3 variables are likely to be a driver of burned area in 41.02 % of the biome, very similarly to ALL (41.53 %). The sensitivity followed the spatial pattern as ALL, with an overall lower sensitivity. Areas prone to burning in Cerrado due to group 3 were reduced by 10.84 % compared to in ALL, totalling 43.95 %. The reduction was concentrated in the northeast, while, in the southwest, there was an increase in the likelihood of burning due to group 3. The sensitivity reduced in the northeast, varying across the biome. Within Pantanal, regions susceptible to burning due to group 3 comprised 32.69 % of the area. Regions with an unclear response increased by 4.30 %, encompassing 17.30 % of the region and being concentrated at the eastern edges. In Pampas, 44.77 % of the biome is likely to burn due to group 3. The sensitivity pattern for NAT followed ALL, concentrated at the western and eastern edges. Caatinga accounted for 35.68 % of areas prone to burning, with higher being sensitivities observed in the middle and eastern regions of the biome.
Higher uncertainties were found in the potential response for NON, meaning that the range of possible outcomes was generally larger for this category (Fig. 12). However, the likelihood showed similar spatial variation, although unclear responses increased. Group 1 acts as a driver of burning in 62.99 % of Amazonia, a similar number when compared to NAT and ALL. The main difference for this category is the magnitude of increase, which is higher at the edges and in the middle of the biome. Likewise, the sensitivity was higher, especially in the 90th percentile. The potential and sensitivity response of the Atlantic Forest was quite similar for the three categories, with 64.61 % being likely to have group 1 increasing burning in the biome. Within Cerrado, a 13.15 % and 9.67 % increase in areas susceptible to burning is observed compared to ALL and NAT, respectively (totalling 71.45 %). Unclear responses were higher and reached 9.21 % of the biome. Sensitivity was higher in the northeast of the biome. For Pantanal, NON comprised 69.23 % of areas likely to burn due to group 1. An increase in unclear responses of 7.7 % and 9.62 % compared to ALL and NAT, respectively, was found (totalling 13.45 % of the biome). Sensitivity levels were mostly high across the biome. Within Pampas, 79.10 % of the biome was considered to be likely to burn due to group 1. The sensitivity was larger at the edges of the biome. The potential and sensitivity responses of Caatinga follow a similar pattern between the categories, where 47.70 % of the biome is likely to be susceptible to burning due to group 1.
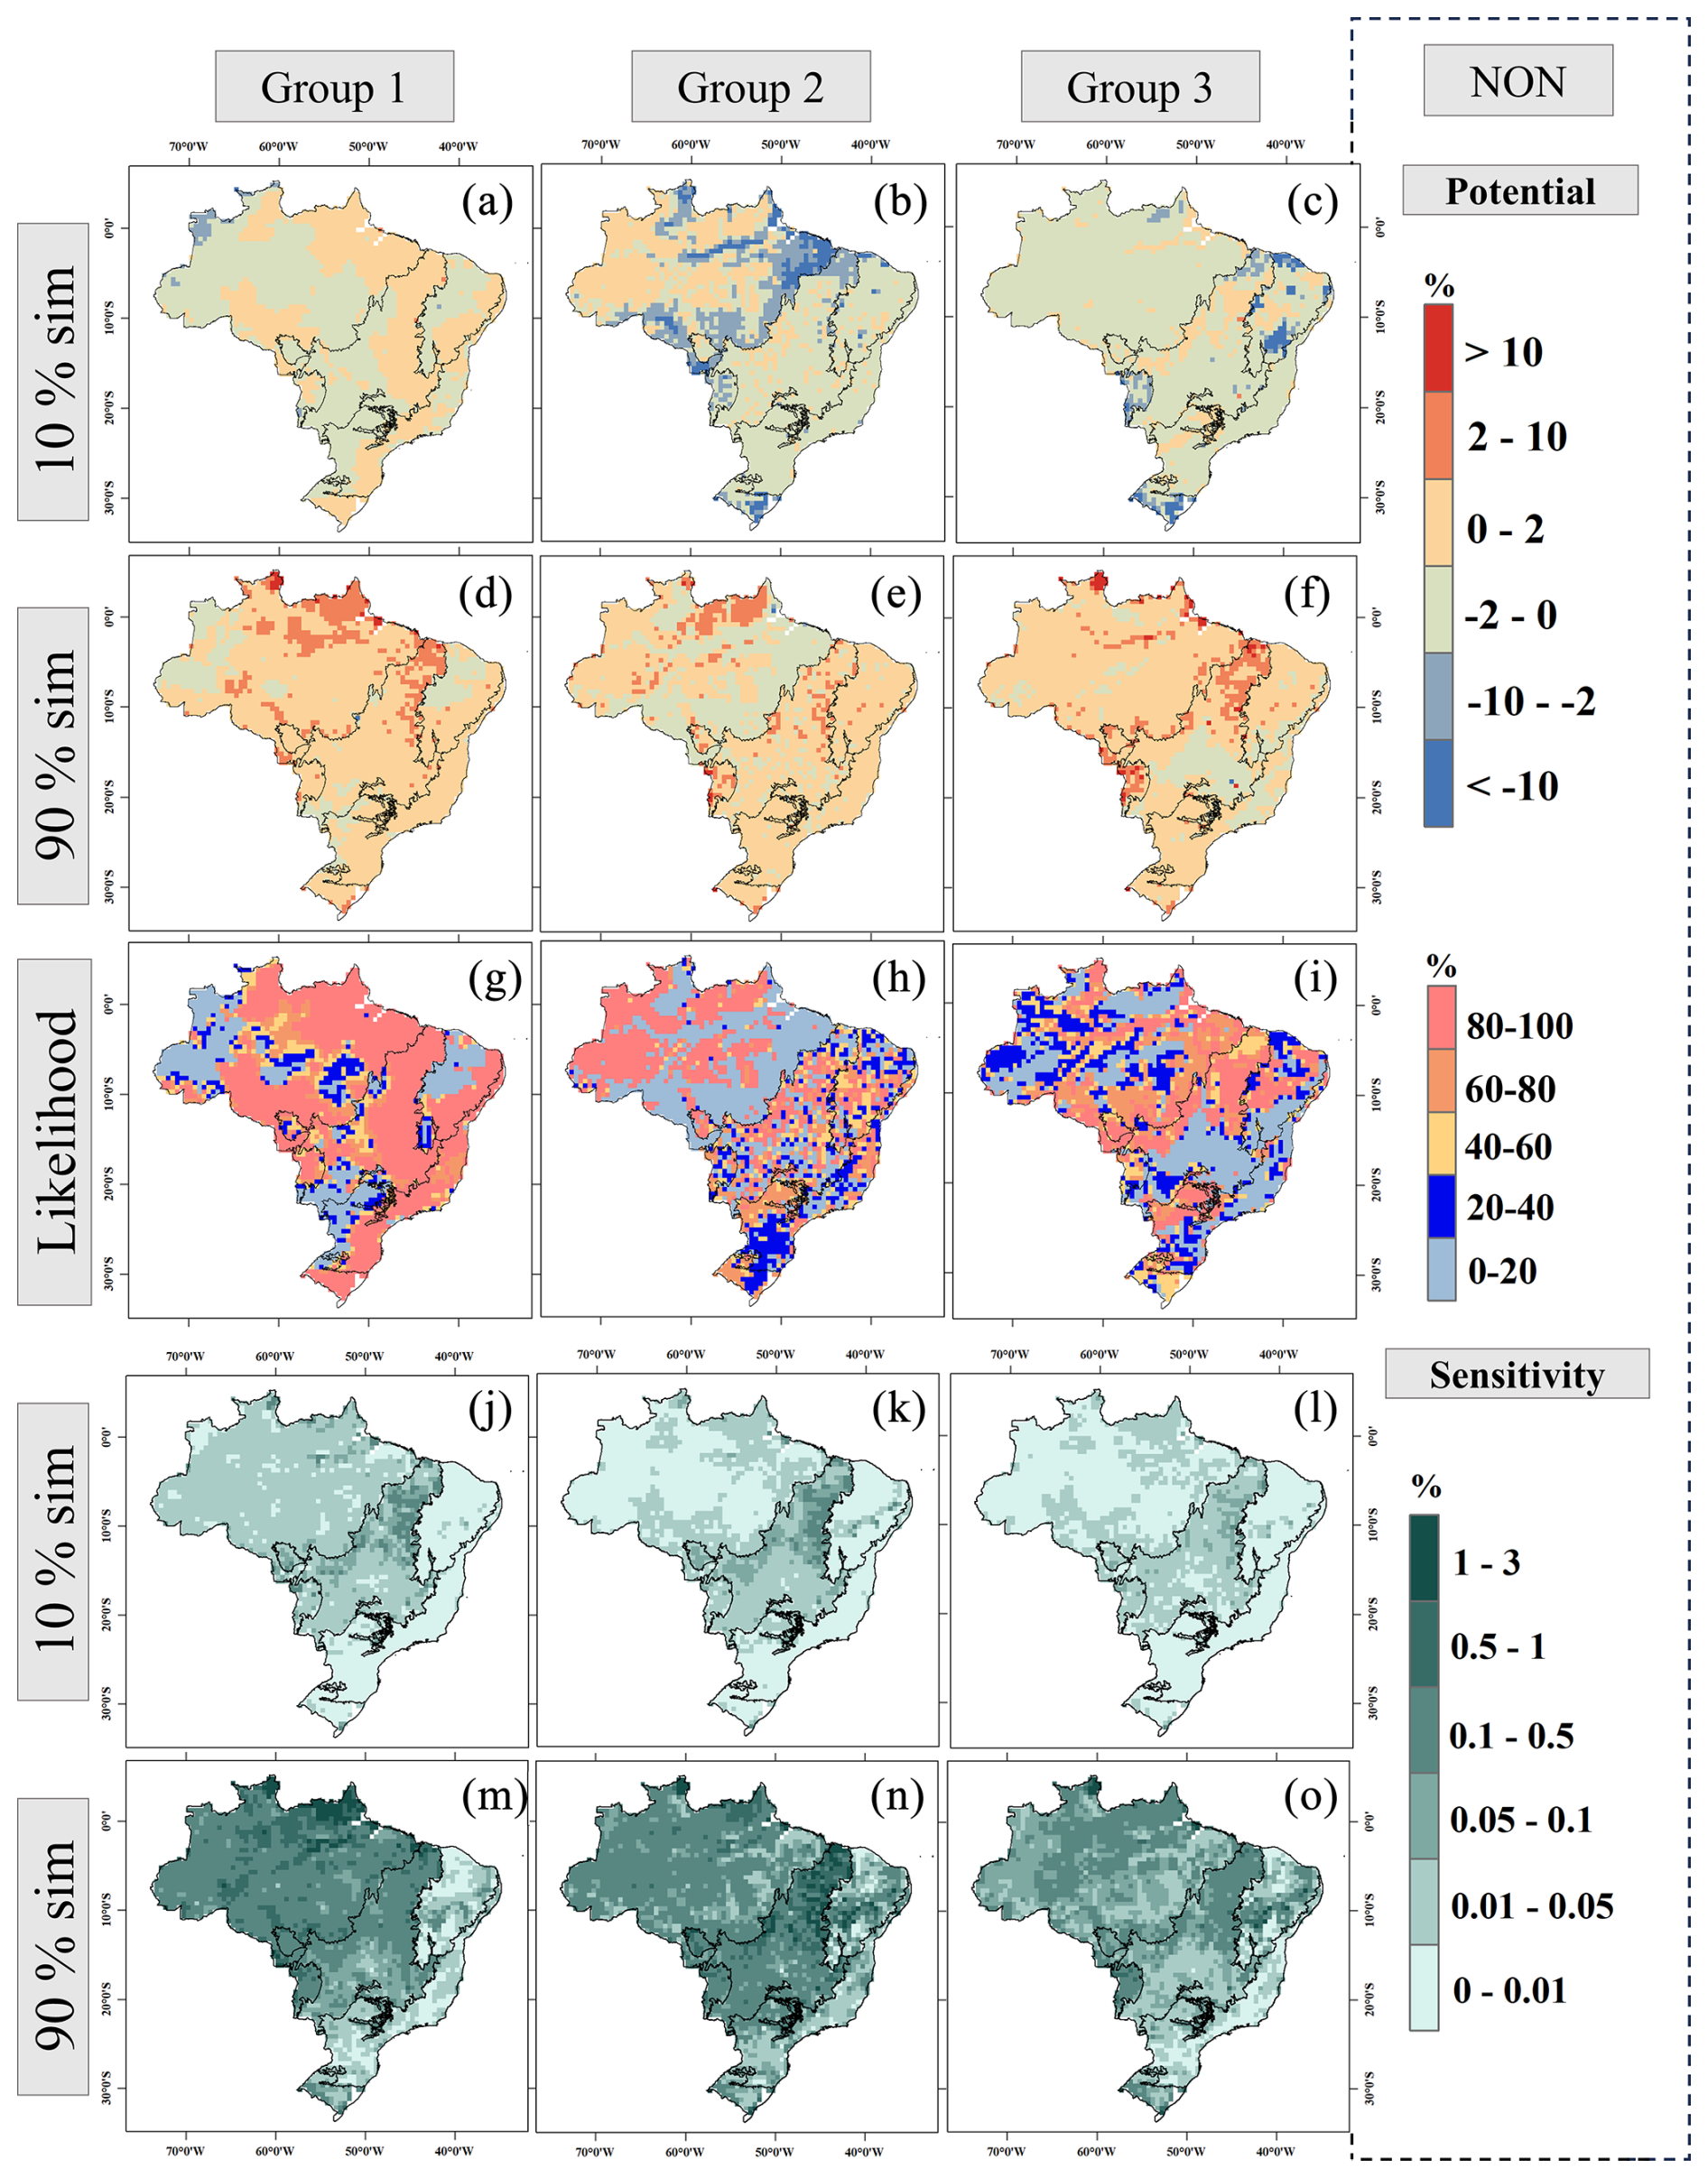
Figure 12Same as Fig. 10 but for NON.
Similarly, the main difference for group 2 in Amazonia was the increase, which reached up to 10 % in the north and middle of the biome. Most of the biome shows high sensitivity. Within the Atlantic Forest, there was a notable reduction of 30.51 % in regions with unclear responses compared to NAT, where the proportion was 11.28 %. Regions likely to see increased burned area due to fragmentation comprise 41.28 % of the biome, an increase of 14.87 % compared to NAT. Sensitivity showed a similar pattern for the three categories, where regions likely to see increased burning presented higher sensitivities. In Cerrado, approximately 41.54 % of the area is likely to be susceptible to increased burning due to group 2. Higher sensitivity was observed in the northeastern region of the biome. Pantanal showed a 40.38 % likely increase and a significant sensitivity across the biome. Pampas patterns for potential and sensitivity responses were similar to ALL and NAT, with 49.25 % of the biome being likely to see increased burning. However, the likelihood was comparatively lower (between 60 % and 80 %). In the case of Caatinga, it is likely to see increased burning in 36.39 % of the biome. Sensitivity displayed a similar pattern to ALL and NAT, with higher sensitivities in the middle and northeast.
Group 3 exhibited higher uncertainties in Amazonia. The likelihood of increase encompasses 44.59 % of the biome, while areas with unclear responses surpass ALL and NAT, comprising 10.21 %. Sensitivity was also higher, especially in the north of Amazonia. The Atlantic Forest showed a similar pattern compared to ALL and NAT, with 38.71 % of its area being likely to see increased burning and with a generally lower sensitivity to this group. Cerrado exhibited a marked pattern, where burning in the north is likely to be driven by group 3, encompassing 40.78 % of the biome. These regions also exhibited higher sensitivity to group-3 variables. This group exhibited the highest level of unclear responses in Pantanal, totalling 30.77 %. Meanwhile, regions with a likelihood of increased burning decreased to 25 %. The sensitivity was generally high across the biome. This group was also shown to be highly uncertain in Pampas (55.22 %). The areas likely to see increased burning comprised 23.88 % of Pampa, a reduction of 28.35 % and 20.89 % compared to ALL and NAT, respectively. The sensitivity was similar in the three categories, with slightly higher sensitivity in the middle for NON. The Caatinga region exhibited a 35.33 % portion of its area with a heightened likelihood of increased burning attributed to group 3, displaying a similar pattern across all three categories concerning potential and sensitivity response.
4.1 FLAME's performance in context
Our proposed model uniquely combines two previously distinct approaches employed in fire modelling: Bayesian inference and maximum entropy (Kelley et al., 2021; Ferreira et al., 2023). This combination allows for a more comprehensive understanding of fire dynamics as it models a probability distribution rather than singular values, a departure from conventional models (e.g. Bistinas et al., 2014; Haas et al., 2022). Notably, our approach employs maximum entropy to capture the most uncertain outcomes that align with our priors, reflecting the stochastic nature of real-world fires. This concept contributes to a more nuanced and realistic representation of fire behaviour. We conducted our analysis by categorising the burned area into three categories: burned areas in both natural and non-natural vegetation (ALL), burned areas in natural vegetation (NAT), and burned areas in non-natural vegetation (NON). This classification yielded distinct results for each category, with an overall improvement across the biomes for NAT and NON. Moreover, this approach allows us to make more targeted conclusions.
The results demonstrate the robust performance of our model in capturing observations while providing a range of possible outcomes represented by the 10th and 90th percentiles. It is noteworthy that the model was capable of reproducing the observations in Pampa, the Atlantic Forest, and Caatinga as these are areas where other methods used in previous studies have not performed well (Nogueira et al., 2017; Oliveira et al., 2022). Despite some level of bias in the results, even during periods of suboptimal performance, the likelihood of the observations remained consistently high, with the majority exceeding 80 %. The Pantanal biome presented an exception, displaying a likelihood of 59 % for the combined category (ALL), with improvements for specific categories, reaching 86 % for NAT and 78 % for NON. This biome encompasses a mosaic of vegetation types characterised by seasonally flooded areas, which play an important role in the fire dynamics of the region (Damasceno-Junior et al., 2022). Fire in these areas was not included in this study due to our general approach, posing a limitation for simulation within this biome. However, our framework's adaptability means that future work could look at different explanatory variables, relationships, and fire categorisations that could target performance in places like Pantanal.
The MaxEnt species distribution model, widely used in fire modelling (e.g. Fonseca et al., 2017; Banerjee, 2021; Ferreira et al., 2023), applies the same maximum entropy concept as in this study. However, MaxEnt's default settings, based on average values, may not suit specific species, regions, or datasets (Phillips and Dudik, 2008) and can result in overly complex models prone to overfitting (Radosavljevic and Anderson, 2013). While independent evaluation data are essential (Peterson et al., 2011), many studies rely on random partitions of occurrence data for calibration and validation (Chen et al., 2015; Göltas et al., 2024), which can compromise model reliability and generality. In contrast, our approach incorporates an independent evaluation framework designed to assess the model's capacity to capture unseen dynamics and to simulate scenarios beyond the observed data. Furthermore, the commonly used the area-under-the-curve (AUC) metric, while widely adopted, fails to provide insights into the spatial distribution of model performance (Lobo et al., 2008; Jiménez-Valverde, 2011). Here, we developed a targeted evaluation analysis to assess model performance spatially.
Currently, global fire models incompletely reproduce the observed spatial patterns of burned area. We found that FLAME captures high burned area, albeit not with the exact magnitude observed. This ability presents an advantage compared to many process-based fire models. While global fire modelling provides useful information on broad-scale patterns and trends, it is mostly designed to estimate global mean burned area (Hantson et al., 2016; Burton and Lampe et al., 2024). As a result, its applicability to regional scales, such as the Brazilian biomes, is inherently limited. These models often rely on assumptions about the relationships between explanatory variables, which may not hold true in all locations due to variations in environmental conditions, ecosystem dynamics, and human activities. Additionally, while fire-enabled Earth system models can integrate feedback mechanisms between land and atmosphere, therefore enabling the evaluation of inter-variable effects, offline global fire models do not do this. Similarly, FLAME is not designed to capture these feedbacks, underscoring the need for tailored methodologies to address specific research questions.
4.2 Burning controls across the biomes
We combined our explanatory variables into three groups to assess their compound effect on the burned area. This is a similar approach to that of Kelley et al. (2019), who also used a Bayesian framework to assess drivers of global fire regimes. Nonetheless, Kelley et al. (2019) considered only linear responses, which is especially challenging when considering the varying responses across the globe. Our results highlighted the spatial variability of each explanatory variable group's influence on burning within and between each biome. The potential response displayed similar spatial likelihood variations between the ALL, NAT, and NON categories. However, differences were still observed, especially for the fire-dependent biomes (Cerrado and Pantanal). Overall, the uncertainties were larger for the NON category, particularly for Pampas and Pantanal.
For example, group-1 variables (maximum temperature and precipitation) are likely to be drivers of burning in large portions of each biome during the fire peak, as demonstrated by the potential and sensitivity results. Our results indicate that, in highly forested areas in Amazonia, climate alone does not control burning, suggesting that forests can potentially mitigate the effects of climate in burned areas. These regions showed up to 3 times less sensitivity to minor variations in climate for NAT, while ALL and NON displayed high sensitivity in the whole biome. However, natural landscapes, especially forests, are highly susceptible during extreme weather conditions (Dos Reis et al., 2021; Barbosa et al., 2022). This suggests that, while natural vegetation may mitigate sensitivity to minor climate variations, projected climate change could greatly increase the risk of Amazonia forest fires (Flores et al., 2024). Moreover, non-natural vegetation in Amazonia is mainly concentrated in the arc of deforestation, reducing the samples for this category in other parts of Amazonia and potentially influencing the model's response. In this sense, dividing Amazonia into subregions, specifically separating the region where the most deforestation occurs, could improve the model's regional estimates and is a recommended approach for future Amazonia-focused research.
An opposite dynamic was found in Cerrado and Pantanal. Regions with large areas of natural vegetation were more likely to be influenced by climate. These regions were more sensitive to minor variations in climate for NON in Cerrado, while the entirety of Pantanal displayed similar sensitivity in the three categories. This aligns with prior research showing that fires in Cerrado are linked with meteorological conditions, particularly rainfall and temperature (Nogueira et al., 2017; Libonati et al., 2022a; Li et al., 2022). Similarly, in Pantanal, the 2020 fire season revealed the connections between meteorological conditions and increased burning in the biome (Barbosa et al., 2022; Libonati et al., 2022b), and this was seen once again during the 2023 El Niño. Barbosa et al. (2022) reported that 84 % of the 2020 record of fires in Pantanal occurred in natural vegetation, with a 514 % increase from the average within forests. Although land use changes played a role, the precipitation and maximum temperature anomalies were particularly high in 2020, contributing to the spread of fires into fire-sensitive vegetation.
Group 2 (edge density and road density) encompasses explanatory variables expected to have uncertain responses across the biomes. Within Cerrado, 40.63 % of the area will likely see decreased burned area for NAT due to group-2 variables. A high density of forest edges has been associated with a higher incidence of fires in forest ecosystems (Armenteras et al., 2013; Silva Junior et al., 2022). However, fragmentation can also act as a barrier to fire spread, potentially reducing fire occurrences (Driscoll et al., 2021). Rosan et al. (2022) revealed that, in Cerrado, fragmentation is correlated with a decrease in burned-area fraction, while, in Amazonia, it is linked to an increase in burning. Nevertheless, we found a decrease in burning where edge densities are concentrated in Amazonia. This could indicate that the edges of Amazonia reach levels of fragmentation that may act as firebreaks, thereby impeding fires from spreading, particularly due to the reduction in aboveground biomass near forest edges (Numata et al., 2017). However, further research is needed to test this hypothesis.
Depending on the landscape, road densities can also exhibit contrasting relationships with fires. While more fires are expected surrounding roads (Armenteras et al., 2017), fewer fires are expected with increased density due to urbanisation. The Atlantic Forest is a very fragmented biome with very high densities of natural edges and roads (Fig. 3). We found an uncertain response for NAT in 41.79 % of the Atlantic Forest, and only 26.41 % of the area showed likely increases. Singh and Huang (2022) suggest that the fragmentation partly explains burned-area variation in the Atlantic Forest, where small patches are more vulnerable to fires. The majority of Caatinga is likely to see decreased burning due to group 2. However, the sensitivity was up to 3 times higher in the middle and northeast, which is more likely to increase. Antongiovanni et al. (2020) discussed the fact that fires in Caatinga occur at all edge distances, although they are slightly more frequent at fragment edges. Nonetheless, the limited number of studies across the different biomes addressing these relationships makes it harder to understand the related uncertainties.
Group 3 (forest, pasture, and carbon in dead vegetation) is likely to influence burning in 54.74 % of Amazonia for NAT, particularly in the arc of deforestation. This suggests that the combination of less forest, increased pasture, and more fuel (Fig. 3) increases burning in natural lands in Amazonia, corroborating previous findings (Silveira et al., 2020; Silveira et al., 2022). The relationship in Pantanal and Pampa showed that these variables increase burning in 32.69 % (NAT) and 25 % (NON) of the area in Pantanal and in 44.78 % (NAT) and 23.88 % (NON) of the area in Pampas. The regions with unclear responses were the highest for NON at 30.77 % of Pantanal and 55.22 % of Pampa. These biomes are characterised by lower forest and pasture cover (Fig. 3), with fires and cattle ranching mainly being linked to grasslands (Barbosa et al., 2022; Fidelis et al., 2022; Chiaravalloti et al., 2023). Thus, incorporating grassland cover in the model will likely reveal further relationships between burned area and LULC in these biomes. Caatinga showed increased sensitivity, where group 3 is likely to increase burning, matching the area of influence of group 2. This area is associated with low forest cover and carbon in dead vegetation and moderate pasture cover. De Araújo et al. (2012) observed that, due to the intermittent and scattered characteristics of cattle ranching in Caatinga, fires tend to occur mainly in natural vegetation, characterised by a large cover of savanna vegetation. Although our study provides a general overview of burning dynamics in the biomes, targeting variables is highly recommended for future studies, especially where fires are poorly understood, such as in Caatinga.
4.3 FLAME potentialities
Further developments are recommended to improve FLAME's capabilities. We tested the model with different numbers of predictors and observed that, although adding more variables reduced uncertainties in burned-area simulations, it increased uncertainties in the variables' responses. Future work could explore and incorporate better-informed and additional priors when introducing additional predictors, which we did not address in this study. Utilising alternative metrics to assess drivers, particularly those tailored to specific biomes, could offer a more nuanced understanding of the influencing factors. For example, future work could explore the potential response to estimate thresholds that trigger increased burning or to develop metrics specifically aimed at extreme fire events. Customising explanatory variable selection based on biome characteristics would contribute to a more contextually relevant analysis and could help reduce biases in biomes with unique ecological characteristics, such as Pantanal. In addition, including lagged climate variables is important to account for fuel moisture memory effects, and future research can explore their integration to improve the model's accuracy.
Consideration of different fire categories shows how the model could be used in further research. For instance, a more detailed stratification could involve categorising fires into distinct groups such as forest, agricultural, and deforestation fires. Although deforestation is a significant driver of fires in many regions in Brazil, we chose to exclude this from our analysis because it is not the only human-caused fire issue in Brazil, and it is not the primary driver in all biomes. For instance, fires in Pantanal are more strongly associated with the flood pulse levels (Damasceno-Junior et al., 2022) combined with human activities but not necessarily deforestation. In addition, in the Atlantic Forest, deforestation is not strongly linked to present-day fire activity (De Praga Baião et al., 2023). Even in the Amazon, fires are not always directly associated with increased deforestation (De Oliveira et al., 2023). One potential application of our model is to explore the relationship between deforestation and fires in future work. The primary aim of this study, however, was to document the model rather than to analyse all drivers of fires across the country.
Furthermore, accounting for the varying proportions of natural and non-natural lands within each pixel, as demonstrated in this study, provides a more accurate landscape representation. This contributes to improved simulations where these areas are very small. Finer grids and the subdivision of the biomes may uncover local processes, though eventually fire spread at finer scales would need to be considered. Understanding the factors that drive fires could be crucial for improving the model's predictive capabilities. Previous modelling attempts often parameterise on a large regional basis. However, our approach allows for optimisation based on much smaller areas while still quantifying the confidence in the analysis. FLAME is flexible enough to be used in various locations and, through targeted benchmarking, holds the potential to evaluate extreme fires and the inter-annual and seasonal variability of fires, to project future fires, and to simulate other hazards. With appropriate adaptations and enhancements, FLAME has the potential to evolve into a robust model capable of simulating terrestrial impacts effectively.
The self-reinforcing cycle between fires and climate change is fundamental in improving fire simulations. An understanding of what drives fires is essential for devising mitigation and adaptation strategies. However, this can be particularly challenging due to the intricate interplay of various factors, especially in a diverse country like Brazil. We propose a novel approach for simulating burned area in the Brazilian biomes that keeps assumptions at a minimum whilst quantifying uncertainties. The model performs well in all biomes and enables the assessment of fire categories and the grouped effect of explanatory variables. Furthermore, conventional modelling efforts often parameterise at a large scale. FLAME enables optimisation in smaller areas while still providing a means to quantify confidence in the analysis.
Climate is an important factor in burned area in all biomes. Despite several studies showing this relationship, climate-related uncertainties have not been extensively quantified, a gap the current research fills. Groups 2 (road and edge densities) and 3 (forest, pasture, and carbon in dead vegetation) and the NON category showed the highest uncertainties among the responses. This highlights the challenge in modelling human-related factors. Pantanal, Cerrado, and Amazonia showed a higher sensitivity to minor variations in the explanatory variables. It is important to note that sensitivity is more important where burning is already high, which is the case in these biomes (Alencar et al., 2022). None of the groups drive huge changes in burned area in the Atlantic Forest. However, since this biome is fire-sensitive, even small changes in burned area can have a substantial impact on its ecosystems. Uncertain responses compound the complexity of burned-area drivers as different explanatory variables interact uniquely within each biome. The same vegetation type may show contrasting responses to the same drivers in different locations. Therefore, no universal fire management policies will fit the whole country. In particular, Caatinga, the Atlantic Forest, and Pampa require further investigation. Emphasising regional-scale analysis is crucial for decision-makers and fire management strategies, enabling more informed and effective prevention of fires.
The FLAME 1.0 model code is available at https://doi.org/10.5281/zenodo.13367375 (Barbosa et al., 2024a).
The data supporting this study are available from the Zenodo repository: https://doi.org/10.5281/zenodo.11491125 (Barbosa et al., 2024b).
The supplement related to this article is available online at https://doi.org/10.5194/gmd-18-3533-2025-supplement.
Conceptualisation: MLFB, DIK, CAB, and LOA. Data curation: MLFB, DIK, and AB. Formal analysis: MLFB and DIK. Methodology: MLFB, DIK, and CAB. Resources and software: MLFB, DIK, and CAB. Visualisation: MLFB and RMdV. Funding acquisition: MLFB and LOA. Supervision: LOA, DIK, and CAB. Resources: LOA, DIK, and CAB. Writing (original draft preparation): MLFB. Writing (review and editing): MLFB, IJMF, RMdV, AB, and PGM. All of the co-authors approved the draft.
The contact author has declared that none of the authors has any competing interests.
Publisher's note: Copernicus Publications remains neutral with regard to jurisdictional claims made in the text, published maps, institutional affiliations, or any other geographical representation in this paper. While Copernicus Publications makes every effort to include appropriate place names, the final responsibility lies with the authors.
We thank Eleanor Burke (UK Met Office) for the original JULES-ES simulations. We thank Tristan Quaife (University of Reading) for the supervisor support. We thank Eddy Roberton (UK Met Office) for the support and discussions regarding this research.
Douglas I. Kelley was supported by the Natural Environment Research Council as part of the LTSM2 TerraFIRMA project and the NC-International programme (grant no. NE/X006247/1) delivering National Capability. This work and its contributors (Chantelle A. Burton and Anna Bradley) were funded by the Met Office Climate Science for Service Partnership (CSSP) Brazil project, which is supported by the Department for Science, Innovation and Technology (DSIT). Liana O. Anderson acknowledges support from the São Paulo Research Foundation (FAPESP) (project nos. 2021/07660-2 and 2020/16457-3) and by the National Council for Scientific and Technological Development (CNPq) (project no. 409531/2021-9) and its productivity scholarship (grant no. 314473/2020-3). Maria Lucia Ferreira Barbosa and Igor J. M. Ferreira were supported by the Coordination for the Improvement of Higher Education Personnel (CAPES) under finance code 001. Maria Lucia Ferreira Barbosa and Paulo Guilherme Molin acknowledge support from the São Paulo Research Foundation (FAPESP) (project no. 2021/11940-0). Renata Moura da Veiga thanks the São Paulo Research Foundation (FAPESP) for grant nos. 2020/06470-2 and 2022/13322-5.
This research has been supported by the Coordenação de Aperfeiçoamento de Pessoal de Nível Superior (grant no. 001), the Natural Environment Research Council (grant no. NE/X006247/1), the Fundação de Amparo à Pesquisa do Estado de São Paulo (grant nos. 2021/07660-2, 2020/16457-3, 2021/11940-0, 2020/06470-2, and 2022/13322-5), and the Conselho Nacional de Desenvolvimento Científico e Tecnológico (grant no. 409531/2021-9).
This paper was edited by Sam Rabin and reviewed by two anonymous referees.
Abril-Pla, O., Andreani, V., Carroll, C., Dong, L., Fonnesbeck, C. J., Kochurov, M., Kumar, R., Lao, J., Luhmann, C. C., Martin, O. A., Osthege, M., Vieira, R., Wiecki, T., and Zinkov, R.: PyMC: A Modern and Comprehensive Probabilistic Programming Framework in Python, Comput. Sci., 9, e1516, https://doi.org/10.7717/peerj-cs.1516, 2023.
Alencar, A. A., Arruda, V. L., Silva, W. V. D., Conciani, D. E., Costa, D. P., Crusco, N., Duverger, S. G., Ferreira, N. C., Franca-Rocha, W., Hasenack, H., and Martenexen, L. F. M.: Long-term Landsat-based monthly burned area dataset for the Brazilian biomes using deep learning, Remote Sens., 14, 2510, https://doi.org/10.3390/rs14112510, 2022.
Alvarado, S. T., Andela, N., Silva, T. S. F., and Archibald, S.: Thresholds of fire response to moisture and fuel load differ between tropical savannas and grasslands across continents, Global Ecol. Biogeogr., 29, 331–344, https://doi.org/10.1111/geb.13034, 2020.
Andela, N., Morton, D. C., Giglio, L., Chen, Y., Van Der Werf, G. R., Kasibhatla, P. S., Defries, R. S., Collatz, G. J., Hantson, S., Kloster, S., and Bachelet, D.: A human-driven decline in global burned area, Science, 356, 1356–1362, https://doi.org/10.1126/science.aal4108, 2017.
Antongiovanni, M., Venticinque, E. M., Matsumoto, M., and Fonseca, C. R.: Chronic anthropogenic disturbance on Caatinga dry forest fragments, J. Appl. Ecol., 57, 2064–2074, https://doi.org/10.1111/1365-2664.13686, 2020.
Aragão, L. E. O., Malhi, Y., Barbier, N., Lima, A., Shimabukuro, Y., Anderson, L., and Saatchi, S.: Interactions between rainfall, deforestation and fires during recent years in the Brazilian Amazonia, Philos. Trans. R. Soc. B Biol. Sci., 363, 1779–1785, https://doi.org/10.1098/rstb.2007.0026, 2008.
Armenteras, D., González, T. M., and Retana, J.: Forest fragmentation and edge influence on fire occurrence and intensity under different management types in Amazon forests, Biol. Conserv., 159, 73–79, https://doi.org/10.1016/j.biocon.2012.10.026, 2013.
Armenteras, D., Barreto, J. S., Tabor, K., Molowny-Horas, R., and Retana, J.: Changing patterns of fire occurrence in proximity to forest edges, roads and rivers between NW Amazonian countries, Biogeosciences, 14, 2755–2765, https://doi.org/10.5194/bg-14-2755-2017, 2017.
Banerjee, P.: Maximum entropy-based forest fire likelihood mapping: analysing the trends, distribution, and drivers of forest fires in Sikkim Himalaya, Scand. J. For. Res., 36, 275–288, https://doi.org/10.1080/02827581.2021.1918239, 2021.
Barbosa, M. L. F., Delgado, R. C., Teodoro, P. E., Pereira, M. G., Correia, T. P., de Mendonça, B. A. F., and Ávila Rodrigues, R. D.: Occurrence of fire foci under different land uses in the State of Amazonas during the 2005 drought, Environ. Develop. Sustain., 21, 2707–2720, https://doi.org/10.1007/s10668-018-0157-4, 2019.
Barbosa, M. L. F., Haddad, I., da Silva Nascimento, A. L., Maximo da Silva, G., Moura da Veiga, R., Hoffmann, T. B., Rosane de Souza, A., Dalagnol, R., Susin Streher, A., Souza Pereira, F. R., and Oliveira e Cruz de Aragão, L. E.: Compound impact of land use and extreme climate on the 2020 fire record of the Brazilian Pantanal, Global Ecol. Biogeogr., 31, 1960–1975, https://doi.org/10.1111/geb.13563, 2022.
Barbosa, M. L. F., Kelley, D., Burton, C., and Anderson, L.: FLAME 1.0: Fogo local analisado pela Máxima Entropia (v0.1), Zenodo [code], https://doi.org/10.5281/zenodo.13367375, 2024a.
Barbosa, M. L. F, Kelley, D., Bradley, A., and Burton, C.: FLAME 1.0: a novel approach for modelling burned area in the Brazilian biomes using the Maximum Entropy concept, Zenodo [data set], https://doi.org/10.5281/zenodo.11491125, 2024b.
Bistinas, I., Harrison, S. P., Prentice, I. C., and Pereira, J. M. C.: Causal relationships versus emergent patterns in the global controls of fire frequency, Biogeosciences, 11, 5087–5101, https://doi.org/10.5194/bg-11-5087-2014, 2014.
Burton, C., Betts, R., Cardoso, M., Feldpausch, T. R., Harper, A., Jones, C. D., Kelley, D. I., Robertson, E., and Wiltshire, A.: Representation of fire, land-use change and vegetation dynamics in the Joint UK Land Environment Simulator vn4.9 (JULES), Geosci. Model Dev., 12, 179–193, https://doi.org/10.5194/gmd-12-179-2019, 2019.
Burton, C., Kelley, D. I., Jones, C. D., Betts, R. A., Cardoso, M., and Anderson, L.: South American fires and their impacts on ecosystems increase with continued emissions, Clim. Resil. Sustain., 1, e8, https://doi.org/10.1002/cli2.8, 2022.
Burton, C., Lampe, S., Kelley, D. I., Thiery, W., Hantson, S., Christidis, N., Gudmundsson, L., Forrest, M., Burke, E., Chang, J., and Huang, H.: Global burned area increasingly explained by climate change, Nat. Clim. Chang., 14, 1186–1192, https://doi.org/10.1038/s41558-024-02140-w, 2024.
Campanharo, W. A., Lopes, A. P., Anderson, L. O., da Silva, T. F., and Aragão, L. E.: Translating fire impacts in Southwestern Amazonia into economic costs, Remote Sens., 11, 764, https://doi.org/10.3390/rs11070764, 2019.
Cano-Crespo, A., Oliveira, P. J., Boit, A., Cardoso, M., and Thonicke, K.: Forest edge burning in the Brazilian Amazon promoted by escaping fires from managed pastures, J. Geophys. Res.-Biogeo., 120, 2095–2107, https://doi.org/10.1002/2015JG002914, 2015.
Cano-Crespo, A., Traxl, D., Prat-Ortega, G., Rolinski, S., and Thonicke, K.: Characterization of land cover-specific fire regimes in the Brazilian Amazon, Reg. Environ. Change, 23, 19, https://doi.org/10.1007/s10113-022-02012-z, 2023.
Cecil, D. J.: LIS/OTD 0.5 degree high resolution monthly climatology, NASA Global Hydrometeorology Resource Center DAAC [data set], https://doi.org/10.5067/LIS/LIS-OTD/DATA311, 2006.
Chen, F., Du, Y., Niu, S., and Zhao, J.: Modeling forest lightning fire occurrence in the Daxinganling Mountains of Northeastern China with MAXENT, Forests, 6, 1422–1438, https://doi.org/10.3390/f6051422, 2015.
Chen, X., Dimitrov, N. B., and Meyers, L. A.: Uncertainty analysis of species distribution models, PLoS One, 14, e0214190, https://doi.org/10.1371/journal.pone.0214190, 2019.
Chiaravalloti, R. M., Tomas, W. M., Akre, T., Morato, R. G., Camilo, A. R., Giordano, A. J., and Leimgruber, P.: Achieving conservation through cattle ranching: the case of the Brazilian Pantanal, Conservation Science and Practice, 1–11, https://doi.org/10.1111/csp2.13006, 2023.
Damasceno-Junior, G. A., Pereira, A. d. M. M., Oldeland, J., Parolin, P., and Pott, A.: Fire, Flood and Pantanal Vegetation, in: Flora and Vegetation of the Pantanal Wetland, Plant and Vegetation, edited by: Damasceno-Junior, G. A. and Pott, A., Springer, Cham, vol. 18, https://doi.org/10.1007/978-3-030-83375-6_18, 2022.
De Araújo, F. M., Ferreira, L. G., and Arantes, A. E.: Distribution patterns of burned areas in the Brazilian biomes: An analysis based on satellite data for the 2002–2010 period, Remote Sens., 4, 1929–1946, 2012.
De Oliveira, G., Mataveli, G., Stark, S. C., Jones, M. W., Carmenta, R., Brunsell, N. A., Santos, C. A., da Silva Junior, C. A., Cunha, H. F., da Cunha, A. C., and dos Santos, C. A.: Increasing wildfires threaten progress on halting deforestation in Brazilian Amazonia, Nat. Ecol. Evol., 7, 1945–1946, https://doi.org/10.1038/s41559-023-02233-3, 2023.
De Praga Baião, C. F., Santos, F. C., Ferreira, M. P., Bignotto, R. B., da Silva, R. F. G., and Massi, K. G.: The relationship between forest fire and deforestation in the southeast Atlantic rainforest, PLoS One, 18, e0286754, https://doi.org/10.1371/journal.pone.0286754, 2023.
Dos Reis, M., de Alencastro Graça, P. M. L., Yanai, A. M., Ramos, C. J. P., and Fearnside, P. M.: Forest fires and deforestation in the central Amazon: effects of landscape and climate on spatial and temporal dynamics, J. Environ. Manage., 288, 112310, https://doi.org/10.1016/j.jenvman.2021.112310, 2021.
Dos Santos, A. C., da Rocha Montenegro, S., Ferreira, M. C., Barradas, A. C. S., and Schmidt, I. B.: Managing fires in a changing world: fuel and weather determine fire behavior and safety in the neotropical savannas, J. Environ. Manage., 289, 112508, https://doi.org/10.1016/j.jenvman.2021.112508, 2021.
Driscoll, D. A., Armenteras, D., Bennett, A. F., Brotons, L., Clarke, M. F., Doherty, T. S., Haslem, A., Kelly, L. T., Sato, C. F., Sitters, H., and Aquilué, N.: How fire interacts with habitat loss and fragmentation, Biol. Rev., 96, 976–998, https://doi.org/10.1111/brv.12687, 2021.
Elith, J., Phillips, S. J., Hastie, T., Dudík, M., Chee, Y. E., and Yates, C. J.: A statistical explanation of MaxEnt for ecologists, Divers. Distrib., 17, 43–57, https://doi.org/10.1111/j.1472-4642.2010.00725.x, 2011.
Ferreira, I. J., Campanharo, W. A., Barbosa, M. L., Silva, S. S. D., Selaya, G., Aragão, L. E., and Anderson, L. O.: Assessment of fire hazard in Southwestern Amazon, Front. For. Global Change, 6, 1107417, https://doi.org/10.3389/ffgc.2023.1107417, 2023.
Fidelis, A., Schmidt, I. B., Furquim, F. F., and Overbeck, G. E.: Burning in the Pampa and Cerrado in Brazil, Global Application of Prescribed Fire, CSIRO Publishing, 38 pp., ISBN 9781486312481, 2022.
Flores, B. M., Montoya, E., Sakschewski, B., Nascimento, N., Staal, A., Betts, R. A., Levis, C., Lapola, D. M., Esquível-Muelbert, A., Jakovac, C., and Nobre, C. A.: Critical transitions in the Amazon Forest system, Nature, 626, 555–564, https://doi.org/10.1038/s41586-023-06970-0, 2024.
Fonseca, M. G., Anderson, L. O., Arai, E., Shimabukuro, Y. E., Xaud, H. A., Xaud, M. R., Madani, N., Wagner, F. H., and Aragão, L. E.: Climatic and anthropogenic drivers of northern Amazon fires during the 2015–2016 El Niño event, Ecol. Appl., 27, 2514–2527, https://doi.org/10.1002/eap.1628, 2017.
Fonseca, M. G., Alves, L. M., Aguiar, A. P. D., Arai, E., Anderson, L. O., Rosan, T. M., Shimabukuro, Y. E., and de Aragão, L. E. O. E. C.: Effects of climate and land-use change scenarios on fire probability during the 21st century in the Brazilian Amazon, Glob. Change Biol., 25, 2931–2946, https://doi.org/10.1111/gcb.14709, 2019.
Forkel, M., Andela, N., Harrison, S. P., Lasslop, G., van Marle, M., Chuvieco, E., Dorigo, W., Forrest, M., Hantson, S., Heil, A., Li, F., Melton, J., Sitch, S., Yue, C., and Arneth, A.: Emergent relationships with respect to burned area in global satellite observations and fire-enabled vegetation models, Biogeosciences, 16, 57–76, https://doi.org/10.5194/bg-16-57-2019, 2019.
Frieler, K., Volkholz, J., Lange, S., Schewe, J., Mengel, M., del Rocío Rivas López, M., Otto, C., Reyer, C. P. O., Karger, D. N., Malle, J. T., Treu, S., Menz, C., Blanchard, J. L., Harrison, C. S., Petrik, C. M., Eddy, T. D., Ortega-Cisneros, K., Novaglio, C., Rousseau, Y., Watson, R. A., Stock, C., Liu, X., Heneghan, R., Tittensor, D., Maury, O., Büchner, M., Vogt, T., Wang, T., Sun, F., Sauer, I. J., Koch, J., Vanderkelen, I., Jägermeyr, J., Müller, C., Rabin, S., Klar, J., Vega del Valle, I. D., Lasslop, G., Chadburn, S., Burke, E., Gallego-Sala, A., Smith, N., Chang, J., Hantson, S., Burton, C., Gädeke, A., Li, F., Gosling, S. N., Müller Schmied, H., Hattermann, F., Wang, J., Yao, F., Hickler, T., Marcé, R., Pierson, D., Thiery, W., Mercado-Bettín, D., Ladwig, R., Ayala-Zamora, A. I., Forrest, M., and Bechtold, M.: Scenario setup and forcing data for impact model evaluation and impact attribution within the third round of the Inter-Sectoral Impact Model Intercomparison Project (ISIMIP3a), Geosci. Model Dev., 17, 1–51, https://doi.org/10.5194/gmd-17-1-2024, 2024.
Gelman, A., Carlin, J. B., Stern, H. S., Dunson, D. B., Vehtari, A., and Rubin, D. B.: Bayesian Data Analysis, Third Edition, Chapman and Hall/CRC, ISBN 978-1-4398-4095-5, 2013.
Giglio, L., Boschetti, L., Roy, D. P., Humber, M. L., and Justice, C. O.: The Collection 6 MODIS burned area mapping algorithm and product, Remote Sens. Environ., 217, 72–85, https://doi.org/10.1016/j.rse.2018.08.005, 2018.
Göltas, M., Ayberk, H., and Küçük, O.: Forest fire occurrence modeling in Southwest Turkey using MaxEnt machine learning technique, iForest-Biogeosci. Forest., 17, 10–18, https://doi.org/10.3832/ifor4321-016, 2024.
Haas, O., Prentice, I. C., and Harrison, S. P.: Global environmental controls on wildfire burnt area, size, and intensity, Environ. Res. Lett., 13, 065004, https://doi.org/10.1088/1748-9326/ac6a69, 2022.
Hantson, S., Arneth, A., Harrison, S. P., Kelley, D. I., Prentice, I. C., Rabin, S. S., Archibald, S., Mouillot, F., Arnold, S. R., Artaxo, P., Bachelet, D., Ciais, P., Forrest, M., Friedlingstein, P., Hickler, T., Kaplan, J. O., Kloster, S., Knorr, W., Lasslop, G., Li, F., Mangeon, S., Melton, J. R., Meyn, A., Sitch, S., Spessa, A., van der Werf, G. R., Voulgarakis, A., and Yue, C.: The status and challenge of global fire modelling, Biogeosciences, 13, 3359–3375, https://doi.org/10.5194/bg-13-3359-2016, 2016.
Hantson, S., Kelley, D. I., Arneth, A., Harrison, S. P., Archibald, S., Bachelet, D., Forrest, M., Hickler, T., Lasslop, G., Li, F., Mangeon, S., Melton, J. R., Nieradzik, L., Rabin, S. S., Prentice, I. C., Sheehan, T., Sitch, S., Teckentrup, L., Voulgarakis, A., and Yue, C.: Quantitative assessment of fire and vegetation properties in simulations with fire-enabled vegetation models from the Fire Model Intercomparison Project, Geosci. Model Dev., 13, 3299–3318, https://doi.org/10.5194/gmd-13-3299-2020, 2020.
Hardesty, J., Myers, R., and Fulks, W.: Fire, ecosystems, and people: a preliminary assessment of fire as a global conservation issue, The George Wright Forum, 22, 78–87, https://www.jstor.org/stable/43597968 (last access: 7 March 2024), 2005.
Hesselbarth, M. H. K., Sciani, M., Nowosad, J., Hanss, S., Graham, L. J., Hollister, J., With, K. A., Privé, F., Project Nayuki, and Strimas-Mackey, M.: Landscape Metrics for Categorical Map Patterns, Comprehensive R Archive Network (CRAN), https://cran.r-project.org/web/packages/landscapemetrics/landscapemetrics.pdf (last access: 15 December 2024), 2024.
Hoffman, M. D. and Gelman, A.: The No-U-Turn sampler: adaptively setting path lengths in Hamiltonian Monte Carlo, J. Mach. Learn. Res., 15, 1593–1623, 2014.
Jaynes, E. T.: Information theory and statistical mechanics, Phys. Rev., 106, 620–630, https://doi.org/10.1103/PhysRev.106.620, 1957.
Jiménez-Valverde, A.: Insights into the area under the receiver operating characteristic curve (AUC) as a discrimination measure in species distribution modelling, Global Ecol. Biogeogr., 21, 498–507, https://doi.org/10.1111/j.1466-8238.2011.00683.x, 2011.
Krawchuk, M. A. and Moritz, M. A.: Burning issues: statistical analyses of global fire data to inform assessments of environmental change, Environmetrics, 25, 472–481, https://doi.org/10.1002/env.2287, 2014.
Kelley, D. I. and Harrison, S. P.: Enhanced Australian carbon sink despite increased wildfire during the 21st century, Environ. Res. Lett., 9, 104015, https://doi.org/10.1088/1748-9326/9/10/104015, 2014.
Kelley, D. I., Bistinas, I., Whitley, R., Burton, C., Marthews, T. R., and Dong, N.: How contemporary bioclimatic and human controls change global fire regimes, Nat. Clim. Change, 9, 690–696, https://doi.org/10.1038/s41558-019-0540-7, 2019.
Kelley, D. I., Burton, C., Huntingford, C., Brown, M. A. J., Whitley, R., and Dong, N.: Technical note: Low meteorological influence found in 2019 Amazonia fires, Biogeosciences, 18, 787–804, https://doi.org/10.5194/bg-18-787-2021, 2021.
Laplace, P. S.: The Analytic Theory of Probabilities, Third Edition, Book II, Courcier, ISBN 978-1009549004, 1820.
Li, B., Liu, B., Guo, K., Li, C., and Wang, B.: Application of a maximum entropy model for mineral prospectivity maps, Minerals, 9, 556, https://doi.org/10.3390/min9090556, 2019.
Li, S., Rifai, S., Anderson, L. O., and Sparrow, S.: Identifying local-scale meteorological conditions favorable to large fires in Brazil, Clim. Resil. Sustain., 1, e11, https://doi.org/10.1002/cli2.11, 2022.
Libonati, R., Geirinhas, J. L., Silva, P. S., Monteiro dos Santos, D., Rodrigues, J. A., Russo, A., Peres, L. F., Narcizo, L., Gomes, M. E., Rodrigues, A. P., and Dacamara, C. C.: Drought–heatwave nexus in Brazil and related impacts on health and fires: a comprehensive review, Ann. N.Y. Acad. Sci., 1517, 44–62, https://doi.org/10.1111/nyas.14887, 2022a.
Libonati, R., Geirinhas, J. L., Silva, P. S., Russo, A., Rodrigues, J. A., Belém, L. B. C., Nogueira, J., Roque, F. O., Dacamara, C. C., Nunes, A. M. B., Marengo, J. A., and Trigo, R. M.: Assessing the role of compound drought and heatwave events on unprecedented 2020 wildfires in the Pantanal, Environ. Res. Lett., 17, 015005, https://doi.org/10.1088/1748-9326/ac462e, 2022b.
Lobo, J. M., Jiménez-Valverde, A., and Real, R.: AUC: a misleading measure of the performance of predictive distribution models, Global Ecol. Biogeogr., 17, 145–151, https://doi.org/10.1111/j.1466-8238.2007.00358.x, 2008.
MapBiomas Fogo: Coleção 2 do mapeamento das cicatrizes de fogo do Brasil (1985–2022), MapBiomas, https://brasil.mapbiomas.org/wp-content/uploads/sites/4/2023/08/ATBD_-_MapBiomas_Fogo_-_Colecao_2.pdf (last access: 12 April 2024), 2023.
Mapbiomas Project: Coleção 7 da série anual de mapas de cobertura e uso da terra do Brasil, MapBiomas, https://brasil.mapbiomas.org/downloads/ (last access: 20 April 2024), 2022.
Mathison, C., Burke, E., Hartley, A. J., Kelley, D. I., Burton, C., Robertson, E., Gedney, N., Williams, K., Wiltshire, A., Ellis, R. J., Sellar, A. A., and Jones, C. D.: Description and evaluation of the JULES-ES set-up for ISIMIP2b, Geosci. Model Dev., 16, 4249–4264, https://doi.org/10.5194/gmd-16-4249-2023, 2023.
Meijer, J. R., Huijbregts, M. A. J., Schotten, C. G. J., and Schipper, A. M.: Global patterns of current and future road infrastructure, Environ. Res. Lett., 13, e064006, https://doi.org/10.1088/1748-9326/aabd42, 2018.
Met Office: Iris: a powerful, format-agnostic, and community-driven Python package for analysing and visualising Earth science data, v3.6, 2010–2023, Met Office, http://scitools.org.uk/ (last access: 20 June 2024), 2023.
Nogueira, J. M., Rambal, S., Barbosa, J. P. R., and Mouillot, F.: Spatial pattern of the seasonal drought/burned area relationship across Brazilian biomes: sensitivity to drought metrics and global remote-sensing fire products, Climate, 5, 42, https://doi.org/10.3390/cli5020042, 2017.
Numata, I., Silva, S. S., Cochrane, M. A., and D'Oliveira, M. V.: Fire and edge effects in a fragmented tropical forest landscape in the southwestern Amazon, For. Ecol. Manag., 401, 135–146, https://doi.org/10.1016/j.foreco.2017.07.010, 2017.
Oliveira, U., Soares-Filho, B., Bustamante, M., Gomes, L., Ometto, J. P., and Rajão, R.: Determinants of fire impact in the Brazilian biomes, Front. For. Glob. Change, 5, 735017, https://doi.org/10.3389/ffgc.2022.735017, 2022.
Penfield Jr., P.: Principle of maximum entropy: simple form, Massachusetts Institute of Technology, Massachusetts, Springer, https://dspace.mit.edu/bitstream/handle/1721.1/45591/6-050JSpring-2003/NR/rdonlyres/Electrical-Engineering-and-Computer-Science/6-050JInformation-and-EntropySpring2003/ECB9F73C-48E8-4528-B69E-F5CBAF886C5C/0/chapter9.pdf (last access: 12 June 2025), 2003.
Peterson, A. T., Soberón, J., Pearson, R. G., Anderson, R. P., Martinez-Meyer, E., Nakamura, M., and Araujo, M. B.: Ecological niches and geographic distributions, Princeton University Press, Princeton, 49, https://doi.org/10.1515/9781400840670, 2011.
Phillips, S. J. and Dudik, M.: Modeling of species distributions with Maxent: new extensions and a comprehensive evaluation, Ecography, 31, 161–175, https://doi.org/10.1111/j.0906-7590.2008.5203.x, 2008.
Phillips, S. J., Anderson, R. P., and Schapire, R. E.: Maximum entropy modeling of species geographic distributions, Ecol. Model., 190, 231–259, https://doi.org/10.1016/j.ecolmodel.2005.03.026, 2006.
Radosavljevic, A. and Anderson, R. P.: Making better Maxent models of species distributions: complexity, overfitting and evaluation, J. Biogeogr., 41, 629–643, https://doi.org/10.1111/jbi.12227, 2013.
Rosan, T. M., Sitch, S., Mercado, L. M., Heinrich, V., Friedlingstein, P., and Aragão, L. E.: Fragmentation-driven divergent trends in burned area in Amazonia and Cerrado, Front. For. Glob. Change, 5, 801408, https://doi.org/10.3389/ffgc.2022.801408, 2022.
Silva Junior, C. H., Buna, A. T., Bezerra, D. S., Costa Jr., O. S., Santos, A. L., Basson, L. O., Santos, A. L., Alvarado, S. T., Almeida, C. T., Freire, A. T., and Rousseau, G. X.: Forest fragmentation and fires in the eastern Brazilian Amazon–Maranhão State, Brazil, Fire, 5, 77, https://doi.org/10.3390/fire5030077, 2022.
Silveira, M. V., Petri, C. A., Broggio, I. S., Chagas, G. O., Macul, M. S., Leite, C. C., Ferrari, E. M., Amim, C. G., Freitas, A. L., Motta, A. Z., and Carvalho, L. M.: Drivers of fire anomalies in the Brazilian Amazon: Lessons learned from the 2019 fire crisis, Land, 9, 516, https://doi.org/10.3390/land9120516, 2020.
Silveira, M. V., Silva-Júnior, C. H., Anderson, L. O., and Aragão, L. E.: Amazon fires in the 21st century: the year of 2020 in evidence, Global Ecol. Biogeogr., 31, 2026–2040, https://doi.org/10.1111/geb.13577, 2022.
Singh, M. and Huang, Z.: Analysis of forest fire dynamics, distribution and main drivers in the Atlantic Forest, Sustainability, 14, 992, https://doi.org/10.3390/su14020992, 2022.
Spearman, C.: The proof and measurement of association between two things, in: Studies in Individual Differences: The Search for Intelligence, edited by: Jenkins, J. J. and Paterson, D. G., Appleton Century Crofts, 45–58, https://doi.org/10.1037/11491-005, 1961.
United Nations Environment Programme (UNEP): Spreading like wildfire: the rising threat of extraordinary landscape fires, A UNEP Rapid Response Assessment, Nairobi, United Nations Environment Programme (UNEP), 240827, https://www.unep.org/resources/report/spreading-wildfire-rising-threat-extraordinary-landscape-fires (last access: 18 December 2024), 2022.
Volkholz, J., Lange, S., and Geiger, T.: ISIMIP3a population input data (v1.2), ISIMIP Repository [data set], https://doi.org/10.48364/ISIMIP.822480.2, 2022.
Wan, J., Qi, G., Ma, J., Ren, Y., Wang, R., and McKirdy, S.: Predicting the potential geographic distribution of Bactrocera bryoniae and Bactrocera neohumeralis (Diptera: Tephritidae) in China using MaxEnt ecological niche modeling, J. Integr. Agric., 19, 2072–2082, https://doi.org/10.1016/S2095-3119(19)62840-6, 2020.
Wiltshire, A. J., Burke, E. J., Chadburn, S. E., Jones, C. D., Cox, P. M., Davies-Barnard, T., Friedlingstein, P., Harper, A. B., Liddicoat, S., Sitch, S., and Zaehle, S.: JULES-CN: a coupled terrestrial carbon–nitrogen scheme (JULES vn5.1), Geosci. Model Dev., 14, 2161–2186, https://doi.org/10.5194/gmd-14-2161-2021, 2021.
Wu, Y., Li, S., Xu, R., Chen, G., Yue, X., Yu, P., Ye, T., Wen, B., Coêlho, M. D. S. Z. S., Saldiva, P. H. N., and Guo, Y.: Wildfire-related PM2.5 and health economic loss of mortality in Brazil, Environ. Int., 174, 107906, https://doi.org/10.1016/j.envint.2023.107906, 2023.
Zacharakis, I. and Tsihrintzis, V. A.: Environmental forest fire danger rating systems and indices around the globe: a review, Land, 12, 194, https://doi.org/10.3390/land12010194, 2023.