the Creative Commons Attribution 4.0 License.
the Creative Commons Attribution 4.0 License.
 | 28 May 2025
Soil nitrous oxide emissions from global land ecosystems and their drivers within the LPJ-GUESS model (v4.1)
Almut Arneth
Benjamin Smith
Peter Anthoni
Xu-Ri
Peter Eliasson
David Wårlind
Martin Wittenbrink
Stefan Olin
Nitrogen (N) transformation processes by soil microbes account for significant nitrous oxide (N2O) emissions from natural ecosystems and cropland. However, understanding and quantifying global soil N2O emissions and their responses to changing environmental conditions remain challenging. Here, we implemented a soil nitrification–denitrification module into the dynamic vegetation model LPJ-GUESS to estimate N2O emissions from global lands. The performance of this new development is examined using observed N2O fluxes from natural-soil and cropland field trials and independent global-scale estimates. LPJ-GUESS broadly reproduces the cumulative N2O emissions under different climate conditions and N fertilizer applications that are observed in the field experiments, with some deviations in emission seasonality. Globally, simulated soil N2O emissions from terrestrial ecosystems increase from 5.6±0.2 Tg N yr−1 in the 1960s to 9.9±0.3 Tg N yr−1 in the 2010s, with croplands contributing about two-thirds of the total increase. East Asia and South Asia show the fastest growth rates in N2O emissions over the study period due to the expansion of fertilized croplands. On a global scale, N fertilization (including synthetic fertilizer and manure use), atmospheric N deposition, and climate change contribute 58 %, 46 %, and 24 %, respectively, to the simulated soil N2O emissions in the 2010s. Rising CO2 levels in the atmosphere reduce the simulated emissions by 32 % through increased plant N uptake, whereas land use changes have varied spatial effects on emissions depending on N management intensity after land cover conversion. Our estimates only account for the direct soil N2O emissions, excluding those from fertilized pastures. This study highlights the importance of environmental factors in influencing global soil N2O emissions, particularly for assessing greenhouse gas mitigation potential in agricultural ecosystems.
- Article
(7433 KB) - Full-text XML
-
Supplement
(2129 KB) - BibTeX
- EndNote


Understanding how anthropogenic activities that influence greenhouse gas emissions and exchanges affect the climate system is crucial to address the threats posed by global change. While much of the attention has been on the carbon (C) cycle and carbon dioxide (CO2), interest in non-CO2 greenhouse gases has grown over the last 2 decades, particularly for nitrous oxide (N2O) due to its rapidly increasing concentration in the atmosphere (from ∼290 ppb in 1940 to ∼336 ppb in 2022, with a marked rapid growth of 1.3 ppb yr−1 from 1980 to 2022; Tian et al., 2024). This human-induced N2O increase contributes significantly to global warming as N2O is about 273 times more potent than CO2 with regard to warming the atmosphere from a 100-year perspective (Canadell et al., 2021). Additionally, N2O is an important stratospheric-ozone-depleting substance, potentially increasing surface levels of harmful ultraviolet radiation (World Meteorological Organization, 2022).
The main sources of terrestrial N2O emissions to the atmosphere are nitrogen (N) transformation processes by soil microbes. Other major non-soil contributors include fossil fuel combustion, inland waters, and biomass burning (Tian et al., 2020). From 2000 to 2016, the global soil release of N2O through nitrification and denitrification from land ecosystems has been estimated to be 9–13 Tg N yr−1 (Bouwman et al., 2013; Tian et al., 2019; Zaehle, 2013), with tropical rainforest soils being the most important sources due to their high organic matter turnover rates in their warm and moist environment (Stehfest and Bouwman, 2006). Agricultural soils (within and outside the tropics) are also critical owing to their high reactive N levels. A significant portion of the increase in atmospheric N2O from agriculture can be attributed to N management practices and N applications to croplands, especially mineral fertilizer from the Haber–Bosch process. Estimates indicate that global cropland N2O emissions have increased by 1–3 times in the last several decades, ranging from 0.4–1.4 Tg N yr−1 in the 1960s to 1.3–3.3 Tg N yr−1 in the 2010s (Tian et al., 2019; Wang et al., 2020; Xu et al., 2020). These soil N2O emissions are expected to continue to rise due to the growing food demand associated with the increasing human population and changes in per capita consumption (Davidson and Kanter, 2014; Fowler et al., 2013). Significant reductions in agricultural N2O emissions are required to achieve ambitious climate targets, particularly through changes in land management practices and, ultimately, enhanced N use efficiency – that is, increasing the fraction of N input that is harvested as products (Gu et al., 2023; Springmann et al., 2018; Zhang et al., 2021).
N input, especially the use of industrial N fertilizer, is one of the most reliable predictors to quantify past and present N2O emissions in agricultural ecosystems, with an estimated emission factor (EF) varying from 0.2 % to 1.8 % of the N applied to the soil (default value in IPCC Tier 1; Hergoualc'h et al., 2019). While large-scale estimates of N2O emissions have been made based on regional and/or global mean EF values (primarily estimated from various reactive N sources; see Crutzen et al., 2008; Smith et al., 2012), all EF methods assume a linear increase in N2O in response to N input. However, field experimental evidence shows that emission trends are usually exponential when N fertilizer rates exceed plant needs (Shcherbak et al., 2014; Song et al., 2018). Process-based ecological models that capture soil–vegetation interactions and the effects of environmental drivers on the physiological and biogeochemical processes of plants or crops, soils, and microbial communities provide an approach for quantifying historical and future N2O emissions on large spatial scales (Butterbach-Bahl et al., 2013). This is due to their mechanistic parameterization of C–N dynamics between vegetation and soils under changing environmental conditions and land use management (Pongratz et al., 2018).
Compared with some well-developed site-specific models from the 1990s (e.g., DayCent, Parton et al., 1996; DNDC, Li et al., 1992), the implementation of N2O-related processes in global biosphere models, such as dynamic global vegetation models (DGVMs; Cramer et al., 2001), only began in the early years of this century. For instance, Xu-Ri and Prentice (2008) adopted the descriptions of nitrification and denitrification processes from the DNDC model (Li et al., 2000) and introduced them in a simplified way into the DGVM LPJ-DyN. They assumed that N2O fluxes are mainly regulated by soil moisture and temperature, carbon supply, soil characteristics (such as aeration and texture), and reactive N availability. Likewise, Zaehle et al. (2011) largely followed the approach of Xu-Ri and Prentice (2008) and incorporated inorganic soil N dynamics into the O–CN vegetation model, enhancing it with the inclusion of soil pH and chemo-nitrification processes. To better represent the influence of soil microbes on N transformation, some DGVMs further considered the activity of nitrifiers and denitrifiers by simulating the growth and mortality of the responsible bacteria (e.g., CLM3.5, Saikawa et al., 2013; IBIS, Ma et al., 2022b; TRIPLEX, Zhang et al., 2017b). However, most of these DGVM developments focused predominantly on N2O emissions in natural soils given the extensive coverage of natural vegetation on Earth's land surface (e.g., forest and grassland; see Huang and Gerber, 2015; Saikawa et al., 2013; Xu-Ri et al., 2012). Considering the growing contribution of the agricultural sector to the global N cycle, DGVMs are also being equipped to account for cropland management options – such as N fertilizer and manure use (Tian et al., 2012; Von Bloh et al., 2018), lime and basalt application (Val Martin et al., 2023), tillage (Ciais et al., 2011; Lutz et al., 2020), cover crops (Ma et al., 2023; Olin et al., 2015b; Porwollik et al., 2022), and residue retention (Ren et al., 2020). These strategies have been shown through field experiments to play crucial roles in regulating N2O emissions (Abalos et al., 2022; Li et al., 2023; Quemada et al., 2020; Yangjin et al., 2021).
In this study, we implemented soil nitrification–denitrification processes in the DGVM LPJ-GUESS, into which detailed agricultural management practices have been incorporated previously (Olin et al., 2015a; Smith et al., 2014). Building on the concepts introduced by Xu-Ri and Prentice (2008), these processes are parameterized within our model to estimate soil N2O emissions across major natural-vegetation and cropland land cover classes, allowing us to investigate how N2O responds to environmental changes and N management. The performance of the updated model is evaluated using field experimental data, published results from other modeling studies, and global inversion estimates. Our objective is to quantify the temporal and spatial pattern of global N2O fluxes across natural vegetation, pastures, and croplands while exploring the environmental factors that drive changes in N2O emissions over the historical period.
2.1 Model description
The LPJ-GUESS model is a comprehensive, process-based global vegetation simulator designed to study plant–soil interactions and their influence on ecosystem biogeochemical cycling, including C–N dynamics of natural and managed ecosystems under environmental changes (e.g., global warming and rising CO2 levels; see Smith et al., 2014) and land management (capturing, e.g., conservation agriculture, forest thinning, and clear-cutting; see Lindeskog et al., 2021; Olin et al., 2015b). This is achieved by simulating the physiological and biogeochemical processes of plants on a daily basis (Smith et al., 2014). In the default global configuration, the model's natural-vegetation component includes 12 plant functional types (PFTs), specifically 10 forest and 2 grass types, each characterized by distinct phenological and morphological traits; bioclimatic constraints; and specific strategies for establishment, growth, and mortality. Pasture ecosystems are modeled as a competition between C3 and C4 grasses, with 50 % of the aboveground biomass being removed annually to represent grazing effects. To account for internal manure deposition from livestock in pastures, the model assumes that 75 % of the N from the harvested biomass is returned to the soil (Lindeskog et al., 2013). Cropland in the version of LPJ-GUESS used in this study is characterized by six crop functional types (CFTs): two temperate C3 cereals sown in spring and autumn–winter, a C4 crop representing maize, a tropical C3 crop representing rice, and two N-fixing C3 grain legumes representing soybean and pulses (Ma et al., 2022a; Olin et al., 2015a). These CFTs are simulated as either rain-fed or irrigated, determined by the prescribed fractions provided as external input. Crops are harvested once every year when the required heat units are reached. Agricultural practices – such as tillage intensity, N mineral fertilizer and manure application, crop residue removal, and leguminous and non-leguminous cover crops – are also included (Ma et al., 2023; Olin et al., 2015b; Pugh et al., 2015). For large-scale applications, to reflect the widespread adoption of conventional practices in current global agriculture (Porwollik et al., 2019), the model assumes that all croplands are under tillage management without cover-cropping systems and that 25 % of aboveground crop residue is retained in the fields after harvest. Industrial N fertilizer is added to soils at three different stages of crop growth, with application rates varying by CFT. In contrast, all manure is applied as a single input at crop sowing to reflect the time required for manure N to become available for plant uptake in real-world practices (Olin et al., 2015b).
In the model, the C transfers induced by decomposition between 11 soil organic matter (SOM) pools drive N mineralization–immobilization processes in order to maintain prescribed C:N ratios and mass balances in both the C-donor and C-receiver pools (Smith et al., 2014). Soil mineral N after the processes of mineralization and immobilization (i.e., NH) and biological N fixation (NH), chemical N fertilizer input (NO and NH), and atmospheric N deposition (NO and NH) jointly determine the total size of the soil reactive N pool. This pool is initially depleted by vegetation uptake, followed by hydrological N losses and gaseous N emissions from the soils (Wårlind et al., 2014). Mineral N leaching in the model increases linearly with soil NO concentration and is dynamically adjusted by soil water-holding capacity and percolation rate. Gaseous N losses through soil N transformation are implemented in this study and are described in detail below.
2.2 Representation of gaseous N emissions from the soil
2.2.1 Ammonia (NH3) volatilization
N losses through NH3 volatilization significantly affect the concentration of NH in soils, thereby influencing N2O emissions through nitrification. Following Xu-Ri and Prentice (2008), production of NH3 from NH is simulated as a response function to (1) the exchangeable NH in the soil solution, (2) soil temperature, and (3) pH level:
where NH3soil is the NH3 concentration in the soil (kg N m−2 d−1); NH is the exchangeable NH concentration determined by the pool size of NH and the relative soil water content (Wsoil_relative); and and are the limitations (ranging from 0 to 1) placed on volatilization by soil temperature and pH, respectively, and are taken from the LPJ-DyN (Xu-Ri and Prentice, 2008) and CLM5.0 (Val Martin et al., 2023) models.
In the above, Tsoil is the soil temperature (°C) at a depth of 25 cm, representing the mean temperature of the 0–50 cm top layer in the two-layer implementation of LPJ-GUESS we used, and pH is the soil pH values provided together with soil mineral properties as external input.
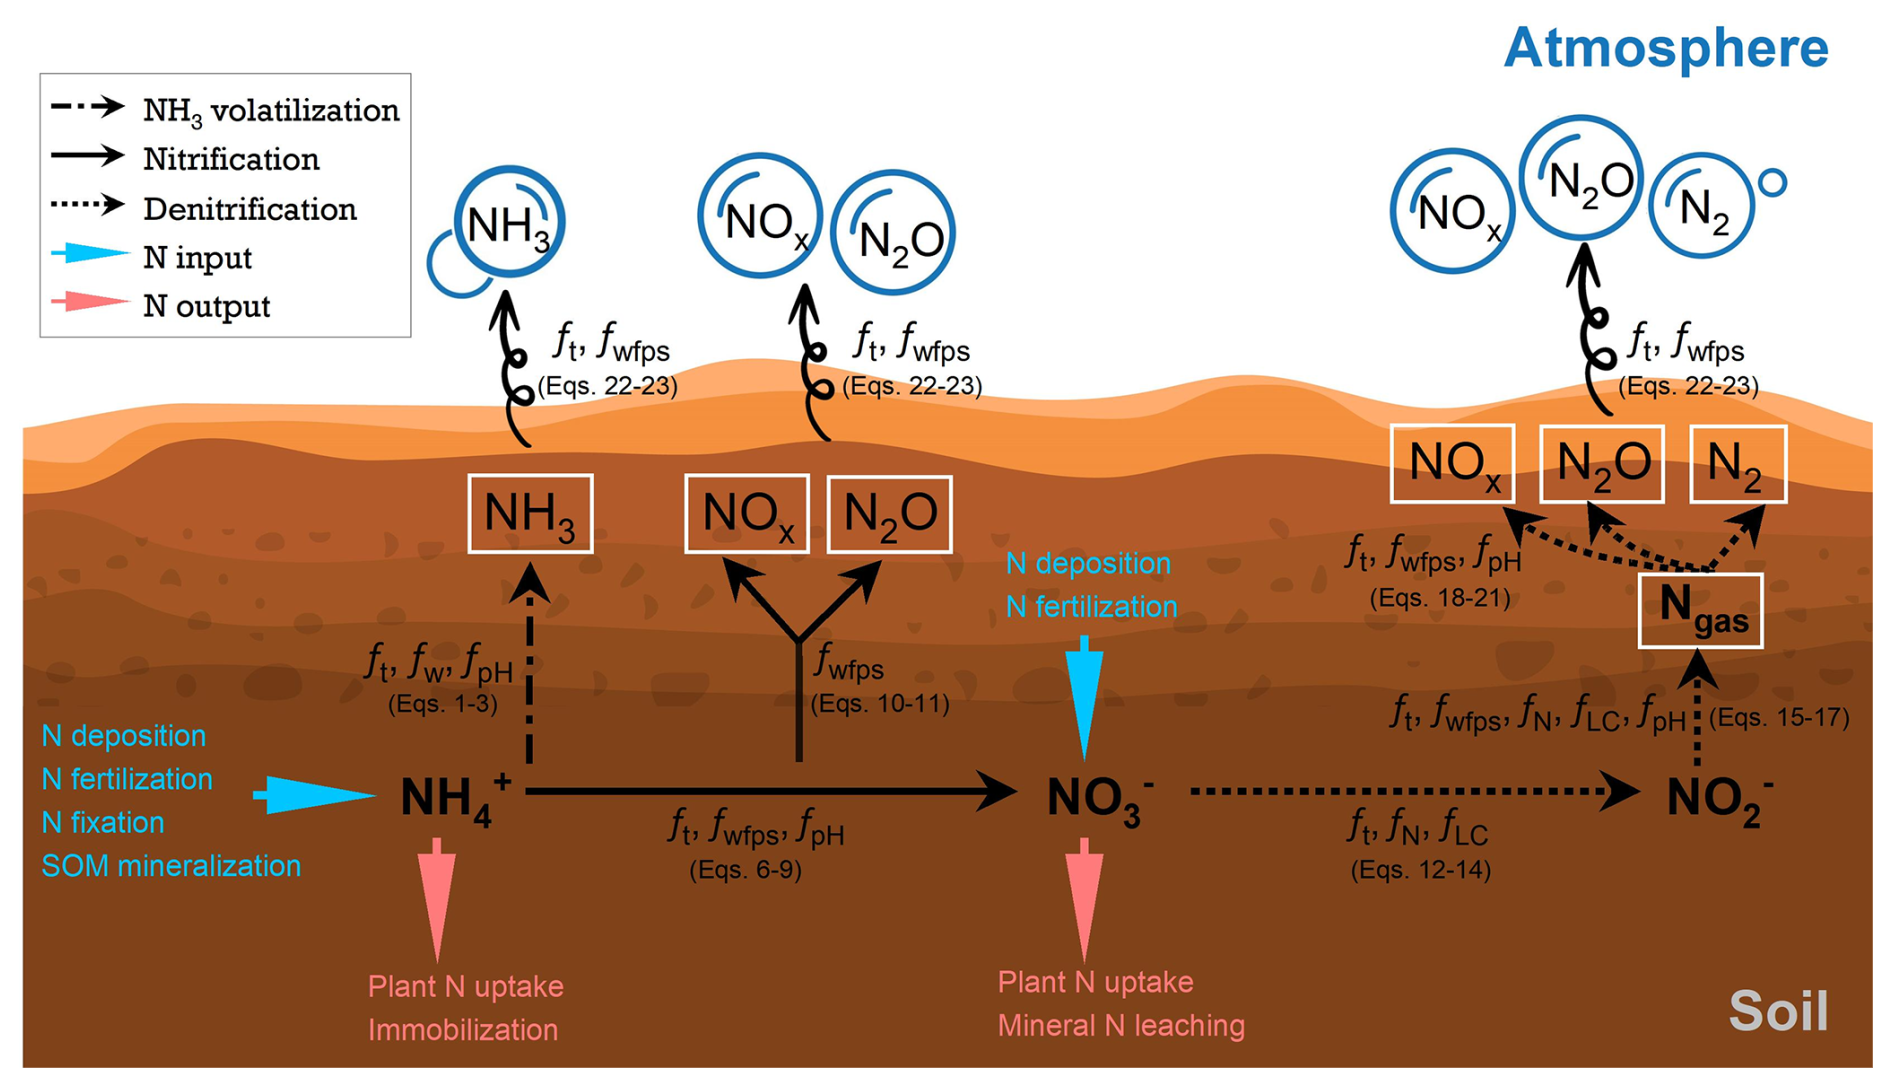
Figure 1Representation of key transformations of soil mineral N in LPJ-GUESS. N species in white boxes represent the concentration of the transformed gases accumulated in the soil. See the equations in Sect. 2.2.1–2.2.4 for details on the limitation factors during each process.
After NH3 volatilization, the remaining soil NH pool will continue to be depleted by nitrification processes in the model (see Fig. 1). Since nitrification and denitrification can occur simultaneously under aerobic and anaerobic conditions, respectively, the concept of the “anaerobic balloon” proposed by Li et al. (2000) is adopted to partition reactive N species (e.g., NO and NH) into these two soil states, with soil water-filled pore space (WFPS) being used as an indicator (Xu-Ri and Prentice, 2008). According to Li et al. (2000), the size of the anaerobic balloon increases exponentially with soil moisture. Therefore, in the model, the fraction of anaerobic substrates (fanaero) is simply estimated as an exponential function of WFPS:
where Wsoil_volume is the soil volumetric water content in the top layer (m3 m−3; 0–50 cm), and PORsoil is the soil porosity determined by soil physical properties (m3 m−3). The partitioning of soil substrates under aerobic (Xsoil_aero) and anaerobic (Xsoil_anaero) conditions is estimated using
where Xsoil is the soil substrate concentration (kg N (or C) m−2 d−1), representing any of the following in this study: NH, NO, NO, or labile carbon.
2.2.2 Nitrification
Autotrophic nitrification and heterotrophic nitrification are two distinct biological processes involved in the N transformation in soil ecosystems. We focused solely on representing autotrophic nitrification, which is the dominant process in most natural and agricultural soils (Chapin et al., 2011). The heterotrophic pathway is also more challenging to model as it requires estimation of dissolved organic nitrogen as the main substrate for the responsible nitrifying bacteria. Autotrophic nitrification is an aerobic process wherein NH undergoes sequential oxidation to NO and then to NO, producing NOx and N2O as intermediates and/or by-products. The initial oxidation step involves two distinct groups of nitrifiers: ammonia-oxidizing bacteria and archaea. The subsequent oxidation of NO to NO is facilitated by nitrite-oxidizing bacteria. Due to the current limitation in the model's ability to simulate the growth and mortality of soil microbes, we integrate these two oxidation steps into one single process – i.e., NH is oxidized to NO directly – to collectively represent nitrification in LPJ-GUESS (see Fig. 1). The production of NO through nitrification () is formulated as follows:
where kmax_nit is the maximum nitrification coefficient and is set as a constant of 0.1 based on the experimental data from Khalil et al. (2004); NH is the aerobic soil NH concentration after NH3 volatilization (kg N m−2 d−1; see Sect. 2.2.1); and ft_nit, fWFPS_nit, and fpH_nit are the limitation factors of soil temperature, moisture, and pH, respectively. Soil temperature plays a crucial role in regulating microbial activities. For nitrite-oxidizing bacteria, 37–39 °C is found to be optimal for substrate oxidation (Taylor et al., 2019), and for ammonia-oxidizing bacteria and archaea, the optimal soil temperature can range from 31 to 42 °C (Ouyang et al., 2017). In the model, the maximum nitrification rate is thus assumed to occur at 38 °C as the average optimal temperature for these three groups of nitrifiers:
Besides soil temperature, soil moisture and pH are also key factors affecting nitrification rates. Gleeson et al. (2010) demonstrated that the activity of nitrifying bacteria decreases rapidly when soil WFPS exceeds 0.6 and stops completely when it surpasses 0.8. Consequently, a three-threshold limitation function is incorporated into LPJ-GUESS to simulate soil moisture influence (Eq. 8). For soil pH constraints, the response function of nitrification rate is adopted from Parton et al. (2001), as implemented in the DayCent model (Eq. 9):
Since the mechanisms of N gas emissions during nitrification are not yet fully understood (Butterbach-Bahl et al., 2013), we adopted the same assumption as other ecosystem and crop models, namely that the gaseous N concentration through nitrification (i.e., Rgas_nit) is proportional to the nitrification rate, and we estimate the emissions using
where is the soil NO concentration produced through nitrification in Eq. (6) (kg N m−2 d−1), and Fmax_gas_nit is the maximum fraction of nitrified N lost as NOx and N2O, a parameter that varies widely between models due to differences in their structural configuration for simulating N gas species and specific nitrification processes (Gabbrielli et al., 2024). We assume this parameter to be a constant of 0.25 based on the MICN model (Ma et al., 2022b) to broadly account for the potential N gas fluxes driven by different groups of nitrifying bacteria. Previous studies have revealed that, during nitrification, NOx dominates at a WFPS below 0.3, and the ratio of NOx : N2O is often close to 1.0 at a WFPS of 0.6 (Davidson et al., 2000; Pilegaard, 2013). Thus, in the model, nitrified gaseous N concentration (i.e., Rgas_nit) is partitioned into NOx and N2O species using an empirical function of soil WFPS:
where NOx_nit and N2O_nit are nitrified NOx and N2O gases in the soil, respectively (kg N m−2 d−1), and is the partitioning scheme between NOx and N2O taken from previous studies (Goldberg and Gebauer, 2009; Pilegaard, 2013).
2.2.3 Denitrification
Denitrification is a series of reduction reactions driven by different groups of microorganisms in anaerobic conditions. Heterotrophic denitrifying bacteria facilitate the full reduction chain from NO to molecular nitrogen (N2) (), a process known as denitrifier denitrification. In contrast, autotrophic nitrifiers typically convert NH to NO under aerobic conditions, but when oxygen becomes scarce, they switch to reducing NO to NOx and N2O and, finally, to N2, a process known as nitrifier denitrification. Given the high reactivity of NOx under the reducing conditions that facilitate denitrification (Parton et al., 2001; Schlüter et al., 2025), accurately simulating every single transformation step from NO to N2 is challenging due to the interdependent nature of these processes (Ma et al., 2022b). In this study, following the concept of “holes in a pipe” (e.g., Firestone and Davidson, 1989; Davidson et al., 2000; Val Martin et al., 2023), we combine the entire reduction chain from NO to N2 into a single step (see Fig. 1) to broadly represent the emissions of all N gases produced during denitrification:
where DENITLPJ-GUESS is the N reduction chain during denitrification represented in LPJ-GUESS; NO is the soil NO concentration under anaerobic conditions calculated in Eq. (5) (kg N m−2 d−1); and and Rgas_denit are the concentrations of denitrified soil NO and all N gases (kg N m−2 d−1), respectively. Since the availability of the particular N oxide (NO or NO) and the availability of soil labile C are the two dominant drivers controlling the activity of denitrifiers (Weier et al., 1993; Chapin et al., 2011), we incorporate these two factors into the model to reflect their limitations on the denitrification rate, along with soil temperature as an additional constraint:
where ft_denit, fLC_denit, and are limitations (ranging from 0 to 1) on denitrification by soil temperature, available C, and soil NO concentration, respectively. kmax_denit is the maximum denitrification coefficient and can reach 1.0 when there are no limitations by environmental factors or the populations of denitrifying bacteria (Gabbrielli et al., 2024). In LPJ-GUESS, to reflect the absence of limitation due to the growth of denitrifiers, kmax_denit is assumed to be a constant value of 0.5, chosen as the middle point of the possible range from 0 to 1. For fLC_denit and , both response functions are adopted from the DNDC model (Li et al., 1992), following the Michaelis–Menten equation. For ft_denit, an empirical sigmoid function, built on experimental observations (Benoit et al., 2015; Ma et al., 2022b), is used for the parameterization of temperature effects:
where KC and KN are Michaelis–Menten constants of 0.017 kg C m−3 and 0.083 kg N cm−3 for labile C and N oxides, respectively (Li et al., 1992). Wsoil_volume is volumetric soil water content in the top layer (m3 m−3; 0–50 cm). Since labile C is not explicitly modeled in LPJ-GUESS, we use soil heterotrophic respiration under anaerobic conditions (Rhsoil_anaero; kg C m−2 d−1) as a surrogate for C availability, following Parton et al. (2001) and Xu-Ri and Prentice (2008).
In addition to soil labile C and N oxides, much experimental evidence has shown that soil pH and moisture are also critical in regulating the denitrification rate, particularly during the transformation process from NO to N2 (e.g., Bao et al., 2012; Bergaust et al., 2010; Kool et al., 2011; Lim et al., 2018). Therefore, in the model, after the first reduction step (), soil NO is further denitrified as N gases (Rgas_denit) using the reduction equation as the first step but with added limitations by soil pH and WFPS (Eqs. 15–17). Both of these two response functions ( and below) are established based on experimental data and are taken from Blanc-Betes et al. (2021) and Ma et al. (2022b), respectively:
Davidson et al. (2000) and Pilegaard (2013) pointed out that NOx emissions exponentially decrease when soil WFPS exceeds 0.3 and cease entirely at 0.7. We therefore assume that the denitrified gaseous N (Rgas_denit in Eq. 18) produces NOx and N2O species only when WFPS is below 0.7. Above this threshold, the production shifts to N2O and N2 gases instead.
In the above, NOx_denit, N2O_denit, and N2_denit are denitrified NOx, N2O, and N2 in the soil, respectively (kg N m−2 d−1). For soil WFPS between 0 and 0.7, the denitrified gaseous N is partitioned into NOx and N2O using
where is the partitioning ratio between NOx and N2O, built on the data provided in Davidson et al. (2000) and Pilegaard (2013). Previous studies indicated that low temperature, combined with low pH and low soil water content, reduces the activity of N2O reductase, thereby increasing the ratio of N2O to (N2+N2O) in the last step of denitrification (Weier et al., 1993; Siljanen et al., 2020). Accordingly, for soil WFPS above 0.7, the partitioning of Rgas_denit into N2O and N2 is determined by soil temperature, moisture, and pH levels, with emissions being estimated using
where is the partitioning ratio of N2O to (N2+N2O), jointly constrained by soil temperature (), WFPS (), and pH value (). The field-based observed data – soil temperature from Weier et al. (1993), soil WFPS from Maag and Vinther (1996), and soil pH from Liu et al. (2010) and Rochester (2003) – are used to establish the three limitation functions.
2.2.4 Gas diffusion
In the model, N gases transformed through ammonia volatilization, nitrification, and denitrification accumulate in the soil and are ultimately released into the atmosphere. Since soil aeration status and temperature are key factors influencing gas diffusion (Li et al., 1992; Zhang et al., 2017b), a straightforward equation based on these two variables, as suggested by Xu-Ri and Prentice (2008), is adopted to estimate gas transport from the top soil layer to the atmosphere:
where ft_dif is the soil temperature limitation function on gas diffusion, taken from Xu-Ri and Prentice (2008), and NH3_gas, NOx_gas, N2O_gas, and N2_gas are NH3, NOx, N2O, and N2 gases released from the soil into the atmosphere, respectively. It should be noted that other N gas processes, such as gas diffusion fluxes between soil layers and NOx losses due to its rapid oxidation near the plant canopy, are not implemented in the model at the moment. A flowchart of key transformations of soil mineral N in LPJ-GUESS is shown in Fig. 1.
2.3 Model experimental protocol
This study includes three model applications or experiments. First, we evaluate the model performance in reproducing observed N2O fluxes from various natural and cropland field sites worldwide. Next, a global simulation is performed over the historical period to assess the model results against estimates from other modeling studies and inversion approaches. In the last part, we analyze and discuss the environmental factors driving temporal and spatial changes in historical N2O emissions in global natural-vegetation, pasture, and cropland ecosystems.
To initialize the model state, we adopted the spin-up procedure following the protocol in our earlier study (Ma et al., 2022a). All simulations are initialized with a 500-year spin-up using atmospheric CO2 concentrations and N deposition from 1901, along with repeating the de-trended 1901–1920 climate (data sources described below). The spin-up starts with simulations of potential natural vegetation, representing unmanaged forest and grassland ecosystems. In the last 30 years of the spin-up, the model gradually introduces cropland by linearly increasing the cropland fraction from zero to the 1901 historic value. Details of the model experiment protocol are provided below.
2.3.1 Model evaluation at site scale
To assess model performance, field-based N2O observations from natural and cropland soils were compiled from the published literature. This dataset includes 49 natural-vegetation sites and 55 cropland sites situated between ∼43° S and ∼61° N (Fig. 2a and b). For natural lands, field studies typically reported annual N2O emissions (kg N ha−1 yr−1) across five ecosystems: tropical forests (13 sites), temperate forests (21 sites), boreal forests (5 sites), grasslands (8 sites), and savannas (2 sites). These measurements were recorded during the period from 1981 to 2010. In contrast, observed data from croplands focused solely on cumulative N2O emissions over the crop-growing season within four major cropping systems (kg N ha−1 per season; wheat, maize, rice, and legumes). This dataset, covering the period from 1994 to 2020, examined how N2O fluxes respond to varying N fertilizer inputs and management practices in agricultural soils (Fig. 2c). Detailed information for these sites – including geographic coordinates, experimental periods, and cropping management systems – is provided in Tables S1 and S2 in the Supplement.
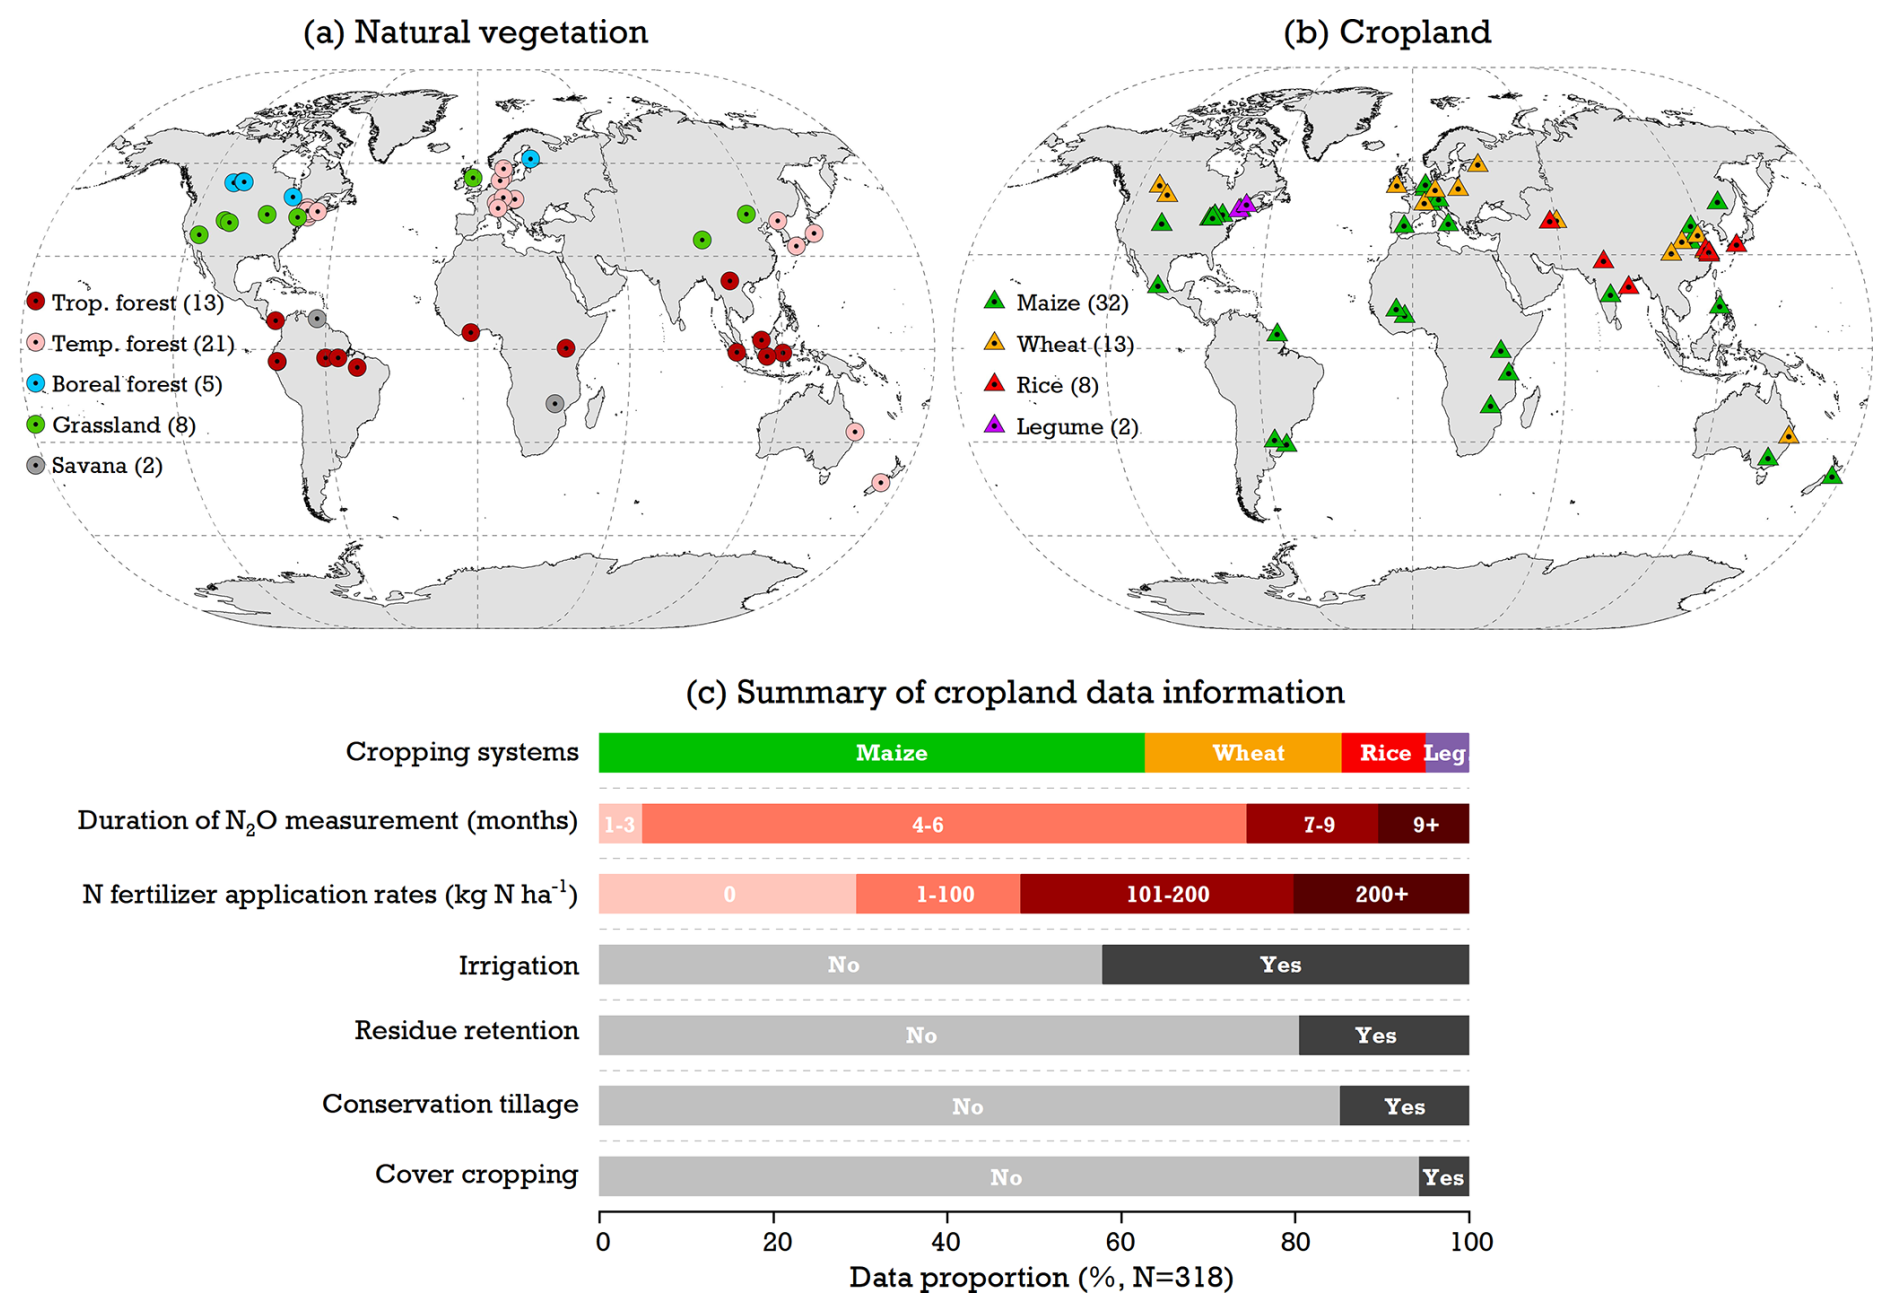
Figure 2Distribution of in situ N2O observation studies used for model evaluation based on (a) natural vegetation and (b) cropland. For cropland field experiments, overall N2O flux measurement information – cropping systems, measurement duration, and N fertilizer and conservation agriculture managements (i.e., residue, tillage, and cover crops) – is shown in (c).
Due to the lack of weather and N deposition data for most study sites, an observation-based gridded climate dataset, CRU JRA v2.4 (Harris et al., 2020; Kobayashi et al., 2015), and an atmospheric N deposition dataset simulated by CCMI (NHx–N and NOy–N; Tian et al., 2018) were used as inputs to drive LPJ-GUESS, selecting the representative grid cell (0.5°×0.5°) for each experimental site. To maintain equilibrium in soil C and N pools after model spin-up, natural-vegetation and cropland systems were simulated continuously from 1901 onwards at their respective experimental sites. Since N fertilizer management had been established for several years before the start of the N2O emission trials at most cropland sites, we assumed a 5-year period of N fertilizer use in croplands prior to the field trials, with application rates being consistent with those used during the trials. Throughout the experimental period, simulations based on croplands were performed based on the management details reported in the literature (Table S2), whereas natural-vegetation sites remained unmanaged (i.e., growing under rain-fed and unfertilized conditions without timber or biomass harvests). Additionally, to estimate soil hydraulic properties and evaluate our developed N transformation processes, soil physical characteristics – such as soil pH and texture (i.e., content of sand, silt, and clay) – were collected from the literature and kept constant during the simulation period. The accuracy of the simulated N2O fluxes was statistically assessed using the adjusted R2 (the goodness of fit for the linear regression), mean error (ME), mean absolute error (MAE), and root mean square error (RMSE) across all sites.
2.3.2 Global soil N2O emissions and their drivers
For global-scale applications, climate variables from the CRU JRA v2.4 dataset – daily temperature (minimum, mean, and maximum), precipitation, solar radiation, specific humidity, and wind speed – were used for driving model simulations, covering the period from 1901 to 2020 at a resolution of 0.5°×0.5° (Harris et al., 2020; Kobayashi et al., 2015). Historical annual atmospheric CO2 concentration and monthly N deposition rates over the same period were derived from Meinshausen et al. (2020) and Tian et al. (2018), respectively (Fig. S1 in the Supplement). Land use and land cover data spanning from 1901 to 2020 were sourced from HILDA+ (Winkler et al., 2020), initially at a 0.01° resolution and later being aggregated to 0.5°. This dataset provides annually varying proportions of natural vegetation, pasture, and cropland for each grid cell. The crop distribution map, including rain-fed and irrigated fractions per grid cell around the year 2000, was extracted from the MIRCA dataset (Portmann et al., 2010) and aggregated to match the six CFTs simulated in the model (see Sect. 2.1 above). To parameterize soil water characteristics, global gridded soil profile data at 0.5° resolution from WISE3 (Batjes, 2009) were used. Synthetic N fertilizer and manure application rates to crops were obtained from AG Grid (Elliott et al., 2015) and Zhang et al. (2017a), respectively, covering the period of 1901–2015 (Fig. S1). As N fertilizer data were available only until 2015, we assumed that N application rates to croplands during 2016–2020 remained steady at 2015 levels. At present, pasture ecosystems represented in LPJ-GUESS do not receive any N fertilizer inputs.
Table 1Simulation setups representing the contribution of environmental factors to global soil N2O emissions (see Sect. 2.3.2).
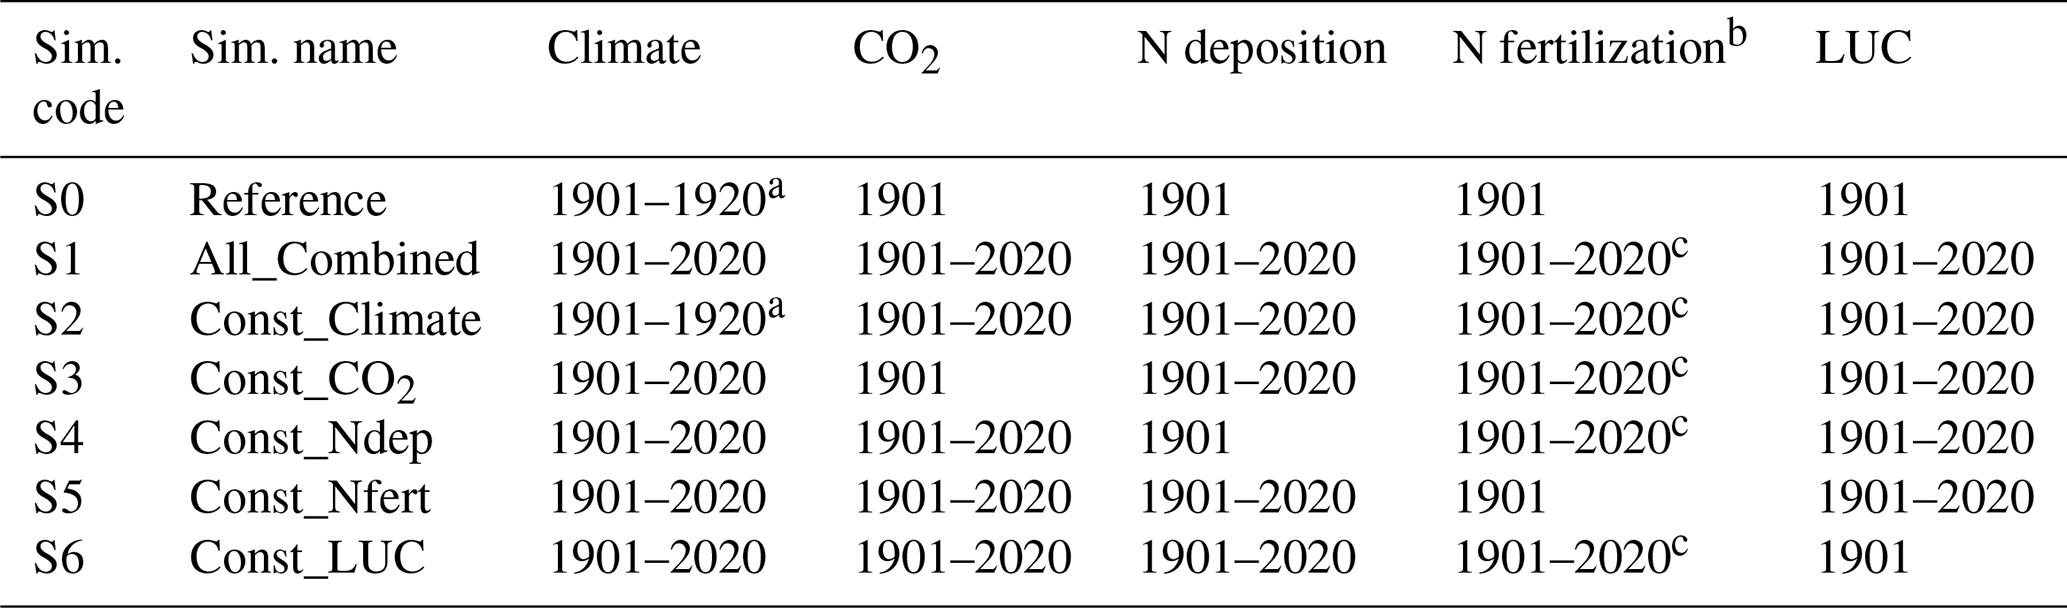
a Historical climate (1901–1920) with temperature de-trended, repeated throughout the period of 1901–2020. b N fertilization on croplands, including mineral N fertilizer and manure application. Fertilized pasture is not simulated in this study. c Historical N inputs between 1901–2015, with the 2015 data being extended to cover the period of 2016–2020.
All model experiments for this part of the study spanned from 1901 to 2020. However, the focus of our analyses was primarily on the period from 1960 to 2020, during which time N fertilizer use became prevalent. In the “Reference” simulation (referred to as S0 in Table 1), the model was driven by a constant recycled 1901–1920 climate, together with 1901 CO2 concentration, N deposition, land use, and fertilizer inputs, to monitor model drift and internal variation. The result of this run was used to generate background N2O emissions with minimal human influence. Conversely, the “All_Combined” run (referred to as S1 in Table 1) incorporated dynamic inputs for all these factors from 1901 to 2020, reflecting realistic N2O emissions due to anthropogenic perturbation and environmental change. In each subsequent simulation (referred to as S2–S6 in Table 1), all but one of the factors were allowed to vary dynamically over time, with one factor being held constant at its 1901 level. This setup was designed to isolate and identify the individual impact of each factor on N2O emissions by comparing S1 with any runs in S2–S6 (denoted as ΔN2Osi in Eq. 24). The total change caused by these five factors was calculated as the difference between S1 and S0 simulations (ΔN2Oall). The relative contribution (%) of every single factor to the total change in N2O emissions was then determined by the ratio of ΔN2Osi to ΔN2Oall using Eq. (24):
where ΔN2Osi% represents the relative contribution of each factor to the total change in N2O emissions, and ΔN2Ointeractive% denotes the interactive effects between these factors, presented as a percentage. Si refers to the five environmental factor simulations of Const_Climate, Const_CO2, Const_Ndep, Const_Nfert, and Const_LUC given in Table 1.
3.1 Model–observation comparisons at site scale
3.1.1 Model performance across all sites
The simulated cumulative N2O emissions generally showed a good agreement with measurements, with regression slopes ranging from 0.72 to 0.87. However, the model tended to overestimate measured emissions by 65 % globally for natural vegetation and by 11 % for cropland sites (Fig. 3a and b). According to in situ observations of natural lands (Fig. S2), tropical forests were identified as the primary N2O-emitting sources, showing a mean cumulative flux of 1.23 kg N ha−1 annually. Temperate forests followed with an average flux of 0.52 kg N ha−1 yr−1, and boreal forests had the lowest emissions at 0.12 kg N ha−1 yr−1. The model broadly reproduced a similar regional pattern, with the highest N2O emissions in the warm tropics and the lowest emissions in the cold boreal region, although it underrepresented N2O sources in the tropics by 15 % while overestimating emissions in temperate and boreal forests by 84 % and 50 %, respectively. Both field measurements and model experiments indicated grasslands to be a weak N2O source, with the simulations being 24 % lower than the observed emissions of 0.19 kg N ha−1 yr−1 on average. This pattern of underestimation was also found at the grass-dominant savanna site, where LPJ-GUESS underestimated the reported N2O fluxes of the field trials by 78 % (Fig. S2).
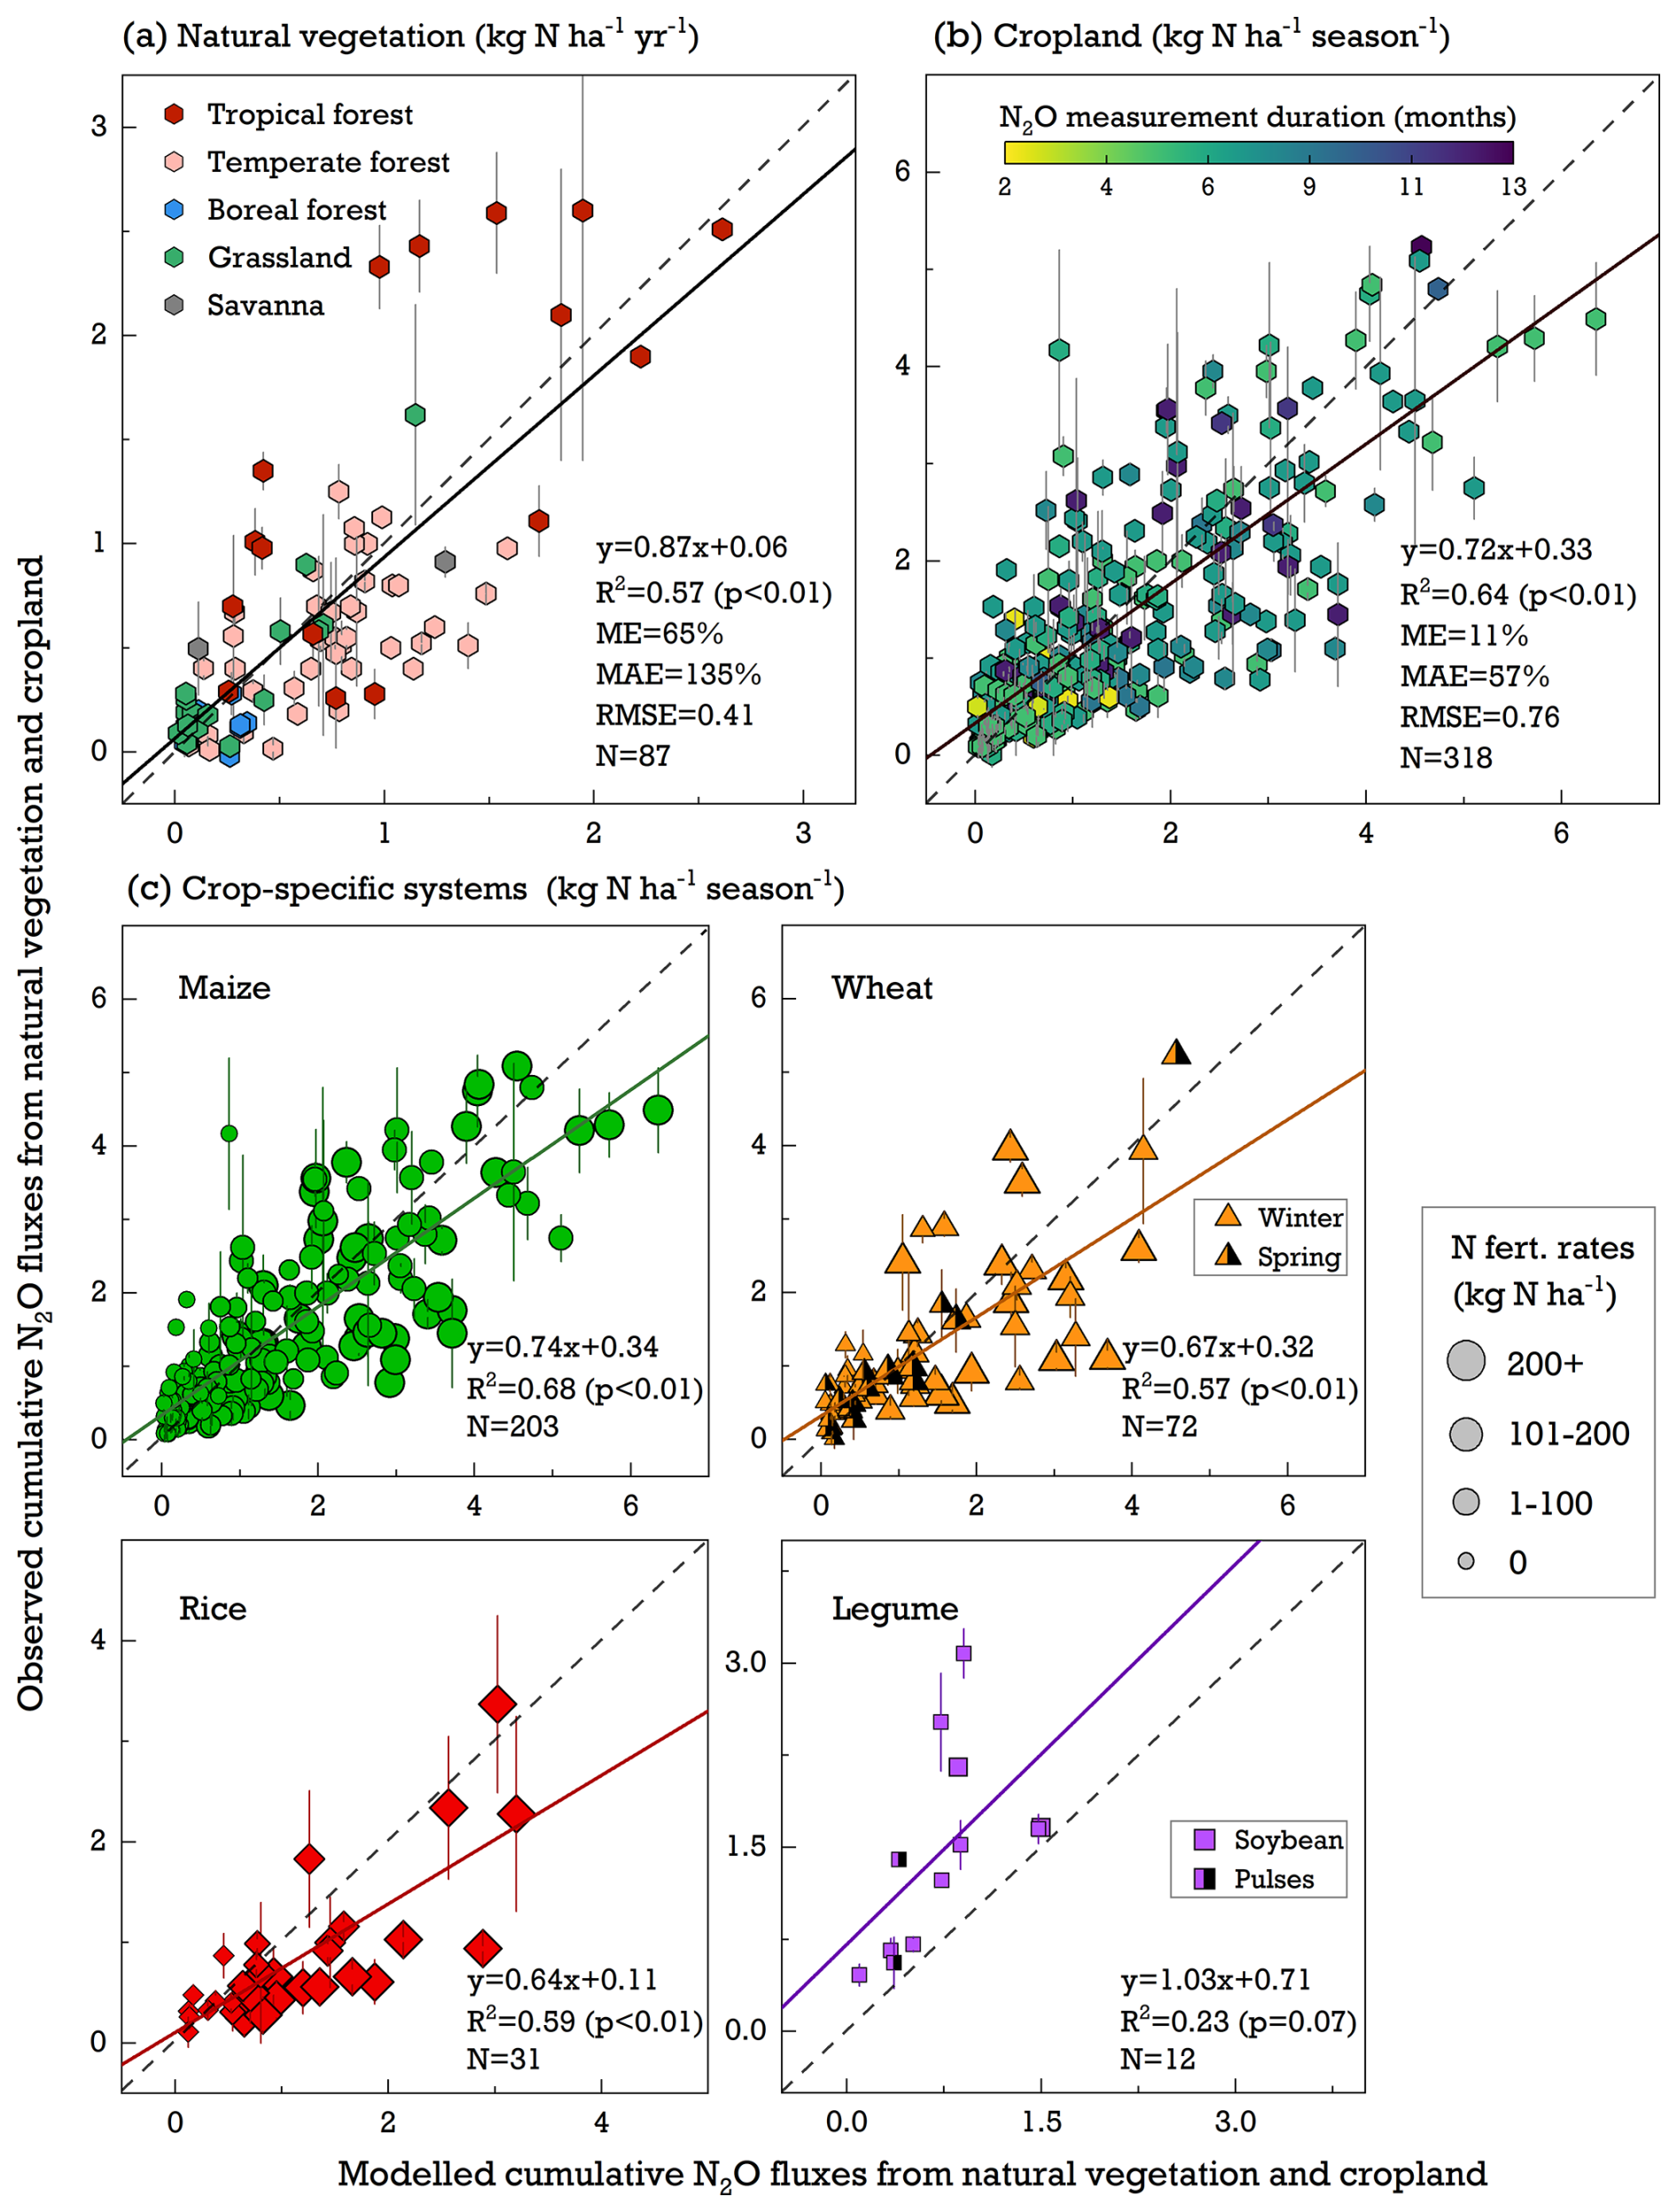
Figure 3Comparison of modeled and observed cumulative N2O emissions from (a) natural-vegetation, (b) cropland, and (c) crop-specific systems across all studied sites. The dashed line is the 1:1 line, and the bold black line is a fitted linear regression. ME (mean error) and MAE (mean absolute error) are shown as percentages, while RMSE (root mean square error) is in kg N ha−1 yr−1 for natural vegetation and in kg N ha−1 per season for cropland. Error bars denote the standard error from different field trial replicates collected from the literature. In (c), marker sizes from large to small indicate descending N fertilizer rates applied to crops.
Compared with natural vegetation, cropping systems showed higher N2O emissions throughout the growing period, primarily due to their high levels of N fertilizer use (Fig. 3c). While the linear regression slopes for the four simulated cropping systems were not far from 1.0, LPJ-GUESS overestimated the seasonal N2O fluxes in most cropland measurements. This overestimation was particularly pronounced in field-grown rice trials, wherein the modeled emissions were approximately 50 % higher than the field observations. Conversely, grain legumes – crops that fix atmospheric N and typically receive little N fertilizer in the fields – were the only cropping system showing lower simulated N2O emissions than measured, with an underestimation of 45 % (Fig. 3c). A positive exponential relationship between N fertilizer input and cumulative N2O emissions was found across various field trials in observations. Although LPJ-GUESS simulations effectively captured this observed increase in N2O fluxes with rising N fertilizer levels, some discrepancies were noted. Specifically, the model underestimated emissions in the unfertilized soils by 28 % and overestimated emissions in most highly fertilized trials (>200 kg N ha−1) by 65 %. This overestimation tended to become more pronounced with higher N application rates (Fig. S2).
3.1.2 Seasonal pattern of N2O emissions in natural vegetation
The seasonal pattern of N2O emissions showed significant variation across different vegetation ecosystems and between individual years in both field experiments and model simulations. For a tropical rainforest in Brazil (Fig. 4a), observed fluxes of N2O increased during the rainy season and rapidly decreased over the dry period. The model was able to reproduce this rainfall-induced mean response; however, the simulated peak flux was delayed by 2 months compared with the observations, likely due to a temporal mismatch between the modeled and reported soil moisture during the wet season (Fig. S3; Davidson et al., 2008). In contrast, a tropical montane forest in Indonesia (Fig. 4b), where rainfall is more evenly distributed throughout the year (Purbopuspito et al., 2006), exhibited no distinct seasonal pattern in N2O fluxes in the simulations or the observations. Soil temperature and water availability jointly influenced the magnitude of N2O emissions in temperate and boreal ecosystems, with the largest fluxes being observed during summer (June–August) and weaker sources (or occasional sinks, depending on the sites) being observed during the winter season (Fig. 4c–g). LPJ-GUESS did not capture these negative fluxes recorded in the field trials and instead produced near-zero N2O emissions in cold and dry conditions (Fig. 4f and g), mainly as a result of negative temperatures deactivating nitrification and denitrification during the winter. Soil moisture was identified as the dominant factor controlling the seasonal dynamics of N2O fluxes in a semi-arid grassland with a sandy loam soil texture, where observed WFPS ranged from 0.01 to 0.48 between June and August (Du et al., 2006). While the model effectively represented this N2O rise due to increasing WFPS under aerobic conditions, it overestimated total emissions by ∼95 % over the summer season (Fig. 4h). This overestimation primarily resulted from the model simulating a higher WFPS value of 0.37 for this sand-dominant soil compared with the observed average of 0.20 in these 3 months (Fig. S3; Du et al., 2006).
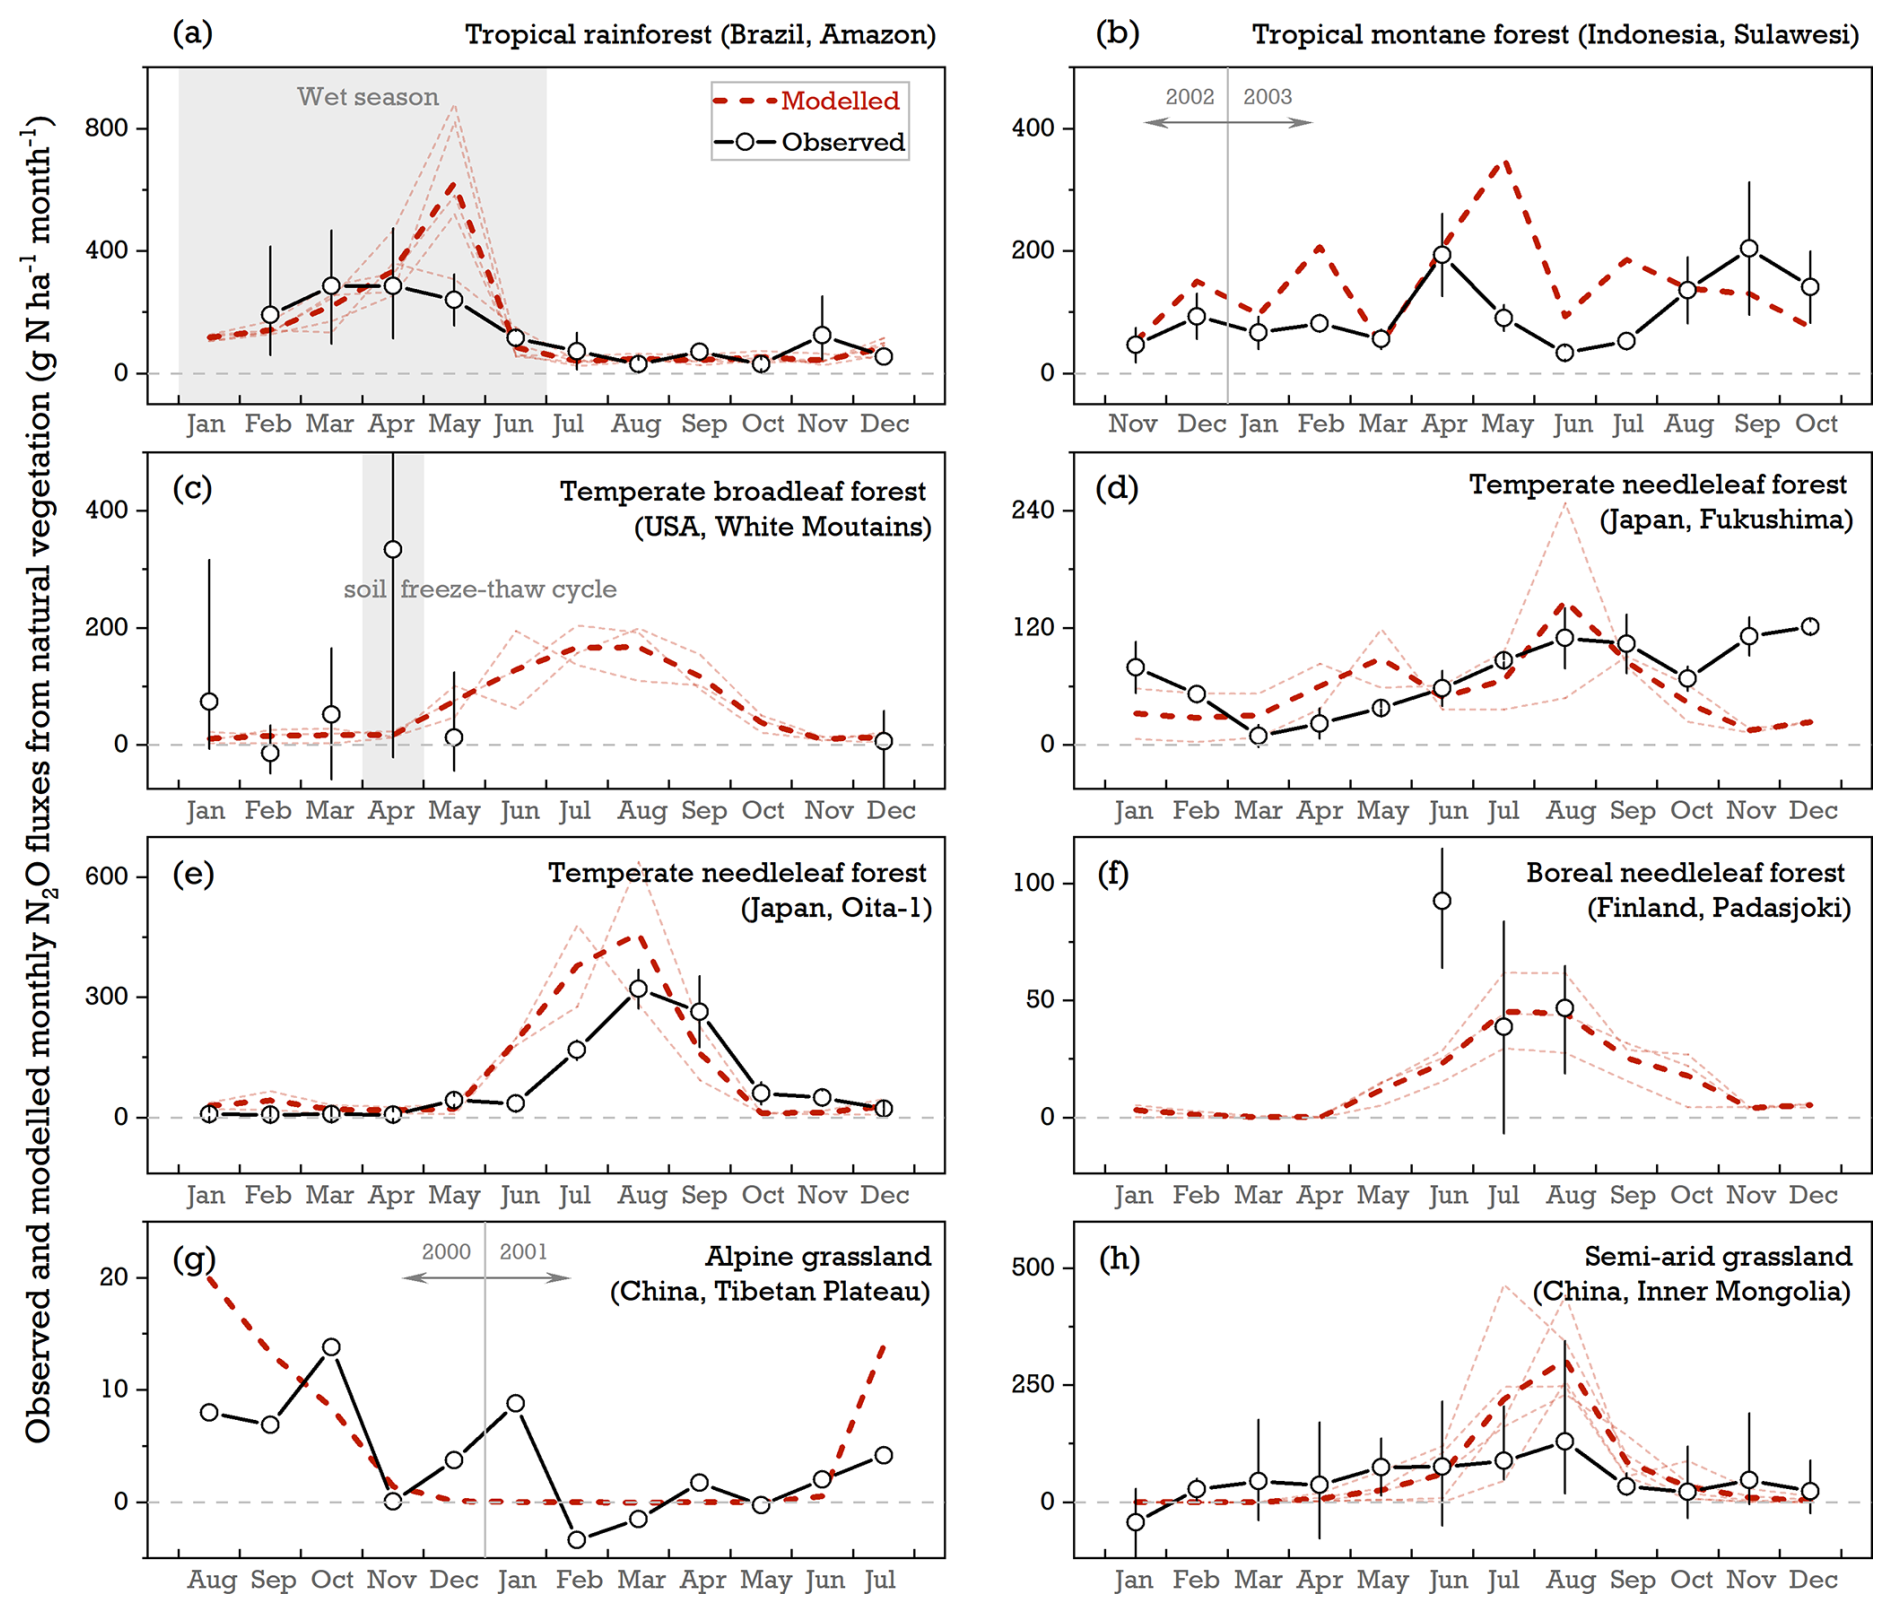
Figure 4Comparison of modeled and observed monthly N2O emissions at eight natural-vegetation sites: (a) Tapajós National Forest, Brazil (2.9° S, 54.9° W; 2000–2004; Davidson et al., 2008); (b) tropical montane forest, central Sulawesi, Indonesia (1.4° S, 120.3° E; November 2002–October 2003 in Wuasa; Purbopuspito et al., 2006); (c) White Mountain National Forest, USA (43.9° N, 71.8° W; 1998–2000; Groffman et al., 2006); (d) temperate Cedrus forest, Fukushima, Japan (37.4° N, 140.3° E; 2003–2004; Morishita et al., 2007); (e) temperate Cedrus forest, Oita-1 site, Japan (33.2° N, 131.3° E; 2003–2004; Morishita et al., 2007); (f) boreal spruce forest, Finland (61.3° N, 24.9° E; June–August 2000, 2001, and 2003; Maljanen et al., 2006); (g) alpine grassland, Tibetan Plateau, China (35.1° N, 93.1° E; August 2000–July 2001; Pei et al., 2004); and (h) native semi-arid grassland, Inner Mongolia, China (43.5° N, 114.7° E; 1995, 1998, and 2001–2003; Du et al., 2006). The dashed dark-red lines denote the multi-year average of simulations over the observation period. Dashed lines in lighter colors represent the simulations for individual years. Open circles indicate the observed N2O fluxes averaged over all measurement years, with error bars showing the maximum and minimum values.
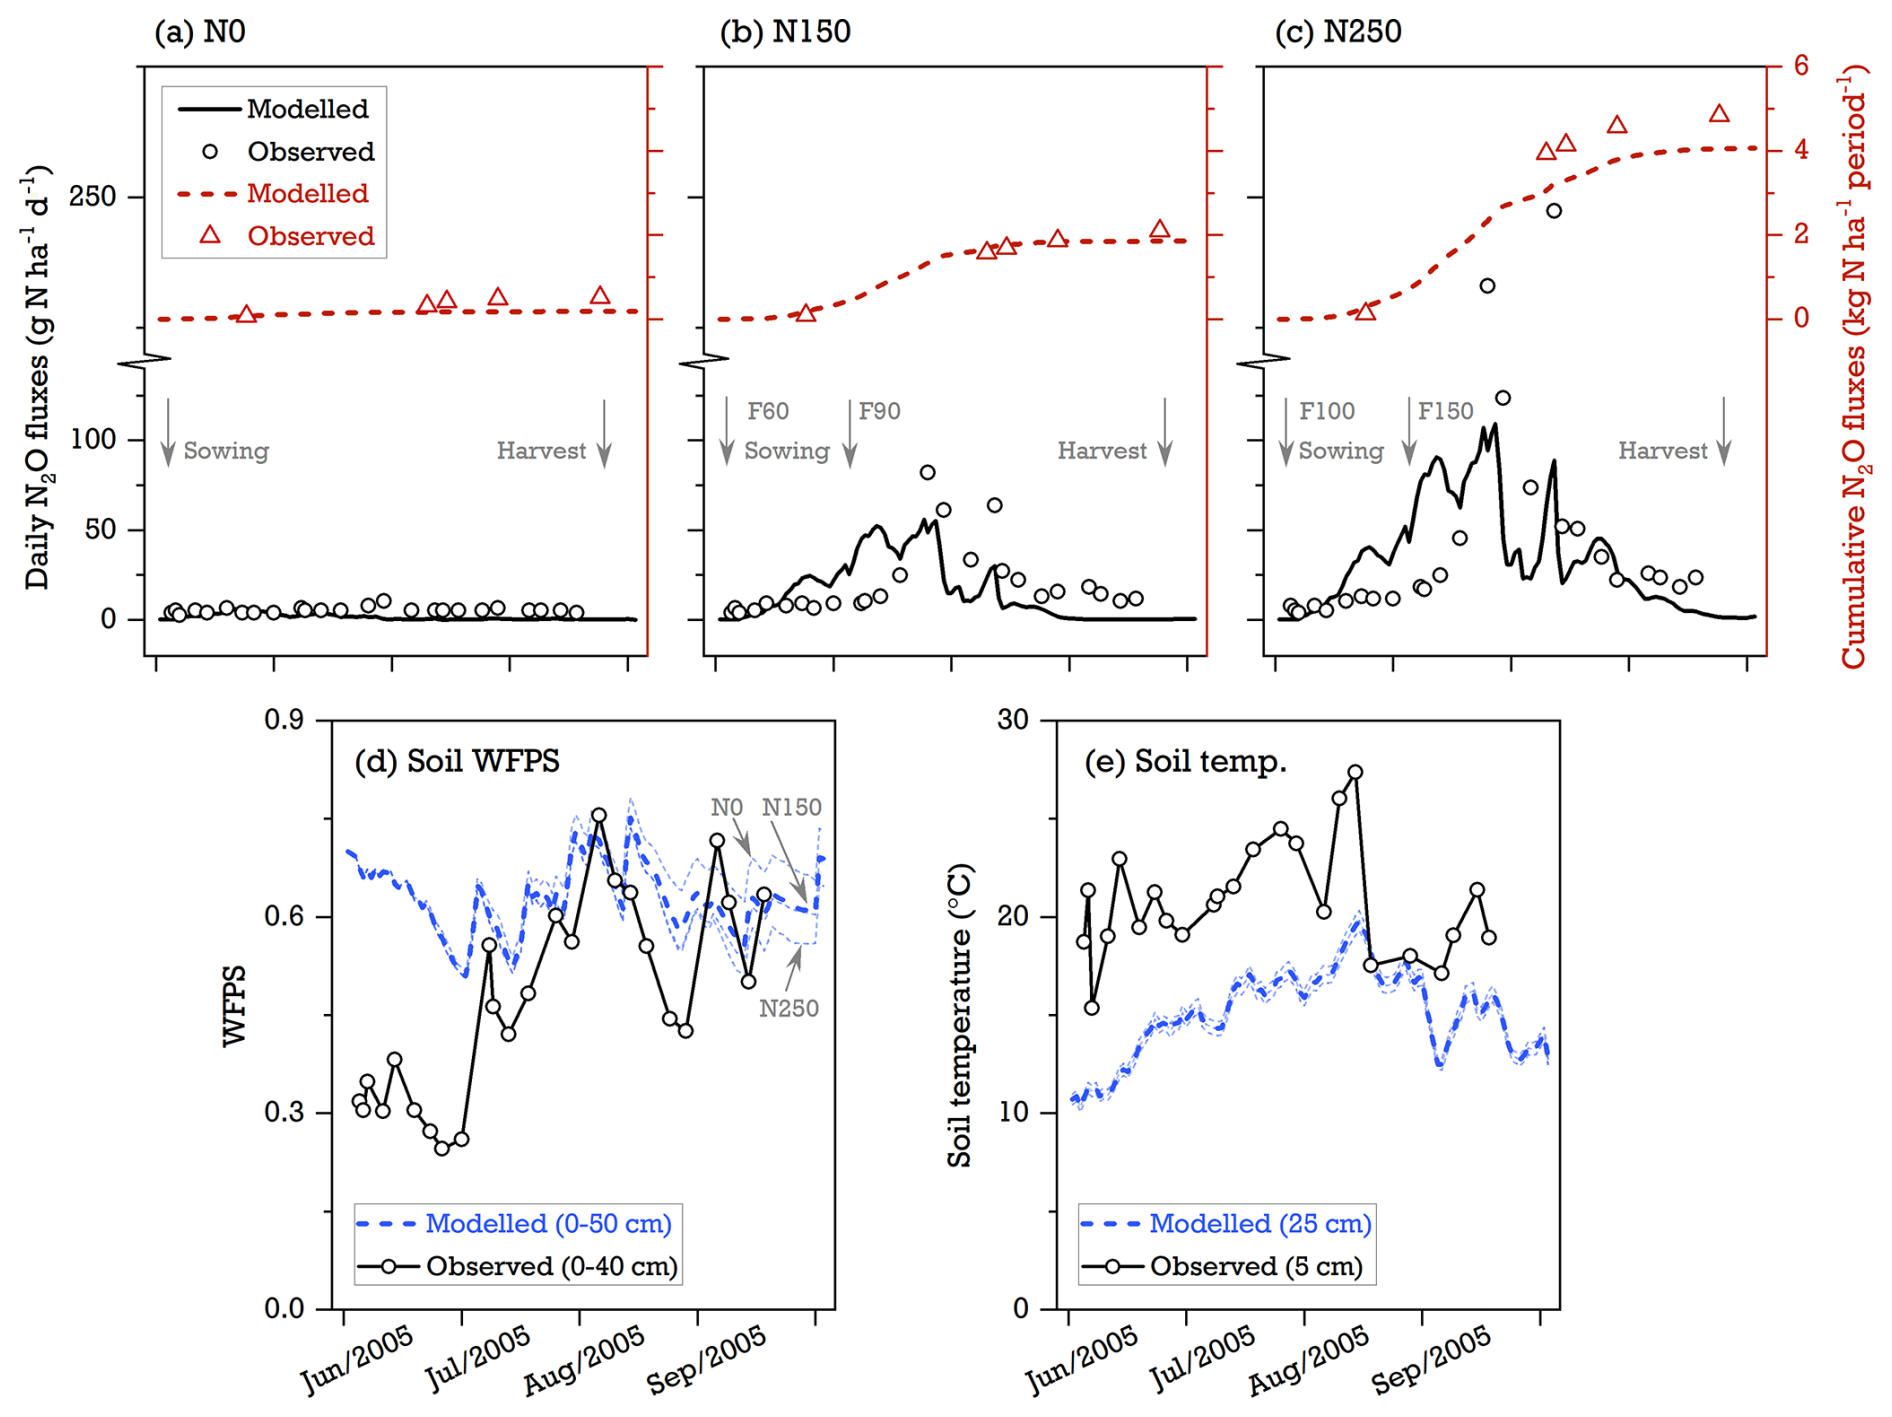
Figure 5Modeled and observed seasonal pattern of (a–c) N2O emissions in response to three levels of N fertilizer inputs (0, 150, and 250 kg N ha−1, referred to as N0, N150, and N250), (d) soil moisture (WFPS), and (e) soil temperature in °C at a rain-fed maize field site in China for the cropping season of 2005 (47.6° N, 133.5° E; Song and Zhang, 2009). In (a)–(c), totals of 40 % and 60 % of the mineral N fertilizer are applied at the time of the maize-sowing and maize-jointing stages, respectively, with the implemented managements of conventional tillage, zero residue retention, and no cover crops (Song and Zhang, 2009). The thick dashed blue lines in (d) and (e) denote the simulated mean of three N fertilizer inputs. The thinner dashed lines represent the simulations for individual N treatments.
3.1.3 Cropland N2O emission response to N fertilization
The model's ability to simulate the observed N2O flux response to N fertilizer application was assessed using seasonal data from a rain-fed maize field site in northeastern China (47.6° N, 133.5° E). Alongside three levels of N fertilizer inputs (0, 150, and 250 kg N ha−1, denoted as N0, N150, and N250 below), this cropping system was managed with conventional tillage, zero residue retention, and no cover crops (see Song and Zhang, 2009). Over the maize-growing season, the cumulative N2O fluxes were measured at 0.4, 2.0, and 4.8 kg N ha−1 for the N0, N150, and N250 treatments, respectively, exceeding the simulated results of 0.2, 1.8, and 4.1 kg N ha−1. The model's estimates of the fertilizer-induced N2O emission factors were 1.1 % for the N150 treatment and 1.6 % for the N250 treatment, which closely matched the measured range of 1.0 %–1.8 %, suggesting a good overall agreement between the model simulations and field experiments regarding the N2O response to N addition (Fig. 5a–c). However, LPJ-GUESS failed to capture the peak N2O fluxes at the maize-flowering stage, particularly in the highly fertilized N250 treatment (Fig. 5c). The remaining difference between modeled and measured seasonal dynamics was found within the 3-week period after each application of N fertilizer, with the simulated N2O rates being much higher than the observed values. This overestimation indicated that the soil N transformation processes in the model were overly sensitive to reactive N input. At this site with silt–clay-textured soil, the simulated seasonal trends of soil WFPS and temperature broadly aligned with the observed variations (Pearson correlation coefficients of 0.42–0.57, p<0.05 for both variables) despite the modeled WFPS values being consistently higher than the observed ones (Fig. 5d and e).
3.2 Global soil N2O emissions
The modeled global N2O emissions from the soil to the atmosphere increased steadily from 1960 to 2020, with estimates growing from 5.6±0.2 Tg N yr−1 in the 1960s to 9.9±0.3 Tg N yr−1 by the 2010s (Fig. 6). While natural soils remained as the major sources of N2O, their contributions to global total emissions declined from 81% to 59 % over this period. In contrast, simulated N2O emissions in croplands showed a clear upward trend from 1960, coinciding with the widespread use of synthetic N fertilizer. Croplands reached their highest average emission rate, 3.6±0.2 Tg N yr−1, in the 2010s, representing 37 % of global land emissions. Pasture ecosystems were identified as weak sources of N2O in our simulations, with historical estimates varying between 0.3±0.04 to 0.4±0.05 Tg N yr−1 (Table S3); we note, however, that fertilized pastures were not simulated in the model. Overall, the model's estimates of global soil N2O emissions since the 1980s – in terms of both magnitude and interannual variability – were broadly consistent with other studies using bottom-up approaches (Global Nitrous Oxide Budget; Tian et al., 2024), process-based modeling (global N2O Model Intercomparison Project, NMIP; Tian et al., 2019), and atmospheric-inversion methods (Thompson et al., 2019).
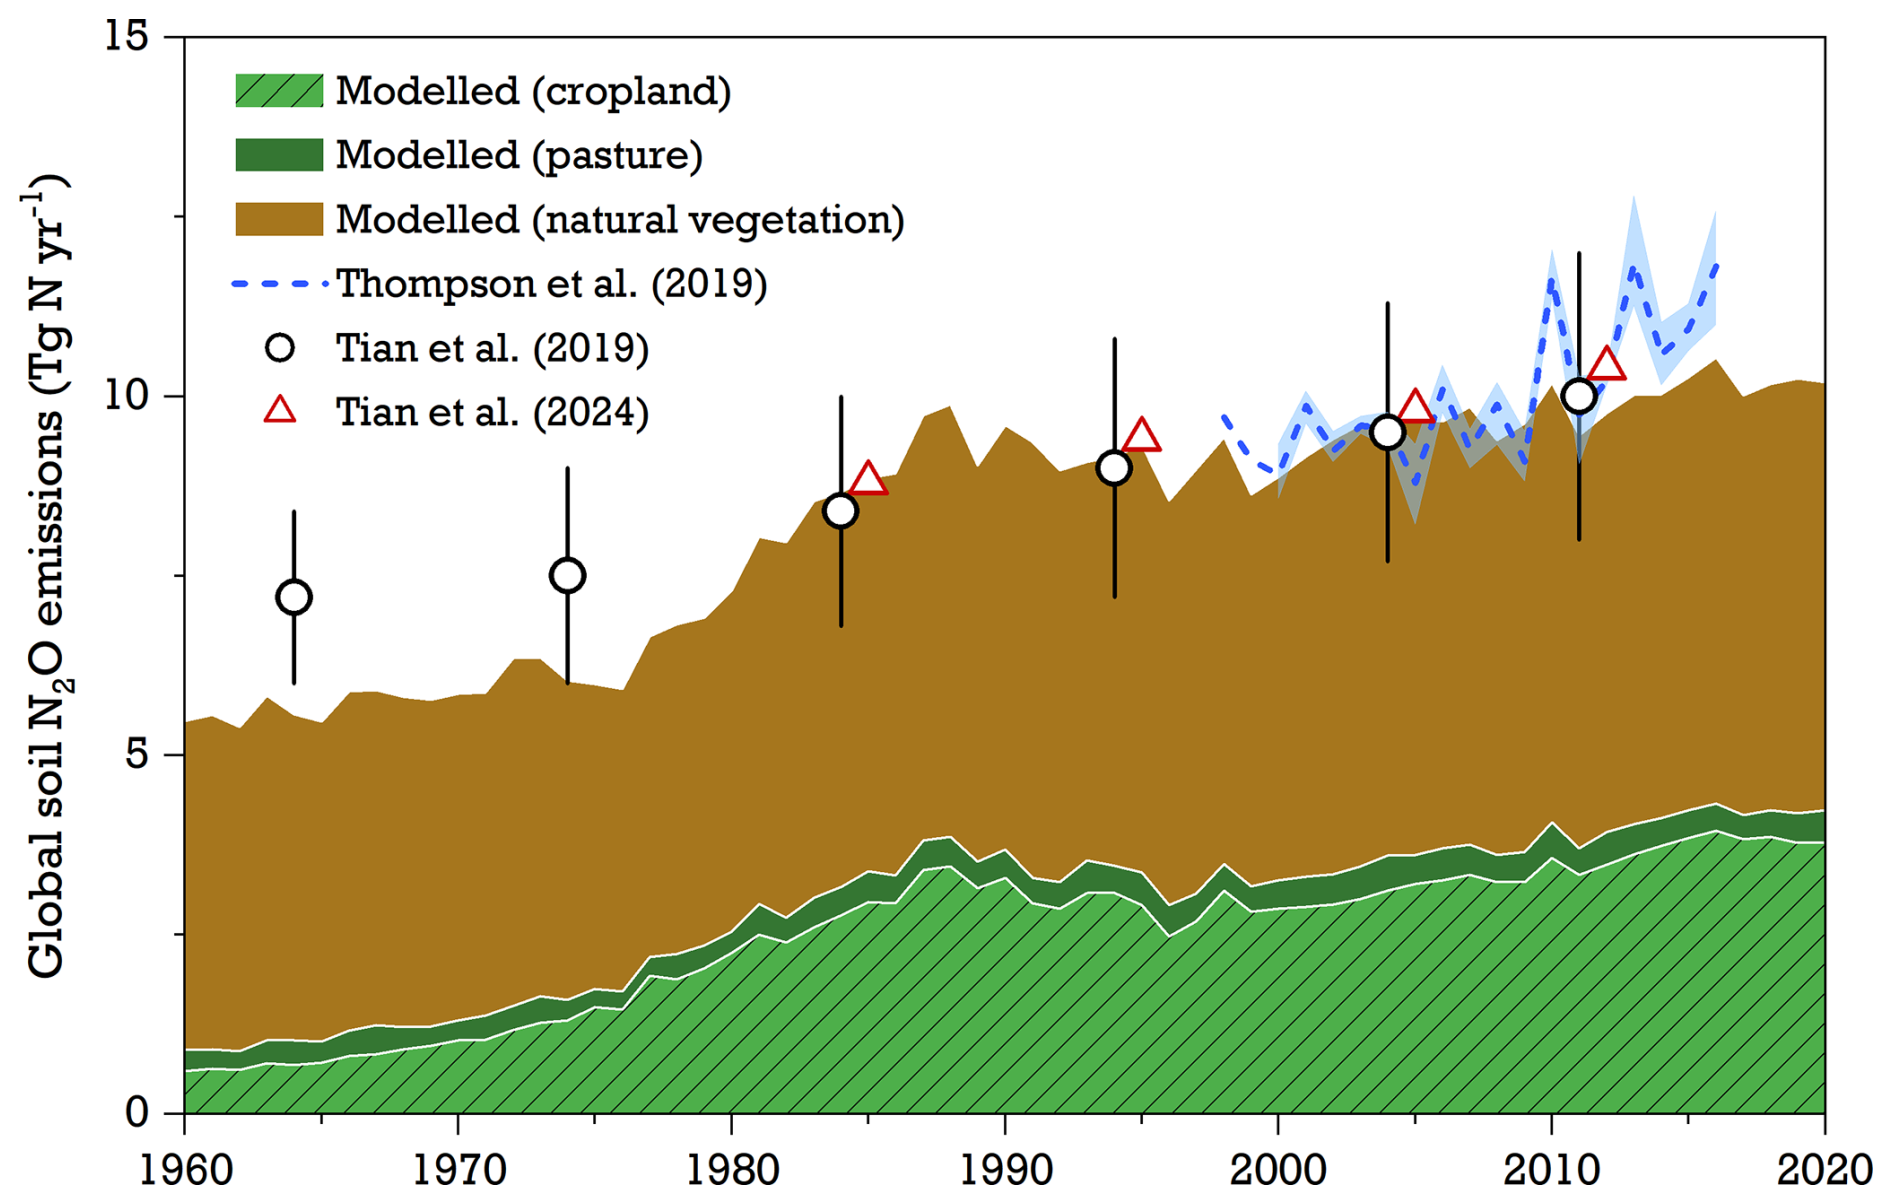
Figure 6Modeled global soil N2O emissions from natural vegetation, pasture, and cropland by LPJ-GUESS for the period of 1960–2020 (see S1 run in Table 1) compared with global land estimates from the literature. Reported data from Tian et al. (2019) in open circles indicate 10-year average emissions simulated by seven process-based vegetation models, with error bars representing 1 standard deviation. The decadal mean emissions from Tian et al. (2024), shown in red triangles, are derived from bottom-up estimates and exclude the emissions from non-soil components (such as inland water, fossil fuels and industry, and biomass burning). Annual N2O emissions between 1998–2016 from Thompson et al. (2019), shown with the dashed line, represent the average of three atmospheric-inversion frameworks, with the range indicated by the blue-shaded area.
The modeled map of soil N2O emissions revealed large spatial variation in the 1960s (Fig. 7a). Simulated N2O rates as high as 1.5–2.5 kg N ha−1 yr−1 were found in the tropics (such as the Congo Basin) and parts of Europe and the United States, where neither water nor temperature was a critical constraint for nitrification and denitrification processes. Conversely, regions with arid climates or at high latitudes experienced N2O emissions as low as 0–0.5 kg N ha−1 yr−1 as soil water content or temperature limitations restricted the turnover rates of soil N pools in LPJ-GUESS. At a regional scale, Africa and South America, with their extensive areas of natural vegetation, together accounted for 50 % of simulated global land N2O emissions in the 1960s. North America and Southeast Asia followed, with contributions of 13 % and 9 %, respectively (Table S3).
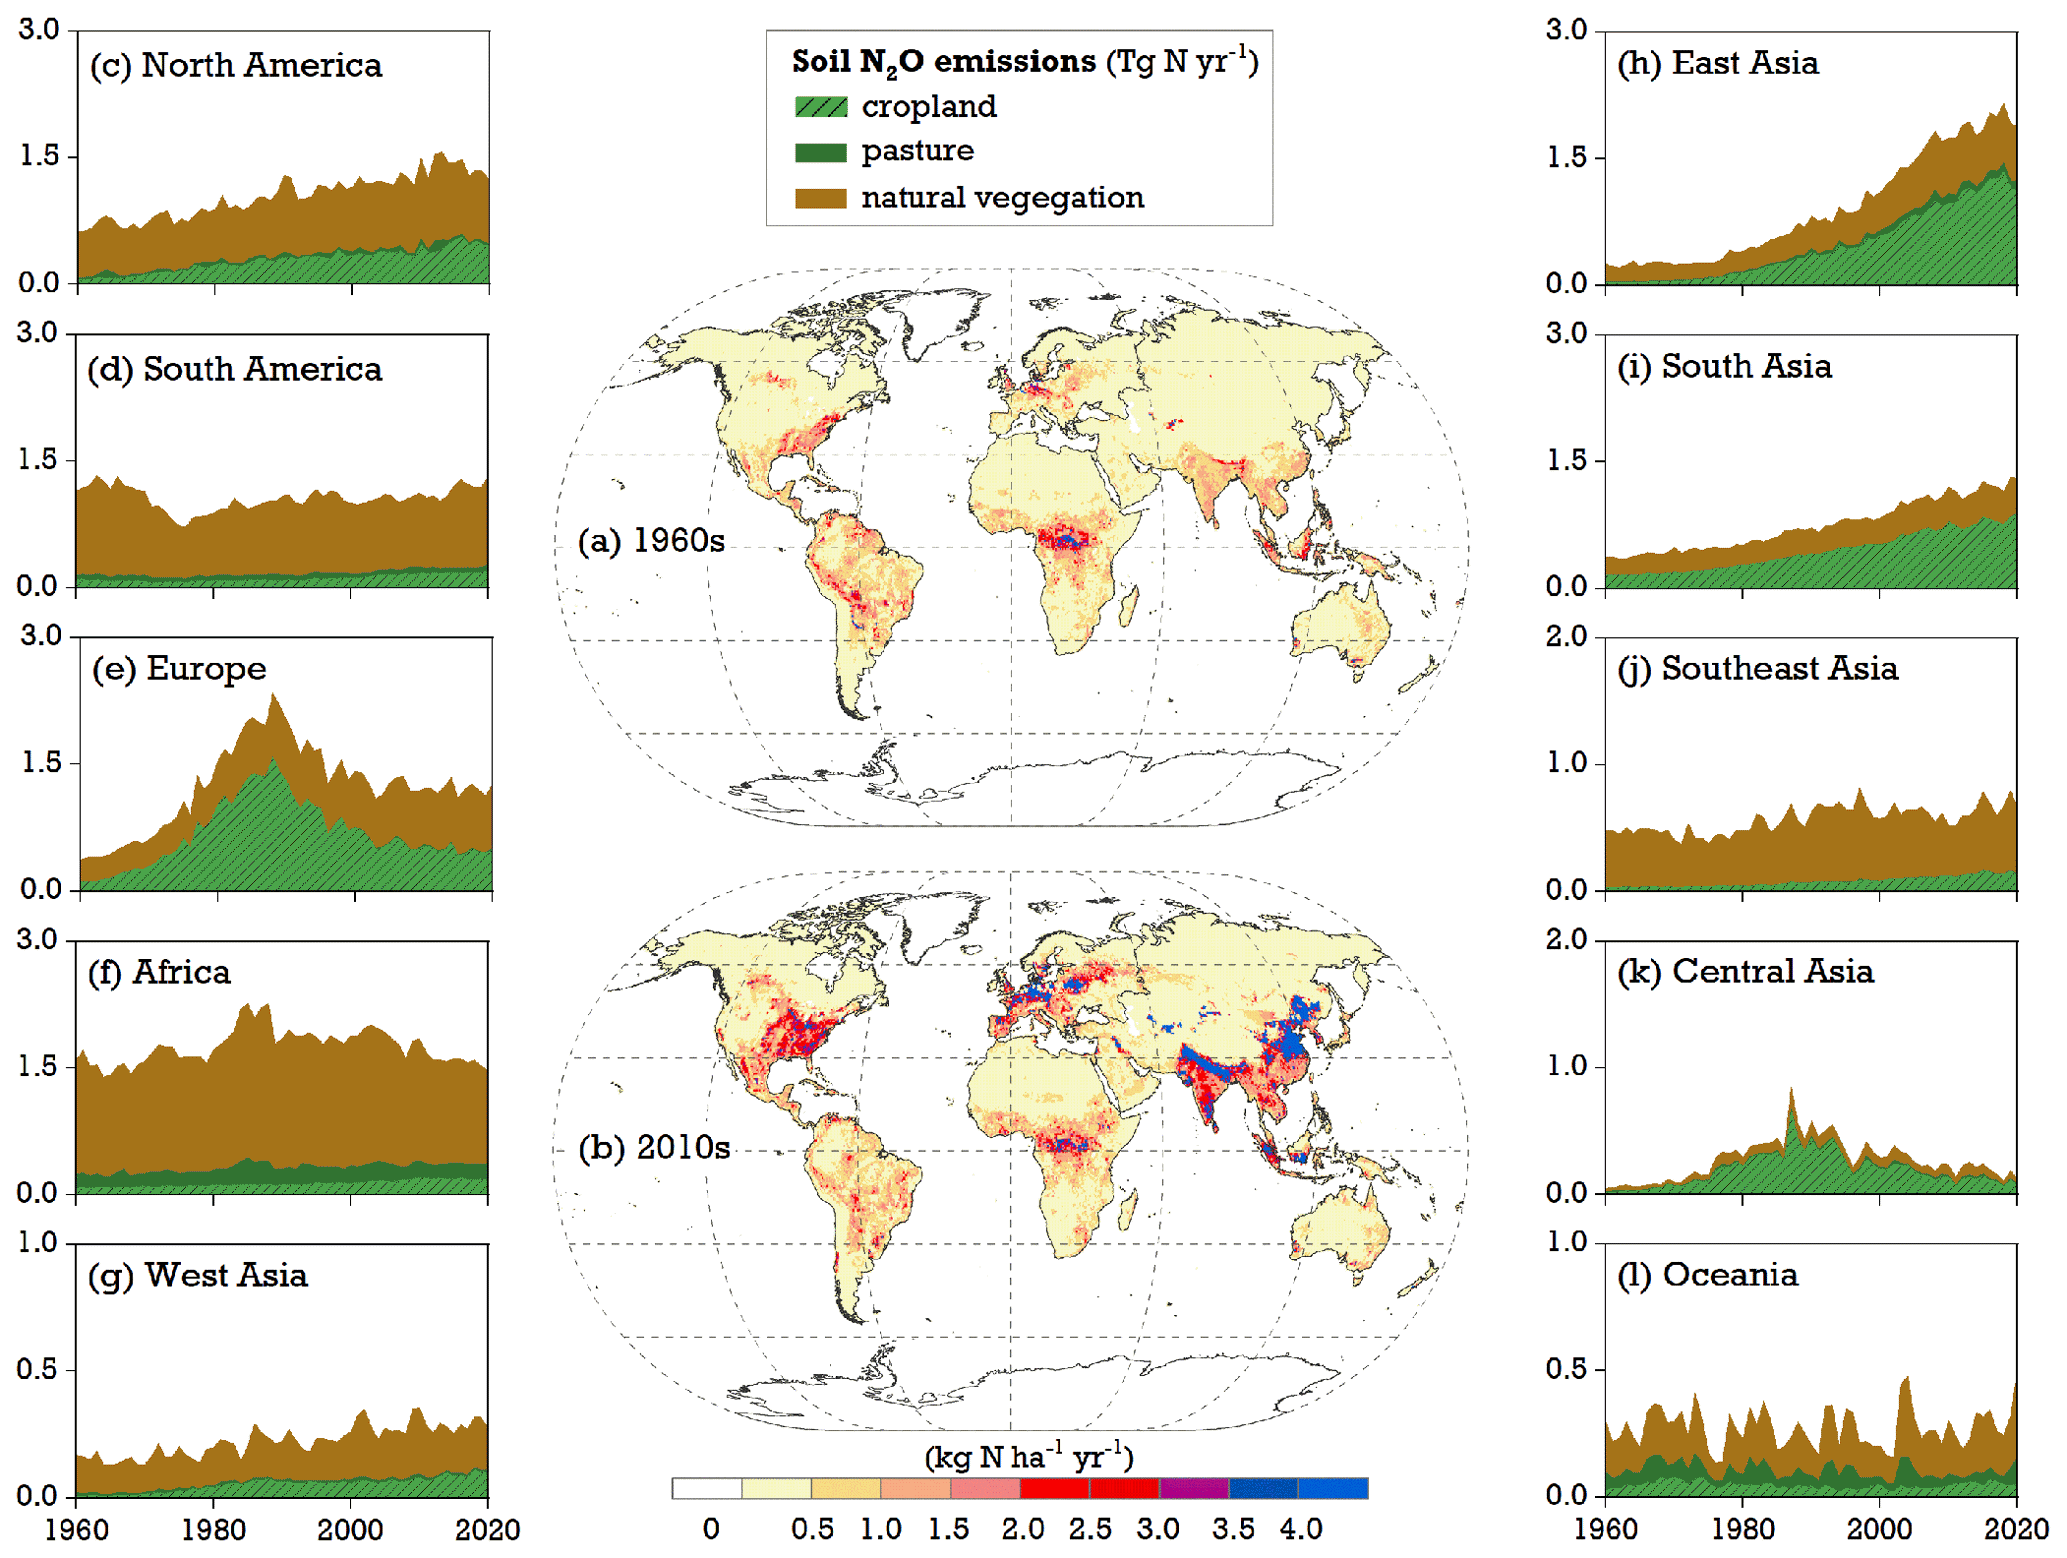
Figure 7Maps of soil N2O emissions modeled by LPJ-GUESS in the (a) 1960s and (b) 2010s and (c–l) time series of simulated total soil N2O emissions from natural vegetation, pasture, and cropland at a continental level for the period of 1960–2020 (see S1 run in Table 1). The division of the 10 continents used in this study is given in Fig. S4.
Compared with the 1960s, soil N2O emission rates increased in most parts of the world during 2011–2020, mainly as a result of the combined effects of environmental changes and N management practices (Fig. 7b). The regions with high N deposition and intensive fertilizer use – such as northern China, India, central Europe, and the eastern United States (Fig. S1) – were simulated to have the highest N2O rates, ranging from 3.5 to 4.5 kg N ha−1 yr−1. Compared with other regions, East Asia and South Asia showed the fastest growth in emissions between the 1960s and 2010s (Fig. 7c–l), largely due to their expansion of fertilized croplands. From 2011 to 2020, these two regions jointly contributed 31 % to global total emissions, which was slightly higher than the combined 27 % contribution from North America and Europe (Table S3).
3.3 Drivers of increased N2O emissions
Changes in the temporal–spatial patterns of soil N2O emissions were influenced by a combination of land use factors, climate variation, and atmospheric-composition changes. Between 1960–2020, the global increase in soil N2O emissions was primarily driven by the growing use of N fertilizer and manure, as well as N deposition and climate change, which elevated soil levels of reactive N available for N2O production (Fig. 8). During the 2010s, N fertilization alone contributed 3.2±0.2 Tg N yr−1, representing 58 % of the increased global terrestrial emissions. N deposition and climate change followed, with estimated contributions of 46 % and 24 %, respectively (Table S4). In contrast, rising CO2 concentrations were found to lower soil N2O emissions, with the negative effect increasing over time. This reduction was particularly significant in natural-vegetation and pasture ecosystems and was less pronounced in croplands. From 2011 to 2020, the CO2 effect was simulated to reduce global soil N2O emissions by 1.83±0.1 Tg N yr−1, roughly offsetting half of the increased emissions due to N fertilizer use.
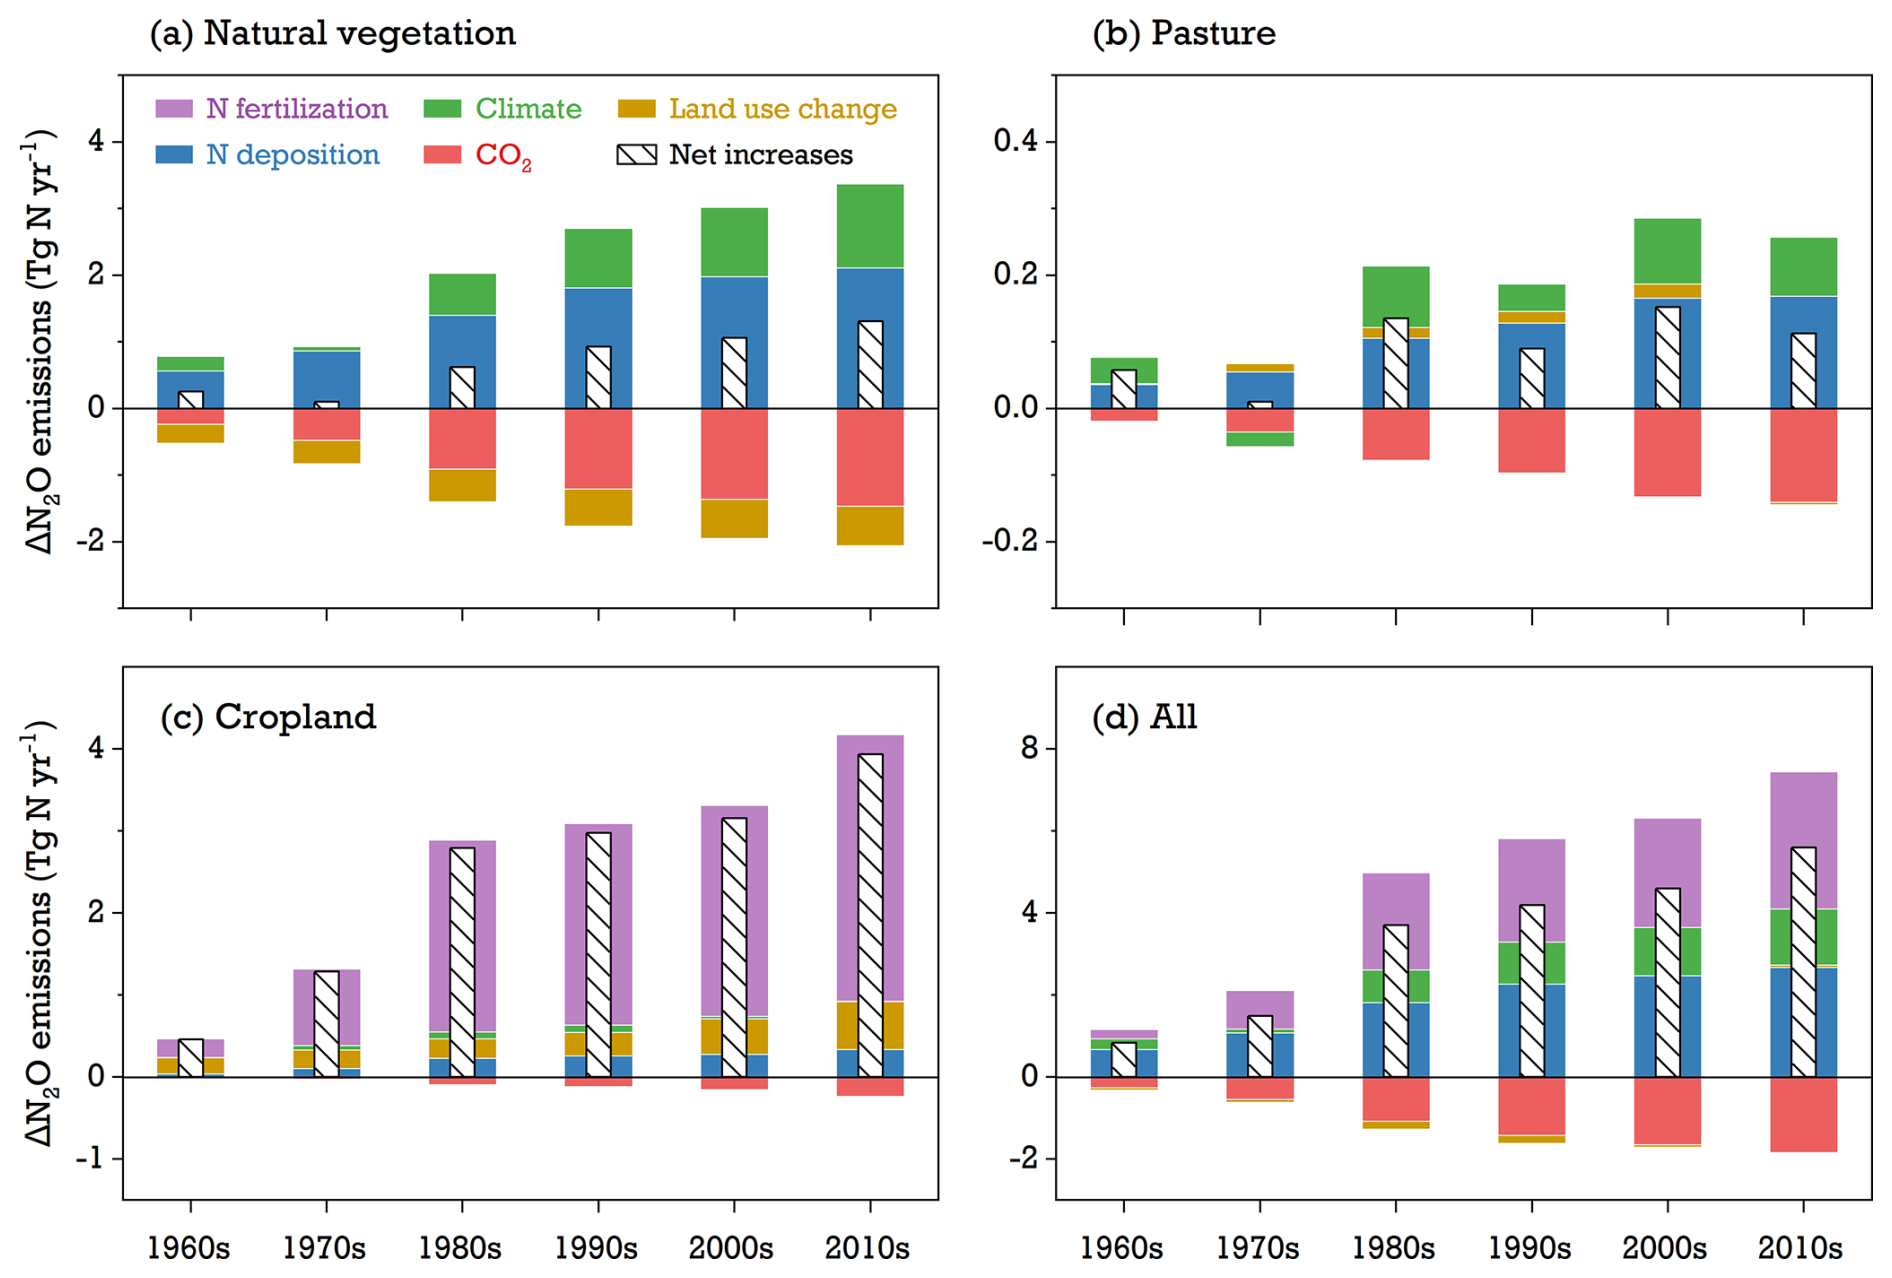
Figure 8Modeled contributions (ΔN2O) of environmental factors (climate change, rising CO2 levels, N fertilization, N deposition, and land use change) to global soil N2O emissions between 1960–2020 across various vegetation types: (a) natural vegetation, (b) pasture, (c) cropland, and (d) the aggregate of all three ecosystems. The white bar with slashes is the net emission from all factors' contributions. See Eq. (24) for ΔN2O calculation.
In model simulations, the impact of land use change on soil N2O emissions showed significant spatial variation depending on N management intensity after land cover conversion (Fig. 9). For instance, increased N2O due to land use change was typically found in regions where soils received high reactive N input (such as northern China and central Europe). Conversely, regions with low levels of N fertilizer and manure use – like most countries in Africa and South America – were beneficial in reducing N2O emissions after the conversion from natural vegetation to croplands. Additionally, a net expansion of natural lands in the northern temperate regions, such as the southeastern US and eastern Europe, was found to contribute to the mitigation of emissions. On a global scale, a land-use-induced reduction in N2O emissions on natural lands was estimated to be Tg N yr−1 during 2011–2020, while cropland experienced an increase of 0.58±0.04 Tg N yr−1 over the same period.
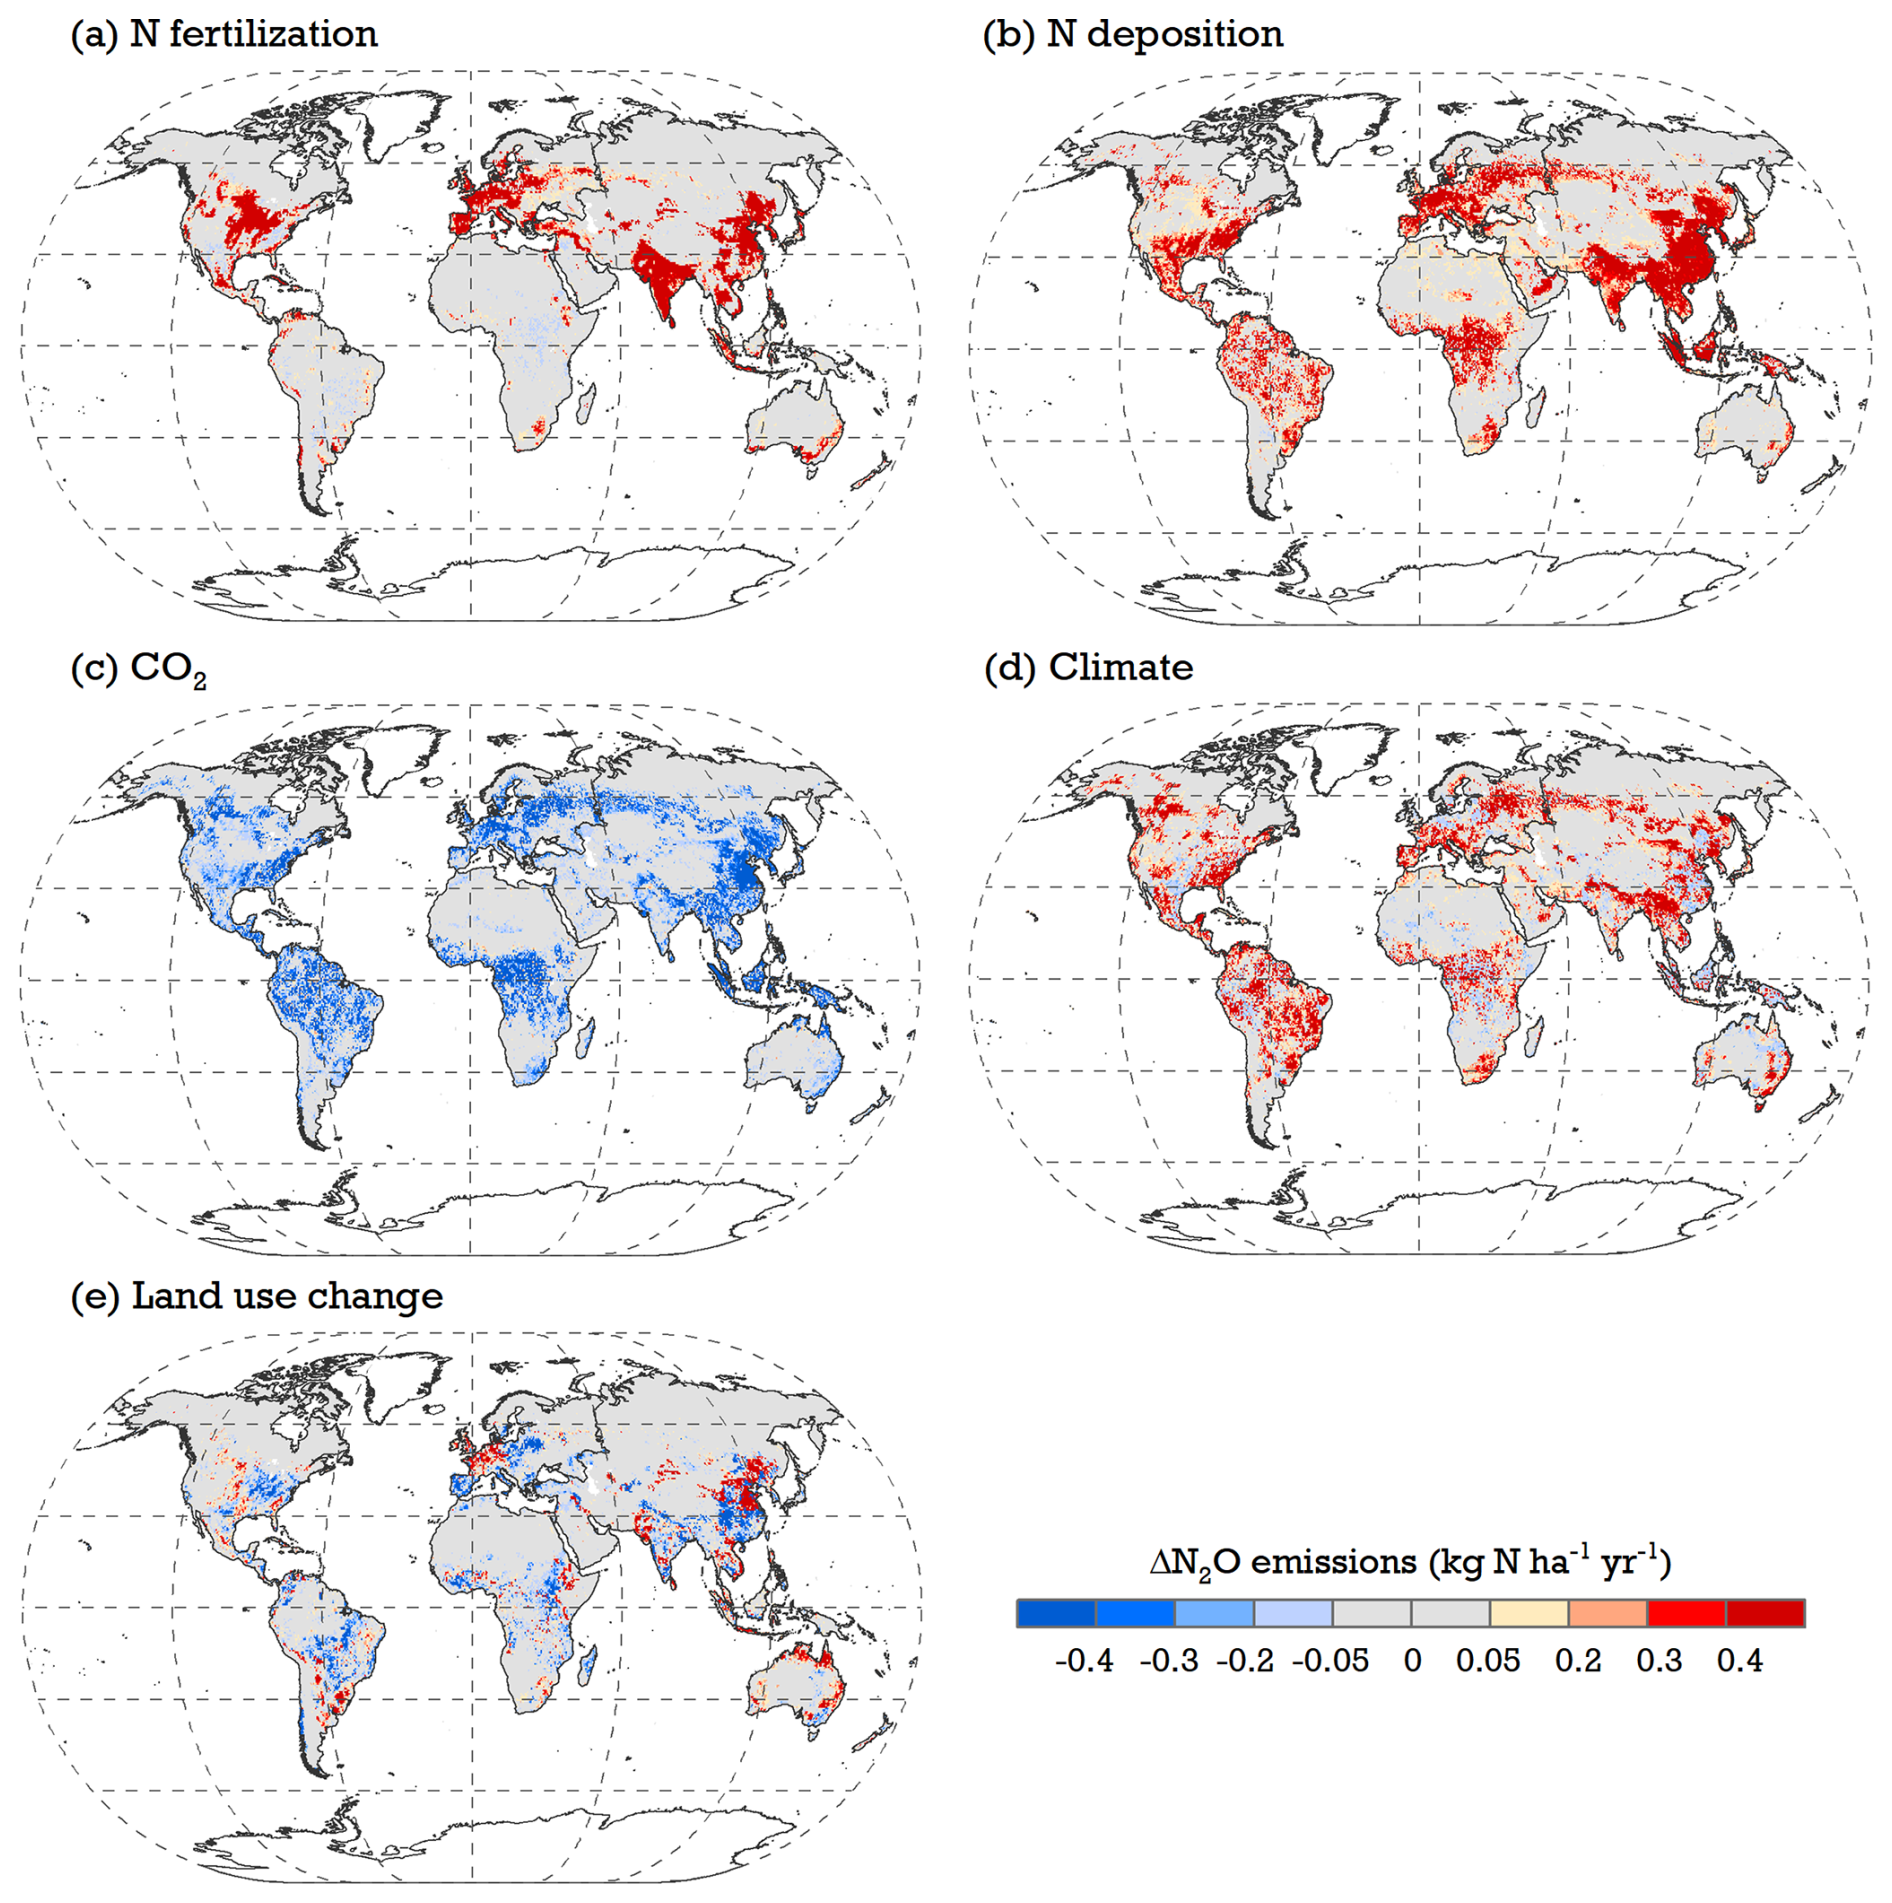
Figure 9Modeled maps of the contributions of (a) N fertilization, (b) N deposition, (c) rising CO2, (d) climate change, and (e) land use change to soil N2O emissions between 2011–2020. See S1–S6 runs in Table 1 for simulation setups and Eq. (24) for ΔN2O calculation.
4.1 Model uncertainties at site scale
Incorporating specific nitrification and denitrification processes, together with agricultural management practices, into LPJ-GUESS led to a good agreement between modeled and observed N2O emissions at cropland sites despite some overestimations relative to highly fertilized trials. One factor contributing to this overestimation is that some of the processes taking place during crop growth are not well represented in the model. In previous studies (Ma et al., 2022a, 2023), crop yields simulated by LPJ-GUESS under high N fertilizer inputs were lower than observations, indicating an underestimation of both plant N demand and uptake. Consequently, the excess N remaining in the soil would facilitate higher gaseous loss in the model. This can also explain the significant overestimations of cumulative N2O emissions in rice-cropping systems (Fig. 3), where the simulated growing season was about 1 month shorter than field experiments since the growth phase between rice sowing and transplanting has not been implemented in LPJ-GUESS. Compared to observations, such a reduction in the simulated growing period was expected to produce lower N uptake and higher N2O emissions.
We found that the model generally underrepresented N2O sources in the tropics while simultaneously overestimating annual emissions in temperate and boreal forests across all evaluated natural sites (Fig. S2). This discrepancy can be partially attributed to the high levels of soil WFPS simulated for most humid tropical climates with fine- or medium-textured soils (>0.75, not shown), leading to large amounts of N2 gas (instead of N2O) being produced at low oxygen concentrations (Davidson et al., 2000; Pilegaard, 2013). A field-based synthetic analysis estimated that the global mean ratio of N2O to (N2O + N2) in natural soils was 0.125 during the denitrification processes (Scheer et al., 2020). Although our simulated ratios of 0.08–0.10 in the tropics and of 0.12–0.15 in a typical temperate site were close to this global mean estimate (Fig. S3), they may show a potential 35 % underestimation of N2O in tropical climates and a 15 % overestimation in temperate natural vegetation. This issue could be addressed by adjusting the partitioning scheme between N2O and N2 in the denitrification processes (see Eq. 21). However, this is currently prevented by the lack of measured N2 data as accurately determining N2 fluxes from the soil is challenging due to the high background concentration in the atmosphere (Butterbach-Bahl et al., 2013; dos Reis Martins et al., 2022).
LPJ-GUESS simulated the cumulative N2O emissions in response to variations in soil moisture, temperature, and N fertilizer input reasonably well, but it did not capture the measured seasonal dynamics well, particularly for the representation of peak N2O daily fluxes (Figs. 4 and 5). This issue was not unique to our study and has also been reported in other studies using different ecological models (e.g., Gaillard et al., 2018; Huang and Gerber, 2015; Ma et al., 2022b; Val Martin et al., 2023). The poor performance in simulating the variability in daily N2O fluxes was likely to be due to the missing or incomplete N transformation processes in the model. For instance, N2O uptake has often been reported in field studies during low-temperature seasons (Fig. 3), especially in natural ecosystems at high latitudes (Brummell et al., 2014). Recent studies indicated that an N2O sink could result from efficient N2O consumption by anaerobic microsites during the final reduction step of denitrification processes (Hiis et al., 2024; Sihi et al., 2020; Siljanen et al., 2020). However, this underlying mechanism is not well understood, which limits the model's ability to characterize N2O uptake. In addition, the large differences between simulated and measured N2O monthly fluxes were seen during the spring, when the soil underwent seasonal freezing and thawing (Fig. 3). These N2O increases associated with freeze–thaw cycles are difficult to simulate because of challenges in parameterizing the transient pulses of nutrient availability in the micro-environment (Zhang et al., 2017b). The impacts of soil freeze events on nutrient release – stimulated by microbial mortality and the physical breakdown of soil aggregates – have not been represented in either LPJ-GUESS or other process-based models (Tian et al., 2019) despite many field measurements reporting their importance for annual N2O emissions (Kazmi et al., 2025; Wagner-Riddle et al., 2024).
Similarly to other modeling studies, LPJ-GUESS adopted empirical modifiers, kmax_nit (Eq. 6) and kmax_denit (Eq. 13), to simulate maximum nitrification and denitrification rates in order to account for the limitations that cannot currently be clarified. These parameters vary to a large degree between models, and this variation likely represents each model's unique structure and the specific N transformation processes it includes (Gabbrielli et al., 2024). In this study, we used prescribed constants for kmax_nit and kmax_denit based on values from the literature (see Sect. 2.2). Assessing the impact of this implementation on seasonal dynamics of N2O is challenging as these experiment-dependent parameters are typically unavailable for each test site. Using fixed values to represent all unclarified nitrification–denitrification situations, such as in our global-uniform parameterization, cannot reflect the high spatial–temporal variability across different sites, which may further affect the evaluated seasonal pattern of N2O emission at the site level.
4.2 Global soil N2O emissions and their drivers
Global simulations by LPJ-GUESS indicated that soil N2O emissions from natural vegetation were 5.9±0.13 Tg N yr−1 in the 2010s, which was comparable with the 6.4 Tg N yr−1 reported by the Global Nitrous Oxide Budget (Tian et al., 2024). Saikawa et al. (2014) used the top-down atmospheric-inversion method to estimate N2O emissions from natural soils over the period of 1995–2008, yielding an average emission rate of 7.1 Tg N yr−1. Our estimate of 5.8±0.2 Tg N yr−1, although lower, remains within the range of these other findings (4.7–8.4 Tg N yr−1) for that same 14-year time frame.
Cropland N2O emissions were simulated by LPJ-GUESS to be 3.5±0.25 Tg N yr−1 globally between 2007–2016, which was consistent with the ensemble mean of 3.3 Tg N yr−1 obtained by NMIP models over the same period (Tian et al., 2019). Our estimates were also close to those of Xu et al. (2020) and Val Martin et al. (2023), who reported a range of 3.1–3.2 Tg N yr−1 in N2O emissions during 2010–2014 using the DLEM and CLM5 models, respectively. However, these process-based models broadly produced higher N2O emission rates compared with estimates using the global inventory approach. For instance, based on the IPCC Tier-1 emission factor (EF), FAOSTAT predicted a 10-year average of 1.7 Tg N yr−1 in direct soil N2O emissions from 2011 to 2020 through the combination of emissions from N fertilizer use, manure application, and crop residues (FAOSTAT, 2024). Similarly, the latest Emissions Database for Global Atmospheric Research (EDGAR v8.0; Crippa et al., 2024) reported direct soil N2O emissions in agricultural lands of 3.0 Tg N yr−1 for the same period, including large contributions from livestock excreta on grazing pastures. The discrepancies between our results and EF-based approaches were most likely due to the background “legacy effect” – resulting from soil mineralization and residual N accumulation from previous years – not being accounted for by IPCC guidelines. Considering this legacy effect (∼1.5 Tg N yr−1; Kim et al., 2013), a recent study re-estimated global cropland N2O emissions to be 2.6 Tg N yr−1 over 2010–2014 based on an N-rate-dependent EF method (Wang et al., 2020). While our model results are higher, they can thus be seen to be comparable with this statistically derived estimate.
Emission factors from IPCC Tier 1 (default values of 0.4 % for flooded rice and 1 % for other crops; Hergoualc'h et al., 2019) are often used to quantify large-scale soil N2O emissions caused by reactive N inputs. Davidson (2009) implemented an EF of 2.5 % and reported global synthetic-fertilizer-induced soil emissions to be 2.2 Tg N yr−1 in 2005, including both direct and indirect sources. In this study, we only simulated direct N2O emissions from fertilization, which amounted to 2.6 Tg N yr−1 in the same year. The higher simulated fertilization effect can be partially attributed to the inclusion of emissions from manure application in the model (S5 in Table 1), whereas Davidson (2009) did not report this agricultural source independently. According to our simulation results, in 2005, the ratio of fertilization effect (2.6 Tg N yr−1) to total fertilizer inputs (synthetic N and manure; 109 Tg N yr−1) was estimated to be 2.4 % globally, consistently with the findings in Davidson (2009). Notably, both studies imply that the default EF of 1 % in IPCC Tier 1 might lower the estimation of direct N2O emissions in agricultural soils. Similarly with N-applied croplands, recent global meta-analysis has shown that N enrichment (e.g., atmospheric N deposition) significantly increased N2O emissions by 80 %–101 % in natural ecosystems, particularly in temperate and boreal forests (Deng et al., 2020; Shen and Zhu, 2022). We identified N deposition to be the most important environmental driver of N2O emissions in our model (S4 in Table 1), contributing to a 126 % increase for natural lands during 2011–2020 (Fig. 8). This finding was in line with the results of the meta-data analyses referenced above.
Understanding of the CO2 effect on soil N2O emissions is still incomplete at the global scale. A quantitative assessment by Van Groenigen et al. (2011) found that rising atmospheric CO2 levels increased N2O emissions by 25 % in upland natural ecosystems. This increase was attributed to enhanced plant fine-root biomass and soil moisture, which favored the carbon availability for denitrifying bacteria under anaerobic conditions. Conversely, a recent meta-analysis argued that elevated CO2 concentrations significantly improved plant N use efficiency by as much as 32 %, subsequently decreasing hydrological N loss by 33 % and N2O emissions by 5 % in global forests (Cui et al., 2024). It remains unclear which of these two opposing mechanisms might play a more dominant role in field measurements, but the negative CO2 effect on N2O emissions, at least in our simulations (−87 % during 2011–2020 on global natural lands; Fig. 8), can be explained by enhanced vegetation N uptake and reduced soil mineral N surplus under increased CO2 conditions (Fig. S5). Studies using other models have shown similar results (e.g., Huang and Gerber, 2015; Tian et al., 2019; Zaehle et al., 2011). However, the situation differs for N-applied agricultural lands, where the high abundance of soil mineral N is typically sufficient for crop uptake and nitrifier–denitrifier use, thus favoring N2O production even under rising CO2 levels. The low CO2 effect on cropland N2O emissions compared with natural-vegetation emissions in our simulations (−6 % during 2011–2020; Fig. 8) is in line with previous modeling findings that reactive N addition (e.g., N fixation and deposition) may diminish the negative influence of elevated CO2 on soil N2O emissions through mitigating N limitation to both vegetation and soil microbes (Kanter et al., 2016; Xu-Ri et al., 2012).
In this study, climate change was simulated to increase global N2O emissions by 1.3 Tg N yr−1 (+24 %; Fig. 8) during 2011–2020, which was slightly higher than the mean increase of 1.0 Tg N yr−1 found by NMIP models (Tian et al., 2019) and below the 33 % warming-induced enhancement reported in a meta-analysis (Li et al., 2020). This positive effect in both simulations and observations can be explained by the increased soil temperature, which can (a) speed up the N mineralization process, resulting in N-rich substrates for microbe use, and (b) significantly stimulate the activity and population of denitrifying bacteria, which thrive more in warmer environments than nitrifiers (Pärn et al., 2018). Regionally, an N2O decline due to climate change was seen in parts of India, Malaysia, and Indonesia (Fig. 9), likely resulting from increased rainfall over the 2 most recent decades (Xu et al., 2020). As discussed in Sect. 4.1, high soil water content linked to ample rainfall can suppress N2O production in the tropics once soil WFPS exceeds 0.7 (Davidson et al., 2000; Pilegaard, 2013). By contrast, the N2O decreases in semi-arid climates, such as in western Asia, could be attributed to reduced precipitation. In these regions, nitrification is the dominant process determining N2O production under aerobic conditions and is usually proportional to the simulated soil WFPS (Fig. S3; Davidson et al., 2000).
4.3 Modeling limitations and implications
Implementing and evaluating soil N2O emissions in models remains challenging due to the short timescales and high spatial heterogeneity of microbial processes in soils, as well as uncertainties from model input forcings, parameterization, and structure. In this study, we incorporated the influence of major controlling factors – soil moisture and temperature, carbon supply, soil texture and pH, and reactive N availability – into nitrification and denitrification processes in LPJ-GUESS, following empirical findings from previous studies. Although the model can represent the cumulative N2O emissions satisfactorily, the daily magnitude and seasonal variation did not match experimental observations well. This discrepancy probably reflects the differences between highly controlled and/or specific local field conditions and the general protocols adopted for our simulations related to land use history, N interaction between plants and soils, initial SOM levels, and assumptions made regarding other N-related fluxes (e.g., NH3 volatilization, N leaching, and partitioning ratio between N2 and N2O). Moreover, some key processes that regulate N2O emissions in field trials – such as the life cycle of nitrifiers and denitrifiers, N2O uptake, heterotrophic nitrification–aerobic denitrification, and freeze–thaw cycles – have not been implemented in the model.
The current LPJ-GUESS version used in this study only models two soil layers (i.e., 0–50 and 50–150 cm; see Smith et al., 2014; Wårlind et al., 2014). Soil organic matter has no defined placement within the soil column, and the N transformation processes implemented in this study are influenced solely by the temperature and moisture of the top layer (see Sect. 2.2). Given the 50 cm thickness, soil water variability during rain events is minimal, which explains the absence of any distinct WFPS peaks in our modeling results (Figs. 5 and S3). In reality, however, most N2O-related hydrological processes occur very close to the surface, where soil saturation and drying take place rapidly over short periods. Additionally, soil water content is currently simulated between the wilting point and field capacity (Smith et al., 2014), indicating that fully saturated or completely dry soils cannot be represented in the model. This constraint would consequently impact the simulated WFPS values across different soil textures, which, in turn, affects all other N transformation processes relying on WFPS (see Fig. 1). To better account for gaseous N losses from the soil, the improvement in the soil hydrological scheme within LPJ-GUESS remains to be taken into account in future model development.
Both modeling and EF-based approaches indicated that managed grasslands were strong N2O sources, with emissions of 1.5–2.2 Tg N yr−1 between 2000–2006, including contributions from livestock excreta deposition, manure use, and N fertilizer application (Dangal et al., 2019; Oenema et al., 2005). In this study, LPJ-GUESS did not account for the effects of N management on pasture, which may have resulted in an underestimation of soil N2O emissions across global land. However, a long-term gridded dataset for fertilizer and manure applications on pasture has recently become available (HaNi; Tian et al., 2022), offering the possibility of incorporating fertilized grasslands into our future model simulations. In addition, concentrations of soil NH and NO, as essential substrates for nitrifying and denitrifying bacteria, are dominant factors controlling N2O production on agricultural lands (Fig. 1). The ratio of NH to NO, which typically varies with fertilizer types, has been reported to significantly influence soil N2O emissions in field experiments (e.g., Nelissen et al., 2014; Shcherbak et al., 2014). Globally, Nishina et al. (2017) and Tian et al. (2022) pointed out that the NH : NO ratio from N fertilizer application gradually increased from 2.0 to 7.0 during 1961–2010 as a result of the increased consumption of urea on croplands. In contrast, LPJ-GUESS assumed this ratio to be a constant of 1.0 when agricultural soils received N fertilizer inputs. Using this fixed parameter in our simulations cannot reflect the variability of fertilizer-type-induced N2O emissions in reality, particularly in highly fertilized regions. Considering the model's sensitivity to N fertilization (Fig. 3) and the contribution of synthetic N fertilizer to global N2O increases (Fig. 8), a step forward could be to harmonize the existing fertilizer-species-dependent datasets to reduce the simulated uncertainties of cropland N2O emissions.
In addition to N fertilizer and manure management, conservation agriculture – like reduced tillage, residue retention, and legume cover crops – has, for many years, been recommended as a promising climate mitigation practice because of its ability to enhance soil carbon sequestration (Poeplau and Don, 2015; Smith et al., 2020). However, much experimental evidence showed that these conservation practices had the potential to offset the CO2 mitigation effect due to the increased N2O emissions (e.g., Lugato et al., 2018; Mei et al., 2018; Quemada et al., 2020; Yangjin et al., 2021). In this study, we only simulated conventional management because of the limited adoption of conservation agriculture in current global croplands (see Sect. 2.1). Whether such a trade-off between CO2 uptake and N2O emissions due to conservation practices would also emerge on a large scale – particularly in regions with high N fertilizer applications – needs to be investigated in future work.
In this study, we implemented mechanistic representations of nitrification and denitrification in LPJ-GUESS to account for soil N2O emissions in global terrestrial ecosystems. The simulated N2O fluxes from natural soils and croplands were compared against observations ranging from the site level to the global scale. Our results showed that the N2O scheme implemented in the model realistically responded to changes in soil moisture, temperature, and reactive N inputs. It produced cumulative N2O emission rates comparable with measured data despite some deviations in seasonal patterns.
In our simulations, global soil N2O emissions from land ecosystems showed a rapid increase between 1960–2020, rising from 5.6±0.2 Tg N yr−1 in the 1960s to 9.9±0.3 Tg N yr−1 in the 2010s. While natural vegetation was the predominant N2O source in the 1960s, its emissions were gradually surpassed by croplands over the study period. During 2011–2020, East Asia emerged as the largest regional source of N2O, with N fertilization (including synthetic fertilizer and manure use) being identified as the major contributor. On average, global N2O increases due to N fertilization increased from 0.22±0.13 Tg N yr−1 in the 1960s to 3.2±0.2 Tg N yr−1 in the 2010s. We also found that atmospheric N deposition and climate change have both contributed to the rise in global N2O emissions, although effects varied significantly among different vegetation types. Conversely, rising CO2 levels were found to reduce simulated N2O emissions through increased plant N uptake, whereas land use change had varied spatial effects on emissions depending on how nitrogen was managed after land cover conversion.
Incorporating key transformations of soil mineral N into LPJ-GUESS offers the opportunity to evaluate total N loss from the soil to the atmosphere, which is essential for accurately quantifying the global terrestrial N cycle in response to changing environmental conditions. This representation also facilitates the assessment of climate mitigation potential in global agricultural soils by examining how CO2 uptake and N2O emissions may interact under various conservation practices.
The LPJ-GUESS model source code is publicly accessible through the Zenodo repository at https://doi.org/10.5281/zenodo.14258279 (Ma et al., 2024). The global historical climate data of CRU JRA are available at https://data.ceda.ac.uk/badc/cru/data/cru_jra/cru_jra_2.4 (CEDA Archive, 2025). The land use dataset of HILDA+ can be downloaded at https://doi.org/10.1594/PANGAEA.921846 (Winkler et al., 2020). The crop growth distribution from MIRCA2000 can be accessed at https://doi.org/10.5281/zenodo.7422506 (Portmann et al., 2010). The site-level observations collected from the existing literature, together with large-scale model inputs and outputs, are publicly available through https://doi.org/10.5281/zenodo.14169306 (Ma and Olin, 2024).
The supplement related to this article is available online at https://doi.org/10.5194/gmd-18-3131-2025-supplement.
SO, AA, BS, and JM conceptualized this study. JM, SO, PE, DW, and XR developed the model code. JM, AA, and SO designed the model protocol runs. JM carried out the formal analysis and visualization. SO assisted with the field data collection and parameter tuning for model evaluation. PA and MW processed the model input forcing globally. BS, DW, AA, and PA provided constructive suggestions for the discussion on model limitations. JM wrote the original draft, with further editing from all of the authors.
The contact author has declared that none of the authors has any competing interests.
Publisher's note: Copernicus Publications remains neutral with regard to jurisdictional claims made in the text, published maps, institutional affiliations, or any other geographical representation in this paper. While Copernicus Publications makes every effort to include appropriate place names, the final responsibility lies with the authors.
We thank the two anonymous reviewers for their valuable input that enhanced the quality of our paper.
This research has been supported by the European Union's Horizon Europe Research and Innovation program (EYE-CLIMA; grant no. 101081395) and by the Swedish Research Council FORMAS (grant no. 211-2009-1682). This study is a contribution to the Strategic Research Areas Biodiversity and Ecosystem Services in a Changing Climate (BECC) and Modelling the Regional and Global Earth System (MERGE) funded by the Swedish Government.
The article processing charges for this open-access publication were covered by the Karlsruhe Institute of Technology (KIT).
This paper was edited by Bo Zheng and reviewed by two anonymous referees.
Abalos, D., Recous, S., Butterbach-Bahl, K., De Notaris, C., Rittl, T. F., Topp, C. F. E., Petersen, S. O., Hansen, S., Bleken, M. A., Rees, R. M., and Olesen, J. E.: A review and meta-analysis of mitigation measures for nitrous oxide emissions from crop residues, Sci. Total Environ., 828, 154388, https://doi.org/10.1016/j.scitotenv.2022.154388, 2022.
Bao, Q., Ju, X., Gao, B., Qu, Z., Christie, P., and Lu, Y.: Response of Nitrous Oxide and Corresponding Bacteria to Managements in an Agricultural Soil, Soil Sci. Soc. Am. J., 76, 130–141, https://doi.org/10.2136/sssaj2011.0152, 2012.
Batjes, N. H.: Harmonized soil profile data for applications at global and continental scales: Updates to the WISE database, Soil Use Manage., 25, 124–127, https://doi.org/10.1111/j.1475-2743.2009.00202.x, 2009.
Benoit, M., Garnier, J., and Billen, G.: Temperature dependence of nitrous oxide production of a luvisolic soil in batch experiments, Process Biochem., 50, 79–85, https://doi.org/10.1016/j.procbio.2014.10.013, 2015.
Bergaust, L., Mao, Y., Bakken, L. R., and Frostegård, Å.: Denitrification response patterns during the transition to anoxic respiration and posttranscriptional effects of suboptimal ph on nitrogen oxide reductase in paracoccus denitrificans, Appl. Environ. Microbiol., 76, 6387–6396, https://doi.org/10.1128/AEM.00608-10, 2010.
Blanc-Betes, E., Kantola, I. B., Gomez-Casanovas, N., Hartman, M. D., Parton, W. J., Lewis, A. L., Beerling, D. J., and DeLucia, E. H.: In silico assessment of the potential of basalt amendments to reduce N2O emissions from bioenergy crops, GCB Bioenergy, 13, 224–241, https://doi.org/10.1111/gcbb.12757, 2021.
Bouwman, A. F., Beusen, A. H. W., Griffioen, J., Van Groenigen, J. W., Hefting, M. M., Oenema, O., Van Puijenbroek, P. J. T. M., Seitzinger, S., Slomp, C. P., and Stehfest, E.: Global trends and uncertainties in terrestrial denitrification and N2O emissions, Philos. T. Roy. Soc. B, 368, 20130112, https://doi.org/10.1098/rstb.2013.0112, 2013.
Brummell, M. E., Farrell, R. E., Hardy, S. P., and Siciliano, S. D.: Greenhouse gas production and consumption in High Arctic deserts, Soil Biol. Biochem., 68, 158–165, https://doi.org/10.1016/j.soilbio.2013.09.034, 2014.
Butterbach-Bahl, K., Baggs, E. M., Dannenmann, M., Kiese, R., and Zechmeister-Boltenstern, S.: Nitrous oxide emissions from soils: How well do we understand the processes and their controls?, Philos. T. Roy. Soc. B, 368, 20130122, https://doi.org/10.1098/rstb.2013.0122, 2013.
Canadell, J. G., Monteiro, P. M. S., Costa, M. H., Cotrim da Cunha, L., Cox, P. M., Eliseev, A. V., Henson, S., Ishii, M., Jaccard, S., Koven, C., Lohila, A., Patra, P. K., Piao, S., Rogelj, J., Syampungani, S., Zaehle, S., and Zickfeld, K.: Global Carbon and Other Biogeochemical Cycles and Feedbacks, in: Climate Change 2021: The Physical Science Basis, Contribution of Working Group I to the Sixth Assessment Report of the Intergovernmental Panel on Climate Change, edited by: Masson-Delmotte, V., Zhai, P., Pirani, A., Connors, S. L., Péan, C., Berger, S., Caud, N., Chen, Y., Goldfarb, L., Gomis, M. I., Huang, M., Leitzell, K., Lonnoy, E., Matthews, J. B. R., Maycock, T. K., Waterfield, T., Yelekçi, O., Yu, R., and Zhou, B., Cambridge University Press, Cambridge, UK and New York, NY, USA, 673–816, https://doi.org/10.1017/9781009157896.007, 2021.
CEDA Archive: CRU JRA v2.4: A forcings dataset of gridded land surface blend of Climatic Research Unit (CRU) and Japanese reanalysis (JRA) data, CEDA Archive [data set], https://data.ceda.ac.uk/badc/cru/data/cru_jra/cru_jra_2.4 (last access: 26 May 2025), 2025.
Chapin III, F. S., Matson, P. A., and Vitousek, P. M.: Principles of Terrestrial Ecosystem Ecology, in: 2nd Edn., Springer Science and Business Media, New York, USA, https://doi.org/10.1007/978-1-4419-9504-9, 2011.
Ciais, P., Gervois, S., Vuichard, N., Piao, S. L., and Viovy, N.: Effects of land use change and management on the European cropland carbon balance, Global Change Biol., 17, 320–338, https://doi.org/10.1111/j.1365-2486.2010.02341.x, 2011.
Cramer, W., Bondeau, A., Woodward, F. I., Prentice, I. C., Betts, R. A., Brovkin, V., Cox, P. M., Fisher, V., Foley, J. A., Friend, A. D., Kucharik, C., Lomas, M. R., Ramankutty, N., Sitch, S., Smith, B., White, A., and Young-Molling, C.: Global response of terrestrial ecosystem structure and function to CO2 and climate change: Results from six dynamic global vegetation models, Global Change Biol., 7, 357–373, https://doi.org/10.1046/j.1365-2486.2001.00383.x, 2001.
Crippa, M., Guizzardi, D., Pagani, F., Schiavina, M., Melchiorri, M., Pisoni, E., Graziosi, F., Muntean, M., Maes, J., Dijkstra, L., Van Damme, M., Clarisse, L., and Coheur, P.: Insights into the spatial distribution of global, national, and subnational greenhouse gas emissions in the Emissions Database for Global Atmospheric Research (EDGAR v8.0), Earth Syst. Sci. Data, 16, 2811–2830, https://doi.org/10.5194/essd-16-2811-2024, 2024.
Crutzen, P. J., Mosier, A. R., Smith, K. A., and Winiwarter, W.: N2O release from agro-biofuel production negates global warming reduction by replacing fossil fuels, Atmos. Chem. Phys., 8, 389–395, https://doi.org/10.5194/acp-8-389-2008, 2008.
Cui, J., Zheng, M., Bian, Z., Pan, N., Tian, H., Zhang, X., Qiu, Z., Xu, J., and Gu, B.: Elevated CO2 levels promote both carbon and nitrogen cycling in global forests, Nat. Clim. Change, 14, 511–517, https://doi.org/10.1038/s41558-024-01973-9, 2024.
Dangal, S. R. S., Tian, H., Xu, R., Chang, J., Canadell, J. G., Ciais, P., Pan, S., Yang, J., and Zhang, B.: Global Nitrous Oxide Emissions From Pasturelands and Rangelands: Magnitude, Spatiotemporal Patterns, and Attribution, Global Biogeochem. Cy., 33, 200–222, https://doi.org/10.1029/2018GB006091, 2019.
Davidson, E. A.: The contribution of manure and fertilizer nitrogen to atmospheric nitrous oxide since 1860, Nat. Geosci., 2, 659–662, https://doi.org/10.1038/ngeo608, 2009.
Davidson, E. A. and Kanter, D.: Inventories and scenarios of nitrous oxide emissions, Environ. Res. Lett., 9, 105012, https://doi.org/10.1088/1748-9326/9/10/105012, 2014.
Davidson, E. A., Keller, M., Erickson, H. E., Verchot, L. V., and Veldkamp, E.: Testing a conceptual model of soil emissions of nitrous and nitric oxides, Bioscience, 50, 667–680, https://doi.org/10.1641/0006-3568(2000)050[0667:TACMOS]2.0.CO;2, 2000.
Davidson, E. A., Nepstad, D. C., Ishida, F. Y., and Brando, P. M.: Effects of an experimental drought and recovery on soil emissions of carbon dioxide, methane, nitrous oxide, and nitric oxide in a moist tropical forest, Global Change Biol., 14, 2582–2590, https://doi.org/10.1111/j.1365-2486.2008.01694.x, 2008.
Deng, L., Huang, C., Kim, D. G., Shangguan, Z., Wang, K., Song, X., and Peng, C.: Soil GHG fluxes are altered by N deposition: New data indicate lower N stimulation of the N2O flux and greater stimulation of the calculated C pools, Global Change Biol., 26, 2613–2629, https://doi.org/10.1111/gcb.14970, 2020.
dos Reis Martins, M., Necpalova, M., Ammann, C., Buchmann, N., Calanca, P., Flechard, C. R., Hartman, M. D., Krauss, M., Le Roy, P., Mäder, P., Maier, R., Morvan, T., Nicolardot, B., Skinner, C., Six, J., and Keel, S. G.: Modeling N2O emissions of complex cropland management in Western Europe using DayCent: Performance and scope for improvement, Eur. J. Agron., 141, 126613, https://doi.org/10.1016/j.eja.2022.126613, 2022.
Du, R., Lu, D., and Wang, G.: Diurnal, seasonal, and inter-annual variations of N2O fluxes from native semi-arid grassland soils of inner Mongolia, Soil Biol. Biochem., 38, 3474–3482, https://doi.org/10.1016/j.soilbio.2006.06.012, 2006.
Elliott, J., Müller, C., Deryng, D., Chryssanthacopoulos, J., Boote, K. J., Büchner, M., Foster, I., Glotter, M., Heinke, J., Iizumi, T., Izaurralde, R. C., Mueller, N. D., Ray, D. K., Rosenzweig, C., Ruane, A. C., and Sheffield, J.: The Global Gridded Crop Model Intercomparison: Data and modeling protocols for Phase 1 (v1.0), Geosci. Model Dev., 8, 261–277, https://doi.org/10.5194/gmd-8-261-2015, 2015.
FAOSTAT: Climate Change:Agrifood systems emissions/Totals and Indicators/Emissions totals, FAOSTAT [data set], https://www.fao.org/faostat/en/#data/GT (last access: 29 June 2024), 2024.
Firestone, M. K. and Davidson, E. A.: Microbiological basis of NO and N2O production and consumption in soil, in: Exchange of trace gases between terrestrial ecosystems and the atmosphere, edited by: Andreae, M. O. and Schimel, D. S., John Wiley and Sons, New York, USA, 7–12, ISBN 0471925519, 1989.
Fowler, D., Coyle, M., Skiba, U., Sutton, M. A., Cape, J. N., Reis, S., Sheppard, L. J., Jenkins, A., Grizzetti, B., Galloway, J. N., Vitousek, P., Leach, A., Bouwman, A. F., Butterbach-Bahl, K., Dentener, F., Stevenson, D., Amann, M., and Voss, M.: The global nitrogen cycle in the twenty-first century, Philos. T. Roy. Soc. B, 368, 20130164, https://doi.org/10.1098/rstb.2013.0164, 2013.
Gabbrielli, M., Allegrezza, M., Ragaglini, G., Manco, A., Vitale, L., and Perego, A.: A Review of the Main Process-Based Approaches for Modeling N2O Emissions from Agricultural Soils, Horticulturae, 10, 1–47, https://doi.org/10.3390/horticulturae10010098, 2024.
Gaillard, R. K., Jones, C. D., Ingraham, P., Collier, S., Izaurralde, R. C., Jokela, W., Osterholz, W., Salas, W., Vadas, P., and Ruark, M. D.: Underestimation of N2O emissions in a comparison of the DayCent, DNDC, and EPIC models, Ecol. Appl., 28, 694–708, https://doi.org/10.1002/eap.1674, 2018.
Gleeson, D. B., Müller, C., Banerjee, S., Ma, W., Siciliano, S. D., and Murphy, D. V.: Response of ammonia oxidizing archaea and bacteria to changing water filled pore space, Soil Biol. Biochem., 42, 1888–1891, https://doi.org/10.1016/j.soilbio.2010.06.020, 2010.
Goldberg, S. D. and Gebauer, G.: N2O and NO fluxes between a Norway spruce forest soil and atmosphere as affected by prolonged summer drought, Soil Biol. Biochem., 41, 1986–1995, https://doi.org/10.1016/j.soilbio.2009.07.001, 2009.
Groffman, P. M., Hardy, J. P., Discoll, C. T., and Fahey, T. J.: Snow depth, soil freezing, and fluxes of carbon dioxide, nitrous oxide and methane in a northern hardwood forest, Global Change Biol., 12, 1748–1760, https://doi.org/10.1111/j.1365-2486.2006.01194.x, 2006.
Gu, B., Zhang, X., Lam, S. K., Yu, Y., Grinsven, H. J. M., Zhang, S., Wang, X., Bodirsky, B. L., Wang, S., Duan, J., Ren, C., Bouwman, L., Vries, W., Xu, J., Sutton, M. A., and Chen, D.: Cost-effective mitigation of nitrogen pollution from global croplands, Nature, 613, 77–84, https://doi.org/10.1038/s41586-022-05481-8, 2023.
Harris, I., Osborn, T. J., Jones, P., and Lister, D.: Version 4 of the CRU TS monthly high-resolution gridded multivariate climate dataset, Sci. Data, 7, 109, https://doi.org/10.1038/s41597-020-0453-3, 2020.
Hergoualc'h, K., Akiyama, H., Bernoux, M., Chirinda, N., del Prado, A., Kasimir, Å., McDonald, J. D., Ogle, S., Regina, K., van der Weerden, T. J., Liang, C., and Noble, A.: N2O Emissions from Managed Soils, and CO2 Emissions from Lime and Urea Application, in: 2019 Refinement to the 2006 IPCC Guidelines for National Greenhouse Gas Inventories, edited by: Calvo Buendia, E., Tanabe, K., Kranjc, A., Jamsranjav, B., Fukuda, M., Ngarize, S., Osako, A., Pyrozhenko, Y., Shermanau, P., and Federici, S., IPCC, Switzerland, 11–13, ISBN 978-4-88788-232-4, 2019.
Hiis, E. G., Vick, S. H. W., Molstad, L., Røsdal, K., Jonassen, K. R., Winiwarter, W., and Bakken, L. R.: Unlocking bacterial potential to reduce farmland N2O emissions, Nature, 630, 421–428, https://doi.org/10.1038/s41586-024-07464-3, 2024.
Huang, Y. and Gerber, S.: Global soil nitrous oxide emissions in a dynamic carbon-nitrogen model, Biogeosciences, 12, 6405–6427, https://doi.org/10.5194/bg-12-6405-2015, 2015.
Kanter, D. R., Zhang, X., Mauzerall, D. L., Malyshev, S., and Shevliakova, E.: The importance of climate change and nitrogen use efficiency for future nitrous oxide emissions from agriculture, Environ. Res. Lett., 11, 094003, https://doi.org/10.1088/1748-9326/11/9/094003, 2016.
Kazmi, F. A., Espenberg, M., Pärn, J., Masta, M., Ranniku, R., Thayamkottu, S., and Mander, Ü.: Meltwater of freeze-thaw cycles drives N2O-governing microbial communities in a drained peatland forest soil, Biol. Fertil. Soils, 61, 667–680, https://doi.org/10.1007/s00374-023-01790-w, 2025.
Khalil, K., Mary, B., and Renault, P.: Nitrous oxide production by nitrification and denitrification in soil aggregates as affected by O2 concentration, Soil Biol. Biochem., 36, 687–699, https://doi.org/10.1016/j.soilbio.2004.01.004, 2004.
Kim, D. G., Giltrap, D., and Hernandez-Ramirez, G.: Background nitrous oxide emissions in agricultural and natural lands: A meta-analysis, Plant Soil, 373, 17–30, https://doi.org/10.1007/s11104-013-1762-5, 2013.
Kobayashi, S., Ota, Y., Harada, Y., Ebita, A., Moriya, M., Onoda, H., Onogi, K., Kamahori, H., Kobayashi, C., Endo, H., Miyaoka, K., and Kiyotoshi, T.: The JRA-55 reanalysis: General specifications and basic characteristics, J. Meteorol. Soc. Jpn., 93, 5–48, https://doi.org/10.2151/jmsj.2015-001, 2015.
Kool, D. M., Dolfing, J., Wrage, N., and Van Groenigen, J. W.: Nitrifier denitrification as a distinct and significant source of nitrous oxide from soil, Soil Biol. Biochem., 43, 174–178, https://doi.org/10.1016/j.soilbio.2010.09.030, 2011.
Li, C., Frolking, S., and Frolking, T. A.: A model of nitrous oxide evolution from soil driven by rainfall events: 1. Model structure and sensitivity, J. Geophys. Res., 97, 9759–9776, https://doi.org/10.1029/92jd00509, 1992.
Li, C., Aber, J., Frolking, S., Butterbach-Bahl, K., and Papen, H.: A process-oriented model of N2O and NO emissions from forest soils: 1. Model development, J. Geophys. Res., 105, 4369–4384, https://doi.org/10.1029/1999JD900949, 2000.
Li, L., Zheng, Z., Wang, W., Biederman, J. A., Xu, X., Ran, Q., Qian, R., Xu, C., Zhang, B., Wang, F., Zhou, S., Cui, L., Che, R., Hao, Y., Cui, X., Xu, Z., and Wang, Y.: Terrestrial N2O emissions and related functional genes under climate change: A global meta-analysis, Globasl Change Biol., 26, 931–943, https://doi.org/10.1111/gcb.14847, 2020.
Li, Y., Chen, J., Drury, C. F., Liebig, M., Johnson, J. M. F., Wang, Z., Feng, H., and Abalos, D.: The role of conservation agriculture practices in mitigating N2O emissions: A meta-analysis, Agron. Sustain. Dev., 43, 1–13, https://doi.org/10.1007/s13593-023-00911-x, 2023.
Lim, N. Y. N., Frostegård, Å., and Bakken, L. R.: Nitrite kinetics during anoxia: The role of abiotic reactions versus microbial reduction, Soil Biol. Biochem., 119, 203–209, https://doi.org/10.1016/j.soilbio.2018.01.006, 2018.
Lindeskog, M., Arneth, A., Bondeau, A., Waha, K., Seaquist, J., Olin, S., and Smith, B.: Implications of accounting for land use in simulations of ecosystem carbon cycling in Africa, Earth Syst. Dynam., 4, 385–407, https://doi.org/10.5194/esd-4-385-2013, 2013.
Lindeskog, M., Smith, B., Lagergren, F., Sycheva, E., Ficko, A., Pretzsch, H., and Rammig, A.: Accounting for forest management in the estimation of forest carbon balance using the dynamic vegetation model LPJ-GUESS (v4.0, r9710): Implementation and evaluation of simulations for Europe, Geosci. Model Dev., 14, 6071–6112, https://doi.org/10.5194/gmd-14-6071-2021, 2021.
Liu, B., Mørkved, P. T., Frostegård, Å., and Bakken, L. R.: Denitrification gene pools, transcription and kinetics of NO, N2O and N2 production as affected by soil pH, FEMS Microbiol. Ecol., 72, 407–417, https://doi.org/10.1111/j.1574-6941.2010.00856.x, 2010.
Lugato, E., Leip, A., and Jones, A.: Mitigation potential of soil carbon management overestimated by neglecting N2O emissions, Nat. Clim. Change, 8, 219–223, https://doi.org/10.1038/s41558-018-0087-z, 2018.
Lutz, F., Del Grosso, S., Ogle, S., Williams, S., Minoli, S., Rolinski, S., Heinke, J., Stoorvogel, J. J., and Müller, C.: The importance of management information and soil moisture representation for simulating tillage effects on N2O emissions in LPJmL5.0-tillage, Geosci. Model Dev., 13, 3905–3923, https://doi.org/10.5194/gmd-13-3905-2020, 2020.
Ma, J. and Olin, S.: Soil N2O emissions from global land ecosystems simulated by the LPJ-GUESS model, Zenodo [data set], https://doi.org/10.5281/zenodo.14169306, 2024.
Ma, J., Olin, S., Anthoni, P., Rabin, S. S., Bayer, A. D., Nyawira, S. S., and Arneth, A.: Modeling symbiotic biological nitrogen fixation in grain legumes globally with LPJ-GUESS (v4.0, r10285), Geosci. Model Dev., 15, 815–839, https://doi.org/10.5194/gmd-15-815-2022, 2022a.
Ma, J., Anthoni, P., Olin, S., Rabin, S. S., Bayer, A. D., Xia, L., and Arneth, A.: Estimating the global influence of cover crops on ecosystem service indicators in croplands with the LPJ-GUESS model, Earth's Future, 11, e2022EF003142, https://doi.org/10.1029/2022EF003142, 2023.
Ma, J., Arneth, A., Smith, B., Anthoni, P., Xu, R., Peter, E., Wårlind, D., and Olin, S.: LPJ-GUESS model used for soil N2O simulation (v4.1), Zenodo [code], https://doi.org/10.5281/zenodo.14258279, 2024.
Ma, M., Song, C., Fang, H., Zhang, J., Wei, J., Liu, S., Chen, X., Zhang, K., Yuan, W., and Lu, H.: Development of a Process-Based N2O Emission Model for Natural Forest and Grassland Ecosystems, J. Adv. Model. Earth Syst., 14, e2021MS002460, https://doi.org/10.1029/2021MS002460, 2022b.
Maag, M. and Vinther, F. P.: Nitrous oxide emission by nitrification and denitrification in different soil types and at different soil moisture contents and temperatures, Appl. Soil Ecol., 4, 5–14, 1996.
Maljanen, M., Jokinen, H., Saari, A., Strömmer, R., and Martikainen, P. J.: Methane and nitrous oxide fluxes, and carbon dioxide production in boreal forest soil fertilized with wood ash and nitrogen, Soil Use Manage., 22, 151–157, https://doi.org/10.1111/j.1475-2743.2006.00029.x, 2006.
Mei, K., Wang, Z., Huang, H., Zhang, C., Shang, X., Dahlgren, R. A., Zhang, M., and Xia, F.: Stimulation of N2O emission by conservation tillage management in agricultural lands: A meta-analysis, Soil Till. Res., 182, 86–93, https://doi.org/10.1016/j.still.2018.05.006, 2018.
Meinshausen, M., Nicholls, Z. R. J., Lewis, J., Gidden, M. J., Vogel, E., Freund, M., Beyerle, U., Gessner, C., Nauels, A., Bauer, N., Canadell, J. G., Daniel, J. S., John, A., Krummel, P. B., Luderer, G., Meinshausen, N., Montzka, S. A., Rayner, P. J., Reimann, S., Smith, S. J., Van Den Berg, M., Velders, G. J. M., Vollmer, M. K., and Wang, R. H. J.: The shared socio-economic pathway (SSP) greenhouse gas concentrations and their extensions to 2500, Geosci. Model Dev., 13, 3571–3605, https://doi.org/10.5194/gmd-13-3571-2020, 2020.
Morishita, T., Sakata, T., Takahashi, M., Ishizuka, S., Mizoguchi, T., Inagaki, Y., Terazawa, K., Sawata, S., Igarashi, M., Yasuda, H., Koyama, Y., Suzuki, Y., Toyota, N., Muro, M., Kinjo, M., Yamamoto, H., Ashiya, D., Kanazawa, Y., Hashimoto, T., and Umata, H.: Methane uptake and nitrous oxide emission in Japanese forest soils and their relationship to soil and vegetation types, Soil Sci. Plant Nutr., 53, 678–691, https://doi.org/10.1111/j.1747-0765.2007.00181.x, 2007.
Nelissen, V., Saha, B. K., Ruysschaert, G., and Boeckx, P.: Effect of different biochar and fertilizer types on N2O and NO emissions, Soil Biol. Biochem., 70, 244–255, https://doi.org/10.1016/j.soilbio.2013.12.026, 2014.
Nishina, K., Ito, A., Hanasaki, N., and Hayashi, S.: Reconstruction of spatially detailed global map of NH and NO application in synthetic nitrogen fertilizer, Earth Syst. Sci. Data, 9, 149–162, https://doi.org/10.5194/essd-9-149-2017, 2017.
Oenema, O., Wrage, N., Velthof, G. L., Van Groenigen, J. W., Dolfing, J., and Kuikman, P. J.: Trends in global nitrous oxide emissions from animal production systems, Nutr. Cycl. Agroecosyst., 72, 51–65, https://doi.org/10.1007/s10705-004-7354-2, 2005.
Olin, S., Schurgers, G., Lindeskog, M., Wårlind, D., Smith, B., Bodin, P., Holmér, J., and Arneth, A.: Modelling the response of yields and tissue C:N to changes in atmospheric CO2 and N management in the main wheat regions of western Europe, Biogeosciences, 12, 2489–2515, https://doi.org/10.5194/bg-12-2489-2015, 2015a.
Olin, S., Lindeskog, M., Pugh, T. A. M., Schurgers, G., Wårlind, D., Mishurov, M., Zaehle, S., Stocker, B. D., Smith, B., and Arneth, A.: Soil carbon management in large-scale Earth system modelling: Implications for crop yields and nitrogen leaching, Earth Syst. Dynam., 6, 745–768, https://doi.org/10.5194/esd-6-745-2015, 2015b.
Ouyang, Y., Norton, J. M., and Stark, J. M.: Ammonium availability and temperature control contributions of ammonia oxidizing bacteria and archaea to nitrification in an agricultural soil, Soil Biol. Biochem., 113, 161–172, https://doi.org/10.1016/j.soilbio.2017.06.010, 2017.
Pärn, J., Verhoeven, J. T. A., Butterbach-Bahl, K., Dise, N. B., Ullah, S., Aasa, A., Egorov, S., Espenberg, M., Järveoja, J., Jauhiainen, J., Kasak, K., Klemedtsson, L., Kull, A., Laggoun-Défarge, F., Lapshina, E. D., Lohila, A., Lõhmus, K., Maddison, M., Mitsch, W. J., Müller, C., Niinemets, Ü., Osborne, B., Pae, T., Salm, J. O., Sgouridis, F., Sohar, K., Soosaar, K., Storey, K., Teemusk, A., Tenywa, M. M., Tournebize, J., Truu, J., Veber, G., Villa, J. A., Zaw, S. S., and Mander, Ü.: Nitrogen-rich organic soils under warm well-drained conditions are global nitrous oxide emission hotspots, Nat. Commun., 9, 1–8, https://doi.org/10.1038/s41467-018-03540-1, 2018.
Parton, W. J., Mosier, A. R., Ojima, D. S., Valentine, D. W., Schime, D. S., Weier, K., and Kulmala, A. E.: Generalized model for N2 and N2O production from nitrification and denitrification, Global Biogeochem. Cy., 10, 401–412, https://doi.org/10.1029/96GB01455, 1996.
Parton, W. J., Holland, E. A., Del Grosso, S. J., Hartman, M. D., Martin, R. E., Mosier, A. R., Ojima, D. S., and Schimel, D. S.: Generalized model for NOx and N2O emissions from soils, J. Geophys. Res., 106, 17403–17419, https://doi.org/10.1029/2001JD900101, 2001.
Pei, Z., Hua, O., Zhou, C., and Xu, X.: N2O Exchange Within a Soil and Atmosphere Profile in Alpine Grasslands on the Qinghai-Xizang Plateau, Acta Bot. Sin., 46, 20–28, 2004.
Pilegaard, K.: Processes regulating nitric oxide emissions from soils, Philos. T. Roy. Soc. B, 368, 20130126, https://doi.org/10.1098/rstb.2013.0126, 2013.
Poeplau, C. and Don, A.: Carbon sequestration in agricultural soils via cultivation of cover crops – A meta-analysis, Agric. Ecosyst. Environ., 200, 33–41, https://doi.org/10.1016/j.agee.2014.10.024, 2015.
Pongratz, J., Dolman, H., Don, A., Erb, K. H., Fuchs, R., Herold, M., Jones, C., Kuemmerle, T., Luyssaert, S., Meyfroidt, P., and Naudts, K.: Models meet data: Challenges and opportunities in implementing land management in Earth system models, Global Change Biol., 24, 1470–1487, https://doi.org/10.1111/gcb.13988, 2018.
Portmann, F. T., Siebert, S., and Döll, P.: MIRCA2000 (1.1), Zenodo [data set], https://doi.org/10.5281/zenodo.7422506, 2010.
Porwollik, V., Rolinski, S., Heinke, J., and Müller, C.: Generating a rule-based global gridded tillage dataset, Earth Syst. Sci. Data, 11, 823–843, https://doi.org/10.5194/essd-11-823-2019, 2019.
Porwollik, V., Rolinski, S., Heinke, J., von Bloh, W., Schaphoff, S., and Müller, C.: The role of cover crops for cropland soil carbon, nitrogen leaching, and agricultural yields – a global simulation study with LPJmL (V.5.0-tillage-cc), Biogeosciences, 19, 957–977, https://doi.org/10.5194/bg-19-957-2022, 2022.
Pugh, T. A. M., Arneth, A., Olin, S., Ahlström, A., Bayer, A. D., Klein Goldewijk, K., Lindeskog, M., and Schurgers, G.: Simulated carbon emissions from land-use change are substantially enhanced by accounting for agricultural management, Environ. Res. Lett., 10, 124008, https://doi.org/10.1088/1748-9326/10/12/124008, 2015.
Purbopuspito, J., Veldkamp, E., Brumme, R., and Murdiyarso, D.: Trace gas fluxes and nitrogen cycling along an elevation sequence of tropical montane forests in Central Sulawesi, Indonesia, Global Biogeochem. Cy., 20, 1–11, https://doi.org/10.1029/2005GB002516, 2006.
Quemada, M., Lassaletta, L., Leip, A., Jones, A., and Lugato, E.: Integrated management for sustainable cropping systems: Looking beyond the greenhouse balance at the field scale, Global Change Biol., 26, 2584–2598, https://doi.org/10.1111/gcb.14989, 2020.
Ren, W., Banger, K., Tao, B., Yang, J., Huang, Y., and Tian, H.: Global pattern and change of cropland soil organic carbon during 1901–2010: Roles of climate, atmospheric chemistry, land use and management, Geogr. Sustain., 1, 59–69, https://doi.org/10.1016/j.geosus.2020.03.001, 2020.
Rochester, I. J.: Estimating nitrous oxide emissions from flood-irrigated alkaline grey clays, Aust. J. Soil Res., 41, 197–206, https://doi.org/10.1071/SR02068, 2003.
Saikawa, E., Schlosser, C. A., and Prinn, R. G.: Global modeling of soil nitrous oxide emissions from natural processes, Global Biogeochem. Cy., 27, 972–989, https://doi.org/10.1002/gbc.20087, 2013.
Saikawa, E., Prinn, R. G., Dlugokencky, E., Ishijima, K., Dutton, G. S., Hall, B. D., Langenfelds, R., Tohjima, Y., Machida, T., Manizza, M., Rigby, M., O'Doherty, S., Patra, P. K., Harth, C. M., Weiss, R. F., Krummel, P. B., Van Der Schoot, M., Fraser, P. J., Steele, L. P., Aoki, S., Nakazawa, T., and Elkins, J. W.: Global and regional emissions estimates for N2O, Atmos. Chem. Phys., 14, 4617–4641, https://doi.org/10.5194/acp-14-4617-2014, 2014.
Scheer, C., Fuchs, K., Pelster, D. E., and Butterbach-Bahl, K.: Estimating global terrestrial denitrification from measured product ratios, Curr. Opin. Environ. Sustain., 47, 72–80, https://doi.org/10.1016/j.cosust.2020.07.005, 2020.
Schlüter, S., Lucas, M., Grosz, B., Ippisch, O., Zawallich, J., He, H., Dechow, R., Kraus, D., Blagodatsky, S., Senbayram, M., Kravchenko, A., Vogel, H. J., and Well, R.: The anaerobic soil volume as a controlling factor of denitrification: a review, Biol. Fertil. Soils, 61, 343–365, https://doi.org/10.1007/s00374-024-01819-8, 2025.
Shcherbak, I., Millar, N., and Robertson, G. P.: Global metaanalysis of the nonlinear response of soil nitrous oxide (N2O) emissions to fertilizer nitrogen, P. Natl. Acad. Sci. USA, 111, 9199–9204, https://doi.org/10.1073/pnas.1322434111, 2014.
Shen, Y. and Zhu, B.: Effects of nitrogen and phosphorus enrichment on soil N2O emission from natural ecosystems: A global meta-analysis, Environ. Pollut., 301, 118993, https://doi.org/10.1016/j.envpol.2022.118993, 2022.
Sihi, D., Davidson, E. A., Savage, K. E., and Liang, D.: Simultaneous numerical representation of soil microsite production and consumption of carbon dioxide, methane, and nitrous oxide using probability distribution functions, Global Change Biol., 26, 200–218, https://doi.org/10.1111/gcb.14855, 2020.
Siljanen, H. M. P., Welti, N., Voigt, C., Heiskanen, J., Biasi, C., and Martikainen, P. J.: Atmospheric impact of nitrous oxide uptake by boreal forest soils can be comparable to that of methane uptake, Plant Soil, 454, 121–138, https://doi.org/10.1007/s11104-020-04638-6, 2020.
Smith, B., Wårlind, D., Arneth, A., Hickler, T., Leadley, P., Siltberg, J., and Zaehle, S.: Implications of incorporating N cycling and N limitations on primary production in an individual-based dynamic vegetation model, Biogeosciences, 11, 2027–2054, https://doi.org/10.5194/bg-11-2027-2014, 2014.
Smith, K. A., Mosier, A. R., Crutzen, P. J., and Winiwarter, W.: The role of N2O derived from crop-based biofuels, and from agriculture in general, in Earth's climate, Philos. T. Roy. Soc. B, 367, 1169–1174, https://doi.org/10.1098/rstb.2011.0313, 2012.
Smith, P., Calvin, K., Nkem, J., Campbell, D., Cherubini, F., Grassi, G., Korotkov, V., Le Hoang, A., Lwasa, S., McElwee, P., Nkonya, E., Saigusa, N., Soussana, J. F., Taboada, M. A., Manning, F. C., Nampanzira, D., Arias-Navarro, C., Vizzarri, M., House, J., Roe, S., Cowie, A., Rounsevell, M., and Arneth, A.: Which practices co-deliver food security, climate change mitigation and adaptation, and combat land degradation and desertification?, Global Change Biol., 26, 1532–1575, https://doi.org/10.1111/gcb.14878, 2020.
Song, C. and Zhang, J.: Effects of soil moisture, temperature, and nitrogen fertilization on soil respiration and nitrous oxide emission during maize growth period in northeast China, Acta Agric. Scand. B, 59, 97–106, https://doi.org/10.1080/09064710802022945, 2009.
Song, X., Liu, M., Ju, X., Gao, B., Su, F., Chen, X., and Rees, R. M.: Nitrous Oxide Emissions Increase Exponentially When Optimum Nitrogen Fertilizer Rates Are Exceeded in the North China Plain, Environ. Sci. Technol., 52, 12504–12513, https://doi.org/10.1021/acs.est.8b03931, 2018.
Springmann, M., Clark, M., Mason-D'Croz, D., Wiebe, K., Bodirsky, B. L., Lassaletta, L., de Vries, W., Vermeulen, S. J., Herrero, M., Carlson, K. M., Jonell, M., Troell, M., DeClerck, F., Gordon, L. J., Zurayk, R., Scarborough, P., Rayner, M., Loken, B., Fanzo, J., Godfray, H. C. J., Tilman, D., Rockström, J., and Willett, W.: Options for keeping the food system within environmental limits, Nature, 562, 519–525, https://doi.org/10.1038/s41586-018-0594-0, 2018.
Stehfest, E. and Bouwman, L.: N2O and NO emission from agricultural fields and soils under natural vegetation: Summarizing available measurement data and modeling of global annual emissions, Nutr. Cycl. Agroecosyst., 74, 207–228, https://doi.org/10.1007/s10705-006-9000-7, 2006.
Taylor, A. E., Myrold, D. D., and Bottomley, P. J.: Temperature affects the kinetics of nitrite oxidation and nitrification coupling in four agricultural soils, Soil Biol. Biochem., 136, 107523, https://doi.org/10.1016/j.soilbio.2019.107523, 2019.
Thompson, R. L., Lassaletta, L., Patra, P. K., Wilson, C., Wells, K. C., Gressent, A., Koffi, E. N., Chipperfield, M. P., Winiwarter, W., Davidson, E. A., Tian, H., and Canadell, J. G.: Acceleration of global N2O emissions seen from two decades of atmospheric inversion, Nat. Clim. Change, 9, 993–998, https://doi.org/10.1038/s41558-019-0613-7, 2019.
Tian, H., Lu, C., Melillo, J., Ren, W., Huang, Y., Xu, X., Liu, M., Zhang, C., Chen, G., Pan, S., Liu, J., and Reilly, J.: Food benefit and climate warming potential of nitrogen fertilizer uses in China, Environ. Res. Lett., 7, 044020, https://doi.org/10.1088/1748-9326/7/4/044020, 2012.
Tian, H., Yang, J., Lu, C., Xu, R., Canadell, J. G., Jackson, R. B., Arneth, A., Chang, J., Chen, G., Ciais, P., Gerber, S., Ito, A., Huang, Y., Joos, F., Lienert, S., Messina, P., Olin, S., Pan, S., Peng, C., Saikawa, E., Thompson, R. L., Vuichard, N., Winiwarter, W., Zaehle, S., Zhang, B., Zhang, K., and Zhu, Q.: The global N2O model intercomparison project, B. Am. Meteorol. Soc., 99, 1231–1251, https://doi.org/10.1175/BAMS-D-17-0212.1, 2018.
Tian, H., Yang, J., Xu, R., Lu, C., Canadell, J. G., Davidson, E. A., Jackson, R. B., Arneth, A., Chang, J., Ciais, P., Gerber, S., Ito, A., Joos, F., Lienert, S., Messina, P., Olin, S., Pan, S., Peng, C., Saikawa, E., Thompson, R. L., Vuichard, N., Winiwarter, W., Zaehle, S., and Zhang, B.: Global soil nitrous oxide emissions since the preindustrial era estimated by an ensemble of terrestrial biosphere models: Magnitude, attribution, and uncertainty, Global Change Biol., 25, 640–659, https://doi.org/10.1111/gcb.14514, 2019.
Tian, H., Xu, R., Canadell, J. G., Thompson, R. L., Winiwarter, W., Suntharalingam, P., Davidson, E. A., Ciais, P., Jackson, R. B., Janssens-Maenhout, G., Prather, M. J., Regnier, P., Pan, N., Pan, S., Peters, G. P., Shi, H., Tubiello, F. N., Zaehle, S., Zhou, F., Arneth, A., Battaglia, G., Berthet, S., Bopp, L., Bouwman, A. F., Buitenhuis, E. T., Chang, J., Chipperfield, M. P., Dangal, S. R. S., Dlugokencky, E., Elkins, J. W., Eyre, B. D., Fu, B., Hall, B., Ito, A., Joos, F., Krummel, P. B., Landolfi, A., Laruelle, G. G., Lauerwald, R., Li, W., Lienert, S., Maavara, T., MacLeod, M., Millet, D. B., Olin, S., Patra, P. K., Prinn, R. G., Raymond, P. A., Ruiz, D. J., van der Werf, G. R., Vuichard, N., Wang, J., Weiss, R. F., Wells, K. C., Wilson, C., Yang, J., and Yao, Y.: A comprehensive quantification of global nitrous oxide sources and sinks, Nature, 586, 248–256, https://doi.org/10.1038/s41586-020-2780-0, 2020.
Tian, H., Bian, Z., Shi, H., Qin, X., Pan, N., Lu, C., Pan, S., Tubiello, F. N., Chang, J., Conchedda, G., Liu, J., Mueller, N., Nishina, K., Xu, R., Yang, J., You, L., and Zhang, B.: History of anthropogenic Nitrogen inputs (HaNi) to the terrestrial biosphere: a 5 arcmin resolution annual dataset from 1860 to 2019, Earth Syst. Sci. Data, 14, 4551–4568, https://doi.org/10.5194/essd-14-4551-2022, 2022.
Tian, H., Pan, N., Thompson, R. L., Canadell, J. G., Suntharalingam, P., Regnier, P., Davidson, E. A., Prather, M., Ciais, P., Muntean, M., Pan, S., Winiwarter, W., Zaehle, S., Zhou, F., Jackson, R. B., Bange, H. W., Berthet, S., Bian, Z., Bianchi, D., Bouwman, A. F., Buitenhuis, E. T., Dutton, G., Hu, M., Ito, A., Jain, A. K., Jeltsch-Thömmes, A., Joos, F., Kou-Giesbrecht, S., Krummel, P. B., Lan, X., Landolfi, A., Lauerwald, R., Li, Y., Lu, C., Maavara, T., Manizza, M., Millet, D. B., Mühle, J., Patra, P. K., Peters, G. P., Qin, X., Raymond, P., Resplandy, L., Rosentreter, J. A., Shi, H., Sun, Q., Tonina, D., Tubiello, F. N., Van Der Werf, G. R., Vuichard, N., Wang, J., Wells, K. C., Western, L. M., Wilson, C., Yang, J., Yao, Y., You, Y., and Zhu, Q.: Global nitrous oxide budget (1980–2020), Earth Syst. Sci. Data, 16, 2543–2604, https://doi.org/10.5194/essd-16-2543-2024, 2024.
Val Martin, M., Blanc-Betes, E., Ming Fung, K., Kantzas, E. P., Kantola, I. B., Chiaravalloti, I., Taylor, L. T., Emmons, L. E., Wieder, W. R., Planavsky, N. J., Masters, M. D., Delucia Evan H., Tai, A. P. K., and Beerling, D. J.: Improving nitrogen cycling in a land surface model (CLM5) to quantify soil N2O, NO and NH3 emissions from enhanced rock weathering with croplands, Geosci. Model Dev., 16, 5783–5801, https://doi.org/10.5194/gmd-16-5783-2023, 2023.
Van Groenigen, K. J., Osenberg, C. W., and Hungate, B. A.: Increased soil emissions of potent greenhouse gases under increased atmospheric CO2, Nature, 475, 214–216, https://doi.org/10.1038/nature10176, 2011.
Von Bloh, W., Schaphoff, S., Müller, C., Rolinski, S., Waha, K., and Zaehle, S.: Implementing the nitrogen cycle into the dynamic global vegetation, hydrology, and crop growth model LPJmL (version 5.0), Geosci. Model Dev., 11, 2789–2812, https://doi.org/10.5194/gmd-11-2789-2018, 2018.
Wagner-Riddle, C., Congreves, K. A., Brown, S. E., Helgason, W. D., and Farrell, R. E.: Overwinter and Spring Thaw Nitrous Oxide Fluxes in a Northern Prairie Cropland Are Limited but a Significant Proportion of Annual Emissions, Global Biogeochem. Cy., 38, e2023GB008051, https://doi.org/10.1029/2023GB008051, 2024.
Wang, Q., Zhou, F., Shang, Z., Ciais, P., Winiwarter, W., Jackson, R. B., Tubiello, F. N., Janssens-Maenhout, G., Tian, H., Cui, X., Canadell, J. G., Piao, S., and Tao, S.: Data-driven estimates of global nitrous oxide emissions from croplands, Natl. Sci. Rev., 7, 441–452, https://doi.org/10.1093/nsr/nwz087, 2020.
Wårlind, D., Smith, B., Hickler, T., and Arneth, A.: Nitrogen feedbacks increase future terrestrial ecosystem carbon uptake in an individual-based dynamic vegetation model, Biogeosciences, 11, 6131–6146, https://doi.org/10.5194/bg-11-6131-2014, 2014.
Weier, K. L., Doran, J. W., Power, J. F., and Walters, D. T.: Denitrification and the Dinitrogen/Nitrous Oxide Ratio as Affected by Soil Water, Available Carbon, and Nitrate, Soil Sci. Soc. Am. J., 57, 66–72, https://doi.org/10.2136/sssaj1993.03615995005700010013x, 1993.
Winkler, K., Fuchs, R., Rounsevell, M., and Herold, M.: HILDA+ Global Land Use Change between 1960 and 2019, PANGAEA [data set], https://doi.org/10.1594/PANGAEA.921846, 2020.
World Meteorological Organization: Scientific Assessment of Ozone Depletion, Geneva, Switzerland, https://ozone.unep.org/science/assessment/sap (last access: 29 June 2024), 2022.
Xu, R., Tian, H., Pan, S., Prior, S. A., Feng, Y., and Dangal, S. R. S.: Global N2O Emissions From Cropland Driven by Nitrogen Addition and Environmental Factors: Comparison and Uncertainty Analysis, Global Biogeochem. Cy., 34, 1–16, https://doi.org/10.1029/2020GB006698, 2020.
Xu-Ri and Prentice, I. C.: Terrestrial nitrogen cycle simulation with a dynamic global vegetation model, Global Change Biol., 14, 1745–1764, https://doi.org/10.1111/j.1365-2486.2008.01625.x, 2008.
Xu-Ri, Prentice, I. C., Spahni, R., and Niu, H.: Modelling terrestrial nitrous oxide emissions and implications for climate feedback, New Phytol., 196, 472–488, https://doi.org/10.1111/j.1469-8137.2012.04269.x, 2012.
Yangjin, D., Wu, X., Bai, H., and Gu, J.: A meta-analysis of management practices for simultaneously mitigating N2O and NO emissions from agricultural soils, Soil Till. Res., 213, 105142, https://doi.org/10.1016/j.still.2021.105142, 2021.
Zaehle, S.: Terrestrial nitrogen-carbon cycle interactions at the global scale, Philos. T. Roy. Soc. B, 368, 20130125, https://doi.org/10.1098/rstb.2013.0125, 2013.
Zaehle, S., Ciais, P., Friend, A. D., and Prieur, V.: Carbon benefits of anthropogenic reactive nitrogen offset by nitrous oxide emissions, Nat. Geosci., 4, 601–605, https://doi.org/10.1038/ngeo1207, 2011.
Zhang, B., Tian, H., Lu, C., Dangal, S., Yang, J., and Pan, S.: nitrogen production and application in cropland and rangeland during 1860–2014: A 5 arcmin gridded global data set for Earth system modeling, Earth Syst. Sci. Data, 9, 667–678, https://doi.org/10.5194/essd-2017-11, 2017a.
Zhang, K., Peng, C., Wang, M., Zhou, X., Li, M., Wang, K., Ding, J., and Zhu, Q.: Process-based TRIPLEX-GHG model for simulating N2O emissions from global forests and grasslands: Model development and evaluation, J. Adv. Model. Earth Syst., 2079–2102, https://doi.org/10.1002/2017MS000934, 2017b.
Zhang, X., Zou, T., Lassaletta, L., Mueller, N. D., Tubiello, F. N., Lisk, M. D., Lu, C., Conant, R. T., Dorich, C. D., Gerber, J., Tian, H., Bruulsema, T., Maaz, T. M. C., Nishina, K., Bodirsky, B. L., Popp, A., Bouwman, L., Beusen, A., Chang, J., Havlík, P., Leclère, D., Canadell, J. G., Jackson, R. B., Heffer, P., Wanner, N., Zhang, W., and Davidson, E. A.: Quantification of global and national nitrogen budgets for crop production, Nat. Food, 2, 529–540, https://doi.org/10.1038/s43016-021-00318-5, 2021.