the Creative Commons Attribution 4.0 License.
the Creative Commons Attribution 4.0 License.
 | 15 May 2025
Similarity-based analysis of atmospheric organic compounds for machine learning applications
Hilda Sandström
Patrick Rinke
The formation of aerosol particles in the atmosphere impacts air quality and climate change, but many of the organic molecules involved remain unknown. Machine learning could aid in identifying these compounds through accelerated analysis of molecular properties and detection characteristics. However, such progress is hindered by the current lack of curated datasets for atmospheric molecules and their associated properties. To tackle this challenge, we propose a similarity analysis that connects atmospheric compounds to existing large molecular datasets used for machine learning development. We find a small overlap between atmospheric and non-atmospheric molecules using standard molecular representations in machine learning applications. The identified out-of-domain character of atmospheric compounds is related to their distinct functional groups and atomic composition. Our investigation underscores the need for collaborative efforts to gather and share more molecular-level atmospheric chemistry data. The presented similarity-based analysis can be used for future dataset curation for machine learning development in the atmospheric sciences.
- Article
(10982 KB) - Full-text XML
- BibTeX
- EndNote


Aerosol particles influence our climate by sunlight reflection and absorption, as well as by serving as nuclei for cloud condensation (Pörtner et al., 2023). Beyond climate impact, aerosol particles affect air quality, causing adverse effects on human health (Pozzer et al., 2023; Khomenko et al., 2021; Lelieveld et al., 2020). However, the underlying molecular-level processes involving organic molecules remain poorly understood, due to the vast number of organic compounds participating in atmospheric chemistry. Many of these particles are formed through the oxidation of volatile organic compounds, which leads to the formation of so-called secondary organic aerosols in the atmosphere (Bianchi et al., 2019). This existing gap in knowledge hampers a comprehensive understanding of particle formation and growth in different environments (Masson-Delmotte et al., 2023; Elm et al., 2020). In this paper, we take an initial step to evaluate the potential of filling this void using machine learning. We propose a molecular similarity-based analysis to measure the overlap between atmospheric compounds and common molecular datasets used in machine learning development. By doing so, we can provide a tool to tailor machine learning models for studies of aerosol particle formation and the effects human-based activities, such as industry and agriculture, on the formation process. Ultimately, such insights can lead to more informed decisions regarding air quality and climate change mitigation.
Secondary organic aerosol particle formation is affected by atmospheric composition and molecular emissions into the atmosphere. Emitted molecules can transform in reactions initiated by sunlight to a diverse array of compounds with numerous functional groups (Bianchi et al., 2019). These reactions are estimated to produce between hundreds of thousands to millions of atmospherically relevant molecules (Goldstein and Galbally, 2007; Nozière et al., 2015). Out of this plethora, an unknown number can form or grow aerosol particles by interacting with inorganic emissions (Schobesberger et al., 2013; Riccobono et al., 2014; Ehn et al., 2014), or by themselves (Kirkby et al., 2016). Details of aerosol particle formation can be uncovered through identification of relevant atmospheric reactions (e.g., Peräkylä et al., 2020; Iyer et al., 2023), aerosol-forming compounds (e.g., Franklin et al., 2022; Worton et al., 2017; Hamilton et al., 2004; Thoma et al., 2022), and cluster formation steps (Elm et al., 2020).
Mapping aerosol particle formation experimentally is challenging due to the sheer number of potentially relevant compounds. Moreover, spectrometry-based compound identification with, for example, mass spectrometers is hindered by the absence of curated reference spectra for atmospheric molecules (Franklin et al., 2022; Worton et al., 2017; Hamilton et al., 2004). The study of particle growth is another experimental challenge due to the wide range of size scales involved. Neither aerosol mass spectrometry nor atmospheric pressure chemical ionization mass spectrometry alone can be used to study the entire particle growth process (Elm et al., 2020). Thus, with a few exceptions (e.g., Franklin et al., 2022; Worton et al., 2017; Hamilton et al., 2004; Sander, 2015), curated structure-annotated molecular datasets from experiments are lacking.
In adjacent chemical disciplines such as metabolomics, these curated molecular datasets play a crucial role for chemical analysis. For example, they assist in compound identification either directly (Kind et al., 2013; Sud et al., 2007; HighChem LLC, 2023; Sawada et al., 2012; Wissenbach et al., 2011b, a; Montenegro-Burke et al., 2020; Taguchi and Ishikawa, 2010; Oberacher, 2012; Hummel et al., 2013; Watanabe et al., 2000; McLafferty and Wiley, 2020; Wang et al., 2016; Wishart et al., 2022; Wallace and Moorthy, 2023; Weber et al., 2012; MassBank consortium, 2024; MassBank of North America, 2024) or through the development of machine-learning-based identification tools (Heinonen et al., 2012; Dührkop et al., 2015; Brouard et al., 2016; Nguyen et al., 2018, 2019). These datasets also form the foundation of data-driven analysis platforms, e.g., Nothias et al. (2020). Moreover, curated datasets contribute to the construction of machine learning models for quantitative structure–activity relationships, facilitating large-scale screening of molecular properties for specific reactions or applications (Kulik et al., 2022). Thus, in order to reach the full potential of data-driven methods, we need such datasets. Currently, in atmospheric science, computational techniques are bridging the gap to what can be experimentally observed for atmospheric compounds.
Computational simulations and predictive modeling offer an alternative approach to studying molecular-level atmospheric chemistry (Fig. 1). Reaction models, such as Gecko-A (Aumont et al., 2005) or the Master Chemical Mechanism (MCM, http://mcm.leeds.ac.uk/MCM, last access: 22 April 2025) (Jenkin et al., 1997; Saunders et al., 2003), can be used to propose likely atmospheric reaction products based on a set of precursor molecules, reactions, and conditions. With such model simulations, atmospheric molecular datasets such as Gecko (Isaacman-Vanwertz and Aumont, 2021) and Wang (Wang et al., 2017) have been generated. The Wang dataset (Wang et al., 2017) was constructed using MCM (Jenkin et al., 1997; Saunders et al., 2003) to simulate the atmospheric degradation of 143 atmospheric compounds (methane and 142 non-methane volatile organic compounds) by photolysis and reactions with OH, NO3, and O3. Similarly, the Gecko dataset (Isaacman-Vanwertz and Aumont, 2021) was generated by simulating the gas-phase oxidation of three important atmospheric compounds – toluene, α-pinene, and decane – using the Gecko-A code (Aumont et al., 2005; Lannuque et al., 2018). Both the Wang and Gecko datasets have been used to predict physicochemical properties such as saturation vapor pressures and partition coefficients (Wang et al., 2017; Lumiaro et al., 2021; Besel et al., 2023, 2024). In addition, computational simulations of particle formation have resulted in the Clusteromics datasets containing common acid–base clusters and their associated thermodynamic and kinetic properties (Elm, 2019, 2021a, b, 2022; Knattrup and Elm, 2022). Thus, simulations and property prediction can be used to propose important candidate compounds in organic aerosol formation processes (Fig. 1).

Figure 1Molecular emissions react in the atmosphere to form a diverse array of compounds, contributing to aerosol particle formation. However, identifying these compounds remains challenging. Although experiments and field studies can detect certain compounds in the atmosphere and within the aerosols, they lack the ability to resolve the identity of a majority of these compounds. Computational techniques, like reaction mechanistic simulations and property predictions, aid in describing atmospheric reaction products and their impact on particulate matter. Enhancing our understanding of these molecular processes will illuminate the effects of human emissions on cloud formation, air quality, and climate. Data-driven methods could help advance and accelerate the displayed experimental and computational workflows.
In recent years, machine learning methods have shown promise for accelerating traditional computational and experimental atmospheric chemistry research (Sandström et al., 2024; Franklin et al., 2022; Besel et al., 2023, 2024; Berkemeier et al., 2023; Kubečka et al., 2023; Knattrup et al., 2023; Krüger et al., 2022; Hyttinen et al., 2022; Lumiaro et al., 2021). Yet, practical applications of data-driven methods in atmospheric chemistry are still hindered by the aforementioned scarcity of curated experimental datasets. This raises questions about how machine learning advancements in atmospheric chemistry can leverage molecular datasets and models from computational simulations or other chemical disciplines. While this approach is currently especially important in atmospheric chemistry, it also mirrors similar efforts of data augmentation in other fields.
Here, our goal is to assess how closely atmospheric molecular data align with comprehensive curated datasets from other chemical domains. We assess the impact of the current data gap in atmospheric chemistry on the progress of data-driven methods in the field. We also address the potential for using datasets and models developed in other tangential chemical domains (e.g., metabolomics, drug design or environmental chemistry) for transfer learning or data augmentation in atmospheric chemistry.
In our analysis, we represent atmospheric compounds by the abovementioned Wang and Gecko datasets. In addition, we include a third atmospheric dataset composed of quinones, organic molecules that result from oxidation of aromatic compounds (Tabor et al., 2019; Krüger et al., 2022). Example molecular precursors to Wang and Gecko, as well as an example quinone compound, are shown in Fig. 2.

Figure 2The three atmospheric datasets used in the comparison of this paper are Wang (Wang et al., 2017), Gecko (Isaacman-Vanwertz and Aumont, 2021), and Quinones (Tabor et al., 2019; Krüger et al., 2022). The Gecko and Wang datasets contain simulated reaction products starting from a set of precursors (exemplified in the figure), and the Quinone dataset contains compounds from a class of oxidation products derived from aromatics called quinones.
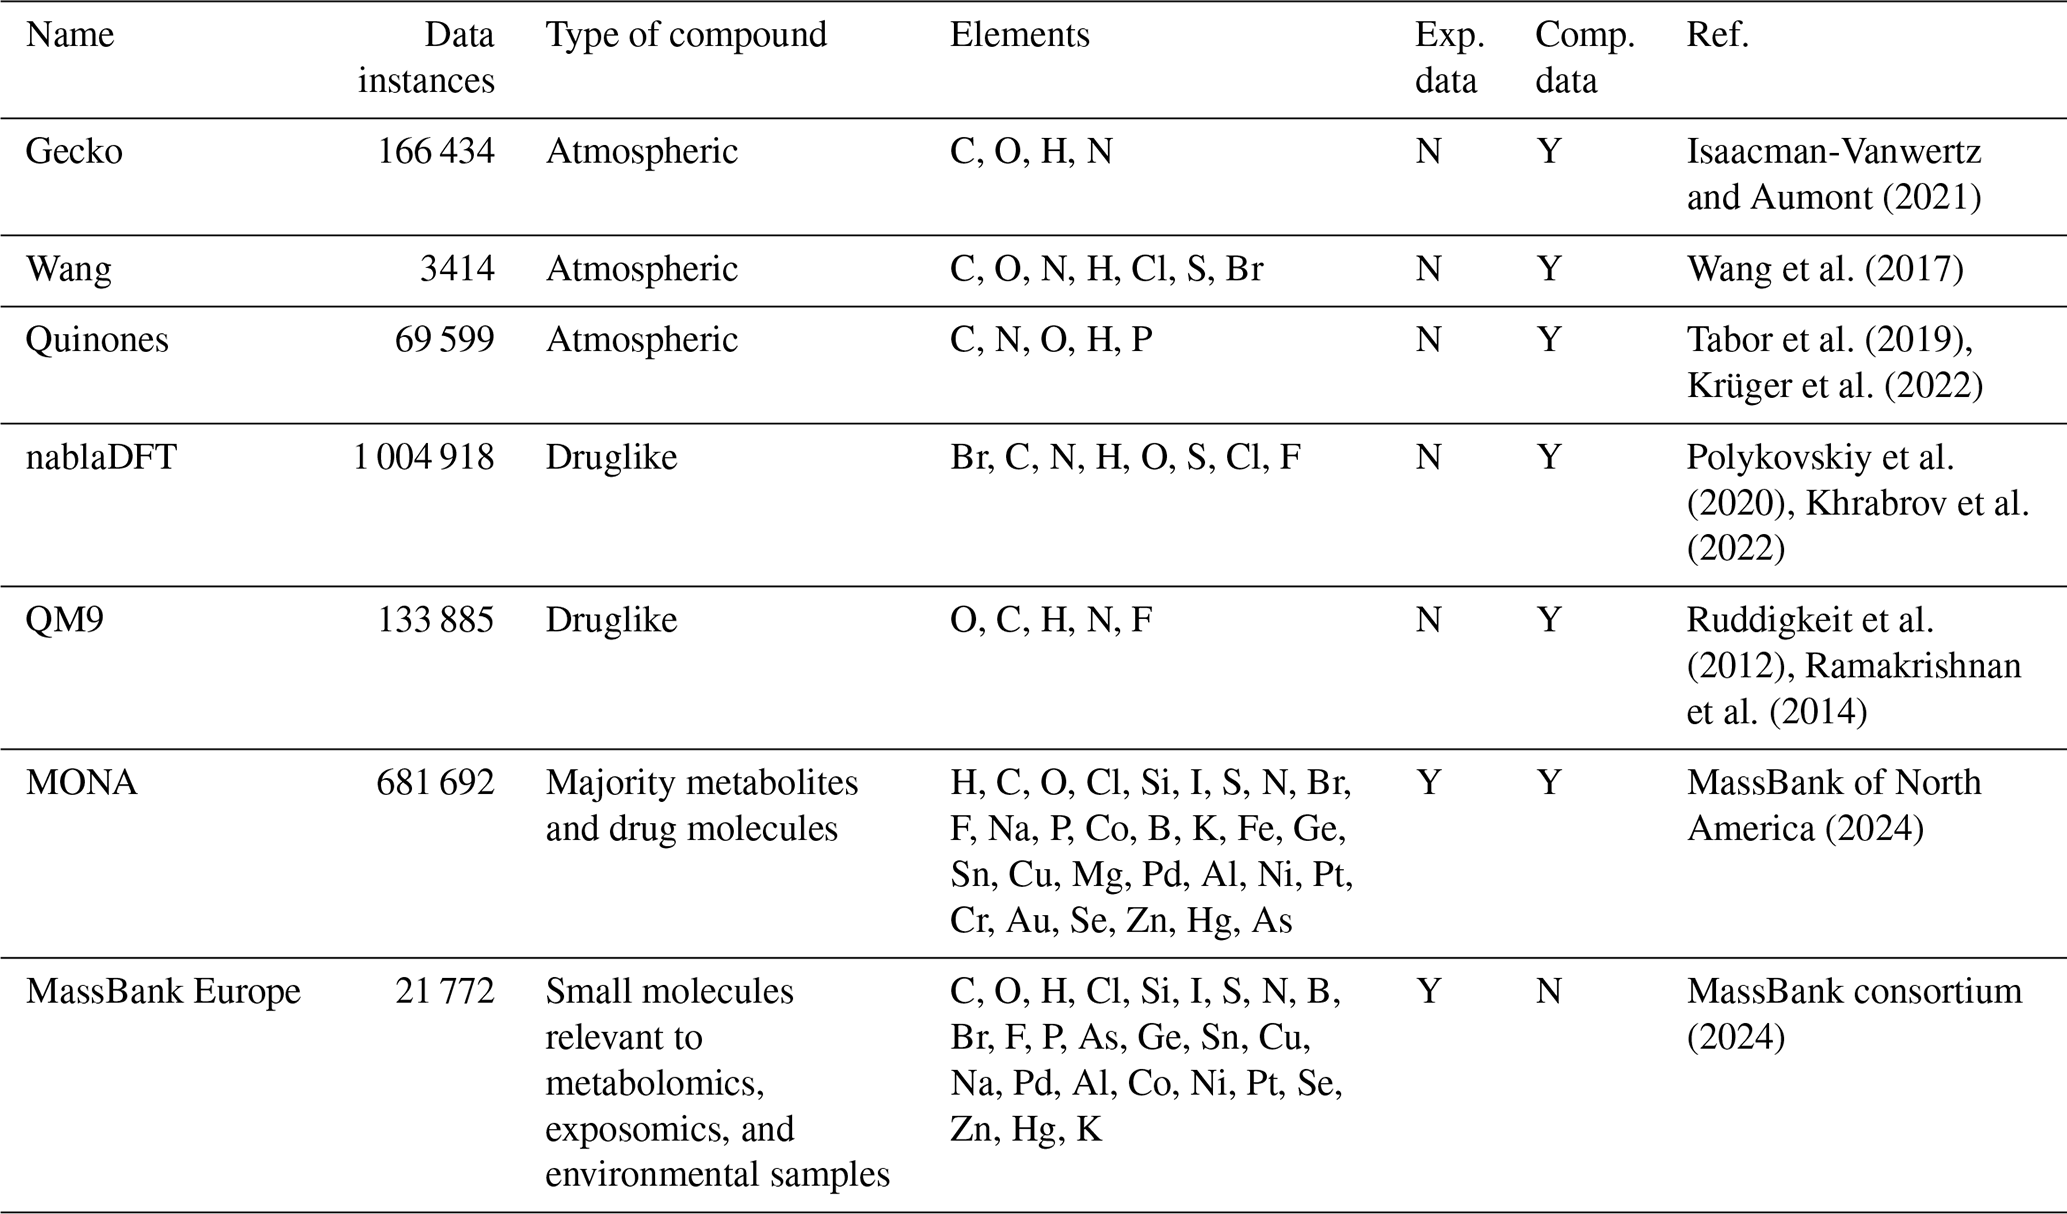
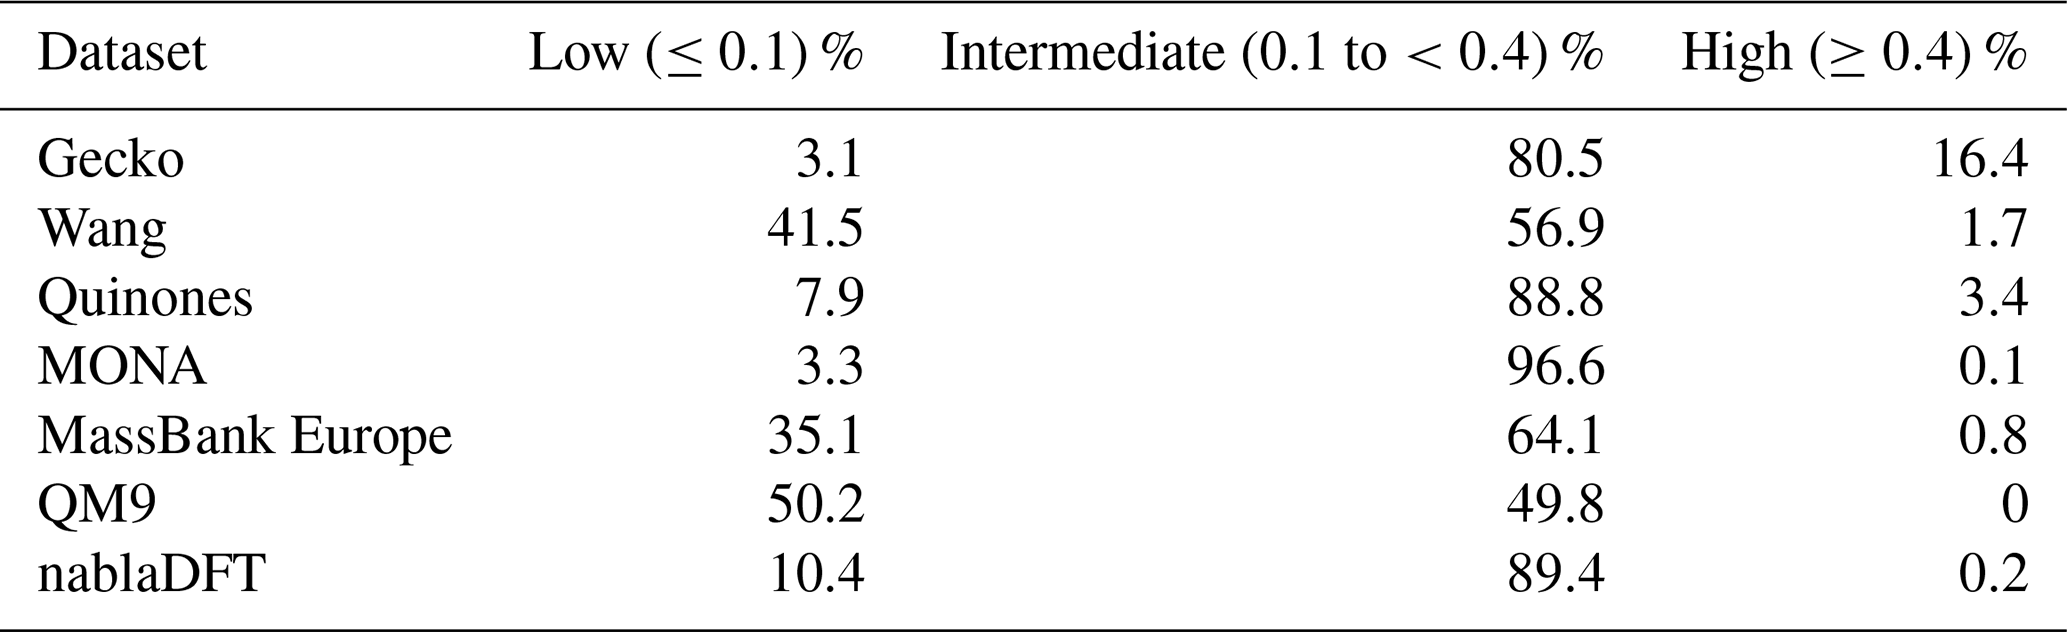
We explore the similarity of our atmospheric compound domain to four molecular datasets used either for molecular property prediction (QM9 and nablaDFT) or compound identification by mass spectrometry (MassBank Europe and MassBank of North America, MONA). Both application areas are relevant to machine learning in molecular atmospheric research (Sandström et al., 2024; Franklin et al., 2022; Worton et al., 2017; Hamilton et al., 2004; Besel et al., 2023; Lumiaro et al., 2021; Wang et al., 2017). QM9 (Ramakrishnan et al., 2014) is a standard benchmark dataset for machine learning in molecular sciences. The dataset was constructed by selecting molecules with up to nine non-hydrogen atoms (limited to OCNF) from the GDB-17 database (Ruddigkeit et al., 2012). GDB-17 is a database consisting of 166 billion enumerated molecules consisting of up to 17 CNOS and halogen atoms. QM9 includes harmonic frequencies, dipole moments, polarizabilities, and electronic and thermal energies for the molecular minimum energy conformation. The nablaDFT dataset, instead, was curated from the Molecular Sets (MOSES) dataset (Polykovskiy et al., 2020) for the purpose of training models for quantum chemical property prediction (conformational energy and Hamiltonian). On the other hand, the MassBank datasets provide data pairs of molecular structures and their corresponding mass spectra, and they have been used to train and test machine learning models for compound identification based on mass spectra (Heinonen et al., 2012; Dührkop et al., 2015, 2019). The MassBank datasets primarily contain molecules with relevance to metabolomics or environmental studies. While MassBank Europe contains purely experimental data, MONA also provides computationally predicted mass spectra. Table 1 summarizes the seven atmospheric and non-atmospheric molecular datasets we use in our analysis.
Isaacman-Vanwertz and Aumont (2021)Wang et al. (2017)Tabor et al. (2019)Krüger et al. (2022)Polykovskiy et al. (2020)Khrabrov et al. (2022)Ruddigkeit et al. (2012)Ramakrishnan et al. (2014)MassBank of North America (2024)MassBank consortium (2024)Table 1The molecular datasets used in our similarity analysis comparing atmospheric compounds to metabolite and drug compounds. The datasets were downloaded 8 January 2024 in SMILES (Simplified Molecular Input Line Entry System) format (xyz in the case of QM9). The reported dataset sizes were obtained after data preprocessing, which involved removing unparsable SMILES representations and eliminating duplicate entries.
The paper is organized as follows. We present our molecular similarity analysis method in Sect. 2. Section 3 presents the outcomes of our similarity-based comparison. In Sect. 4 we discuss our findings, and in Sect. 5 we provide an outlook on how our similarity-based analysis can be used to guide data curation for model development in atmospheric research.
2.1 Molecular similarity
In our similarity-based analysis, we measure the overlap between atmospheric compounds and other sets of molecules using the two similarity metrics: t-distributed stochastic neighbor embedding (t-SNE, Maaten and Hinton, 2008), as implemented in Scikit-learn v. 1.2 (Pedregosa et al., 2011) and the Tanimoto similarity index (Tanimoto, 1958), as implemented in RDKit version 2022.09.3 (Landrum, 2022). These metrics utilize a molecular representation in the form of a binary vector (see “Molecular descriptors” section below). Both t-SNE and the Tanimoto similarity index are standard tools to measure chemical diversity (see Soleimany et al., 2021; Nakamura et al., 2022) for out-of-domain applications and uncertainty quantification (Moret et al., 2023; Hirschfeld et al., 2020; Scalia et al., 2020; Janet et al., 2019; Liu et al., 2018; Sheridan et al., 2004). The t-SNE metric is an unsupervised machine learning method that embeds high-dimensional data into lower dimensions while preserving distances from the higher-dimensional space. The low-dimensional embedding can be used to draw qualitative conclusions about data structure and similarity. The t-SNE clusters depend on a perplexity hyperparameter which in brief balances the preservation of global and local aspects during projection from high- to low-dimensional space. We tested three different perplexity values of 5, 50, and 100. We preprocess the molecular fingerprints by performing a principal component analysis and select the 50 first components. Thereafter, we run the t-SNE clustering with random initialization for a maximum of 5000 iterations.
In contrast, the Tanimoto index, SA,B, offers a quantitative measure of similarity. SA,B is calculated as the fraction of present features (represented by non-zero bits) that are shared compared to the total number of present features in molecules A and B, according to
If the two molecules A and B share all features, then the Tanimoto index equals one; if they instead share no features, then it equals zero. We note that both similarity metrics depend on the choice of molecular representation. Here, we performed the analysis with two types of molecular representations (see “Molecular descriptors” section below).
We make a statistical analysis of the Tanimoto similarities between pairs of molecules from different datasets, comparing two sets at a time. Initially, we select either the Wang dataset or the Gecko dataset as our reference dataset. Then, we compute the Tanimoto similarity for each molecule in the non-reference dataset against every molecule in the chosen reference dataset. This process yields a distribution of pairwise similarities, illustrating the degree of resemblance between molecules in the non-reference dataset and those in the reference dataset. Additionally, we calculate the self-similarity within the reference dataset by determining the Tanimoto similarity for all pairs of molecules within it. Analyzing the obtained similarity distributions allows us to assess the relationship between the datasets and understand both the inter-dataset similarities and internal similarity of the reference dataset. We interpret our results by introducing high- and low-similarity reference values. This choice is motivated by previous studies of Tanimoto similarity (Liu et al., 2018; Moret et al., 2023). A similarity of 0.1 or less is considered to indicate no significant molecular similarity (Liu et al., 2018). Moreover, a nearest neighbor similarity to the training set above 0.4 indicates enhanced prediction performance and increased machine learning model confidence (Liu et al., 2018; Moret et al., 2023).
2.2 Molecular descriptors
As mentioned above, we perform our similarity analysis with two different molecular representations as implemented in RDKit: the RDKit topological fingerprint (Landrum, 2022) and the Molecular ACCess System (MACCS) fingerprint (Accelrys, 2011). The MACCS fingerprint consists of 166 keys (RDKit's version has 167 keys as key 0 is an unused dummy key) which represent different molecular features (e.g., number of rings or atoms of a certain element, Fig. 3b). The topological fingerprint is based on enumeration of paths in the 2D molecular structure (Fig. 3c). We used default hyperparameter values for the topological fingerprint (a maximum path length of seven, two bits per hash, and a fingerprint length of 2048 bits). A wide variety of fingerprints and molecular representations have been developed in cheminformatics and more recently in chemistry, physics, and materials science (Himanen et al., 2020; Langer et al., 2022). In this paper, we limit ourselves to the topological and the MACCS fingerprints out of practicality and relevance. Both fingerprints have been used in atmospheric chemistry machine learning applications (Lumiaro et al., 2021; Besel et al., 2023, 2024) and are therefore pertinent for our comparison.
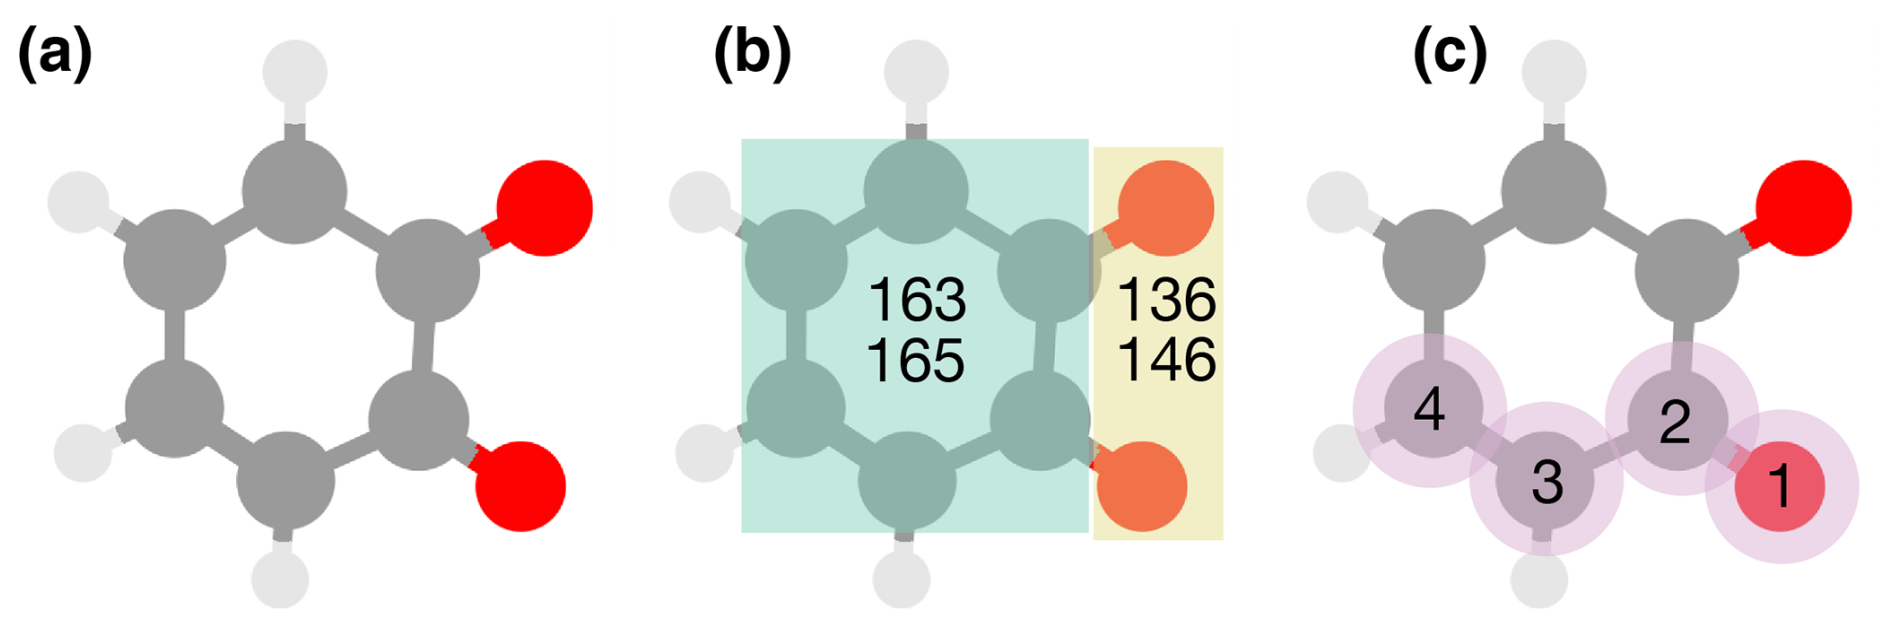
Figure 3Pictorial overview of the two molecular fingerprints used in our analysis. (a) A ball-and-stick representation of o-benzoquinone. (b) The MACCS fingerprint contains 166 keys which correspond to answers to yes-or-no questions regarding the presence of molecular features, such as whether there is a ring and if it is a 6-membered ring (keys 163 and 165), or if there is more than one oxygen or more than one double-bonded oxygen (keys 136 and 146). (c) The topological fingerprint encodes paths in the two-dimensional molecular structure. The panel shows an example path length traversing four atoms.
We performed a molecular structure analysis in RDKit, and the functional group analysis using the APRL Substructure Search Program (Ruggeri and Takahama, 2016). For the sake of clarity, we chose to not display the following categories returned by the program (Figs. 4 and 5 in the Results section) due to redundant information (“ester, all”, “carbon number”) or to a lack of correspondence to a functional group (“zeroeth group”, “C=C–C=O in non-aromatic ring”, “aromatic CH”, “alkane CH”, “C=C (non-aromatic)”, “alkene CH”, “nC-OHside-a” and “carbon number on the acid-side of an amide (asa)”).
In what follows, we describe our similarity analysis of atmospheric molecules and how they compare to other compounds found in public molecular datasets. Our initial focus is on molecular structure and composition, followed by a comparison of molecular fingerprint representations. Subsequently, we illustrate the implications of our analysis in two central applications for machine learning in atmospheric chemistry: computational property prediction and the analysis of mass spectra.
3.1 Molecular structure comparison
Figure 4 presents a selected number of molecular features for the three atmospheric datasets included in our work. In Fig. 4a, the molecular size, as measured by the number of non-hydrogen atoms, varies across datasets, averaging to approximately 10, 20, and 30 for the Wang, Gecko, and Quinone datasets, respectively. The non-hydrogen atoms are mainly oxygen and carbon atoms (see Table 1 and Fig. 4b). The high average O : C ratio of the Gecko molecules suggests that they are appreciably more oxidized than the Wang and Quinone compounds. The Wang molecules are more saturated, as indicated by their high H : C ratio. Functional group analysis reveals common oxygen-carrying groups to be hydroxyl, carbonyl, ketone, and carboxylic acid groups in all three sets (panel c). Furthermore, over half of the Gecko molecules contain hydroperoxide and nitrate groups, unlike the Wang (approx. less than a third) and Quinone (absent) compounds.
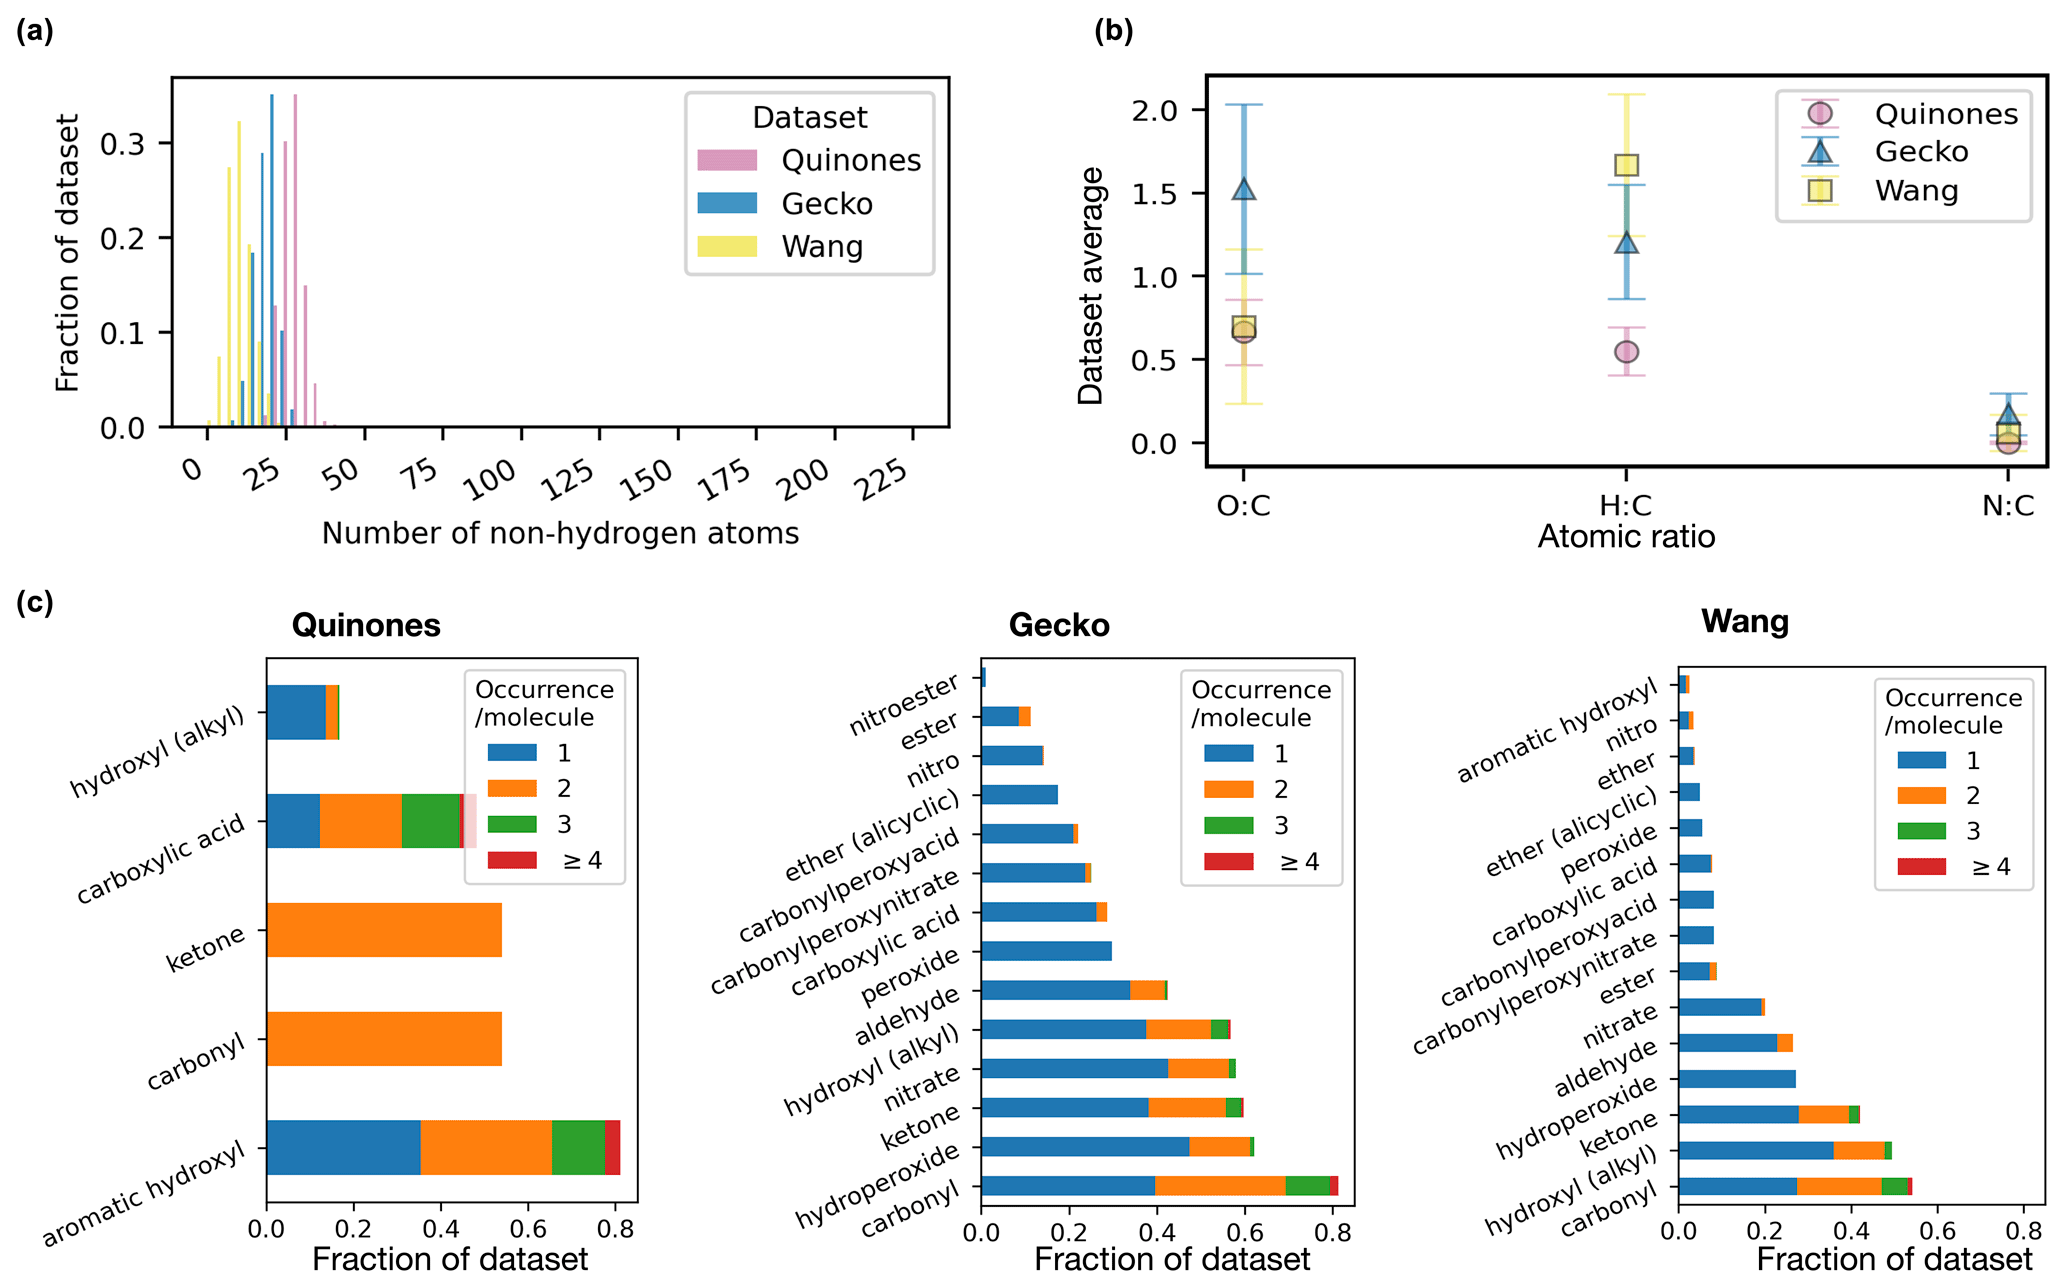
Figure 4Molecular structure analysis of the atmospheric molecules in terms of molecular size as represented by non-hydrogen atom count (a, histogram normalized so bar heights sum to one), mean and standard deviation of atomic ratios (b), and functional groups (c, present in ≥1 % of dataset).
We now turn our focus to the non-atmospheric molecules which primarily comprise metabolites and druglike compounds. Figure 5 compares QM9, nablaDFT, MassBank Europe, and MONA datasets (Table 1). The molecular size in these datasets varies over a wider range than in the atmospheric datasets. While QM9, nablaDFT, and MassBank Europe have a similar size (average 9, 21, and 22, respectively, as measured by the non-hydrogen atom number) to the atmospheric compounds, the average MONA compounds are larger (68 non-hydrogen atoms). In particular, the largest MONA molecules reach up to 230 non-hydrogen atoms. Such large compounds are not expected to be airborne, except when volatilized for mass spectrometry analysis or the like. Compared to the atmospheric molecules, these datasets are markedly less oxidized and more saturated (low O : C and high H : C, respectively, Fig. 4b). Oxygen-carrying groups such as hydroxyls, carbonyls, esters, and ethers appear in both atmospheric and non-atmospheric datasets (Fig. 4c). Functional groups such as peroxides and nitrates are less prevalent in non-atmospheric than in atmospheric compounds. Finally, amides and amines, the most common nitrogen carrying groups in the non-atmospheric compounds, are rare in our atmospheric datasets. We discuss possible causes for these outlined differences in Sect. 4.

Figure 5Molecular structure analysis of the non-atmospheric molecules in terms of molecular size as represented by non-hydrogen atom count (a, histogram normalized so bar heights sum to one), mean and standard deviation of atomic ratios (b), and functional groups (c, present in ≥1 % of dataset).
3.2 Molecular fingerprint similarity
The molecular structure comparison presented above can be used to identify similarities between atmospheric molecules and other compound classes. However, in machine learning applications, the molecules are often represented in a different way, e.g, using molecular fingerprints. Below, we make a similarity comparison using two types of fingerprints – the topological and MACCS fingerprints – to inspect molecular similarities as they would appear to a machine learning algorithm.
3.2.1 t-SNE clustering
In Fig. 6, we compare the atmospheric and non-atmospheric molecules using t-SNE. In t-SNE plots, the degree of similarity among different molecular datasets is discerned by the presence of shared clusters. Figure 6a shows t-SNE clustering using the topological fingerprint as the molecular representation. What stands out is the encompassing cluster or halo of MONA molecules, which does not overlap with molecules from the other datasets. Meanwhile, the nablaDFT dataset forms a central cluster which overlaps with MassBank Europe as well as MONA molecules – an expected result due to the presence of druglike molecules in all three datasets. On the left, a group of smaller but similar clusters appears, which also include the QM9 and MONA datasets. Barring a small subset of the Wang and Quinone compounds, these non-atmospheric datasets share no appreciable clusters with the atmospheric compounds which instead form their own, separate clusters. We see both similarities and differences among the atmospheric datasets, as the Gecko and Wang molecules cluster together, but the Quinones form their own clusters.
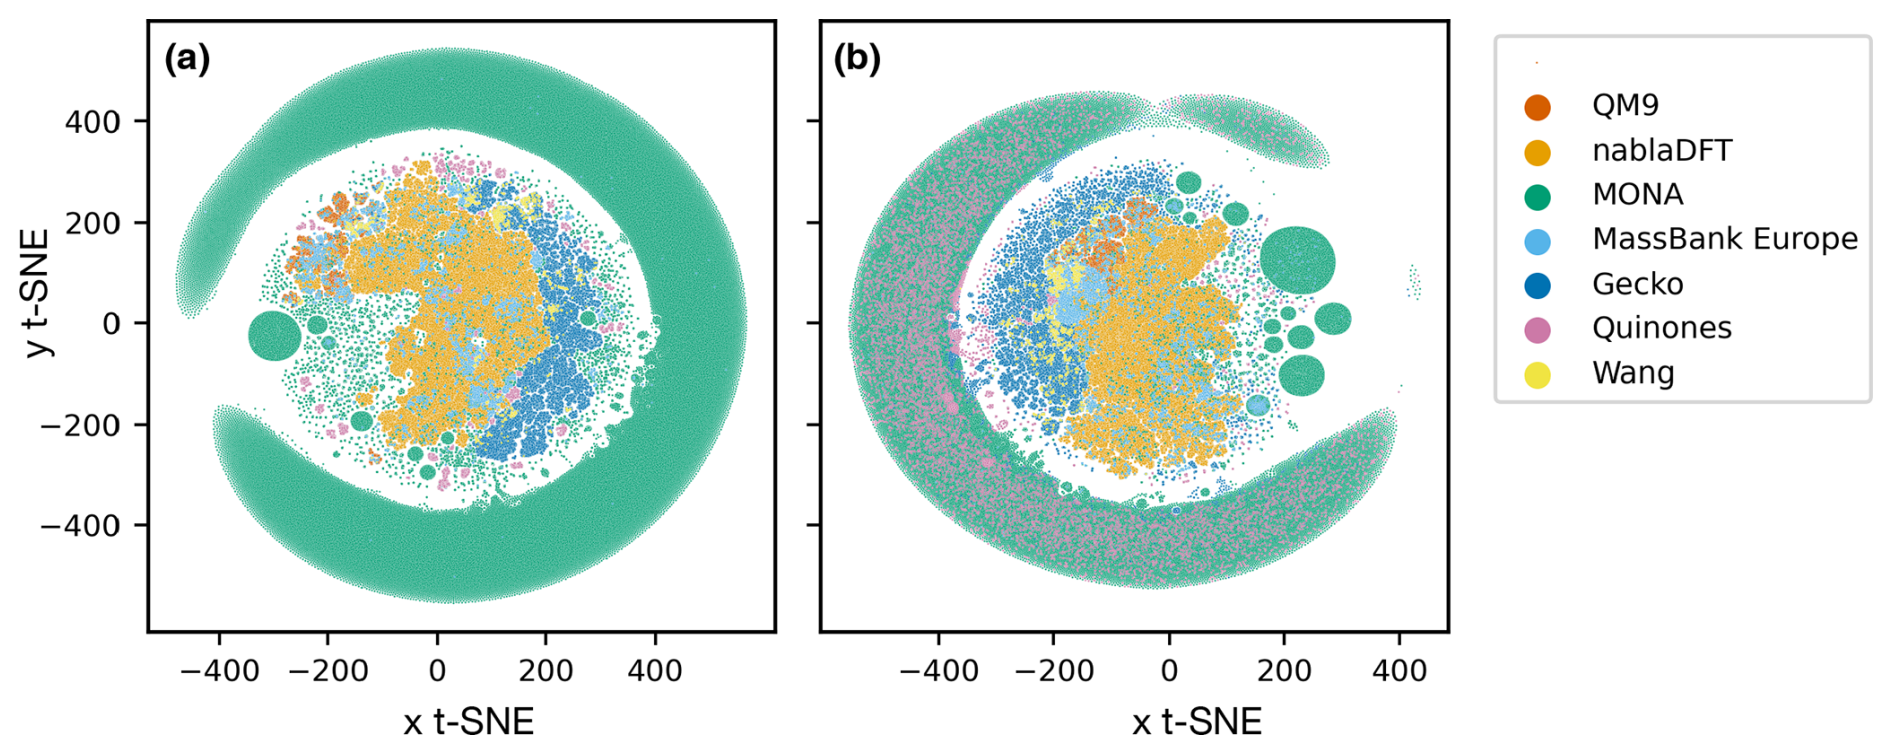
Figure 6Results of t-distributed stochastic neighbor embedding (t-SNE) analysis of different atmospheric and non-atmospheric molecular datasets using a perplexity of 50 and 5000 as the maximum number of iterations. (a) Similarity of topological fingerprints. (b) Similarity of MACCS fingerprints.
In Fig. 6b, we have clustered the molecules using the MACCS fingerprint representation. We observe a similar behavior as for the topological fingerprint. However, the outer ring of MONA molecules now also encompasses portions of the Quinones and Gecko datasets, suggesting that MONA is in part atmospheric-like when viewed through the MACCS representation. In contrast, the topological fingerprint produced more distinct clusters with little overlap between atmospheric and non-atmospheric molecules.
We tested the robustness of our t-SNE analysis with respect to different perplexity hyperparameter values (Appendix A; see Figs. A1 and A2, and refer to the Methods section for a brief explanation). For perplexities of 50 and 100, we find consistent outcomes. However, for both fingerprints, one central cluster forms at a lower perplexity of 5, encompassing molecules from all datasets. Moreover, an outer cluster emerges of mainly MONA and Gecko molecules for the topological fingerprint (see Fig. A1) and of MONA, Gecko, and Quinone molecules for the MACCS fingerprint (see Fig. A2). In summary, the qualitative t-SNE analysis separates atmospheric and non-atmospheric molecules albeit more so with the topological than the MACCS fingerprint. This finding suggests low similarity across the different chemical domains.
3.2.2 Tanimoto similarity distributions
Next, we conducted a quantitative comparison of molecular fingerprint similarity using the Tanimoto similarity index which ranges from one for perfect to zero for no similarity (see Sect. 2). We utilized either Gecko or Wang as our reference atmospheric dataset for two separate comparisons. The compounds in the reference dataset were used to compute pairwise Tanimoto similarities with molecules from other datasets. This analysis was repeated using both the topological and MACCS fingerprints. For facilitating the assessment, we use a high-similarity reference value of 0.4 and a low similarity reference value of 0.1, as detailed in Sect. 2. Figure B1 in Appendix B shows examples of molecules with similarities at these reference values.
In Fig. 7a–d, we analyzed molecular similarity based on the topological fingerprint. The figures depict normalized similarity density distributions, providing insight into the frequency of different similarity values between compounds in the compared datasets. We will utilize the locations of the similarity density distribution peaks to discuss trends.
We begin by establishing a similarity relationship among compounds in our atmospheric datasets. In Fig. 7a, the distribution peaks are all below 0.1, indicating that the Wang compounds hold, as a rule, little resemblance to other atmospheric compounds. This is also true amongst the Wang molecules themselves, suggesting that this dataset is diverse. In Fig. 7b, we observe that the Gecko dataset is of intermediate similarity (peak between 0.1 and 0.4) to the Quinones set. Moreover, the Gecko molecules have intermediate similarity to each other and are thus less diverse than in the Wang set.
Next, we compare the atmospheric and non-atmospheric dataset similarities based on the topological fingerprint in Fig. 7c and d. Overall, the Wang compounds have mostly low similarities to nablaDFT, QM9, and MassBank Europe, albeit with visible fractions of intermediate similarities. Interestingly, MONA is the only dataset with a similarity distribution peak in the region we define as intermediate when compared to the Wang dataset. Meanwhile, both MONA and nablaDFT have their similarity distribution peaks at intermediate values when compared to Gecko. On the other hand, MassBank Europe and QM9 are on the boundary between low and intermediate similarity values compared to Gecko. Notably, when compared to Gecko, the Wang compounds' similarity distribution peak is at lower values than those of the non-atmospheric datasets (though the Wang distribution is more right-skewed to intermediate values). In summary, no appreciable degree of similarities of topological fingerprints was in our high-similarity region, not when comparing atmospheric compounds to non-atmospheric molecules or among different atmospheric datasets themselves.

Figure 7The distribution of pairwise Tanimoto similarities between topological fingerprints. The Tanimoto similarity distribution between atmospheric molecules with the Wang (a) and Gecko (b) molecules. The Tanimoto similarity between the non-atmospheric molecules with the Wang (c) and Gecko (d) datasets, respectively. Vertical lines mark our high and low similarities of 0.1 and 0.4. The histograms were normalized so that the area under their respective curves integrate to 1.
An analogous comparison for the MACCS fingerprint (Fig. 8) revealed similar trends as those for the topological fingerprint. Overall, the similarity distributions are less skewed than those of the topological fingerprint. Moreover, molecules also appear more similar for the MACCS fingerprint. For instance, the Gecko self-similarities now peak in the high-similarity region (>0.4). Moreover, similarity distributions comparing the Quinone and Wang datasets with Gecko compounds peak at intermediate similarity, with visible fractions of the distributions at high similarity values. Also, the Wang compounds have appreciably higher similarities to parts of the Quinone compounds. All non-atmospheric similarity distributions peak at intermediate values when compared to both Wang and Gecko (Fig. 8c–d). In addition, MONA and MassBank Europe have a visible fraction of high-similarity to the Gecko and Wang compounds. We also note that the similarity distributions between atmospheric datasets are broader than between atmospheric and non-atmospheric compounds.

Figure 8The distribution of pairwise Tanimoto similarities between MACCS fingerprints. The Tanimoto similarity distribution between atmospheric molecules with the Wang (a) and Gecko (b) molecules. The Tanimoto similarity between the non-atmospheric molecules with the Wang (c) and Gecko (d) datasets, respectively. Vertical lines mark our high and low similarities of 0.1 and 0.4. The histograms were normalized so that the area under their respective curves integrate to 1.
In Appendix D, we investigate a subset of the Tanimoto similarities that belong to the nearest neighbors (i.e., compounds with highest similarity). Such a comparison could reveal if the large datasets have local subsets in the high-similarity region. In Fig. D1, the nearest-neighbor similarity for the topological fingerprint is shown. All atmospheric compounds have nearest neighbors in the high-similarity region within the reference datasets. In contrast, the majority of non-atmospheric datasets have nearest neighbors in the intermediate similarity region. Figure D2, which depicts the nearest-neighbor similarity for the MACCS fingerprints, reveals a similar trend: most datasets show nearest neighbors in the high-similarity region, with the exception of nablaDFT.
Figures D3 and D4 provide additional context. In Fig. D3, which considers the topological fingerprint, most Wang compounds have nearest neighbors in the high-similarity region, whereas nablaDFT and Quinones are exceptions. Nearest neighbors of Gecko compounds predominantly fall in the intermediate similarity region, with the exception of Wang compounds. For the MACCS fingerprints in Fig. D4, Wang and Gecko compounds both generally have nearest neighbors in the high-similarity region. However, nablaDFT and Quinones are notable exceptions, with Quinones being the only dataset where the majority of nearest neighbors fall below the high-similarity threshold. This result could be explained by the homogeneity of the Quinones dataset, which consists of a single compound class, limiting the structural diversity of potential nearest neighbors.
From these comparisons (Figs. D1–D4), we observe that while some Wang and Gecko compounds have high-similarity nearest neighbors in non-atmospheric datasets, the overall suitability of existing datasets for atmospheric science remains limited.
In Figs. 4 and 5, we observe a number of features in the molecular structure of atmospheric molecules which set them apart from the other compound classes in terms of functional groups, elemental composition, and size (only compared to MONA). These differences indicate what type of extrapolation a machine learning model would have to do if transferred from one domain to the other. In particular, atmospheric oxidation results in a set of organic compounds with distinct atomic ratios and functional groups that are rarely found in other domains. These compounds are primarily made up of carbon, hydrogen, oxygen, and some nitrogen atoms. They stem from volatile emissions, primarily composed of hydrogen and carbon, with nitrogen and oxygen introduced during oxidation. Autoxidation, in particular, increases the oxygen content, resulting in elevated O : C ratios in atmospheric datasets. Oxygen predominantly incorporates into functional groups such as peroxide, nitrate, hydroxyl, carbonyl, and ketones.
Our comparison of nitrogen-containing functional groups instead revealed a lack of amine and amide content in our atmospheric compound datasets compared to the other compound classes. We note that the atmosphere is known to contain numerous reduced nitrogen compounds (estimated to be at least hundreds; Ge et al., 2011). Yet, these compounds are typically presumed to quickly combine with acidic molecules or clusters to form aerosol particles in the atmosphere. Consequently, they are generally excluded from gas-phase oxidation reactions in simulation models such as MCM or Gecko-A, which explains their absence in our study. These artificial biases in the computational generation of atmospheric compounds necessitate scrutiny and awareness when curating atmospheric datasets and developing models based on such datasets depending on application area.
Furthermore, the similarity between molecular representations such as fingerprints can unveil whether compounds bear similarity to a machine learning model that utilizes such representations for molecular predictions. Here, the t-SNE and Tanimoto fingerprint similarity metrics revealed low similarities across molecular datasets and compound classes. The t-SNE analysis showed that the atmospheric compounds, besides a certain similarity to MONA and nablaDFT, are distinct as seen through the molecular descriptors (topological and MACCS fingerprint). Moreover, the Tanimoto similarity between atmospheric and non-atmospheric molecules is low and, as a rule, below our high-similarity reference value (Figs. 7 and 8). These results reinforce the conclusion that atmospheric compounds should be considered out-of-domain compounds for models which have been trained on drug- or metabolite-like compounds.
Our similarity analysis also revealed that our three atmospheric datasets, albeit sharing molecular features such as common functional groups and relative atomic ratios, contain a diverse array of compounds. Relative to the comparison of atmospheric and non-atmospheric compounds, we observed that the three atmospheric datasets had a larger fraction of compounds of intermediate similarity. However, we observed few to no high Tanimoto similarity pairs between the three atmospheric datasets for the topological fingerprint, while a larger fraction of high-similarity pairs emerged for the MACCS fingerprint. These results could be used in future work to curate a diverse set of atmospheric molecules for model training or to assess current blind spots in existing sets.
Moreover, the Tanimoto similarity analysis of compounds from the same atmospheric datasets (Gecko or Wang) revealed a difference in the degree of self-similarity which can be traced back to how these datasets were generated. In Figs. 7 and 8, we observed that Gecko molecules exhibit greater similarity to each other, while the Wang compounds are more diverse. This difference in dataset homogeneity can be attributed to the distinct generation processes of the two datasets: Wang was constructed from over 100 precursor compounds, while Gecko was constructed from only 3. Moreover, in Gecko, the much higher average O : C ratio (and lower H : C ratio) is due to inclusion of more oxidation steps during dataset generation compared to that of Wang.
The analyses conducted using the t-SNE and Tanimoto metrics reveal varying perspectives on dataset similarity. In the Tanimoto similarity analysis of the atmospheric datasets, the Gecko molecules have a greater similarity to the Quinone molecules, whereas in the t-SNE analysis the Wang molecules appear more adjacent. These disparities in perceived similarity arise from the fundamental differences in the algorithms employed by Tanimoto and t-SNE.
Tanimoto analysis only compares molecular features that are present (represented by ones in the fingerprint) in either molecule, while t-SNE considers both the absence and presence of features (both ones and zeroes) when determining adjacency or similarity in high-dimensional space. Consequently, t-SNE may group molecules based on a common lack of features which the Tanimoto analysis does not. The absence of shared features does not necessarily imply true similarity unless the molecular descriptor captures all molecular structure features, highlighting a limitation of t-SNE for similarity analysis with molecular fingerprints. This distinction in methodology can elucidate why the Gecko and Quinone datasets appear relatively more similar in the Tanimoto analysis compared to the t-SNE analysis or why the similarity between the Wang and Gecko datasets is relatively high in t-SNE but lower in Tanimoto analysis.
Finally, our comparisons in Figs. 7 and 8 highlight the varying degree of atmospheric dataset similarity depending on the molecular descriptor utilized for representing their structures. As alluded to above, a comprehensive molecular similarity measure should be based on an encoding of the entire molecular structure into the descriptor. In this study, we assessed similarity using both topological and MACCS molecular fingerprints. The generally low levels of similarity observed across atmospheric datasets could suggest a potential to develop molecular fingerprints tailored to atmospheric compounds to better capture their unique molecular structure features. Such explorations could be the topic of future work.
Atmospheric compounds constitute a vast and diverse chemical space. Their unique characteristics, coupled with the sheer number of atmospheric compounds, make collecting experimental or high-accuracy computational data both time-consuming and challenging. Thus, one major challenge to advancing data-driven methods in atmospheric chemistry is the current absence of curated datasets. Therefore, this paper investigated how similar atmospheric molecules are compared to large and openly available datasets that have been utilized in machine learning. The current challenges and data gaps elucidated by our similarity analysis and discussion above can be addressed in future work in a number of ways.
One primary application of our similarity analysis is to serve as a foundation for dataset assembly and to fill data gaps for atmospheric chemistry research. This endeavor will be based on identifying relatively similar datasets from other chemical domains. Once identified, such molecular datasets can be used to mend data gaps and to improve machine learning development in atmospheric research. However, since compounds' similarity is dependent on molecular representation and application area, data augmentation needs to be judged on a case-by-case basis. As more atmospheric research data, whether computational or experimental, become available, these models can be further refined. Below, we list additional considerations when supplementing atmospheric datasets with larger curated ones from different chemical domains.
Currently, the limited number of atmospheric datasets lack comprehensive coverage of multiple relevant molecular target properties. For example, a dataset may include vapor pressures but not electronic properties or mass spectra. This incomplete coverage leads to data gaps, even when combining multiple datasets, as seen in our investigations.
As already mentioned, to address these cases of missing properties, incorporating existing datasets or models from other disciplines is an alternative to gain larger datasets and potentially improve model training. However, in addition to structural dissimilarity issues, such data augmentation can be challenging due to potential mismatches in target property coverage. For instance, atmospheric particle formation involves compounds with low volatility, which can be characterized by properties such as extremely low vapor pressures. These properties often deviate from typical chemistry contexts. In Fig. 9, we have compared vapor pressure distributions between oxidized atmospheric compounds from a subset of the Gecko dataset and tabulated values from the Handbook of Chemistry and Physics. This comparison illustrates the underrepresentation of low-pressure target values in generic reference datasets.
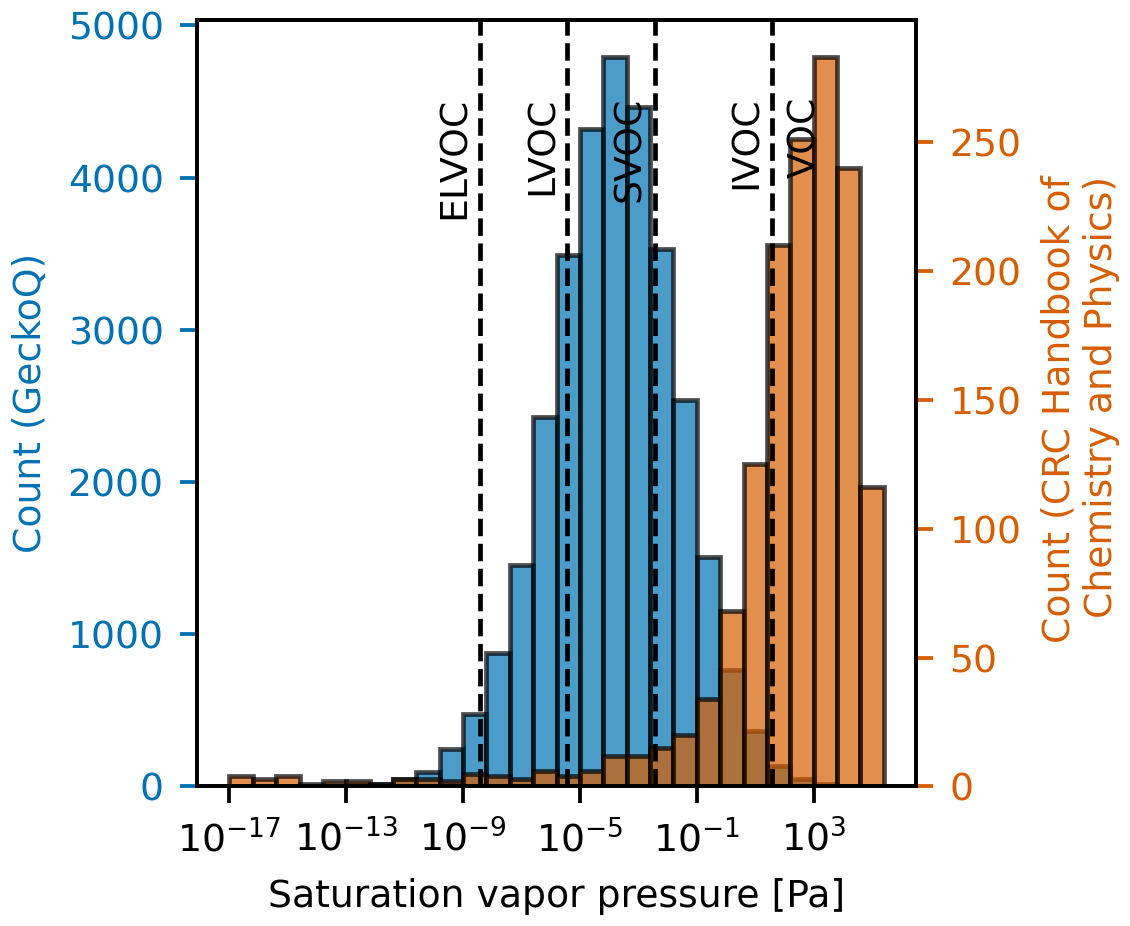
Figure 9Computationally predicted saturation vapor pressure of atmospheric compounds in a subset of the Gecko dataset studied here called GeckoQ (Besel et al., 2023), at 298 K (blue), and vapor pressures listed in the CRC Handbook of Chemistry and Physics (Rumble, 2023) in a table entitled “Vapor Pressure for Inorganic and Organic Substances at Various Temperatures”, computed at 298 K using the Clausius–Clapeyron equation. The volatility regions are assigned according to those defined by Donahue et al. (2012): ELVOC (extremely low volatility organic compound), LVOC (low volatility organic compound), SVOC (semivolatile organic compound), IVOC (intermediate volatility organic compound), and VOC (volatile organic compound). We assumed the ideal gas law and a molecular weight of an average molecule in organic aerosols (200 g mol−1; Donahue et al., 2011).
Moreover, not only assessing the overlap of target values, but also carefully examining the target data type is crucial. Each property must be evaluated in the context of its relevance to atmospheric chemistry and its potential impact on the overall dataset integration process. Such considerations become particularly relevant in mass spectrometry applications. In this study, we compared atmospheric compounds to those found in large mass spectrometric data banks. This choice was based on the central role of mass spectrometry in atmospheric chemistry for studying molecular-level processes (Nozière et al., 2015).
In this study, we have found certain overlaps in terms of molecular fingerprint similarity between atmospheric compounds and molecules in the MassBank datasets (MONA in particular). However, the fragmentation mass spectrometric techniques commonly employed when generating MassBank data diverge from the prevailing methods utilized in field campaigns, which predominantly rely on chemical ionization (Nozière et al., 2015; Sandström et al., 2024). Thus, future development of machine learning tools could be directed towards analysis of the mass spectra primarily collected in atmospheric field studies.
A second application of our similarity analysis is for curating new atmospheric molecular datasets. The persistent challenges to collecting experimental data for atmospheric molecules suggest that this function primarily fits as a tool for computational studies. Here, the similarity analysis could be used to characterize atmospheric compounds into different types based on their location in chemical space (as defined either by the molecular features or fingerprint, or both). As mentioned in Sect. 4, such characterization can be used to create tailored datasets for analysis or to construct data-driven analysis tools based on either diverse or niche groups of compounds.
Finally, our study underscores that focus should be given to initiatives aimed at sharing atmospheric molecular data in openly accessible repositories. Examples of such initiatives have recently been developed, such as the Clusteromics I–V and Clusterome datasets (Elm, 2021a, b, 2022; Knattrup and Elm, 2022; Knattrup et al., 2023; Ayoubi et al., 2023), the Aerosolomics project (Thoma et al., 2022), and repositories at University of California, Berkeley (Goldstein, 2024). Still, improving unambiguous identification of atmospheric compounds requires collection of more relevant reference data. Given the diverse techniques and instruments employed in atmospheric science, standardizing data will likely remain challenging. Thus, effective data sharing should include information on data quality and comprehensive metadata, including instrument versions. This information could be considered during development of general predictive models, by, for example, mitigating the impact of instrument versions on data collection and quality.
In this study, we compared atmospheric molecules to compounds commonly used to train machine learning models for molecular applications. Assessing molecular structure similarity provides a straightforward means to determine whether atmospheric compounds fall within the scope of existing machine learning methods. This assessment aids in directing the development of machine learning techniques within this relatively unexplored chemical domain. Here, we focused on comparing molecules with two molecular descriptors – the MACCS and topological fingerprints. Analysis of both representations revealed low similarity between progressively oxygenated atmospheric reaction products and non-atmospheric molecules made up of primarily metabolites and druglike compounds. Notably, the MONA mass spectral library exhibited the highest similarity to atmospheric compounds. Yet, upon scrutiny of molecular size, atomic ratios, and common functional groups, we observed disparities between MONA molecules (and other non-atmospheric datasets) and atmospheric compounds. These discrepancies highlight the need for careful testing and validation before using models trained on MassBank-like datasets in atmospheric chemistry. The differences we observe between chemical domains and between the atmospheric datasets can be used to guide future dataset curation for atmospheric molecular research. Such datasets have laid the foundation for data-driven method development in other chemical domains. Thus, we hope this study will motivate the broader atmospheric chemistry community to establish and contribute to infrastructure for public data sharing. Closing the current data gap regarding atmospheric compounds will expedite the shift towards a data-driven era in molecular atmospheric research. This advancement will facilitate the development of high-accuracy and high-throughput analysis tools, offering essential insights into the molecular-level atmospheric processes that influence both climate and air quality.

Figure A1The t-SNE analysis of the datasets' topological fingerprints at perplexity values of 5 (a), 50 (b), and 100 (c).
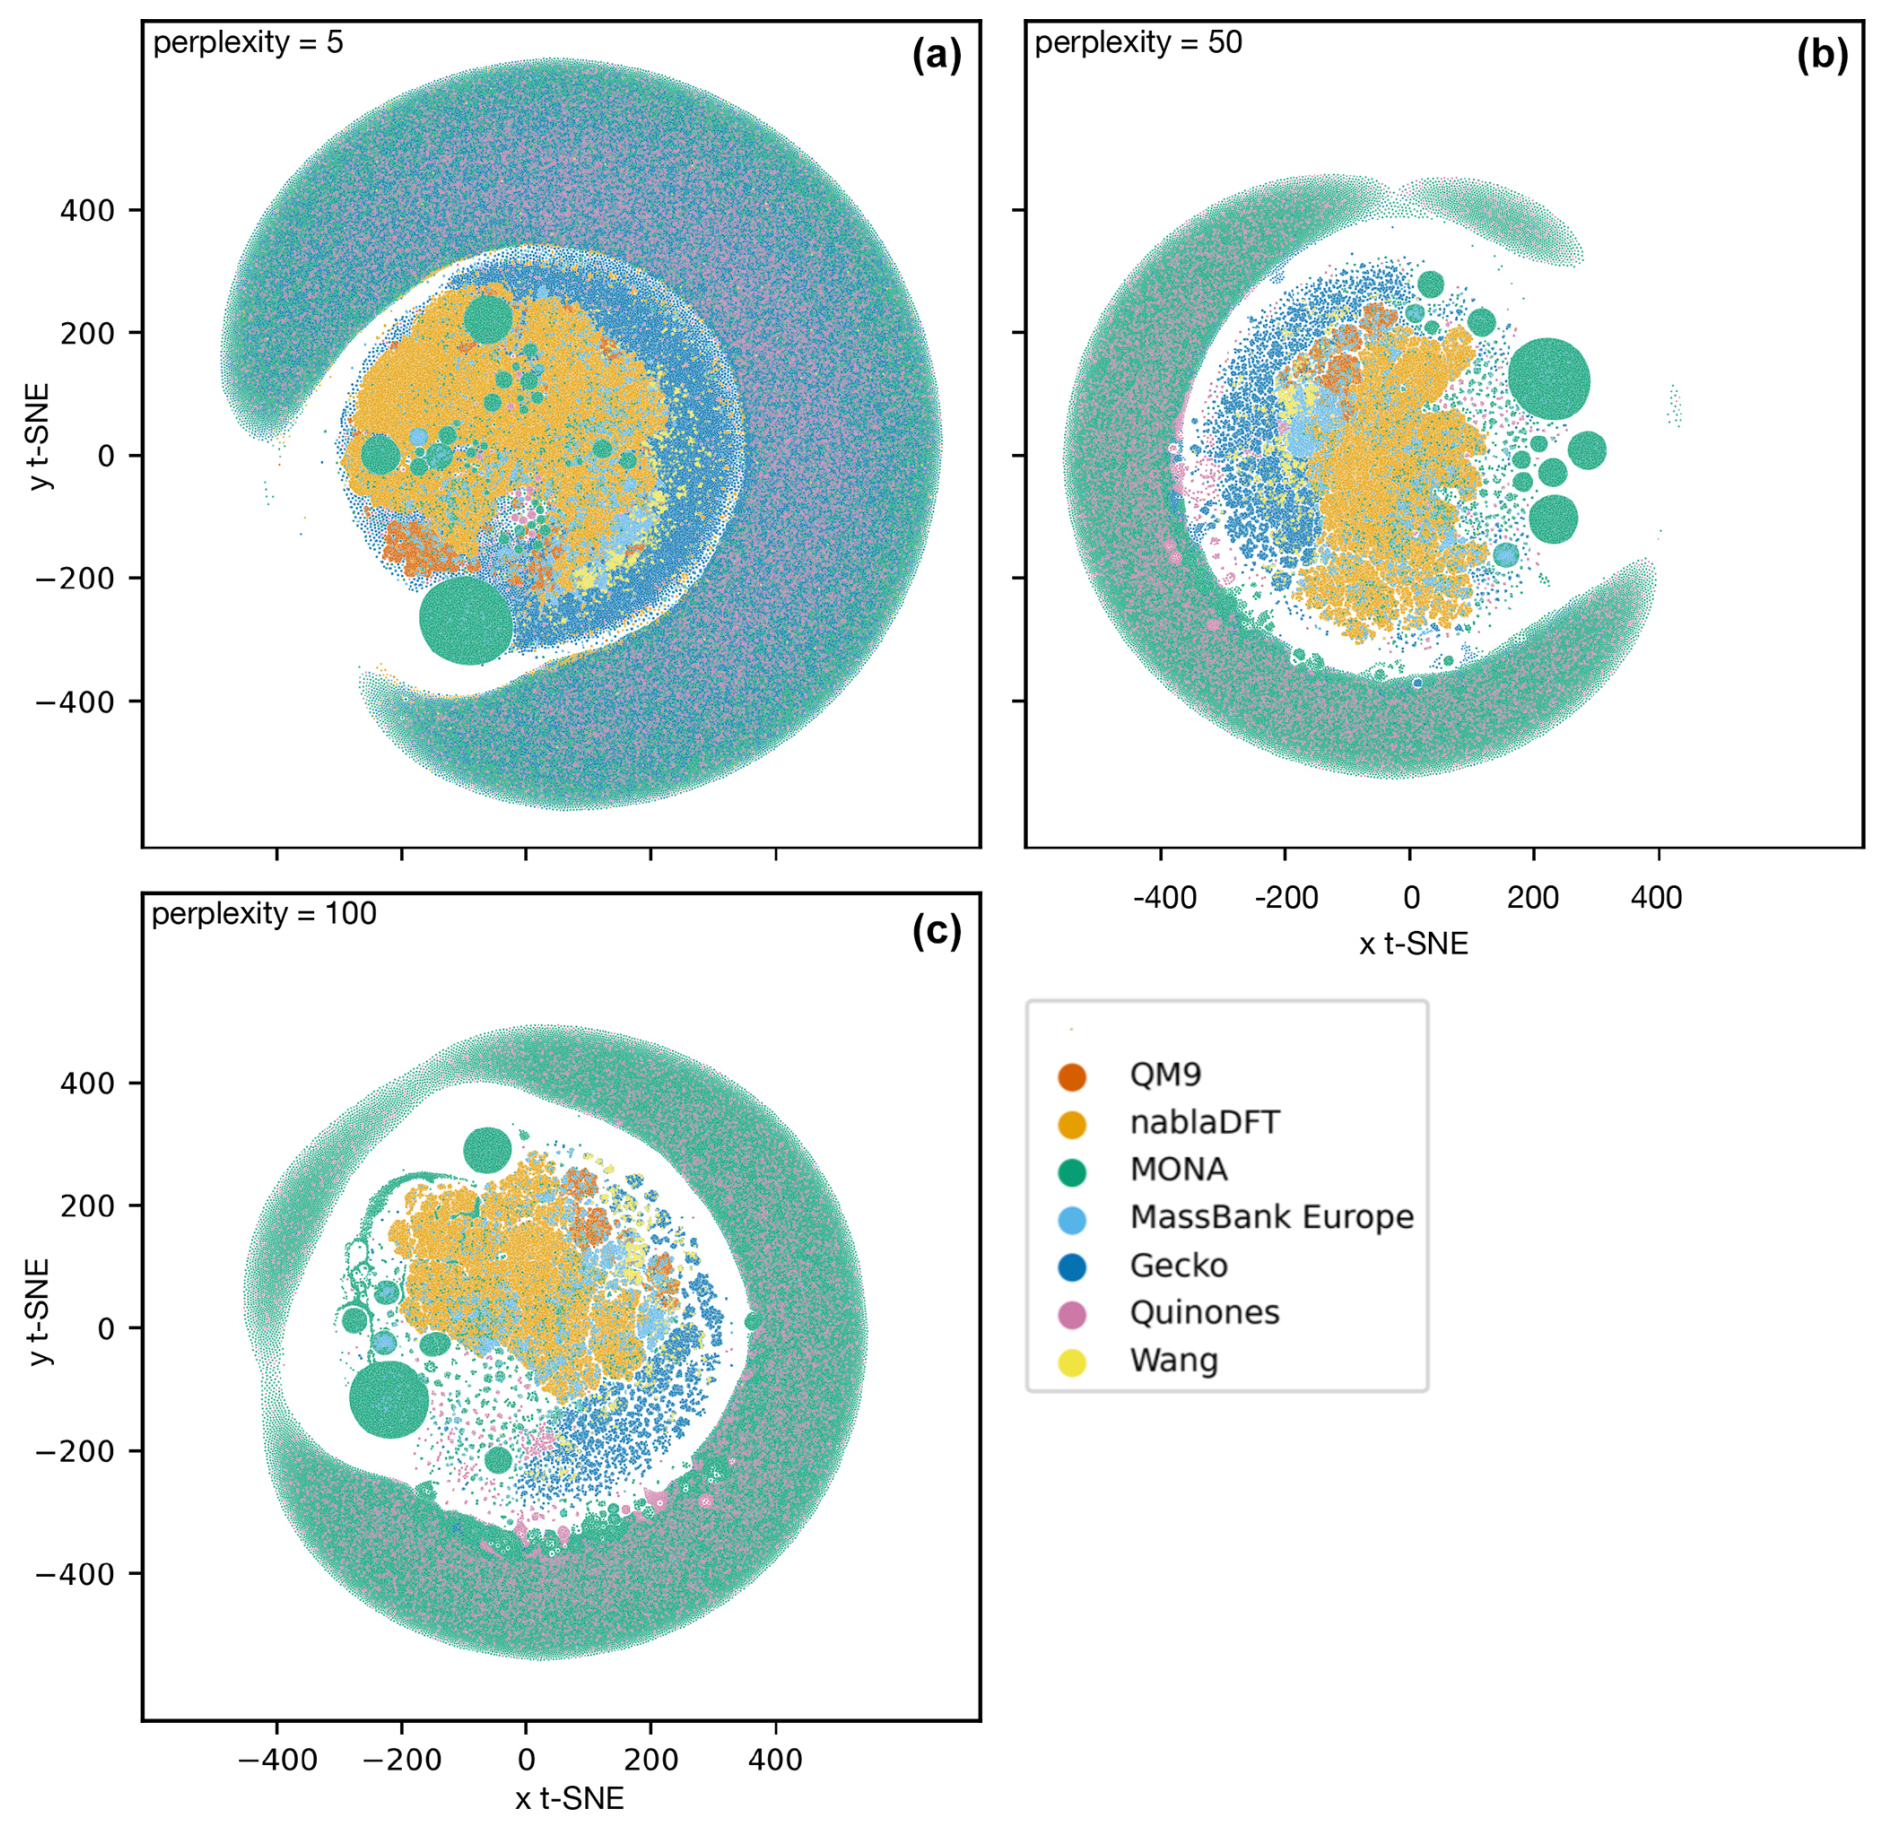
Figure A2The t-SNE analysis of the datasets' MACCS fingerprints at perplexity values 5 (a), 50 (b), and 100 (c).
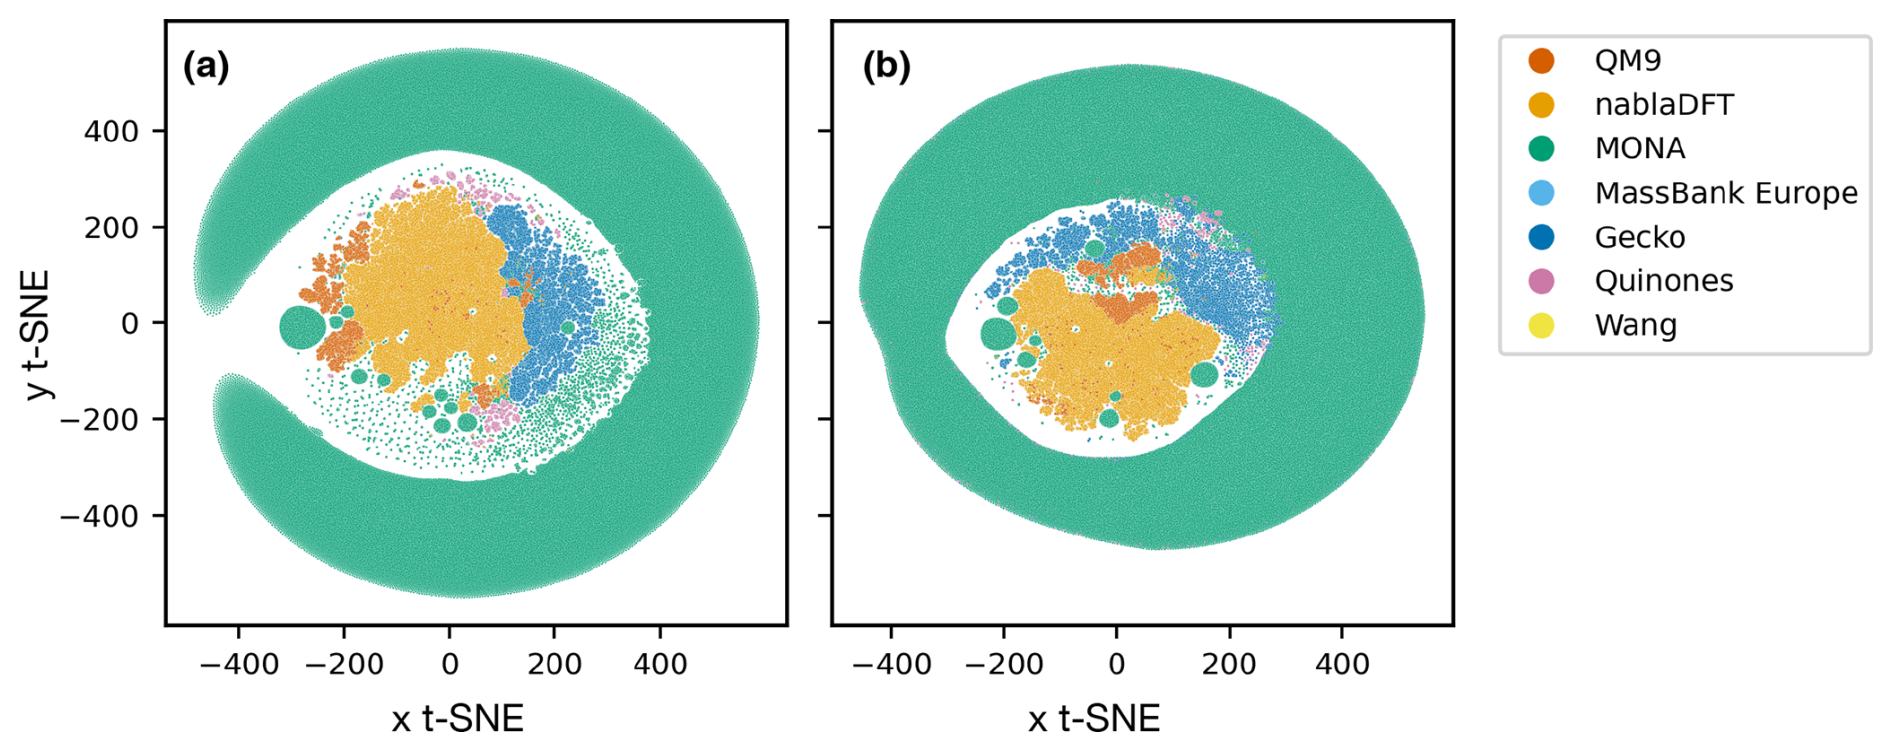
Figure A3The t-SNE analysis of the datasets read in reverse order with respect to Fig. 6 in the main text. (a) Topological fingerprint clusters and (b) MACCS fingerprint clusters.
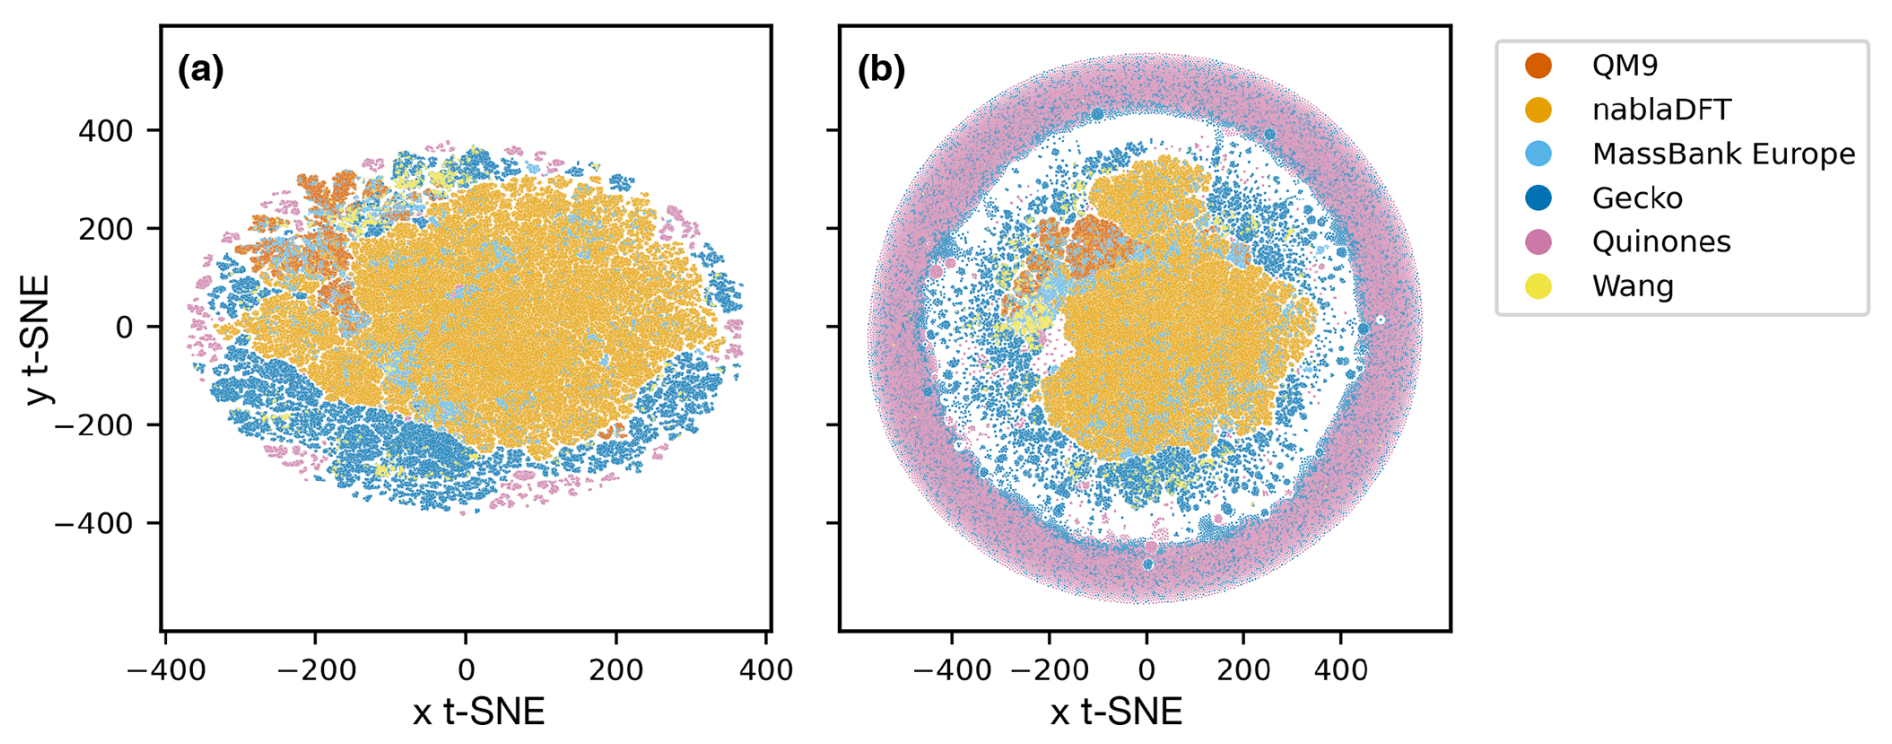
Figure A4The t-SNE analysis of the datasets without MONA with perplexity of 50. (a) Topological fingerprint clusters and (b) MACCS fingerprint clusters.
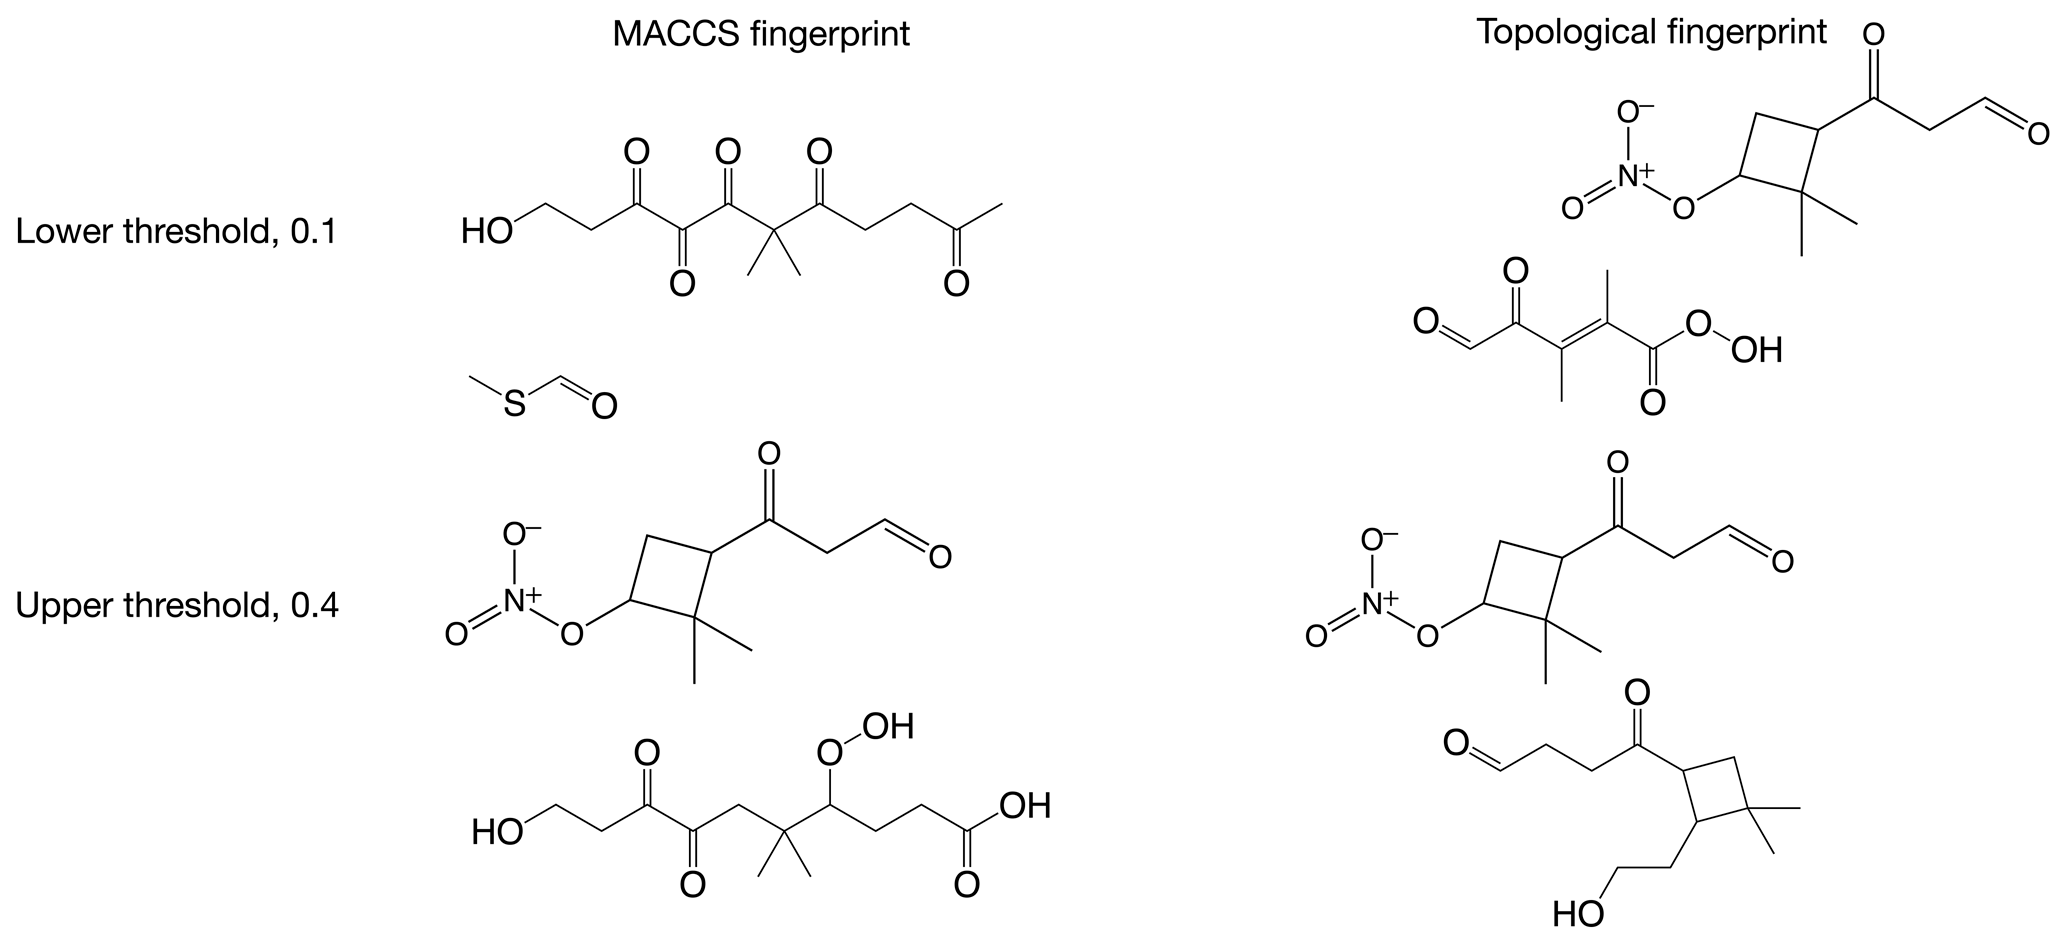
Figure B1Examples of molecules with similarities close to the lower (0.1) and upper (0.4) similarity thresholds applied in this paper when discussing high and low similarity.
Table C1The number similarity values in low, high, or intermediate similarity regions when datasets are compared with the MACCS fingerprints and to the Wang dataset.
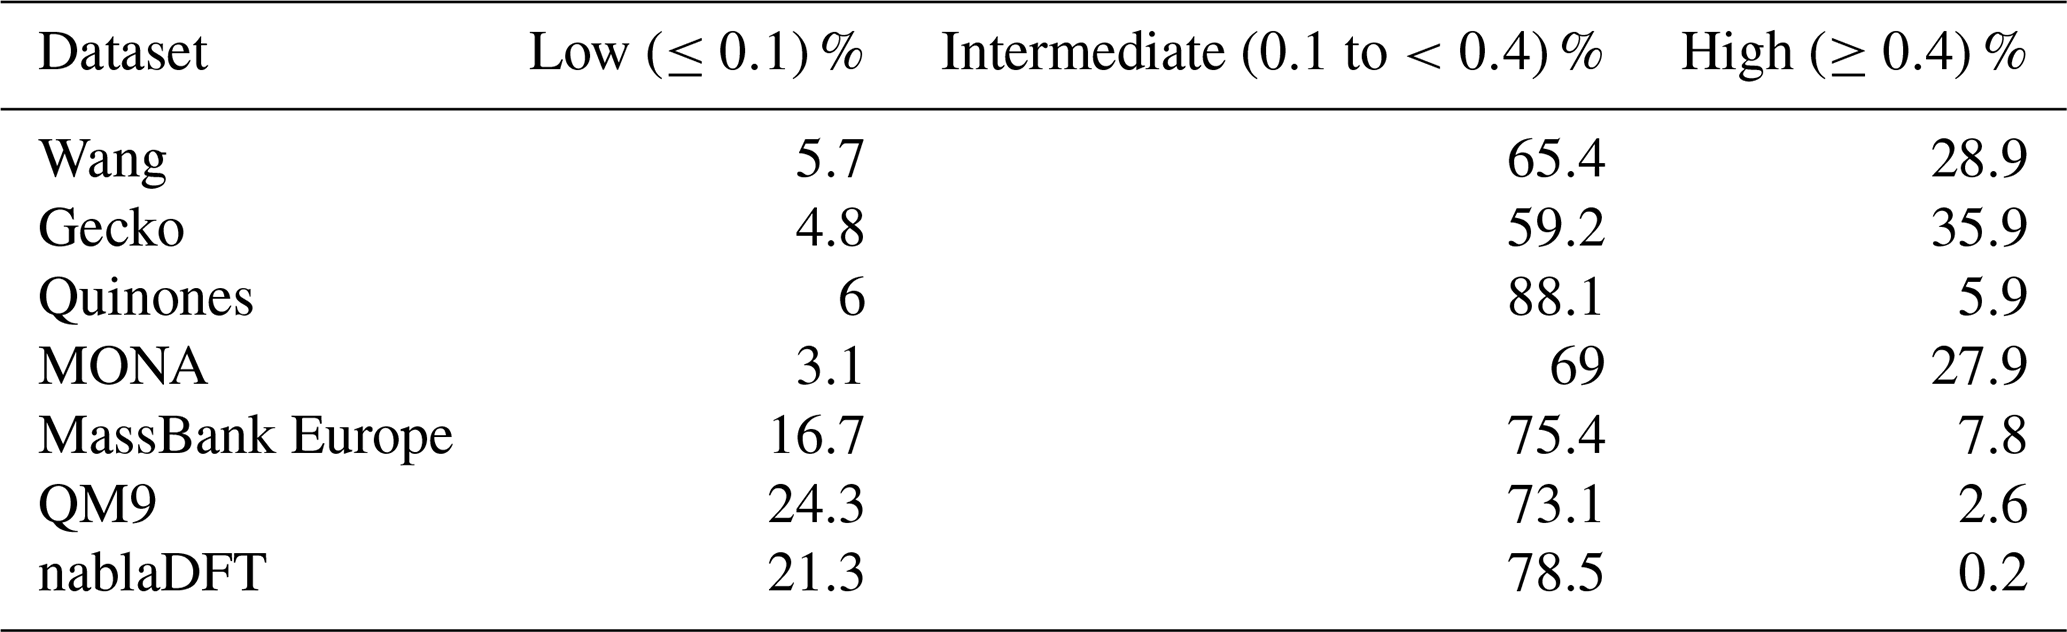
Table C2The number similarity values in low, high, or intermediate similarity regions when datasets are compared with the MACCS fingerprints and to the Gecko dataset.
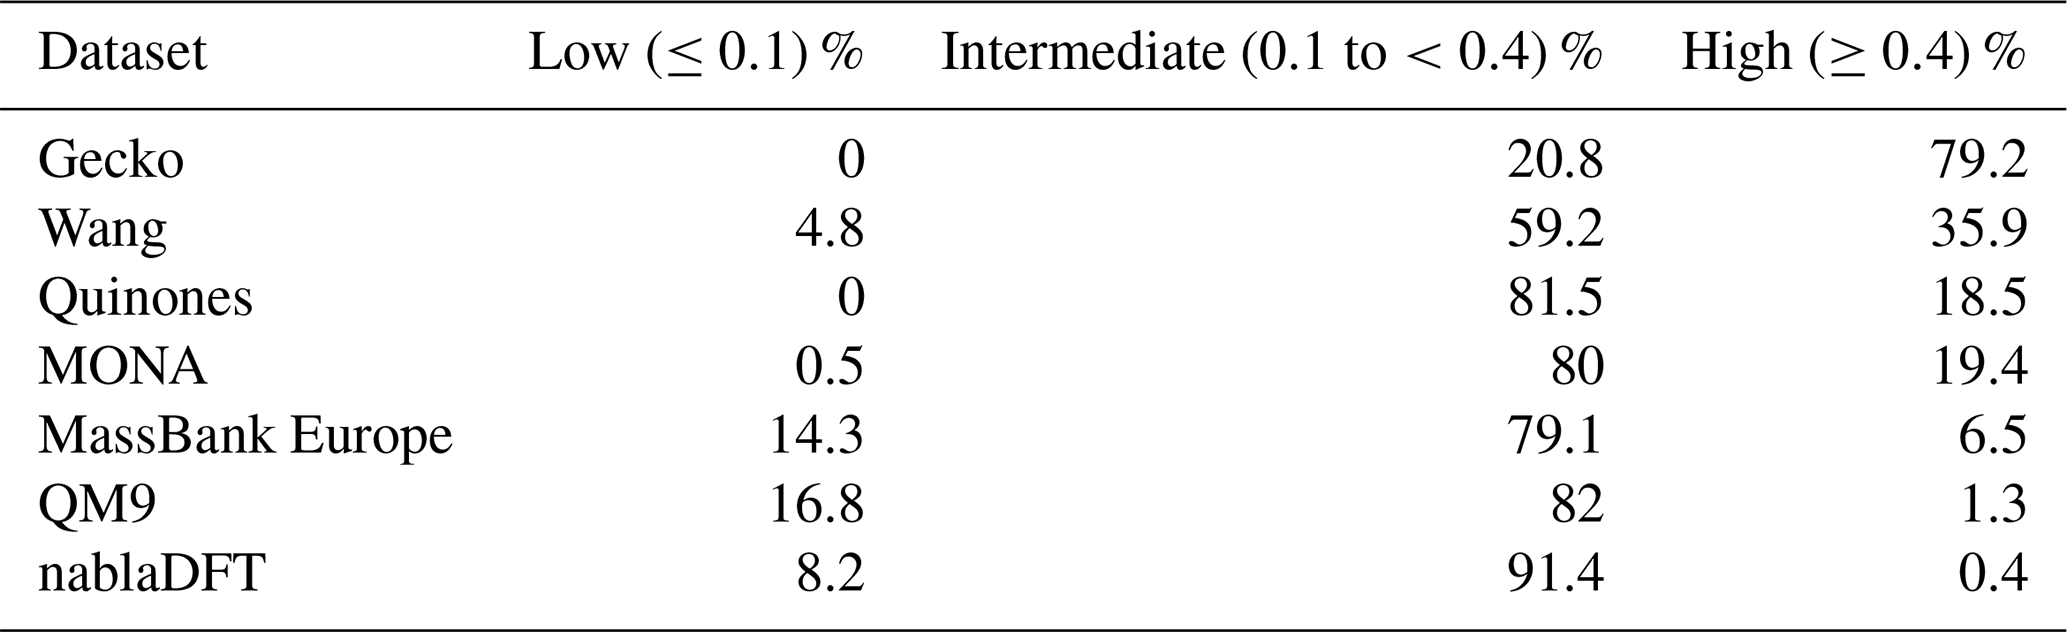
Table C3The number similarity values in low, high, or intermediate similarity regions when datasets are compared with the topological fingerprints and to the Wang dataset.
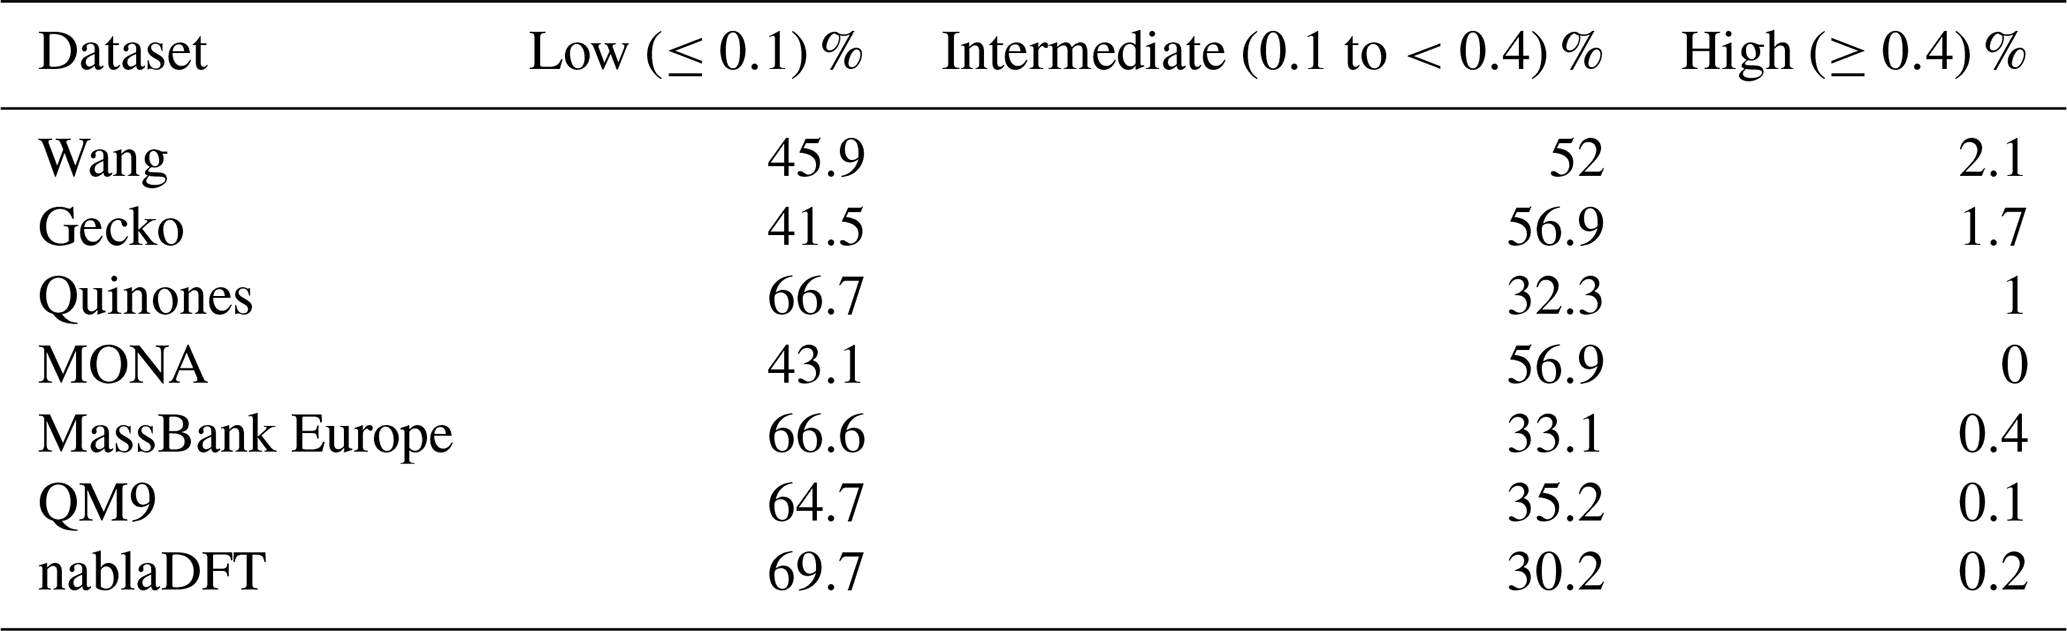
Table C4The number similarity values in low, high, or intermediate similarity regions when datasets are compared with the topological fingerprints and to the Gecko dataset.
D1 Maximum similarity for each non-reference compound
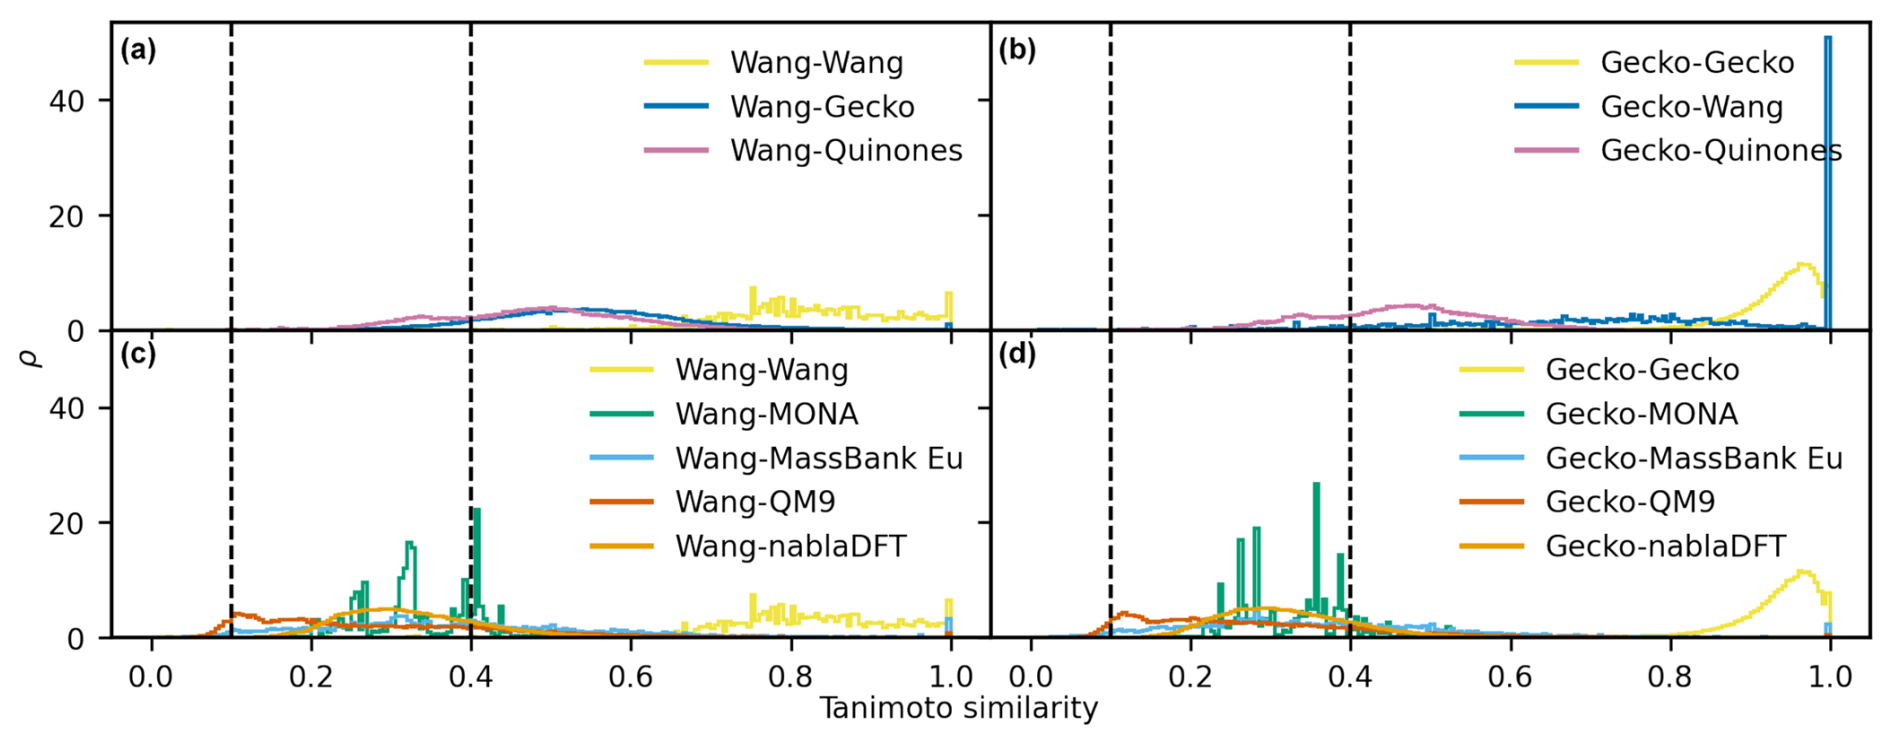
Figure D1The distributions of maximum Tanimoto similarity are shown for non-reference compounds in different comparisons based on topological fingerprints. Panels (a) and (b) depict the distributions of maximum Tanimoto similarity between atmospheric molecules and Wang molecules (a) and Gecko molecules (b), respectively. Panels (c) and (d) present the distributions for comparisons between non-atmospheric molecules and Wang molecules (c) and Gecko molecules (d). Vertical lines at similarity values of 0.1 and 0.4 indicate reference values for low and high similarity, respectively. The histograms have been normalized such that the area under each curve equals 1.
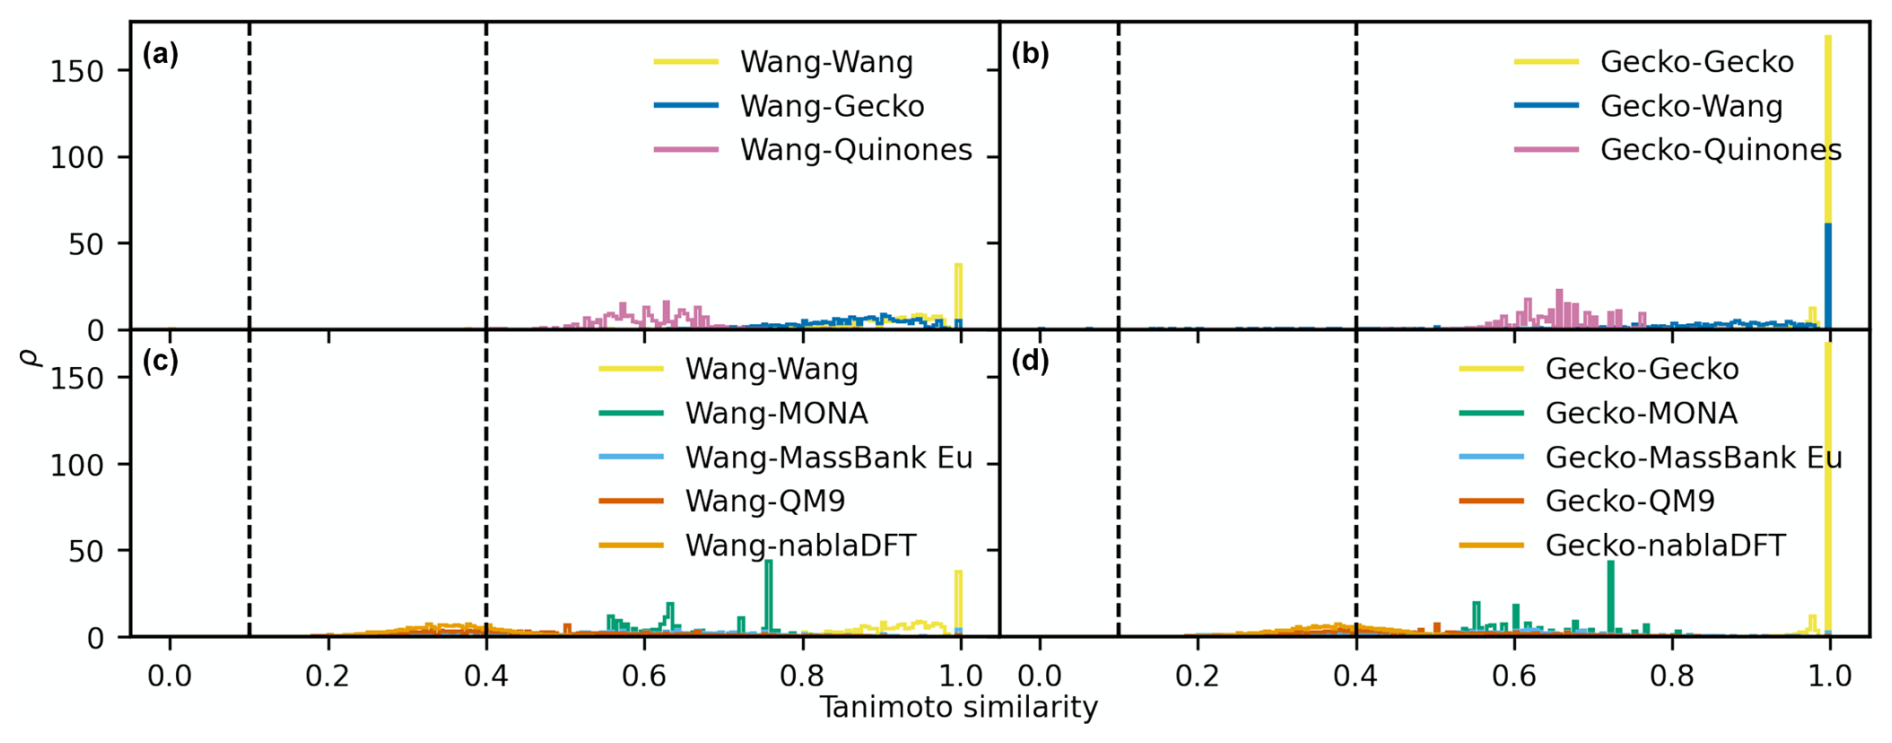
Figure D2The distributions of maximum Tanimoto similarity are shown for non-reference compounds in different comparisons based on MACCS fingerprints. Panels (a) and (b) depict the distributions of maximum Tanimoto similarity between atmospheric molecules and Wang molecules (a) and Gecko molecules (b), respectively. Panels (c) and (d) present the distributions for comparisons between non-atmospheric molecules and Wang molecules (c) and Gecko molecules (d). Vertical lines at similarity values of 0.1 and 0.4 indicate reference values for low and high similarity, respectively. The histograms have been normalized such that the area under each curve equals 1.
D2 Maximum similarity for each reference compound
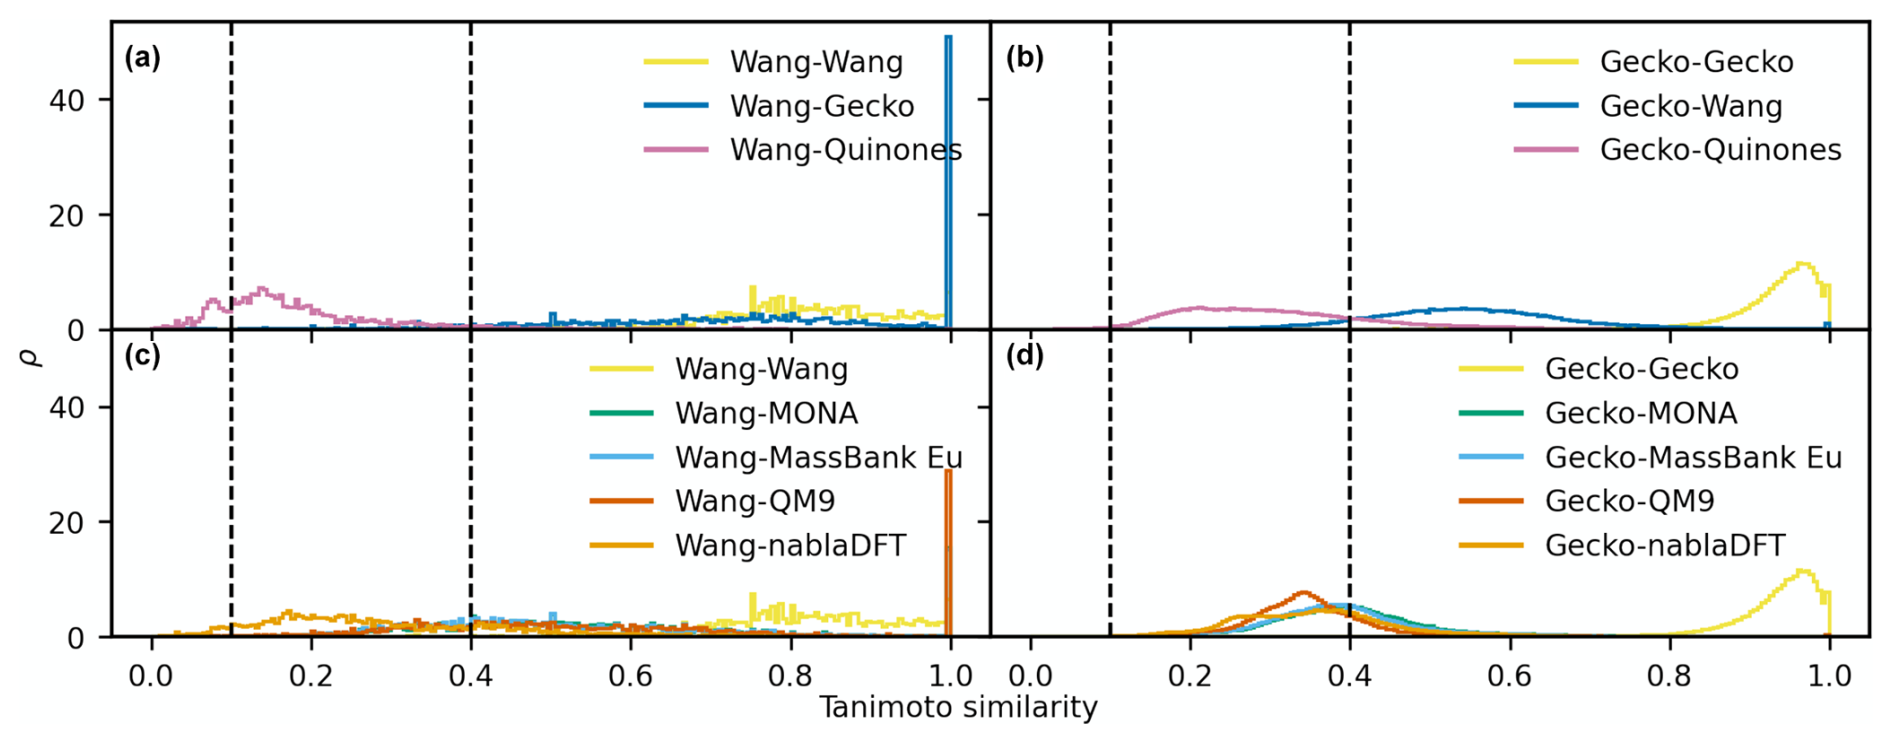
Figure D3The distributions of maximum Tanimoto similarity are shown for reference compounds in different comparisons based on topological fingerprints. Panels (a) and (b) depict the distributions of maximum Tanimoto similarity between Wang molecules (a) and Gecko molecules (b) and atmospheric molecules, respectively. Panels (c) and (d) present the distributions for comparisons between Wang molecules (c) and Gecko molecules (d) and non-atmospheric molecules. Vertical lines at similarity values of 0.1 and 0.4 indicate reference values for low and high similarity, respectively. The histograms have been normalized such that the area under each curve equals 1.
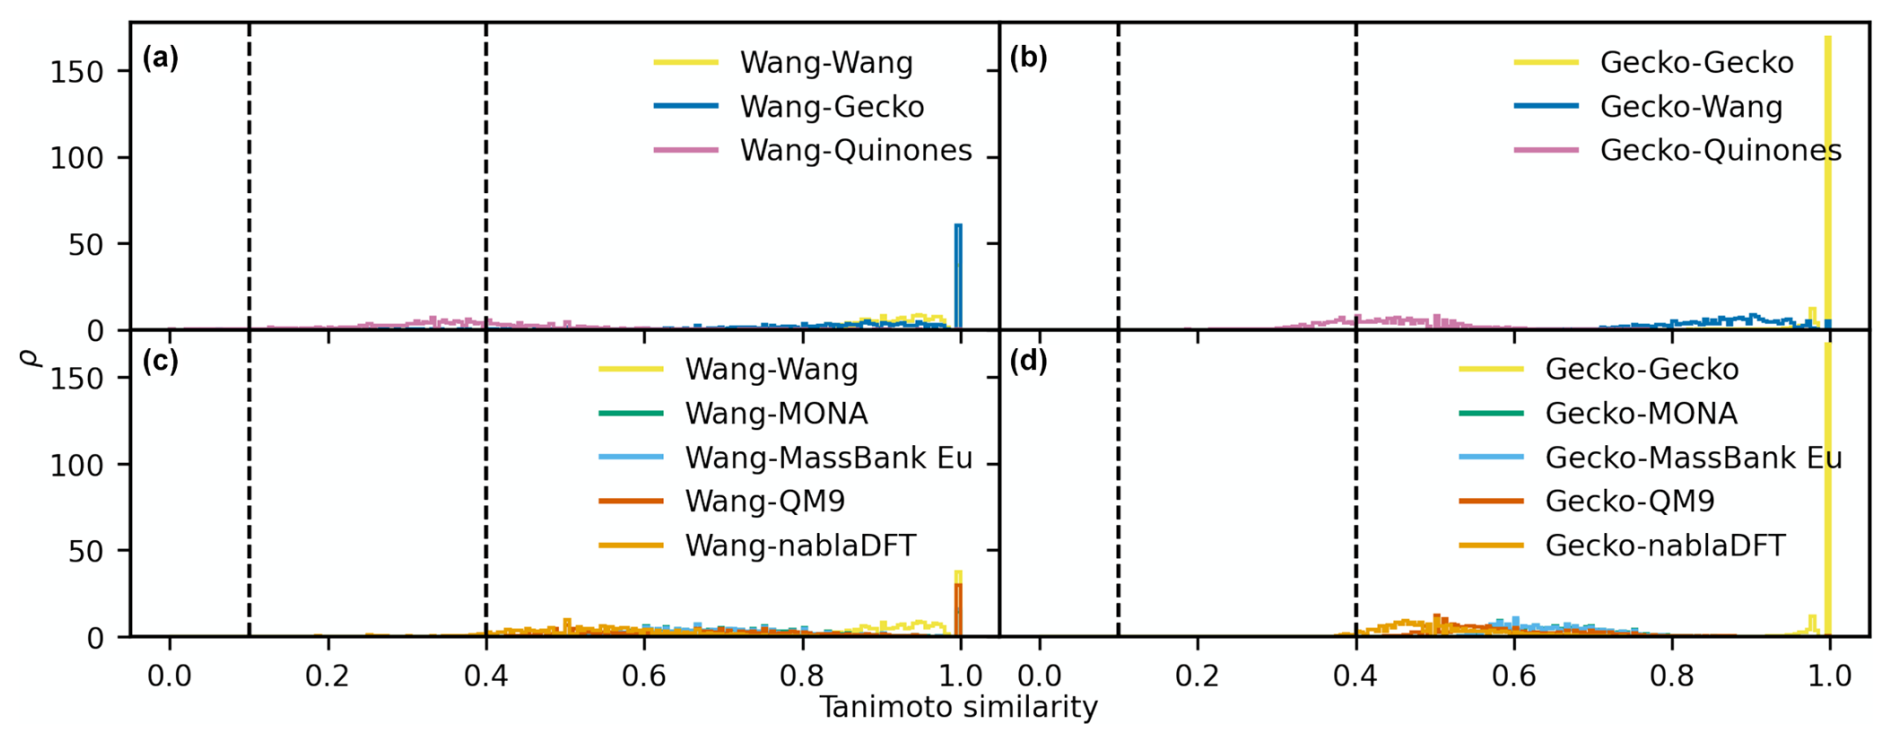
Figure D4The distributions of maximum Tanimoto similarity are shown for reference compounds in different comparisons based on MACCS fingerprints. Panels (a) and (b) depict the distributions of maximum Tanimoto similarity between Wang molecules (a) and Gecko molecules (b) and atmospheric molecules, respectively. Panels (c) and (d) present the distributions for comparisons between Wang molecules (c) and Gecko molecules (d) and non-atmospheric molecules. Vertical lines at similarity values of 0.1 and 0.4 indicate reference values for low and high similarity, respectively. The histograms have been normalized such that the area under each curve equals 1.
The current version of model is available from the project website: https://github.com/hilsan/atmospheric_compound_similarity_analysis hilsan, 2025 under the GNU General Public License v3.0. The exact version of the model used to produce the results used in this paper is archived on Zenodo (https://doi.org/10.5281/zenodo.14671496, Sandström, 2025), as are the input data and scripts to run the model and produce the plots for all the simulations presented in this paper (https://doi.org/10.5281/zenodo.14671496, Sandström, 2025). The datasets used in this study are sourced from publicly available repositories (original dataset sources are provided in Table 1), each under a specific license. Detailed licensing information is provided in the Zenodo repository accompanying this paper.
HS – conceptualization, investigation, data curation, formal analysis, visualization, validation, writing (original draft). PR – conceptualization, writing (original draft), supervision, funding acquisition.
The contact author has declared that neither of the authors has any competing interests.
Publisher's note: Copernicus Publications remains neutral with regard to jurisdictional claims made in the text, published maps, institutional affiliations, or any other geographical representation in this paper. While Copernicus Publications makes every effort to include appropriate place names, the final responsibility lies with the authors.
The authors wish to acknowledge Theo Kurtén and Matti Rissanen for insightful discussions. We further acknowledge CSC-IT Center for Science, Finland, and the Aalto Science-IT project.
This research has been supported by the Research Council of Finland (grant no. 346377) and the European Cooperation in Science and Technology (grant nos. CA18234 and CA22154).
This paper was edited by Sergey Gromov and reviewed by Jonas Elm and two anonymous referees.
Accelrys: The Keys to Understanding MDL Keyset Technology [White paper], Tech. rep., Accelrys, 2011. a
Aumont, B., Szopa, S., and Madronich, S.: Modelling the evolution of organic carbon during its gas-phase tropospheric oxidation: development of an explicit model based on a self generating approach, Atmos. Chem. Phys., 5, 2497–2517, https://doi.org/10.5194/acp-5-2497-2005, 2005. a, b
Ayoubi, D., Knattrup, Y., and Elm, J.: Clusteromics V: Organic Enhanced Atmospheric Cluster Formation, ACS Omega, 8, 9621–9629, https://doi.org/10.1021/acsomega.3c00251, 2023. a
Berkemeier, T., Krüger, M., Feinberg, A., Müller, M., Pöschl, U., and Krieger, U. K.: Accelerating models for multiphase chemical kinetics through machine learning with polynomial chaos expansion and neural networks, Geosci. Model Dev., 16, 2037–2054, https://doi.org/10.5194/gmd-16-2037-2023, 2023. a
Besel, V., Todorović, M., Kurtén, T., Rinke, P., and Vehkamäki, H.: Atomic structures, conformers and thermodynamic properties of 32k atmospheric molecules, Sci. Data, 10, 450, https://doi.org/10.1038/s41597-023-02366-x, 2023. a, b, c, d, e
Besel, V., Todorović, M., Kurtén, T., Vehkamäki, H., and Rinke, P.: The search for sparse data in molecular datasets: Application of active learning to identify extremely low volatile organic compounds, J. Aerosol Sci., 179, 106375, https://doi.org/10.1016/J.JAEROSCI.2024.106375, 2024. a, b, c
Bianchi, F., Kurtén, T., Riva, M., Mohr, C., Rissanen, M. P., Roldin, P., Berndt, T., Crounse, J. D., Wennberg, P. O., Mentel, T. F., Wildt, J., Junninen, H., Jokinen, T., Kulmala, M., Worsnop, D. R., Thornton, J. A., Donahue, N., Kjaergaard, H. G., and Ehn, M.: Highly Oxygenated Organic Molecules (HOM) from Gas-Phase Autoxidation Involving Peroxy Radicals: A Key Contributor to Atmospheric Aerosol, Chem. Rev., 119, 3472–3509, https://doi.org/10.1021/acs.chemrev.8b00395, 2019. a, b
Brouard, C., Shen, H., Dührkop, K., D'Alché-Buc, F., Böcker, S., and Rousu, J.: Fast metabolite identification with Input Output Kernel Regression, Bioinformatics, 32, i28–i36, https://doi.org/10.1093/BIOINFORMATICS/BTW246, 2016. a
Donahue, N. M., Epstein, S. A., Pandis, S. N., and Robinson, A. L.: A two-dimensional volatility basis set: 1. organic-aerosol mixing thermodynamics, Atmos. Chem. Phys., 11, 3303–3318, https://doi.org/10.5194/acp-11-3303-2011, 2011. a
Donahue, N. M., Kroll, J. H., Pandis, S. N., and Robinson, A. L.: Atmospheric Chemistry and Physics A two-dimensional volatility basis set-Part 2: Diagnostics of organic-aerosol evolution, Atmos. Chem. Phys, 12, 615–634, https://doi.org/10.5194/acp-12-615-2012, 2012. a
Dührkop, K., Shen, H., Meusel, M., Rousu, J., and Böcker, S.: Searching molecular structure databases with tandem mass spectra using CSI:FingerID, P. Natl. Acad. Sci. USA, 112, 12580–12585, https://doi.org/10.1073/pnas.1509788112, 2015. a, b
Dührkop, K., Fleischauer, M., Ludwig, M., Aksenov, A. A., Melnik, A. V., Meusel, M., Dorrestein, P. C., Rousu, J., and Böcker, S.: SIRIUS 4: a rapid tool for turning tandem mass spectra into metabolite structure information, Nat. Methods, 16, 299–302, https://doi.org/10.1038/S41592-019-0344-8, 2019. a
Ehn, M., Thornton, J. A., Kleist, E., Sipilä, M., Junninen, H., Pullinen, I., Springer, M., Rubach, F., Tillmann, R., Lee, B., Lopez-Hilfiker, F., Andres, S., Acir, I. H., Rissanen, M., Jokinen, T., Schobesberger, S., Kangasluoma, J., Kontkanen, J., Nieminen, T., Kurtén, T., Nielsen, L. B., Jørgensen, S., Kjaergaard, H. G., Canagaratna, M., Maso, M. D., Berndt, T., Petäjä, T., Wahner, A., Kerminen, V. M., Kulmala, M., Worsnop, D. R., Wildt, J., and Mentel, T. F.: A large source of low-volatility secondary organic aerosol, Nature, 506, 476–479, https://doi.org/10.1038/nature13032, 2014. a
Elm, J.: An atmospheric cluster database consisting of sulfuric acid, bases, organics, and water, ACS Omega, 4, 10965–10974, https://doi.org/10.1021/acsomega.9b00860, 2019. a
Elm, J.: Clusteromics II: Methanesulfonic Acid-Base Cluster Formation, ACS Omega, 6, 17035–17044, https://doi.org/10.1021/acsomega.1c02115, 2021a. a, b
Elm, J.: Clusteromics I: Principles, Protocols, and Applications to Sulfuric Acid-Base Cluster Formation, ACS Omega, 6, 7804–7814, https://doi.org/10.1021/acsomega.1c00306, 2021b. a, b
Elm, J.: Clusteromics III: Acid Synergy in Sulfuric Acid-Methanesulfonic Acid-Base Cluster Formation, ACS Omega, 7, 15206–15214, https://doi.org/10.1021/acsomega.2c01396, 2022. a, b
Elm, J., Kubečka, J., Besel, V., Jääskeläinen, M. J., Halonen, R., Kurtén, T., and Vehkamäki, H.: Modeling the formation and growth of atmospheric molecular clusters: A review, J. Aerosol Sci., 149, 105621, https://doi.org/10.1016/J.JAEROSCI.2020.105621, 2020. a, b, c
Franklin, E. B., Yee, L. D., Aumont, B., Weber, R. J., Grigas, P., and Goldstein, A. H.: Ch3MS-RF: a random forest model for chemical characterization and improved quantification of unidentified atmospheric organics detected by chromatography–mass spectrometry techniques, Atmos. Meas. Tech., 15, 3779–3803, https://doi.org/10.5194/amt-15-3779-2022, 2022. a, b, c, d, e
Ge, X., Wexler, A. S., and Clegg, S. L.: Atmospheric amines – Part I. A review, Atmos. Environ., 45, 524–546, https://doi.org/10.1016/J.ATMOSENV.2010.10.012, 2011. a
Goldstein, A. H.: Mass spectral libraries, https://nature.berkeley.edu/ahg/resources/ (last access: 7 November 2024), 2024. a
Goldstein, A. H. and Galbally, I. E.: Known and unexplored organic constituents in the earth's atmosphere, Environ. Sci. Technol., 41, 1514–1521, https://doi.org/10.1021/es072476p, 2007. a
Hamilton, J. F., Webb, P. J., Lewis, A. C., Hopkins, J. R., Smith, S., and Davy, P.: Partially oxidised organic components in urban aerosol using GCXGC-TOF/MS, Atmos. Chem. Phys., 4, 1279–1290, https://doi.org/10.5194/acp-4-1279-2004, 2004. a, b, c, d
Heinonen, M., Shen, H., Zamboni, N., and Rousu, J.: Metabolite identification and molecular fingerprint prediction through machine learning, Bioinformatics, 28, 2333–2341, https://doi.org/10.1093/BIOINFORMATICS/BTS437, 2012. a, b
HighChem LLC: Advanced Mass Spectral Database (mzCloud), HighChem LLC, Slovakia, https://www.mzcloud.org (last access: 22 August 2023), 2023. a
hilsan: atmospheric_compound_similarity_analysis, GitHub [code], https://github.com/hilsan/atmospheric_compound_similarity_analysis (last access: 22 April 2025), 2025. a
Himanen, L., Jäger, M. O., Morooka, E. V., Canova, F. F., Ranawat, Y. S., Gao, D. Z., Rinke, P., and Foster, A. S.: DScribe: Library of descriptors for machine learning in materials science, Comput. Phys. Commun., 247, 106949, https://doi.org/10.1016/J.CPC.2019.106949, 2020. a
Hirschfeld, L., Swanson, K., Yang, K., Barzilay, R., and Coley, C. W.: Uncertainty Quantification Using Neural Networks for Molecular Property Prediction, J. Chem. Inf. Model., 60, 3770–3780, https://doi.org/10.1021/acs.jcim.0c00502, 2020. a
Hummel, J., Strehmel, N., Bölling, C., Schmidt, S., Walther, D., and Kopka, J.: Mass Spectral Search and Analysis Using the Golm Metabolome Database, The Handbook of Plant Metabolomics, Wiley, 321–343, https://doi.org/10.1002/9783527669882.CH18, 2013. a
Hyttinen, N., Pihlajamäki, A., and Häkkinen, H.: Machine Learning for Predicting Chemical Potentials of Multifunctional Organic Compounds in Atmospherically Relevant Solutions, J. Phys. Chem. Lett., 13, 9928–9933, https://doi.org/10.1021/acs.jpclett.2c02612, 2022. a
Isaacman-VanWertz, G. and Aumont, B.: Impact of organic molecular structure on the estimation of atmospherically relevant physicochemical parameters, Atmos. Chem. Phys., 21, 6541–6563, https://doi.org/10.5194/acp-21-6541-2021, 2021. a, b, c, d
Iyer, S., Kumar, A., Savolainen, A., Barua S., Daub, C., Pichelstorfer, L., Roldin, P., Garmash, O., Seal, P., Kurtén, T., and Rissanen, M.: Molecular rearrangement of bicyclic peroxy radicals is a key route to aerosol from aromatics, Nat. Commun., 14, 4984, https://doi.org/10.1038/s41467-023-40675-2, 2023. a
Janet, J. P., Duan, C., Yang, T., Nandy, A., and Kulik, H. J.: A quantitative uncertainty metric controls error in neural network-driven chemical discovery, Chem. Sci., 10, 7913–7922, https://doi.org/10.1039/C9SC02298H, 2019. a
Jenkin, M. E., Saunders, S. M., and Pilling, M. J.: The tropospheric degradation of volatile organic compounds: a protocol for mechanism development, Atmos. Environ., 31, 81–104, https://doi.org/10.1016/S1352-2310(96)00105-7, 1997. a, b
Khomenko, S., Cirach, M., Pereira-Barboza, E., Mueller, N., Barrera-Gómez, J., Rojas-Rueda, D., de Hoogh, K., Hoek, G., and Nieuwenhuijsen, M.: Premature mortality due to air pollution in European cities: a health impact assessment, The Lancet Planetary Health, 5, e121–e134, https://doi.org/10.1016/S2542-5196(20)30272-2, 2021. a
Khrabrov, K., Shenbin, I., Ryabov, A., Tsypin, A., Telepov, A., Alekseev, A., Grishin, A., Strashnov, P., Zhilyaev, P., Nikolenko, S., and Kadurin, A.: nablaDFT: Large-Scale Conformational Energy and Hamiltonian Prediction benchmark and dataset, Phys. Chem. Chem. Phys., 24, 25853–25863, https://doi.org/10.1039/D2CP03966D, 2022. a
Kind, T., Liu, K. H., Lee, D. Y., Defelice, B., Meissen, J. K., and Fiehn, O.: LipidBlast in silico tandem mass spectrometry database for lipid identification, Nat. Meth., 10, 755–758, https://doi.org/10.1038/nmeth.2551, 2013. a
Kirkby, J., Duplissy, J., Sengupta, K., Frege, C., Gordon, H., Williamson, C., Heinritzi, M., Simon, M., Yan, C., Almeida, J., Trostl, J., Nieminen, T., Ortega, I. K., Wagner, R., Adamov, A., Amorim, A., Bernhammer, A. K., Bianchi, F., Breitenlechner, M., Brilke, S., Chen, X., Craven, J., Dias, A., Ehrhart, S., Flagan, R. C., Franchin, A., Fuchs, C., Guida, R., Hakala, J., Hoyle, C. R., Jokinen, T., Junninen, H., Kangasluoma, J., Kim, J., Krapf, M., Kurten, A., Laaksonen, A., Lehtipalo, K., Makhmutov, V., Mathot, S., Molteni, U., Onnela, A., Perakyla, O., Piel, F., Petaja, T., Praplan, A. P., Pringle, K., Rap, A., Richards, N. A., Riipinen, I., Rissanen, M. P., Rondo, L., Sarnela, N., Schobesberger, S., Scott, C. E., Seinfeld, J. H., Sipila, M., Steiner, G., Stozhkov, Y., Stratmann, F., Tomé, A., Virtanen, A., Vogel, A. L., Wagner, A. C., Wagner, P. E., Weingartner, E., Wimmer, D., Winkler, P. M., Ye, P., Zhang, X., Hansel, A., Dommen, J., Donahue, N. M., Worsnop, D. R., Baltensperger, U., Kulmala, M., Carslaw, K. S., and Curtius, J.: Ion-induced nucleation of pure biogenic particles, Nature, 533, 521–526, https://doi.org/10.1038/nature17953, 2016. a
Knattrup, Y. and Elm, J.: Clusteromics IV: The Role of Nitric Acid in Atmospheric Cluster Formation, ACS Omega, 7, 31551–31560, https://doi.org/10.1021/acsomega.2c04278, 2022. a, b
Knattrup, Y., Kubečka, J., Ayoubi, D., and Elm, J.: Clusterome: A Comprehensive Data Set of Atmospheric Molecular Clusters for Machine Learning Applications, ACS Omega, 8, 25155–25164, https://doi.org/10.1021/acsomega.3c02203, 2023. a, b
Krüger, M., Wilson, J., Wietzoreck, M., Bandowe, B. A. M., Lammel, G., Schmidt, B., Pöschl, U., Berkemeier, T., and Berkemeier, C. T.: Convolutional neural network prediction of molecular properties for aerosol chemistry and health effects, Nat. Sci., 2, e20220016, https://doi.org/10.1002/NTLS.20220016, 2022. a, b, c, d
Kubečka, J., Knattrup, Y., Engsvang, M., Jensen, A. B., Ayoubi, D., Wu, H., Christiansen, O., and Elm, J.: Current and future machine learning approaches for modeling atmospheric cluster formation, Nat. Comput. Sci., 3, 495–503, https://doi.org/10.1038/s43588-023-00435-0, 2023. a
Kulik, H. J., Hammerschmidt, T., Schmidt, J., Botti, S., Marques, M. A., Boley, M., Scheffler, M., Todorović, M., Rinke, P., Oses, C., Smolyanyuk, A., Curtarolo, S., Tkatchenko, A., Bartók, A. P., Manzhos, S., Ihara, M., Carrington, T., Behler, J., Isayev, O., Veit, M., Grisafi, A., Nigam, J., Ceriotti, M., Schütt, K. T., Westermayr, J., Gastegger, M., Maurer, R. J., Kalita, B., Burke, K., Nagai, R., Akashi, R., Sugino, O., Hermann, J., Noé, F., Pilati, S., Draxl, C., Kuban, M., Rigamonti, S., Scheidgen, M., Esters, M., Hicks, D., Toher, C., Balachandran, P. V., Tamblyn, I., Whitelam, S., Bellinger, C., and Ghiringhelli, L. M.: Roadmap on Machine learning in electronic structure, Electronic Structure, 4, 023004, https://doi.org/10.1088/2516-1075/AC572F, 2022. a
Landrum, G.: RDKit: Open-source cheminformatics, version 2022.09.03, GitHub [code], https://github.com/rdkit/rdkit (last access: 22 April 2025), 2022. a, b
Langer, M. F., Goeßmann, A., and Rupp, M.: Representations of molecules and materials for interpolation of quantum-mechanical simulations via machine learning, npj Computational Materials, 8, 41, https://doi.org/10.1038/s41524-022-00721-x, 2022. a
Lannuque, V., Camredon, M., Couvidat, F., Hodzic, A., Valorso, R., Madronich, S., Bessagnet, B., and Aumont, B.: Exploration of the influence of environmental conditions on secondary organic aerosol formation and organic species properties using explicit simulations: development of the VBS-GECKO parameterization, Atmos. Chem. Phys., 18, 13411–13428, https://doi.org/10.5194/acp-18-13411-2018, 2018. a
Lelieveld, J., Pozzer, A., Pöschl, U., Fnais, M., Haines, A., and Münzel, T.: Loss of life expectancy from air pollution compared to other risk factors: a worldwide perspective, Cardiovasc. Res., 116, 1910–1917, https://doi.org/10.1093/CVR/CVAA025, 2020. a
Liu, R., Glover, K. P., Feasel, M. G., and Wallqvist, A.: General Approach to Estimate Error Bars for Quantitative Structure-Activity Relationship Predictions of Molecular Activity, J. Chem. Inf. Model., 58, 1561–1575, https://doi.org/10.1021/acs.jcim.8b00114, 2018. a, b, c, d
Lumiaro, E., Todorović, M., Kurten, T., Vehkamäki, H., and Rinke, P.: Predicting gas–particle partitioning coefficients of atmospheric molecules with machine learning, Atmos. Chem. Phys., 21, 13227–13246, https://doi.org/10.5194/acp-21-13227-2021, 2021. a, b, c, d
Maaten, L. V. D. and Hinton, G.: Visualizing Data using t-SNE, J. Mach. Learn. Res., 9, 2579–2605, 2008. a
MassBank consortium: MassBank/MassBank-data: Release version 2023.11, GitHub, https://github.com/MassBank/MassBank-data/releases/tag/2023.11, 2024. a, b
MassBank of North America: MassBank of North America, https://mona.fiehnlab.ucdavis.edu/ (last access: 8 January 2024), 2024. a, b
Masson-Delmotte, V., P Pirani, A. Z., S L Péan, C. Berger, S. C., Caud, N., Chen, Y., Goldfarb, L., Gomis, M. I., Huang, M., Leitzell, K., Lonnoy, E., Matthews, J. B. R., Maycock, T. K., Waterfield, T., Yelekçi, O., Yu, R., and Zhou, B. (Eds.): Climate Change 2021: The Physical Science Basis. Contribution of Working Group I to the Sixth Assessment Report of the Intergovernmental Panel on Climate Change, Cambridge University Press, https://doi.org/10.1017/9781009157896, 2023. a
McLafferty, F. W. and Wiley: Wiley Registry of Mass Spectral Data, Wiley, 12th edn., ISBN 978-1-119-17102-7, 2020. a
Montenegro-Burke, J. R., Guijas, C., and Siuzdak, G.: METLIN: A Tandem Mass Spectral Library of Standards, Methods in molecular biology (Clifton, N.J.), 2104, 149, https://doi.org/10.1007/978-1-0716-0239-3_9, 2020. a
Moret, M., Angona, I. P., Cotos, L., Yan, S., Atz, K., Brunner, C., Baumgartner, M., Grisoni, F., and Schneider, G.: Leveraging molecular structure and bioactivity with chemical language models for de novo drug design, Nat. Commun., 14, 1–12, https://doi.org/10.1038/s41467-022-35692-6, 2023. a, b, c
Nakamura, T., Sakaue, S., Fujii, K., Harabuchi, Y., Maeda, S., and Iwata, S.: Selecting molecules with diverse structures and properties by maximizing submodular functions of descriptors learned with graph neural networks, Sci. Rep., 12, 1–18, https://doi.org/10.1038/s41598-022-04967-9, 2022. a
Nguyen, D. H., Nguyen, C. H., and Mamitsuka, H.: SIMPLE: Sparse Interaction Model over Peaks of moLEcules for fast, interpretable metabolite identification from tandem mass spectra, Bioinformatics, 34, i323–i332, https://doi.org/10.1093/BIOINFORMATICS/BTY252, 2018. a
Nguyen, D. H., Nguyen, C. H., and Mamitsuka, H.: Recent advances and prospects of computational methods for metabolite identification: a review with emphasis on machine learning approaches, Brief. Bioinform., 20, 2028–2043, https://doi.org/10.1093/BIB/BBY066, 2019. a
Nothias, L. F., Petras, D., Schmid, R., Dührkop, K., Rainer, J., Sarvepalli, A., Protsyuk, I., Ernst, M., Tsugawa, H., Fleischauer, M., Aicheler, F., Aksenov, A. A., Alka, O., Allard, P. M., Barsch, A., Cachet, X., Caraballo-Rodriguez, A. M., Silva, R. R. D., Dang, T., Garg, N., Gauglitz, J. M., Gurevich, A., Isaac, G., Jarmusch, A. K., Kameník, Z., Kang, K. B., Kessler, N., Koester, I., Korf, A., Gouellec, A. L., Ludwig, M., H, C. M., McCall, L. I., McSayles, J., Meyer, S. W., Mohimani, H., Morsy, M., Moyne, O., Neumann, S., Neuweger, H., Nguyen, N. H., Nothias-Esposito, M., Paolini, J., Phelan, V. V., Pluskal, T., Quinn, R. A., Rogers, S., Shrestha, B., Tripathi, A., van der Hooft, J. J., Vargas, F., Weldon, K. C., Witting, M., Yang, H., Zhang, Z., Zubeil, F., Kohlbacher, O., Böcker, S., Alexandrov, T., Bandeira, N., Wang, M., and Dorrestein, P. C.: Feature-based molecular networking in the GNPS analysis environment, Nat. Meth., 17, 905–908, https://doi.org/10.1038/s41592-020-0933-6, 2020. a
Nozière, B., Kalberer, M., Claeys, M., Allan, J., D'Anna, B., Decesari, S., Finessi, E., Glasius, M., Grgić, I., Hamilton, J. F., Hoffmann, T., Iinuma, Y., Jaoui, M., Kahnt, A., Kampf, C. J., Kourtchev, I., Maenhaut, W., Marsden, N., Saarikoski, S., Schnelle-Kreis, J., Surratt, J. D., Szidat, S., Szmigielski, R., and Wisthaler, A.: The Molecular Identification of Organic Compounds in the Atmosphere: State of the Art and Challenges, Chem. Rev., 115, 3919–3983, https://doi.org/10.1021/cr5003485, 2015. a, b, c
Oberacher, H.: Wiley Registry of Tandem Mass Spectral Data: MS for ID, Wiley, ISBN 978-1-118-03744-7, 2012. a
Pedregosa, F., Varoquaux, G., Gramfort, A., Michel, V., Thirion, B., Grisel, O., Blondel, M., Prettenhofer, P., Weiss, R., Dubourg, V., Vanderplas, J., Passos, A., Cournapeau, D., Brucher, M., Perrot, M., and Duchesnay, E.: Scikit-learn: Machine Learning in Python, J. Mach. Learn. Res., 12, 2825–2830, 2011. a
Peräkylä, O., Riva, M., Heikkinen, L., Quéléver, L., Roldin, P., and Ehn, M.: Experimental investigation into the volatilities of highly oxygenated organic molecules (HOMs) , Atmos. Chem. Phys., 20, 649–669, https://doi.org/10.5194/acp-20-649-2020, 2020. a
Polykovskiy, D., Zhebrak, A., Sanchez-Lengeling, B., Golovanov, S., Tatanov, O., Belyaev, S., Kurbanov, R., Artamonov, A., Aladinskiy, V., Veselov, M., Kadurin, A., Johansson, S., Chen, H., Nikolenko, S., Aspuru-Guzik, A., and Zhavoronkov, A.: Molecular Sets (MOSES): A Benchmarking Platform for Molecular Generation Models, Front. Pharmacol., 11, 1931, https://doi.org/10.3389/fphar.2020.565644, 2020. a, b
Pozzer, A., Anenberg, S. C., Dey, S., Haines, A., Lelieveld, J., and Chowdhury, S.: Mortality Attributable to Ambient Air Pollution: A Review of Global Estimates, GeoHealth, 7, e2022GH000711, https://doi.org/10.1029/2022GH000711, 2023. a
Pörtner, A. O., Roberts, D., Tignor, M., Poloczanska, E., Mintenbeck, K., Alegrìa, A., Craig, M., Langsdorf, S., Löschke, S., Möller, V., Okem, A., and Rama, B. (Eds.): IPCC, 2022: Climate change 2022: Impacts, Adaptation and Vulnerability, Cambridge University Press, https://doi.org/10.1017/9781009325844, 2023. a
Ramakrishnan, R., Dral, P. O., Rupp, M., Lilienfeld, O. A. V., and Characteristic, S.: Quantum chemistry structures and properties of 134 kilo molecules, Sci. Data, 1, 140022, https://doi.org/10.1038/sdata.2014.22, 2014. a, b
Riccobono, F., Schobesberger, S., Scott, C. E., Dommen, J., Ortega, I. K., Rondo, L., Almeida, J., Amorim, A., Bianchi, F., Breitenlechner, M., David, A., Downard, A., Dunne, E. M., Duplissy, J., Ehrhart, S., Flagan, R. C., Franchin, A., Hansel, A., Junninen, H., Kajos, M., Keskinen, H., Kupc, A., Kürten, A., Kvashin, A. N., Laaksonen, A., Lehtipalo, K., Makhmutov, V., Mathot, S., Nieminen, T., Onnela, A., Petäjä, T., Praplan, A. P., Santos, F. D., Schallhart, S., Seinfeld, J. H., Sipilä, M., Spracklen, D. V., Stozhkov, Y., Stratmann, F., Tomé, A., Tsagkogeorgas, G., Vaattovaara, P., Viisanen, Y., Vrtala, A., Wagner, P. E., Weingartner, E., Wex, H., Wimmer, D., Carslaw, K. S., Curtius, J., Donahue, N. M., Kirkby, J., Kulmala, M., Worsnop, D. R., and Baltensperger, U.: Oxidation products of biogenic emissions contribute to nucleation of atmospheric particles, Science, 344, 717–721, https://doi.org/10.1126/science.1243527, 2014. a
Ruddigkeit, L., Deursen, R. V., Blum, L. C., and Reymond, J. L.: Enumeration of 166 billion organic small molecules in the chemical universe database GDB-17, J. Chem. Inf. Model., 52, 2864–2875, https://doi.org/10.1021/ci300415d, 2012. a, b
Ruggeri, G. and Takahama, S.: Technical Note: Development of chemoinformatic tools to enumerate functional groups in molecules for organic aerosol characterization, Atmos. Chem. Phys., 16, 4401–4422, https://doi.org/10.5194/acp-16-4401-2016, 2016. a
Rumble, J. R. (Ed.): Handbook of Chemistry and Physics, CRC Press, Taylor & Francis Group, an Informa Group company, 104th edn., https://hbcp.chemnetbase.com/contents/ContentsSearch.xhtml?dswid=-1569 (last access: 25 April 2025), 2023. a
Sander, R.: Compilation of Henry's law constants (version 4.0) for water as solvent, Atmos. Chem. Phys., 15, 4399–4981, https://doi.org/10.5194/acp-15-4399-2015, 2015. a
Sandström, H.: Similarity-Based Analysis of Atmospheric Organic Compounds for Machine Learning Applications (Version 1), Zenodo [data set, code], https://doi.org/10.5281/zenodo.14671496, 2025. a, b
Sandström, H., Rissanen, M., Rousu, J., and Rinke, P.: Data-Driven Compound Identification in Atmospheric Mass Spectrometry, Adv. Sci., 11, 2306235, https://doi.org/10.1002/ADVS.202306235, 2024. a, b, c
Saunders, S. M., Jenkin, M. E., Derwent, R. G., and Pilling, M. J.: Protocol for the development of the Master Chemical Mechanism, MCM v3 (Part A): tropospheric degradation of non-aromatic volatile organic compounds, Atmos. Chem. Phys., 3, 161–180, https://doi.org/10.5194/acp-3-161-2003, 2003. a, b
Sawada, Y., Nakabayashi, R., Yamada, Y., Suzuki, M., Sato, M., Sakata, A., Akiyama, K., Sakurai, T., Matsuda, F., Aoki, T., Hirai, M. Y., and Saito, K.: RIKEN tandem mass spectral database (ReSpect) for phytochemicals: A plant-specific MS/MS-based data resource and database, Phytochemistry, 82, 38–45, https://doi.org/10.1016/J.PHYTOCHEM.2012.07.007, 2012. a
Scalia, G., Grambow, C. A., Pernici, B., Li, Y. P., and Green, W. H.: Evaluating Scalable Uncertainty Estimation Methods for Deep Learning-Based Molecular Property Prediction, J. Chem. Inf. Model., 60, 2697–2717, https://doi.org/10.1021/acs.jcim.9b00975, 2020. a
Schobesberger, S., Junninen, H., Bianchi, F., Lönn, G., Ehn, M., Lehtipalo, K., Dommen, J., Ehrhart, S., Ortega, I. K., Franchin, A., Nieminen, T., Riccobono, F., Hutterli, M., Duplissy, J., Almeida, J., Amorim, A., Breitenlechner, M., Downard, A. J., Dunne, E. M., Flagan, R. C., Kajos, M., Keskinen, H., Kirkby, J., Kupc, A., Kürten, A., Kurtén, T., Laaksonen, A., Mathot, S., Onnela, A., Praplan, A. P., Rondo, L., Santos, F. D., Schallhart, S., Schnitzhofer, R., Sipilä, M., Tomé, A., Tsagkogeorgas, G., Vehkamäki, H., Wimmer, D., Baltensperger, U., Carslaw, K. S., Curtius, J., Hansel, A., Petäjä, T., Kulmala, M., Donahue, N. M., and Worsnop, D. R.: Molecular understanding of atmospheric particle formation from sulfuric acid and large oxidized organic molecules, P. Natl. Acad. Sci. USA, 110, 17223–17228, https://doi.org/10.1073/pnas.1306973110, 2013. a
Sheridan, R. P., Feuston, B. P., Maiorov, V. N., and Kearsley, S. K.: Similarity to molecules in the training set is a good discriminator for prediction accuracy in QSAR, J. Chem. Inf. Comp. Sci., 44, 1912–1928, https://doi.org/10.1021/ci049782w, 2004. a
Soleimany, A. P., Amini, A., Goldman, S., Rus, D., Bhatia, S. N., and Coley, C. W.: Evidential Deep Learning for Guided Molecular Property Prediction and Discovery, ACS Cent. Sci., 7, 1356–1367, 2021. a
Sud, M., Fahy, E., Cotter, D., Brown, A., Dennis, E. A., Glass, C. K., Merrill, A. H., Murphy, R. C., Raetz, C. R., Russell, D. W., and Subramaniam, S.: LMSD: LIPID MAPS structure database, Nucleic Acids Res., 35, D527–D532, https://doi.org/10.1093/NAR/GKL838, 2007. a
Tabor, D. P., Gómez-Bombarelli, R., Tong, L., Gordon, R. G., Aziz, M. J., and Aspuru-Guzik, A.: Mapping the frontiers of quinone stability in aqueous media: implications for organic aqueous redox flow batteries, J. Mater. Chem. A, 7, 12833–12841, https://doi.org/10.1039/C9TA03219C, 2019. a, b, c
Taguchi, R. and Ishikawa, M.: Precise and global identification of phospholipid molecular species by an Orbitrap mass spectrometer and automated search engine Lipid Search, J. Chromatogr. A, 1217, 4229–4239, https://doi.org/10.1016/J.CHROMA.2010.04.034, 2010. a
Tanimoto, T. T.: An elementary mathematical theory of classification and prediction, Tech. rep., IBM Internal Report, 1958. a
Thoma, M., Bachmeier, F., Gottwald, F. L., Simon, M., and Vogel, A. L.: Mass spectrometry-based Aerosolomics: a new approach to resolve sources, composition, and partitioning of secondary organic aerosol, Atmos. Meas. Tech., 15, 7137–7154, https://doi.org/10.5194/amt-15-7137-2022, 2022. a, b
Wallace, W. E. and Moorthy, A. S.: NIST Mass Spectrometry Data Center standard reference libraries and software tools: Application to seized drug analysis, J. Forensic Sci., 68, 1484–1493, https://doi.org/10.1111/1556-4029.15284, 2023. a
Wang, C., Yuan, T., Wood, S. A., Goss, K.-U., Li, J., Ying, Q., and Wania, F.: Uncertain Henry's law constants compromise equilibrium partitioning calculations of atmospheric oxidation products, Atmos. Chem. Phys., 17, 7529–7540, https://doi.org/10.5194/acp-17-7529-2017, 2017. a, b, c, d, e, f
Wang, M., Carver, J. J., Phelan, V. V., Sanchez, L. M., Garg, N., Peng, Y., Nguyen, D. D., Watrous, J., Kapono, C. A., Luzzatto-Knaan, T., Porto, C., Bouslimani, A., Melnik, A. V., Meehan, M. J., Liu, W. T., Crüsemann, M., Boudreau, P. D., Esquenazi, E., Sandoval-Calderón, M., Kersten, R. D., Pace, L. A., Quinn, R. A., Duncan, K. R., Hsu, C. C., Floros, D. J., Gavilan, R. G., Kleigrewe, K., Northen, T., Dutton, R. J., Parrot, D., Carlson, E. E., Aigle, B., Michelsen, C. F., Jelsbak, L., Sohlenkamp, C., Pevzner, P., Edlund, A., McLean, J., Piel, J., Murphy, B. T., Gerwick, L., Liaw, C. C., Yang, Y. L., Humpf, H. U., Maansson, M., Keyzers, R. A., Sims, A. C., Johnson, A. R., Sidebottom, A. M., Sedio, B. E., Klitgaard, A., Larson, C. B., Boya, C. A., Torres-Mendoza, D., Gonzalez, D. J., Silva, D. B., Marques, L. M., Demarque, D. P., Pociute, E., O'Neill, E. C., Briand, E., Helfrich, E. J., Granatosky, E. A., Glukhov, E., Ryffel, F., Houson, H., Mohimani, H., Kharbush, J. J., Zeng, Y., Vorholt, J. A., Kurita, K. L., Charusanti, P., McPhail, K. L., Nielsen, K. F., Vuong, L., Elfeki, M., Traxler, M. F., Engene, N., Koyama, N., Vining, O. B., Baric, R., Silva, R. R., Mascuch, S. J., Tomasi, S., Jenkins, S., Macherla, V., Hoffman, T., Agarwal, V., Williams, P. G., Dai, J., Neupane, R., Gurr, J., Rodríguez, A. M., Lamsa, A., Zhang, C., Dorrestein, K., Duggan, B. M., Almaliti, J., Allard, P. M., Phapale, P., Nothias, L. F., Alexandrov, T., Litaudon, M., Wolfender, J. L., Kyle, J. E., Metz, T. O., Peryea, T., Nguyen, D. T., VanLeer, D., Shinn, P., Jadhav, A., Müller, R., Waters, K. M., Shi, W., Liu, X., Zhang, L., Knight, R., Jensen, P. R., Palsson, B., Pogliano, K., Linington, R. G., Gutiérrez, M., Lopes, N. P., Gerwick, W. H., Moore, B. S., Dorrestein, P. C., and Bandeira, N.: Sharing and community curation of mass spectrometry data with Global Natural Products Social Molecular Networking, Nat. Biotechnol., 34, 828–837, https://doi.org/10.1038/nbt.3597, 2016. a
Watanabe, K., Yasugi, E., and Oshima, M.: How to Search the Glycolipid data in “LIPIDBANK for Web”, the Newly Developed Lipid Database in Japan, Trends Glycosci. Glyc., 12, 175–184, https://doi.org/10.4052/TIGG.12.175, 2000. a
Weber, R. J., Li, E., Bruty, J., He, S., and Viant, M. R.: MaConDa: a publicly accessible mass spectrometry contaminants database, Bioinformatics, 28, 2856–2857, https://doi.org/10.1093/BIOINFORMATICS/BTS527, 2012. a
Wishart, D. S., Guo, A., Oler, E., Wang, F., Anjum, A., Peters, H., Dizon, R., Sayeeda, Z., Tian, S., Lee, B. L., Berjanskii, M., Mah, R., Yamamoto, M., Jovel, J., Torres-Calzada, C., Hiebert-Giesbrecht, M., Lui, V. W., Varshavi, D., Varshavi, D., Allen, D., Arndt, D., Khetarpal, N., Sivakumaran, A., Harford, K., Sanford, S., Yee, K., Cao, X., Budinski, Z., Liigand, J., Zhang, L., Zheng, J., Mandal, R., Karu, N., Dambrova, M., Oth, H. B. S., Greiner, R., and Gautam, V.: HMDB 5.0: the Human Metabolome Database for 2022, Nucleic Acids Res., 50, D622–D631, https://doi.org/10.1093/nar/gkab1062, 2022. a
Wissenbach, D. K., Meyer, M. R., Remane, D., Philipp, A. A., Weber, A. A., and Maurer, H. H.: Drugs of abuse screening in urine as part of a metabolite-based LC-MS n screening concept, Anal. Bioanal. Chem., 400, 3481–3489, https://doi.org/10.1007/s00216-011-5032-1, 2011a. a
Wissenbach, D. K., Meyer, M. R., Remane, D., Weber, A. A., and Maurer, H. H.: Development of the first metabolite-based LC-MS n urine drug screening procedure-exemplified for antidepressants, Anal. Bioanal. Chem., 400, 79–88, https://doi.org/10.1007/S00216-010-4398-9, 2011b. a
Worton, D. R., Decker, M., Isaacman-VanWertz, G., Chan, A. W., Wilson, K. R., and Goldstein, A. H.: Improved molecular level identification of organic compounds using comprehensive two-dimensional chromatography, dual ionization energies and high resolution mass spectrometry, Analyst, 142, 2395–2403, https://doi.org/10.1039/C7AN00625J, 2017. a, b, c, d
- Abstract
- Introduction
- Methods
- Results
- Discussion
- Outlook
- Conclusions
- Appendix A: t-SNE analysis at different perplexity values
- Appendix B: Example molecule pairs at different similarity values
- Appendix C: Percentage of molecule pairs in high- and low-similarity regions
- Appendix D: Maximum Tanimoto similarity per compound
- Code and data availability
- Author contributions
- Competing interests
- Disclaimer
- Acknowledgements
- Financial support
- Review statement
- References