the Creative Commons Attribution 4.0 License.
the Creative Commons Attribution 4.0 License.
Forecasting contrail climate forcing for flight planning and air traffic management applications: the CocipGrid model in pycontrails 0.51.0
Zebediah Engberg
Roger Teoh
Tristan Abbott
Thomas Dean
Marc E. J. Stettler
Marc L. Shapiro
The global annual mean contrail climate forcing may exceed that of aviation's cumulative CO2 emissions. As only 2 %–3 % of all flights are likely responsible for 80 % of the global annual contrail energy forcing (EFcontrail), re-routing these flights could reduce the occurrence of strongly warming contrails. Here, we develop a contrail forecasting tool that produces global maps of persistent contrail formation and their EFcontrail formatted to align with standard weather and turbulence forecasts for integration into existing flight planning and air traffic management workflows. This is achieved by extending the existing trajectory-based contrail cirrus prediction model (CoCiP), which simulates contrails formed along flight paths, to a grid-based approach that initializes an infinitesimal contrail segment at each point in a 4D spatiotemporal grid and tracks them until their end of life. Outputs are provided for N aircraft-engine groups, with groupings based on similarities in aircraft mass and engine particle number emissions: N=7 results in a 3 % mean error between the trajectory- and grid-based CoCiP, while N=3 facilitates operational simplicity but increases the mean error to 13 %. We use the grid-based CoCiP to simulate contrails globally using 2019 meteorology and compare its forecast patterns with those from previous studies. Two approaches are proposed to apply these forecasts for contrail mitigation: (i) monetizing EFcontrail and including it as an additional cost parameter within a flight trajectory optimizer or (ii) constructing polygons to avoid airspace volumes with strongly warming contrails. We also demonstrate a probabilistic formulation of the grid-based CoCiP by running it with ensemble meteorology and excluding grid cells with significant uncertainties in the simulated EFcontrail. This study establishes a working standard for incorporating contrail mitigation into flight management protocols and demonstrates how forecasting uncertainty can be incorporated to minimize unintended consequences associated with increased CO2 emissions from re-routes.
- Article
(10341 KB) - Full-text XML
-
Supplement
(9005 KB) - BibTeX
- EndNote
Global aviation activity produces significant socio-economic benefits, but also emits CO2 and non-CO2 pollutants that impact the environment in the form of climate change and air quality degradation. Lee et al. (2021) estimated that aviation accounted for 3.5 % of the global anthropogenic climate forcing in 2018, where the collective effective radiative forcing (ERF) from non-CO2 components such as contrail cirrus (57.4 [17, 98] mW m−2 at a 95 % confidence interval) and nitrogen oxides (17.5 [0.6, 29] mW m−2) could be 2 times larger than its cumulative CO2 emitted since the 1940s (34.3 [28, 40] mW m−2). Given the significant impact from aviation non-CO2 emissions, the European Union (EU) Emissions Trading System (ETS) monitoring, reporting, and verification (MRV) framework has recently been amended to require flights travelling within Europe to measure their non-CO2 impacts, including the effects from contrail cirrus, from 2025 onwards (European Commission, 2023).
Contrails form behind an aircraft when conditions in the rapidly cooling exhaust plume become supersaturated with respect to water, enabling water vapour to condense on the surface of particles to form droplets that subsequently freeze to form ice particles (Kärcher and Yu, 2009; Schumann, 1996). Previous studies have estimated that up to 85 % of contrails are short-lived and sublimate within 5 min (Teoh et al., 2024a; Wolf et al., 2023a). The remaining contrails typically persist in ice-supersaturated regions (ISSR), where they can evolve into contrail cirrus clusters that become indistinguishable from natural cirrus (Haywood et al., 2009). These persistent contrails exhibit lifetimes that generally follow an exponential distribution with a mean duration of 1–3 h (Caiazzo et al., 2017; Teoh et al., 2024a; Vázquez-Navarro et al., 2015). During daylight hours, persistent contrails can cause a cooling effect by reflecting incoming shortwave (SW) solar radiation back to space. However, they always induce a warming effect by absorbing and re-emitting outgoing longwave (LW) infrared radiation (Meerkötter et al., 1999). Contrail LW and SW instantaneous radiative forcing (RF) varies regionally and is influenced by air traffic density, aircraft-engine particle number emissions, background radiation fields, ambient meteorology, and diurnal and seasonal factors (Kärcher, 2018; Schumann and Heymsfield, 2017; Teoh et al., 2022a, 2024a).
While observational tools such as satellite imagery and ground-based cameras have been used for observing contrail formation and evolution (Duda et al., 2019; Low et al., 2025; Mannstein et al., 2010; Rosenow et al., 2023; Schumann et al., 2013a; Vázquez-Navarro et al., 2015), estimates of the cumulative contrail climate forcing over their entire life cycle are currently only available through simulation-based models. Various physics-based modelling approaches have been employed for this purpose, including (i) large-eddy simulations (LESs) (Lewellen, 2014; Lewellen et al., 2014; Unterstrasser, 2016) and (ii) parameterized Lagrangian models, such as the Contrail Cirrus Prediction Model (CoCiP) (Schumann, 2012); Contrail Evolution and Radiation Model (CERM) (Caiazzo et al., 2017); and Aircraft Plume Chemistry, Emissions, and Microphysics Model (APCEMM) (Fritz et al., 2020). A third approach is (iii) general circulation models (GCMs), which simulate the interaction between contrails and atmospheric processes, including the rapid atmospheric adjustments directly caused by the contrail, such as changes in water vapour concentration, temperature lapse rate, and natural cirrus properties (Bickel et al., 2019; Bier and Burkhardt, 2022; Chen and Gettelman, 2013; Grewe et al., 2014; Ponater et al., 2021). Specifically, approaches (ii) and (iii) have been applied to investigate the spatiotemporal variations in contrail climate effects and used for flight trajectory optimization purposes (Frömming et al., 2021; Grewe et al., 2017; Schumann et al., 2011; Teoh et al., 2020a).
Recently, Teoh et al. (2024a) used CoCiP to simulate contrails globally for 2019, estimating that around 20 % of all flights produced persistent contrails. Among these persistent contrail-forming flights, 70 % of them (17 % of all flights) had a net warming effect and 10 % of them (2.7 % of all flights) were responsible for 80 % of the global annual contrail energy forcing (EFcontrail). EFcontrail represents the cumulative contrail climate forcing over its lifetime, with a positive value indicating more energy entering the Earth system than leaving it. We use the terms “warming/cooling effect” to describe this net energy balance at the top of the atmosphere while acknowledging that the actual surface temperature change depends on the contrail efficacy and spatiotemporal factors (Bickel et al., 2019; Ponater et al., 2005, 2021; Schumann and Mayer, 2017). These findings highlight a potential pathway for aviation to reduce its overall climate forcing by strategically re-routing a small subset of flights to minimize the formation of strongly warming contrails (Teoh et al., 2020a, b; Wilhelm et al., 2021). While two small-scale operational contrail-avoidance trials have been conducted in recent years (Sonabend-W et al., 2024; Sausen et al., 2023), several challenges must be addressed to implement a contrail-minimization strategy at a larger scale. These challenges include (i) integrating a contrail forecast model into flight planning and management software to account for airspace and operational constraints; (ii) automating airspace procedures to perform trajectory adjustments, which is necessary to reduce air traffic controller workload (Molloy et al., 2022; Sausen et al., 2023); (iii) incorporating meteorological and contrail forecast uncertainties into the decision-making framework for contrail mitigation actions (Agarwal et al., 2022; Gierens et al., 2020; Molloy et al., 2022); and (iv) balancing trade-offs between reducing contrail climate forcing and potential increases in fuel consumption. Challenges (i) to (iii) could be addressed by providing contrail climate forcing forecasts in a format similar to turbulence forecasts (Turbli, 2024), thereby facilitating their integration into the operational workflow of existing flight planning software (Martin Frias et al., 2024).
This study aims to extend the existing trajectory-based CoCiP to create a prototype contrail forecasting tool that generates global maps of persistent contrail formation and their associated climate forcing. We then compare the spatial trends of contrail climate forcing predicted by this new tool with those from the trajectory-based CoCiP and earlier global contrail simulation studies. Additionally, we demonstrate how the tool can be applied to flight trajectory optimization and propose strategies to account for contrail forecast uncertainties arising from weather forecasts and model simplifications.
Our contrail forecasting tool uses a Lagrangian model instead of LESs and GCMs for two key reasons: (i) it can utilize reanalysis or forecast meteorological data provided by numerical weather prediction (NWP) models rather than relying on representative weather conditions from GCMs (Grewe et al., 2014), and (ii) it can compute EFcontrail efficiently within the time constraints required for flight planning and operational use. While we expect contrail forecasts to evolve as modelling and observational capabilities improve, we aim to use this prototype to enable stakeholders (e.g. flight planners and air navigation service providers) to accommodate contrail forecasts in flight planning by establishing standards, data integration, and modifications to software tools and operational processes.
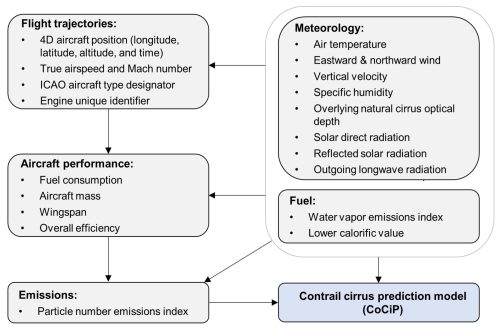
CoCiP simulates the contrail properties and climate forcing for a single flight trajectory using inputs of (i) flight trajectory waypoints; (ii) fuel properties, such as the water vapour emission index ( and lower calorific value (Qfuel); (iii) aircraft properties and performance parameters, including the true airspeed (VTAS), fuel mass flow rate (), overall efficiency (η), aircraft mass (M), and wingspan; (iv) aircraft-engine specific non-volatile particulate matter (nvPM) number emission index (EIn); and (v) historical or forecast meteorology provided by NWP models (Schumann, 2012).
Briefly, CoCiP utilizes the Schmidt–Appleman criterion (SAC) to estimate the threshold temperature for contrail formation (TSAC), where TSAC is influenced by η, , and Qfuel (Schumann, 1996). For waypoints that satisfy the SAC, i.e. with ambient temperature (Tamb) falling below TSAC, CoCiP simulates the wake-vortex downwash using a probabilistic two-phase wake-vortex decay model which parametrically estimates the mean downward displacement and initial contrail width and depth as a function of aircraft mass, wingspan, and VTAS (Holzapfel, 2003). Persistent contrail segments are defined when the post-wake-vortex contrail ice water content (IWC) in two consecutive waypoints is greater than 10−12 kg kg−1. For each contrail segment, the contrail ice crystal number per flight distance flown (nice,initial) is initialized by estimating the nvPM particle number emissions per flight distance flown, fraction of nvPM particles that activates to form contrail ice crystals (factivation), and fraction of contrail ice crystals that survive the wake-vortex phase (fsurv):
where
and
The nvPM number emissions per unit distance is calculated by multiplying the aircraft-engine specific nvPM EIn with the fuel consumption per distance flown (), factivation is determined by the difference between Tamb and TSAC (Bräuer et al., 2021; Teoh et al., 2022a), and fsurv is assumed to be proportional to the change in contrail IWC due to adiabatic heating from the wake-vortex downwash (ΔIWCad) (Schumann, 2012).
For persistent contrail segments, a first-order Euler method simulates the evolution of their locations, dimensions, and properties, with model time steps (dt, <3600 s; 300 s in this study), until their end of life, defined as when the contrail segment age exceeds a maximum lifetime of 12 h, ice particle number per volume of air drops below 103 m−3, or optical depth (τcontrail) falls below 10−6 (Schumann, 2012; Teoh et al., 2024a). A parametric RF model, which is fitted to the libRadtran radiative transfer package (Mayer and Kylling, 2005), estimates the local contrail SW and LW RF (RF′, the change in radiative flux over the contrail coverage area) at each time step (Schumann et al., 2012b). These RF′ estimates indirectly account for the presence of various cloud types (e.g. ice, liquid, and mixed-phase clouds) above and below the contrail through input meteorological parameters such as the reflected solar radiation (RSR), outgoing longwave radiation (OLR), effective albedo (i.e. the fraction of incoming solar radiation reflected by the surface and/or clouds), and optical depth of overlying cirrus clouds (τcirrus) (Schumann et al., 2012b). Additionally, recent CoCiP studies have also formulated an approach to approximate the change in contrail RF′ due to contrail–contrail overlapping (Schumann et al., 2021; Teoh et al., 2024a).
EFcontrail is estimated by integrating the contrail net RF′ over its contrail segment length (L), width (W), and lifetime (tmax) (Schumann et al., 2011):
We note that EFcontrail is sensitive to several factors, including the (i) contrail RF′ estimates from the fitted parametric RF model; (ii) humidity fields from the NWP model, which affect the contrail tmax and coverage area (L and W); and (iii) contrail segment angle (α), which is the angle between the contrail segment and the longitudinal axis. For (iii), α influences the magnitude of wind shear acting perpendicular to the contrail segment () (Schumann, 2012):
where and represent the wind shear acting on the eastward and northward directions respectively. , in turn, influences the contrail's spreading rate, ice crystal loss rate, and tmax. Consequently, contrails with a large EFcontrail are generally long-lived with a large coverage area, while short-lived contrails with a large positive net RF′ may have a negligible EFcontrail (Teoh et al., 2020b).
While previous studies have compared the distribution of simulated contrail properties from CoCiP with in situ measurements, remote sensing, and satellite observations over their life cycle (Driver et al., 2024; Jeßberger et al., 2013; Low et al., 2025; Schumann et al., 2017, 2021; Schumann and Heymsfield, 2017; Teoh et al., 2024a), further comparisons with observations remain crucial for building greater confidence in and improving the accuracy of CoCiP predictions. For further details on the versioning and evolution of the trajectory-based CoCiP, readers can refer to Appendix A1 and the documentation of the open-source pycontrails repository (Shapiro et al., 2024).
The existing implementation of CoCiP described in Sect. 2, i.e. the trajectory-based CoCiP, simulates contrails formed along a flight path. However, when used to optimize the trajectory of multiple flights, the trajectory-based approach becomes computationally inefficient because of the need for repeated model re-runs across each flight and various trajectory iterations to identify the solution with a minimum EFcontrail. One way to address this limitation is to produce a 4D field of the EFcontrail per flight distance flown, effectively identifying regions forecast to form persistent and/or strongly warming contrails. We achieve this by extending the trajectory-based CoCiP to a grid-based approach, where an infinitesimal contrail segment (i) is initialized at each point in a 4D spatiotemporal domain; (ii) is simulated until its end of life with a dt of 300 s using the equations of the trajectory-based CoCiP; and (iii) has its cumulative climate forcing attributed back to the grid cell where it originally formed, with the model outputs taking the same form as traditional 4D NWP data. For (ii), Appendix A2 evaluates the sensitivity of dt on the simulated EFcontrail and provides the rationale for selecting a dt of 300 s for the grid-based CoCiP. Additionally, we note that the grid-based CoCiP defines regions with strongly warming contrails based on the 80th percentile (5×10⁸ J m−1) and the 95th percentile (1.5×10⁹ J m−1) of EFcontrail per flight distance flown, both of which were derived from a 2019 global contrail simulation using the trajectory-based CoCiP (Teoh et al., 2024a).
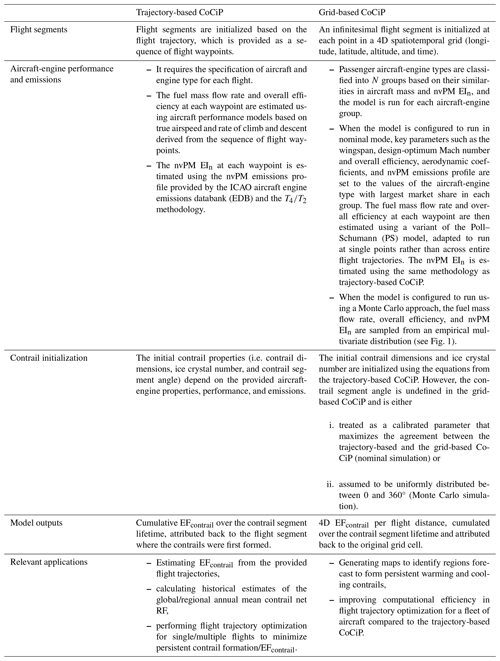
Table 1 presents the differences between the trajectory and grid-based CoCiP. The primary distinction lies in how the contrail segment properties are initialized. Here, we describe our methodology to initialize the contrail segment properties in the grid-based CoCiP (Sect. 3.1) and the meteorological datasets used in this study (Sect. 3.2) and outline key differences in the grid-based CoCiP when it is configured to run with a nominal (Sect. 3.3) and a Monte Carlo simulation (Sect. 3.4).
3.1 Initial contrail properties
In the trajectory-based CoCiP, contrail segment properties are initialized based on the flight segment (α and VTAS) and aircraft-engine-specific properties (wingspan, M, , η, and nvPM EIn). However, this approach cannot be directly applied to the grid-based CoCiP because of the need to (i) model aircraft performance (VTAS, , M, η, and nvPM EIn) locally rather than based on entire flight trajectories and (ii) determine an appropriate value for α, which influences the wind shear acting on the contrail segment (see Eq. 5), without prior information about the direction of travel.
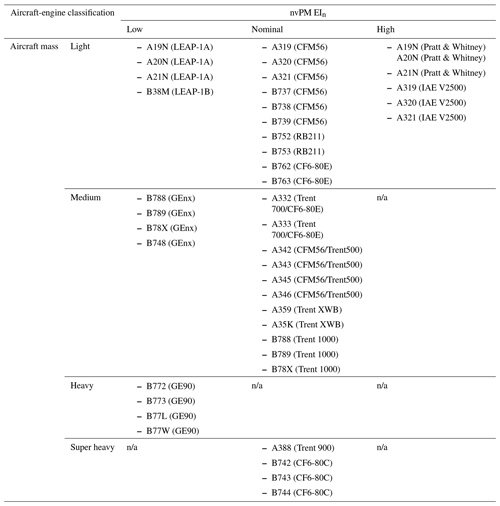
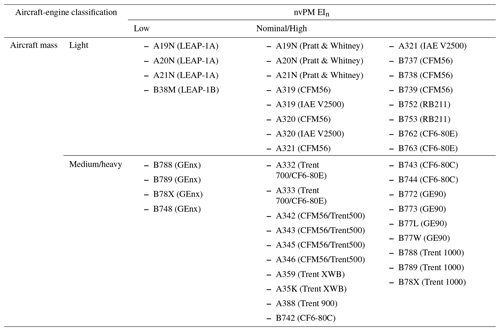
Table 2Classification of commonly used passenger aircraft-engine types into 12 unique groups based on their similarities in aircraft mass and nvPM EIn. The aircraft types listed here are labelled based on their ICAO aircraft type designator.
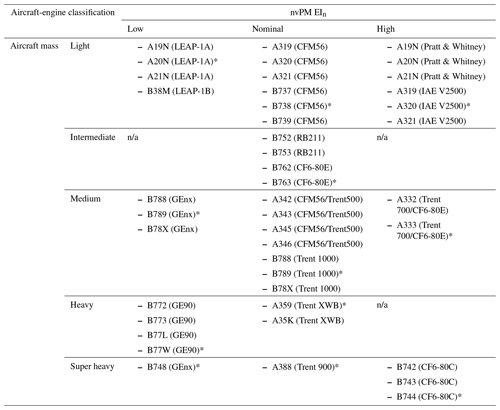
* The asterisk refers to the aircraft-engine type with the largest market share within the group based on the 2019 GAIA dataset (Teoh et al., 2024b). n/a: not applicable.
Table 3Summary of the aircraft properties (wingspan, service ceiling altitude, and maximum Mach number) and range of aircraft performance and emissions parameters (aircraft mass, η, and nvPM EIn) for the 12 aircraft-engine groups. Details of the aircraft-engine types that are included in each group can be found in Table 2. Differences in aircraft mass and nvPM EIn among the 12 aircraft-engine groups are visualized in Fig. A5.
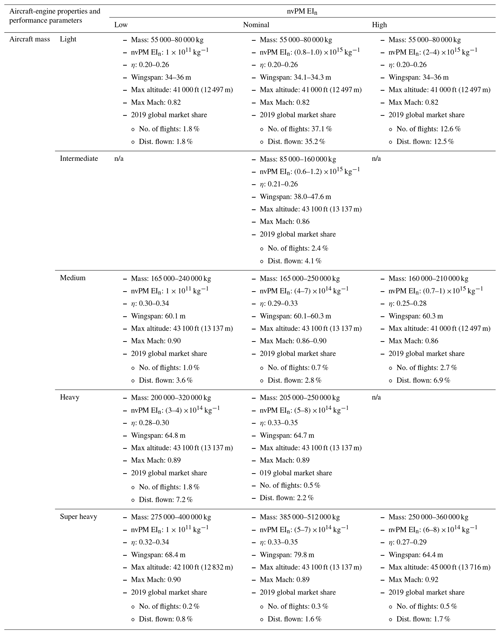
n/a: not applicable
Moreover, the grid-based CoCiP must account for variations in aircraft performance across different aircraft and engine types that are known to influence EFcontrail (Teoh et al., 2022a). In theory, this issue could be resolved by re-running the grid-based CoCiP for each aircraft-engine combination. However, this method would lead to increased computational and data transfer requirements as well as increased operational complexity when used in the context of flight planning and execution. Instead, we address this challenge by classifying the most commonly used passenger aircraft-engine types into N groups based on their similarities in aircraft mass and nvPM EIn (Tables 2 and 3), thereby introducing a fifth dimension to the model outputs ( aircraft-engine group).
The classification by aircraft mass and nvPM is informed by the strong correlation between the nvPM emissions per flight distance, which is estimated as a product of nvPM EIn and (where the aircraft mass is used as a proxy) and the EFcontrail per flight distance (R=0.71) (Teoh et al., 2022a). While a higher N is expected to improve the agreement between the trajectory- and grid-based CoCiP, our goal is to identify an acceptable minimum value for N to reduce the computational demands and operational complexity in practice (Sect. 4). For each group, the waypoint-specific inputs (α, VTAS, wingspan, aircraft mass, , η, and nvPM EIn) vary depending on whether the grid-based CoCiP is configured to run in a nominal mode (Sect. 3.3) or with a Monte Carlo simulation (Sect. 3.4).
3.2 Meteorology
In practice, the grid-based CoCiP would utilize forecast meteorological products (e.g. the European Centre for Medium-Range Weather Forecasts (ECMWF) Atmospheric Model high-resolution 10 d forecast (ECMWF, 2024) to provide contrail climate forcing forecasts. For this paper, we use historical meteorology, specifically the ECMWF ERA5 high-resolution realization (HRES) reanalysis for the nominal simulation and the ERA5 10-member ensembles for the Monte Carlo simulation (Sect. 3.4) (Hersbach et al., 2020).
Both datasets share a vertical resolution of 26 model levels, spanning from 6300 m (20 000 ft) to 15 000 m (49 000 ft), but the ERA5 HRES Reanalysis offers a higher spatiotemporal resolution (0.25° longitude × 0.25° latitude at a 1 h temporal resolution) than the ERA5 10-member ensembles (0.5° longitude × 0.5° latitude at a 3 h temporal resolution). The spatiotemporal resolution of the grid-based CoCiP is adjustable and set to align with the ERA5 HRES Reanalysis. For both meteorological products, we apply a correction to ensure that the ERA5 relative humidity with respect to ice (RHi) distribution is consistent with in situ measurements (refer to Appendix A3 for further details).
3.3 Nominal simulation
Each aircraft-engine type is characterized by a set of fixed properties, including the wingspan, design-optimum Mach number, aerodynamic coefficients, and nvPM emissions profile, all of which are required as inputs to aircraft performance and emission models. The Poll–Schumann (PS) aircraft performance model (Poll and Schumann, 2020, 2021) provides the wingspan, design-optimum Mach number, and aerodynamic coefficients, while the International Civil Aviation Organization (ICAO) Aircraft Engine Emissions Databank (EASA, 2021) supplies the nvPM EIn at the four ICAO certification test points representing the engine power settings (i.e. 7 %, 30 %, 85 %, and 100 % of the maximum rated engine thrust) used in the landing-and-take-off (LTO) cycle. For each aircraft-engine group, which encompasses multiple aircraft-engine types (Table 2), we set these fixed properties to values of the aircraft-engine type with the largest market share within the group (Teoh et al., 2024b).
The nominal grid-based CoCiP derives the waypoint-specific parameters (e.g. VTAS, M, , η, and nvPM EIn) using two key assumptions and two established models. Firstly, it assumes that the Mach number at each grid cell is equal to the design-optimum Mach number with 0.04 added (Teoh et al., 2024b), reflecting the common practice of airlines of flying faster to minimize time-dependent costs and/or address delays (Edwards et al., 2016; Lovegren and Hansman, 2011). Secondly, it assumes that the aircraft mass at each altitude is equal to the value that maximizes η, which is based on the rationale that a lower aircraft mass is required to fly at higher altitudes (Fig. 1). The PS model is used to estimate the (Poll and Schumann, 2020, 2021), while the T4/T2 methodology estimates the nvPM EIn at the cruise phase of flight by interpolating the LTO-based nvPM emissions profile relative to the non-dimensional engine thrust settings (EASA, 2021; Teoh et al., 2024b).
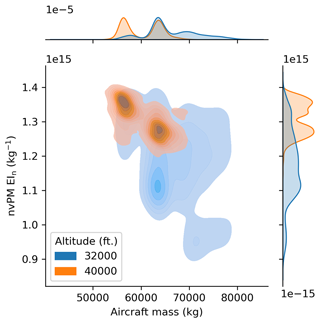
Figure 1Multivariate distribution of aircraft mass and nvPM EIn for one aircraft-engine group (light aircraft mass and nominal nvPM EIn, see Table 2) at 32 000 ft (9754 m, in blue) and 40 000 ft (12 192 m, in orange). The underlying data are provided by the 2019 Global Aviation emissions Inventory based on the Automatic Dependent Surveillance–Broadcast (ADS-B) (GAIA) (Teoh et al., 2024b). The multi-modal distribution of the aircraft mass and nvPM EIn is due to the inclusion of two comparable aircraft engine families (Boeing 737 and Airbus A320 families) in the same group, each exhibiting distinct operating characteristics. The variations in nvPM EIn with altitude results from changes in aircraft mass and air density, both of which influence the engine thrust settings and subsequently nvPM emissions (EASA, 2021).
As α cannot be defined for an infinitesimal flight segment, the nominal grid-based CoCiP adopts a workaround by calibrating Eq. (5) as follows:
where
is the magnitude of the wind shear, and fshear is a free parameter and has physical limits of 0 (i.e. contrail segment aligned with the wind shear) and 1 (i.e. contrail segment perpendicular to shear). We calibrate fshear=0.665 by minimizing each of the error metrics when evaluating EFcontrail from the trajectory- and grid-based CoCiP (described in Sect. 4).
3.4 Monte Carlo simulation
The grid-based CoCiP can perform Monte Carlo simulations to produce a range of EFcontrail estimates for each grid cell. Here, we utilize this capability to demonstrate how uncertainties in contrail forecasts can be integrated into flight planning (Sect. 5.3). We note that the uncertainties in the simulated EFcontrail can arise from multiple independent sources, including meteorological inputs provided by NWP models, aircraft performance and emission estimates, contrail model simplifications, parametric RF model fitted to the libRadtran radiative transfer package, and potentially other unidentified factors (Low et al., 2025; Platt et al., 2024; Schumann et al., 2021; Teoh et al., 2020a, 2024a). While Platt et al. (2024) evaluate various uncertainty sources affecting EFcontrail in an earlier implementation of the grid-based CoCiP, the Monte Carlo simulations in this study focus only on uncertainties related to meteorological inputs and the grid-based model simplifications (i.e. aircraft-engine groups and treatment of α) as a proof of concept. Future updates to the grid-based CoCiP will incorporate additional uncertainty sources to improve the model's robustness.
We account for multi-collinearity among different aircraft performance parameters (i.e. VTAS, M, , η, and nvPM EIn) by constructing a 5D empirical multivariate distribution for each aircraft-engine group. Figure 1 illustrates an example of the relationship between two (M and nvPM EIn) of these five variables. These distributions are derived using flight waypoints during the cruise phase of flight (i.e. above 25 000 ft, equivalent to 7620 m, and zero vertical climb rate) from the 2019 Global Aviation emissions Inventory based on the Automatic Dependent Surveillance–Broadcast (ADS-B) (GAIA) (Teoh et al., 2024b). Our Monte Carlo approach consists of 100 global simulations, with each of the ERA5 10-member ensembles fixed for 10 consecutive simulation runs. Within each set of 10 simulation runs using the same ensemble member, the aircraft performance parameters (i.e. VTAS, M, , η, and nvPM EIn) at different altitudes are sampled from the 5D empirical multivariate distribution, and α is sampled from a uniform distribution that ranges between 0 and 360°. This setup allows the 10 ensemble members to account for meteorological uncertainties, while the 10 independent simulations within each ensemble capture variabilities in aircraft performance and α, resulting in a total of 100 simulations. We use these outputs to quantify the probabilities of forming persistent warming and cooling contrails for each grid cell.
Here, we use both the trajectory-based and the nominal grid-based CoCiP to simulate EFcontrail from historical flight trajectories provided by GAIA (Teoh et al., 2024b). We evaluate the agreement between both models and explore the trade-off between the model agreement and model simplification, i.e. formulating the grid-based CoCiP with a smaller number of aircraft-engine groups (N) as discussed in Sect. 3.1. To achieve this, we classify the most commonly used passenger aircraft-engine types into groups of between 1 (no differentiation between aircraft-engine types) and 12 based on their aircraft mass and nvPM EIn (see Tables 2 and 3, and Appendix A4). We then filter the GAIA dataset to only include the 43 aircraft-engine types covered in Table 2 and randomly sample 1 d per week throughout the entire year of 2019. We extract flight waypoint data within each day and simulate EFcontrail using both the trajectory-based () and the grid-based CoCiP ().
Our goal in this analysis is not to validate grid-based CoCiP in an absolute sense but to demonstrate that the grid-based CoCiP can provide sufficiently accurate representations of the trajectory-based CoCiP. We recognize the critical importance of validating both CoCiP variants against independent observations, which is an active area of ongoing research.
4.1 Metrics
The agreement between and is assessed using five distinct approaches. Together, these approaches are aimed at quantifying both the pointwise errors and the fleet-aggregated errors. We note that these metrics are predominantly biased towards evaluating the model's ability to correctly predict strongly warming contrails rather than all contrails, which is consistent with existing proposals that aim to target the 2 %–3 % of flights that are responsible for 80 % of the global annual EFcontrail (Teoh et al., 2020a, b, 2024a; Wilhelm et al., 2021).
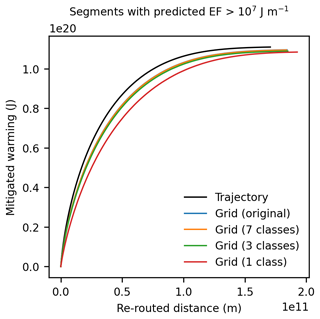
Figure 2Performance curves for the trajectory-based CoCiP (black line) and the grid-based CoCiP when it is configured using the exact/original aircraft-engine types (i.e. the same as the trajectory-based CoCiP; blue line) and with N=7 (orange line), N=3 (green line), and N=1 (red line) aircraft-engine groups respectively. Further methodological information used to construct these performance curves can be found in Appendix A5.
Pointwise errors are quantified using three metrics including the false negative rate, that is, ; the false alarm rate
; and the modified mean absolute log error (modified MALE). The false negative and false alarm rates serve to evaluate the accuracy of the grid-based CoCiP in identifying the location of moderately and strongly warming contrails, which are assumed to be those with an EFthreshold of 1×10⁷ J m−1 (around the 50th percentile) and 5×10⁸ J m−1 (80th percentile) respectively (Teoh et al., 2024a). In addition, the modified MALE measures the average relative error between and at each flight segment while minimizing the impact of prediction errors in segments with a weak contrail climate forcing (i.e. EFcontrail<107 J m−1).
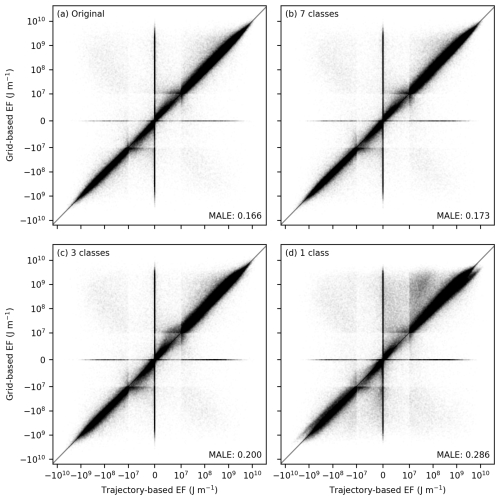
Figure 3Pointwise errors between and when the grid-based CoCiP is configured (a) using the exact/original aircraft-engine types (i.e. the same as the trajectory-based CoCiP) and with (b) N=7, (c) N=3, and (d) N=1 aircraft-engine groups respectively. Each panel contains 107 randomly sampled flight waypoints. The axes use a logarithmic scale for J m−1 and a linear scale between 10−7 and 107 J m−1. For both axes, the box-like structures observed around 10−7 and 107 J m−1 arise from the transition between the linear and the logarithmic scale.
Fleet-aggregated errors are evaluated using the weighted Kendall rank correlation coefficient (τw), which assesses the grid-based CoCiP's capability to correctly rank flight segments by their magnitude of . We additionally use two custom performance curve metrics that evaluate the deterioration in contrail mitigation potential when interventions are informed by imperfect predictions () (Platt et al., 2024). The performance curves are constructed by first sorting the flight segments based on an estimate of their EFcontrail () and then plotting their cumulative EFcontrail as a function of the cumulative flight distance flown (L), shown in Fig. 2. This is equivalent to a curve showing the reduction in EFcontrail as a function of L, with interventions being prioritized based on an estimate of EFcontrail and assuming that the contrail mitigation at the flight segment is successful (EFcontrail=0). The cumulative EFcontrail increases the most quickly with the cumulative L if EFcontrail is based on perfect information (i.e. ) and less quickly if EFcontrail estimates (i.e. ) contain errors. We use these performance curves to quantify the (i) change in initial mitigation rate (i.e. the reduced effectiveness in mitigating flight segments with the most strongly warming contrails), which is estimated from the gradient of a secant line over the first 5 % of the cumulative EFcontrail (m5) and expressed as a ratio, , and (ii) change in flight segment ratio, , which quantifies the additional flight distance where interventions have to be applied to mitigate 80 % of the total EFcontrail. A detailed description of each metric can be found in Appendix A5.
Table 4Summary of the different performance metrics used to evaluate the agreement between the grid-based CoCiP with different configurations of aircraft-engine groups (N) relative to the trajectory-based CoCiP. Further information on these metrics can be found in Sect. 4.1 and Appendix A5.

a This indicates the modified mean absolute log error (modified MALE), where a value of zero indicates perfect agreement in the magnitude of EFcontrail between the trajectory-based and grid-based CoCiP, while larger values are indicative of larger relative errors. The modified MALE can be converted to a percentage relative error using the following formula: . A value of 1 implies that, on average, is off by 1 order of magnitude.
b The weighted Kendall rank correlation coefficient, (τw), where τw=1 indicates a perfect agreement between the rankings of and , τw=0 indicates a completely random relationship, and indicates a perfect disagreement.
c The mean percentage error across all performance metrics when compared with the grid-based CoCiP without any aircraft-engine configuration, visualized in Fig. A8.
4.2 Model comparison
Table 4 summarizes the performance metrics when comparing the model agreement between the trajectory-based CoCiP and various configurations of the grid-based CoCiP, i.e. using the original aircraft-engine type for each flight as in the trajectory-based CoCiP and with different aircraft-engine groupings ().
For the original aircraft-engine group, the false negative and false alarm rates are 3.2 % and 10.4 % respectively when evaluated against moderately warming contrails (EF J m−1) and 6.0 % and 17.7 % respectively when assessed against strongly warming contrails (EF J m−1). The modified MALE of 0.166 corresponds to a 47 % relative error between and . These pointwise errors (shown in Fig. 3a) are independent of the aircraft-engine grouping and primarily arise from (i) the assumption of an infinitesimal contrail segment in the grid-based CoCiP compared to a finite segment in the trajectory-based CoCiP, where the can be zero if the next flight waypoint does not form a persistent contrail; (ii) the use of nominal VTAS and aircraft mass in the grid-based CoCiP, which causes differences in the downward displacement and survivability of the contrail during the wake-vortex phase; and (iii) the calibrated fshear (see Eq. 6), which affects the , contrail diffusivity, coverage area, lifetime, and EFcontrail. For the fleet-aggregated errors, the τw of 0.821 demonstrates a strong correlation between the rankings of and . The change in initial mitigation rate of 0.816 suggests an 18 % reduction in the effectiveness of mitigating the most strongly warming contrails with the grid-based CoCiP, and a change in the flight segment ratio of 1.156 indicates that interventions must be applied to an additional 16 % of the total flight distance flown to mitigate 80 % of EFcontrail.
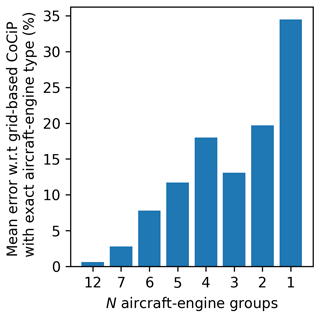
Using different aircraft-engine groupings () rather than the original aircraft-engine type introduces additional sources of error between the trajectory-based and grid-based CoCiP (Table 4 and Figs. 2, 3, and A8). The mean error across different performance metrics for N=12 and N=7 are around 0.6 % and 2.8 % relative to the configuration without any aircraft-engine grouping, but the degradation rate generally starts to increase when N<7 (Fig. A8). Specifically, the mean error for N=1 (34.5 %) is around an order of magnitude larger than that of N=7 (2.8 %), with these errors primarily arising from overestimates in EFcontrail from aircraft-engine types with low nvPM EIn (see top-right quadrant in Fig. 3d). Notably, a reduction from N=4 to N=3 results in an improvement in mean error across the performance metrics from 18.0 % to 13.1 %. This improvement can be attributed to the fact that N=3 categorizes the aircraft-engine types solely based on their nvPM EIn, whereas N=4 categorized the aircraft-engine types into two nvPM and two aircraft mass categories, thereby suggesting that the nvPM EIn is a stronger predictor of EFcontrail than aircraft mass.
Based on these results, we draw three key insights to inform the selection of an optimal N: (i) the model agreement between the trajectory-based and grid-based CoCiP is comparable for N=12 and N=7, which suggests that there may not be a significant advantage to running the grid-based CoCiP with N=12 rather than N=7; (ii) N=3, which categorizes the aircraft-engine types solely based on nvPM EIn, offers a reasonable trade-off between model accuracy and operational complexity; and (iii) N=1 significantly degrades the accuracy of the grid-based CoCiP and is not recommended for operational use.
Here, we run a 2019 full-year grid-based global contrail simulation with N=3 and reanalysis meteorology to quantify the annual statistics and spatial trends of strongly warming and cooling contrails (Sect. 5.1). We then introduce two different approaches for integrating the grid-based CoCiP into flight trajectory optimization (Sect. 5.2), followed by proposing two strategies to account for uncertainties within the decision-making process of contrail mitigation to increase the probability of achieving a net climate benefit (Sect. 5.3).
5.1 Global contrail simulation
The grid-based CoCiP produces a global map of the EFcontrail per flight distance for each of the three aircraft-engine group that were categorized based on their nvPM EIn (Fig. 4 and Sect. 4.2). A comparison between the nominal and high-nvPM aircraft-engine group (Fig. 4b) showed notable differences in the magnitude of EFcontrail, where the global mean EFcontrail per flight distance for the high-nvPM aircraft-engine group (10×108 J m−1) is around 2 times larger than the nominal nvPM group (5.5×10⁸ J m−1). These groups also show differences in the sign of EFcontrail, especially at around 25–60° S and 60–150° E, where the number of grid cells with cooling contrails (EFcontrail<0) in the high-nvPM group is 18 % higher than in the nominal nvPM group. These trends can be linked to the relationship between the nvPM EIn and contrail lifetime, where a larger nvPM EIn generally leads to a higher initial contrail ice crystal number, which, in turn, lowers the ice crystal sizes and their sedimentation rate, thereby prolonging the contrail lifetime, and increase the magnitude and variability in EFcontrail (Teoh et al., 2022a). Although the global mean EFcontrail for the low-nvPM group (0.15×10⁸ J m−1) is around 1 order of magnitude smaller than the nominal nvPM group (5.5×10⁸ J m−1) (Fig. 4c), we note that EFcontrail estimates from the low-nvPM group are likely underestimated because CoCiP does not currently account for the potential activation of volatile particulate matter and ambient aerosols to form contrail ice crystals in the “soot-poor” regime (nvPM EIn<1013 kg−1) (Kärcher and Yu, 2009; Yu et al., 2024).
Unlike a map of the ISSR coverage area, which identifies regions likely to form persistent contrails, the 4D EFcontrail per flight distance accounts for the intensity of contrail-induced warming and allows for more targeted mitigation. For example, in 2019, the global annual mean percentage of airspace volumes forecasted with strongly warming contrails was 0.44 % for EFcontrail>95th percentile (1.5×10⁹ J m−1), and 1.6 % for EFcontrail>80th percentile (5.0×10⁸ J m−1). These values are up to 91 % smaller than the airspace volumes with net warming contrails (4.8 % for EFcontrail>0) and up to 93 % smaller than the ISSR coverage area (6.6 % for EFcontrail≠0) (Fig. 5a). Thus, using this approach to navigational contrail avoidance could minimize potential disruptions to air traffic management and airspace capacity as it focuses only on the most warming contrails rather than avoiding all persistent contrails.
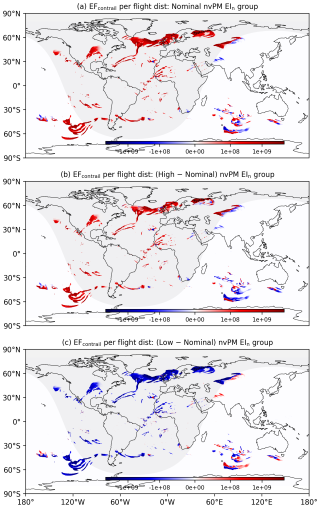
Figure 4The (a) absolute EFcontrail per flight distance for the aircraft-engine group with nominal nvPM and the absolute difference in EFcontrail per flight distance between the (b) nominal and high-nvPM aircraft-engine group and (c) nominal and low-nvPM aircraft-engine group. The global contrail climate forcings shown here are simulated at FL360 (10 973 m) on 7 January 2019 at 03:00:00 UTC. The basemap was plotted using Cartopy 0.22.0 and sourced from Natural Earth; it is licensed under public domain.
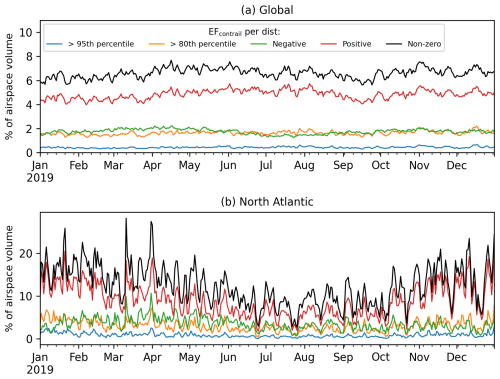
Figure 5Daily means of the percentage of airspace volume (a) globally and (b) over the North Atlantic region (between 40 and 63° N and 70 and 5° W) in 2019, where the EFcontrail per flight distance is (i) greater than 1.54×10⁹ J m−1 (95th percentile; blue lines), (ii) greater than 5.0×10⁸ J m−1 (80th percentile; orange lines), (iii) negative (i.e. cooling contrails; green lines), (iv) positive (i.e. warming contrails; red lines), and (v) non-zero (i.e. all contrails; black lines).
We also use the 2019 grid-based global contrail simulation to quantify the global annual mean EFcontrail per flight distance (Fig. 6) and annual occurrence of strongly warming (EF J m−1, 95th percentile) and cooling contrails (EF J m−1, 5th percentile) at different altitudes (Fig. 7). The grid-based CoCiP's predictions of persistent contrail occurrence and spatial trends in EFcontrail are generally consistent with earlier global contrail simulation studies (Bier and Burkhardt, 2022; Gettelman et al., 2021; Teoh et al., 2024a). For example, the absence of persistent contrails below 35 000 ft (10 668 m) in the tropics (Fig. 6a and b) is due to its higher relative ambient temperatures and tropopause height (Santer et al., 2003), while the lower relative EFcontrail per flight distance in the subtropics (i.e. China, India, Middle East, and Australia, as shown in Fig. 6c) is associated with a lower persistent contrail formation due to the Hadley circulation (Teoh et al., 2024a). Diurnal and seasonal effects contribute to a higher prevalence of both strongly warming and cooling contrails at higher latitudes due to the significant seasonal variations in daylight hours (Fig. 7a to d). Background radiation fields, such as the solar direct radiation (SDR), RSR, OLR, and albedo (RSR/SDR), are mainly influenced by latitude, natural cirrus occurrence, and surface temperature and reflectance. In general, strongly warming contrails are more likely in regions with (i) high albedo (e.g. poles, Siberia, and areas with high natural cirrus coverage), (ii) high OLR (e.g. tropics and the Sahara Desert), and (iii) low SDR (e.g. wintertime) (Figs. 6 and 7). Condition (i) limits the contrail SW RF because a higher proportion of incoming solar radiation is already reflected without contrails, while condition (ii) drives the contrail LW RF, especially in cloud-free conditions. In contrast, regions and times with a larger relative SDR-to-OLR ratio (e.g. southeast Asia, springtime at high latitudes) are associated with strongly cooling contrails (Fig. 7b, d, and f). Finally, global atmospheric circulation patterns can also influence the humidity transport underlying ISSR occurrence (i.e. Hadley circulation and the North Atlantic warm conveyor belt) and preferential advection of persistent contrails to specific regions (Teoh et al., 2024a; Voigt et al., 2017; Wolf et al., 2024).
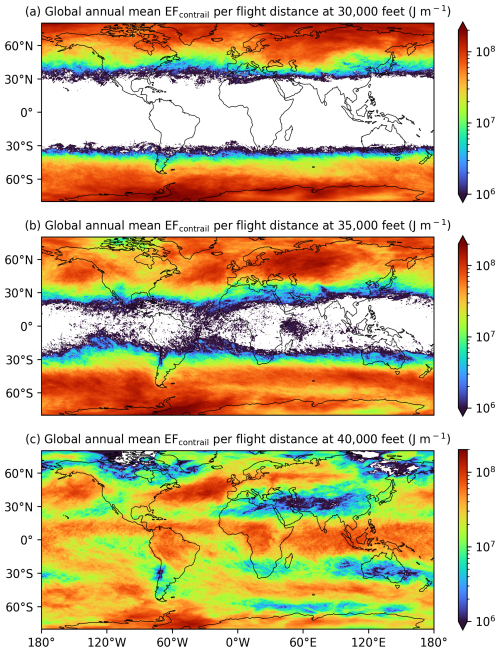
Figure 6The 2019 global annual mean EFcontrail per flight distance from the grid-based CoCiP at an altitude of (a) 30 000 ft (9144 m); (b) 35 000 ft (10 668 m); and (c) 40 000 ft (12 192 m) for the nominal nvPM aircraft-engine group. The basemap was plotted using Cartopy 0.22.0 and sourced from Natural Earth; it is licensed under public domain.
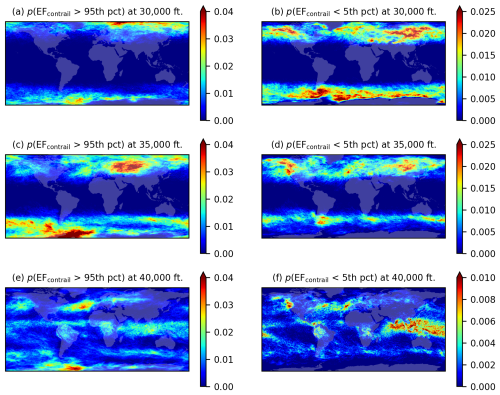
Figure 7The 2019 annual probability of the EFcontrail per flight distance at each grid cell being above the 95th percentile (1.54×10⁹ J m−1) and below the 5th percentile ( J m−1) at 30 000 ft (9144 m) (a, b), 35 000 ft (10 668 m) (c, d), and 40 000 ft (12 192 m) (e, f). The basemap was plotted using Cartopy 0.22.0 and sourced from Natural Earth; it is licensed under public domain.
5.2 Flight trajectory optimization
The contrail climate forcing estimates from the grid-based CoCiP can be applied within the context of flight trajectory optimization. We demonstrate two possible optimization strategies using an in-house flight trajectory optimizer (described in Appendix A6) to optimize the trajectory of an actual transatlantic flight that was flown by a B77W from New York to Cairo on 7 January 2019.
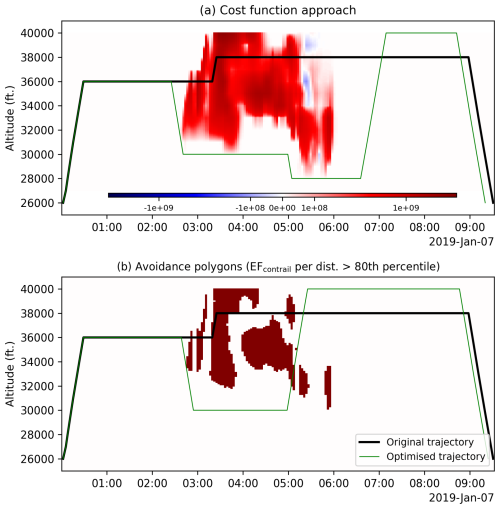
Figure 8Application of the grid-based CoCiP in flight trajectory optimization, where the (a) 4D EFcontrail per flight distance flown is integrated as an additional cost component (see Eq. 8) or (b) airspace volumes that are expected to form strongly warming contrails, i.e. EFcontrail>80th percentile (5×10⁸ J m−1) highlighted in red, are avoided. For both optimization methods, the original and optimized flight trajectories are depicted by the black and green lines respectively, and the optimized trajectories are not checked for real-world air traffic management constraints.
5.2.1 Cost-based optimization
The 4D EFcontrail per flight distance fields (shown in Fig. 4a) takes the form of a standard weather forecast field and can be incorporated into the flight trajectory optimizer as an additional cost factor alongside existing cost parameters, such as fuel consumption and overflight charges (Martin Frias et al., 2024). To do so, flight planners can convert EFcontrail to a CO2 mass equivalent () (Teoh et al., 2024a):
where the global mean ERF RF ratio of 0.42 is used as a best estimate to convert the RF to an ERF estimate (Lee et al., 2021). Given the significant uncertainties in the global mean ERF RF ratio (ranging from 0.21 to 0.59 based on four global climate model studies) (Bickel, 2023; Bickel et al., 2019; Ponater et al., 2005; Rap et al., 2010) and its spatiotemporal variabilities, flight planners can choose the lower bound to conservatively incorporate the contrail climate effects. is the CO2 absolute global warming potential over a selected time horizon (TH) ( J m−2 per kg CO2 for 20 years or J m−2 per kg CO2 for 100 years) (Gaillot et al., 2023), and SEarth is the Earth surface area (5.101×10¹⁴ m2). If necessary, can be further converted to a monetary value by multiplying it with the social cost of carbon (), which we assume to be USD 185 (USD 44–413, 5 %–95 % range per tonne of CO2 (Rennert et al., 2022). Here, we apply Eq. (8) in the trajectory optimizer to minimize the total CO2 mass-equivalent emissions (), where is estimated using ( J m−2 per kg CO2) and rounding the results to the nearest tonne to align with the precision of the input parameters. We note that this is only one example of deriving the cost function and that many other metrics are possible. The task of defining an appropriate cost function to assess trade-offs between contrail and CO2 climate forcing remains a critically important topic for future research.
Using this cost-based approach, the flight trajectory optimizer successfully lowered the by 64 %, from 597 t (203 t of CO2 emitted from the total fuel consumed with an additional 394 t from contrails) in the original trajectory to 213 t (213 t +0 t) in the optimized trajectory. In simpler terms, more than 99.9 % of the total EFcontrail (1.3×10¹⁵ J in the original trajectory vs. 1.0×10⁸ J in the optimized trajectory) is mitigated at the expense of a 5 % increase in total fuel consumption. This is achieved by (i) lowering the cruise altitude from 36 000 ft (10 973 m) to 30 000 ft (9144 m) between 02:45 and 05:00 UTC, followed by (ii) a further descent to 28 000 ft (8534 m) between 05:00 and 06:30 UTC to avoid regions forecasted with persistent warming contrails, and then (iii) climbing to a final cruise altitude of 40 000 ft (12 192 m) at around 06:30 UTC (Fig. 8a).
5.2.2 Polygon-based optimization
Alternatively, the 4D EFcontrail per flight distance can also be used to construct contrail-avoidance polygons to identify regions forecast with strongly warming contrails (Fig. 9a). These regions can be defined by when the EFcontrail per flight distance at a grid cell exceeds a user-defined threshold, e.g. the 80th percentile (5.0×10⁸ J m−1) (Teoh et al., 2024a). These polygons can then be integrated into existing flight planning software (Martin Frias et al., 2024) akin to weather-avoidance polygons which restrict flights from traversing in airspace volumes that are forecast with turbulence and/or thunderstorms (Rubnich and Delaura, 2010).
Using the 80th percentile contrail-avoidance polygons, the optimizer recommends a trajectory that reduces by 60 %, from 597 t (203 t of CO2 emitted from the total fuel consumed with an additional 394 t from contrails) in the original trajectory to 236 t (207+28 t) in the optimized trajectory. Put differently, 93 % of the total EFcontrail (1.3×10¹⁵ J in the original trajectory vs. 9.6×10¹³ J in the optimized trajectory) is avoided with a fuel penalty of 2 %. This approach involves lowering the cruise altitude from 36 000 ft (10 973 m) to 30 000 ft (9144 m) between 03:00 and 05:00 UTC, followed by a step climb to 40 000 ft (12 192 m) at 05:00 UTC to exploit a gap in the contrail-avoidance polygon (Fig. 8b).
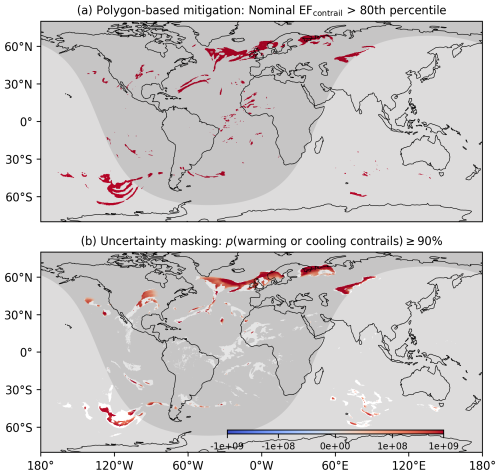
Figure 9Application of the simulated EFcontrail per flight distance for contrail mitigation, where flight planners can (a) construct polygons and avoid flying in regions forecast with strongly warming contrails (i.e. grid cells where the EFcontrail per flight distance is greater than the 80th percentile; 5.0×10⁸ J m−1) and/or (b) account for uncertainties in the simulated contrail climate forcing by masking and disregarding grid cells (shown in white) when their probability of forming net warming (or cooling) contrails is less than 90 %. The global contrail climate forcings shown here are from the nominal nvPM aircraft-engine group and simulated at FL360 (10 973 m) on 7 January 2019 at 03:00:00 UTC. For panel (a), the impact of dt on regions forecast with strongly warming contrails are evaluated in Appendix A2. The basemap was plotted using Cartopy 0.22.0 and sourced from Natural Earth; it is licensed under public domain.
5.3 Decision-making under uncertainty
Here, we propose two strategies as a proof of concept to incorporate contrail forecast uncertainties in the decision-making process of contrail mitigation. Our goal of providing a range of EFcontrail estimates is to increase the probability of achieving a net climate benefit and minimize the unintended consequences associated with increased fuel consumption and long-lived CO2 emissions.
The first strategy involves applying an additional constraint to the cost-based or the polygon-based approach (Sect. 5.2), excluding grid cells where their probability of forming net warming contrails is below a user-defined threshold (e.g. 90 %, as shown in Fig. 9b). This approach would ensure that mitigation actions are more likely to be focused on areas with a high probability of forming net warming contrails. A visual examination of the uncertainties in the simulated EFcontrail at a specific point in time reveals three key features: (i) EFcontrail uncertainties are generally larger at the edges and localized pockets of ISSRs, (ii) the sign of EFcontrail tends to be more stable on a synoptic scale (i.e. ISSRs with horizontal coverages of ∼1000 km), and (iii) persistent contrails formed at night and in winter are more likely to have a lower relative uncertainty compared to those formed during daytime and in the summer (i.e. Northern vs. Southern Hemisphere, as shown in Fig. 9b). These results suggest that contrail interventions may be more effective when implemented at a regional level rather than targeting individual flights as contrail uncertainties in specific locations and time may be lower than in other areas.
Secondly, flight planners and policymakers could implement additional constraints to ensure that diversions are performed only under specific circumstances, such as (i) when there are no fuel penalties, which may be possible if the original cruise altitude and/or VTAS were suboptimal, or if the alternative trajectory offers more favourable wind conditions (Poll, 2017), or (ii) when the selected CO2-equivalence metric from the alternative trajectory exceeds a predefined reduction threshold compared to the original route, thereby providing some margin of error to account for contrail uncertainties (Borella et al., 2024). Notably, the transition of airspace surveillance towards satellite-based systems, such as the Automatic Dependent Surveillance–Broadcast (ADS-B) standard, can improve airspace capacity and flexibility, thus increasing the likelihood of fulfilling these constraints (Molloy et al., 2022).
The global annual mean contrail climate forcing, which represents the largest component of aviation's overall climate forcing (Lee et al., 2021), underscores the need for heightened attention and priority from stakeholders in formulating effective mitigation solutions. As only around 2 %–3 % of all flights are responsible for 80 % of the global annual EFcontrail, one proposed solution is to re-route affected flights to avoid regions forecast with strongly warming contrails.
To implement this mitigation strategy in the real world, we developed a tool that uses reanalysis or forecast meteorology to generate global maps of persistent contrail climate forcing within the time frame necessary for flight planning and operational deployment. This is achieved by extending the existing trajectory-based CoCiP, which simulates contrails formed along flight trajectories, to a grid-based approach, which initializes an infinitesimal contrail segment at every point in a spatiotemporal grid and simulates the contrail climate forcing over its life cycle. The model outputs of the grid-based CoCiP (i.e. the 5D EFcontrail per flight distance with dimensions, aircraft-engine groups) are similar to the concept of climate change functions (CCFs) introduced in previous studies (Frömming et al., 2021; Grewe et al., 2014) and provided in a format that is consistent with standard weather and turbulence forecasts so it can be readily integrated into existing flight planning software.
Our comparison of EFcontrail estimates between the grid-based and the trajectory-based CoCiP demonstrates a good agreement for use as a prototype contrail forecasting tool (Table 4). When the grid-based CoCiP is configured with N≥7, the mean error across all performance metrics is up to 3 % when compared with the configuration without any aircraft-engine grouping. Alternatively, a configuration of N=3 for the grid-based CoCiP provides operational simplicity for end users, but this comes at an expense of increasing the mean error across all metrics to 13 %. While the model simplifications required for the grid-based CoCiP inevitably lead to additional uncertainties in the absolute EFcontrail values, we consider their relative spatiotemporal variabilities to be more relevant for the study's objective of identifying regions with strongly warming contrails (i.e. EFcontrail>80th or 95th percentile) for flight trajectory optimization (Grewe et al., 2014).
Several strategies are proposed to utilize the grid-based CoCiP for contrail mitigation while accounting for uncertainties in the decision-making framework. Contrail forecasts can be integrated into flight planning software in two different ways: (i) using a cost-based approach, where EFcontrail is monetized and included as an additional cost component within their flight trajectory optimizer, or (ii) adopting a polygon-based approach, where weather-avoidance polygons are defined to avoid traversing in airspace expected to produce strongly warming contrails. The grid-based CoCiP can also be set up in a Monte Carlo formulation to estimate the probability of each grid cell forming net warming contrails (EFcontrail>0), which, in turn, enables mitigation efforts to be focused on grid cells with a high probability of forming net warming contrails (Fig. 9b). The probability of achieving a net climate benefit can also be maximized when diversions are only targeted to flights where their alternative trajectory either avoids a fuel penalty or achieves a reduction in the user-selected CO2-equivalence metric beyond a predefined margin of safety.
We acknowledge that the widespread adoption of our contrail forecasting tool in real-world operations depends on a successful validation of its predictions against independent observations. The ongoing focus on observational validation for both CoCiP variants underscores the active efforts in this critical area. While multiplying EFcontrail by the ERF RF ratio (see Eq. 8) was used in this study to approximate and account for the rapid atmospheric adjustments directly caused by the contrail (Bickel et al., 2019), our future work aims to establish a stronger connection between this computationally efficient EFcontrail calculation and the more rigorous CCF calculations (Frömming et al., 2021). Future versions of the grid-based CoCiP are also expected to be prioritized to bring us towards (i) evaluating and accounting for different uncertainty sources (e.g. global humidity correction, aircraft performance estimates, engine particle emissions and ice nucleation efficacy, CoCiP model parameters, and parametric RF model) to produce a more comprehensive probabilistic forecast of the grid-based CoCiP (Platt et al., 2024); (ii) incorporating contrail predictions from other models, such as Google's artificial-intelligence-based predictions (Elkin and Sanekommu, 2023) and/or algorithmic climate change functions (Dietmüller et al., 2023), and only performing flight diversions in regions where there are inter-model agreements; (iii) improving the contrail forecast estimates for aircraft-engine groups that operate in the soot-poor regime by accounting for the potential activation of volatile particulate matter and ambient aerosols in forming contrail ice crystals (Kärcher et al., 2015; Kärcher and Yu, 2009; Yu et al., 2024); and (iv) utilizing real-time observations from ground-based cameras and/or satellite images (Geraedts et al., 2024; Low et al., 2025) to improve forecast accuracy and verify the outcome of any contrail mitigation actions.
A1 Versioning of trajectory-based CoCiP
The original trajectory-based contrail cirrus prediction model (CoCiP), versioned as CoCiP (2012), was developed by Ulrich Schumann at the German Aerospace Center (DLR) using the Fortran programming language (Schumann, 2012; Schumann et al., 2012b). Figure A1 summarizes the steps and input parameters needed to run the trajectory-based CoCiP.
A1.1 CoCiP versioning and improvements
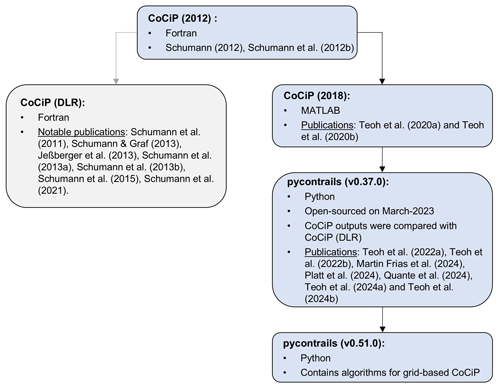
Since its first publication, CoCiP has undergone continuous refinement in its contrail simulation workflow and treatment of input parameters. Figure A2 provides an overview of the different versions of CoCiP and its evolution. Subsequent versions that are used by its creator, Ulrich Schumann, are versioned as CoCiP (DLR) and have been extensively used in multiple studies (Jeßberger et al., 2013; Schumann et al., 2011, 2013a, b, 2015, 2017, 2021; Schumann and Graf, 2013; Schumann and Heymsfield, 2017). CoCiP (DLR) incorporates additional features such as
-
radiative heating effects on the contrail plume (Schumann et al., 2010),
-
humidity exchange between contrails and the background air (Schumann et al., 2015), and
-
change in contrail radiative forcing due to contrail–contrail overlapping (Schumann et al., 2021).
In 2018, a copy of CoCiP (2012) was provided for cooperation to Imperial College by Ulrich Schumann and DLR. CoCiP (2012) was re-coded in MATLAB by Imperial College with support from Ulrich Schumann. This version of CoCiP is designated as CoCiP (2018). In 2022, CoCiP (2018) was re-coded to Python by Breakthrough Energy and hosted on GitHub via the pycontrails library repository (Shapiro et al., 2023). This CoCiP implementation is referred to as pycontrails (v0.37.0) and was made open-source in March 2023. The pycontrails library standardized input and output data structures to expand access to the CoCiP model. The different structures include flight trajectories (pycontrails.Flight), meteorology (pycontrails.MetDataset), fuel properties (pycontrails.Fuel), and aircraft performance and emission models (pycontrails.Model). The CoCiP model implemented in pycontrails also features several improvements relative to CoCiP (2018), including
-
modelling the radiative heating effects on the contrail plume, identical to the workflow that has already been implemented in CoCiP (DLR) (Schumann et al., 2010; Schumann and Graf, 2013), and
-
modelling the nvPM activation rate to form contrail ice crystals (factivation), which now depends on the difference between the ambient temperature and SAC threshold temperature (Bräuer et al., 2021) and replaces the simplifying assumption that factivation=1 at each flight waypoint.
The CoCiP model outputs from pycontrails (v0.37.0) were evaluated against those from CoCiP (DLR), revealing consistent results. The pycontrails repository is regularly updated, with the version used in this study being v0.51.0 (Shapiro et al., 2024). Detailed documentation on the specific changes made between each version of pycontrails can be found in the change log of Shapiro et al. (2024). Notably, several updates have also been applied to the trajectory-based CoCiP, including
-
implementing a parameterized model of the ice crystal survival fraction during the wake-vortex phase developed based on outputs from large-eddy simulations (Unterstrasser, 2016) and
-
incorporating the contrail–contrail overlapping effects on the contrail radiative forcing (Teoh et al., 2024a) with minor modifications relative to the approach of Schumann et al. (2021).
A1.2 Publications using CoCiP
Initial results of the CoCiP (2012) include comparisons to satellite and airborne lidar remote sensing observations as well as comparisons to exhaust and contrail in situ measurements (Schumann, 2010; Schumann and Wirth, 2009; Voigt et al., 2010). The concept of contrail energy forcing (EFcontrail), which represents the cumulative contrail climate forcing over its lifetime, and its application to flight trajectory optimization were first introduced in Schumann et al. (2011). The first application of a gridded CoCiP approach was demonstrated in Schumann et al. (2012a). Additionally, CoCiP (2012) was applied alongside 8 years of METEOSAT cirrus and outgoing longwave radiation observations to derive the contrail longwave radiative forcing (RF) over the North and South Atlantic (Schumann and Graf, 2013). These results were then extrapolated through CoCiP simulations to estimate the global contrail shortwave and longwave RF, the results of which were used to inform the Intergovernmental Panel on Climate Change (IPCC) report (Boucher et al., 2013).
CoCiP (2018) was used in two separate studies to simulate contrails over the Japanese airspace (Teoh et al., 2020a, b), which included the following changes to the simulation workflow relative to CoCiP (2012):
-
the incorporation of the fractal aggregate (FA) model, which estimates the non-volatile particulate matter (nvPM) number emission index (EIn) at each flight waypoint based on the engine thrust setting and pressure ratio rather than assuming a constant nvPM EIn (1015 kg−1), and
-
the implementation of a Monte Carlo simulation to propagate uncertainties in the nvPM EIn estimates and meteorology to the simulated contrail properties and climate forcing.
The pycontrails repository has been used in multiple studies to simulate aircraft emissions and contrail climate forcing (Martin Frias et al., 2024; Platt et al., 2024; Quante et al., 2024; Teoh et al., 2022a, b, 2024b, a), with the following improvements to the simulation workflow:
-
The T4/T2 methodology (Teoh et al., 2022a, 2024b), which supersedes the FA model and estimates the aircraft-engine specific nvPM EIn using the reported nvPM emissions profile provided by the ICAO aircraft engine emissions databank (EDB) was utilized (EASA, 2021),
-
The change in contrail formation and properties resulting from the use of sustainable aviation fuel (SAF) was simulated (Teoh et al., 2022b),
-
Corrections were applied to the humidity fields provided by numerical weather predictions (NWP), which ensures that the provided relative humidity with respect to ice (RHi) is more consistent with in situ measurements (Teoh et al., 2022a, 2024a; Wolf et al., 2023b) (see Appendix A3).
-
Additional interpolation methods across the vertical level, such as the log–log and cubic spline interpolation, are supported to account for the non-linear lapse rate of the specific humidity.
-
Additional features in various structures are incorporated in pycontrails (i.e. pycontrails.Flight and pycontrails.MetDataset), and the open-source Poll–Schumann (PS) aircraft performance model is supported (Poll and Schumann, 2020, 2021, 2024).
Since 2023, a revised CoCiP (DLR) has been in the process of implementation into the Icosahedral Nonhydrostatic (ICON) weather model of the German Weather Service (DWD) (Ulrich Schumann, personal communication, 31 May 2024). The pycontrails repository is also currently in use at DLR with modifications to the interpolation scheme (not versioned).
A2 Sensitivity of contrail climate forcing to CoCiP model time step
Previous studies that simulated contrails with CoCiP have used different model time steps (dt) ranging between 5 and 60 min depending on their specific application and available computational resources:
-
Schumann et al. (2015) used a 60 min dt due to (i) CoCiP's coupling with the Community Atmosphere Model (CAM), which operates on a 60 min time step, and (ii) the extensive computational demands of the 20-year global simulations.
-
Regional studies over Japan, Europe, and the North Atlantic used a 30 min dt as these simulations were conducted locally on consumer-grade hardware (Schumann et al., 2021; Teoh et al., 2020a, 2022a).
-
Schumann and Graf (2013) used a 15 min dt to match the time resolution of their air traffic and satellite datasets.
-
Teoh et al. (2024a) used a 5 min dt because the simulation was conducted on the cloud where computational resources were no longer constrained.
In this section, we perform a sensitivity analysis by running the grid-based CoCiP with different dt values of 1, 5, 10, 15, and 30 min and quantify their impact on the estimated EFcontrail. We specifically simulated contrails on 7 January 2019 at 03:00:00 UTC to be consistent with the time period used in the examples in Sect. 5. Figure A3 shows that the magnitude and variance of EFcontrail tend to increase as dt decreases, with the mean EFcontrail per flight distance simulated with a 1 min dt being approximately 24 % larger than those simulated with a 30 min dt. Likewise, the global airspace area forecast with strongly warming contrails (EFcontrail>80th percentile) is 20 % larger at a 1 min dt compared to a 30 min dt (1.60 % vs. 1.33 %, as shown in Fig. A4). The smaller EFcontrail and coverage area at larger dt values, such as 30 min, can be explained by the contrail lifetime ending prematurely. For example, if ambient conditions at the next model time step, (t+30 min), are unfavourable for contrail persistence, EFcontrail between t and (t+30 min) becomes 0 because contrails are no longer present at (t+30 min). In contrast, under the same ambient conditions, a smaller dt of 1 min allows the simulated contrails to persist for a longer time period within the same 30 min window, thereby increasing the overall contrail lifetime and resulting in a larger warming or cooling effect (, as shown in the larger standard deviation in Fig. A3).
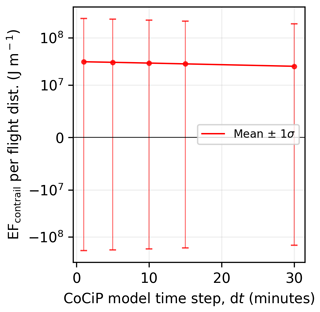
Figure A3Change in the global mean and standard deviation of EFcontrail per flight distance across different CoCiP model time steps (dt). Contrails are simulated globally at FL360 (10 973 m) on 7 January 2019 at 03:00:00, with the nominal nvPM aircraft-engine group. The y axis uses a logarithmic scale for J m−1 and a linear scale between 10−7 and 107 J m−1.
In this study, we chose a 5 min dt to align with Teoh et al. (2024a) as their EFcontrail thresholds (i.e. >80th and 95th percentiles) were used to identify regions that are forecasted to produce strongly warming contrails. While time step error is one of the many sources of errors influencing EFcontrail, our analysis in this section suggests that it is not the most dominant one, especially when compared to the impact of humidity corrections applied to the ERA5 HRES (Teoh et al., 2024a). Since dt is a model parameter, we recommend that users select a dt of 1 or 5 min to minimize its impact as a source of error as smaller dt values are expected to result in convergence of the global airspace area forecast with strongly warming contrails (1.60 % for a 1 min dt vs. 1.58 % for a 5 min dt, as shown in Fig. A4).
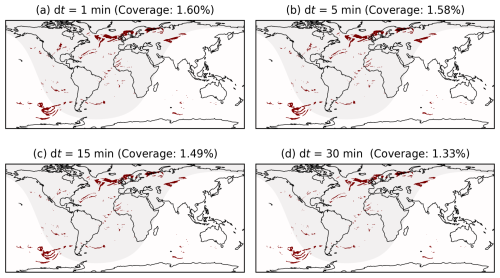
Figure A4Regions forecasted with strongly warming contrails, i.e. EFcontrail per flight distance J m−1 (80th percentile) when simulated with different model time steps (dt) of (a) 1 min, (b) 5 min, (c) 15 min, and (d) 30 min. Contrails are simulated globally at FL360 (10 973 m) on 7 January 2019 at 03:00:00, with the nominal nvPM aircraft-engine group.The basemap was plotted using Cartopy 0.22.0 and sourced from Natural Earth; it is licensed under public domain.
A3 Humidity correction
Two approaches have been used in previous studies to ensure that the RHi distribution provided by the European Centre for Medium Range Weather Forecasts (ECMWF) ERA5 products are consistent with in situ RHi measurements.
Firstly, a global humidity correction developed by Teoh et al. (2024a) attempts to improve the goodness of fit of the ERA5-derived and in situ RHi distribution. It scales the ERA5-derived RHi with the following parametric equations:
where
and
pliq(Tamb) and pice(Tamb) are the saturation pressure of water vapour over liquid water and ice respectively (Sonntag, 1994). aopt and bopt capture the change in tropopause height between 20 and 50° N/S, which aims to account for the latitude effects on the RHi distribution. The model coefficients are re-calibrated based on the specific ERA5 product, with (i) a0=0.06262, a1=0.4589, a2=39.25, a3=0.9522, b0=1.471, b1=0.04431, b2=18.76, and b3=1.433 for the ERA5 HRES reanalysis on pressure levels (Teoh et al., 2024a), or (ii) a0=0.02630, a1=2.2501, a2=36.5494, a3=0.9651, b0=0.4891, b1=4.1827, b2=17.5338, and b3=2.2109 for the ERA5 HRES reanalysis on model levels. The main factor contributing to differences between the two set of coefficients stems from the higher vertical resolution of the ERA5 HRES on model levels relative to those on pressure levels (26 vs. 10 levels between 6300 and 15 000 m).
Secondly, more recent studies corrected the ERA5-derived RHi using a quantile mapping approach (Platt et al., 2024; Wolf et al., 2023b). The quantile mapping approach replicates the in situ RHi distribution by constructing two cumulative density functions (CDFs) based on RHi distributions from the ERA5 and in situ measurements, estimating the quantile value of the ERA5-derived RHi (represented on the y axis of the CDF), and using the quantile values to substitute the ERA5-derived RHi with the in situ RHi values.
The ERA5-corrected RHi from both methodologies (i.e. global humidity correction and quantile mapping) was compared against in situ RHi measurements from the mid-latitude region (30–70° N and 125° W–145° E) (Hofer et al., 2024). These comparisons used the equitable threat score (ETS) metric, where an ETS score of 1 represents perfect agreement between the ERA5-corrected and in situ RHi measurements, an ETS score of 0 suggests a random agreement, and an ETS score below 0 signifies an inverse relationship. The results show that the ETS from the quantile mapping method (0.344) is 21 % higher than the global humidity correction method (0.284) and that the corrected RHi from both methods represent a significant improvement relative to the uncorrected ERA5-derived RHi (0.198). However, we note that these findings are only valid for the mid-latitude region, and further work is required to evaluate both correction methodologies globally. We note that we do not advocate for any specific humidity correction methodology, and a final decision for the operational global contrail forecasting tool will be determined through stakeholder consensus. For the purposes of this paper, we employ the global humidity correction methodology instead of the quantile mapping approach because it was calibrated to account for the latitude effects (see Eqs. A2 and A3), which could be more suitable for a global contrail simulation.
A4 Alternative aircraft type classifications
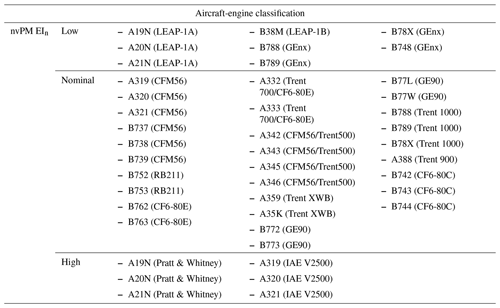
The grid-based CoCiP provides the simulated EFcontrail per flight distance across five dimensions, longitude, latitude, altitude, time, and N unique groups of passenger aircraft-engine types. The fifth dimension is necessary to differentiate between the contrails formed by passenger aircraft-engine types with varying nvPM number emissions and aircraft mass. Generally, a higher N improves the agreement in the simulated EFcontrail between the trajectory-based and the grid-based CoCiP, but this comes at the expense of an increase in computational resources and data storage/transfer requirements. Tables 2 and 3 in the main text classify the most commonly used passenger aircraft-engine types into 12 groups. Here, we propose several alternative aircraft-engine classifications with N ranging between 3 and 7 (groups) to assess the trade-offs between the model performance and computational requirements (see Tables A1 to A5). Additionally, we visualize the range of aircraft mass and nvPM EIn for each aircraft-engine group when they are clustered into 12 groups (Fig. A5 and Table 2), 7 groups (Fig. A6 and Table A1), and 3 groups (Fig. A7 and Table A5) respectively.
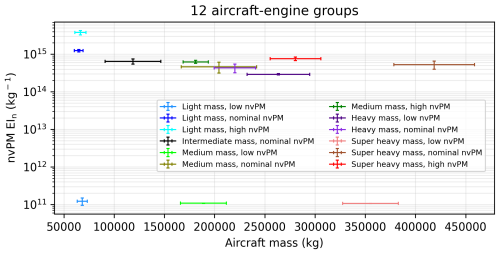
Figure A5Range of aircraft mass and nvPM EIn for each aircraft-engine group when they are clustered into 12 groups. The error bars for each data point represent 1 standard deviation of these values, which are provided by the 2019 Global Aviation emissions Inventory based on ADS-B (GAIA) (Teoh et al., 2024b).
Table A1Classification of the commonly used passenger aircraft-engine types into seven unique groups based on their similarities in aircraft mass and nvPM EIn.
n/a: not applicable
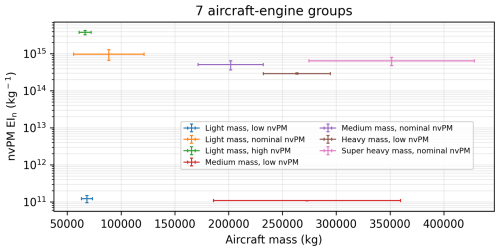
Figure A6Range of aircraft mass and nvPM EIn for each aircraft-engine group when they are clustered into seven groups. The error bars for each data point represent 1 standard deviation of these values, which are provided by the 2019 Global Aviation emissions Inventory based on ADS-B (GAIA) (Teoh et al., 2024b).
Table A2Classification of the commonly used passenger aircraft-engine types into six unique groups based on their similarities in aircraft mass and nvPM EIn.
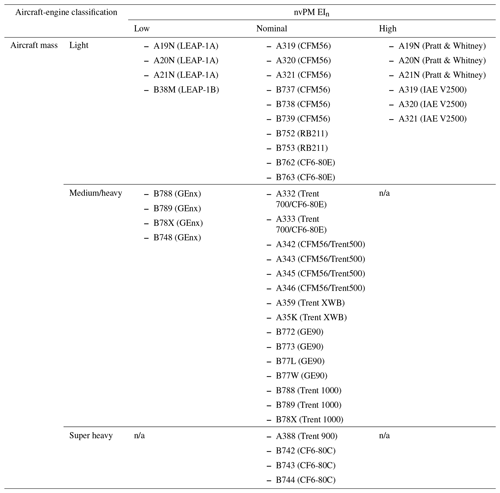
n/a: not applicable
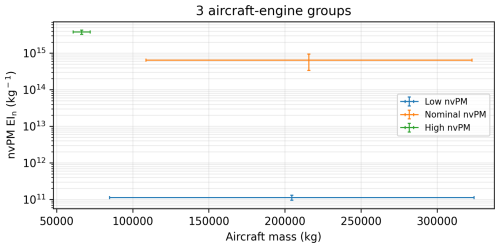
Figure A7Range of aircraft mass and nvPM EIn for each aircraft-engine group when they are clustered into three groups. The error bars for each data point represent 1 standard deviation of these values, which are provided by the 2019 Global Aviation emissions Inventory based on ADS-B (GAIA) (Teoh et al., 2024b).
Table A3Classification of the commonly used passenger aircraft-engine types into five unique groups based on their similarities in aircraft mass and nvPM EIn.
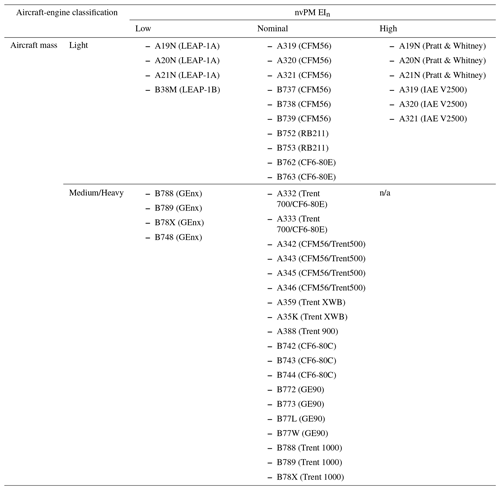
n/a: not applicable
Table A4Classification of the commonly used passenger aircraft-engine types into four unique groups based on their similarities in aircraft mass and nvPM EIn.
A5 Comparison metrics
Section 4 in the main text assesses the agreement in the simulated contrail climate forcing between the trajectory-based () and the grid-based CoCiP () using four different approaches: (i) the false negative and false alarm rate, (ii) the modified mean absolute log error (modified MALE), (iii) the weighted Kendall rank correlation coefficient (τw), and (iv) two custom performance curves (Platt et al., 2024) which evaluate the effectiveness of contrail mitigation when interventions are based on an imperfect prediction of EFcontrail. Approaches (i) and (ii) evaluate the pointwise errors between and at each contrail segment, while approaches (iii) and (iv) assess the model agreement at the fleet-aggregated level. Here, we provide a detailed description of approaches (ii), (iii), and (iv) and discuss the rationale behind their inclusion.
Firstly, the modified MALE describes the relative errors in the magnitude of EFcontrail at each flight segment and is calculated based on the actual (Ftrue) and predicted (Fpredicted) EFcontrail:
where
N represents the total number of data points in the sample, the subscript x denotes the true or predicted EFcontrail, sgn(Fx,i) is the sign of Fx,i (1 or −1), and Fmin is set to 107 J m−1. The modified MALE calculates the average errors between and at the flight waypoint level with a focus on accurately predicting moderately and strongly warming and cooling contrail segments. It achieves this by minimizing the impact of prediction errors in segments with a weak EFcontrail (<107 J m−1). A value of 1 implies that, on average, the is off by 1 order of magnitude relative to .
Secondly, we calculate τw to assess the grid-based CoCiP's accuracy in ranking flight segments according to their magnitude of EFcontrail:
where
τw measures the correlation between the two rankings based on the proportion of concordant and discordant pairs. A τw value of 1 indicates a perfect match between the rankings, a value of 0 indicates an absence of association between Ftrue and Fpred, and a value of −1 means that no pairs share the same ordering. For the purposes of evaluating the grid-based CoCiP, we only include flight waypoints if Ftrue>Fmin (=107 J m−1), and the wij term is introduced to assign larger weights to correctly rank flight segments with a large EFcontrail, which is consistent with the approach used in the modified MALE. The primary distinction between the modified MALE and τw lies in their treatment of pointwise errors (i.e. difference in the magnitude of EFcontrail between the trajectory-based and the grid-based CoCiP), where τw disregards these errors unless they are significant enough to alter their relative rankings.
Thirdly, the two performance curves are formulated to measure the impact of model errors in the effectiveness of contrail mitigation when interventions are prioritized to specific flight segments based on an imperfect prediction of the EFcontrail per flight distance. More specifically, the performance curves are constructed with the following steps:
-
Given the and per flight distance on a common set of contrail segments (indexed from i=1 to N), sort the waypoint indices into two distinct lists, ptraj(i) and pgrid(i). More specifically, ptraj(i) sorts the values from largest to smallest and represents prioritizing flight segments for mitigation based on perfect knowledge of the contrail climate forcing, while pgrid(i) sorts the per flight distance values from largest to smallest and represents prioritizations based on an imperfect prediction of contrail climate forcing.
-
Calculate four cumulative sums, F(x), for the EFcontrail per flight distance and flight segment lengths (L) for the trajectory-based and grid-based CoCiP:
and
-
Construct two absolute cumulative density functions by plotting versus and versus , both of which represent the performance curves for the trajectory-based and grid-based CoCiP respectively.
An example of these performance curves is shown in Fig. 2 in the main text. We then use these performance curves to derive two metrics that evaluate the effectiveness of contrail mitigation based on imperfect knowledge of EFcontrail:
-
the change in initial mitigation rate, i.e. the relative reduction in EFcontrail per unit of re-routed flight distance for the most strongly warming contrails, which is estimated as the gradient of a secant line (m) from the origin to the fifth percentile of and and expressed as a ratio of , and
-
the change in the total flight distance flown that contributes to 80 % of the total EFcontrail, which is estimated as a ratio of .
In essence, quantifies the reduced effectiveness of the grid-based CoCiP in mitigating the most strongly warming contrails when compared to the trajectory-based CoCiP, while measures the additional effort that is required to mitigate 80 % of the total EFcontrail when imperfect predictions are used. Table 4 summarizes the performance metrics when various configurations of the grid-based CoCiP (i.e. original aircraft-engine type and with different aircraft-engine groupings) are evaluated against the trajectory-based CoCiP. Figure A8 shows the mean percentage error across all performance metrics when comparing the grid-based CoCiP with different aircraft-engine groupings () relative to the configuration using the exact aircraft-engine type.
A6 Flight trajectory optimizer
In Sect. 5.2, we use an in-house flight trajectory optimizer together with the 4D EFcontrail per flight distance provided by the grid-based CoCiP to minimize the total CO2 mass-equivalent emissions ( from a historical transatlantic flight, where is calculated using Eq. (8). Here, we describe the algorithm of the flight trajectory optimizer. We note that this flight trajectory optimizer is not intended to create trajectories that could be used in real-world operations but rather as a heuristic to estimate the time and fuel costs associated with contrail mitigation and to demonstrate the utility of the contrail forecasts in flight planning.
The optimizer attempts to make realistic trajectories by implementing two constraints: (i) restricting the aircraft cruise altitude at designated flight levels, typically in increments of 2000 ft (610 m), and (ii) requiring that the aircraft maintains a specific flight level for a minimum duration of 90 min between step climbs. Constraint (i) aims to account for the established airspace structure, which typically dictates vertical separation of flights travelling in opposite directions at intervals of 1000 ft (305 m) (ICAO, 2016), while constraint (ii) attempts to capture constraints in airspace capacity and air traffic controller workload where flights are typically not permitted to perform frequent step changes in cruise altitude (Filippone, 2015; Tobaruela, 2015). We also do not consider a full 4D flight trajectory optimization in this work. Instead, the optimization is only performed in two dimensions – namely, time and altitude – while retaining the original horizontal flight path.
The main input parameter of the flight trajectory optimizer is the cost index (CI), which is defined as the ratio between the time and fuel-related fuel costs, and the optimizer minimizes the weighted objective function that combines time costs, CO2, and contrail costs. The flight trajectory is divided into equal flight segments, where each segment will be traversed in approximately 5 min at a near-optimal cruise speed. The search space used to find the optimal trajectory is then constrained to a 2D grid representing the flight segments (i.e. horizontal axis) and flight level (i.e. vertical axis). For the flight trajectory used in Sect. 5.2, the horizontal axis consisted of 207 segments, each approximately 44.8 km in length, and the vertical axis represents the altitude that is divided into increments of 2000 ft (610 m) between a specified minimum (assumed to be 26 000 ft (7925 m)) and maximum altitude (assumed to be the maximum operating altitude of the aircraft). We also ensure that the step climb/descent performed at each flight segment is realistic and does not exceed a nominal rate of climb and descent (ROCD) of 500 ft min−1 (2.54 m s−1).
The flight trajectory optimizer performs a breadth-first Dykstra-like search across the 2D search space. Starting from the initial point of the horizontal grid and the lowest flight level, the algorithm iterates through each of the feasible grid points to determine the optimal Mach number (Mopt) for the given aircraft type and CI. The Mopt that minimizes the total cost of cruise at each flight segment is given by
where the CI is assumed to be 60 in this study, Δm(M) is the fuel burn over this flight segment for a given Mach number (M), and VTAS is the aircraft true airspeed. The fuel burn for the original and alternative flight paths, which represent different cruise altitude options, is computed using the Poll–Schumann (PS) aircraft performance model (Poll and Schumann, 2020, 2021, 2024). The estimated fuel burn accounts for various input parameters such as the aircraft type, ambient air temperature, ambient wind conditions (which influence VTAS), and aircraft mass. We then define a set of allowed actions for the aircraft to transition to the next flight segment:
-
If the aircraft is at the starting point of the search, it is allowed to stay level or climb.
-
If the aircraft remained level during the last horizontal segment, it must continue to remain level unless it has exceeded the specified time interval (>90 min) since the last altitude change.
-
If the aircraft was climbing or descending during the last horizontal segment, it must maintain its current climb and descent until it has reached an allowed flight level for cruise, at which point it has the option to remain level or continue its climb or descent.
-
Each action is allowed only if the required thrust and lift are within the rated operating conditions of the aircraft as determined by the PS model.
At each grid point reached through an allowed action, the algorithm compares the cumulative cost of the current flight trajectory with any previously identified optimal path to that same grid point. During each iteration, the algorithm only saves the lowest-cost path for reaching the designated grid point. The search concludes once it has examined every viable grid point, and the optimal trajectory is reconstructed by starting from the final grid point and retracing the sequence of actions that were previously taken to reach that point. We note that the optimized flight trajectories are not checked for practical usage, and a real-world flight trajectory optimization needs to consider practical flight and air traffic management constraints, such as the minimum separation between aircraft, airspace congestion and design (i.e. North Atlantic Organised Track System), and air traffic controller workload (Molloy et al., 2022).
The pycontrails repository that contains the algorithms for the Poll–Schumann (PS) aircraft performance model, the trajectory-based CoCiP (Cocip), and the grid-based CoCiP (CocipGrid) is publicly available at https://doi.org/10.5281/zenodo.11263606 (Shapiro et al., 2024). The grid-based CoCiP can also be accessed via an application programming interface (API) at https://api.contrails.org (Breakthrough Energy, 2025a) and https://nav.contrails.org (Breakthrough Energy, 2025b). This document contains Copernicus Climate Change Service information from 2024. Neither the European Commission nor the ECMWF is responsible for any use of Copernicus information.
The supplement related to this article is available online at: https://doi.org/10.5194/gmd-18-253-2025-supplement.
MLS and MEJS conceptualized the study. ZE, RT, TA, TD, MEJS, and MLS developed the methodology and undertook the investigation. ZE, RT, TA, TD, and MLS were responsible for software development and data curation. RT, TA, and TD created the figures and wrote the original manuscript. MLS acquired funding. All authors have read, edited, and reviewed the manuscript and agreed upon the published version of the paper.
The contact author has declared that none of the authors has any competing interests.
Publisher's note: Copernicus Publications remains neutral with regard to jurisdictional claims made in the text, published maps, institutional affiliations, or any other geographical representation in this paper. While Copernicus Publications makes every effort to include appropriate place names, the final responsibility lies with the authors.
The authors thank Ulrich Schumann for reviewing Appendix A1 on the CoCiP version histories and publications. He also generously dedicated his time and effort to discuss and resolve model discrepancies, ensuring that the implementation of CoCiP in the open-source pycontrails repository is consistent with CoCiP (DLR).
This paper was edited by Volker Grewe and reviewed by two anonymous referees.
Agarwal, A., Meijer, V. R., Eastham, S. D., Speth, R. L., and Barrett, S. R. H.: Reanalysis-driven simulations may overestimate persistent contrail formation by 100–250 %, Environ. Res. Lett., 17, 1–14, https://doi.org/10.1088/1748-9326/AC38D9, 2022.
Bickel, M.: Climate Impact of Contrail Cirrus, PhD thesis/dissertation, Faculty of Physics, LMU Munich, https://doi.org/10.57676/MZMG-R403, 2023.
Bickel, M., Ponater, M., Bock, L., Burkhardt, U., and Reineke, S.: Estimating the Effective Radiative Forcing of Contrail Cirrus, J. Climate, 33, 1991–2005, https://doi.org/10.1175/JCLI-D-19-0467.1, 2019.
Bier, A. and Burkhardt, U.: Impact of Parametrizing Microphysical Processes in the Jet and Vortex Phase on Contrail Cirrus Properties and Radiative Forcing, J. Geophys. Res.-Atmos., 127, e2022JD036677, https://doi.org/10.1029/2022JD036677, 2022.
Borella, A., Boucher, O., Shine, K. P., Stettler, M., Tanaka, K., Teoh, R., and Bellouin, N.: The importance of an informed choice of CO2-equivalence metrics for contrail avoidance, Atmos. Chem. Phys., 24, 9401–9417, https://doi.org/10.5194/acp-24-9401-2024, 2024.
Boucher, O., Randall, D., Artaxo, P., Bretherton, C., Feingold, G., Forster, P., Kerminen, V. M., Kondo, Y., Liao, H., Lohmann, U., Rasch, P., Satheesh, S. K., Sherwood, S., Stevens, B., and Zhang, X. Y.: Clouds and aerosols. In Climate change 2013: the physical science basis. Contribution of Working Group I to the Fifth Assessment Report of the Intergovernmental Panel on Climate Change, edited by: Stocker, T. F., Qin, D., Plattner, G.-K., Tignor, M., Allen, S. K., Boschung, J., Nauels, A., Xia, Y., Bex, V., and Midgley, P. M., 571–657, Cambridge University Press, https://doi.org/10.1017/CBO9781107415324.016, 2013.
Bräuer, T., Voigt, C., Sauer, D., Kaufmann, S., Hahn, V., Scheibe, M., Schlager, H., Diskin, G. S., Nowak, J. B., DiGangi, J. P., Huber, F., Moore, R. H., and Anderson, B. E.: Airborne Measurements of Contrail Ice Properties – Dependence on Temperature and Humidity, Geophys. Res. Lett., 48, e2020GL092166, https://doi.org/10.1029/2020GL092166, 2021.
Breakthrough Energy: Contrails API, Breakthrough Energy [data set], https://api.contrails.org (last access: 10 January 2025), 2025a.
Breakthrough Energy: Contrails Navigator, Breakthrough Energy [data set], https://nav.contrails.org (last access: 10 January 2025), 2025b.
Caiazzo, F., Agarwal, A., Speth, R. L., and Barrett, S. R. H.: Impact of biofuels on contrail warming, Environ. Res. Lett., 12, 114013, https://doi.org/10.1088/1748-9326/aa893b, 2017.
Chen, C.-C. and Gettelman, A.: Simulated radiative forcing from contrails and contrail cirrus, Atmos. Chem. Phys., 13, 12525–12536, https://doi.org/10.5194/acp-13-12525-2013, 2013.
Dietmüller, S., Matthes, S., Dahlmann, K., Yamashita, H., Simorgh, A., Soler, M., Linke, F., Lührs, B., Meuser, M. M., Weder, C., Grewe, V., Yin, F., and Castino, F.: A Python library for computing individual and merged non-CO2 algorithmic climate change functions: CLIMaCCF V1.0, Geosci. Model Dev., 16, 4405–4425, https://doi.org/10.5194/gmd-16-4405-2023, 2023.
Driver, O. G. A., Stettler, M. E. J., and Gryspeerdt, E.: Factors limiting contrail detection in satellite imagery, EGUsphere [preprint], https://doi.org/10.5194/egusphere-2024-2198, 2024.
Duda, D. P., Bedka, S. T., Minnis, P., Spangenberg, D., Khlopenkov, K., Chee, T., and Smith Jr., W. L.: Northern Hemisphere contrail properties derived from Terra and Aqua MODIS data for 2006 and 2012, Atmos. Chem. Phys., 19, 5313–5330, https://doi.org/10.5194/acp-19-5313-2019, 2019.
EASA: ICAO Aircraft Engine Emissions Databank (07/2021), EASA, https://www.easa.europa.eu/domains/environment/icao-aircraft-engine-emissions-databank (last access: 15 February 2022), 2021.
ECMWF: Atmospheric Model high resolution 10-day forecast (Set I – HRES), ECMWF, https://www.ecmwf.int/en/forecasts/datasets/set-i (last access: 17 April 2024), 2024.
Edwards, H. A., Dixon-Hardy, D., and Wadud, Z.: Aircraft cost index and the future of carbon emissions from air travel, Appl. Energy, 164, 553–562, https://doi.org/10.1016/J.APENERGY.2015.11.058, 2016.
Elkin, C. and Sanekommu, D.: How AI is helping airlines mitigate the climate impact of contrails, Google, https://blog.google/technology/ai/ai-airlines-contrails-climate-change/ (last access: 12 March 2024), 2023.
European Commission: Directive (EU) 2023/958 of the European Parliament and of the Council of 10 May 2023, European Commission, https://eur-lex.europa.eu/legal-content/EN/TXT/PDF/?uri=CELEX:32023L0958 (last access: 6 May 2024), 2023.
Filippone, A.: Assessment of aircraft contrail avoidance strategies, J. Aircr., 52, 872–877, https://doi.org/10.2514/1.C033176, 2015.
Fritz, T. M., Eastham, S. D., Speth, R. L., and Barrett, S. R. H.: The role of plume-scale processes in long-term impacts of aircraft emissions, Atmos. Chem. Phys., 20, 5697–5727, https://doi.org/10.5194/acp-20-5697-2020, 2020.
Frömming, C., Grewe, V., Brinkop, S., Jöckel, P., Haslerud, A. S., Rosanka, S., van Manen, J., and Matthes, S.: Influence of weather situation on non-CO2 aviation climate effects: the REACT4C climate change functions, Atmos. Chem. Phys., 21, 9151–9172, https://doi.org/10.5194/acp-21-9151-2021, 2021.
Gaillot, T., Beauchet, S., Lorne, D., and Krim, L.: The impact of fossil jet fuel emissions at altitude on climate change: A life cycle assessment study of a long-haul flight at different time horizons, Atmos. Environ., 311, 119983, https://doi.org/10.1016/J.ATMOSENV.2023.119983, 2023.
Geraedts, S., Brand, E., Dean, T. R., Eastham, S., Elkin, C., Engberg, Z., Hager, U., Langmore, I., McCloskey, K., Yue-Hei Ng, J., Platt, J. C., Sankar, T., Sarna, A., Shapiro, M., and Goyal, N.: A scalable system to measure contrail formation on a per-flight basis, Environ. Res. Commun., 6, 015008, https://doi.org/10.1088/2515-7620/AD11AB, 2024.
Gettelman, A., Chen, C.-C., and Bardeen, C. G.: The climate impact of COVID-19-induced contrail changes, Atmos. Chem. Phys., 21, 9405–9416, https://doi.org/10.5194/acp-21-9405-2021, 2021.
Gierens, K., Matthes, S., and Rohs, S.: How Well Can Persistent Contrails Be Predicted?, Aerospace, 7, 169, https://doi.org/10.3390/AEROSPACE7120169, 2020.
Grewe, V., Frömming, C., Matthes, S., Brinkop, S., Ponater, M., Dietmüller, S., Jöckel, P., Garny, H., Tsati, E., Dahlmann, K., Søvde, O. A., Fuglestvedt, J., Berntsen, T. K., Shine, K. P., Irvine, E. A., Champougny, T., and Hullah, P.: Aircraft routing with minimal climate impact: the REACT4C climate cost function modelling approach (V1.0), Geosci. Model Dev., 7, 175–201, https://doi.org/10.5194/gmd-7-175-2014, 2014.
Grewe, V., Matthes, S., Frömming, C., Brinkop, S., Jöckel, P., Gierens, K., Champougny, T., Fuglestvedt, J., Haslerud, A., and Irvine, E.: Feasibility of climate-optimized air traffic routing for trans-Atlantic flights, Environ. Res. Lett., 12, 34003, https://doi.org/10.1088/1748-9326/aa5ba0, 2017.
Haywood, J. M., Allan, R. P., Bornemann, J., Forster, P. M., Francis, P. N., Milton, S., Rädel, G., Rap, A., Shine, K. P., and Thorpe, R.: A case study of the radiative forcing of persistent contrails evolving into contrail-induced cirrus, J. Geophys. Res.-Atmos., 114, D24201, https://doi.org/10.1029/2009JD012650, 2009.
Hersbach, H., Bell, B., Berrisford, P., Hirahara, S., Horányi, A., Muñoz-Sabater, J., Nicolas, J., Peubey, C., Radu, R., Schepers, D., Simmons, A., Soci, C., Abdalla, S., Abellan, X., Balsamo, G., Bechtold, P., Biavati, G., Bidlot, J., Bonavita, M., De Chiara, G., Dahlgren, P., Dee, D., Diamantakis, M., Dragani, R., Flemming, J., Forbes, R., Fuentes, M., Geer, A., Haimberger, L., Healy, S., Hogan, R. J., Hólm, E., Janisková, M., Keeley, S., Laloyaux, P., Lopez, P., Lupu, C., Radnoti, G., de Rosnay, P., Rozum, I., Vamborg, F., Villaume, S., and Thépaut, J. N.: The ERA5 global reanalysis, Q. J. Roy. Meteor. Soc., 146, 1999–2049, https://doi.org/10.1002/qj.3803, 2020.
Hofer, S., Gierens, K., and Rohs, S.: How well can persistent contrails be predicted? An update, Atmos. Chem. Phys., 24, 7911–7925, https://doi.org/10.5194/acp-24-7911-2024, 2024.
Holzapfel, F.: Probabilistic Two-Phase Wake Vortex Decay and Transport Model, J. Aircr., 40, 323–331, https://doi.org/10.2514/2.3096, 2003.
ICAO: Air Traffic Management – Procedures for Air Navigation Services, International Civil Aviation Organisation, http://flightservicebureau.org/wp-content/uploads/2017/03/ICAO-Doc4444-Pans-Atm-16thEdition-2016-OPSGROUP.pdf (last access: 6 May 2024), Montreal, Canada, 2016.
Jeßberger, P., Voigt, C., Schumann, U., Sölch, I., Schlager, H., Kaufmann, S., Petzold, A., Schäuble, D., and Gayet, J.-F.: Aircraft type influence on contrail properties, Atmos. Chem. Phys., 13, 11965–11984, https://doi.org/10.5194/acp-13-11965-2013, 2013.
Kärcher, B.: Formation and radiative forcing of contrail cirrus, Nat. Commun., 9, 1824, https://doi.org/10.1038/s41467-018-04068-0, 2018.
Kärcher, B. and Yu, F.: Role of aircraft soot emissions in contrail formation, Geophys. Res. Lett., 36, L01804, https://doi.org/10.1029/2008GL036649, 2009.
Kärcher, B., Burkhardt, U., Bier, A., Bock, L., and Ford, I. J.: The microphysical pathway to contrail formation, J. Geophys. Res.-Atmos., 120, 7893–7927, https://doi.org/10.1002/2015JD023491, 2015.
Lee, D. S., Fahey, D. W., Skowron, A., Allen, M. R., Burkhardt, U., Chen, Q., Doherty, S. J., Freeman, S., Forster, P. M., Fuglestvedt, J., Gettelman, A., De León, R. R., Lim, L. L., Lund, M. T., Millar, R. J., Owen, B., Penner, J. E., Pitari, G., Prather, M. J., Sausen, R., and Wilcox, L. J.: The contribution of global aviation to anthropogenic climate forcing for 2000 to 2018, Atmos. Environ., 244, 117834, https://doi.org/10.1016/J.ATMOSENV.2020.117834, 2021.
Lewellen, D. C.: Persistent contrails and contrail cirrus. Part II: Full lifetime behavior, J. Atmos. Sci., 71, 4420–4438, https://doi.org/10.1175/JAS-D-13-0317.1, 2014.
Lewellen, D. C., Meza, O., Huebsch, W. W., Lewellen, D. C., Meza, O., and Huebsch, W. W.: Persistent Contrails and Contrail Cirrus. Part I: Large-Eddy Simulations from Inception to Demise, J. Atmos. Sci., 71, 4399–4419, https://doi.org/10.1175/JAS-D-13-0316.1, 2014.
Lovegren, J. A. and Hansman, R. J.: Estimation of Potential Aircraft Fuel Burn Reduction in Cruise Via Speed and Altitude Optimization Strategies, https://dspace.mit.edu/handle/1721.1/62196 (last access: 9 April 2024), 2011.
Low, J., Teoh, R., Ponsonby, J., Gryspeerdt, E., Shapiro, M., and Stettler, M. E. J.: Ground-based contrail observations: comparisons with reanalysis weather data and contrail model simulations, Atmos. Meas. Tech., 18, 37–56, https://doi.org/10.5194/amt-18-37-2025, 2025.
Mannstein, H., Brömser, A., and Bugliaro, L.: Ground-based observations for the validation of contrails and cirrus detection in satellite imagery, Atmos. Meas. Tech., 3, 655–669, https://doi.org/10.5194/amt-3-655-2010, 2010.
Martin Frias, A., Shapiro, M., Engberg, Z., Zopp, R., Soler, M., and Stettler, M. E. J.: Feasibility of contrail avoidance in a commercial flight planning system: an operational analysis, Environ. Res.-Infrastructure and Sustainability, 4, 015013, https://doi.org/10.1088/2634-4505/ad310c, 2024.
Mayer, B. and Kylling, A.: Technical note: The libRadtran software package for radiative transfer calculations – description and examples of use, Atmos. Chem. Phys., 5, 1855–1877, https://doi.org/10.5194/acp-5-1855-2005, 2005.
Meerkötter, R., Schumann, U., Doelling, D. R., Minnis, P., Nakajima, T., and Tsushima, Y.: Radiative forcing by contrails, Ann. Geophys., 17, 1080–1094, https://doi.org/10.1007/s00585-999-1080-7, 1999.
Molloy, J., Teoh, R., Harty, S., Koudis, G., Schumann, U., Poll, I., and Stettler, M. E. J.: Design Principles for a Contrail-Minimizing Trial in the North Atlantic, Aerospace, 9, 375, https://doi.org/10.3390/AEROSPACE9070375, 2022.
Platt, J., Shapiro, M., Engberg, Z., McCloskey, K., Geraedts, S., Sankar, T., Stettler, M. E. J., Teoh, R., Schumann, U., Rohs, S., Brand, E., and Van Arsdale, C.: The effect of uncertainty in humidity and model parameters on the prediction of contrail energy forcing, Environ. Res. Commun., 6, 095015, https://doi.org/10.1088/2515-7620/ad6ee5, 2024.
Poll, D. I. A.: 21st-Century civil aviation: Is it on course or is it over-confident and complacent? – thoughts on the conundrum of aviation and the environment, The Aeronautical Journal, 121, 115–140, https://doi.org/10.1017/aer.2016.140, 2017.
Poll, D. I. A. and Schumann, U.: An estimation method for the fuel burn and other performance characteristics of civil transport aircraft in the cruise. Part 1 fundamental quantities and governing relations for a general atmosphere, The Aeronautical Journal, 125, 257–295, https://doi.org/10.1017/aer.2020.62, 2020.
Poll, D. I. A. and Schumann, U.: An estimation method for the fuel burn and other performance characteristics of civil transport aircraft during cruise: part 2, determining the aircraft's characteristic parameters, The Aeronautical Journal, 125, 296–340, https://doi.org/10.1017/AER.2020.124, 2021.
Poll, D. I. A. and Schumann, U.: On the conditions for absolute minimum fuel burn for turbofan powered, civil transport aircraft and a simple model for wave drag, The Aeronautical Journal, 128, 1071–1103, https://doi.org/10.1017/AER.2024.10, 2024.
Ponater, M., Marquart, S., Sausen, R., and Schumann, U.: On contrail climate sensitivity, Geophys. Res. Lett., 32, L10706, https://doi.org/10.1029/2005GL022580, 2005.
Ponater, M., Bickel, M., Bock, L., and Burkhardt, U.: Towards Determining the Contrail Cirrus Efficacy, Aerospace, 8, 42, https://doi.org/10.3390/AEROSPACE8020042, 2021.
Quante, G., Voß, S., Bullerdiek, N., Voigt, C., and Kaltschmitt, M.: Hydroprocessing of fossil fuel-based aviation kerosene – Technology options and climate impact mitigation potentials, Atmos. Environ. X, 22, 100259, https://doi.org/10.1016/J.AEAOA.2024.100259, 2024.
Rap, A., Forster, P. M., Haywood, J. M., Jones, A., and Boucher, O.: Estimating the climate impact of linear contrails using the UK Met Office climate model, Geophys. Res. Lett., 37, L20703, https://doi.org/10.1029/2010GL045161, 2010.
Rennert, K., Errickson, F., Prest, B. C., Rennels, L., Newell, R. G., Pizer, W., Kingdon, C., Wingenroth, J., Cooke, R., Parthum, B., Smith, D., Cromar, K., Diaz, D., Moore, F. C., Müller, U. K., Plevin, R. J., Raftery, A. E., Ševčíková, H., Sheets, H., Stock, J. H., Tan, T., Watson, M., Wong, T. E., and Anthoff, D.: Comprehensive evidence implies a higher social cost of CO2, Nature, 610, 687–692, https://doi.org/10.1038/s41586-022-05224-9, 2022.
Rosenow, J., Hospodka, J., Lán, S., and Fricke, H.: Validation of a Contrail Life-Cycle Model in Central Europe, Sustainability, 15, 8669, https://doi.org/10.3390/SU15118669, 2023.
Rubnich, M. and Delaura, R.: An algorithm to identify robust convective weather avoidance polygons in en route airspace, 10th AIAA Aviation Technology, Integration and Operations Conference 2010, 13–15 September 2010, Fort Worth, Texas, American Institute of Aeronautics and Astronautics, ATIO 2010, 2, https://doi.org/10.2514/6.2010-9164, 2010.
Santer, B. D., Sausen, R., Wigley, T. M. L., Boyle, J. S., AchutaRao, K., Doutriaux, C., Hansen, J. E., Meehl, G. A., Roeckner, E., Ruedy, R., Schmidt, G., and Taylor, K. E.: Behavior of tropopause height and atmospheric temperature in models, reanalyses, and observations: Decadal changes, J. Geophys. Res.-Atmos., 108, ACL 1-1, https://doi.org/10.1029/2002JD002258, 2003.
Sausen, R., Hofer, S. M., Gierens, K. M., Bugliaro Goggia, L., Ehrmanntraut, R., Sitova, I., Walczak, K., Burridge-Diesing, A., Bowman, M., and Miller, N.: Can we successfully avoid persistent contrails by small altitude adjustments of flights in the real world?, Meteorol. Z., 33, 83–98, https://doi.org/10.1127/metz/2023/1157, 2023.
Schumann, U.: On conditions for contrail formation from aircraft exhausts, Meteorol. Z., 5, 4–23, https://doi.org/10.1127/metz/5/1996/4, 1996.
Schumann, U.: A contrail cirrus prediction tool, in: Proceedings of the 2nd International Conference on Transport, Atmosphere and Climate (TAC-2), 69–74, https://elib.dlr.de/68002/ (last access: 9 March 2024), 2010.
Schumann, U.: A contrail cirrus prediction model, Geosci. Model Dev., 5, 543–580, https://doi.org/10.5194/gmd-5-543-2012, 2012.
Schumann, U. and Graf, K.: Aviation-induced cirrus and radiation changes at diurnal timescales, J. Geophys. Res.-Atmos., 118, 2404–2421, https://doi.org/10.1002/jgrd.50184, 2013.
Schumann, U. and Heymsfield, A. J.: On the lifecycle of individual contrails and contrail cirrus, Meteorological Monographs, 58, 3.1–3.24, https://doi.org/10.1175/amsmonographs-d-16-0005.1, 2017.
Schumann, U. and Mayer, B.: Sensitivity of surface temperature to radiative forcing by contrail cirrus in a radiative-mixing model, Atmos. Chem. Phys., 17, 13833–13848, https://doi.org/10.5194/acp-17-13833-2017, 2017.
Schumann, U. and Wirth, M.: Optical depth of cirrus and embedded contrails from airborne Lidar and models, in: EGU General Assembly 2009, 5128, https://ui.adsabs.harvard.edu/abs/2009EGUGA..11.5128S/abstract (last access: 9 March 2024), 2009.
Schumann, U., Mayer, B., Hamann, U., and Graf, K.: Radiative heating in contrail cirrus, Geophysical Research Abstracts, 12 (EGU201), 1–2, European Geophysical Union General Assembly 2010, 2–7 May 2010, Wien, https://elib.dlr.de/67811/ (last access: 5 December 2022), 2010.
Schumann, U., Graf, K., and Mannstein, H.: Potential to reduce the climate impact of aviation by flight level changes, in: 3rd AIAA Atmospheric Space Environments Conference, 27–30 June 2011, Honolulu, Hawaii, American Institute of Aeronautics and Astronautics, https://doi.org/10.2514/6.2011-3376, 2011.
Schumann, U., Graf, K., Mannstein, H., and Mayer, B.: Contrails: Visible aviation induced climate impact, in: Atmospheric Physics, Springer, 239–257, https://doi.org/10.1007/978-3-642-30183-4_15, 2012a.
Schumann, U., Mayer, B., Graf, K., and Mannstein, H.: A parametric radiative forcing model for contrail cirrus, J. Appl. Meteorol. Climatol., 51, 1391–1406, https://doi.org/10.1175/JAMC-D-11-0242.1, 2012b.
Schumann, U., Hempel, R., Flentje, H., Garhammer, M., Graf, K., Kox, S., Lösslein, H., and Mayer, B.: Contrail study with ground-based cameras, Atmos. Meas. Tech., 6, 3597–3612, https://doi.org/10.5194/amt-6-3597-2013, 2013a.
Schumann, U., Jeßberger, P., and Voigt, C.: Contrail ice particles in aircraft wakes and their climatic importance, Geophys. Res. Lett., 40, 2867–2872, https://doi.org/10.1002/grl.50539, 2013b.
Schumann, U., Penner, J. E., Chen, Y., Zhou, C., and Graf, K.: Dehydration effects from contrails in a coupled contrail–climate model, Atmos. Chem. Phys., 15, 11179–11199, https://doi.org/10.5194/acp-15-11179-2015, 2015.
Schumann, U., Baumann, R., Baumgardner, D., Bedka, S. T., Duda, D. P., Freudenthaler, V., Gayet, J.-F., Heymsfield, A. J., Minnis, P., Quante, M., Raschke, E., Schlager, H., Vázquez-Navarro, M., Voigt, C., and Wang, Z.: Properties of individual contrails: a compilation of observations and some comparisons, Atmos. Chem. Phys., 17, 403–438, https://doi.org/10.5194/acp-17-403-2017, 2017.
Schumann, U., Poll, I., Teoh, R., Koelle, R., Spinielli, E., Molloy, J., Koudis, G. S., Baumann, R., Bugliaro, L., Stettler, M., and Voigt, C.: Air traffic and contrail changes over Europe during COVID-19: a model study, Atmos. Chem. Phys., 21, 7429–7450, https://doi.org/10.5194/acp-21-7429-2021, 2021.
Shapiro, M., Engberg, Z., Teoh, R., and Dean, T.: pycontrails: Python library for modeling aviation climate impacts (v0.39.4), Zenodo [code], https://doi.org/10.5281/zenodo.7776686, 2023.
Shapiro, M., Engberg, Z., Teoh, R., Stettler, M., Dean, T., and Abbott, T.: pycontrails: Python library for modelling aviation climate impacts (v0.51.0), Zenodo [code], https://doi.org/10.5281/zenodo.11263606, 2024.
Sonabend-W, A., Elkin, C., Dean, T., Dudley, J., Ali, N., Blickstein, J., Brand, E., Broshears, B., Chen, S., Engberg, Z., Galyen, M., Geraedts, S., Goyal, N., Grenham, R., Hager, U., Hecker, D., Jany, M., McCloskey, K., Ng, J., Norris, B., Opel, F., Rothenberg, J., Sankar, T., Sanekommu, D., Sarna, A., Schütt, O., Shapiro, M., Soh, R., Van Arsdale, C., and Platt, J. C.: Feasibility test of per-flight contrail avoidance in commercial aviation, Commun. Eng., 3, 1–7, https://doi.org/10.1038/s44172-024-00329-7, 2024.
Sonntag, D.: Advancements in the field of hygrometry, Meteorol. Z., 3, 51–66, https://doi.org/10.1127/metz/3/1994/51, 1994.
Teoh, R., Schumann, U., Majumdar, A., and Stettler, M. E. J.: Mitigating the Climate Forcing of Aircraft Contrails by Small-Scale Diversions and Technology Adoption, Environ. Sci. Technol., 54, 2941–2950, https://doi.org/10.1021/acs.est.9b05608, 2020a.
Teoh, R., Schumann, U., and Stettler, M. E. J.: Beyond Contrail Avoidance: Efficacy of Flight Altitude Changes to Minimise Contrail Climate Forcing, Aerospace, 7, 121, https://doi.org/10.3390/aerospace7090121, 2020b.
Teoh, R., Schumann, U., Gryspeerdt, E., Shapiro, M., Molloy, J., Koudis, G., Voigt, C., and Stettler, M. E. J.: Aviation contrail climate effects in the North Atlantic from 2016 to 2021, Atmos. Chem. Phys., 22, 10919–10935, https://doi.org/10.5194/acp-22-10919-2022, 2022a.
Teoh, R., Schumann, U., Voigt, C., Schripp, T., Shapiro, M., Engberg, Z., Molloy, J., Koudis, G., and Stettler, M. E. J.: Targeted Use of Sustainable Aviation Fuel to Maximise Climate Benefits, Environ. Sci. Technol., 56, 17246–17255, https://doi.org/10.1021/acs.est.2c05781, 2022b.
Teoh, R., Engberg, Z., Schumann, U., Voigt, C., Shapiro, M., Rohs, S., and Stettler, M. E. J.: Global aviation contrail climate effects from 2019 to 2021, Atmos. Chem. Phys., 24, 6071–6093, https://doi.org/10.5194/acp-24-6071-2024, 2024a.
Teoh, R., Engberg, Z., Shapiro, M., Dray, L., and Stettler, M. E. J.: The high-resolution Global Aviation emissions Inventory based on ADS-B (GAIA) for 2019–2021, Atmos. Chem. Phys., 24, 725–744, https://doi.org/10.5194/acp-24-725-2024, 2024b.
Tobaruela, G.: A Framework to assess the ability of automation to deliver capacity targets in European airspace, PhD Thesis, Imperial College London, https://doi.org/10.25560/28150, 2015.
Turbli: Turbulence forecast for your flight, https://turbli.com/ (last access: 15 April 2024), 2024.
Unterstrasser, S.: Properties of young contrails – a parametrisation based on large-eddy simulations, Atmos. Chem. Phys., 16, 2059–2082, https://doi.org/10.5194/acp-16-2059-2016, 2016.
Vázquez-Navarro, M., Mannstein, H., and Kox, S.: Contrail life cycle and properties from 1 year of MSG/SEVIRI rapid-scan images, Atmos. Chem. Phys., 15, 8739–8749, https://doi.org/10.5194/acp-15-8739-2015, 2015.
Voigt, C., Schumann, U., Jurkat, T., Schäuble, D., Schlager, H., Petzold, A., Gayet, J.-F., Krämer, M., Schneider, J., Borrmann, S., Schmale, J., Jessberger, P., Hamburger, T., Lichtenstern, M., Scheibe, M., Gourbeyre, C., Meyer, J., Kübbeler, M., Frey, W., Kalesse, H., Butler, T., Lawrence, M. G., Holzäpfel, F., Arnold, F., Wendisch, M., Döpelheuer, A., Gottschaldt, K., Baumann, R., Zöger, M., Sölch, I., Rautenhaus, M., and Dörnbrack, A.: In-situ observations of young contrails – overview and selected results from the CONCERT campaign, Atmos. Chem. Phys., 10, 9039–9056, https://doi.org/10.5194/acp-10-9039-2010, 2010.
Voigt, C., Schumann, U., Minikin, A., Abdelmonem, A., Afchine, A., Borrmann, S., Boettcher, M., Buchholz, B., Bugliaro, L., Costa, A., Curtius, J., Dollner, M., Dörnbrack, A., Dreiling, V., Ebert, V., Ehrlich, A., Fix, A., Forster, L., Frank, F., Fütterer, D., Giez, A., Graf, K., Grooß, J. U., Groß, S., Heimerl, K., Heinold, B., Hüneke, T., Järvinen, E., Jurkat, T., Kaufmann, S., Kenntner, M., Klingebiel, M., Klimach, T., Kohl, R., Krämer, M., Krisna, T. C., Luebke, A., Mayer, B., Mertes, S., Molleker, S., Petzold, A., Pfeilsticker, K., Port, M., Rapp, M., Reutter, P., Rolf, C., Rose, D., Sauer, D., Schäfler, A., Schlage, R., Schnaiter, M., Schneider, J., Spelten, N., Spichtinger, P., Stock, P., Walser, A., Weigel, R., Weinzierl, B., Wendisch, M., Werner, F., Wernli, H., Wirth, M., Zahn, A., Ziereis, H., and Zöger, M.: ML-CIRRUS: The Airborne Experiment on Natural Cirrus and Contrail Cirrus with the High-Altitude Long-Range Research Aircraft HALO, B. Am. Meteorol. Soc., 98, 271–288, https://doi.org/10.1175/BAMS-D-15-00213.1, 2017.
Wilhelm, L., Gierens, K., and Rohs, S.: Weather Variability Induced Uncertainty of Contrail Radiative Forcing, Aerospace, 8, 332, https://doi.org/10.3390/AEROSPACE8110332, 2021.
Wolf, K., Bellouin, N., and Boucher, O.: Long-term upper-troposphere climatology of potential contrail occurrence over the Paris area derived from radiosonde observations, Atmos. Chem. Phys., 23, 287–309, https://doi.org/10.5194/acp-23-287-2023, 2023a.
Wolf, K., Bellouin, N., Boucher, O., Rohs, S., and Li, Y.: Correction of temperature and relative humidity biases in ERA5 by bivariate quantile mapping: Implications for contrail classification, EGUsphere [preprint], https://doi.org/10.5194/egusphere-2023-2356, 2023b.
Wolf, K., Bellouin, N., and Boucher, O.: Distribution and morphology of non-persistent contrail and persistent contrail formation areas in ERA5, Atmos. Chem. Phys., 24, 5009–5024, https://doi.org/10.5194/acp-24-5009-2024, 2024.
Yu, F., Kärcher, B., and Anderson, B. E.: Revisiting Contrail Ice Formation: Impact of Primary Soot Particle Sizes and Contribution of Volatile Particles, Environ. Sci. Technol., 58, 17650–17660, https://doi.org/10.1021/ACS.EST.4C04340, 2024.


