the Creative Commons Attribution 4.0 License.
the Creative Commons Attribution 4.0 License.
 | 11 Apr 2025
Including the phosphorus cycle into the LPJ-GUESS dynamic global vegetation model (v4.1, r10994) – global patterns and temporal trends of N and P primary production limitation
Mateus Dantas de Paula
Matthew Forrest
David Warlind
João Paulo Darela Filho
Katrin Fleischer
Anja Rammig
Thomas Hickler
Phosphorus (P) is a critical macronutrient for plant growth, often limiting plant production in areas where plant demand is higher than soil supply. In contrast to nitrogen (N), P cannot be sourced from the atmosphere; therefore, where it is rare, it becomes a strong constraint on primary production. Due to this, most dynamic global vegetation models (DGVMs) are incorporating a prognostic P cycle in addition to N, improving their ability to correctly predict stocks and fluxes of carbon and how climate change may impact N and/or P limitations to soil processes and plant productivity.
We included the P cycle into an individual-based DGVM, Lund–Potsdam–Jena General Ecosystem Simulator (LPJ-GUESS, v4.1, r10994), in order to improve model performance with regard to observations of vegetation and soil N and P stocks and fluxes in comparison to the N-only (LPJ-GUESS-CN) model version. The new model version (LPJ-GUESS-CNP v1.0) includes soil organic P dynamics, P limitation of organic matter decomposition, P deposition, temperature- and humidity-dependent P weathering, plant P demand and uptake, and P limitations to photosynthesis. Using the CNP version of LPJ-GUESS, we also estimated global spatial patterns of nutrient limitation to plant growth as well as the temporal change in plant N and P limitation during the 20th and early 21st century, evaluating the causes for these temporal shifts.
We show that including the P cycle significantly reduces simulated global vegetation and soil C and N stocks and fluxes, in particular in tropical regions. The CNP model simulation improves the fit to global biomass observations in relation to the CN simulation. The CNP model predicts predominant P limitation of plant growth in the tropics, and N limitation in the temperate, boreal, and high-altitude tropical regions. The CNP model also correctly predicted the global magnitude (∼50 PgP) and the spatial pattern of total organic P stocks. P-limited regions cover less land surface area (46 %) than N-limited ones but are responsible for 57 % of the global gross primary productivity (GPP) and 68 % of vegetation biomass, while N-limited regions store a larger portion of total carbon stocks (55.9 %). Finally, the model shows that globally, primary production limitation to N availability decreased and limitation to P increased from 1901 to 2018, with N being more responsive to temperature and P than CO2 changes. We conclude that including the P cycle in models like LPJ-GUESS is crucial for understanding global-scale spatial and temporal patterns in nutrient limitation and improving the simulated carbon stocks and fluxes.
- Article
(14415 KB) - Full-text XML
- BibTeX
- EndNote


Vegetation productivity is strongly limited by available nutrients, especially nitrogen (N) and phosphorus (P) (Van Der Heijden et al., 2008; Wieder et al., 2015; Zhu et al., 2016). Nutrient availability determines plant carbon storage and community composition (Quesada et al., 2012; Wieder et al., 2015). With rises in atmospheric CO2 concentrations and its impacts on climate and plant physiology, such as CO2 fertilization (Hickler et al., 2015; Walker et al., 2021), nutrient availability increases in importance as a factor limiting vegetation growth (Hickler et al., 2015; Johnson, 2006; Kou et al., 2020; Luo et al., 2004). Furthermore, anthropogenic impacts on the nutrient cycle may affect the community balance from one major nutrient limitation to another. For example, N deposition exacerbates P limitation (Peñuelas et al., 2013), while increases in fire frequency result in attenuation of P limitation, as N volatilizes and P is retained in the system (Butler et al., 2018).
A global analysis of terrestrial ecosystem N and P limitation showed that, excluding cropland and urban and glacial areas, only 18 % of natural terrestrial land area was predominantly N-limited, whereas 43 % was predominantly P-limited (Du et al., 2020). This pattern might occur across the entire tropical swath of the globe (Cunha et al., 2022; Vitousek, 1984; Wright, 2019), where highly weathered soils provide very little available P for plant growth. Global patterns of soil P availability indicate that it increases from the Equator to the poles as well as from lowlands to highlands in the tropical regions (Du et al., 2020). Soil characteristics also play a major role, with organic carbon and phosphorus content and parent material and sand content being the most important predictors of P availability (He et al., 2021b; da Silva et al., 2022). In these regions of relative low P availability, a tight coupling of P cycling between plants and the soil biota in these regions has been observed (Wilcke et al., 2019), as well as diverse plant P-acquisition strategies (Reichert et al., 2022). Fertilization experiments in these regions resulted in rapid changes to the plant communities, with increased productivity after P (Lugli, 2021) and N additions, suggesting that both elements limit plant growth concurrently (Li et al., 2016; Wright, 2019). In light of this, understanding vegetation response to N and P availability and their global patterns is crucial for projecting the future carbon balance of the Earth (Fleischer et al., 2019; Leuschner et al., 2013).
For such large time- (i.e. decades to centuries) and spatial-scale (local to global) studies, the use of dynamic global vegetation models (DGVMs) has been an important tool (Prentice et al., 2007; Quillet et al., 2009; Shi et al., 2021). The inclusion of nutrient cycling and nutrient constraints of productivity in DGVMs has been carried out since the last few decades as models without nutrient cycles overestimate the potential future increase in ecosystem carbon storage under increasing CO2 (Cramer et al., 2001; Fleischer et al., 2019; Haverd et al., 2020). Historically, the N cycle has seen the most widespread inclusion into DGVMs (Von Bloh et al., 2018; Fisher et al., 2010; Smith et al., 2014; Zaehle and Friend, 2010) due to the focus on the predominantly N-limited ecosystems from the higher latitudes of the Northern Hemisphere (Zhu et al., 2015). However, many tropical areas such as moist forests and savannas, which account for a large portion of vegetation biomass and productivity, are predominantly P-limited (Du et al., 2020; Field et al., 1998). In addition, responses of the N and P cycles to environmental change can differ greatly due to different biogeochemical controls in each (Vitousek et al., 1997). In light of this, the P cycle was included recently in several vegetation models, such as ORCHIDEE (Goll et al., 2017), CASA (Wang et al., 2010), CLM (Yang et al., 2014), CABLE (Haverd et al., 2018), FUN (Allen et al., 2020), and CoupModel (He et al., 2021a), which have as a common goal an improved fit to gross primary productivity (GPP) and biomass observations and an improved model response to CO2 fertilization. Indeed, compared to DGVMs which do not include the P cycle, CO2-induced biomass growth differed by as much as 50 % when simulating a low-P site in the central Amazon (Fleischer et al., 2019). In spite of this, these implementations rarely had a global extent or evaluated the progression of N and P limitation during the last century. Also, a thorough investigation of which environmental factors can impact the N and P cycles differently is still absent.
Here we implement the P cycle into the DGVM LPJ-GUESS (Smith et al., 2001, 2014), which includes implementing the relevant processes into the vegetation and soil dynamics. We then execute global simulations of the model in CN (only the carbon (C) and the N cycles affecting the simulation) and CNP (C, N, and P cycles affecting the simulation) versions (CN being N-limited and CNP being N-and-P-limited) in order to answer the following questions:
-
Does including the P cycle improve model agreement with biomass and GPP observations?
-
What drives N and P limitation across climate zones?
-
How has that changed during the 20th and early 21st century?
-
Which environmental factor change among CO2 concentration, N deposition, precipitation, and temperature is more relevant for N and P limitation change during this period?
2.1 General model description
The Lund–Potsdam–Jena General Ecosystem Simulator (LPJ-GUESS) DGVM (Smith et al., 2001, 2014) is an individual-based DGVM that simulates vegetation biome distribution and shifts, forest succession, and disturbances by wildfires and biogeochemical cycles. The model includes, for example, individual representations of tree cohorts, a Farquhar-based photosynthesis implementation, establishment and competition processes (light, water, nutrients, and space), fire, and mortality (which includes the effect of age and low growth efficiency). Each tree and grass individual belongs to a specific plant functional type (PFT), which determines their properties by pre-defined trait parameters.
Previous versions of the model already include soil organic matter (SOM) dynamics following the CENTURY approach (Parton et al., 1993, 2010) with organic matter pools and the N cycle (Smith et al., 2014). Organic matter enters the SOM model through vegetation litter input, which, through tissue characteristics and traits, strongly influences soil N content and SOM decomposition rates. Simulated tree and grass individuals depend on mineral available N for growth. Their N demand is the product of the leaf N concentration needed to optimize the carboxylation capacity of the canopy to maximize GPP and the size of other compartments of the individuals where their N concentrations follow the optimal leaf N concentration. Lower N uptake than demand reduces photosynthetic rates and drives increased relative allocation to roots, increasing N uptake capacity and strength with respect to other tree or grass individuals (Smith et al., 2014). The model has been widely evaluated globally (Wärlind et al., 2014) and regionally (Hickler et al., 2012).
2.2 P soil processes
The inclusion of P cycle soil processes in LPJ-GUESS closely follows the implementation of the CENTURY model structure for P (Parton et al., 2010), from which the N cycle is also adopted. From the CENTURY P submodel, we included the values for the C:P ratios of the slow, passive, and active (microbial) organic matter pools and their variation according to the labile (inorganic) P pool.
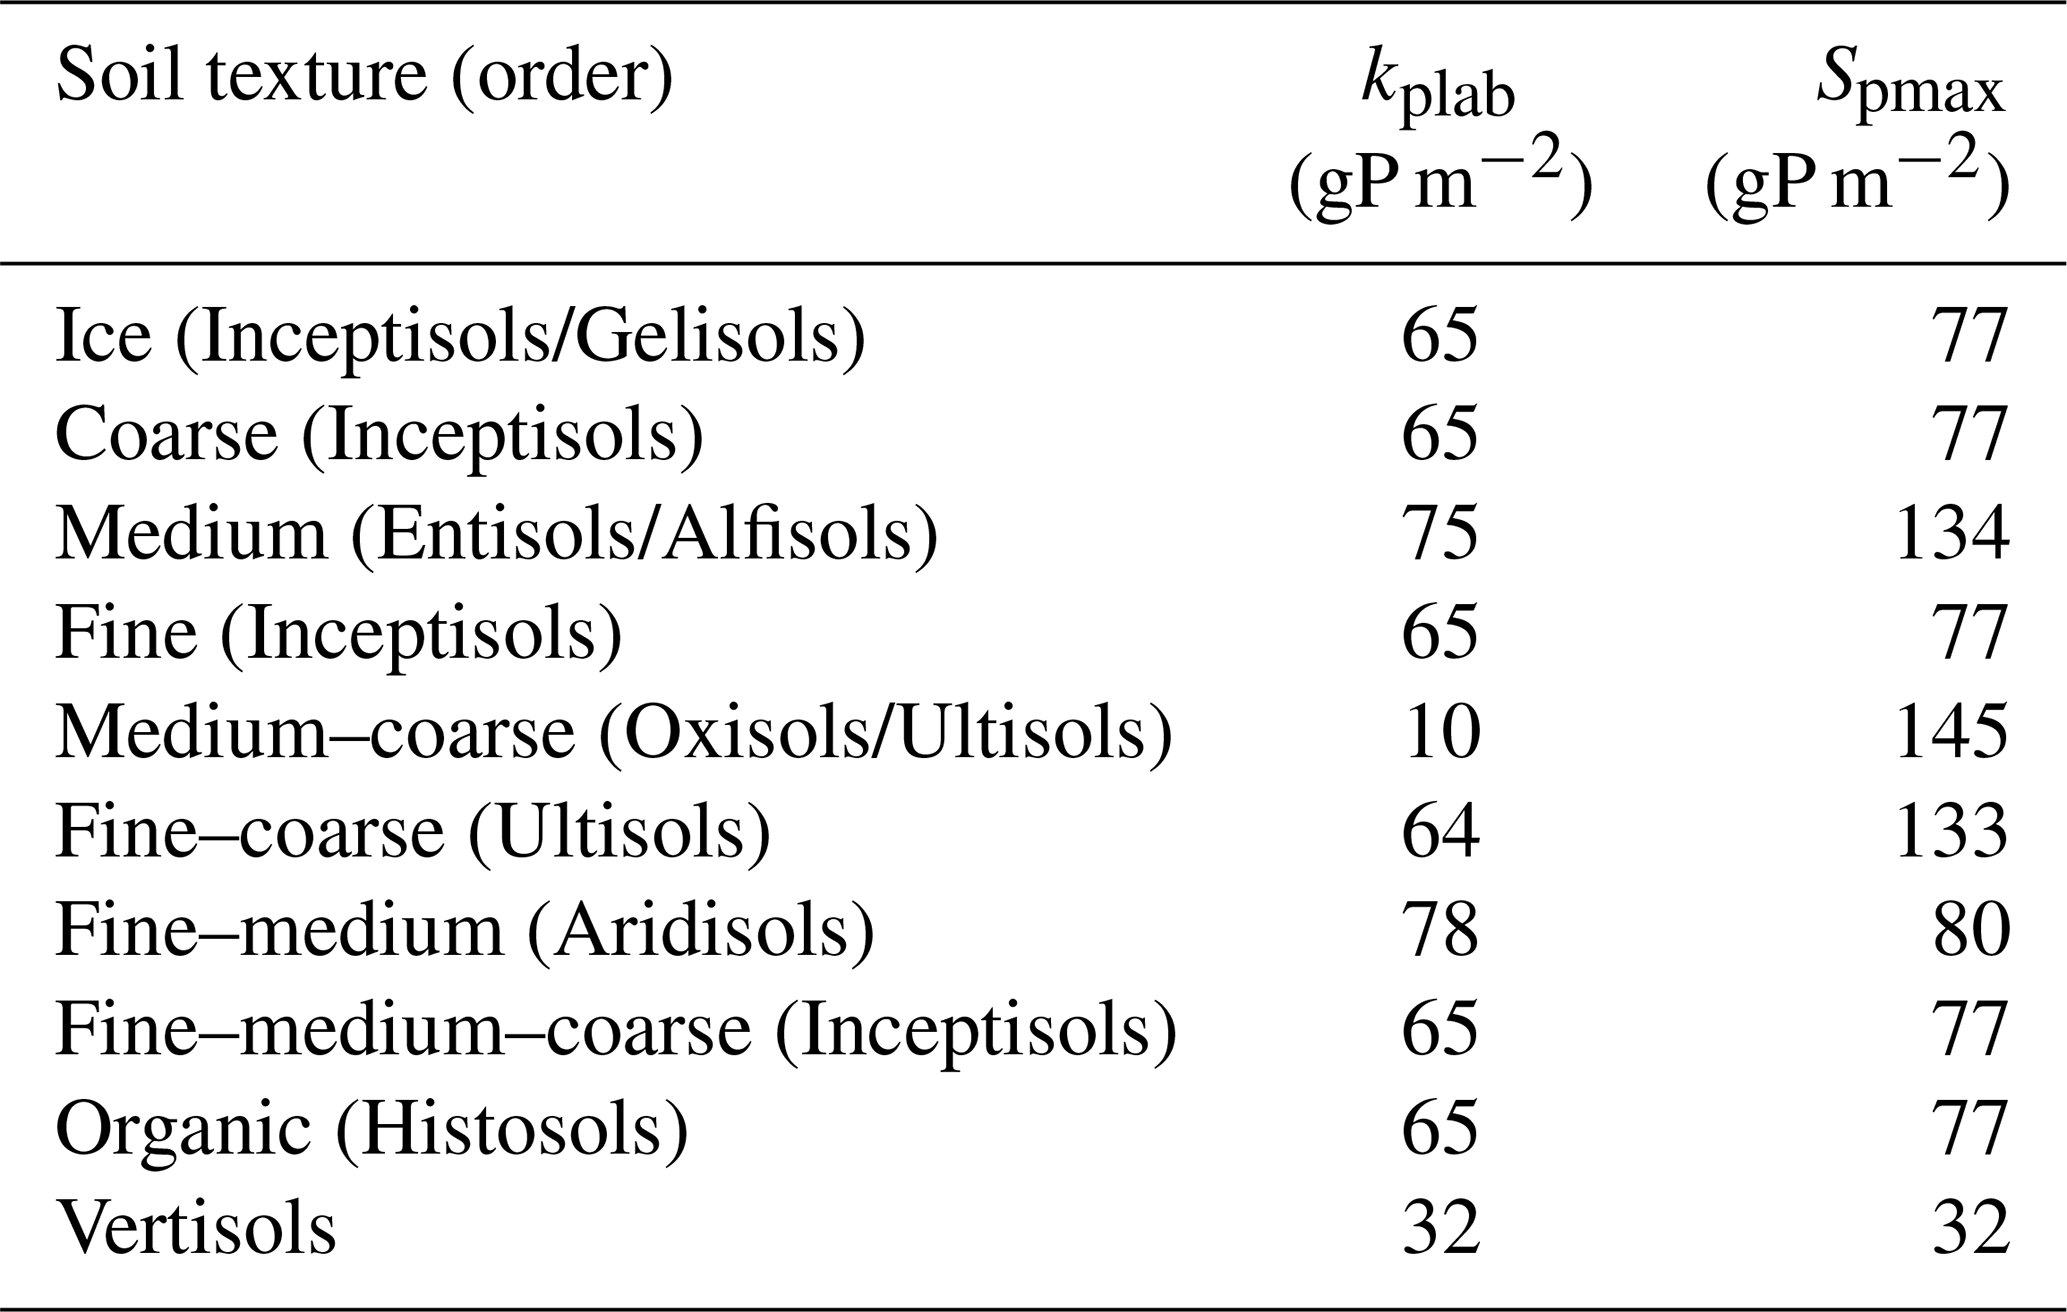
An overview of the soil and vegetation interaction scheme is given in Fig. 1. The P soil implementation was included into the existing organic and inorganic matter pools established in the soil module developed for the N cycle (Smith et al., 2014). New organic matter pools exclusive to the P cycle were the available P pool (representing mineral P which plants can readily uptake), the sorbed P pool, and the strongly sorbed P pool (Fig. 1). For the sorption and adsorption processes, which determine the dynamics between the available, sorbed, and strongly sorbed pools, we used the equations of the CASA-CNP model by Wang et al. (2007, 2010). Here, the relationship between sorbed and available pools is based on Langmuir equations (Bolster and Hornberger, 2007) and is calculated daily. The relationship between sorbed and strongly sorbed pools is proportional to the amount of sorbed P in the soil (Eq. A2). From Wang et al. (2010), we also used the soil-type-specific parameters for equilibrium between sorbed and labile P (Kplab) and the maximum amount of sorbed P (Spmax) (Table A1).
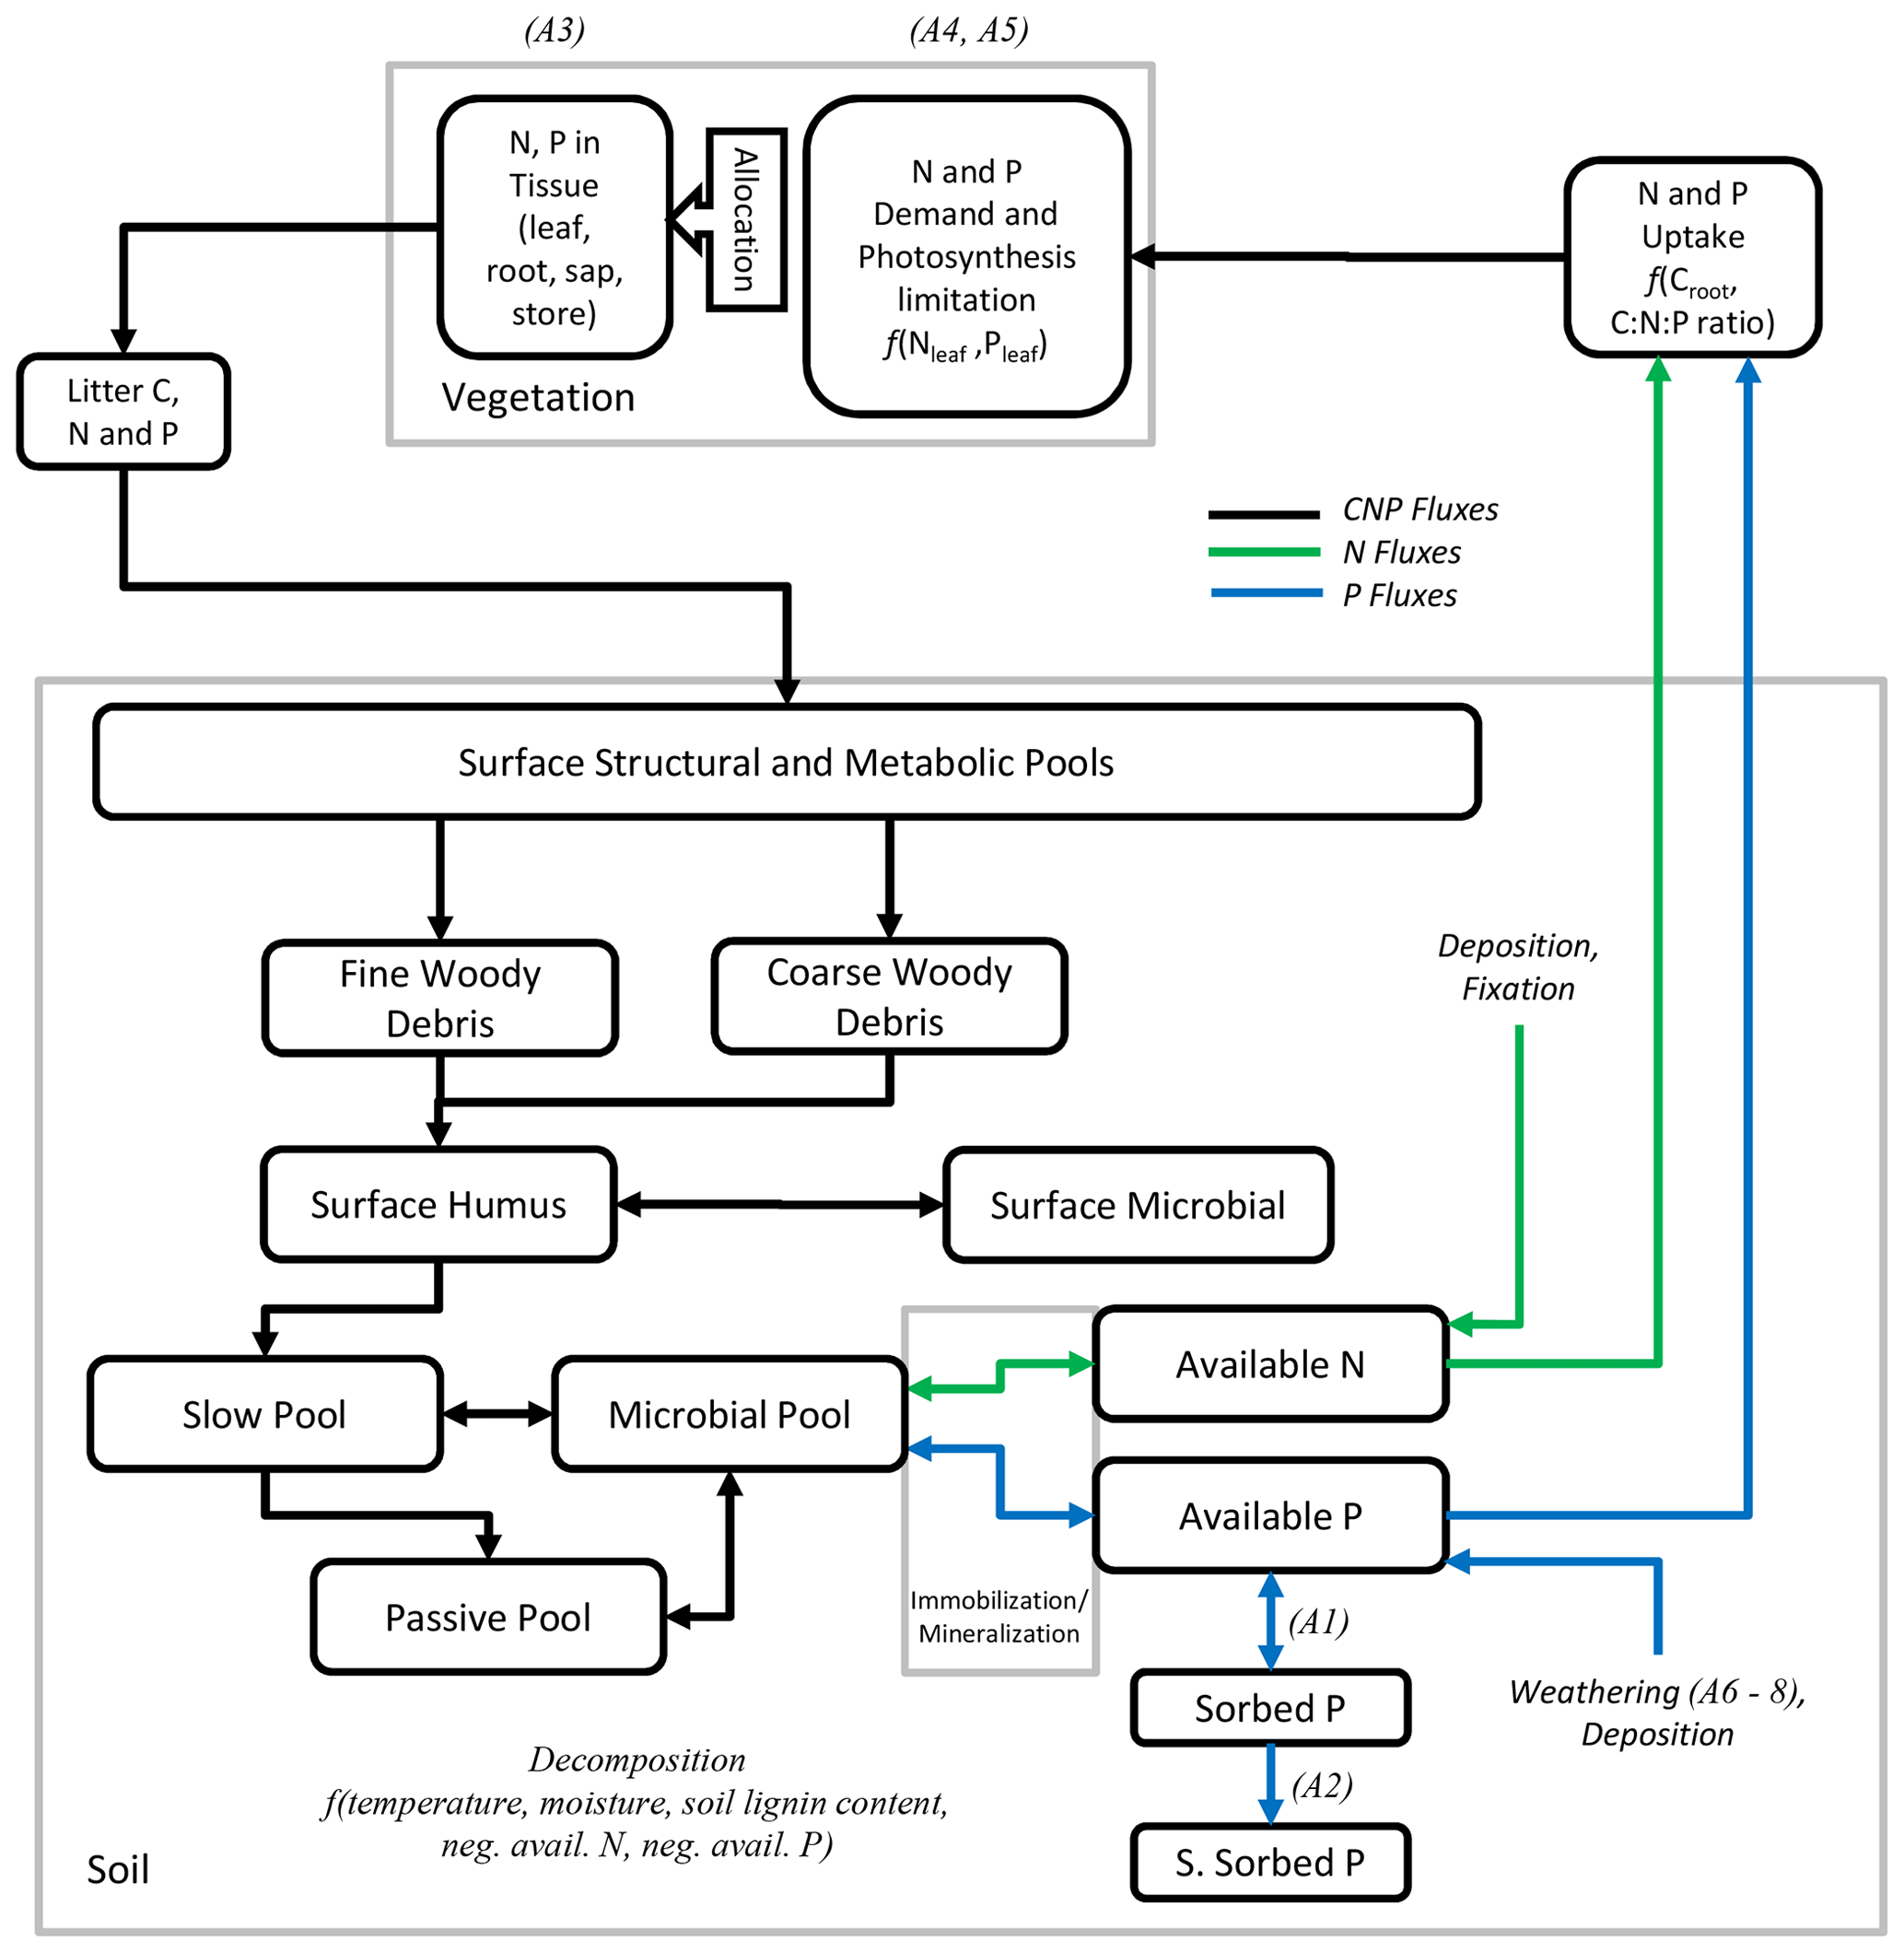
Figure 1Fluxes of C, N, and P and modelled pools of soils and vegetation. Pools connected by a blue arrow are new for the phosphorus version of LPJ-GUESS. The letter A in parentheses refer to equations in the Appendix for the related processes.
Similarly to available N in the CN version of LPJ-GUESS, the available P pool can influence decomposition rates. If immobilization is larger than available pools, decomposition rates are reduced, meaning that available N or P may can limit decay rates. Inorganic leaching follows the same approach as the N cycle in LPJ-GUESS (Smith et al., 2014), but leached organic P is retained and considered to be mineralized in order to reflect the tighter plant–soil coupling (Parton et al., 1988). Although in LPJ-GUESS, mineral soil is represented up to 150 cm, divided into 15 layers, SOM is simulated as a bulk pool without explicit depth, with the temperature and moisture of the third mineral layer (30 cm) affecting SOM dynamics. The effect of fire on the P cycle is also implemented differently than in N. While part of N contained in burnt plant tissue and litter (both fine and coarse woody debris) is volatilized and goes into the atmosphere, we consider burnt P from plant tissue and litter to be completely retained in the soil.
P weathering is a key process in P cycling and was implemented following the empirical chemical weathering model (CWM) of Hartmann and Moosdorf (2011) with the soil shielding factor (Hartmann et al., 2014). The model (Eq. A6) is initialized with the global lithological map of the Earth at a 0.5×0.5° spatial resolution, containing the model's weathering parameters for each lithological class (Hartmann and Moosdorf, 2012). Daily weathering rates are calculated for each simulated patch using soil temperature and runoff derived from LPJ-GUESS. Since runoff is influenced by vegetation structure, our model thus provides a relationship between vegetation and weathering. A detailed description of the chemical weathering model can be found in the Appendix.
2.3 P in plant tissue and uptake
Individual plants at each time step attempt to uptake P from the inorganic P pool (P labile) in accordance with their P demand, which is calculated from each individual's optimal leaf C:P value. This value specific to plant functional type (PFT) is estimated using the specific leaf area (SLA) parameter according to Eq. (S3), which was derived in turn using a global tradeoff relationship from the TRY database (Kattge et al., 2020). The amount of P each individual can take from the P labile pool is limited by the total root area (determined using root biomass) and the Michaelis–Menten uptake dynamics, parameterized using the measurements from da Silveira and Cardoso (2004), resulting in a Vmax uptake of gPO4 gC−1 d−1 and a half-saturation constant of kgPO4 L−1 In addition, individuals also compete for the available P labile in each simulated patch, following the same approach as for the previously implemented N competition in LPJ-GUESS. If the individual is not able to uptake enough P to meet its daily demand, then it is considered P-limited (which does not exclude being N-limited), leading in turn to a decrease in leaf-to-fine-root ratio (increase in relative root allocation) and a reduction in photosynthetic capacity, both on a yearly scale. P is returned to the soil organic matter through plant death and/or senescence of leaves and fine roots. In the case of the latter, a fixed 50 % of P in leaves and fine roots is resorbed before transfer to the fine-litter organic pool.
2.4 P effects on photosynthesis
In each time step, the carboxylation rate (Vcmax) of the individual is calculated as follows: (1) without considering leaf nutrient content (Vcmax), (2) considering leaf N content (Vcmax,N), and (3) considering leaf P content (Vcmax,P). In the CNP version of GUESS, the smallest of the three is the value used for Vcmax, according to Liebig's law of the minimum. More detailed information on the calculations of Vcmax and Vcmax,N can be found in Smith et al. (2014), Eq. (C10). The calculation of Vcmax,P is based on Hidaka and Kitayama (2013) for tropical trees. The equation (Eq. A4) uses the value of active P, which is a fixed fraction of leaf P content (Eq. A5) and based on the metabolic P measurements from Hidaka and Kitayama (2013). By dividing Vcmax,N or Vcmax,P by Vcmax, we establish the daily N and P limitation (0 denoting no limitation and 1 full limitation) on Vc,max for each individual cohort:
By normalizing with daily GPP (Eqs. 3 and 4) over all cohorts (Nindiv), we get daily patch average Vcmax limitations.
To get annual Vcmax limitations, we normalize similarly to Eqs. (3) and (4) the daily patch nutrient limitations with total patch GPP throughout the year. By normalizing through all the steps in calculating the annual nutrient limitations, we put a greater focus on highly productive and probably larger individual cohorts. When the nutrient limitations are known, it is also possible to determine the magnitude of co-limitation by calculating
This results in positive values for predominant N limitation and negative values for predominant P limitation. In order to account for productivity differences between grid cells, global spatial averages of Vcmax,NPlim are weighted by grid cell values of GPP.
2.5 Driving data
Our simulations were run for the years 1901 to 2018. For temperature, precipitation, and radiation, we used daily sums or averages of the CRU JRA 2.0 dataset (Harris, 2019). For CO2 concentrations, we used yearly values from IPCC (2003). N deposition was based on the ACCMIP dataset of multi-year averaged N historical values (Fig. A2a) at a 0.5×0.5° spatial resolution, ranging spatially from 0.13 to 105.62 kg ha−1 yr−1 since 2005 (Lamarque et al., 2013), which is the sum of total inorganic bulk and dry deposition of NH4 and NO3. P deposition is taken from a gridded dataset with a 2×2° spatial resolution (Fig. A2c) with fixed monthly averages, ranging spatially from 0 to 65.23 kg ha−1 yr−1 (Chien et al., 2014), which is the sum of total inorganic bulk and dry PO4 deposition and includes total soluble particles. We consider only N deposition to have a historic trend (Fig. A1), with P deposition remains unchanged during our historic time period (1901–2018). This is assumed to be due to the timescale evaluated here (100 years) since, from an aerosol deposition perspective, human perturbations into the N cycle far exceed those of any other biogeochemical cycle (Mahowald et al., 2017). N aerosols are estimated to have increased by approximately 250 % in pre-industrial conditions and over much of the industrialized regions of the Northern Hemisphere (Kanakidou et al., 2016). Main emission sources of N are from the burning of fossil fuels and the use of fertilizers in agriculture.
2.6 Model protocol, scenarios, and evaluation
In order to evaluate the implications of adding the P cycle to LPJ-GUESS, we execute the model in the CN and CNP versions, calculate global averages of C, N, and P stocks and fluxes, and we provide global maps of potential natural vegetation on a 0.5×0.5° grid covering the ice-free surfaces, averaging a part of the simulation time period (2005–2015). This time period was chosen in order to improve validation possibilities. In each grid cell, 15 patches of vegetation were simulated in which plant individuals compete for resources. In order to represent larger-scale disturbances, individual patches are randomly destroyed at an interval of 100 years. The fire module we use for our simulations is GLOBFIRM (Thonicke et al., 2001).
We then compare the simulated results to values from the literature. In order to validate the spatial patterns of the CN and CNP versions, we compare simulated vegetation biomass and GPP to the global biomass maps of ESA CCI (Santoro et al., 2021) and GOSIF GPP (Li and Xiao, 2019) respectively. The solar-induced fluorescence-based (GOSIF) dataset is preferred to other methods (e.g. MODIS GPP – light-use efficiency – or FluxCom – machine learning) due to its lower susceptibility of saturation in lower-latitude regions (Pickering et al., 2022). We also compare our global soil P stocks to the empirically derived map from He et al. (2021b) and produce global maps of Vcmax N and P limitation and establish which is dominant for each grid cell.
In order to analyse the global changes of N and P limitation of vegetation productivity from 1901 to 2018, we plotted the global average N and P limitation for each year and calculated the trends of average limitation in the period from 1901–2018 for each grid cell. Finally, aiming to evaluate the climatic and edaphic drivers of global N and P limitation changes, we conduct a factorial experiment in which temperature and precipitation are fixed at mean and detrended 1901–1931 levels, and replicated until 2018. CO2 concentration was fixed at 1901 measurements (295.3 ppm) and N deposition at 2 kg ha−1 yr−1 N. The scenarios considered for these factorial runs are in the following denoted as Allfixed (all four drivers fixed), CO2var (only CO2 concentrations varying according to observations), Tempvar (only temperature varying according to observations), Precvar (only precipitation varying according to observations), and Ndepvar (only N deposition varying according to observations).
3.1 Global CNP stocks, fluxes, and evaluation
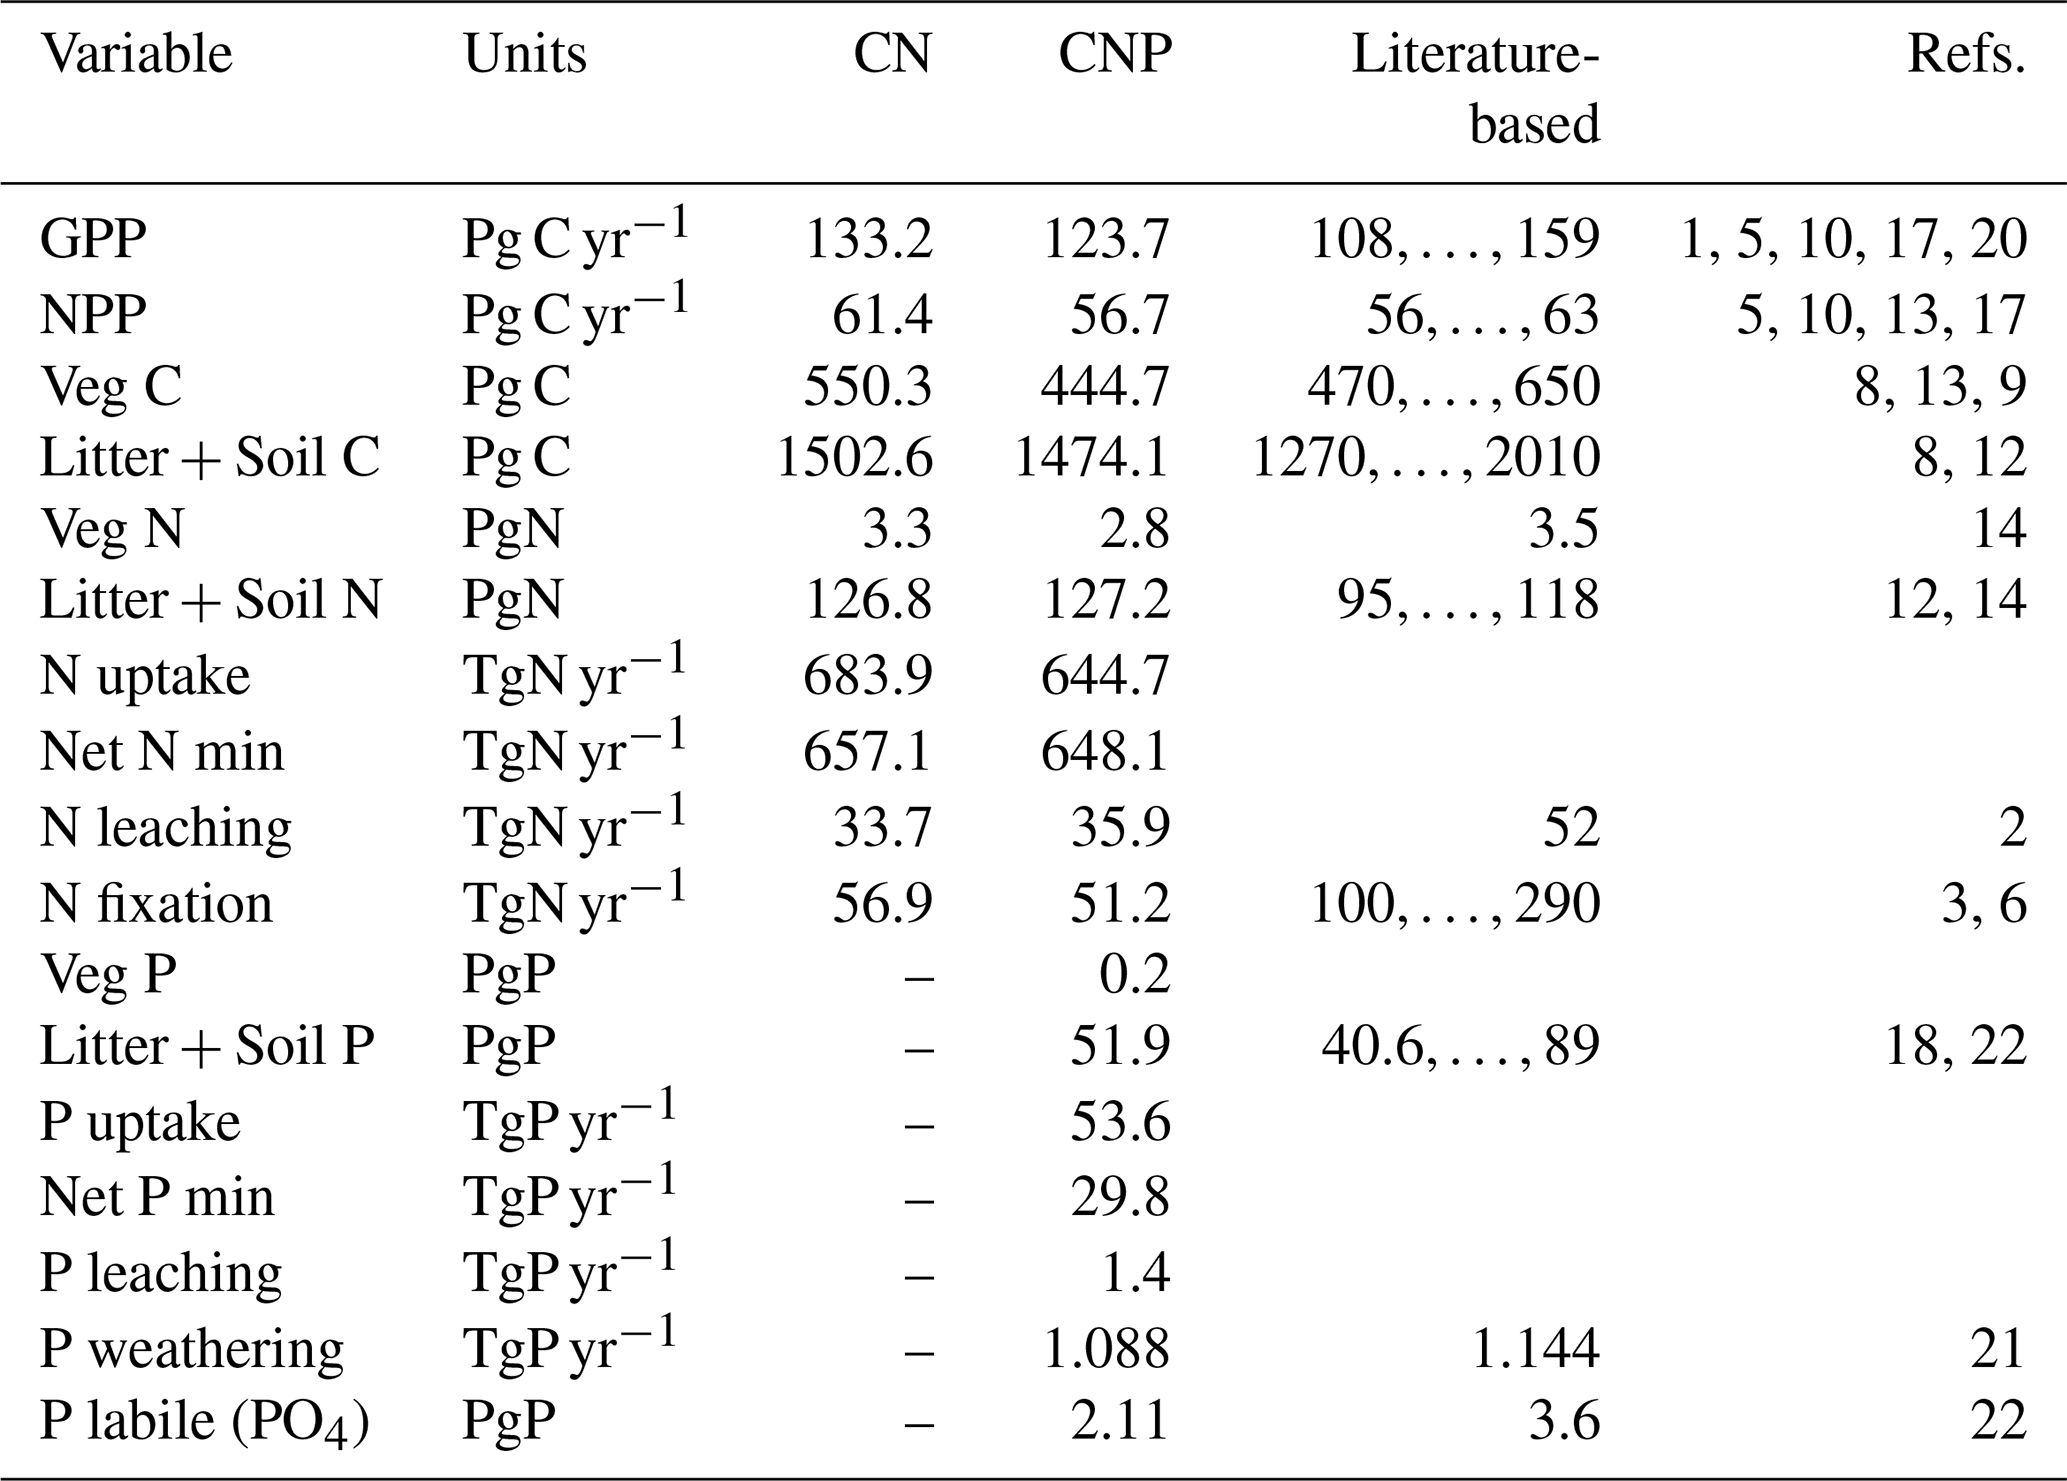
In general terms, including the P cycle and vegetation limitations to P availability reduced plant productivity and biomass as well as the other element stocks and fluxes (Table 1). In relation to the CN version, CNP reduced GPP by 7 % and biomass by 19 %. With regards to observations, both model version CN and CNP values fall within ranges for GPP, net primary productivity (NPP), Veg C, Veg N, Litter + Soil C, and overestimated Litter + Soil N. Values for Litter + Soil N, N leaching, Litter + Soil P, and P labile are underestimated but in general correspond to the order of magnitude (Table 1).
Table 1Mean Global C, N, and P stocks and fluxes for the N-only (CN) and N-with-P (CNP) simulation runs. Soil C, N, or P refers to total organic matter pools without litter pools; litter refers to pools of shed leaves, fine roots, and fine and coarse woody debris and is added through vegetation tissue turnover. The references used are as follows: (1) Beer et al. (2010); (2) Boyer et al. (2006); (3) Cleveland et al. (1999); (4) Cleveland and Liptzin (2007); (5) Demarty et al. (2007); (6) Galloway et al. (2004); (7) House et al. (2003); (8) IPCC (2007); (9) Ito and Penner (2004); (10) Ito (2011); (11) Piao et al. (2010); (12) Post et al. (1985); (13) Saugier and Roy (2001); (14) Schlesinger (1997); (15) Schultz et al. (2008); (16) van der Werf et al. (2010); (17) Zhang et al. (2009); (18) He et al. (2021b); (19) Santoro et al. (2021); (20) Li and Xiao (2019); (21) Hartmann et al. (2014); (22) Yang et al. (2013). The time period for the simulated averages is 2005–2015.
Global patterns of biomass and productivity changed noticeably between the CN and CNP model versions (Fig. 2). Activating the P cycle resulted in a significantly lower biomass, particularly in the tropical region and also less prominently in northeastern USA and northern Europe (Fig. 2c). GPP also decreased most strongly in the tropics with the inclusion of the P cycle and showed changes in temperate and boreal zones, with increases even in southern Finland and western Russia (Fig. 2d).
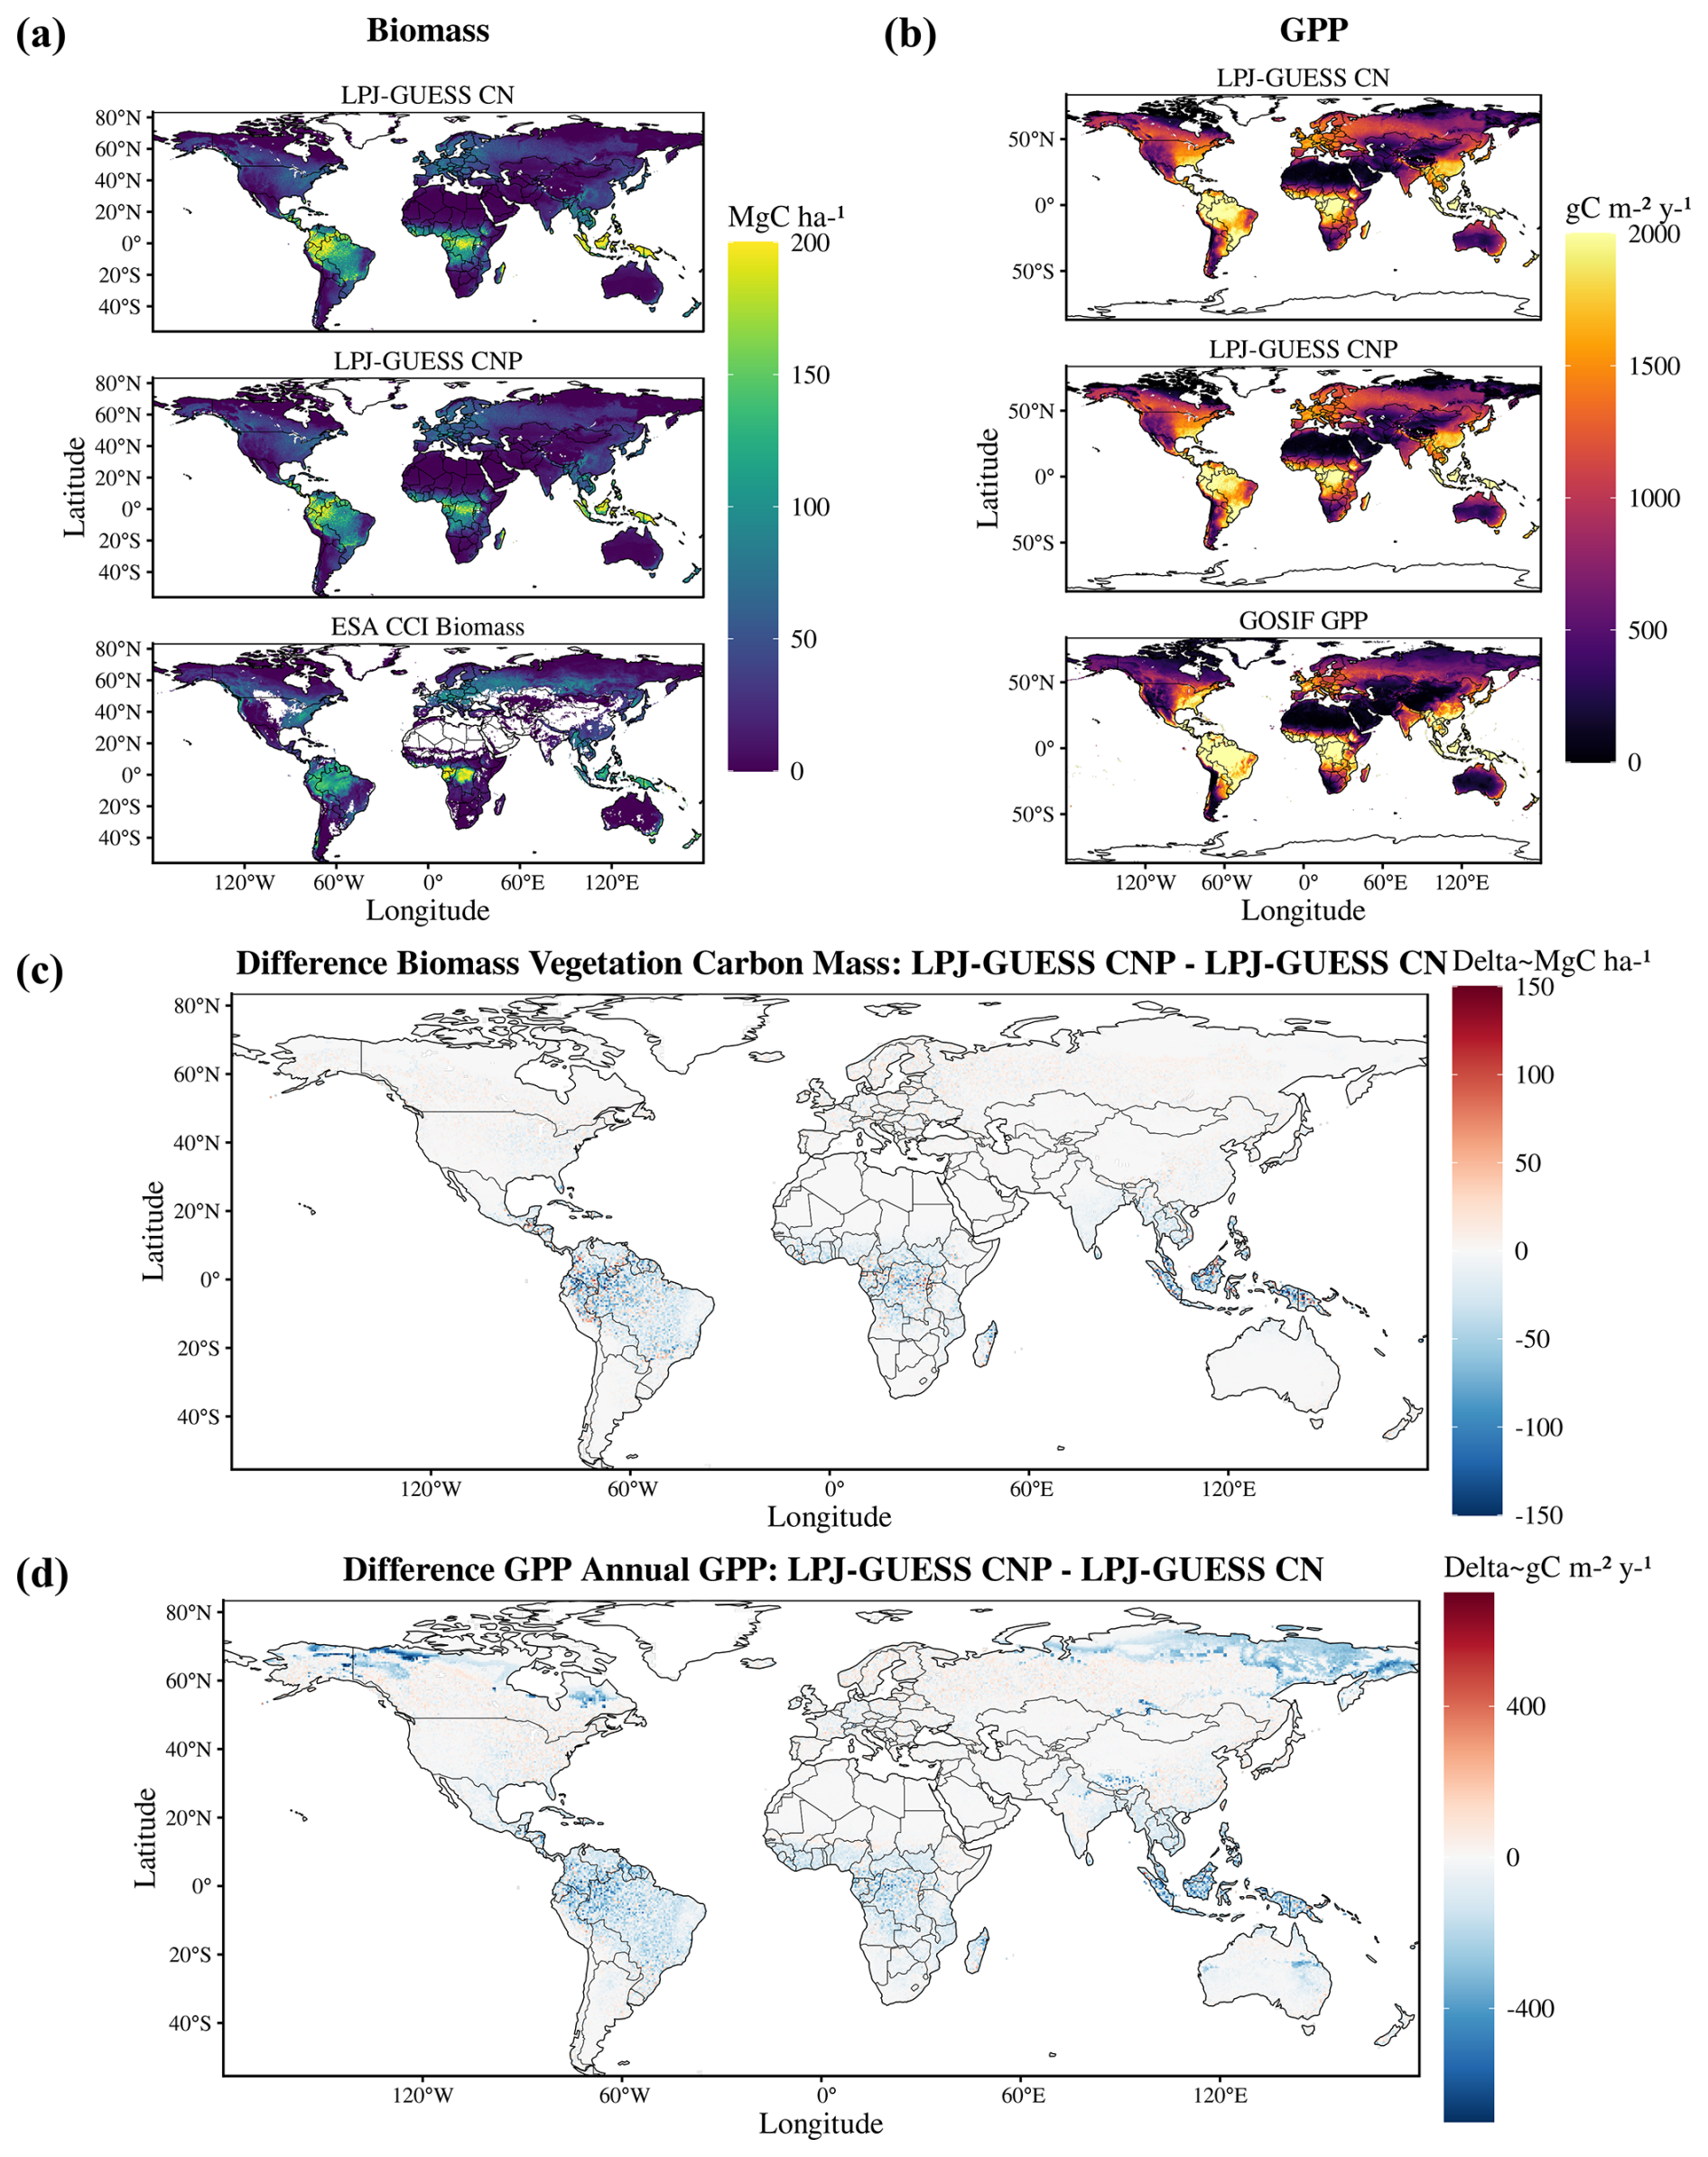
Figure 2Global maps of biomass (a) and GPP (b) for the CN and CNP model simulations and evaluation datasets (biomass data taken from Santoro et al., 2021, and GPP from Li and Xiao, 2019). In panels (c) and (d), the maps indicate the differences between the two model setups. Negative values indicate lower estimates by the CNP version.
Estimates of model error and fit to the reference ESA CCI biomass map show that including the P cycle improves simulated results of global vegetation C stocks. In relation to the reference data, we observe a general reduction of model error from the CN to the CNP version (Table 2). This resulted in less deviation from the reference ESA CCI biomass map (Fig. 3a). With regards to GPP, the already evident underestimation of GPP in relation to GOSIF data was exacerbated in the CNP version, which is expected due to the inclusion of the extra factor of limitation to productivity. This resulted in a worsening of fit to observations from CN to CNP, when considering the GOSIF dataset as reference (Fig. 3b).
Table 2Statistical measures of the comparisons of model runs to the ESA CCI Biomass and GOSIF GPP maps. The values are calculated using the R DGVMTools package (https://github.com/MagicForrest/DGVMTools, last access: August 2024).
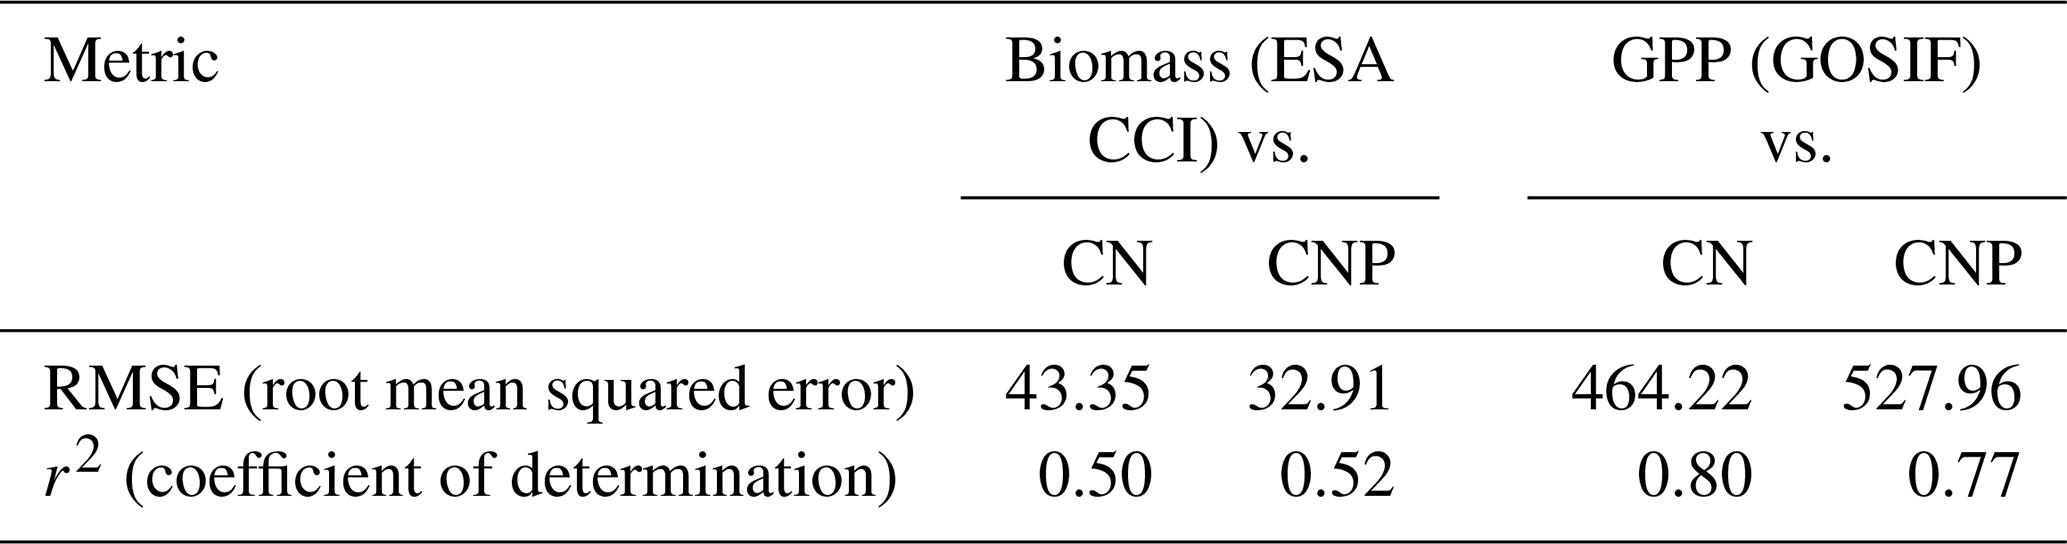
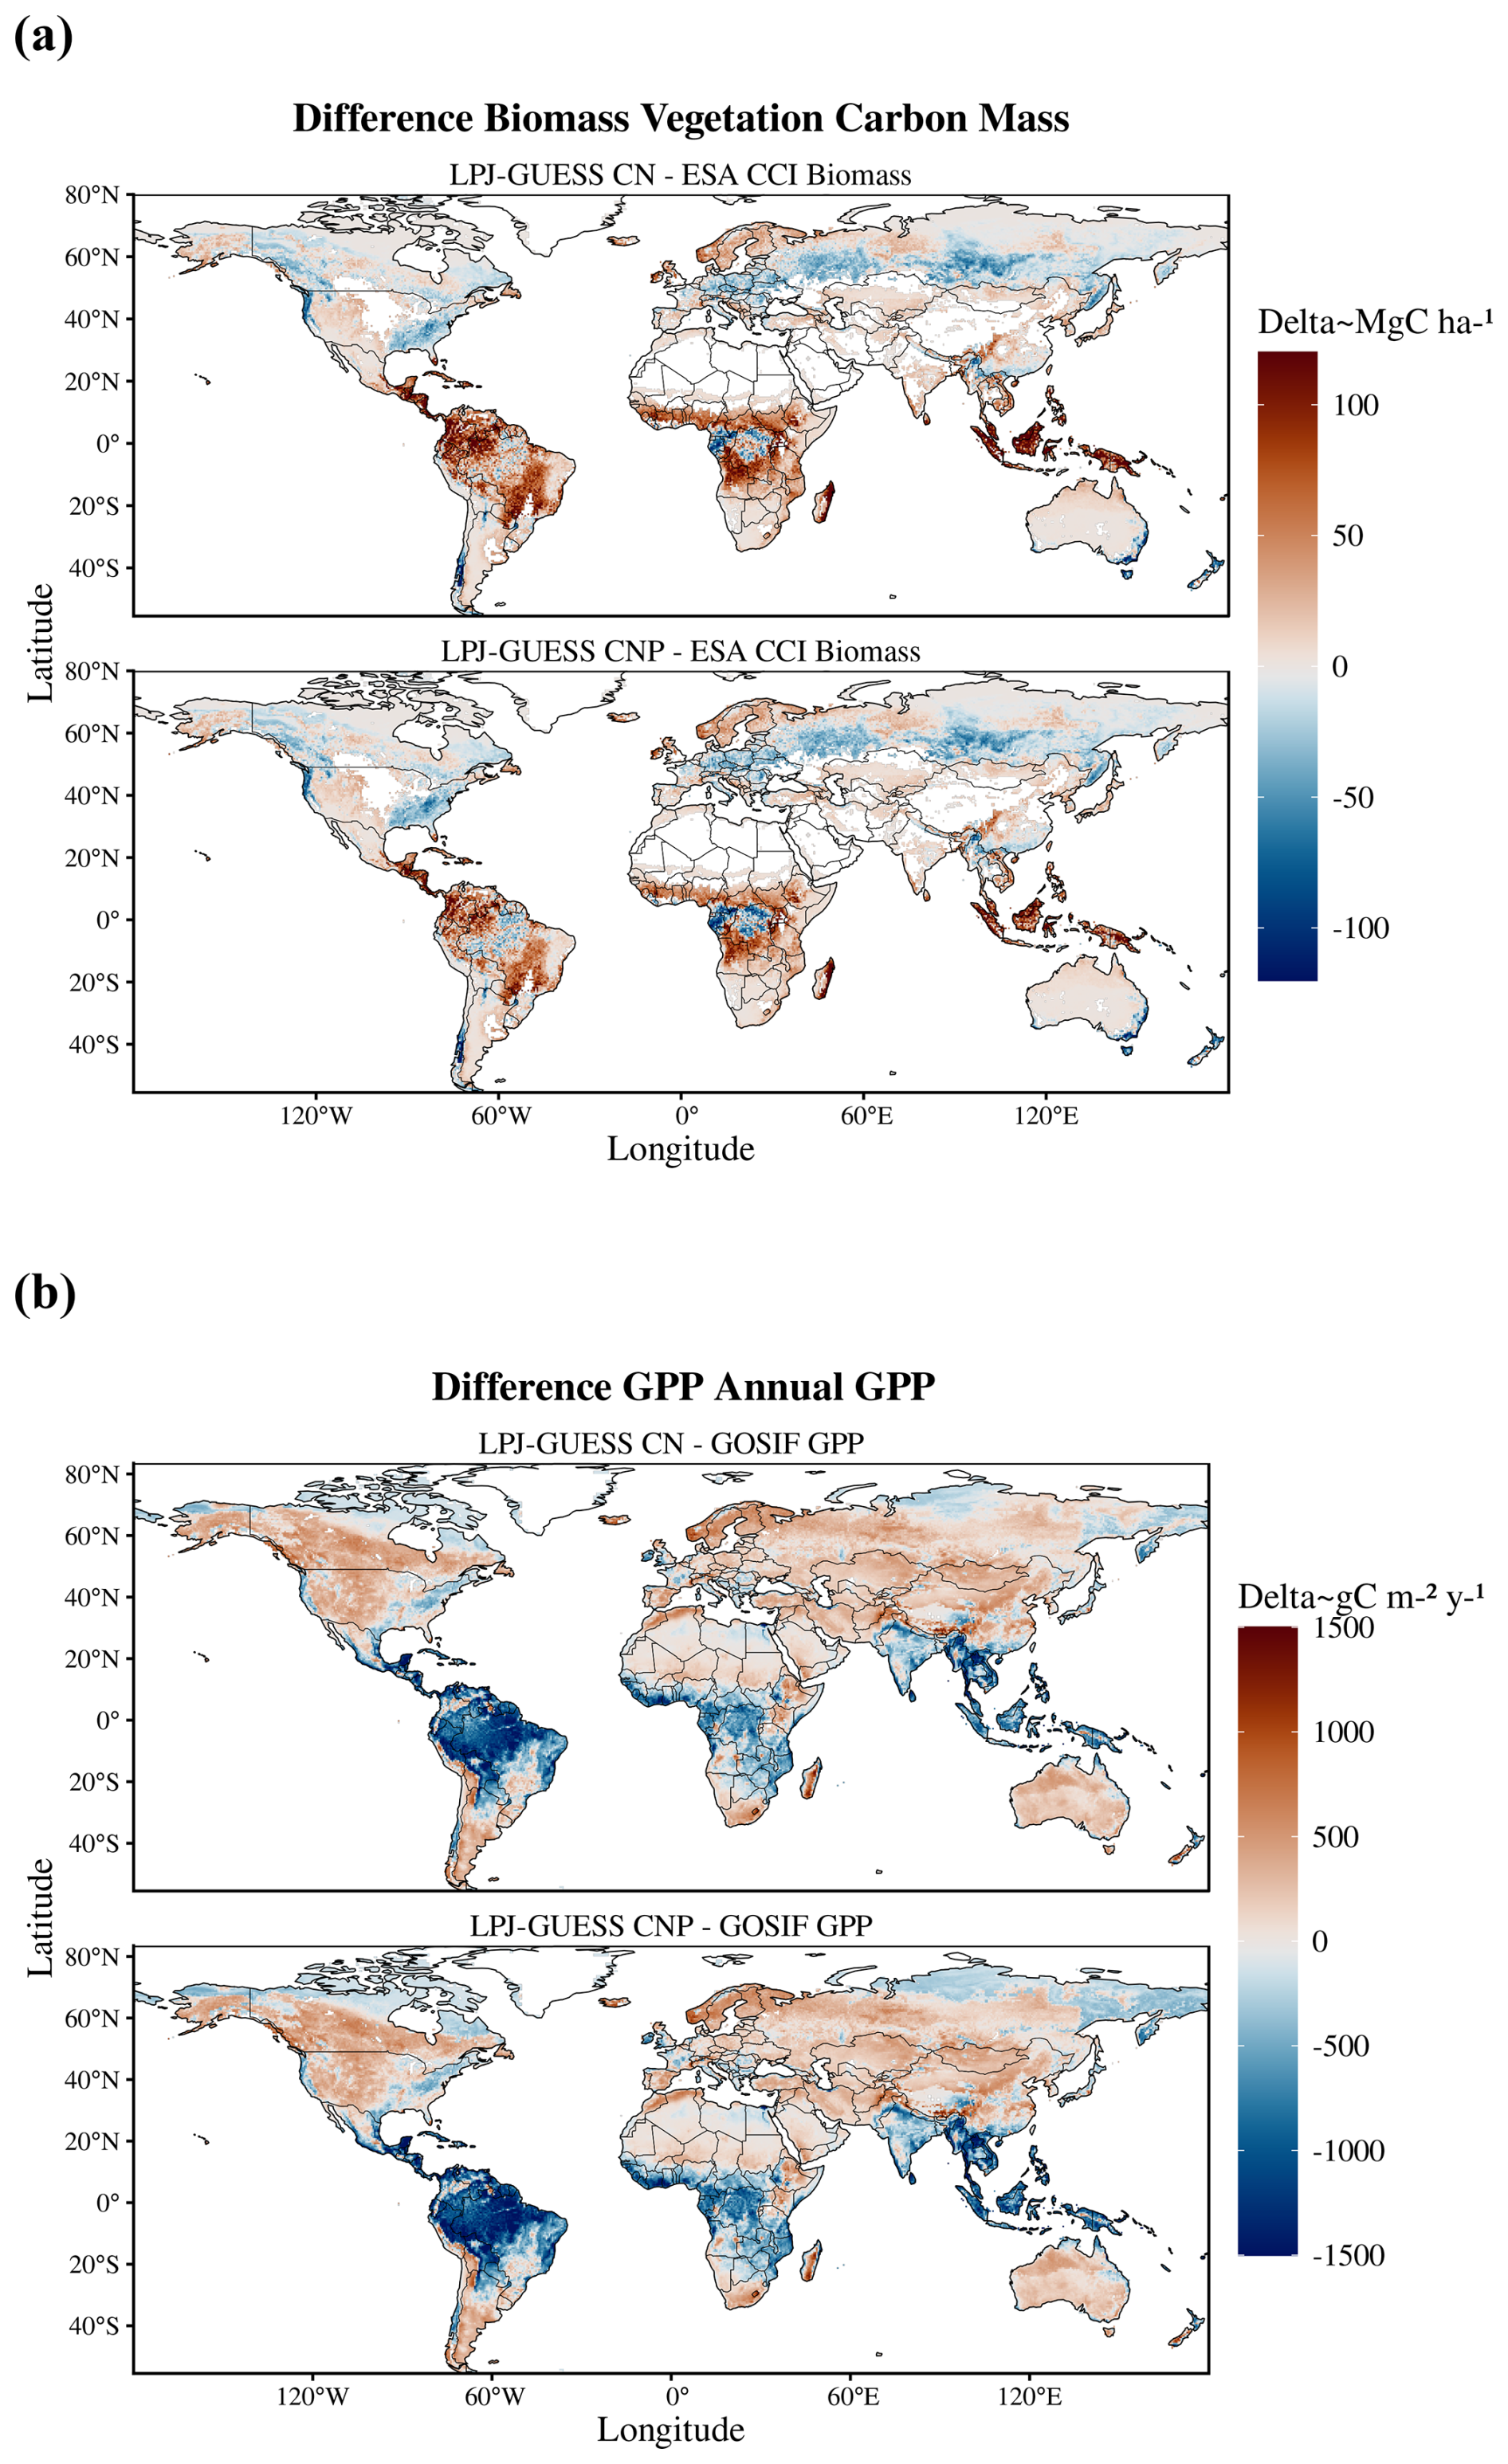
Figure 3Differences between model simulations and global biomass regarding (a) and GPP (b) reference maps. Red are model overestimations, blue are underestimations.
3.2 Global simulated spatial patterns of N and P limitation and P stocks
Spatial averages of N limitation for the period from 2005–2018 show the lowest values for the tropics, and P limitation show a less predictable pattern (Fig. 4a and b). The global plots of predominant N and P productivity limitation resulted in the expected global spatial patterns from other studies. For example, similarly to the map produced by Du et al. (2020), our simulated map show predominant N limitation in higher latitudes, dry areas, and higher elevations and predominant P limitation throughout the tropical region (Fig. 4c). Differently from Du et al. (2020), our map results in less grid cells being predominantly P-limited (27 %), with the rest (and the majority) being N-limited.
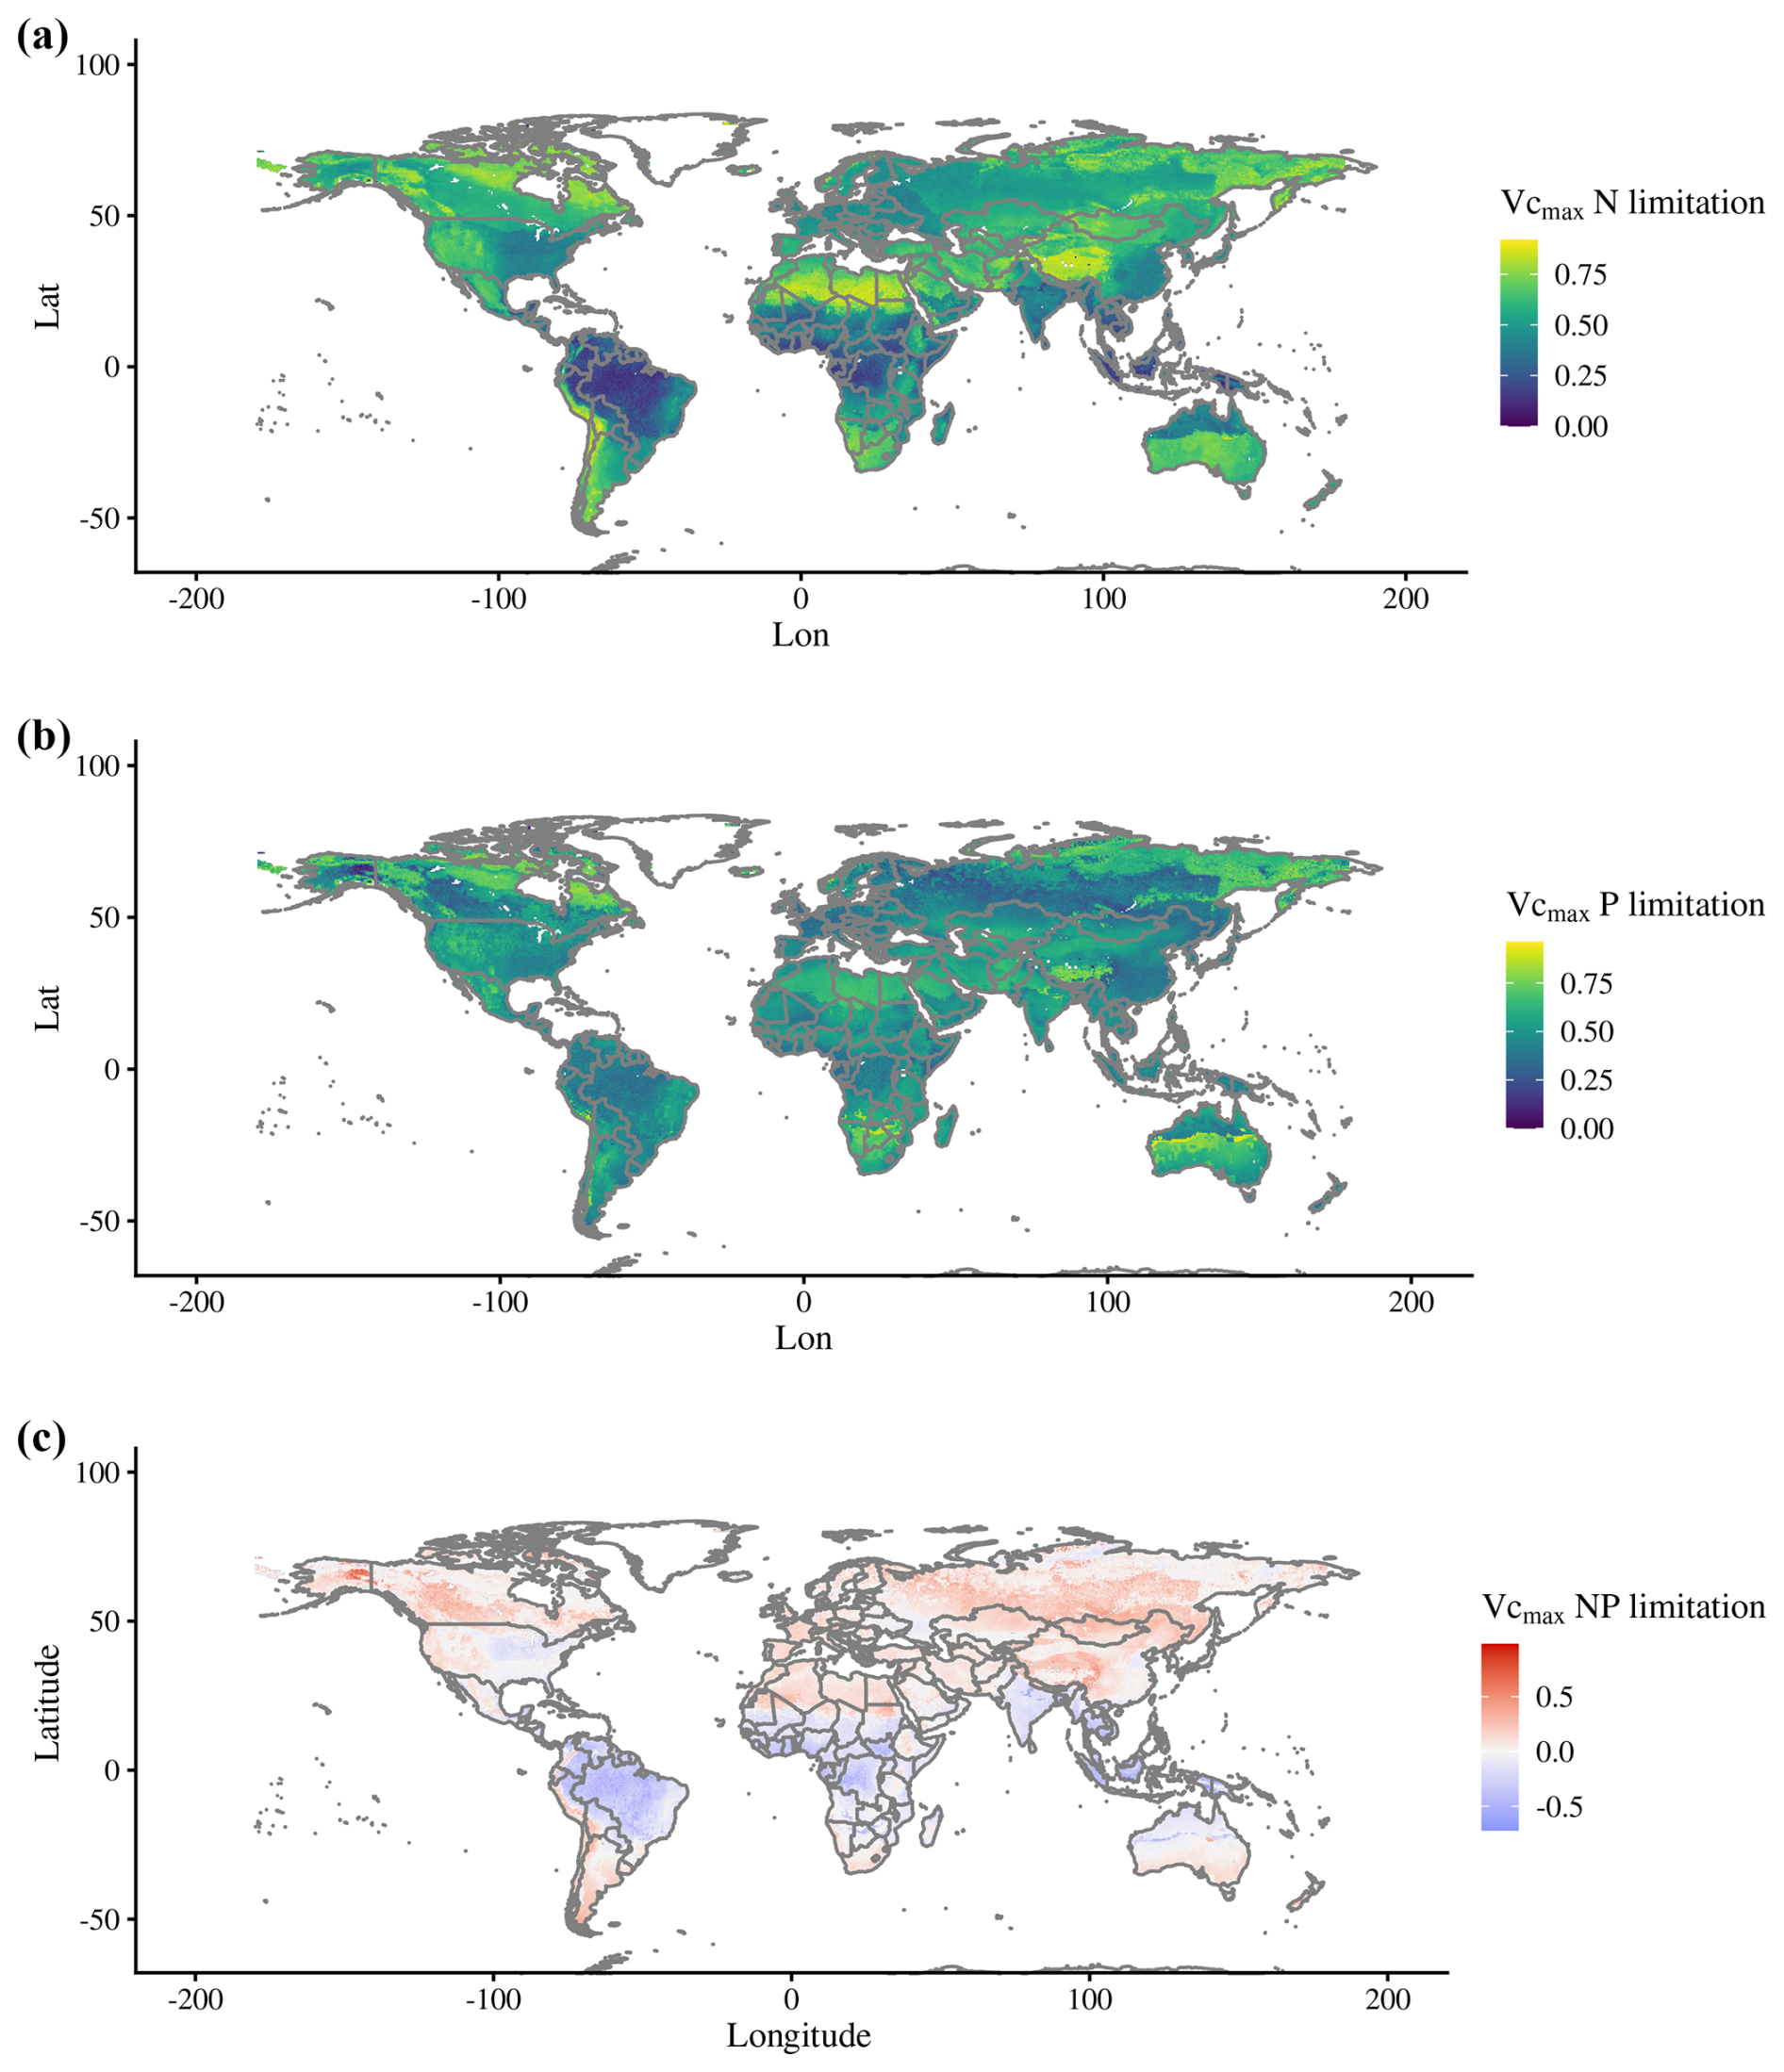
Figure 4Global maps of (a) N and (b) P limitation, where 0 represents no limitation to Vcmax (unitless) and 1 represents complete limitation. (c) Map of predominant N or P limitation calculated using Eq. (3), with positive values being predominantly N-limited and negative values predominantly P-limited. Values for each grid cell are averages for 2005–2018.
Simulated organic stocks of P (Litter + Soil P) show a very similar spatial pattern to the field-based estimates from He et al. (2021b), with the highest soil organic P rocks being in Canada and Russia (Fig. 5a). The model also correctly predicted higher P stocks in tropical high elevations, such as the Andes, but failed to predict the high stocks of the Tibetan Plateau. Soil labile P stocks (Fig. 5b) look similar to a combination of P deposition and weathering (Fig. A2d) and are influenced by water runoff. N fixation results show an expected spatial pattern of high values in the tropical regions and lower values elsewhere (Fig. A2b).
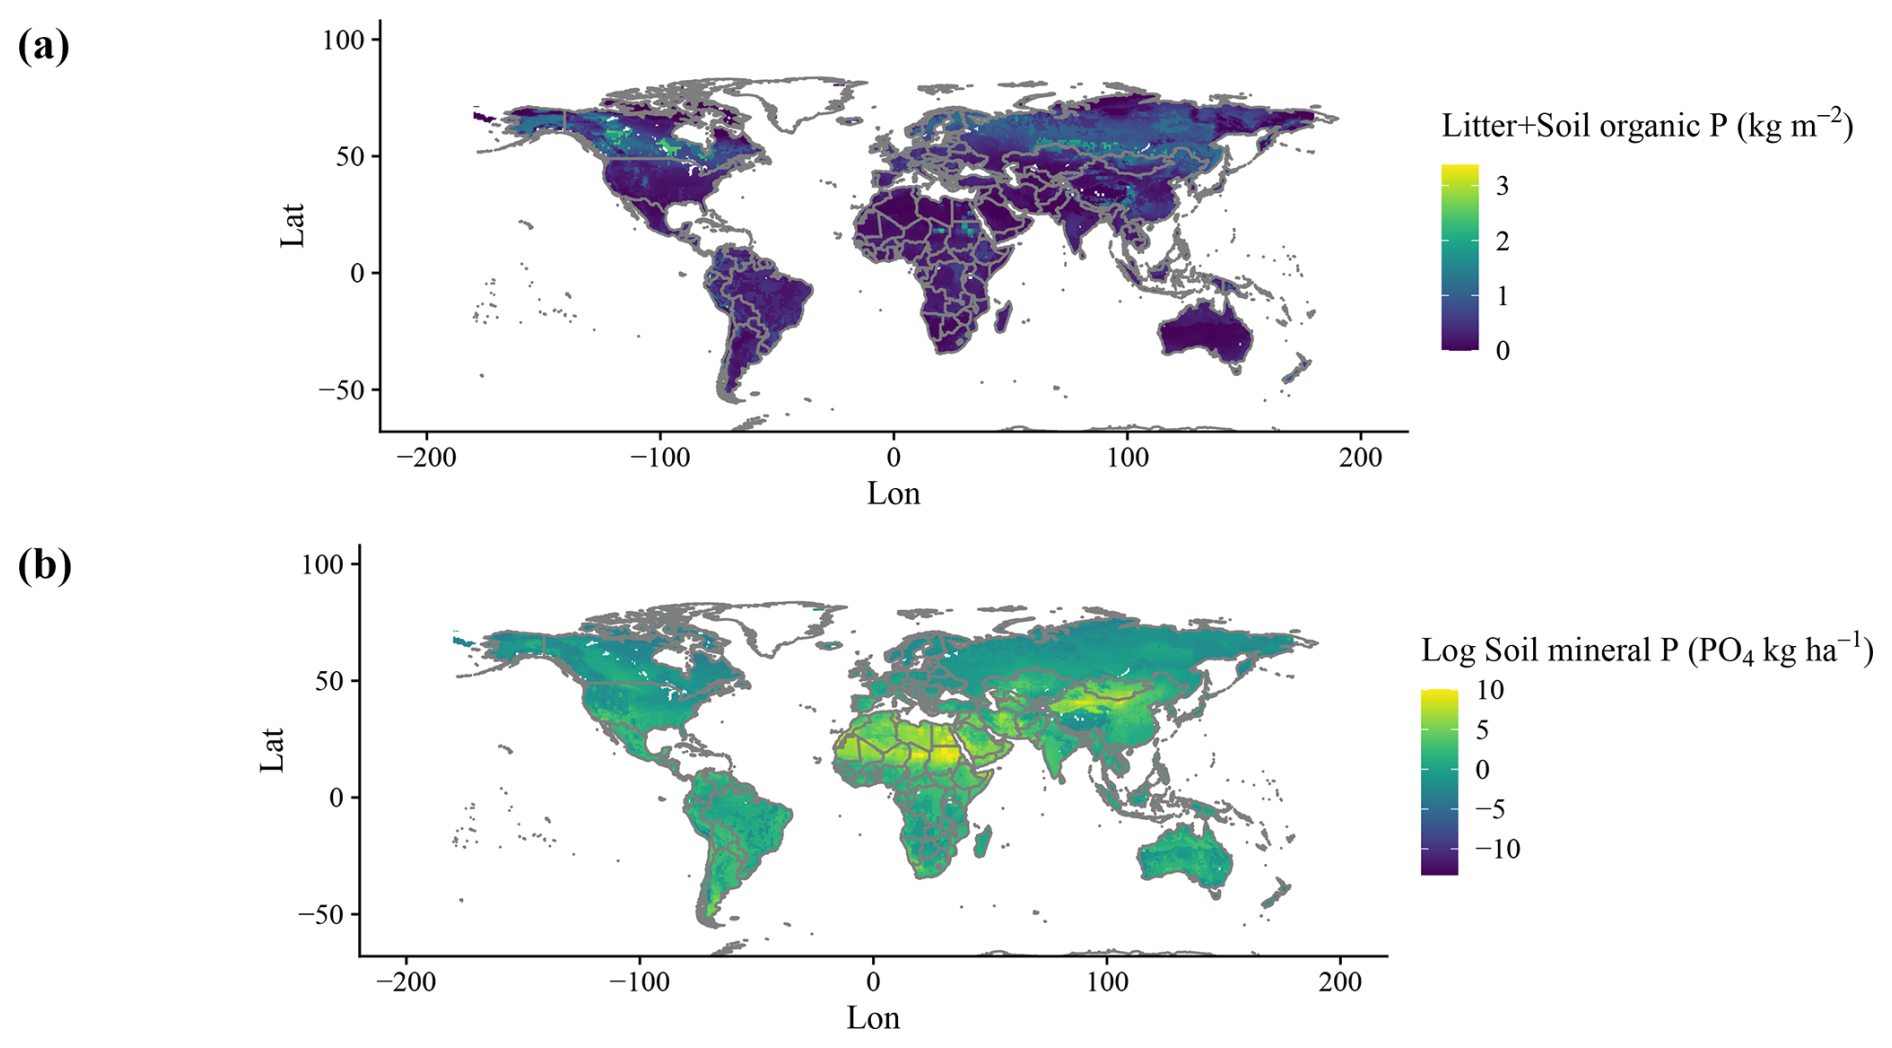
Figure 5Global maps of soil organic (a) and labile (b) P stocks. Soil P refers to total organic matter pools without litter pools; litter refers to pools of shed leaves, fine roots, and fine and coarse woody debris and is added through vegetation tissue turnover.
3.3 Global historic trends of N and P limitation
Average values for N and P limitation were shown to have shifted in our simulation in response to the environmental changes, which include temperature, precipitation, CO2, and N deposition from 1901 to 2018. The trends of nutrient limitation during this time period indicate that 71 % of the grid cells showed a reduction in N limitation, while 64 % showed an increase in P limitation (Fig. 6a). This resulted in a global trend from 1901 to 2018 where N limitation decreases and P limitation increases, overtaking N limitation as the most dominant element, when accounting for grid-cell GPP (Fig. 6b).
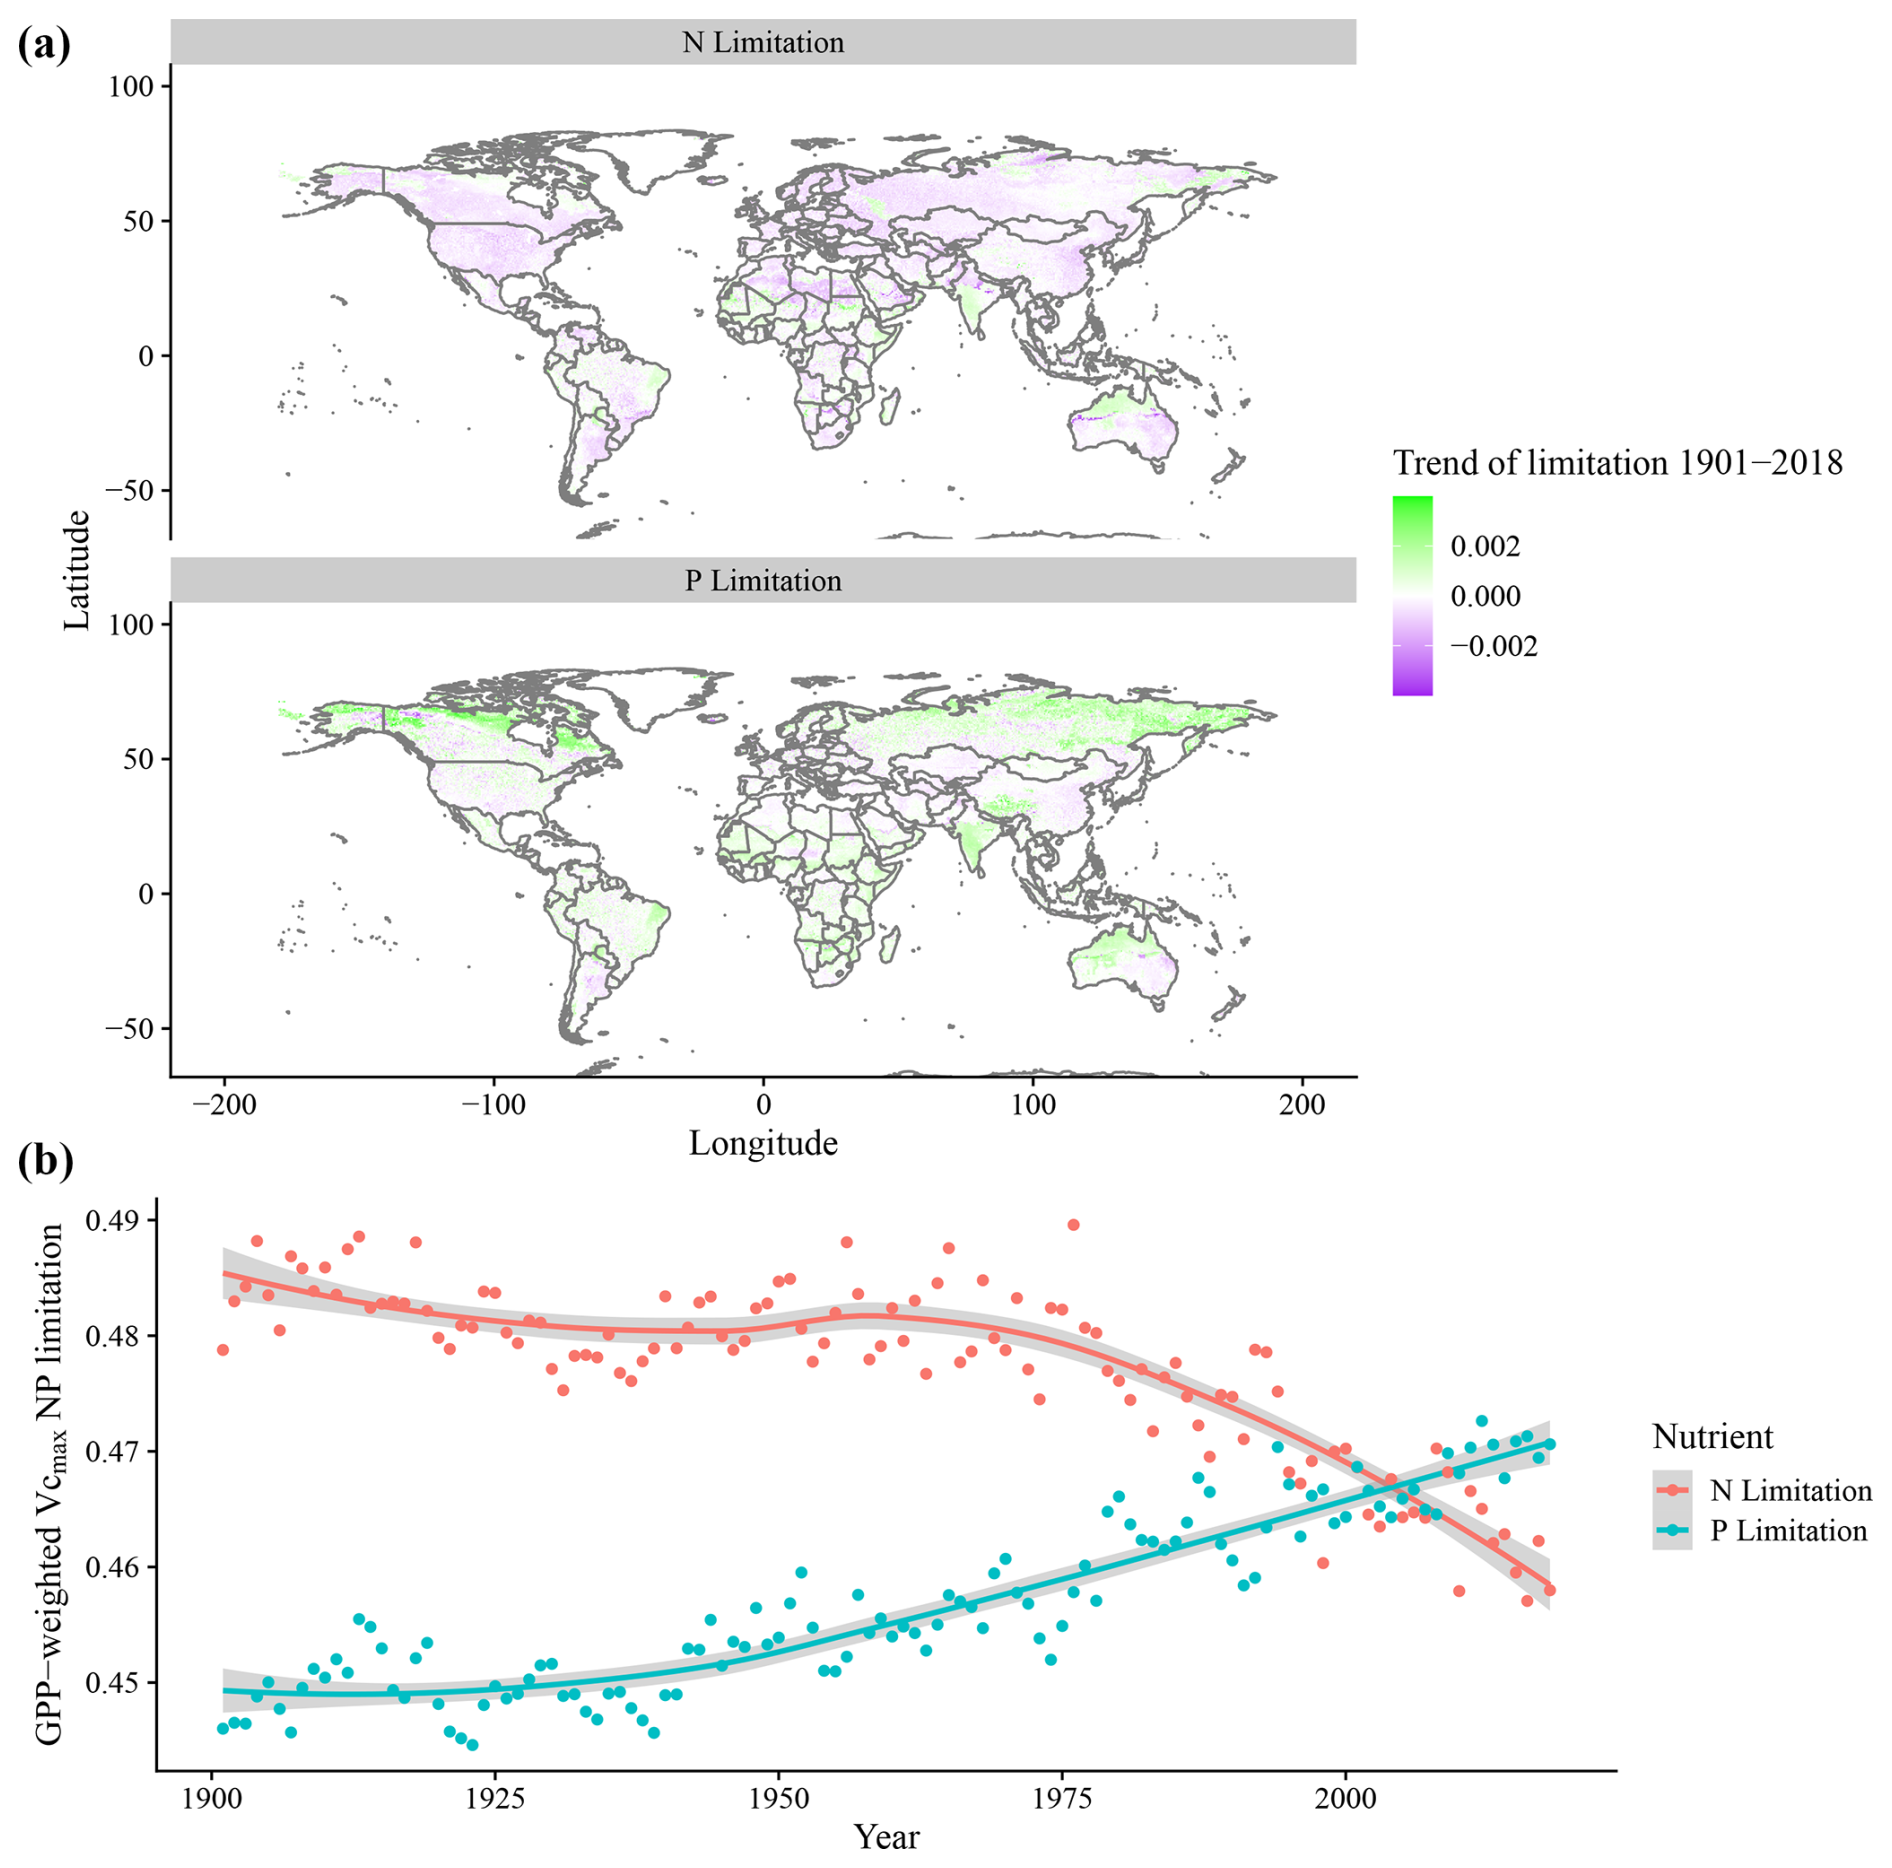
Figure 6Global simulated trends of N and P Vcmax limitation from 1901 to 2018. (a) N and P limitation trends per grid cell for the 1901–2018 period. Negative (purple) values indicate a reduction of nutrient limitation, and positive (green) values indicate increases of nutrient limitation. (b) Time series of GPP-weighted N and P Vcmax limitation, where each point represents the average global limitation for N or P for all grid cells.
When isolating the individual climatic and edaphic drivers for the model in the factorial analysis, we observe that precipitation and N deposition changes from 1901 to 2018 have little impact on global modelled Vcmax limitation even though N deposition increases strongly from 1901 to 2018 (Fig. A1). The inclusion of temperature variation significantly reduces N limitation but has only a weak effect on P limitation. Changes in CO2 concentrations increase both limitations, particularly P (Fig. 7).
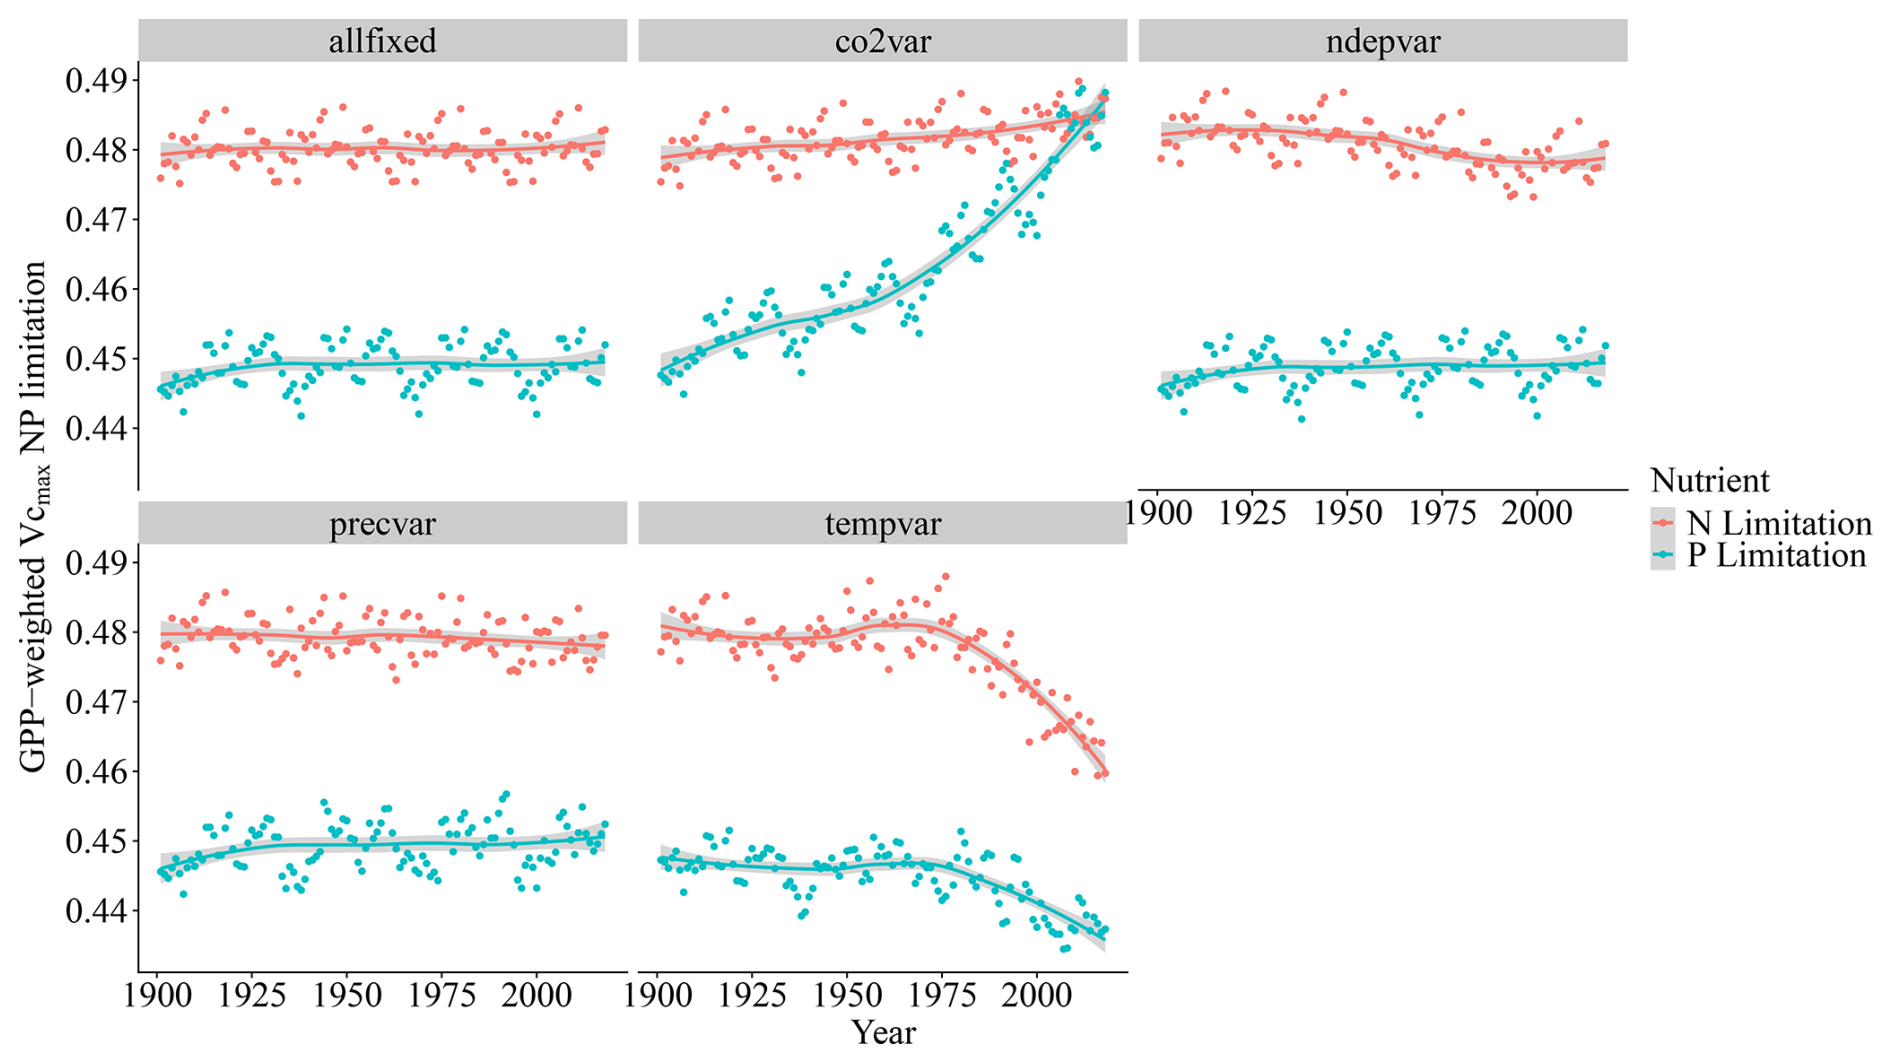
Figure 7Global simulated trends of N and P Vcmax limitation resulting from the factorial experiment.
With our implementation of the P cycle and P limitations to photosynthesis into LPJ-GUESS, we were able to (1) reduce biomass overestimations in comparison to the N-only model; (2) reproduce the expected global pattern of N and P limitation to photosynthesis, both the latitudinal and the tropical altitudinal gradient; (3) reproduce the global geographical pattern of soil organic P stocks and fluxes of P within the magnitude of global total values; and (4) provide a glimpse into the global trends of N and P limitation to vegetation productivity for the last century and which environmental factors are driving these trends.
4.1 Model evaluation and global patterns
The inclusion of the P cycle in LPJ-GUESS slightly improved the model fit compared to the CN version for biomass (Table 1; Figs. 3c and 4a). In the case of GPP, reasons for the underestimation in relation to observations for the CN and CNP versions partially lie with the model's representations of light use efficiency and light interception (i.e. FAPAR calculation) as well as the choice of the radiation input dataset. These may play a role here and contribute considerably to uncertainties. In addition, divergences between major global reference datasets of GPP (e.g. FLUXCOM and MODIS) hinder validations of process-based models, such as the one used in this study (Zhang and Ye, 2022).
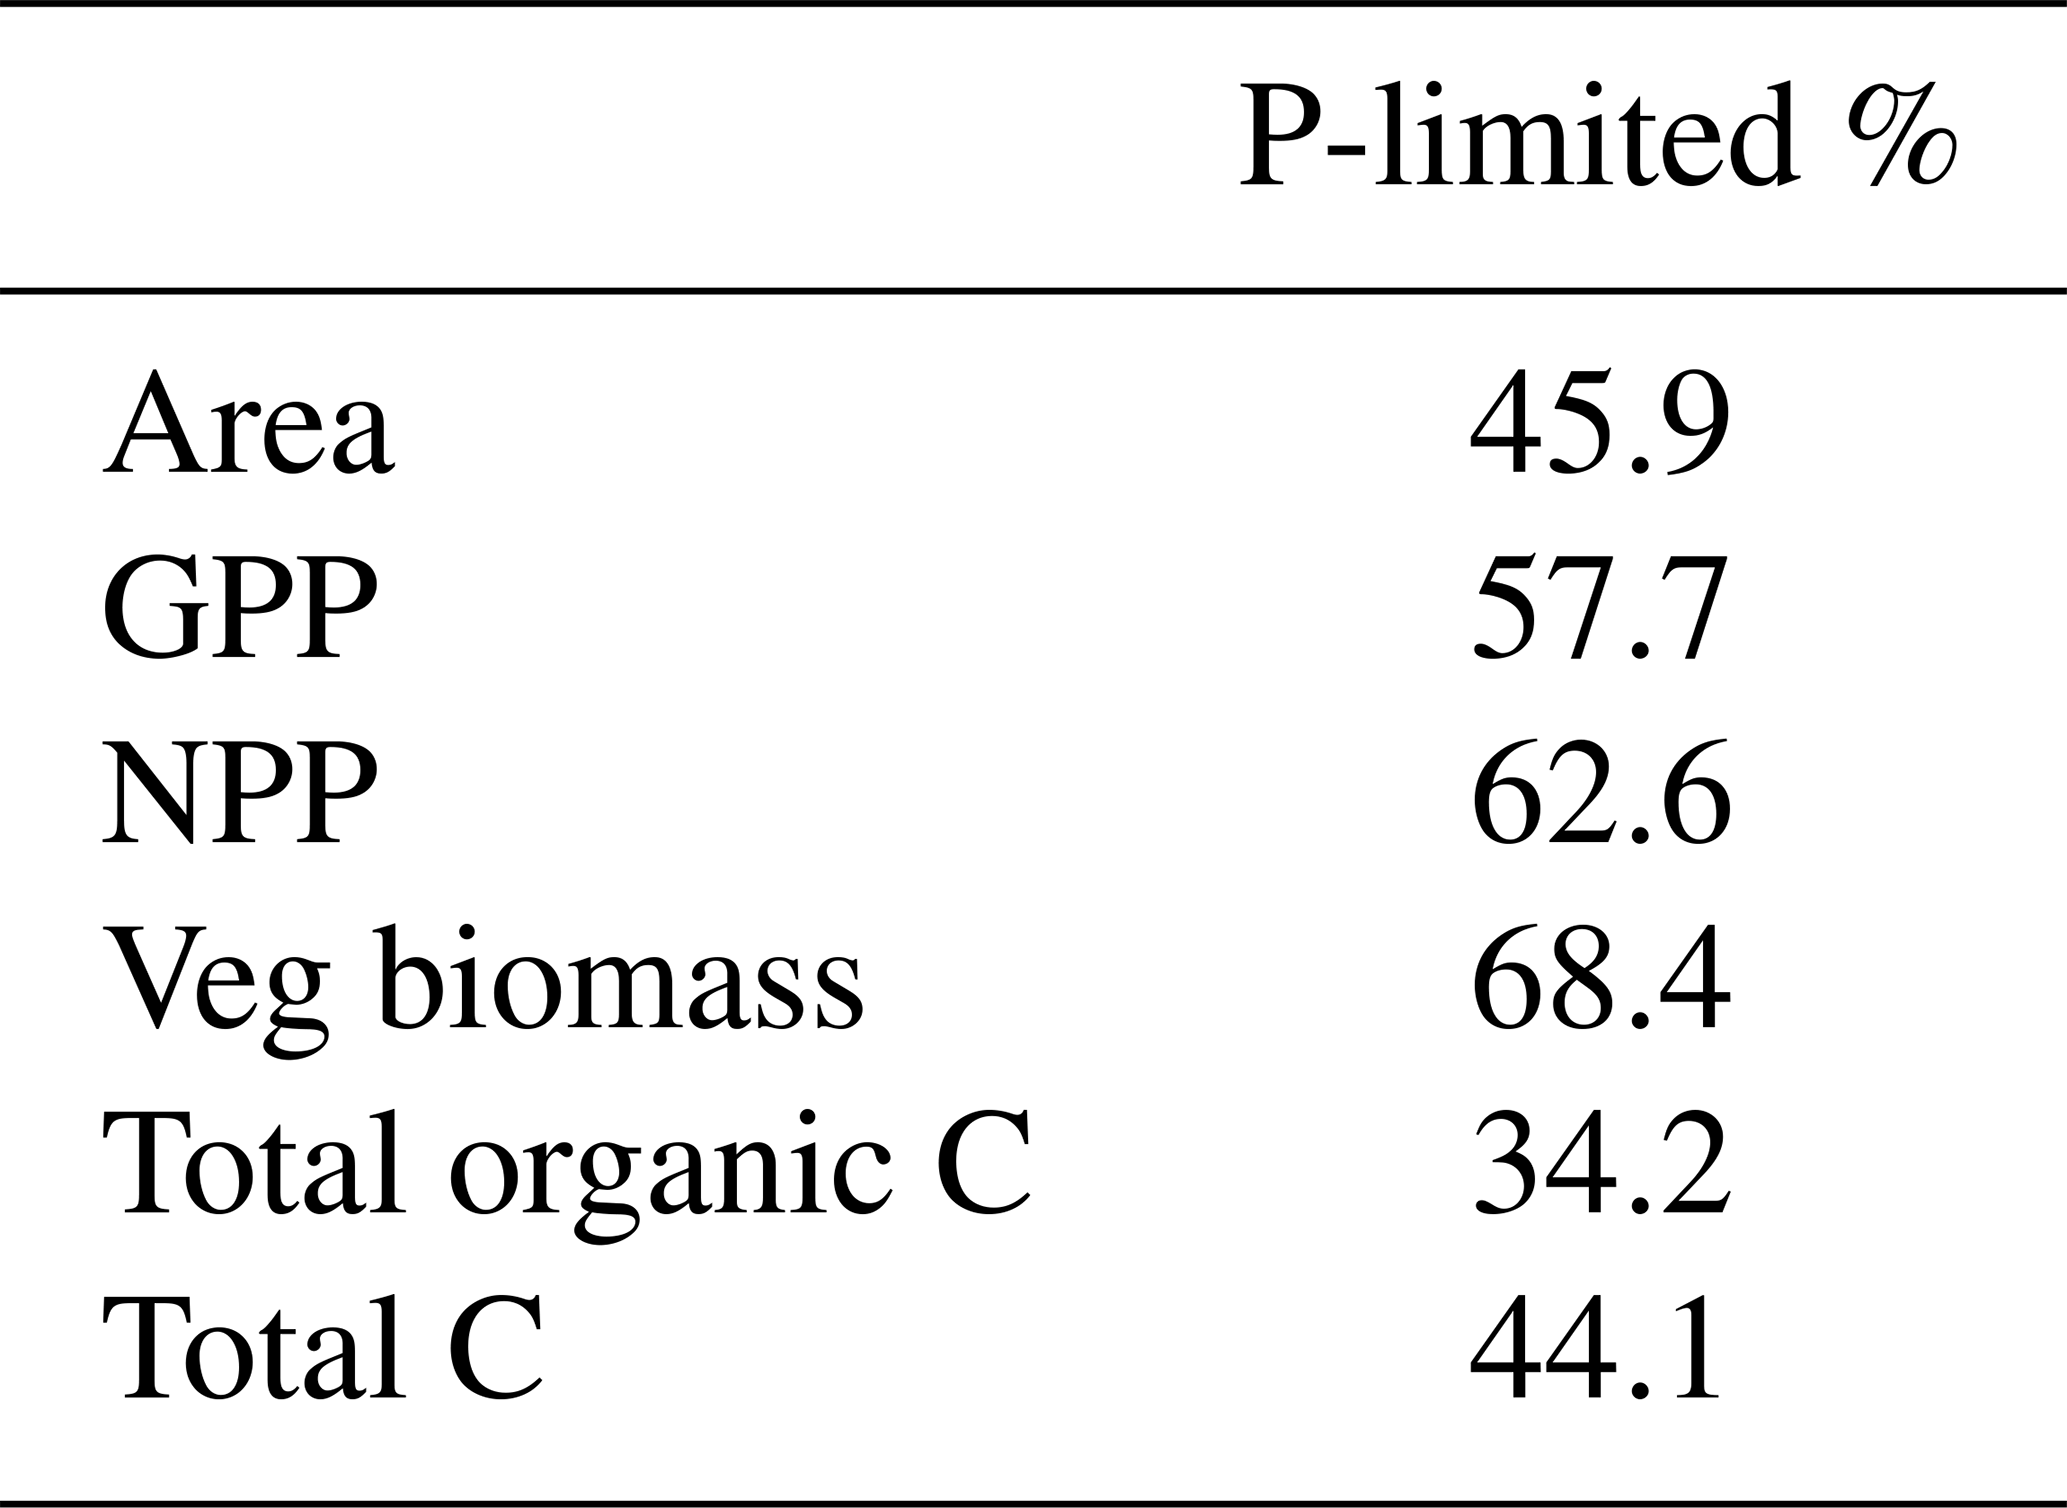
Adding a limiting factor to photosynthesis was expected to drive both C processes down, as was the case with our CNP simulation. The scale to which this reduction occurred, 7 % for GPP and 19 % for biomass globally, was not very high, given that according to Du et al. (2020), 43 % of the natural terrestrial area is predominantly limited by P. Although in that study N or P limitation was defined as nutrient resorption efficiency, while in ours it is the Vcmax limitation, our measured percentage of P-limited regions is remarkably close, at 46% (Table A2). Further, these predominantly P-limited grid cells are disproportionately important for the vegetation carbon cycle. Overall, 57.7 % of global GPP is located in these P-limited regions, along with 62.6 % of NPP and 68.4 % of vegetation biomass. With regards to total carbon stocks, however, N-limited regions are more relevant than the tropics, storing 55.9 %. This is due to the large soil organic C storage of N-limited regions, which is 65.8 % of the global total.
4.2 Soil organic matter dynamics and the P cycle
The presence of a detailed soil organic matter (SOM) dynamics module in LPJ-GUESS allows for an in-depth exploration of the links between vegetation and soil processes, and the implementation of LPJ-GUESS-CNP reveals the interactions between the N and P cycles. For instance, the influence of mineral P in soil decomposition, empirically representing bacterial nutrient demand, also reduces net N mineralization (Table 1). P-limitation can thus exert an important role even in predominantly N-limited areas since P can limit decomposition in areas where N limits photosynthesis.
Whether our simulated global organic and labile P stocks are realistic is still uncertain due to large discrepancies between estimates of different authors as well as varying methods. He et al. (2021b) calculated 26.8±3.1 (mean + standard deviation) Pg of total P for soils up to 30 cm depth and 62.2±8.9 Pg for 30–100 cm, while Yang et al. (2013) estimated 40.6±18 Pg P for 0–50 cm. Our simulated total P stocks are located within this range, at 53 Pg P. However, since LPJ-GUESS-CNP does not consider soil depth for SOM, comparisons between simulated and empirical estimations here are difficult. Future versions of LPJ-GUESS which include a definition of an explicit depth of SOM are in development. Regarding simulated labile P stocks, our 2.45 Pg P is within the global estimations of 3.6±3 Pg P (0–50 cm) according to Yang et al. (2013) based on Hedley P availability. Other methods, such as Olsen P, for global P plant-available stocks, are, at 0.319±0.022 Pg P (0–20 cm), significantly lower but may be underestimating phosphorus stocks available for plants. New estimations using the same method as Yang et al. (2013) but with a much larger dataset result in even higher labile P estimations (He et al., 2023). The estimations by Yang et al. (2013) correspond to a sum of labile inorganic added to labile organic P, which results in a pool of P to which plants have access using direct and biomineralization pathways. These simplifications are suggested to be adequate for models such as ours with a daily time step (Yang et al., 2013). We thus justify the absence of biomineralization processes in our model through our larger plant-available P pool.
The inclusion of a P weathering process which accounts for precipitation and temperature in our model is an advancement due to several aspects. First, the chemical weathering model (CWM) allows for accounting not only for the P release, but also other important plant nutrients such as potassium (K), calcium (Ca), and iron (Fe) for future implementations. Second, the CWM provides a direct link between lithologies and plants, providing a framework to test hypotheses regarding the link between geodiversity and plant structural diversity. Third, in LPJ-GUESS, forest structure has an impact on hydrology since runoff is influenced by the amount of intercepted precipitation and evapotranspiration, and this in turn is affected by total patch leaf area index. Since vegetation affects runoff, it has a significant impact on chemical release because runoff is one of the variables in the CWM. We suspect that the effect of vegetation structure on runoff is the main reason why the total P release from the model differs from observed P-release (Table 1), which is based on the same CWM, however, using fixed temperature and runoff datasets. Thus, a DGVM which includes a CWM is the ideal tool to test hypotheses regarding the effects of climate change on future chemical weathering. We suggest that future DGVM developments on which chemical weathering plays an important role take advantage of this CWM to estimate the influence of vegetation in weathering. In addition, the CWM's parameters were determined by a limited set of observations of rock P content (Hartmann et al., 2014; Hartmann and Moosdorf, 2011), potentially hampering global estimations. Therefore, additional sampling campaigns, particularly in P-limited regions, may significantly improve the CWM's P release estimations and consequently our model results.
4.3 Spatial patterns of global NP limitation
While in most areas, one nutrient limitation may clearly dominate over the other, in many regions, co-limitation may also be very high (Wright et al., 2018). For instance, in many dry regions, such as in western China or in Australia, both nutrients are severely limiting and the dominance of one factor over another does not mean that the non-dominant factor is not limiting. The high N fixation rates in the tropics (Fig. 5b) in our model are most likely the main driving factor for a predominant P limitation there. The Indian subcontinent, however, has low rates of fixation but a predominant P limitation occurs due to high N deposition (Fig. 5a). Europe and North America, however, are still predominantly N-limited despite also exhibiting high N deposition, although in peak deposition areas of these two continents, the American Midwest and the Netherlands/northern Germany/east Britain (Fig. A3), the predominant limiting element is phosphorus. Such shifts of commonly N-limited regions to P limitation have indeed been reported, for example, in southern Sweden (He et al., 2021a). Regarding stocks and fluxes of modelled P, the choices of parameters may play a significant role, in particular those related to soil decomposition, sorption/desorption, weathering, deposition, and plant P demand and uptake, among others. Parametrization and validation data for the P cycle are scarcer than for the N cycle, as can be seen, for example, from global plant trait databases (Kattge et al., 2020). Thus, increased effort in collecting field data on plant and soil P would be invaluable to test and improve current P-enabled DGVMs.
The maps produced by LPJ-GUESS in Fig. 4a and b indicate a general pattern of global co-limitation of N and P of varying degrees. Simulated patterns of N and P limitation broadly follow that of CASA-CNP from Wang et al. (2010), which is also a process-based model and produces maps based on limitations to NPP as in our study. Their study, however, shows predominant N limitation patterns for India and Australia, which in our approach had P as the main limiting factor. This and other differences may arise from a weathering input in CASA-CNP which did not consider temperature or runoff. Climatic factors are crucial in weathering since even P-rich substrates may not render significant amounts of nutrients if the climate is too dry or cold or the lithology is shielded (Hartmann et al., 2014). Another approach, by Du et al. (2020), also shows broad similarities with our patterns, but these are not directly comparable due to a distinct definition of N and P limitation based on resorption efficiencies and the use of an empirical predictive model. Their NP limitation maps show greater P limitation in North America, Europe, and central Asia but agree with our maps regarding the very high N limitation areas of eastern Russia and the Tibetan Plateau and unexpected predominant P limitation in many temperate areas, suggesting that P limitation is more widespread than we previously thought (Hou et al., 2020).
4.4 Temporal trends in global NP limitation
The simulated global trends in N and P vegetation productivity limitation follow other global or regional studies that indicate an increasing role of P to be a limiting factor (Li et al., 2016) and decreasing N limitation. Our simulated trends of N and P limitation should be considered here conservatively since no land-use and fertilization aspects were considered. Nevertheless, using our factorial simulation runs, we are able to identify which environmental factors during the period of 1901–2018 might have played a role in the trend of N and P limitations.
The drivers which affected the N and P limitation to productivity were not the same, which is expected since the factors affecting the individual processes of the N and P cycles are different. Globally and on average, we have identified that the N limitation decrease is predominantly driven by temperature, while the P limitation increase is dominated by CO2. In addition to the temporal average global values of Fig. 7, we also present the spatial pattern of the trend slope for each factorial scenario, which indicates where nutrient limitation was affected by the varying factors (Fig. A4). The spatial pattern for the simulation experiment with the temperature-variation-only (Tempvar) scenario, in which N limitation is predominantly affected, shows that N limitation is increasing across most of the affected grid cells, whereas for P, there is a mixed signal with decreasing and increasing P limitations, resulting in almost no effect. A probable cause of a lack of a strong average global effect of temperature on decreasing P limitation was increases in P limitation for the boreal regions (Fig. A4). In spite of this strong increase in P limitation for the boreal regions, those areas, however, remained predominantly N-limited at the end of our simulations. Decreases in C, N, and P total soil stocks and increases in mineralization rates with increasing temperatures (Fig. A5) may have had a strong role in N limitation decrease but less so for P (Fig. 7).
The strong impact of CO2 on both Vcmax N and P limitation represents the increasing role of nutrients in limiting CO2 fertilization. The stronger impact of CO2 on P than on N limitation can be clearly inferred through the soil organic matter dynamics as organic stocks of C and N increase and P decrease (Fig. A6a–c), and only N has increasing mineralization rates in time (Fig. A6d). N limitation increases due to CO2, on the other hand, are offset in our simulations by strong rises in nitrogen fixation rates (Fig. A6g). In LPJ-GUESS, nitrogen fixation is modelled following Cleveland et al. (1999) based on evapotranspiration. Since in our model evapotranspiration strongly depends on the crown area and leaf biomass, which increase due to CO2, the model provides an indirect path from which plants can invest carbon to alleviate N deficiency. Indeed, increased symbiotic nitrogen fixation, indicated by larger nodules, number, nitrogenase activity, and plant N content has been commonly reported in plant cultivars in response to elevated CO2 experiments (Leakey et al., 2009; Rogers et al., 2009; Xu et al., 2017). In addition, the proportion of fixed N in relation to soil-derived of resorption-derived has been seen to increase from ambient to elevated CO2 (Li et al., 2017). It is reasoned thus that enhanced photosynthesis provides extra C sources for improving nodule function and N2 fixation. For P, there is no such pathway in our model for increased carbon availability to improve nutrition. However, plants are known to use several strategies when it comes to investing carbon to acquire P (Lugli et al., 2020; Reichert et al., 2022; Smith and Smith, 2011; Stock et al., 2021). For instance, mycorrhizal associations – elevated CO2 experiments – indicated that plants mediated by ectomycorrhizal fungus (EMF) are able to gain more biomass in relation to arbuscular mycorrhizal (AMF) fungi since the former can mine nutrients from organic matter (Terrer et al., 2021). Consequently, boreal regions in which EMFs are abundant may be less limited than our studies suggest although N (which is limiting in these environments) is necessary for producing the enzymes required for P acquisition. Also, plants are able to invest C into P acquisition using phosphatase and organic acids, and this investment may also increase under eCO2 (Margalef et al., 2017). Therefore, we may be overestimating the increase of P limitation due to varying CO2 in our simulations. However, a meta analysis of plant responses to elevated CO2 found that plants in low-P environments have lower biomass growth than those in the high-P one (Jiang et al., 2020). This suggests that higher C investment in P acquisition strategies under elevated CO2 only has a limited role in alleviating P stress, particularly when N required for these strategies is limiting. Finally, regarding vegetation biomass and GPP, the co2var scenario has been seen to have a much larger effect than Tempvar (Figs. A5 and A6, panels h and i).
Our inclusion of the P cycle into a community-developed DGVM has confirmed expectations of the crucial role P plays in vegetation productivity and structure. We find that P limitation is widespread globally as a co-limiting factor together with N and as a predominant limiting factor in the tropical lowland regions. In addition, the effect of P in limiting global vegetation productivity has been increasing during the last and beginning of this century, becoming more limiting than N globally after the year 2000. Our process-based model approach allowed us to evaluate which factors were behind this increase, revealing that N limitation decrease is much more driven by temperature changes than increases in N deposition rates. Also, while N limitation changes are predominantly affected by temperature, P changes are mostly affected by CO2 increase. The progressive P limitation may play a significant role in constraining model estimations of CO2 fertilization under future climate change scenarios. The inclusion of the P cycle in vegetation models is therefore an important step in improving model realism and avoiding productivity overestimations, but further ones may be important too. These include the impact of microbiota and plants in mineral and organic weathering (which can alleviate P limitation in relation to our results), and cycles of other important plant nutrients, such as potassium and calcium (which may alter spatial patterns of biomass and productivity in relation to our results). A more in-depth evaluation of N and P limitation trends over the last century, with future projections using a suite of models which include the N and P cycle and other P-related processes not included here, would be invaluable to confirm if progressive P limitation is underway on a global scale.
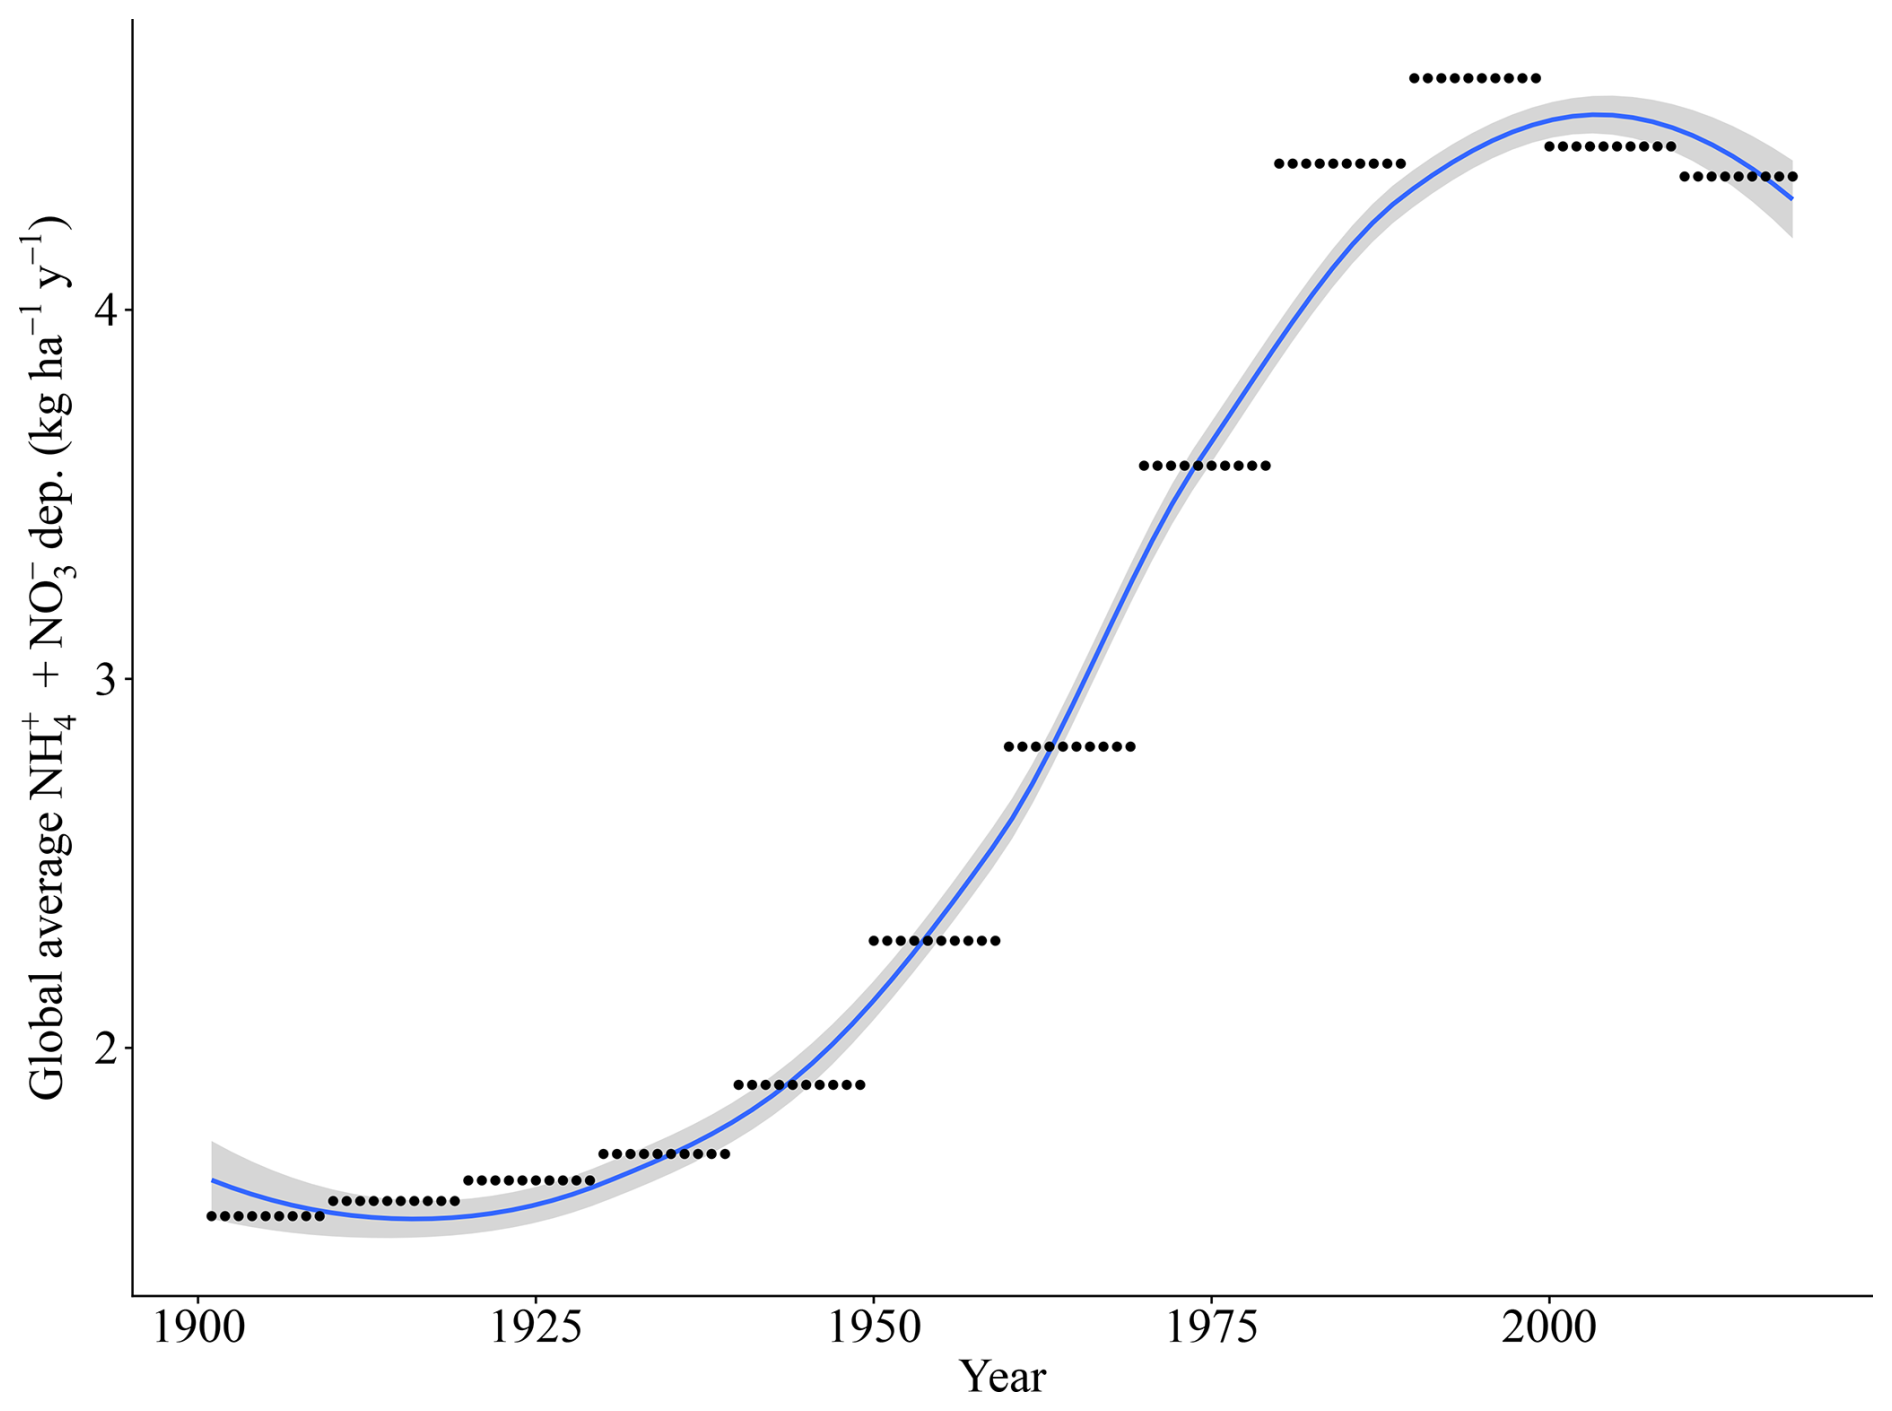
Figure A1Yearly trend of global N deposition for the LPJ-GUESS runs based on the ACCMIP dataset (Lamarque et al., 2013).
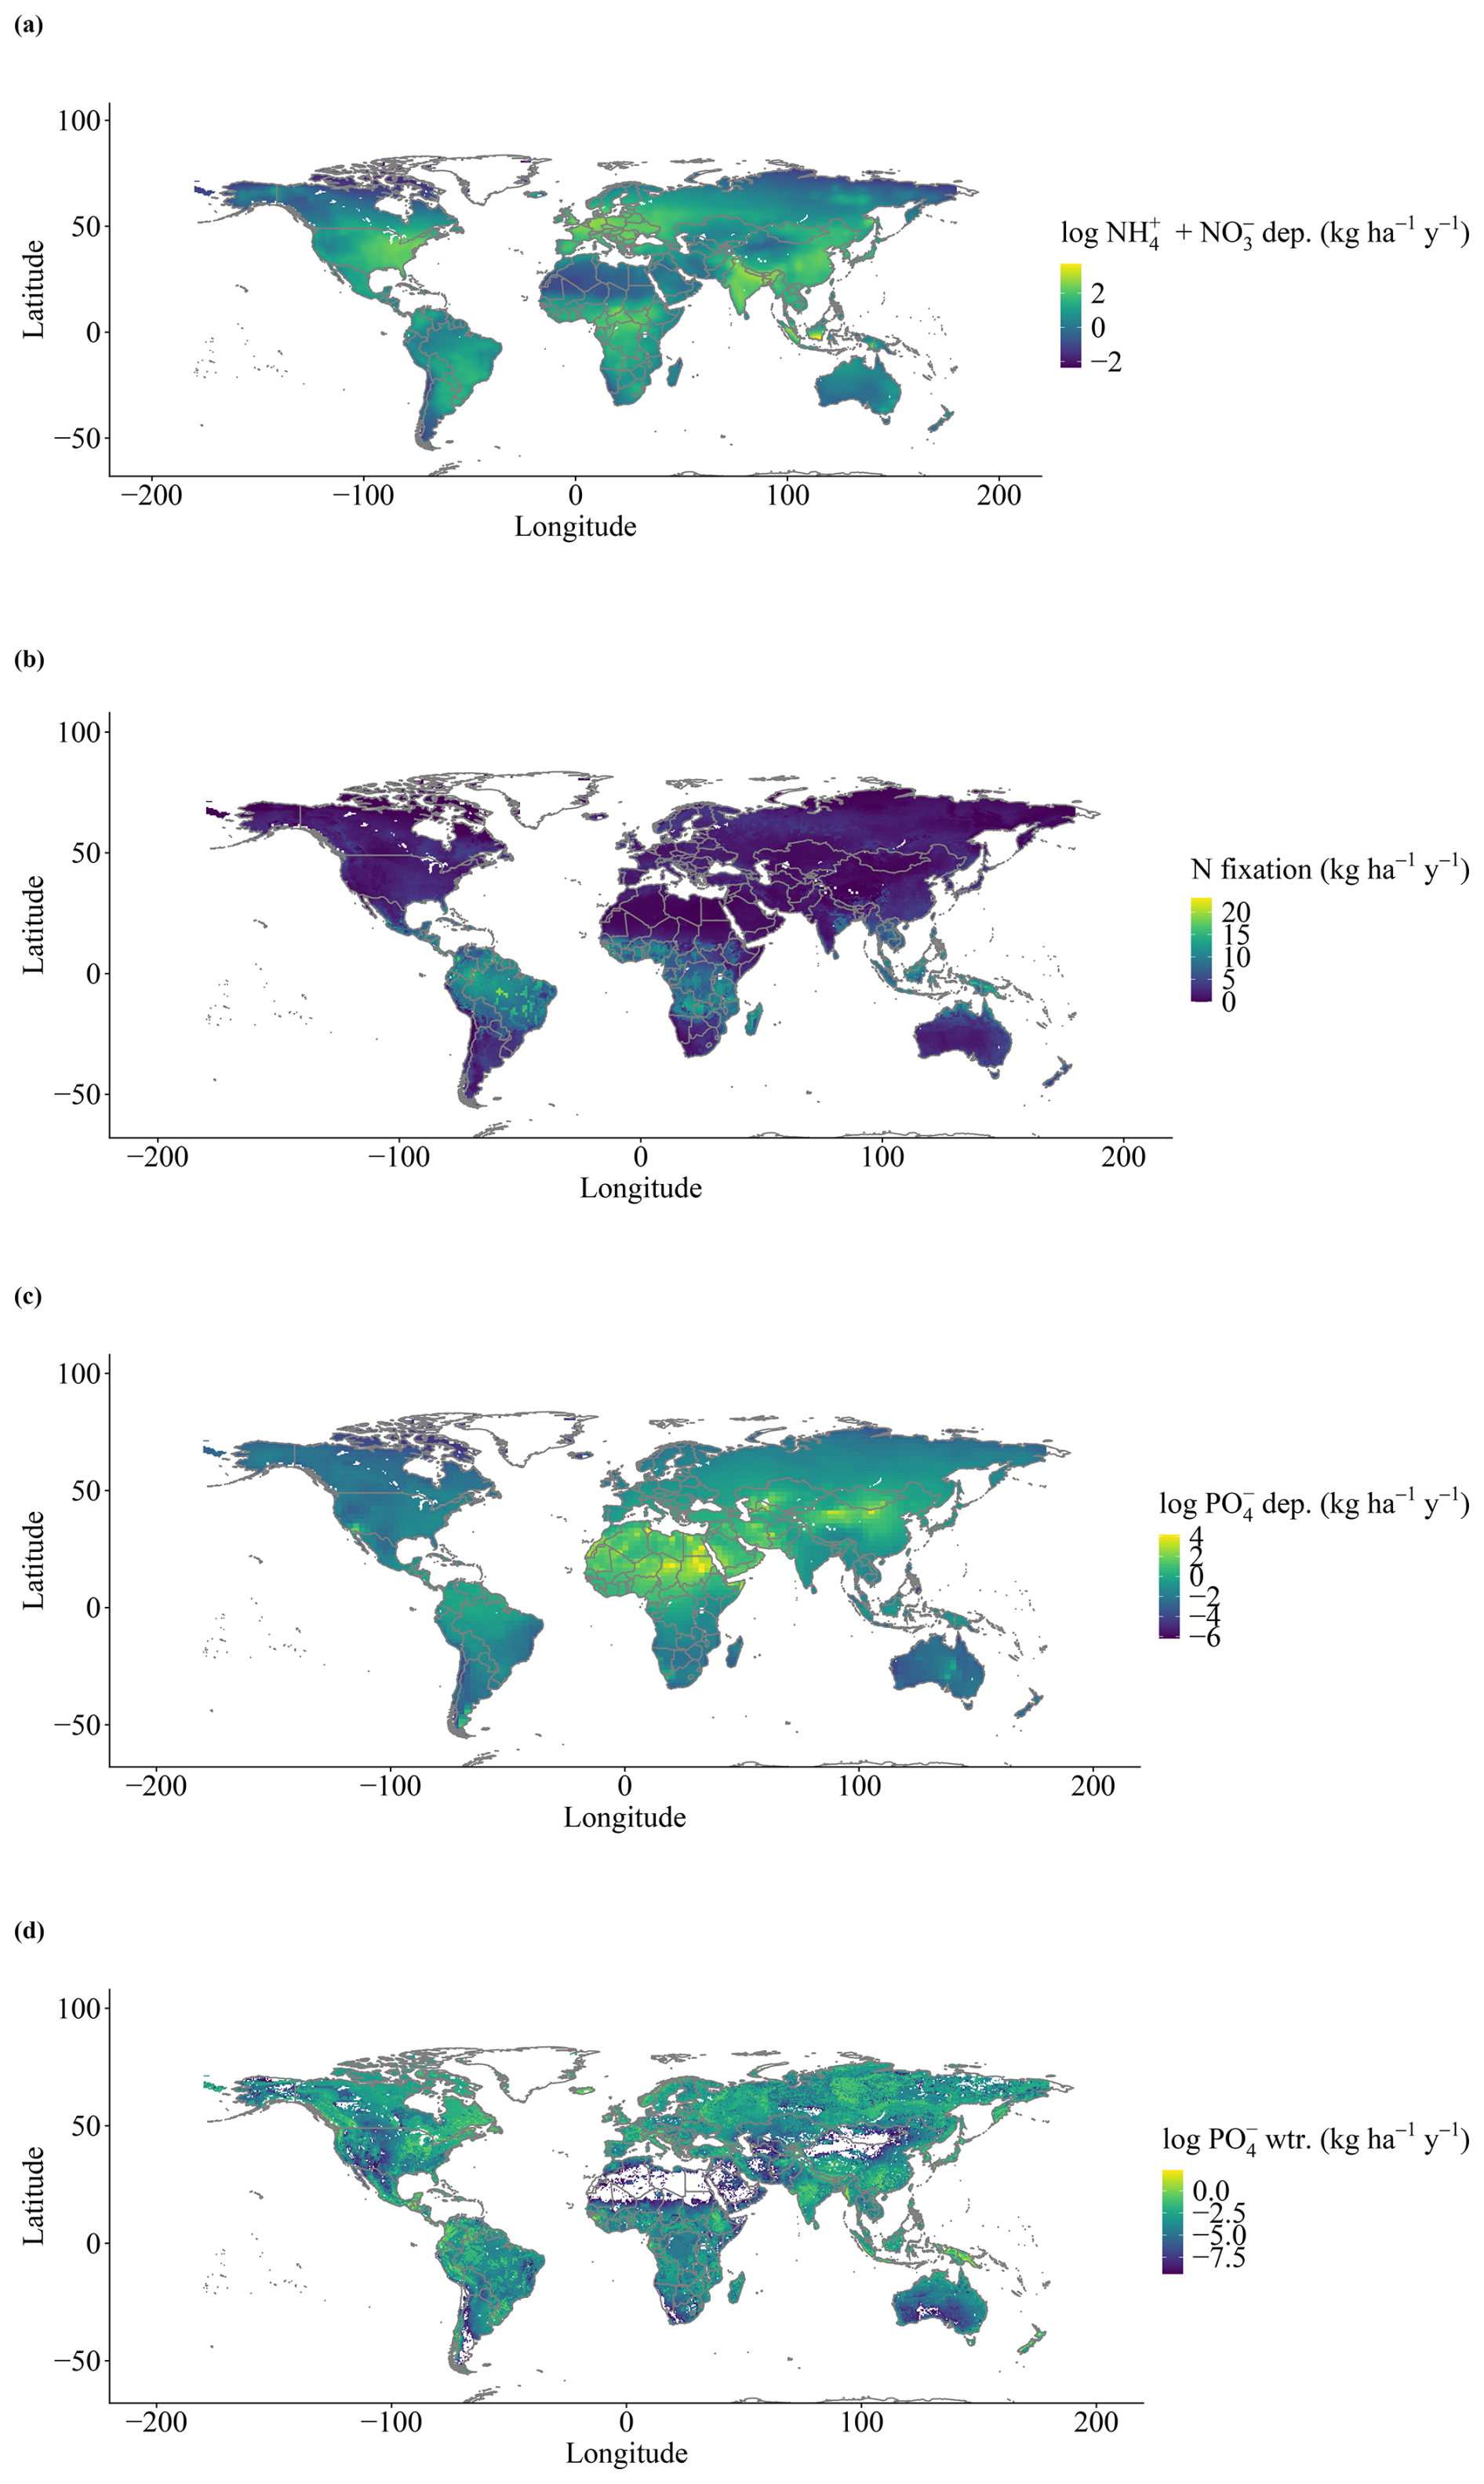
Figure A2Global inputs (grid-cell averages for the period from 1901–2018) of N and P: (a) inorganic N deposition, (b) N fixation, (c) inorganic P deposition, and (d) P weathering rate.
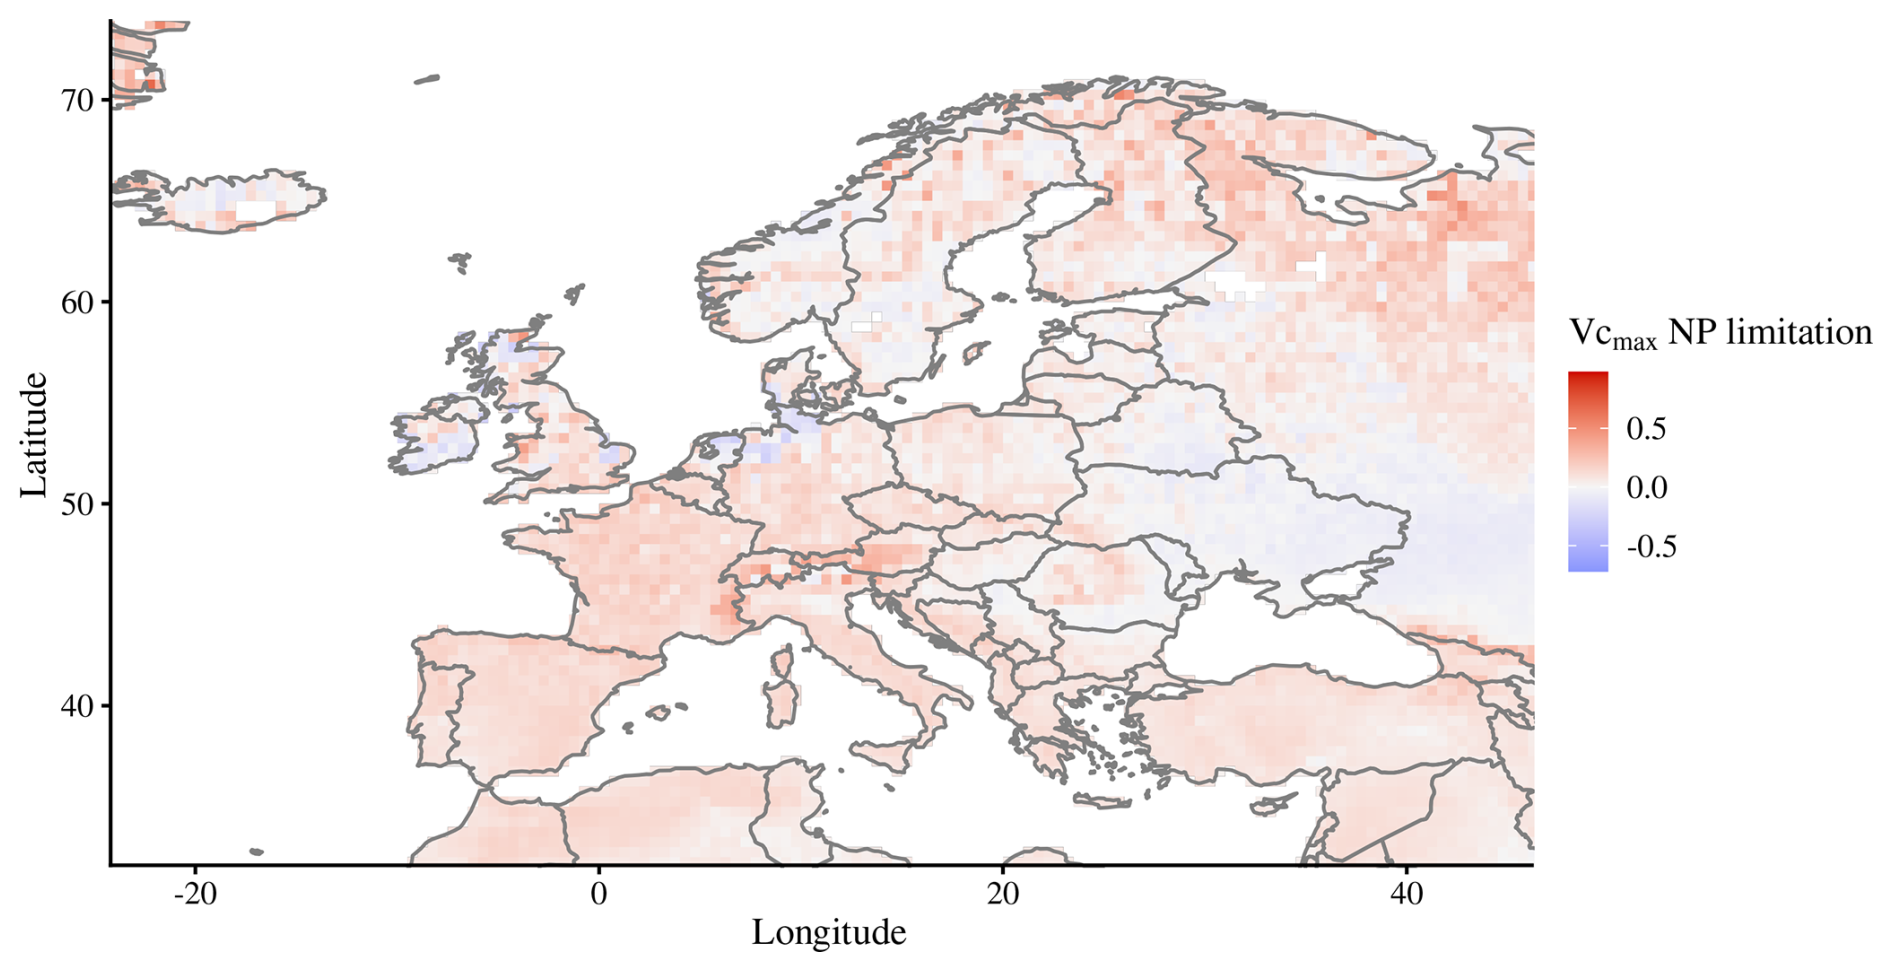
Figure A3Map of predominant N or P limitation for Europe, with positive values being predominantly N-limited and negative values predominantly P-limited. Values for each grid cell are averages for 2005–2018.
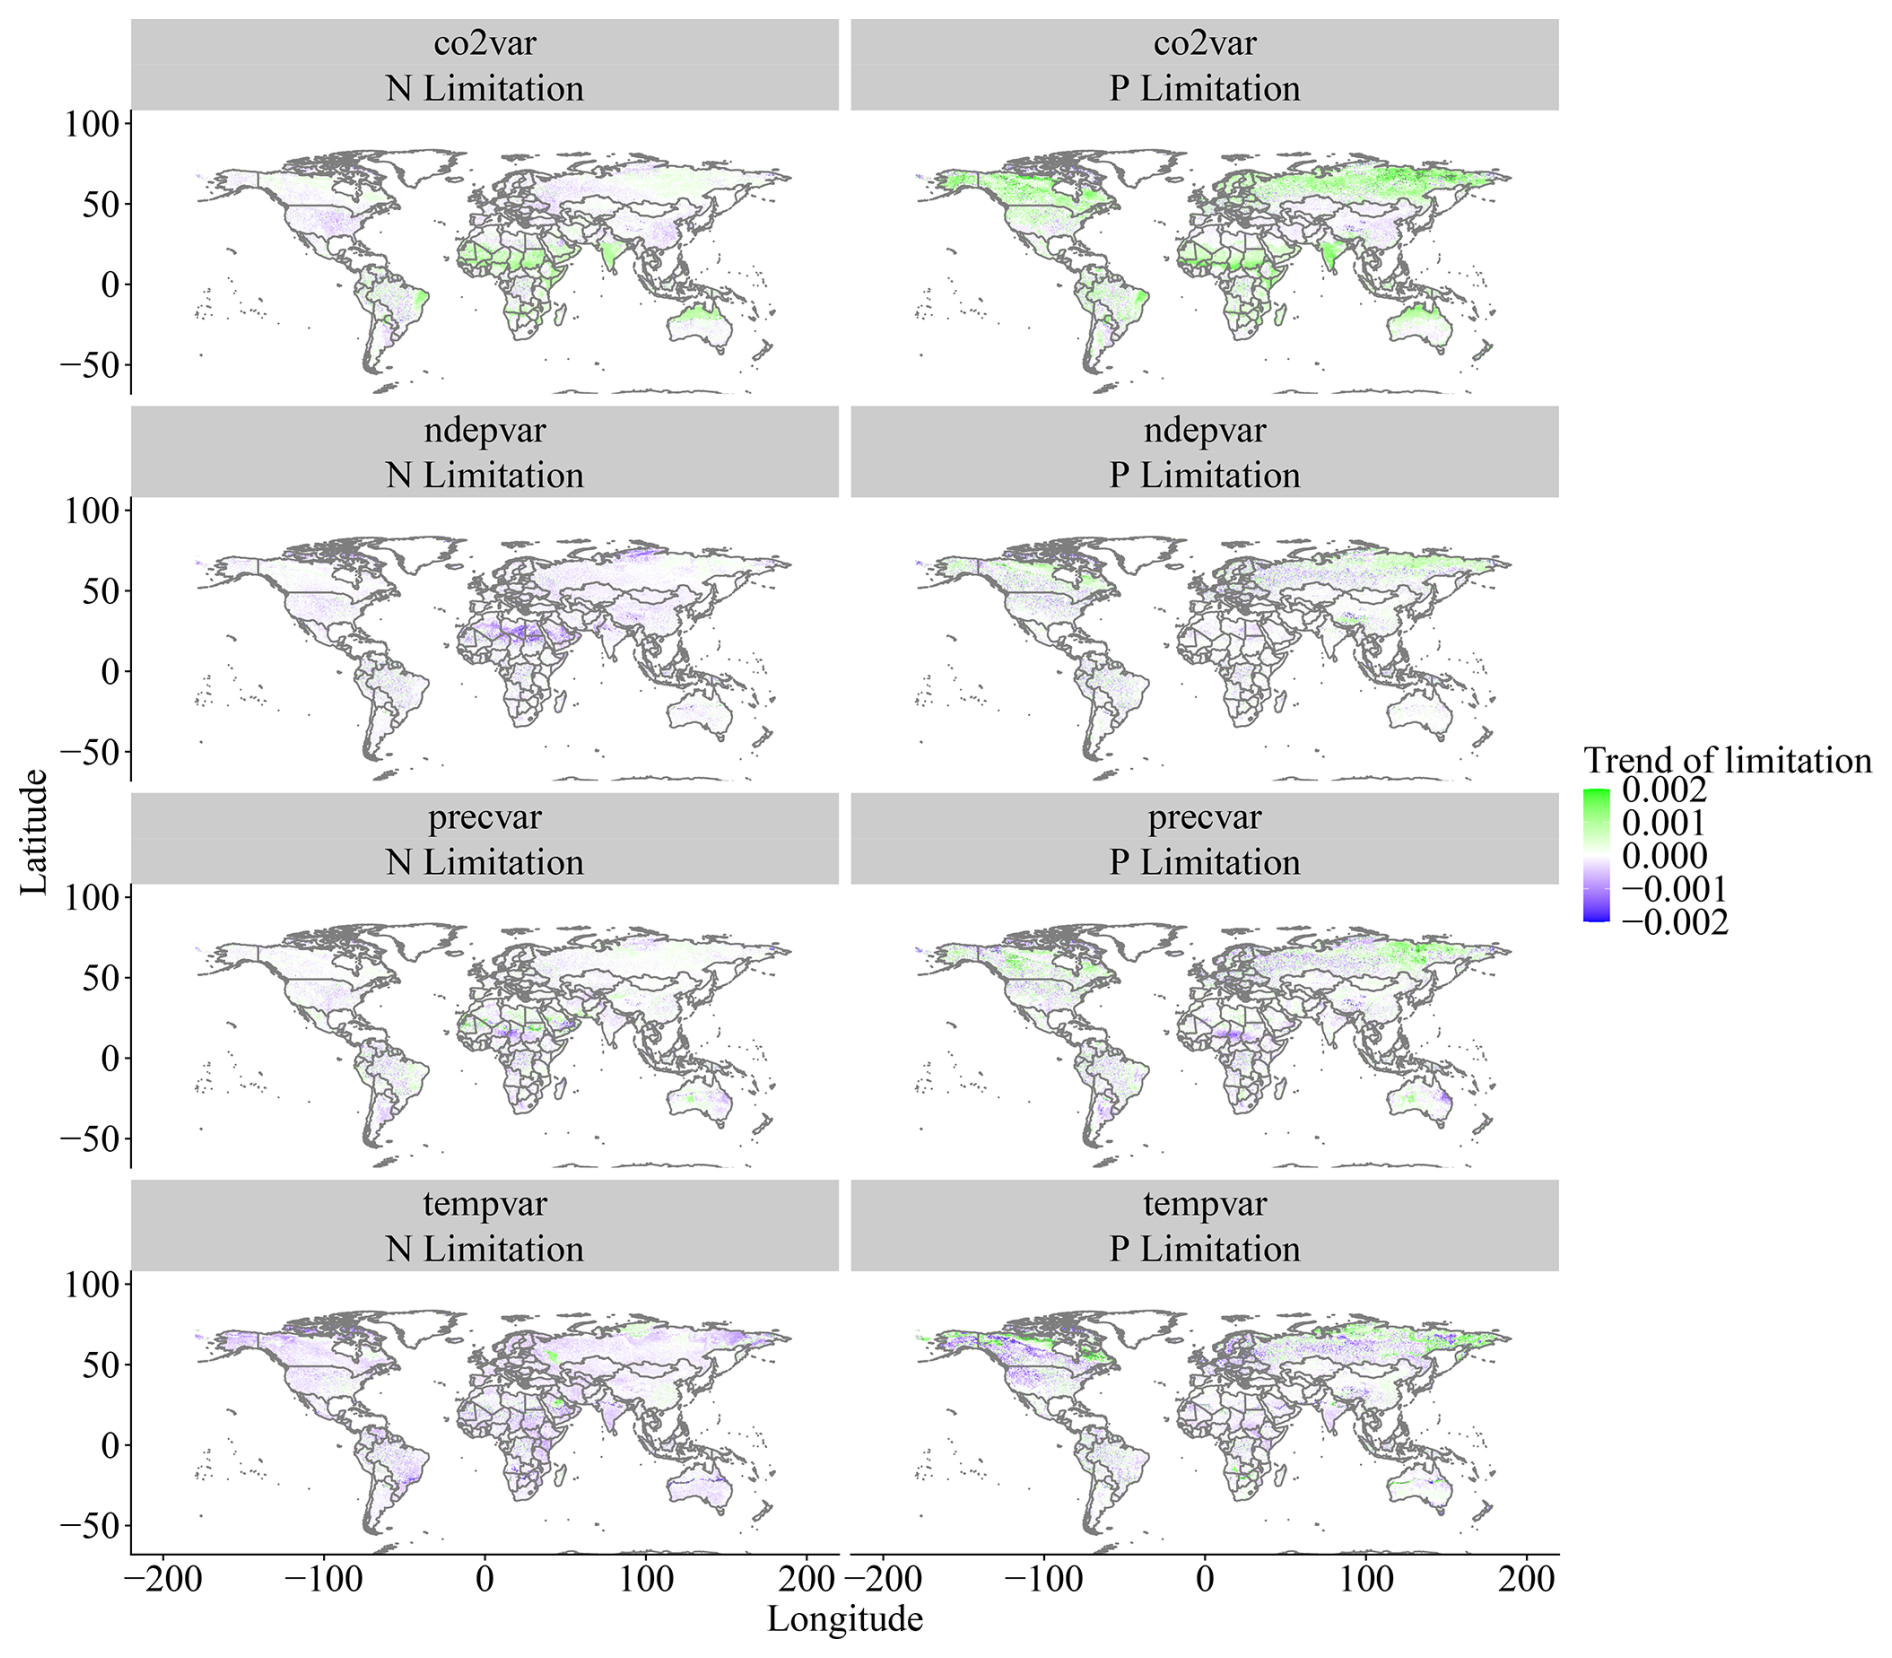
Figure A4Spatial trends of N and P limitation change between 1901 and 2018 for the factorial experiment scenarios. Values are slopes of trends, with positive values (green) indicating increasing limitation and negative values (purple) indicating decreasing limitation.
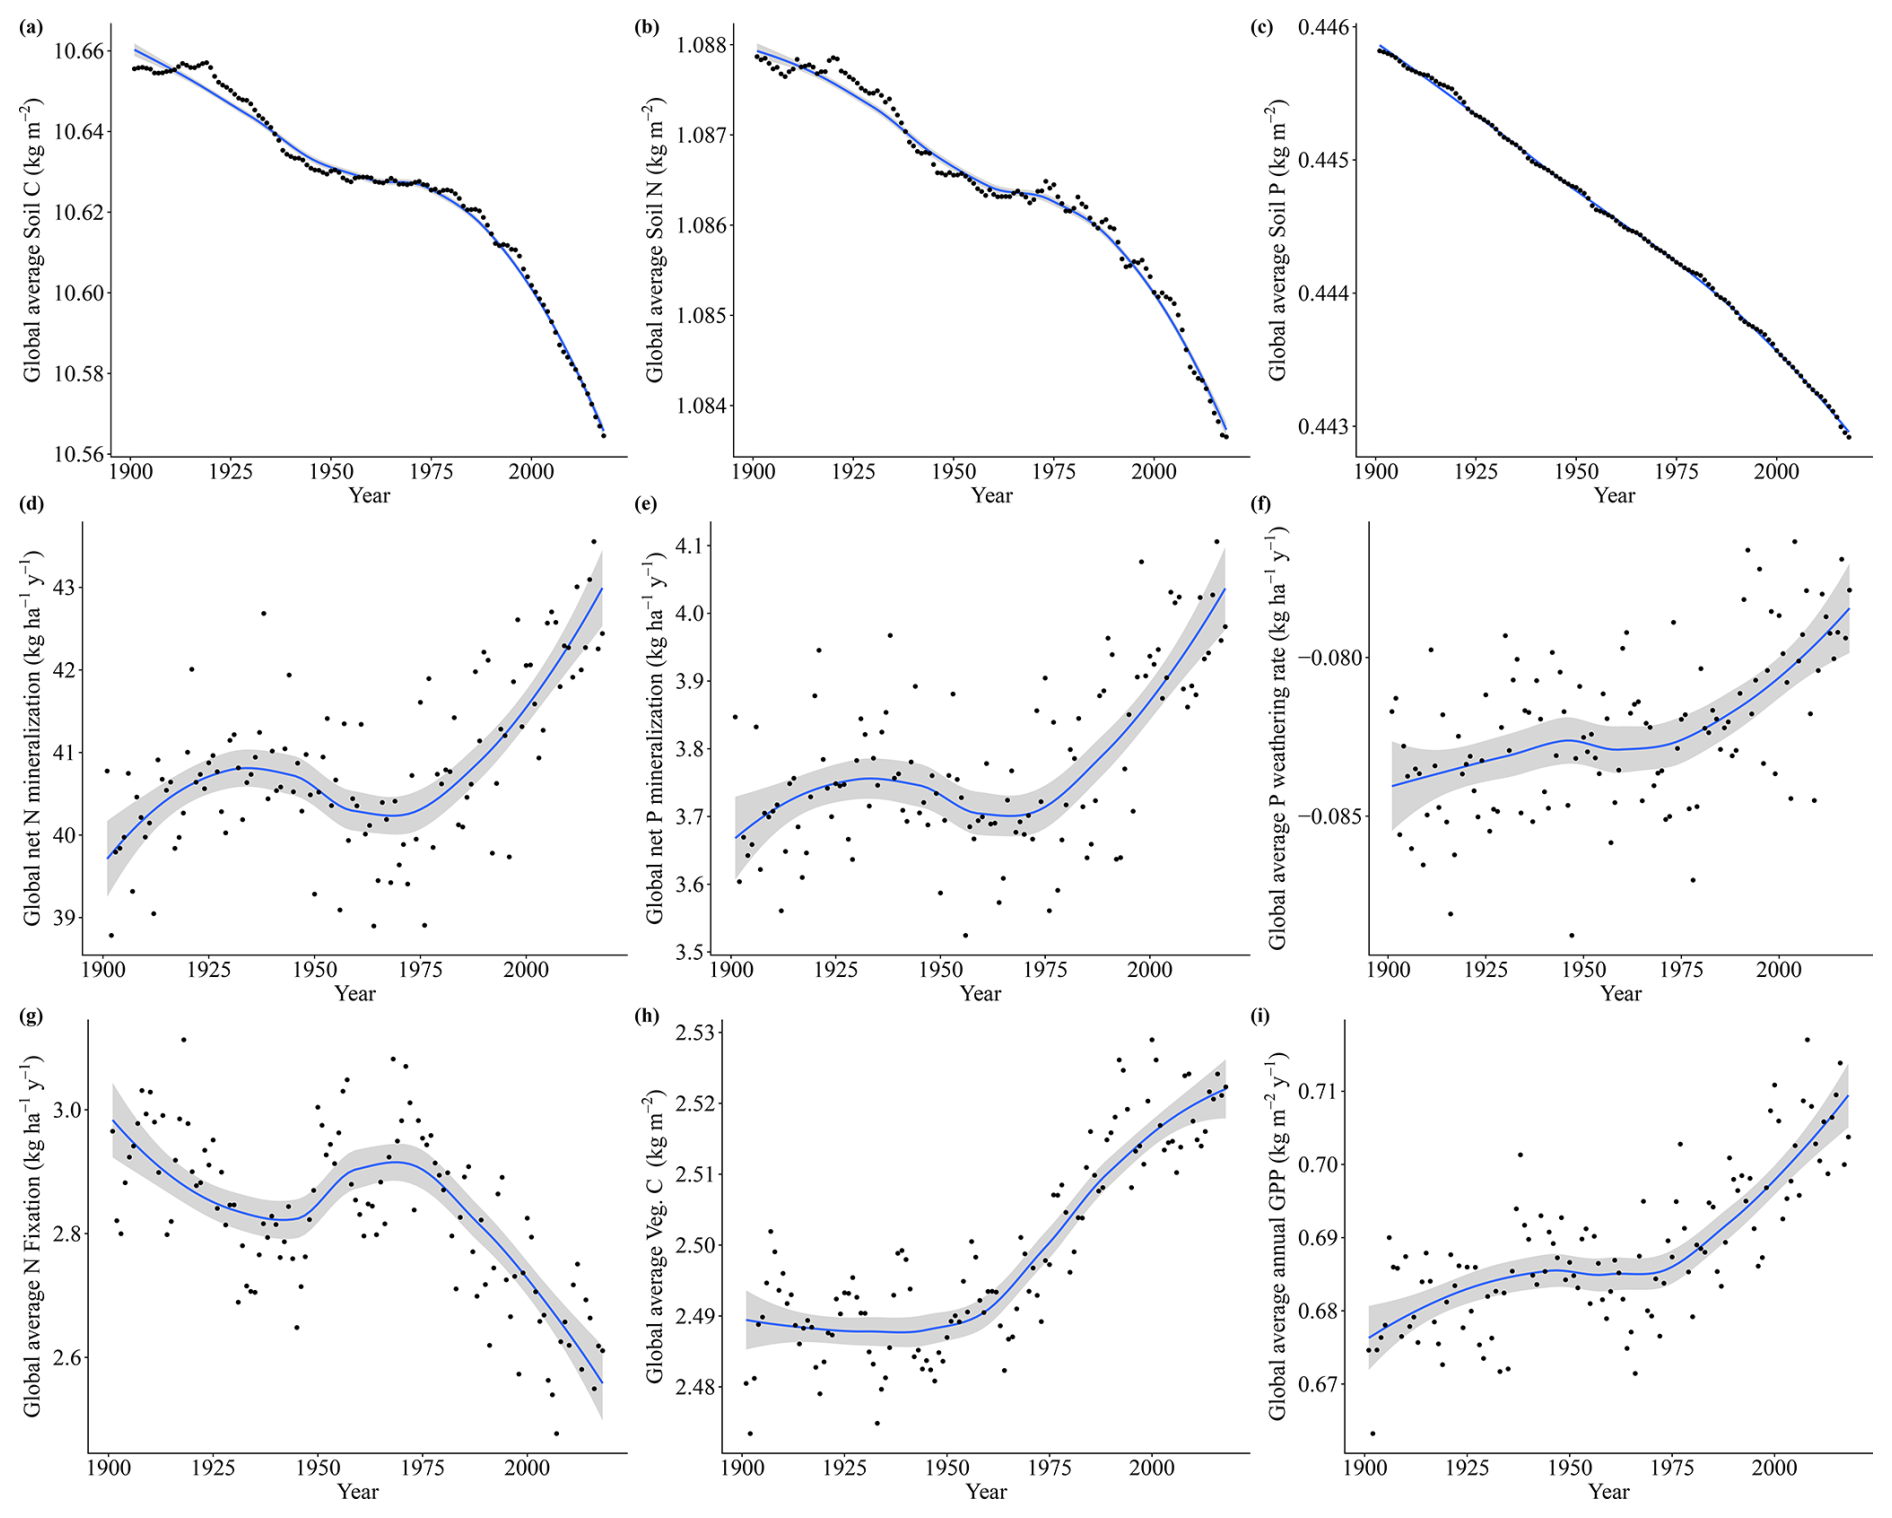
Figure A5Soil C, N, and P fluxes for the Tempvar scenario from 1901 to 2018, with points representing global average values for each year, the lines representing trends (loess), and the gray area representing the confidence interval (0.95).
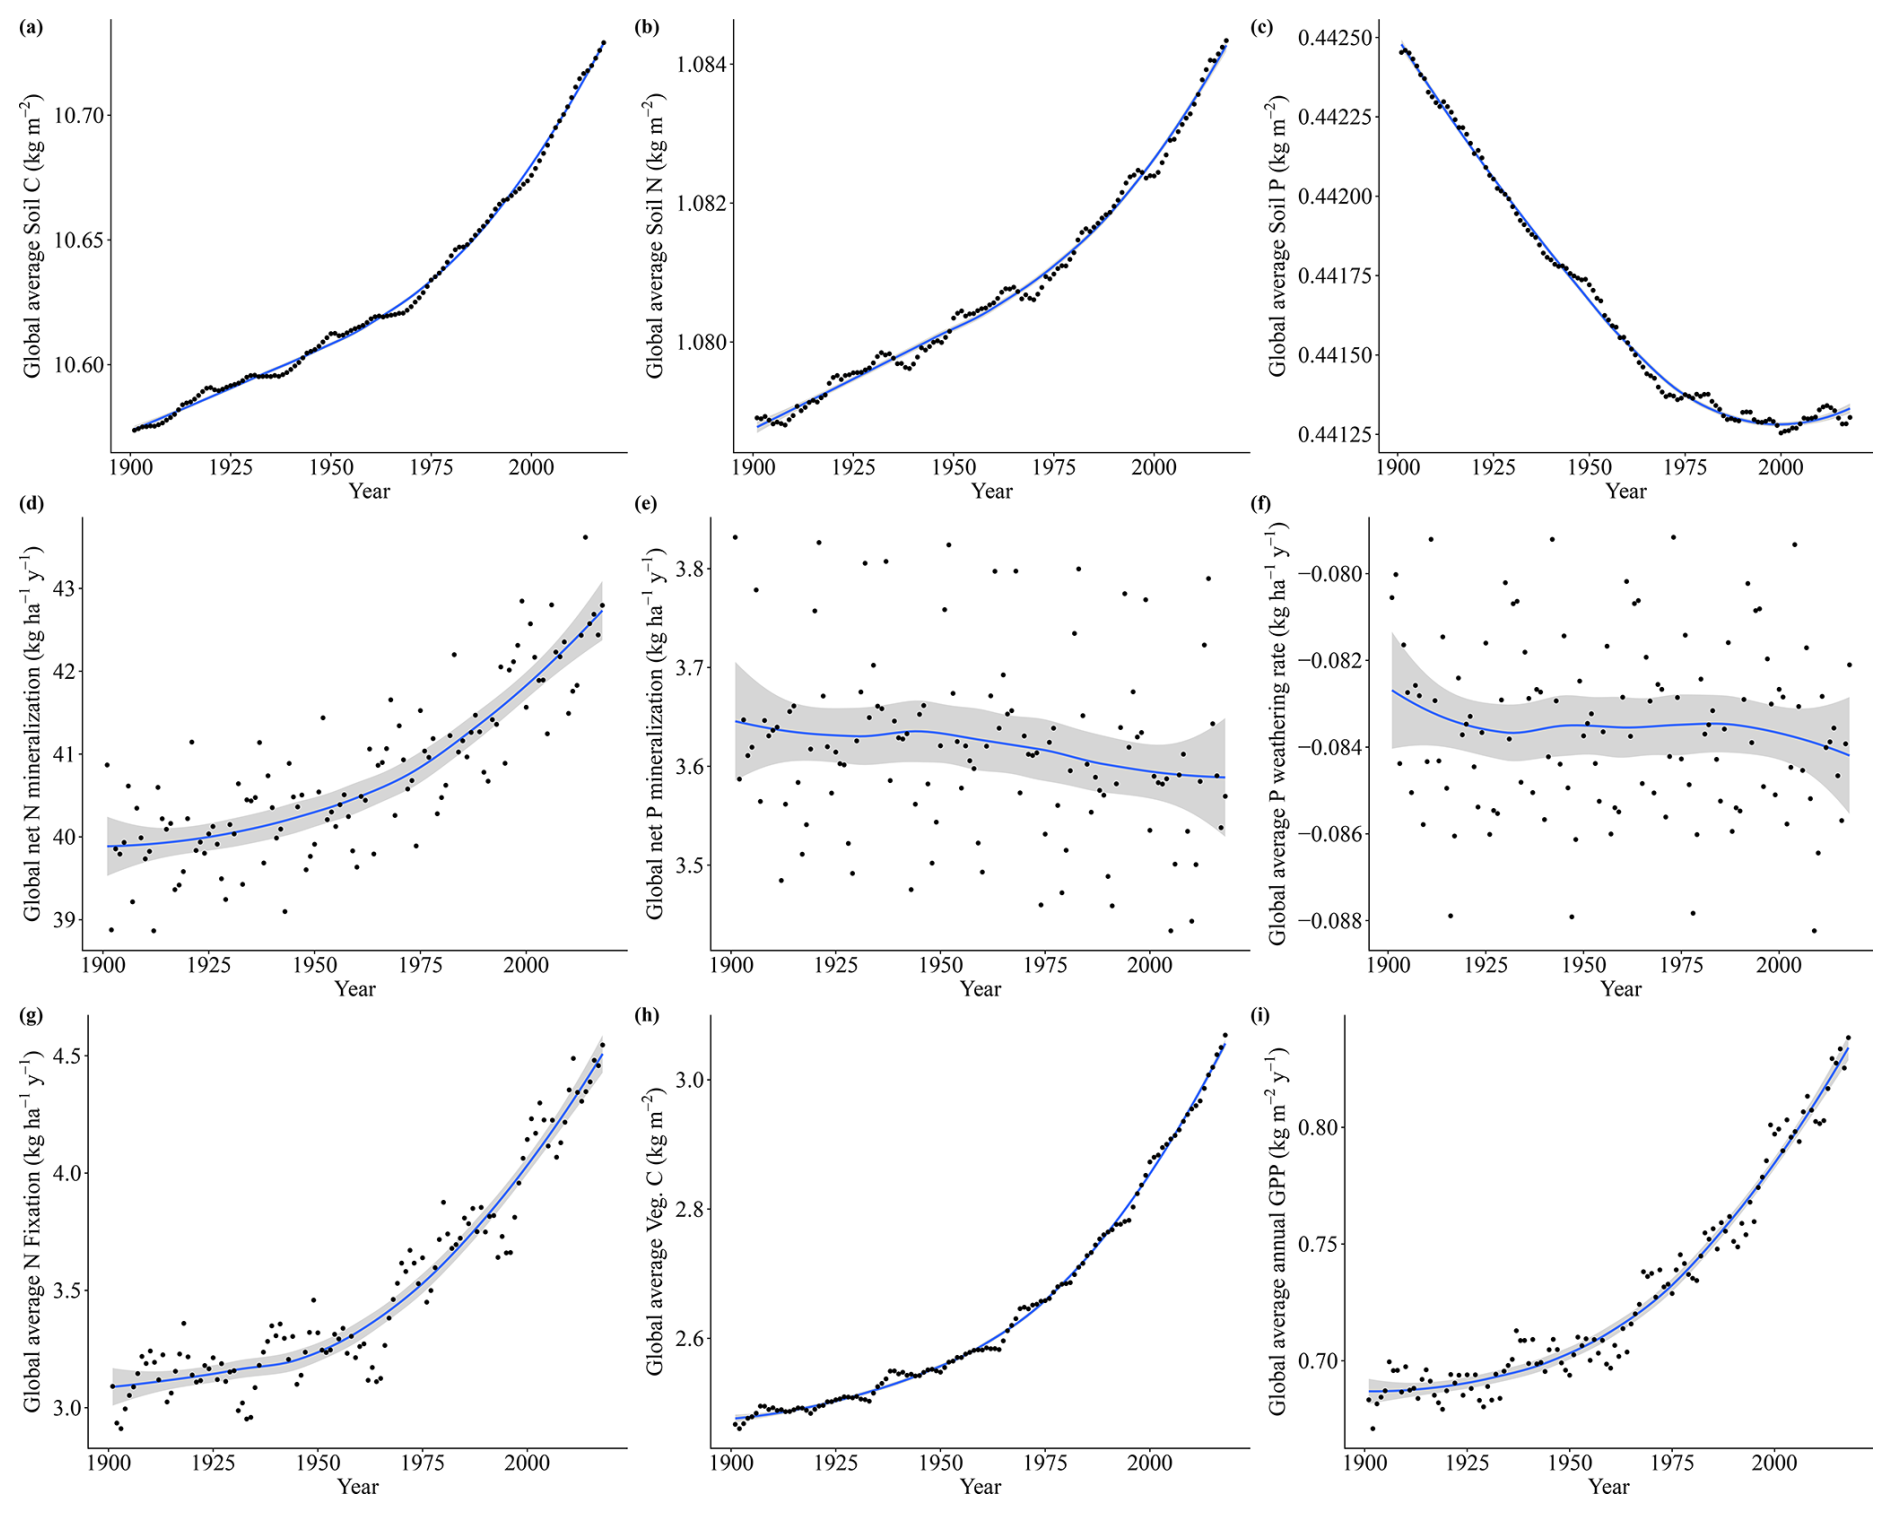
Figure A6Soil C, N, and P fluxes for the co2var scenario from 1901 to 2018, with points representing global average values for each year, the lines representing trends (loess), and the gray area representing the confidence interval (0.95).
A1 Soil phosphorus parameters
Table A1Parameters for equilibrium between sorbed and labile P (kplab) and the maximum amount of sorbed P (Spmax) parameters for each of the LPJ-GUESS soil types. Based on Wang et al. (2010).
A2 Soil phosphorus dynamics
The equilibrium relationship between labile P (Plab) and sorbed P (Psorb) is determined by the Langmuir equation, based on Wang et al. (2010), defined as
where kplab and Spmax are soil-dependent parameters and and are described as positive or negative fluxes.
The flux from the sorbed pool to the strongly sorbed pool () is also based on the same previous reference and defined as
where μsorb and μssorb are rate constants and both equal to 0.0067 yr−1.
A3 Plant P stoichiometry
Leaf average C:P ratio, which determines plant P demand, is defined using a global tradeoff equation from the TRY database (Kattge et al., 2020), defined as
where SLA is the individual's specific leaf area as defined from the parameter file for each plant functional type. From this average, minimum and maximum C:P values are defined as ±39 % of the average C:P (same approach as for C:N; Smith et al., 2014). If uptaken P (C : Pactual) is not enough satisfy the average C:P ratio, the plant is under stress at a factor of phosphorus stress P stress = C : Pactual/C : Paverage. The minimum of P stress, N stress (same calculation with N) and water stress are multiplied by the leaf : fine root allocation ratio and determine how much more biomass is allocated to roots than leaves.
The C:P ratio of other tissues is calculated as a function of the leaf values following the same proportions as those of N defined in the CN version of GUESS. C:P ratios of roots are 1.16 times those of leaves, and the C:P ratio of sapwood is 6.9 times those of leaves.
A4 P effects on photosynthesis
The maximum carboxylation rate (Vcmax) dependent of leaf P content is defined as
where the Vcmax,P is in kgC m−2 d−1, Pactive is in kgP m−2, and phosphorus fraction related to photosynthesis is defined as follows:
Both Vcmax,P and Pactive equations are based on Hidaka and Kitayama (2013).
A5 P weathering
Phosphorus weathering is based on the chemical weathering model of Hartmann and Moosdorf (2011) and Hartmann et al. (2014). This empirical model is driven by the Global Lithological Map database (GLiM, Hartmann and Moosdorf, 2012), which divides the surface into classes from which the parameters for the model are derived. For each grid cell and time step, P weathering is then determined by
Here, FCW,i is the chemical weathering rate in t km−2 yr−1 for the lithological class i, defined by
where bcarbonate and bsilicate are the chemical weathering parameters (Hartmann et al., 2014, Table A1-1) for carbonate and silicate respectively, pi is the phosphorus content (Hartmann et al., 2014, Table A1-2) of the lithological class i, and q is the runoff in mm yr−1, which is included prognostically in the model for each simulated patch.
Also, FT is the temperature effect on weathering, calculated by
where Ea,i is the activation energy for the lithological class i; R the gas constant; T the soil temperature in kelvins, calculated prognostically in the model daily for each grid cell; and T0 the average reference temperature of Japan (284.15 K).
Finally, to account for some conditions where weatherable material is isolated from the hydrological processes by thick, chemically depleted soils or other surface layers such as wetlands or laterites, a soil shielding factor is included for some lithologies (Hartmann et al., 2014). Fs is then 0.1 for the lithologies where soil shielding has a significant role and 1 otherwise.
Table A2Percentage of several ecosystem measures in P-limited regions (defined as negative Vcmax,NPlim, calculated using Eq. (3), main Text, and averaged from 2005 to 2018).
The input data for the factorial simulation runs (https://doi.org/10.5281/zenodo.13594436, Dantas De Paula, 2024a) and for the standard simulation runs (https://doi.org/10.5281/zenodo.13472421, Dantas De Paula, 2024b) and scripts to run the model and produce the plots for all the simulations presented in this paper (https://doi.org/10.5281/zenodo.13385547, Dantas De Paula, 2024c) are archived on Zenodo. The current version of the LPJ-GUESS-CNP model is available at https://github.com/mateusdp/LPJ-GUESS-NTD/tree/phosphorus-cf-walker under the Mozilla Public License 2.0. The exact version of the model used to produce the results used in this paper is archived on Zenodo (https://doi.org/10.5281/zenodo.13471785, Dantas De Paula, 2024d).
MDdP: design of the research, performance of the research, data analysis and interpretation, and writing the manuscript. MF: design of the research, performance of the research, data analysis and interpretation, and writing the manuscript. DW: design of the research, performance of the research, data analysis and interpretation, and writing the manuscript. JPDF: performance of the research, data analysis and interpretation, and writing the manuscript. KF: performance of the research, data analysis and interpretation, and writing the manuscript. AR: performance of the research, data analysis and interpretation, and writing the manuscript. TH: design of the research, performance of the research, data analysis and interpretation, and writing the manuscript.
The contact author has declared that none of the authors has any competing interests.
Publisher's note: Copernicus Publications remains neutral with regard to jurisdictional claims made in the text, published maps, institutional affiliations, or any other geographical representation in this paper. While Copernicus Publications makes every effort to include appropriate place names, the final responsibility lies with the authors.
We would like to thank Natalie Mahowald, Jens Hartmann, and Giovanni Iadarola for support in the development of this study.
Mateus Dantas de Paula acknowledges financial support from the DFG-funded research unit RESPECT (grant no. FOR2730).
David Wårlind acknowledges financial support from the Strategic Research Area MERGE (Modeling the Regional and Global Earth System – https://www.merge.lu.se/, last access: August 2024) and the Swedish Research Council (grant no. 2020-05051).
This research has been supported by the Vetenskapsrådet (grant no. 2020-05051) and the Deutsche Forschungsgemeinschaft (grant no. FOR2730; RESPECT).
This open-access publication was funded by Goethe University Frankfurt.
This paper was edited by Carlos Sierra and reviewed by three anonymous referees.
Allen, K., Fisher, J. B., Phillips, R. P., Powers, J. S., and Brzostek, E. R.: Modeling the Carbon Cost of Plant Nitrogen and Phosphorus Uptake Across Temperate and Tropical Forests, Front. Forest. Glob. Change, 3, 1–12, https://doi.org/10.3389/ffgc.2020.00043, 2020.
Beer, C., Reichstein, M., Tomelleri, E., Ciais, P., Jung, M., Carvalhais, N., Roedenbeck, C., Arain, M. A., Baldocchi, D., Bonan, G. B., Bondeau, A., Cescatti, A., Lasslop, G., Lindroth, A., Lomas, M., Luyssaert, S., Margolis, H., Oleson, K. W., Roupsard, O., Veenendaal, E., Viovy, N., Williams, C., Woodward, F. I., and Papale, D.: Terrestrial gross carbon dioxide uptake: global distribution and covariation with climate, Science, 329, 834–838, 2010.
Bolster, C. H. and Hornberger, G. M.: On the Use of Linearized Langmuir Equations, Soil Sci. Soc. Am. J., 71, 1796–1806, https://doi.org/10.2136/sssaj2006.0304, 2007.
Boyer, E. W., Howarth, R. W., Galloway, J. N., Dentener, F. J., Green, P. A., and Vorosmarty, C. J.: Riverine nitrogen export from the continents to the coasts, Global Biogeochem. Cy., 20, GB1S91, https://doi.org/10.1029/2005GB002537, 2006.
Butler, O. M., Elser, J. J., Lewis, T., Mackey, B., and Chen, C.: The phosphorus-rich signature of fire in the soil–plant system: a global meta-analysis, Ecol. Lett., 21, 335–344, https://doi.org/10.1111/ele.12896, 2018.
Chien, C.-T., Mackey, K. R. M., Dutkiewicz, S., Mahowald, N. M., Prospero, J. M., and Paytan, A.: Effects of African dust deposition on phytoplankton in the western tropical Atlantic Ocean off Barbados, Global Biogeochem. Cy., 30, 716–734, https://doi.org/10.1002/2015GB005334, 2014.
Cleveland, C. C. and Liptzin, D.: stoichiometry in soil: is there a “Redfield ratio” for the microbial biomass?, Biogeochemistry, 85, 235–252, 2007.
Cleveland, C. C., Townsend, A. R., Schimel, D. S., Fisher, H., Howarth, R. W., Hedin, L. O., Perakis, S. S., Latty, E. F., Von Fischer, J. C., Elseroad, A., and Wasson, M. F.: Global patterns of terrestrial biological nitrogen (N2) fixation in natural ecosystems, Global Biogeochem. Cy., 13, 623–645, https://doi.org/10.1029/1999gb900014, 1999.
Cramer, W., Bondeau, A., Woodward, F. I., Prentice, I. C., Betts, R. A., Brovkin, V., Cox, P. M., Fisher, V., Foley, J. A., Friend, A. D., Kucharik, C., Lomas, M. R., Ramankutty, N., Sitch, S., Smith, B., White, A., and Young-Molling, C.: Global response of terrestrial ecosystem structure and function to CO2 and climate change: Results from six dynamic global vegetation models, Global Change Biol., 7, 357–373, https://doi.org/10.1046/j.1365-2486.2001.00383.x, 2001.
Cunha, H. F. V., Andersen, K. M., Lugli, L. F., Santana, F. D., Aleixo, I., Moraes, A. C. M., Garcia, S., Di Ponzio, R., Mendoza, E. O., Brum, B., Rosa, J. S., Cordeiro, A. L., Portela, B. T. T., Ribeiro, G., Coelho, S. D., de Souza, S. T., Silva, L. S., Antonieto, F., Pires, M., Salomão, A. C., Miron, A. C., Assis, R., Domingues, T. F., Aragão, L. E. O. C., Meir, P., Carmargo, J. L., Manzi, A., Nagy, L., Mercado, L. M., Hartley, I. P., and Quesada, C. A.: Direct evidence for phosphorus limitation on Amazon forest productivity, Nature, 608, 558–562, https://doi.org/10.1038/s41586-022-05085-2, 2022.
Dantas De Paula, M.: LPJ-GUESS-CNP driver files (fixed), Zenodo [data set], https://doi.org/10.5281/zenodo.13594436, 2024a.
Dantas De Paula, M.: LPJ-GUESS-CNP driver files [Data set], Zenodo [data set], https://doi.org/10.5281/zenodo.13472421, 2024b.
Dantas De Paula, M.: LPJ-GUESS-CNP result files [Data set], Zenodo [data set], https://doi.org/10.5281/zenodo.13385547, 2024c.
Dantas De Paula, M.: LPJ-GUESS-CNP v1.0, Zenodo [data set], https://doi.org/10.5281/zenodo.13471785, 2024d (code is available at: https://github.com/mateusdp/LPJ-GUESS-NTD/tree/phosphorus-cf-walker, last access: 8 April 2025).
da Silva, E. C., da Silva Sales, M. V., Aleixo, S., Gama-Rodrigues, A. C., and Gama-Rodrigues, E. F.: Does Structural Equation Modeling Provide a Holistic View of Phosphorus Acquisition Strategies in Soils of Amazon Forest?, J. Soil Sci. Plant Nutr., 22, 3334–3347, https://doi.org/10.1007/s42729-022-00890-0, 2022.
da Silveira, A. P. D. and Cardoso, E. J. B. N.: Arbuscular mycorrhiza and kinetic parameters of phosphorus absorption by bean plants, Sci. Agric., 61, 203–209, https://doi.org/10.1590/s0103-90162004000200013, 2004.
Demarty, J., Chevallier, F., Friend, A. D., Viovy, N., Piao, S., and Ciais, P.: Assimilation ofglobal MODIS leafarea index retrievals within a terrestrial biosphere model, Geophys. Res. Lett., 34, L15402, https://doi.org/10.1029/2007GL030014, 2007
Du, E., Terrer, C., Pellegrini, A. F. A., Ahlström, A., van Lissa, C. J., Zhao, X., Xia, N., Wu, X., and Jackson, R. B.: Global patterns of terrestrial nitrogen and phosphorus limitation, Nat. Geosci., 13, 221–226, https://doi.org/10.1038/s41561-019-0530-4, 2020.
Field, C. B., Behrenfeld, M. J., Randerson, J. T., and Falkowski, P.: Primary production of the biosphere: Integrating terrestrial and oceanic components, Science, 281, 237–240, https://doi.org/10.1126/science.281.5374.237, 1998.
Fisher, J. B., Sitch, S., Malhi, Y., Fisher, R. A., Huntingford, C., and Tan, S.-Y.: Carbon cost of plant nitrogen acquisition: A mechanistic, globally applicable model of plant nitrogen uptake, retranslocation, and fixation, Global Biogeochem. Cy., 24, GB1014, https://doi.org/10.1029/2009gb003621, 2010.
Fleischer, K., Rammig, A., De Kauwe, M. G., Walker, A. P., Domingues, T. F., Fuchslueger, L., Garcia, S., Goll, D. S., Grandis, A., Jiang, M., Haverd, V., Hofhansl, F., Holm, J. A., Kruijt, B., Leung, F., Medlyn, B. E., Mercado, L. M., Norby, R. J., Pak, B., von Randow, C., Quesada, C. A., Schaap, K. J., Valverde-Barrantes, O. J., Wang, Y. P., Yang, X., Zaehle, S., Zhu, Q., and Lapola, D. M.: Amazon forest response to CO2 fertilization dependent on plant phosphorus acquisition, Nat. Geosci., 12, 736–741, https://doi.org/10.1038/s41561-019-0404-9, 2019.
Galloway, J. N., Dentener, F. J., Capone, D. G., Boyer, E. W., Howarth, R. W., Seitzinger, S. P., Asner, G. P., Cleveland, C. C., Green, P. A., Holland, E. A., Karl, D. M., Michaels, A. F., Porter, J. H., Townsend, A. R., and Vörösmarty, C. J.: Nitrogen cycles: past, present, and future, Biogeochemistry, 70, 1–74, 2004.
Goll, D. S., Vuichard, N., Maignan, F., Jornet-Puig, A., Sardans, J., Violette, A., Peng, S., Sun, Y., Kvakic, M., Guimberteau, M., Guenet, B., Zaehle, S., Penuelas, J., Janssens, I., and Ciais, P.: A representation of the phosphorus cycle for ORCHIDEE (revision 4520), Geosci. Model Dev., 10, 3745–3770, https://doi.org/10.5194/gmd-10-3745-2017, 2017.
Harris, I. C.: CRU JRA v2.0: A forcings dataset of gridded land surface blend of Climatic Research Unit (CRU) and Japanese reanalysis (JRA) data: January 1901–December 2018, Centre for Environmental Data Analysis, https://catalogue.ceda.ac.uk/uuid/7f785c0e80aa4df2b39d068ce7351bbb/ (last access: 10 April 2025), 2019.
Hartmann, J. and Moosdorf, N.: Chemical weathering rates of silicate-dominated lithological classes and associated liberation rates of phosphorus on the Japanese Archipelago-Implications for global scale analysis, Chem. Geol., 287, 125–157, https://doi.org/10.1016/j.chemgeo.2010.12.004, 2011.
Hartmann, J. and Moosdorf, N.: The new global lithological map database GLiM: A representation of rock properties at the Earth surface, Geochem. Geophy. Geosy., 13, 1–37, https://doi.org/10.1029/2012GC004370, 2012.
Hartmann, J., Moosdorf, N., Lauerwald, R., Hinderer, M., and West, A. J.: Global chemical weathering and associated p-release – the role of lithology, temperature and soil properties, Chem. Geol., 363, 145–163, https://doi.org/10.1016/j.chemgeo.2013.10.025, 2014.
Haverd, V., Smith, B., Nieradzik, L., Briggs, P. R., Woodgate, W., Trudinger, C. M., Canadell, J. G., and Cuntz, M.: A new version of the CABLE land surface model (Subversion revision r4601) incorporating land use and land cover change, woody vegetation demography, and a novel optimisation-based approach to plant coordination of photosynthesis, Geosci. Model Dev., 11, 2995–3026, https://doi.org/10.5194/gmd-11-2995-2018, 2018.
Haverd, V., Smith, B., Canadell, J. G., Cuntz, M., Mikaloff-Fletcher, S., Farquhar, G., Woodgate, W., Briggs, P. R., and Trudinger, C. M.: Higher than expected CO2 fertilization inferred from leaf to global observations, Global Change Biol., 26, 2390–2402, https://doi.org/10.1111/gcb.14950, 2020.
He, H., Jansson, P. E., and Gärdenäs, A. I.: CoupModel (v6.0): An ecosystem model for coupled phosphorus, nitrogen, and carbon dynamics – Evaluated against empirical data from a climatic and fertility gradient in Sweden, Geosci. Model Dev., 14, 735–761, https://doi.org/10.5194/gmd-14-735-2021, 2021a.
He, X., Augusto, L., Goll, D. S., Ringeval, B., Wang, Y., Helfenstein, J., Huang, Y., Yu, K., Wang, Z., Yang, Y., and Hou, E.: Global patterns and drivers of soil total phosphorus concentration, Earth Syst. Sci. Data, 13, 5831–5846, https://doi.org/10.5194/essd-13-5831-2021, 2021b.
He, X., Augusto, L., Goll, D. S., Ringeval, B., Wang, Y. P., Helfenstein, J., Huang, Y., and Hou, E.: Global patterns and drivers of phosphorus fractions in natural soils, Biogeosciences, 20, 4147–4163, https://doi.org/10.5194/bg-20-4147-2023, 2023.
Hickler, T., Vohland, K., Feehan, J., Miller, P. A., Smith, B., Costa, L., Giesecke, T., Fronzek, S., Carter, T. R., Cramer, W., Kühn, I., and Sykes, M. T.: Projecting the future distribution of European potential natural vegetation zones with a generalized, tree species-based dynamic vegetation model, Glob. Ecol. Biogeogr., 21, 50–63, https://doi.org/10.1111/j.1466-8238.2010.00613.x, 2012.
Hickler, T., Rammig, A., and Werner, C.: Modelling CO2 impacts on forest productivity, Curr. Forest. Rep., 1, 69–80, https://doi.org/10.1007/s40725-015-0014-8, 2015.
Hidaka, A. and Kitayama, K.: Relationship between photosynthetic phosphorus-use efficiency and foliar phosphorus fractions in tropical tree species, Ecol. Evol., 3, 4872–4880, https://doi.org/10.1002/ece3.861, 2013.
Hou, E., Luo, Y., Kuang, Y., Chen, C., Lu, X., Jiang, L., Luo, X., and Wen, D.: Global meta-analysis shows pervasive phosphorus limitation of aboveground plant production in natural terrestrial ecosystems, Nat. Commun., 11, 1–9, https://doi.org/10.1038/s41467-020-14492-w, 2020.
House, J. I., Prentice, I. C., Ramankutty, N., Houghton, R. A., and Heimann, M.: Reconciling apparent inconsistencies in estimates of terrestrial CO2 sources and sinks, Tellus B, 55, 345–363, 2003.
IPCC: Definitions and Methodological Options to Inventory Emissions from Direct Human-induced Degradation of Forests and Devegetation of Other Vegetation Types, Natl. Greenh. Gas Invent. Program. 2, Elsevier, https://doi.org/10.1016/B978-0-12-375067-9.00128-5, 2003.
IPCC – Intergovernmental Panel on Climate Change: Climate Change 2007 – The Physical Science Basis. Contribution of Working Group I to the Fourth Assessment Report of the IPCC, Cambridge University Press, Cambridge, UK, ISBN 978 0521 88009-1, 2007.
Ito, A.: A historical meta-analysis of global terrestrial net primary productivity: are estimates converging?, Global Change Biol., 17, 3161–3175, 2011.
Ito, A. and Penner, J. E.: Global estimates ofbiomass burning emis- sions based on satellite imagery for the year 2000, J. Geophys. Res., 109, D14S05, https://doi.org/10.1029/2003JD004423, 2004.
Jiang, M., Caldararu, S., Zhang, H., Fleischer, K., Crous, K. Y., Yang, J., De Kauwe, M. G., Ellsworth, D. S., Reich, P. B., Tissue, D. T., Zaehle, S., and Medlyn, B. E.: Low phosphorus supply constrains plant responses to elevated CO2: A meta-analysis, Global Change Biol., 26, 5856–5873, https://doi.org/10.1111/gcb.15277, 2020.
Johnson, D. W.: Progressive N limitation in forests: review and implications for long-term responses to elevated CO2, Ecology, 87, 64–75, https://doi.org/10.1177/1075547006291346, 2006.
Kanakidou, M., Myriokefalitakis, S., Daskalakis, N., Fanourgakis, G., Nenes, A., Baker, A. R., Tsigaridis, K., and Mihalopoulos, N.: Past, present, and future atmospheric nitrogen deposition, J. Atmos. Sci., 73, 2039–2047, https://doi.org/10.1175/JAS-D-15-0278.1, 2016.
Kattge, J., Bönisch, G., Díaz, S., Lavorel, S., Prentice, I. C., Leadley, P., Tautenhahn, S., Werner, G. D. A., Aakala, T., Abedi, M., Acosta, A. T. R., Adamidis, G. C., Adamson, K., Aiba, M., Albert, C. H., Alcántara, J. M., Alcázar C, C., Aleixo, I., Ali, H., Amiaud, B., Ammer, C., Amoroso, M. M., Anand, M., Anderson, C., Anten, N., Antos, J., Apgaua, D. M. G., Ashman, T., Asmara, D. H., Asner, G. P., Aspinwall, M., Atkin, O., Aubin, I., Baastrup-Spohr, L., Bahalkeh, K., Bahn, M., Baker, T., Baker, W. J., Bakker, J. P., Baldocchi, D., Baltzer, J., Banerjee, A., Baranger, A., Barlow, J., Barneche, D. R., Baruch, Z., Bastianelli, D., Battles, J., Bauerle, W., Bauters, M., Bazzato, E., Beckmann, M., Beeckman, H., Beierkuhnlein, C., Bekker, R., Belfry, G., Belluau, M., Beloiu, M., Benavides, R., Benomar, L., Berdugo-Lattke, M. L., Berenguer, E., Bergamin, R., Bergmann, J., Bergmann Carlucci, M., Berner, L., Bernhardt-Römermann, M., Bigler, C., Bjorkman, A. D., Blackman, C., Blanco, C., Blonder, B., Blumenthal, D., Bocanegra-González, K. T., Boeckx, P., Bohlman, S., Böhning-Gaese, K., Boisvert-Marsh, L., Bond, W., Bond-Lamberty, B., Boom, A., Boonman, C. C. F., Bordin, K., Boughton, E. H., Boukili, V., Bowman, D. M. J. S., Bravo, S., Brendel, M. R., Broadley, M. R., Brown, K. A., Bruelheide, H., Brumnich, F., Bruun, H. H., Bruy, D., Buchanan, S. W., Bucher, S. F., Buchmann, N., Buitenwerf, R., Bunker, D. E., et al.: TRY plant trait database – enhanced coverage and open access, Global Change Biol., 26, 119–188, https://doi.org/10.1111/gcb.14904, 2020.
Kou, D., Yang, G., Li, F., Feng, X., Zhang, D., Mao, C., Zhang, Q., Peng, Y., Ji, C., Zhu, Q., Fang, Y., Liu, X., Xu-Ri, Li, S., Deng, J., Zheng, X., Fang, J., and Yang, Y.: Progressive nitrogen limitation across the Tibetan alpine permafrost region, Nat. Commun., 11, 3331, https://doi.org/10.1038/s41467-020-17169-6, 2020.
Lamarque, J. F., Dentener, F., McConnell, J., Ro, C. U., Shaw, M., Vet, R., Bergmann, D., Cameron-Smith, P., Dalsoren, S., Doherty, R., Faluvegi, G., Ghan, S. J., Josse, B., Lee, Y. H., Mackenzie, I. A., Plummer, D., Shindell, D. T., Skeie, R. B., Stevenson, D. S., Strode, S., Zeng, G., Curran, M., Dahl-Jensen, D., Das, S., Fritzsche, D., and Nolan, M.: Multi-model mean nitrogen and sulfur deposition from the atmospheric chemistry and climate model intercomparison project (ACCMIP): Evaluation of historical and projected future changes, Atmos. Chem. Phys., 13, 7997–8018, https://doi.org/10.5194/acp-13-7997-2013, 2013.
Leakey, A. D. B., Ainsworth, E. A., Bernacchi, C. J., Rogers, A., Long, S. P., and Ort, D. R.: Elevated CO2 effects on plant carbon, nitrogen, and water relations: Six important lessons from FACE, J. Exp. Bot., 60, 2859–2876, https://doi.org/10.1093/jxb/erp096, 2009.
Leuschner, C., Zach, A., Moser, G., Soethe, N., Graefe, S., Hertel, D., Iost, S., Ro, M., Horna, V., and Wolf, K.: The Carbon Balance of Tropical Mountain Forests Along an Altitudinal Transect, in: Ecosystem Services, Biodiversity and Environmental Change in a Tropical Mountain Ecosystem of South Ecuador, vol. 221, edited by: Bendix, J., Springer-Verlag, Berlin, Heidelberg, 117–139, https://doi.org/10.1007/978-3-642-38137-9, 2013.
Li, X. and Xiao, J.: Mapping photosynthesis solely from solar-induced chlorophyll fluorescence: A global, fine-resolution dataset of gross primary production derived from OCO-2, Remote Sens., 11, 2563, https://doi.org/10.3390/rs11212563, 2019.
Li, Y., Niu, S., and Yu, G.: Aggravated phosphorus limitation on biomass production under increasing nitrogen loading: A meta-analysis, Global Change Biol., 22, 934–943, https://doi.org/10.1111/gcb.13125, 2016.
Li, Y., Yu, Z., Liu, X., Mathesius, U., Wang, G., Tang, C., Wu, J., Liu, J., Zhang, S., and Jin, J.: Elevated CO2 increases Nitrogen fixation at the reproductive phase contributing to various yield responses of soybean cultivars, Front. Plant Sci., 8, 1546, https://doi.org/10.3389/fpls.2017.01546, 2017.
Lugli, L. F.: Rapid responses of root traits and productivity to phosphorus and cation additions in a tropical lowland forest in Amazonia, New Phytol., 230, 116–128, https://doi.org/10.1111/nph.17154, 2021.
Lugli, L. F., Andersen, K. M., Aragão, L. E. O. C., Cordeiro, A. L., Cunha, H. F. V., Fuchslueger, L., Meir, P., Mercado, L. M., Oblitas, E., Quesada, C. A., Rosa, J. S., Schaap, K. J., Valverde-Barrantes, O., and Hartley, I. P.: Multiple phosphorus acquisition strategies adopted by fine roots in low-fertility soils in Central Amazonia, Plant Soil, 450, 49–63, https://doi.org/10.1007/s11104-019-03963-9, 2020.
Luo, Y., Su, B., Currie, W. S., Dukes, J. S., Finzi, A., Hartwig, U., Hungate, B., McMurtrie, R. E., Oren, R., Parton, W. J., Pataki, D. E., Shaw, M. R., Zak, D. R., and Field, C. B.: Progressive nitrogen limitation of ecosystem responses to rising atmospheric carbon dioxide, Bioscience, 54, 731–739, https://doi.org/10.1641/0006-3568(2004)054[0731:PNLOER]2.0.CO;2, 2004.
Mahowald, N. M., Scanza, R., Brahney, J., Goodale, C. L., Hess, P. G., Moore, J. K., and Neff, J.: Aerosol Deposition Impacts on Land and Ocean Carbon Cycles, Curr. Clim. Change Rep., 3, 16–31, https://doi.org/10.1007/s40641-017-0056-z, 2017.
Margalef, O., Sardans, J., Fernández-Martínez, M., Molowny-Horas, R., Janssens, I. A., Ciais, P., Goll, D., Richter, A., Obersteiner, M., Asensio, D., and Peñuelas, J.: Global patterns of phosphatase activity in natural soils, Sci. Rep., 7, 1–13, https://doi.org/10.1038/s41598-017-01418-8, 2017.
Parton, W. J., Stewart, J. W. B., and Cole, C. V.: Dynamics of C, N, P and S in grassland soils: a model, Biogeochemistry, 5, 109–131, https://doi.org/10.1007/BF02180320, 1988.
Parton, W. J., Scurlock, J. M. O., Ojima, D. S., Gilmanov, T. G., Scholes, R. J., Schimel, D. S., Kirchner, T., Menaut, J.-C., Seastedt, T., Garcia Moya, E., Kamnalrut, A., and Kinyamario, J. I.: Observations and modeling of biomass and soil organic matter dynamics for the grassland biome worldwide, Global Biogeochem. Cy., 7, 785–809, https://doi.org/10.1029/93GB02042, 1993.
Parton, W. J., Hanson, P. J., Swanston, C., Torn, M., Trumbore, S. E., Riley, W., and Kelly, R.: ForCent model development and testing using the Enriched Background Isotope Study experiment, J. Geophys. Res.-Biogeo., 115, 1–15, https://doi.org/10.1029/2009JG001193, 2010.
Peñuelas, J., Poulter, B., Sardans, J., Ciais, P., Van Der Velde, M., Bopp, L., Boucher, O., Godderis, Y., Hinsinger, P., Llusia, J., Nardin, E., Vicca, S., Obersteiner, M., and Janssens, I. A.: Human-induced nitrogen-phosphorus imbalances alter natural and managed ecosystems across the globe, Nat. Commun., 4, 2934, https://doi.org/10.1038/ncomms3934, 2013.
Piao, S., Luyssaert, S., Ciais, P., Janssens, I. A., Chen, A., Cao, C., Fang, J., Friedlingstein, P., Luo, Y., and Wang, S.: Forest annual carbon cost: a global-scale analysis of autotrophic respiration, Ecology, 91, 652–661, 2010.
Pickering, M., Cescatti, A., and Duveiller, G.: Sun-induced fluorescence as a proxy for primary productivity across vegetation types and climates, Biogeosciences, 19, 4833–4864, https://doi.org/10.5194/bg-19-4833-2022, 2022.
Post, W. M., Pastor, J., Zinke, P. J., and Stangenberger, A.G.: Global patterns of soil-nitrogen storage, Nature, 317, 613–616, 1985.
Prentice, I. C., Bondeau, A., Cramer, W., Harrison, S. P., Hickler, T., Lucht, W., Sitch, S., Smith, B., and Sykes, M. T.: Dynamic Global Vegetation Modeling: Quantifying Terrestrial Ecosystem Responses to Large-Scale Environmental Change, in: Terrestrial Ecosystems in a Changing World, edited by: Canadell, J. G., Pataki, D. E., and Piteka, L. F., Springer, Berlin, Heidelberg, 175–192, https://doi.org/10.1007/978-3-540-32730-1_15, 2007.
Quesada, C. A., Phillips, O. L., Schwarz, M., Czimczik, C. I., Baker, T. R., Patiño, S., Fyllas, N. M., Hodnett, M. G., Herrera, R., Almeida, S., Alvarez Dávila, E., Arneth, A., Arroyo, L., Chao, K. J., Dezzeo, N., Erwin, T., Di Fiore, A., Higuchi, N., Honorio Coronado, E., Jimenez, E. M., Killeen, T., Lezama, A. T., Lloyd, G., Löpez-González, G., Luizão, F. J., Malhi, Y., Monteagudo, A., Neill, D. A., Núñez Vargas, P., Paiva, R., Peacock, J., Peñuela, M. C., Peña Cruz, A., Pitman, N., Priante Filho, N., Prieto, A., Ramírez, H., Rudas, A., Salomão, R., Santos, A. J. B., Schmerler, J., Silva, N., Silveira, M., Vásquez, R., Vieira, I., Terborgh, J., and Lloyd, J.: Basin-wide variations in Amazon forest structure and function are mediated by both soils and climate, Biogeosciences, 9, 2203–2246, https://doi.org/10.5194/bg-9-2203-2012, 2012.
Quillet, A., Peng, C., and Garneau, M.: Toward dynamic global vegetation models for simulating vegetation–climate interactions and feedbacks: recent developments, limitations, and future challenges, Environ. Rev., 18, 333–353, https://doi.org/10.1139/A10-016, 2009.
Reichert, T., Rammig, A., Fuchslueger, L., Lugli, L. F., Quesada, C. A., and Fleischer, K.: Plant phosphorus-use and -acquisition strategies in Amazonia, New Phytol., 234, 1126–1143, https://doi.org/10.1111/nph.17985, 2022.
Rogers, A., Ainsworth, E. A., and Leakey, A. D. B.: Will elevated carbon dioxide concentration amplify the benefits of nitrogen fixation in legumes?, Plant Physiol., 151, 1009–1016, https://doi.org/10.1104/pp.109.144113, 2009.
Santoro, M., Cartus, O., Carvalhais, N., Rozendaal, D. M. A., Avitabile, V., Araza, A., De Bruin, S., Herold, M., Quegan, S., Rodríguez-Veiga, P., Balzter, H., Carreiras, J., Schepaschenko, D., Korets, M., Shimada, M., Itoh, T., Moreno Martínez, Á., Cavlovic, J., Gatti, R. C., Da Conceição Bispo, P., Dewnath, N., Labrière, N., Liang, J., Lindsell, J., Mitchard, E. T. A., Morel, A., Pacheco Pascagaza, A. M., Ryan, C. M., Slik, F., Vaglio Laurin, G., Verbeeck, H., Wijaya, A., and Willcock, S.: The global forest above-ground biomass pool for 2010 estimated from high-resolution satellite observations, Earth Syst. Sci. Data, 13, 3927–3950, https://doi.org/10.5194/essd-13-3927-2021, 2021.
Saugier, B. and Roy, J.: Estimations of global terrestrial pro- ductivity: converging towards a single number?, in: Terrestrial Global Productivity: Past, Present and Future, edited by: Roy, J., Saugier, B., and Mooney, H. A., Academic Press, San Diego, CA, USA, ISBN 978-0-12-505290-0, 2001.
Schlesinger, W. H.: Biogeochemistry: An Analysis of Global Change, in: 2nd Edn., Academic Press, San Diego, ISBN 978-0-12-625157-9, 1997.
Schultz, M. G., Heil, A., Hoelzemann, J. J. Spessa, A., Thonicke, K., Goldammer, J. G., Held, A. C., Pereira, J. M. C., and van het Bolscher, M.: Global wildland fire emissions from 1960 to 2000, Global Biogeochem. Cy., 22, GB2002, https://doi.org/10.1029/2007GB003031, 2008.
Shi, H., Tian, H., Pan, N., Reyer, C. P. O., Ciais, P., Chang, J., Forrest, M., Frieler, K., Fu, B., Gädeke, A., Hickler, T., Ito, A., Ostberg, S., Pan, S., Stevanović, M., and Yang, J.: Saturation of Global Terrestrial Carbon Sink Under a High Warming Scenario, Global Biogeochem. Cy., 35, 1–18, https://doi.org/10.1029/2020GB006800, 2021.
Smith, B., Prentice, I. C., and Sykes, M. T.: Representation of vegetation dynamics in the modelling of terrestrial ecosystems: comparing two contrasting approaches within European climate space, Global Ecol. Biogeogr., 10, 621–637, https://doi.org/10.1046/j.1466-822X.2001.t01-1-00256.x, 2001.
Smith, B., Wärlind, D., Arneth, A., Hickler, T., Leadley, P., Siltberg, J., and Zaehle, S.: Implications of incorporating N cycling and N limitations on primary production in an individual-based dynamic vegetation model, Biogeosciences, 11, 2027–2054, https://doi.org/10.5194/bg-11-2027-2014, 2014.
Smith, S. E. and Smith, F. A.: Roles of Arbuscular Mycorrhizas in Plant Nutrition and Growth: New Paradigms from Cellular to Ecosystem Scales, Annu. Rev. Plant Biol., 227–50, https://doi.org/10.1146/annurev-arplant-042110-103846, 2011.
Stock, S. C., Koester, M., Boy, J., Godoy, R., Nájera, F., Matus, F., Merino, C., Abdallah, K., Leuschner, C., Spielvogel, S., Gorbushina, A. A., Kuzyakov, Y., and Dippold, M. A.: Plant carbon investment in fine roots and arbuscular mycorrhizal fungi: A cross-biome study on nutrient acquisition strategies, Sci. Total Environ., 781, 146748, https://doi.org/10.1016/j.scitotenv.2021.146748, 2021.
Terrer, C., Phillips, R., Hungate, B., Rosende, J., Pett-Ridge, J., Craig, M., van Groenigen, K., Keenan, T., Sulman, B., Stocker, B., Reich, P., Pellegrini, A., Pendall, E., Zhang, H., Evans, R., Carrillo, Y., Fisher, J., Van Sundert, K., Vicca, S., and Jackson, R.: A trade-off between plant and soil carbon storage under elevated CO2, Nature, 591, 599–603, https://doi.org/10.1038/s41586-021-03306-8, 2021.
Thonicke, K., Venevsky, S., Sitch, S., and Cramer, W.: The role of fire disturbance for global vegetation dynamics: Coupling fire into a dynamic global vegetation model, Global Ecol. Biogeogr., 10, 661–677, https://doi.org/10.1046/j.1466-822X.2001.00175.x, 2001.
Van Der Heijden, M. G. A., Bardgett, R. D., and Van Straalen, N. M.: The unseen majority: Soil microbes as drivers of plant diversity and productivity in terrestrial ecosystems, Ecol. Lett., 11, 296–310, https://doi.org/10.1111/j.1461-0248.2007.01139.x, 2008.
van der Werf, G. R., Randerson, J. T., Giglio, L., Collatz, G. J., Mu, M., Kasibhatla, P. S., Morton, D. C., DeFries, R. S., Jin, Y., and van Leeuwen, T. T.: Global fire emissions and the contribution of deforestation, savanna, forest, agricultural, and peat fires (1997–2009), Atmos. Chem. Phys., 10, 11707–11735, https://doi.org/10.5194/acp-10-11707-2010, 2010.
Vitousek, P., Mooney, H., Lubchenco, J., and Melillo, J.: Human Domination of Earth Ecosystems, Science, 278, 494–499, https://doi.org/10.1126/science.277.5325.494, 1997.
Vitousek, P. M.: Litterfall, Nutrient Cycling, and Nutrient Limitation in Tropical Forests, Ecology, 65, 285–298, https://doi.org/10.2307/1939481, 1984.
Von Bloh, W., Schaphoff, S., Müller, C., Rolinski, S., Waha, K., and Zaehle, S.: Implementing the nitrogen cycle into the dynamic global vegetation, hydrology, and crop growth model LPJmL (version 5.0), Geosci. Model Dev., 11, 2789–2812, https://doi.org/10.5194/gmd-11-2789-2018, 2018.
Walker, A. P., De Kauwe, M. G., Bastos, A., Belmecheri, S., Georgiou, K., Keeling, R. F., McMahon, S. M., Medlyn, B. E., Moore, D. J. P., Norby, R. J., Zaehle, S., Anderson-Teixeira, K. J., Battipaglia, G., Brienen, R. J. W., Cabugao, K. G., Cailleret, M., Campbell, E., Canadell, J. G., Ciais, P., Craig, M. E., Ellsworth, D. S., Farquhar, G. D., Fatichi, S., Fisher, J. B., Frank, D. C., Graven, H., Gu, L., Haverd, V., Heilman, K., Heimann, M., Hungate, B. A., Iversen, C. M., Joos, F., Jiang, M., Keenan, T. F., Knauer, J., Körner, C., Leshyk, V. O., Leuzinger, S., Liu, Y., MacBean, N., Malhi, Y., McVicar, T. R., Penuelas, J., Pongratz, J., Powell, A. S., Riutta, T., Sabot, M. E. B., Schleucher, J., Sitch, S., Smith, W. K., Sulman, B., Taylor, B., Terrer, C., Torn, M. S., Treseder, K. K., Trugman, A. T., Trumbore, S. E., van Mantgem, P. J., Voelker, S. L., Whelan, M. E., and Zuidema, P. A.: Integrating the evidence for a terrestrial carbon sink caused by increasing atmospheric CO2, New Phytol., 229, 2413–2445, https://doi.org/10.1111/nph.16866, 2021.
Wang, Y. P., Houlton, B. Z., and Field, C. B.: A model of biogeochemical cycles of carbon, nitrogen, and phosphorus including symbiotic nitrogen fixation and phosphatase production, Global Biogeochem. Cy., 21, 1–15, https://doi.org/10.1029/2006GB002797, 2007.
Wang, Y. P., Law, R. M., and Pak, B.: A global model of carbon, nitrogen and phosphorus cycles for the terrestrial biosphere, Biogeosciences, 7, 2261–2282, https://doi.org/10.5194/bg-7-2261-2010, 2010.
Wärlind, D., Smith, B., Hickler, T., and Arneth, A.: Nitrogen feedbacks increase future terrestrial ecosystem carbon uptake in an individual-based dynamic vegetation model, Biogeosciences, 11, 6131–6146, https://doi.org/10.5194/bg-11-6131-2014, 2014.
Wieder, W. R., Cleveland, C. C., Smith, W. K., and Todd-Brown, K.: Future productivity and carbon storage limited by terrestrial nutrient availability, Nat. Geosci., 8, 441–444, https://doi.org/10.1038/NGEO2413, 2015.
Wilcke, W., Velescu, A., Leimer, S., Bigalke, M., Boy, J., and Valarezo, C.: Temporal Trends of Phosphorus Cycling in a Tropical Montane Forest in Ecuador During 14 Years, J. Geophys. Res.-Biogeo., 124, 1–17, https://doi.org/10.1029/2018JG004942, 2019.
Wright, S. J.: Plant responses to nutrient addition experiments conducted in tropical forests, Ecol. Monogr., 89, 1–18, https://doi.org/10.1002/ecm.1382, 2019.
Wright, S. J., Turner, B. L., Yavitt, J. B., Harms, K. E., Kaspari, M., Tanner, E. V. J., Bujan, J., Griffin, E. A., Mayor, J. R., Pasquini, S. C., Sheldrake, M., and Garcia, M. N.: Plant responses to fertilization experiments in lowland, species-rich, tropical forests, Ecology, 99, 1129–1138, https://doi.org/10.1002/ecy.2193, 2018.
Xu, J., Chen, Y., Zhang, L., Chai, Y., Wang, M., Guo, Y., Li, T., and Yue, M.: Using phylogeny and functional traits for assessing community assembly along environmental gradients: A deterministic process driven by elevation, Ecol. Evol., 7, 5056–5069, https://doi.org/10.1002/ece3.3068, 2017.
Yang, X., Post, W. M., Thornton, P. E., and Jain, A.: The distribution of soil phosphorus for global biogeochemical modeling, Biogeosciences, 10, 2525–2537, https://doi.org/10.5194/bg-10-2525-2013, 2013.
Yang, X., Thornton, P. E., Ricciuto, D. M., and Post, W. M.: The role of phosphorus dynamics in tropical forests – A modeling study using CLM-CNP, Biogeosciences, 11, 1667–1681, https://doi.org/10.5194/bg-11-1667-2014, 2014.
Zaehle, S. and Friend, A. D.: Carbon and nitrogen cycle dynamics in the O-CN land surface model: 1. Model description, site-scale evaluation, and sensitivity to parameter estimates, Global Biogeochem. Cy., 24, 1–13, https://doi.org/10.1029/2009GB003521, 2010.
Zhang, Y. and Ye, A.: Uncertainty analysis of multiple terrestrial gross primary productivity products, Global Ecol. Biogeogr., 31, 2204–2218, https://doi.org/10.1111/geb.13578, 2022.
Zhang, Y., Xu, M., Chen, H., and Adams, J.: Global pattern of NPP to GPP ratio derived from MODIS data: effects of ecosystem type, geographical location and climate, Global Ecol. Biogeogr., 18, 280–290, 2009.
Zhu, D., Peng, S. S., Ciais, P., Viovy, N., Druel, A., Kageyama, M., Krinner, G., Peylin, P., Ottlé, C., Piao, S. L., Poulter, B., Schepaschenko, D., and Shvidenko, A.: Improving the dynamics of Northern Hemisphere high-latitude vegetation in the ORCHIDEE ecosystem model, Geosci. Model Dev., 8, 2263–2283, https://doi.org/10.5194/gmd-8-2263-2015, 2015.
Zhu, Q., Riley, W. J., Tang, J., and Koven, C. D.: Multiple soil nutrient competition between plants, microbes, and mineral surfaces: Model development, parameterization, and example applications in several tropical forests, Biogeosciences, 13, 341–363, https://doi.org/10.5194/bg-13-341-2016, 2016.