the Creative Commons Attribution 4.0 License.
the Creative Commons Attribution 4.0 License.
 | 24 Feb 2025
CropSuite v1.0 – a comprehensive open-source crop suitability model considering climate variability for climate impact assessment
Matthias Knüttel
Benjamin Poschlod
Increasing demand for agricultural land resources and changing climate conditions require strategic land-use planning and the development of adaptation strategies. Therefore, information about the suitability of agricultural land is a prerequisite. Current suitability approaches often focus on single crops, can only be applied regionally, and usually neglect the impact of climate variability on crop suitability. Here, we introduce CropSuite, a new, comprehensive, and easy-to-use crop suitability model that allows us to overcome these shortcomings. It provides a graphical user interface (GUI) and a wide range of pre- and postprocessing options, including a tool for data analysis, which allows users to easily apply the model and analyze the results. Further, it includes a spatial downscaling approach to climate data, which enables crop suitability analysis at very high spatial resolution. CropSuite uses a fuzzy-logic approach and is based on the assumption of Liebig's law of the minimum. An expandable number of environmental and socioeconomic factors that affect crop suitability can be flexibly integrated into CropSuite by determining membership functions. CropSuite allows for the consideration of irrigated and rainfed agricultural systems, vernalization requirements for winter crops, lethal temperature thresholds, photoperiodic sensitivity, and several other limitations for crop growth. The model endogenously calculates and outputs climate, soil, and crop suitability, the optimal sowing and harvest dates, the potential for multiple cropping, the (most-)limiting factor(s), and the recurrence rate of potential crop failure according to the inter-annual climate variability.
In this study, we apply CropSuite to 48 crops at a spatial resolution of 30 arcsec (1 km at the Equator) for Africa. Thereby, we consider regionally important staple and cash crops that are usually understudied, such as coffee, cassava, banana, oil palm, cocoa, cowpea, groundnuts, mango, millet, papaya, rubber, sesame, sorghum, sugar cane, tobacco, and yam. We find that the consideration of climate variability when calculating crop suitability makes a significant difference to suitable areas but also affects optimal sowing dates and multiple cropping potentials. The most vulnerable regions for climate variability are identified in Somalia, Kenya, Ethiopia, South Africa, and the Maghreb countries. The results provide valuable crop-specific information that can be further used for climate impact assessments, adaptation, and land-use planning at the global, regional, or local scale. CropSuite is provided as open-source code and could be of interest for model developers, scientists, and a wide range of potential users and stakeholders, such as farmers, companies, governmental organizations (GOs), and non-governmental organizations (NGOs).
- Article
(9492 KB) - Full-text XML
-
Supplement
(7532 KB) - BibTeX
- EndNote


Climate change poses major challenges for agricultural production and food security. With a warming climate, agricultural suitability changes, and suitable areas shift towards higher latitudes (Franke et al., 2021; Zabel et al., 2014). Crop suitability models allow for a quantitative evaluation of land for crop cultivation and can therefore assess how the suitability of land changes with changing climate. Contrary to mechanistic crop models (Jägermeyr et al., 2021; Jägermeyr et al., 2020; Müller et al., 2024), crop suitability models are based on empirical approaches but are less computationally intensive and thus allow for the consideration of more crops at a higher spatial resolution (Zabel et al., 2014). As a result, crop suitability models provide important insights into sustainable land-use planning and climate change adaptation, e.g., through cultivar change or land-use change. Akpoti et al. (2019) give an overview of existing crop suitability approaches. Most studies are applied at a regional scale (Maleki et al., 2017; Bonfante et al., 2015; Ranjitkar et al., 2016), while just a few global approaches exist (Akpoti et al., 2019). In addition, most studies focus only on single crops and do not cover a variety of different crops (Ramirez-Villegas et al., 2013; Akpoti et al., 2020). Particularly for Africa, domestically consumed staple crops such as yam and cassava are often overlooked in current studies due to their minor economic relevance, despite their regional importance for food security (Chapman et al., 2020; Chemura et al., 2024; Van Zonneveld et al., 2023; Karl et al., 2024). So far, none of the existing approaches systematically considers the impact of climate variability on crop suitability, which is a major shortcoming since climate variability is expected to increase with climate warming and has a strong impact on agriculture (Vogel et al., 2019; Goulart et al., 2021; IPCC, 2021).
The aim of this study is to introduce the CropSuite model, which is based on the crop suitability approach developed by Zabel et al. (2014) and has been further developed by Cronin et al. (2020) and Schneider et al. (2022a). The model has previously been applied globally to 23 crops under different climate scenarios (Zabel, 2022). The model applies Liebig's law of the minimum, assuming that the scarcest resource limits the crop growth. CropSuite is based on a fuzzy-logic approach where, in contrast to Boolean logic, the truth value of variables can be any real number between 0 and 1. In fuzzy logic, fuzzy sets consist of elements whose degrees of membership are described by membership functions (Zadeh, 1965). In our approach, we apply fuzzy logic to create crop-specific membership functions (Fig. 1) describing the abiotic crop requirements between 0 (not suitable) and 100 (highly suitable), according to various climatic, soil, and topographic variables (Zabel et al., 2014). Using a value range between 0 and 100 (instead of 0 and 1) enables the use of an 8-bit-integer data type for the internal calculation and storage of the results, which allows efficient use of the computer's memory and hard-disk space. This approach is adopted, fundamentally redesigned, and expanded, with the goal of providing a comprehensive but easy-to-use and flexible open-source model that can be applied, e.g., by scientists, farmers, companies, national or international governmental organizations (GOs), and non-governmental organizations (NGOs). Therefore, CropSuite has now been completely reprogrammed in Python and consists of a graphical user interface (GUI) as well as several preprocessing and analysis tools, e.g., for selecting a simulation domain, statistically downscaling the climate data, interpolating the membership functions, and automatically analyzing and mapping the results. In addition, CropSuite is complemented by a new approach to consider the impact of climate variability on crop suitability. It includes a user manual, which is provided together with the source code (Knüttel and Zabel, 2024a).
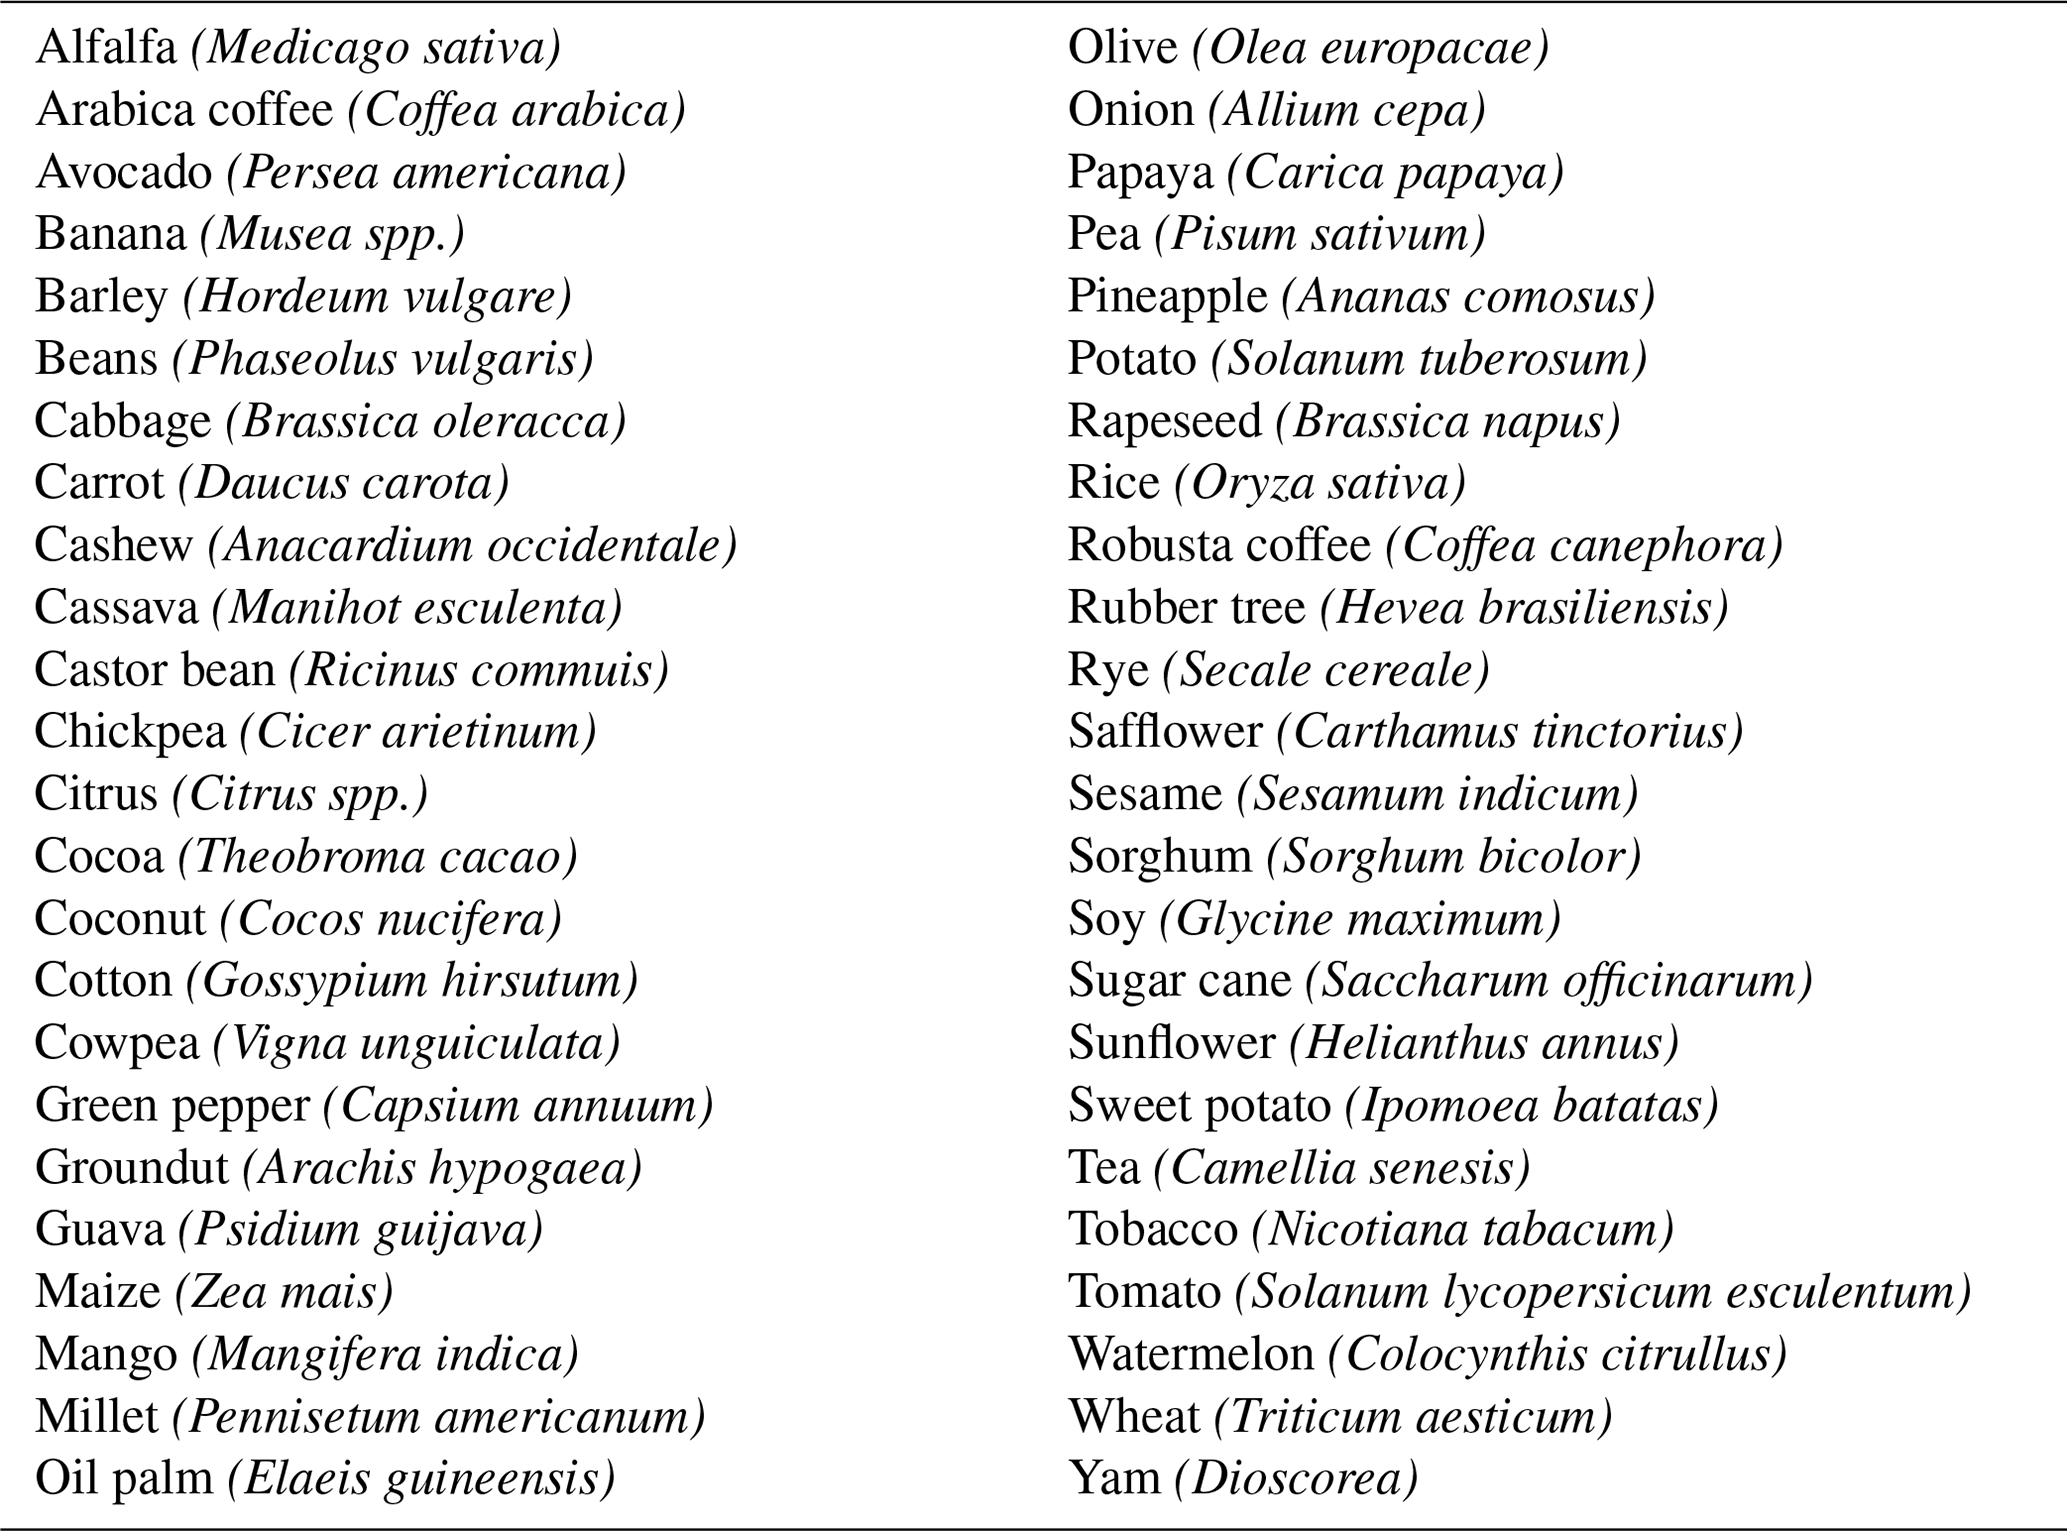
For this study, we apply CropSuite to Africa at a 30 arcsec spatial resolution (approximately 1 km2 at the Equator), with the goal of simulating relevant but often overlooked crops for this continent (Van Zonneveld et al., 2023). Table 1 shows the 48 crops that have been parameterized and simulated with CropSuite.
Table 1List of the 48 crops considered in this study and simulated with CropSuite. Binomial names are given in brackets.
We simulate a 20-year time period from 1991 to 2010 using the Climate Hazards Group Infrared Precipitation with Stations (CHIRPS) v2.0 daily data for precipitation (Funk et al., 2015) and the Climate Hazards Center Infrared Temperature with Stations (CHIRTS) v1.0 data for temperature (Funk et al., 2019; Verdin et al., 2020) at a 2.5 arcmin spatial resolution over Africa. Both datasets provide climatologies at daily to monthly resolution based on a combination of satellite remote sensing and climate stations. They benefit from long-term geostationary satellite observations, delivering consistent data since the 1980s at the quasi-global (50° S–50° N) scale.
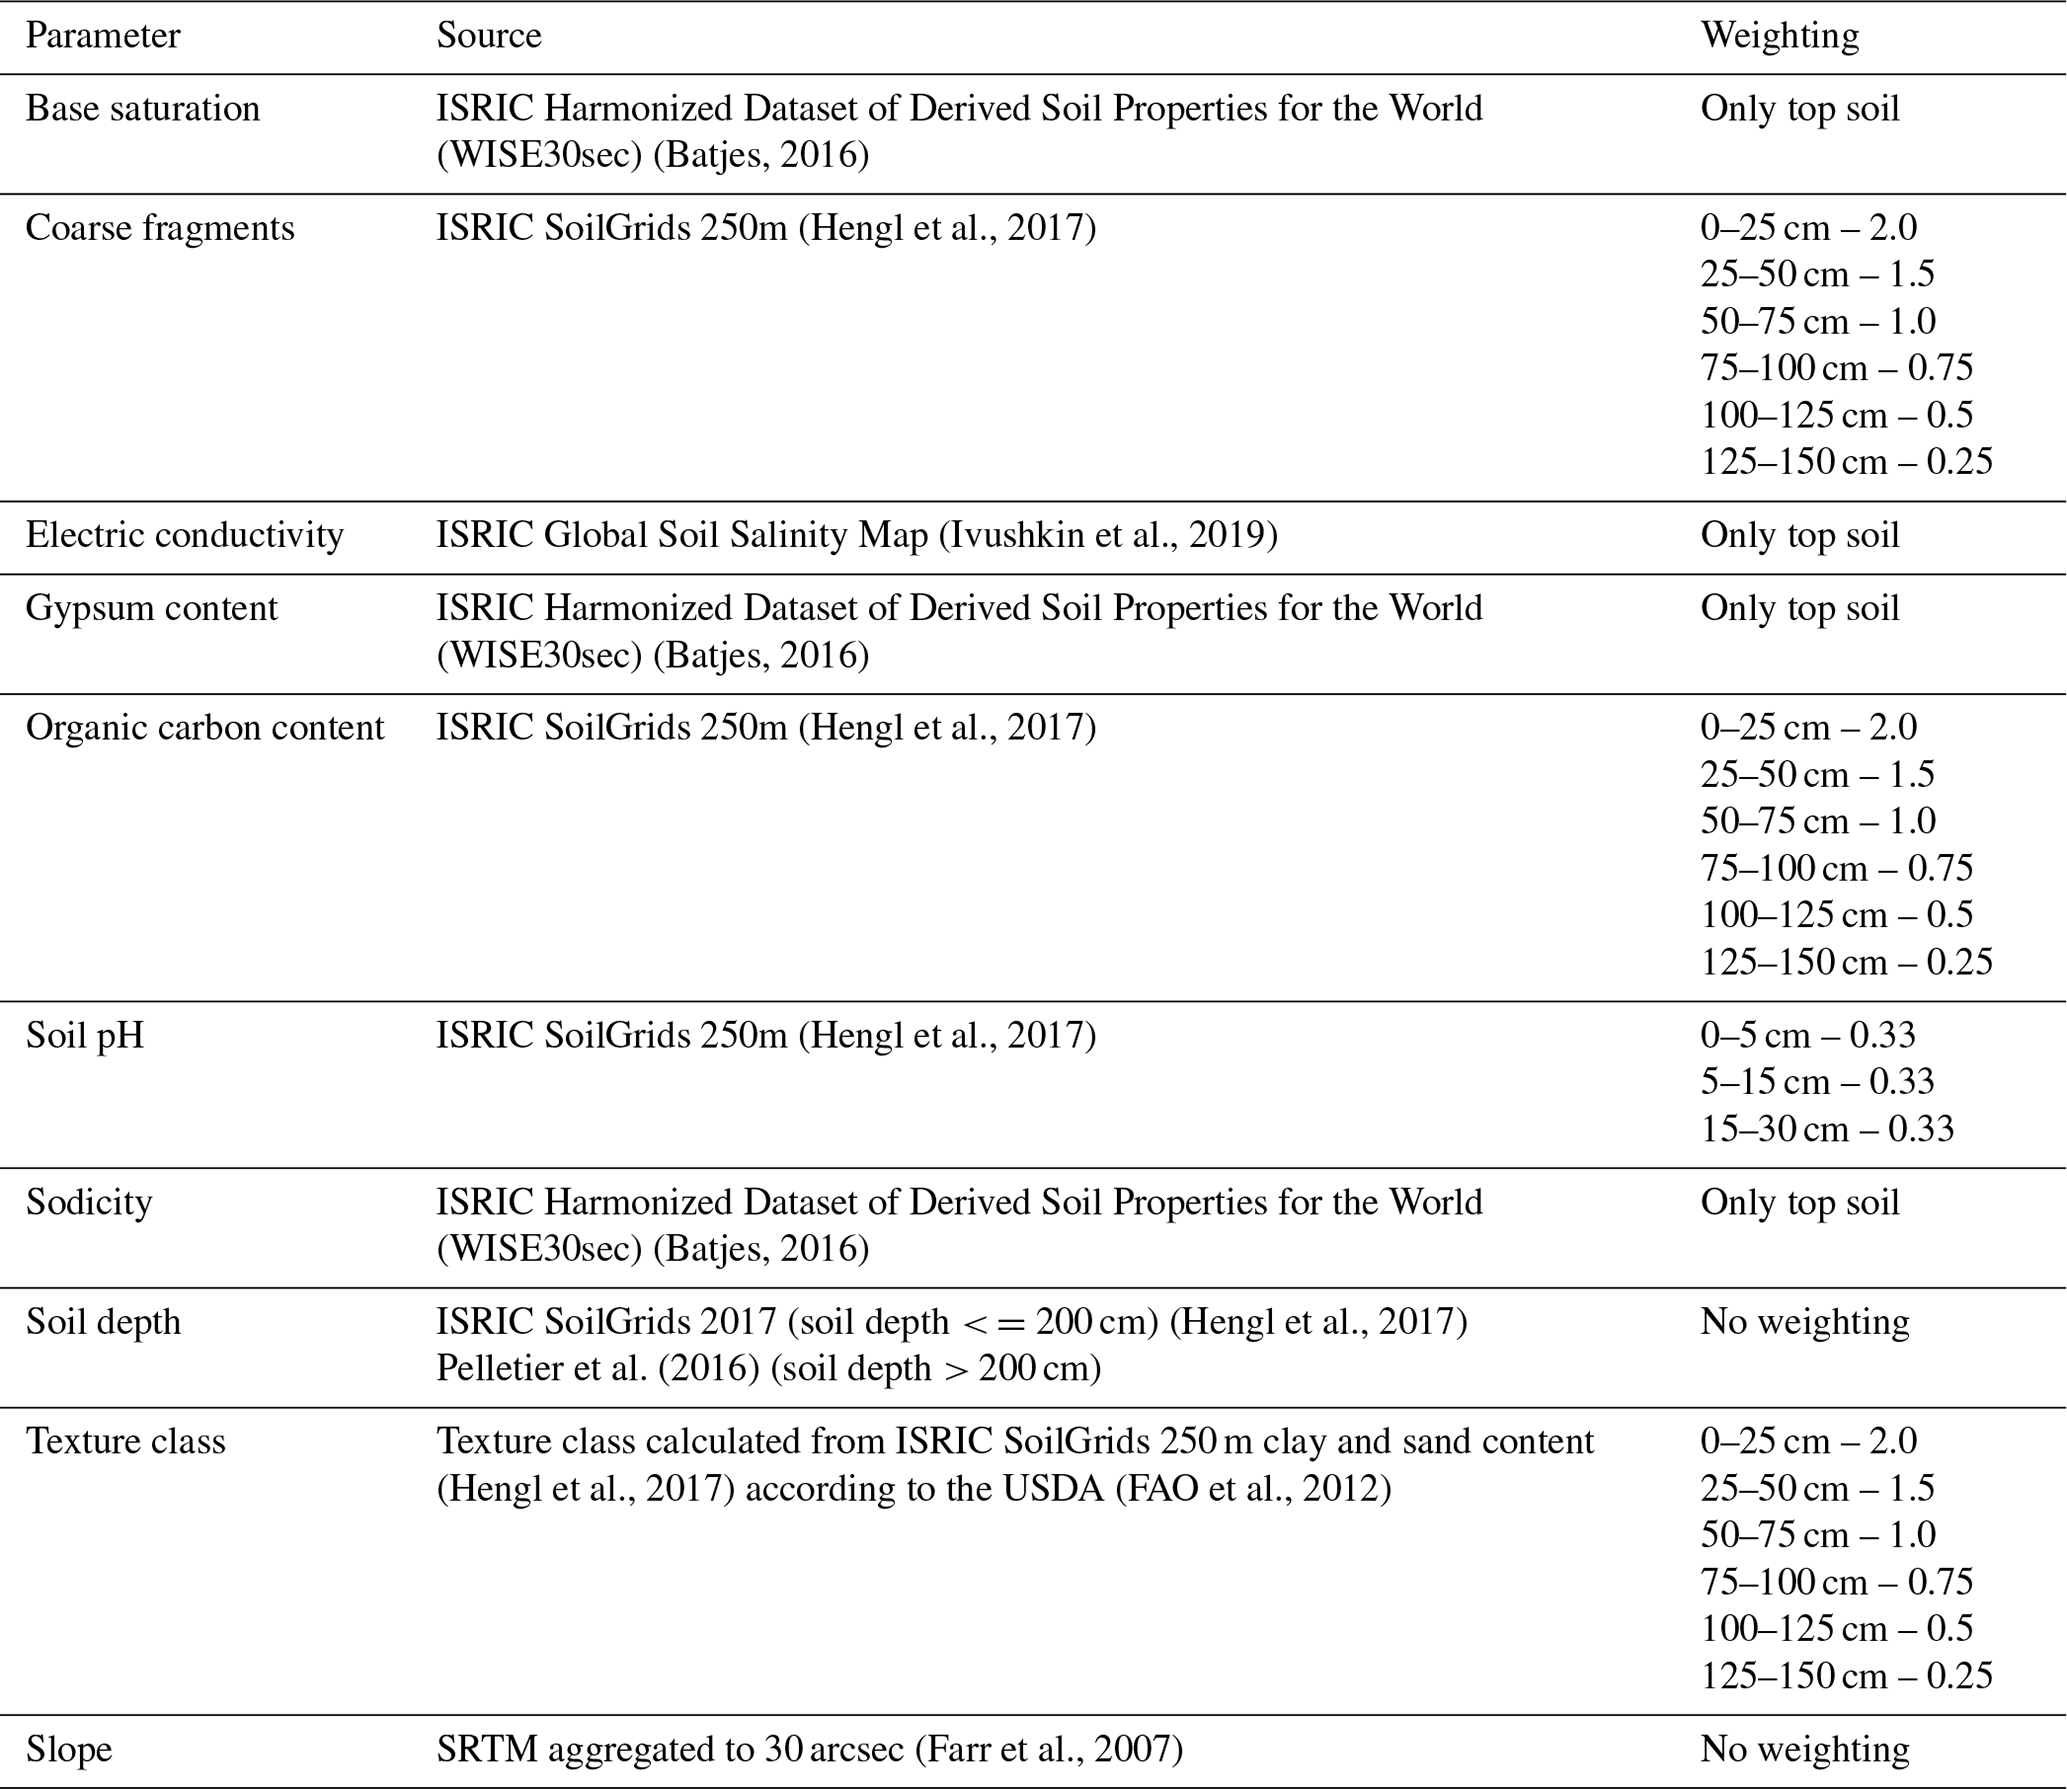
In addition, soil and terrain information is required. Table 2 gives an overview of the soil and terrain data used for this study. Soil data are mainly based on the International Soil Reference and Information Centre (ISRIC) SoilGrids (Hengl et al., 2017), which have a spatial resolution of 250 m but are also provided at a 1000 m spatial resolution. These data are reprojected to WGS84 and spatially interpolated to the spatial resolution of 30 arcsec applied in this study using a nearest-neighbor approach. Base saturation, gypsum, and exchangeable sodium content (ESP, sodicity) are taken from the World Inventory of Soil Emission Potentials (WISE) database at a spatial resolution of 30 arcsec (Batjes, 2016). For electric conductivity, the ISRIC Global Soil Salinity Map with a resolution of 250 m is used (Ivushkin et al., 2019). In contrast to the Harmonized World Soil Database (HWSD) (FAO et al., 2012), the ISRIC soil datasets do not contain a layer for texture class. For this reason, the texture class is determined using the sand and clay layer from SoilGrids according to the United States Department of Agriculture (USDA) triangular diagram of soil texture classes (FAO et al., 2012). For soil depths greater than 200 cm and up to 50 m, the ISRIC dataset on absolute depth to bedrock (Hengl et al., 2017) is complemented by the dataset from Pelletier et al. (2016), which covers soil depths up to 200 cm.
Available soil layers can be weighted in CropSuite as required. The SoilGrids datasets provide information for six depths: 0–5, 5–15, 15–30, 30–60, 60–100, and 100–200 cm (Hengl et al., 2017, 2014). According to Sys et al. (1991), soil properties have different effects on crop suitability depending on the soil layer. Accordingly, we use weighting factors as proposed by Sys et al. (1991) (see Table 2). The different distribution of the soil depths between the SoilGrids data and the weighting factors by Sys et al. (1991) is taken into account using a proportional weighting of the SoilGrids layers. Terrain data are taken from the Shuttle Radar Topography Mission (SRTM) dataset (Farr et al., 2007), which are used to calculate the slope at the spatial resolution applied. Please be aware that a coarser spatial resolution generally reduces the slope, which could result in an underestimation of possible slope limitations in mountainous regions. Possible terracing could remove the restriction due to the slope, but usually terraces are too small to be considered at the aggregated spatial resolution of 30 arcsec of the SRTM data used in this study.
Table 2Soil and terrain data used in this study and the applied weighting of the different soil layers.
Membership functions for temperature, precipitation, slope, soil depth, texture class, coarse fragments, gypsum, base saturation, pH, organic carbon, electric conductivity, and sodicity (Fig. 1) are defined for the 48 crops considered, relying on information from Sys et al. (1993), who provide membership functions for most of the crops considered. Additionally, data from the EcoCrop database, which provides crop ecological requirements for more than 2500 plant species (FAO, 2024), are used for cowpea, rye, and yam. CropSuite in principle allows the flexible addition of any further membership function and dataset that is relevant for the use case.
Nutrient deficits, such as nitrogen content, are not considered in our approach since according to our definition of crop suitability, they are not a decisive factor for the suitability of crops but rather depend on the crop management. Accordingly, we do not consider any soil tillage that can affect the soil properties, such as liming, which can influence the pH value.
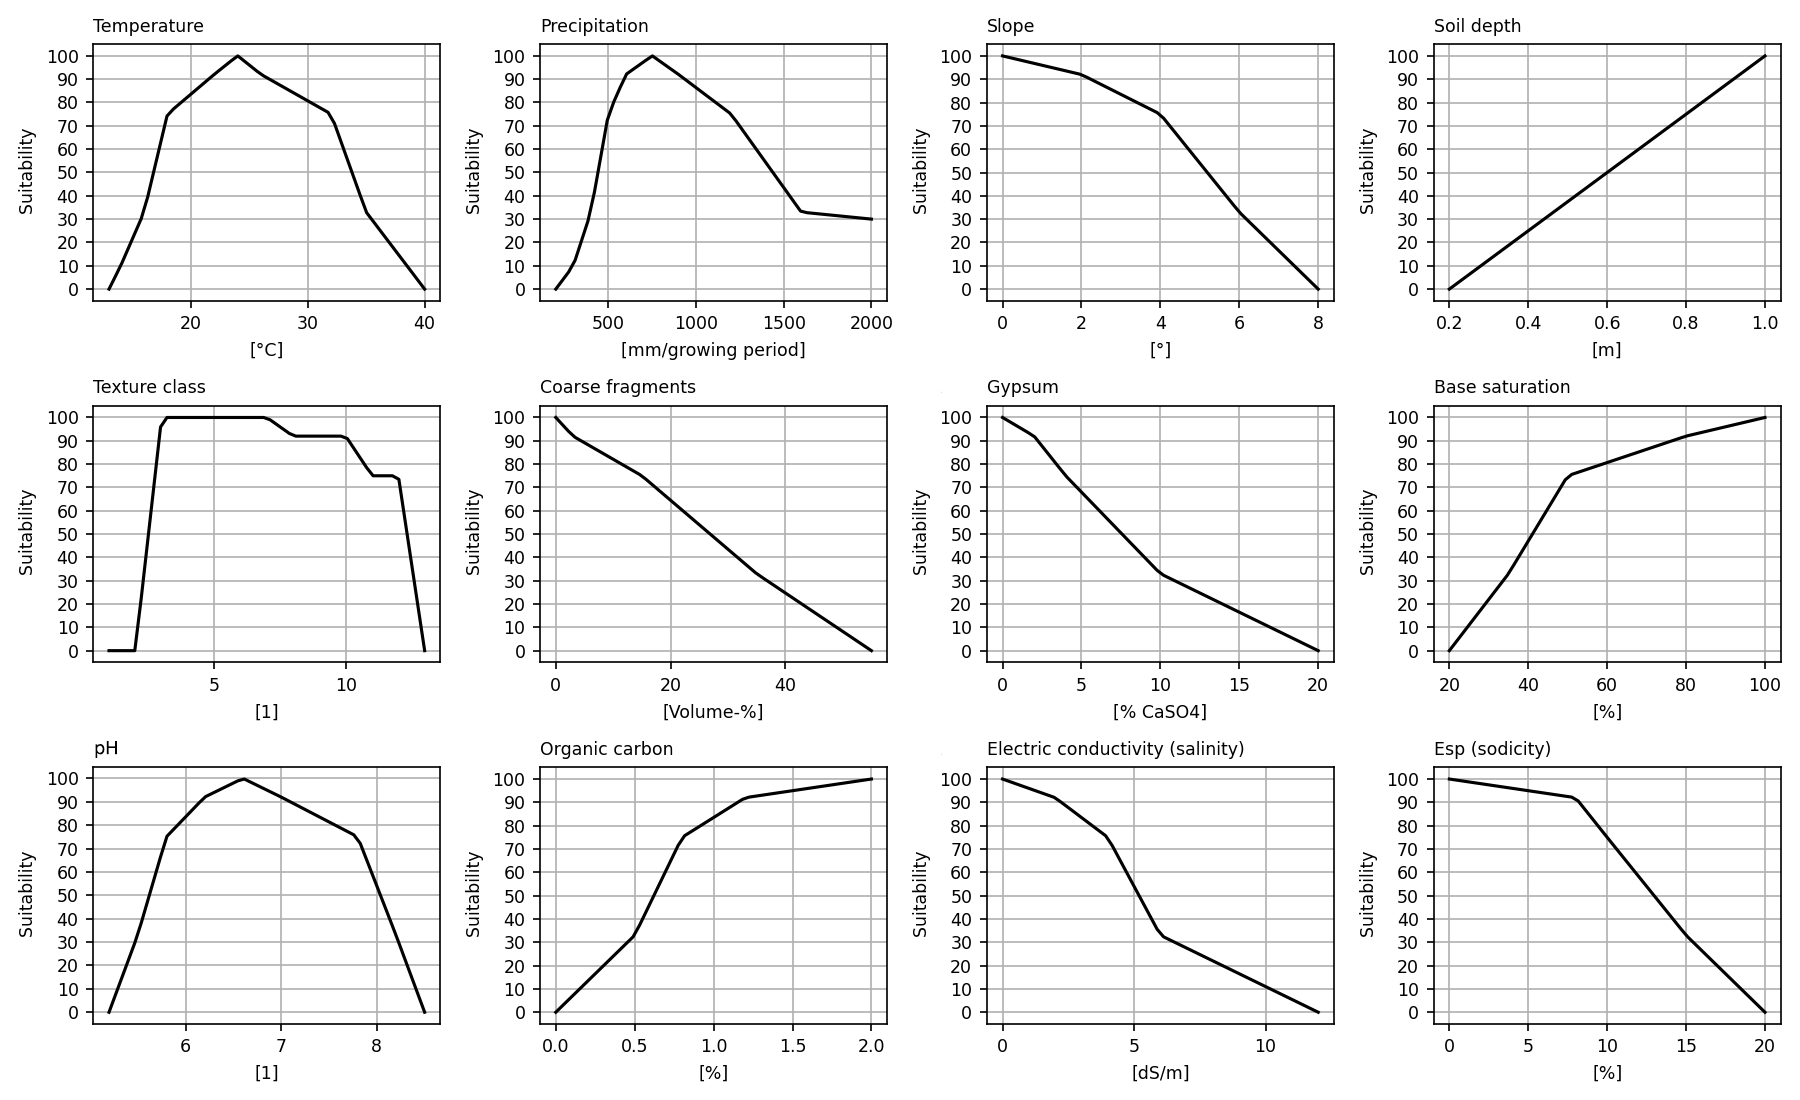
Figure 1Membership functions for maize as an example, with a growing cycle of 110 d for the climatic (mean temperature over the growing cycle, total precipitation over the growing cycle), topographic (slope), and soil constraints (soil depth, texture class, coarse fragments, gypsum, base saturation, pH, organic carbon, salinity, sodicity) considered.
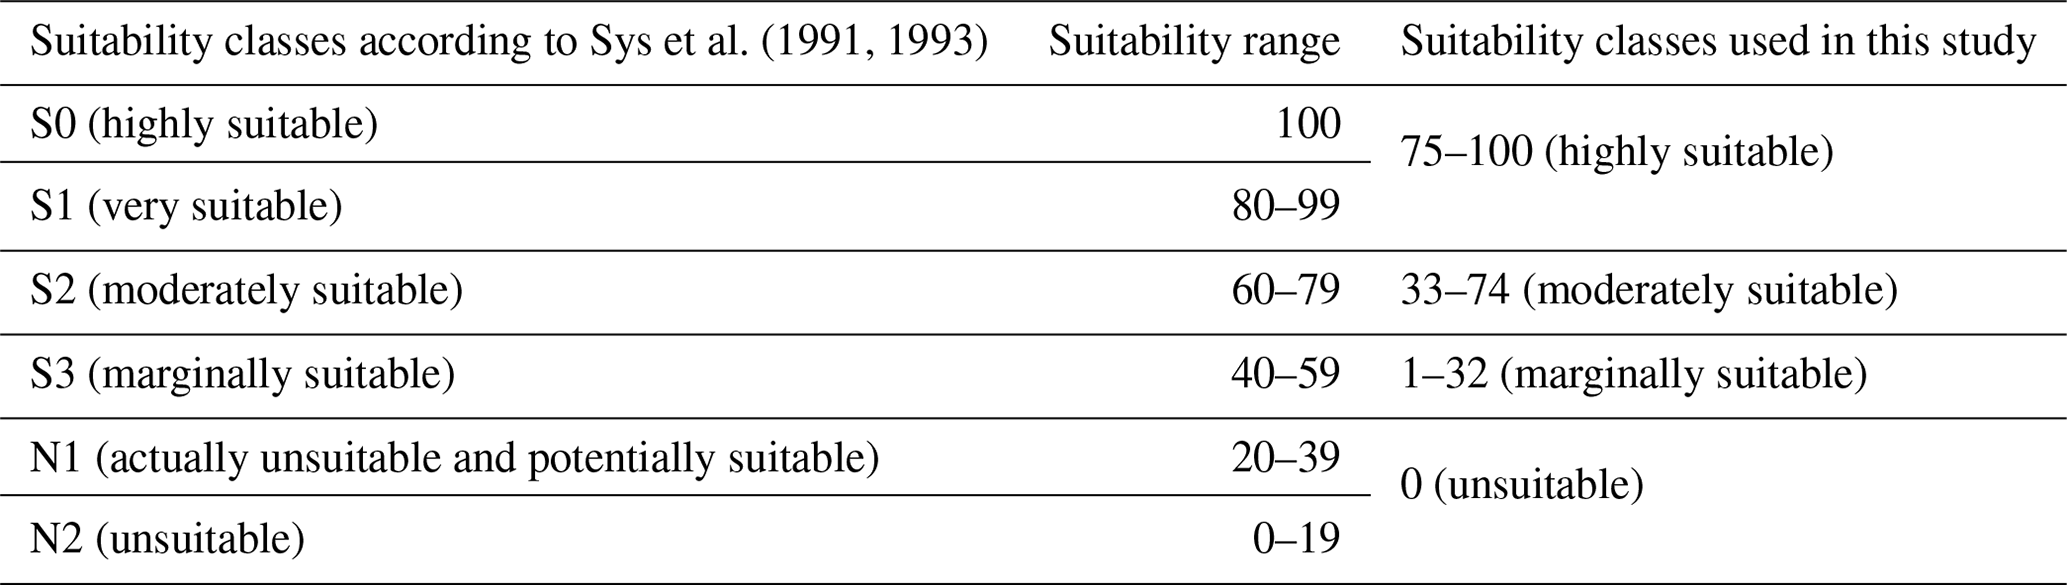
Sys et al. (1993) use a classification system with six classes, ranging from N2 (unsuitable) to S0 (highly suitable). In this study, we dismiss the N1 class due to a vague definition and differentiate three suitability classes: marginally, moderately, and highly suitable (Table 3).
Table 3The crop suitability classification system used in this study compared to that of Sys et al. (1991, 1993).
2.1 The CropSuite model
Figure 2 shows the workflow and outputs of CropSuite, which first calculates the climate suitability (considering all climate constraints) and then calculates the soil suitability (considering all soil and topography constraints). Both data records can be output separately. Thereby, CropSuite applies Liebig's law of the minimum for both the climate and the soil suitability by choosing the lowest suitability value between the different soil parameters and climate variables. Finally, the crop suitability is calculated from the combination of climate and soil suitability by again following Liebig's law of the minimum, which means that the lowest suitability value between climate and soil suitability is chosen since it restricts overall crop suitability. The most-limiting factor is identified as the parameter that imposes the greatest growth constraint on a specific crop. In addition, the magnitude of the constraint is output for each input factor. Overall, CropSuite allows for a variety of outputs for optimal sowing and harvest dates, suitable sowing days, multiple cropping potential, the limiting factor, and the recurrence rate of potential crop failure. The output data format can be set to GeoTIFF or NetCDF.
CropSuite includes a preprocessing procedure that creates intermediate results for climate variability. Since climate model data are usually available at a relatively coarse spatial resolution, CropSuite has implemented a spatial downscaling module for the climate data, which allows the model to be applied at a very high spatial resolution from the global to the regional to the local scale. In this study, we apply a statistical downscaling to the climate data, refining the spatial resolution from 2.5 arcmin to 30 arcsec. In principle, the targeted spatial resolution can be set in CropSuite but is limited to the available resolution of the additional input data, such as the soil data, whereas for the climate data, two different statistical spatial downscaling methods are implemented, requiring little computational effort. The first methodology is based on an altitude regression for temperature (Marke et al., 2014), where the temperature gradients are extracted from the climate model data via a moving window that can be set in size. Thereby, the extracted gradients must remain within the natural boundaries for wet and dry adiabatic temperature gradients. The second downscaling methodology uses the historical high-resolution spatial patterns for monthly temperature and precipitation taken from WorldClim at a 30 arcsec spatial resolution (Fick and Hijmans, 2017). To downscale a coarse-resolution grid cell, all fine-resolution WorldClim grid cells within the coarse-resolution cell are selected and aggregated per month. On this basis, additive factors are calculated for temperature, and multiplicative factors are calculated for precipitation separately for each month. Thereby the sum (mean) of these additive (multiplicative) factors within the coarse-resolution cell amounts to 0 (1). Considering the monthly seasonality, these factors are applied to the coarse-resolution climate data, imprinting the spatial pattern of the high-resolution reference data onto the coarse climate data at a daily time step. Both downscaling methods conserve mass and energy from the climate input data by iteratively minimizing residuals over the simulation domain. For a more advanced statistical downscaling to the kilometer scale, the expert user may apply more complex topographical downscaling methods (Daly et al., 1994; Fiddes et al., 2022; Karger et al., 2023) or downscaling based on machine learning (Damiani et al., 2024; Wang et al., 2021) outside of CropSuite. Furthermore, we do not recommend applying downscaling methods implemented with high scaling factors from very coarse (hundreds of kilometers) to very high (single-kilometer) resolutions.
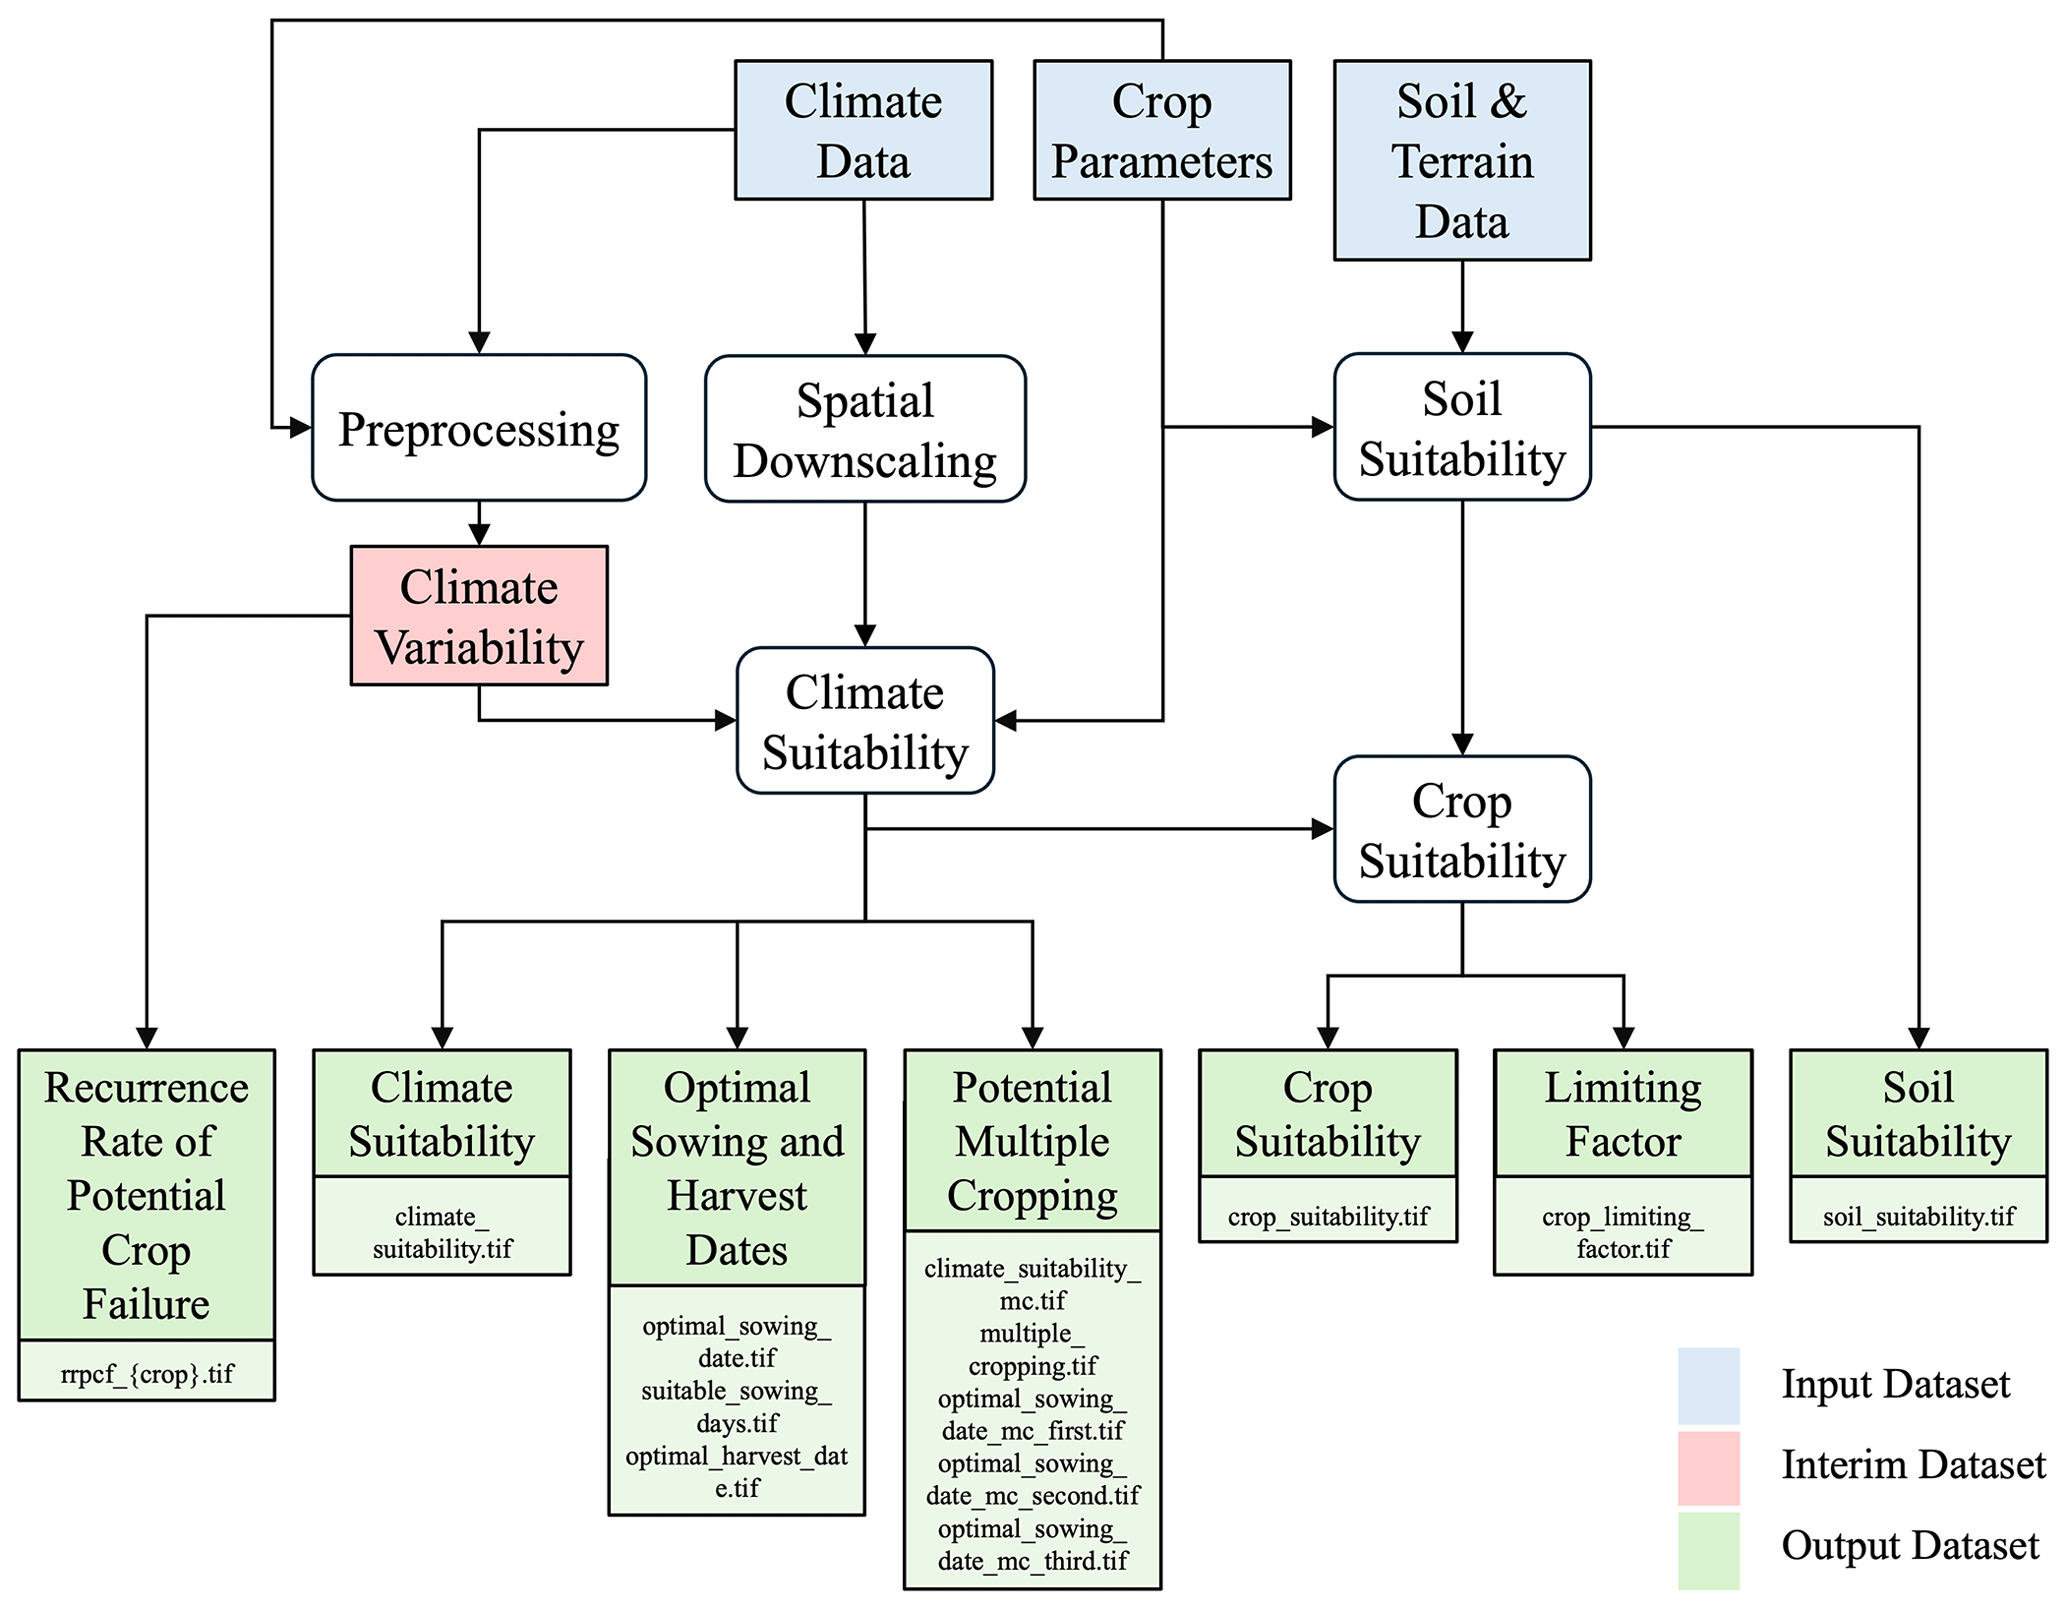
Figure 2The CropSuite workflow. Input data in blue, intermediate results in red, and output data in green. The processing steps are shown in white.
CropSuite requires daily climate data as an input for temperature and precipitation. As climate models tend to produce too many days with low-intensity precipitation, called “drizzle bias” (Chen et al., 2021), days with aggregated daily precipitation values below 1 mm d−1 are considered dry days (Sun et al., 2006). This threshold can be set in the model. Both downscaled temperature and precipitation data and the datasets calculated for climate variability are used to calculate the climate suitability. Therefore, the crop-specific membership functions determine the suitability according to the average temperature, total precipitation, and the recurrence rate of potential crop failure over the length of the growing cycle (time from sowing till maturity) for each day of the year (DOY). Thereby, the suitability value for each DOY refers to the average conditions during the growing cycle from that DOY, which corresponds to the sowing date, until maturity, determined by the length of the growing cycle, which is set in the crop parameterization for each crop. For perennial crops, the length of the growing cycle is set to 365 d. Climate suitability throughout the year is then identified by selecting the minimum (most-limiting) value of the three individual suitability values for temperature, precipitation, and climate variability. As shown in Fig. 3, the DOY with the highest climate suitability value over the year finally determines the optimal sowing date for annual crops (optimal planting date for rice, which is not sown but is planted as a seedling in wet rice cultivation). For perennial crops this is set to 1.
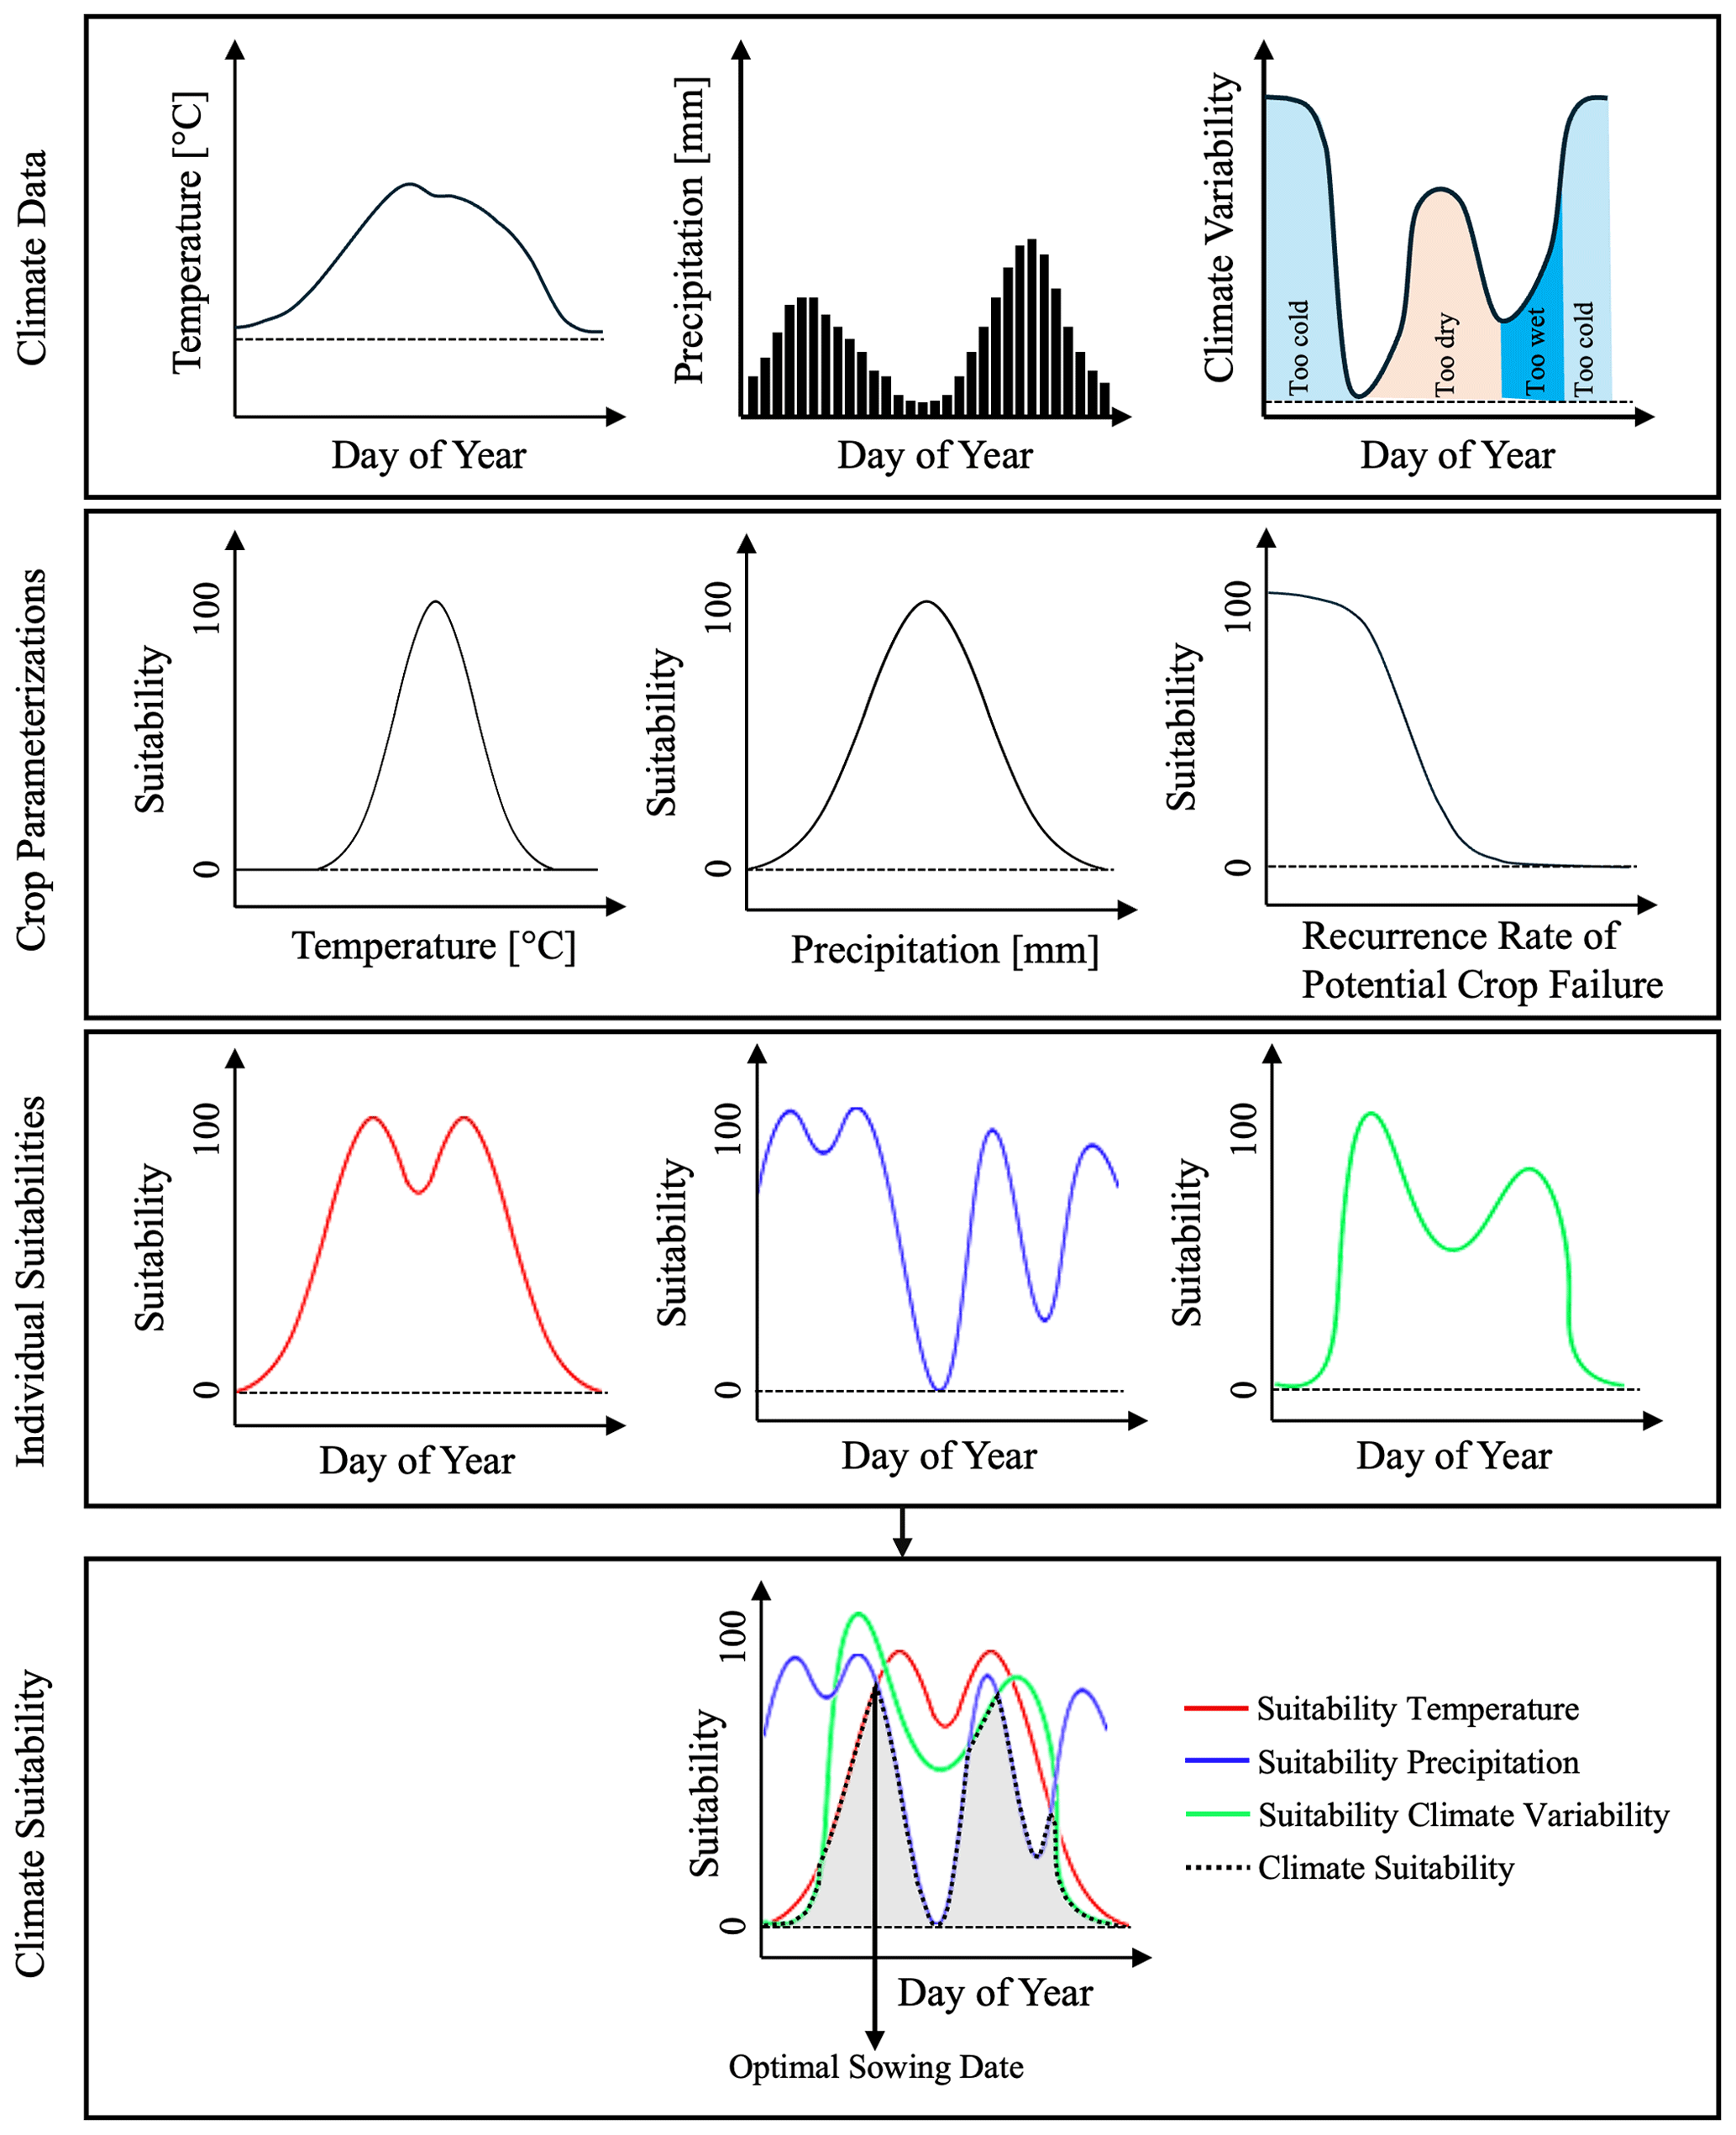
Figure 3Schematic illustration of the determination of climate suitability, the optimal sowing date, and the limiting factor. The input data show the annual course of temperature and precipitation and the recurrence rate of potential crop failure, indicating whether it is too cold, too dry, or too wet. The crop parameterizations show the membership functions resulting in the individual suitability values for each DOY for temperature (red line), precipitation (blue line), and climate variability (green line). Climate suitability throughout the year (dashed black line) results from the lowest of the three curves (most limiting) on any day. The highest value of climate suitability over the year finally determines the optimal sowing date. The limiting factor is the most constraining factor at this point.
For annual crops, CropSuite also calculates the potential for multiple harvests without considering crop rotation. Between harvest and reseeding, we assume a certain time period (21 d in this study) for fieldwork and processing, which can be set flexibly in the model. Accordingly, all possible combinations of sowing dates are tested with the aim of maximizing climatic suitability to achieve the highest sum of climatic suitability within a year. The optimal sowing dates are selected from the best sowing date combinations, resulting in one, two, or three sowing dates per year. A multiple cropping layer that shows how often a crop can be harvested within 1 year is output.
CropSuite distinguishes between rainfed and irrigated agricultural systems, which can be selected before starting the simulation. For the irrigated case, precipitation is not considered a constraining factor, with consequences for all further calculations, affecting, e.g., the climate variability, the optimal sowing date, and the multiple cropping. For this study, we simulated both rainfed and irrigated options separately for all crops. In the postprocessing, we combined both datasets according to the irrigated areas dataset by Meier et al. (2018) (Fig. S1 in the Supplement), which is available at a 30 arcsec spatial resolution.
For germination, crop-specific temperature and soil water requirements can be set in the model. The latter can be considered for rainfed conditions by defining a certain amount of precipitation within a certain period of time after sowing.
Some crops, such as soybeans, have a high photoperiodic sensitivity that can limit their suitability (Cober and Morrison, 2010; Abdulai et al., 2012). Therefore, crop-specific photoperiodic sensitivity can be considered in CropSuite by defining a maximum and minimum day length on average over the growing cycle. Additional lethal climatic limitations can be taken into account in CropSuite. We assume permafrost in areas with an average annual temperature below 0 °C, which is computed from the downscaled climate input data. A maximum lethal temperature threshold of > 40 °C on average over the growing cycle is set for all crops (Asseng et al., 2021). In addition, a minimum and maximum threshold for the lethal temperature over a certain consecutive number of days can be set in the model per crop. Further, the maximum number of consecutive dry days can be set dependent on the crop. CropSuite allows for the consideration of vernalization requirements for winter crops. Therefore, crop-specific temperature requirements with minimum and maximum temperature thresholds for a certain number of effective vernalization days can be configured in the model. Accordingly, CropSuite simulates, for each location, if and when these vernalization requirements are fulfilled, which impacts the length of the vernalization period and the optimal sowing date. An offset of days from sowing to the start of the vernalization period can optionally be added.
A GUI is available for CropSuite that allows users to easily set the model up, parameterize the crop requirements and the membership functions (Fig. 4a–e), and start the simulations. Further, new membership functions can be created, an unlimited number of crop-specific requirements can be defined, and any additional data can be added, which can be flexibly assigned to the predefined membership functions (Fig. 4e). Moreover, new crops or crop varieties can be added. The GUI also allows for the visualization, analysis, and comparison of the results (Fig. 4f).
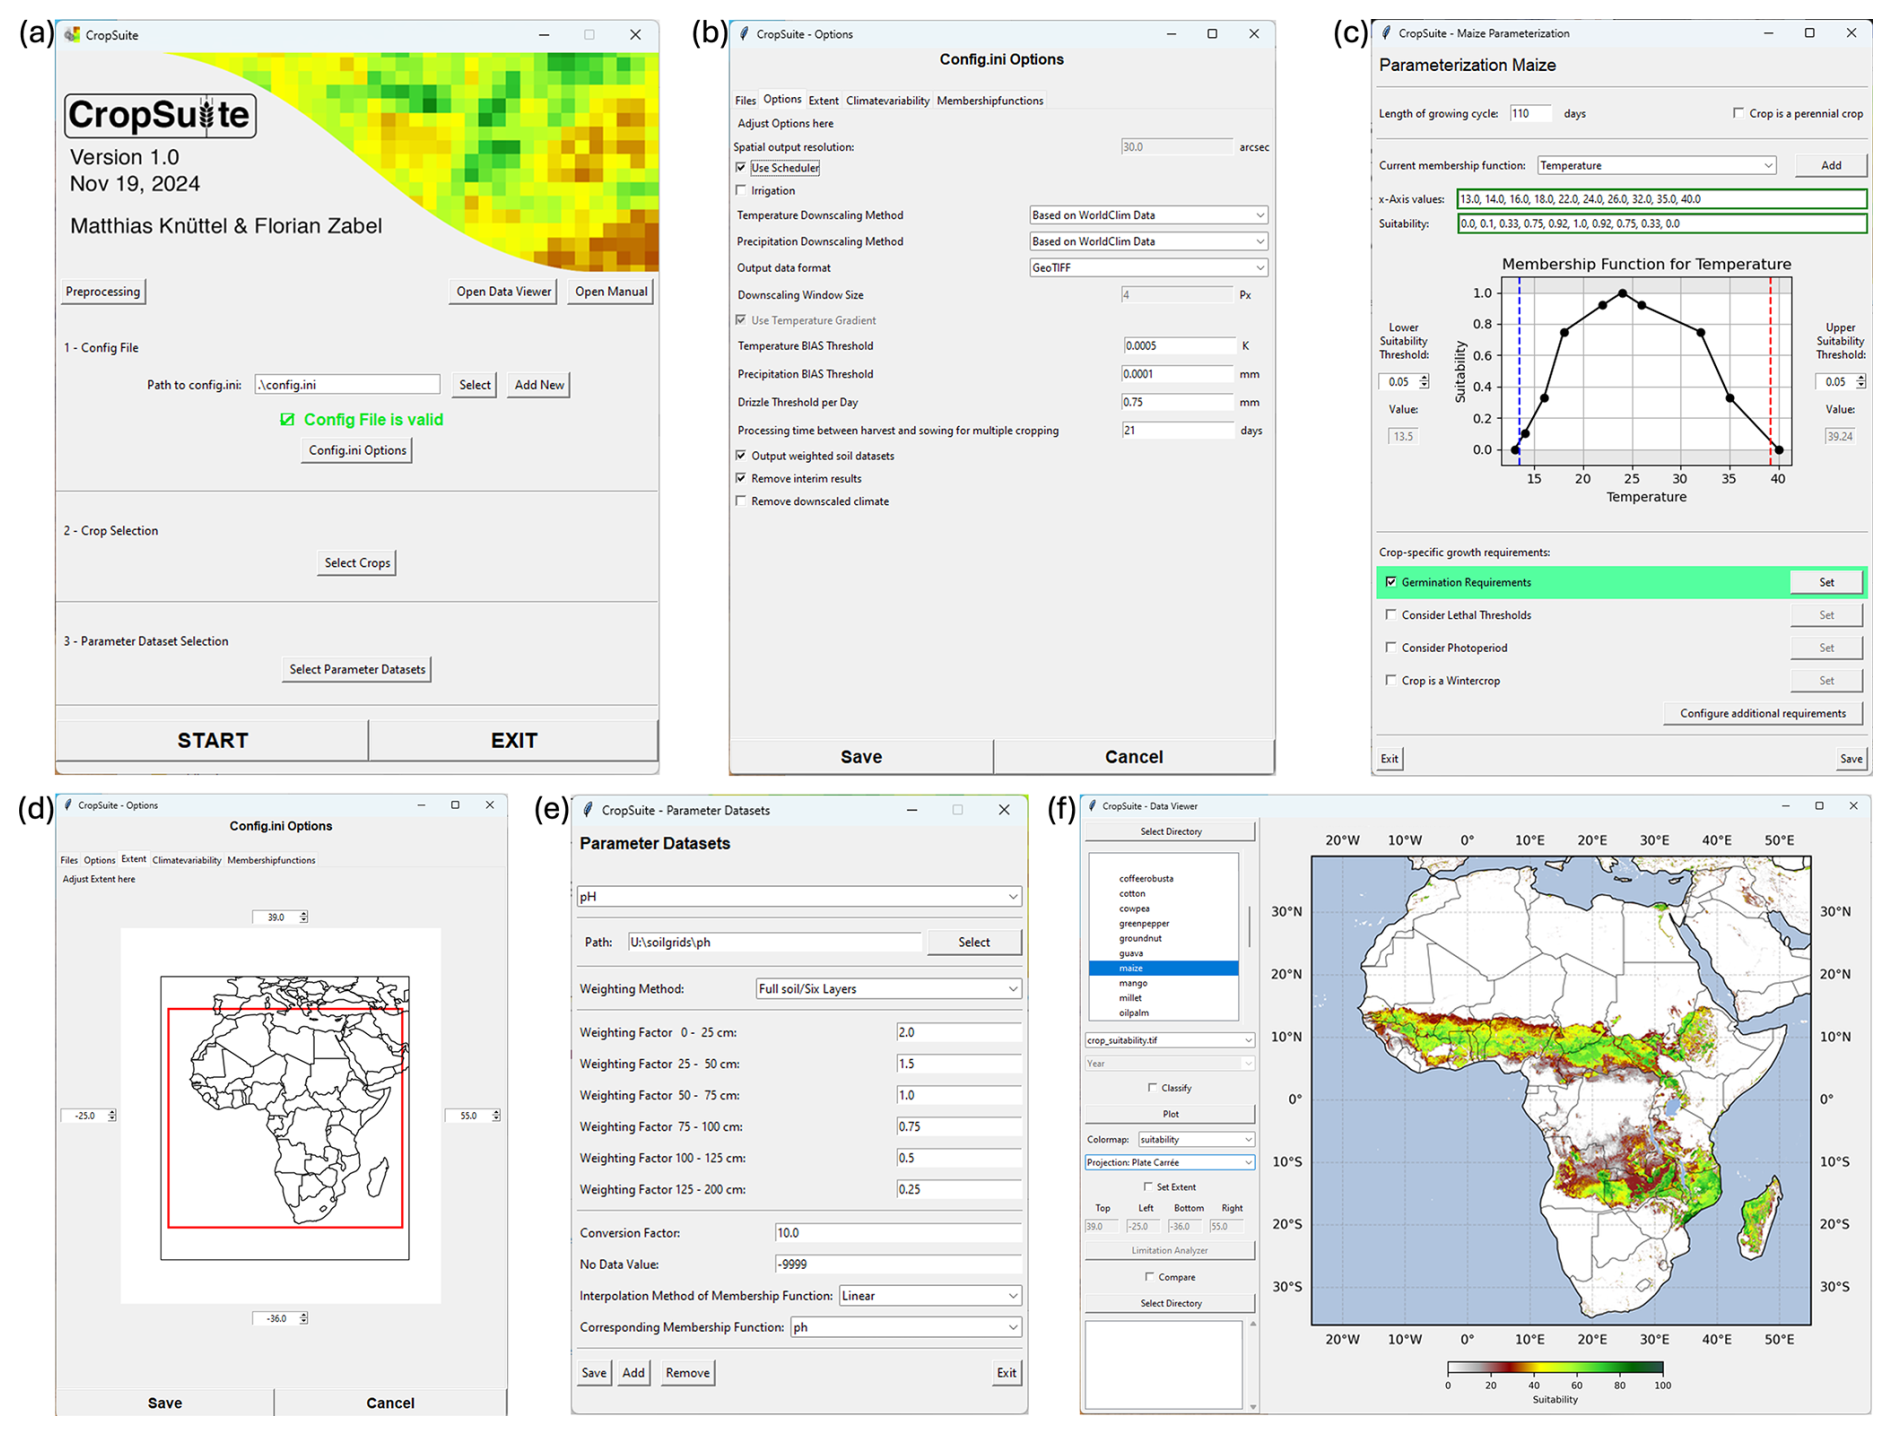
Figure 4The graphical user interface of CropSuite. Panel (a) shows the main screen, panel (b) shows an example of available model settings, panel (c) shows the available options for crop parameterizations for the example of maize, panel (d) shows the window to set up the simulation domain, panel (e) shows the setup of a parameter dataset for soil pH as an example, and panel (f) shows the integrated data viewer in CropSuite.
2.2 Climate variability
In addition to several improvements and redesigns, one of the most important advancements in CropSuite is the consideration of climate variability in the assessment of crop suitability. Usually, crop suitability models consider long-term climate averages, e.g., 10-, 20-, or 30-year periods and climatic trends that affect crop suitability (Ramirez-Villegas et al., 2013; Schneider et al., 2022b). They are not designed to simulate seasonal yields, as, for instance, mechanistic crop models do (Jägermeyr et al., 2021). However, existing crop suitability approaches may overestimate crop suitability when only long-term averages are considered because high climatic variability may result in a high frequency of unsuitable years, which would result in crop failure. This would, however, significantly increase the risk for farmers, who require stable conditions that can be planned around. As a result, a farmer may conclude that the risk of crop failure due to unstable climate conditions in a certain region is too high for crop cultivation. As such, climate variability is not a purely ecological limitation but depends on the socioeconomic circumstances of how farmers deal with the risk of crop failure. We developed an approach that allows for the consideration of climate variability and thus the implicit integration of socioeconomic limitations into the suitability assessment for crops.
Therefore, we specify a crop-specific lower and upper threshold for temperature and precipitation. We recommend using these thresholds between the higher and lower 5 % and 10 % of the suitability values of the crop-specific membership function (Figs. 1, 4c). If the suitability of the membership function does not approach 0 at its higher (lower) limit, we recommend setting the threshold to the highest (lowest) value of the membership function. This is the case for the wet limit of the precipitation membership function for maize (see Fig. 1c). For each year within a given period of time (here we use 20-year time periods), how often these thresholds are surpassed during the growing cycle for all possible sowing dates (1 January until 31 December) is tested and totaled. As a result, a variability dataset is generated for each DOY, indicating the number of years in which at minimum either the temperature or the precipitation surpasses the threshold values. The number of years is divided by the length of the time period (here 20 years) to obtain the recurrence rate of potential crop failure. This data can be stored as a two-dimensional raster file for perennial crops or as a three-dimensional raster file for non-perennial crops, with each of the 365 DOYs representing the conditions for the respective sowing day.
For rainfed agricultural systems, the cases that are considered for climate variability include excessively high or low temperatures and precipitation, while for irrigated agricultural systems, only excessively high or low temperatures and excessively high precipitation are considered, to address potential water logging, plant diseases, or root rotting. Due to computational limitations, the preprocessing of the climate variability is carried out at the resolution of the input climate data (2.5 arcmin) and is further interpolated bilinearly to the output resolution of 30 arcsec.
Finally, we introduce a membership function defining the impact of climate variability on crop suitability. As shown in Fig. 5, a sigmoid is adopted for the course of the function. According to expert knowledge, we set this sigmoid function in a way that reduces the suitability to 0 when the recurrence rate of potential crop failure is greater than once every 4 years (25 %). However, this function may be different in different parts of the world and different between crops (see Discussion section).
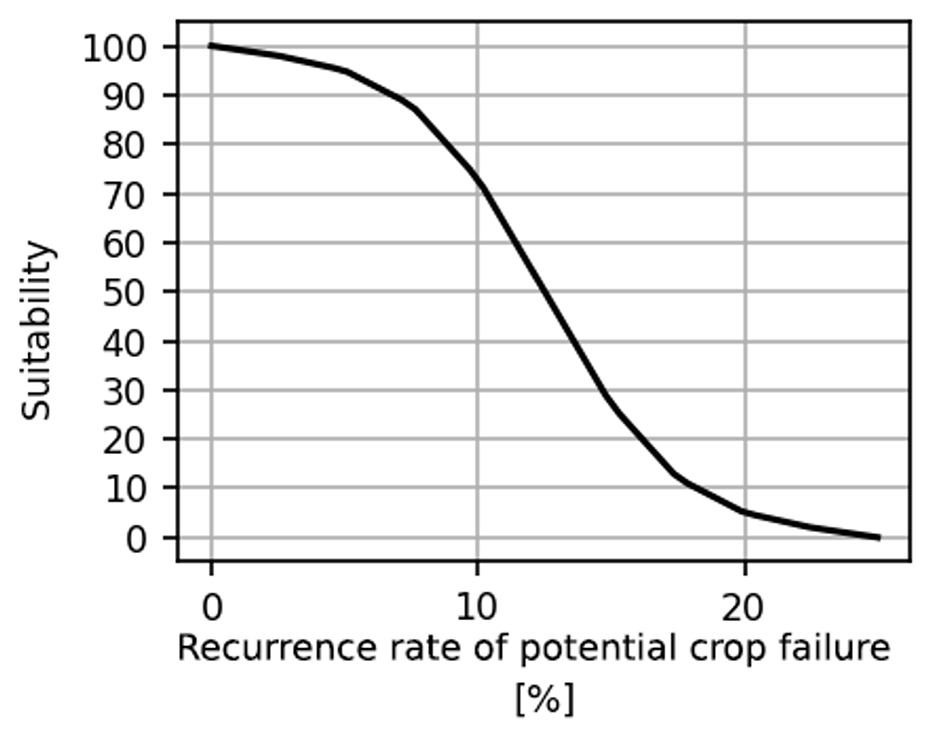
Figure 5The membership function for climate variability, showing the impact of the recurrence rate of potential crop failure on crop suitability. The seasonal recurrence rate is shown in percent.
Crop suitability is difficult to validate or measure, and it is not equivalent to agricultural yields or production values. However, a comparison with other studies and data can provide valuable information and build confidence in the approach.
3.1 Comparison with harvested area
In principle, a crop should be suitable where it is already cultivated. According to this premise, we compare the suitable area simulated with CropSuite to the harvested areas from the global spatially disaggregated crop production statistics data for 2020 (MapSPAM 2020 v1.0) produced by the International Food Policy Research Institute (IFPRI) using the Spatial Production Allocation Model (SPAM) (IFPRI, 2024). The CropSuite results for Africa consider climate variability and are combined for irrigated and rainfed areas according to Meier et al. (2018). While MapSPAM is related to the year 2020, our simulations refer to the 1991–2010 time period, which could be a source of uncertainty. Nevertheless, we used MapSPAM 2020 instead of other available versions of MapSPAM since it includes 32 crops from our investigation and is the latest version of MapSPAM released. A comparison between CropSuite and different MapSPAM versions is shown for maize as an example in Fig. S2, revealing a considerably better fit with CropSuite in the MapSPAM 2020 version. For comparison, harvested areas below 10 ha per pixel are excluded from the calculation, and the high spatial resolution of the CropSuite model output is resampled to the same spatial resolution (5 arcmin) as the MapSPAM 2020 data. Figure 6 depicts the results of this analysis for all crops, where green and purple bars represent areas that are suitable, and orange and green areas represent harvested areas in MapSPAM. Purple bars indicate suitable areas that are currently not used by the respective crop. While green areas are also identified as being suitable in our approach, orange areas are not suitable in CropSuite despite the respective crop being harvested according to MapSPAM. The crops with the largest mismatching areas are rice, maize, and onion (Fig. 6). Most crops show a small proportion of orange to green areas, except for onions, rapeseed, cocoa, pea, rubber, tea, coffee, and rice (Fig. S3). This can have various causes, such as uncertainty in climate, soil, and irrigation data (Avellan et al., 2012); incorrect membership functions; the use of different crop varieties; or an incorrect localization of the cultivation areas in MapSPAM due to high uncertainties in the underlying national statistical data, especially in African countries (Yu et al., 2020), or due to crop management practices that could level out ecological limitations.
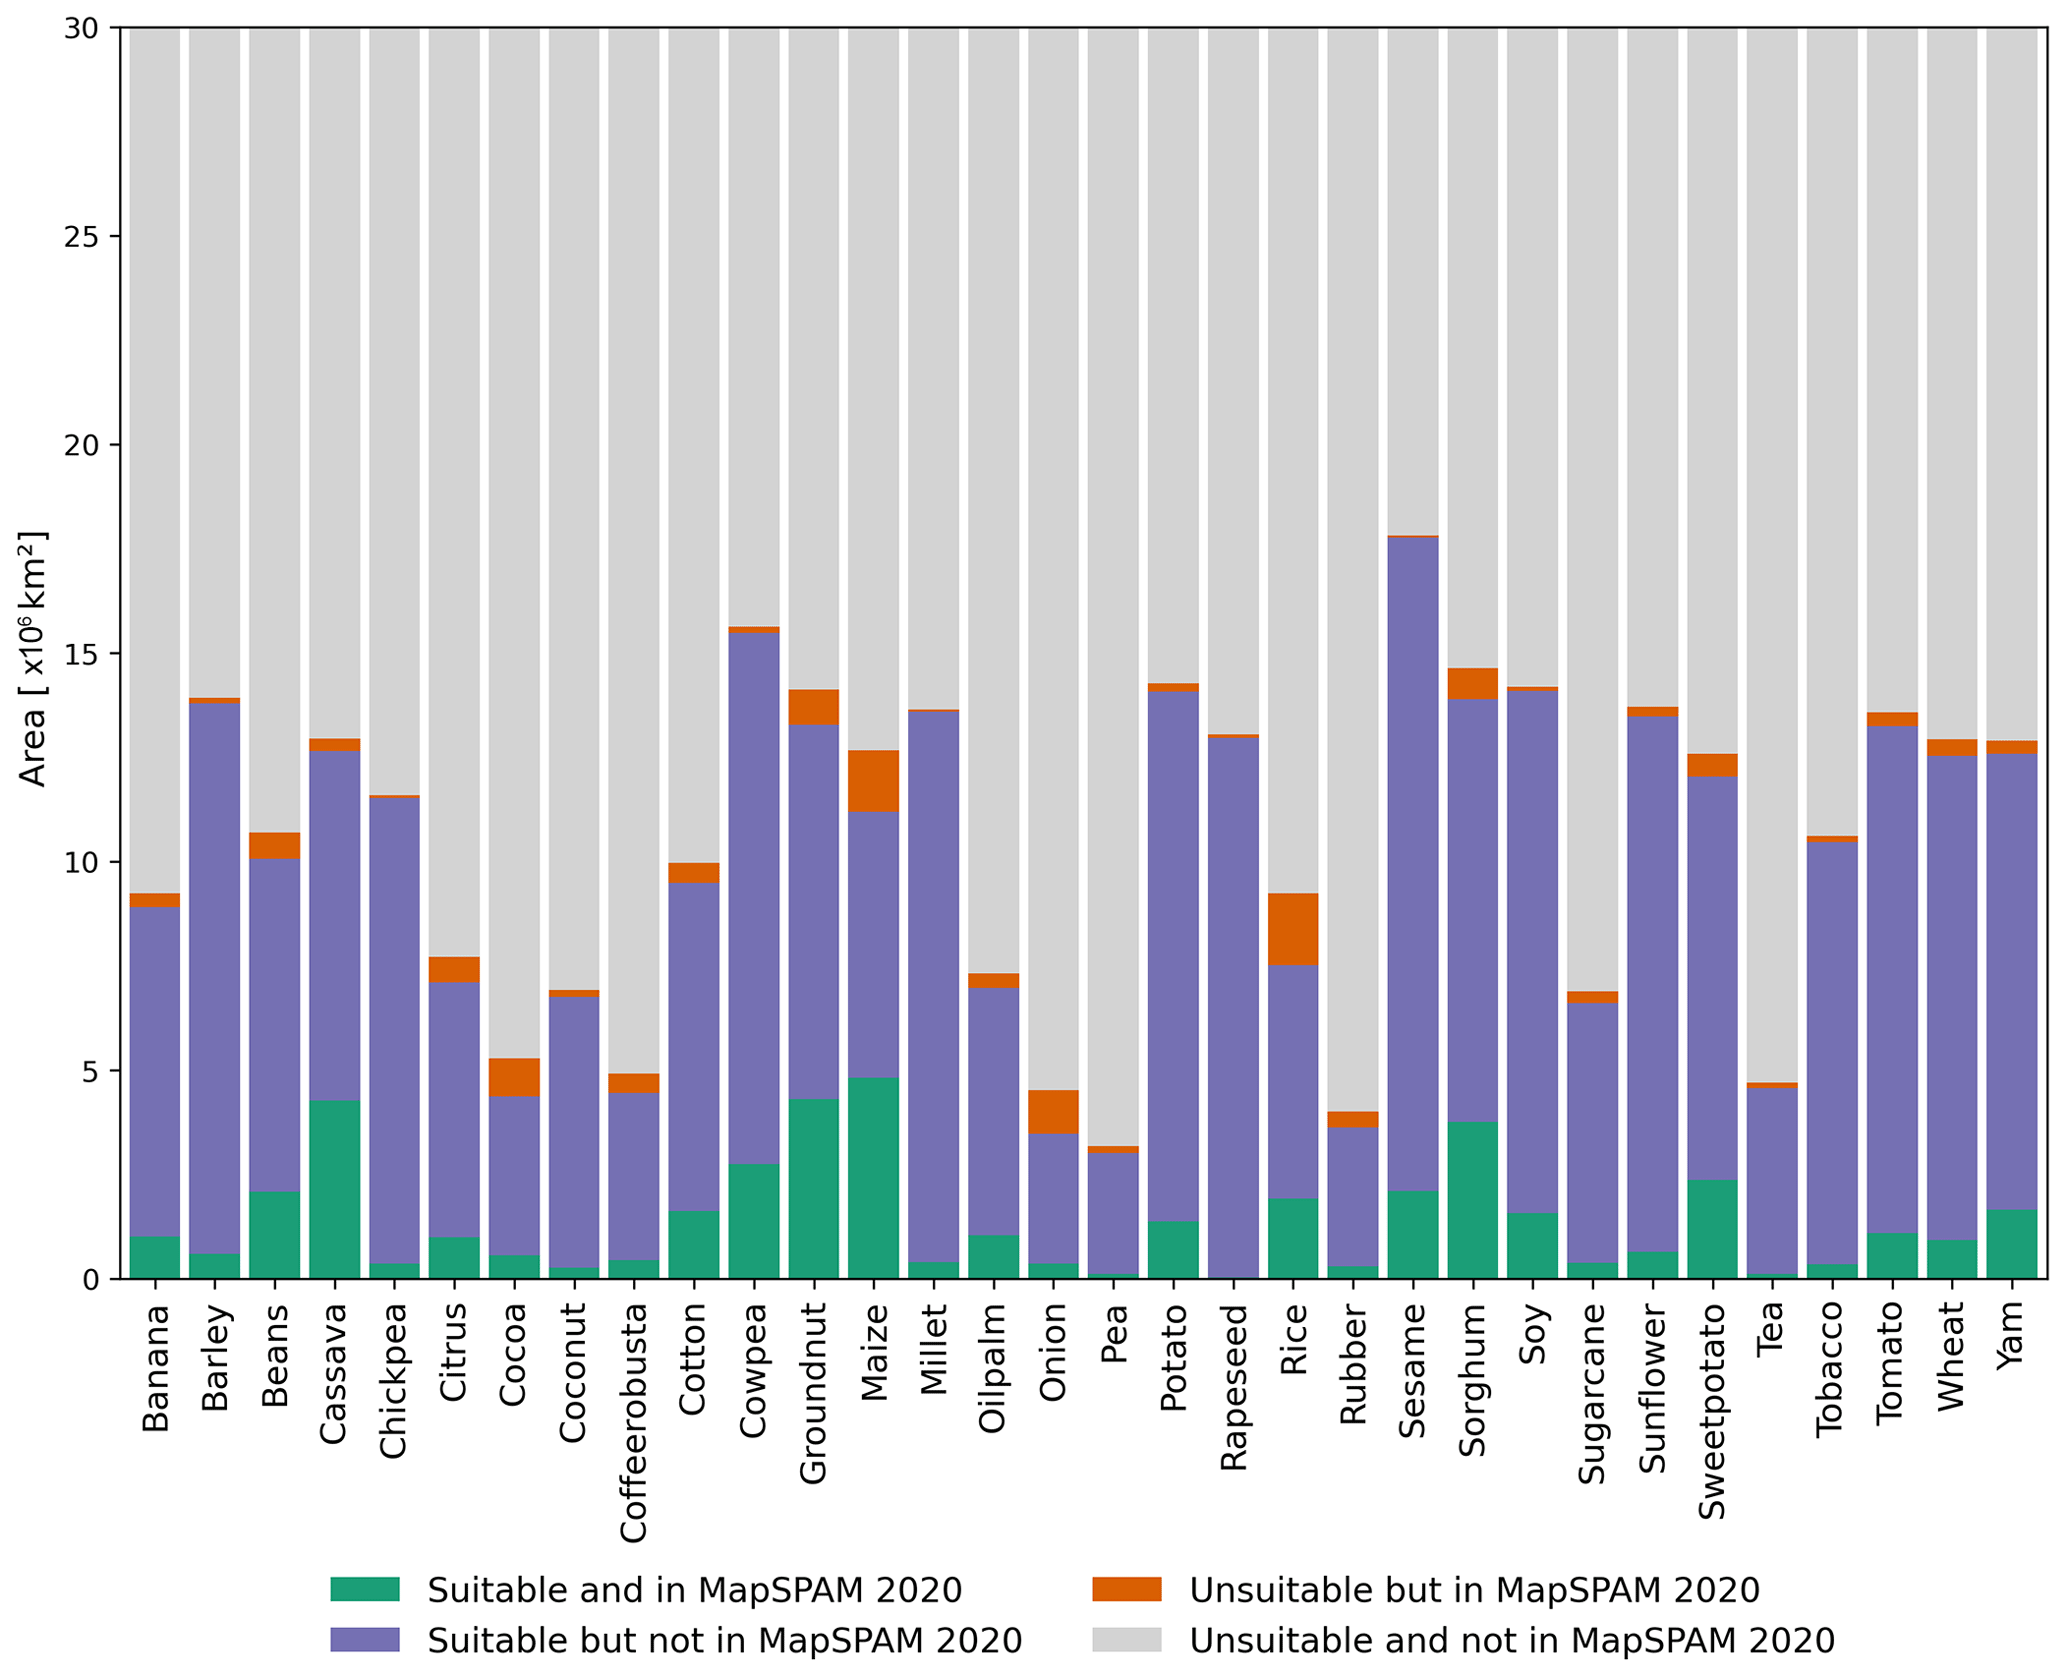
Figure 6Comparison of CropSuite and MapSPAM 2020 for all matching crops. CropSuite results combine irrigated and rainfed areas according to Meier et al. (2018) and consider climate variability. Areas in which the respective crop is harvested according to MapSPAM and which are suitable according to CropSuite are shown in green; areas that are suitable but in which the crop is not harvested are shown in purple. Areas that are unsuitable but are harvested according to MapSPAM are shown in orange, while unsuitable areas that are not harvested according to MapSPAM are shown in gray.
Figure 7a shows the spatial comparison between crop suitability and harvested areas for maize. Areas where maize is harvested according to MapSPAM, even though CropSuite has identified these areas as unsuitable, are found mainly in Egypt, the northern Sahel, and the Congo Basin, as well as parts of Cameroon, Gabon, Kenya, Tanzania, Zimbabwe, and South Africa. Figure 7b shows the comparison when ignoring the impact of climate variability on crop suitability. Disregarding climate variability results in large (blue) areas that are considered suitable but are no-harvest areas according to MapSPAM, especially along the dry belts (15° N and 20° S). Our approach considering climate variability (Fig. 7a) reduces these blue areas but induces some mismatches where MapSPAM indicates harvested areas and CropSuite shows no suitability (red areas). We find that the mismatching areas along the dry belts (including the Sahel) and in eastern Africa (Tanzania, Kenya) are often associated with limits due to climate variability. This indicates that the thresholds for climate variability (Sect. 2.2) and the membership function (Fig. 5) might be parameterized slightly too exclusively. However, some of these regions might be used as cropland by smallholders or subsistence farmers despite the high risk of crop failure.
In the inner tropics, the limited crop suitability can primarily be attributed to soil acidity (pH), indicating possible uncertainties with the SoilGrids dataset used; differences in Egypt mainly result from discrepancies according to different assumptions for irrigated areas.
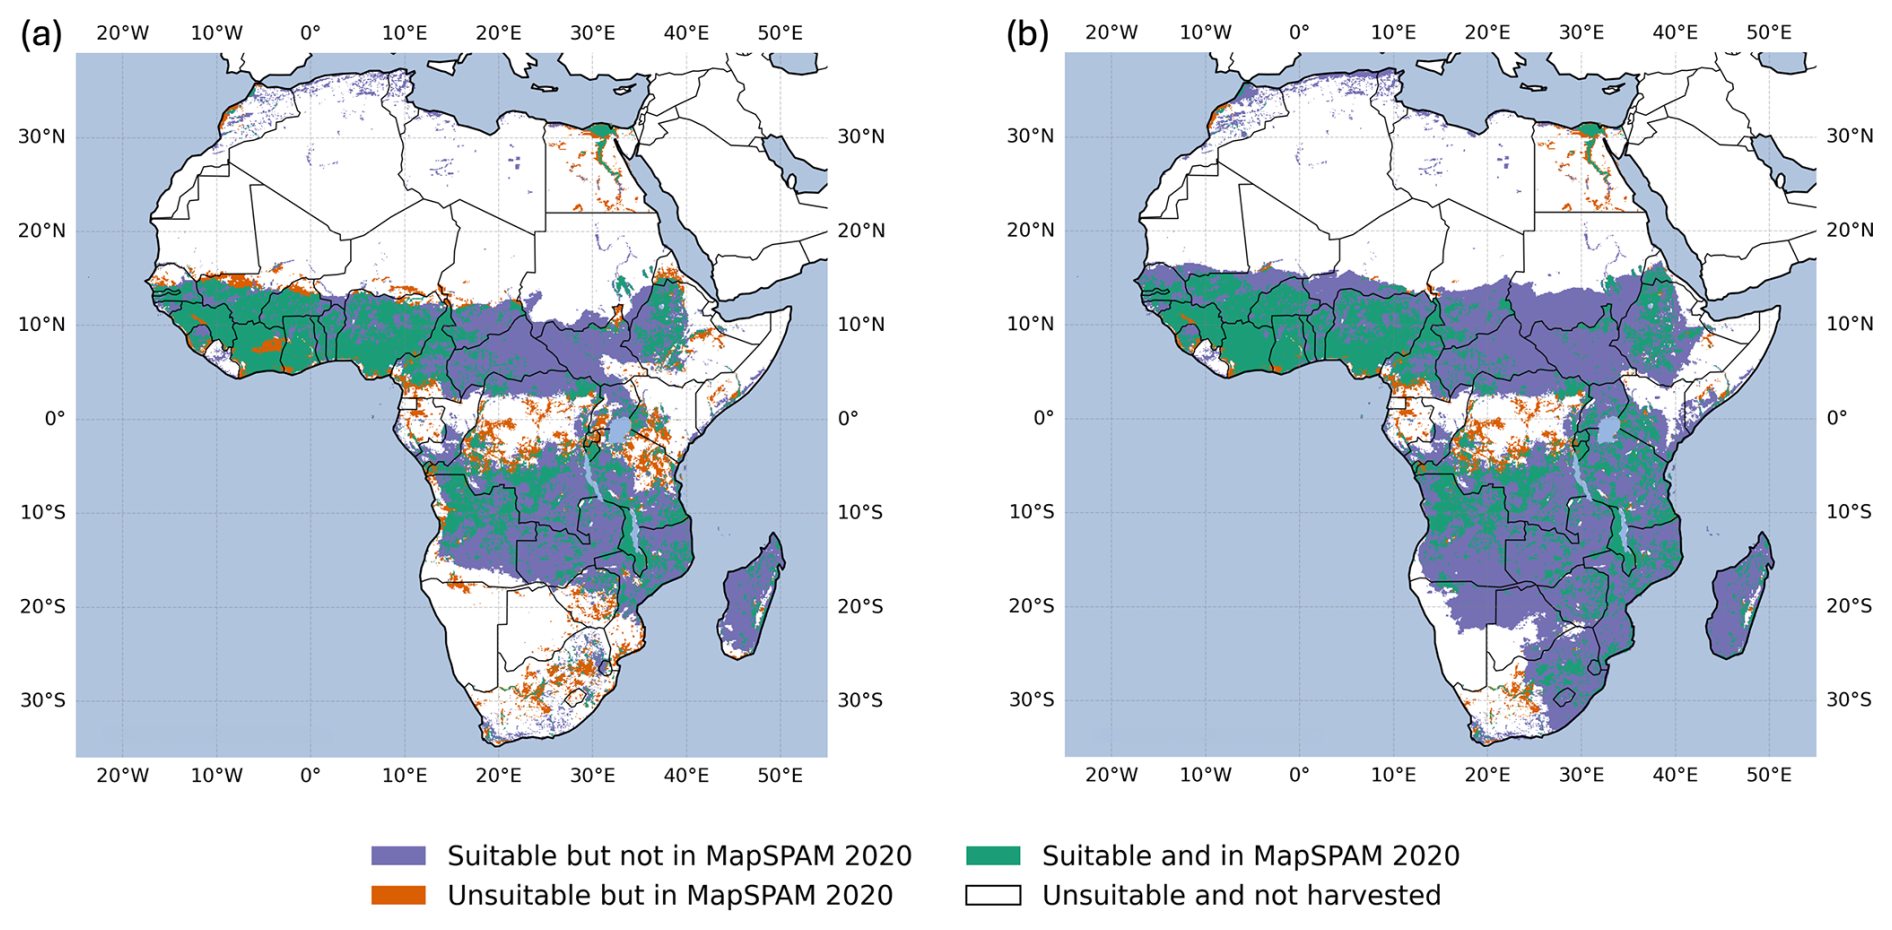
Figure 7Comparison of CropSuite and MapSPAM 2020 for maize. Panel (a) shows the comparison when considering climate variability in CropSuite, while climate variability is not considered in (b). Areas in which the respective crop is harvested according to MapSPAM and which are suitable according to CropSuite are shown in green; areas that are suitable but in which the crop is not harvested are shown in blue. Areas that are not suitable but are harvested according to MapSPAM are shown in red. Unsuitable areas that are not harvested according to MapSPAM are shown in white.
3.2 Comparison with GAEZ
A state-of-the-art climate-edaphic suitability assessment for crops is provided by the Global Agro-Ecological Zones (GAEZ) v4 (Fischer et al., 2021). For comparison with CropSuite, we used GAEZ data for the time period of 1981–2010 for a high input level, rainfed conditions, and the option “all land in grid cell”. The high input level refers to advanced management assumptions (fully mechanized; optimum application of nutrients; and chemical pest, disease, and weed control) (Fischer et al., 2021), which correspond best to the assumptions made in CropSuite for this study. The suitability range of the GAEZ data is transformed into the classification system, as shown in Table 3. The CropSuite data for rainfed conditions are resampled (using the average) to the same spatial resolution of 5 arcmin as the GAEZ data. For this comparison, we use CropSuite data without climate variability since the GAEZ approach does not consider climate variability. Coffee was compared against the best type (either robusta or arabica), as was done in the GAEZ data (Fischer et al., 2021). Overall, there are large overlaps between GAEZ and CropSuite (Fig. 8). Generally, CropSuite identifies larger suitable areas than GAEZ for Africa (purple bars in Fig. 8), particularly for barley, cabbage, chickpea, rapeseed, rye, and wheat. A main reason for differences may be due to different underlying soil data: GAEZ uses the HWSD, while CropSuite uses the SoilGrids data. As an example, we found abrupt changes in the GAEZ results, especially between borders (e.g., between Angola and Zambia), which follows the patterns of a known issue in the underlying HWSD (Dewitte et al., 2013). The consideration of climate variability in CropSuite mainly results in larger areas that are unsuitable in CropSuite but still suitable in GAEZv4 (orange bars) (Fig. S4).
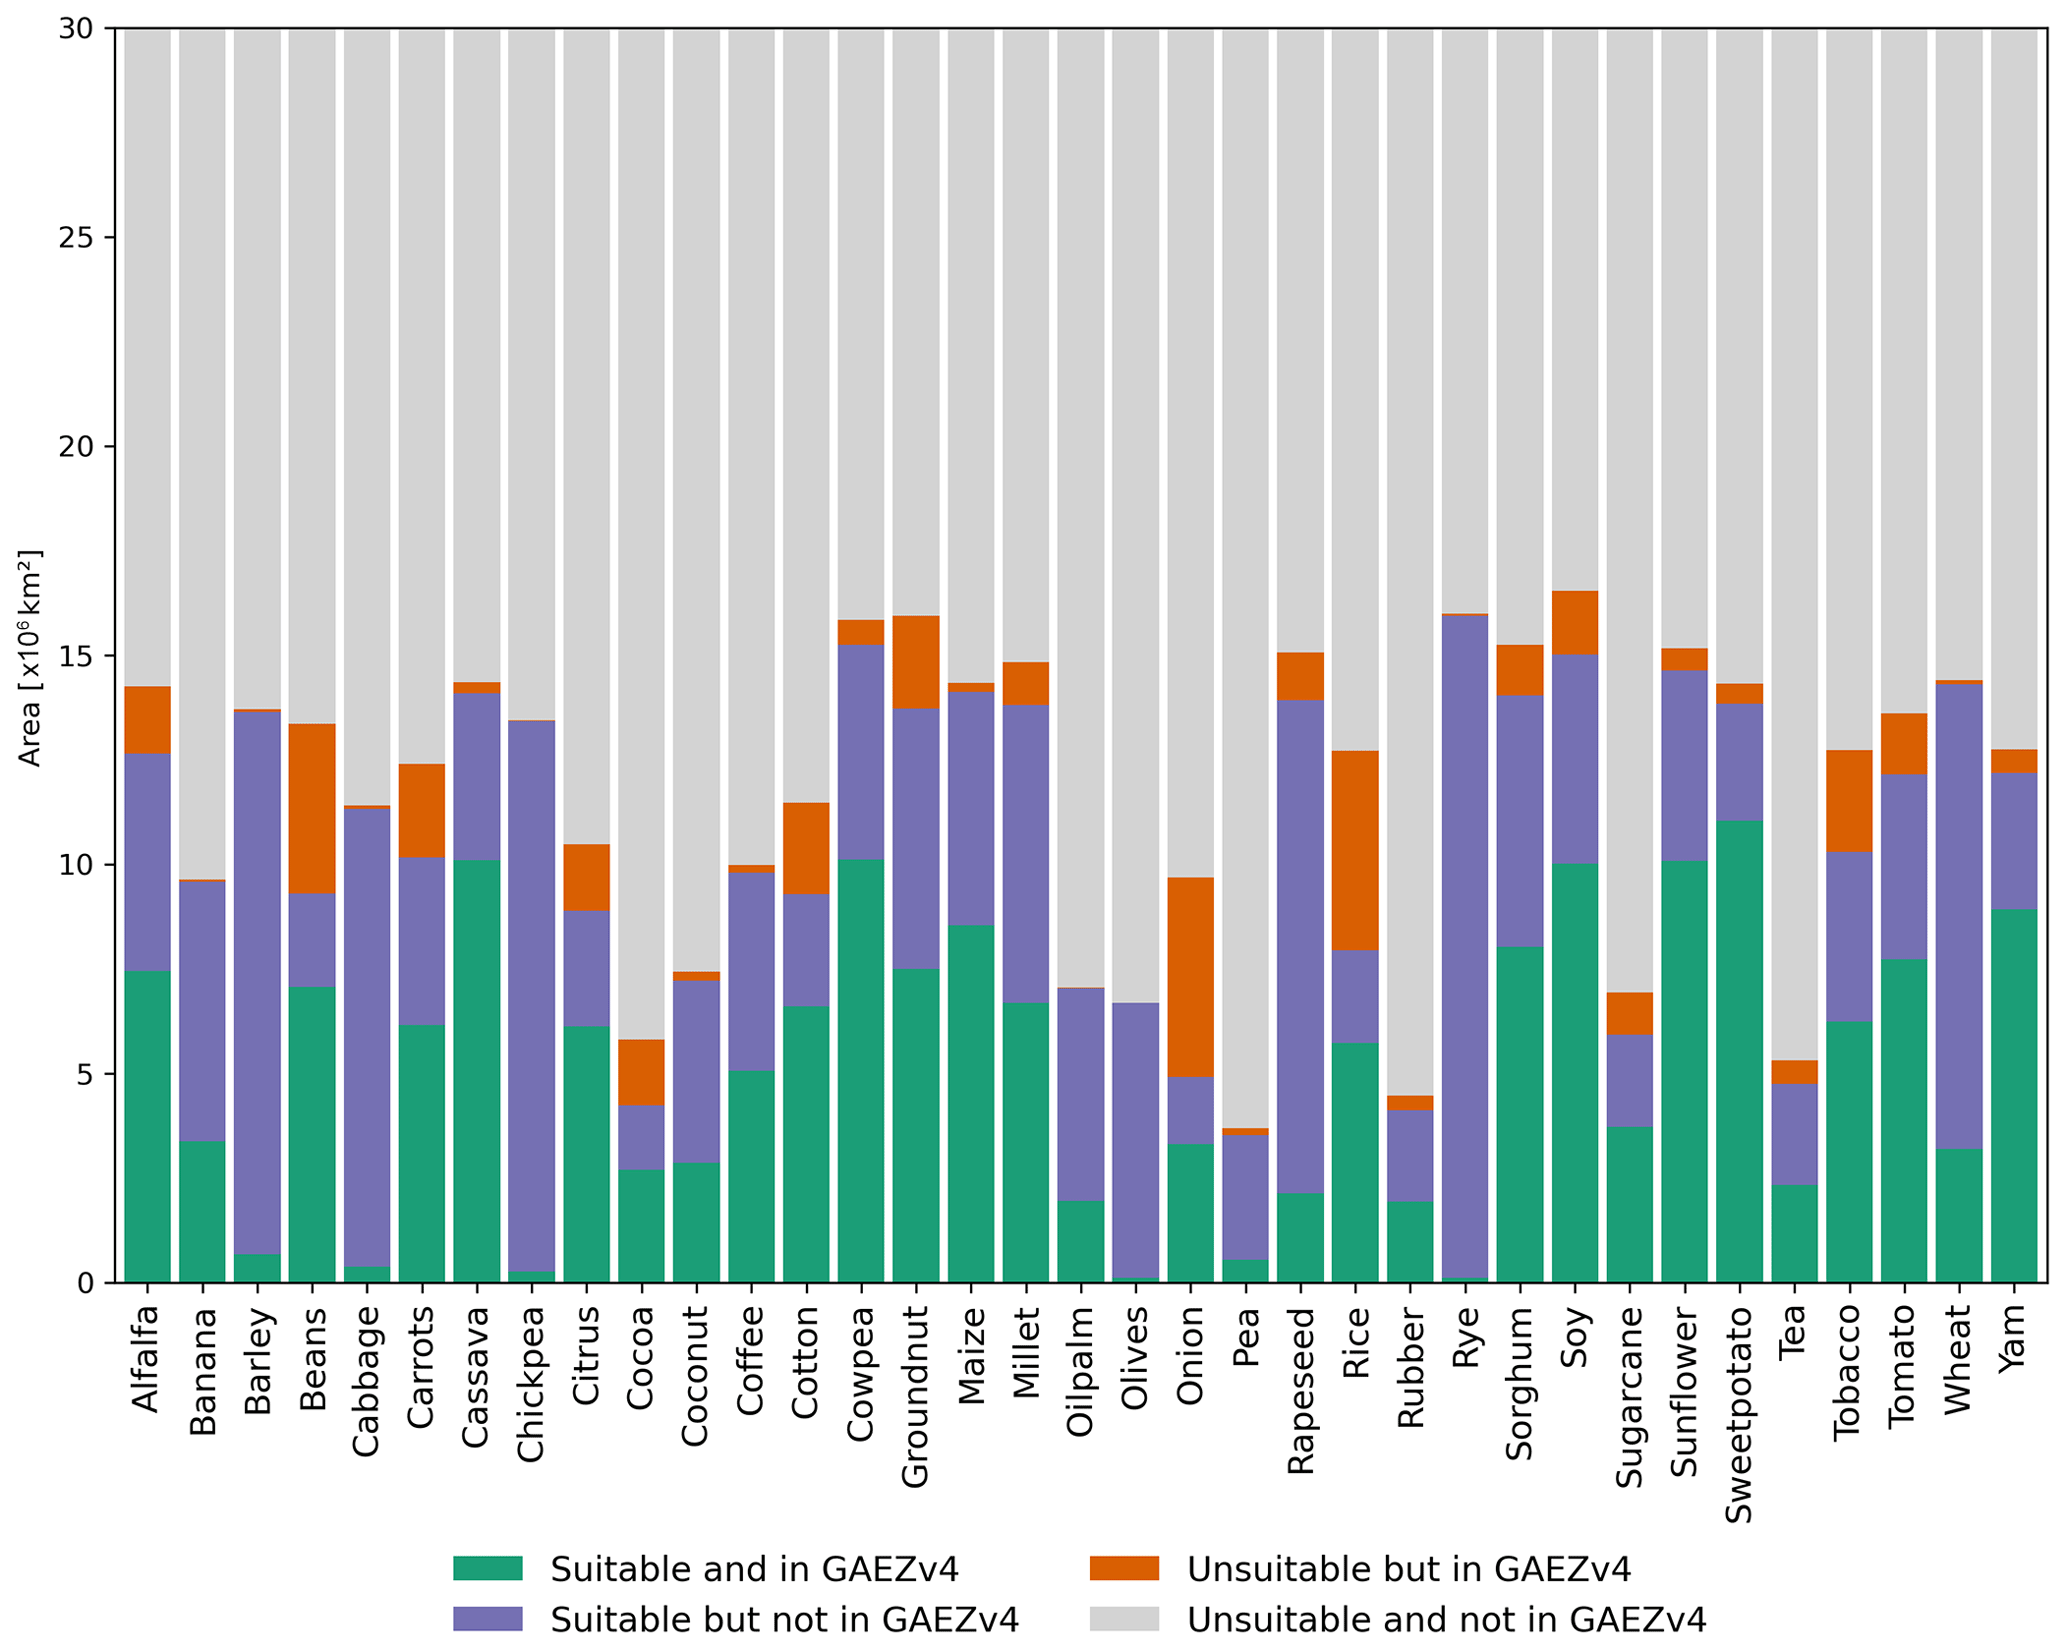
Figure 8Comparison between CropSuite and GAEZv4 suitability data for all matching crops. CropSuite results are shown without considering climate variability. Areas that are suitable in both CropSuite and GAEZv4 are shown in green; areas suitable in CropSuite but not suitable in GAEZv4 are shown in purple. Unsuitable area in CropSuite that is suitable in GAEZv4 is shown in orange. Areas that are unsuitable in both datasets are shown in gray.
3.3 Comparison of optimal sowing dates with the GGCMI crop calendar
Another method of validation involves comparing the optimal sowing dates computed with CropSuite to the crop calendar from the Global Gridded Crop Model Intercomparison (GGCMI), which is available globally for a variety of different crops at a 0.5° spatial resolution (Jägermeyr et al., 2021). Figure 9 illustrates the average differences in the sowing dates across Africa, averaged for the matching crops in the two datasets. The comparison is performed at a spatial resolution of 30 arcsec (Fig. 9) and at a half degree resolution (see Fig. S5). For the high spatial resolution, the GGCMI data are interpolated to 30 arcsec using the nearest-neighbor method. Unlike CropSuite, which displays the optimal sowing date, the GGCMI data show the actual sowing date based on extrapolated statistics. Thus, there might be differences between the optimal and actual sowing dates. We must also consider that the GGCMI crop calendar is based on statistics that apply to discrete areas at a relatively coarse half degree spatial resolution, while CropSuite was simulated at a pixel accuracy of a 30 arcsec spatial resolution. In fact, the median differences are mostly within 1 month of the GGCMI crop calendar, which generally indicates high agreement. Generally, we found that a greater distance to the Equator potentially increased the discrepancy between the two datasets. As an example, in tropical climates with dry and rainy seasons, a shift from one rainy season to another rainy season might result in a greater discrepancy. Also, we found that the distribution of sowing dates over the year was less concentrated in CropSuite, which could be a result of the higher spatial resolution (see Fig. S6). At the coarse resolution, the difference between the two datasets and the spread is smaller (Fig. S5).
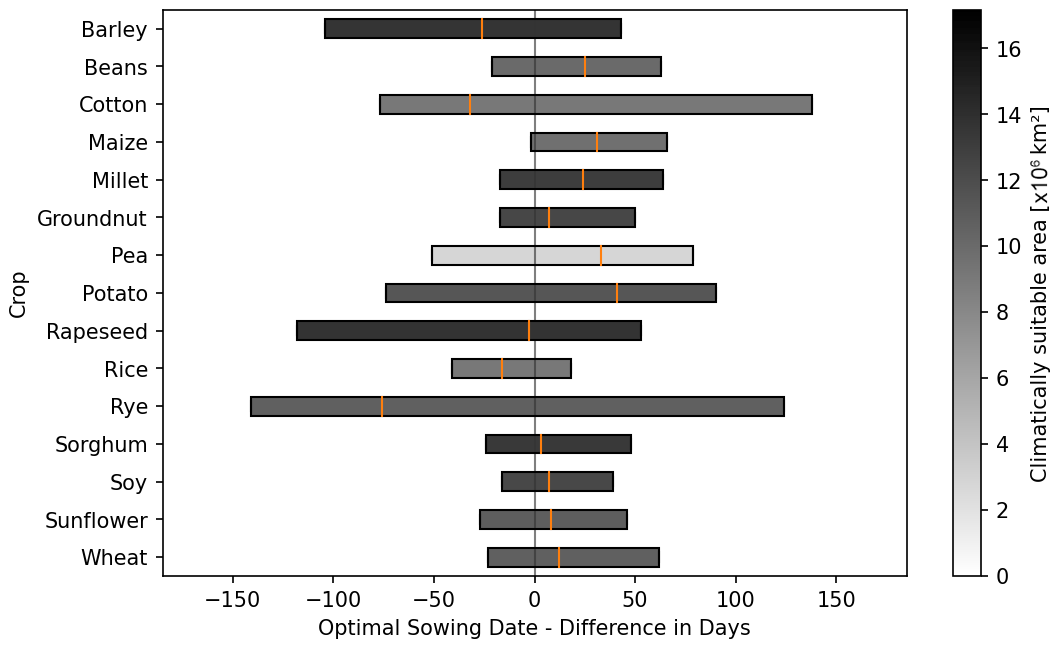
Figure 9Comparison of the optimal sowing dates from CropSuite and the actual sowing dates from the GGCMI crop calendars. The area-weighted shift in the sowing date in days is shown for all matching crops. Negative values mean an earlier sowing date in CropSuite; positive values mean a later sowing date in CropSuite compared to the GGCMI crop calendar. The bars show the 5th and 95th percentiles; the orange marker shows the median. The color of the bars indicates the climatically suitable area for the whole of Africa. Irrigated areas are considered according to Meier et al. (2018). The comparison is performed at a 30 arcsec spatial resolution for both datasets.
Crop suitability is simulated for historical climate conditions (1991–2010) for rainfed and irrigated conditions. Figure 10a illustrates the overall crop suitability, showing for each location the value for the most suitable of all crops considered. Irrigation is considered according to the currently irrigated areas for Africa (Meier et al., 2018), such as along the Nile river in Egypt (see Fig. S1 for irrigated areas in Africa). In total for Africa, 5.7 ×10⁶ km2 is highly suitable, 10.6 ×10⁶ km2 is moderately suitable, 3.3 ×10⁶ km2 is marginally suitable, and 10.4 ×10⁶ km2 is not suitable for crop cultivation. Mainly between 10° N and 10° S, a high potential for multiple cropping exists, with the possibility of two or three harvests per year (Fig. 10b). Looking at the number of crops suitable for cultivation (Fig. 10c), a large proportion of the crops considered can grow along the wet savannahs in particular, which gives these regions plenty of opportunities for cultivation. In contrast, only a few crops are suitable for the inner tropics and the dry savannahs, which limits the possibilities for switching between crops.
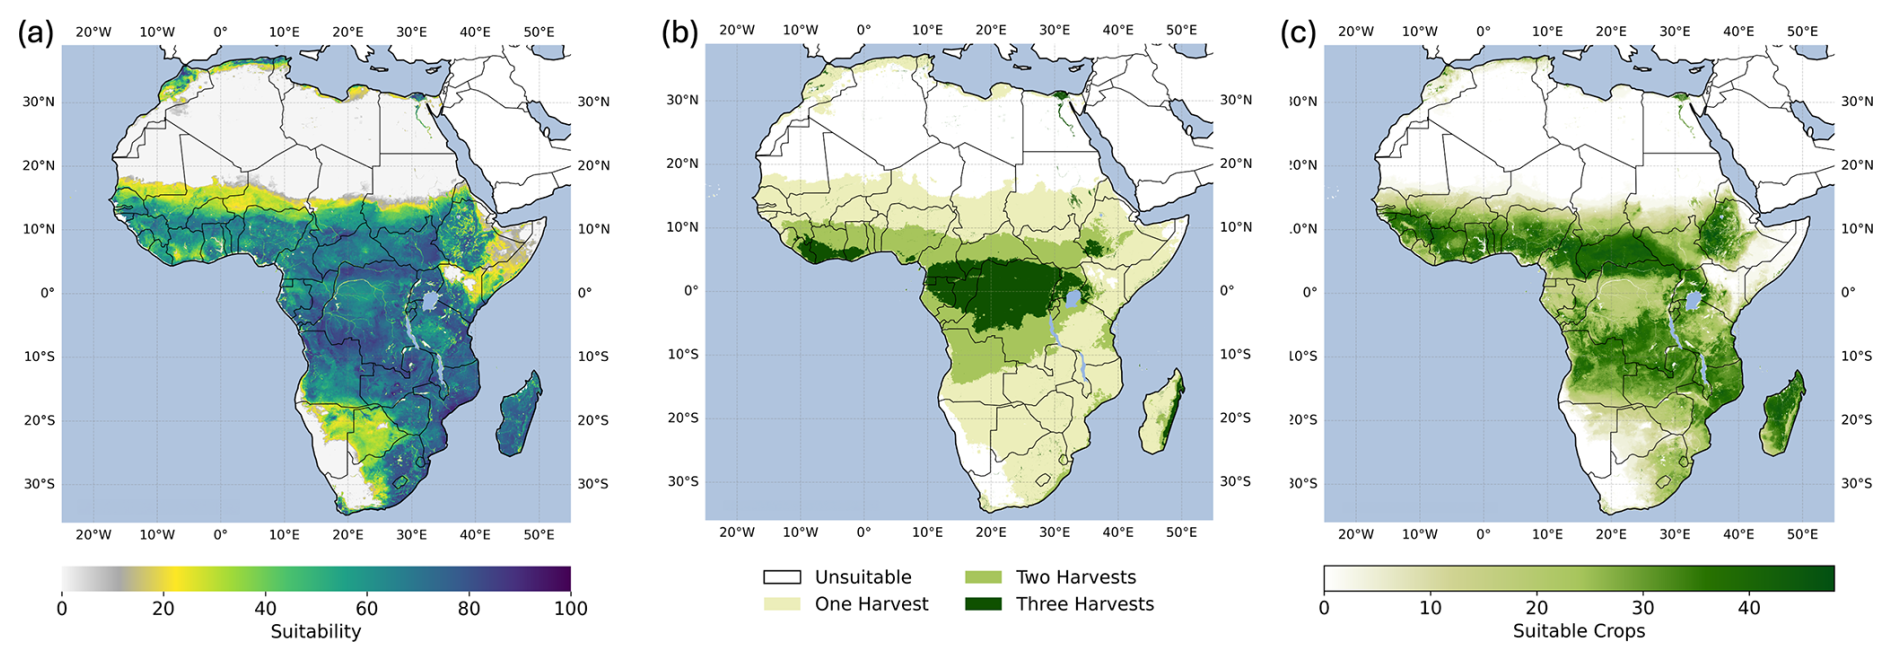
Figure 10(a) Overall crop suitability, (b) potential multiple cropping, and (c) number of suitable crops under historical climate conditions from 1991 to 2010. Irrigated areas are considered according to Meier et al. (2018). The overall crop suitability (a) and the potential multiple cropping (b) are each shown for the most suitable crop at each location. The maximum number of suitable crops is a result of the 48 crops considered (see Table 1) in this paper. Figure 10a is shown with a different color map in the Supplement (Fig. S7).
Figure 11 shows the suitable area for each of the simulated crops in Africa. The five crops with the largest suitable areas in Africa are safflower (16.82 ×10⁶ km2), sesame (15.76 ×10⁶ km2), guava (14.15 ×10⁶ km2), cowpea (13.61 ×10⁶ km2), and mango (13.39 ×10⁶ km2).
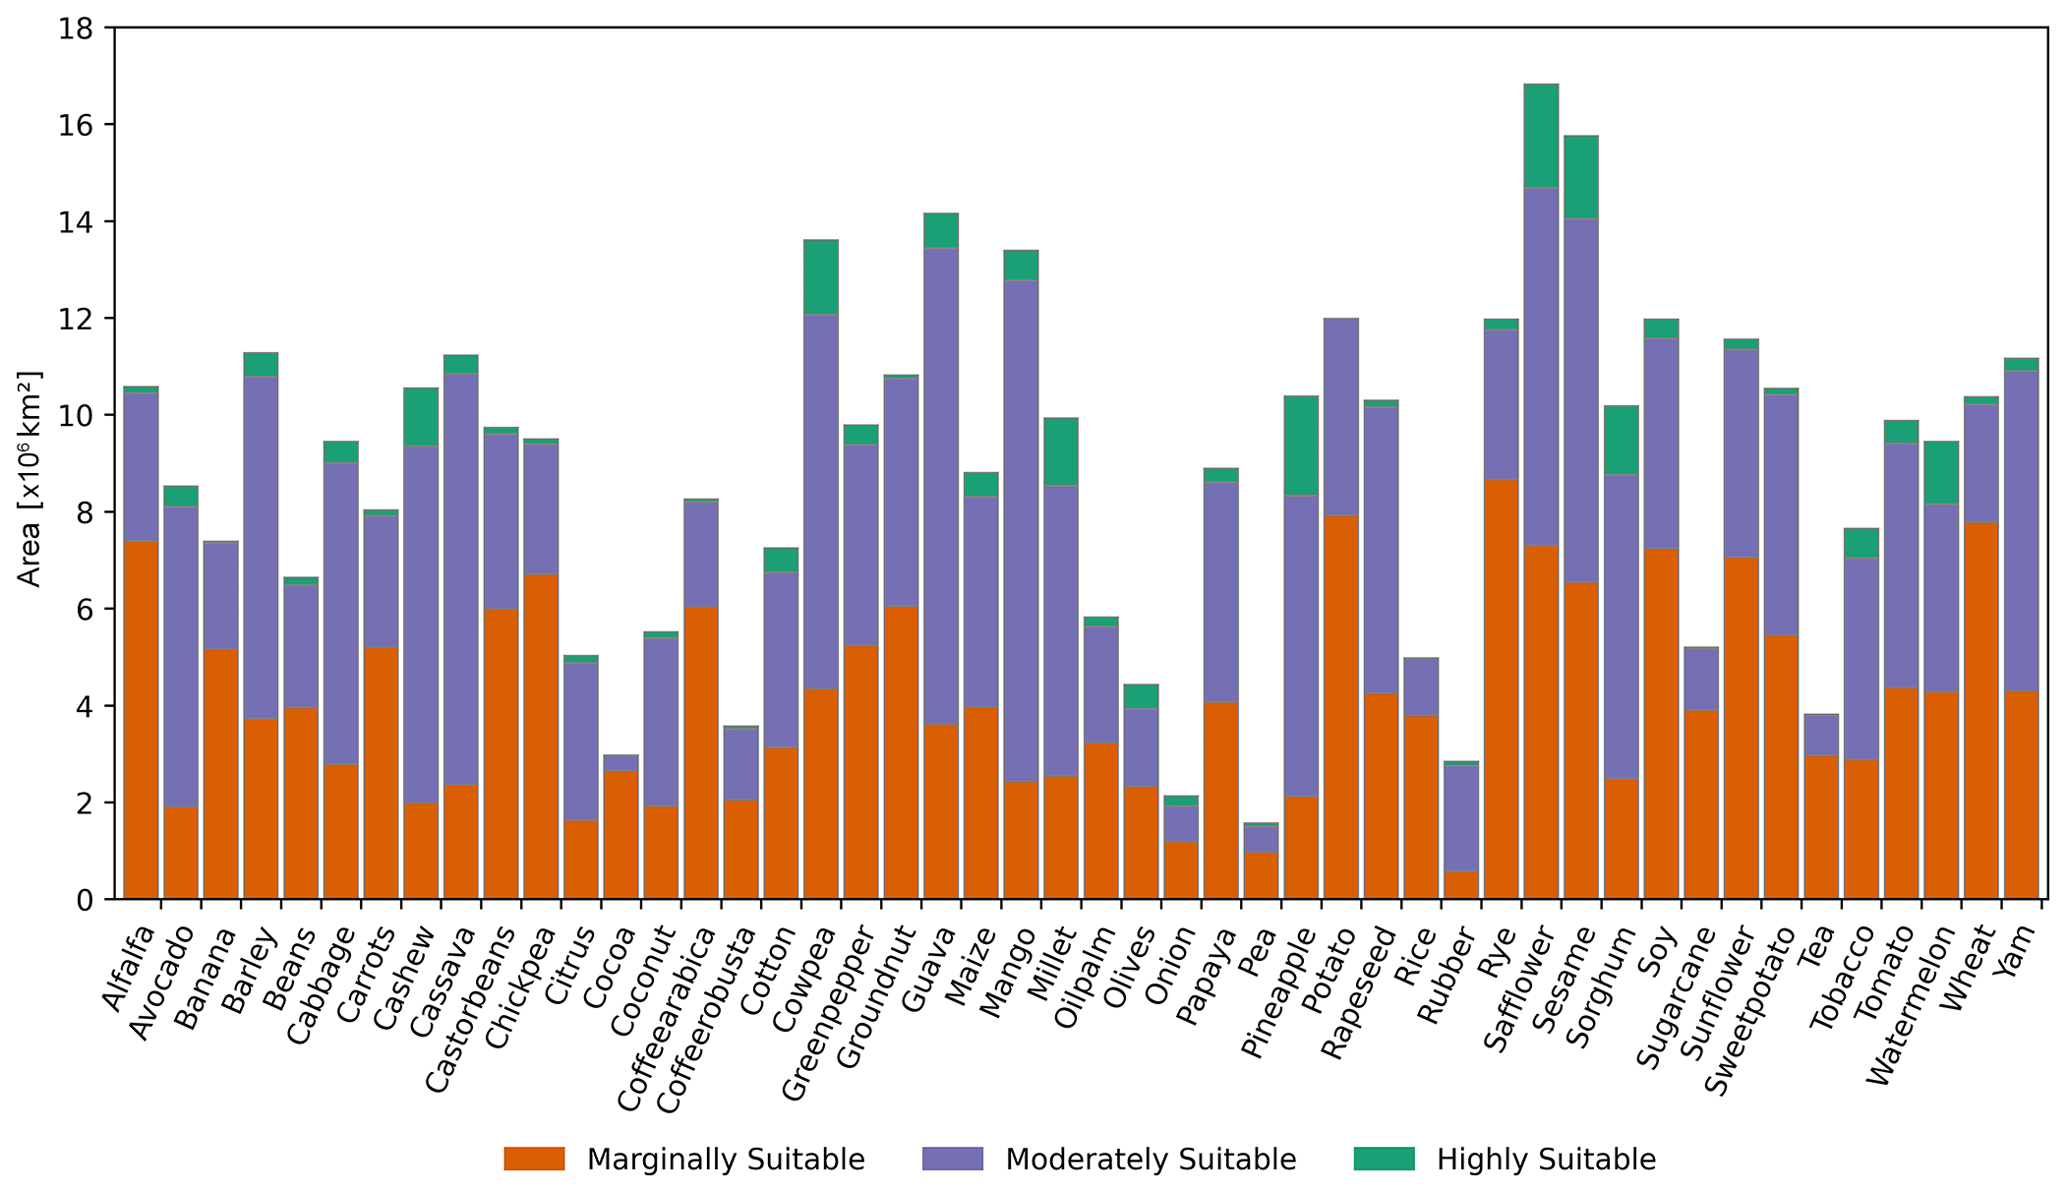
Figure 11Marginally, moderately, and highly suitable areas for all 48 crops under historical climate conditions from 1991 to 2010 in Africa. Suitability classes are chosen according to Table 3. Irrigated areas are considered according to Meier et al. (2018).
Figure 12a shows the crop suitability simulated for maize as an example. The maps for all crops are provided via Zenodo (see “Data availability” section). Maize is highly suitable along a strip of the 10° N and the 20° S parallel, as well as in large parts of Mozambique and Madagascar. In total, 0.49 ×10⁶ km2 is highly suitable, 4.34 ×10⁶ km2 is moderately suitable, 3.97 ×10⁶ km2 is marginally suitable, and 21.23 ×10⁶ km2 is unsuitable.
The optimal sowing date for single cropping (Fig. 12b) for maize shifts with latitude from the Northern Hemisphere across the Equator to the Southern Hemisphere. Figure 12c shows the number of potential harvests per year for maize. Climate conditions allow up to two harvests per year in some parts of Congo and Cameroon and in the irrigated areas, e.g., along the Nile river. Optimal sowing dates for first and second sowing in areas suitable for multiple cropping are shown in Fig. S8.
Figure 12d shows the climate suitability for maize, which only considers climatic constraints for the suitability of maize. In comparison to the crop suitability map (Fig. 12a), more areas are suitable, and suitability is substantially higher if soil and topography are not considered and therefore do not limit or reduce crop suitability.
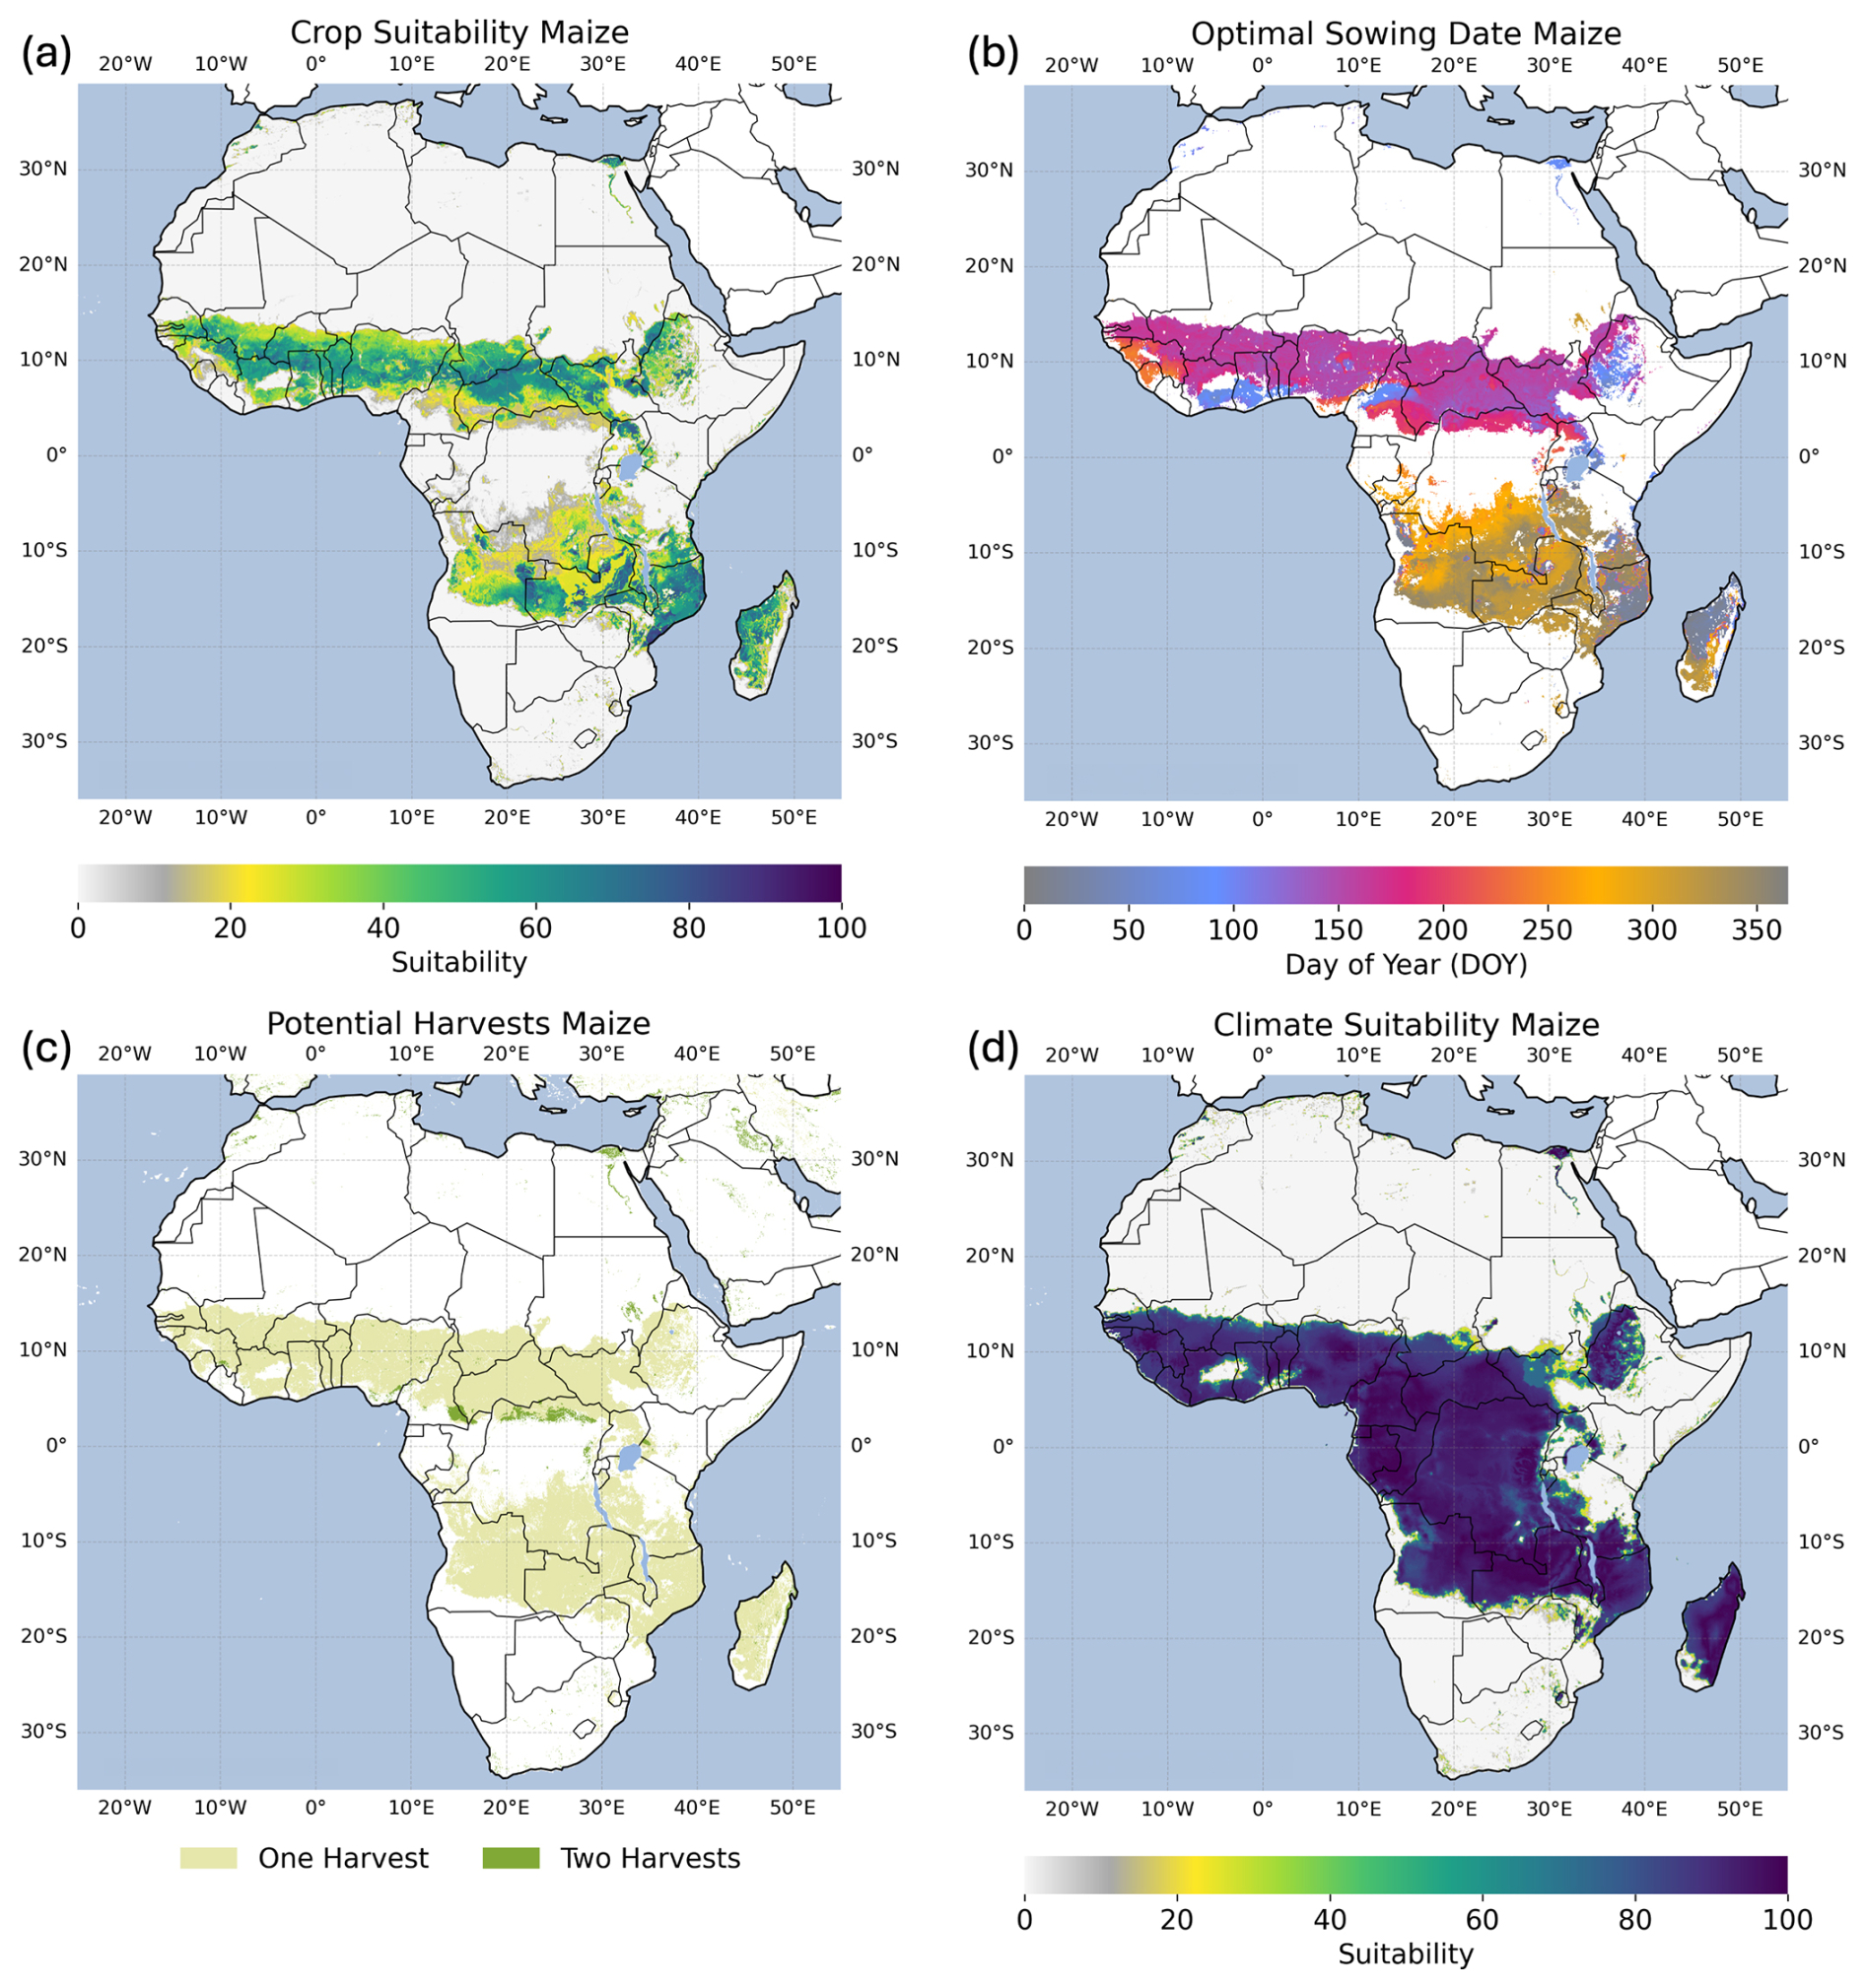
Figure 12(a) Crop suitability, (b) optimal sowing date for single cropping, (c) potential multiple cropping, and (d) climate suitability for maize under historical climate conditions from 1991 to 2010. Irrigated areas are considered according to Meier et al. (2018). Figure 12a is shown with a different color map in the Supplement (Fig. S9).
The most-limiting factor is shown in Fig. 13a. While low precipitation prevents maize from being suitable in large parts of Africa in the arid deserts, soil predominantly restricts suitability in tropical regions. In particular, pH is the most-limiting factor in the humid tropics, such as the Congo Basin, where soils are too acidic to grow maize. A large band along the drylands highlights regions where inter-annual climate variability is limiting maize suitability the most (in orange, Fig. 13a). Here, climate conditions are unstable for maize cultivation, and the recurrence rate of potential crop failure is larger than 25 % (every fourth year). For maize, climate variability limits crop suitability over 4.4 ×10⁶ km2 in Africa (Fig. 13a).
Figure 13b shows the degree of limitation for all climate, soil, and terrain factors considered along a transect following 20° E from north to south. In the Sahara, several factors, including temperature, organic carbon content, and soil pH, are not in an optimal range, while precipitation and the climate variability are the most-limiting factors (note that climate variability is by definition a limiting factor if precipitation and/or temperature are limiting factors). Due to the unfavorable soil conditions, irrigation would only slightly improve maize suitability here. Between 15 and 5° N, the limitations of all factors are relatively low. Here, coarse fragments and base saturation are the most-limiting factors. The tropical areas along the transect between 5° N and 10° S are mainly constrained by soil pH. Accordingly, soil management or practices that increase pH in these regions would have a significantly positive impact on crop suitability in this region since no other factor has such a strong impact on maize suitability. Further south, low precipitation again mostly limits maize suitability.
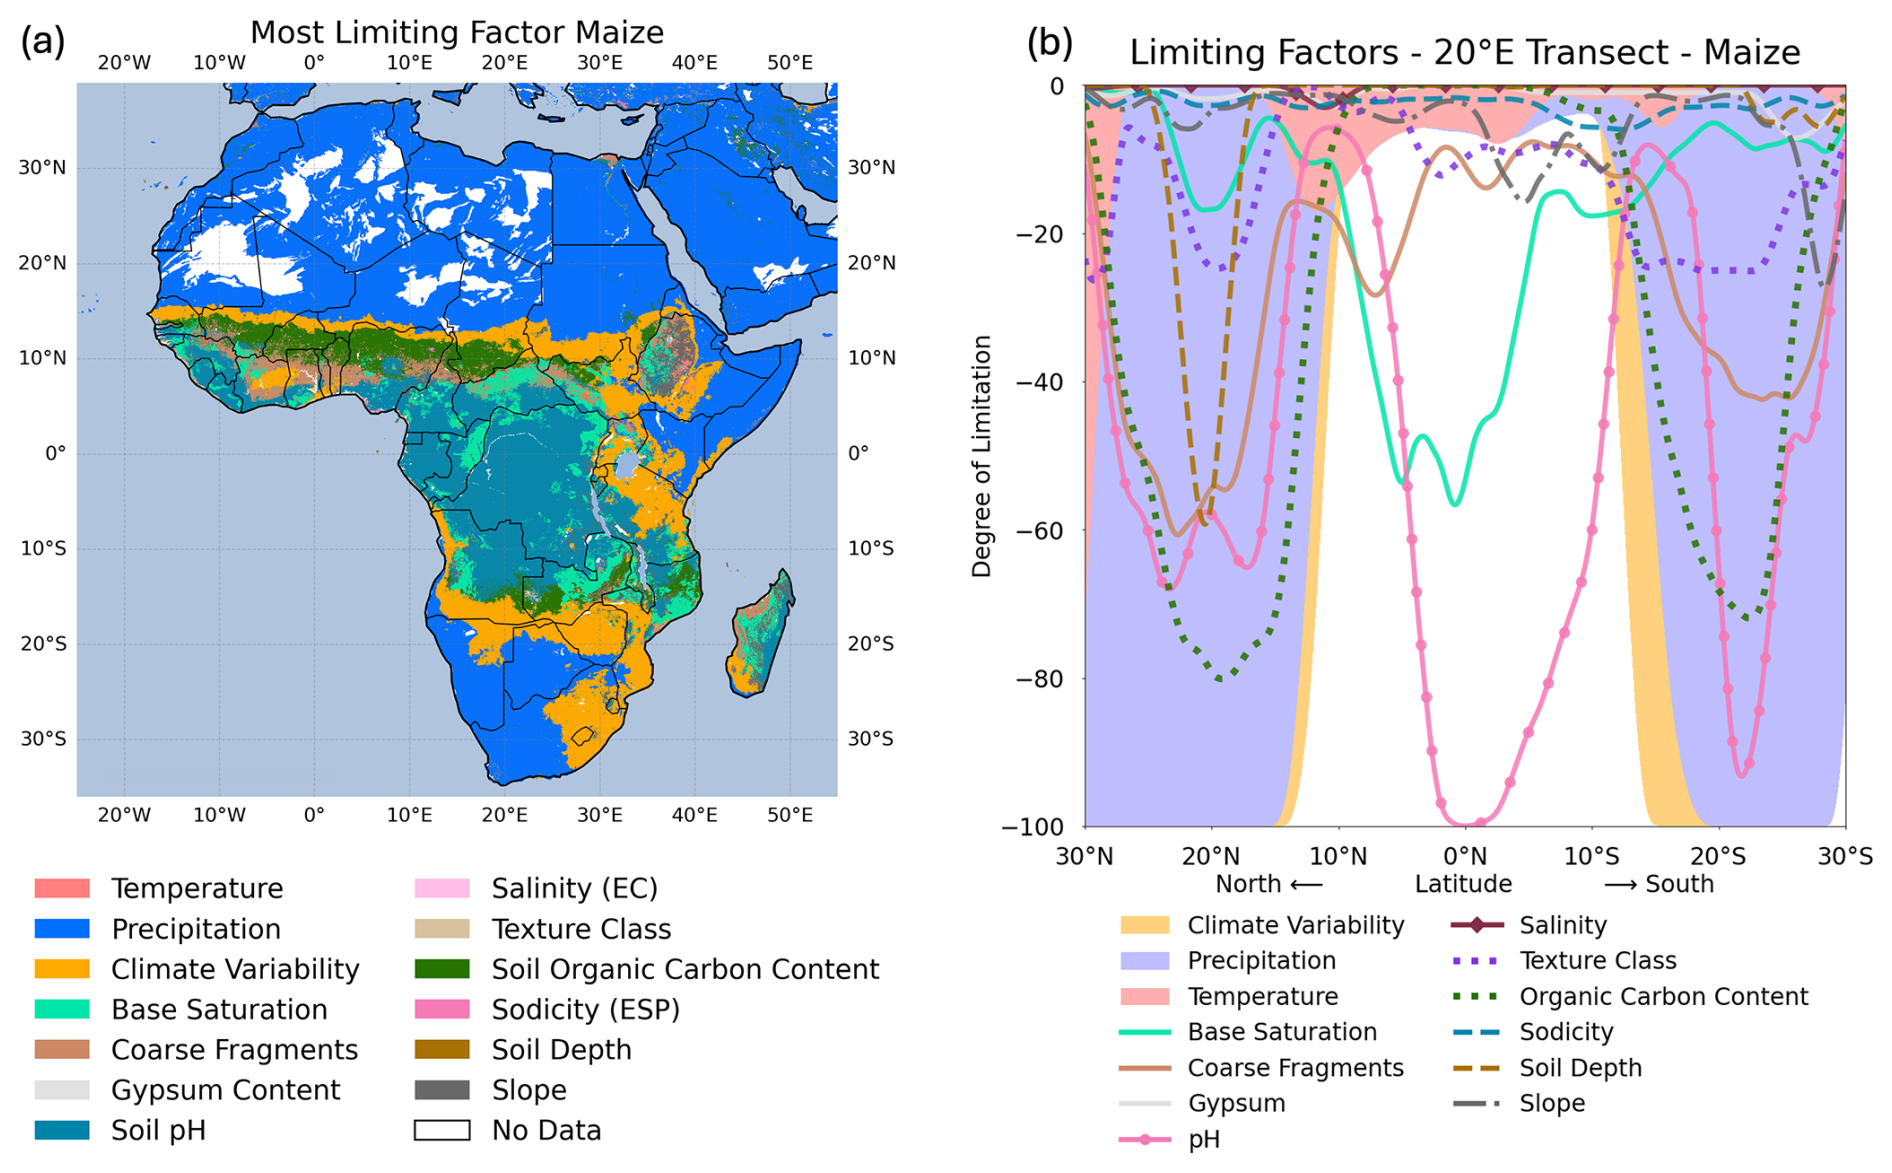
Figure 13Limiting factors. (a) the most-limiting factor for suitability for maize under historical climate conditions from 1991 to 2010. Panel (b) shows the degree of limitation of all factors along a transect of 20° E from 30° N to 30° S. The most-limiting factors are displayed with priority according to the order in the legend in (a) if more than one factor fully limits the suitability. For visualization, the shapes in (b) are smoothed using a moving average. Irrigated areas are considered according to Meier et al. (2018) in (a) and are not considered in (b).
Consideration of climate variability significantly reduces climate suitability for maize, as shown in Fig. 14a, mainly in the transition area between dry savannah and desert in the Sahel zone; in Burundi and Tanzania in eastern Africa; and in the southern part of Africa in Angola, Zambia, Zimbabwe, Mozambique, South Africa, and the southern part of Madagascar. In total, climate variability reduces climate suitability over more than 5.4 ×10⁶ km2.
Optimal sowing dates also shift when considering climate variability since the algorithm identifies the most suitable time window for the growing cycle over the year (Fig. S10). As a result, optimal sowing for maize considerably shifts in Tanzania, Mozambique, and Madagascar.
Figure 14b shows the impact of climate variability on the overall crop suitability for all crops. In this case, overall crop suitability is reduced over 2.2 ×10⁶ km2, mainly in Somalia; Kenya; Ethiopia; South Africa; and the Maghreb countries of Morocco, Algeria, Tunisia, and Libya. These regions generally show high vulnerability to climatic variability. Climate variability also reduces the potential for multiple cropping in general for all crops over more than 2.3 ×10⁶ km2 (Fig. S11).
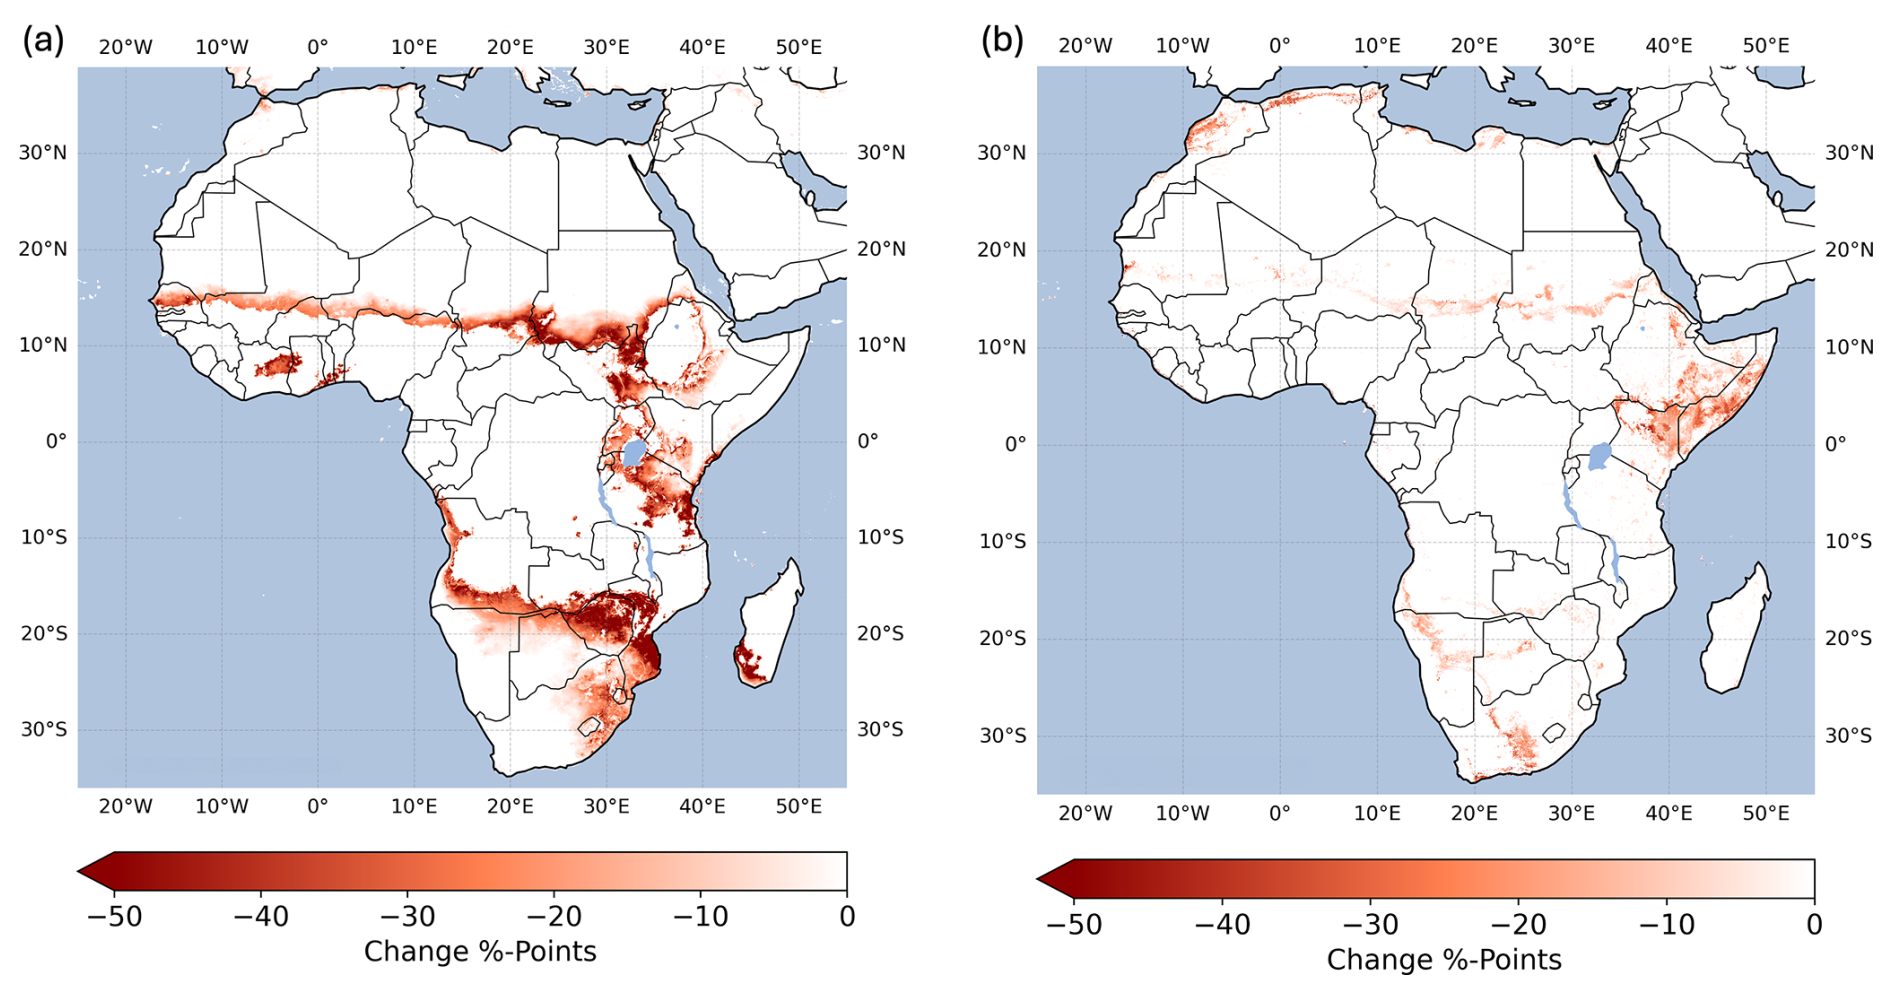
Figure 14Impact of the consideration of climate variability on crop suitability (a) for maize and (b) for the overall crop suitability of all crops under historical climate conditions from 1991 to 2010. Irrigated areas are considered according to Meier et al. (2018).
We found that consideration of climate variability significantly affects crop suitability, multiple cropping, and optimal sowing dates in Africa. Our approach allows us to adjust the risk aversion of farmers by adjusting the thresholds for climate variability (Sect. 2.2.) and the membership function (Fig. 5). The shape of this function may differ between crops and regions and might be influenced by several socioeconomic factors, such as the degree of mechanization, financial possibilities, and the availability of crop insurance, which is likely to reduce the risk aversion of farmers. We suggest that the function shown in Fig. 5 is a broad and general solution, which is primarily designed to represent risk aversion of commercial farms. In our comparison analysis for maize (Sect. 3), reference data showed some cultivation in the regions we identified as unsuitable due to the high recurrence rate of potential crop failure caused by high climate variability (Fig. 7). In some regions, despite the high risk of crop failure, land might be cultivated by smallholders or subsistence farmers who have no other choice but to cultivate these lands. However, we admit that the tuning of the climate variability thresholds and the membership function requires more research, and the optimal results will vary depending on the crop and region. CropSuite offers the platform and the possibility to conduct such assessments.
The results of CropSuite (Sect. 4) are subject to uncertainties in the climate, soil, terrain, and irrigation data applied, as well as the membership functions (Fig. 1). Soil and terrain data are assumed to be static, although management could influence soil properties such as pH, and terracing could reduce slope limitations. The climate data from CHIRPS and CHIRTS applied here are found to be particularly valuable in regions where climate stations are sparse. Over Africa, CHIRPS is successfully validated (Dinku et al., 2018), showing good performance (Lemma et al., 2019; Muthoni et al., 2019). Verdin et al. (2020) also report good agreement of CHIRTS over Africa, with poor performance, however, over central Africa, the Horn of Africa, and parts of northern Mali. Generally, both datasets rely on station data to correct the satellite estimations, which is why uncertainties for very data-scarce regions remain. To apply CropSuite to regions outside 50° S–50° N or to longer time periods before the 1980s, the user of CropSuite could also rely on global high-resolution climate reanalysis, such as ERA5 (Hersbach et al., 2020). For the African continent, the ERA5 reanalysis shows large improvements over its predecessor, ERA-Interim (Gleixner et al., 2020). Still, considerable deviations in precipitation from CHIRPS are reported, e.g., wet biases over Uganda (Gleixner et al., 2020) and a dry bias over the western Sahel (Gbode et al., 2023), where CHIRPS is applied as a reference. We therefore assume that CHIRPS and CHIRTS are very suitable climatic datasets to investigate our example of maize suitability in Africa. The soil profiles used for the generation of the SoilGrids show a heterogeneous distribution with large gaps over central Africa, which is why Hengl et al. (2017) attribute uncertainty in the data to the undersampling. They argue that a few hundred additional profiles in undersampled areas could massively improve the resulting SoilGrids.
The membership functions derived by Sys et al. (1993) are widely applied but are also governed by inherent uncertainties. Herzberg et al. (2019) argue that the assessment by Sys et al. (1993) is not detailed enough to capture specific features of small areas. They find that Sys et al. (1993) would consider a hilly area in tropical Vietnam unsuitable due to too acidic soils and steep slopes, whereas the local farmers can cultivate the land. Furthermore, the approach cannot account for compound effects and interactions of the climate and soil variables (Elsheikh et al., 2013). The membership functions cover the general behavior in a univariate manner, while real plant physiology is a more complex interplay of climatic variables and soil conditions (Joswig et al., 2022). This also applies specifically to compound extremes, for example the combination of hot and dry climatic conditions (Goulart et al., 2023) that limits water availability and favors evaporation, which can trigger water and temperature stress in plants. This is relevant in the course of a warming climate, as the joint probability of hot and dry conditions is projected to increase in many regions of the world (Bevacqua et al., 2022; Felsche et al., 2024). This is, however, not a specific drawback of CropSuite but rather a lack of bivariate, multivariate, or interactive membership functions. The assessment of the membership functions by Sys et al. (1993) is also outdated for new crop varieties that might be more resilient to climatic and environmental stressors (Peter et al., 2020). Furthermore, we argue that the uncertainty in the temperature and precipitation membership functions is by design larger at its low and high ends, as the functions are derived empirically. Since our consideration of climate variability is based on the 5 % to 10 % suitability values (see Sect. 2.2), the uncertainties in the membership functions are propagated to the assessment of climate variability. More research and updated functions could support the results by CropSuite.
The sampling of climate variability within 20-year periods is limited, as variability can cover wide time ranges. There, the application of single-model initial-condition large ensembles can help to robustly assess the variability based on decadal or multidecadal time periods (Deser et al., 2020). This is especially important for precipitation and precipitation extremes, which show high sensitivity to climate variability (Lang and Poschlod, 2024; Tebaldi et al., 2021). Furthermore, for the assessment of climate variability, we only capture the occurrence of growing seasons exceeding the percentile thresholds, but we do not consider the intensity of the events. Single days with extreme precipitation can induce flooding that leads to crop failure (Balgah et al., 2023; Müller et al., 2023), even though the average precipitation for the growing season is still within the suitable range of the membership function. This drawback, however, also applies to most of the mechanistic crop models at the global scale (Ruane et al., 2017), while regional applications evolve incorporating crop losses due to waterlogging and flooding (Li et al., 2016; Monteleone et al., 2023; Pasley et al., 2020). This is why we claim to assess climate variability and not climate extremes inducing potential crop failure.
CropSuite is a new, easy-to-use comprehensive open-source model that provides a complete processing chain (preprocessing, spatial downscaling, suitability simulations, data analysis, and visualization) for carrying out crop suitability and climate change impact analysis. CropSuite allows users to easily parameterize different varieties of the same crops or additional crops by determining the membership functions in the GUI. Thereby, the fuzzy-logic approach makes it easy to use expert knowledge for the parameterization of the membership functions. Besides all data and the compiled maps generated, we provide a user manual for CropSuite (Knüttel and Zabel, 2024a) and the parameterizations of the 48 crops considered in this study. Furthermore, the model allows the flexible addition of further parameters and membership functions that might affect suitability if the required data are provided. For the future, this allows the consideration of further ecological and socioeconomic limitations (such as access to fertilizers; available labor, know-how, infrastructure, and transportation; and heat stress impacts on labor) that have not yet been sufficiently considered in crop suitability assessments (Orlov et al., 2024; Akpoti et al., 2019).
For this study, we simulated 48 crops in Africa under the consideration of climate variability in historical climate conditions. Thus, we created a huge dataset, providing detailed high-resolution information on climate, soil, and crop suitability; optimal sowing dates; multiple cropping potential; and the limiting factors, which can be used for follow-up studies and climate impact assessments. Additionally, the data include substantial information to develop strategies for efficient land use (Schneider et al., 2024; Molina Bacca et al., 2023; Delzeit et al., 2019). The consideration of future climate change scenarios will allow for the investigation of efficient strategies for climate change adaptation through shifting sowing dates or cultivar and land-use change. Further, information about the limiting factors can be helpful to optimize crop management since it identifies the parameter that most efficiently improves crop suitability.
The CropSuite (v1.0) code is written in Python and is available open-source (CC BY-SA 4.0), together with the GUI, on Zenodo (https://doi.org/10.5281/zenodo.13285635, Knüttel and Zabel, 2024b) and GitHub (https://github.com/flozabel/CropSuite, last access: 15 February 2025). A user manual is provided separately on Zenodo (https://doi.org/10.5281/zenodo.14196314, Knüttel and Zabel, 2024a).
The data results are available for download as GeoTIFF files on Zenodo (https://doi.org/10.5281/zenodo.13285541, Zabel et al., 2024). In addition to the figures shown as examples for maize in this paper, the compiled figures for all 48 crops considered are provided for download, including a separation of rainfed and irrigated agricultural systems and a comparison with MapSPAM 2020 (https://doi.org/10.5281/zenodo.13285541, Zabel et al., 2024).
The supplement related to this article is available online at https://doi.org/10.5194/gmd-18-1067-2025-supplement.
FZ conceptualized and developed the model. MK programmed the CropSuite model and the GUI in Python. FZ, MK, and BP developed the methodology for the consideration of climate variability. FZ and MK performed the simulations and analyzed the results. FZ and MK prepared the paper, with contributions from BP.
The contact author has declared that none of the authors has any competing interests.
Publisher’s note: Copernicus Publications remains neutral with regard to jurisdictional claims made in the text, published maps, institutional affiliations, or any other geographical representation in this paper. While Copernicus Publications makes every effort to include appropriate place names, the final responsibility lies with the authors.
The simulations were performed using the sciCORE (http://scicore.unibas.ch/, last access: 15 February 2025) scientific computing center at the University of Basel, requiring in total approximately 150 000 CPUh.
We thank CGIAR and CIAT for their support and the scholarship provided to Matthias Knüttel and for the collaboration with the Africa Agriculture Adaptation Atlas.
This paper was edited by Di Tian and reviewed by two anonymous referees.
Abdulai, A. L., Kouressy, M., Vaksmann, M., Asch, F., Giese, M., and Holger, B.: Latitude and Date of Sowing Influences Phenology of Photoperiod-Sensitive Sorghums, J. Agron. Crop Sci., 198, 340–348, https://doi.org/10.1111/j.1439-037X.2012.00523.x, 2012.
Akpoti, K., Kabo-bah, A. T., and Zwart, S. J.: Review – Agricultural land suitability analysis: State-of-the-art and outlooks for integration of climate change analysis, Agr. Syst., 173, 172–208, https://doi.org/10.1016/j.agsy.2019.02.013, 2019.
Akpoti, K., Kabo-bah, A. T., Dossou-Yovo, E. R., Groen, T. A., and Zwart, S. J.: Mapping suitability for rice production in inland valley landscapes in Benin and Togo using environmental niche modeling, Sci. Total Environ., 709, 136165, https://doi.org/10.1016/j.scitotenv.2019.136165, 2020.
Asseng, S., Spänkuch, D., Hernandez-Ochoa, I. M., and Laporta, J.: The upper temperature thresholds of life, The Lancet Planetary Health, 5, e378–e385, https://doi.org/10.1016/S2542-5196(21)00079-6, 2021.
Avellan, T., Zabel, F., and Mauser, W.: The influence of input data quality in determining areas suitable for crop growth at the global scale – a comparative analysis of two soil and climate datasets, Soil Use Manage., 28, 249–265, https://doi.org/10.1111/j.1475-2743.2012.00400.x, 2012.
Balgah, R. A., Ngwa, K. A., Buchenrieder, G. R., and Kimengsi, J. N.: Impacts of Floods on Agriculture-Dependent Livelihoods in Sub-Saharan Africa: An Assessment from Multiple Geo-Ecological Zones, Land, 12, 334, https://doi.org/10.3390/land12020334, 2023.
Batjes, N. H.: Harmonized soil property values for broad-scale modelling (WISE30sec) with estimates of global soil carbon stocks, Geoderma, 269, 61–68, https://doi.org/10.1016/j.geoderma.2016.01.034, 2016.
Bevacqua, E., Zappa, G., Lehner, F., and Zscheischler, J.: Precipitation trends determine future occurrences of compound hot–dry events, Nat. Clim. Change, 12, 350–355, https://doi.org/10.1038/s41558-022-01309-5, 2022.
Bonfante, A., Monaco, E., Alfieri, S. M., De Lorenzi, F., Manna, P., Basile, A., and Bouma, J.: Chapter Two – Climate Change Effects on the Suitability of an Agricultural Area to Maize Cultivation: Application of a New Hybrid Land Evaluation System, in: Advances in Agronomy, edited by: Sparks, D. L., Academic Press, 33–69, https://doi.org/10.1016/bs.agron.2015.05.001, 2015.
Chapman, S., E Birch, C., Pope, E., Sallu, S., Bradshaw, C., Davie, J., and Marsham, J.: Impact of climate change on crop suitability in sub-Saharan Africa in parameterized and convection-permitting regional climate models, Environ. Res. Lett., 15, 094086, https://doi.org/10.1088/1748-9326/ab9daf, 2020.
Chemura, A., Gleixner, S., and Gornott, C.: Dataset of the suitability of major food crops in Africa under climate change, Sci. Data, 11, 294, https://doi.org/10.1038/s41597-024-03118-1, 2024.
Chen, D., Dai, A., and Hall, A.: The Convective-To-Total Precipitation Ratio and the “Drizzling” Bias in Climate Models, J. Geophys. Res.-Atmos., 126, e2020JD034198, https://doi.org/10.1029/2020JD034198, 2021.
Cober, E. R. and Morrison, M. J.: Regulation of seed yield and agronomic characters by photoperiod sensitivity and growth habit genes in soybean, Theor. Appl. Genet., 120, 1005–1012, https://doi.org/10.1007/s00122-009-1228-6, 2010.
Cronin, J., Zabel, F., Dessens, O., and Anandarajah, G.: Land suitability for energy crops under scenarios of climate change and land-use, GCB Bioenergy, 12, 648–665, https://doi.org/10.1111/gcbb.12697, 2020.
Daly, C., Neilson, R. P., and Phillips, D. L.: A Statistical-Topographic Model for Mapping Climatological Precipitation over Mountainous Terrain, J. Appl. Meteorol. Clim., 33, 140–158, https://doi.org/10.1175/1520-150450(1994)033<0140:ASTMFM>2.0.CO;2, 1994.
Damiani, A., Ishizaki, N. N., Sasaki, H., Feron, S., and Cordero, R. R.: Exploring super-resolution spatial downscaling of several meteorological variables and potential applications for photovoltaic power, Sci. Rep., 14, 7254, https://doi.org/10.1038/s41598-024-57759-8, 2024.
Delzeit, R., Pongratz, J., Schneider, J. M., Schuenemann, F., Mauser, W., and Zabel, F.: Forest restoration: Expanding agriculture, Science, 366, 316–317, https://doi.org/10.1126/science.aaz0705, 2019.
Deser, C., Lehner, F., Rodgers, K. B., Ault, T., Delworth, T. L., DiNezio, P. N., Fiore, A., Frankignoul, C., Fyfe, J. C., Horton, D. E., Kay, J. E., Knutti, R., Lovenduski, N. S., Marotzke, J., McKinnon, K. A., Minobe, S., Randerson, J., Screen, J. A., Simpson, I. R., and Ting, M.: Insights from Earth system model initial-condition large ensembles and future prospects, Nat. Clim. Change, 10, 277–286, https://doi.org/10.1038/s41558-020-0731-2, 2020.
Dewitte, O., Jones, A., Spaargaren, O., Breuning-Madsen, H., Brossard, M., Dampha, A., Deckers, J., Gallali, T., Hallett, S., Jones, R., Kilasara, M., Le Roux, P., Michéli, E., Montanarella, L., Thiombiano, L., Van Ranst, E., Yemefack, M., and Zougmore, R.: Harmonisation of the soil map of Africa at the continental scale, Geoderma, 211–212, 138–153, https://doi.org/10.1016/j.geoderma.2013.07.007, 2013.
Dinku, T., Funk, C., Peterson, P., Maidment, R., Tadesse, T., Gadain, H., and Ceccato, P.: Validation of the CHIRPS satellite rainfall estimates over eastern Africa, Q. J. Roy. Meteor. Soc., 144, 292–312, https://doi.org/10.1002/qj.3244, 2018.
Elsheikh, R., Mohamed Shariff, A. R. B., Amiri, F., Ahmad, N. B., Balasundram, S. K., and Soom, M. A. M.: Agriculture Land Suitability Evaluator (ALSE): A decision and planning support tool for tropical and subtropical crops, Comput. Electron. Agr., 93, 98–110, https://doi.org/10.1016/j.compag.2013.02.003, 2013.
FAO: The Ecocrop Database, FAO [data set], https://gaez.fao.org/pages/ecocrop (last access: 15 February 2025), 2024.
FAO, IIASA, ISRIC, ISSCAS, and JRC: Harmonized World Soil Database (version 1.2), 2012.
Farr, T. G., Rosen, P. A., Caro, E., Crippen, R., Duren, R., Hensley, S., Kobrick, M., Paller, M., Rodriguez, E., Roth, L., Seal, D., Shaffer, S., Shimada, J., Umland, J., Werner, M., Oskin, M., Burbank, D., and Alsdorf, D.: The Shuttle Radar Topography Mission, Rev. Geophys., 45, RG2004, https://doi.org/10.1029/2005RG000183, 2007.
Felsche, E., Böhnisch, A., Poschlod, B., and Ludwig, R.: European hot and dry summers are projected to become more frequent and expand northwards, Commun. Earth Environ., 5, 410, https://doi.org/10.1038/s43247-024-01575-5, 2024.
Fick, S. E. and Hijmans, R. J.: WorldClim 2: new 1-km spatial resolution climate surfaces for global land areas, Int. J. Climatol., 37, 4302–4315, https://doi.org/10.1002/joc.5086, 2017.
Fiddes, J., Aalstad, K., and Lehning, M.: TopoCLIM: rapid topography-based downscaling of regional climate model output in complex terrain v1.1, Geosci. Model Dev., 15, 1753–1768, https://doi.org/10.5194/gmd-15-1753-2022, 2022.
Fischer, G., Nachtergaele, F. O., van Velthuizen, H. T., Chiozza, F., Franceschini, G., Henry, M., Muchoney, D., and Tramberend, S.: Global Agro-Ecological Zones v4 – Model documentation, 1, FAO, Rome, https://doi.org/10.4060/cb4744en, 2021.
Franke, J. A., Müller, C., Minoli, S., Elliott, J., Folberth, C., Gardner, C., Hank, T., Izaurralde, R. C., Jägermeyr, J., Jones, C. D., Liu, W., Olin, S., Pugh, T. A. M., Ruane, A. C., Stephens, H., Zabel, F., and Moyer, E. J.: Agricultural breadbaskets shift poleward given adaptive farmer behavior under climate change, Glob. Change Biol., 28, 167–181, https://doi.org/10.1111/gcb.15868, 2021.
Funk, C., Peterson, P., Landsfeld, M., Pedreros, D., Verdin, J., Shukla, S., Husak, G., Rowland, J., Harrison, L., Hoell, A., and Michaelsen, J.: The climate hazards infrared precipitation with stations—a new environmental record for monitoring extremes, Sci. Data, 2, 150066, https://doi.org/10.1038/sdata.2015.66, 2015.
Funk, C., Peterson, P., Peterson, S., Shukla, S., Davenport, F., Michaelsen, J., Knapp, K. R., Landsfeld, M., Husak, G., Harrison, L., Rowland, J., Budde, M., Meiburg, A., Dinku, T., Pedreros, D., and Mata, N.: A High-Resolution 1983–2016 Tmax Climate Data Record Based on Infrared Temperatures and Stations by the Climate Hazard Center, J. Climate, 32, 5639–5658, https://doi.org/10.1175/JCLI-D-18-0698.1, 2019.
Gbode, I. E., Babalola, T. E., Diro, G. T., and Intsiful, J. D.: Assessment of ERA5 and ERA-Interim in Reproducing Mean and Extreme Climates over West Africa, Adv. Atmos. Sci., 40, 570–586, https://doi.org/10.1007/s00376-022-2161-8, 2023.
Gleixner, S., Demissie, T., and Diro, G. T.: Did ERA5 Improve Temperature and Precipitation Reanalysis over East Africa?, Atmosphere, 11, 996, https://doi.org/10.3390/atmos11090996, 2020.
Goulart, H. M. D., van der Wiel, K., Folberth, C., Balkovic, J., and van den Hurk, B.: Storylines of weather-induced crop failure events under climate change, Earth Syst. Dynam., 12, 1503–1527, https://doi.org/10.5194/esd-12-1503-2021, 2021.
Goulart, H. M. D., van der Wiel, K., Folberth, C., Boere, E., and van den Hurk, B.: Increase of Simultaneous Soybean Failures Due To Climate Change, Earth's Future, 11, e2022EF003106, https://doi.org/10.1029/2022EF003106, 2023.
Hengl, T., de Jesus, J. M., MacMillan, R. A., Batjes, N. H., Heuvelink, G. B. M., Ribeiro, E., Samuel-Rosa, A., Kempen, B., Leenaars, J. G. B., Walsh, M. G., and Gonzalez, M. R.: SoilGrids1km – Global Soil Information Based on Automated Mapping, PLOS ONE, 9, e105992, https://doi.org/10.1371/journal.pone.0105992, 2014.
Hengl, T., Mendes de Jesus, J., Heuvelink, G. B. M., Ruiperez Gonzalez, M., Kilibarda, M., Blagotić, A., Shangguan, W., Wright, M. N., Geng, X., Bauer-Marschallinger, B., Guevara, M. A., Vargas, R., MacMillan, R. A., Batjes, N. H., Leenaars, J. G. B., Ribeiro, E., Wheeler, I., Mantel, S., and Kempen, B.: SoilGrids250m: Global gridded soil information based on machine learning, PLOS ONE, 12, e0169748, https://doi.org/10.1371/journal.pone.0169748, 2017.
Hersbach, H., Bell, B., Berrisford, P., Hirahara, S., Horányi, A., Muñoz-Sabater, J., Nicolas, J., Peubey, C., Radu, R., Schepers, D., Simmons, A., Soci, C., Abdalla, S., Abellan, X., Balsamo, G., Bechtold, P., Biavati, G., Bidlot, J., Bonavita, M., De Chiara, G., Dahlgren, P., Dee, D., Diamantakis, M., Dragani, R., Flemming, J., Forbes, R., Fuentes, M., Geer, A., Haimberger, L., Healy, S., Hogan, R. J., Hólm, E., Janisková, M., Keeley, S., Laloyaux, P., Lopez, P., Lupu, C., Radnoti, G., de Rosnay, P., Rozum, I., Vamborg, F., Villaume, S., and Thépaut, J.-N.: The ERA5 global reanalysis, Q. J. Roy. Meteor. Soc., 146, 1999–2049, https://doi.org/10.1002/qj.3803, 2020.
Herzberg, R., Pham, T. G., Kappas, M., Wyss, D., and Tran, C. T. M.: Multi-Criteria Decision Analysis for the Land Evaluation of Potential Agricultural Land Use Types in a Hilly Area of Central Vietnam, Land, 8, 90, https://doi.org/10.3390/land8060090, 2019.
IFPRI: Global Spatially-Disaggregated Crop Production Statistics Data for 2020 Version 1.0, Harvard Dataverse [data set], https://doi.org/10.7910/DVN/SWPENT, 2024.
IPCC: Climate Change 2021: The Physical Science Basis. Contribution of Working Group I to the Sixth Assessment Report of the Intergovernmental Panel on Climate Change, Cambridge University Press, https://doi.org/10.1017/9781009157896, 2021.
Ivushkin, K., Bartholomeus, H., Bregt, A. K., Pulatov, A., Kempen, B., and de Sousa, L.: Global mapping of soil salinity change, Remote Sens. Environ., 231, 111260, https://doi.org/10.1016/j.rse.2019.111260, 2019.
Jägermeyr, J., Robock, A., Elliott, J., Müller, C., Xia, L., Khabarov, N., Folberth, C., Schmid, E., Liu, W., Zabel, F., Rabin, S. S., Puma, M. J., Heslin, A., Franke, J., Foster, I., Asseng, S., Bardeen, C. G., Toon, O. B., and Rosenzweig, C.: A regional nuclear conflict would compromise global food security, P. Natl. Acad. Sci. USA, 117, 7071–7081, https://doi.org/10.1073/pnas.1919049117, 2020.
Jägermeyr, J., Müller, C., Ruane, A. C., Elliott, J., Balkovic, J., Castillo, O., Faye, B., Foster, I., Folberth, C., Franke, J. A., Fuchs, K., Guarin, J. R., Heinke, J., Hoogenboom, G., Iizumi, T., Jain, A. K., Kelly, D., Khabarov, N., Lange, S., Lin, T.-S., Liu, W., Mialyk, O., Minoli, S., Moyer, E. J., Okada, M., Phillips, M., Porter, C., Rabin, S. S., Scheer, C., Schneider, J. M., Schyns, J. F., Skalsky, R., Smerald, A., Stella, T., Stephens, H., Webber, H., Zabel, F., and Rosenzweig, C.: Climate impacts on global agriculture emerge earlier in new generation of climate and crop models, Nature Food, 2, 873–885, https://doi.org/10.1038/s43016-021-00400-y, 2021.
Joswig, J. S., Wirth, C., Schuman, M. C., Kattge, J., Reu, B., Wright, I. J., Sippel, S. D., Rüger, N., Richter, R., Schaepman, M. E., van Bodegom, P. M., Cornelissen, J. H. C., Díaz, S., Hattingh, W. N., Kramer, K., Lens, F., Niinemets, Ü., Reich, P. B., Reichstein, M., Römermann, C., Schrodt, F., Anand, M., Bahn, M., Byun, C., Campetella, G., Cerabolini, B. E. L., Craine, J. M., Gonzalez-Melo, A., Gutiérrez, A. G., He, T., Higuchi, P., Jactel, H., Kraft, N. J. B., Minden, V., Onipchenko, V., Peñuelas, J., Pillar, V. D., Sosinski, Ê., Soudzilovskaia, N. A., Weiher, E., and Mahecha, M. D.: Climatic and soil factors explain the two-dimensional spectrum of global plant trait variation, Nat. Ecol. Evol., 6, 36–50, https://doi.org/10.1038/s41559-021-01616-8, 2022.
Karger, D. N., Lange, S., Hari, C., Reyer, C. P. O., Conrad, O., Zimmermann, N. E., and Frieler, K.: CHELSA-W5E5: daily 1 km meteorological forcing data for climate impact studies, Earth Syst. Sci. Data, 15, 2445–2464, https://doi.org/10.5194/essd-15-2445-2023, 2023.
Karl, K., MacCarthy, D., Porciello, J., Chimwaza, G., Fredenberg, E., Freduah, B. S., Guarin, J., Mendez Leal, E., Kozlowski, N., Narh, S., Sheikh, H., Valdivia, R., Wesley, G., Van Deynze, A., van Zonneveld, M., and Yang, M.: Opportunity Crop Profiles for the Vision for Adapted Crops and Soils (VACS) in Africa, https://doi.org/10.7916/7msa-yy32, 2024.
Knüttel, M. and Zabel, F.: CropSuite User Manual, Zenodo, https://doi.org/10.5281/zenodo.14196314, 2024a.
Knüttel, M. and Zabel, F.: CropSuite (v1.0) (1.0), Zenodo [code], https://doi.org/10.5281/zenodo.13285635, 2024b.
Lang, A. and Poschlod, B.: Updating catastrophe models to today's climate – An application of a large ensemble approach to extreme rainfall, Clim. Risk Manage., 44, 100594, https://doi.org/10.1016/j.crm.2024.100594, 2024.
Lemma, E., Upadhyaya, S., and Ramsankaran, R.: Investigating the performance of satellite and reanalysis rainfall products at monthly timescales across different rainfall regimes of Ethiopia, Int. J. Remote Sens., 40, 4019–4042, https://doi.org/10.1080/01431161.2018.1558373, 2019.
Li, S., Tompkins, A. M., Lin, E., and Ju, H.: Simulating the impact of flooding on wheat yield – Case study in East China, Agr. Forest Meteorol., 216, 221–231, https://doi.org/10.1016/j.agrformet.2015.10.014, 2016.
Maleki, F., Kazemi, H., Siahmarguee, A., and Kamkar, B.: Development of a land use suitability model for saffron (Crocus sativus L.) cultivation by multi-criteria evaluation and spatial analysis, Ecol. Eng., 106, 140–153, https://doi.org/10.1016/j.ecoleng.2017.05.050, 2017.
Marke, T., Mauser, W., Pfeiffer, A., Zängl, G., Jacob, D., and Strasser, U.: Application of a hydrometeorological model chain to investigate the effect of global boundaries and downscaling on simulated river discharge, Environ. Earth Sci., 71, 4849–4868, https://doi.org/10.1007/s12665-013-2876-z, 2014.
Meier, J., Zabel, F., and Mauser, W.: A global approach to estimate irrigated areas – a comparison between different data and statistics, Hydrol. Earth Syst. Sci., 22, 1119–1133, https://doi.org/10.5194/hess-22-1119-2018, 2018.
Molina Bacca, E. J., Stevanović, M., Bodirsky, B. L., Karstens, K., Chen, D. M.-C., Leip, D., Müller, C., Minoli, S., Heinke, J., Jägermeyr, J., Folberth, C., Iizumi, T., Jain, A. K., Liu, W., Okada, M., Smerald, A., Zabel, F., Lotze-Campen, H., and Popp, A.: Uncertainty in land-use adaptation persists despite crop model projections showing lower impacts under high warming, Commun. Earth Environ., 4, 284, https://doi.org/10.1038/s43247-023-00941-z, 2023.
Monteleone, B., Giusti, R., Magnini, A., Arosio, M., Domeneghetti, A., Borzì, I., Petruccelli, N., Castellarin, A., Bonaccorso, B., and Martina, M. L. V.: Estimations of Crop Losses Due to Flood Using Multiple Sources of Information and Models: The Case Study of the Panaro River, Water, 15, 1980, https://doi.org/10.3390/w15111980, 2023.
Müller, C., Ouédraogo, W. A., Schwarz, M., Barteit, S., and Sauerborn, R.: The effects of climate change-induced flooding on harvest failure in Burkina Faso: case study, Front. Publ. Health, 11, 1166913, https://doi.org/10.3389/fpubh.2023.1166913, 2023.
Müller, C., Jägermeyr, J., Franke, J. A., Ruane, A. C., Balkovic, J., Ciais, P., Dury, M., Falloon, P., Folberth, C., Hank, T., Hoffmann, M., Izaurralde, R. C., Jacquemin, I., Khabarov, N., Liu, W., Olin, S., Pugh, T. A. M., Wang, X., Williams, K., Zabel, F., and Elliott, J. W.: Substantial Differences in Crop Yield Sensitivities Between Models Call for Functionality-Based Model Evaluation, Earth's Future, 12, e2023EF003773, https://doi.org/10.1029/2023EF003773, 2024.
Muthoni, F. K., Odongo, V. O., Ochieng, J., Mugalavai, E. M., Mourice, S. K., Hoesche-Zeledon, I., Mwila, M., and Bekunda, M.: Long-term spatial-temporal trends and variability of rainfall over Eastern and Southern Africa, Theor. Appl. Climatol., 137, 1869–1882, https://doi.org/10.1007/s00704-018-2712-1, 2019.
Orlov, A., Jägermeyr, J., Müller, C., Daloz, A. S., Zabel, F., Minoli, S., Liu, W., Lin, T.-S., Jain, A. K., Folberth, C., Okada, M., Poschlod, B., Smerald, A., Schneider, J. M., and Sillmann, J.: Human heat stress could offset potential economic benefits of CO2 fertilization in crop production under a high-emissions scenario, One Earth, 7, 1250-1265, https://doi.org/10.1016/j.oneear.2024.06.012, 2024.
Pasley, H. R., Huber, I., Castellano, M. J., and Archontoulis, S. V.: Modeling Flood-Induced Stress in Soybeans, Front. Plant Sci., 11, 62, https://doi.org/10.3389/fpls.2020.00062, 2020.
Pelletier, J. D., Broxton, P. D., Hazenberg, P., Zeng, X., Troch, P. A., Niu, G.-Y., Williams, Z., Brunke, M. A., and Gochis, D.: A gridded global data set of soil, intact regolith, and sedimentary deposit thicknesses for regional and global land surface modeling, J. Adv. Model. Earth Sy., 8, 41–65, https://doi.org/10.1002/2015MS000526, 2016.
Peter, B. G., Messina, J. P., Lin, Z., and Snapp, S. S.: Crop climate suitability mapping on the cloud: a geovisualization application for sustainable agriculture, Sci. Rep., 10, 15487, https://doi.org/10.1038/s41598-020-72384-x, 2020.
Ramirez-Villegas, J., Jarvis, A., and Läderach, P.: Empirical approaches for assessing impacts of climate change on agriculture: The EcoCrop model and a case study with grain sorghum, Agr. Forest Meteorol., 170, 67–78, https://doi.org/10.1016/j.agrformet.2011.09.005, 2013.
Ranjitkar, S., Sujakhu, N. M., Merz, J., Kindt, R., Xu, J., Matin, M. A., Ali, M., and Zomer, R. J.: Suitability Analysis and Projected Climate Change Impact on Banana and Coffee Production Zones in Nepal, PLOS ONE, 11, e0163916, https://doi.org/10.1371/journal.pone.0163916, 2016.
Ruane, A. C., Rosenzweig, C., Asseng, S., Boote, K. J., Elliott, J., Ewert, F., Jones, J. W., Martre, P., McDermid, S. P., Müller, C., Snyder, A., and Thorburn, P. J.: An AgMIP framework for improved agricultural representation in integrated assessment models, Environ. Res. Lett., 12, 125003, https://doi.org/10.1088/1748-9326/aa8da6, 2017.
Schneider, J. M., Zabel, F., and Mauser, W.: Global inventory of suitable, cultivable and available cropland under different scenarios and policies, Sci. Data, 9, 527, https://doi.org/10.1038/s41597-022-01632-8, 2022a.
Schneider, J. M., Zabel, F., and Mauser, W.: Global inventory of suitable, cultivable and available cropland under different scenarios and policies, Sci. Data, 9, 527, https://doi.org/10.1038/s41597-022-01632-8, 2022b.
Schneider, J. M., Delzeit, R., Neumann, C., Heimann, T., Seppelt, R., Schuenemann, F., Söder, M., Mauser, W., and Zabel, F.: Effects of profit-driven cropland expansion and conservation policies, Nat. Sustain., 7, 1335–1347, https://doi.org/10.1038/s41893-024-01410-x, 2024.
Sun, Y., Solomon, S., Dai, A., and Portmann, R. W.: How Often Does It Rain?, J. Climate, 19, 916–934, https://doi.org/10.1175/jcli3672.1, 2006.
Sys, C. O., van Ranst, E., and Debaveye, J.: Land evaluation: Part II Methods in Land Evaluation, G.A.D.C, Brussels, 1991.
Sys, C. O., van Ranst, E., Debaveye, J., and Beernaert, F.: Land evaluation: Part III Crop requirements, G.A.D.C, Brussels, 1993.
Tebaldi, C., Dorheim, K., Wehner, M., and Leung, R.: Extreme metrics from large ensembles: investigating the effects of ensemble size on their estimates, Earth Syst. Dynam., 12, 1427–1501, https://doi.org/10.5194/esd-12-1427-2021, 2021.
Van Zonneveld, M., Kindt, R., McMullin, S., Achigan-Dako, E. G., N'Danikou, S., Hsieh, W.-H., Lin, Y.-R., and Dawson, I. K.: Forgotten food crops in sub-Saharan Africa for healthy diets in a changing climate, P. Natl. Acad. Sci. USA, 120, e2205794120, https://doi.org/10.1073/pnas.2205794120, 2023.
Verdin, A., Funk, C., Peterson, P., Landsfeld, M., Tuholske, C., and Grace, K.: Development and validation of the CHIRTS-daily quasi-global high-resolution daily temperature data set, Sci. Data, 7, 303, https://doi.org/10.1038/s41597-020-00643-7, 2020.
Vogel, E., Donat, M. G., Alexander, L. V., Meinshausen, M., Ray, D. K., Karoly, D., Meinshausen, N., and Frieler, K.: The effects of climate extremes on global agricultural yields, Environ. Res. Lett., 14, 054010, https://doi.org/10.1088/1748-9326/ab154b, 2019.
Wang, F., Tian, D., Lowe, L., Kalin, L., and Lehrter, J.: Deep Learning for Daily Precipitation and Temperature Downscaling, Water Resour. Res., 57, e2020WR029308, https://doi.org/10.1029/2020WR029308, 2021.
Yu, Q., You, L., Wood-Sichra, U., Ru, Y., Joglekar, A. K. B., Fritz, S., Xiong, W., Lu, M., Wu, W., and Yang, P.: A cultivated planet in 2010 – Part 2: The global gridded agricultural-production maps, Earth Syst. Sci. Data, 12, 3545–3572, https://doi.org/10.5194/essd-12-3545-2020, 2020.
Zabel, F.: Global Agricultural Land Resources – A High Resolution Suitability Evaluation and Its Perspectives until 2100 under Climate Change Conditions (v3.0), Zenodo [data set], https://doi.org/10.5281/zenodo.13285541, 2022.
Zabel, F., Putzenlechner, B., and Mauser, W.: Global Agricultural Land Resources – A High Resolution Suitability Evaluation and Its Perspectives until 2100 under Climate Change Conditions, PLoS ONE, 9, e107522–e107522, https://doi.org/10.1371/journal.pone.0107522, 2014.
Zabel, F., Knüttel, M., and Poschlod, B.: CropSuite – Crop suitability assessment for 48 crops under rainfed and irrigated conditions for Africa (1.0), Zenodo [data set], https://doi.org/10.5281/zenodo.13285541, 2024.
Zadeh, L. A.: Fuzzy sets, Information and Control, 8, 338–353, https://doi.org/10.1016/S0019-9958(65)90241-X, 1965.