the Creative Commons Attribution 4.0 License.
the Creative Commons Attribution 4.0 License.
Lambda-PFLOTRAN 1.0: a workflow for incorporating organic matter chemistry informed by ultra high resolution mass spectrometry into biogeochemical modeling
Katherine A. Muller
Peishi Jiang
Glenn Hammond
Tasneem Ahmadullah
Hyun-Seob Song
Ravi Kukkadapu
Nicholas Ward
Madison Bowe
Rosalie K. Chu
Qian Zhao
Vanessa A. Garayburu-Caruso
Alan Roebuck
Xingyuan Chen
Organic matter (OM) composition plays a central role in microbial respiration of dissolved organic matter and subsequent biogeochemical reactions. Here, a direct connection of organic matter chemistry and thermodynamics to reactive transport simulators has been achieved through the newly developed Lambda-PFLOTRAN workflow tool that succinctly incorporates carbon chemistry data generated from Fourier transform ion cyclotron resonance mass spectrometry (FTICR-MS) into reaction networks to simulate organic matter degradation and the resulting biogeochemistry. Lambda-PFLOTRAN is a Python-based workflow, executed through a Jupyter notebook interface, that digests raw FTICR-MS data, develops a representative reaction network based on substrate-explicit thermodynamic modeling (also termed lambda modeling due to its key thermodynamic parameter λ used therein), and completes a biogeochemical simulation with the open source, reactive flow and transport code PFLOTRAN. The workflow consists of the following five steps: configuration, thermodynamic (lambda) analysis, sensitivity analysis, parameter estimation, and simulation output and visualization. Two test cases are provided to demonstrate the functionality of the Lambda-PFLOTRAN workflow. The first test case uses laboratory incubation data of temporal oxygen depletion to fit lambda parameters (i.e., maximum utilization rate and microbial carrying capacity). A slightly more complex second test case fits multiple lambda formulation and soil organic matter release parameters to temporal greenhouse gas generation measured during a soil incubation. Overall, the Lambda-PFLOTRAN workflow facilitates upscaling by using molecular-scale characterization to inform biogeochemical processes occurring at larger scales.
- Article
(2616 KB) - Full-text XML
-
Supplement
(615 KB) - BibTeX
- EndNote
Microbial respiration of dissolved organic carbon (DOC) is a main driver of environmental biogeochemical processes. Mechanistic biogeochemical models often rely on lumping organic matter into a few distinct carbon pools (e.g., dissolved, sorbed, mineral-associated or refractory, labile) (e.g., Fatichi et al., 2019; Robertson et al., 2019; Wang et al., 2013) but do not fully consider the properties of the organic matter (OM) compounds individually. Pooled carbon approaches have benefits, such as assigning variable levels of bioavailability. However, this approach does not capture the complex temporal dynamics of respiration driven by OM composition, as aerobic respiration rates have been linked to organic carbon concentration, thermodynamics of the OM (Stegen et al., 2018; Garayburu-Caruso et al., 2020), and the diversity of OM compounds present (Lehmann et al., 2020; Stegen et al., 2023). Such findings highlight the importance of incorporating individual OM chemistry into biogeochemical modeling to capture, and ultimately predict, system behavior more accurately.
There are many advanced instrumentation techniques capable of detecting and identifying individual OM formulas that comprise a bulk OM sample (e.g., GC-MS, HPLC-MS, FTICR-MS). For instance, FTICR-MS is a powerful, high resolution method that identifies molecular formulas for individual organic compounds. In any given environmental sample, FTICR-MS (or other ultra high resolution methods) will typically resolve thousands of discrete OM molecular formulas, each with a unique mass and elemental composition (Cooper et al., 2022; Bahureksa et al., 2021). However, untargeted analytical techniques like FTICR-MS are only able to determine whether a compound is present and cannot quantify the total concentration associated with each OM molecule. Still, such techniques do provide immense amounts of characterization data encompassing a deeper analytical window than when measuring a small number of individual biomarkers quantitatively (e.g., Ward et al., 2013). Utilizing such high resolution molecular data in reactive transport modeling frameworks affords a new opportunity to advance carbon cycling in terrestrial, riverine, and coastal systems despite various theoretical and computational challenges.
Substrate-explicit thermodynamic modeling (SXTM) provides an avenue for incorporating individual OM reactivity based on thermodynamics (Song et al., 2020) into reactive transport models. The SXTM procedure takes the individual chemical formula derived from FTICR-MS (or another high resolution technique) and uses its thermodynamic properties to generate an oxidation reaction for each molecular formula present in a sample. The corresponding reaction stoichiometry is then determined by considering catabolic, anabolic, and metabolic reactions and balancing the energy for the overall metabolic reaction, allowing for the development of an aerobic respiration expression for each OM formula.
Still, the sheer number of compounds identified in each sample proves difficult for model integration. Typically, reactive transport simulators consider only a small number of primary species in their reaction networks, and most could not support modeling each of the thousands of organic matter molecules individually. Here, the developed Lambda-PFLOTRAN workflow addresses this challenge by grouping, or binning, similar compounds based on their thermodynamic properties, allowing for the number of species considered within the reaction network to be reduced and thus decreasing the required computational resources.
Lambda-PFLOTRAN is a Python-based workflow that digests raw FTICR-MS data, develops a representative reaction network based on substrate-explicit thermodynamic modeling (Song et al., 2020), and completes a biogeochemical simulation with the open source, parallel reactive flow and transport code PFLOTRAN (Hammond et al., 2014). PFLOTRAN is developed using an open-source GNU LGPL license. The term “lambda” is used here because λ is a key parameter in the SXTM that quantifies the thermodynamic favorability of aerobic respiration of OM. The connection between the unique reaction network developed for each FTICR-MS sample hinges on the use of PFLOTRAN's reaction sandbox capability (Hammond, 2022). The reaction sandbox gives the ability to define additional custom, kinetic reactions beyond standard formulations (e.g., mineral precipitation–dissolution, Michaelis–Menten). The Lambda-PFLOTRAN workflow enables upscaling by using molecular-scale information to inform larger-scale biogeochemical processes occurring throughout a watershed, which can be simulated with PFLOTRAN. Herein we describe the Lambda-PFLOTRAN workflow process, including the governing expressions, workflow steps, data requirements, and associated assumptions and limitations. Two illustrative test cases are also included to demonstrate the workflow.
2.1 Conceptual model
The respiration modeling herein is based on the thermodynamic theory of Desmond-Le Quéméner and Bouchez (2014), which was updated for multiple OM formulas by Song et al. (2020). The generalized form of OM molecules is assumed to take the form of CaHbNcOdPeS. Each molecular formula then undergoes respiration (i.e., reaction with oxygen) based on the following general reaction expression:
This generalized expression is used to describe the oxidation of any OM molecule, i, and has been normalized to 1 mole of biomass (BM) produced. BM is assumed to have a formula of CH1.8O0.5N0.2 (Stephanopoulos et al., 1998; Kleerebezem and Van Loosdrecht, 2010). OMi represents the OM molecules as informed by FTICR-MS. Each y represents the reaction stoichiometry for that reactant (y<0) or product (y>0). While this expression is specific to cases where oxygen is the electron acceptor, such an expression could be updated for alternative electron acceptors.
Substrate-explicit thermodynamic modeling expressions developed by Song et al. (2020) were implemented in a reaction sandbox within PFLOTRAN. The expressions were implemented in a general manner, allowing for flexibility in handling variations in FTICR-MS data and several user-adjustable analysis configurations.
The microbial growth kinetics are described by Eq. (2):
where is the unregulated uptake rate of reaction for OMi [h−1], μmax is the maximal microbial growth rate [h−1], yOM,i is the stoichiometry for OMi [mol-OM mol-biomass−1], and Vh is the microbial harvest volume [m3]. [OMi] is the organic matter concentration of OMi [mol-OM L−1], is the stoichiometry for O2 for respiration of OMi [mol-O2 mol-biomass−1], [O2] is the oxygen concentration [mol-O2 L−1], α is a microbial unit conversion [mol-biomass], and 1000 is the conversion of cubic meters to liters. Given the physical interpretation of Vh as the microbial harvest volume, it is assumed here that the value of Vh is the same for both OMi and O2.
Further, using a cybernetic modeling approach (following Song et al., 2020), all the unregulated uptake rates () are normalized by the sum of the unregulated uptake rates across all the reactions, i, following Eq. (3):
where ui is the fraction of the unregulated rate [–]. The final regulated rate ri [h−1] for each reaction is then computed following Eq. (4):
For implementation within PFLOTRAN, the use of inhibition terms was required to prevent negative concentrations once a reactant is nearly depleted. For a reaction to proceed, all reactant species must be present above a minimum concentration, even if the reactants do not explicitly control the respiration rate (i.e., species other than OM and O2; Eq. 2). If a reactant concentration falls below a threshold concentration, the respiration rate is inhibited. Reactant inhibition is computed by Eq. (5) (Kinzelbach et al., 1991) for reactant species j:
where Cth,i is the threshold concentration [M] and f is the threshold scaling factor [–]. The default value is 10−20 M.
The reaction rates are also inhibited by the microbial carrying capacity of the system, Icc, as follows in Eq. (6):
where [BM] is the biomass concentration [mol-BM L−1] and CC is the biomass carrying capacity [mol-BM L−1]. Icc has a non-negativity constraint, so if [BM] > CC, then Icc=0.
These inhibition factors are applied to the overall rate expression as shown in Eq. (7):
The overall individual species rates, [mol-species L−1 h−1], are then computed as follows with Eq. (8):
where j is the species index. The total number of species includes seven general species (i.e., HCO, NH, HPO, HS−, H+, O2, and BM in Eq. 1) and the OM species considered (i.e., typically 10). i is the reaction index, and n is the total number of reactions as based on the total number of OM species (typically with this workflow n=10). yi,j is the stoichiometric coefficient for species j in reaction i.
The expression for biomass is also modified to account for biomass decay (note that all biomass stoichiometries are 1 by definition):
where kdeg is the biomass decay rate [h−1].
2.2 Lambda analysis and binning
To reduce the number of organic compounds considered in the simulation, OM molecules are grouped, or binned, based on their λ value computed by Eq. (10):
where ΔG are the Gibbs energies for the anabolic and catabolic reactions and the associated dissipation energy, respectively. The value of λ is indicative of how many times the catabolic reaction needs to be completed to provide the energy required to synthesize 1 mole of biomass. Lower λ values suggest higher thermodynamic favorability of OM respiration. Using the chemical formula determined for each OM molecule, the energy balance equations are solved, providing the overall reaction stoichiometry Eq. (1), and the λ is calculated. Using the λ value for each molecule, the cumulative probability distribution for the sample is produced (Fig. 2).
It is this conversion from individual compounds to a distribution that is critical for reducing the entire sample to a representative set of expressions. The λ bins are then formed by splitting the cumulative probability distribution into equally weighted sections by which to define the overall sample. The illustrative example shown in Fig. 2 demonstrates the sample distribution being divided into 10 sections (i.e., in this case each section contains 10 % of the overall sample distribution).
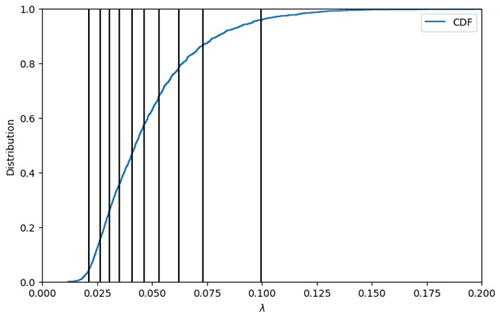
Figure 2Lambda binning to convert raw FTICR-MS into a representative reaction network using the cumulative distribution function (CDF) for Test Case 1a. The vertical lines display the average λ value for each of the 10 bins (left to right: λ bins 1 to 10).
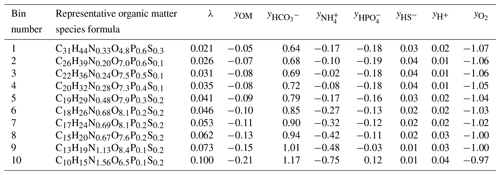
Each section is used to determine a representative organic matter formula and the associated reaction and stoichiometry of that λ bin. The group of representative reactions (one per bin) is called the reaction network. A demonstrative reaction network defined by λ analysis and binning is shown in Table 1.
Currently, the representative OM molecule that defines each bin is computed as the average chemical formula of all the molecules present in that λ section. The disadvantage of this approach is that unrealistic compounds are defined as representative molecules instead of realistic molecules. The issue with selecting a single but real compound from within each λ section resides in chemical complexity and variation – for instance, some molecules may contain low levels of phosphorous or sulfur and others may not contain either element in the chemical formula. Thus, requiring the representative chemical formula to be a real compound present in the sample would create a bias which would propagate through the reaction network and into the resulting biogeochemical simulation results.
2.3 Lambda-PFLOTRAN workflow
The Lambda-PFLOTRAN workflow digests raw FTICR-MS data, calculates the λ distribution for the sample, generates the λ bins and the corresponding reaction network, and completes a biogeochemical simulation using PFLOTRAN. Further, we incorporated sensitivity analysis and ensemble data assimilation to enable an in-depth exploration of the impact of reaction parameters on respiration as well as a straightforward parameter estimation method to fit model parameters to experimental data.
The workflow is implemented through a user-friendly Jupyter notebook interface (Kluyver et al., 2016), where a user can configure the simulation parameters by adjusting initial concentrations, the λ binning configuration, parameter values and/or ranges, and data assimilation options. Based on the user's data file and the associated parameters, scripts within the Jupyter notebook write the corresponding PFLOTRAN input files, including the OM molecules and aqueous chemistry. The PFLOTRAN simulations are completed locally through a Docker container, making this capability much more user-friendly and accessible. The progress of the data assimilation tool used for parameter fitting is illustrated in the Jupyter notebook. The resulting best-fit final biogeochemical simulation is output visually with plots and as a text file (when applicable).
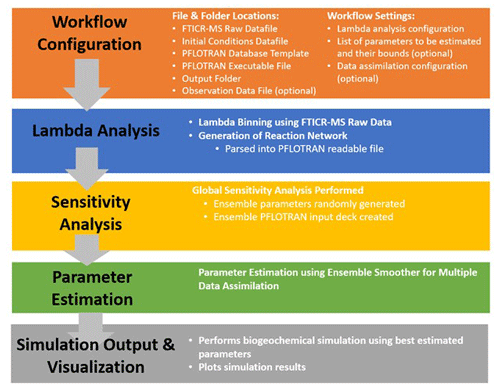
The Lambda-PFLOTRAN workflow steps are shown in Fig. 1 and described in detail in the following subsections.
2.3.1 Step 1 – workflow configuration
The first step is to set up the workflow configuration for a Lambda-PFLTORAN application. This includes specifying the file and folder locations of the following information: (1) a FTICR-MS raw data file (.csv); (2) an initial species concentration file (.csv) that includes the starting molar concentrations for HCO, NH, HPO, HS−, H+, O2, BM, and total organic carbon (TOC); (3) a PFLOTRAN database template file; (4) a PFLOTRAN executable file; (5) a workflow output folder; and, when completing parameter estimation, (6) the data observation file (.csv) if applicable.
The user is also asked to configure the workflow settings related to (1) the Lambda analysis configuration, including the number of λ bins and the method to define the λ bins (i.e., cumulative vs. uniform); (2) the respiration modeling parameter setup, including the list of parameters to be estimated and their associated upper and lower bounds; and (3) the data assimilation configuration (see below).
2.3.2 Step 2 – organic matter chemistry using Lambda analysis
With only an input of FTICR-MS data, the workflow first performs the Lambda analysis (Sect. 2.2) to group OM molecules into various λ bins based on each compound's thermodynamics (Fig. 2) and to produce the corresponding reaction network for respiration (Table 1). The default number of λ bins is 10, although this can be adjusted in the workflow configuration by the user if desired. The generated reaction network is then automatically parsed by the workflow into a text file that can be read by PFLOTRAN.
2.3.3 Step 3 – sensitivity analysis using mutual information
This step performs the global sensitivity analysis of the parameters to be estimated. Ensemble parameters are first generated by randomly sampling them from their predefined ranges in the configuration step and saving them into an HDF5 file. Then, the workflow generates a PFLOTRAN input deck to conduct ensemble simulations using the ensemble parameters. The generated ensemble model states enable a global sensitivity analysis using mutual information (Cover and Thomas, 2006; Jiang et al., 2022) as follows:
where x and y are the specific values of X and Y, respectively; H(Y) is the Shannon entropy of Y; H(Y|X) is the conditional entropy of Y given X; and p is the probability density function. Higher I values indicate higher sensitivity between X and Y. Besides sensitivity analysis, the ensemble parameter and states also serve as the prior information for parameter estimation at the next step.
2.3.4 Step 4 – parameter estimation using an ensemble smoother for multiple data assimilation
The workflow adopts an ensemble smoother for multiple data assimilation (Emerick and Reynolds, 2013; Jiang et al, 2021), abbreviated as ESMDA, for data assimilation in this step. Rooted in an ensemble Kalman filter, ESMDA is an iterative data assimilation approach that assimilates observations of the entire time period multiple times to reduce the uncertainty of the estimated or posterior parameters. During each iteration of ESMDA, the model parameters are updated based on the following equation:
where the subscripts k and l are the indices of the ensemble member and the iteration, respectively; the superscripts “u” and “f” are the updated and forecast parameters or states, respectively; Ne is the number of ensemble members; L is the number of iterations; and are the kth ensemble member of the forecast or prior and updated or posterior parameters, respectively, at the lth iteration; dobs is the observation; zk is the observation noise sampled from independent standard normal distributions for the kth ensemble member; is the kth ensemble member of the predicted observation states by the model using ; is the cross-covariance matrix between the prior parameters and the predicted observation state ; is the auto-covariance matrix of the predicted observation states ; CD is the auto-covariance matrix of the observation error; and αl is the inflation coefficient at the lth iteration with the sum of all αl values equal to 1.
Here, the assimilation starts by taking the ensemble model parameters/states in Step 3 as well as the provided observations and calculating the posterior parameters using the ensemble Kalman filter, updating the prior parameters with the current posterior for the next iteration, and then repeating the whole process multiple times (typically three to five iterations, as defined by the user). The final estimated parameters are obtained from the posterior parameter at the last iteration and are updated in the HDF5 parameter file. The parameter estimation is implemented in a way that allows assimilation of either a single species (e.g., Test Case 1) or multiple observed species simultaneously through a simple change in the inputs. For example, if temporal experimental or field data are available for oxygen, pH, and total carbon, all of these data sources could be fitted simultaneously, with only minor adjustments to the Jupyter notebook.
2.3.5 Step 5 – simulation output and visualization
The last step performs the ensemble simulation of the biogeochemical modeling a final time using the estimated parameters in Step 4. Optionally, users can further pick the realization with the best performance. The user has the option of selecting their preferred goodness-of-fit metric from the following options as a means of selecting the best-performing simulation: R squared (R2), root mean squared error (RMSE), modified Kling–Gupta efficiency (mKGE), Nash–Sutcliffe model efficiency coefficient (NSE), or correlation coefficient (CorC). Based on the selection, the final time series of aqueous chemistry, oxygen consumption, CO2 production, λ-binned, and total organic carbon concentrations will be computed and plotted.
3.1 Test Case 1 – oxygen-depleted incubation experiments
In the first illustrative example, the workflow was used to fit μmax to laboratory incubation experiments where oxygen levels were measured over 2 h in a closed reactor. The incubation experiments were completed as part of the Worldwide Hydrobiogeochemistry Observation Network for Dynamic River Systems (WHONDRS) program (Goldman et al., 2020). For these incubations, sediment was taken from three locations within a stream, i.e., upstream (Test Case 1a), midstream (Test Case 1b), and downstream (Test Case 1c), in the Yakima River basin in Washington, USA, for subsequent laboratory respiration experiments. FTICR-MS was used to determine the OM chemistry from each sediment sample, resulting in variable formulas being identified in each sample. Formula assignments for all the samples included herein were completed using Formultitude (Tolic et al., 2017). Total dissolved organic carbon concentration paired with the FTICR-MS sample and biomass measurements taken at the start of each experiment were used as the initial concentrations for each of the simulations. Due to the absence of quantitative data related to how the total carbon mass is distributed between the various OM compounds, the total carbon concentration (on a per-C basis) was assumed to be split equally between each of the λ bins. The total organic carbon concentration was distributed into each λ bin using Eq. (13). While this assumption results in an equal distribution of carbon between the bins, consequently it assigns different initial species concentrations due to varying carbon concentrations between the molecules:
where [Cλbin]0 is the initial species concentration in each λ bin [mol L−1]; TOC is the total organic carbon measured [mol-carbon L−1]; nλbin is the number of λ bins [–]; and nCλbin is the number of carbon molecules in the assumed formula for the λ bins [mol-carbon mol-molecule−1].
Using the Lambda-PFLOTRAN workflow, the FTICR-MS data from each laboratory experiment were digested into the corresponding λ bins to create the individual reaction network. The Jupyter notebook for this example is “Test_Case1-WHONDRS.ipynb” and is available at https://doi.org/10.15485/2281403 (Muller et al., 2024).
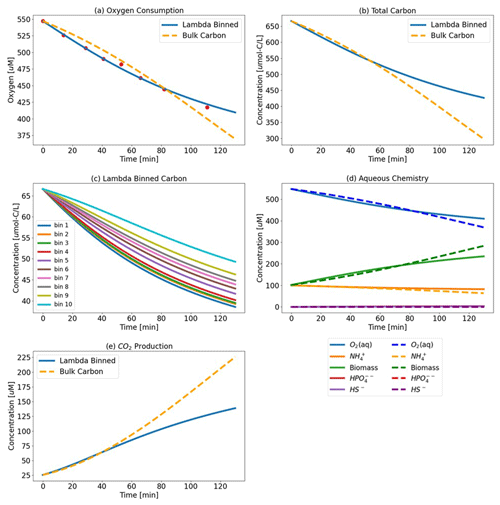
Figure 3Test Case 1a results – (a) oxygen consumption where the Lambda-PFLOTRAN workflow was used to fit the (blue line) experimental respiration data (red dots) and (b) the total carbon consumption. (c) Individual organic matter consumption by λ bin and (d) biogeochemistry, including O2 (aq) (blue), biomass (green), NH (orange), HS− (purple), and HPO (red). (e) CO2 production for the upstream incubation. The dashed orange lines (a, b, and e) show the simulation results assuming a generic OM species of CH2O for comparison.
μmax was fitted to the provided experimental oxygen data. The final λ-binned fit, along with the corresponding carbon consumption (individual and total) and aqueous chemistry, is displayed in Fig. 3 (and in Figs. S1 and S2 in the Supplement for Test Cases 1b (midstream) and 1c (downstream), respectively). To evaluate the use of λ-binned OM obtained from FTICR-MS (Fig. 3), the workflow was also run for a baseline case where μmax was fitted again but this time assuming a generic bulk OM form of CH2O for comparison. The reaction network developed for a generic OM molecule of CH2O is shown in Eq. (14).
This reaction network is used in the Lambda-PFLOTRAN workflow for bulk OM simulations.
The fitted μmax value for the λ-binned model is 0.25 min−1 (R2=0.99), and the μmax value fitted to the bulk OM CH2O model is 0.032 min−1 (R2=0.96). Vh and CC are fixed at assumed values of 10 m3 and 1 M, respectively, in both simulations.
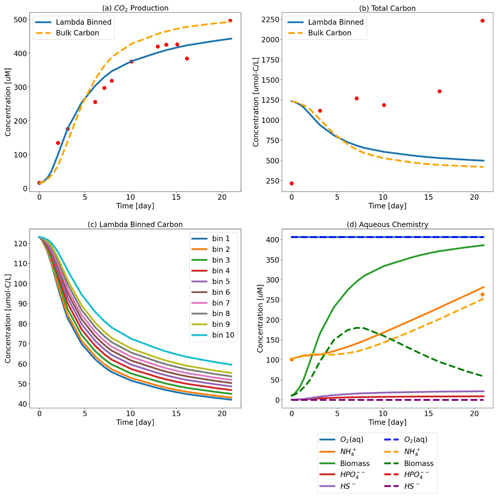
Figure 4Test Case 2 results – (a) CO2 production where the Lambda-PFLOTRAN workflow was used to fit (blue line) experimental respiration data (red dots) and (b) the corresponding total organic carbon. (c) Individual organic matter consumption by λ bin. (d) The corresponding biogeochemistry, including O2 (aq) (blue), biomass (green), NH (orange), HS− (purple), and HPO (red). The dots indicate the experimental data. The dashed orange lines in the top two panels show simulation results assuming a generic OM species of CH2O for comparison. The fitted parameters for the λ-binned model are d−1, μmax=37.6 d−1, Vh=5.0 m3, CC = 0.12 M, and d−1 (R2=0.953), and the fitted bulk OM CH2O model values are d−1, μmax=47 d−1, Vh=1.0 m3, CC = 0.77 M, and kdeg=0.15 d−1 (R2=0.909).
However, even over the short time frame of this simulation (i.e., only 120 min), the difference between assuming the generic CH2O and using the more detailed organic matter chemistry resulted in different predictions of total carbon and CO2 generation. The bulk OM model predicts more carbon consumption and greater CO2 production than the λ-binned model. The bulk OM model estimates that 50 % of the initial total carbon is consumed over the first 120 min, whereas the λ-binned model predicts 34 % consumption. Similarly, the bulk OM model estimates approximately 35 % more CO2 generation as compared to the λ-binned model. The effects on aqueous chemistry over this short duration are more muted, albeit still present.
3.2 Test Case 2 – respiration incubation experiments
Test Case 2 uses soil respiration incubation data from Ward et al. (2023) aimed at investigating the influence of soil type, oxygen condition (aerobic vs. anaerobic), and seawater exposure (fresh vs. saline) on respiration extent and rate. For these experiments, temporal measurements were collected for CO2 generation, DOC, organic matter formulas via FTICR-MS, and other bulk aqueous chemistry (i.e., pH, NH, and other metals and ions), creating a rich dataset for calibration of system-specific lambda model parameters. These incubations were set up by adding dry soil to the reactor and then adding water (resulting in a soil : water ratio ranging from 1:11 to 1:16). The soil and water were shaken vigorously for 5 min and then sampled for the initial time point prior to officially starting the incubation. For the aerobic experiments, the reactor headspace was cycled every 24 h to measure the CO2 generated but also to ensure that the system was kept aerobic. This was only performed 5 d per week, with no measurements taken on the weekend due to logistical constraints. Upon experiment completion, the increase in DOC concentrations indicated that organic carbon was being kinetically released from the soil into the aqueous phase over the course of the 21 d experiment. Similarly, measured NH concentrations also increased during the experiment. To address this within our reactive transport model, a source of nitrogen was assumed to be released from the soil as well (Nrelease). Both carbon and nitrogen releases are included in this example and are assumed to follow a zero-order constant release rate. Any organic carbon released from the soil was fractionated into each λ bin on the same per-carbon basis assumed for the initial total organic carbon. This was implemented through a dependent function that calculated the release of carbon into each λ bin based on a fitted single bulk krelease rate. Mathematically, in PFLOTRAN the constant oxygen conditions were implemented through a gas–liquid partitioning expression with a fast exchange term. These three additional processes were added to describe the experimental conditions of Test Case 2 more accurately (i.e., release of carbon, nitrogen, and sustained aerobic conditions). However, a PFLOTRAN input deck can be expanded and customized to include a host of additional processes and full geochemistry for a specific system of interest. For instance, aqueous complexation, mineral dissolution and precipitation, sorption, and redox reactions can be added, all of which can influence the resultant pH and carbon, nitrogen, and other nutrient dynamics.
The workflow was used to fit μmax, Vh, CC, kdeg, and krelease to the temporal CO2 generation for a single aerobic soil incubation (Fig. 4). The Jupyter notebook for this example is “Test_Case2-Colloids.ipynb”.
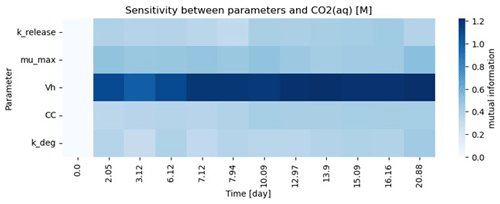
For the purposes for showcasing the workflow, five parameters were estimated in this test case example, and as a result the models are overparameterized given the amount of data available. Parameter sensitivity over the course of the simulation time is shown in Fig. 5 and suggests that this system is highly sensitive to Vh. It should be noted that both these model fits are also highly sensitive to the allowable parameter space as defined by the lower and upper parameter bounds. In general, parameterization efforts are inherently challenging. For Lambda-PFLOTRAN, which models microbially mediated processes, we recommend initially focusing on constraining the biomass parameters (i.e., CC, kdeg, and Vh) by measuring temporal changes in the biomass concentrations. Further, Vh and μmax are typically highly sensitive and often correlated. However, since Vh represents the theoretical volume accessible to microbes and cannot be measured directly, we suggest fixing Vh within the range 1–10 m3. If these microbial parameters can be constrained adequately, the focus can shift to μmax, the maximum microbial growth rate, which significantly influences the overall respiration and is expected to exhibit the highest variability across different locations and conditions.
Any additional experimental data, collected either during incubations or through independent experiments (e.g., carbon release from the soil in an abiotic system), would be expected to help constrain the model and improve the parameterization. Additionally, it is unclear why the model is unable to capture the total organic carbon behavior in Test Case 2. One potential explanation is that some of the released organic carbon may not be fully bioavailable and thus the model may be compensating for this by artificially reducing the concentration of OM available for respiration.
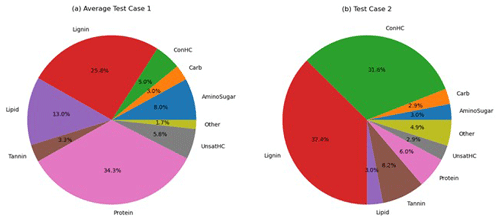
The variability in OM speciation was briefly assessed by comparing FTICR-MS data from Test Cases 1 and 2. Each identified OM species was classified into one of nine compound classes. For Test Case 1, the average of the three Test Case 1 samples (1a – upstream, 1b – midstream, and 1c – downstream) was computed. The predominant classes were proteins (34±1 %), lignin (26±1 %), and lipids (13±2 %), with the errors representing the standard deviation among the Test Case 1a–c samples. The low standard deviation suggests consistent reproducibility in OM speciation for samples taken from nearby locations. In contrast, OM in Test Case 2 was primarily composed of lignin (37.4 %) and concentrated hydrocarbons (32 %). The full distribution of the compound classes is presented in Fig. 6.
The influence of the sample OM speciation on the λ-binned reaction networks was also assessed. Figure 7 illustrates the impact of OM speciation on the corresponding λ-binned reaction networks, with three key observations. First, the variability in OM speciation between the different samples is evident when comparing Test Case 1 and Test Case 2. To enhance visual clarity, the range of the Test Case 1 samples (1a–c) is depicted as a grey-shaded region showing the spread between the minimum and maximum values of the three samples. For Test Case 2, data from the single FTICR-MS sample are represented by blue dots. Test Case 1 and Test Case 2 have distinct λ-derived reaction networks, as indicated by the little overlap between the grey region and the blue dots in Fig. 7b–i.
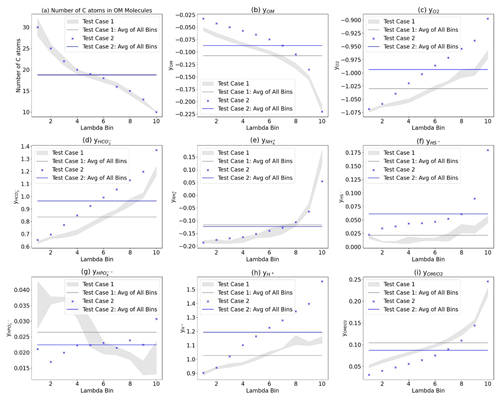
Figure 7Comparison of the λ-binned reaction network parameters. (a) Number of carbons in the OM. Stoichiometric coefficient y for (b) OM, (c) O2, (d) HCO, (e) NH, (f) HS−, (g) HPO, and (h) H+. (i) Ratio of the coefficients for Test Cases 1a–c (grey dots), the average of all λ bins for Test Case 1 (grey line) and Test Case 2 (blue “x”), and the average of all λ bins for Test Case 2 (blue line). The grey-shaded area highlights the range of values for Test Cases 1a–c for better visual comparison.
Second, the λ-binning process captures the OM speciation variation within a sample. To illustrate this intrasample variability, a line representing the average of all the λ bins is shown in Fig. 7 (grey line for Test Case 1, blue line for Test Case 2). The difference between the reaction network coefficients (vertical axis) for the λ binning (grey-shaded area and blue dots) and the test case average lines highlights the extent of this variability. Finally, although the λ-binning process resulted in a similar number of carbon atoms to OM molecules within each λ bin for both test cases (Fig. 7a), the resulting stoichiometric coefficients in the reaction networks differ significantly (Fig. 7b–h). These stoichiometric differences lead to variations in biogeochemical outcomes, such as OM-to-oxygen utilization ratios during aerobic respiration (Fig. 7i). These differences are due to the additional elements beyond carbon in the OM molecules (i.e., nitrogen, oxygen, sulfur, hydrogen, and phosphorus).
To further assess and isolate the effect of OM speciation, extended forward simulations were performed by only varying FTICR-MS input data (Fig. 8). FTICR-MS samples from Test Cases 1a–c and Test Case 2 were tested. These simulations replicate Fig. 3 (i.e., Test Case 1a conditions and fitted μmax values) with the expectation of OM speciation and demonstrate the significant impact of OM chemistry and speciation on the overall predicted behavior, especially over longer time periods.
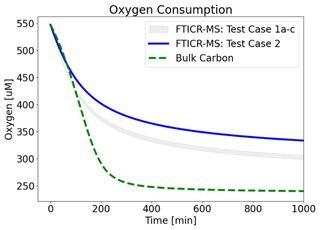
Figure 8Influence of OM speciation on oxygen consumption. FTICR-MS data from Test Cases 1a–c (grey-shaded area) and Test Case 2 (blue line) were used as inputs. Bulk CH2O OM (green line) was also plotted for reference. Best-fit μmax values for Test Case 1a were used (i.e., λ-binned μmax=0.25 min−1; bulk OM μmax=0.032 min−1).
The clear variability in OM speciation, differences between a generic OM reaction network and one informed by FTICR-MS, and the impact of OM chemistry on biogeochemical predictive simulations underscore the importance of incorporating site-specific OM chemistry informed by ultra high resolution characterization into biogeochemical models.
Overall, the Lambda-PFLOTRAN workflow provides an important link between molecular-scale organic matter characterization and reactive transport simulations. This workflow allows for the influence of organic matter composition to be utilized within simulators to provide a more comprehensive understanding of the system chemistry and behavior, moving beyond the standard assumption of bulk organic matter chemistry and composition. While there are current limitations due to how composition is characterized and quantified, this workflow connecting characterization information to simulations is an important advancement that can be refined as these laboratory techniques improve over time.
One of the major limitations surrounding this method is the lack of understanding of organic matter compound bioavailability, resulting in a large conceptual gap as to how various organic carbon compounds may be utilized by microbes. In the absence of such information, all identified organic matter molecules are assumed to have equal bioavailability within this modeling framework when, in reality, compounds will exhibit varying degrees of bioavailability depending on factors such as the associated size fraction, carbon pool, and environmental factors (Schmidt et al., 2011; Ahamed et al., 2023). Until improved understanding is established to discern individual compound bioavailability, this will remain a limitation.
Another limitation of this method involves the analytical limitations of organic carbon characterization and quantification. For instance, FTICR-MS focuses on water-soluble organic matter, which may provide a basis for the types of carbon identified by this technique (Tfaily et al., 2017). Additionally, as mentioned previously, FTICR-MS is qualitative. It does not provide structural information and will not differentiate between different isomers that have the same molecular formulas, and it is only able to identify whether a molecular formula is present or absent and not the concentration associated with each peak. Here, this has been addressed by assuming an equal distribution of total carbon between the formulas within each λ bin on a per-carbon basis. This caveat can easily be updated in the workflow if new analytical advances are made that provide more quantitative information. Some existing approaches could be suitable for this type of modeling, such as using quantitative biomarkers that cover major compound classes (Kim and Blair, 2023), but further advances in obtaining both high resolution and quantitative OM characterization would greatly aid our understanding and modeling of ecosystems.
The source code, installation requirements, example test case notebooks, and associated data are available in ESS DIVE at https://doi.org/10.15485/2281403 (Muller et al., 2024).
The supplement related to this article is available online at: https://doi.org/10.5194/gmd-17-8955-2024-supplement.
KAM: conceptualization, formal analysis, methodology, software, writing – original draft preparation. PJ: methodology, software, writing – original draft preparation. GH: methodology, software, writing – review and editing. TA: data curation, software, writing – review and editing. HSS: methodology, writing – review and editing. RK: supervision. NW: supervision, writing – review and editing. MB: investigation. RKC: investigation. QZ: investigation. VAGC: investigation, data curation. AR: investigation. XC: conceptualization, investigation, writing – review and editing.
The contact author has declared that none of the authors has any competing interests.
The work was performed at the Pacific Northwest National Laboratory (PNNL). PNNL is operated for the U.S. Department of Energy (DOE) by Battelle Memorial Institute under contract no. DE-AC05-76RL01830. Any subjective views or opinions that might be expressed in the paper do not necessarily represent the views of the U.S. Department of Energy or the United States Government.
Publisher's note: Copernicus Publications remains neutral with regard to jurisdictional claims made in the text, published maps, institutional affiliations, or any other geographical representation in this paper. While Copernicus Publications makes every effort to include appropriate place names, the final responsibility lies with the authors.
This research was performed in a variety of interdisciplinary projects, including the DOE sponsored Office of Science, the Office of Biological and Environmental Research (BER), the Environmental System Science (ESS) program, IDEAS Watersheds, the River Corridor Scientific Focus Area (SFA), the Environmental Molecular Sciences Laboratory User Facility sponsored by the Biological and Environmental Research program under contract no. DE-AC05-76RL01830, and COMPASS-FME, a multi-institutional project supported by DOE BER as part of the ESS program. The study used data from WHONDRS.
This research has been supported by the Office of Science (grant no. DE-AC05-76RL01830).
This paper was edited by Carlos Sierra and reviewed by two anonymous referees.
Ahamed, F., You, Y., Burgin, A., Stegen, J. C., Scheibe, T. D., and Song, H. S.: Exploring the determinants of organic matter bioavailability through substrate-explicit thermodynamic modeling, Front. Water, 5, 1169701, https://doi.org/10.3389/frwa.2023.1169701, 2023.
Bahureksa, W., Tfaily, M. M., Boiteau, R. M., Young, R. B., Logan, M. N., McKenna, A. M., and Borch, T.: Soil organic matter characterization by Fourier transform ion cyclotron resonance mass spectrometry (FTICR MS): A critical review of sample preparation, analysis, and data interpretation, Environ. Sci. Technol., 55, 9637–9656, https://doi.org/10.1021/acs.est.1c01135, 2021.
Cooper, W. T., Chanton, J. C., D'Andrilli, J., Hodgkins, S. B., Podgorski, D. C., Stenson, A. C., Tfaily, M. M., and Wilson, R. M.: A history of molecular level analysis of natural organic matter by FTICR mass spectrometry and the paradigm shift in organic geochemistry, Mass Spectrom. Rev., 41, 215–239, https://doi.org/10.1002/mas.21663, 2022.
Cover, T. M. and Thomas, J. A.: Elements of information theory (Wiley series in telecommunications and signal processing), Wiley-Interscience, ISBN-13 9780471241959, 2006.
Desmond-Le Quéméner, E. and Bouchez, T.,: A thermodynamic theory of microbial growth. The ISME J., 8, 1747–1751, https://doi.org/10.1038/ismej.2014.7, 2014.
Emerick, A. A. and Reynolds, A. C.: Ensemble smoother with multiple data assimilation, Comput. Geosci., 55, 3–15, https://doi.org/10.1016/j.cageo.2012.03.011, 2013.
Fatichi, S., Manzoni, S., Or, D., and Paschalis, A.: A mechanistic model of microbially mediated soil biogeochemical processes: a reality check, Global Biogeochem. Cy., 33, 620–648, https://doi.org/10.1029/2018GB006077, 2019.
Garayburu-Caruso, V. A., Stegen, J. C., Song, H. S., Renteria, L., Wells, J., Garcia, W., Resch, C. T., Goldman, A. E., Chu, R. K., Toyoda, J., and Graham, E. B.: Carbon limitation leads to thermodynamic regulation of aerobic metabolism, Environ. Sci. Technol. Lett., 7, 517–524, https://doi.org/10.1021/acs.estlett.0c00258, 2020.
Goldman, A. E., Arnon, S., Bar-Zeev, E., Chu, R. K., Danczak, R. E., Daly, R. A., Delgado, D., Fansler, S., Forbes, B., Garayburu-Caruso, V. A., Graham, E. B., Laan, M., McCall, M. L., McKever, S., Patel, K. F., Ren, H., Renteria, L., Resch, C. T., Rod, K. A., Tfaily, M., Tolic, N., Torgeson, J. M., Toyoda, J. G., Wells, J., Wrighton, K. C., Stegen, J. C., and WHONDRS Consortium T: WHONDRS Summer 2019 Sampling Campaign: Global River Corridor Sediment FTICR-MS, Dissolved Organic Carbon, Aerobic Respiration, Elemental Composition, Grain Size, Total Nitrogen and Organic Carbon Content, Bacterial Abundance, and Stable Isotopes (v8), River Corridor and Watershed Biogeochemistry SFA, ESS-DIVE repository [data set], https://doi.org/10.15485/1729719, 2020.
Hammond, G. E.: The PFLOTRAN Reaction Sandbox, Geosci. Model Dev., 15, 1659–1676, https://doi.org/10.5194/gmd-15-1659-2022, 2022.
Hammond, G. E., Lichtner, P. C., and Mills, R. T.: Evaluating the performance of parallel subsurface simulators: An illustrative example with PFLOTRAN, Water Resour. Res., 50, 208–228, https://doi.org/10.1002/2012WR013483, 2014.
Jiang, P., Chen, X., Chen, K., Anderson, J., Collins, N., and Gharamti, M.: DART-PFLOTRAN: An ensemble-based data assimilation system for estimating subsurface flow and transport model parameters, Environ. Model. Softw., 142, 105074, https://doi.org/10.1016/j.envsoft.2021.105074, 2021.
Jiang, P., Son, K., Mudunuru, M. K., and Chen, X.: Using mutual information for global sensitivity analysis on watershed modelling, Water Resour. Res., 58, e2022WR032932, https://doi.org/10.1029/2022WR032932, 2022.
Kim, J. and Blair, N. E.: Biomarker heatmaps: visualization of complex biomarker data to detect storm-induced source changes in fluvial particulate organic carbon, Earth Sci. Inform., 16, 2915–2924, https://doi.org/10.1007/s12145-023-01039-y, 2023.
Kinzelbach, W., Schafer, W., and Herzer, J.: Numerical modeling of natural and enhanced denitrification processes in aquifers, Water Resour. Res., 27, 1123–1135, https://doi.org/10.1029/91WR00474, 1991.
Kleerebezem, R. and Van Loosdrecht, M. C.: A generalized method for thermodynamic state analysis of environmental systems, Crit. Rev. Env. Sci. Tech., 40, 1–54, https://doi.org/10.1080/10643380802000974, 2010.
Kluyver, T., Ragan-Kelley, B., Pérez, F., Granger, B., Bussonnier, M., Frederic, J., Kelley, K., Hamrick, J., Grout, J., Corlay, S., and Ivanov, P.: Jupyter Notebooks-a publishing format for reproducible computational workflows, Elpub, IOS Press, 87–90, https://doi.org/10.3233/978-1-61499-649-1-87, 2016.
Lehmann, J., Hansel, C. M., Kaiser, C., Kleber, M., Maher, K., Manzoni, S., Nunan, N., Reichstein, M., Schimel, J. P., Torn, M. S., and Wieder, W. R.: Persistence of soil organic carbon caused by functional complexity, Nat. Geosci., 13, 529–534, https://doi.org/10.1038/s41561-020-0612-3, 2020.
Muller, K. A., Jiang, P., Hammond, G., Ahmadullah, T., Song, H., Kukkadapu, R., Ward, N., Bowe, M., Chu, R. K., Zhao, Q., Garayburu-Caruso, V. A., Roebuck, A., and Chen, X.: Data and Scripts associated with “Lambda-PFLOTRAN: Workflow for Incorporating Organic Matter Chemistry Informed by Ultra High Resolution Mass Spectrometry into Biogeochemical Modeling”, River Corridor and Watershed Biogeochemistry SFA, ESS-DIVE repository [code and data set], https://doi.org/10.15485/2281403, 2024.
Robertson, A. D., Paustian, K., Ogle, S., Wallenstein, M. D., Lugato, E., and Cotrufo, M. F.: Unifying soil organic matter formation and persistence frameworks: the MEMS model, Biogeosciences, 16, 1225–1248, https://doi.org/10.5194/bg-16-1225-2019, 2019.
Schmidt, M. W., Torn, M. S., Abiven, S., Dittmar, T., Guggenberger, G., Janssens, I. A., Kleber, M., Kögel-Knabner, I., Lehmann, J., Manning, D. A., and Nannipieri, P.: Persistence of soil organic matter as an ecosystem property, Nature, 478, 49–56, https://doi.org/10.1038/nature10386, 2011.
Song, H. S., Stegen, J. C., Graham, E. B., Lee, J. Y., Garayburu-Caruso, V. A., Nelson, W. C., Chen, X., Moulton, J. D., and Scheibe, T. D.: Representing organic matter thermodynamics in biogeochemical reactions via substrate-explicit modelling, Front. Microbiol., 11, 531756, https://doi.org/10.3389/fmicb.2020.531756, 2020.
Stegen, J. C., Johnson, T., Fredrickson, J. K., Wilkins, M. J., Konopka, A. E., Nelson, W. C., Arntzen, E. V., Chrisler, W. B., Chu, R. K., Fansler, S. J., and Graham, E. B.: Influences of organic carbon speciation on hyporheic corridor biogeochemistry and microbial ecology, Nat. Commun., 9, 585, https://doi.org/10.1038/s41467-018-02922-9, 2018.
Stegen, J. C., Garayburu-Caruso, V. A., Danczak, R. E., Goldman, A. E., Renteria, L., Torgeson, J. M., and Hager, J.: Maximum respiration rates in hyporheic zone sediments are primarily constrained by organic carbon concentration and secondarily by organic matter chemistry, Biogeosciences, 20, 2857–2867, https://doi.org/10.5194/bg-20-2857-2023, 2023.
Stephanopoulos, G., Aristidou, A. A., and Nielsen, J.: Metabolic engineering: principles and methodologies, ISBN-13 9780126662603, 1998.
Tfaily, M. M., Chu, R. K., Toyoda, J., Tolić, N., Robinson, E. W., Paša-Tolić, L., and Hess, N. J.: Sequential extraction protocol for organic matter from soils and sediments using high resolution mass spectrometry, Anal. Chim. Ac., 972, 54–61, 2017.
Tolic, N., Liu, Y., Liyu, A., Shen, Y., Tfaily, M. M., Kujawinski, E. B., Longnecker, K., Kuo, L. J., Robinson, E. W., Paša-Tolić, L., and Hess, N. J.: Formularity: software for automated formula assignment of natural and other organic matter from ultrahigh-resolution mass spectra, Anal. Chem., 89, 12659–12665, 2017.
Wang, G., Post, W. M., and Mayes, M. A.: Development of microbial-enzyme-mediated decomposition model parameters through steady-state and dynamics analyses, Ecol. Appl., 23, 255–272, https://doi.org/10.1890/12-0681.1, 2013.
Ward, N. D., Keil, R. G., Medeiros, P. M., Brito, D. C., Cunha, A. C., Dittmar, T., Yager, P. L., Krusche, A. V., and Richey, J. E.: Degradation of terrestrially derived macromolecules in the Amazon River, Nat. Geosci., 6, 530–533, https://doi.org/10.1038/ngeo1817, 2013.
Ward, N. D, Muller, K. A., Chen, X., Zhao, Q., Chu, R., Cheng, Z., Wietsma, T. W., and Kukkadapu, R. K.: Interactive Effects of Salinity, Redox State, Soil type, and Colloidal Size Fractionation on Greenhouse Gas Production in Coastal Wetland Soils, ESS Open Archive [preprint], https://doi.org/10.22541/essoar.170158332.29336750/v1, 2023.


